T. Rowe Price Group, Inc. November 1, 2024 Earnings Release Supplement Q3 2024 A copy of this presentation, which includes additional information, is available at investors.troweprice.com. Data as of September 30, 2024, unless otherwise noted. All figures are USD, unless otherwise noted.
2T. R O W E P R I C E This presentation, and other statements that T. Rowe Price may make, may contain forward-looking statements within the meaning of the Private Securities Litigation Reform Act, with respect to T. Rowe Price’s future financial or business performance, strategies, or expectations. Forward-looking statements are typically identified by words or phrases such as “trend,” “potential,” “opportunity,” “pipeline,” “believe,” “comfortable,” “expect,” “anticipate,” “current,” “intention,” “estimate,” “position,” “assume,” “outlook,” “continue,” “remain,” “maintain,” “sustain,” “seek,” “achieve,” and similar expressions, or future or conditional verbs such as “will,” “would,” “should,” “could,” “may,” and similar expressions. Forward-looking statements in this presentation may include, without limitation, information concerning future results of our operations, revenues, expenses, earnings, liquidity, cash flows and capital expenditures, industry or market conditions, amount or composition of assets under management, flows into our investment funds, regulatory developments, changes in our effective fee rate, demand for and pricing of our products, new products and services, effective tax rates, net income and earnings per common share, future transactions, our strategic initiatives, general economic conditions, dividends, stock repurchases, and other aspects of our business. T. Rowe Price cautions that forward-looking statements are subject to numerous assumptions, risks, and uncertainties, which change over time. Actual results could differ materially from those anticipated in forward-looking statements, and future results could differ materially from historical performance. Forward- looking statements speak only as of the date they are made, and T. Rowe Price assumes no duty to and does not undertake to update forward-looking statements. We caution investors not to rely unduly on any forward-looking statements and urge you to carefully consider the risks described in our most recent Form 10-K filed with the Securities and Exchange Commission. Forward-Looking Statement
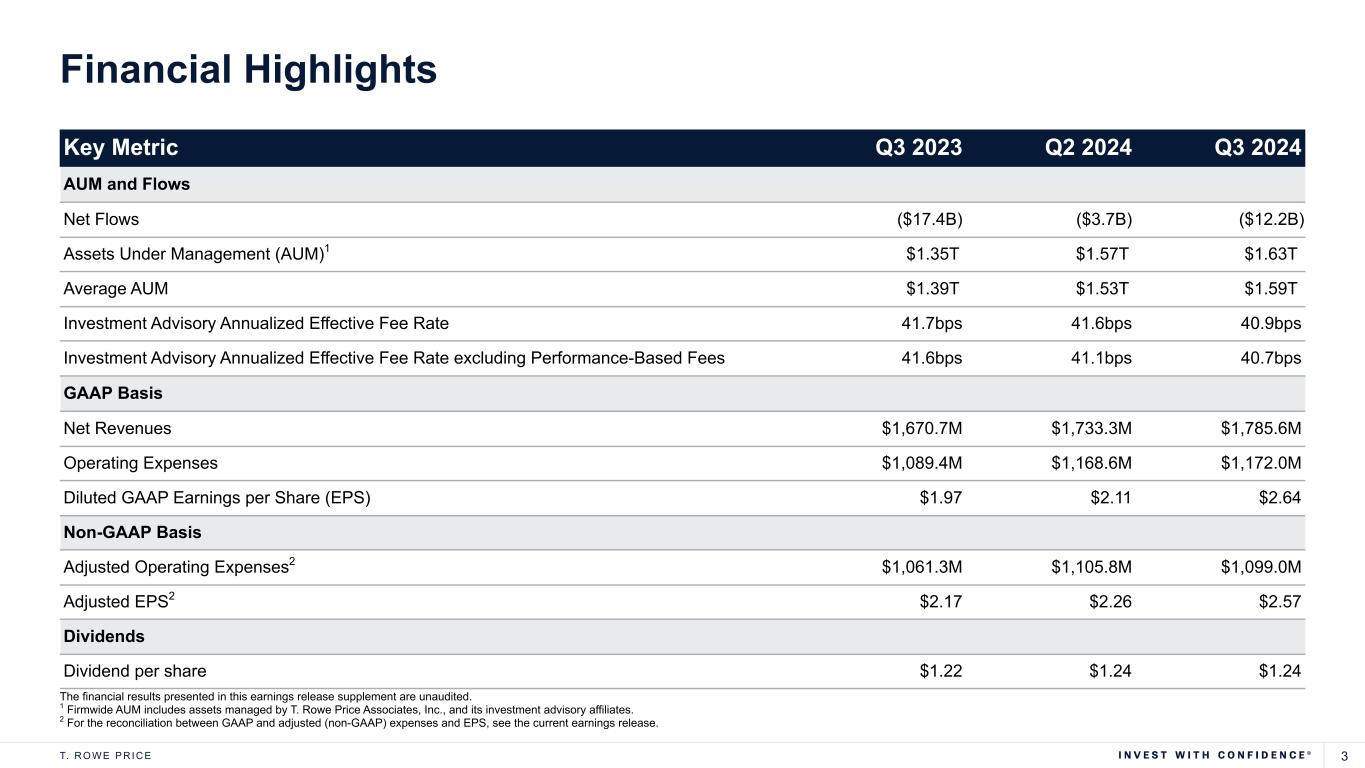
3T. R O W E P R I C E Key Metric Q3 2023 Q2 2024 Q3 2024 AUM and Flows Net Flows ($17.4B) ($3.7B) ($12.2B) Assets Under Management (AUM)1 $1.35T $1.57T $1.63T Average AUM $1.39T $1.53T $1.59T Investment Advisory Annualized Effective Fee Rate 41.7bps 41.6bps 40.9bps Investment Advisory Annualized Effective Fee Rate excluding Performance-Based Fees 41.6bps 41.1bps 40.7bps GAAP Basis Net Revenues $1,670.7M $1,733.3M $1,785.6M Operating Expenses $1,089.4M $1,168.6M $1,172.0M Diluted GAAP Earnings per Share (EPS) $1.97 $2.11 $2.64 Non-GAAP Basis Adjusted Operating Expenses2 $1,061.3M $1,105.8M $1,099.0M Adjusted EPS2 $2.17 $2.26 $2.57 Dividends Dividend per share $1.22 $1.24 $1.24 The financial results presented in this earnings release supplement are unaudited. 1 Firmwide AUM includes assets managed by T. Rowe Price Associates, Inc., and its investment advisory affiliates. 2 For the reconciliation between GAAP and adjusted (non-GAAP) expenses and EPS, see the current earnings release. Financial Highlights
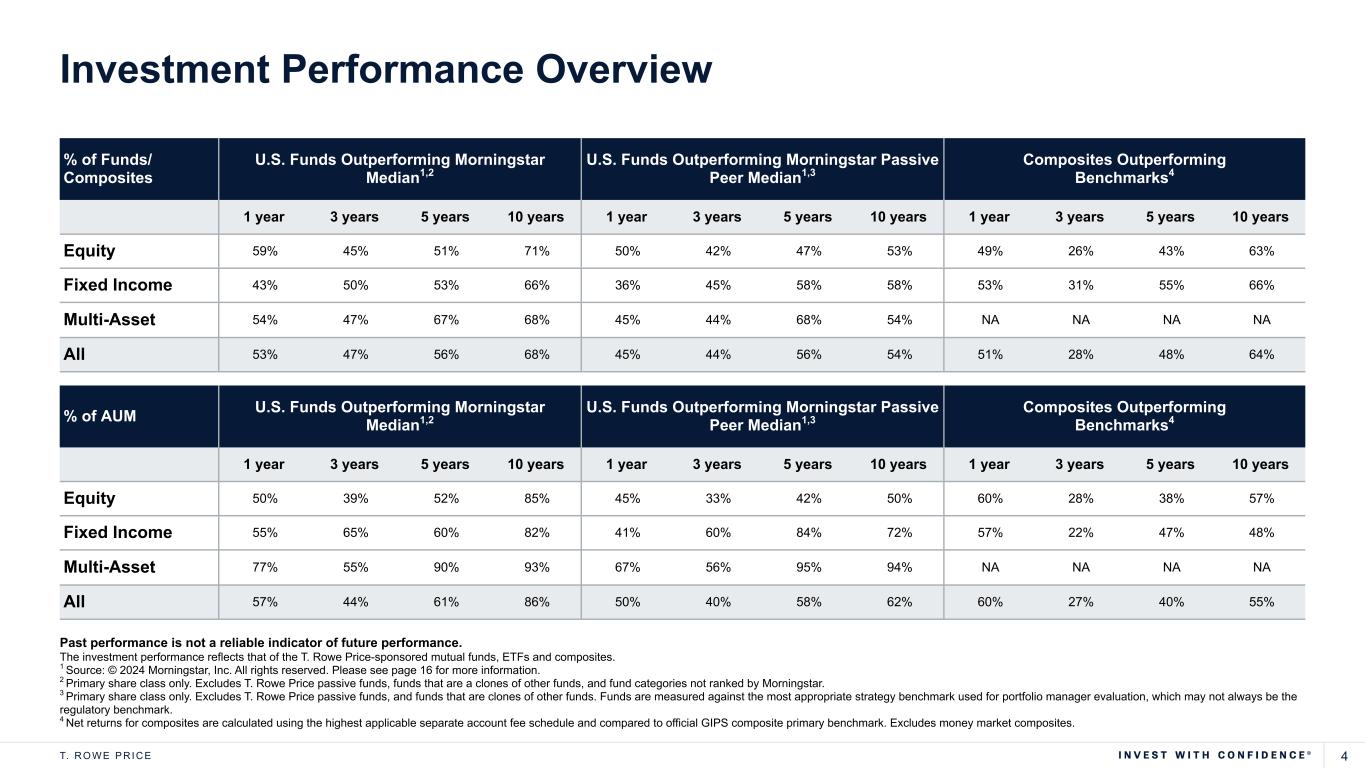
4T. R O W E P R I C E % of Funds/ Composites U.S. Funds Outperforming Morningstar Median1,2 U.S. Funds Outperforming Morningstar Passive Peer Median1,3 Composites Outperforming Benchmarks4 1 year 3 years 5 years 10 years 1 year 3 years 5 years 10 years 1 year 3 years 5 years 10 years Equity 59% 45% 51% 71% 50% 42% 47% 53% 49% 26% 43% 63% Fixed Income 43% 50% 53% 66% 36% 45% 58% 58% 53% 31% 55% 66% Multi-Asset 54% 47% 67% 68% 45% 44% 68% 54% NA NA NA NA All 53% 47% 56% 68% 45% 44% 56% 54% 51% 28% 48% 64% Past performance is not a reliable indicator of future performance. The investment performance reflects that of the T. Rowe Price-sponsored mutual funds, ETFs and composites. 1 Source: © 2024 Morningstar, Inc. All rights reserved. Please see page 16 for more information. 2 Primary share class only. Excludes T. Rowe Price passive funds, funds that are a clones of other funds, and fund categories not ranked by Morningstar. 3 Primary share class only. Excludes T. Rowe Price passive funds, and funds that are clones of other funds. Funds are measured against the most appropriate strategy benchmark used for portfolio manager evaluation, which may not always be the regulatory benchmark. 4 Net returns for composites are calculated using the highest applicable separate account fee schedule and compared to official GIPS composite primary benchmark. Excludes money market composites. % of AUM U.S. Funds Outperforming Morningstar Median1,2 U.S. Funds Outperforming Morningstar Passive Peer Median1,3 Composites Outperforming Benchmarks4 1 year 3 years 5 years 10 years 1 year 3 years 5 years 10 years 1 year 3 years 5 years 10 years Equity 50% 39% 52% 85% 45% 33% 42% 50% 60% 28% 38% 57% Fixed Income 55% 65% 60% 82% 41% 60% 84% 72% 57% 22% 47% 48% Multi-Asset 77% 55% 90% 93% 67% 56% 95% 94% NA NA NA NA All 57% 44% 61% 86% 50% 40% 58% 62% 60% 27% 40% 55% Investment Performance Overview
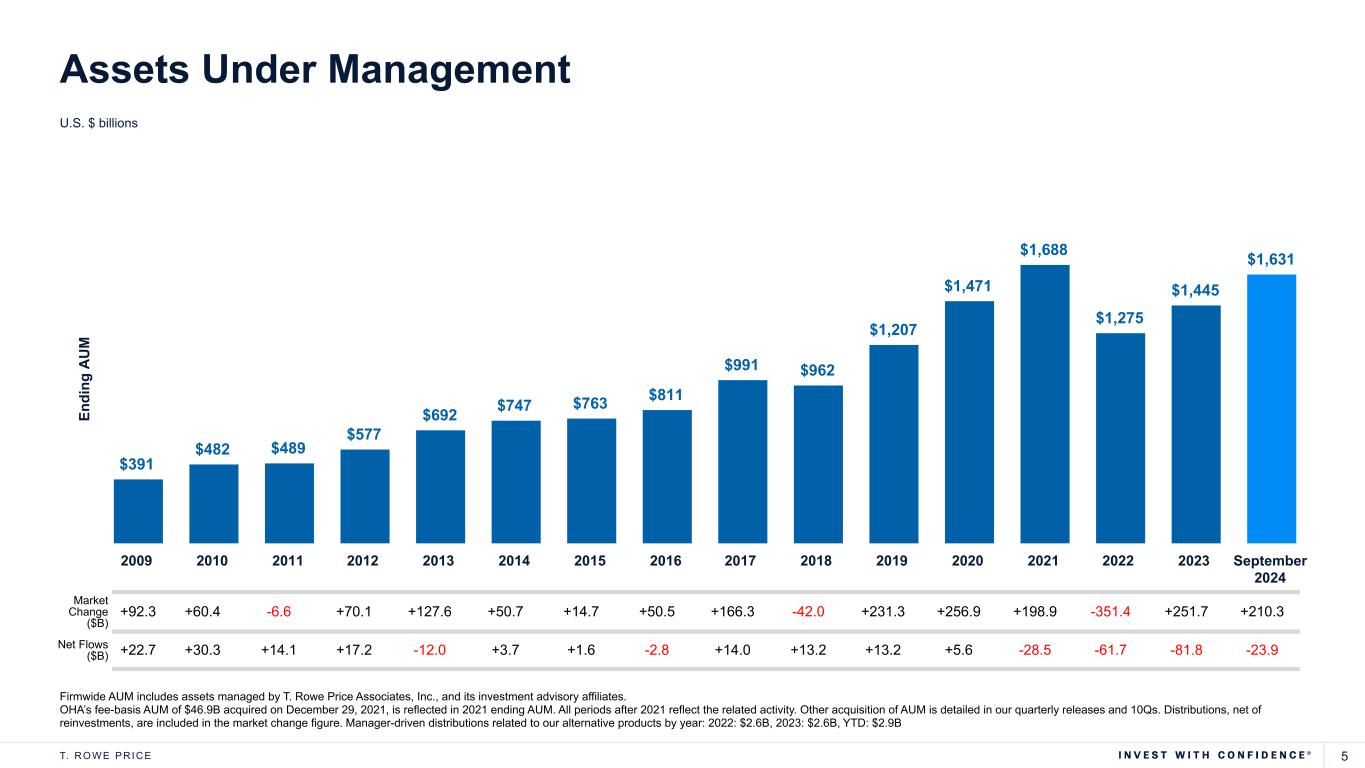
5T. R O W E P R I C E Firmwide AUM includes assets managed by T. Rowe Price Associates, Inc., and its investment advisory affiliates. OHA’s fee-basis AUM of $46.9B acquired on December 29, 2021, is reflected in 2021 ending AUM. All periods after 2021 reflect the related activity. Other acquisition of AUM is detailed in our quarterly releases and 10Qs. Distributions, net of reinvestments, are included in the market change figure. Manager-driven distributions related to our alternative products by year: 2022: $2.6B, 2023: $2.6B, YTD: $2.9B U.S. $ billions Assets Under Management Market Change ($B) +92.3 +60.4 -6.6 +70.1 +127.6 +50.7 +14.7 +50.5 +166.3 -42.0 +231.3 +256.9 +198.9 -351.4 +251.7 +210.3 Net Flows ($B) +22.7 +30.3 +14.1 +17.2 -12.0 +3.7 +1.6 -2.8 +14.0 +13.2 +13.2 +5.6 -28.5 -61.7 -81.8 -23.9 En di ng A U M $391 $482 $489 $577 $692 $747 $763 $811 $991 $962 $1,207 $1,471 $1,688 $1,275 $1,445 $1,631 2009 2010 2011 2012 2013 2014 2015 2016 2017 2018 2019 2020 2021 2022 2023 September 2024
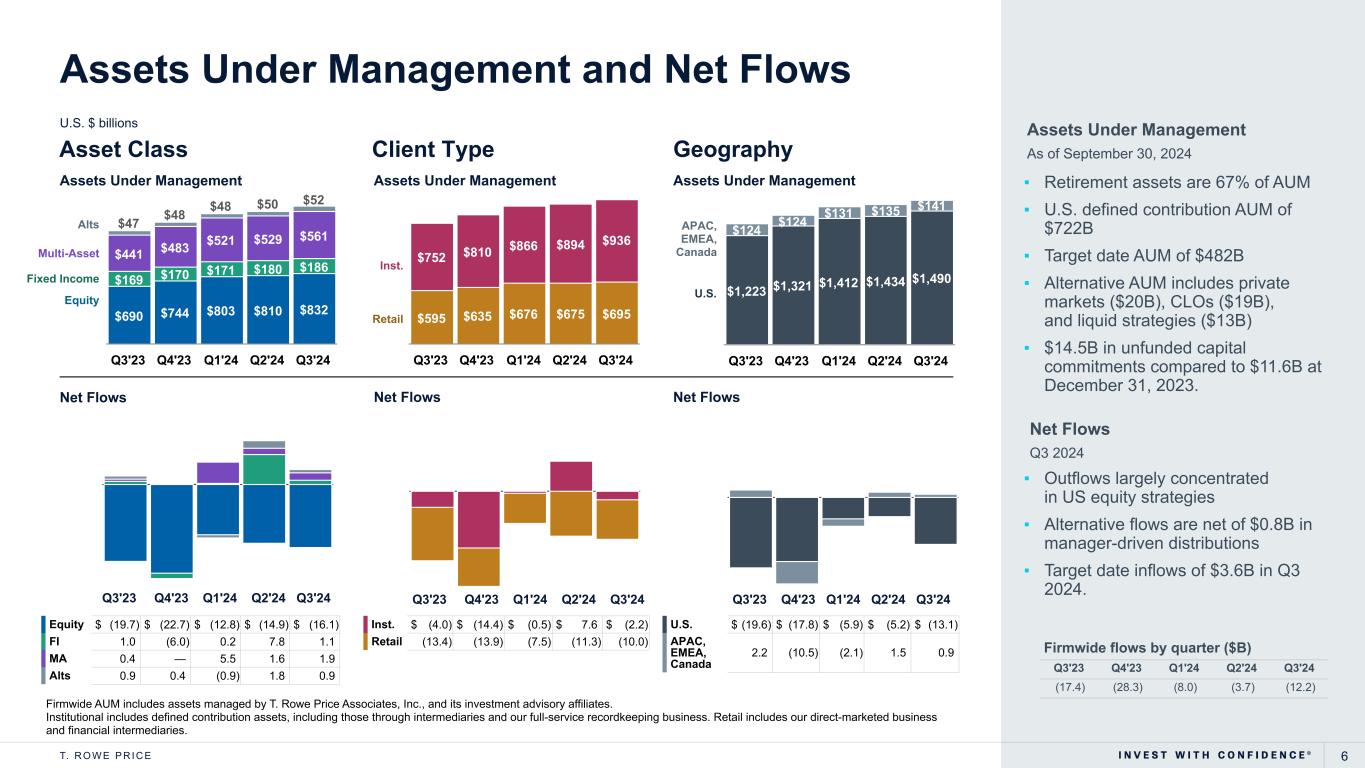
6T. R O W E P R I C E Firmwide AUM includes assets managed by T. Rowe Price Associates, Inc., and its investment advisory affiliates. Institutional includes defined contribution assets, including those through intermediaries and our full-service recordkeeping business. Retail includes our direct-marketed business and financial intermediaries. Assets Under Management and Net Flows U.S. $ billions ▪ Retirement assets are 67% of AUM ▪ U.S. defined contribution AUM of $722B ▪ Target date AUM of $482B ▪ Alternative AUM includes private markets ($20B), CLOs ($19B), and liquid strategies ($13B) ▪ $14.5B in unfunded capital commitments compared to $11.6B at December 31, 2023. ▪ Outflows largely concentrated in US equity strategies ▪ Alternative flows are net of $0.8B in manager-driven distributions ▪ Target date inflows of $3.6B in Q3 2024. Firmwide flows by quarter ($B) Q3'23 Q4'23 Q1'24 Q2'24 Q3'24 (17.4) (28.3) (8.0) (3.7) (12.2) Net Flows Q3 2024 Assets Under Management As of September 30, 2024Asset Class Client Type Geography Equity $ (19.7) $ (22.7) $ (12.8) $ (14.9) $ (16.1) FI 1.0 (6.0) 0.2 7.8 1.1 MA 0.4 — 5.5 1.6 1.9 Alts 0.9 0.4 (0.9) 1.8 0.9 Inst. $ (4.0) $ (14.4) $ (0.5) $ 7.6 $ (2.2) Retail (13.4) (13.9) (7.5) (11.3) (10.0) U.S. $ (19.6) $ (17.8) $ (5.9) $ (5.2) $ (13.1) APAC, EMEA, Canada 2.2 (10.5) (2.1) 1.5 0.9 Retail Inst. U.S. APAC, EMEA, Canada $690 $744 $803 $810 $832 $169 $170 $171 $180 $186 $441 $483 $521 $529 $561 $47 $48 $48 $50 $52 Q3'23 Q4'23 Q1'24 Q2'24 Q3'24 Fixed Income Multi-Asset Alts Equity $595 $635 $676 $675 $695 $752 $810 $866 $894 $936 Q3'23 Q4'23 Q1'24 Q2'24 Q3'24 $1,223 $1,321 $1,412 $1,434 $1,490 $124 $124 $131 $135 $141 Q3'23 Q4'23 Q1'24 Q2'24 Q3'24 Assets Under Management Assets Under Management Assets Under Management Net Flows Net Flows Net Flows Q3'23 Q4'23 Q1'24 Q2'24 Q3'24 Q3'23 Q4'23 Q1'24 Q2'24 Q3'24 Q3'23 Q4'23 Q1'24 Q2'24 Q3'24
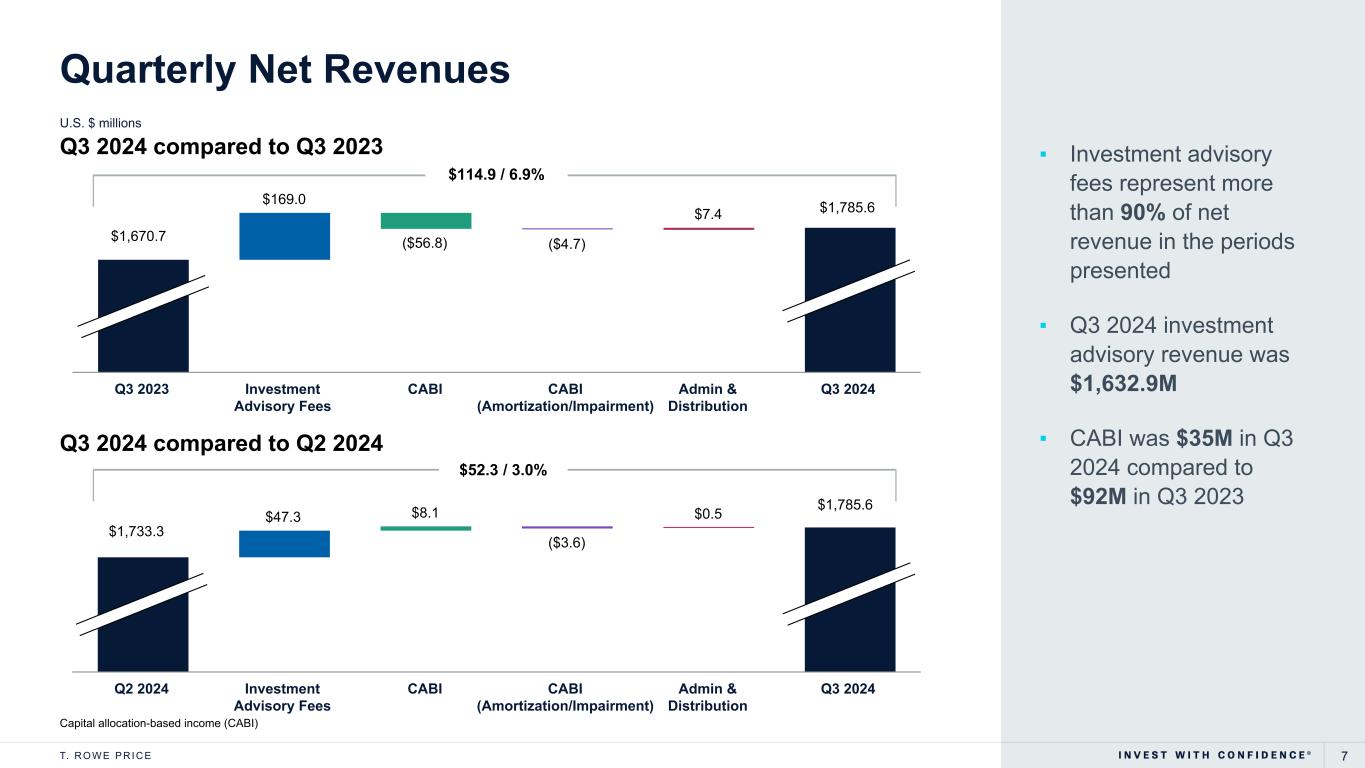
7T. R O W E P R I C E $169.0 ($56.8) ($4.7) $7.4 Q3 2023 Investment Advisory Fees CABI CABI (Amortization/Impairment) Admin & Distribution Q3 2024 Quarterly Net Revenues U.S. $ millions ▪ Investment advisory fees represent more than 90% of net revenue in the periods presented ▪ Q3 2024 investment advisory revenue was $1,632.9M ▪ CABI was $35M in Q3 2024 compared to $92M in Q3 2023 Q3 2024 compared to Q2 2024 Q3 2024 compared to Q3 2023 $47.3 $8.1 ($3.6) $0.5 Q2 2024 Investment Advisory Fees CABI CABI (Amortization/Impairment) Admin & Distribution Q3 2024 Capital allocation-based income (CABI) $114.9 / 6.9% $52.3 / 3.0% $1,670.7 $1,785.6 $1,785.6 $1,733.3
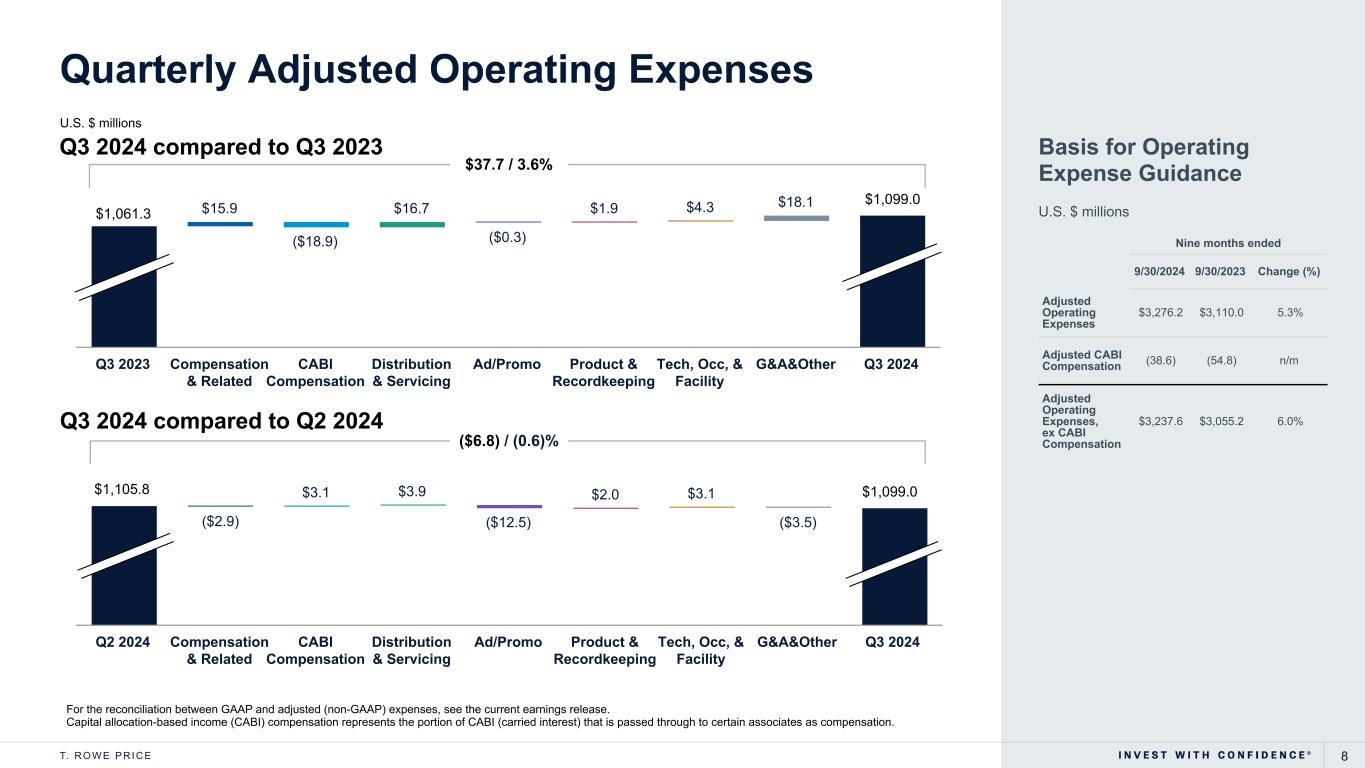
8T. R O W E P R I C E ($2.9) $3.1 $3.9 ($12.5) $2.0 $3.1 ($3.5) Q2 2024 Compensation & Related CABI Compensation Distribution & Servicing Ad/Promo Product & Recordkeeping Tech, Occ, & Facility G&A&Other Q3 2024 Quarterly Adjusted Operating Expenses U.S. $ millions Q3 2024 compared to Q3 2023 $15.9 ($18.9) $16.7 ($0.3) $1.9 $4.3 $18.1 Q3 2023 Compensation & Related CABI Compensation Distribution & Servicing Ad/Promo Product & Recordkeeping Tech, Occ, & Facility G&A&Other Q3 2024 Q3 2024 compared to Q2 2024 For the reconciliation between GAAP and adjusted (non-GAAP) expenses, see the current earnings release. Capital allocation-based income (CABI) compensation represents the portion of CABI (carried interest) that is passed through to certain associates as compensation. $37.7 / 3.6% $1,061.3 ($6.8) / (0.6)% $1,105.8 $1,099.0 $1,099.0 Nine months ended 9/30/2024 9/30/2023 Change (%) Adjusted Operating Expenses $3,276.2 $3,110.0 5.3% Adjusted CABI Compensation (38.6) (54.8) n/m Adjusted Operating Expenses, ex CABI Compensation $3,237.6 $3,055.2 6.0% Basis for Operating Expense Guidance U.S. $ millions
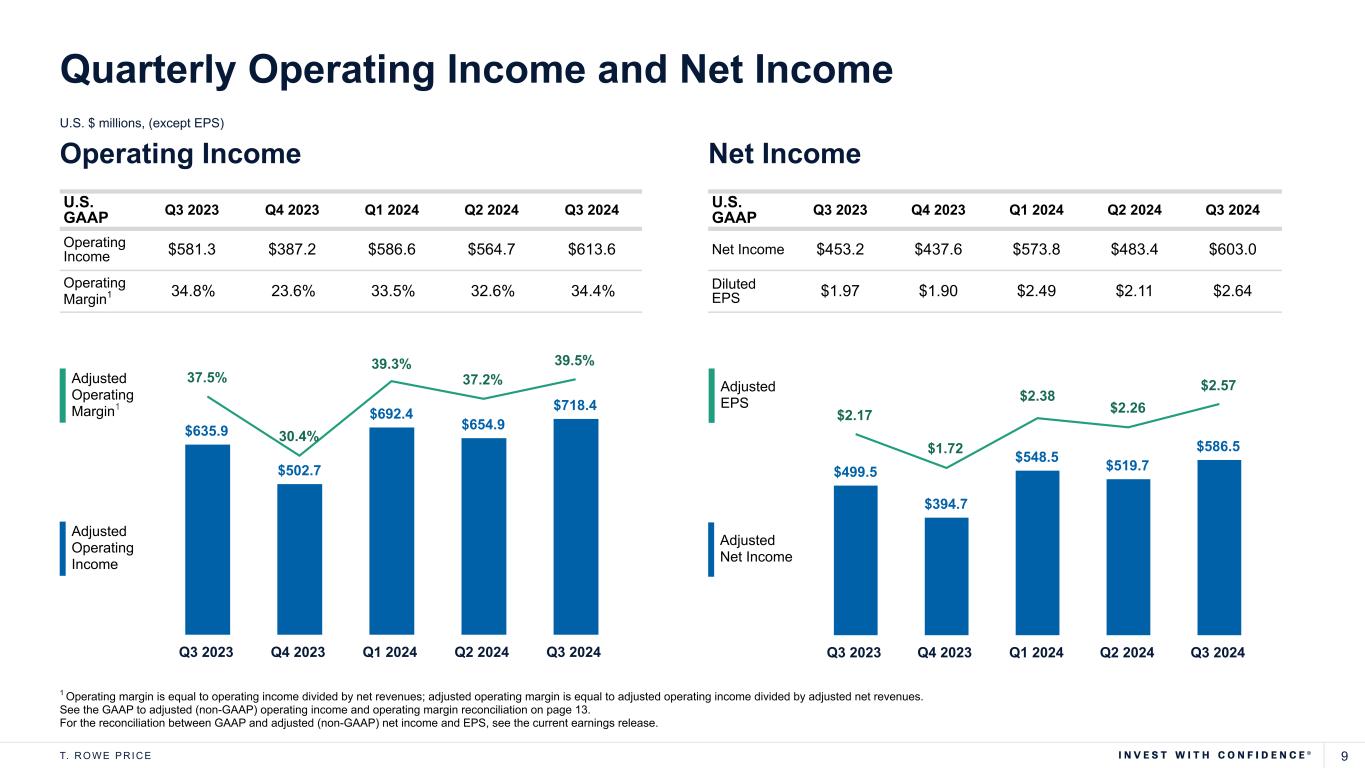
9T. R O W E P R I C E 1 Operating margin is equal to operating income divided by net revenues; adjusted operating margin is equal to adjusted operating income divided by adjusted net revenues. See the GAAP to adjusted (non-GAAP) operating income and operating margin reconciliation on page 13. For the reconciliation between GAAP and adjusted (non-GAAP) net income and EPS, see the current earnings release. Net Income U.S. $ millions, (except EPS) Quarterly Operating Income and Net Income U.S. GAAP Q3 2023 Q4 2023 Q1 2024 Q2 2024 Q3 2024 Net Income $453.2 $437.6 $573.8 $483.4 $603.0 Diluted EPS $1.97 $1.90 $2.49 $2.11 $2.64 Operating Income U.S. GAAP Q3 2023 Q4 2023 Q1 2024 Q2 2024 Q3 2024 Operating Income $581.3 $387.2 $586.6 $564.7 $613.6 Operating Margin1 34.8% 23.6% 33.5% 32.6% 34.4% Adjusted Operating Income Adjusted Operating Margin1 $635.9 $502.7 $692.4 $654.9 $718.4 37.5% 30.4% 37.2% 39.5% Q3 2023 Q4 2023 Q1 2024 Q2 2024 Q3 2024 Adjusted Net Income Adjusted EPS $499.5 $394.7 $548.5 $519.7 $586.5 $2.17 $1.72 $2.26 $2.57 Q3 2023 Q4 2023 Q1 2024 Q2 2024 Q3 2024 $2.38 39.3%

10T. R O W E P R I C E Capital Returned to Stockholders Cash and Investments1 1 Cash and investments includes our cash and investments in T. Rowe Price products. This display does not include the non-controllable interest of our seed investments, which we normally consolidate due to our ownership. U.S. $ millions Capital Management Data through 9/30/2024 Q3 2023 Q4 2023 Q3 2024 Cash and Cash Equivalents $2,578.7 $2,066.6 $3,173.5 Discretionary Investments 486.3 463.7 471.8 Cash and Discretionary Investments $3,065.0 $2,530.3 $3,645.3 Redeemable Seed Capital $1,167.4 $1,370.9 $1,379.9 Investments Used to Hedge the Supplemental Savings Plan Liability $783.9 $894.6 $969.1 282 1,132 3,329 71 367 1,983 — — — Q3 2024 Last 12 months Last 36 months $5,312 $1,498 $354 Dividends Share Repurchases
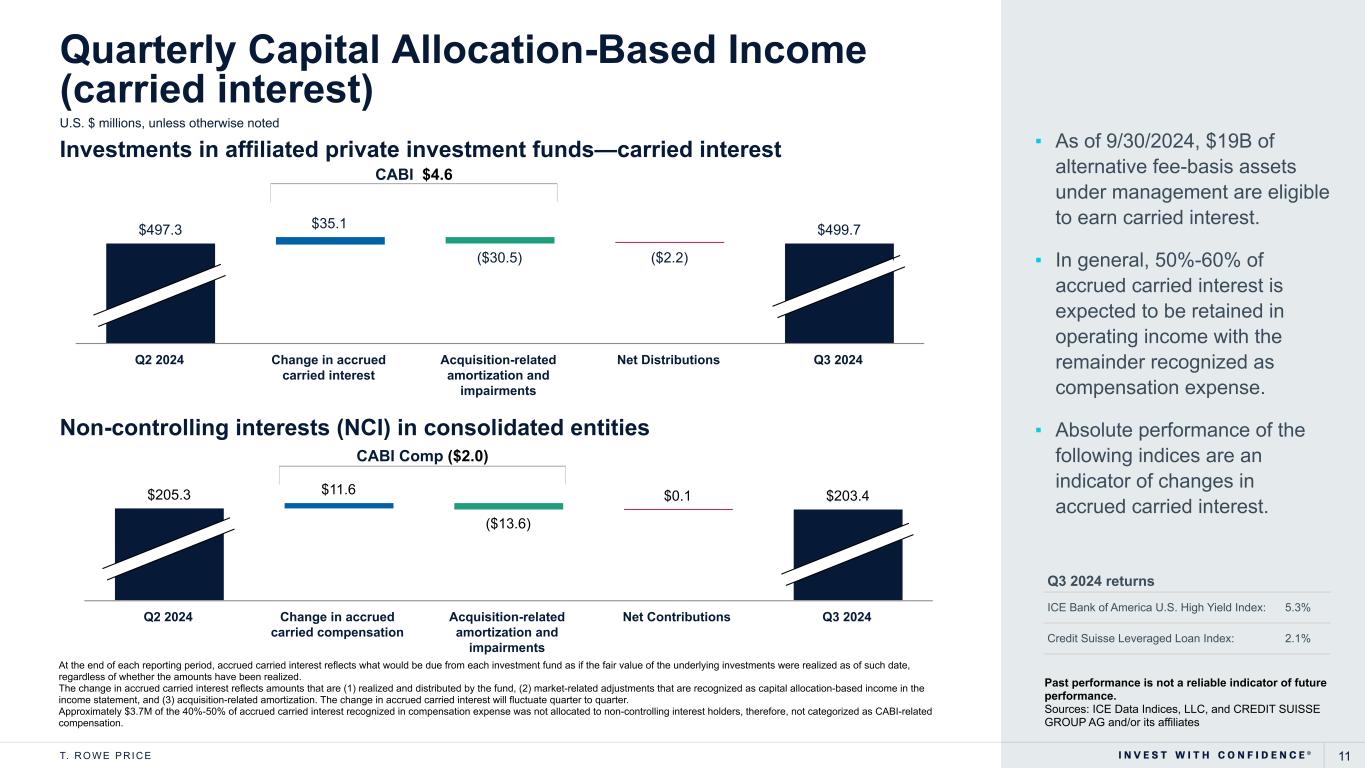
11T. R O W E P R I C E $205.3 $11.6 ($13.6) $0.1 $203.4 Q2 2024 Change in accrued carried compensation Acquisition-related amortization and impairments Net Contributions Q3 2024 At the end of each reporting period, accrued carried interest reflects what would be due from each investment fund as if the fair value of the underlying investments were realized as of such date, regardless of whether the amounts have been realized. The change in accrued carried interest reflects amounts that are (1) realized and distributed by the fund, (2) market-related adjustments that are recognized as capital allocation-based income in the income statement, and (3) acquisition-related amortization. The change in accrued carried interest will fluctuate quarter to quarter. Approximately $3.7M of the 40%-50% of accrued carried interest recognized in compensation expense was not allocated to non-controlling interest holders, therefore, not categorized as CABI-related compensation. Quarterly Capital Allocation-Based Income (carried interest) U.S. $ millions, unless otherwise noted ▪ As of 9/30/2024, $19B of alternative fee-basis assets under management are eligible to earn carried interest. ▪ In general, 50%-60% of accrued carried interest is expected to be retained in operating income with the remainder recognized as compensation expense. ▪ Absolute performance of the following indices are an indicator of changes in accrued carried interest. Non-controlling interests (NCI) in consolidated entities CABI Comp ($2.0) Q3 2024 returns ICE Bank of America U.S. High Yield Index: 5.3 % Credit Suisse Leveraged Loan Index: 2.1 % CABI $4.6 Past performance is not a reliable indicator of future performance. Sources: ICE Data Indices, LLC, and CREDIT SUISSE GROUP AG and/or its affiliates Investments in affiliated private investment funds—carried interest $497.3 $35.1 ($30.5) ($2.2) $499.7 Q2 2024 Change in accrued carried interest Acquisition-related amortization and impairments Net Distributions Q3 2024

Non-GAAP Reconciliation

13T. R O W E P R I C E Q3 2023 Q4 2023 Q1 2024 Q2 2024 Q3 2024 Net Revenues, GAAP Basis $1,670.7 $1,642.0 $1,750.2 $1,733.3 $1,785.6 Non-GAAP Adjustments1: Consolidated Investment Products 0.7 0.5 1.2 0.5 1.3 Investment Amortization and Impairments 25.8 10.9 12.4 26.9 30.5 Net Revenues, Non-GAAP Basis $1,697.2 $1,653.4 $1,763.8 $1,760.7 $1,817.4 Operating Income, GAAP Basis $581.3 $387.2 $586.6 $564.7 $613.6 Non-GAAP Adjustments1: Acquisition-Related Adjustments 67.4 51.3 50.5 73.0 59.0 Consolidated Investment Products 1.4 2.3 2.3 2.6 2.4 Supplemental Savings Plan Liability (14.2) 61.9 53.0 14.6 43.4 Operating Income, Non-GAAP Basis $635.9 $502.7 $692.4 $654.9 $718.4 Operating Margin, GAAP Basis2 34.8 % 23.6 % 33.5 % 32.6 % 34.4 % Operating Margin, as Adjusted2 37.5 % 30.4 % 39.3 % 37.2 % 39.5 % 1 For a description of the non-GAAP adjustments, see the related earnings releases and/or prior 10Q or 10Ks filed with the SEC. 2 Operating margin is equal to operating income divided by net revenues. U.S. $ millions Non-GAAP Net Revenues and Operating Income Reconciliation

Appendix
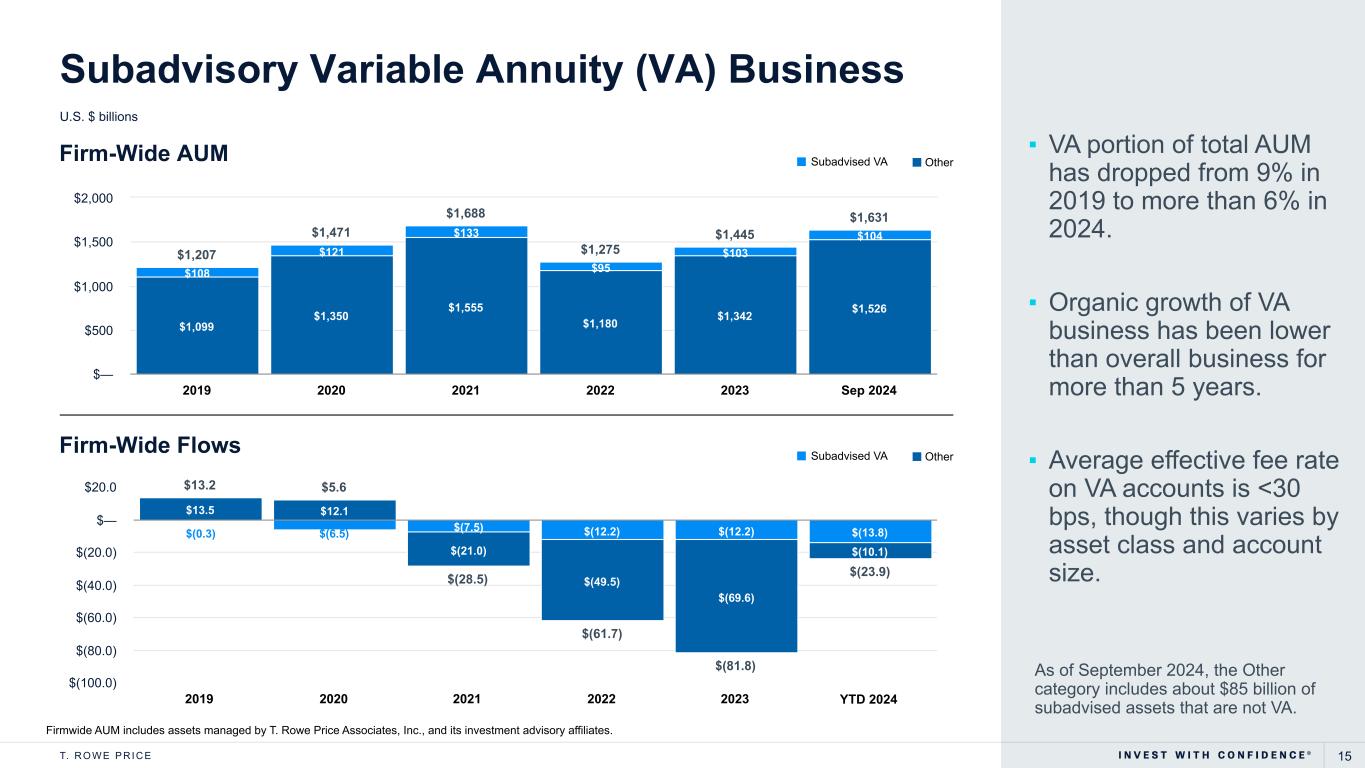
15T. R O W E P R I C E $(28.5) $(61.7) $(81.8) $(23.9) $13.2 $5.6 $(0.3) $(6.5) $(7.5) $(12.2) $(12.2) $(13.8) $13.5 $12.1 $(21.0) $(49.5) $(69.6) $(10.1) 2019 2020 2021 2022 2023 Sep 2024 $(100.0) $(80.0) $(60.0) $(40.0) $(20.0) $— $20.0 Firmwide AUM includes assets managed by T. Rowe Price Associates, Inc., and its investment advisory affiliates. Subadvisory Variable Annuity (VA) Business U.S. $ billions ▪ VA portion of total AUM has dropped from 9% in 2019 to more than 6% in 2024. ▪ Organic growth of VA business has been lower than overall business for more than 5 years. ▪ Average effective fee rate on VA accounts is <30 bps, though this varies by asset class and account size. As of September 2024, the Other category includes about $85 billion of subadvised assets that are not VA. $1,207 $1,471 $1,688 $1,275 $1,445 $1,631 $1,099 $1,350 $1,555 $1,180 $1,342 $1,526 $108 $121 $133 $95 $103 $104 2019 2020 2021 2022 2023 Sep 2024 $— $500 $1,000 $1,500 $2,000 Firm-Wide Flows Firm-Wide AUM Subadvised VA Other YTD Subadvised VA Other

16T. R O W E P R I C E Figures may not total due to rounding. Investment performance overview (slide 4) 1 Source: © 2024 Morningstar, Inc. All rights reserved. The information contained herein: 1) is proprietary to Morningstar and/or its content providers; 2) may not be copied or distributed; and 3) is not warranted to be accurate, complete, or timely. Neither Morningstar nor its content providers are responsible for any damages or losses arising from any use of this information. Past performance is no guarantee of future results. 2 Source: Morningstar. Primary share class only. Excludes money market mutual funds, funds with an operating history of less than one year, T. Rowe Price passive funds, and T. Rowe Price funds that are clones of other funds. The top chart reflects the percentage of T. Rowe Price funds with 1 year, 3 year, 5 year, and 10 year track record that outperformed the Morningstar category median. The bottom chart reflects the percentage of T. Rowe Price funds AUM that has outperformed for the time periods indicated. Total AUM included for this analysis includes $332B for 1 year, $329B for 3 years, $328B for 5 years, and $327B for 10 years. 3 Passive Peer Median was created by T. Rowe Price using data from Morningstar. Primary share class only. Excludes money market mutual funds, funds with an operating history of less than one year, funds with fewer than three peers, T. Rowe Price passive funds, and T. Rowe Price funds that are clones of a retail fund. This analysis compares T. Rowe Price active funds with the applicable universe of passive/index open-end funds and ETFs of peer firms. The top chart reflects the percentage of T. Rowe Price funds with 1 year, 3 year, 5 year, and 10 year track record that outperformed the passive peer universe. The bottom chart reflects the percentage of T. Rowe Price funds AUM that has outperformed for the time periods indicated. Total AUM included for this analysis includes $315B for 1 year, $312B for 3 years, $272B for 5 years, and $267B for 10 years. 4 Composite net returns are calculated using the highest applicable separate account fee schedule. Excludes money market composites. All composites compared to official GIPS composite primary benchmark. The top chart reflects the percentage of T. Rowe Price composites with 1 year, 3 year, 5 year, and 10 year track record that outperformed their benchmarks. The bottom chart reflects the percentage of T. Rowe Price composite AUM that has outperformed for the time periods indicated. Total AUM included for this analysis includes $1,457B for 1 year, $1,452B for 3 years, $1,444B for 5 years, and $1,392B for 10 years. Capital Allocation Based Income (slide 11) © 2024 CREDIT SUISSE GROUP AG and/or its affiliates. All rights reserved. ICE Data Indices, LLC (“ICE DATA”), is used with permission. ICE DATA, ITS AFFILIATES AND THEIR RESPECTIVE THIRD-PARTY SUPPLIERS DISCLAIM ANY AND ALL WARRANTIES AND REPRESENTATIONS, EXPRESS AND/OR IMPLIED, INCLUDING ANY WARRANTIES OF MERCHANTABILITY OR FITNESS FOR A PARTICULAR PURPOSE OR USE, INCLUDING THE INDICES, INDEX DATA AND ANY DATA INCLUDED IN, RELATED TO, OR DERIVED THEREFROM. NEITHER ICE DATA, ITS AFFILIATES NOR THEIR RESPECTIVE THIRD-PARTY SUPPLIERS SHALL BE SUBJECT TO ANY DAMAGES OR LIABILITY WITH RESPECT TO THE ADEQUACY, ACCURACY, TIMELINESS OR COMPLETENESS OF THE INDICES OR THE INDEX DATA OR ANY COMPONENT THEREOF, AND THE INDICES AND INDEX DATA AND ALL COMPONENTS THEREOF ARE PROVIDED ON AN “AS IS” BASIS AND YOUR USE IS AT YOUR OWN RISK. ICE DATA, ITS AFFILIATES AND THEIR RESPECTIVE THIRD-PARTY SUPPLIERS DO NOT SPONSOR, ENDORSE, OR RECOMMEND T. ROWE PRICE OR ANY OF ITS PRODUCTS OR SERVICES. Additional Information
17T. R O W E P R I C E Important Information Referenced in the earnings call: Pacific Life provides a variety of products and services designed to help individuals and businesses in the retail, institutional, workforce benefits, and reinsurance markets achieve financial security. All guarantees are subject to the claims-paying ability and financial strength of the issuing insurance company. See https://investors.troweprice.com/news-releases/news-release-details/t-rowe- price-launches-lifetime-income-solution-retirees-pacific The following entities may be referenced in the earnings supplement or the earnings call: ▪ TRPA – T. Rowe Price Associates, Inc. ▪ TRPIM – T. Rowe Price Investment Management, Inc. This material, including any statements, information, data and content contained within it and any materials, information, images, links, graphics or recordings provided in conjunction with this material are being furnished by T. Rowe Price for general informational purposes only. Under no circumstances should the material, in whole or part, be copied or distributed without consent from T. Rowe Price. The views contained herein are as of the date of the presentation. The information and data obtained from third-party sources which is contained in the report were obtained from the sources deemed reliable; however, its accuracy and completeness is not guaranteed. The products and services discussed in this presentation are available via subsidiaries of T. Rowe Price Group as authorized in countries throughout the world. The products and services are not available to all investors or in all countries. Visit troweprice.com to learn more about the products and services available in your country and the T. Rowe Price Group subsidiary which is authorized to provide them. The material is not intended for use by persons in jurisdictions that prohibit or restrict the distribution of the material and in certain countries the material is provided upon specific request. © 2024 T. Rowe Price. All Rights Reserved. T. ROWE PRICE, INVEST WITH CONFIDENCE, and the Bighorn Sheep design are, collectively and/or apart, trademarks of T. Rowe Price Group, Inc.


