
1
July 28, 2004
Fiscal Year 2004 3rd Quarter
Earnings Conference Call
Larry Yost, Chairman and CEO
Carl Soderstrom, Senior Vice President and CFO

This presentation contains “forward-looking statements” as defined in the Private Securities
Litigation Reform Act of 1995. These forward-looking statements are based on currently
available competitive, financial and economic data and management’s views and
assumptions regarding future events. Such forward-looking statements are inherently
uncertain, and actual results may differ materially from those projected as a result of certain
risks and uncertainties, including but not limited to global economic and market conditions;
the demand for commercial, specialty and light vehicles for which the company supplies
products; risks inherent in operating abroad, including foreign currency exchange rates;
availablity and cost of raw materials; OEM program delays; demand for and market
acceptance of new and existing products; reliance on major OEM customers; labor relations
of the company, its customers and suppliers; successful integration of acquired or merged
businesses; achievement of the expected annual savings and synergies from past and future
business combinations; success and timing of potential divestitures; potential impairment of
long-lived assets, including goodwill; competitive product and pricing pressures; the amount
of the company’s debt; the ability of the company to access capital markets; the credit ratings
of the company’s debt; the outcome of existing and any future legal proceedings, including
any litigation with respect to environmental or asbestos-related matters; as well as other risks
and uncertainties, including but not limited to those detailed herein and from time to time in
ArvinMeritor’s Securities and Exchange Commission filings.
Forward-Looking Statements
2
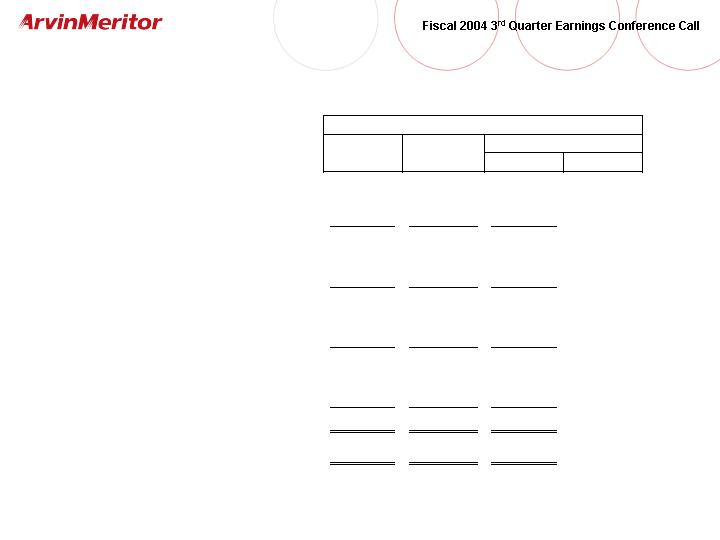
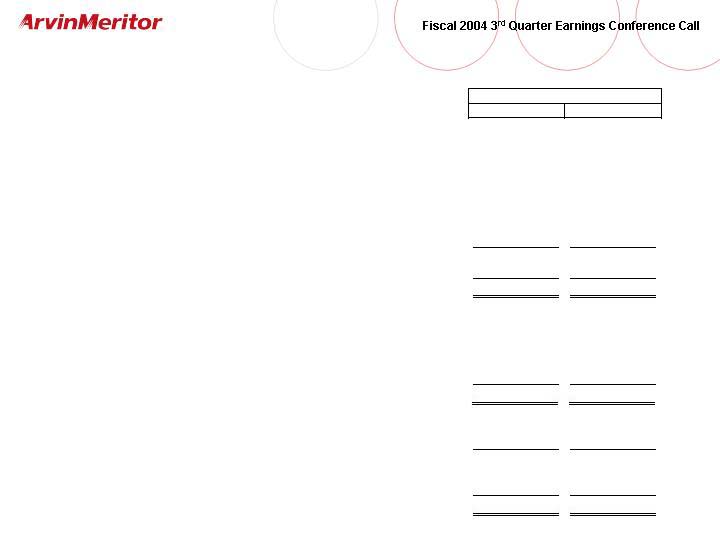
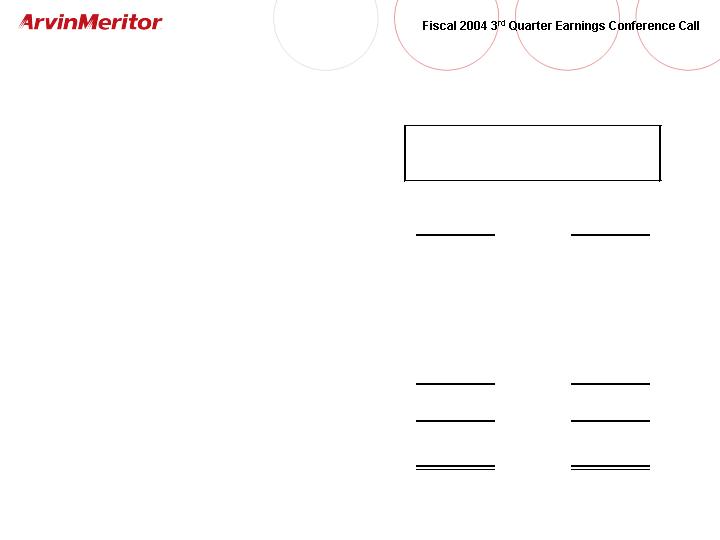
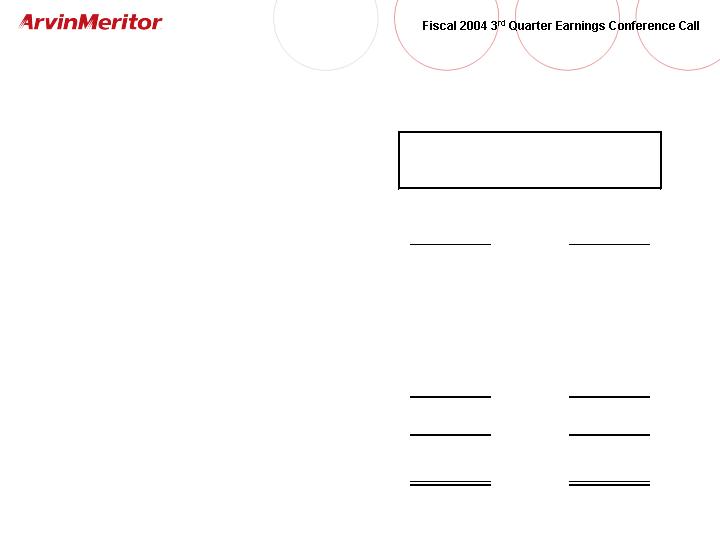
3rd Quarter Income Statement
(in millions, except per share amounts)
2004
2003
$
%
Sales
2,388
$
2,109
$
279
$
13%
Cost of Sales
(2,159)
(1,896)
(263)
-14%
Gross Margin
229
213
16
8%
SG&A
(123)
(111)
(12)
-11%
Restructuring Costs
(4)
(5)
1
20%
Operating Income
102
97
5
5%
Equity in Earnings of Affiliates
5
4
1
25%
Interest Expense, Net and Other
(26)
(26)
-
0%
Income Before Income Taxes
81
75
6
8%
Provision for Income Taxes
(24)
(24)
-
0%
Minority Interests
(4)
(4)
-
0%
Net Income
53
$
47
$
6
$
13%
Diluted EPS
0.77
$
0.69
$
0.08
$
12%
Operating Margin
4.3%
4.6%
(0.3)
pts
Better/(Worse)
Quarter Ended June 30,
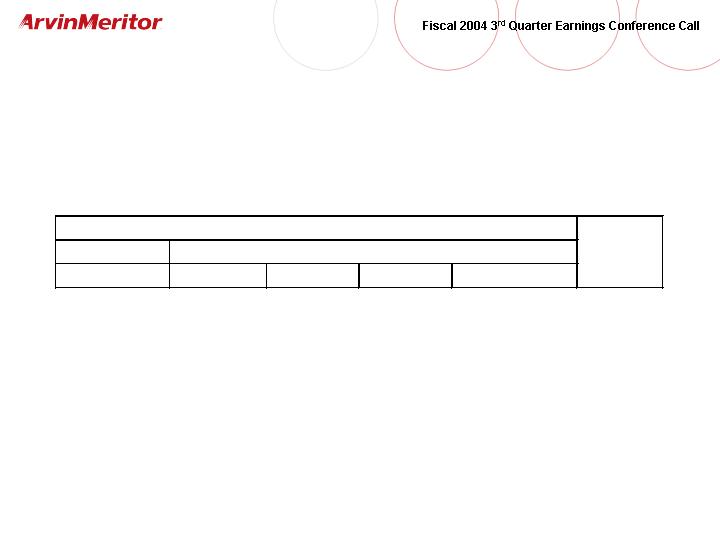
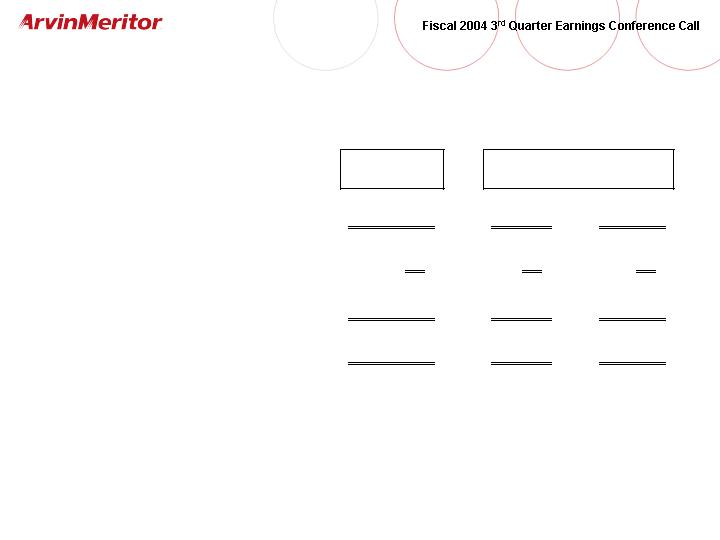
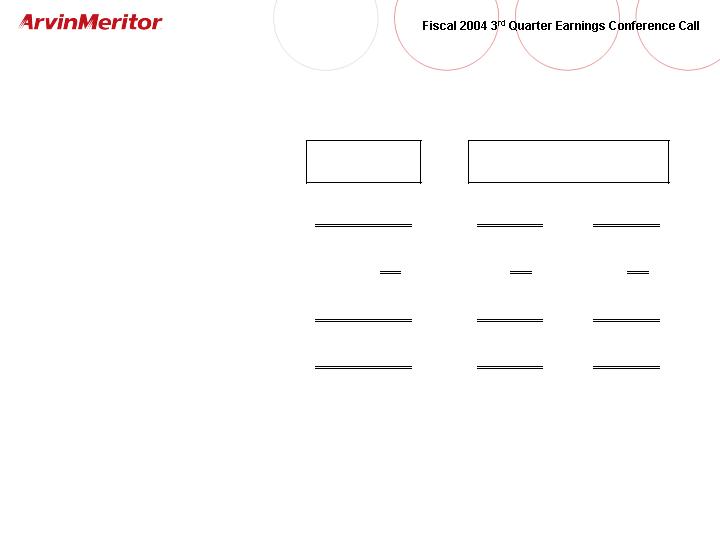
3
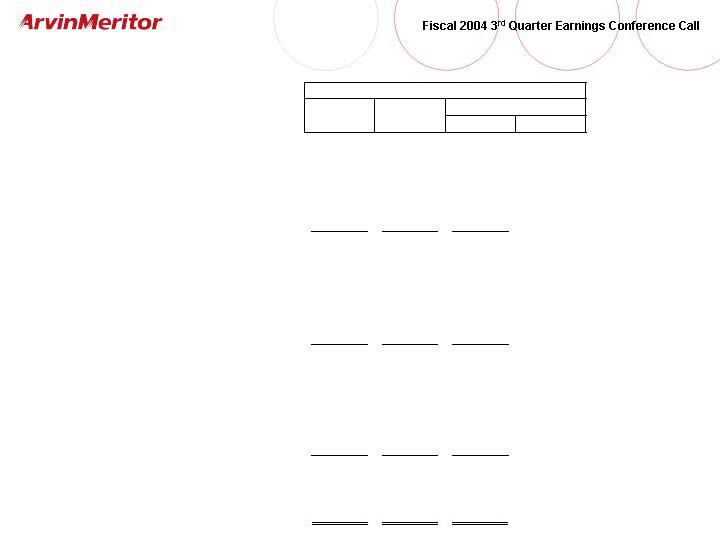
3rd Quarter Segment Sales
(in millions)
2004
2003
$
%
Sales
Light Vehicle Systems
North America
524
$
511
$
13
$
3%
Europe
604
561
43
8%
South America
45
44
1
2%
Asia-Pacific and Other
77
79
(2)
-3%
Total
1,250
1,195
55
5%
Commercial Vehicle Systems
North America
532
394
138
35%
Europe
224
177
47
27%
South America
34
23
11
48%
Asia-Pacific and Other
72
51
21
41%
Total
862
645
217
34%
Light Vehicle Aftermarket
North America
151
165
(14)
-8%
Europe
56
53
3
6%
South America
9
1
8
800%
Asia-Pacific and Other
8
6
2
33%
Total
224
225
(1)
0%
Other - North America
52
_________
44
_________
8
_________
18%
Total
2,388
$
2,109
$
279
$
13%
Quarter Ended June 30,
Better/(Worse)
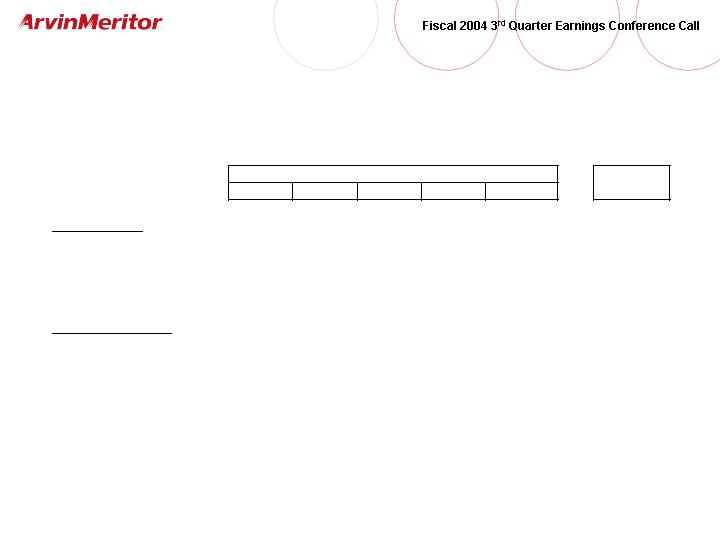
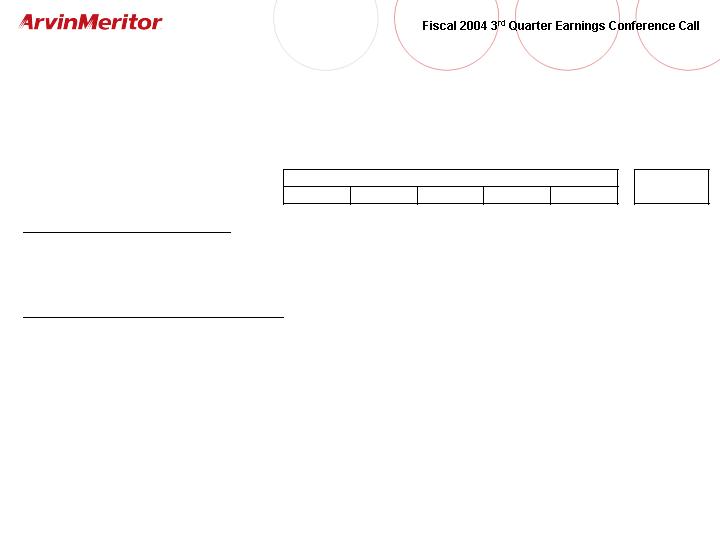
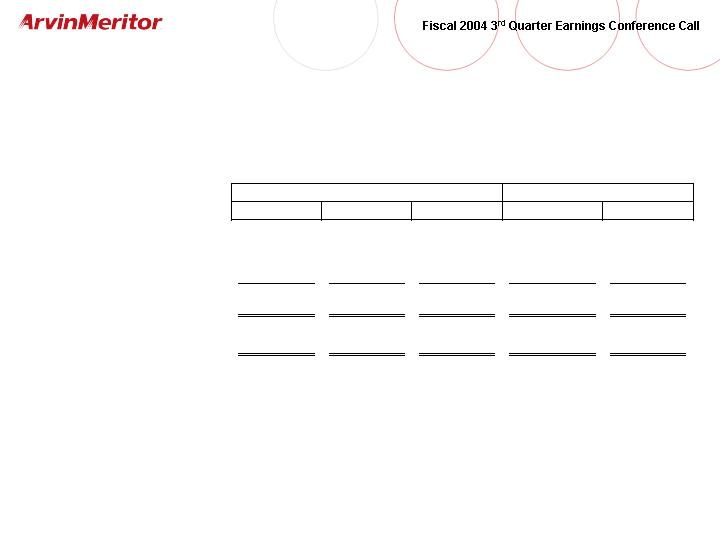
4
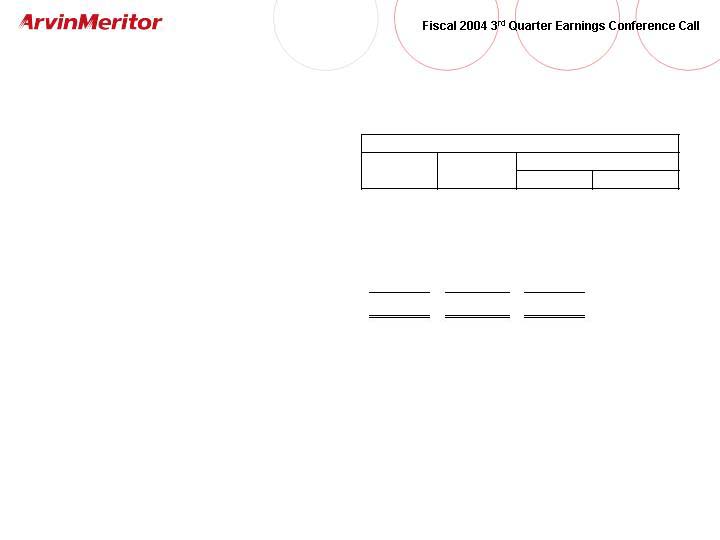
3rd Quarter Segment Operating Income
(in millions)
2004
2003
$
%
Operating Income
Light Vehicle Systems
38
$
46
$
(8)
$
-17%
Commercial Vehicle Systems
53
38
15
39%
Light Vehicle Aftermarket
4
10
(6)
-60%
Other
7
3
4
133%
Total Operating Income
102
$
97
$
5
$
5%
Operating Margin
Light Vehicle Systems
3.0%
3.8%
(0.8)
pts
Commercial Vehicle Systems
6.1%
5.9%
0.2
pts
Light Vehicle Aftermarket
1.8%
4.4%
(2.6)
pts
Other
13.5%
6.8%
6.7
pts
Total Operating Margin
4.3%
4.6%
(0.3)
pts
Quarter Ended June 30,
Better/(Worse)
5
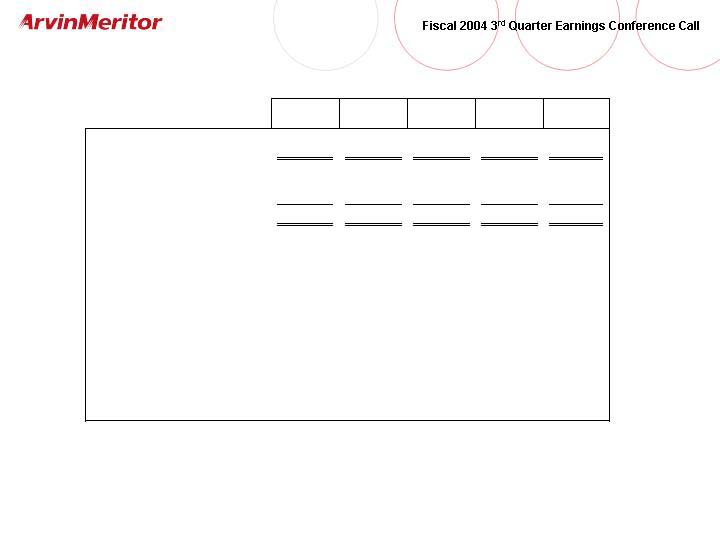
Balance Sheet Highlights
(in millions)
June 30,
Mar. 31,
Dec. 31,
Sept. 30,
June 30,
2004
2004
2003
2003
2003
Cash
122
$
119
$
137
$
103
$
103
$
Short-term Debt
5
$
3
$
12
$
20
$
12
$
Long-term Debt
1,585
1,527
1,572
1,541
1,562
Total Debt
1,590
$
1,530
$
1,584
$
1,561
$
1,574
$
Minority Interests
64
68
73
64
73
Equity
1,100
1,051
1,024
899
1,040
Total Debt to Capital
58%
58%
59%
62%
59%
Net Debt (1)
1,590
1,601
1,694
1,696
1,757
Factored Receivables
9
16
70
47
89
Securitized Receivables
142
225
223
237
263
Working Capital (2)
616
661
673
562
622
Working Capital % of Sales (3)
6.7%
7.4%
7.1%
7.5%
6.5%
(1)
Net debt is calculated as total debt less fair value of interest rate swaps plus factored and
securitized receivables less cash.
(2)
Includes accounts receivable securitization and factored receivables and excludes cash and
short term debt.
(3)
Calculated using quarterly average working capital and current quarter annualized sales.
6
Cash Flow Highlights
(in millions)
2004
2003
Net income
113
$
103
$
Adjustments to Income:
Depreciation and Amortization
164
161
Gain on Sale of Marketable Securities
(7)
-
Restructuring Costs, Net of Expenditures
1
2
Gain on Divestitures
(20)
(2)
Pension and Retiree Medical Expense
99
73
Pension and Retiree Medical Contributions
(185)
(141)
Changes in Assets and Liabilities
(65)
(138)
Cash Provided by Operations (Ex. AR Secur. and Factoring)
100
58
Accounts Receivable Securitization and Factored Receivables
(115)
148
Cash (Used for) Provided by Operating Activities
(15)
$
206
$
Capital Expenditures
(108)
$
(119)
$
Acquistions of Businesses and Investments, Net of Cash Acquired
-
(104)
Proceeds from Dispositions of Property and Businesses
85
42
Proceeds from Sale of Marketable Securities
18
-
Other Investing Activities
(1)
-
Cash Used for Investing Activities
(6)
$
(181)
$
Net Change in Revolving Debt
45
$
44
$
Net Change in Other Debt
5
(22)
Net Increase in Debt
50
22
Proceeds from the Exercise of Stock Options
5
-
Cash Dividends
(21)
(20)
Cash Provided by Financing Activities
34
$
2
$
Nine Months Ended June 30,
7
FY 2004 Light Vehicle
Production Outlook
(in millions)
Calendar
Q1
Q2
Q3
Q4
Full Year
Year
North America
2004 Outlook
3.9
4.2
4.2
3.6
15.9
15.9
2003 Actual
3.9
4.2
4.2
3.7
16.0
16.0
Change
0%
0%
0%
-3%
-1%
-1%
Western Europe (1)
2004 Outlook
4.3
4.3
4.4
3.6
16.6
16.5
2003 Actual
4.2
4.4
4.4
3.7
16.7
16.8
Change
2%
-2%
0%
-3%
-1%
-2%
(1) - Includes Czech Republic
Source: CSM Worldwide, Inc.
Fiscal Year Ended September 30
8
Light Vehicle Systems Net New Business
(in millions)
Implied
Actual
Annual
2003
2004
2005
2006
Cumulative
Growth
4,355
$
236
$
226
$
118
$
580
$
4%
Sales
Incremental
9
FY 2004 Commercial Vehicle
Production Outlook
(in thousands)
Calendar
Q1
Q2
Q3
Q4
Full Year
Year
North America - Class 8 Trucks (1)
2004 Outlook
47
54
64
69
234
251
2003 Actual
41
35
43
45
164
170
Change
15%
54%
49%
53%
43%
48%
Western Europe - Heavy & Medium Trucks
2004 Outlook
95
93
98
90
376
374
2003 Actual
98
93
92
81
364
361
Change
-3%
0%
7%
11%
3%
4%
(1) - Includes U.S., Canada and Mexico
Fiscal Year Ended September 30
10
FY 2004 Sales Outlook
(in millions)
Sales FY 2003
7,788
$
7,788
$
Light Vehicle Systems
523
-
528
Commercial Vehicle Systems
749
-
754
Light Vehicle Aftermarket
1
-
6
Other
29
-
29
Total Change
1,302
-
1,317
Sales FY 2004
9,090
$
-
9,105
$
FY 2004
Full Year Outlook
11
Full Year FY 2004 Outlook
(in millions, except EPS)
FY 2003
Full Year
Sales
7,788
$
9,090
$
-
9,105
$
Operating Margin
4.0%
3.4%
-
3.5%
Net Income Before Acctg. Change
(1)
140
$
151
$
-
155
$
Diluted EPS Before Acctg. Change
(1)
2.06
$
2.20
$
-
2.25
$
Note (1): FY 2003 excludes the cumulative effect of an accounting change due to
the adoption of FIN 46 of $4 million ($0.06 per diluted share).
Note (2): Outlook does not include the impact of any future acquisitions or divestitures.
Full Year Outlook (2)
FY 2004
12
Planned Facility Closures and Workforce
Reduction Costs and Savings
(in millions)
Q1
Q2
Q3
Q4
Full Year
Pre-tax Charge
(1)
$
(8)
$
(4)
$
(6)
$
(19)
$
Pre-tax Savings
-
1
4
6
11
Net Pre-tax Impact
(1)
$
(7)
$
-
$
-
$
(8)
$
Diluted Earnings Per Share
(0.01)
$
(0.07)
$
-
$
-
$
(0.08)
$
Fiscal Year 2004 Forecast
Actual
13
FY 2004 Free Cash Flow Outlook
(in millions)
Net Income
151
$
-
155
$
Adjustments to Income
Depreciation and Other Amortization
215
-
220
Pension and Retiree Medical Expense
130
-
130
Pension and Retiree Medical Contributions
(205)
-
(210)
Changes in Assets and Liabilities
34
-
60
Cash Provided by Operations
325
-
355
Capital Expenditures
(185)
-
(195)
Free Cash Flow
140
$
-
160
$
Net Proceeds from Acquisitions and Divestitures (1)
102
$
-
102
$
Cash Dividends ($0.40 per share)
(28)
$
-
(28)
$
(1) Includes sale of businesses, property and marketable securities.
Note: Does not include the effects of any changes in A/R securitization and factoring
or any future acquisitions or divestitures.
Full Year
FY 2004
14
4th Quarter FY 2004 Sales Outlook
(in millions)
Sales FY 2003 Fourth Quarter
1,977
$
1,977
$
Light Vehicle Systems
42
-
47
Commercial Vehicle Systems
239
-
244
Light Vehicle Aftermarket
6
-
11
Other
1
-
1
Total Change
288
-
303
Sales FY 2004 Fourth Quarter
2,265
$
-
2,280
$
FY 2004
4th Quarter Outlook
15
4th Quarter FY 2004 Outlook
(in millions, except EPS)
FY 2003
4th Quarter
Sales
1,977
$
2,265
$
2,280
$
Operating Margin
3.8%
3.4%
-
3.6%
Net Income (1)
37
$
38
$
-
41
$
Diluted Earnings Per Share (1)
0.54
$
0.55
$
-
0.60
$
(1) FY 2003 excludes the cumulative effect of an accounting change due to the
adoption of FIN 46 of $4 million ($0.06 per diluted share).
(2) Outlook does not include the impact of any acquistions or divestitures.
FY 2004
4th Quarter Outlook (2)
16

Appendix
Non-GAAP Financial Information
17
Use of Non-GAAP Financial Information
In addition to the results reported in accordance with accounting principles generally accepted in the United States (“GAAP”)
included throughout this presentation, the Company has provided information regarding certain non-GAAP financial
measures. These measures include “net debt”, “sales in constant currency” and “free cash flow”. Net debt is defined as total
debt less the fair value adjustment of debt due to interest rate swaps, plus securitized and factored receivables, less cash.
Free cash flow represents net cash provided by operating activities before the net change in accounts receivable securitized or
factored, less capital expenditures. The Company believes it is appropriate to exclude the net change in securitized and
factored accounts receivable in the calculation of free cash flow since the sale of receivables may be viewed as a substitute
for borrowing activity.
Management believes that the non-GAAP financial measures used in this presentation are useful to both management and
investors in their analysis of the Company’s financial position and results of operations. In particular, management believes
that net debt is an important indicator of the Company’s overall leverage and free cash flow is useful in analyzing the
Company’s ability to service and repay its debt. Further, management uses these non-GAAP measures for planning and
forecasting in future periods.
Neither, net debt nor free cash flow should be considered substitutes for debt, cash provided by operating activities or other
balance sheet or cash flow statement data prepared in accordance with GAAP or as a measure of financial position or liquidity.
In addition, the calculation of free cash flow does not reflect cash used to service debt and thus, does not reflect funds
available for investment or other discretionary uses. These non-GAAP financial measures, as determined and presented by
the Company, may not be comparable to related or similarily titled measures reported by other companies.
Set forth on the following slides are reconciliations of these non-GAAP financial measures, if applicable, to the most directly
comparable financial measures calculated and presented in accordance with GAAP.
18
Non-GAAP Financial Information
Net Debt
(in millions)
June 30,
Mar. 31,
Dec. 31,
Sept. 30,
June 30,
2004
2004
2003
2003
2003
Total Debt
1,590
$
1,530
$
1,584
$
1,561
$
1,574
$
Less:
Fair value of interest rate swaps
(29)
(51)
(46)
(46)
(66)
Plus:
Receivable securitization
142
225
223
237
263
Plus:
Receivable factorization
9
16
70
47
89
Subtotal
1,712
1,720
1,831
1,799
1,860
Less:
Cash
(122)
(119)
(137)
(103)
(103)
Net Debt
1,590
$
1,601
$
1,694
$
1,696
$
1,757
$
19
Non-GAAP Financial Information
Sales in Constant Currency
(in millions)
Sales
Reported
Sales
Approximate
Currency
Impact
Sales in
Constant
Currency
Light Vehicle Systems
1,250
$
(55)
$
1,195
$
Commercial Vehicle Systems
862
(10)
852
Light Vehicle Aftermarket
224
(5)
219
Other
52
-
52
Total
2,388
$
(70)
$
2,318
$
Quarter Ended June 30, 2004
20

21