KeyBanc Capital Markets
2005 Industrial &
Automotive Investment
Conference
June 8, 2005
Charles G. “Chip” McClure
Chairman, CEO and President
James D. Donlon, III
Sr. Vice President and CFO
Rakesh Sachdev
Sr. Vice President Corporate Strategy

Cautionary Statement Concerning
Forward-Looking Statement
This presentation contains “forward-looking statements” as defined in the Private Securities
Litigation Reform Act of 1995. These forward-looking statements are based on currently available
competitive, financial and economic data and management’s views and assumptions regarding
future events. Such forward-looking statements are inherently uncertain, and actual results may
differ materially from those projected as a result of certain risks and uncertainties, including but
not limited to global economic and market conditions; the demand for commercial, specialty and
light vehicles for which the company supplies products; risks inherent in operating abroad,
including foreign currency exchange rates and potential disruption production and supply due to
terrorist attacks or acts of aggression; availability and cost of raw materials, including steel; OEM
program delays; demand for and market acceptance of new and existing products; reliance on
major OEM customers; labor relations of the company, its customers and suppliers; the financial
condition of the company’s suppliers and customers, including potential bankruptcies; successful
integration of acquired or merged businesses; achievement of the expected annual savings and
synergies from past and future business combinations; success and timing of potential
divestitures; potential impairment of long-lived assets, including goodwill; competitive product
and pricing pressures; the amount of the company’s debt; the ability of the company to access
capital markets; the credit ratings of the company’s debt; the outcome of existing and any future
legal proceedings, including any litigation with respect to environmental or asbestos-related
matters; as well as other risks and uncertainties, including but not limited to those detailed herein
and from time to time in ArvinMeritor’s Securities and Exchange Commission filings.
2
Agenda
Company Profile
Winning with the 3Rs
Profitable Growth Opportunities
Segments and Outlook
Summary
3
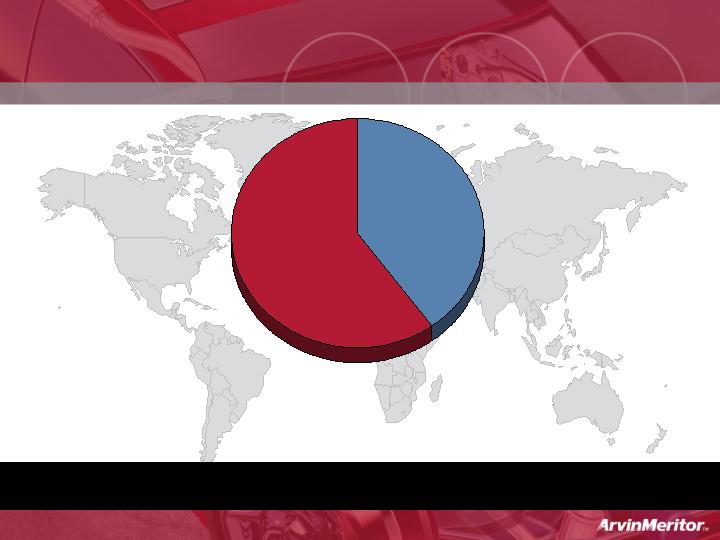
Two Focused Businesses
Market Diversity
Commercial
Vehicle
Systems
Light
Vehicle
Systems
60%
40%
Total Sales = $8.0B
Continuing Operations
FY 2004
4
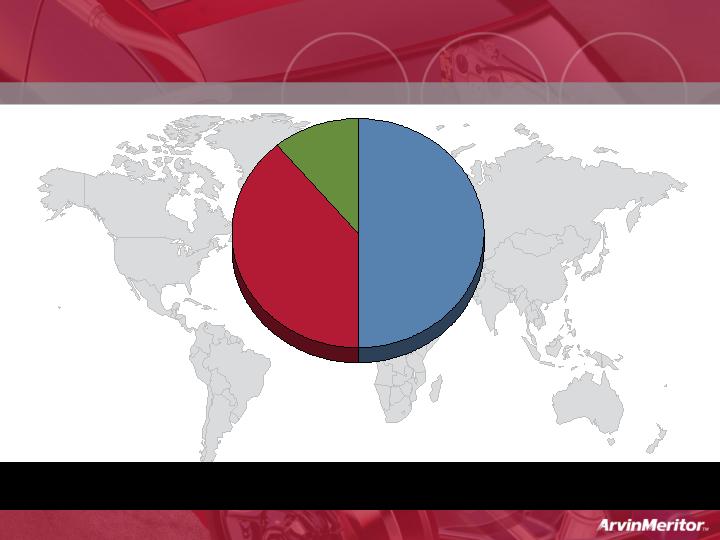
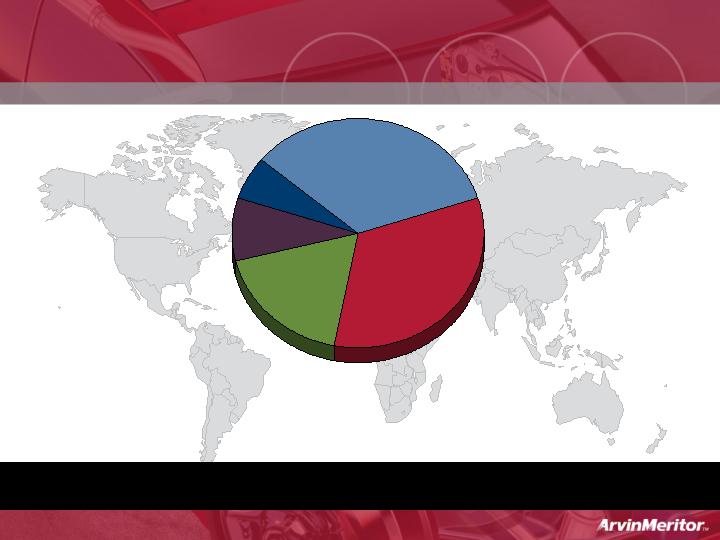
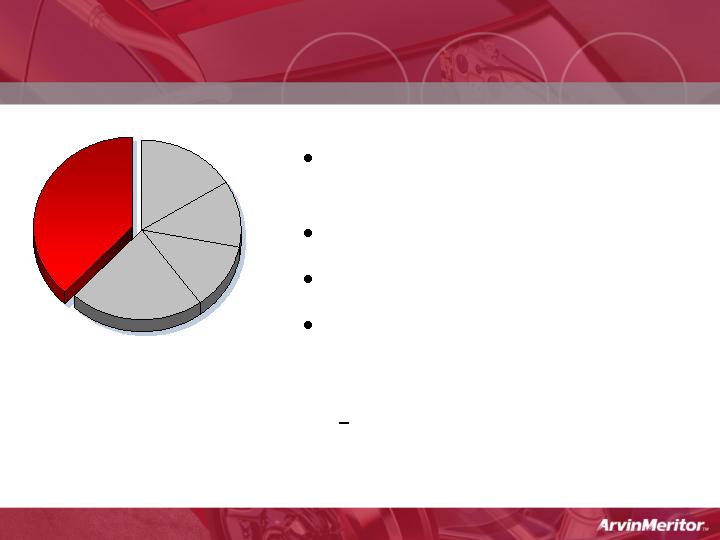
Geographic Split
Geographic Diversity
North
America
Europe
39%
50%
Total Sales = $8.0B
Continuing Operations
FY 2004
11%
Asia and
Other
5
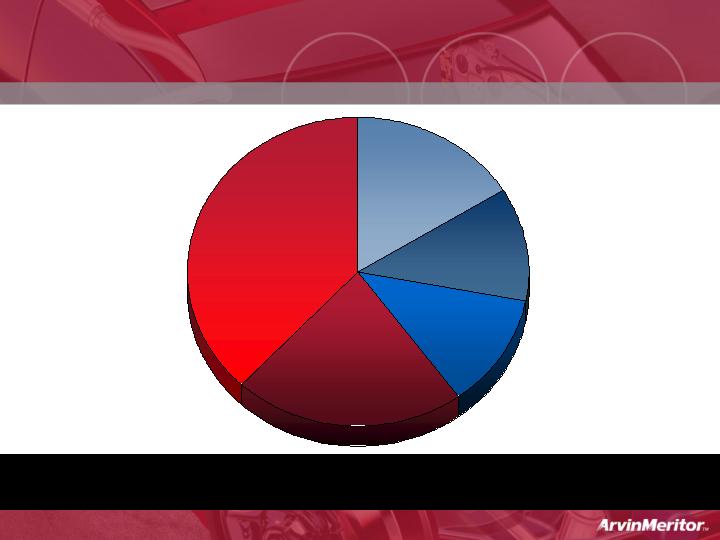
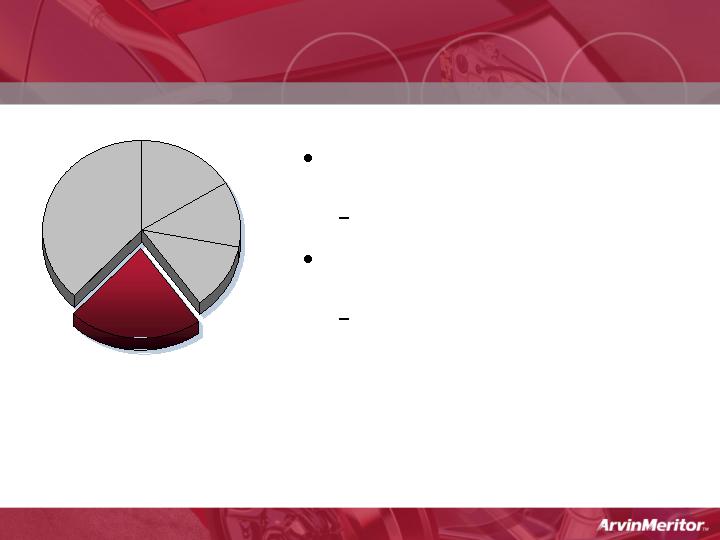
Product Line
Product Diversity
CVS –
Undercarriage
and Drivetrain
LVS –
Undercarriage
33%
34%
Total Sales = $8.0B
Continuing Operations
FY 2004
18%
9%
6%
LVS –
Emission
Technology
LVS -
Aperture
CVS -
Specialty
6
Agenda
Company Profile
Winning with the 3Rs
Profitable Growth Opportunities
Segments and Outlook
Summary
7
The 3Rs
Rationalize
Initiate
and
Execute
3Rs
Regenerate
Refocus
8
3Rs Update
Rationalize
400-500 salaried reductions
Closed 5 facilities over the
last two years
Focused and intense cost
reductions
Closing 11 facilities
Integrating and
consolidating other facilities
Efficient asset utilization
Expand margins
Align capacity to market
Higher return on assets
Refocus
Sold Roll Coater
Sold Automotive Stamping
Components
Sold Central Tubing Facility
Sold Trailer Axle Beam
Manufacturing Operation
Sell LVA (North America)
Sell LVA (Europe)
Evaluating all business lines
Sell other non-core and
non-performing businesses
Concentrate and focus on
businesses that generate
cash and strengthen
financial position
Regenerate
Volvo – RVI axles
Net new business
Hyundai doors
Strong CVA sales
On-Trac support
CVS new emission
technology contracts
Toyota emissions
Asia FAW brakes
Lexus steering (MSSC)
Fill strategic gaps
Bolt-on acquisitions,
alliances, and
partnerships
Expand global presence
China
India
Emissions 2007 - 2010
What have we done?
What are we doing now?
Where are we going?
9
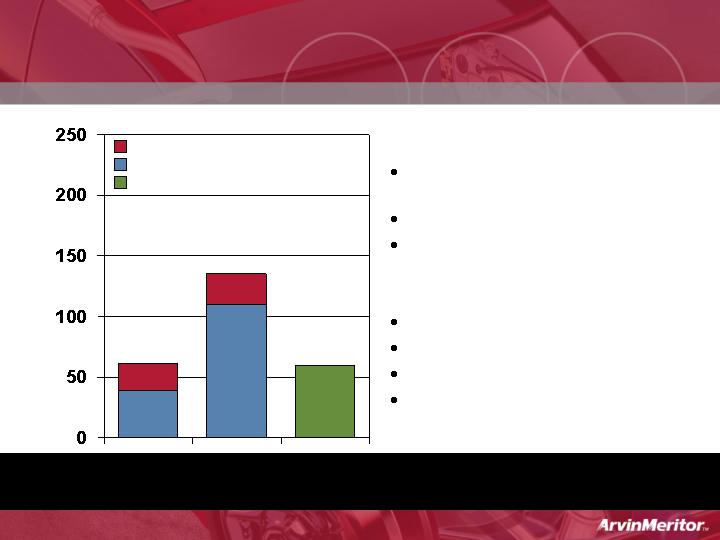
New Restructuring Actions
Summary of Plan
400-500 global salaried
employees
Close 11 facilities largely in LVS
Integration and consolidation of
other facilities
Benefits
Take out excess capacity
Improve fixed cost
Improve operational efficiencies
Improve manufacturing footprint
$23
$25
Non-Cash Costs
Cash Costs
Annual Savings
$39
$62
$110
$135
($ in millions)
Savings
Costs
2Q Charge
Remainder of Charges – Approximately $73M – to be
Incurred in the Next 12 - 18 Months
$50-$60
10

Agenda
Company Profile
Winning with the 3Rs
Profitable Growth Opportunities
Segments and Outlook
Summary
11
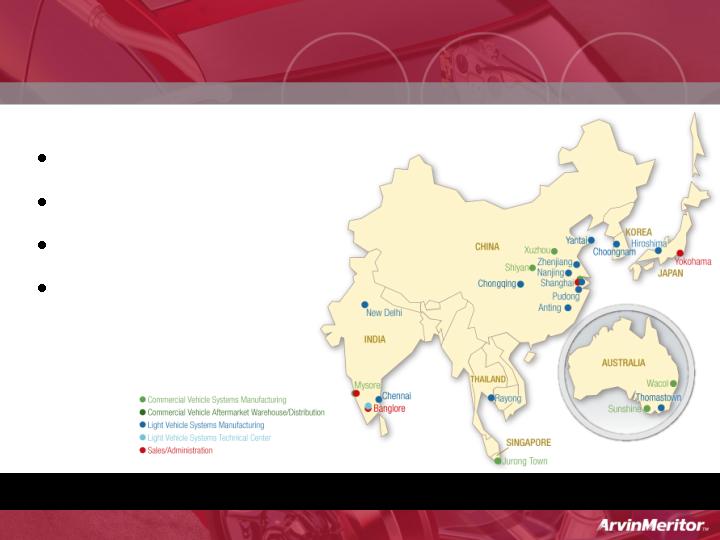
Expanding Our Global Presence in
Asia/Pacific
FY04 sales $397M
7 countries
24 sites
~2,100 employees
Global Strategy
12
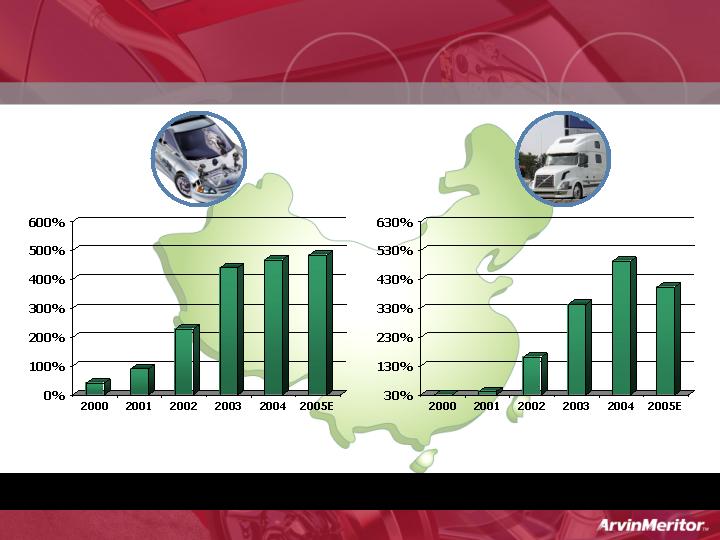
Year-Over-Year Growth in China
Light Vehicle Systems
Commercial Vehicle Systems
Global Growth Strategy
13
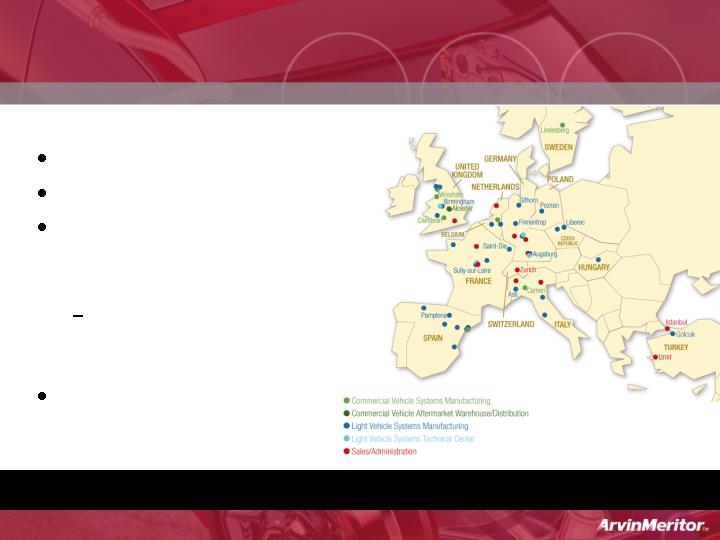
Presence in Europe
FY04 sales $3.2B
12 countries
14 major
manufacturing and
distribution operations
Additional facilities
located throughout
Europe
~10,000 employees
Global Strategy
14
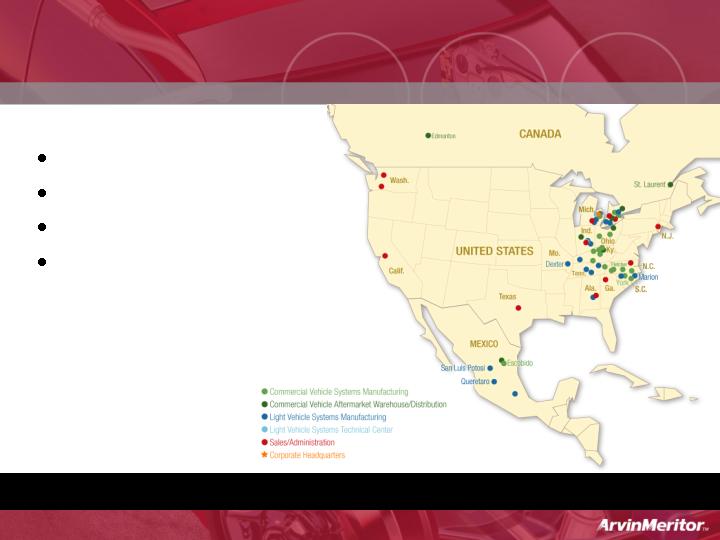
Presence in North America
Global Strategy
FY04 sales $4.0B
3 countries
60 sites
~15,000 employees
15
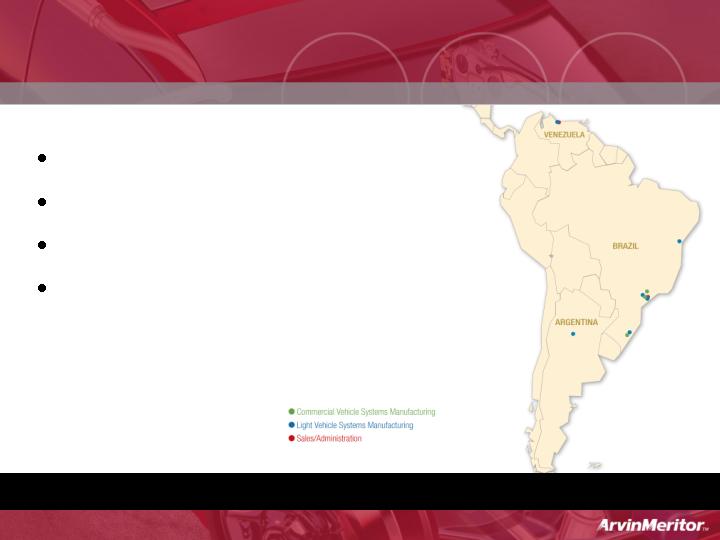
FY04 sales $312M
Three countries
Eleven sites
~2,500 employees
Global Strategy
Presence in South America
Note: Does not include discontinued operations
16

Unconsolidated joint ventures financial performance is strong
Sales $1.1B and Net Income of $56M
$600M in consolidated sales
Strong cash dividends
Total assets of unconsolidated joint ventures $454M
Twelve emerging market JVs
Taking advantage of domestic growth and export opportunities
Most are market leaders in their region
Joint Ventures Add to Success
17
Future Direction
LVS
Components:
Axles
Brakes
Suspensions
Drivelines
Controls
Sourcing
Design
Engineering
Suspension
Module
SYNERGIES
Integrated
Systems/
Modules
Total System
Design
Engineering
Expertise
Components:
Axles
Brakes
Suspensions
Drivelines
Controls
CVS
Future
Today
Undercarriage Growth Strategy
Worldwide Emissions Regulations
Emissions Growth Strategy
EPA ’98
EPA ’04
Euro IV
Euro III
Euro II
Euro I
Japan ‘05
Projected
Euro
III=
2010
Euro IV=
2006
Euro IV=
2010
Euro III= 2006
Euro IV= 2009
Euro III= 2007
Euro IV=2010
Euro IV=
20??
EPA ‘04=
2007
Euro V= 2008
Euro VI=2011
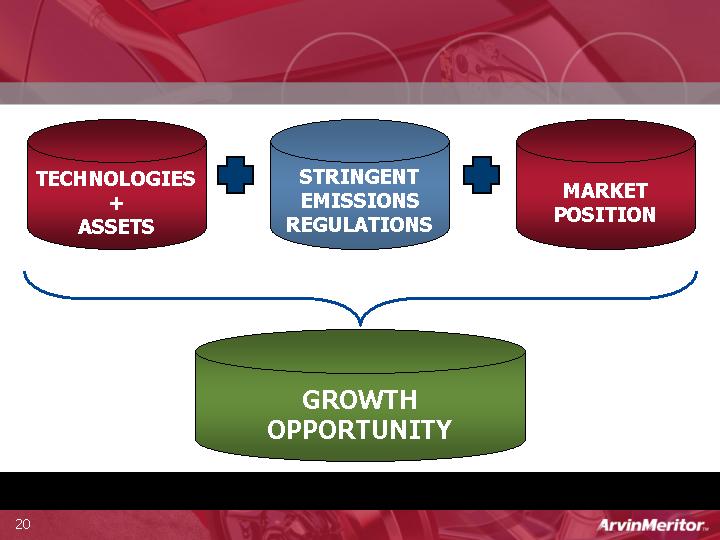
Significant Diesel Emissions Opportunity
LVS
CVS
EURO 4 & 5, US 2007 & 2010
JAPAN 2005
Emissions Growth Strategy
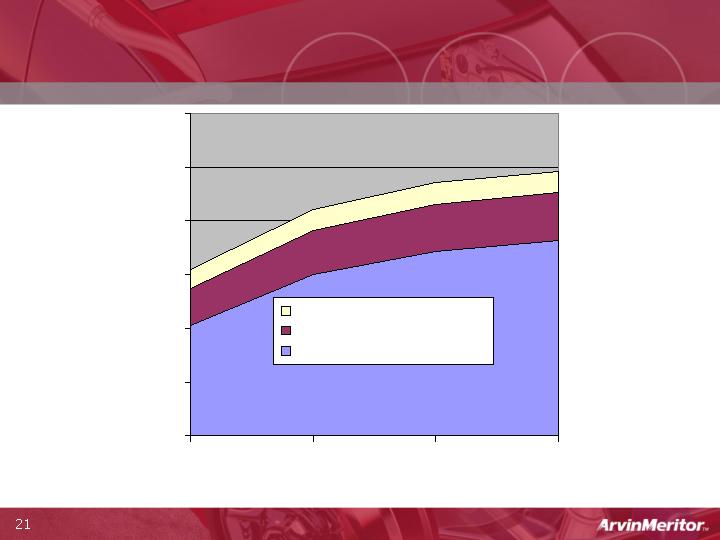
LVS Awarded Contract Volumes
Worldwide*
* Confirmed Business Only (Dec. 2004)
Calendar Years
$-
$50m
$100m
$150m
$200m
$250m
$300m
2005
2006
2007
2008
Manifold
NVH (mufflers)
DOC/DPF
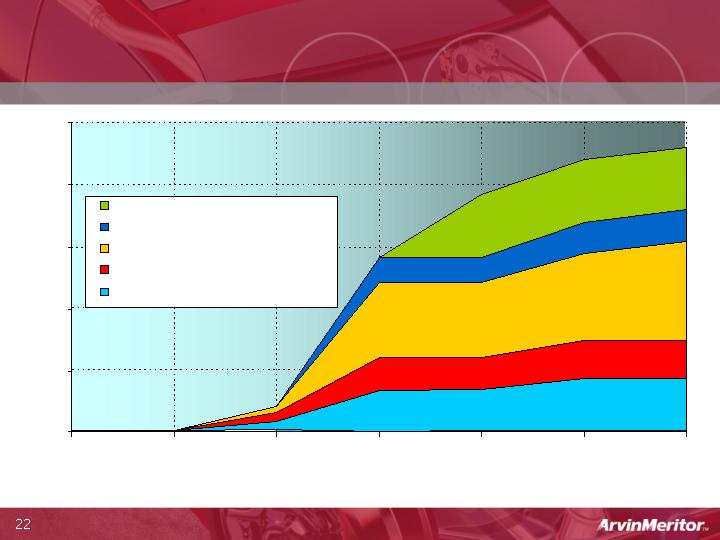
CVS Awarded Contract Volumes
Europe and U.S.*
* Confirmed Business Only (Dec. 2004)
0
$50m
$100m
$150m
$200m
$250m
2003
2004
2005
2006
2007
2008
2009
Calendar Years
U.S. HD Truck PM Filter
European HD Engine PM Filter
European MD PM Filter
European HD Truck SCR
European HD/MD Truck SCR
Agenda
Company Profile
Winning with the 3Rs
Profitable Growth Opportunities
Segments and Outlook
Summary
23
Building Resilience
to Market and Customer Risk
Well-Defined Short-Term Strategies
and Actions for Each Segment
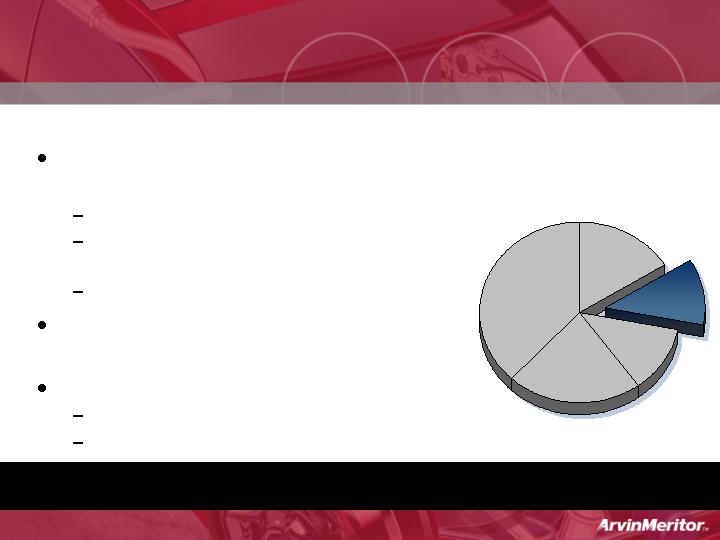
N.A. OEM
Truck & Trailer
Sales
16%
FY 2004
Europe &
ROW
OE Sales
12%
CV
Aftermarket &
Specialty
OEMs
12%
N.A. Big 3 LVS
OEM Sales
20%
Other LVS
OEM Sales
40%
Commercial
Vehicle
Systems
40%
Light
Vehicle
Systems
60%
24
CVS N.A. OEM Truck and Trailer
Manage through economic cycles
Profitable during downturn
Layered capacity in developing
countries (Mexico, Brazil, Turkey, India)
Selling non-core assets
Leverage extensive and established
sales and service network
Seize emissions opportunity
Leverage “component” strength to
enter systems and modules business
N.A. OEM Truck
& Trailer Sales
16%
Successfully Managing Cyclicality
Class 8
10%
Class 5-7
3%
Trailers
3%
25
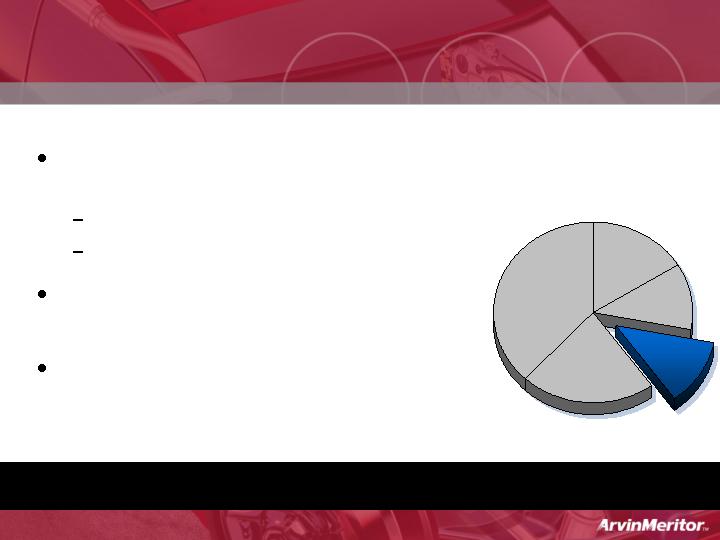
CVS Europe and Rest-of-World OEM
Successfully de-integrate OEMs
drivetrain business
Volvo/RVI axle and brake business
Emerging market opportunities (India
and China)
Other European OEMs
Leverage manufacturing footprint to
expand margins
CV Emissions business opportunity
SCR for Euro IV
Several contracts won
Europe & ROW
OEM Sales
12%
Continuing Growth Opportunities
26
CV Aftermarket and Specialty OEM
Leverage brand and distribution
channel to expand share and content
Growing brake business
Growing remanufacturing business
Synergies between OEM and
aftermarket
Core competencies in developing
mechanically complex and low-
volume specialty products
CV Aftermarket
& Specialty OEs
12%
Highly Stable and Profitable Business
27
Selective growth; manage for
margins
Exhaust, apertures
Selective growth; manage for
returns on invested capital
Suspension modules
N.A. Big Three Light Vehicle OEM Sales
N.A. Big Three
LVS OEM Sales
20%
28
Continue aggressive cost
reduction programs
Right-size manufacturing capacity
Flawless product launches
Continue growth in emerging
markets and with Asian OEMs in
North America
China, Korea, India
Other LVS OEM Sales
ROW LVS
OEM Sales
40%
29
CVS 2007 vs. 2001 – N.A. Truck Market
2001 Downturn
Class 8 market declined 50%
(to 150,000)
CVS OE business in NA ~ 60%
CVS business slightly profitable
(before restructuring)
ARM generated $188M in free
cash flow (lower working
capital)
2007 Downturn
Market expected to decline
less (~ 35%)
CVS OE business in NA <50%
CVS business profitability
expected to be higher
ARM free cash flow expected
to be healthy
2007 Downturn Not Expected to be as Severe When
Compared to the 2001 Downturn
30
Agenda
Company Profile
Industry Challenges
Winning with the 3Rs
Profitable Growth Opportunities
Summary
31

Financial Performance Improvement
CVS volumes and performance strong
Savings from restructuring initiatives and
productivity programs beginning to be realized
Impact of steel moderating
Managing through lower GM and Ford production
volumes
Q3 and Full Year Guidance Expected to be at the Top of
the Range

Appendix
33
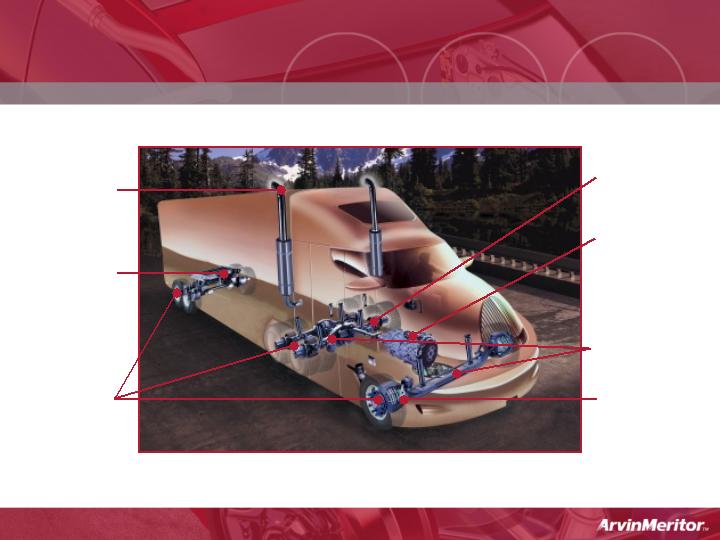
ABS, air
system and
stability
controls
Emissions
systems
Complete
Braking
systems
(wheel ends
and brakes)
Drivelines
Automated
transmissions
/clutch
Front and
rear axles
CVS Product Portfolio
Trailer and
suspension
systems
34
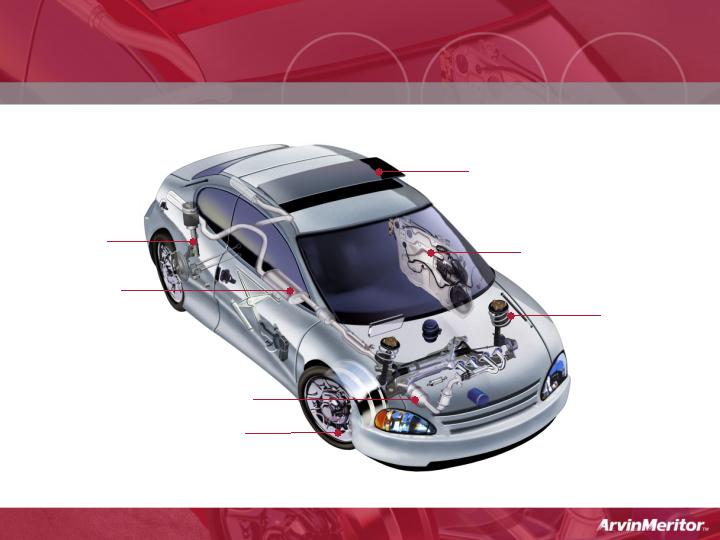
LVS Product Portfolio
Roof systems and modules
Door systems
and modules
Suspension
components
(coil
springs,
stabilizer
and torsion
bars)
Steel wheels
Emission systems
Suspension
modules
Exhaust
systems
35