
8th Annual JPMorgan Harbour Auto Conference
August 1, 2005
James D. Donlon, III
Sr. Vice President and CFO

Cautionary Statement Concerning
Forward-Looking Statement
This presentation contains “forward-looking statements” as defined in the Private
Securities Litigation Reform Act of 1995. These forward-looking statements are based
on currently available competitive, financial and economic data and management’s
views and assumptions regarding future events. Such forward-looking statements are
inherently uncertain, and actual results may differ materially from those projected as
a result of certain risks and uncertainties, including but not limited to global economic
and market conditions; the demand for commercial, specialty and light vehicles for
which the company supplies products; risks inherent in operating abroad, including
foreign currency exchange rates and potential disruption production and supply due
to terrorist attacks or acts of aggression; availability and cost of raw materials,
including steel; OEM program delays; demand for and market acceptance of new and
existing products; reliance on major OEM customers; labor relations of the company,
its customers and suppliers; the financial condition of the company’s suppliers and
customers, including potential bankruptcies; successful integration of acquired or
merged businesses; achievement of the expected annual savings and synergies from
past and future business combinations; success and timing of potential divestitures;
potential impairment of long-lived assets, including goodwill; competitive product and
pricing pressures; the amount of the company’s debt; the ability of the company to
access capital markets; the credit ratings of the company’s debt; the outcome of
existing and any future legal proceedings, including any litigation with respect to
environmental or asbestos-related matters; as well as other risks and uncertainties,
including but not limited to those detailed herein and from time to time in
ArvinMeritor’s Securities and Exchange Commission filings.
2

Agenda
ArvinMeritor Business Overview
3rd Quarter Results
Outlook
3
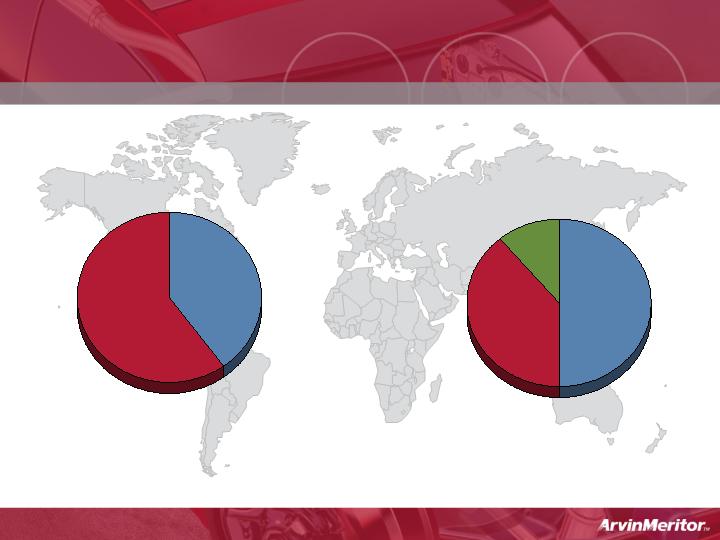
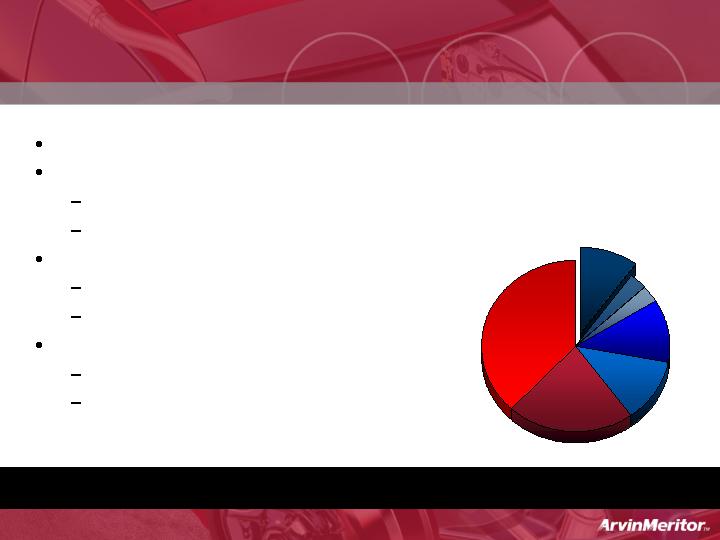
Diversified Global Company
North
America
39%
50%
11%
Asia and
Other
Europe
Commercial
Vehicle
Systems
Light
Vehicle
Systems
60%
40%
Business Segments
39%
11%
Geographic Sales
LVS sales are 55% and CVS sales are 45% for the first nine months of 2005
FY 2004
4
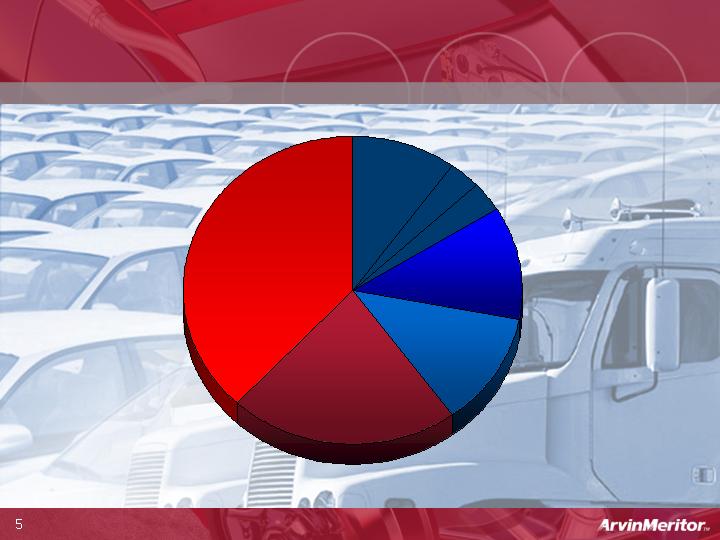
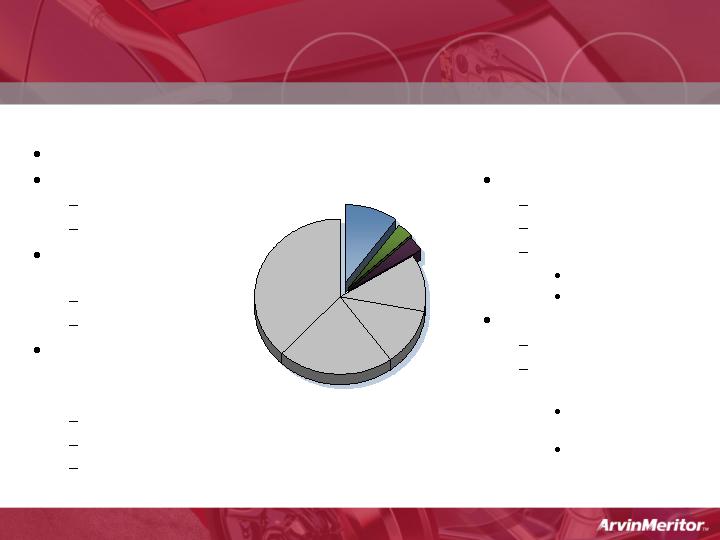
FY 2004
N.A. OEM Truck
& Trailer Sales
16%
Europe &
ROW
OE Sales
12%
CV Aftermarket
&
Specialty OEMs
12%
N.A. Big 3
LVS OEM
Sales
20%
Other LVS
OEM Sales
40%
Diversified Global Company
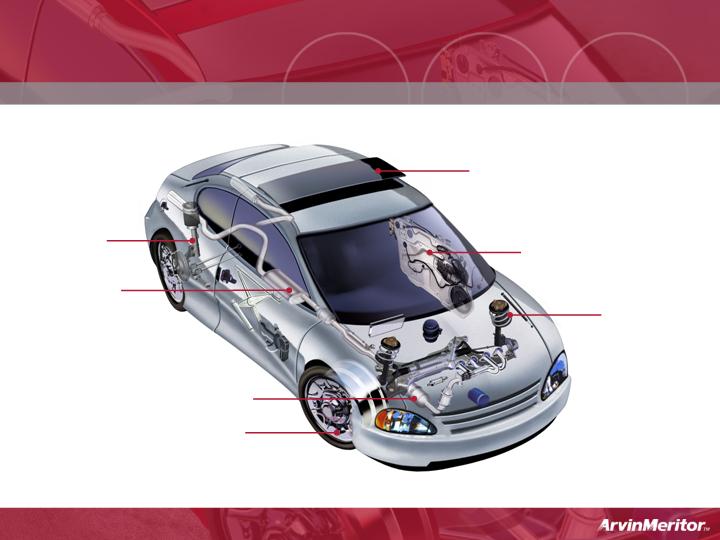
Light Vehicle Systems
Product Portfolio
Roof systems and modules
Door systems
and modules
Suspension
components
(coil
springs,
stabilizer
and torsion
bars)
Steel wheels
Emission systems
Suspension
modules
Exhaust
systems
6
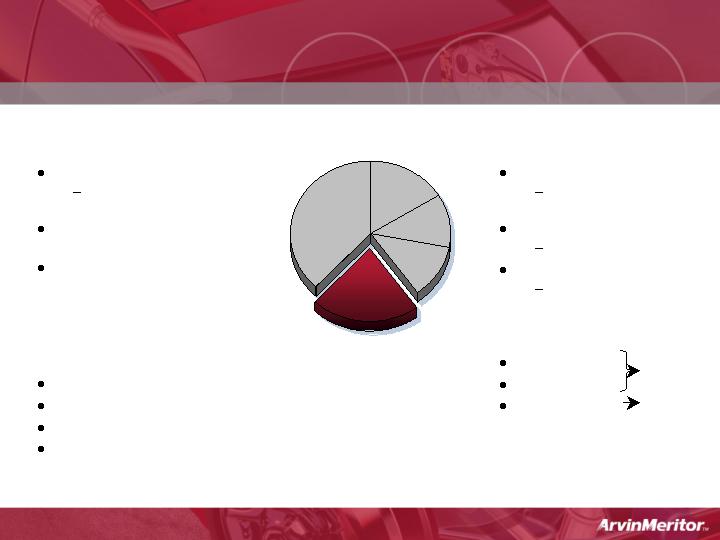
Light Vehicle Systems
Strengths
Diversified
N.A. Big 3 only 20%
of total sales
Diverse product
portfolio
LVS emissions
technology being used
in heavy truck
solutions
Issues
Low operating margins
Steel
Excess capacity
Focus of product lines
3 Rs Actions
Restructure
Eliminate excess
capacity
Refocus
Evaluate portfolio
Regenerate
Grow profitable
business product
lines
Timetable
Restructure
Refocus
Regenerate
N.A. Big Three
LVS OEM Sales
20%
FY05/06
FY06/07
7
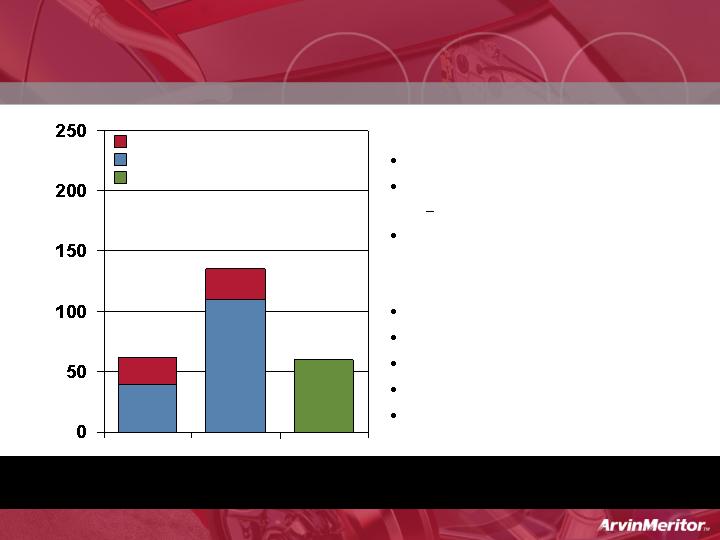
Restructuring Actions
Summary of Plan
400-500 global salaried employees
Close 11 facilities largely in LVS
1,850 additional employees
Integration and consolidation of
other facilities
Benefits
Take out excess capacity
Improve fixed cost
Improve operational efficiencies
Improve manufacturing footprint
Full Year savings expected in 2007
$24
$25
Non-Cash Costs
Cash Costs
Annual Savings
$44
$68
$110
$135
($ in millions)
Savings
Costs
Q2 & Q3
Charges
$50 - $60
Remainder of Charges – Approximately $67M –
to be recorded in the Next 12 - 15 Months
8
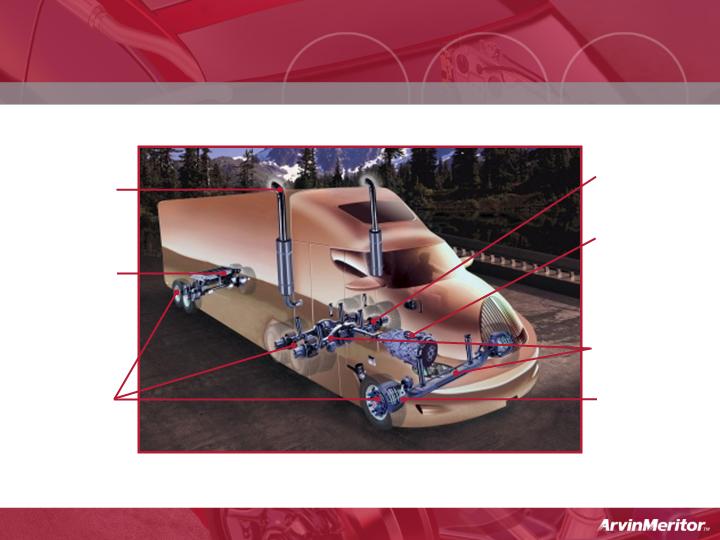
ABS, air
system and
stability
controls
Emissions
systems
Complete
Braking
systems
(wheel ends
and brakes)
Drivelines
Automated
transmissions
/clutch
Front and
rear axles
Commercial Vehicle Systems
Product Portfolio
Trailer and
suspension
systems
9
Heavy Truck Systems
Strengths:
Focused portfolio
Diversified
Customer
Geography
Strengths in “hot”
areas
Emissions
Safety
Strong global
markets
3rd Quarter, 2005
30% growth
Operating margins
6.5% (before special
items)
Issues/Opportunities:
Steel
Moderating prices
Supply good
Opportunities
Supply source
Product Design
2007 N.A. Downturn
Not as severe
ARM better
positioned
10% N.A. heavy
truck
Strong emissions
solutions
Class 8
10%
Class 5-7
3%
Trailers
3%
N.A. OEM Truck
& Trailer Sales
16%
10

Steel Impact
Basic steel costs moderating
Specialty steels still generating headwind
$20 million net impact in Q3, 2005
$100 million full year net impact
11
2007 Heavy Truck Downturn
Not as severe as 2001 downturn (30-35% vs. 50%)
Diversified customer base
Volvo JV
Hino
Diversified product portfolio
Commercial Vehicle Emissions
Aftermarket
Diversified globally
Asia
Europe
Well Positioned to Maintain Strong Performance
N.A. Class 8 Sales
10% of Company
12
Third-Quarter Results (Before Special Items)
80 bps
5.7%
6.5%
$ 0.09
$ 0.61
$ 0.70
$ 3
$ 48
$ 51
(80)bps
2.7%
1.9%
$ 6
$ 42
$ 48
$ 14
$ 82
$ 96
$ 312
$ 2,099
$ 2,411
Increase/
(Decrease)
Third-Quarter
FY 2005 FY 2004
Continuing Operations (LVS, CVS)
Sales
Operating Income
Income
Diluted EPS
Free Cash Flow
Operating Margin
CVS
LVS
Met High End of Guidance
13

Full-Year FY 2005 Outlook
(In millions, except EPS)
$ 1.40
$ 97
2.5%
$ 8,750
Full Year
FY 2005
-
-
-
-
$ 1.60
$ 110
2.8%
$ 8,825
Diluted EPS
Income
Operating Margin
Sales
Continuing Operations (Before Special Items)
Focused on Achieving Full-Year Results at the Top End
of Earnings Range
14

2006 Outlook
Continued Strong Truck Markets Globally
Restructuring Gains Traction
Moderating Steel
Earnings Headwind from Pensions
Stronger Cash Flow
14

Appendix
1

Use of Non-GAAP Financial Information
In addition to the results reported in accordance with accounting principles generally accepted in the
United States (“GAAP”) included throughout this presentation, the Company has provided information
regarding income from continuing operations, diluted earnings per share and segment operating income
and margins before special items which are non-GAAP financial measures. These non-GAAP measures
are defined as reported income or loss from continuing operations, reported diluted earnings or loss per
share and segment operating income plus or minus special items.
Management believes that the non-GAAP financial measures used in this presentation are useful to both
management and investors in their analysis of the Company’s results of operations. In particular,
management believes that income from continuing operations, diluted earnings per share and segment
operating income and margins before special items is a better summary of the company’s results of
operations. Further, management uses these non-GAAP measures for planning and forecasting in future
periods.
These non-GAAP measures should not be considered a substitute for the reported results prepared in
accordance with GAAP. These non-GAAP financial measures, as determined and presented by the
Company, may not be comparable to related or similarly titled measures reported by other companies.
Set forth on the following slide is a reconciliation of these non-GAAP financial measures to the most
directly comparable financial measures calculated and presented in accordance with GAAP.
2

Reconciliation of GAAP Financial Information to
3rd Qtr FY 05 Results before Special Items
Q3 FY 05
Reported
Restructuring
Q3 FY05
Adjusted
Sales
2,411
$
-
$
2,411
$
Gross Margin
201
-
201
Operating Income
90
6
96
Income from Continuing Operations
44
4
48
Diluted Earnings Per Share - Continuing Operations
0.64
$
0.06
$
0.70
$
Guidance
$0.60 - $0.70
Segment Operating Income
LVS Operating Income
20
$
5
$
25
$
CVS Operating Income
72
1
73
Segment Operating Income
92
6
98
Unallocated Corporate Costs
(2)
-
(2)
Total Operating Income
90
$
6
$
96
$
Operating Margins
LVS
1.5%
1.9%
CVS
6.4%
6.5%
Segment Operating Margins
3.8%
4.1%
Total Operating Margins
3.7%
4.0%
3