
Analyst Day 2005
1

Forward-Looking Statement
This presentation contains statements relating to future results of the company (including certain
projections and business trends) that are “forward-looking statements” as defined in the Private
Securities Litigation Reform Act of 1995. Forward-looking statements are typically identified by
words or phrases such as “believe,” “expect,” “anticipate,” “estimate,” “should,” “are likely to be,”
“will,” and similar expressions. Actual results may differ materially from those projected as a
result of certain risks and uncertainties, including, but not limited to, global economic and market
conditions; the demand for commercial, specialty and light vehicles for which the company
supplies products; risks inherent in operating abroad (including foreign currency exchange rates
and potential disruption of production and supply due to terrorist attacks or acts of aggression);
availability and cost of raw materials, including steel; OEM program delays; demand for and
market acceptance of new and existing products; successful development of new products;
reliance on major OEM customers; labor relations of the company, its customers and suppliers;
including potential disruptions in supply of parts to our facilities or demand for our products due
to work stoppages; the financial condition of the company’s suppliers and customers, including
potential bankruptcies; successful integration of acquired or merged businesses; the ability to
achieve the expected annual savings and synergies from past and future business combinations;
success and timing of potential divestitures; potential impairment of long-lived assets, including
goodwill; competitive product and pricing pressures; the amount of the company’s debt; the
ability of the company to access capital markets; credit ratings of the company’s debt; the
outcome of existing and any future legal proceedings, including any litigation with respect to
environmental or asbestos-related matters; as well as other risks and uncertainties, including, but
not limited to, those detailed from time to time in the filings of the company with the Securities
and Exchange Commission.
2

Chip McClure
Chairman, CEO and President
Dec. 8, 2005
3

2005 Year in Review
Steel/steel/steel
Tough actions taken
Solved supply issues
Moderating for 2006
Industry turmoil in Light Vehicle Systems (LVS)
Operational improvements
Restructuring (LVS/CVS/Corporate)
On budget and on-track
Divestitures
Completed Roll Coater/17th St.
Achieved $200M in proceeds
Light Vehicle Aftermarket in progress
Met guidance
Delivered results in tough times
4
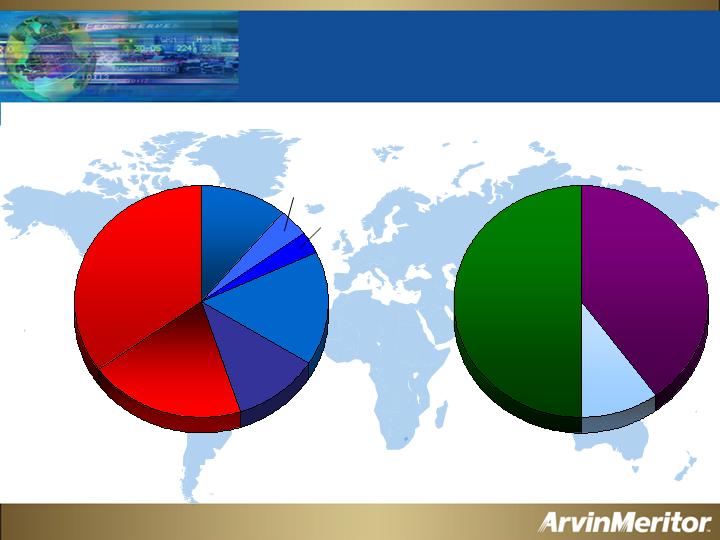
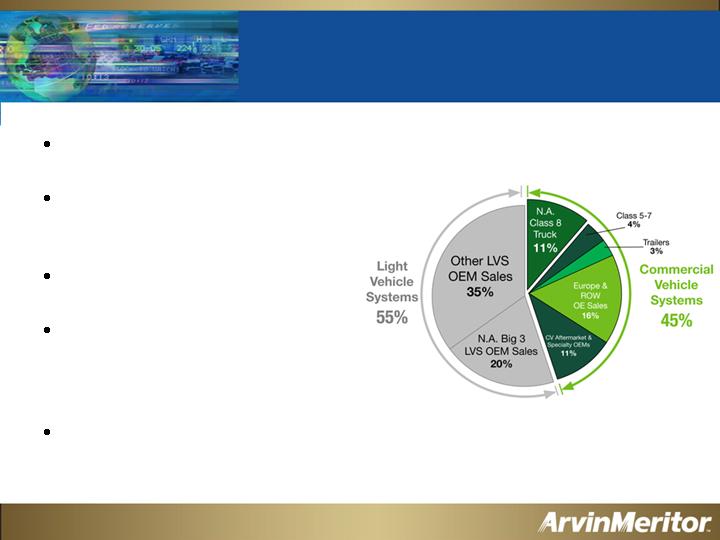
Global Business Diversity
Light
Vehicle
Systems
55%
Commercial
Vehicle
Systems
45%
North
America
50%
Europe
40%
Rest of
World
10%
Other LVS
OEM Sales
35%
N.A. Big 3
LVS OEM
Sales
20%
N.A.
Class 8
Truck
11%
CV
Aftermarket
& Specialty
OEMs
11%
Europe and
ROW OE
Sales
16%
Class 5-7
4%
Trailers
3%
5

Light Vehicle Systems
Business strategy is
being paced by
market factors
Creating value in
tough environment,
whether we
ultimately hold or sell
Continue to
capitalize on
emissions
technologies
6
Commercial Vehicle Systems
Business focused on
making 2007 a
non-event
Capitalizing on
business strengths,
including emissions
technology
solutions
Growing
aftermarket
business globally
7
Financial Review
Detailed FY06
outlook
Pension
including FY06
EPS impact
Review
financial
health
8
Business Strategy
Redefining our strategic
intent
Drive results to achieve
13-15 percent Return on
Invested Capital (ROIC)
9

Key Points
Strong leadership team
Taking the right actions today
Focused on making 2007
a non-event
Financially healthy
Driving to 13-15 percent ROIC
10

Light Vehicle Systems
Juan De La Riva
President
11
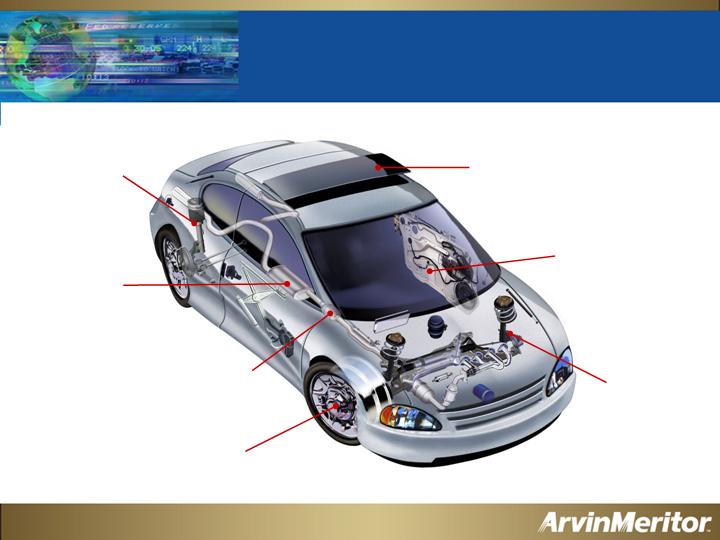
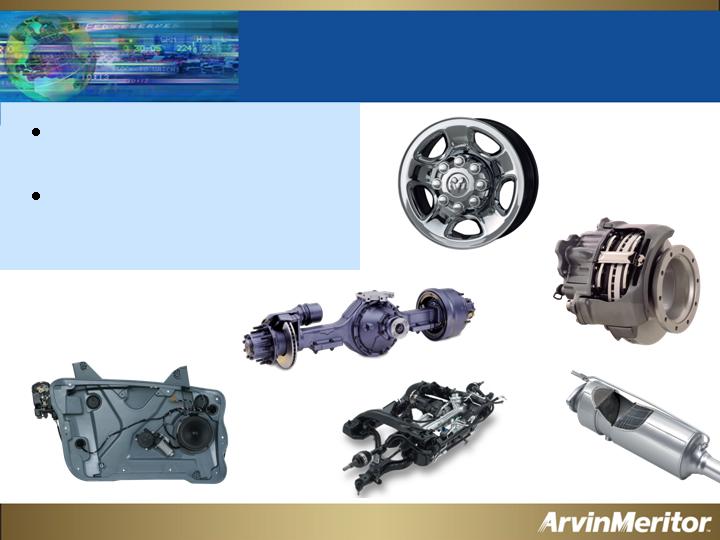
Automotive Product Range
Steel wheels
Suspension
components
Emissions controls
Door systems
and modules
Suspension
modules
Roof systems and modules
Exhaust
systems
12

LVS Geographic Footprint
North America
44%
Asia/Pacific
and Other
9%
Europe
47%
Fiscal Year 2005 Sales of $4.8 Billion
13
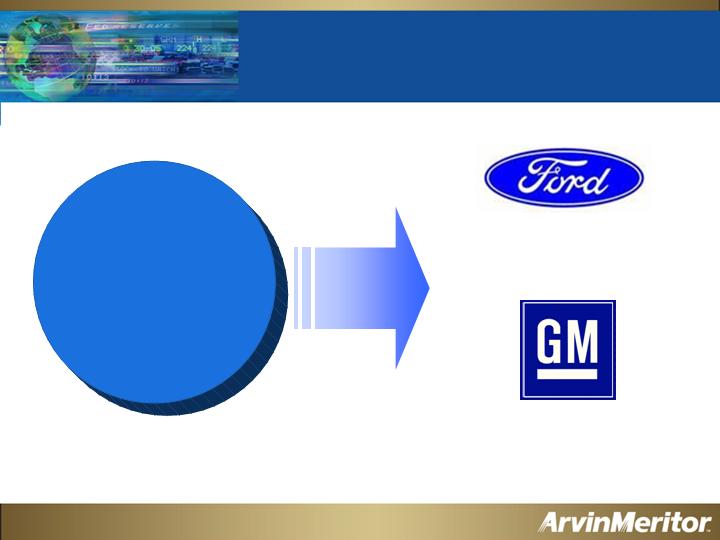
Limited LVS Exposure
to GM and Ford in North America
5%
10%
$3.5B
Value-Added
Sales*
* Total LVS, FY05
14

LVS Sales
17.0
17.0
16.4
16.4
European Volumes*
16.5
16.0
15.6
15.6
N. American Volumes*
$5.0
$1.5
$3.5
FY08
$4.6
$4.6
$4.8
TOTAL Sales
$1.4
$1.4
$1.3
Pass-Through
Sales
$3.2
$3.2
$3.5
Value-Added Sales
FY07
FY06
FY05
in billions
*Company estimates
15

LVS Margins
3.3%
2.0%
1.3%
0.8%
TOTAL Margin
4.7%
FY08
2.9%
1.9%
1.1%
Value-Added
Margin
FY07
FY06
FY05
(Before special items)
16
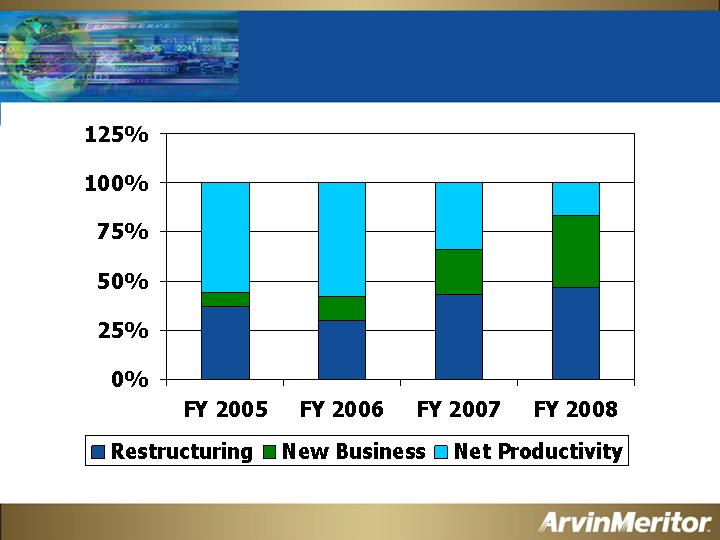
LVS Margin Improvements
17
LVS Restructuring Program
Annual run rate of ~$35M savings
beginning in 2007
May 2005 restructuring program
Downsize
16 percent salaried positions
8 percent hourly positions
Close
9 of 11 recently announced facility
closings in LVS
Divest
17th Street, Columbus, Ind., U.S.
18
Seize Procurement Opportunities
Substantial cost reductions of
raw materials and components
available
Localize supply base in
Asia/Pacific
Must have strong supplier
development in place
Strong support from
Engineering groups essential
LVS Procurement leadership
residing in Shanghai
Moving Rapidly to Reduce Supply Costs
19
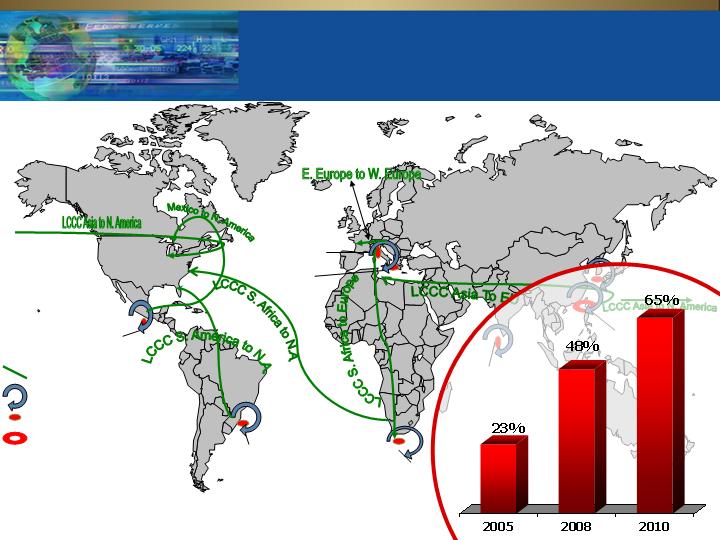
Leading Cost Competitive Country (LCCC)
Supplier Development and Management
Queretaro, Mexico
Limeira, SP Brazil
Cape Town, South Africa
Istanbul, Turkey
Liberec, Czech Republic
Bangalore, India
Shanghai, China
Asia Procurement
Headquarters
Seoul, Korea
LCCC Mexico
LCCC Brazil
LCCC South Africa
LCCC Asia
Global Purchasing Offices
Asia Procurement
Headquarters
LCCC To LCC Spend
LCCC To HCC Spend
Legend
Comprehensive Strategy to Double LCCC Spend by 2008
Leading Competitive Cost Country Sourcing Drives
Global Resource Planning
20
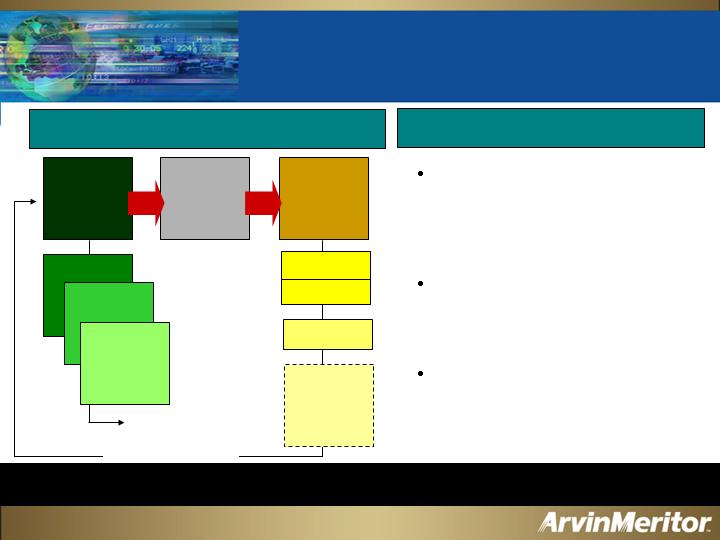
Low-Cost Producer Strategy
MOS
Metrics
Gap
Analysis
Continuous
Improvement
Global
Regional
Plant
PORs & QBRs
EI Teams
White Shirt
AMPS Tools
Plant Level
Line of Sight
to P&L
Impact
Overall Concept
Main Enablers
MOS metrics drive in-plant gap
analysis to identify Continuous
Improvement projects impacting
Performance Operating Profit
(POP) and ROIC
Robust ArvinMeritor Performance
System (AMPS) tools for driving
improvement and sharing
solutions
White Shirt culture engages
employees in self-directed
Employee Involvement teams that
focus on bottom-line results
Continuous Improvement – AMPS Tools – White Shirt Philosophy
Reset Benchmarks
21
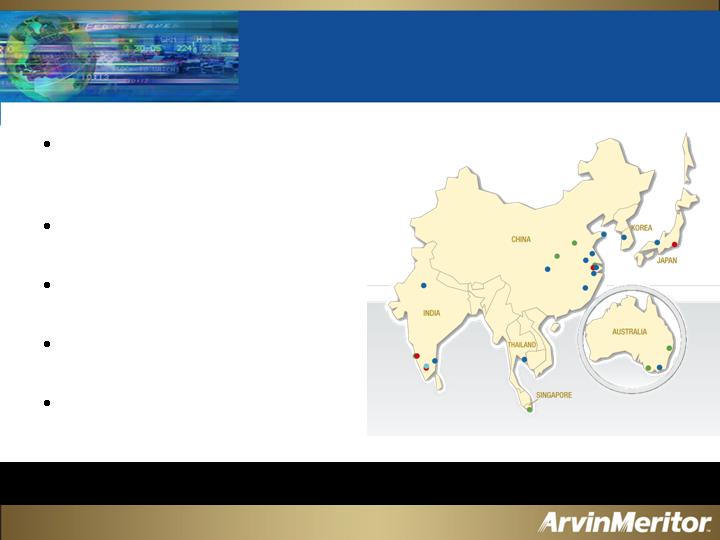
Focus on Asia/Pacific Customers
Emissions Technologies (Korea)
Diesel Particulate Filters (DPFs)
Door Systems (Korea and India)
Door modules and components
Wheels (India and China)
Suspension Components (China)
Asia/Pacific Joint Venture Initiatives
Asia Pacific includes: Australia, China, India, Japan, Korea and Thailand
LVS Asia/Pacific Sales
22
Evaluating Product Portfolio
Reducing capacity/sourcing globally
not enough for some products
Divestures of non-core products/
processes under consideration
Market valuations have become
pacing factor
Continue steps to capture value
throughout evaluation process
23

LVS Emissions Technologies
Michael Bleidt
General Manager and Vice President
24
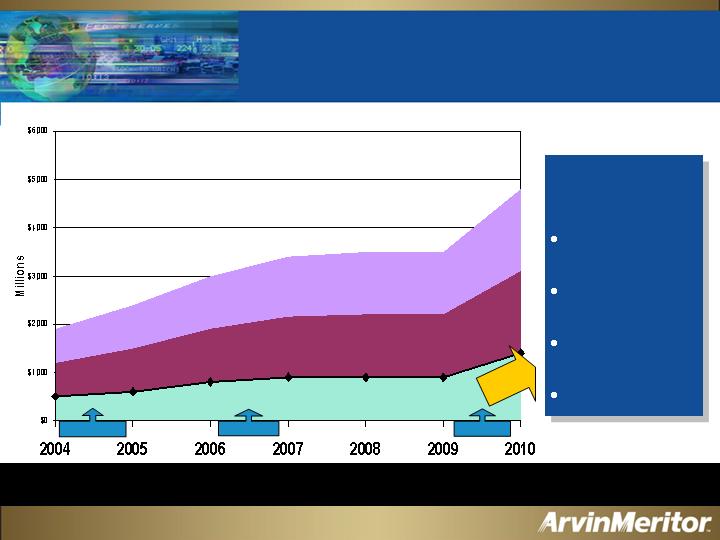
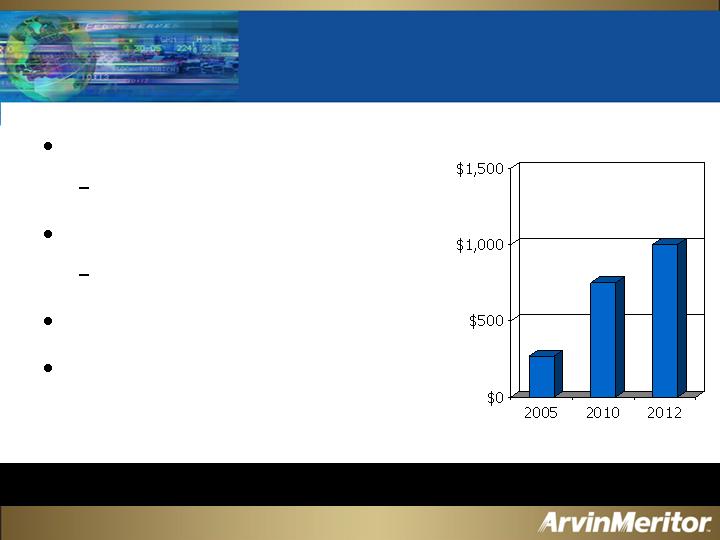
Light Vehicle Diesel After-Treatment
Global Addressable Market
Addressable Market Grows Beyond $1 Billion
Euro 4 / Japan
EPA 2007
Euro 5
Catalyzed Coatings
Ceramic Internals
ARM Value-Added Addressable Market
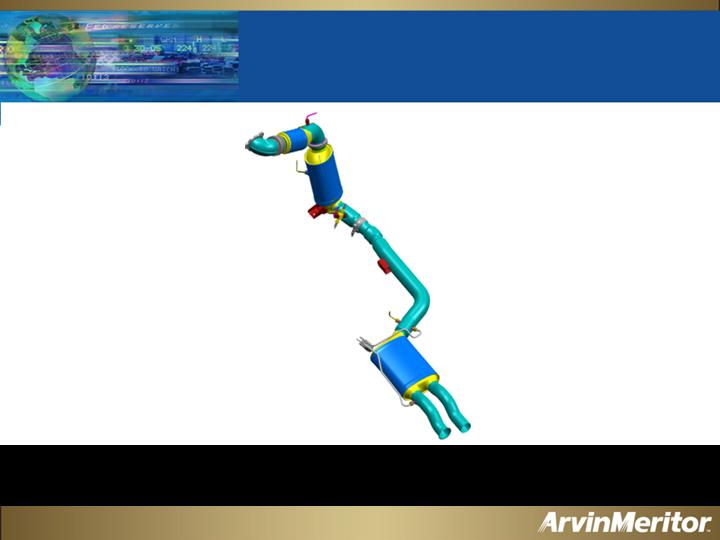
ArvinMeritor
Expertise
Systems design
and integration
Thermal fluid
management
Systems
optimization
Canning
25
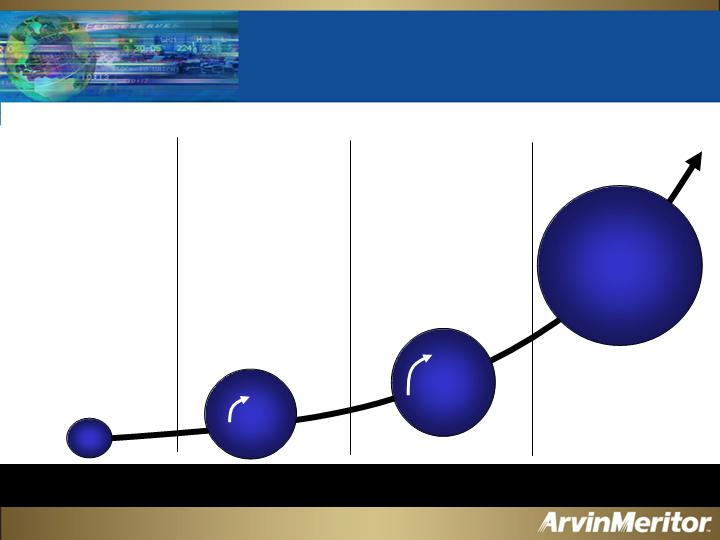
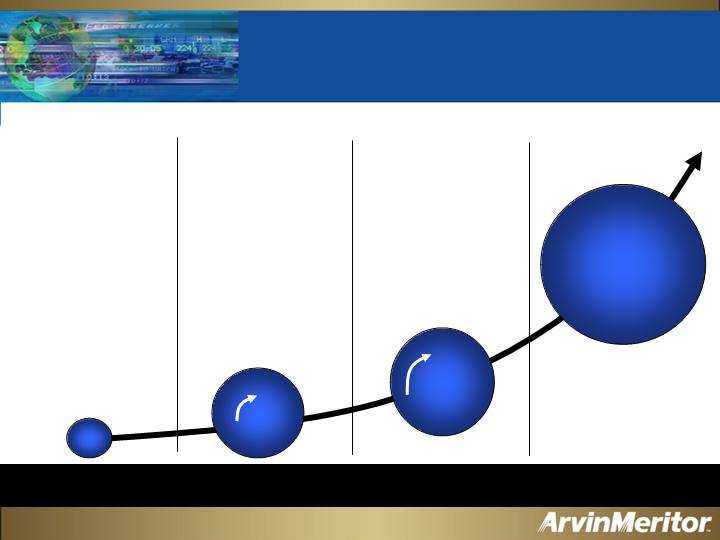
Positioned for
Market Share Leadership
Generation 1
2003-04
Generation 2
2005-07
Generation 3
2008-09
Generation 4
2010+
Leading Product Innovation
33%+
Next
Technology Leap
Lean NOx Traps, SCR/DPF Combinations and DPNR
First
Widespread
Use
Catalyzed DPF without Additive
25%
20%
Maturing Volumes
– Emphasis
on Cost
Affordable, More Efficient Regeneration Port Injection Technology
33%
20%
DPF with Additive
Early Adopters
0%
26
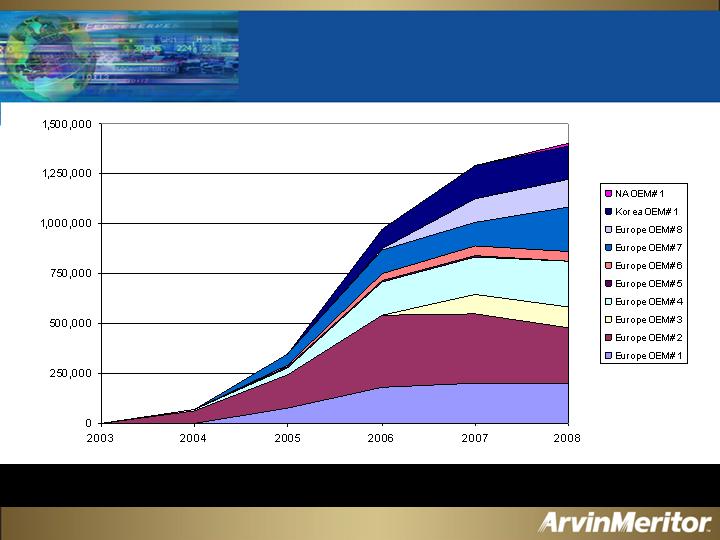
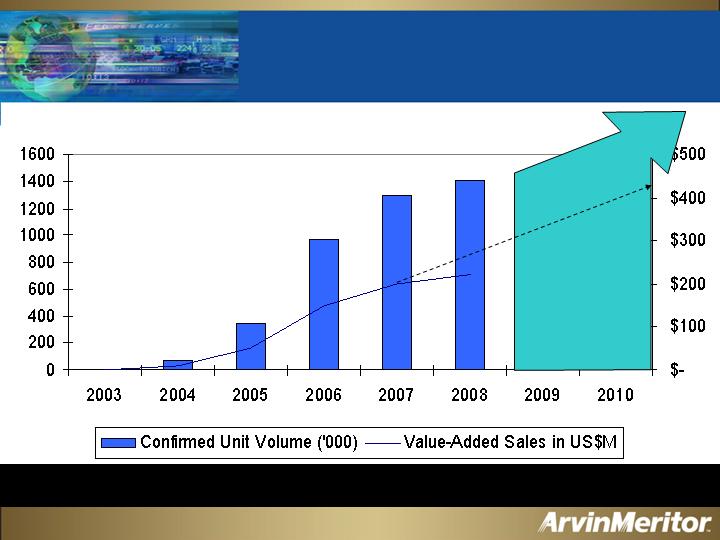
1.4 Million DPF Units Confirmed
DPF Production in Europe, Korea
and North America
27
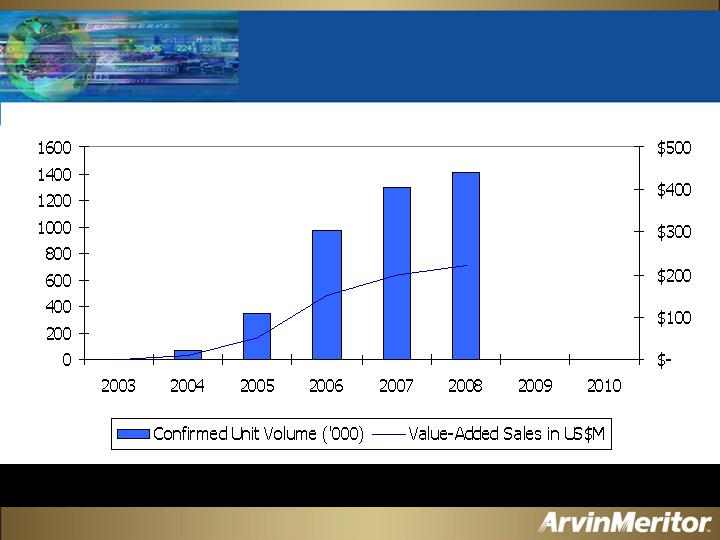
Confirmed DPF Value-Added Sales
35 Percent Market Share of European DPFs
28
Positioned for
Market Share Leadership
Generation 1
2003-04
Generation 2
2005-07
Generation 3
2008-09
Generation 4
2010+
Leading Product Innovation
33%+
Next
Technology Leap
Lean NOx Traps, SCR/DPF Combinations and DPNR
First
Widespread
Use
Catalyzed DPF without Additive
25%
20%
Maturing Volumes
– Emphasis
on Cost
Affordable, More Efficient Regeneration Port Injection Technology
33%
20%
DPF with Additive
Early Adopters
0%
29

Diesel Market Western Europe
14.786
4.746
32,1%
0%
20
14.490
6.694
46,2%
5%
400
15.200
7.904
52,0%
38%
3.000
15.200
8.208
54,0%
100%
8.200
YEAR
Passenger Car-Market
(in 1.000 vehicles)
Passenger Car-Diesel
(in 1.000 vehicles)
Diesel-
Share
Share
Diesel Particulate
Filter
Passenger Car with
Particulate Filter
(in 1.000 vehicles)
2000
2004
2007
2010/12
EURO 4
EURO 5
* Source: Federal Environmental Agency
UBA Estimates of DPF Market
30
System Cost
Regeneration
Efficiency
Oil Dilution
Drivers
* Source: FGP, ATA Congress 09/04
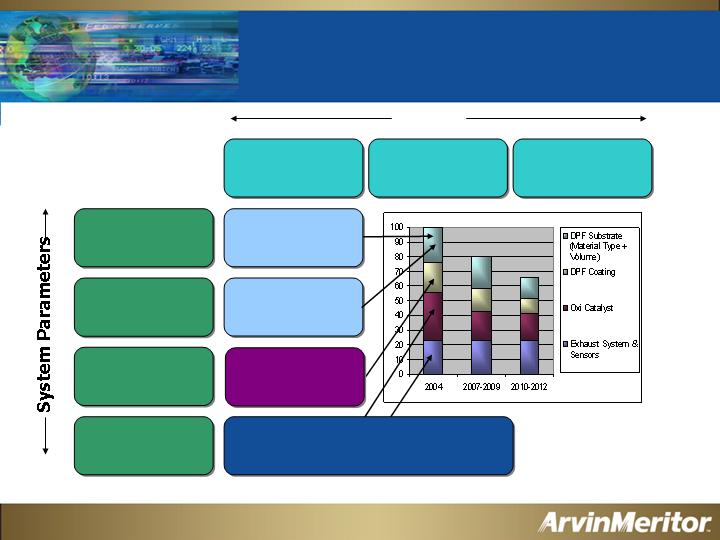
Industry Desperate to Reduce
Diesel-Emissions Related Costs
DPF Volume
Exhaust System/
Layout
Filter Substrate
(Material)
DPF Coating
(Washcoat + PGM)
Reduce Size and Number of DOC;
Move to Close-Coupled DPF
Reduce DPF Size
Find New
Substrate Material
Reduce Platinum
Dependence
Customer’s technical objective
31
Focus ArvinMeritor
Expertise
and Technologies on
Reducing
System Costs
Light Vehicle
Diesel Emissions Strategy
32

Formula for Success
+
=
Vaporizer Enables 20 Percent Cost Reduction
Low-Cost
Diesel Regeneration
System
Proprietary
Port-Injection
Dosing
Technology
Proprietary
Predictive
Software
Core
Competencies
+
33
Positioned for
Market Share Leadership
Leading Product Innovation
Generation 1
2003-04
Generation 2
2005-07
Generation 3
2008-09
Generation 4
2010+
33%+
Next
Technology Leap
Lean NOx Traps, SCR/DPF Combinations and DPNR
First
Widespread
Use
Catalyzed DPF without Additive
25%
20%
Maturing Volumes
– Emphasis
on Cost
Affordable, More Efficient Regeneration Port Injection Technology
33%
20%
DPF with Additive
Early Adopters
0%
34
Generation Four in Development
UREA
Injection + diffuser
DPF
Light PGM loading
SOOT
Capacitor
SCR
Catalyst
Vaporizer
Proven Regeneration Experience
Positions ArvinMeritor as Emissions Leader
35
Strategy Propels Growth
Advanced Products Earning Higher Margins
36

Commercial Vehicle Systems
Tom Gosnell
President
37
Capitalizing on Strengths
Significant volume increases in North America, Europe,
South America and China
(2005 vs. 2004)
+30%
+12%
+16%
+11%
Commercial Vehicle Markets Are Strong Globally
38

Commercial Vehicle
Production Outlook
421
305
FY06
Heavy- and Medium-Duty
Trucks
(Western Europe)
Class 8 Trucks (North America)
Commercial Vehicle Production
(thousands of units)
-
(6%)
% Change
421
324
FY05
39

Capitalizing on Strengths
Well-positioned to capture growth
Firmly entrenched in global markets
European Volvo joint venture
First Auto Works (FAW) joint venture in China
Dynamic product portfolio in “hot” growth areas
Safety/Undercarriage
Aftermarket
Emissions
40

CVS Sales and Margins
6.0%
6.2%
5.2%
Operating Margin
$3.8
$4.0
$4.1
Sales
FY07
FY06
FY05
$ in billions
(Before special items)
41
2007 N.A. Truck Market Cyclicality
Being Well-Managed
Only impacts 11 percent of
total ArvinMeritor business
N.A. downturn not expected to
be as severe (30-35 percent vs.
50 percent)
Global markets expected to
remain strong in 2007
Emissions and aftermarket
growth provide meaningful
offset to potential North
America market decline
Operational improvements
continue in Trailer and
Specialty products
FY05
42

Commercial Vehicle Emissions
Pedro Ferro
Vice President and General Manager
43
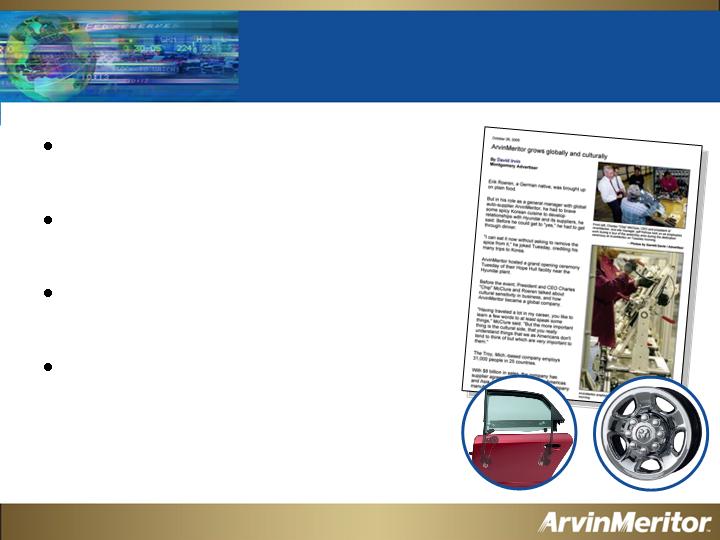
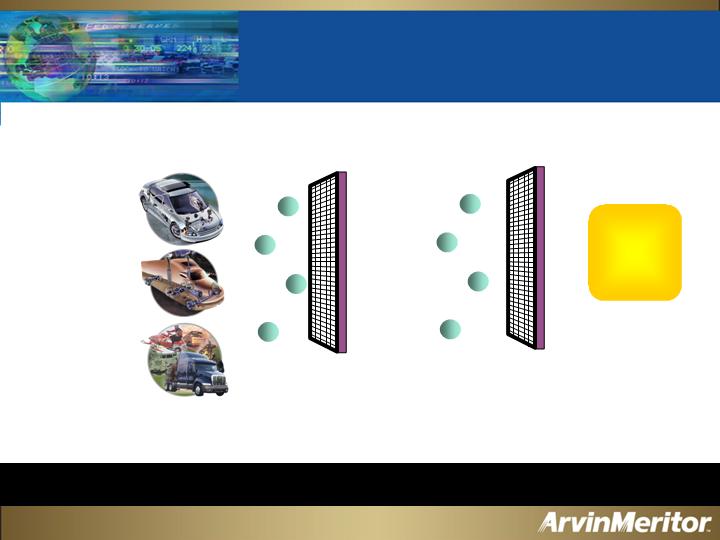
Why ArvinMeritor…
TECHNOLOGIES
+
ASSETS
MARKET
POSITION
+
VEHICLE
DYNAMICS
STRINGENT
EMISSIONS
REGULATIONS
LIGHT VEHICLE SYSTEMS
EMISSIONS TECHNOLOGIES
COMMERCIAL
VEHICLE SYSTEMS
EURO 4 & 5, U.S. 2007 & 2010
JAPAN 2005
MAJOR
GROWTH
BUSINESS
Warton,
U.K.
Columbus,
Ind., U.S.
Troy, Mich., U.S.
44
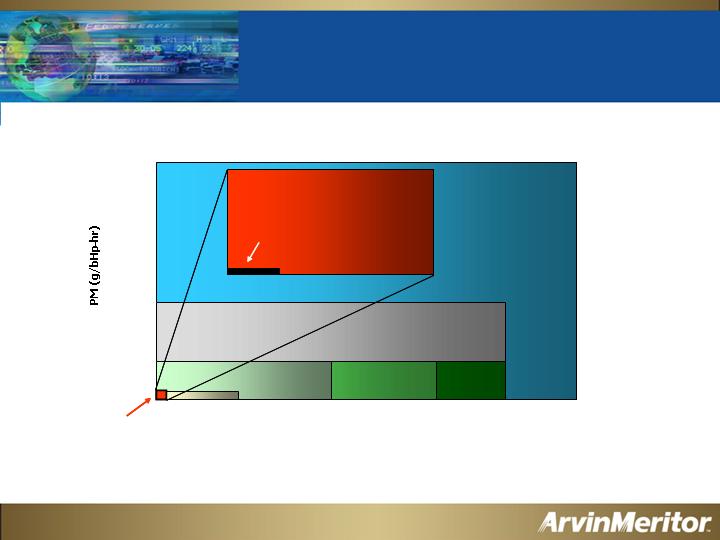
Diesel Emissions Opportunities
NOx (g/bHp
-
hr)
2010
(PM = 0.01, NOx = 0.2)
1988
1991
1994
1998
2002
0
1
4
3
2
5
6
0.1
0.2
0.3
0.4
0.5
0.6
0
1
4
3
2
5
6
0.1
0.2
0.3
0.4
0.5
0.6
NOx (g/bHp
-
hr)
2010
1988
1991
1994
1998
2002
0
0.05
0.2
0.1
0.002
0.004
0.006
0.008
0.01
0.15
2010
2014
(PM = 0.001, NOx = 0.05)
0
0.05
0.2
0.1
0.002
0.004
0.006
0.008
0.01
0.15
2010
2014
Sources: EPA and DieselNet
U.S. Diesel Emissions Standards
45
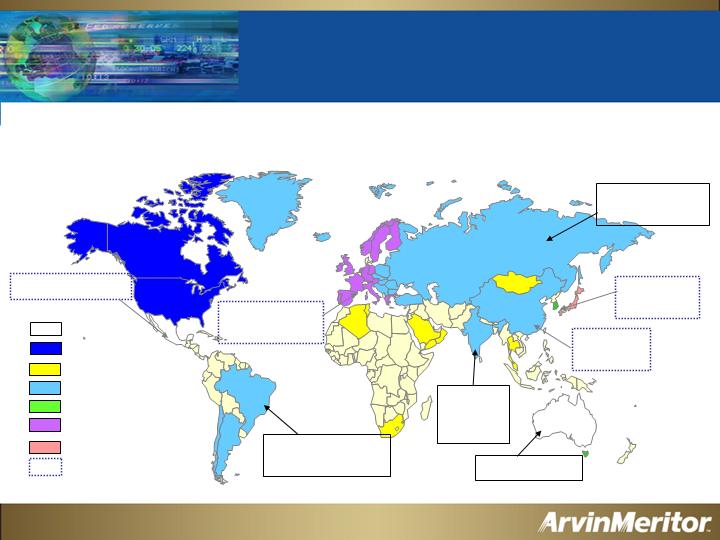
Diesel Emissions Opportunities
EPA ’98
EPA ’04
Euro IV
Euro III
Euro II
Euro I
Japan ‘05
Projected
Euro
III=
2010
EPA ‘04= 2006
Euro IV=
2010
Euro III= 2006
Euro IV= 2009
Euro III= 2007
Euro IV=2010
Euro IV=
20??
EPA ‘04= 2007
Euro V= 2008
Euro VI=2011
Global Emissions Standards are Driving
Significant Growth Opportunities for ArvinMeritor
46
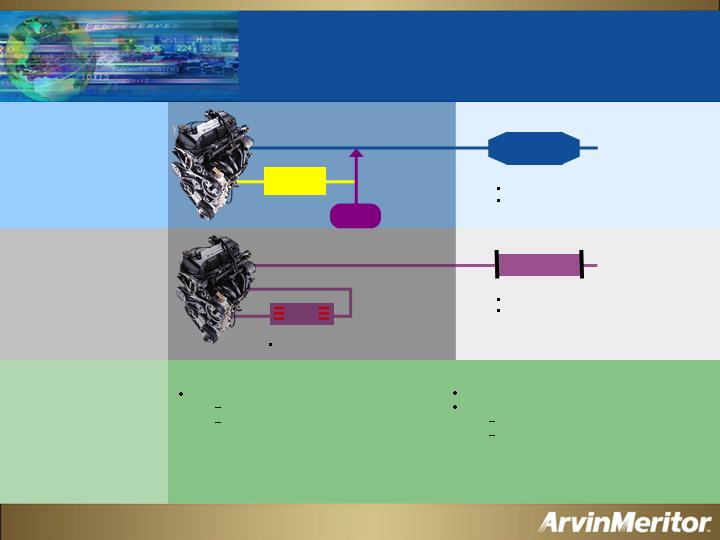
Diesel Emissions Solutions
U.S. may adopt SCR solution
Improves fuel efficiency
Low sulfur diesel capacity
constraint
Lean NOx Traps
Combined PM and NOx Traps
SCRT (SCR+DPF)
Lean NOx Trap with Plasma Fuel
Reformer
2007
U.S.
Solution
2006
Europe
Solution
EGR
Exhaust Gas Recirculation (EGR)
Reduces NOx
DPF
Diesel Particulate Filter (DPF)
Reduces PM
Vocational application uses
actively regenerated filter
SCR
Urea
Control
Selective Catalytic Reduction (SCR)
Reduces NOx
Reduces PM
Beyond
2007
47
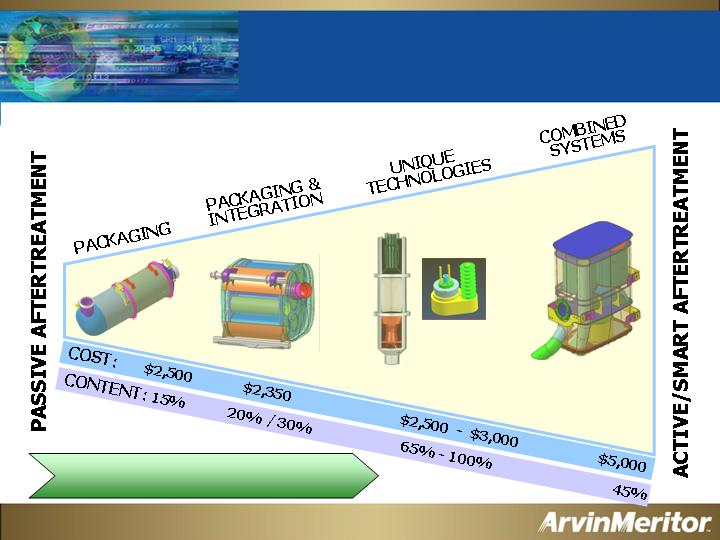
Increasing Value-Added Content
DPF
SCR
PFR
SCRT
LNT+DPF
TR
EMISSIONS REQUIREMENTS
48
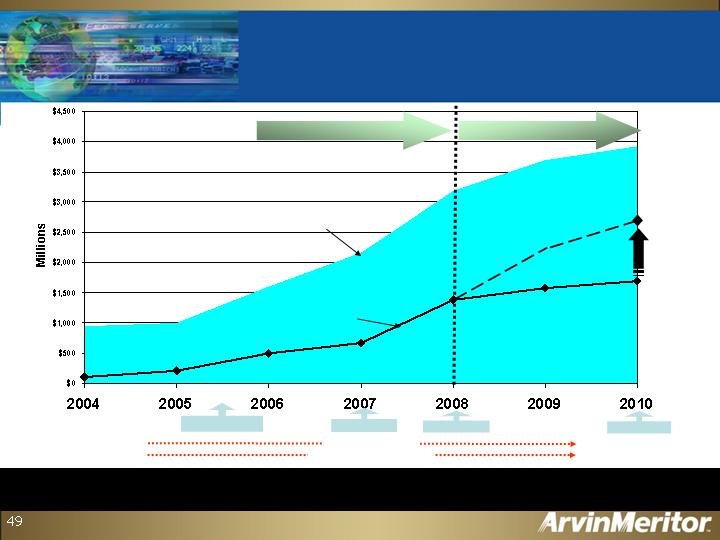
Commercial Vehicle Diesel Emissions
Global Addressable Market
$660/truck
$2,700/truck
Euro 4 / Japan
EPA 2007
Euro 5
EPA 2010
EU: mostly SCR
US: EGR+DPF
Technology TBD
Current Tech. Prevails
(EGR + DPF)
New Tech. Required
(SCR & Active DPF)
Technology Defined
Global Market $2+ billion in 2007
ARM Addressable Market
Addressable Market Grows to $2-3 Billion in 2010
Global Solutions
ArvinMeritor Solutions
$2,000/truck
$300-360 /truck
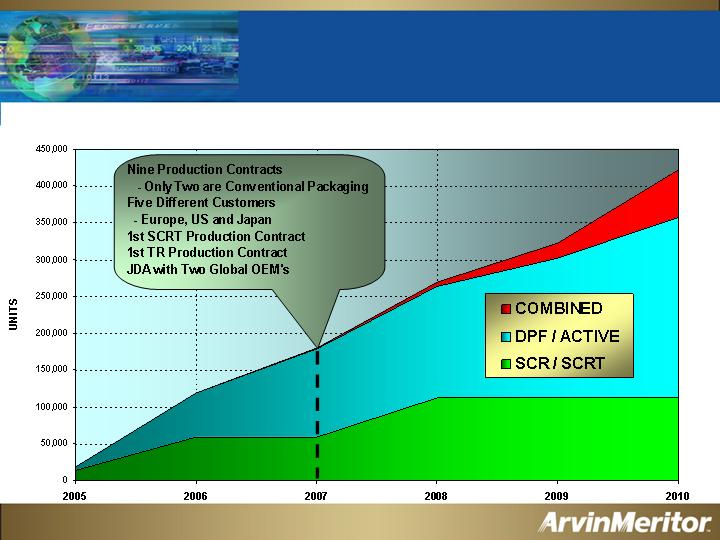
Global Volume Growth by Solution
50

Positioned to Meet
Global Requirements
Diesel emissions market is growing rapidly for Commercial Vehicle
and Light Vehicle
Positioned to do more than packaging in diesel
SCR, Thermal Regenerator, Plasma Fuel Reformer
Experience in United States, Europe and Japan
“Passive” and “Active” Aftertreatment
Fuel cost and precious metals price escalation favors ArvinMeritor
technology
Addressable market is likely to grow
Active DPF Regeneration displacing Catalytic Filters
Further developing portfolio for 2010
Combined NOx and PM solution
Diesel aftertreatment has more content $ than gasoline
Problem-solving opportunities in diesel aftertreatment
Capturing new business and developing future technology
51

Financial Review
Jim Donlon
Senior Vice President and CFO
52
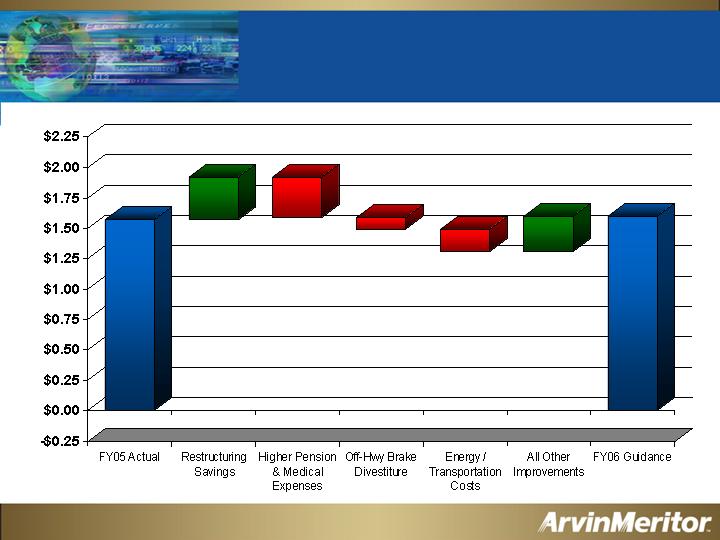
FY06 EPS Walk from FY05
(Before Special Items)
$0.30 - $0.40
($0.32) – ($0.35)
($0.10)
($0.15) – ($0.20)
$0.20 – $0.38
$1.50 – $1.70
$1.57
53
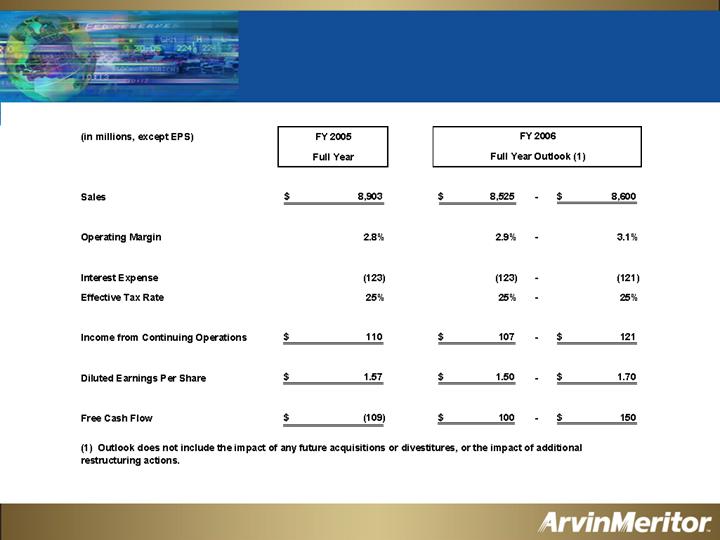
FY06 Outlook
Continuing Operations Before Special Items
54
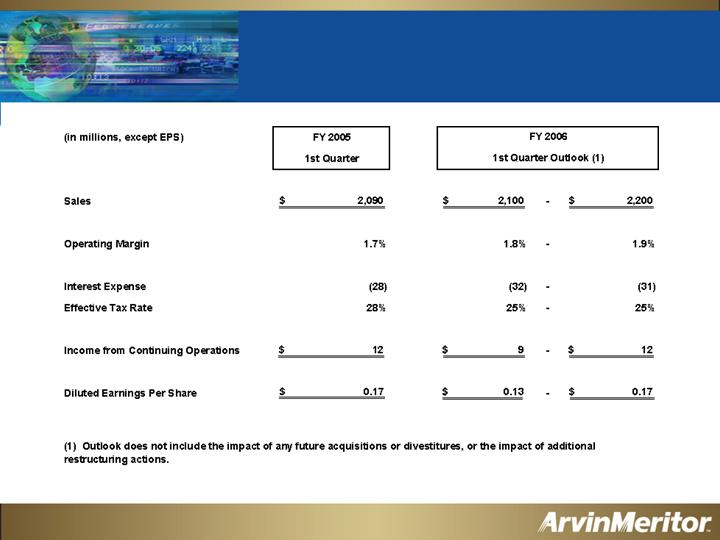
FY06 First Quarter Outlook
Continuing Operations Before Special Items
55
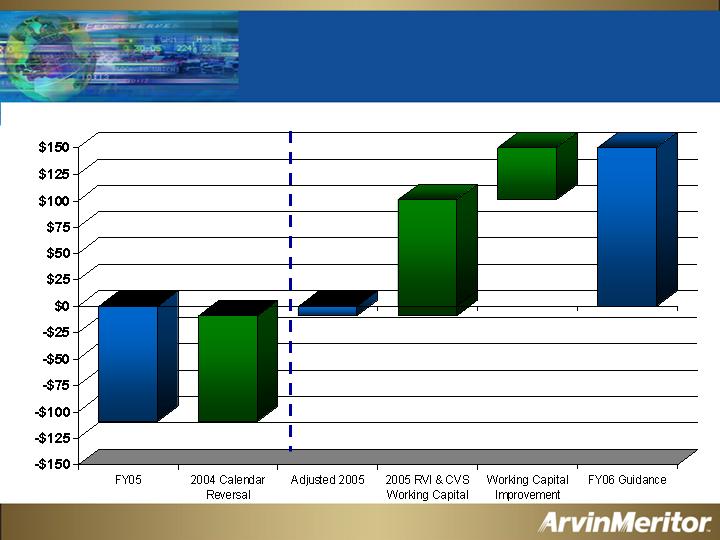
FY06 Free Cash Flow Walk from FY05
$100
$110
$0- $50
$100 - $150
($109)
($9)
($ millions)
56
FY06 Cash Flow Outlook Details
(in millions)
Income From Continuing Operations
85
$
-
99
$
Adjustments to Income
Depreciation and Other Amortization
180
-
185
Pension and Retiree Medical Expense
135
-
135
Pension and Retiree Medical Contributions
(175)
-
(175)
Changes in Assets and Liabilities
30
-
66
Cash Flows provided by continuing operations
255
-
310
Cash Flows provided by discontinued operations
-
-
5
Total Cash Flows Provided by Operations
255
-
315
Capital Expenditures
(155)
-
(165)
Free Cash Flow
100
$
-
150
$
Note: Does not include the effects of any changes in A/R securitization and factoring or any future
acquisitions or divestitures.
Full Year
FY 2006
57
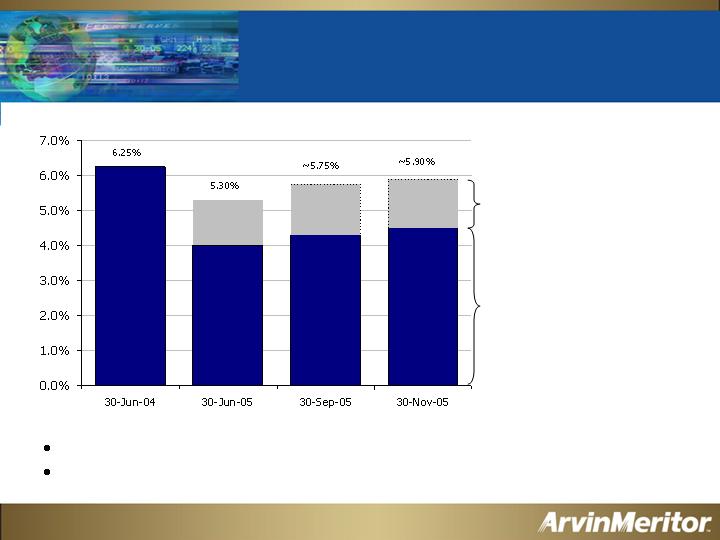
Pension Discount Rate Trends
2005 discount rate creates headwind in 2006
Trend suggests that discount rate will create tailwind in 2007
Ten-Year Treasury Rate
Estimated spread to
Corporate AA Bond
Portfolio
58

Actions to Reduce Legacy Obligations
Changed supplemental healthcare benefits to Medicare
eligible retirees
Benefit no longer provided
Announced Aug. 3, 2004; effective Jan. 1, 2006
Reduced Accumulated Projected Benefit Obligation
(APBO) by $257M
Modified pension benefit for new employees
Defined benefit becomes defined contribution
Effective Oct. 1, 2005
59

Recent cash flow has been strong
Expecting 2006 to be much better than 2005
Pension discount rate creates 2006 headwind
Non-cash event
Rate trends suggest 2007 tailwind
Legacy cost issues addressed
Liquidity is adequate
Plans to continue improving
Financial Summary
60

Rakesh Sachdev
Senior Vice President
Corporate Strategy
61

Beginning Our Transformation with
Renewed Strategic Intent
From
To
To be the number one
supplier to the motor
vehicle industry by 2010
To be a leading global
provider of innovative
customer solutions that
enhance mobility, safety
and the environment
Transition Focus from Gaining Scale to
Sustainable Value Creation
Result
Expectation
Focused on revenue growth
CAGR >10% since spin-off
CVS + LVS
Leading positions in CVS
Undercarriage and LVS Emissions
Focus on creating valued solutions
Mobility, safety, environment
Expanded markets
Framework for differentiating our core
product for substantial profitability
62
Near-Term Priorities
Reshape our portfolio
Assess strategic fit and financial viability
Complete operational turnaround of
underperformers
Drive for achieving ROIC targets in 3-5 years
Create value for additional portfolio activity
Pursue profitable expansion strategy
Emerging market
Customer service and support
Adjacent and emerging technologies
Long-Term Financial Target:
ROIC 13-15% and Operating Margin 6-7%
63
Roadmap to Long-Term Margin Target
(Five-Year Results)
6.0% - 7.0%
Long-Term Target
0.75% - 1.0%
Active Intelligent Systems
(Undercarriage and Emissions)
0.5%
Commercial Vehicle Aftermarket
0.5%
Emerging Markets
0.25% - 0.5%
Portfolio Reshaping/Divestitures
0.5% - 1.0%
Operational Improvements,
Including Supply Chain
0.5%
Restructuring
Roadmap for Improvement:
3%
Current
Operating Margin %
64
Reshaping Our Portfolio in 2006
Products:
Axles
Brakes
Suspensions
Shocks
Wheels
Roofs
Doors
Emissions
Strategic Fit
Mobility, Safety
and Environment
Value Creation
Customers:
Financial Fit
Operating Margin
and Asset Turns
Sustainable ROIC
Reshaping the Management and Content of Our Portfolio
Core
Business
65
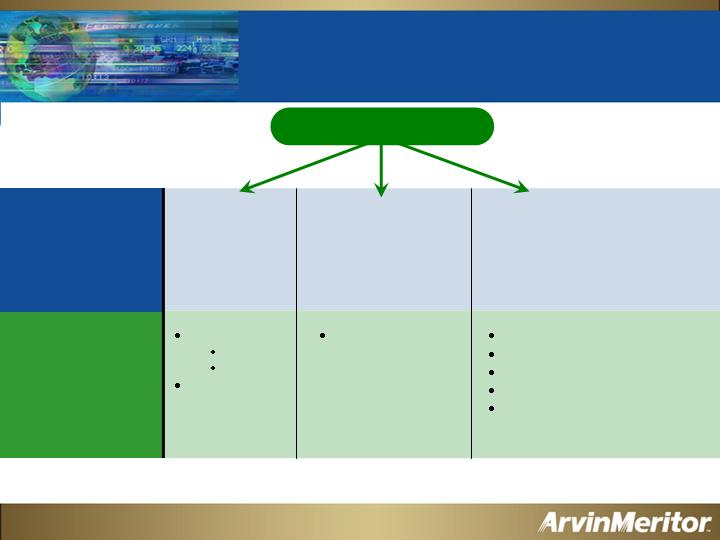
Focused Initiatives for Expansion
CORE BUSINESSES
EXAMPLES:
Emerging
Markets
Customer Service
and Support
Adjacent and Emerging
Technologies
GROWTH
OPPORTUNITIES:
China/India
Axles
Brakes
Corporate
Shared
Services
Commercial
Vehicle
Aftermarket
Vehicle Stability Control
Driver Warning
Collision Avoidance
Active DP/NOx Control
Fuel Optimization
Active/Intelligent Systems
66
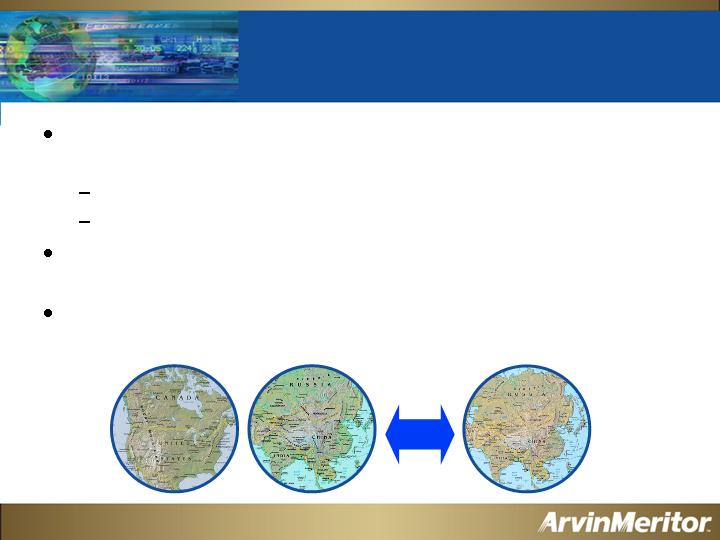
Emerging Market Business Model
Build business in emerging markets by transferring
proven solutions from the developed world
Invest in joint ventures and wholly owned subsidiaries
Greater than $10 Billion addressable market
Utilize emerging market capacity for economical export
opportunities
Evaluate Business Process Outsourcing (BPO) initiatives
* Our current addressable market >$10B
Total Returns
67
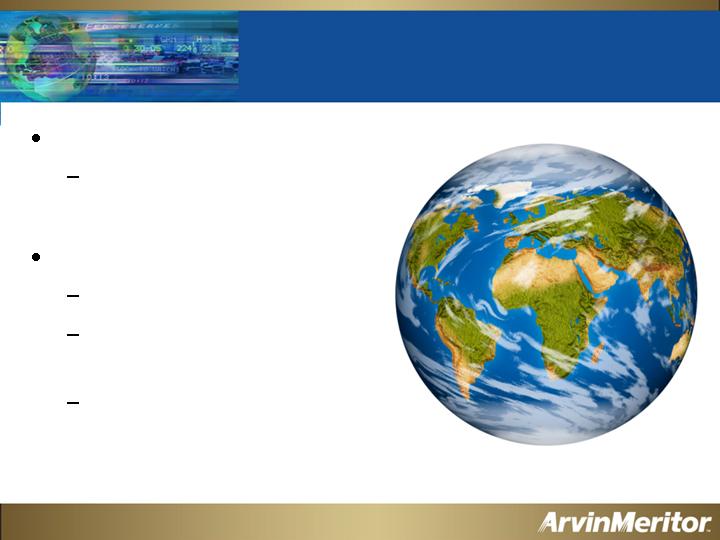
Growth Potential for
Commercial Vehicle Aftermarket
Large global market
$90 Billion ($20 Billion
undercarriage)
Leverage growth on
Expanding OE business
Channel management
experience
Emerging market presence
and infrastructure
68
Path to Differentiating Solutions
Products Solutions
---------------------------Technology -------------------------
Active and
Intelligent
Solutions
Active Ride Control
Vehicle Dynamic Control
Driver Warning
Collision Avoidance
Active Emissions
Management
Active NoX and PM
Reduction
Systems
Undercarriage Systems
Mechanical Components
Modules and Aftermarket
Emissions Systems
Aftertreatment Systems
69

Positioning ArvinMeritor for
Sustained Value Over the Cycle
In the next one to two years:
Focus on reshaping our portfolio
Create value through operational improvements
Develop emerging markets, service and support, and
accelerate technology initiatives
In the next three to five years:
Achieve and begin sustaining value creation targets –
ROIC of 13-15 percent
Pursue journey towards active/intelligent systems
through adjacent technology and market objectives
70

Chip McClure
Chairman, President and CEO
Summary
71

Key Points
Strong leadership team
Taking the right actions today
Focused on making 2007
a non-event
Financially healthy
Driving to 13-15 percent ROIC
72

www.arvinmeritor.com
73