Exhibit 99

2007 AANY Conference
Chip McClure
Chairman, CEO and President
1

This presentation contains statements relating to future results of the company (including certain projections and business trends) that are “forward-looking statements” as defined in the Private Securities Litigation Reform Act of 1995. Forward-looking statements are typically identified by words or phrases such as “believe,” “expect,” “anticipate,” “estimate,” “should,” “are likely to be,” “will” and similar expressions. Actual results may differ materially from those projected as a result of certain risks and uncertainties, including but not limited to global economic and market cycles and conditions; the demand for commercial, specialty and light vehicles for which the company supplies products; risks inherent in operating abroad (including foreign currency exchange rates and potential disruption of production and supply due to terrorist attacks or acts of aggression); availability and cost of raw materials, including steel; OEM program delays; demand for and market acceptance of new and existing products; successful development of new products; reliance on major OEM customers; labor relations of the company, its suppliers and customers, including potential disruptions in supply of parts to our facilities or demand for our products due to work stoppages; the financial condition of the company’s suppliers and customers, including potential bankruptcies; possible adverse effects of any future suspension of normal trade credit terms by our suppliers; potential difficulties competing with companies that have avoided their existing contracts in bankruptcy and reorganization proceedings; successful integration of acquired or merged businesses; the ability to achieve the expected annual savings and synergies from past and future business combinations and the ability to achieve the expected benefits of restructuring actions; success and timing of potential divestitures; potential impairment of long-lived assets, including goodwill; competitive product and pricing pressures; the amount of the company’s debt; the ability of the company to continue to comply with covenants in its financing agreements; the ability of the company to access capital markets; credit ratings of the company’s debt; the outcome of existing and any future legal proceedings, including any litigation with respect to environmental or asbestos-related matters; rising costs of pension and other post-retirement benefits and possible changes in pension and other accounting rules; as well as other risks and uncertainties, including but not limited to those detailed herein and from time to time in other filings of the company with the SEC. These forward-looking statements are made only as of the date hereof, and the company undertakes no obligation to update or revise the forward-looking statements, whether as a result of new information, future events or otherwise, except as otherwise required by law.
Forward-Looking Statements
2

Agenda
Overview of Company and Results
Envisioning the Future of ArvinMeritor
Performance Plus Success Factors
3

Diverse Customer Base
Commercial Vehicle Customers
Light Vehicle Customers
DaimlerChrysler
10%
General Motors
9%
Volkswagen
10%
Ford 7%
Asia-Based
OEMs 3%
BMW 2%
Fiat 3%
Other LVS
9%
Other CVS
15%
Fiat 2%
Asia-Based
OEMs 3%
Ford 3%
Volkswagen 1%
General Motors 1%
PACCAR 2%
International 3%
Volvo 9%
DaimlerChrysler
8%
47%
Commercial
Vehicles
53%
Light
Vehicles
Overview
4
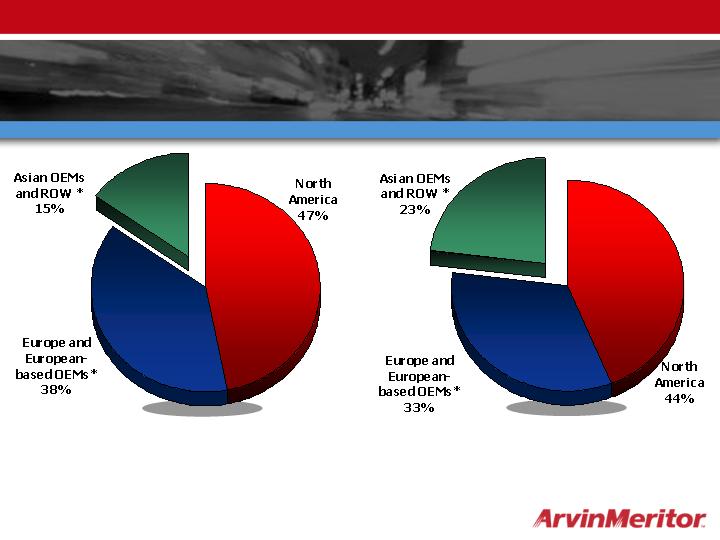
Consolidated
Revenue
* Includes local operations of companies
headquartered in North America and Europe
+ Non-Consolidated
Joint Ventures
Geographic/Customer Mix
of 2006 Sales
Overview
5
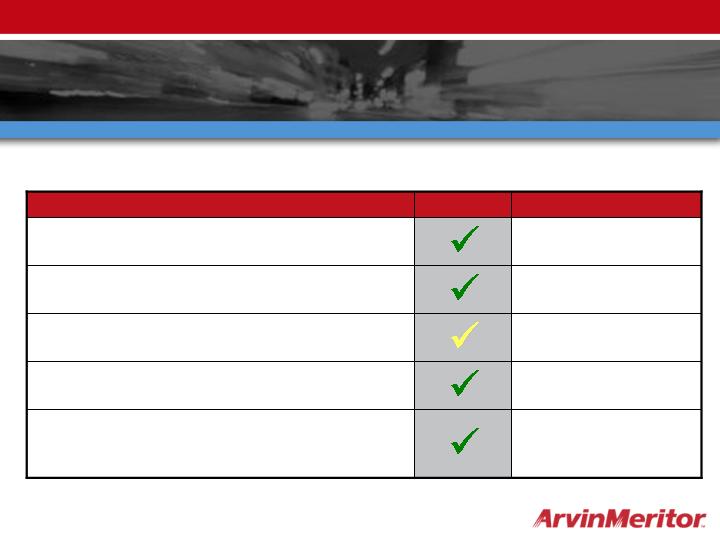
Commitments Kept
$262 million
Operating income of $250 - $265 million
$284 million
Free cash flow of $100 - $150 million
$501 million
reduction in net debt
Improve balance sheet
Delivery
$1.78
$9.2 billion
EPS of $1.50 - $1.70
Sales of $8.5 - $8.6 billion
Actual Result
Goal
Overview
Goals from 2005 Analyst Day
6

Agenda
Overview of Company and Results
Envisioning the Future of ArvinMeritor
Performance Plus Success Factors
7
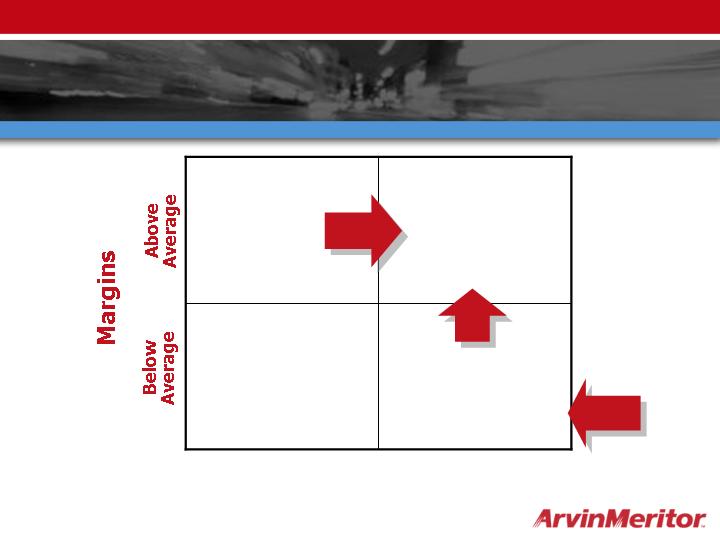
Today’s Portfolio of Businesses
CV Emissions
LV Emissions
Roofs
Wheels
Doors
Aftermarket
Specialty
Axles
Brakes
Trailers
Low
High
Growth
Envisioning the Future
Emerging
Markets
New
Stars
8
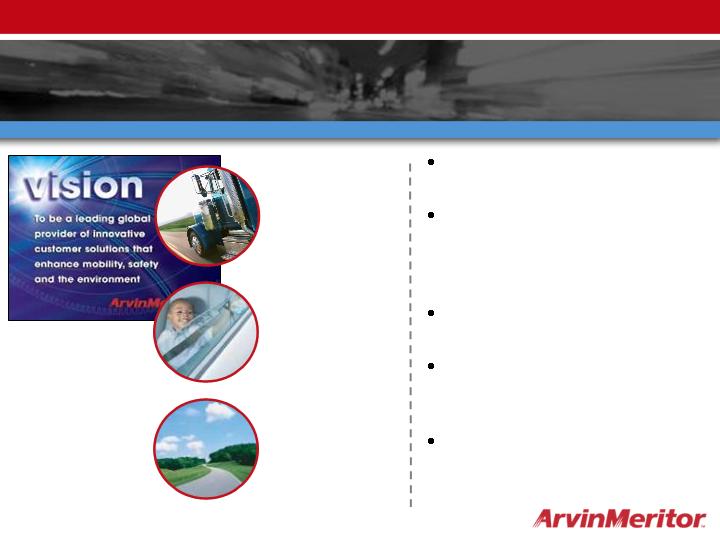
Vision for Growth and Profitability
Be a global systems leader
in our target markets
Develop scalable product
technologies and
capabilities, focusing on
electronics and controls
Accelerate growth in Asia
and with Asian OEMs
Accelerate growth in
Commercial Vehicle
Aftermarket
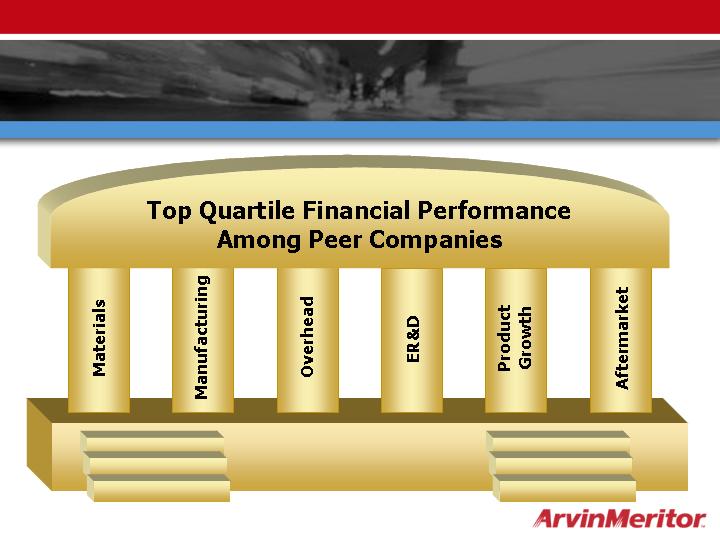
Achieve top quartile
financial performance
among peer companies
Safety
Environment
Mobility
Envisioning the Future
9

Integrated Systems Leadership
Envisioning the Future
What it is not
Full-service supplier initiative
Outsourcing of engineering from OEMs
What it is
For mature markets:
High-tech, cross-systems capability to develop new
product solutions that customers will value
More controls and electronics capability
For developing markets
Helping local OEMs gain the full cost benefits of
modularization and mechanical integration
10

Medium-Term Goals
Growth with a Purpose
Envisioning the Future
1/3 – 1/3 – 1/3 regional business mix
Triple sales in Asia and with Asian OEMs
Triple the size of Aftermarket business
Grow organically where margins are good
Achieve ROIC of 13 – 15 percent
11

Triple Asian Sales in Five Years
Envisioning the Future
ArvinMeritor is a Partner for All Phases
Success: Being the partner our growing customers need now
- Capacity for explosive growth
- Improved technology
- World-class quality
Enduring global partnership
Customer Phase
Customer Need
12
OEMs Producing in Asia
- Local consumption
- Regional export
- Global export
Transplants

Case Study: CIMC Leverages ARM Quality
and Technology For Leadership
CIMC, the world’s largest marine container company with sales
of $3.5 billion, entered the semi-trailer business in 2002
Already the #1 trailer OEM in China, aspires to be #1 globally
For about three years, ARM has supplied axles from Frankfort,
KY for trailer production in China for customers in the U.S.
(about $60 million ARM sales in 2006)
ARM delivered needed technology and quality for global exports
Pushing for the same advantages at lower cost, CIMC
encouraged ARM to build new facility in China
We opened a wholly-owned green field plant in Wuxi, Jiangsu;
customer shipments began this week
Envisioning the Future
13

Wuxi Plant: Platform for Growth
300,000 square feet and 160 employees in 2007
350 employees with full ramp-up of trailer axles
Transition all CIMC export production over 12-18 mos.
Grow local content of axles to 100% over same time
Enter market for “square” axles for domestic trailers
Lead in higher-tech axles as domestic market matures
Launch component manufacturing for axles assembled in
North America and Europe
Potential future expansion for brakes, wheels and other systems
Potential aftermarket opportunity
Envisioning the Future
14

Agenda
Overview of Company and Results
Envisioning the Future of ArvinMeritor
Performance Plus Success Factors
15
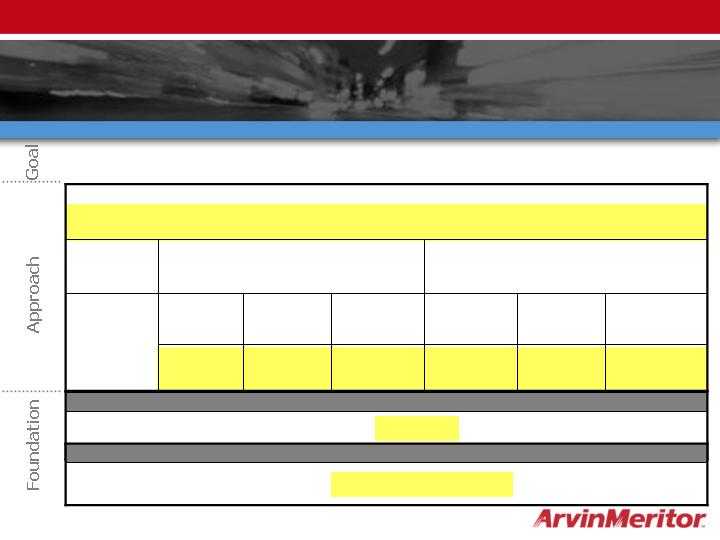
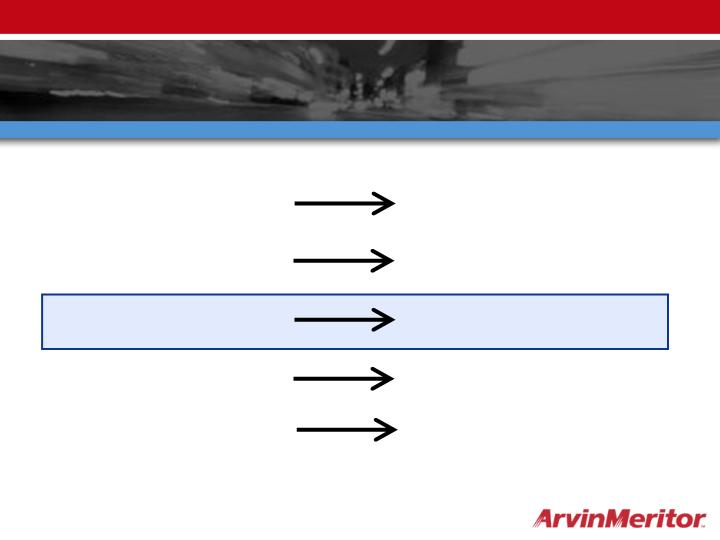
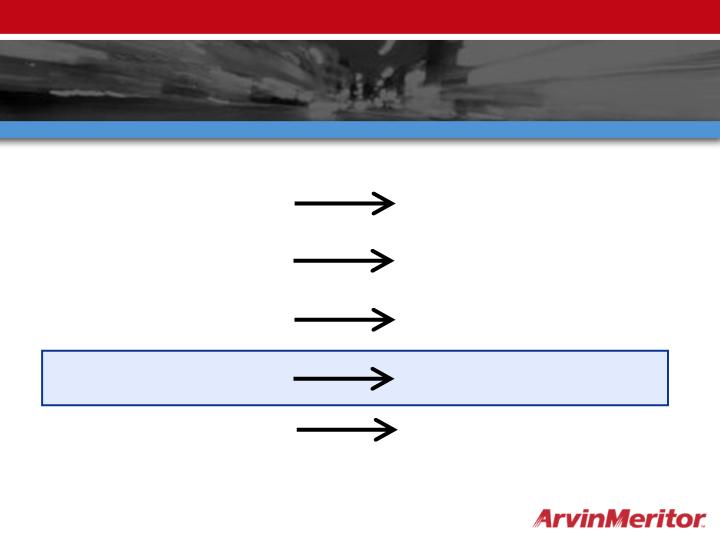
Performance Plus Success Factors
16
Industry challenges
Reason to change
Executive alignment
Agents of change
Clear strategies
Pathway to change
Fast-start actions
Momentum to change
Strong balance sheet
Resources to change
Industry Challenges Provide a
Reason to Change
Reason to Change
Commercial Vehicle Systems
2007 North America Class 8 downturn
Light Vehicle Systems
Lower production at some key customers
Industry margins below historical average
Uneven regional growth rates
Emissions Technologies
Lower production at some key customers
Industry margins below historical average
Higher stainless steel prices
17
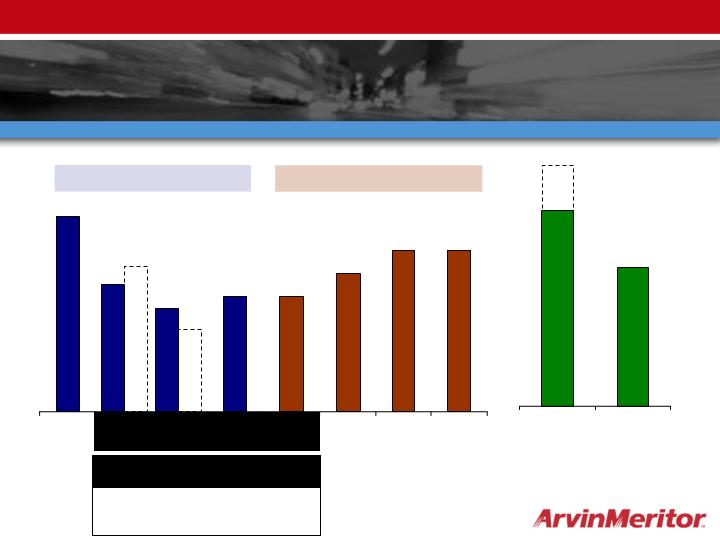
OE/Supplier Forecasts
Calendar Year 2007
Average 211
High Est. 250
Low Est. 181
(Thousands of vehicles)
FY2007 = 235K vehicles
FY2008 = 250K vehicles
Q2 Q3 Q4 Q1
CY2007 = 200K Vehicles
North America Class 8 Volumes
85
55
45
50
50
60
70
70
Q1
Q2
Q3
Q4
Q1
Q2
Q3
Q4
65
35
310
220
FY2009
FY2010
Reason to Change
18
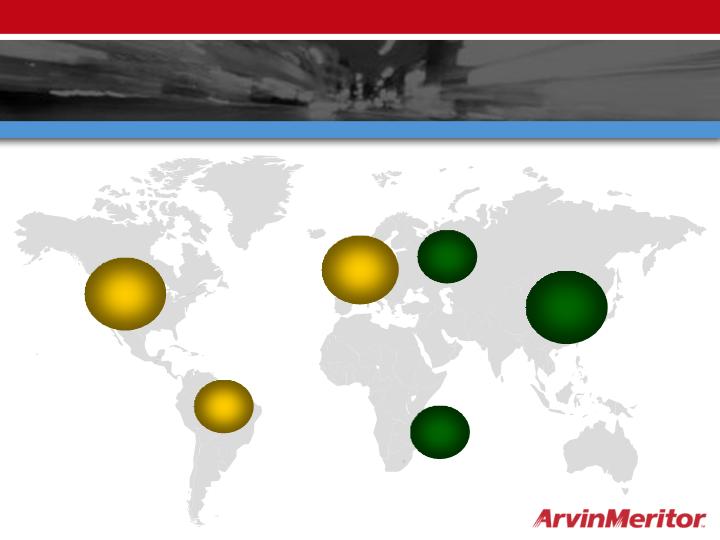
North
America
Western
Europe
South
America
Source: CSM Worldwide light vehicle production by region (2006 – 2012)
Central
Europe
Middle East
& Africa
+1.0%
Uneven Regional Growth Rates
Asia
Pacific
Reason to Change
+6.4%
+1.3%
+5.4%
+9%
+3.7%
Global Light Vehicle Production Outlook
19
Factors Affecting Fiscal Q1 Results
European Axle Launch Costs and New ERP System
Strike at VW plant in Brussels
Slightly Higher N.A. Heavy Truck Market
Significantly Reduced Big Three Production
Q1, FY 2007
RED = Decreases
GREEN = Increases
$0.17 EPS from Continuing Operations Before Special Items
Q1, FY 2006
Reason to Change
20
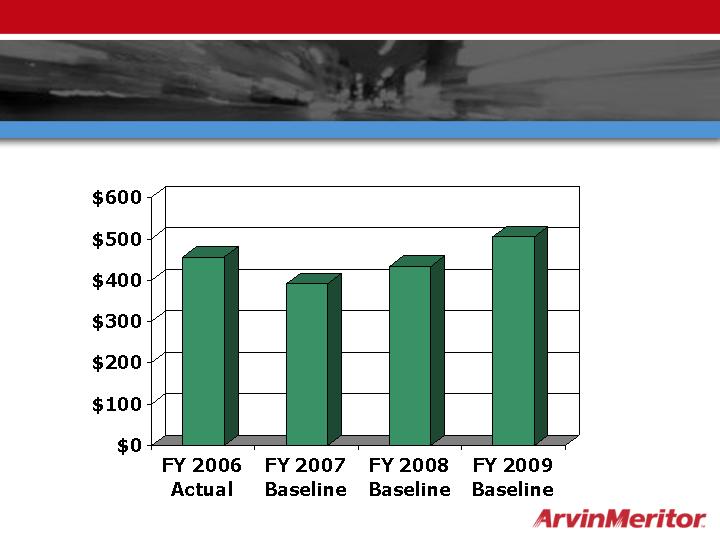
Baseline EBITDA Forecast as of Dec. 7
(Before Performance Plus)
$ Millions Before Special Items
Reason to Change
$456
$375-$405
$410-$455
$475-$535
21
Performance Plus Success Factors
22
Industry challenges
Reason to change
Executive alignment
Agents of change
Clear strategies
Pathway to change
Fast-start actions
Momentum to change
Strong balance sheet
Resources to change
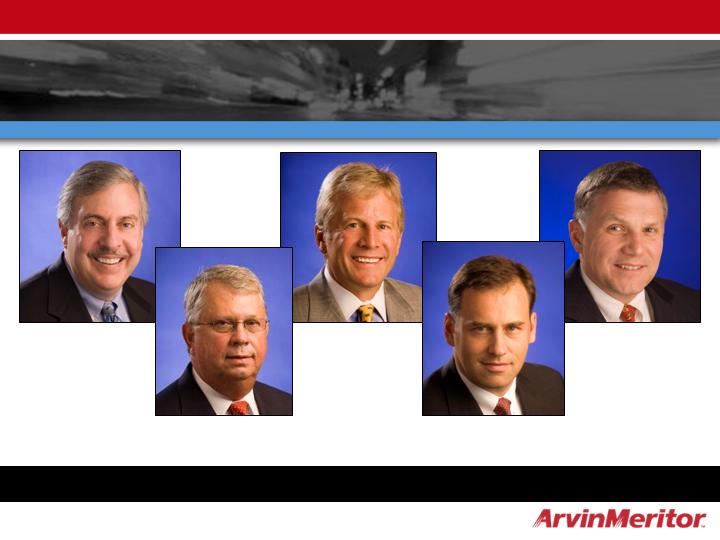
Phil Martens,
President, LVS
H. H. “Buddy” Wacaser,
President, ET
Rob Ostrov,
Sr. VP HR
Jay Craig
VP and
Controller
Carsten Reinhardt,
President, CVS
Strong Leaders to Reshape Our Future
New Leadership Team
Agents of Change
23
New Leaders Drive Performance Plus
J. Craig
P. Martens
P. Martens
J. Craig
C.
Reinhardt
C.
Reinhardt
Aftermarket
Product
Growth
Overhead
Mfg.
ER&D
Materials
Commercial Excellence
Revenue Enhancement
Operational Excellence
Cost Improvements
Steering Committee
J. Craig
J. Donlon
R. Ostrov
C. Reinhardt
P. Martens
Sponsor: R. Ostrov
Talent Excellence
Sponsors: J. Craig and J. Donlon
Program Office
R. Sachdev
Sponsors
Agents of Change
Top Quartile Financial Performance Among Peer Companies
24
Performance Plus Success Factors
25
Industry challenges
Reason to change
Executive alignment
Agents of change
Clear strategies
Pathway to change
Fast-start actions
Momentum to change
Strong balance sheet
Resources to change
Talent Excellence
Pillars of Performance
Pathway to Change
26
Performance Plus Success Factors
27
Industry challenges
Reason to change
Executive alignment
Agents of change
Clear strategies
Pathway to change
Fast-start actions
Momentum to change
Strong balance sheet
Resources to change

Actions Already Underway
Momentum to Change
Category crossover
Expansion of shared services
Reengineering projects for material savings
(e.g., driveline yoke)
Rationalization of engineering footprint
Broadening of remanufacturing
ET restructuring (not included in Performance Plus targets)
28
Light Vehicles
Commercial Vehicles
Growth from Category Cross-Over
Crossing the Boundary
Leverage technology
Utilize capacity
Innovate for leadership
Future State: Eliminate Boundaries
Steel wheels
Car and light truck axles
and modules
DPFs, converters
Window regulators, door
modules
Medium truck wheels
Drive axles
Momentum to Change
Commercial diesel emissions
Truck and specialty vehicle
doors
29

Shared Services
Launched Shared Services pilot program in partnership
with HCL
Twenty Accounts Payable positions moved to Chennai,
India
Achieved two-thirds cost and productivity improvement
Based on success of pilot, ramping up additional activities
throughout 2007
Accounts Receivable, Payroll, Benefits
Boundary-less organization is an enabler
Momentum to Change
30

New Business Wins with Asian
Customers
First Auto Works
Momentum to Change
31
Performance Plus Success Factors
32
Industry challenges
Reason to change
Executive alignment
Agents of change
Clear strategies
Pathway to change
Fast-start actions
Momentum to change
Strong balance sheet
Resources to change
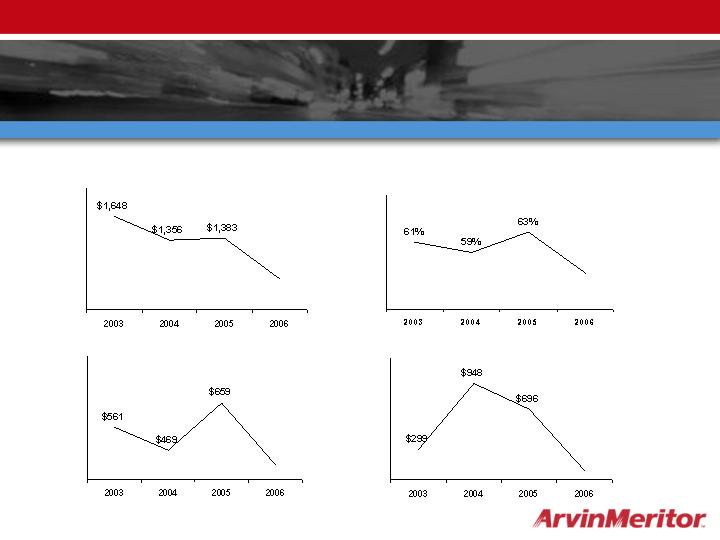
Debt-to-capitalization ratio
(millions)
Term debt due within 5 years
(millions)
Net debt (1)
(millions)
$882
55%
$93
$409
Balance Sheet Strengthening
Resources to Change
(1) See appendix for definition of net debt
33
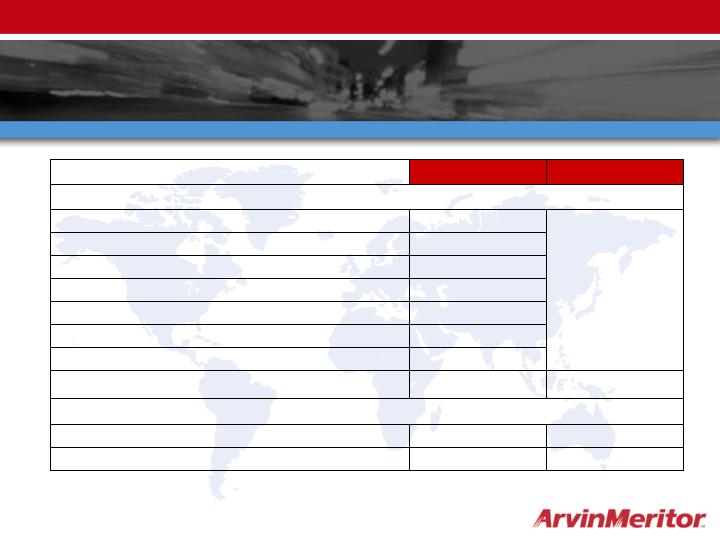
$39 million
Sold
CVS Off-Highway Brakes
$ 227million
Total Light Vehicle Aftermarket
Other Divestitures
Light Vehicle Aftermarket
N/A
Evaluating
LVS MSSC suspension JV
Sold
Equity share in Purolator India
In Process
N.A. Ride Control
Sold
S. Africa Ride Control
Sold
N.A. Purolator filters
Sold
N.A. Exhaust
In Process
LVA Europe
Sold
N.A. Motion Control
Proceeds
Status
Divestiture Status
Resources to Change
34
Performance Plus Success Factors
Performance Plus will Transform ArvinMeritor into a
Top-Quartile Financial Performer
35
Industry challenges
Reason to change
Executive alignment
Agents of change
Clear strategies
Pathway to change
Fast-start actions
Momentum to change
Strong balance sheet
Resources to change
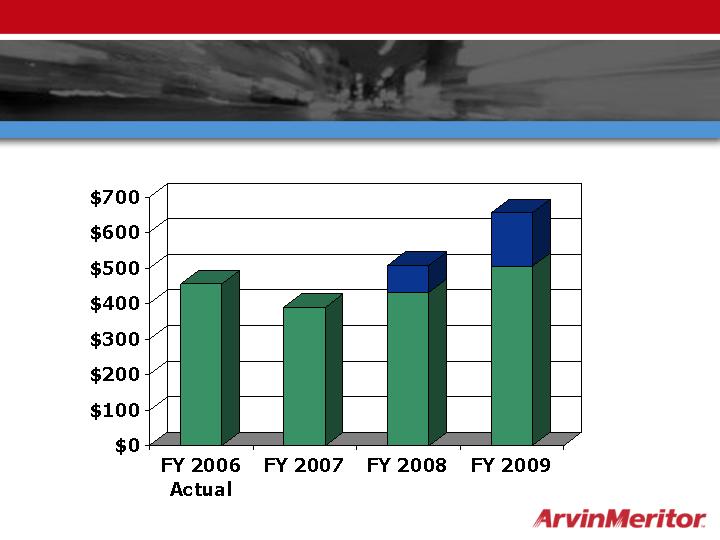
EBITDA with High Confidence
Improvement from Performance Plus
$ Millions Before Special Items
$456
$375-$405
$485-$530
$625-$685
36

Appendix
37

Use of Non-GAAP Financial Information
In addition to the results reported in accordance with accounting principles generally accepted in the United States (“GAAP”) included throughout this presentation, the company has provided information regarding income from continuing operations, diluted earnings per share and operating income and margins before special items, which are non-GAAP financial measures. These non-GAAP measures are defined as reported income or loss from continuing operations, reported diluted earnings or loss per share from continuing operations and operating income or loss plus or minus special items. Other non-GAAP financial measures include “EBITDA before special items” and “free cash flow”. EBITDA is defined as earnings before interest, income taxes, depreciation and amortization plus or minus special items. Free cash flow represents net cash provided by operating activities less capital expenditures.
Management believes that the non-GAAP financial measures used in this presentation are useful to both management and investors in their analysis of the Company’s financial position and results of operations. In particular, management believes EBITDA is a meaningful measure of performance as it is commonly utilized by management and investors to analyze operating performance and entity valuation. Management, the investment community and the banking institutions routinely use EBITDA, together with other measures, to measure operating performance in our industry. Management believes that free cash flow is useful in analyzing the Company’s ability to service and repay its debt. Further, management uses these non-GAAP measures for planning and forecasting in future periods.
These non-GAAP measures should not be considered a substitute for the reported results prepared in accordance with GAAP. EBITDA should not be considered as an alternative to net income as an indicator of our operating performance or to cash flows as a measure of liquidity. Free cash flow should not be considered a substitute for cash provided by operating activities or other cash flow statement data prepared in accordance with GAAP or as a measure of liquidity. In addition, the calculation of free cash flow does not reflect cash used to service debt and thus, does not reflect funds available for investment or other discretionary uses. These non-GAAP financial measures, as determined and presented by the company, may not be comparable to related or similarly titled measures reported by other companies.
Set forth on the following slides are reconciliations of these non-GAAP financial measures, if applicable, to the most directly comparable financial measures calculated and presented in accordance with GAAP.
38
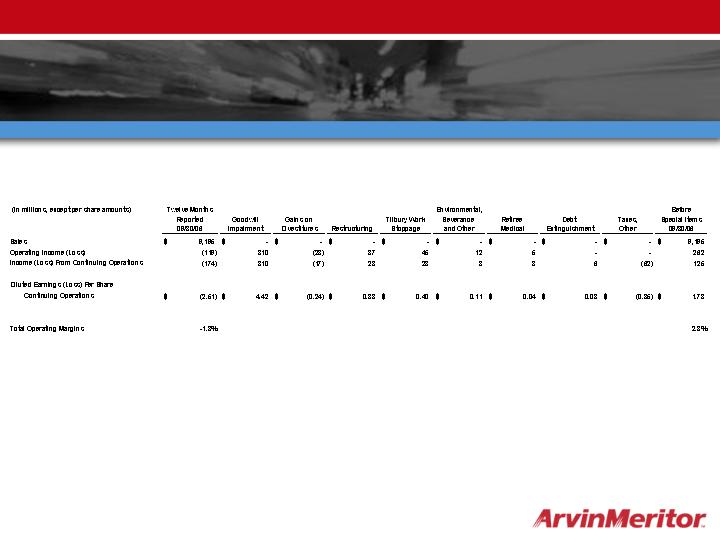
Non-GAAP Financial Information –
Full Year FY 2006 Results Before Special Items
39
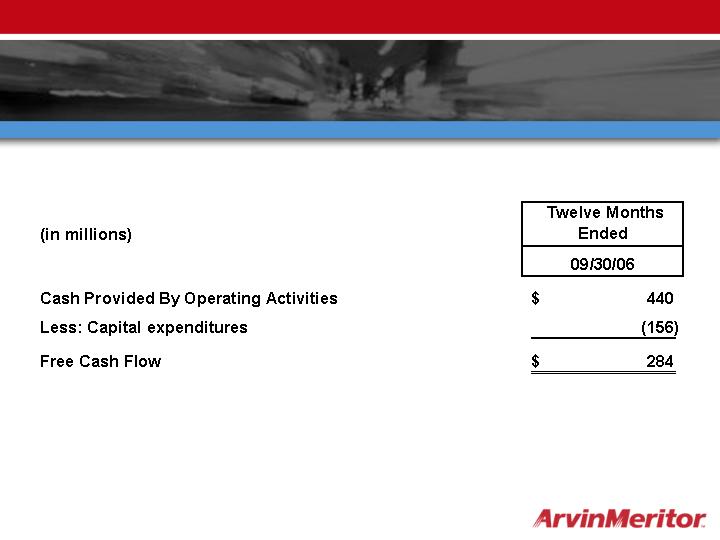
Non-GAAP Financial Information –
Free Cash Flow
40
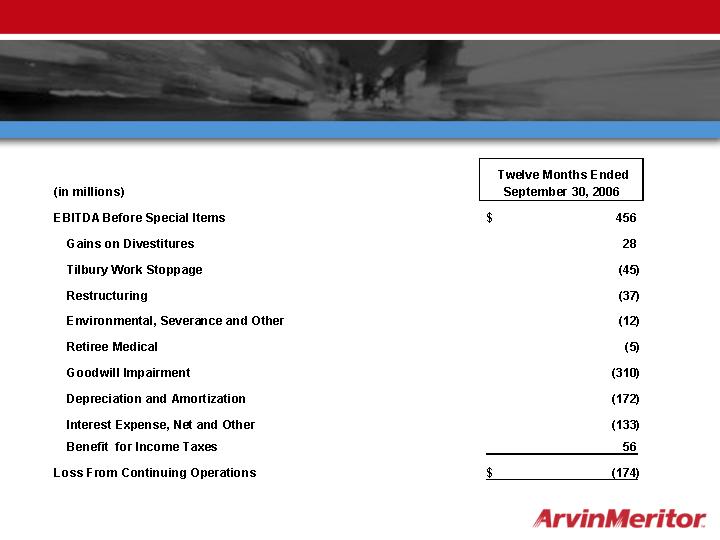
Non-GAAP Financial Information –
EBITDA – Before Special Items
41
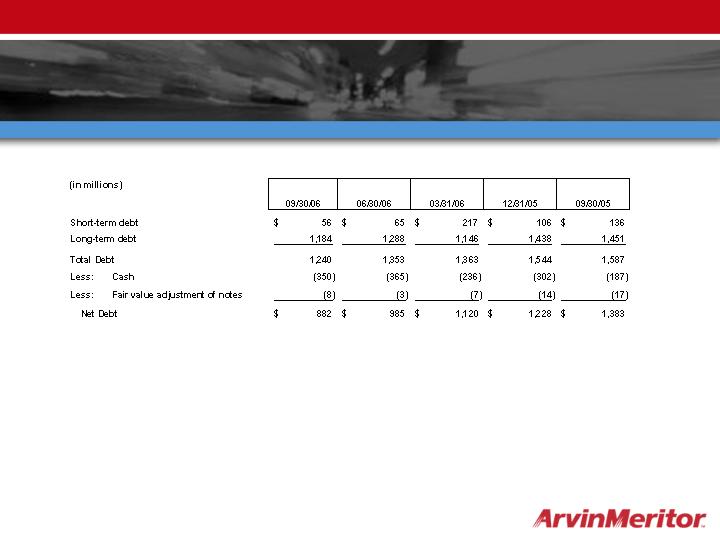
Non-GAAP Financial Information –
Net Debt
42