
FY 2007 Third Quarter
Earnings Presentation
Chip McClure, Chairman, CEO & President
Jim Donlon, Senior Vice President & CFO
July 30, 2007
1

Forward-Looking Statements
2
This presentation contains statements relating to future results of the company (including certain projections and
business trends) that are “forward-looking statements” as defined in the Private Securities Litigation Reform Act of
1995. Forward-looking statements are typically identified by words or phrases such as “believe,” “expect,”
“anticipate,” “estimate,” “should,” “are likely to be,” “will” and similar expressions. Actual results may differ
materially from those projected as a result of certain risks and uncertainties, including but not limited to global
economic and market cycles and conditions; the demand for commercial, specialty and light vehicles for which the
company supplies products; risks inherent in operating abroad (including foreign currency exchange rates and
potential disruption of production and supply due to terrorist attacks or acts of aggression); availability and cost of
raw materials, including steel; OEM program delays; demand for and market acceptance of new and existing
products; successful development of new products; reliance on major OEM customers; labor relations of the
company, its suppliers and customers, including potential disruptions in supply of parts to our facilities or demand
for our products due to work stoppages; the financial condition of the company’s suppliers and customers,
including potential bankruptcies; possible adverse effects of any future suspension of normal trade credit terms by
our suppliers; potential difficulties competing with companies that have avoided their existing contracts in
bankruptcy and reorganization proceedings; successful integration of acquired or merged businesses; the ability
to achieve the expected annual savings and synergies from past and future business combinations and the ability
to achieve the expected benefits of restructuring actions; success and timing of potential divestitures; potential
impairment of long-lived assets, including goodwill; competitive product and pricing pressures; the amount of the
company’s debt; the ability of the company to continue to comply with covenants in its financing agreements; the
ability of the company to access capital markets; credit ratings of the company’s debt; the outcome of existing and
any future legal proceedings, including any litigation with respect to environmental or asbestos-related matters;
rising costs of pension and other post-retirement benefits and possible changes in pension and other accounting
rules; as well as other risks and uncertainties, including but not limited to those detailed herein and from time to
time in other filings of the company with the SEC. These forward-looking statements are made only as of the
date hereof, and the company undertakes no obligation to update or revise the forward-looking statements,
whether as a result of new information, future events or otherwise, except as otherwise required by law.
Highlights
Earned $0.25 per share from continuing operations before special
items
LVS year-over-year margin expansion continues
CVS profitable in the trough of the 2007 downturn
Completed the sale of Emissions Technologies on May 17
Performance Plus teams on track to achieve goals
FY 2007 EPS guidance before special items of $0.75 to $0.80
compared to $0.70 to $0.80 previously
Cash flow guidance reduced to a range of $50 million to $100
million outflow reflecting working capital investments for growth
outside North America and timing of ET post-closing adjustments
3
Minimizing Impact of the Downturn
Q3 2007 Compared to FY 2001
-1.5 pts
-6.2 pts
CVS operating margin vs. prior year
Reduced CVS margin impact
Improved LVS margins
Expanded global presence
Diversified– less dependent
on North America
Downturn equally severe
+1.1 pts
-1.4 pts
LVS operating margin vs. prior year
+8%
-4%
European truck industry vs. prior year
53%
37%
ARM sales outside North America
-31%
-29%
Class 5-7 vs. prior year
-54%
-48%
Class 8 industry vs. prior year
Q3 2007
FY 2001
Better positioned for 2007 downturn
4

Accomplishments of Performance Plus
Manufacturing footprint improvements underway
Three plant closures announced (Brussels, Frankfurt, St. Thomas)
Two others proceeding in near term
Lean manufacturing implementation underway
Launched ArvinMeritor Production System
Expanding Specialty business
International and Armor Holdings contracts represent 58% of total
MRAP business awarded to date
Growing Commercial Vehicle Aftermarket
Launched trailer axle remanufacturing for North America
Entered significant JV with Chery Motors in China
Light vehicle chassis products produced in Wuhu
$150 million of business by 2010 including door modules and wheels
5
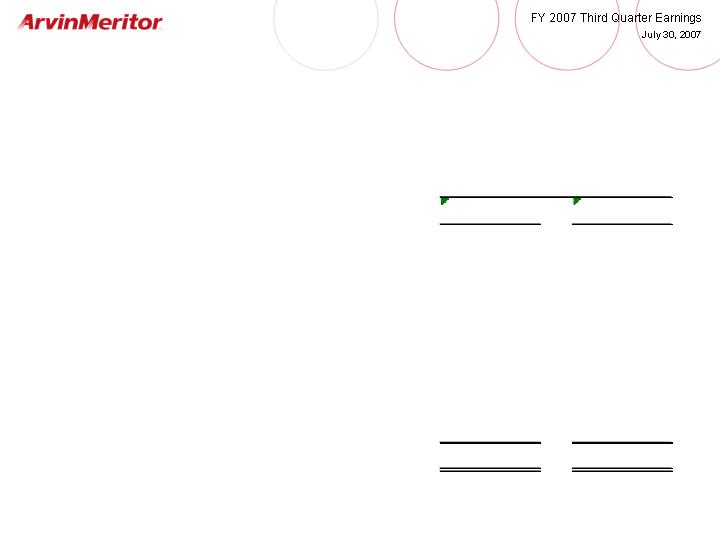
Third Quarter Income Statement from Continuing
Operations – Before Special Items (1)
(1) See Appendix – “Non-GAAP Financial Information”
-43%
$ (0.19)
$ 0.44)
$ 0.25)
Continuing Operations
Diluted Earnings Per Share
-42%
$ (13)
$ 31
$ 18)
Income from Continuing Operations
-25%
(1)
(4)
(5)
Minority Interests
58%
7)
(12)
(5)
Provision for Income Taxes
-40%
(19)
47)
28)
Income Before Income Taxes
4%
1)
(28)
(27)
Interest Expense, Net and Other
0%
-)
10)
10)
Equity in Earnings of Affiliates
-31%
(20)
65)
45)
Operating Income
4%
4
(97)
(93)
SG&A
-15%
(24)
162)
138)
Gross Margin
3%
49
(1,573)
(1,524)
Cost of Sales
-4%
$ (73)
$ 1,735)
$ 1,662)
Sales
%
$
Better/(Worse)
2006
2007
Three Months Ended June 30,
(in millions, except per share amounts)
6
0%
-
(2)
(2)
Unallocated Corporate Costs
-13%
(14)
110)
96)
Segment EBITDA
-29%
(2)
(7)
(9)
ET Corporate Allocations
-16%
$ (16)
$ 101)
$ 85)
Total EBITDA
-0.7 pts
5.8%
5.1%
Total EBITDA Margins
-0.5 pts
6.3%
5.8%
Segment EBITDA Margins
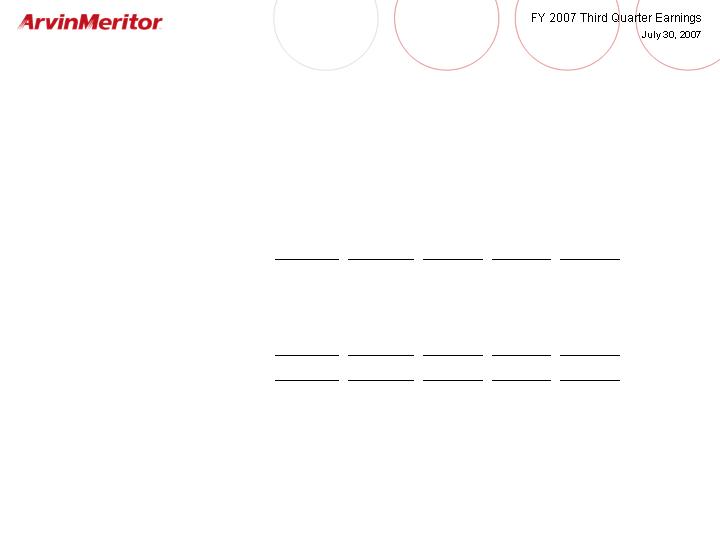
-1.5 pts
7.7%
6.2%
Commercial Vehicle System
1.1 pts
3.8%
4.9%
Light Vehicle Systems (2)
EBITDA Margins
-25%
(22)
87)
65)
Commercial Vehicle System
35%
$ 8)
$ 23)
$ 31)
Light Vehicle Systems
EBITDA
%
$
Better/(Worse)
2006
2007
Quarter Ended June 30,
(in millions)
Segment EBITDA Before Special Items (1)
7
(1)
See Appendix – “Non-GAAP Financial Information”
(2)
Adjusted to reflect the impact of reduced volumes in our Brussels operation

ET Proceeds Received to Date
$ 215
Cash Received to Date
Quarter Ended
June 30, 2007
$ 251
Cash Portion
(59)
Less Note and Assumed Liabilities
(36)
Delayed Closings (1)
$ 40 – $ 60
Memo: Pending Refund of Working Capital
$ 310
Total Consideration
(In millions)
(1) In escrow and expected to close in Q4.
8
Free Cash Flow including Divestiture Proceeds
Free Cash Flow
(42)
-- Continuing Operations
(114)
-- Discontinued Operations
$ 215
ET Proceeds Received to Date
Quarter Ended
June 30, 2007
$ 59
Free Cash Flow including Proceeds
(In millions)
9
Free Cash Flow (1)
30
50
Restructuring and Other
Quarter Ended
June 30,
(32)
(177)
Performance Working Capital (2)
$ 155
$ (156)
Free Cash Flow
78
(114)
Discontinued Operations
63
95
Off Balance Sheet Securitization and Factoring
6
(14)
Pension and Retiree Medical Net of Expense
6
8
Net Spending (D&A less Capital Expenditures)
$ 4
$ (4)
Income (Loss) from Continuing Operations
2006
2007
(1) See Appendix – “Non-GAAP Financial Information”
(2) Change in payables less changes in receivables, inventory and customer tooling
(In millions)
10
Pension Underfunded Status
(In millions)
11
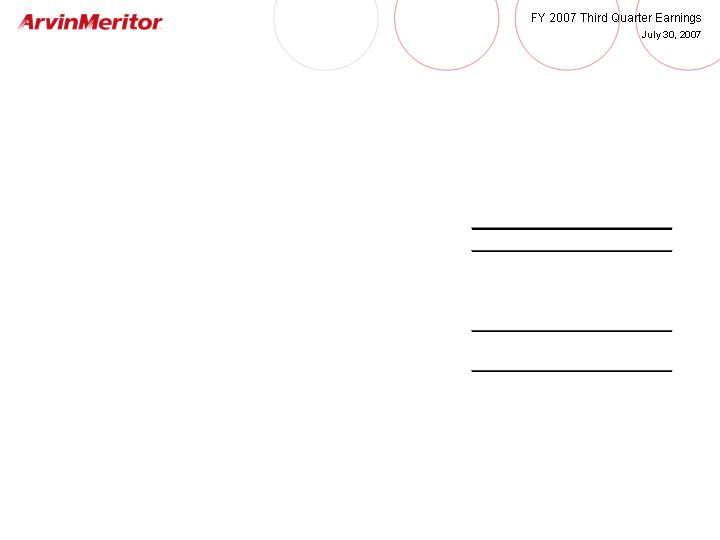
Fiscal Year 2007 Outlook
Continuing Operations Before Special Items
(100)
(50)
Free Cash Flow
0.80
0.75
Diluted Earnings Per Share
$ 57
$ 54
Income from Continuing
Operations
0%
(4)%
Effective Tax Rate
(110)
(100)
Interest Expense
300
285
EBITDA
$ 6,300
$ 6,200
Sales
FY 2007
Full Year Outlook (1)
(in millions except tax rate and EPS)
(1) Excluding gains or losses on divestitures, restructuring costs, and other special items
12
(1) Excluding gains or losses on divestitures, restructuring costs, and other special items
(0.10)
–
Funding Cost of Working Capital Investments
0.05 – 0.10
100 – 200
ROW Sales Growth
0.05
–
Lower Tax Rate
$6,200 – $6,300
$6,000 – $6,200
Sales
(millions)
$0.75 – $0.80
Updated FY 2007 Guidance Range
$0.70 – $0.80
Previous Guidance
Estimated
EPS (1)
FY 2007 Outlook vs. Prior
Continuing Operations Before Special Items
13
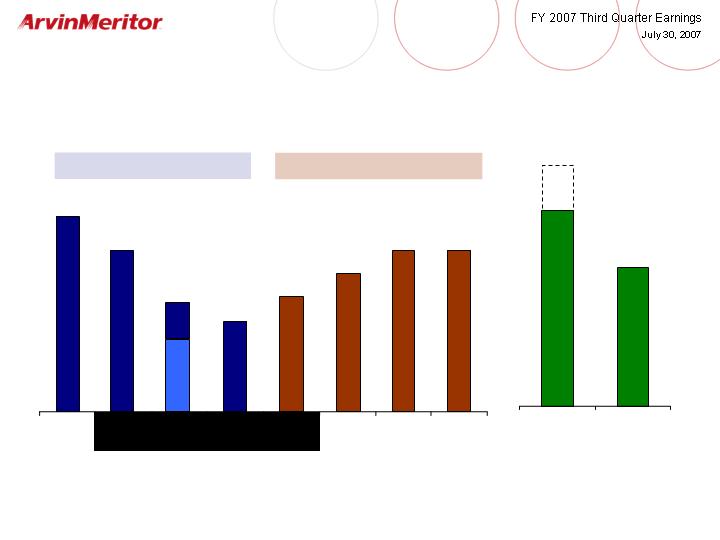
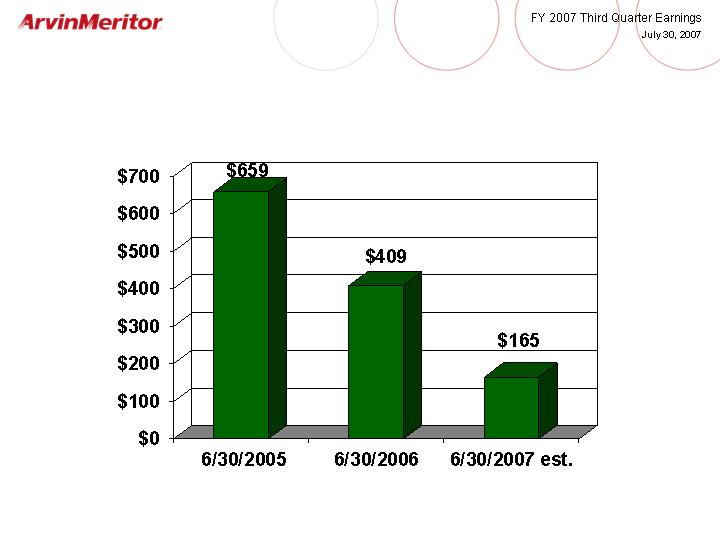
(Thousands of vehicles)
FY2007 = 238K vehicles
FY2008 = 250K vehicles
Q2 Q3 Q4 Q1
CY2007 = 199K Vehicles
89
71
50
60
70
70
Q1
Q2
Q3
Q4
42
310
220
FY2009
FY2010
36
North America Class 8 Volumes
28*
* Previous forecast
14

Why ArvinMeritor?
Strong commercial vehicle volumes
Continuing strong industry in Europe
Continuing rapid growth in Asia and South America
2008-2009 pre-buy in North America
Performance Plus profit improvement plan
$75 million cost reductions by 2008
$150 million cost reductions by 2009
Significant growth initiatives
Continued rapid growth in Asia
New chassis JV and expanded relationship with Chery
Significant expansion of commercial vehicle axle business in India
Strong balance sheet
Track record of reducing leverage and improving liquidity
Positioned for investment opportunities
15

Appendix
16
Use of Non-GAAP Financial Information
In addition to the results reported in accordance with accounting principles generally accepted in the United States (“GAAP”)
included throughout this presentation, the Company has provided information regarding income from continuing operations
and diluted earnings per share before special items, which are non-GAAP financial measures. These non-GAAP measures
are defined as reported income or loss from continuing operations and reported diluted earnings or loss per share from
continuing operations plus or minus special items. Other non-GAAP financial measures include “EBITDA,” “net debt” and
“free cash flow”. EBITDA is defined as earnings before interest, taxes, depreciation and amortization, and losses on sales of
receivables, plus or minus special items. Net debt is defined as total debt less the fair value adjustment of notes due to
interest rate swaps, less cash. Free cash flow represents net cash provided by operating activities less capital expenditures.
Management believes that the non-GAAP financial measures used in this presentation are useful to both management and
investors in their analysis of the Company’s financial position and results of operations. In particular, management believes
that net debt is an important indicator of the Company’s overall leverage and free cash flow is useful in analyzing the
Company’s ability to service and repay its debt. EBITDA is a meaningful measure of performance commonly used by
management, the investment community and banking institutions to analyze operating performance and entity valuation.
Further, management uses these non-GAAP measures for planning and forecasting in future periods.
These non-GAAP measures should not be considered a substitute for the reported results prepared in accordance with
GAAP. Neither net debt nor free cash flow should be considered substitutes for debt, cash provided by operating activities or
other balance sheet or cash flow statement data prepared in accordance with GAAP or as a measure of financial position or
liquidity. In addition, the calculation of free cash flow does not reflect cash used to service debt and thus, does not reflect
funds available for investment or other discretionary uses. EBITDA should not be considered an alternative to net income as
an indicator of operating performance or to cash flows as a measure of liquidity. These non-GAAP financial measures, as
determined and presented by the Company, may not be comparable to related or similarly titled measures reported by other
companies.
Set forth on the following slides are reconciliations of these non-GAAP financial measures, if applicable, to the most directly
comparable financial measures calculated and presented in accordance with GAAP.
17
Announced Plant Closures
Freightliner,
Armor Holdings,
CVA
BMW, GM,
Nissan, Ford/
Land Rover,
Porsche
Volkswagen
Major Customers
Drivelines
Sunroofs and
components
Door systems
Products
17
182
128
Number of Employees
20,000
146,000
103,000
Square Footage
St. Thomas,
Ontario
Frankfurt,
Germany
Brussels,
Belgium
18
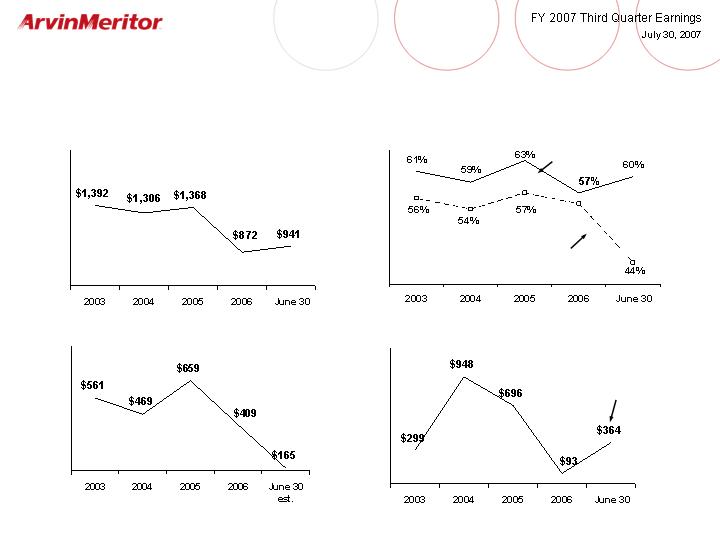
Debt-to-capitalization ratio
Unfunded pension liability
(millions)
Term debt due within 5 years
(millions)
Net debt
(millions)
Balance Sheet Strengthening
Market value
Book value
8-3/4% due
March 2012
19
Non-GAAP Financial Information
Income Statement Special Items Walk 3Q 2007
20
Product
Before
GAAP
Disruptions
Income
Special Items
Q3 2007
and Restructuring
Taxes
Q3 2007
Sales
1,662
$
-
$
-
$
1,662
$
Gross Margin
136
2
-
138
Operating Income
19
26
-
45
Income (Loss) Before Income Taxes
2
26
-
28
Income (Loss) From Continuing Operations
(4)
16
6
18
DILUTED EARNINGS (LOSS) PER SHARE
Continuing Operations
(0.06)
$
0.23
$
0.08
$
0.25
$
Diluted Shares Outstanding
70.8
71.8
71.8
71.8
EBITDA
Light Vehicle Systems
12
$
19
$
-
$
31
$
Commercial Vehicle Systems
63
2
-
65
Segment EBITDA
75
21
-
96
Unallocated Corporate Costs
(7)
5
-
(2)
ET Corporate Allocations
(9)
-
-
(9)
Total EBITDA
59
$
26
$
-
$
85
$
Non-GAAP Financial Information
Income Statement Special Items Walk 3Q 2006
21
Tilbury
Before
GAAP
Work
Taxes,
Special Items
Q3 2006
Stoppage
Sheffield
Restructuring
other
Q3 2006
Sales
1,735
$
-
$
-
$
-
$
-
$
1,735
$
Gross Margin
117
45
-
-
-
162
Operating Income
24
45
(5)
1
-
65
Income Before Income Taxes
6
45
(5)
1
-
47
Income From Continuing Operations
4
28
(3)
1
1
31
DILUTED EARNINGS (LOSS) PER SHARE
Continuing Operations
0.06
$
0.40
$
(0.04)
$
0.01
$
0.01
$
0.44
$
Diluted Shares Outstanding
70.1
70.1
70.1
70.1
70.1
70.1
EBITDA
Light Vehicle Systems
28
$
-
$
(5)
$
-
$
-
$
23
$
Commercial Vehicle Systems
41
45
-
1
-
87
Segment EBITDA
69
45
(5)
1
-
110
Unallocated Corporate Costs
(2)
-
-
-
-
(2)
ET Corporate Allocations
(7)
-
-
-
-
(7)
Total EBITDA
60
$
45
$
(5)
$
1
$
-
$
101
$
Non-GAAP Financial Information
Income Statement Special Items Walk FY 2006
22
Twelve Months
Tilbury
Environmental
Before
Reported
Gains on
Work
Severance
Retiree
Debt
Taxes,
Special Items
9/30/06
Divestitures
Restructuring
Stoppage
and Other
Medical
Extinguishment
other
9/30/06
Sales
6,415
$
-
$
-
$
-
$
-
$
-
$
-
$
-
$
6,415
$
Gross Margin
505
-
-
45
3
5
-
-
558
Operating Income
171
(28)
18
45
12
5
-
-
223
Income Before Income Taxes
72
(28)
18
45
12
5
10
-
134
Income From Continuing Operations
112
(17)
11
28
7
3
6
(57)
93
DILUTED EARNINGS (LOSS) PER SHARE
Continuing Operations
1.60
$
(0.24)
$
0.16
$
0.40
$
0.10
$
0.04
$
0.09
$
(0.81)
$
1.32
$
Diluted Shares Outstanding
70.2
70.2
70.2
70.2
70.2
70.2
70.2
70.2
70.2
EBITDA
Light Vehicle Systems
58
$
(5)
$
13
$
-
$
3
$
-
$
-
$
-
$
69
$
Commercial Vehicle Systems
293
(23)
5
45
3
5
-
-
328
Segment EBITDA
351
(28)
18
45
6
5
-
-
397
Unallocated Corporate Costs
(7)
-
-
-
6
-
-
-
(1)
ET Corporate Allocations
(31)
-
-
��
-
-
-
-
-
(31)
Total EBITDA
313
$
(28)
$
18
$
45
$
12
$
5
$
-
$
-
$
365
$
Non-GAAP Financial Information
3Q EBITDA Reconciliation
23
2007
2006
Total EBITDA - Before Special Items
$ 85
$ 101
Restructuring Costs
(24)
(1)
Product Disruptions
(2)
(45)
Gain on Divestitures
-
5
Loss on Sale of Receivables
(3)
-
Depreciation and Amortization
(32)
(30)
Interest Expense, Net
(27)
(28)
Benefit (Provision) for Income Taxes
(1)
2
Income (Loss) From Continuing Operations
(4)
$
4
$
Quarter Ended
June 30,
Non-GAAP Financial Information
Net Debt
24
(in millions)
Q3
Q2
Q1
Q4
Q3
FY 2007
FY 2007
FY 2007
FY 2006
FY 2006
Short-term Debt
108
$
17
$
137
$
56
$
65
$
Long-term Debt
1,118
1,220
1,174
1,174
1,275
Total Debt
1,226
1,237
1,311
1,230
1,340
Less:
Cash
(284)
(222)
(369)
(350)
(365)
Fair value adjustment of notes
(1)
(8)
(8)
(8)
(3)
Net Debt
941
$
1,007
$
934
$
872
$
972
$
Non-GAAP Financial Information
Free Cash Flow
25
2007
2006
Cash provided by (used for) operating activities
(127)
$
186
$
Less: Capital expenditures (1)
(29)
(31)
Free cash flow
(156)
$
155
$
(1) Includes capital expenditures of discontinued operations.
Three Months Ended
June 30,

26