Exhibit 99a

Deutsche Bank
2007 Leveraged Finance
Conference
Jim Donlon, Executive Vice President and CFO
Mary Lehmann, Sr. VP, Strategic Initiatives, and Treasurer
October 3, 2007
1

Forward-Looking Statements
This presentation contains statements relating to future results of the company (including certain projections and
business trends) that are “forward-looking statements” as defined in the Private Securities Litigation Reform Act of
1995. Forward-looking statements are typically identified by words or phrases such as “believe,” “expect,”
“anticipate,” “estimate,” “should,” “are likely to be,” “will” and similar expressions. Actual results may differ
materially from those projected as a result of certain risks and uncertainties, including but not limited to global
economic and market cycles and conditions; the demand for commercial, specialty and light vehicles for which the
company supplies products; risks inherent in operating abroad (including foreign currency exchange rates and
potential disruption of production and supply due to terrorist attacks or acts of aggression); availability and cost of
raw materials, including steel; OEM program delays; demand for and market acceptance of new and existing
products; successful development of new products; reliance on major OEM customers; labor relations of the
company, its suppliers and customers, including potential disruptions in supply of parts to our facilities or demand
for our products due to work stoppages; the financial condition of the company’s suppliers and customers,
including potential bankruptcies; possible adverse effects of any future suspension of normal trade credit terms by
our suppliers; potential difficulties competing with companies that have avoided their existing contracts in
bankruptcy and reorganization proceedings; successful integration of acquired or merged businesses; the ability
to achieve the expected annual savings and synergies from past and future business combinations and the ability
to achieve the expected benefits of restructuring actions; success and timing of potential divestitures; potential
impairment of long-lived assets, including goodwill; competitive product and pricing pressures; the amount of the
company’s debt; the ability of the company to continue to comply with covenants in its financing agreements; the
ability of the company to access capital markets; credit ratings of the company’s debt; the outcome of existing and
any future legal proceedings, including any litigation with respect to environmental or asbestos-related matters;
rising costs of pension and other post-retirement benefits and possible changes in pension and other accounting
rules; as well as other risks and uncertainties, including but not limited to those detailed herein and from time to
time in other filings of the company with the SEC. These forward-looking statements are made only as of the
date hereof, and the company undertakes no obligation to update or revise the forward-looking statements,
whether as a result of new information, future events or otherwise, except as otherwise required by law.
2

Product Portfolio
Commercial Vehicle Systems
Light Vehicle Systems
3

Customer Base After ET Divestiture
2006 Sales
Commercial Vehicle Customers
Light Vehicle Customers
DaimlerChrysler
8%
General Motors 3%
Volkswagen
7%
Ford 3%
Asian Based
OEMs 4%
BMW 1%
Other LVS 7%
Other CVS
22%
Fiat 2%
Asian Based
OEMs 4%
Ford 1%
Volkswagen 1%
General Motors 1%
PACCAR 2%
International
5%
Volvo 17%
DaimlerChrysler
12%
67%
Commercial
Vehicle
33%
Light
Vehicle
4

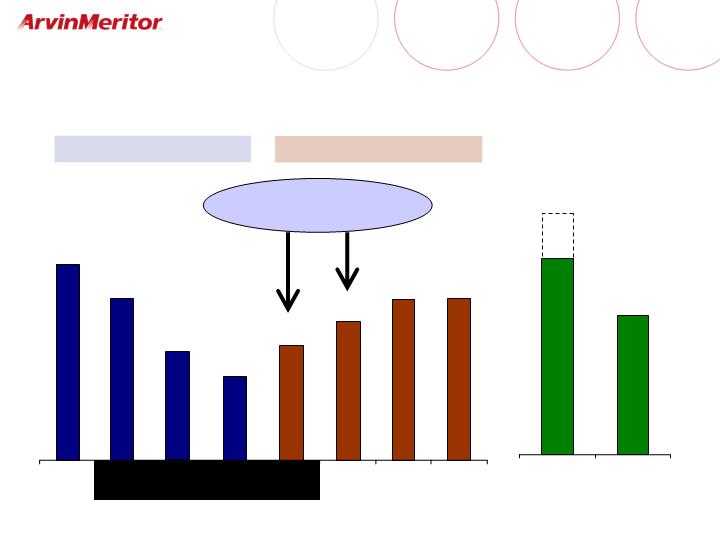
Scorecard of Downturn Offsets
Slide from June 2006 showing expected offsets to N.A. Class 8 downturn
Layered Capacity
Emerging Markets
High-Volume Premium Reduction
CVA Growth
Specialty Vehicle Market
CVE Growth
Trailer Productivity
Conversion @ 15%-20% ($45M) – ($60M)
Other Markets ~($15M)
30-35% ~($300M)
Exposure to Class 8: 11% of $8.8B ~ $900M
2007 Outcome
½
Volume shortfall
Sold Emissions
Industry contracted
Migrated to Europe
Exceeded
As estimated
June 2006
5

Credit Crunch Affects Aftermarket, Trailers and
OE Truck Sales
Scarce funding
exacerbates already poor
new home sales.
The demand for aftermarket
truck components declines as
ton-miles remain weak.
Trailer sales also suffer.
The volume of building
materials, landscaping
materials, appliances
and furniture being
shipped is down.
Class 8 truck downturn lasts
longer, and mix favors owner-
operators over large fleets.
About 20% of
all freight is
related to new
housing
construction
6

Truck Tonnage Index
Seasonally adjusted monthly index, 2000 = 100.0
Jan
2006
Apr
2006
Jul
2006
Oct
2006
Jan
2007
Apr
2007
Freight volumes were weak even before credit crunch
Source: ATA
Jul
2007
July down 4% vs July 2006
Below year-ago 12 of last 13 months
July CYTD down 3% vs 2006
August and September weaker
7

2007 CY U.S. Trailer Sales Forecast
Total U.S. trailer industry builds
Actual
September Forecast
January Forecast
Source: ACT Research
Trailer weakness continues to surprise industry analysts
August Forecast
11% miss
Lowered by 8%
one month later
8

Class 8 Truck Net New Orders
2006
2007
2005
Source: ACT Research
New order intake for heavy trucks has been weak
9
FY2007 = 224K vehicles
FY2008 = 250K vehicles
Q2 Q3 Q4 Q1
CY2007 = 185K Vehicles
89
71
50
60
70
70
Q1
Q2
Q3
Q4
42
310
220
FY2009
FY2010
36
Class 8 Production Likely to Recover Later
(Thousands of vehicles)
Downward pressure
10

Unfavorable Sales Mix
Class 8 Registrations July YTD
32%
24%
For-hire Carriers
All Other
For-hire freight carriers (where ARM share is greatest) affected most
Source: R.L. Polk
Total registrations 30% lower
2006
2007
11

Europe Medium & Heavy Truck Production
Thousands of vehicles, fiscal quarters
Nov. 2006 Forecast
Preliminary Actual
Source: Internal estimates
Europe truck volumes have taken OEMs and suppliers off-guard
FY Actual
510
FY Forecast
419
22% Surprise
15%
20%
15%
47%
12

Premium freight
CVS Europe Supply Constraints
Western
European
Suppliers
ArvinMeritor
Eastern
European &
Asian
Suppliers
Components
Systems
Assembly
Vehicle
Assembly
Capacity
Constrained
Capacity
Constrained
Capacity
Constrained
Premium freight
Scheduling
Challenged
Late changes
Qualify new
suppliers
Capacity
Constrained
Premium freight
Premium freight
Scheduling
Challenged
Capacity
Investments
Lean manu-
facturing
13

Revised Outlook for 2007
Earnings Per Share
EPS Impact
2008
2007
Element
None
($0.20)
Non-recurring items in Q4
- Supplier reorganizations
- German tax law change
1H flowthrough
($0.20)
Ongoing operational issues
- Weak U.S. economy
- Supply shortages in Europe
14

2008 Guidance Compared to 2007
Diluted EPS for Continuing Operations Before Special Items
0.25 - 0.35
Performance Plus product & growth actions
including improved customer terms
0.10 - 0.15
Pension and retiree medical
(0.20) - (0.30)
1H flowthrough of Q4 operational issues
(0.10) - (0.20)
North America CVS net volume and mix
0.70 - 0.75
Performance Plus cost savings
$1.40 - $1.60
FY 2008 Guidance
$0.75 - $0.80
July 30, 2007 Guidance – FY 2007
15
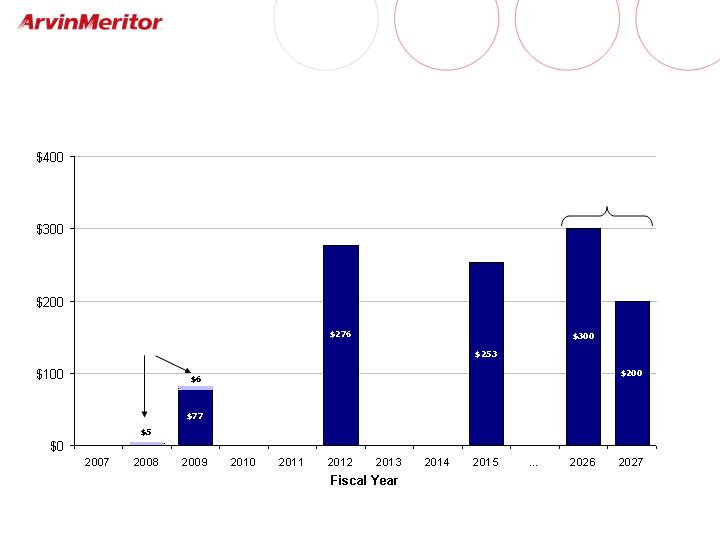
Convertible
Newest
Issue
Term Debt Profile
(Maturities in millions)
Defeased
16

Retiree Healthcare
June 30, 2007 estimate
Unfunded Position: ��
$587 million
Disputed
Amount
$168
UAW
Plants
$447
Salaried
and Other
$140
Annual spend:
$50-$55 million
expense and
cash
17

Medium-term Investment Thesis Intact
Strong commercial vehicle volumes
Solid 2H 2008 in North America, followed by 2009 pre-buy
Continuing strong industry in Europe, with improving ability
to capitalize
Continuing rapid growth in Asia
Performance Plus profit improvement plan
$75 million cost reductions in 2008 and $150 million in 2009
Significant growth initiatives
Solid balance sheet
No significant near-term maturities of term debt
Short-term credit line covenant relief granted
18