
FY 2007 Fourth Quarter
Earnings Presentation
Chip McClure, Chairman, CEO & President
Jim Donlon, Executive Vice President & CFO
November 14, 2007

Forward-Looking Statements
This presentation contains statements relating to future results of the company (including certain projections and
business trends) that are “forward-looking statements” as defined in the Private Securities Litigation Reform Act of
1995. Forward-looking statements are typically identified by words or phrases such as “believe,” “expect,”
“anticipate,” “estimate,” “should,” “are likely to be,” “will” and similar expressions. Actual results may differ
materially from those projected as a result of certain risks and uncertainties, including but not limited to global
economic and market cycles and conditions; the demand for commercial, specialty and light vehicles for which the
company supplies products; risks inherent in operating abroad (including foreign currency exchange rates and
potential disruption of production and supply due to terrorist attacks or acts of aggression); availability and cost of
raw materials, including steel and oil; OEM program delays; demand for and market acceptance of new and
existing products; successful development of new products; reliance on major OEM customers; labor relations of
the company, its suppliers and customers, including potential disruptions in supply of parts to our facilities or
demand for our products due to work stoppages; the financial condition of the company’s suppliers and
customers, including potential bankruptcies; possible adverse effects of any future suspension of normal trade
credit terms by our suppliers; potential difficulties competing with companies that have avoided their existing
contracts in bankruptcy and reorganization proceedings; successful integration of acquired or merged businesses;
the ability to achieve the expected annual savings and synergies from past and future business combinations and
the ability to achieve the expected benefits of restructuring actions; success and timing of potential divestitures;
potential impairment of long-lived assets, including goodwill; potential adjustment of the value of deferred tax
assets; competitive product and pricing pressures; the amount of the company’s debt; the ability of the company
to continue to comply with covenants in its financing agreements; the ability of the company to access capital
markets; credit ratings of the company’s debt; the outcome of existing and any future legal proceedings, including
any litigation with respect to environmental or asbestos-related matters; rising costs of pension and other post-
retirement benefits and possible changes in pension and other accounting rules; as well as other risks and
uncertainties, including but not limited to those detailed herein and from time to time in other filings of the
company with the SEC. These forward-looking statements are made only as of the date hereof, and the company
undertakes no obligation to update or revise the forward-looking statements, whether as a result of new
information, future events or otherwise, except as otherwise required by law.
FY 2007 Fourth Quarter Earnings
November 14, 2007
2

2007 Highlights
Earned $0.53 per share from continuing operations before special
items (1)
Booked a substantial amount of new business, including a new
relationship with Chery and components for the majority of the
MRAP vehicles awarded
Completed the sale of Emissions Technologies
Continued our aggressive restructuring plan
Continued to expand LVS margins
Continued to grow affiliate income through joint ventures
Improved technical capability by doubling employment at India tech
center and initiating new tech center for Shanghai
Generated ideas and completed implementation plans for promised
2008 cost reductions through Performance Plus
Cut pension underfunding by more than half
(1) See Appendix – “Non-GAAP Financial Information”
FY 2007 Fourth Quarter Earnings
November 14, 2007
3
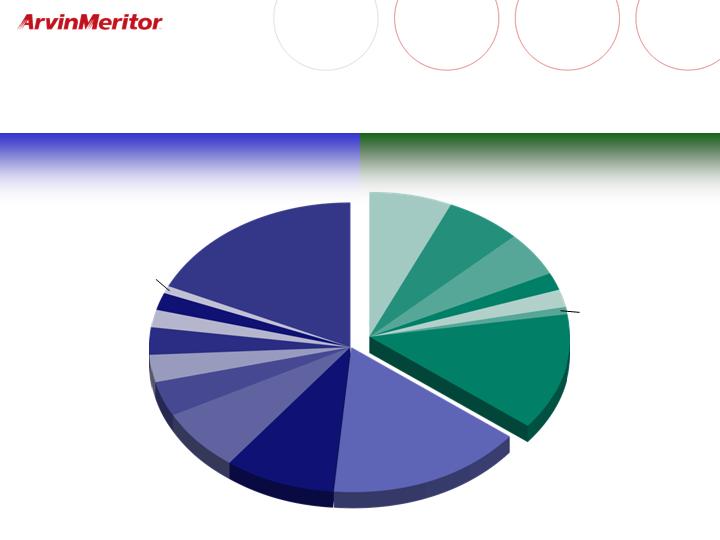
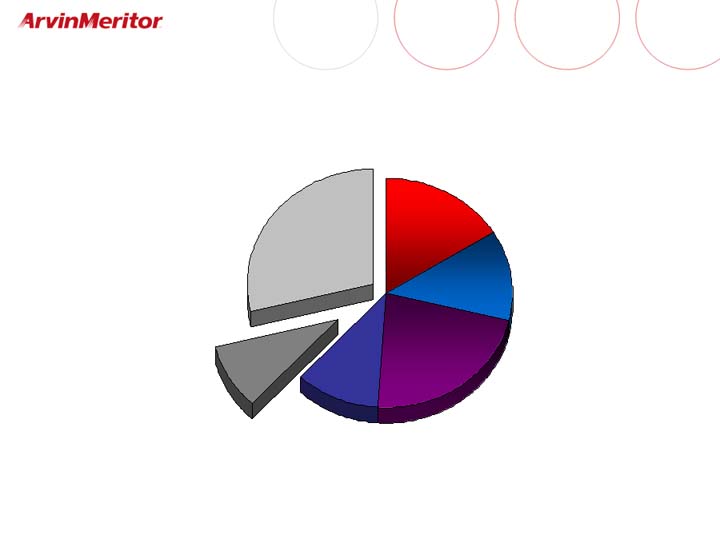
Commercial Vehicle Customers
Light Vehicle Customers
Volkswagen
7%
Customer Base
2007 Sales
Chrysler
6%
General Motors 1%
Ford 2%
Asian Based OEMs 5%
Volvo
16%
Other LVS
12%
Other CVS
18%
Fiat 3%
Asian Based
OEMs 7%
Ford 1%
Volkswagen 2%
General Motors 2%
PACCAR 3%
International 4%
Daimler 9%
PSA 2%
65%
Commercial
Vehicle
35%
Light
Vehicle
FY 2007 Fourth Quarter Earnings
November 14, 2007
4

2008 Outlook and Actions
FY 2008 EPS guidance before special items of $1.40
to $1.60, unchanged from previous outlook
Expecting positive cash flow for FY 2008
SG&A “belt-tightening” actions for first half of year
Performance Plus on track, integrated into business
units
Gradual improvement in European supply and
operational issues
Plant restructuring on track
Improving terms with customers, suppliers and
employees
Growth initiatives continue to contribute new wins
FY 2007 Fourth Quarter Earnings
November 14, 2007
5

Satisfying CVS Europe Customer Demand
Launch new suppliers as necessary
Make capital investment to increase capacity and
capabilities
Re-charge lean manufacturing at other facilities
Completion
Action
Work with customers to optimize schedules
Develop talent base and fill key leadership positions
Leverage internal and external NA capacity
Ramp up existing suppliers and JVs in LCCCs
Execute lean manufacturing in constraint operations
FY 2007 Fourth Quarter Earnings
November 14, 2007
6
Announced Plant Closures
Brussels, Belgium (Doors)
Frankfurt, Germany (Roofs)
Toronto, Ontario (Ride
Control)
Chickasha, OK (Ride
Control)
St. Thomas, Ontario
(Trailer Axle)
Arden, NC (Truck
Axle/Brakes)
North
America
Europe
CVS
LVS
6 of 13 planned plant closures have been announced
Announced
this quarter
FY 2007 Fourth Quarter Earnings
November 14, 2007
7

New Business Wins and Expansions
Announcing a new door systems plant in Romania to
support awarded business with Dacia and western
European OEMs
Announced last week a major new contract with Hyundai to
supply aperture motors to a variety of programs globally
Announced last week a new brake and axle components
plant to be built in Monterrey, Mexico
A new Ride Control aftermarket partnership with TRW
(announced in October) will dramatically expand our reach
into European independent distributors
Received an award for an additional 1,000 MRAP units with
International in October
FY 2007 Fourth Quarter Earnings
November 14, 2007
8

Fourth Quarter Income Statement from
Continuing Operations – Before Special Items (1)
(1) See Appendix – “Non-GAAP Financial Information”
-115%
$ (0.47)
$ 0.41
$ (0.06)
Continuing Operations
Diluted Earnings (Loss) Per Share
-114%
$ (33)
$ 29
$ (4)
Income (Loss) from Continuing Operations
-67%
(2)
(3)
(5)
Minority Interests
200%
10
(5)
5
Benefit from/(Provision for) Income Taxes
-111%
(41)
37
(4)
Income (Loss) Before Income Taxes
21%
6
(28)
(22)
Interest Expense, Net and Other
11%
1
9
10
Equity in Earnings of Affiliates
-86%
(48)
56
8
Operating Income
-56%
(40)
(71)
�� (111)
SG&A and other
-7%
(9)
127
118
Gross Margin
-1%
(14)
(1,460)
(1,474)
Cost of Sales
0%
$ 5
$ 1,587
$ 1,592
Sales
%
$
Better/(Worse)
2006
2007
Three Months Ended September 30,
(in millions, except per share amounts)
FY 2007 Fourth Quarter Earnings
November 14, 2007
9

Selling, General and Administrative Costs
Before Special Items (1)
(1) See Appendix – “Non-GAAP Financial Information”
Quarterly
SG&A
(in millions)
(3)
Shared services investments (software, people moves, etc.)
(12)
Consulting costs (substantially complete)
(largely offset by savings in Cost of Sales)
$ (111)
FY 2007 Q4
(1)
Other, net of improvements
(2)
Foreign exchange
(2)
Receivables factoring costs
(3)
Administrative costs associated with restructuring
(4)
Launch of Asian growth initiatives incl. Shanghai Tech Center
(10)
Europe productivity task forces
(3)
Acceleration of lean manufacturing implementation
Performance Plus launch costs
$ (71)
FY 2006 Q4
FY 2007 Fourth Quarter Earnings
November 14, 2007
10

Full Year 2007 Income Statement from
Continuing Operations – Before Special Items (1)
(1) See Appendix – “Non-GAAP Financial Information”
-60%
$ (0.79)
$ 1.32
$ 0.53
Continuing Operations
Diluted Earnings Per Share
-59%
$ (55)
$ 93
$ 38
Income from Continuing Operations
-7%
(1)
(14)
(15)
Minority Interests
88%
23
(26)
(3)
Provision for Income Taxes
-58%
(77)
133
56
Income Before Income Taxes
15%
18
(122)
(104)
Interest Expense, Net and Other
6%
2
32
34
Equity in Earnings of Affiliates
-43%
(97)
223
126
Operating Income
-11%
(38)
(335)
(373)
SG&A and other
-11%
(59)
558
499
Gross Margin
-2%
(93)
(5,857)
(5,950)
Cost of Sales
1%
$ 34
$ 6,415
$ 6,449
Sales
%
$
Better/(Worse)
2006
2007
Twelve Months Ended September 30,
(in millions, except per share amounts)
FY 2007 Fourth Quarter Earnings
November 14, 2007
11

(1)
See Appendix – “Non-GAAP Financial Information”
-150%
(3)
(2)
(5)
Unallocated Corporate Costs
-19%
(75)
397
322
Segment EBITDA
-24%
(7)
(29)
(36)
ET Corporate Allocations
-23%
$ (85)
$ 366
$ 281
Total EBITDA
-1.3 pts
5.7%
4.4%
Total EBITDA Margins
-1.2 pts
6.2%
5.0%
Segment EBITDA Margins
0.9 pts
3.1%
4.0%
Light Vehicle System
-2.3 pts
7.8%
5.5%
Commercial Vehicle Systems
EBITDA Margins
30%
21
69
90
Light Vehicle System
-29%
$ (96)
$ 328
$ 232
Commercial Vehicle Systems
EBITDA
%
$
Better/(Worse)
2006
2007
Twelve Months Ended September 30,
(in millions)
Full Year Segment EBITDA Before Special Items (1)
FY 2007 Fourth Quarter Earnings
November 14, 2007
12

Free Cash Flow (1)
$ 178
(18)
(8)
230
12
(15)
$ (23)
2007
Quarter Ended
September 30,
$ 82
(101)
11
114
5
3
$ 50
2006
Year Ended
September 30,
53
10
Performance Working Capital (2)
$ 284
$ (113)
Free Cash Flow
(42)
(170)
Restructuring, Discontinued Operations and
Other
116
139
Off Balance Sheet Securitization and Factoring
28
(71)
Pension and Retiree Medical Net of Expense
17
9
Net Spending (D&A less Capital Expenditures)
$ 112
$ (30)
Income (Loss) from Continuing Operations
2006
2007
(1) See Appendix – “Non-GAAP Financial Information”
(2) Change in payables less changes in receivables, inventory and customer tooling
(In millions)
FY 2007 Fourth Quarter Earnings
November 14, 2007
13

Restructuring Update
$130-$140
$75-$80
$25-$30
$11
Cumulative Annual
Benefits of Restructuring
$150
$80
$100
2009
$280
$325
Total by
2012
$75
$100
$115
2008
-
$42
$71
2007
Memo: Total Performance
Plus Cost Improvement
Restructuring Cash
Restructuring Expense
(millions)
FY 2007 Fourth Quarter Earnings
November 14, 2007
14
Fiscal Year 2008 Outlook
Continuing Operations Before Special Items
Free Cash Flow
1.60
1.40
Diluted Earnings Per Share
$ 118
$ 104
Income from Continuing
Operations
24%
20%
Effective Tax Rate
(105)
(95)
Interest Expense
405
385
EBITDA
$ 6,950
$ 6,750
Sales
FY 2008
Full Year Outlook (1)
(in millions except tax rate and EPS)
(1) Excluding gains or losses on divestitures, restructuring costs, and other special items
Positive
FY 2007 Fourth Quarter Earnings
November 14, 2007
15

2008 Planning Assumptions
Calendar Year Basis
Other Regions/Metrics
North America
540-550
Europe medium & heavy
truck production (000)
235-255
Class 8 truck production
(000)
1,340
Asia medium & heavy
truck production (000)
305
Trailer production (000)
165
Europe trailer production
180
Class 5-7 truck production
(000)
17.0
W. Europe light vehicle
industry sales (millions)
16.0
U.S. light vehicle industry
sales (millions)
8,800
MRAP production
Moderate
increase
Steel price change
Flat
CV aftermarket industry
growth rate ex. pricing
2.2%
Europe GDP growth
2.4%
U.S. GDP growth
FY 2007 Fourth Quarter Earnings
November 14, 2007
16
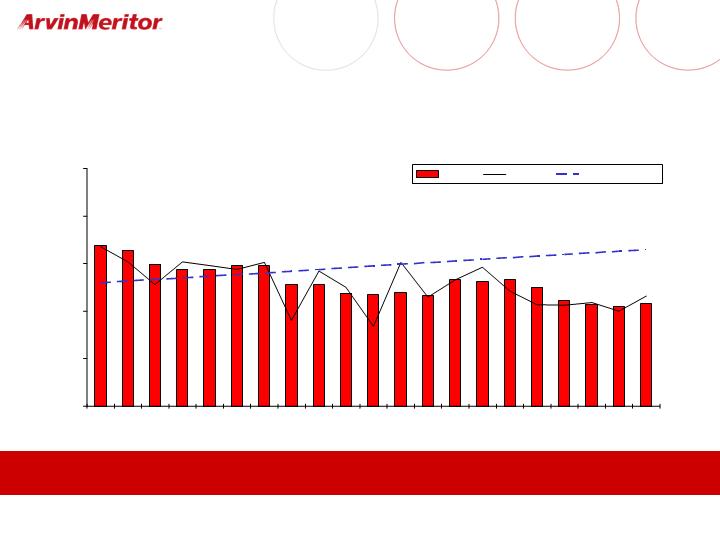
Truck Tonnage Index
Seasonally adjusted monthly index, 2000 = 100.0
Jan
2006
Apr
2006
Jul
2006
Oct
2006
Jan
2007
Apr
2007
Weak freight volumes have pressured sales and production
Source: ATA
Jul
2007
100
105
110
115
120
125
3 MMA
Monthly
10-Year Trend
FY 2007 Fourth Quarter Earnings
November 14, 2007
17
0
10,000
20,000
30,000
40,000
50,000
60,000
Jan
Feb
Mar
Apr
May
Jun
Jul
Aug
Sep
Oct
Nov
Dec
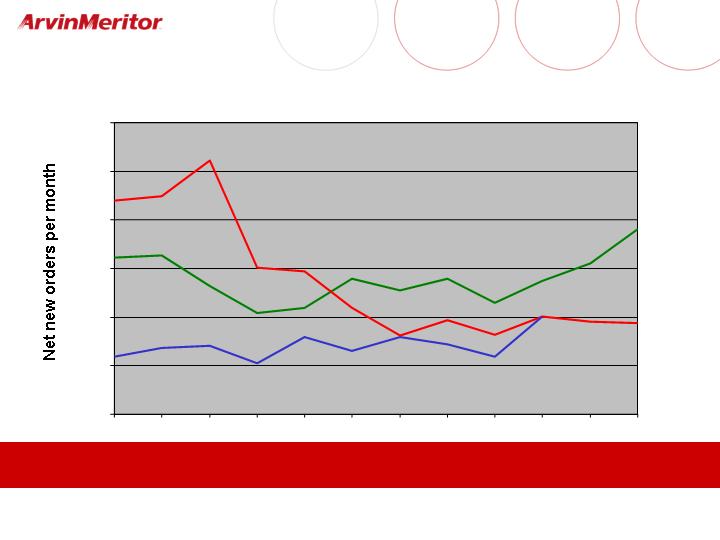
Class 8 Truck Net New Orders
2006
2007
2005
Source: ACT Research
Although choppy, a gradually improving trend is underway
FY 2007 Fourth Quarter Earnings
November 14, 2007
18
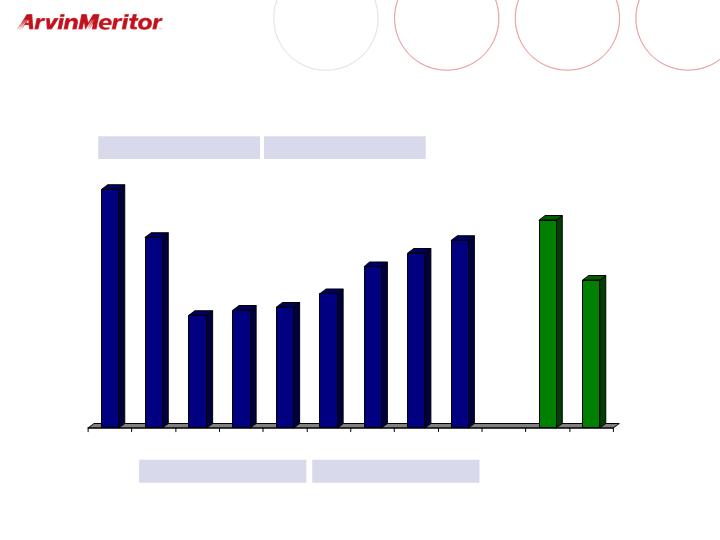
North America Class 8 Production
310
220
FY2007 = 246K vehicles
FY2008 = 210K - 230K
CY2007 = 202K vehicles
CY2008 = 235K – 255K
89
71
42
44
45
50
60
65
70
Q1
Q2
Q3
Q4
Q1
Q2
Q3
Q4
Q1
FY
2009
FY
2010
FY 2007 Fourth Quarter Earnings
November 14, 2007
19
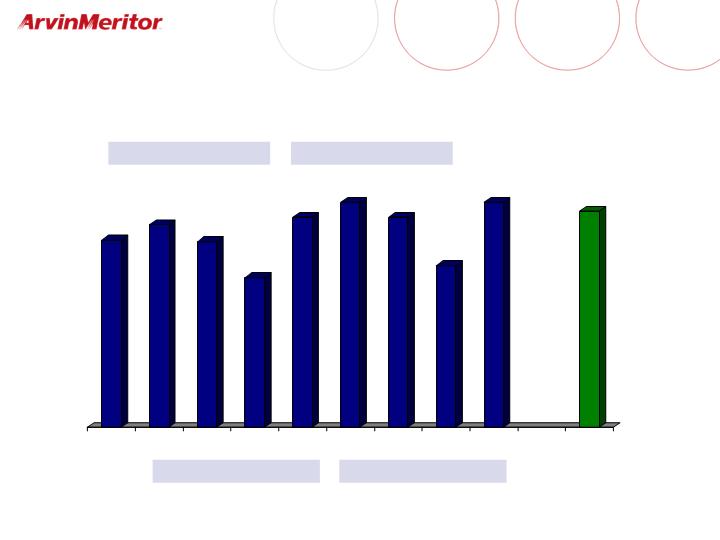
Europe Medium and Heavy Truck Production
573
FY2007 = 480K vehicles
FY2008 = 530K - 540K
CY2007 = 495K vehicles
CY2008 = 540K – 550K
+9%
+11%
+13%
124
134
123
99
139
149
139
107
149
Q1
Q2
Q3
Q4
Q1
Q2
Q3
Q4
Q1
FY
2009
FY 2007 Fourth Quarter Earnings
November 14, 2007
20

ArvinMeritor: Managed for Success
Shareholder
Alignment
Performance
Improvement
Attention to
Balance
Sheet
Strategic
Focus
Short-term compensation: EBITDA and cash flow
Long-term compensation: ROIC and total returns to shareholders
Strong executive ownership guidelines
Board composition: Chairman + 9 outside directors
Performance Plus restructuring and other cost savings of $75 million in
2008 and $150 million in 2009
Growth initiatives to expand in Asia and the most profitable segments
Strong new management to address underperforming operations
Reduced net debt by $700 million in three years
No significant maturities before 2012
Reduced pension underfunding from $659 million to $180 million
Potential opportunity to address retiree healthcare through VEBA trust
Improved focus through divestitures of RollCoater, LVA and Emissions
Growing with a purpose in key segments and geographies
Poised to profit from rebound in U.S. truck market and strength in Europe
Constantly review portfolio of businesses for optimal mix
FY 2007 Fourth Quarter Earnings
November 14, 2007
21

Appendix
FY 2007 Fourth Quarter Earnings
November 14, 2007
22
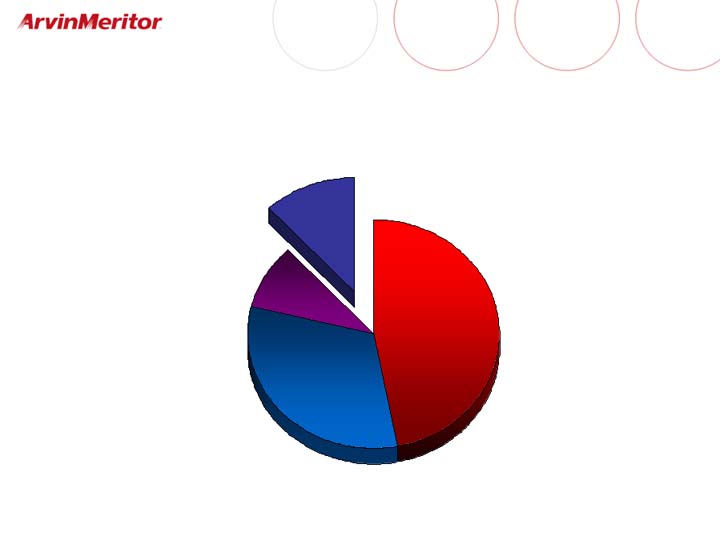
Geographic/Customer Mix
2007 Sales
Asia and Asian-
based OEMs
12%
North America
47%
South America
9%
Europe
32%
FY 2007 Fourth Quarter Earnings
November 14, 2007
23
Commercial Vehicle Systems Sales Mix
2007 Sales
N.A Class 8
16%
Asia & South
America Truck
11%
Specialty &
Aftermarket
29%
Trailers
9%
Europe Truck
22%
N.A Class 5-7
13%
FY 2007 Fourth Quarter Earnings
November 14, 2007
24

Top 10 Light Vehicle Platforms
2007 Value Added Sales
Golf, Touareg, Audi A1, Skoda
Octavia
VW PQ34/35
Santa Fe, Sonata
Hyundai NF/CM
Polo, Ibiza, Audi A2, Skoda Fabia
VW PQ24/25
Megane, Scenic
Renault C
Focus, C-MAX, Volvo S40/V50
Ford Europe C1
Ram
Dodge DR-DE
Audi Q7
VW 7L
207
Peugeot PF1
Opel Corsa
GM Europe Gamma
Jeep Cherokee, Commander
Chrysler WK/XK
Key Vehicles
Platform
FY 2007 Fourth Quarter Earnings
November 14, 2007
25

Announced Plant Closures
Chrysler, PACCAR,
Freightliner
OE shock
absorbers
500
217,000
Toronto, Ontario
AutoZone
Packaging and
distribution
200
397,000
Chickasha, Oklahoma
Hino, GM, Volvo,
International,
PACCAR
Axle and brake
assembly
56
122,000
Arden, North Carolina
Drivelines
Sunroofs and
components
Door systems
Products
Freightliner, Armor
Holdings, CVA
17
20,000
St. Thomas, Ontario
BMW, GM, Nissan,
Ford/ Land Rover,
Porsche
182
146,000
Frankfurt, Germany
Volkswagen
128
103,000
Brussels, Belgium
Major Customers
Number of
Employees
Square
Footage
FY 2007 Fourth Quarter Earnings
November 14, 2007
26
Debt-to-capitalization ratio
(market value)
Unfunded pension liability
(millions)
Term debt due within 5 years
(millions)
Net debt
(millions)
Balance Sheet Metrics
8-3/4% due
March 2012
(1) See Appendix – “Non-GAAP Financial Information”
55%
48%
57%
54%
56%
2003
2004
2005
2006
2007
$1,392
$1,306
$1,368
$726
$872
2003
2004
2005
2006
2007
$561
$469
$659
$182
$409
2003
2004
2005
2006
2007
$299
$948
$696
$364
$93
2003
2004
2005
2006
2007
FY 2007 Fourth Quarter Earnings
November 14, 2007
27

(1)
See Appendix – “Non-GAAP Financial Information”
0%
-
-
-
Unallocated Corporate Costs
-44%
(46)
104
58
Segment EBITDA
-13%
(1)
(8)
(9)
ET Corporate Allocations
-49%
$ (47)
$ 96
$ 49
Total EBITDA
-2.9 pts
6.0%
3.1%
Total EBITDA Margins
-3.0 pts
6.6%
3.6%
Segment EBITDA Margins
-1.7 pts
4.0%
2.3%
Light Vehicle System
-3.5 pts
7.8%
4.3%
Commercial Vehicle Systems
EBITDA Margins
-35%
(7)
20
13
Light Vehicle System
-46%
$ (39)
$ 84
$ 45
Commercial Vehicle Systems
EBITDA
%
$
Better/(Worse)
2006
2007
Three Months Ended September 30,
(in millions)
Q4 Segment EBITDA Before Special Items (1)
FY 2007 Fourth Quarter Earnings
November 14, 2007
28

Use of Non-GAAP Financial Information
In addition to the results reported in accordance with accounting principles generally accepted in the United States (“GAAP”)
included throughout this presentation, the Company has provided information regarding income from continuing operations
and diluted earnings per share before special items, which are non-GAAP financial measures. These non-GAAP measures
are defined as reported income or loss from continuing operations and reported diluted earnings or loss per share from
continuing operations plus or minus special items. Other non-GAAP financial measures include “EBITDA,” “net debt” and
“free cash flow”. EBITDA is defined as earnings before interest, taxes, depreciation and amortization, and losses on sales of
receivables, plus or minus special items. Net debt is defined as total debt less the fair value adjustment of notes due to
interest rate swaps, less cash. Free cash flow represents net cash provided by operating activities less capital expenditures.
Management believes that the non-GAAP financial measures used in this presentation are useful to both management and
investors in their analysis of the Company’s financial position and results of operations. In particular, management believes
that net debt is an important indicator of the Company’s overall leverage and free cash flow is useful in analyzing the
Company’s ability to service and repay its debt. EBITDA is a meaningful measure of performance commonly used by
management, the investment community and banking institutions to analyze operating performance and entity valuation.
Further, management uses these non-GAAP measures for planning and forecasting in future periods.
These non-GAAP measures should not be considered a substitute for the reported results prepared in accordance with
GAAP. Neither net debt nor free cash flow should be considered substitutes for debt, cash provided by operating activities or
other balance sheet or cash flow statement data prepared in accordance with GAAP or as a measure of financial position or
liquidity. In addition, the calculation of free cash flow does not reflect cash used to service debt and thus, does not reflect
funds available for investment or other discretionary uses. EBITDA should not be considered an alternative to net income as
an indicator of operating performance or to cash flows as a measure of liquidity. These non-GAAP financial measures, as
determined and presented by the Company, may not be comparable to related or similarly titled measures reported by other
companies.
Set forth on the following slides are reconciliations of these non-GAAP financial measures, if applicable, to the most directly
comparable financial measures calculated and presented in accordance with GAAP.
FY 2007 Fourth Quarter Earnings
November 14, 2007
29

Non-GAAP Financial Information
Income Statement Special Items Walk 4Q 2007
Before
GAAP
Income
Special Items
(in millions)
Q4 2007
Restructuring
Other (1)
Taxes
Q4 2007
Sales
1,592
$
-
$
-
$
-
$
1,592
$
Gross Margin
109
-
9
-
118
Operating Income (Loss)
(16)
10
14
-
8
Loss From Continuing Operations
(23)
6
9
4
(4)
DILUTED EARNINGS (LOSS) PER SHARE
Continuing Operations
(0.32)
$
0.08
$
0.12
$
0.06
$
(0.06)
$
EBITDA
Commercial Vehicle Systems
35
$
1
$
9
$
-
$
45
$
Light Vehicle Systems
2
8
3
-
13
Segment EBITDA
37
$
9
$
12
$
-
$
58
$
Unallocated Corporate Costs
(3)
1
2
-
-
ET Corporate Allocations
(9)
-
-
-
(9)
Total EBITDA
25
$
10
$
14
$
-
$
49
$
(1) Other includes costs associated with product disruptions, supplier reorganizations, environmental remediations and other.
FY 2007 Fourth Quarter Earnings
November 14, 2007
30

Non-GAAP Financial Information
Income Statement Special Items Walk FY 2007
Twelve Months
Ride Control
Before
Reported
Fair Value
Debt
Income
Special Items
9/30/07
Adjustment
Restructuring
Other (1)
Extinguishment
Taxes
9/30/07
Sales
6,449
$
-
$
-
$
-
$
-
$
-
$
6,449
$
Gross Margin
492
-
-
7
-
-
499
Operating Income
53
(10)
71
12
-
-
126
Income (Loss) From Continuing Operations
(30)
(6)
44
8
4
18
38
DILUTED EARNINGS (LOSS) PER SHARE
Continuing Operations
(0.43)
$
(0.08)
$
0.62
$
0.11
$
0.05
$
0.26
$
0.53
$
Diluted Shares Outstanding
70.5
71.6
71.6
71.6
71.6
71.6
71.6
EBITDA
Commercial Vehicle Systems
221
$
-
$
11
$
-
$
-
$
-
$
232
$
Light Vehicle Systems
36
(12)
54
12
-
-
90
Segment EBITDA
257
(12)
65
12
-
-
322
Unallocated Corporate Costs
(11)
-
6
-
-
-
(5)
ET Corporate Allocations
(36)
-
-
-
-
-
(36)
Total EBITDA
210
$
(12)
$
71
$
12
$
-
$
-
$
281
$
(1) Other includes costs associated with product disruptions, supplier reorganizations, environmental remediations and other.
FY 2007 Fourth Quarter Earnings
November 14, 2007
31

Non-GAAP Financial Information
Income Statement Special Items Walk 4Q 2006
Environmental,
Before
GAAP
Severance
Retiree
Taxes,
Special Items
Q4 2006
Restructuring
and Other
Medical
other
Q4 2006
Sales
1,587
$
-
$
-
$
-
$
-
$
1,587
$
Gross Margin
119
-
3
5
-
127
Operating Income
34
8
9
5
-
56
Income Before Income Taxes
15
8
9
5
-
37
Income From Continuing Operations
50
5
6
3
(35)
29
DILUTED EARNINGS (LOSS) PER SHARE
Continuing Operations
0.71
$
0.07
$
0.09
$
0.04
$
(0.50)
$
0.41
$
EBITDA
Commercial Vehicle Systems
74
$
3
$
2
$
5
$
-
$
84
$
Light Vehicle Systems
12
5
3
-
-
20
Segment EBITDA
86
8
5
5
-
104
Unallocated Corporate Costs
(4)
-
4
-
-
-
ET Corporate Allocations
(8)
-
-
-
-
(8)
Total EBITDA
74
$
8
$
9
$
5
$
-
$
96
$
FY 2007 Fourth Quarter Earnings
November 14, 2007
32

Non-GAAP Financial Information
Income Statement Special Items Walk FY 2006
Twelve Months
Environmental,
Before
Reported
Gains on
Tilbury Work
Severance
Retiree
Debt
Taxes,
Special Items
9/30/06
Divestitures
Restructuring
Stoppage
Other
Medical
Extinguishment
other
9/30/06
Sales
6,415
$
-
$
-
$
-
$
-
$
-
$
-
$
-
$
6,415
$
Gross Margin
505
-
-
45
3
5
-
-
558
Operating Income
171
(28)
18
45
12
5
-
-
223
Income Before Income Taxes
72
(28)
18
45
12
5
9
-
133
Income From Continuing Operations
112
(17)
11
28
8
3
6
(58)
93
DILUTED EARNINGS (LOSS) PER SHARE
Continuing Operations
1.60
$
(0.24)
$
0.16
$
0.40
$
0.11
$
0.04
$
0.08
$
(0.83)
$
1.32
$
EBITDA
Commercial Vehicle Systems
293
$
(23)
$
6
$
45
$
2
$
5
$
-
$
-
$
328
$
Light Vehicle Systems
58
(5)
12
-
4
-
-
-
69
Segment EBITDA
351
(28)
18
45
6
5
-
-
397
Unallocated Corporate Costs
(8)
-
-
-
6
-
-
-
(2)
ET Corporate Allocations
(29)
-
-
-
-
-
-
-
(29)
Total EBITDA
314
$
(28)
$
18
$
45
$
12
$
5
$
-
$
-
$
366
$
FY 2007 Fourth Quarter Earnings
November 14, 2007
33

Non-GAAP Financial Information
EBITDA Reconciliation
2007
2006
2007
2006
Total EBITDA - Before Special Items
$ 49
$ 96
$ 281
$ 366
Restructuring Costs
(10)
(8)
(71)
(18)
Reversal of Impairment Reserves
-
-
12
-
Gain on Divestitures
-
-
-
28
Retiree Medical
-
(5)
-
(5)
Other (1)
(14)
(9)
(12)
(57)
Loss on Sale of Receivables
(3)
(1)
(9)
(1)
Depreciation and Amortization
(33)
(33)
(129)
(124)
Interest Expense, Net and other
(22)
(28)
(110)
(131)
Income Tax Benefit
10
38
8
54
Income (Loss) From Continuing Operations
(23)
$
50
$
(30)
$
112
$
(1) Other includes costs associated with product disruptions, supplier reorganizations, environmental
remediation, severance and other.
Twelve Months Ended
September 30,
Quarter Ended
September 30,
FY 2007 Fourth Quarter Earnings
November 14, 2007
34

Non-GAAP Financial Information
Net Debt
(in millions)
Q4
Q3
Q2
Q1
Q4
FY 2007
FY 2007
FY 2007
FY 2007
FY 2006
Short-term Debt
18
$
108
$
17
$
137
$
56
$
Long-term Debt
1,130
1,118
1,220
1,174
1,174
Total Debt
1,148
1,226
1,237
1,311
1,230
Less:
Cash
(409)
(284)
(222)
(369)
(350)
Fair value adjustment of notes
(13)
(1)
(8)
(8)
(8)
Net Debt (1)
726
$
941
$
1,007
$
934
$
872
$
(1) Net debt is calculated as total debt less fair value of interest rate swaps and cash.
FY 2007 Fourth Quarter Earnings
November 14, 2007
35

Non-GAAP Financial Information
Free Cash Flow
(in millions)
2007
2006
2007
2006
Cash provided by operating activities
226
$
128
$
36
$
440
$
Less: Capital expenditures (1)
(48)
(46)
(149)
(156)
Free Cash Flow
178
$
82
$
(113)
$
284
$
(1) Includes capital expenditures of discontinued operations.
September 30,
Three Months Ended
Twelve Months Ended
September 30,
FY 2007 Fourth Quarter Earnings
November 14, 2007
36
