

Forward-Looking Statements
This presentation contains statements relating to future results of the company (including certain projections and business trends) that are
“forward-looking statements” as defined in the Private Securities Litigation Reform Act of 1995. Forward-looking statements are typically identified
by words or phrases such as “believe,” “expect,” “anticipate,” “estimate,” “should,” “are likely to be,” “will” and similar expressions. There are risks
and uncertainties relating to the company’s announced plans to divest the Body Systems business of LVS and any of the strategic options under
which to pursue such divestiture. In the case of any sale of all or a portion of the business, these risks and uncertainties include the timing and
certainty of completion of any sale, the terms upon which any purchase and sale agreement may be entered into (including potential substantial
costs) and whether closing conditions (some of which may not be within the company’s control) will be met. In the case of any shut down of
portions of the business, these risks and uncertainties include the amount of substantial severance and other payments as well as the length of
time we will continue to have to operate the business, which is likely to be longer than in a sale scenario. There is also a risk of loss of customers
of this business due to the uncertainty as to the future of this business. In addition, actual results may differ materially from those projected as a
result of certain risks and uncertainties, including but not limited to global economic and market cycles and conditions, including the recent global
economic crisis; the demand for commercial, specialty and light vehicles for which the company supplies products; risks inherent in operating
abroad (including foreign currency exchange rates and potential disruption of production and supply due to terrorist attacks or acts of aggression);
whether our liquidity will be affected by declining vehicle production volumes in the future; availability and sharply rising cost of raw materials,
including steel and oil; OEM program delays; demand for and market acceptance of new and existing products; successful development of new
products; reliance on major OEM customers; labor relations of the company, its suppliers and customers, including potential disruptions in supply
of parts to our facilities or demand for our products due to work stoppages; the financial condition of the company’s suppliers and customers,
including potential bankruptcies; possible adverse effects of any future suspension of normal trade credit terms by our suppliers; potential
difficulties competing with companies that have avoided their existing contracts in bankruptcy and reorganization proceedings; successful
integration of acquired or merged businesses; the ability to achieve the expected annual savings and synergies from past and future business
combinations and the ability to achieve the expected benefits of restructuring actions; the ability to achieve anticipated or continued cost savings
from reduction actions; success and timing of potential divestitures; potential impairment of long-lived assets, including goodwill; potential
adjustment of the value of deferred tax assets; competitive product and pricing pressures; the amount of the company’s debt; the ability of the
company to continue to comply with covenants in its financing agreements; the ability of the company to access capital markets; credit ratings of
the company’s debt; the outcome of existing and any future legal proceedings, including any litigation with respect to environmental or asbestos-
related matters; the outcome of actual and potential product liability and warranty and recall claims; rising costs of pension and other post-
retirement benefits and possible changes in pension and other accounting rules; as well as other risks and uncertainties, including but not limited to
those detailed from time to time in filings of the company with the SEC. These forward-looking statements are made only as of the date hereof, and
the company undertakes no obligation to update or revise the forward-looking statements, whether as a result of new information, future events or
otherwise, except as otherwise required by law.
All earnings per share amounts are on a diluted basis. The company's fiscal year ends on the Sunday nearest Sept. 30, and its fiscal quarters end
on the Sundays nearest Dec. 31, March 31 and June 30. All year and quarter references relate to the company's fiscal year and fiscal quarters,
unless otherwise stated.

Agenda
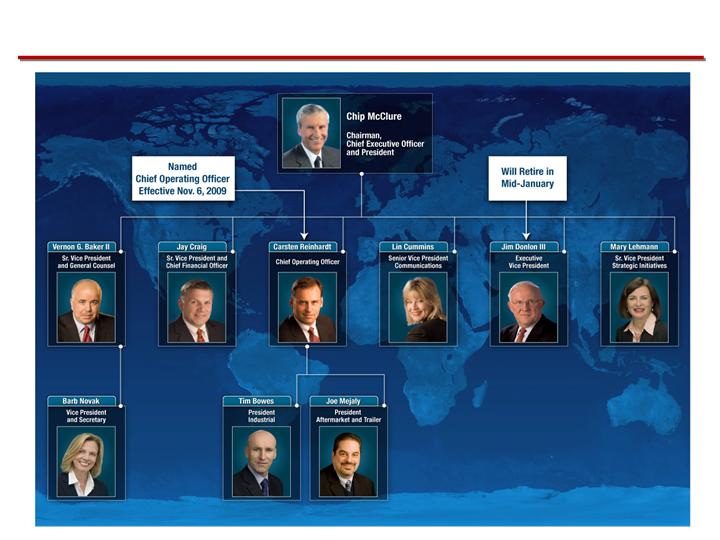
Chris Snodgrass
Vice President, Worldwide Manufacturing
Manufacturing & Supply
Chain
Jay Craig
Chief Financial Officer
Financial Overview
Strategic Direction
Chip McClure
Chairman, CEO and President
Operations Strategy &
Performance Plus
Commercial Truck
Carsten Reinhardt
Chief Operating Officer
Industrial & Asia Pacific
Tim Bowes
President, Industrial
Aftermarket & Trailer
Joe Mejaly
President, Aftermarket & Trailer
Divestiture Update
Mary Lehmann
Chris Snodgrass
& Supply Chain
Manufacturing & Supply
Chain
Jay Craig
Chief Financial Officer
Financial Overview
Strategic Direction
Chip McClure
Chairman, CEO and President
Operations Strategy &
Performance Plus
Commercial Truck
Carsten Reinhardt
Chief Operating Officer
Industrial & Asia Pacific
Tim Bowes
President, Industrial & Asia Pacific
Aftermarket & Trailer
Joe Mejaly
President, Aftermarket & Trailer
Divestiture Update
Mary Lehmann
Senior Vice President, Strategic
Initiatives
2009 Priorities
Accelerate restructuring and other cost
reductions
Continue operational performance
improvement
Complete LVS separation
Continue to grow high-margin segments
Innovate and strengthen technology
Did what we said we would do
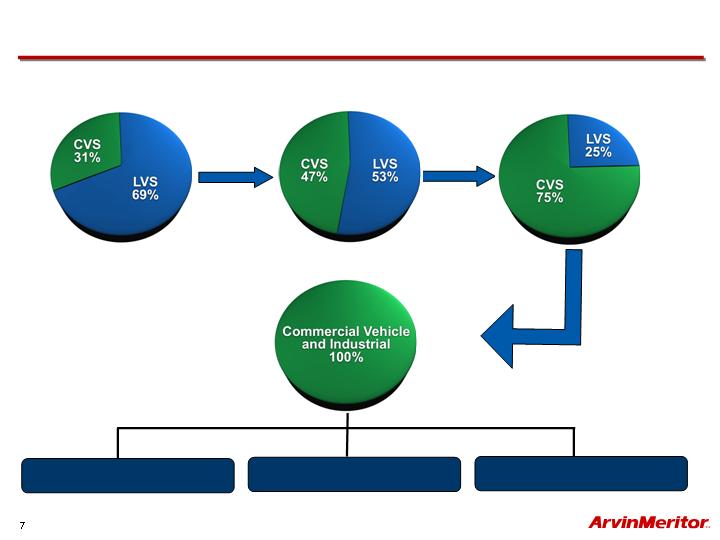
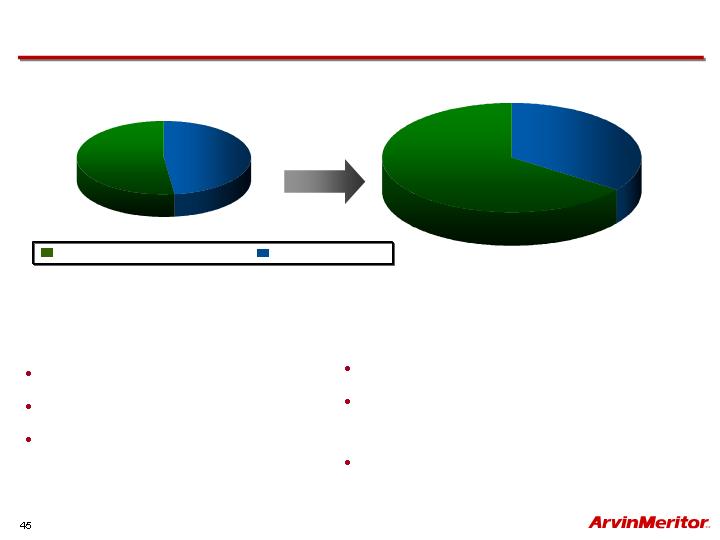
Progress Toward Transformation
FY03
FY06
Future
Commercial Truck
Industrial
Aftermarket & Trailer
Based on Sales
FY09
Commercial Truck
Maintain leadership position
in delivering advanced
drivetrain solutions
Expand global brake
leadership positions
Invest in advanced
technologies to improve
vehicle efficiency
Strengthen electronics and
controls capability
Strategic Priorities
Industrial
Grow global off-highway,
specialty and defense
business
Expand product and
customer portfolio
Grow market share in Asia
Pacific
Accelerate investments in
engineering and technology
capabilities in China and
India
Strategic Priorities
Aftermarket & Trailer
Grow aftermarket through
expansion of product portfolio
and remanufacturing
business
Continue to expand
aftermarket global distribution
network and systems
infrastructure
Expand into emerging
markets
Increase global share of the
growing trailer market
Strategic Priorities
Light Vehicle Systems
Continue commitment to
LVS divestiture strategy
Continue to invest and
support customers
Limit costs to carry the
business
Strategic Priorities

2010 Priorities
Remain focused on rigorous cost management to
realize improved operating leverage
Continue transformation to focus the company on
global commercial and industrial markets
Successfully execute as global markets recover
Drive innovation – accelerating new products and
advanced fuel efficient technologies
Maintain focus on sustainable profitable growth
Continue focus on balance sheet management

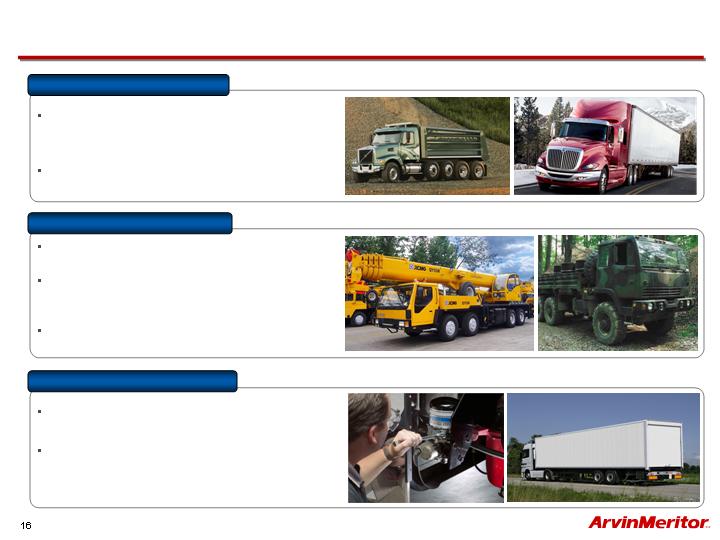
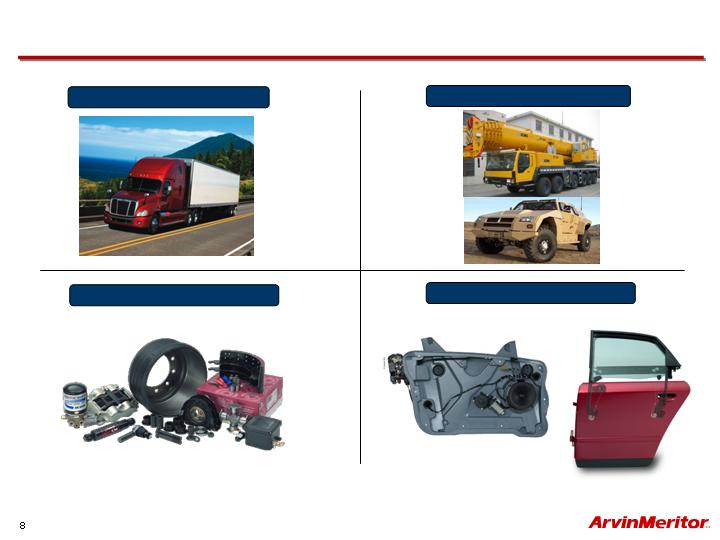
Axles, brakes, suspension and transmissions
to commercial vehicle aftermarket customers
Wide variety of undercarriage products and
systems for trailer applications
Transforming the Business
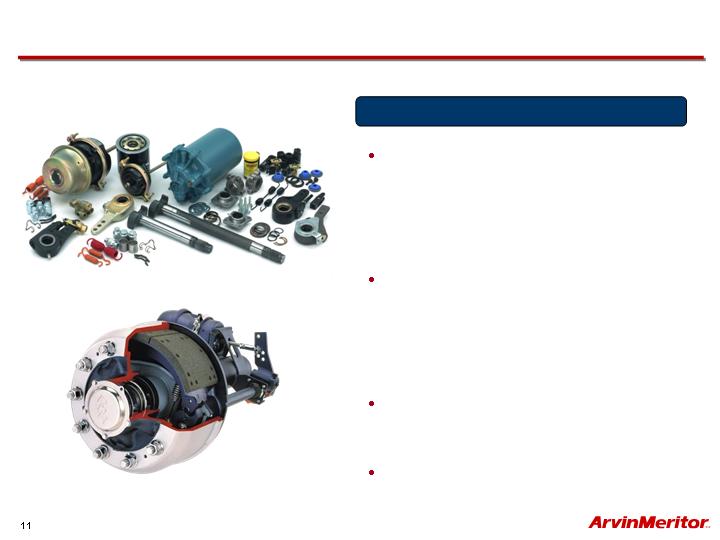
Drivetrain systems and components
including axles, drivelines, braking and
suspension systems
Medium and heavy duty trucks in NA,
SA and Europe
Drivetrain systems including axles, brakes,
drivelines and suspensions
Off-highway, military, construction, bus and
coach, fire and emergency and other
industrial
On- and off-highway activities in Asia
Pacific
Aftermarket & Trailer
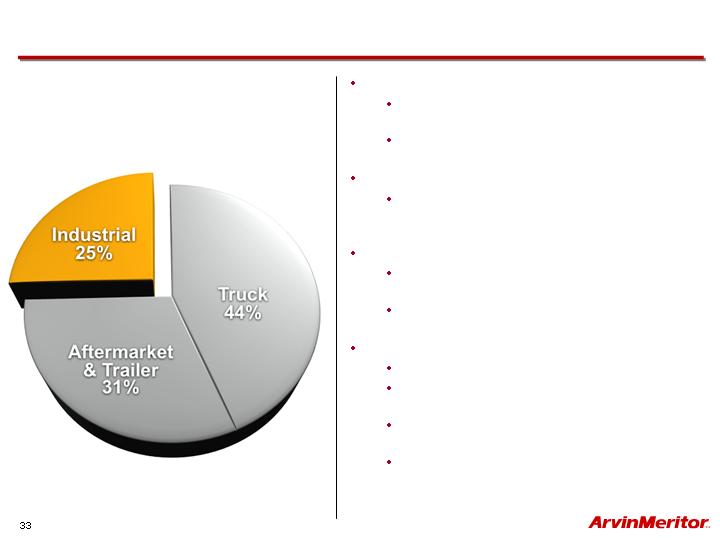
Industrial
Commercial Truck
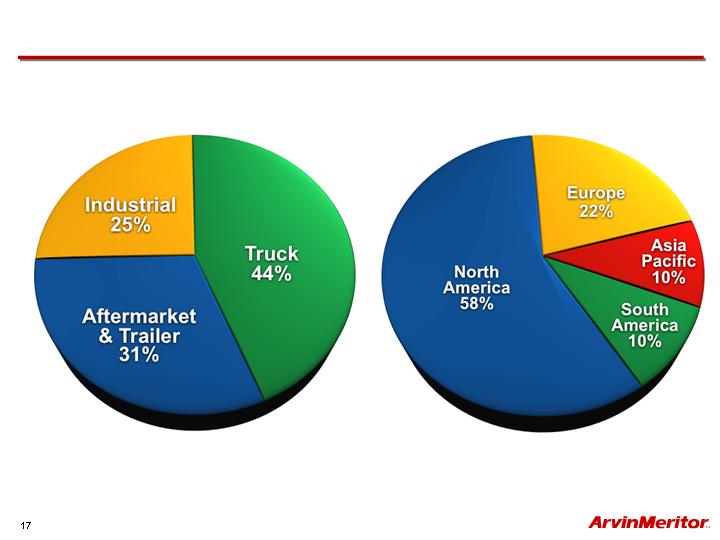
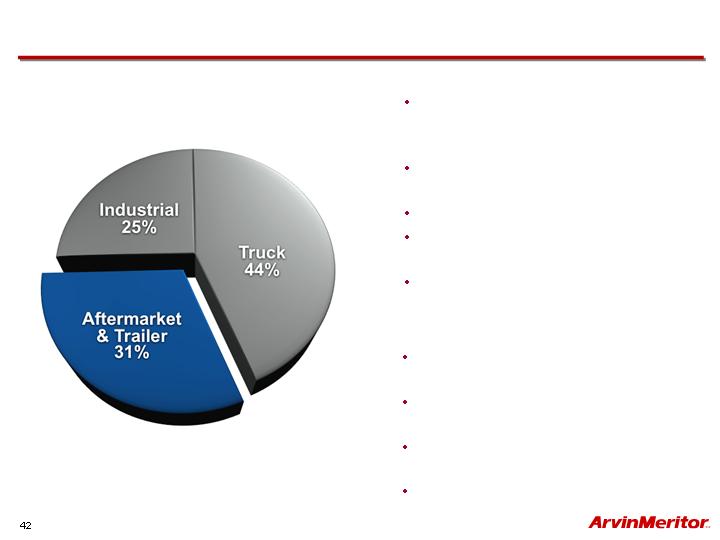
Regional and Segment Mix – Core Business
2009 Sales: $3.1 billion
Commercial Truck, Industrial, Aftermarket & Trailer
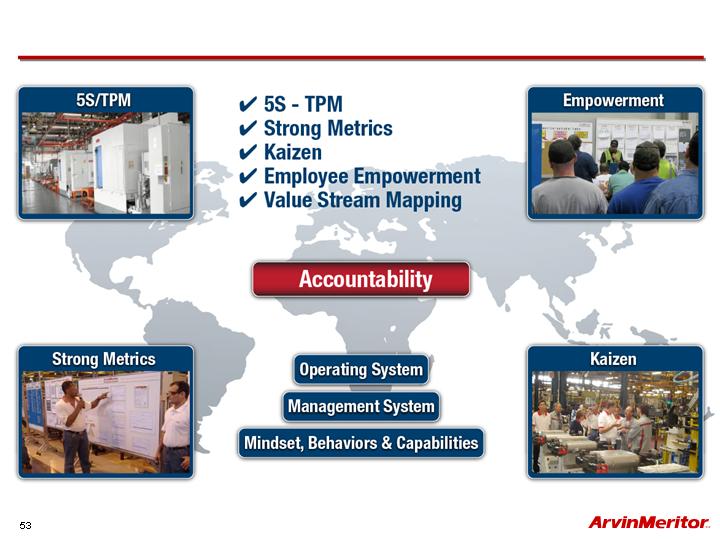
Direct Material
Optimization
Manufacturing
Overhead
C
O
S
T
SIX MAIN AREAS DEFINED IN 2006
More than 450 initiatives in the pipeline; more than 1,300
complete
Forty full-time employees
Active business process in NA, EU, SA, India and China
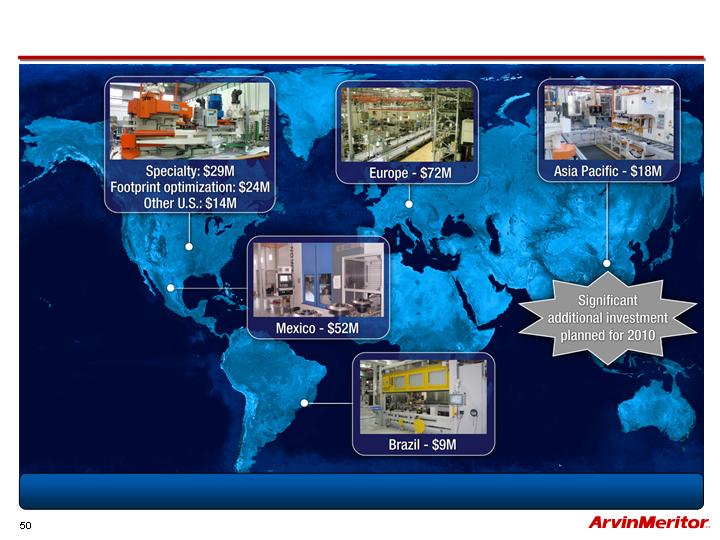
Reduced supply base by 15%
Invested $100 million in rationalization, flexibility and capacity
Exceeded targeted annual labor and burden savings of 3% (net
of economics)
One plant opened, six plants closed and consolidated
APS launched in 100% of our plants globally
Investment initiated in additional capacity in lucrative, emerging
markets in Brazil and China
Substantially exceeded risk-adjusted target of ~$45 million
Including 8% indirect material savings
Additional G&A savings include: temp labor, travel &
entertainment, shared services and outsourcing

Product Strategy
Engineering R&D
Aftermarket
R
E
V
E
N
U
E
SIX MAIN AREAS DEFINED IN 2006
Increased engineering staff by 10%+
Invested $3 million in testing and validation
Forty-seven major program launches since 2007
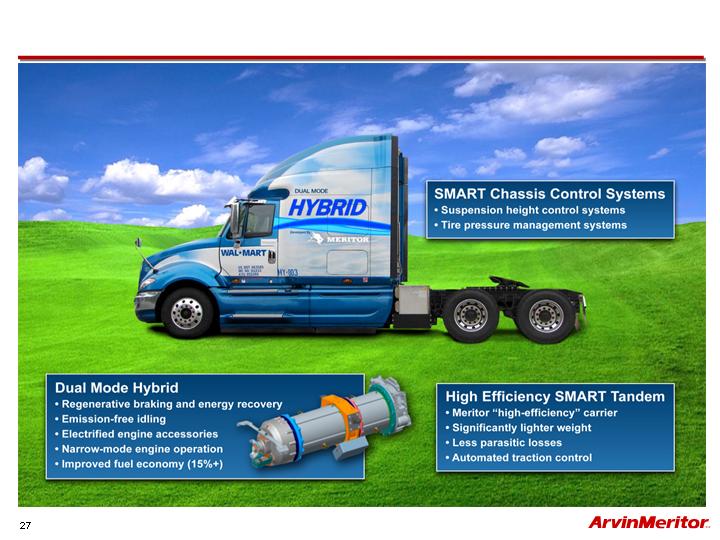
Presented dual-mode hybrid technology
Grew electronics and controls capabilities
Defined key growth segments such as off-highway,
defense, drivetrain efficiency and brake technology
First products have hit the marketplace
Focused program to improve profitability of products
through pricing and complexity reduction
Increased revenue by approximately $120 million or 17%
Revenue growth of 70% in Remanufacturing
Launched new products including Platinum Shield
Combined trailer axle offering with remanufactured
products to EU fleets for lower cost of operation
Launched CVA product platform in BRIC countries

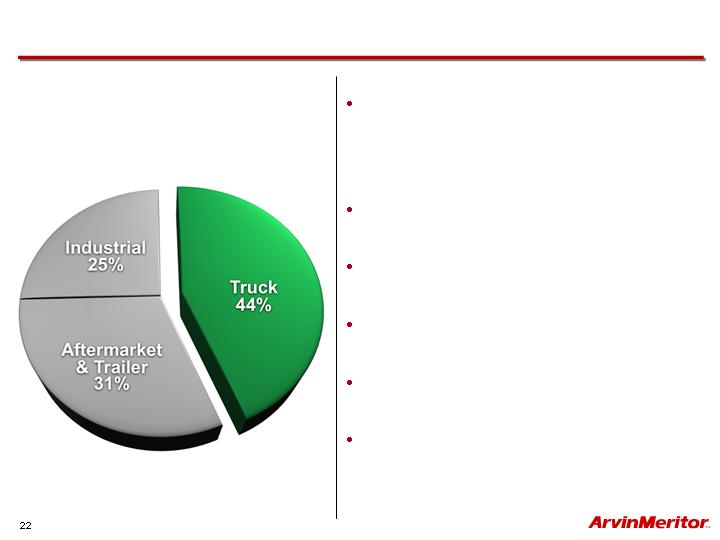
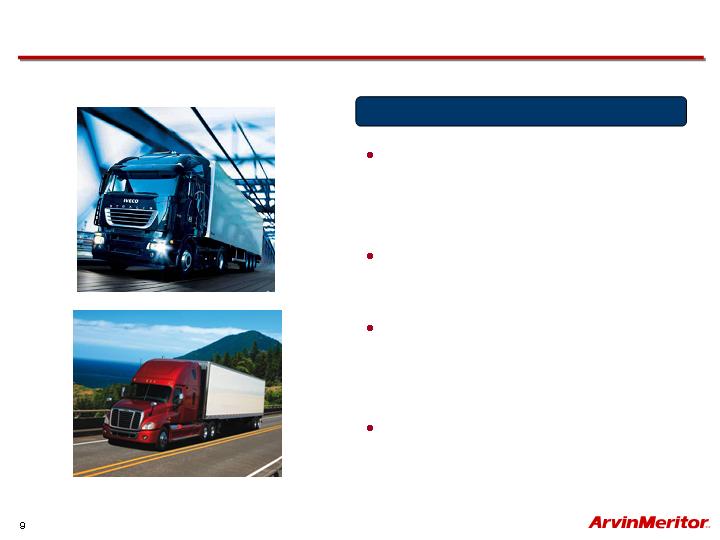
Commercial Truck
Based on FY09 Sales
Well-positioned to benefit from
rebound in global commercial
truck markets in North America
and Europe
Well-established position in
South America
Strong product portfolio and
customer relationships
Building on strong position to
diversify customer mix
Aggressive product launch
cadence in 2010/2011/2012
Designing products for vehicle
efficiency
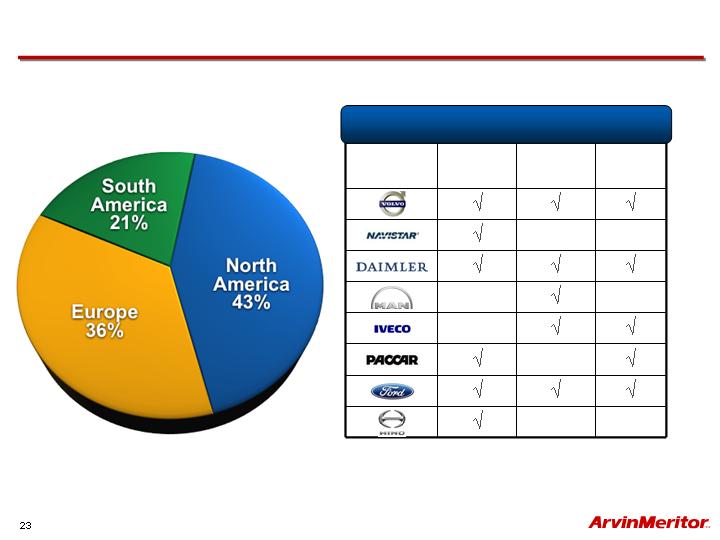
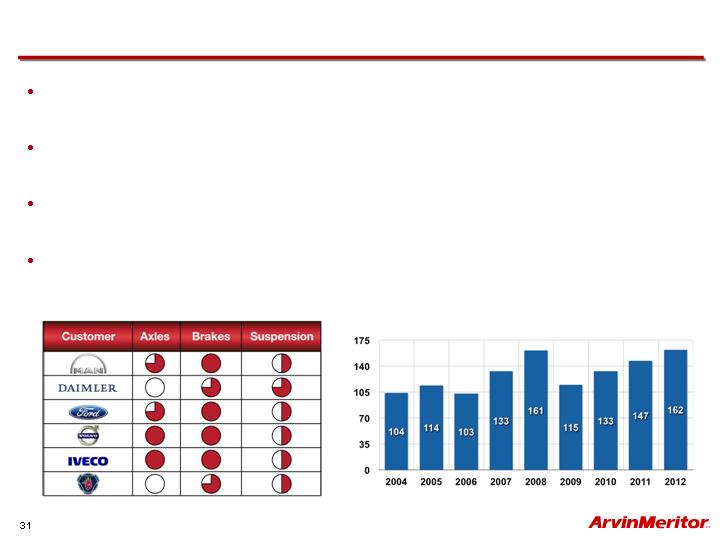
Truck Markets and Customers
Customer
North
America
South
America
Europe
v
v
v
v
v
v
v
v
v
v
v
v
v
v
v
v
Top Truck Customers 2009
Based on FY09 Sales
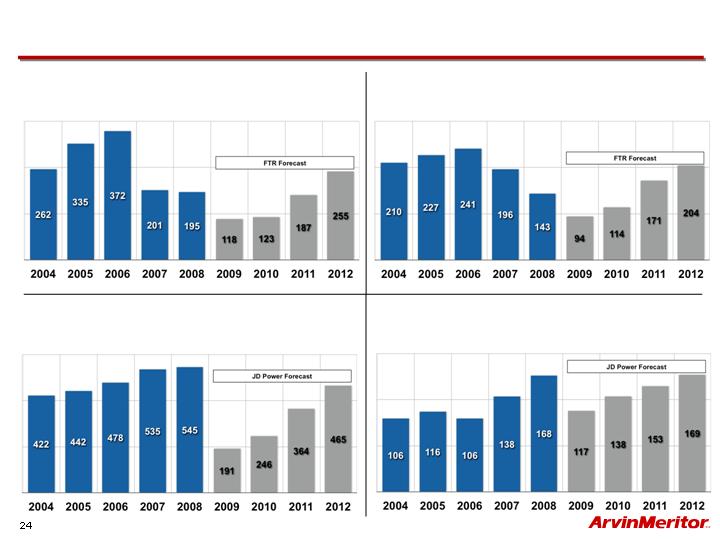
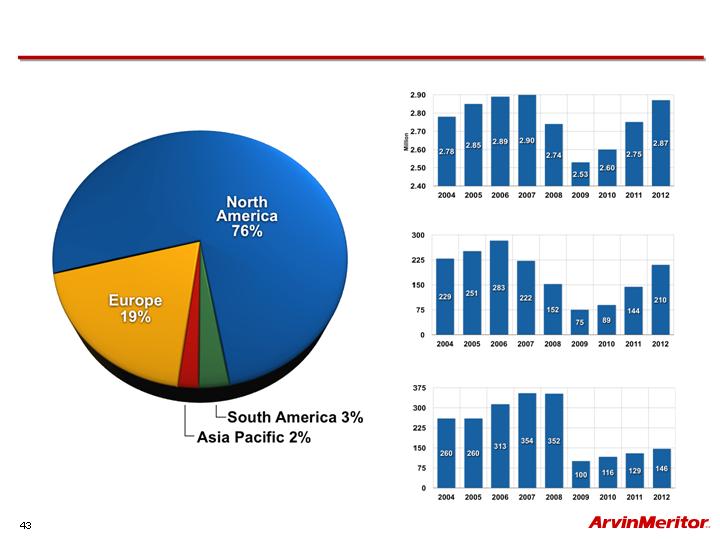
Global Truck Production Trends
North America
Class 8 Production (000)
Calendar Year
Western Europe
Med. & Heavy Truck Production GVW>6t (000)
Calendar Year
North America
Class 4-7 Production (000)
Calendar Year
South America
Med. & Heavy Truck Production GVW>6t (000)
Calendar Year

Growing Business in North America
PACCAR
Meritor front and rear
axles and brakes now
standard on the
KENMEX new T460 for
cement mixer and dump
truck applications
KENMEX is the Mexican
subsidiary of the
Kenworth Truck
Company, a PACCAR
company
Volvo
Meritor will continue to be the
standard drive axle supplier for
the Volvo and Mack truck
brands for the next three years
RPL Meritor drivelines will be
standard on Volvo
RN Meritor drivelines will be
standard on Mack
DTNA
Extends long-term
relationship with DTNA
Agreement through 2011
Continues supply of axles,
brakes and drivelines to
Freightliner and Western
Star at historical penetration
levels
Meritor WABCO awarded
standard position for new
SS1200 plus air dryer
beginning January 2010
Navistar
Signed 7-year axle agreement
in March 2009
Meritor axles now standard
position on International
medium duty trucks and IC Bus
brand school and commercial
buses
Gained additional standard axle
position on International’s
heavy-duty trucks
Gained data book positions for
Meritor WABCO
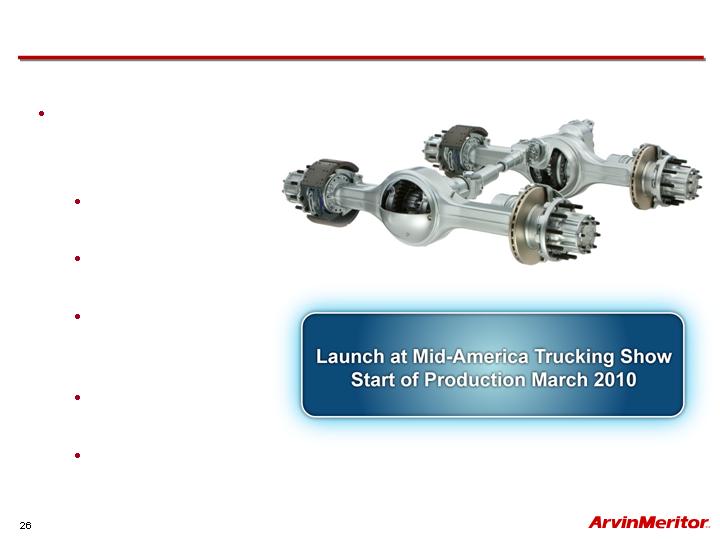
Next Generation Technology
New design
addresses
customer needs
Improved vehicle
efficiency
Lowest weight in
industry
Optimized
driveline
angularity
Higher torque/HP
capability
Faster axle ratios
MT-14X Tandem Axle
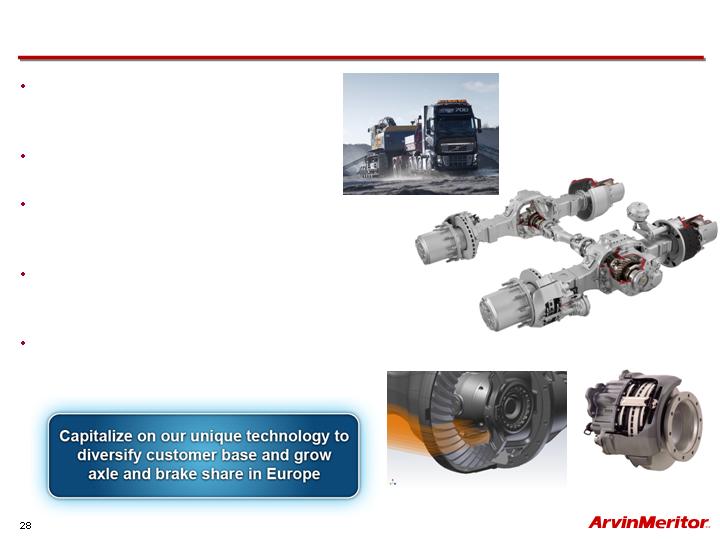
Developing technologies to improve
product cost, performance and vehicle
efficiency to support key customers
Successfully launched 17-X drive axle
for European applications
Plan to begin production of
MS-18X for 60 ton GCW Global
applications in 2Q11
Significant investment planned to
support foundation air disc brake
business
Increasing the scale of our well known,
on-highway hub reduction technology
with the 610 product platform
Growing Business in Western Europe
ELSA Disc Brake
17-X Technology
Hub Reduction Technology
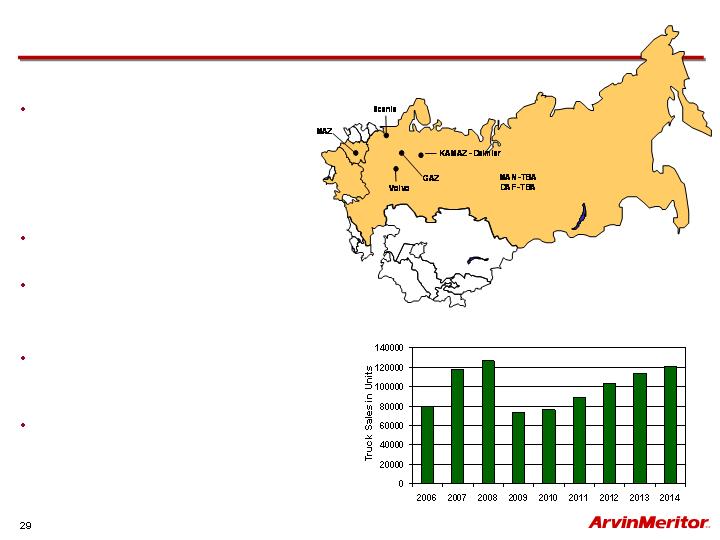
Growing Business in Russia
Background
ARM sales in the Commonwealth of
Independent States (CIS) have
increased to more than $10 million as
100,000 new and used EU and NA
trucks have been imported into the
region
Moscow office opened in 2008 to
support region with aftermarket needs
Further growth in CIS expected as
conditions improve
Next Steps
Signed MOU to study feasibility of a
joint venture for axles, brakes and
trailer components in the region
JV would serve the CIS
and provide low cost manufactured
components for other territories
Market Growth in CIS Significant
Source: Global Insight
Brazil Economy Improving
GDP expanded by 1.9% quarter-over-quarter in 2Q; estimates for
approximately 5% real GDP growth through 2015
Government plans to invest $160 billion from 2009-2013 on recovery and
production of recently discovered deep water oil reserves
Expected government stimulus for 2014 World Cup and 2016 Summer
Olympics
Growth Acceleration Program will invest more than $400 billion over next
five years in infrastructure
Brazil
Truck Production, GVW>6t
Calendar Year
Source: J.D. Power and Associates
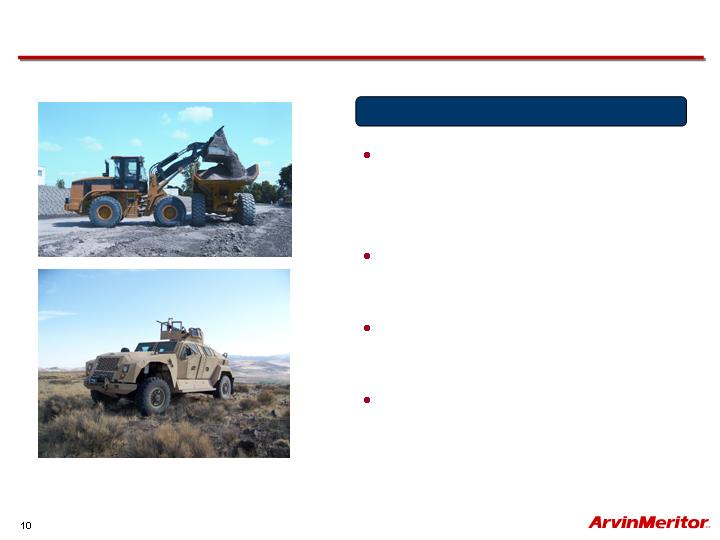
Industrial and Asia Pacific
Off-Highway
Leading independent off-highway axle
supplier in China
Re-entering global off-highway market
leveraging global scale and technology
Defense
Largest independent drivetrain producer
for tactical wheeled vehicles globally
Commercial Vehicle
Largest independent supplier of axles
in India and Australia
Leading supplier of drum brakes in
China
Specialty
Leader in Bus & Coach in U.S.
Leader in customized fire truck market
in the U.S.
Leader in Class 5 AWD market in the
U.S.
Expanding in premium bus & coach
market in India and China
Based on FY09 Sales
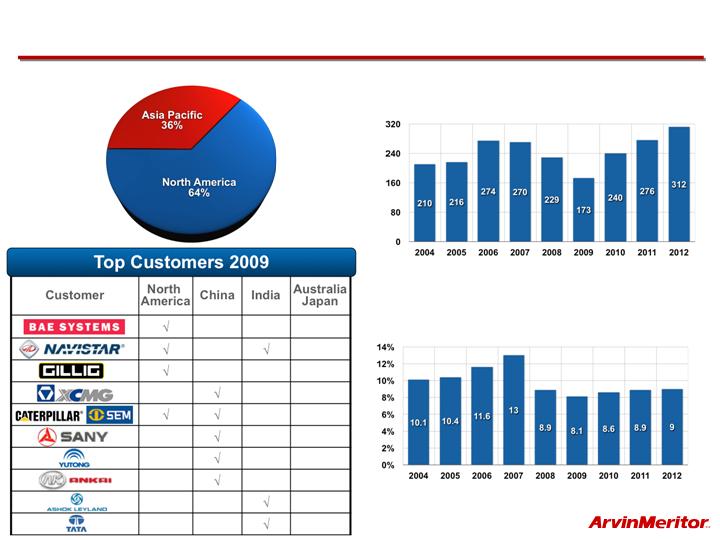
Industrial and Asia Pacific
China
GDP Growth
India
Truck Production GVW>6t
Source: J.D. Power and Associates
Source: J.D. Power and Associates
Based on FY09 Sales
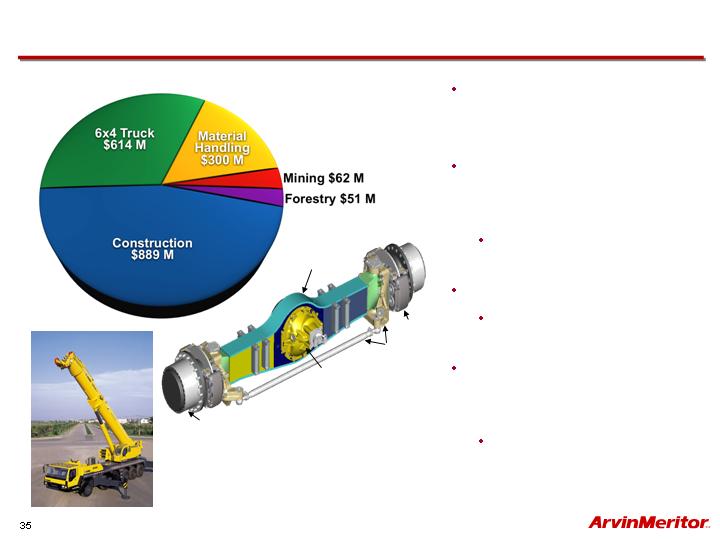
Global Off-Highway Market
Target Launch Market of $1.9B
Demand expected to grow
through 2014; AP major
growth market
Leveraging China installed
base and commercial
vehicle products
More than 50 new axle
models
Robust global product plans
New axle families from
35,000 lb-300,000 lb capacity
Significant investment
planned for Xuzhou Meritor
Axle Co. joint venture
Targeting 20% increase in
capacity
Housing
Brake
Steering
Wheel end
Carrier
AT Crane
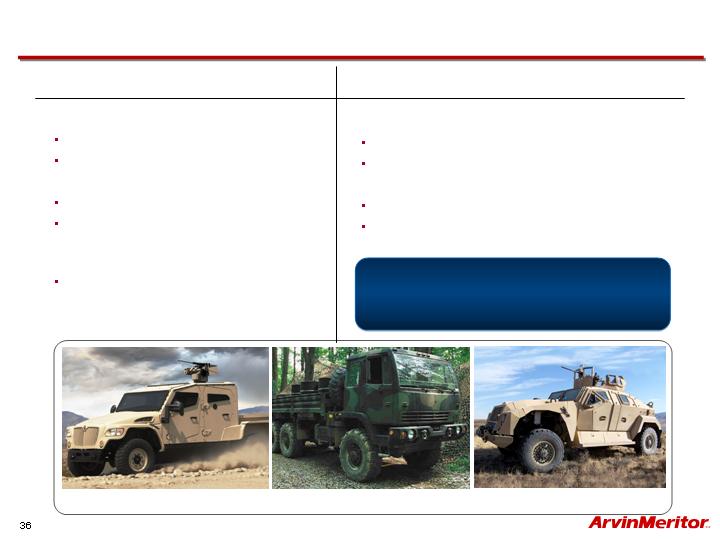
MXT
FMTV
JLTV
Defense Programs
Future Programs
Booked Business
FMTV
On-contract through 2010
Re-buy contract starts in 2011
MXT
Production contract with British MoD
Meritor TACTX™ High Mobility
Independent Suspension
Heavy Tactical Trucks
Freightliner on contract through 2010
Aftermarket Service for All Models
Joint Light Tactical Vehicle (JLTV)
HMMWV replacement, production SOP 2013
ArvinMeritor partnered with 2/3 current OEM’s
Marine Personnel Carrier (MPC)
Next Generation LAV
ArvinMeritor on team to build a demonstrator,
production 2014
DEFENSE STRATEGY
Secure North America position
Expand in selective markets
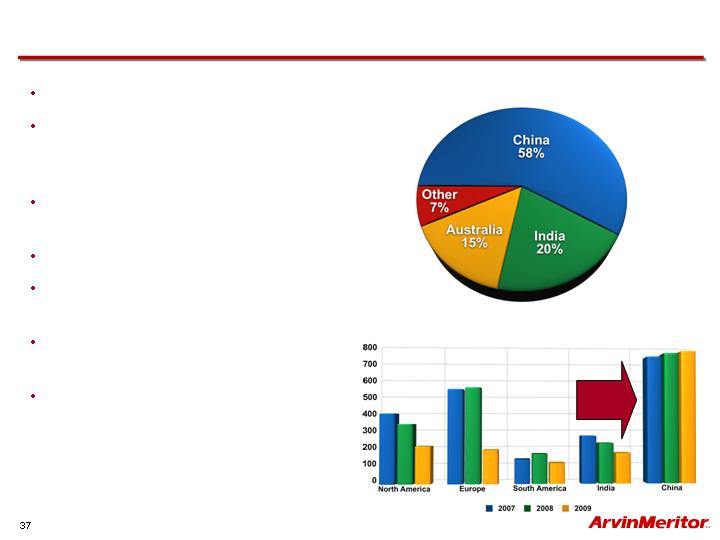
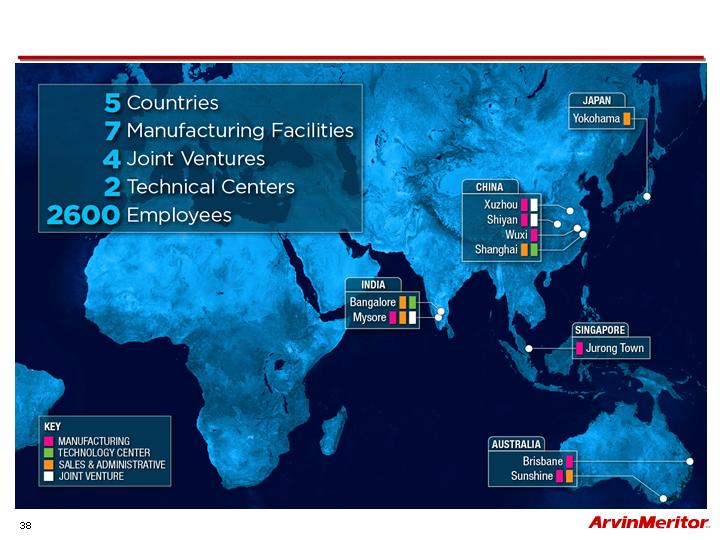
Asia Pacific Strategy
Market presence for nearly 30 years
Strong in-region management with
localized manufacturing and
sourcing
Regional product development
leveraging global capabilities
Strong relationships
Focused on China, India and
ASEAN region
Exploring organic and inorganic
growth opportunities
Increasing engineering capabilities
Regional Market Comparison for Truck Production
FOCUS
Based on FY09 Sales
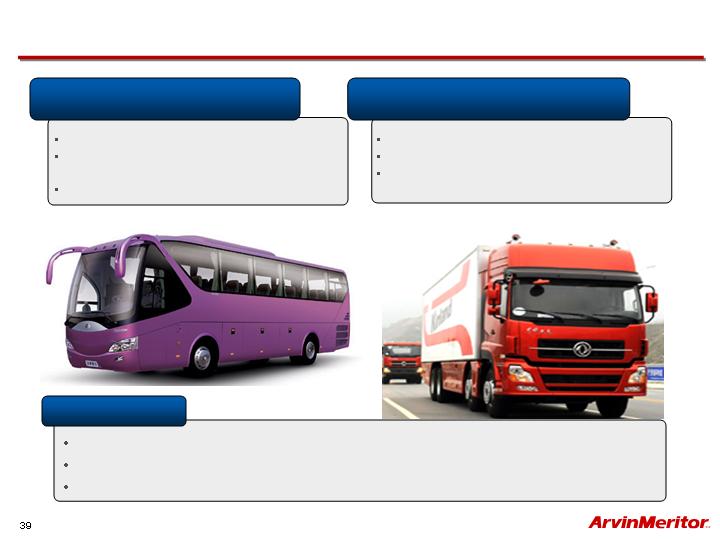
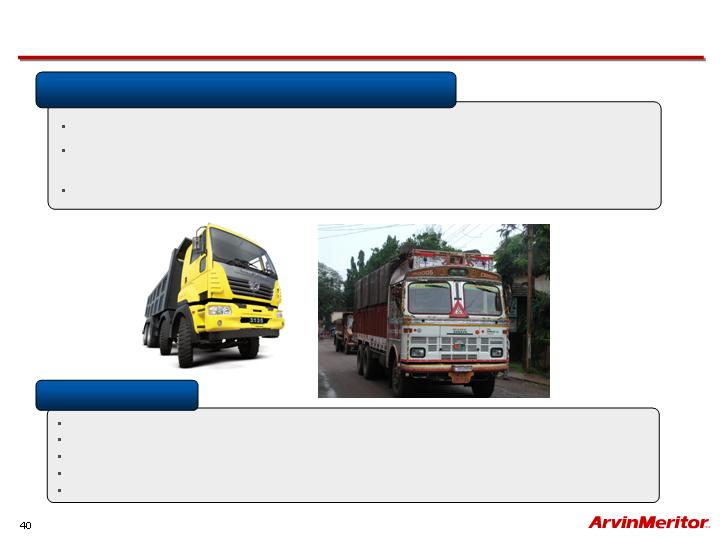
China Commercial Vehicle and Specialty
ArvinMeritor Vehicle Systems
Co., Ltd.
Location: Wuxi, Jiangsu Province, China
Products: Air disc brake, carrier assembly,
axles, trailer beam and axle
Markets: Bus & Coach
Meritor Huayang Vehicle Braking
Co., Ltd.
Expand axle offering for high and mid-range OE Market (truck and bus)
Increase brake capabilities
Increase local engineering and customer service capability
Growth Strategy
Location: Shiyan, Hubei Province, China
Products: Drum brakes
Markets: Commercial vehicles, Bus
& Coach and Off-Highway
India Growth Strategy
Meritor HVS (India) Ltd. and Automotive Axles Ltd.
Location: Mysore
Main Products: Drive axles, front steer axles, tag axles and brakes; significant engineering
and validation capabilities exist
Established: Partnerships with Kalyani Group established in 1998 and 1981
Sales growth in foundation and air disc brakes
Expand product portfolio to meet increasing needs in the commercial vehicle market
Strategically enter growing Indian off-highway market
Opportunities in military market
Advanced product design and development capabilities in Bangalore technical center
Growth Strategy

Aftermarket & Trailer Segment
Global Aftermarket Business
Well-known brand portfolio and
product life-cycle service and
support
World-class packaging and
distribution
Remanufacturing global enterprise
Extensive product portfolio and “all
makes” competitor product lines
Industry-wide leader in customer
service
Global Trailer Business
Full-line axle, wheel-end and
suspension supplier
Established footprint in North
America and Europe
Leading market position with joint
venture in South America
Distribution in Asia Pacific region
Based on FY09 Sales
Aftermarket & Trailer
North American Trailer Production
U.S. Truck Freight Ton Miles
Seasonally Adjusted
Source: FTR Associates
Source: FTR Associates
Source: 2004-08 CLEAR data; 2009-12 blended data
Europe Trailer Production
Based on FY09 Sales
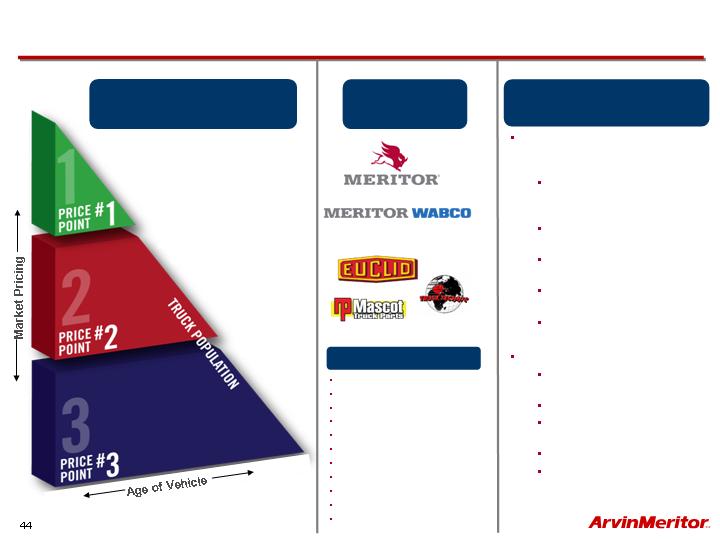
Aftermarket Success Formula
Genuine Product
Genuine Product –
Price/Reman
Price/Reman
Advanced warehousing
management and distribution
systems
Highly-automated
component packaging
capability
Same day shipment for
vehicle-down emergencies
Lean warehousing and Six
Sigma-driven processes
Highly-efficient order
processing capability
Low transaction cost
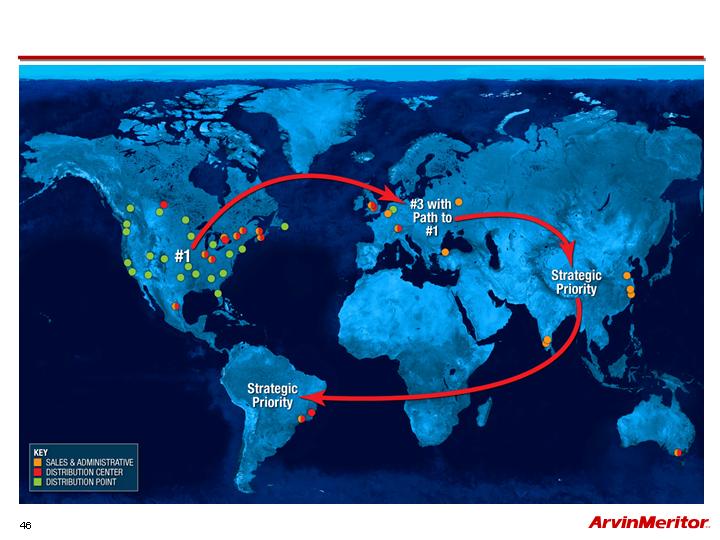
Global Reach
11 distribution centers
across 5 continents
7 remanufacturing centers
8 customer assistance call
centers
3,300 distributors
2,600 OE dealers
Servicing the Full
Lifecycle of the Vehicle
Distribution Expertise and
Extensive Global Network
Product
Brands
Products
Transmissions
Axles
Electronic products
Braking components
Drivelines
Trailer axles/components
Steering gears
Air systems/components
Clutches
Hydraulic braking systems
Remanufactured portfolio
Aftermarket Growth Initiatives - Europe
2003
2009
52%
48%
65%
35%
All-makes extensions
Reman offerings
Brand differentiation
Growth driven by:
Infrastructure investments
Price point products for broad
European market
“Meritor Service Point”
OEM service parts
Independent distributor channel
Based on Sales
North
America
Europe
South
America
Asia Pacific
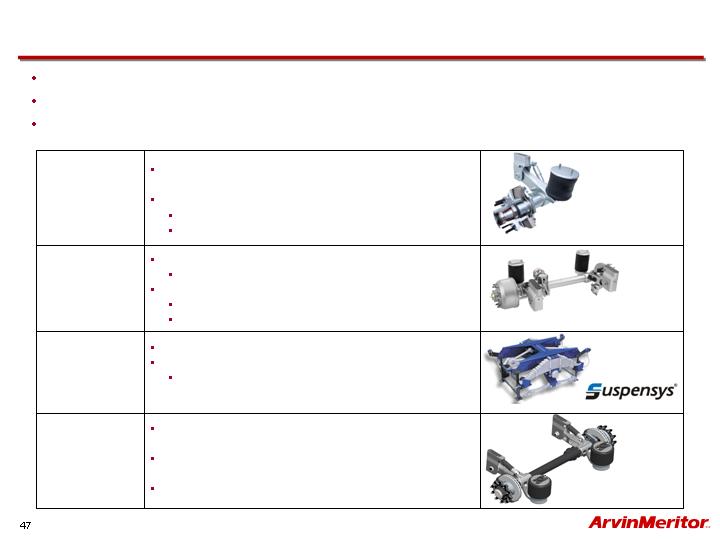
Trailer Growth Initiatives
Significantly reduced breakeven levels at current industry volumes
Well-positioned with new product launches
Prepared to capitalize on market recovery
MTA Air
Suspension
Euroflex
Maintain #1 position in trailer axles and braking
systems
Expand product offerings
Launch new MTA air suspension in 2010
Introduce new advanced technologies (MTIS)
Enhance product lines
Launched Euroflex new air suspension in 2009
Drive growth by leveraging:
Sales and service support
Aftermarket distribution network
Grow with strong joint venture partner
Expand product offerings
Launch next generation air suspension in
2010
Continue to build strong alignment with key
customers
Increase market share in Australia and New
Zealand and expand in other Asian countries
Expand mfg. and dist. footprint in region
CS Suspension
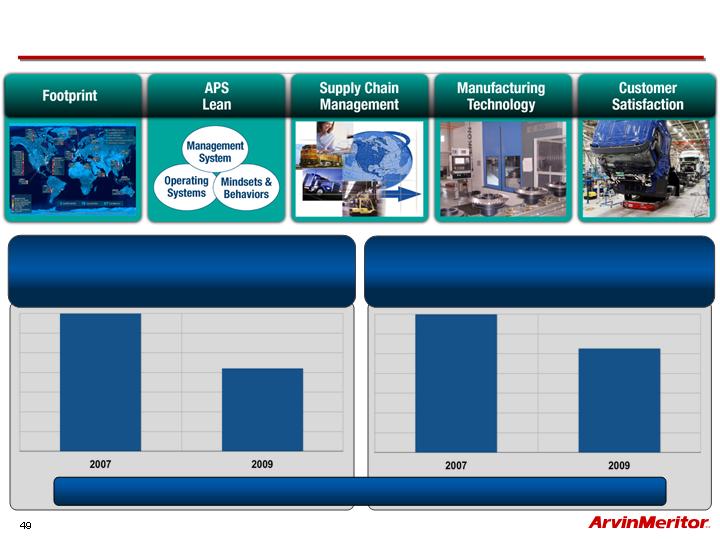
Manufacturing Operations Turnaround
Five focus areas driven by a foundation of talented employees
Labor and Burden
40% reduction in manufacturing
conversion cost
Inventory
25% reduction in inventory
through performance
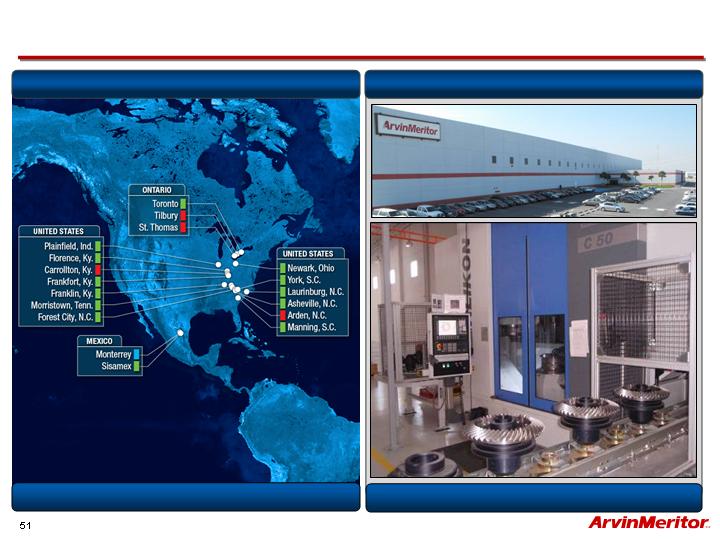
Preparing North America for the Upturn
Mexico
Increased flexibility and capability
Consolidated footprint
North American Footprint
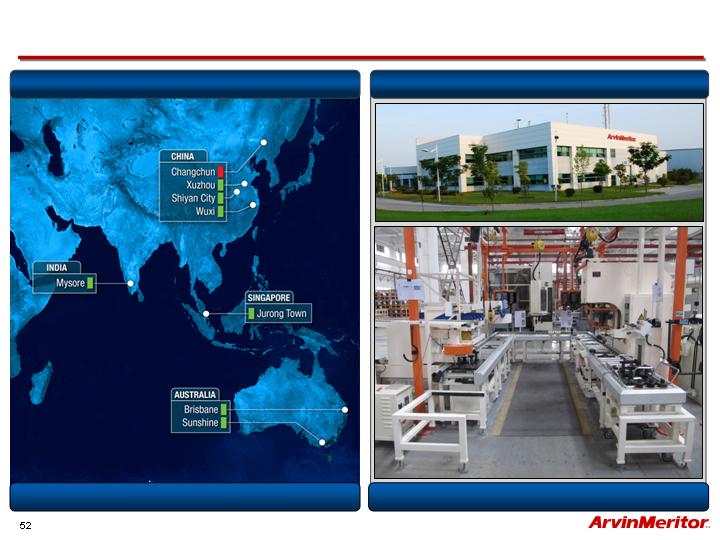
Industrializing Footprint for Growth in Asia
China
Localizing capability
Positioning footprint for growth
Asia Pacific Footprint

Segment EBITDA Before Special Items(1)
Quarter Ended
September 30,
Year Ended
September 30,
2009
2008
2009
2008
Sales
Commercial Truck
$ 325
$ 690
$ 1,566
$ 2,922
Industrial
220
290
888
1,117
Aftermarket & Trailer
219
307
954
1,183
Light Vehicle Systems
288
340
1,033
1,571
Intersegment Sales
(68)
(96)
(333)
(403)
Total Sales
$ 984
$ 1,531
$ 4,108
$ 6,390
EBITDA
Commercial Truck
$ 1
$ 27
$ (38)
$ 116
Industrial
24
36
126
128
Aftermarket & Trailer
18
34
89
110
Light Vehicle Systems
-
5
(53)
15
Segment EBITDA
$ 43
$ 102
$ 124
$ 369
Unallocated Corporate Costs
(3)
(15)
(8)
(39)
Total EBITDA
$ 40
$ 87
$ 116
$ 330
Total EBITDA Margin
4.1%
5.7%
2.8%
5.2%
(in millions)
(1) Continuing operations before special items. See appendix – “Non-GAAP Financial Information.”

Free Cash Flow (1)
Quarter Ended
September 30,
Year Ended
September 30,
2009
2008
2009
2008
Pretax Income from Continuing Operations
$ (2)
$ 23
$ (361)
$ 93
Impairments
-
-
223
-
Net Spending (D&A less Capital Expenditures)
4
(17)
(30)
(18)
Pension and Retiree Medical Net of Expense
(5)
6
(26)
22
Performance Working Capital (2)
41
234
210
(154)
Off Balance Sheet Securitization and Factoring
(15)
(83)
(275)
120
Other, including Restructuring
(13)
(84)
(131)
(21)
Free Cash Flow from Continuing Ops.
$ 10
79
$ (390)
$ 42
Discontinued Operations
12
24
(39)
(51)
Free Cash Flow
$ 22
$ 103
$ (429)
$ (9)
Memo: Cash Flow Provided by Continuing
Operations
$ 27
$ 127
$ (279)
$ 180
(in millions)
(1) See appendix – “Non-GAAP Financial Information.”
(2) Change in payables less changes in receivables, inventory and customer tooling.
Fourth Quarter 2009 Results Comparisons(1)
FY09 Q3
Actual(2)
FY09 Q4
Actual
Sales
$942 million
$984 million
EBITDA BSI
$28 million
$40 million
EPS BSI
$(0.29)
$(0.28)
FCF before Factoring
and Restructuring
$158 million
$48 million
FCF
$73 million
$22 million
(1)
See appendix – “Non-GAAP Financial Information.”
(2)
Recast for LVS divestitures, including removal of Wheels, as reported in Q4 2009.
EBITDA Margin Before Special Items (1)
EBITDA(1) Margin
Q309 – As previously reported
3.3%
Wheels and Chassis divestitures
(0.3)
Q309 – Excluding Wheels and Chassis
3.0%
Europe medium & heavy truck production volume
(1.0)
North America production volume
0.3
South America production volume
0.3
Performance Plus and other cost savings
1.6
Other
(0.2)
Core Business subtotal
4.0%
LVS
0.1
Q409
4.1%
(1) ArvinMeritor uses EBITDA as the primary basis for the chief operating decision maker to evaluate the performance of each of the
company’s reportable segments. See appendix for consolidation and comparison to GAAP measures. EBITDA margin equals
EBITDA divided by sales.
Margins vs. Prior Quarter
Structural Cost Reductions(1)
Core Business
FY09 Savings(1)
Q4
FY
Run
Rate
Structural Cost
Reductions
$34
$97
$136
Temporary Cost
Reductions
$13
$48
$52
Variable Labor
(Volume related)
$18
$50
$72
Total
$65
$195
$260
(1) Cost reductions represent expected savings based on current information and management’s best estimates.
Pay reductions restored
in November
($12 million annual run rate)
FY10 and beyond
(in millions)

Pension & OPEB Update
FY07
FY08
FY09
FY10E(1)
Pension
Unfunded Status
$181
$115
$517
N/A
Expense(2)
$69
$46
$22
$38
Contributions
$152
$34
$25
$51
Discount Rate
U.S.
6.35%
7.10%
5.70%
N/A
Asset Returns
U.S.
OPEB
Contributions(3)
$50
$48
$75
$46
(1)
Based on management’s current planning assumptions and other factors. Actual results may differ materially from projections as a
result of risks and uncertainties. Please see slide “Forward Looking Statements.”
(2)
Based on continuing operations excluding restructuring expenses.
(3)
Includes $28 million one-time settlement of USW retiree medical in Q1 2009.
(in millions)
Long-term return assumption currently at 8.5%
2010 Planning Assumptions(1)
(in millions)
Capital Expenditures
$90 - $110
Interest Expense
$95 - $110
Income Tax Expense - BSI
$40 - $60
Cash Income Taxes
$25 - $50
(1) Based on management’s current planning assumptions and other factors. Actual results may differ materially from
projections as a result of risks and uncertainties. Please see slide “Forward Looking Statements.”
Fiscal Year Basis
Update on First Quarter Outlook(1)
FY 2009 Q4
Actual(2)
FY 2010 Q1
Outlook(1)
Sales
$984 million
Higher
EBITDA BSI
$40 million
Higher
Income before
Taxes BSI
$2 million
Higher
FCF before
Factoring and
Restructuring
$48 million
Slightly Negative
FCF
$22 million
Around Breakeven
(1)
Based on management’s current planning assumptions and other factors. Actual results may differ materially from projections as a
result of risks and uncertainties. Please see slide “Forward Looking Statements.”
(2)
See appendix – “Non-GAAP Financial Information” for a reconciliation to GAAP.
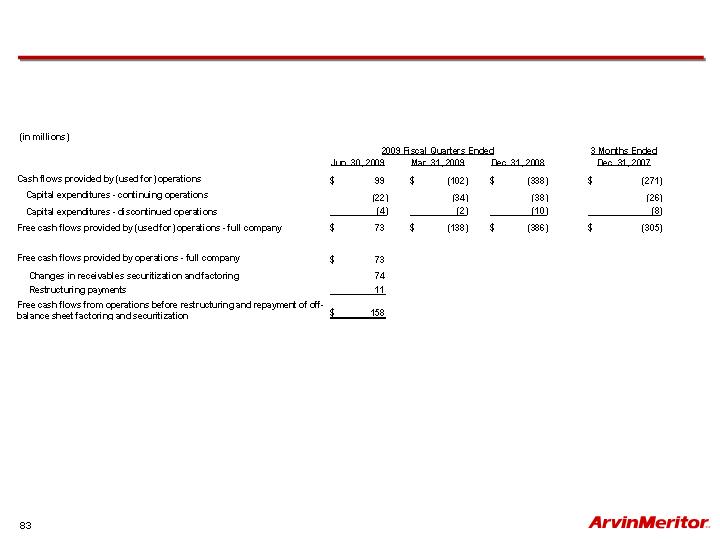
Q1 FY 2010 Free Cash Flow is expected to be
significantly better than previous years
We expect to achieve positive Free Cash Flow for
three consecutive quarters
Stable Cash Flow Results(1)(2)
(1)
Based on management’s current planning assumptions and other factors. Actual results may differ materially from projections as a
result of risks and uncertainties. Please see slide “Forward Looking Statements.”
(2)
See appendix – “Non-GAAP Financial Information.”
(3) GAAP cash flow provided by (used for) continuing operations was $ (338) million for fiscal year 2009 first quarter, $(271) million for
fiscal year 2008 first quarter, $27 million for fiscal year 2009 fourth quarter, $99 million for fiscal year 2009 third quarter and $(102)
million for fiscal year 2009 second quarter.
(in millions)
FY 2010 Q1
Outlook(1)
FY 2009 Q1
Actual
FY 2008 Q1
Actual
Free Cash Flow
Around
Breakeven
$(386) million
$(305) million
(in millions)
FY 2010 Q1
Outlook(1)
FY 2009 Q4
Actual
FY 2009 Q3
Actual
FY 2009 Q2
Actual
FY 2009 Q1
Actual
Free Cash Flow
Around
Breakeven
$22
$73
$(138)
$(386)
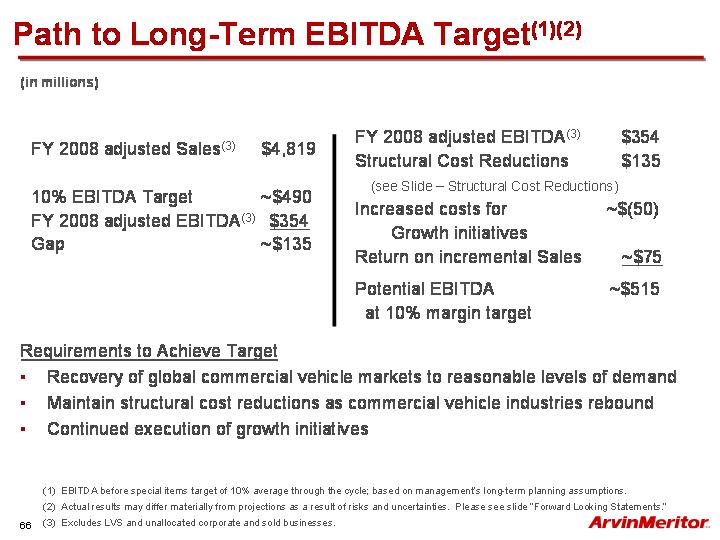
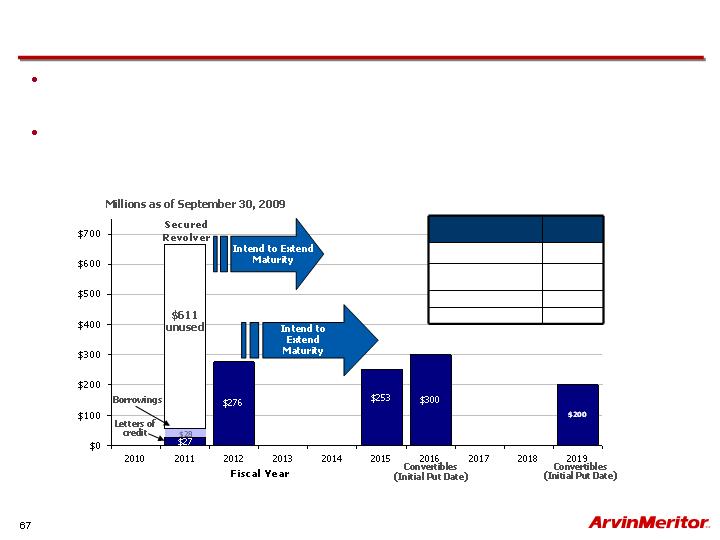
FY10 plan to extend maturities of our revolver and bulk of 2012
notes
Long-term objective of achieving credit statistics near
investment grade
Long-Term Capital Structure(1)
(1)
Based on management’s current planning assumptions and other factors. Actual results may differ materially from projections as a
result of risks and uncertainties. Please see slide “Forward Looking Statements.”
(2)
S&P key industrial financial ratios – Three-year (2005-2007) average medians for BB rated companies.
(Three-year average)
S&P BB
Ratios(2)
EBITDA Interest Coverage
4.8X
Free Operating Cash Flow /
Total Debt
7.1%
Total Debt / EBITDA
3.1X
Total Debt / Capitalization
52.5%

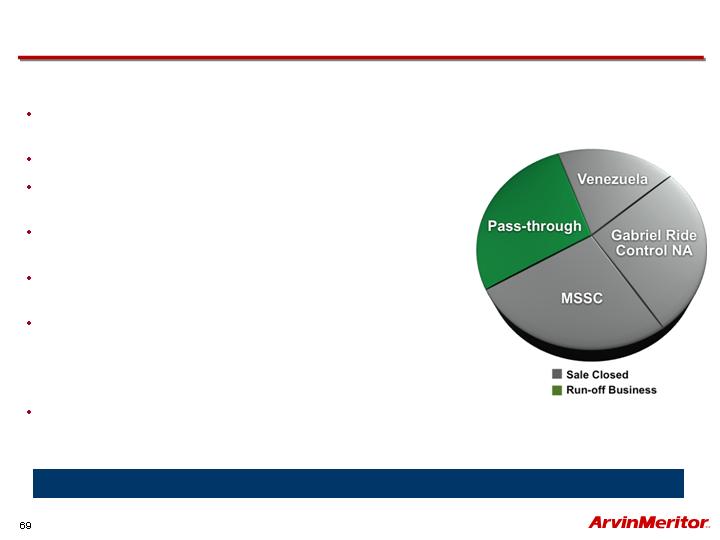
Chassis
Transactions solidified ArvinMeritor’s liquidity
position
Sold stake in Gabriel de Venezuela (June 2009)
Sold Gabriel Ride Control North America U.S.
(July 2009), Mexico (August 2009)
Sold stake in joint venture with Mitsubishi Steel
(MSSC) (October 2009)
Sales from remaining Chassis businesses were
$106 million in FY09
Remaining Chassis businesses have operated
near breakeven; most will run off over the next
two years as vehicle programs end
Chassis Operations
2008 Sales
Wheels
Sold and closed in September 2009;
$166 million net proceeds
Wheels complete; Chassis divestiture essentially complete
LVS Divestiture – Significant Progress to Date
LVS Financial Update
3Q 2009
4Q 2009
Sales
$259
$288
EBITDA – BSI(1)
$(6)
$0
Free Cash Flow
(Before Factoring)
Slightly
Positive
About
Breakeven
Capital
Expenditures(2)
$25 - $30 million in FY 2010
(included in total company FY 2010
assumption of $90 - $110 million)
(1) See appendix – “Non-GAAP Financial Information.”
(2)
Based on management’s current planning assumptions and other factors. Actual results may differ materially from
projections as a result of risks and uncertainties. Please see slide “Forward Looking Statements.”
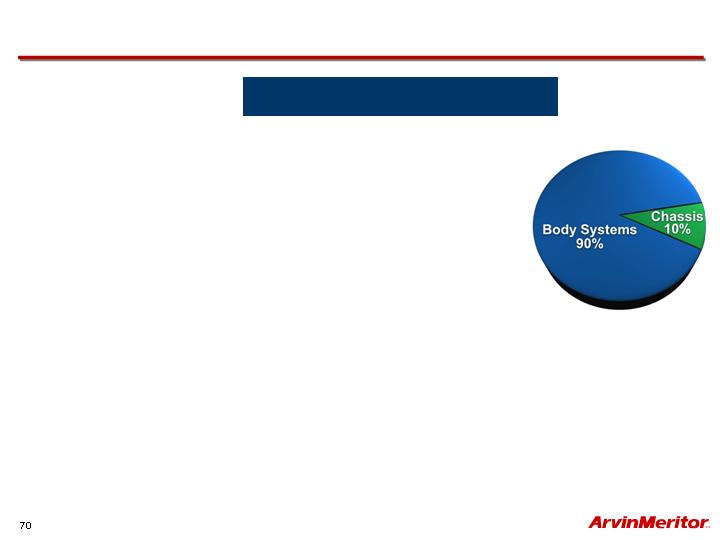
Based on FY09 Sales

LVS Divestiture – Body Systems
Committed to divest Body Systems and will work to
achieve the best outcome for our shareholders,
customers and employees as we move through 2010
Body Systems is believed to have stabilized at continuing
depressed market volumes
EBITDA near breakeven levels in Q3 and Q4 2009
Improved “cost to carry” should provide time to divest the
business in the most economically advantageous way
possible
Preferred outcome is strategic buyer for the business
External progress updates will be provided


A company prepared to realize its full potential
Strong leadership team
Strong focus
Strong market positions
Strong global foundation
Strong profitable growth strategy


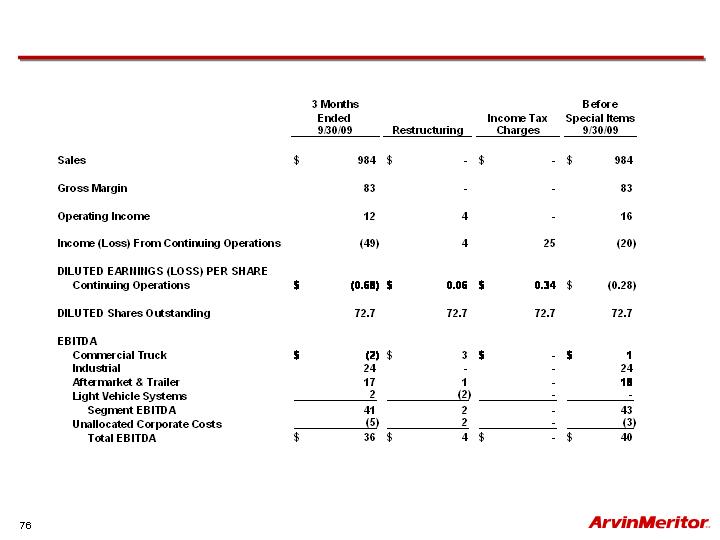
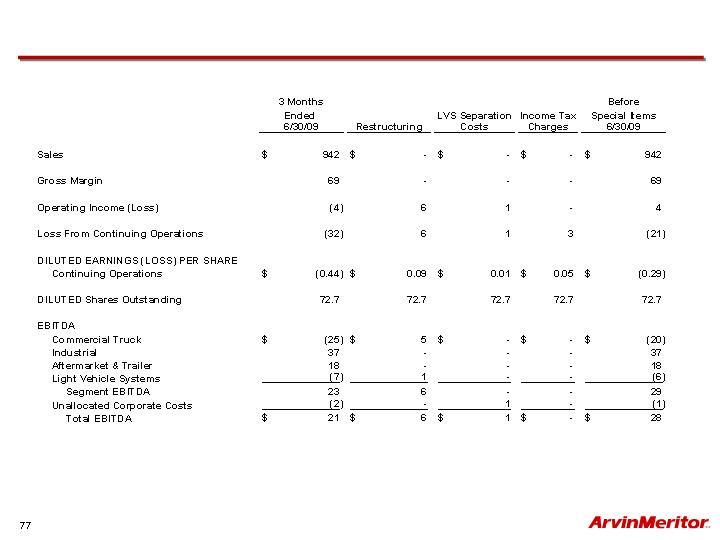
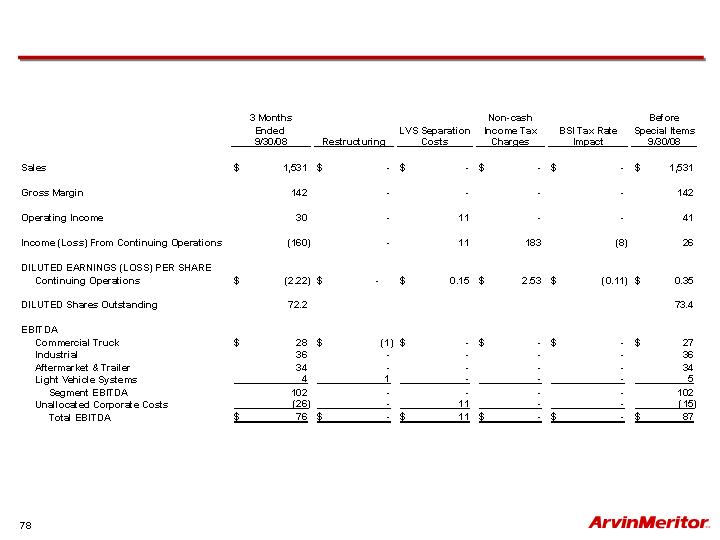
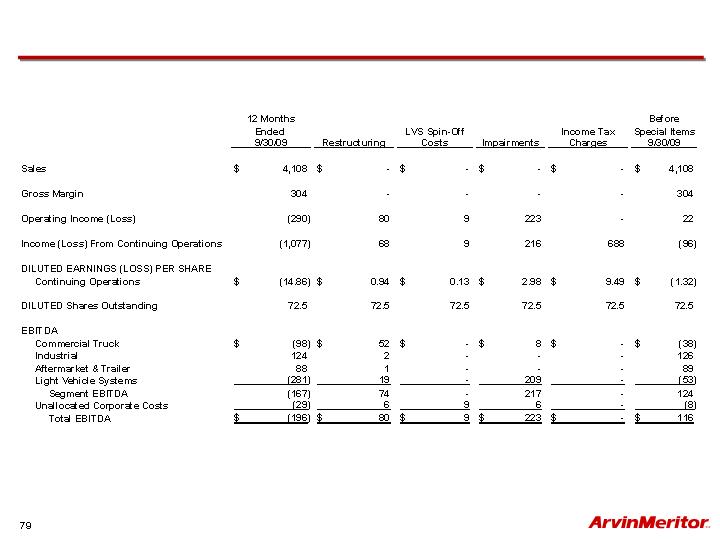
Use of Non-GAAP Financial Information
In addition to the results reported in accordance with accounting principles generally accepted in the United States (“GAAP”)
included throughout this presentation, the Company has provided information regarding income from continuing operations
and diluted earnings per share before special items, which are non-GAAP financial measures. These non-GAAP measures
are defined as reported income or loss from continuing operations and reported diluted earnings or loss per share from
continuing operations plus or minus special items. Other non-GAAP financial measures include “EBITDA” and “free cash
flow”. EBITDA before special items is defined as earnings before interest, taxes, depreciation and amortization, and losses
on sales of receivables, plus or minus special items. Free cash flow represents net cash provided by operating activities less
capital expenditures.
Management believes that the non-GAAP financial measures used in this presentation are useful to both management and
investors in their analysis of the Company’s financial position and results of operations. In particular, management believes
that free cash flow is useful in analyzing the Company’s ability to service and repay its debt. EBITDA is a meaningful
measure of performance commonly used by management, the investment community and banking institutions to analyze
operating performance and entity valuation. Further, management uses these non-GAAP measures for planning and
forecasting in future periods. The company uses EBITDA as the primary basis for the chief operating decision maker to
evaluate the performance of each of the company’s reportable segments.
These non-GAAP measures should not be considered a substitute for the reported results prepared in accordance with
GAAP. Free cash flow should not be considered substitutes for cash provided by operating activities or other balance sheet
or cash flow statement data prepared in accordance with GAAP or as a measure of financial position or liquidity. In addition,
the calculation of free cash flow does not reflect cash used to service debt and thus, does not reflect funds available for
investment or other discretionary uses. EBITDA should not be considered an alternative to operating income as an indicator
of operating performance or to cash flows as a measure of liquidity. These non-GAAP financial measures, as determined and
presented by the Company, may not be comparable to related or similarly titled measures reported by other companies.
Set forth on the following slides are reconciliations of these non-GAAP financial measures, if applicable, to the most directly
comparable financial measures calculated and presented in accordance with GAAP.
In addition, financial data may be provided on a “trailing twelve month basis,” which equates to the sum of the measure in
question for the four most recent quarters.