Maxcom Telecommunications (MXMTY) Inactive
Filed: 24 Oct 14, 12:00am
Exhibit 99.1

 | Third Quarter 2014 Results |  |
MAXCOM REPORTS RESULTS FOR THE THIRD QUARTER OF 2014
Mexico City, October 23th, 2014. –Maxcom Telecomunicaciones, S.A.B. de C.V. (“Maxcom”, or “the Company”) (NYSE: MXT) (BMV: MAXCOM CPO), one of the leading integrated telecommunications companies in Mexico, announced today its unaudited financial and operating results for the quarter ended September 30th, 2014.
NOTE: The monetary amounts in this report have been presented in accordance to International Financial Reporting Standards (IFRS). Amounts are expressed in millions of current Mexican Pesos.
Business Management: Operative Highlights
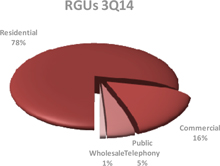
| o | Total company Revenue Generating Units or RGUs, decreased by 3% to 628,545 in 3Q14 compared to the same period of the last year. The Company registered RGU net connections of minus 17,576 during the year. The difference mainly due by disconnection of approximately 34 thousand RGUs with low ARPU during the 4Q13. |
| o | As a result of the disconnections mentioned, total company customer base decreased by 10% to reach 256,691 customers. |
| o | When compared to the same period of last year, voice RGUs decreased 8% reaching 346,186. Voice RGUs include residential voice, commercial voice, public telephone lines and wholesale lines. |
| o | Data residential RGUs increased by 12% to reach 167,195 compared to 149,377 in 3Q13. |
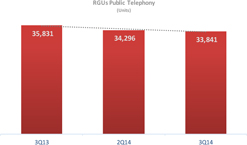
| o | The number of coin operated public phones totaled 33,841, presenting a decrease of 6% in comparison to those in 3Q13. |
| o | The total mobile RGUs base reached 42,555 units which is 4% less than the number registered in 3Q13. |
| o | Pay TV number of RGUs reached 69,703 which represent a decrease of 6% with respect to the figure recorded in 3Q13. |
| o | The residential RGU per customer rate, had a marginally increase at 1.9 with respect at the same ratio of 3Q13. |
| o | The commercial RGU per customer rate went from 26.5 in the 3Q13 to 35.0 at the end of the 3Q14. |
| 3Q14 | Concept | 3Q13 | ||||||
| 253,904 | Residential Customers | 282,087 | ||||||
| 199,223 | Voice | 237,511 | ||||||
| 165,596 | Data | 147,553 | ||||||
| 29,318 | Mobile | 29,830 | ||||||
| 69,527 | TV | 66,659 | ||||||
| 487,402 | Residential RGUs | 514,569 | ||||||
| 208,015 | Voice | 247,115 | ||||||
| 167,195 | Data | 149,377 | ||||||
| 42,489 | Mobile | 44,030 | ||||||
| 69,703 | TV | 74,047 | ||||||
| 1.9 | RGU per Residential Customer | 1.8 | ||||||
| 2,787 | Commercial Customers | 3,000 | ||||||
| 2,484 | Voice | 2,698 | ||||||
| 1,318 | Data | 1,382 | ||||||
| 11 | Mobile | 14 | ||||||
| 180 | Other | 180 | ||||||
| 98,314 | Commercial RGUs | 79,636 | ||||||
| 95,342 | Voice | 76,532 | ||||||
| 2,628 | Data | 2,756 | ||||||
| 66 | Mobile | 72 | ||||||
| 278 | Other | 276 | ||||||
| 35.3 | RGU per Commercial Customer | 26.5 | ||||||
| 33,841 | Public Telephony RGUs | 35,831 | ||||||
| 8,988 | Wholesale RGUs | 16,085 | ||||||
| 628,545 | Total RGUs | 646,121 | ||||||
| 346,186 | Voice RGUs (voice lines in service) | 375,563 | ||||||
| 256,691 | Total Number of Customers | 285,087 | ||||||
 |  |
| 2 |
| Third Quarter 2014 Results | |
Business Management: Revenues and Expenses
| Revenues |
Reported revenues for the third quarter of 2014 amounted Ps.707 million, presenting an increase of 10% compared to the same quarter of last year. This increase is supported by the performance of the wholesale business unit.
| 3Q14 | 3Q13 | D% | ||||||||||
| Residential | Ps. | 223 | Ps. | 220 | 1 | % | ||||||
| Commercial | 164 | 174 | (6 | )% | ||||||||
| Public Telephony | 32 | 39 | (18 | )% | ||||||||
| Wholesale | 285 | 205 | 39 | % | ||||||||
| Other Revenue | 3 | 4 | (25 | )% | ||||||||
| Total | Ps. | 707 | Ps. | 642 | 10 | % | ||||||


Total Maxcom revenues for the nine months ended on September 30th reach the figure of Ps.2,030 million, which represent an increase of 9% with respect to revenues of Ps.1,860 million recorded cumulatively in the same period of 2013.
| 9M14 | Weight % | 9M13 | Weight % | D% | ||||||||||||||||
| Residential | Ps. | 670 | 33 | % | Ps. | 722 | 38 | % | (7 | )% | ||||||||||
| Commercial | 509 | 25 | % | 498 | 27 | % | 2 | % | ||||||||||||
| Public Telephony | 97 | 5 | % | 112 | 6 | % | (13 | )% | ||||||||||||
| Wholesale | 742 | 36 | % | 516 | 28 | % | 44 | % | ||||||||||||
| Other Revenue | 12 | 1 | % | 12 | 1 | % | - | |||||||||||||
| Total | Ps. | 2,030 | 100 | % | Ps. | 1,860 | 100 | % | 9 | % | ||||||||||
Residential
This segment represented 32% of total revenues during 3Q14, a lower participation than the obtained during 3Q13, of 34%. Compared to 3Q13, revenues in this business unit had an increase of 1% (Ps.3 million), the increase was mainly due to additional mobile revenue.
For the nine months ended on September 30th, 2014, revenues for the residential business totaled Ps.670 million, a decrease of 7% in comparison with the Ps.722 million registered in the same period of 2013.
The average revenue per unit (“ARPU”) for the residential business was Ps.153 in the 3Q14, 3% higher than ARPU of Ps.148 registered in 3Q13.
The rate of RGU per customer marginally increased to 1.9 during the 3Q14 with respect at the 3Q13.
Commercial
Revenues of the commercial segment represented 23% of total revenues during the 3Q14, compared to 27% recorded in the 3Q13. Revenues reached Ps.164 million, a decrease of 6% in comparison with Ps.174 million registered during 3Q13. The variances is explained by the sale and lease of capacity on the 3Q13, which not was possible to repeat on this quarter.

| 3 |
| Third Quarter 2014 Results | |
For the nine months ended on September 30th, 2014, revenues for the commercial business were Ps.509 million, representing an increase of 2% in comparison with the Ps.498 million registered in the same period of 2013.
Commercial business ARPU during 3Q14 was Ps.577, below than Ps.765 recorded in 3Q13.
The number of RGUs per commercial customer increased 32% to 35.0 RGUs per customer when compared to 26.5 reached in 3Q13.
Public Telephony
The public telephony income represented 5% of total revenues in 3Q14. Revenues reached Ps.32 million, a decrease of 18% (Ps.7 million) in comparison to Ps.39 million obtained in the same period in 2013. The decrease in revenues is attributed to a reduction in network usage, as well as a minor number of telephones in operation.
For the nine months of 2014, the revenues from public telephony were Ps.97 million, which compares with the Ps.112 million of the same period of 2013 represents a decrease of 13%.
Wholesale
In 3Q14, wholesale revenues increased by 39% (Ps.80 million) reaching Ps.285 million, compared to Ps.205 million registered during the same period in the previous year. The growth in this business unit was due to the increase in the international traffic carried through our network.
In cumulative way, for the nine months of 2014 income of wholesale business unit registered Ps.742 million, representing an increase of 44% in comparison with the income of Ps.516 million recognized in the same period of the previous year.
Other Revenues
Other revenue concept contributed marginally and reached Ps.3 million, almost the same figure of 3Q13. These revenues during the nine months of 2014 reached Ps.12 million, same amount recording at September 2013.
| Network Operation Cost |
Network Operation Costs in 3Q14 increased by 34% or Ps.94 million to reach Ps.374 million in comparison to Ps.280 million in 3Q13. This increase was mainly due to additional Ps.95 million incurred in interconnection costs and technical expenses, partially offset by Ps.1 million decrease in installation expenses.
For the period of 9 months ended on September 30th, 2014, the total network operation costs amounted Ps.1,071 million, compared to Ps.793 million in the same period of the last year; a variation of 35%. In both cases, quarterly and cumulative, the variation mainly derived from the important increase in the international traffic termination costs related to the wholesale business.
| SG&A |
SG&A expenses were Ps.181 million in 3Q14 a 3% or Ps.6 million increase in comparison to the Ps.175 million reported in the same period of 2013. In the nine months of 2014 expenses amounted to Ps.525 million, slightly increase of 1% in comparison with the Ps. 520 million of the previous year.
| 4 |
| Third Quarter 2014 Results | |
| EBITDA and Adjusted EBITDA |
EDITDA for 3Q14 was Ps.153 million, below the Ps.188 million registered in the same period last year. EBITDA Margin was 22% during the period, lesser that the 29% registered in 3Q13. For the nine months ended on September 30th, 2014, EBITDA amounted to Ps.435 million, a 21% decrease in comparison to the Ps.548 million recorded in the same period of 2013. EBITDA margin for the nine months of 2014 was 21%, lower than the 29% of the same period 2013.
Adjusted EBITDA for 3Q14 was Ps.153 million, 14% or Ps.25 million below than the Ps.178 million registered in the same period last year. Adjusted EBITDA Margin was 22% during the period, lower than the 28% registered in the same period of 2013.
| Operating Income (Loss) |
The Company registered an operating income for 3Q14 of Ps.42 million, an increase in comparison to an operating loss of Ps.5 million reported in the same period of 2013. For the nine months ended on September 30th, 2014 the company reported an operating income of Ps.111 million, above at the operating loss of Ps.11 million reported in the same period previous year.
| Comprehensive Financial Result |
During the quarter, the Company registered a net financing cost of Ps.99 million, in comparison with a loss of Ps.85 million registered in the same period of 2013. The variation of Ps.14 million is mainly explained by the offset between less interest expenses generated by the restructured debt and an important exchange rate loss in this quarter. It´s worth to mention that this exchange rate loss do not represent cash disbursement.
| 3Q14 | 3Q13 | DPs. | D% | |||||||||||||
| Interest Expense | 45 | 78 | (33 | ) | (42 | )% | ||||||||||
| Interest (Income) | (3 | ) | - | (3 | ) | - | ||||||||||
| Valuation Effects – Net | 7 | - | 7 | - | ||||||||||||
| Exchange Rate (Gain) Loss – Net | 50 | 7 | 43 | 614 | % | |||||||||||
| Total | 99 | 85 | 14 | 16 | % | |||||||||||
For the nine months ended on September 30th, 2014, comprehensive financial loss for the Company reached Ps.212 million, compared to the Ps.254 million recorded in the same period of 2013.
| Taxes |
At the end of the 3Q14, the Company did not recorded taxes.
| Net Income |
The Company posted a net loss during 3Q14 of Ps.56 million, in comparison to the net loss of Ps.91 million reported in the same period of 2013, the effect is a lower loss of 38%. For the nine months ended on September 30th, 2014, the Company registered a net accumulated loss of Ps.101 million in comparison to the net loss of Ps.266 million recorded in the same period of 2013.
| 5 |
| Third Quarter 2014 Results | |
| Liquidity and Capital Sources |
| Third Quarter Ended | Third Quarter Ended | |||||||
| Millions of Pesos | September 30, 2014 | September 30, 2013 | ||||||
| Resources from Operations and Working Capital | 35 | 126 | ||||||
| CAPEX | (200 | ) | (144 | ) | ||||
| Free Cash Flow | (165 | ) | (18 | ) | ||||
| Financing Activities | 1 | (13 | ) | |||||
| Cash and Financial Instruments at the Start of the Period | 1,795 | 116 | ||||||
| Cash and Financial Instruments at the End of the Period | 1,631 | 85 | ||||||
| Nine Months Ended | Nine Months Ended | |||||||
| Millions of Pesos | September 30, 2014 | September 30, 2013 | ||||||
| Resources from Operations and Working Capital | 126 | 296 | ||||||
| CAPEX | (425 | ) | (370 | ) | ||||
| Free Cash Flow | (299 | ) | (74 | ) | ||||
| Financing Activities | (22 | ) | 12 | |||||
| Cash and Financial Instruments at the Start of the Period | 1,954 | 147 | ||||||
| Cash and Financial Instruments at the End of the Period | 1,633 | 85 | ||||||
Capital Expenditures
The Capital Expenditures during the period totaled Ps.200 million, an increase of 39% or Ps.56 million of the amount invested in 3Q13. Capital Expenditures were primarily used to increase and improve the capacity our fiber optics transport network and the internet infrastructure, and to renew our operation systems.
For the nine months ended on September 30th, 2014 capital expenditures reached Ps.425 million, above of the Ps.370 million recorded in the same period of 2013.
Indebtedness
At September 30th, 2014 the Company reported its Indebtedness level at Ps.2,407 million. The Company’s leverage ratio measured by Debt to EBITDA is at 4.76 times and the Net Debt to EBITDA is at 1.53 times during this period.
Comparative leverage ratios:
| 3Q14 | 2Q14 | 3Q13 | ||||||||||
| Net Debt/EBITDA LTM | 1.53 | 0.93 | 3.34 | |||||||||
| Additional Information |
We expect that the growth of the Company continues for be capable to generate the results and the flows that permit to have a sustainable balance that endorse the commitment with bondholders and with the public investor.
| 6 |
| Third Quarter 2014 Results | |
| About MAXCOM |
MAXCOM Telecomunicaciones, S.A.B. de C.V., headquartered in Mexico City, Mexico, is a facilities-based telecommunications provider using a “smart-build” approach to deliver last-mile connectivity to micro, small and medium-sized businesses and residential customers in the Mexican territory. MAXCOM launched commercial operations in May 1999 and is currently offering local, long distance, data, value-added, paid TV and IP-based services on a full basis in greater metropolitan Mexico City, Puebla, Tehuacan, San Luis, and Queretaro, and on a selected basis in several cities in Mexico. The information contained in this press release is the exclusive responsibility of MAXCOM Telecomunicaciones, S.A.B. de C.V. and has not been reviewed by the Mexican National Banking and Securities Commission (CNBV) or any other authority. The registration of the securities described in this press release before the National Registry of Securities (Registro Nacional de Valores) held by the CNBV, shall it be the case, does not imply a certification of the investment quality of the securities or of MAXCOM’s solvency. The trading of these securities by an investor will be made under such investor’s own responsibility.
For more information contact:
Rodrigo Wright
México, D.F., México
(52 55) 4770-1170
rodrigo.wright@maxcom.com
This document may include forward-looking statements that involve risks and uncertainties. Such forward-looking statements are subject to risks, uncertainties and other factors, including those detailed from time to time in Maxcom’s U.S. Securities and Exchange Commission filings, which could cause the actual results, performance or achievements to be materially different from any future results, performance or achievements expressed or implied by such forward-looking statements. Words such as “estimate,” “project,” “plan,” “believe,” “expect,” “anticipate,” “intend,” and similar expressions may identify such forward-looking statements. Maxcom cautions readers that any forward-looking statement in this press release or made by the company’s management involves risks and uncertainties that may change based on various important factors not under Maxcom’s control. These forward-looking statements represent Maxcom’s judgment as of the date of this press release. Maxcom disclaims any intent or obligation to update these forward-looking statements.
###
| 7 |
| Third Quarter 2014 Results | |
MAXCOM TELECOMUNICACIONES, S.A.B. DE C.V. AND SUBSIDIARIES
UNAUDITED CONSOLIDATED STATEMENT FINANCIAL POSITION IFRS
Thousand of Mexican Pesos (''Ps.'')
| As of September 30, | As of September 30, | vs 3Q 2013 | ||||||||||||||
| 2014 | 2013 | Var $ | Var % | |||||||||||||
| ASSETS: | ||||||||||||||||
| CURRENT ASSETS: | ||||||||||||||||
| Cash and financial instruments | Ps. | 1,632,033 | Ps. | 85,248 | Ps. | 1,546,785 | 1,814 | % | ||||||||
| 1,632,033 | 85,248 | 1,546,785 | 1,814 | % | ||||||||||||
| Accounts receivable: | ||||||||||||||||
| Customers, net of allowance | 640,943 | 663,438 | (22,495 | ) | (3 | )% | ||||||||||
| Value added tax refundable | 153,592 | 89,248 | 64,344 | 72 | % | |||||||||||
| Other sundry debtors | 47,801 | 74,702 | (26,901 | ) | (36 | )% | ||||||||||
| 842,336 | 827,388 | 14,948 | 2 | % | ||||||||||||
| Inventory | 26,796 | 15,318 | 11,478 | 75 | % | |||||||||||
| Prepaid expenses | 13,917 | 23,966 | (10,049 | ) | (42 | )% | ||||||||||
| Total current assets | 2,515,082 | 951,920 | 1,563,162 | 164 | % | |||||||||||
| Frequency rights, net | 4,603 | 15,133 | (10,530 | ) | (70 | )% | ||||||||||
| Telephone network systems and equipment, net | 2,985,775 | 3,836,226 | (850,451 | ) | (22 | )% | ||||||||||
| Intangible assets, net | 87,126 | 99,541 | (12,415 | ) | (12 | )% | ||||||||||
| Deposits | 8,712 | 8,542 | 170 | 2 | % | |||||||||||
| Deferred taxes | 8,794 | 9,793 | (999 | ) | (10 | )% | ||||||||||
| Other assets | 2,151 | 2,151 | - | - | ||||||||||||
| Total assets | Ps. | 5,612,243 | Ps. | 4,923,306 | Ps. | 688,937 | 14 | % | ||||||||
| LIABILITIES | ||||||||||||||||
| CURRENT LIABILITIES: | ||||||||||||||||
| Senior notes | - | 2,301,844 | (2,301,844 | ) | (100 | )% | ||||||||||
| Interest payable | 43,080 | 226,496 | (183,416 | ) | (81 | )% | ||||||||||
| Accounts payable and accrued expenses | 303,512 | 272,992 | 30,520 | 11 | % | |||||||||||
| Notes payable | - | 4,125 | (4,125 | ) | (100 | )% | ||||||||||
| Customers deposits | 2,331 | 2,278 | 53 | 2 | % | |||||||||||
| Hedging valuation | 1,994 | - | 1,994 | 100 | % | |||||||||||
| Payroll and other taxes payable | 30,225 | 7,615 | 22,610 | 297 | % | |||||||||||
| Total current liabilities | 381,142 | 2,815,350 | (2,434,208 | ) | (86 | )% | ||||||||||
| LONG-TERM LIABILITIES: | ||||||||||||||||
| Senior notes | 2,013,279 | - | 2,013,279 | 100 | % | |||||||||||
| Notes payable | - | 4,321 | (4,321 | ) | (100 | )% | ||||||||||
| Other accounts payable | 35,696 | 24,854 | 10,842 | 44 | % | |||||||||||
| Pensions and post-retirement obligations | 5,430 | 5,503 | (73 | ) | (1 | )% | ||||||||||
| Other long term liabilities | 58,174 | 157,633 | (99,459 | ) | (63 | )% | ||||||||||
| Long Term Liabilities | 2,112,579 | 192,311 | 1,920,268 | 999 | % | |||||||||||
| Total liabilities | Ps. | 2,493,721 | Ps. | 3,007,661 | Ps. | (513,940 | ) | (17 | )% | |||||||
| SHAREHOLDERS' EQUITY | ||||||||||||||||
| Capital stock | 7,082,904 | 4,828,481 | 2,254,423 | 47 | % | |||||||||||
| Premium on capital stock | 40,033 | 5,404 | 34,629 | 641 | % | |||||||||||
| Accumulated deficit | (3,903,422 | ) | (2,652,693 | ) | (1,250,729 | ) | (47 | )% | ||||||||
| Net profit (loss) for the period | (100,993 | ) | (265,547 | ) | 164,554 | 62 | % | |||||||||
| Total shareholders' equity | Ps. | 3,118,522 | Ps. | 1,915,645 | Ps. | 1,202,877 | 63 | % | ||||||||
| Total liabitilies and equity | Ps. | 5,612,243 | Ps. | 4,923,306 | Ps. | 688,937 | 14 | % | ||||||||
| 8 |
| Third Quarter 2014 Results | |
MAXCOM TELECOMUNICACIONES, S.A.B. DE C.V. AND SUBSIDIARIES
UNAUDITED CONSOLIDATED STATEMENT OF COMPREHENSIVE INCOME IFRS
Thousand of Mexican Pesos (''Ps.'')
| 3 month ended September 30, | vs 3M 2013 | 9 months ended September 30, | vs 9M 2013 | |||||||||||||||||||||||||||||||||||||||||||||
| 2014 | % | 2013 | % | $ var | % var | 2014 | % | 2013 | % | $ var | % var | |||||||||||||||||||||||||||||||||||||
| TOTAL REVENUES | Ps. | 707,235 | 100 | % | Ps. | 642,136 | 100 | % | Ps. | 65,099 | 10 | % | Ps. | 2,030,361 | 100 | % | Ps. | 1,860,156 | 100 | % | Ps. | 170,205 | 9 | % | ||||||||||||||||||||||||
| Network operating services | 330,373 | 47 | % | 250,905 | 39 | % | 79,468 | 32 | % | 948,151 | 47 | % | 692,557 | 37 | % | 255,594 | 37 | % | ||||||||||||||||||||||||||||||
| Technical expenses | 42,568 | 6 | % | 27,346 | 4 | % | 15,222 | 56 | % | 120,685 | 6 | % | 93,969 | 5 | % | 26,716 | 28 | % | ||||||||||||||||||||||||||||||
| Installation expenses | 667 | 0 | % | 1,548 | 0 | % | (881 | ) | (57 | )% | 1,687 | 0 | % | 6,194 | 0 | % | (4,507 | ) | (73 | )% | ||||||||||||||||||||||||||||
| Cost of network operation | 373,608 | 53 | % | 279,799 | 44 | % | 93,809 | 34 | % | 1,070,523 | 53 | % | 792,720 | 43 | % | 277,803 | 35 | % | ||||||||||||||||||||||||||||||
| GROSS PROFIT | 333,627 | 47 | % | 362,337 | 56 | % | (28,710 | ) | (8 | )% | 959,838 | 47 | % | 1,067,436 | 57 | % | (107,598 | ) | (10 | )% | ||||||||||||||||||||||||||||
| Selling, general and administrative expenses | 180,508 | 26 | % | 174,714 | 27 | % | 5,794 | 3 | % | 525,236 | 26 | % | 519,723 | 28 | % | 5,513 | 1 | % | ||||||||||||||||||||||||||||||
| EBITDA | 153,119 | 22 | % | 187,623 | 29 | % | (34,504 | ) | (18 | )% | 434,602 | 21 | % | 547,713 | 29 | % | (113,111 | ) | (21 | )% | ||||||||||||||||||||||||||||
| Depreciation and amortization | 88,714 | 155,155 | (66,441 | ) | (43 | )% | 272,682 | 427,293 | (154,611 | ) | (36 | )% | ||||||||||||||||||||||||||||||||||||
| Other (Income) Expense | 22,043 | 20,310 | 1,733 | 9 | % | 51,043 | 83,478 | (32,435 | ) | (39 | )% | |||||||||||||||||||||||||||||||||||||
| Reorganization | - | 17,500 | (17,500 | ) | 100 | % | - | 48,215 | (48,215 | ) | 100 | % | ||||||||||||||||||||||||||||||||||||
| Operating income (loss) | 42,362 | (5,342 | ) | 47,704 | 893 | % | 110,877 | (11,273 | ) | 122,150 | 1,084 | % | ||||||||||||||||||||||||||||||||||||
| Comprehensive (income) cost of financing: | ||||||||||||||||||||||||||||||||||||||||||||||||
| Interest expense | 44,767 | 78,963 | (34,196 | ) | (43 | )% | 112,367 | 221,232 | (108,865 | ) | (49 | )% | ||||||||||||||||||||||||||||||||||||
| Interest (income) loss, net | (3,110 | ) | (303 | ) | (2,807 | ) | (926 | )% | (21,093 | ) | (5,619 | ) | (15,474 | ) | (275 | )% | ||||||||||||||||||||||||||||||||
| Valuation effects, net | 7,197 | - | 7,197 | 100 | % | 57,506 | 9,341 | 48,165 | 516 | % | ||||||||||||||||||||||||||||||||||||||
| Exchange (income) loss, net | 49,719 | 6,837 | 42,882 | 627 | % | 63,090 | 29,320 | 33,770 | 115 | % | ||||||||||||||||||||||||||||||||||||||
| 98,573 | 85,497 | 13,076 | 15 | % | 211,870 | 254,274 | (42,404 | ) | (17 | )% | ||||||||||||||||||||||||||||||||||||||
| INCOME (LOSS) BEFORE TAXES | (56,211 | ) | (90,839 | ) | 34,628 | 38 | % | (100,993 | ) | (265,547 | ) | 164,554 | 62 | % | ||||||||||||||||||||||||||||||||||
| Taxes: | ||||||||||||||||||||||||||||||||||||||||||||||||
| Income tax | - | - | - | - | - | - | - | - | ||||||||||||||||||||||||||||||||||||||||
| Defered Income Tax | - | - | - | - | - | - | - | - | ||||||||||||||||||||||||||||||||||||||||
| Total tax | - | - | - | - | - | - | - | - | ||||||||||||||||||||||||||||||||||||||||
| NET INCOME (LOSS) | Ps. | (56,211 | ) | Ps. | (90,839 | ) | Ps. | 34,628 | 38 | % | Ps. | (100,993 | ) | Ps. | (265,547 | ) | Ps. | 164,554 | 62 | % | ||||||||||||||||||||||||||||
| Weighted average basic shares | 3,057,503 | 789,819 | 3,057,503 | 789,819 | ||||||||||||||||||||||||||||||||||||||||||||
| Weighted average fully diluted | 3,060,503 | - | 3,060,503 | - | ||||||||||||||||||||||||||||||||||||||||||||
| Earnings per share basic | (0.02 | ) | (0.12 | ) | (0.03 | ) | (0.34 | ) | ||||||||||||||||||||||||||||||||||||||||
| Earnings per share diluted | (0.02 | ) | - | (0.03 | ) | - | ||||||||||||||||||||||||||||||||||||||||||
| 9 |
| Third Quarter 2014 Results | |
MAXCOM TELECOMUNICACIONES, S.A.B. DE C.V. AND SUBSIDIARIES
UNAUDITED CONSOLIDATED STATEMENT OF CHANGES IN SHAREHOLDERS' EQUITY IFRS
Thousand of Mexican Pesos (''Ps.'')
| Additional | Total | |||||||||||||||||||
| Capital | paid-in | Repurchase | shareholders' | |||||||||||||||||
| stock | capital | Deficit | of shares | equity | ||||||||||||||||
| Balances as of December 31, 2012 | Ps. | 4,814,428 | Ps. | 3,592 | Ps. | (2,652,693 | ) | Ps. | - | Ps. | 2,165,327 | |||||||||
| Reclassification of additional paid-in capital | 14,053 | - | - | - | 14,053 | |||||||||||||||
| Stock option plan | - | 1,812 | - | - | 1,812 | |||||||||||||||
| Comprehensive net loss | - | - | (265,547 | ) | - | (265,547 | ) | |||||||||||||
| Balances as of September 30, 2013 | Ps. | 4,828,481 | Ps. | 5,404 | Ps. | (2,918,240 | ) | Ps. | - | Ps. | 1,915,645 | |||||||||
| Additional | Total | |||||||||||||||||||
| Capital | paid-in | Repurchase | shareholders' | |||||||||||||||||
| stock | capital | Deficit | of shares | equity | ||||||||||||||||
| Balances as of December 31, 2013 | Ps. | 7,028,634 | Ps. | 40,033 | Ps. | (3,903,422 | ) | Ps. | - | Ps. | 3,165,245 | |||||||||
| Increased in capital Stock | 54,270 | - | - | - | 54,270 | |||||||||||||||
| Stock option plan | - | - | - | - | - | |||||||||||||||
| Comprehensive net loss | - | - | (100,993 | ) | - | (100,993 | ) | |||||||||||||
| Balances as of September 30, 2014 | Ps. | 7,082,904 | Ps. | 40,033 | Ps. | (4,004,415 | ) | Ps. | - | Ps. | 3,118,522 | |||||||||
| 10 |
| Third Quarter 2014 Results | |
MAXCOM TELECOMUNICACIONES, S.A.B. DE C.V. AND SUBSIDIARIES
UNAUDITED CONSOLIDATED STATEMENT OF CASH FLOW IFRS
Thousand of Mexican Pesos (''Ps.'')
| 3 months ended September 30, | vs 2013 | 9 months ended September 30, | vs 2013 | |||||||||||||||||||||||||||||
| 2014 | 2013 | $ var | % var | 2014 | 2013 | $ var | % var | |||||||||||||||||||||||||
| Operating Activities: | ||||||||||||||||||||||||||||||||
| Income before taxes | Ps. | (56,211 | ) | Ps. | (90,839 | ) | Ps. | 34,628 | 38 | % | Ps. | (100,993 | ) | Ps. | (265,547 | ) | Ps. | 164,554 | 62 | % | ||||||||||||
| Items without cash flow | 228,620 | 230,767 | (2,147 | ) | (1 | )% | 549,050 | 667,303 | (118,253 | ) | (18 | )% | ||||||||||||||||||||
| Cash flow from income/loss before taxes | 172,409 | 139,928 | 32,481 | 23 | % | 448,057 | 401,756 | 46,301 | 12 | % | ||||||||||||||||||||||
| Cash flow from: | ||||||||||||||||||||||||||||||||
| Accounts receivables | (16,323 | ) | 31,197 | (47,520 | ) | (152 | )% | (42,081 | ) | (2,633 | ) | (39,448 | ) | (1,498 | )% | |||||||||||||||||
| Inventory | 2,215 | 1,882 | 333 | 18 | % | (10,099 | ) | 3,003 | (13,102 | ) | (436 | )% | ||||||||||||||||||||
| Accounts payables | (66,691 | ) | (41,510 | ) | (25,181 | ) | (61 | )% | (66,497 | ) | (42,621 | ) | (23,876 | ) | (56 | )% | ||||||||||||||||
| Other assets and liabilities | (55,415 | ) | (4,858 | ) | (50,557 | ) | (1,041 | )% | (203,741 | ) | (62,863 | ) | (140,878 | ) | (224 | )% | ||||||||||||||||
| Cash flow from operation activities | (136,214 | ) | (13,289 | ) | (122,925 | ) | (925 | )% | (322,418 | ) | (105,114 | ) | (217,304 | ) | (207 | )% | ||||||||||||||||
| Net cash flow from operating activities | 36,195 | 126,639 | (90,444 | ) | (71 | )% | 125,639 | 296,642 | (171,003 | ) | (58 | )% | ||||||||||||||||||||
| Cash flow from: | ||||||||||||||||||||||||||||||||
| Telephone network systems and equipment, net | (200,393 | ) | (144,261 | ) | (56,132 | ) | (39 | )% | (425,439 | ) | (369,757 | ) | (55,682 | ) | (15 | )% | ||||||||||||||||
| Cash flow from capital expeditures | (200,393 | ) | (144,261 | ) | (56,132 | ) | (39 | )% | (425,439 | ) | (369,757 | ) | (55,682 | ) | (15 | )% | ||||||||||||||||
| Cash in excess/(required) to be used in financing activities | (164,198 | ) | (17,622 | ) | (146,576 | ) | (832 | )% | (299,800 | ) | (73,115 | ) | (226,685 | ) | (310 | )% | ||||||||||||||||
| Cash flow from : | ||||||||||||||||||||||||||||||||
| Vendor financing | - | (3,282 | ) | 3,282 | 100 | % | (8,348 | ) | (2,215 | ) | (6,133 | ) | (277 | )% | ||||||||||||||||||
| Capital stock | 1,003 | 981 | 22 | 100 | % | 54,270 | 14,053 | 40,217 | 100 | % | ||||||||||||||||||||||
| Additional paid in capital | - | - | - | - | - | 9 | (9 | ) | (100 | )% | ||||||||||||||||||||||
| Other financing activities | - | (11,049 | ) | 11,049 | 100 | % | (67,781 | ) | - | (67,781 | ) | NA | ||||||||||||||||||||
| Cash flow from financing activities | 1,003 | (13,350 | ) | 14,353 | 108 | % | (21,859 | ) | 11,847 | (33,706 | ) | (285 | )% | |||||||||||||||||||
| Increase (decrease) in cash and temporary investments | (163,195 | ) | (30,972 | ) | (132,223 | ) | (427 | )% | (321,659 | ) | (61,268 | ) | (260,391 | ) | (425 | )% | ||||||||||||||||
| Cash and financial instruments at beginning of the period | 1,795,228 | 116,220 | 1,679,008 | 1,445 | % | 1,953,692 | 146,516 | 1,807,176 | 1,233 | % | ||||||||||||||||||||||
| Cash and cash equivalents at the end of the period | Ps. | 1,632,033 | Ps. | 85,248 | Ps. | 1,546,785 | 1,814 | % | Ps. | 1,632,033 | Ps. | 85,248 | Ps. | 1,546,785 | 1,814 | % | ||||||||||||||||
| 11 |