Exhibit 99.2
Aeterna Zentaris
Management's Discussion and Analysis
of Financial Condition and Results of Operations
Company Overview
Aeterna Zentaris Inc. is a specialty biopharmaceutical company engaged in developing novel treatments in oncology and endocrinology. Our pipeline encompasses compounds at various stages of development.
Our wholly-owned, later-stage product candidates include MACRILEN™ (macimorelin), an orphan drug that evaluates growth hormone deficiency in adults, and zoptarelin doxorubicin, a targeted therapy for endometrial cancer, as well as for castration- and taxane-resistant prostate and other cancers. We are also investigating various additional compounds as potential treatments for a host of unmet medical needs.
The Company's common shares are listed on both the NASDAQ Capital Market (the "NASDAQ"), under the symbol "AEZS", and on the Toronto Stock Exchange ("TSX"), under the symbol "AEZ".
Introduction
This Management's Discussion and Analysis ("MD&A") provides a review of the results of operations, financial condition and cash flows of Aeterna Zentaris Inc. for the year ended December 31, 2013. In this MD&A, "Aeterna Zentaris", the "Company", "we", "us", "our" and the "Group" mean Aeterna Zentaris Inc. and its subsidiaries. This discussion should be read in conjunction with the information contained in the Company's consolidated financial statements and related notes as at December 31, 2013 and December 31, 2012 and for the years ended December 31, 2013, 2012 and 2011. Our consolidated financial statements have been prepared in accordance with International Financial Reporting Standards ("IFRS") as issued by the International Accounting Standards Board ("IASB").
All amounts in this MD&A are presented in United States ("U.S.") dollars, except for share, option and warrant data, per share and per warrant data and as otherwise noted.
All shares, options and share purchase warrants as well as per share, option and share purchase warrant information presented in this MD&A have been adjusted, including proportionate adjustments being made to each stock option and share purchase warrant exercise price, to reflect and give effect to a consolidation, on October 2, 2012, of our issued and outstanding common shares on a six-to-one basis (the "Share Consolidation"). The Share Consolidation affected all shareholders, optionholders and warrantholders uniformly and thus did not materially affect any securityholder's percentage of ownership interest.
About Forward-Looking Statements
This document contains forward-looking statements, which reflect our current expectations regarding future events. Forward-looking statements may include words such as "anticipate", "assuming", "believe", "could", "expect", "foresee", "goal", "guidance", "intend", "may", "objective", "outlook", "plan", "seek", "should", "strive", "target" and "will".
Forward-looking statements involve risks and uncertainties, many of which are discussed in this MD&A. Results or performance may differ significantly from expectations. For example, the results of current clinical trials cannot be foreseen, nor can changes in policy or actions taken by regulatory authorities such as the the U.S. Food and Drug Administration ("FDA"), the European Medicines Agency, the Therapeutic Products Directorate of Health Canada or any other organization responsible for enforcing regulations in the pharmaceutical industry.
Given these uncertainties and risk factors, readers are cautioned not to place undue reliance on any forward-looking statements. We disclaim any obligation to update any such factors or to publicly announce any revisions to any of the forward-looking statements contained herein to reflect future results, events or developments, unless required to do so by a governmental authority or by applicable law.
Aeterna Zentaris
2013 Annual MD&A
About Material Information
This MD&A includes information that we believe to be material to investors after considering all circumstances, including potential market sensitivity. We consider information and disclosures to be material if they result in, or would reasonably be expected to result in, a significant change in the market price or value of our securities, or where it is likely that a reasonable investor would consider the information and disclosures to be important in making an investment decision.
The Company is a reporting issuer under the securities legislation of all of the provinces of Canada, and our securities are registered with the U.S. Securities and Exchange Commission. The Company is therefore required to file or furnish continuous disclosure information, such as interim and annual financial statements, MD&As, proxy circulars, annual reports on Form 20-F, material change reports and press releases with the appropriate securities regulatory authorities. Copies of these documents may be obtained free of charge upon request from the Company's Investor Relations department or on the Internet at the following addresses: www.aezsinc.com, www.sedar.com and www.sec.gov.
Key Developments
MACRILEN™
| |
| ▪ | On January 6, 2014, we announced that the FDA had accepted for substantive review our New Drug Application ("NDA") for our orally available peptidomimetic ghrelin receptor agonist with growth hormone secretagogue activity, MACRILEN™, for the evaluation of adult growth hormone deficiency ("AGHD"). The acceptance for filing of the NDA indicates that the FDA has determined that the application is sufficiently complete to permit a substantive review. The NDA, submitted on November 5, 2013, seeks approval for the commercialization of MACRILEN™, which, if approved, will be the first orally administered drug indicated for the evaluation of AGHD by evaluating the pituitary gland secretion of growth hormone in response to an oral dose of the product. The application is subject to a standard review and will have a Prescription Drug User Fee Act ("PDUFA") date of November 5, 2014. The PDUFA date is the goal date for the FDA to complete its review of the NDA. MACRILEN™ benefits from patent protection covering major markets; in particular, the product is protected in the U.S. at least until October 2027. Phase 3 data have demonstrated the compound to be well tolerated, with accuracy comparable to available intravenous and intramuscular testing procedures. |
Zoptarelin Doxorubicin
| |
| ▪ | On April 10, 2013 we announced the signing of a co-development and profit sharing agreement with Ergomed Clinical Research Ltd. ("Ergomed") as the contract clinical development organization for the Phase 3 ZoptEC (Zoptarelin doxorubicin in Endometrial Cancer) trial in women with locally advanced, recurrent or metastatic endometrial cancer who have progressed and who have received one chemotherapeutic regimen with platinum and taxane (either as adjuvant or first-line treatment). The ZoptEC trial is an open-label, randomized, multicenter trial conducted in North America, Europe and Israel under a Special Protocol Assessment with the FDA. The trial compares zoptarelin doxorubicin with doxorubicin as second line therapy and will involve approximately 500 patients. Patient dosing was initiated in July 2013, and the primary efficacy endpoint of the ZoptEC trial is improvement in median Overall Survival. |
Under the terms of the agreement, Ergomed has agreed to assume 30% (up to $10 million) of the clinical and regulatory costs for this trial, which are estimated at approximately $30 million over the course of the study. Ergomed will be entitled to receive an agreed upon single-digit percentage of any net income received by us for zoptarelin doxorubicin in this indication, up to a specified maximum amount.
| |
| ▪ | On June 3, 2013, we announced encouraging final data for the Phase 1 portion of the ongoing Phase 1/2 trial in men with castration- and taxane-resistant prostate cancer with zoptarelin doxorubicin. Data were presented at the American Society of Clinical Oncology Annual Meeting in Chicago by the principal investigator, Jacek Pinski, MD, PhD, of the University of Southern California's Norris Comprehensive Cancer Center. In general, zoptarelin doxorubicin was well tolerated and demonstrated promising evidence of its anti-tumor activity in this heavily pretreated population. Among the 15 evaluable patients with measurable disease, ten achieved stable disease, and a drop in Prostatic Specific Antigen was noted in three patients. The maximum tolerated dose ("MTD") of zoptarelin doxorubicin in this indication was established at 210 mg/m2, which is below the MTD reported in women with refractory endometrial and ovarian cancer. The Phase 2 portion of this trial in prostate cancer is ongoing. |
Aeterna Zentaris
2013 Annual MD&A
Cetrotide® Manufacturing Rights and Discontinued Operations
| |
| ▪ | On October 1, 2013, we announced that we had successfully completed the transactions contemplated by the transfer and service agreement and concurrent agreements with various partners and licensees with respect to the manufacturing rights for Cetrotide®, currently marketed by a subsidiary of Merck KGaA of Darmstadt, Germany ("Merck Serono") for therapeutic use as part of in vitro fertilization programs. The principal outcome of these agreements is the transfer of manufacturing rights and the grant of a license to Merck Serono for the manufacture, testing, assembling, packaging, storage and release of Cetrotide® in all territories (the "Cetrotide® Business") in exchange for a non-refundable, one-time payment of €2.5 million (approximately $3.3 million). |
| |
| ▪ | The Cetrotide® Business has been presented in our consolidated financial statements as a discontinued operation. As such, relevant amounts impacting elements of our comprehensive income (loss) and cash flows have been retroactively reclassified to reflect the Cetrotide® Business as a discontinued operation and are discussed separately from continuing operations in this MD&A. |
Perifosine
| |
| ▪ | On March 11, 2013, we announced that the Phase 3 trial in multiple myeloma was discontinued after an interim analysis by an independent Data Safety Monitoring Board reported that it was highly unlikely the study would achieve a significant difference in its primary endpoint of progression-free survival. We therefore decided not to make any further investment in the development of perifosine. |
Appointments to Executive Management Team
| |
| ▪ | On April 15, 2013, we announced the appointment of David Dodd as our President, Chief Executive Officer ("CEO") and director of the Company. Mr. Dodd's executive management experience in the pharmaceutical and biotechnology industries spans more than 35 years. Prior to joining our Company, Mr. Dodd was President, CEO and Chairman of BioReliance Corporation, a leading provider of biological safety and related testing services, and President, CEO and director of Serologicals Corporation. Mr. Dodd also held the roles of President and CEO of Solvay Pharmaceuticals, Inc. and of Chairman of its subsidiary, Unimed Pharmaceuticals, Inc., and held various senior management positions at Wyeth-Ayerst Laboratories, the Mead Johnson Laboratories Division at Bristol-Myers Squibb and at Abbott Laboratories. Mr. Dodd holds a Master's degree from Georgia State University and completed the Harvard Business School Advanced Management Program. |
| |
| ▪ | On November 1, 2013, we announced the appointment of Jude Dinges as our Senior Vice President and Chief Commercial Officer. Mr. Dinges is responsible for all activities regarding the potential commercial launch of MACRILEN™ in AGHD, as well as for identifying future commercial opportunities. Mr. Dinges began his career nearly 30 years ago at Bristol Laboratories and later at Merck & Co. in training, sales, management, marketing and market development and was a key contributor to the successful launch of brands such as Cozaar®, Fosamax®, Singulair®, Maxalt®, Vioxx®, and Vytorin®. Mr. Dinges joined Novartis Pharmaceuticals in 2006, overseeing the launch of Tekturna®, and in 2008 became the Respiratory & Infectious Disease Specialty Medicines Director. In 2009, he joined Amgen Inc. as Executive Director of Region Sales, Bone Health Business Unit. |
| |
| ▪ | On January 3, 2014, we announced the appointment of Richard Sachse, MD, PhD, as our Senior Vice President, Chief Scientific Officer and Managing Director. Dr. Sachse, who is based in Frankfurt, holds a degree in medicine from the Friedrich-Alexander-University Erlangen and a board certification in Clinical Pharmacology and has over 20 years' experience as a physician and scientist. He has extensive expertise in a variety of different therapeutic areas, including endocrinology and oncology. In addition to registration studies, Dr. Sachse is especially experienced in the design and implementation of translational programs to bridge research programs to the clinic, as well as in the design and implementation of clinical pharmacology programs, including all required profiling studies and activities, enabling successful registration of products at the international level. Before joining Aeterna Zentaris, Dr. Sachse was Vice President and Head of Global Translational Medicine at Boehringer Ingelheim. From 1996 to 2000, he was International Project Leader at the Bayer AG Institute for Clinical Pharmacology and Principal Investigator at the Bayer Clinical Pharmacology Unit. From 2001 to 2006, Dr. Sachse held a variety of management positions within early and late phase clinical development programs, including responsibilities for completed Phase 3 programs leading to successful New Drug Application / Marketing Authorization Application submissions. In 2007, he became Senior Director, Head of |
Aeterna Zentaris
2013 Annual MD&A
Experimental Medicine, at UCB in Belgium, before being appointed Vice President, Head of Global Translational Medicine, at Boehringer Ingelheim in 2010.
Corporate Developments
"At-the-Market" Issuance Program
| |
| ▪ | Between May 22, 2013 and December 31, 2013, we sold a total of approximately 1.7 million common shares under our At‑The-Market ("ATM") sales program at an average price of $1.76 per share, resulting in aggregate gross proceeds of approximately $3.0 million. This ATM sales program allows the Company to sell, at market prices prevailing at the time of sale, up to a maximum of 2.5 million of our common shares through ATM issuances on the NASDAQ for aggregate gross proceeds not to exceed $4.6 million. Between January 1, 2014 and March 20, 2014, we issued a total of 0.2 million common shares under this ATM sales program for aggregate gross proceeds of $0.3 million. |
Registered Direct Offering
| |
| ▪ | On July 30, 2013, we completed a registered direct offering of 5.2 million units at a purchase price of $1.50 per unit, generating net proceeds of approximately $7.0 million. Each unit consisted of one common share and 0.5 of a warrant to purchase one common share. Each warrant is exercisable at any time after January 30, 2014 for a period of five years from the date of issuance at an exercise price of $1.85 per share. |
Public Offerings
| |
| ▪ | On November 25, 2013 we completed a public offering of 13.1 million units, generating net proceeds of approximately $13.7 million. Each unit consisted of one common share and one whole warrant to purchase one common share, at a purchase price of $1.15 per unit. Each warrant is exercisable for a period of five years at an original exercise price of $1.60 per share, subject to certain anti-dilution provisions. |
| |
| ▪ | Subsequent to year-end, on January 14, 2014, we completed a public offering of 11.0 million units, generating net proceeds of approximately $12.2 million, with each unit consisting of one common share and 0.8 of a warrant to purchase one common share, at a purchase price of $1.20 per unit. Each warrant is exercisable for a period of five years at an original exercise price of $1.25 per share, which is subject to certain anti-dilution provisions. |
Listing Transfer to the NASDAQ Capital Market
| |
| ▪ | On August 28, 2013, we announced that our request to transfer our listing to the NASDAQ Capital Market from the NASDAQ Global Market had been approved by the NASDAQ Listing Qualifications Staff. Our common shares continue to trade on the NASDAQ Capital Market, effective August 29, 2013. |
Aeterna Zentaris
2013 Annual MD&A
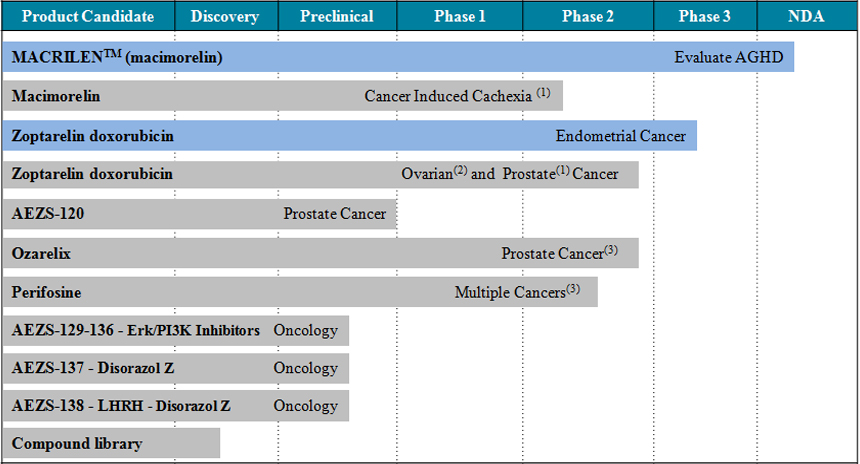
Status of Our Drug Pipeline
_________________________
(1) Investigator-driven and sponsored.
(2) Phase 2 in ovarian cancer completed.
(3) Sponsored entirely by license partners.
We are focused on preparing for the launch of MACRILEN™ for the evaluation of AGHD in the U.S. and on advancing our ZoptEC Phase 3 program with zoptarelin doxorubicin in endometrial cancer, as discussed further below.
Regarding AEZS‑120, which is a targeted, live recombinant oral tumor vaccine candidate, we are reviewing the development program and our available resources related to this compound.
Ozarelix, a modified luteinizing hormone-releasing hormone ("LHRH") receptor antagonist, with the potential to treat hormone-dependent cancers as well as benign proliferative endocrinological disorders, and perifosine, an oral AKT inhibitor which is being investigated as a potential treatment option for various cancer indications, no longer require significant investment from our Company, being licensed out to Spectrum Pharmaceuticals, Inc. and to Yakult Honsha Co., Ltd. ("Yakult"), respectively. Both partners are responsible for conducting and sponsoring all ongoing development.
As for our compounds in earlier stages of development, our Erk/PI3K inhibitors and our disorazol Z product candidates, as well as our discovery activities, are both under review as part of our focused initiative to optimize research and development ("R&D") activities. Our Erk/PI3K inhibitors are part of our kinase research program, comprising the investigation of different compounds for single Erk inhibition, single PI3K inhibition and dual Erk/PI3K kinase inhibition. Disorazol Z product candidates comprise AEZS-138, a novel cytotoxic hybrid based on the natural compound disorazol Z (AEZS-137), and the LHRH receptor agonist D-Lys6-LHRH. We currently do not expect to invest significantly in these projects, unless partnered and/or sponsored through strategic alliances.
Aeterna Zentaris
2013 Annual MD&A
Consolidated Statements of Comprehensive Income (Loss) Information
|
| | | | | | | | | | | | | | | |
| | | Three-month periods ended December 31, | | Years ended December 31, |
| (in thousands, except share and per share data) | | 2013 | | 2012 | | 2013 | | 2012 | | 2011 |
| | | $ | | $ | | $ | | $ | | $ |
| Revenues | | | | | | | | | | |
| Sales | | — |
| | — |
| | 96 |
| | 834 |
| | 250 |
|
| License fees and other | | — |
| | 281 |
| | 6,079 |
| | 1,219 |
| | 4,455 |
|
| | | — |
| | 281 |
| | 6,175 |
| | 2,053 |
| | 4,705 |
|
| Operating expenses | | | | | | | | | | |
| Cost of sales | | — |
| | — |
| | 51 |
| | 591 |
| | 212 |
|
| Research and development costs, net of refundable tax credits and grants | | 5,345 |
| | 5,523 |
| | 21,284 |
| | 20,592 |
| | 24,245 |
|
| Selling, general and administrative expenses | | 2,627 |
| | 2,877 |
| | 12,316 |
| | 10,606 |
| | 11,955 |
|
| | | 7,972 |
| | 8,400 |
| | 33,651 |
| | 31,789 |
| | 36,412 |
|
| Loss from operations | | (7,972 | ) | | (8,119 | ) | | (27,476 | ) | | (29,736 | ) | | (31,707 | ) |
| Finance income | | 65 |
| | 689 |
| | 1,748 |
| | 6,974 |
| | 6,239 |
|
| Finance costs | | (2,689 | ) | | (700 | ) | | (1,512 | ) | | (382 | ) | | (8 | ) |
| Net finance (costs) income | | (2,624 | ) | | (11 | ) | | 236 |
| | 6,592 |
| | 6,231 |
|
| Loss before income taxes | | (10,596 | ) | | (8,130 | ) | | (27,240 | ) | | (23,144 | ) | | (25,476 | ) |
| Income tax expense | | — |
| | — |
| | — |
| | — |
| | (1,104 | ) |
| Net loss from continuing operations | | (10,596 | ) | | (8,130 | ) | | (27,240 | ) | | (23,144 | ) | | (26,580 | ) |
| Net income (loss) from discontinued operations | | 2,353 |
| | 1,183 |
| | 34,055 |
| | 2,732 |
| | (487 | ) |
| Net (loss) income | | (8,243 | ) | | (6,947 | ) | | 6,815 |
| | (20,412 | ) | | (27,067 | ) |
| Other comprehensive (loss) income: | | | | | | | | | | |
| Items that may be reclassified subsequently to profit or loss: | | | | | | | | | | |
| Foreign currency translation adjustments | | 424 |
| | (204 | ) | | 1,073 |
| | (504 | ) | | (789 | ) |
| Items that will not be reclassified to profit or loss: | | | | | | | | | | |
| Actuarial gain (loss) on defined benefit plans | | 2,346 |
| | (3,705 | ) | | 2,346 |
| | (3,705 | ) | | (1,335 | ) |
| Comprehensive (loss) income | | (5,473 | ) | | (10,856 | ) | | 10,234 |
| | (24,621 | ) | | (29,191 | ) |
| Net loss per share (basic and diluted) from continuing operations | | (0.28 | ) | | (0.34 | ) | | (0.92 | ) | | (1.17 | ) | | (1.69 | ) |
| Net income (loss) (basic and diluted) from discontinuing operations | | 0.06 |
| | 0.05 |
| | 1.16 |
| | 0.14 |
| | (0.03 | ) |
| Net (loss) income (basic and diluted) per share | | (0.22 | ) | | (0.29 | ) | | 0.24 |
| | (1.03 | ) | | (1.72 | ) |
| Weighted average number of shares outstanding: | | | | | | | | | | |
| Basic | | 37,274,129 |
| | 24,181,462 |
| | 29,476,455 |
| | 19,775,073 |
| | 15,751,331 |
|
| Diluted | | 37,274,129 |
| | 24,181,462 |
| | 29,476,455 |
| | 19,806,687 |
| | 15,751,331 |
|
Aeterna Zentaris
2013 Annual MD&A
2013 compared to 2012
Revenues from Continuing Operations
Revenues are derived predominantly from license fees, which include periodic milestone payments, R&D contract fees and the amortization of upfront payments received from our licensing partners.
Sales revenues are derived from the sale of active pharmaceutical ingredients, or raw materials, to license partners. Periodic variations of sales, and, consequently, of cost of sales, are attributable to the R&D needs of the requesting license partner.
License fees and other revenues were nil and $6.1 million for the three-month period and the year ended December 31, 2013, respectively, as compared to $0.3 million and $1.2 million for the same periods in 2012.
In March 2011, we entered into an agreement with Yakult for the development, manufacture and commercialization of perifosine in all human uses, excluding leishmaniasis, in Japan. Under the terms of this agreement, Yakult had made an initial, non-refundable gross upfront payment to the Company of approximately $8.4 million. We recorded this upfront payment as deferred revenues and commenced amortizing the underlying proceeds on a straight-line basis over the estimated life cycle of perifosine in colorectal cancer ("CRC") and multiple myeloma ("MM").
On April 1, 2012, following negative results of a Phase 3 study of perifosine in CRC, we discontinued the perifosine program in that indication. Furthermore, in March 2013, following an analysis of interim results of the Phase 3 study of perifosine in MM, we also discontinued the development of perifosine in the MM indication. Given these results and the termination of these studies, we determined that we no longer had significant obligations under the agreement with Yakult to continue with the development of perifosine, and we recognized, in March 2013, the remaining unamortized amount of deferred revenue of $5.9 million related to the above licensing agreement.
On a year-over-year basis, the increase in license fees and other revenues is therefore attributable to the earlier-than-expected recognition of the previously deferred upfront license payment received from Yakult, following the discontinuance of our development of perifosine and given that the earnings process associated with this compound as pertaining to the upfront proceeds received was deemed to be complete.
License fees and other revenues are expected to decrease significantly in 2014 as compared to the year ended December 31, 2013, given the absence of any remaining unamortized license fee payments as at December 31, 2013.
Operating Expenses from Continuing Operations
R&D costs, net of refundable tax credits and grants, were $5.3 million and $21.3 million for the three-month period and the year ended December 31, 2013, respectively, compared to $5.5 million and $20.6 million for the same periods in 2012.
The following table summarizes our net R&D costs by nature of expense:
|
| | | | | | | | | | | | | | | |
| | | Three-month periods ended December 31, | | Years ended December 31, |
| (in thousands) | | 2013 | | 2012 | | 2013 | | 2012 | | 2011 |
| | | $ | | $ | | $ | | $ | | $ |
| Third-party costs | | 2,828 |
| | 2,345 |
| | 10,049 |
| | 8,679 |
| | 10,077 |
|
| Employee compensation and benefits | | 1,629 |
| | 2,145 |
| | 7,864 |
| | 8,590 |
| | 10,028 |
|
| Facilities rent and maintenance | | 466 |
| | 401 |
| | 1,758 |
| | 1,661 |
| | 1,835 |
|
| Other costs* | | 540 |
| | 744 |
| | 2,130 |
| | 2,530 |
| | 2,688 |
|
| R&D tax credits and grants | | (118 | ) | | (112 | ) | | (517 | ) | | (868 | ) | | (383 | ) |
| | | 5,345 |
| | 5,523 |
| | 21,284 |
| | 20,592 |
| | 24,245 |
|
_________________________
* Includes depreciation, amortization and impairment charges.
Aeterna Zentaris
2013 Annual MD&A
The following table summarizes primary third-party R&D costs, by product candidate, incurred by the Company during the three-month periods ended December 31, 2013 and 2012.
|
| | | | | | | | | | | | |
| (in thousands, except percentages) | | Three-month periods ended December 31, |
| Product Candidate | | 2013 | | 2012 |
| | | $ | | % | | $ | | % |
| Zoptarelin doxorubicin | | 1,667 |
| | 58.9 |
| | 282 |
| | 12.0 |
|
| MACRILEN™, macimorelin | | 284 |
| | 10.0 |
| | 30 |
| | 1.3 |
|
| Erk/PI3K inhibitors | | 312 |
| | 11.0 |
| | 199 |
| | 8.5 |
|
| Perifosine | | — |
| | — |
| | 1,434 |
| | 61.2 |
|
| Disorazol Z | | 139 |
| | 4.9 |
| | 55 |
| | 2.3 |
|
| Other | | 426 |
| | 15.2 |
| | 345 |
| | 14.7 |
|
| | | 2,828 |
| | 100.0 |
| | 2,345 |
| | 100.0 |
|
The following table summarizes primary third-party R&D costs, by product candidate, incurred by the Company during the years ended December 31, 2013, 2012 and 2011.
|
| | | | | | | | | | | | | | | | | | |
| (in thousands, except percentages) | | Years ended December 31, |
| Product Candidate | | 2013 | | 2012 | | 2011 |
| | | $ | | % | | $ | | % | | $ | | % |
| Zoptarelin doxorubicin | | 4,934 |
| | 49.1 |
| | 2,133 |
| | 24.6 |
| | 1,652 |
| | 16.4 |
|
| MACRILEN™, macimorelin | | 1,238 |
| | 12.3 |
| | 112 |
| | 1.3 |
| | 1,156 |
| | 11.5 |
|
| Erk/PI3K inhibitors | | 1,128 |
| | 11.2 |
| | 1,727 |
| | 19.9 |
| | 1,860 |
| | 18.5 |
|
| Perifosine | | 1,134 |
| | 11.3 |
| | 3,801 |
| | 43.8 |
| | 3,726 |
| | 37.0 |
|
| Disorazol Z | | 659 |
| | 6.6 |
| | 331 |
| | 3.8 |
| | 256 |
| | 2.5 |
|
| Other | | 956 |
| | 9.5 |
| | 575 |
| | 6.6 |
| | 1,427 |
| | 14.1 |
|
| | | 10,049 |
| | 100.0 |
| | 8,679 |
| | 100.0 |
| | 10,077 |
| | 100.0 |
|
Third-party R&D costs were $10.0 million for the year ended December 31, 2013, as compared to $8.7 million for the same period in 2012. This increase mainly results from the higher development costs associated with zoptarelin doxorubicin, and in particular with our Phase 3 ZoptEC trial initiated in 2013 with Ergomed, as discussed above. Additionally, we incurred higher development costs in 2013 related to MACRILEN™ and macimorelin, primarily consisting of the purchase of active pharmaceutical ingredients. These increases were partly offset by the lower comparative development costs associated with perifosine, given that we have decided not to make any further investment in this product candidate, as discussed above, and by the lower preclinical study-related costs associated with our Erk/PI3K inhibitors.
Third-party R&D costs also increased during the year ended December 31, 2013 due to higher expenditures associated with our disorazol Z product candidates, pursuant to a variety of collaboration agreements with various universities and institutes, and to the purchase of active pharmaceutical ingredients.
Excluding the impact of foreign exchange rate fluctuations, we expect net R&D costs for 2014 to increase, as compared to 2013, mainly due to the advancement of our lead ZoptEC Phase 3 trial with zoptarelin doxorubicin and related sub-studies. Based on currently available information and forecasts, we expect that we will incur net R&D costs of between $24 million and $26 million for the year ended December 31, 2014. As discussed below, however, we currently are in the process of performing a strategic review of all of our preclinical activities. This review may result in changes to our future overall R&D activities that may have a significant impact on our results of operations versus the currently available guidance. As such, our net R&D cost estimates may be revised in future periods as we continue to review our R&D activities, advance R&D development and as new information becomes available.
Aeterna Zentaris
2013 Annual MD&A
Selling, general and administrative ("SG&A") expenses were $2.6 million and $12.3 million for the three-month period and the year ended December 31, 2013, respectively, compared to $2.9 million and $10.6 million for the same periods in 2012.
For the year ended December 31, 2013, the increase in SG&A expenses, as compared to 2012, is mainly related to the recognition in the second quarter of 2013 of non-recurring termination benefits (approximately $1.4 million) paid to our former CEO and to the recording of related non-cash share-based compensation costs, amounting to approximately $0.7 million.
We expect SG&A expenses to decrease in 2014 as compared to the year ended December 31, 2013, despite the progressive ramping up of pre-commercialization activities associated with MACRILEN™, which, as discussed below and conditional upon the successful regulatory approval of our NDA, we expect to launch in the evaluation of AGHD indication in the U.S. market in 2015.
Net finance income (costs) is comprised predominantly of the change in fair value of warrant liability, gains and losses due to changes in foreign currency exchange rates and, as pertaining to 2011 only, to gains on a short-term investment. For the three-month period and the year ended December 31, 2013, net finance (costs) income totalled $(2.6) million and $0.2 million, respectively, as compared to nil and $6.6 million for the same periods in 2012, as presented below.
|
| | | | | | | | | | | | | | | |
| | | Three-month periods ended December 31, | | Years ended December 31, |
| (in thousands) | | 2013 | | 2012 | | 2013 | | 2012 | | 2011 |
| | | $ | | $ | | $ | | $ | | $ |
| Finance income | | | | | | | | | | |
| Gains due to changes in foreign currency exchange rates | | — |
| | — |
| | — |
| | — |
| | 2,197 |
|
| Change in fair value of warrant liability | | — |
| | 634 |
| | 1,563 |
| | 6,746 |
| | 2,533 |
|
| Interest income | | 65 |
| | 55 |
| | 185 |
| | 228 |
| | 223 |
|
| Gain on held-for-trading financial instrument | | — |
| | — |
| | — |
| | — |
| | 1,278 |
|
| | | 65 |
| | 689 |
| | 1,748 |
| | 6,974 |
| | 6,231 |
|
| Finance costs | | | | | | | | | | |
| Losses due to changes in foreign currency exchange rates | | (805 | ) | | (700 | ) | | (1,512 | ) | | (382 | ) | | — |
|
| Change in fair value of warrant liability | | (1,884 | ) | | — |
| | — |
| | — |
| | — |
|
| | | (2,689 | ) | | (700 | ) | | (1,512 | ) | | (382 | ) | | — |
|
| | | (2,624 | ) | | (11 | ) | | 236 |
| | 6,592 |
| | 6,231 |
|
The change in fair value of our warrant liability results from the "mark-to-market" revaluation, via the application of the Black-Scholes option pricing model, of currently outstanding share purchase warrants. The Black-Scholes "mark-to-market" warrant valuation most notably has been impacted by the closing price of our common shares, which, on the NASDAQ, has fluctuated from between $1.03 and $3.23 during the year ended December 31, 2013.
Gains or losses due to changes in foreign currency exchange rates are mainly related to the US dollar vis-à-vis the euro, which weakened from 2011 to 2012 and strengthened from 2012 to 2013, as presented below.
|
| | | | | | | | | | |
| | | Three-month periods ended December 31, | | Years ended December 31, |
| | | 2013 | | 2012 | | 2013 | | 2012 | | 2011 |
| Euro to US$ average conversion rate | | 1.3617 | | 1.2975 | | 1.3288 | | 1.2858 | | 1.3919 |
Net loss from continuing operations for the three-month period and the year ended December 31, 2013 was $10.6 million and $27.2 million, or $0.28 and $0.92 per basic and diluted share, respectively, compared to $8.1 million and $23.1 million, or $0.34 and $1.17 per basic and diluted share for the same periods in 2012.
Aeterna Zentaris
2013 Annual MD&A
The increase in net loss from continuing operations for the three-month period ended December 31, 2013, as compared to the same period in 2012, is largely due to higher net finance costs, as presented above.
The increase in net loss from continuing operations for the year ended December 31, 2013, as compared to 2012, is due largely to the recording of non-recurring termination benefits and related non-cash share-based compensation costs, lower comparative net finance income and higher comparative net R&D costs, partially offset by higher comparative license fee revenues, largely associated with the accelerated recognition of remaining net unamortized amount of deferred revenues related to the licensing agreement entered into with Yakult, as discussed above.
2012 compared to 2011
Revenues from Continuing Operations
License fees and other revenues were $1.2 million for the year ended December 31, 2012, as compared to $4.5 million for the year ended December 31, 2011. This decrease is mainly due to the recording of a $2.6 million milestone payment from Yakult with respect to the initiation of a Phase 1 trial with perifosine in CRC in Japan during the last quarter of 2011.
Operating Expenses from Continuing Operations
R&D costs, net of refundable tax credits and grants, were $20.6 million for the year ended December 31, 2012, as compared to $24.2 million for the year ended December 31, 2011. This decrease is attributable to lower R&D employee compensation and benefit costs, as well as to continued cost-rationalization initiatives, resulting in a lower number of employees. The decrease is also related to comparative lower third-party costs associated with the development of MACRILEN™ in AGHD and to the weakening of the euro against the US dollar.
SG&A expenses were $10.6 million for the year ended December 31, 2012, as compared to $12.0 million for the year ended December 31, 2011. The decrease in SG&A expenses is mainly related to non-recurring 2011 events. During the year ended December 31, 2011, we recognized an impairment loss on property, plant and equipment, an increase in onerous lease provision and we incurred marketing expenses related to the potential marketing by the Company of perifosine in Europe. In addition, the decrease in SG&A expenses is attributable to the decrease in employee benefit expenses as well as to the weakening of the euro against the US dollar, partly offset by higher transaction costs related to share purchase warrants, higher share-based compensation costs related to collaborators and higher professional fees.
Income tax expense was nil for the year ended December 31, 2012, as compared to $1.1 million for the year ended December 31, 2011, which consists of foreign withholding taxes related to an upfront payment received from a partner and to milestone license fee revenues recorded in 2011.
Net loss from continuing operations for the year ended December 31, 2012 was $23.1 million, or $1.17 per basic and diluted share, as compared to $26.6 million, or $1.69 per basic and diluted share, for the year ended December 31, 2011. This decrease is largely due to lower net R&D costs, SG&A expenses and income tax expense, as well as to higher net finance income, partly offset by the significant decrease in license fee revenues.
Discontinued Operations
Following a strategic review of our risk and prospects with respect to the Cetrotide® Business and, in particular, having taken into account, as discussed below, the previous monetization of the corresponding royalty stream, we decided to transfer all manufacturing rights of Cetrotide® and to discontinue our involvement with the Cetrotide® Business. On April 3, 2013 (the "Effective Date"), we entered into a transfer and service agreement ("TSA") and concurrent agreements with various partners and licensees with respect to our manufacturing rights for Cetrotide®, currently marketed for therapeutic use as part of in vitro fertilization programs. The principal effect of these agreements was to transfer, effective October 1, 2013 (the "Closing Date"), our manufacturing rights for Cetrotide® to Merck Serono in all territories. Also per the TSA, we agreed to provide certain transition services to Merck Serono over a period of 36 months from the Effective Date in order to assist Merck Serono in managing overall responsibility for the Cetrotide® Business.
Under the TSA, during the period commencing on the Effective Date and ending on the Closing Date (the "Interim Period"), we were obligated to continue to conduct the Cetrotide® Business in the ordinary course in a manner consistent with past practices,
Aeterna Zentaris
2013 Annual MD&A
subject to certain conditions. Per the TSA, we received a non-refundable, one-time payment of €2.5 million (approximately $3.3 million) in consideration for the transfer of our manufacturing rights referred to above, as well as other payments in exchange for the transfer, also on the Closing Date, of certain assets, such as inventory and equipment used solely for the manufacture of Cetrotide®. We recognized the non-refundable, one-time payment on the Closing Date, as we no longer had managerial involvement or effective control over the manufacturing of goods sold through the Cetrotide® Business. We provide the aforementioned transition services to Merck Serono in exchange for a monthly service fee.
As a result of the transfer of substantially all of the risks and rewards associated with the Cetrotide® Business on the Closing Date, the Cetrotide® Business has been classified as a discontinued operation in the consolidated financial statements. As such, relevant amounts in our consolidated statements of comprehensive income (loss) have been retroactively reclassified to reflect the Cetrotide® Business as a discontinued operation, as presented below.
|
| | | | | | | | | | | | | | | |
| | | Three-month periods ended December 31, | | Years ended December 31, |
| (in thousands) | | 2013 | | 2012 | | 2013 | | 2012 | | 2011 |
| | | $ | | $ | | $ | | $ | | $ |
| Revenues | | | | | | | | | | |
| Sales and royalties | | 3,057 |
| | 9,165 |
| | 63,755 |
| | 30,704 |
| | 31,056 |
|
| License fees and other* | | 3,717 |
| | 99 |
| | 4,589 |
| | 908 |
| | 292 |
|
| | | 6,774 |
| | 9,264 |
| | 68,344 |
| | 31,612 |
| | 31,348 |
|
| Operating expenses | | | | | | | | | | |
| Cost of sales | | 3,071 |
| | 7,489 |
| | 30,002 |
| | 26,229 |
| | 27,348 |
|
| Research and development costs, net of tax credits and grants | | — |
| | — |
| | 8 |
| | 12 |
| | 272 |
|
| Selling, general and administrative expenses | | 1,350 |
| | 592 |
| | 4,279 |
| | 2,639 |
| | 4,215 |
|
| | | 4,421 |
| | 8,081 |
| | 34,289 |
| | 28,880 |
| | 31,835 |
|
| Net income (loss) from discontinued operations | | 2,353 |
| | 1,183 |
| | 34,055 |
| | 2,732 |
| | (487 | ) |
_________________________
* Includes the non-refundable, one-time payment made by Merck Serono in exchange for the manufacturing rights for Cetrotide®.
2013 compared to 2012
Revenues from discontinued operations
Sales and royalties related to discontinued operations were comprised both of net sales of Cetrotide® and of royalties, which represented the amortization, under the units-of-revenue method, of the proceeds received pursuant to a transaction with Healthcare Royalty Partners L.P. (formerly Cowen Healthcare Royalty Partners L.P.) ("HRP"), in which we monetized our royalty stream related to Cetrotide®. In this transaction, we had received a payment of $52.5 million, less certain transaction costs, from HRP in exchange for our rights to royalties on future net sales of Cetrotide® generated by Merck Serono.
We had initially recorded the proceeds received from HRP as deferred revenue due to our then significant continuing involvement with the Cetrotide® Business. However, as of the Closing Date, there was no basis to continue amortizing the deferred revenue associated with HRP, primarily due to the fact that we no longer had significant continuing involvement in the Cetrotide® Business. As such, commencing on the Effective Date, we accelerated the amortization of the remaining deferred revenues of approximately $31.9 million over the Interim Period, by continuing to apply the units-of-revenue method, which is consistent with past practice. The remaining deferred revenues were fully amortized through the end of September 2013.
Sales and royalties from discontinued operations were $3.1 million and $63.8 million for the three-month period and year ended December 31, 2013, respectively, as compared to $9.2 million and $30.7 million for the same periods in 2012.
Aeterna Zentaris
2013 Annual MD&A
The decrease in sales and royalties from discontinued operations during the quarter ended December 31, 2013, as compared to the quarter ended December 31, 2012, relates to the lower comparative volume of recurring Cetrotide® sales. Specifically, we recorded no sales of Cetrotide® during the three months ended December 31, 2013, as compared to the corresponding quarter of 2012, given that the transfer of the Cetrotide® Business was effective on October 1, 2013. However, in connection with the transfer of the Cetrotide® Business, we sold Cetrotide®-related inventory (amounting to approximately $3.0 million) to Merck Serono on October 1, 2013. The sale of inventory assets, therefore, partially offset the significant comparative reduction in recurring Cetrotide® product sales.
License fees and other revenues from discontinued operations increased significantly from each of the quarters and years ended December 31, 2012 to the same periods in 2013 primarily due to the recording, on the Closing Date, of the non-refundable, one-time payment made by Merck Serono, as discussed above.
Cost of sales from discontinued operations were $3.1 million and $30.0 million for the three-month period and year ended December 31, 2013, respectively, as compared to $7.5 million and $26.2 million for the same periods in 2012. The decrease in comparative quarterly cost of sales from discontinued operations results from the absence of recurring Cetrotide® product sales in the fourth quarter of 2013 as compared to the same quarter in 2012. On a comparative annual basis, however, total cost of sales from discontinued operations increased in 2013, as compared to 2012, as a result of the higher comparative volume of Cetrotide® product sales, including the sale of inventory assets to Merck Serono, as discussed above.
Additionally, cost of sales as a percentage of sales and royalties increased to approximately 100.5% for the three-month period ended December 31, 2013, as compared to 81.7% for the same period in 2012, mainly due to the absence of royalties recognized after the Cetrotide® Business was transferred.
For the year ended December 31, 2013, cost of sales as a percentage of sales and royalties decreased to approximately 47.1%, as compared to 85.4% for the same period in 2012, predominantly due to the accelerated recognition of royalties as mentioned above.
SG&A expenses from discontinued operations amounted to $1.4 million and $4.3 million for the three-month period and year ended December 31, 2013, respectively, as compared to $0.6 million and $2.6 million for the same periods in 2012. The year-over-year increase is largely attributable to the recording of a provision for certain non-cancellable contracts related to the Cetrotide® Business that were deemed onerous due to the fact that management expects no economic benefits to flow to the Company following the transfer of the Cetrotide® Business on the Closing Date. The provisions for onerous contracts total $1.3 million and represent the present value of estimated unavoidable future royalty and patent costs associated with the intellectual property underlying Cetrotide®.
Net income from discontinued operations was $2.4 million and $34.1 million for the three-month period and year ended December 31, 2013, respectively, as compared to $1.2 million and $2.7 million for the same periods in 2012. The comparative increases reflect the net impact of items discussed above, and in particular, for comparative annual purposes, are influenced in large part by the inclusion of the accelerated recognition of previously deferred remaining HRP-related revenues as discontinued operations.
2012 compared to 2011
Revenues from discontinued operations, which included recurring sales of Cetrotide® and the ongoing amortization of the proceeds received in 2008 from HRP, were $31.6 million for the year ended December 31, 2012 as compared to $31.3 million for the year ended December 31, 2011.
Cost of sales from discontinued operations were $26.2 million for the year ended December 31, 2012 as compared to $27.3 million for the year ended December 31, 2011.
SG&A expenses from discontinued operations were $2.6 million for the year ended December 31, 2012 as compared to $4.2 million for the year ended December 31, 2011. The comparative decrease is attributable in large part to the absence of an impairment loss in 2012 on our Cetrotide® intangible asset, as compared to 2011.
Net income (loss) from discontinued operations was $2.7 million for the year ended December 31, 2012 as compared to $(0.5) million for the same periods in 2011. The comparative increase reflects the net impact of items discussed above.
Aeterna Zentaris
2013 Annual MD&A
Net (loss) income
2013 compared to 2012
Net (loss) income for the three-month period and the year ended December 31, 2013 was $(8.2) million and $6.8 million, or $(0.22) and $0.24 per basic and diluted share, respectively, compared to $(6.9) million and $(20.4) million, or $(0.29) and $(1.03) per basic and diluted share for the same periods in 2012.
The comparative quarter-to-quarter increase in net loss is mainly due to increased finance costs, partially offset by higher net income from discontinued operations and lower operating expenses. The comparative year-over-year decrease in net loss is mainly due to higher net income from discontinued operations and higher revenues, partially compensated by higher operating costs and lower finance income.
2012 compared to 2011
Net loss for the year ended December 31, 2012 was $20.4 million, or $1.03 per basic and diluted share, compared to $27.1 million, or $1.72 per basic and diluted share for the same period in 2011. The decrease in net loss for the year ended December 31, 2012 is explained above.
Quarterly Consolidated Results of Operations Information
|
| | | | | | | | | | | | |
| (in thousands, except for per share data) | | Quarters ended |
| | | December 31, 2013 | | September 30, 2013 | | June 30, 2013 | | March 31, 2013 |
| | | $ | | $ | | $ | | $ |
| Revenues | | — |
| | 17 |
| | 96 |
| | 6,062 |
|
| Loss from operations | | (7,972 | ) | | (8,648 | ) | | (9,693 | ) | | (1,163 | ) |
| Net (loss) income from continuing operations | | (10,596 | ) | | (7,799 | ) | | (9,848 | ) | | 1,003 |
|
| Net (loss) income | | (8,243 | ) | | 3,842 |
| | 9,330 |
| | 1,886 |
|
| Net (loss) income per share from continuing operations (basic and diluted)* | | (0.28 | ) | | (0.26 | ) | | (0.39 | ) | | 0.04 |
|
| Net (loss) income per share (basic and diluted)* | | (0.22 | ) | | 0.13 |
| | 0.37 |
| | 0.07 |
|
|
| | | | | | | | | | | | |
| (in thousands, except for per share data) | | Quarters ended |
| | | December 31, 2012 | | September 30, 2012 | | June 30, 2012 | | March 31, 2012 |
| | | $ | | $ | | $ | | $ |
| Revenues | | 281 |
| | 265 |
| | 402 |
| | 1,105 |
|
| Loss from operations | | (8,119 | ) | | (6,447 | ) | | (7,672 | ) | | (7,498 | ) |
| Net (loss) income from continuing operations | | (8,130 | ) | | (7,321 | ) | | 4,468 |
| | (12,161 | ) |
| Net (loss) income | | (6,947 | ) | | (6,554 | ) | | 4,540 |
| | (11,451 | ) |
| Net (loss) income per share from continuing operations (basic and diluted)* | | (0.34 | ) | | (0.39 | ) | | 0.24 |
| | (0.69 | ) |
| Net (loss) income per share (basic and diluted)* | | (0.29 | ) | | (0.35 | ) | | 0.25 |
| | (0.65 | ) |
_________________________
| |
| * | Net (loss) income per share is based on the weighted average number of shares outstanding during each reporting period, which may differ on a quarter-to-quarter basis. As such, the sum of the quarterly net (loss) income per share amounts may not equal year-to-date net (loss) income per share. |
Historical quarterly results of operations and net (loss) income cannot be taken as reflective of recurring expenditure patterns or predictable trends.
In the last eight quarters, net (loss) income has been impacted by revenues from continuing operations, which have been non-recurring and have been derived predominantly from licensing initiatives, by the comparative level of net R&D costs in
Aeterna Zentaris
2013 Annual MD&A
connection with the development and termination of our previous perifosine Phase 3 programs, by the increased development of zoptarelin doxorubicin, including the initiation in 2013 of a Phase 3 ZoptEC trial and by the development of MACRILEN™ and of certain earlier stage compounds, as well as by the net income (loss) from discontinued operations, related to the transfer of the Cetrotide® Business mentioned above.
Quarterly net (loss) income was also impacted by the recognition of termination benefits granted to our former CEO and to the related non-cash share-based compensation costs in the second quarter of 2013, as well as by foreign exchange gains or losses and changes in fair value of our warrant liability.
Consolidated Statement of Financial Position Information
|
| | | | | | |
| | | As at December 31, |
| (in thousands) | | 2013 | | 2012 |
| | | $ | | $ |
| Cash and cash equivalents | | 43,202 |
| | 39,521 |
|
| Trade and other receivables and other current assets | | 2,453 |
| | 13,780 |
|
| Restricted cash | | 865 |
| | 826 |
|
| Property, plant and equipment | | 1,351 |
| | 2,147 |
|
| Other non-current assets | | 11,325 |
| | 11,391 |
|
| Total assets | | 59,196 |
| | 67,665 |
|
| Payables and other current liabilities | | 7,242 |
| | 10,470 |
|
| Current portion of deferred revenues | | — |
| | 5,235 |
|
| Warrant liability (current and non-current portions) | | 18,010 |
| | 6,176 |
|
| Non-financial non-current liabilities* | | 16,880 |
| | 52,479 |
|
| Total liabilities | | 42,132 |
| | 74,360 |
|
| Shareholders' equity (deficiency) | | 17,064 |
| | (6,695 | ) |
| Total liabilities and shareholders' equity (deficiency) | | 59,196 |
| | 67,665 |
|
_________________________
* Comprised mainly of non-current portion of deferred revenues, employee future benefits and provisions.
The increase in cash and cash equivalents as at December 31, 2013, as compared to December 31, 2012, is due to the receipt of net proceeds of $20.8 million pursuant to registered direct and public offerings and $2.9 million in drawdowns made under our May 2013 ATM Program, the receipt of the non-refundable, one-time payment after the Closing Date of the transactions involving the discontinuation of the Cetrotide® Business, variations in components of our working capital and the relative strengthening, as at December 31, 2013, of the euro against the US dollar, as compared to December 31, 2012, partially offset by recurring disbursements.
The decrease in trade and other receivables and other current assets as at December 31, 2013, as compared to December 31, 2012, is mainly due to lower trade accounts receivable, inventory and prepaid expenses as a result of the transfer of the Cetrotide® Business, partly offset by the relative strengthening, as at December 31, 2013, of the euro against the US dollar, as compared to December 31, 2012.
The decrease in payables and other current liabilities as at December 31, 2013, as compared to December 31, 2012, is mainly due to lower trade accounts payable, lower accrued Cetrotide® services and deliveries and lower accrued R&D costs, partly offset by the relative strengthening, as at December 31, 2013, of the euro against the US dollar, as compared to December 31, 2012.
The decrease in current portion of deferred revenues as at December 31, 2013, as compared to December 31, 2012, is predominantly due to the change in the timing in the amortization of deferred revenues, as mentioned above.
Aeterna Zentaris
2013 Annual MD&A
Our warrant liability increased from December 31, 2012 to December 31, 2013 predominantly due to the issuance of 15.7 million additional share purchase warrants in connection with the registered direct and public offerings mentioned above. The increase was partly offset by net fair value gains, recorded pursuant to the periodic "mark-to-market" revaluation of the underlying outstanding share purchase warrants.
The decrease in non-financial non-current liabilities as at December 31, 2013, as compared to December 31, 2012, is mainly due to a decrease in deferred revenues, resulting predominantly from the amortization of upfront payments received from our partners in connection with Cetrotide® and perifosine, as mentioned above, and to the decrease of $1.8 million in our pension-related employee benefit obligation (due predominantly to the recording of an actuarial gain). These decreases were partly offset by the recognition of a provision for onerous contracts of $1.3 million, as mentioned above, and by the relative strengthening, as at December 31, 2013, of the euro against the US dollar, as compared to December 31, 2012.
The significant increase in shareholders' equity from December 31, 2012 to December 31, 2013 is mainly attributable to the decrease in our deficit due to the recording of net income, to the increase in share capital following the issuance of common shares pursuant to the aforementioned registered direct and public offerings and May 2013 ATM Program drawdowns, to the decrease in accumulated other comprehensive loss due to foreign currency translation gains and to the increase in other capital due to the recording of share-based compensation costs.
Financial Liabilities, Obligations and Commitments
We have certain contractual lease obligation commitments as well as other long-term obligations related to unfunded benefit pension plans and unfunded post-employment benefit plans. The following tables summarize future cash requirements with respect to these obligations.
Future minimum lease payments and future minimum sublease payments expected to be received under non-cancellable operating leases (subleases), as well as future payments in connection with utility service agreements are as follows:
|
| | | | | | | | | |
| | | As at December 31, 2013 |
| (in thousands) | | Minimum lease payments | | Minimum sublease payments | | Utilities |
| | | $ | | $ | | $ |
| Less than 1 year | | 1,795 |
| | (226 | ) | | 640 |
|
| 1 – 3 years | | 2,562 |
| | (451 | ) | | 559 |
|
| 4 – 5 years | | 515 |
| | (244 | ) | | — |
|
| More than 5 years | | — |
| | — |
| | — |
|
| Total | | 4,872 |
| | (921 | ) | | 1,199 |
|
In accordance with the assumptions used in our employee future benefits obligation calculation as at December 31, 2013, undiscounted benefits expected to be paid are as follows:
|
| | | |
| | | As at December 31, |
| (in thousands) | | 2013 |
| | | $ |
| Less than 1 year | | 531 |
|
| 1 – 3 years | | 1,177 |
|
| 4 – 5 years | | 1,259 |
|
| More than 5 years | | 26,654 |
|
| Total | | 29,621 |
|
Aeterna Zentaris
2013 Annual MD&A
Outstanding Share Data
As at March 20, 2014, we had 56,513,969 common shares issued and outstanding, as well as 2,546,740 stock options outstanding. Warrants outstanding as at March 20, 2014 represented a total of 28,907,410 equivalent common shares.
Capital Disclosures
Our objective in managing capital, consisting of shareholders' equity (deficiency), with cash and cash equivalents and restricted cash equivalents being its primary components, is to ensure sufficient liquidity to fund R&D activities, selling, general and administrative expenses, working capital and capital expenditures.
In the past, we have had access to liquidity through non-dilutive sources, including investment tax credits and grants, interest income, licensing and related services and royalties. More recently, we have increasingly raised capital via public equity offerings and drawdowns under various ATM sales programs.
Our capital management objective remains the same as that in previous periods. The policy on dividends is to retain cash to keep funds available to finance the activities required to advance our product development portfolio.
We are not subject to any capital requirements imposed by any regulators or by any other external source.
Liquidity, Cash Flows and Capital Resources
Our operations and capital expenditures have been financed through certain transactions impacting our cash flows from operating activities, public equity offerings, as well as from the drawdowns under various ATM programs, as discussed above.
Our cash and cash equivalents amounted to $43.2 million as at December 31, 2013, as compared to $39.5 million as at December 31, 2012. As at December 31, 2013, we had cash and cash equivalents amounting to $9.3 million that were denominated in euros.
Based on our assessment, which took into account current cash levels, as well as our strategic plan and corresponding budgets and forecasts, we believe that we have sufficient liquidity and financial resources to fund planned expenditures and other working capital needs for at least, but not limited to, the 12-month period following the statement of financial position date of December 31, 2013.
We may endeavour to secure additional financing, as required, through strategic alliance arrangements or through other activities, as well as via the issuance of new share capital.
Aeterna Zentaris
2013 Annual MD&A
The variations in our liquidity by activity are explained below.
|
| | | | | | | | | | | | | | | |
| (in thousands) | | Three-month periods ended December 31, | | Years ended December 31, |
| | | 2013 | | 2012 | | 2013 | | 2012 | | 2011 |
| | | $ | | $ | | $ | | $ | | $ |
| Cash and cash equivalents - Beginning of period | | 24,829 |
| | 33,202 |
| | 39,521 |
| | 46,881 |
| | 31,998 |
|
| Cash flows from operating activities: | | | | | | | | | | |
| Cash used in operating activities from continuing operations | | (6,184 | ) | | (6,481 | ) | | (30,131 | ) | | (25,681 | ) | | (22,454 | ) |
| Cash provided by (used in) operating activities from discontinued operations | | 9,622 |
| | (2,282 | ) | | 10,147 |
| | (5,134 | ) | | (3,789 | ) |
| | | 3,438 |
| | (8,763 | ) | | (19,984 | ) | | (30,815 | ) | | (26,243 | ) |
| Cash flows from financing activities: | | | | | | | | | | |
| Net proceeds from issuance of common shares and warrants | | 14,795 |
| | 15,097 |
| | 23,708 |
| | 23,619 |
| | 36,250 |
|
| Net proceeds from the exercise of share purchase warrants and other | | — |
| | — |
| | — |
| | 589 |
| | 2,306 |
|
| | | 14,795 |
| | 15,097 |
| | 23,708 |
| | 24,208 |
| | 38,556 |
|
| | | | | | | | | | | |
| Cash flows from investing activities: | | | | | | | | | | |
| Net cash (used in) provided by investing activities from continuing operations | | (21 | ) | | (113 | ) | | (85 | ) | | (272 | ) | | 2,463 |
|
| Net cash provided by investing activities from discontinued operations | | 113 |
| | — |
| | 113 |
| | — |
| | — |
|
| | | 92 |
| | (113 | ) | | 28 |
| | (272 | ) | | 2,463 |
|
| | | | | | | | | | | |
| Effect of exchange rate changes on cash and cash equivalents | | 48 |
| | 98 |
| | (71 | ) | | (481 | ) | | 107 |
|
| Cash and cash equivalents - End of period | | 43,202 |
| | 39,521 |
| | 43,202 |
| | 39,521 |
| | 46,881 |
|
Operating Activities
2013 compared to 2012
Cash flows provided by (used in) operating activities were $3.4 million and $(20.0) million for the three-month period and the year ended December 31, 2013, respectively, compared to $(8.8) million and $(30.8) million for the same periods in 2012. The significant decreases in cash flows used in operating activities are mainly due to the cash provided by operating activities from discontinued operations as a result of the changes in operating assets and liabilities and to the receipt, during the fourth quarter of 2013, of the non-refundable, one-time payment received from Merck Serono pursuant to the transfer of the Cetrotide® Business, as discussed above.
The year-over-year decrease in cash flows used in operating activities is partly offset by the increase in cash used in operating activities from continuing operations, which is explained by the comparable increase in R&D and SG&A expenditures, mainly related to the zoptarelin doxorubicin and MACRILEN™ projects, as well as by lower cash flows provided by license fee revenues.
We expect net cash used in operating activities to range from $33 million to $35 million for the year ended December 31, 2014, as we continue to invest in zoptarelin doxorubicin, our ZoptEC Phase 3 program and related sub-studies, as well as the pre-launch activities related to MACRILEN™ in AGHD in the U.S. market. This estimate may vary significantly in future periods, most notably as a result of the strategic review of our R&D activities, as discussed further below.
Aeterna Zentaris
2013 Annual MD&A
2012 compared to 2011
Cash flows used in operating activities totalled $30.8 million for the year ended December 31, 2012, as compared to $26.2 million for the year ended December 31, 2011. Operating cash flows for the year ended December 31, 2011 included the receipt of a non-recurring $8.4 million upfront payment made by Yakult in connection with our development, commercialization and licensing agreement for the rights related to perifosine in Japan. The increase in cash used in operating activities during 2012 was partially offset by a lower loss from operations for the year ended December 31, 2012.
Financing Activities
2012 compared to 2011
Cash flows provided by financing activities were $24.2 million for the year ended December 31, 2012, as compared to $38.6 million for the year ended December 31, 2011. The year-over-year decrease is primarily due to lower proceeds from the issuance of common shares and warrants, which resulted in the receipt of net cash proceeds of $23.6 million in 2012, as compared to $36.3 million for the same period in 2011, and to lower proceeds received on the exercise of share purchase warrants.
Investing Activities
2012 compared to 2011
Cash flows (used in) provided by investing activities totalled $(0.3) million for the year ended December 31, 2012, as compared to $2.5 million for the year ended December 31, 2011. This decrease is due to the absence, in 2012, of cash proceeds received on the sale of short-term investments, partly offset by lower cash disbursements made in connection with the purchases of laboratory and other equipment used in ongoing R&D activities.
Critical Accounting Policies, Estimates and Judgments
Our consolidated financial statements as at December 31, 2013 and December 31, 2012 and for the years ended December 31, 2013, 2012 and 2011 have been prepared in accordance with IFRS as issued by the IASB.
The preparation of consolidated financial statements in accordance with IFRS requires management to make judgments, estimates and assumptions that affect the reported amounts of our assets, liabilities, revenues, expenses and related disclosures. Judgments, estimates and assumptions are based on historical experience, expectations, current trends and other factors that management believes to be relevant at the time at which our consolidated financial statements are prepared.
Management reviews, on a regular basis, the Company's accounting policies, assumptions, estimates and judgments in order to ensure that the consolidated financial statements are presented fairly and in accordance with IFRS. Revisions to accounting estimates are recognized in the period in which the estimates are revised and in any future periods affected.
A summary of those critical accounting estimates and assumptions, as well as critical judgments used in applying accounting policies in the preparation of our consolidated financial statements, can be found in note 3 to our consolidated financial statements as at December 31, 2013 and December 31, 2012 and for the years ended December 31, 2013, 2012 and 2011.
Recent Accounting Pronouncements
Adopted in 2013
The following new standards and amendments to standards are effective for the first time for interim periods beginning on or after January 1, 2013 and have been applied in preparing these consolidated financial statements. The accounting policies have been applied consistently by all subsidiaries of the Company.
IFRS 10, Consolidated Financial Statements ("IFRS 10"), which builds on existing principles by identifying the concept of control as the determining factor in whether an entity should be included within the consolidated financial statements of a parent company. IFRS 10 also provides additional guidance to assist in the determination of control where this is difficult to assess.
Aeterna Zentaris
2013 Annual MD&A
IFRS 11, Joint Arrangements ("IFRS 11"), which enhances accounting for joint arrangements, particularly by focusing on the rights and obligations of the arrangement, rather than the arrangement's legal form. IFRS 11 also addresses inconsistencies in the reporting of joint arrangements by requiring a single method to account for interests in jointly controlled entities and prohibits proportionate consolidation.
IFRS 12, Disclosure of Interests in Other Entities, which is a comprehensive standard on disclosure requirements for all forms of interests in other entities, including joint arrangements, associates, special purpose vehicles and other off-balance sheet vehicles.
IFRS 13, Fair Value Measurement ("IFRS 13"), which defines fair value, sets out in a single IFRS a framework for measuring fair value and requires disclosures about fair value measurements. IFRS 13 does not determine when an asset, a liability or an entity's own equity instrument is measured at fair value. Rather, the measurement and disclosure requirements of IFRS 13 apply when another IFRS requires or permits the item to be measured at fair value (with limited exceptions).
In June 2011, the IASB issued an amended version of IAS 19, Employee Benefits, including the elimination of the option to defer the recognition of actuarial gains and losses (known as the "corridor method"), the streamlining of the presentation of changes in assets and liabilities arising from defined benefit plans and the enhancement of the disclosure requirements for defined benefit plans, including additional information about the characteristics of defined benefit plans and the risks to which entities are exposed through participation in those plans.
In December 2011, the IASB issued an amended version of IFRS 7, Financial Instruments: Disclosure ("IFRS 7"), including the requirement to disclose information that enables users of an entity's financial statements to evaluate the effect, or potential effect, of offsetting financial assets and financial liabilities, to the entity's financial position.
The impact of the adoption of these standards and amendments did not have a significant impact on the Company's consolidated financial statements.
Not yet adopted
On May 29, 2013, the IASB made amendments to the disclosure requirements of IAS 36, Impairment of Assets ("IAS 36"), requiring disclosure, in certain instances, of the recoverable amount of an asset or cash generating unit, and the basis for the determination of fair value less costs of disposal, when an impairment loss is recognized or when an impairment loss is subsequently reversed. The amendments to IAS 36 are effective for annual periods beginning on or after January 1, 2014 and will be applied prospectively. The Company does not expect that these amendments will have a significant impact on the Company's consolidated financial statements.
In May 2013, the IFRS Interpretations Committee ("IFRIC") issued International Financial Reporting Standard Interpretation 21, Levies ("IFRIC 21"), an interpretation on the accounting for levies imposed by governments. IFRIC 21 is an interpretation of IAS 37, Provisions, Contingent Liabilities and Contingent Assets ("IAS 37"). IAS 37 sets out criteria for the recognition of a liability, one of which is the requirement for the entity to have a present obligation as a result of a past event (known as an obligating event). IFRIC 21 clarifies that the obligating event that gives rise to a liability to pay a levy is the activity described in the relevant legislation that triggers the payment of the levy. IFRIC 21 is effective for annual periods beginning on or after January 1, 2014 and is to be applied on a retrospective basis. The Company does not expect that IFRIC 21 will have a significant impact on the Company's consolidated financial statements.
In November 2009 and October 2010, the IASB issued IFRS 9, Financial Instruments ("IFRS 9"), which represents the completion of the first part of a three-part project to replace IAS 39, Financial Instruments: Recognition and Measurement. Under the new standard, an entity choosing to measure a liability at fair value will present the portion of the change in its fair value due to changes in the entity's own credit risk in the other comprehensive income or loss section of the entity's statement of comprehensive income (loss), rather than within profit or loss in the case where the fair value option is taken for financial liabilities. Additionally, IFRS 7, which is effective on adoption of IFRS 9, was amended to include revised guidance related to the derecognition of financial instruments. The Company is currently assessing the impact, if any, that IFRS 9 will have on the Company's consolidated financial statements.
Aeterna Zentaris
2013 Annual MD&A
Outlook for 2014
MACRILEN™
Throughout the remainder of 2014, we expect to advance the pre-launch activities related to the initial commercialization of MACRILEN™ for the evaluation of AGHD in the U.S. market. As noted above, our NDA is currently under substantive review by the FDA. Subject to the successful review and acceptance of our NDA, we expect to make MACRILEN™ available by prescription in the U.S. as soon as commercially practicable following final regulatory approval.
There are approximately 36,000 AGHD tests performed annually in the U.S. Based on published information from the U.S. Centers for Disease Control and Prevention and by Navigant Research, we estimate that the total potential U.S. market for AGHD evaluation is approximately 158,000 tests per year, including the evaluation of patients who have suffered traumatic brain injury ("TBI"). Research published in the British Journal of Neurosurgery (2007) and in the Frontiers in Endocrinology (2011) estimates that approximately 19% of hospitalized patients suffering from severe and moderate cases of TBI will develop growth hormone deficiency.
We intend to build a commercial infrastructure necessary to access the physicians who perform the majority of AGHD tests (endocrinologists) along with the major centers of AGHD influence. Commercial initiatives are likely to include the targeted selection, hiring and deployment of a contracted sales force by the end of 2014. The targeted marketing efforts of our sales force will reach endocrinology specialists of AGHD. We believe these efforts will enable the realization of a substantial portion of the potential commercial opportunity for MACRILEN™.
We are evaluating the possible final distribution channels for MACRILEN™, however, we expect that MACRILEN™ will be accessed through a mixture of specialty pharmacies, hospital pharmacies, wholesalers and other secondary channels.
To date, we have established an agreement with a contract manufacturer for the commercial supply of the product and expect to use a third-party logistics provider for key services related to logistics, warehousing and inventory management.
We will continue to evaluate the potential to commercialize MACRILEN™ in other geographic territories, including Canada and Europe.
Zoptarelin doxorubicin
We expect to complete initiation of clinical sites (over 100) for our Phase 3 ZoptEC study with Ergomed. Our goal is to secure a first interim (futility) analysis for the Phase 3 ZoptEC study during the first half of 2015 by reaching anticipated patient enrollment.
We also expect to disclose results of the Phase 2 investigator-driven study in castration- and taxane-resistant prostate cancer, for which the investigator of this study was awarded a grant from the National Institutes of Health.
Business development
With our focus to become a growth-oriented, specialty biopharmaceutical company, and in addition to our commitment to developing key product candidates in our existing pipeline, we expect to continue to evaluate potential in-licensing and/or acquisition opportunities, as well as co-promotional arrangements related to targeted commercial products.
Expectations for revenues, operating expenditures and cash flows
Revenues from continuing operations are expected to significantly decrease in 2014, as compared to 2013, mainly as a result of the transfer of the Cetrotide® Business and as all deferred revenues have been recognized in 2013.
Our main focus for R&D efforts will be on our later-stage compound, zoptarelin doxorubicin and its Phase 3 ZoptEC study, as discussed above, where we anticipate substantial investment to fund ongoing development initiatives. For earlier-stage initiatives and product candidates, we expect to recover certain R&D costs through grants, R&D credits or other collaboration agreements. As noted above, however, we currently are in the process of performing a review of all of our preclinical activities in order to streamline our operations, reduce our operating cash burn and more appropriately align our financial resources with our longer-term strategic goals. This review may result in changes to our future overall R&D activities and cost profile that may have a significant impact on our results of operations versus currently available information and forecasts, which estimates net
Aeterna Zentaris
2013 Annual MD&A
R&D costs at between $24 million and $26 million for the year ended December 31, 2014. As such, our net R&D cost estimates may be revised in future periods as we continue to review our R&D activities, advance R&D development and as new information becomes available.
Our SG&A expenses are expected to decrease in 2014, as compared to 2013, despite the ramping up of pre-commercialization efforts related to the expected launch of MACRILEN™ in the U.S. The overall decrease largely reflects the decrease in termination benefits, which in 2013 were paid to our former CEO, as discussed above.
We expect that our overall operating burn in 2014 will range from $33 million to $35 million as we continue to fund operating activities and working capital requirements, excluding the impact of any decisions associated with the overall review of our R&D activities and of any foreign exchange impacts. Our Board of Directors and management team are committed to optimizing our use of operating cash flows, and while we cannot provide any definitive conclusions or address the timeline and potential results of the aforementioned strategic review, we continue to work diligently in order to reach a successful outcome.
Financial Risk Factors and Other Instruments
Fair value risk
The change in our warrant liability, which is measured at fair value through profit or loss, results from the periodic "mark-to-market" revaluation, via the application of the Black-Scholes option pricing model, of currently outstanding share purchase warrants. The Black-Scholes valuation is impacted, among other inputs, by the market price of our common shares. As a result, the change in fair value of the warrant liability, which is reported as finance income (costs) in our consolidated statements of comprehensive income (loss), has been and may continue in future periods to be materially affected by changes in our common share closing price, which has ranged from $1.03 to $3.23 on the NASDAQ during the year ended December 31, 2013.
If variations in the market price of our common shares of -10% and +10% were to occur, the impact on our net income (loss) for the warrant liability held at December 31, 2013 would be as follows:
|
| | | | | | | | | |
| (in thousands) | | Carrying
amount | | -10% | | +10% |
| | | $ | | $ | | $ |
| Warrant liability | | 18,010 |
| | 2,205 |
| | (2,172 | ) |
| Total impact on net income – increase / (decrease) | | | | 2,205 |
| | (2,172 | ) |
Foreign currency risk
Since we operate internationally, we are exposed to currency risks as a result of potential exchange rate fluctuations related to non-intragroup transactions. In particular, fluctuations in the U.S. dollar exchange rates against the euro could have a significant impact on our results of operations.
If foreign exchange rate variations of -5% (depreciation of the EUR) and +5% (appreciation of the EUR) against the US$, from period-end rates of EUR1 = US$1.3779 were to occur, the impact on our net (loss) income for each category of financial instruments held at December 31, 2013 would be as follows:
|
| | | | | | | | | |
| | | | | Balances denominated in US$ |
| (in thousands) | | Carrying
amount | | -5% | | +5% |
| | | $ | | $ | | $ |
| Cash and cash equivalents | | 27,452 |
| | 1,373 |
| | (1,373 | ) |
| Warrant liability | | 18,010 |
| | (901 | ) | | 900 |
|
| Total impact on net income – increase / (decrease) | | | | 472 |
| | (473 | ) |
Aeterna Zentaris
2013 Annual MD&A
Liquidity risk
Liquidity risk is the risk that we will not be able to meet our financial obligations as they become due. We manage this risk through the management of our capital structure and by continuously monitoring actual and projected cash flows. The Board of Directors reviews and approves our operating and capital budgets, as well as any material transactions out of the ordinary course of business. We have adopted an investment policy in respect of the safety and preservation of our capital to ensure our liquidity needs are met. The instruments are selected with regard to the expected timing of expenditures and prevailing interest rates.
We believe that we have sufficient funds to pay our ongoing general and administrative expenses, to pursue our R&D activities and to meet our liabilities, obligations and existing commitments as they fall due for the ensuing twelve months. In assessing whether the going concern assumption is appropriate, we take into account all available information about the future, which is at least, but not limited to, twelve months from the end of the reporting period. We expect to continue to incur operating losses and may require significant capital to fulfill our future obligations. Our ability to continue future operations beyond December 31, 2014 and to fund our activities is dependent on our ability to secure additional financings which may be completed in a number of ways including but not limited to licensing arrangements, partnerships, share and other equity issuances and other financing activities. We will pursue such additional sources of financing when required, and while we have been successful in securing financing in the past, there can be no assurance we will be able to do so in the future or that these sources of funding or initiatives will be available for the Company or that they will be available on terms which are acceptable to us.
Credit risk
Credit risk is the risk of an unexpected loss if a customer or counterparty to a financial instrument fails to meet its contractual obligations. We regularly monitor credit risk exposure and take steps to mitigate the likelihood of this exposure resulting in losses. Our exposure to credit risk currently relates to cash and cash equivalents, to trade and other receivables and to restricted cash. We invest our available cash in amounts that are readily convertible to known amounts of cash and deposit our cash balances with financial institutions that are rated the equivalent of "Baa1" and above. This information is supplied by independent rating agencies where available and, if not available, we use publicly available financial information to ensure that we invest our cash in creditworthy and reputable financial institutions.
As at December 31, 2013, trade accounts receivable for an amount of approximately $1.7 million were with one customer.
As at December 31, 2013, no trade accounts receivable were past due or impaired.
Generally, we do not require collateral or other security from customers for trade accounts receivable; however, credit is extended following an evaluation of creditworthiness. In addition, we perform ongoing credit reviews of all our customers and establish an allowance for doubtful accounts when accounts are determined to be uncollectible.
The maximum exposure to credit risk approximates the amount recognized on the statement of financial position.
Related Party Transactions and Off-Balance Sheet Arrangements
In addition to payments made to members of our key management team, during the year ended December 31, 2013, we paid $76,800 in professional fees to one of the members of the Company's Board of Directors for special tasks mandated by our Nominating, Corporate Governance and Compensation Committee.
As at December 31, 2013, we did not have any interests in special purpose entities or any other off-balance sheet arrangements.
Aeterna Zentaris
2013 Annual MD&A
Risk Factors and Uncertainties
Risks Associated with Operations
| |
| ▪ | Many of our products are currently at an early development stage. It is impossible to ensure that the R&D activities related to these products will result in the creation of profitable operations. |
| |
| ▪ | We are currently developing our product candidates based on R&D activities, preclinical testing and clinical trials conducted to date, and we may not be successful in developing or introducing to the market these or any other new products or technology. If we fail to develop and deploy new products successfully and on a timely basis, we may become non-competitive and unable to recover the R&D and other expenses we incur to develop and test new products. Additionally, if we are unable to successfully complete our clinical trial programs, or if such clinical trials take longer to complete than we project, our ability to execute our current business strategy will be adversely affected. |
| |
| ▪ | Even if our products are approved for commercialization, they may not be successful in the marketplace. Market acceptance of any of our products will depend on a number of factors including, but not limited to: demonstration of clinical efficacy and safety; the prevalence and severity of any adverse side effects; limitations or warnings contained in the product's approved labeling; availability of alternative treatments for the indications we target; the advantages and disadvantages of our products relative to current or alternative treatments; the availability of acceptable pricing and adequate third-party reimbursement; and the effectiveness of marketing and distribution methods for the products. If our products do not gain market acceptance among physicians, patients, healthcare payers and others in the medical community, who may not accept or utilize our products, our ability to generate significant revenues from our products would be limited and our financial condition could be materially adversely affected. In addition, if we fail to further penetrate our core markets and existing geographic markets or successfully expand our business into new markets, the growth in sales of our products, along with our operating results, could be negatively impacted. |
| |
| ▪ | We rely heavily on our proprietary information in developing and manufacturing our products and product candidates. Despite efforts to protect our proprietary rights from unauthorized use or disclosure, third parties may attempt to disclose, obtain or use our proprietary information or technologies. If we are unable to protect the confidentiality of our proprietary information and know-how, the value of our technology and products could be adversely affected. |
| |
| ▪ | If we are unable to establish sales and marketing capabilities or enter into agreements with third parties to market and sell our product candidates, we may not be successful in commercializing MACRILEN™ or any other product candidate if and when they are approved. To achieve commercial success for any approved product, including, in the near and medium term, MACRILEN™, we must either develop a sales and marketing organization or outsource these functions to third parties. We currently plan to establish our own sales and marketing capabilities and promote MACRILEN™ with a targeted sales force if and when this product is ultimately approved. There are risks involved with establishing our own sales and marketing capabilities and entering into arrangements with third parties to perform these services. If we do not establish sales and marketing capabilities successfully, either on our own or in collaboration with third parties, we will not be successful in commercializing our product candidates and our business, financial condition and results of operations will be materially adversely affected. |
| |
| ▪ | We are currently dependent on certain strategic partners and may enter into future collaborations for the research and development of our product candidates. Our arrangements with these strategic partners may not provide us with the benefits we expect and may expose us to a number of risks. We are dependent on, and rely upon, strategic partners to perform various functions related to our business, including, but not limited to, the research and development of some of our product candidates. Our reliance on these relationships poses a number of risks. We may not realize the contemplated benefits of such agreements nor can we be certain that any of these parties will fulfill their obligations in a manner which maximizes our revenue. These arrangements may also require us to transfer certain material rights or issue our equity, voting or other securities to corporate partners, licensees and others. Any license or sublicense of our commercial rights may reduce our product revenue. |
| |
| ▪ | We will rely on third parties to manufacture and supply marketed products. We also have or may have certain supply obligations vis-à-vis our existing and potential licensing partners, who are or will be responsible for the marketing of the products. To be successful, our products have to be manufactured in commercial quantities in compliance with quality controls and regulatory requirements. Even though it is our objective to minimize such risk by introducing alternative |
Aeterna Zentaris
2013 Annual MD&A
suppliers to ensure a constant supply at all times, we cannot guarantee that we will not experience supply shortfalls and, in such event, we may not be able to perform our obligations under contracts with our partners.
| |
| ▪ | We have incurred substantial expenses in our efforts to develop products. Consequently, we have incurred recurrent operating losses, and our operating losses have adversely impacted, and will continue to adversely impact, our working capital, total assets and shareholders' equity (deficiency). We do not expect to reach operating profitability in the immediate future, and our operating expenses are likely to continue to represent a significant component of our overall cost profile as we continue our R&D and clinical study programs and seek regulatory approval for our product candidates. Even if we succeed in developing, acquiring or in-licensing new commercial products, we could incur additional operating losses for at least the next several years. If we do not ultimately generate sufficient revenue from commercialized products and achieve or maintain operating profitability, an investment in our company could result in a significant or total loss. |
| |
| ▪ | Future acquisitions or in-licensed products may not be successfully integrated. The failure to successfully integrate the personnel and operations of businesses that we may acquire or of products that we may in-license in the future with our existing operations, business and products could have a material adverse effect on our operations and results. |
Risks Related to Our Financial Condition and Capital Requirements
| |
| ▪ | We may require significant additional financing, and we may not have access to sufficient capital. We may require additional capital to pursue planned clinical trials, regulatory approvals, as well as further R&D and marketing efforts for our product candidates and potential products. We may attempt to raise additional funds through public or private financings, collaborations with other pharmaceutical companies or from other sources. Additional funding may not be available on terms which are acceptable to us. If adequate funding is not available to us on reasonable terms, we may need to delay, reduce or eliminate one or more of our product development programs or obtain funds on terms less favorable than we would otherwise accept. To the extent that additional capital is raised through the sale of equity securities or securities convertible into or exchangeable for equity securities, the issuance of those securities could result in dilution to our shareholders. Moreover, the incurrence of debt financing could result in a substantial portion of our future cash flows being dedicated to the payment of principal and interest on such indebtedness and could impose restrictions on our operations, and could render us more vulnerable to competitive pressures and economic downturns. |
| |
| ▪ | We have not entered into any forward currency contracts or other financial derivatives to hedge foreign exchange risk, and therefore, we are subject to foreign currency transaction and translation gains and losses. Foreign exchange risk is managed primarily by satisfying foreign denominated expenditures with cash flows or assets denominated in the same currency. However, with companies operating in foreign, non-euro zone countries, we are more exposed to foreign currency risk. Additionally, given that we have significant balances held in US dollars, fluctuations in the US dollar exchange rate against the euro could have a potentially significant impact on our results of operations and on our available liquidity. |
Risks Associated with Regulatory Matters
| |
| ▪ | We will only receive regulatory approval for a product candidate if we can demonstrate in carefully designed and conducted clinical trials that the product candidate is both safe and effective. None of our current product candidates have to date received regulatory approval for their intended commercial sale. In general, significant R&D and clinical studies are required to demonstrate the safety and efficacy of our product candidates before we can submit regulatory applications. Preclinical testing and clinical development are long, expensive and uncertain processes. Though we may engage a contract research organization with experience in conducting regulatory trials, errors in the conduct, monitoring and/or auditing could invalidate the results from a regulatory perspective. Even if a product candidate is approved by the FDA, the Canadian Therapeutic Products Directorate or any other regulatory authority, we may not obtain approval for an indication whose market is large enough to recover our investment in that product candidate. In addition, there can be no assurance that we will ever obtain all or any required regulatory approvals for any of our product candidates. |
| |
| ▪ | We have limited experience in filing an NDA, or similar application for approval in the U.S. or in any country for our current product candidates, which may result in a delay in, or the rejection of, our filing of an NDA or similar application. During the drug development process, regulatory agencies will typically ask questions of drug sponsors. While we endeavor to answer all such questions in a timely fashion, or in the NDA filing, some questions may not be answered by the time we file our NDA. Unless the FDA waives the requirement to answer any such unanswered questions, submission of an NDA may be delayed and acceptance of an NDA may ultimately be rejected. |
Aeterna Zentaris
2013 Annual MD&A
Risks Related to Our Organizational Structure and Key Personnel
| |
| ▪ | Aeterna Zentaris Inc. is a holding company, and a substantial portion of our assets is the share capital of our subsidiaries. Because Aeterna Zentaris Inc. is a holding company, our obligations to our creditors are structurally subordinated to all existing and future liabilities of our subsidiaries. Our rights and the rights of our creditors to participate in any distribution of the assets of any subsidiary in the event that such a subsidiary were to be liquidated or reorganized or in the event of any bankruptcy or insolvency proceeding relating to or involving such a subsidiary, and therefore the rights of the holders of our common shares to participate in those assets, are subject to the prior claims of such subsidiary's creditors. To the extent that we may be a creditor with recognized claims against any such subsidiary, our claims would still be subject to the prior claims of our subsidiary's creditors to the extent that they are secured or senior to those held by us. Accordingly, in the event of any foreclosure, dissolution, winding-up, liquidation or reorganization, or a bankruptcy or insolvency proceeding relating to us or our property, or any subsidiary, there can be no assurance as to the value, if any, that would be available to holders of our common shares. |
| |
| ▪ | Our success is also dependent upon our ability to attract and retain a highly qualified work force and to establish and maintain close relations with research centers. The competition in that regard is quite significant. Our success is dependent to a great degree on our senior officers, scientific personnel and consultants. The failure to recruit qualified staff and the loss of key employees could compromise the pace and success of product development. |
Risks Related to Our Listing on the NASDAQ and the TSX
| |
| ▪ | There can be no assurance that our common shares will remain listed on the NASDAQ. If we fail to meet any of the NASDAQ's continued listing requirements, our common shares may be delisted. Any delisting of our common shares may adversely affect a shareholder's ability to dispose, or obtain quotations as to the market value, of such shares. |
| |
| ▪ | The market price of our common shares is subject to potentially significant fluctuations due to numerous developments directly affecting our business and by developments out of our control or unrelated to us. The stock market generally, and the biopharmaceutical sector in particular, are vulnerable to abrupt changes in investor sentiment. Prices of shares and trading volume of companies in the biopharmaceutical industry can fluctuate dramatically in ways unrelated to, or in ways that bear a disproportionate relationship to, operating performance. Our share price and trading volume may fluctuate based on a number of factors including, but not limited to: clinical and regulatory developments regarding our product candidates; delays in our anticipated development or commercialization timelines; developments regarding current or future third-party collaborators; other announcements by us regarding technological, product development or other matters; arrivals or departures of key personnel; governmental or regulatory action affecting our product candidates and our competitors' products in the U.S., Canada and other countries; developments or disputes concerning patent or proprietary rights; actual or anticipated fluctuations in our revenues or expenses; general market conditions and fluctuations for the emerging growth and biopharmaceutical market sectors; and economic conditions in the U.S., Canada or abroad. |
| |
| ▪ | Our listing on both the NASDAQ and the TSX may increase price volatility due to various factors, including different ability to buy or sell our common shares, different market conditions in different capital markets and different trading volumes. In addition, low trading volume may increase the price volatility of our common shares. A thin trading market could cause the price of our common shares to fluctuate significantly more than the stock market as a whole. |
A more comprehensive list of the risks and uncertainties affecting us can be found in our most recent Annual Report on Form 20-F filed with the Canadian Securities Regulatory Authorities in lieu of an annual information form at www.sedar.com and with the United States Securities and Exchange Commission at www.sec.gov, and investors are urged to consult such risk factors.
Disclosure Controls and Procedures
Under the supervision and with the participation of our management, including the Chief Executive Officer and Chief Financial Officer, we have evaluated the effectiveness of our disclosure controls and procedures as at December 31, 2013. Based on that evaluation, the Chief Executive Officer and Chief Financial Officer have concluded that these disclosure controls and procedures were effective as at December 31, 2013.
Aeterna Zentaris
2013 Annual MD&A
Management's Annual Report on Internal Control over Financial Reporting
The management of Aeterna Zentaris is responsible for establishing and maintaining adequate internal control over financial reporting. Our internal control over financial reporting is a process designed to provide reasonable assurance regarding the reliability of financial reporting and the preparation of financial statements for external purposes in accordance with IFRS as issued by the IASB.
Our internal control over financial reporting includes those policies and procedures that: (i) pertain to the maintenance of records that, in reasonable detail, accurately and fairly reflect the transactions and dispositions of the assets of Aeterna Zentaris; (ii) provide reasonable assurance that transactions are recorded as necessary to permit preparation of financial statements in accordance with IFRS, and that receipts and expenditures of the Company are being made only in accordance with authorizations of Company management; and (iii) provide reasonable assurance regarding prevention or timely detection of unauthorized acquisition, use or disposition of Company assets that could have a material effect on the financial statements.
Because of its inherent limitations, internal control over financial reporting may not prevent or detect misstatements. Also, projections of any evaluation of effectiveness to future periods are subject to the risk that controls may become inadequate because of changes in conditions, or that the degree of compliance with the policies or procedures may deteriorate.
Management conducted an evaluation of the effectiveness of our internal control over financial reporting based on the criteria established in Internal Control - Integrated Framework: 1992 issued by the Committee of Sponsoring Organizations of the Treadway Commission ("COSO"). Based on this evaluation, management has concluded that our internal control over financial reporting was effective as at December 31, 2013.
Changes in Internal Controls over Financial Reporting
There have been no changes in our internal control over financial reporting during the year ended December 31, 2013 that have materially affected, or are reasonably likely to materially affect, our internal control over financial reporting. However, in May 2013, the COSO released an updated Internal Control - Integrated Framework: 2013. The Company currently uses the COSO 1992 original framework and will transition to the updated framework during the transition period which extends to December 15, 2014, after which the 1992 framework will be superseded. Management is currently assessing the impact of this transition and will report any significant changes to the Company's internal controls over financial reporting that may result therefrom.
The design of any system of controls and procedures is based in part upon certain assumptions about the likelihood of certain events. There can be no assurance that any design will succeed in achieving its stated goals under all potential future conditions, including conditions that are remote.
On behalf of management,
/s/ Dennis Turpin
Dennis Turpin, CPA, CA
Senior Vice President and Chief Financial Officer
March 20, 2014