Exhibit 99.3
HYDRO ONE INC.
MANAGEMENT’S DISCUSSION AND ANALYSIS
For the years ended December 31, 2013 and 2012
The following Management’s Discussion and Analysis (MD&A) of the financial condition and results of operations should be read together with the consolidated financial statements and accompanying notes (the Consolidated Financial Statements) of Hydro One Inc. (the Company) for the year ended December 31, 2013. The Consolidated Financial Statements are presented in Canadian dollars and have been prepared in accordance with United States (US) Generally Accepted Accounting Principles (GAAP). All financial information in this MD&A is presented in Canadian dollars, unless otherwise indicated.
The Company has prepared this MD&A with reference to National Instrument 51-102 – Continuous Disclosure Obligations of the Canadian Securities Administrators. Under the US/Canada Multijurisdictional Disclosure System, the Company is permitted to prepare this MD&A in accordance with the disclosure requirements of Canada, which are different from those of the US. This MD&A provides information for the year ended December 31, 2013.
EXECUTIVE SUMMARY
We are wholly owned by the Province of Ontario (Province), and our transmission and distribution businesses are regulated by the Ontario Energy Board (OEB). Our mission and vision reflects the unique role we play in the economy of the Province and as a provider of critical infrastructure to all our customers. We strive to be an innovative and trusted company, delivering electricity safely, reliably and efficiently to create value for our customers. We operate as a commercial enterprise with an independent Board of Directors. Our strategic plan is driven by our values: health and safety; excellence; stewardship; and innovation. Safety is of utmost importance to us because we work in an environment that can be hazardous. We take our responsibility as stewards of critical provincial assets seriously. We demonstrate sound stewardship by managing our assets in a manner that is commercial, transparent and which values our customers. We strive for excellence by being trained, prepared and equipped to deliver high-quality service. We value innovation because it allows us to increase our productivity and develop enhanced methods to meet the needs of our customers. In 2013, we continued to focus on our core businesses and our commitment to our customers, and made important contributions to the rebuilding of Ontario’s core infrastructure while continuing to meet the requirements of the Green Energy Act (GEA).
We manage our business using the following framework:

Core Business and Strategy
Our corporate strategy is based on our mission and vision and our values. Our strategic objectives, which are discussed in the section “Our Strategy,” encompass the core values that drive our business. Our strategy touches every part of our core business: health and safety; our customers; innovation; the reliability and efficiency of our systems; the environment; our workforce; shareholder value; and productivity.
Key Performance Drivers
Performance drivers have been identified that relate to achieving certain of our company’s strategic objectives. We establish specific performance targets for each driver aimed at measuring the achievement of our strategic objectives over time. For example, we track the duration of unplanned customer interruptions per delivery point as an indication of our commitment to provide a reliable transmission system for our customers. We measure transmission and distribution unit costs as an indication of our commitment to increasing productivity. These and other key performance drivers are included in the discussion of our performance measures in the section “Performance Measures and Targets.”
1
HYDRO ONE INC.
MANAGEMENT’S DISCUSSION AND ANALYSIS (continued)
For the years ended December 31, 2013 and 2012
Capability to Deliver Results
We continue to use a balanced scorecard approach as we strive to manage our performance and deliver results each and every year. In 2013, we set nine stretch targets and we met or exceeded five of them. In 2012, we also met or exceeded five of nine stretch targets. We met our target for minimizing the duration of unplanned customer interruptions within our Distribution Business. We also met our targets of satisfying our transmission and distribution customers with the service they receive from our company. Our targets, and our 2013 performance relating to these targets, are discussed in the section “Performance Measures and Targets.” Our ability to deliver results in each of our strategic areas is limited by risks inherent in our regulatory environment, our business, our workforce, and in the economic environment. These risks, as well as our strategies to mitigate them, are discussed in the section “Risk Management and Risk Factors.”
Results and Outlook
During 2013, our financial fundamentals remained strong with net income of $803 million. In 2013, we issued $1,185 million of long-term debt, the proceeds of which were used to fund the retirement of $600 million of long-term debt, and to fund a portion of our capital expenditures and other corporate requirements. A full discussion of our results of operations and financing activities can be found in the sections “Annual Results of Operations” and “Liquidity and Capital Resources.”
In 2013, we made capital investments totaling $1,394 million to improve our transmission and distribution systems’ reliability and performance, address our aging power system infrastructure, facilitate new generation, and improve service to our customers. Capital investments for the next few years will include expenditures required to build critical infrastructure identified in the Long-Term Energy Plan (LTEP), which is based on recommendations from the Ontario Power Authority (OPA), and expenditures to address our aging power system infrastructure. Our future capital expenditures are more fully described in the section “Future Capital Investments.”
OVERVIEW
Our Businesses
Our company has three reportable segments:
| • | Our Transmission Business, which comprises the core business of providing electricity transportation and connection services, is responsible for transmitting electricity throughout the Ontario electricity grid; |
| • | Our Distribution Business, which comprises the core business of delivering and selling electricity to customers; and |
| • | Other, the operations of which primarily consist of those of our telecommunications business. |
Transmission
| Our Transmission Business includes the transmission business of our subsidiary Hydro One Networks, which owns and operates substantially all of Ontario’s electricity transmission system. Our transmission system forms an integrated transmission grid that is monitored, controlled and managed centrally from our Ontario Grid Control Centre. Our system operates over relatively long distances and links major sources of generation to transmission stations and larger area load centres. In 2013, we earned total transmission revenues of $1,529 million, primarily by transmitting approximately 140.7 TWh of electricity, directly or indirectly, to substantially all consumers of electricity in Ontario. Our transmission system is one of the largest in North America, and it is linked to five adjoining jurisdictions through 26 interconnections, through which we can accommodate electricity imports of up to 6,510 MW in the summer and 6,390 MW in the winter, and electricity exports of up to 6,070 MW in the summer and 6,270 MW in the winter. In terms of assets, our Transmission Business is our largest business segment, representing approximately 55% of our total assets at December 31, 2013. | 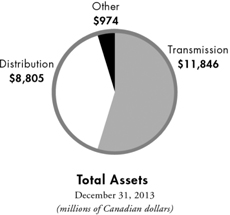 |
2
HYDRO ONE INC.
MANAGEMENT’S DISCUSSION AND ANALYSIS (continued)
For the years ended December 31, 2013 and 2012
Distribution
 | Our consolidated Distribution Business includes the distribution business of our subsidiary Hydro One Networks, as well as our subsidiaries Hydro One Brampton Networks Inc. (Hydro One Brampton Networks) and Hydro One Remote Communities Inc. (Hydro One Remote Communities). Our consolidated distribution system is the largest in Ontario and spans roughly 75% of the province. We serve approximately 1.4 million rural and urban customers. Hydro One Remote Communities operates small, regulated generation and distribution systems in a number of remote communities across northern Ontario that are not connected to Ontario’s electricity grid. In 2013, we earned total distribution revenues of $4,484 million, and over half of our distribution revenues were earned from our residential customers. At December 31, 2013, our Distribution Business assets represented approximately 41% of our total assets. |
Other
Our Other business segment primarily represents the operations of our subsidiary, Hydro One Telecom Inc. (Hydro One Telecom), which markets fibre-optic capacity to telecommunications carriers and commercial customers with broadband network requirements, including a dedicated optical network providing secure, high-capacity connectivity across numerous health care locations in Ontario. In 2013, our Other business segment contributed revenues of $61 million, and had assets of $974 million at December 31, 2013, representing 4% of our total assets.
Our Strategy
Our corporate strategy builds on our strong commitment to the Province and is shaped by our values. It lays out a set of objectives to position our company to achieve our mission and vision, which is to be an innovative and trusted company delivering electricity safely, reliably and efficiently to create value for our customers. Our values represent our core beliefs.
| • | Health and safety: Nothing is more important than the health and safety of our employees, those who work on our property, and the public. |
| • | Excellence: We achieve excellence through continuous training, ensuring we are prepared and equipped to deliver high-quality and affordable service, with integrity. |
| • | Stewardship: We invest in our assets and people to build a safe, environmentally sustainable electricity network in a commercial manner. |
| • | Innovation: We innovate through new processes, people and technology to allow us to find better ways to meet the needs of our customers. |
We have eight strategic objectives that are inextricably linked. They drive the fulfillment of our mission and vision and ensure we remain focused on achieving our corporate goal of providing safe, reliable and affordable service to our customers, today and tomorrow, while increasing enterprise value for our shareholder.
| • | Creating an injury-free workplace and maintaining public safety. Health and safety must be integrated into all that we do as we continue to reinforce that nothing is more important than the health and safety of our employees. We will continue to create a passion for preventing injury, staying safe and keeping each other safe. We will invest in building a culture of accountability to continue our drive to zero injuries in the workplace. In addition, we will continue to strengthen our already strong safety culture through our Journey to Zero initiative and our successful certification to the Occupational Health and Safety Assessment Series (OHSAS) 18001 standard. |
| • | Satisfying our customers. We exist to serve our customers, and serving our customers means reducing costs, improving customer service and meeting their expectations regarding reliable power supply. We will continue to |
3
HYDRO ONE INC.
MANAGEMENT’S DISCUSSION AND ANALYSIS (continued)
For the years ended December 31, 2013 and 2012
focus our efforts to improve our relationship with customers and to improve our customers’ satisfaction with us. We will meet our commitments, make customers our focus in all planning discussions, communicate effectively, coordinate across our company, and maximize opportunities to improve our corporate image and every customer interaction. We will develop and deliver targeted customer segment strategies, products and delivery channels that will respond to their unique needs. |
| • | Continuous innovation. Innovation represents one of our values and is critical to achieving our mission and vision. We have been using innovation and technology to build the foundation of our company as the utility of the future. Over the next two decades, we will continue to build on that foundation to improve the reliability and efficiency of our transmission and distribution systems and provide our customers with more capability to manage their power costs. The development of the Advanced Distribution System (ADS) is a key element in our investment in innovation, as are the investments we have made, through our Cornerstone project, in next generation business tools to enable us to implement leading industry practices and increase productivity. |
| • | Building and maintaining reliable, affordable transmission and distribution systems. Our transmission strategy is to provide a robust and reliable provincial grid that accommodates Ontario’s emerging generation profile, manages an aging asset base and meets demand requirements through prudent expansion and effective maintenance. Our distribution strategy is focused on continuing to meet the challenge of providing reliable, affordable service to our customers in a wide range of geographical regions and climate zones; incorporating ADS technology to provide greater visibility; and increased control and improved customer service. We will meet customer expectations regarding reliability, in part through our investment planning process, which starts with the identification of asset and customer needs. |
| • | Protecting and sustaining the environment for future generations. Consistent with our value of stewardship, we play a central role in reducing Ontario’s carbon footprint through the delivery of clean and renewable energy and through measures that allow our customers to manage and reduce their energy use. |
| • | Championing people and culture. We believe our primary strength is the capability of our people. In order to sustain this advantage, we will continue to address the issues of corporate culture, labour demographics, diversity, development of critical core competencies, and skill and knowledge retention. We will continue to develop a culture of accountability and trust as a key component to fostering employee engagement. Our labour strategy is to consolidate and clarify our collective agreements, increase flexibility and reduce costs, and maintain a progressive relationship with our unions. |
| • | Maintaining a commercial culture that increases value for our shareholder. For the delivery component of a customer bill, we are committed to maintaining total annual bill impacts for an average residential customer at or below the rate of inflation, and delivering income and dividends to our shareholder. We will pursue growth opportunities through local distribution company (LDC) consolidation to increase the enterprise value of our company by leveraging our existing assets, technologies, capabilities, unparalleled experience in LDC acquisitions and our distribution and transmission footprint. |
| • | Achieving productivity improvements and cost-effectiveness. To achieve our mission and vision, we must constantly strive for productivity through efficiency and effective management of costs. Productivity is key to meeting our other strategic objectives and, in particular, to achieving value for our customers and our shareholder. |
Performance Measures and Targets
We target and measure our performance by using a balanced scorecard approach. Key performance drivers are closely monitored throughout the year to ensure that we maintain a focus on our strategic objectives and take mitigating actions as required. In 2013, we met or exceeded five of nine stretch targets. Overall, we are making progress towards achieving many of our strategic goals.
Achieving productivity improvements and cost-effectiveness
One of our strategic objectives is to increase productivity through efficiency improvements and effective management of costs. The measures for this objective for 2013 were transmission unit cost and distribution unit cost. For transmission unit cost, we measured the capital expenditures and operation, maintenance and administration costs per dollar of gross in-service assets (expressed as a percentage). For distribution unit cost, the measure is capital expenditures and operation, maintenance and administration costs per kilometre of line ($’000/km) due to the
4
HYDRO ONE INC.
MANAGEMENT’S DISCUSSION AND ANALYSIS (continued)
For the years ended December 31, 2013 and 2012
length of line required to connect our rural customers. Our objective with our ongoing work and investment program is to maintain and improve our assets and monitor our productivity year-over-year. Our transmission unit cost target was set at 9.8%, and we met this target. The distribution unit cost target was set at $9,800 per kilometre of line. We did not meet this target.
Building and maintaining reliable, cost-effective transmission and distribution systems
We continue to build and retain public confidence and trust in our operations, as stewards of Ontario’s electricity grid. In 2013, we continued our focus on this strategic priority by investing in the key assets of the electricity delivery system and by operating the existing system for customers in a safe, reliable and efficient fashion. We are conscious that commercial customers of all sizes require reliable service to allow them to deliver their products and services and that customers’ expectations are for a reasonably limited duration when interruptions occur. Transmission and distribution reliability is measured through the duration of customer interruptions.
For the duration of unplanned customer interruptions within our transmission business, the target for 2013 was 9 minutes per delivery point. We did not meet this target.
For the duration of unplanned customer interruptions within our distribution business, the target for 2013 was set at 6.7 hours per customer. While we did not meet this target, our Board of Directors noted that the impact of storms in January and February of 2013 would require our company to change work practices and alter resource levels to simply meet the target and that the cost to do so would be prohibitive and not in the best interests of the ratepayer. Considering the storm impacts and the positive results over the balance of the year, our Board of Directors, in the exercise of its discretion, determined that this target was met.
Satisfying our customers
Customer satisfaction measures the degree to which our transmission and distribution customers are satisfied with the service they receive from our company. Customer satisfaction is based on the results of customer surveys conducted on our behalf by independent third parties. In 2013, for transmission customers we targeted a customer satisfaction rate of 82%. The survey was given to three major groups of transmission customers. Our Board of Directors determined that there was significant improvement in two of the three groups which comprise the survey members and accordingly, in the exercise of its discretion, considered this target met. For our distribution customers, we targeted a satisfaction rate of 86%, and we met this target.
Employee engagement
We continue to focus efforts on increasing employee engagement throughout the Company. An engaged workforce is one in which employees embrace the corporate values of safety, stewardship, excellence and innovation. The employee engagement survey is administered by an independent third party expert. Our goal is to improve the grand mean score year-over-year. The target of improving the grand mean score to 4.06 (out of 5) in 2013 was not met.
Maintaining a commercial culture that increases value for our shareholder
Achievement of strong financial performance is measured by a performance measure of targeted level of net income after tax. Our 2013 target was $702 million net income after tax, and we exceeded our target.
Creating an injury-free workplace and maintaining public safety
The safety of our employees is paramount. In 2013, we used medical attentions, defined as injuries that require treatment by a medical practitioner (beyond first aid), as the performance measure for this strategic objective. The medical attentions measure reflects incidents that are reported to the Workplace Safety Insurance Board and is calculated as the number of attentions per 200,000 hours worked. In 2013, we set a target of no higher than 1.9 attentions per 200,000 hours worked. We did not meet this target.
5
HYDRO ONE INC.
MANAGEMENT’S DISCUSSION AND ANALYSIS (continued)
For the years ended December 31, 2013 and 2012
REGULATION
Our electricity transmission and distribution businesses are licensed and regulated by the OEB. Our transmission revenues primarily include our transmission tariff, which is based on the province-wide Uniform Transmission Rates (UTRs) approved by the OEB for all transmitters across Ontario. Our distribution revenues primarily include our distribution tariff, which is also based on OEB-approved rates, and the recovery of the cost of purchased power used by our customers. Transmission and distribution tariff rates are set based on an approved revenue requirement that provides for cost recovery and a return on deemed common equity. In addition, the OEB approves rate riders to allow for the recovery or disposition of specific regulatory accounts over specified timeframes.
The OEB approved the use of US GAAP for rate setting and regulatory accounting and reporting by Hydro One Networks’ Transmission and Distribution Businesses, as well as by Hydro One Remote Communities, beginning with the year 2012. Hydro One Brampton Networks currently uses Canadian GAAP for its distribution rate-setting purposes.
Renewed Regulatory Framework
In December 2010, the OEB initiated a coordinated consultation process for the development of a Renewed Regulatory Framework for Electricity. In October 2012, the OEB issued its reportA Renewed Regulatory Framework for Electricity Distributors: A Performance Based Approach. The report identified three rate-setting models available to provide choices suitable for distributors having varying capital requirements: a fourth generation Incentive Regulation Mechanism (IRM); a custom rate setting; and an Annual Incentive Rate-setting Index method. The report also provided information on performance measurement, continuous improvement and implementation of the new framework.
In late 2013, the OEB issued itsReport of the Board on Rate-Setting Parameters and Benchmarking under the Renewed Regulatory Framework for Ontario’s Electricity Distributors. This report sets out the OEB’s policies and approaches to the rate adjustment parameters for incentive rate setting for electricity distributors and the benchmarking of electricity distributor total cost performance. It also includes the OEB’s determination on rate adjustment parameter values for 2014 incentive rate setting, which were used to adjust Hydro One Networks’ 2014 distribution rates.
Electricity Rates
Under the current market structure, low-volume and designated consumers pay electricity rates established through the Regulated Price Plan (RPP) and wholesale electricity consumers pay a blend of regulated, contract and wholesale spot market prices. The OEB sets prices for RPP customers based on both a two-tiered electricity pricing structure, with seasonal consumption thresholds, and a three-tiered electricity pricing structure with Time of Use (TOU) thresholds. Substantially all of our RPP customers are now on TOU billing. We received an exemption from the OEB, effective until December 31, 2014, from implementing mandatory TOU pricing for approximately 122,000 customers that are currently out of reach of our smart meter telecommunications infrastructure. Unexpected shortfalls or overpayments associated with the RPP are temporarily financed by the OPA. RPP prices are reviewed by the OEB every six months and may change based on an updated OEB forecast and any accumulated differences between the amount that customers paid for electricity and the amount paid to generators in the previous period.
Customers who are not eligible for the RPP and wholesale customers pay the market price for electricity, adjusted for the difference between market prices and prices paid to generators by the Independent Electricity System Operator (IESO) under theElectricity Act, 1998. The IESO is responsible for overseeing and operating the wholesale market, as well as ensuring the reliability of the integrated power system. The following is a summary of the RPP for the reporting and comparative periods:
RPP | Tier Threshold (kWh/month) | Tier Rates (cents/kWh) | ||||||||||||||
Effective Date | Residential | Non-Residential | Lower Tier | Upper Tier | ||||||||||||
November 1, 2011 | 1,000 | 750 | 7.1 | 8.3 | ||||||||||||
May 1, 2012 | 600 | 750 | 7.5 | 8.8 | ||||||||||||
November 1, 2012 | 1,000 | 750 | 7.4 | 8.7 | ||||||||||||
May 1, 2013 | 600 | 750 | 7.8 | 9.1 | ||||||||||||
November 1, 2013 | 1,000 | 750 | 8.3 | 9.7 | ||||||||||||
6
HYDRO ONE INC.
MANAGEMENT’S DISCUSSION AND ANALYSIS (continued)
For the years ended December 31, 2013 and 2012
RPP TOU | Rates (cents/kWh) | |||||||||||
Effective Date | On Peak | Mid Peak | Off Peak | |||||||||
November 1, 2011 | 10.8 | 9.2 | 6.2 | |||||||||
May 1, 2012 | 11.7 | 10.0 | 6.5 | |||||||||
November 1, 2012 | 11.8 | 9.9 | 6.3 | |||||||||
May 1, 2013 | 12.4 | 10.4 | 6.7 | |||||||||
November 1, 2013 | 12.9 | 10.9 | 7.2 | |||||||||
Transmission Rates
In May 2010, we filed a cost-of-service application with the OEB for 2011 and 2012 transmission rates, seeking the approval of revenue requirements of approximately $1,446 million for 2011 and $1,547 million for 2012. In December 2010, the OEB approved revenue requirements of $1,346 million for 2011 and $1,658 million for 2012. The approved 2012 revenue requirement was higher than that applied for, reflecting OEB direction for our company to adopt a cost capitalization policy based on modified IFRS. This adjustment was subsequently reversed when the OEB approved the use of US GAAP for transmission rate-setting purposes beginning January 1, 2012. Consequently, the OEB approved a revenue requirement of $1,418 million for 2012, along with new 2012 UTRs, with an effective date of January 1, 2012. The new rates resulted in an approximate 8% transmission rate increase, or 0.6% when considering total bill impact, for a typical residential customer consuming 800 kWh per month. The adoption of US GAAP in lieu of modified IFRS as a basis for rate setting decreased the approved rates by approximately 15%.
In May 2012, we filed a cost-of-service application with the OEB for our 2013 and 2014 transmission rates. The application sought OEB approval for revenue requirement increases of approximately 0.6% in 2013 and 9.1% in 2014, or estimated increases of 0% in 2013 and 0.7% in 2014 on an average customer’s total bill. In November 2012, we submitted a draft Rate Order, which included revenue requirements of approximately $1,438 million and $1,528 million for 2013 and 2014, respectively. For the transmission portion of the bill, this represents no change from existing 2012 OEB-approved rate levels in 2013 and a 5.8% increase in 2014. For a typical residential customer consuming 800 kWh per month, this represents increases of nil for 2013 and 0.5% for 2014. In December 2012, the OEB approved the 2013 and 2014 transmission revenue requirements of $1,438 million and $1,528 million, respectively, and the 2013 Ontario UTRs, which remained unchanged at the 2012 levels.
On December 6, 2013, we submitted a draft Rate Order for our 2014 transmission rates. The 2014 revenue requirement has been increased to $1,535 million from the originally-approved revenue requirement of $1,528 million, primarily due to changes in the cost of capital parameters for 2014 released by the OEB in November 2013. On January 9, 2014, the OEB approved the draft Rate Order for 2014 transmission rates as filed. For the transmission portion of a customer’s bill, this represents an increase of 6.3% in 2014, or 0.5% when considering total bill impact, for a typical residential customer consuming 800 kWh per month.
Distribution Rates
As a distributor, we are responsible for delivering electricity and billing our customers for our approved distribution rates, purchased power costs and other approved regulatory charges. Substantially all of our purchased power costs and other approved regulatory charges are settled through the IESO, which facilitates payments to other parties, such as generators, the Ontario Electricity Financial Corporation (OEFC), and itself.
| • | Hydro One Networks |
Hydro One Networks elected to retain the same distribution rates for 2012 as approved by the OEB for 2011, with a revenue requirement of $1,218 million.
In June 2012, Hydro One Networks filed an IRM rate application with the OEB for 2013 distribution rates, to be effective January 1, 2013. In December 2012, the OEB issued a final Rate Order, which resulted in an increase in distribution rates of approximately 1.3% in 2013, or 0.4% when considering total bill impact, for a typical residential customer consuming 800 kWh per month.
On April 26, 2013, Hydro One Networks filed an IRM rate application with the OEB for 2014 distribution rates, to be effective January 1, 2014. On September 26, 2013, the OEB issued a partial decision, approving a rate rider to
7
HYDRO ONE INC.
MANAGEMENT’S DISCUSSION AND ANALYSIS (continued)
For the years ended December 31, 2013 and 2012
recover a 2014 revenue requirement of $29.3 million for operation, maintenance and administration expenses and in-service capital costs of the ADS Project, which will modernize our distribution system. On December 5, 2013, the OEB issued its final decision, which resulted in an increase of distribution rates of approximately 2.4% in 2014, or 0.85% when considering total bill impact, for a typical residential customer consuming 800 kWh per month.
On December 19, 2013, Hydro One Networks filed a 2015-2019 distribution custom rate application with the OEB, for rates effective January 1 of each test year. This application is a five-year custom rate application which is being submitted under the OEB’s Renewed Regulatory Framework for Electricity Distributors. It has been customized to fit Hydro One Networks’ specific circumstances, which necessitate significant multi-year investments. The submitted evidence includes the overall business plan, revenue requirements, and rate information necessary to support the issuance of a notice by the OEB. We are seeking OEB approvals for revenue requirements of $1,411 million for 2015, $1,515 million for 2016, $1,571 million for 2017, $1,615 million for 2018, and $1,666 million for 2019. If the application is approved as filed, the resulting change to the distribution portion of the average customer bill will be approximately a 1.3% decrease in 2015, 4.2% increase in 2016, 2.6% increase in 2017, 1.9% increase in 2018, and 2.9% increase in 2019, for a typical residential customer consuming 800 kWh per month. When considering total bill impact, the resulting change will be approximately a 1.1% decrease in 2015, 1.5% increase in 2016, 0.9% increase in 2017, 0.7% increase in 2018, and 1.1% increase in 2019.
| • | Hydro One Brampton Networks |
In September 2011, Hydro One Brampton Networks filed an IRM application with the OEB for 2012 distribution rates, with an effective date of January 1, 2012. In January 2012, the OEB released a decision that resulted in a reduction in distribution rates of approximately 13.2% for 2012, or a 1.7% reduction on the average customer’s total bill, for a typical residential customer consuming 800 kWh per month. These rate reductions were primarily due to OEB-approved adjustments to depreciation rates.
In August 2012, Hydro One Brampton Networks filed an IRM application with the OEB for 2013 distribution rates, to be effective January 1, 2013. In December 2012, the OEB released a decision that resulted in an increase in distribution rates of approximately 0.3% for 2013, or less than 0.1% on the average customer’s total bill, for a typical residential customer consuming 800 kWh per month.
In August 2013, Hydro One Brampton Networks filed an IRM application with the OEB for 2014 distribution rates, to be effective January 1, 2014. On December 5, 2013, the OEB released a decision that resulted in a reduction in distribution rates of approximately 2.5% for 2014, or a 0.5% reduction on the average customer’s total bill, for a typical residential customer consuming 800 kWh per month.
| • | Hydro One Remote Communities |
In November 2011, Hydro One Remote Communities filed an IRM application with the OEB for 2012 distribution rates. In March 2012, the OEB approved an increase of approximately 1.08% to basic rates for the distribution and generation of electricity, with an effective date of May 1, 2012, representing an increase of approximately $1 on the average residential customer’s total bill.
In September 2012, Hydro One Remote Communities filed a cost-of-service application with the OEB for 2013 distribution rates, seeking approval for a 2013 revenue requirement of $53 million. In August 2013, the OEB issued a final decision approving a revenue requirement of $51 million and rate increase of approximately 3.45%, with an effective date of May 1, 2013.
In October 2013, Hydro One Remote Communities filed an IRM application with the OEB for 2014 distribution rates, seeking approval for a rate increase of approximately 0.48%, to be effective May 1, 2014.
Recent Industry Developments
Long-Term Energy Plan
In 2010, the Ministry of Energy released Ontario’s LTEP, which set out the province’s expected electricity needs until 2030 and supported the continued procurement of new, cleaner generation. The 2010 LTEP addressed seven key areas: demand, supply, conservation, transmission, Aboriginal communities, capital investments, and electricity prices.
8
HYDRO ONE INC.
MANAGEMENT’S DISCUSSION AND ANALYSIS (continued)
For the years ended December 31, 2013 and 2012
On December 2, 2013, the Province released its updated LTEP, which sets out the Province’s plan of action for the energy sector, including strategies for mitigating increases in electricity rates; increased renewable energy procurement; nuclear refurbishment; enhanced regional planning with respect to energy infrastructure; transmission enhancements; encouraging Aboriginal participation in energy development, transmission and conservation projects; and the expansion of natural gas infrastructure. The plans are guided by the goal of balancing five core principles: cost-effectiveness, reliability, clean energy, community engagement, and conservation and demand management (CDM). Pursuant to the updated LTEP, the Province “will encourage Ontario Power Generation Inc. (OPG) and Hydro One to explore new business lines and opportunities inside and outside Ontario. These opportunities will help leverage existing areas of expertise and grow revenues for the benefit of Ontarians.” We will continue to work with the Province to develop business plans and efficiency targets that will reduce costs and result in significant ratepayer savings.
In November 2013, the Minister issued a directive to the OEB, which in turn issued a decision and order on January 9, 2014, to amend the transmission licence of Hydro One Networks to develop and seek approval for the Northwest Bulk Transmission Line Project, an expansion or reinforcement of the transmission system in the area west of Thunder Bay. The scope and timing of the Northwest Bulk Transmission Line Project shall be in accordance with the recommendations of the OPA.
Distribution Sector Consolidation
In April 2012, the Province announced it was launching a comprehensive review of Ontario’s electricity sector to explore options to improve efficiencies, including LDC consolidation. As a result, the Province created the Ontario Distribution Sector Review Panel (Panel). In December 2012, the Panel released its report, “Renewing Ontario’s Electricity Distribution Sector: Putting the Consumer First” with recommendations for electricity sector consolidation. This report recommended that the 73 LDCs, comprising the focus of the report, be consolidated into eight to 12 larger regional electricity distributors within a two-year timeframe. Specifically, it recommended there be two regional distributors in northern Ontario and between six and ten regional distributors in southern Ontario with a minimum of 400,000 customers each. Given our company’s position as the largest LDC, the report recommended that Hydro One Networks be given unambiguous direction to lead and engage in the discussion of the merger of distribution assets with the appropriate interested utilities on a commercial basis. The minister of Energy subsequently indicated he was supportive of voluntary consolidation and expects all LDCs to pursue innovative partnerships and transformative initiatives that will result in electricity ratepayer savings.
On April 2, 2013, we reached an agreement with Norfolk County to acquire the outstanding shares of Norfolk Power Inc. (Norfolk Power) for $93 million, subject to final closing adjustments. We will pay Norfolk County approximately $66 million net after assuming Norfolk Power’s existing debt of approximately $27 million. Norfolk Power is a holding company that owns Norfolk Power Distribution Inc., a local distribution company, and Norfolk Energy Inc., a non-rate regulated energy services company. The selection of our company as successful bidder followed a comprehensive competitive sales process initiated by Norfolk Power. The acquisition is pending a regulatory decision from the OEB, which is anticipated in 2014.
We will continue to pursue growth opportunities through LDC consolidation by leveraging our existing assets, technologies, capabilities, unparalleled experience in LDC acquisitions, and our distribution footprint.
Procurement of New Generation
In 2009, the OPA launched its Feed-in Tariff (FIT) Program which is designed to procure energy from a wide range of renewable energy sources, including wind, solar, photovoltaic, bio-energy, and waterpower up to 50 MW. The FIT program is currently divided into three streams: Micro FIT (projects up to 10 kW), Small FIT (projects between 10 kW and 500 kW) and regular FIT (projects greater than 500 kW), all of which may result in connections to our distribution system. Under the FIT program, the OPA has entered into contracts or conditional contracts with generation proponents pursuant to which the OPA will pay a fixed rate for power produced over a specified period of time. We continue to connect projects for which there are firm contracts.
On May 30, 2013, the Province announced that it would make 900 MW of new capacity available between 2013 and 2018 for the Small FIT and Micro FIT programs. The Province has set annual procurement targets, from 2014 onwards, of 150 MW for Small FIT generation and 50 MW for Micro FIT generation. The Province is working with the OPA to develop a competitive process for renewable energy generation projects above 500 kW. The new process will replace the existing large project stream of the FIT program. As at December 31, 2013, our company has connected more than 370 FIT and 11,000 Micro FIT projects.
9
HYDRO ONE INC.
MANAGEMENT’S DISCUSSION AND ANALYSIS (continued)
For the years ended December 31, 2013 and 2012
Conservation and Demand Management
In April 2012, the OEB issued its CDM guidelines for all electricity distributors. These guidelines provide guidance on certain provisions in the CDM Code and the type of evidence that should be filed by distributors in support of an application for OEB-approved CDM programs. The guidelines also provide details on the Lost Revenue Adjustment Mechanism (LRAM) related to CDM programs implemented under the CDM Code. LRAM is the mechanism by which LDCs are compensated for lost revenues associated with their respective load reductions resulting from CDM programs. In addition, the guidelines state that savings associated with TOU pricing are eligible to be counted towards the 2011-2014 CDM targets.
In December 2012, the Minister of Energy issued a directive to the OPA to extend funding for the OPA-contracted Ontario-wide CDM programs for one additional year, to December 31, 2015. This extension will provide an opportunity for the OPA and LDCs to collaboratively work to strengthen the current framework, and to keep customer programs in place for 2015.
On September 30, 2013, in accordance with the CDM Code, Hydro One Networks and Hydro One Brampton Networks each filed a 2012 Annual CDM Report with the OEB. The reports discussed CDM activities, energy and peak demand savings results achieved in 2012, and plans to reach CDM targets by the end of 2014. Hydro One Networks reported that it expects to reach 100% of its demand target and 80% of its cumulative energy target by 2014. Hydro One Brampton Networks reported that it expects to reach 68% of its demand target and 100% of its cumulative energy target by 2014. The OEB has indicated that there are several LDCs that have a similar issue. The OEB is aware of our situation.
ANNUAL RESULTS OF OPERATIONS
Year ended December 31 (millions of Canadian dollars) | 2013 | 2012 | $ Change | % Change | ||||||||||||
Revenues | 6,074 | 5,728 | 346 | 6 | ||||||||||||
Purchased power | 3,020 | 2,774 | 246 | 9 | ||||||||||||
Operation, maintenance and administration | 1,106 | 1,071 | 35 | 3 | ||||||||||||
Depreciation and amortization | 676 | 659 | 17 | 3 | ||||||||||||
|
|
|
|
|
|
|
| |||||||||
| 4,802 | 4,504 | 298 | 7 | |||||||||||||
Income before financing charges and provision for payments in lieu of corporate income taxes | 1,272 | 1,224 | 48 | 4 | ||||||||||||
Financing charges | 360 | 358 | 2 | 1 | ||||||||||||
|
|
|
|
|
|
|
| |||||||||
Income before provision for payments in lieu of corporate income taxes | 912 | 866 | 46 | 5 | ||||||||||||
Provision for payments in lieu of corporate income taxes | 109 | 121 | (12 | ) | (10 | ) | ||||||||||
|
|
|
|
|
|
|
| |||||||||
Net income | 803 | 745 | 58 | 8 | ||||||||||||
|
|
|
|
|
|
|
| |||||||||
10
HYDRO ONE INC.
MANAGEMENT’S DISCUSSION AND ANALYSIS (continued)
For the years ended December 31, 2013 and 2012
Revenues
Year ended December 31 (millions of Canadian dollars) | 2013 | 2012 | $ Change | % Change | ||||||||||||
Transmission | 1,529 | 1,482 | 47 | 3 | ||||||||||||
Distribution | 4,484 | 4,184 | 300 | 7 | ||||||||||||
Other | 61 | 62 | (1 | ) | (2 | ) | ||||||||||
|
|
|
|
|
|
|
| |||||||||
| 6,074 | 5,728 | 346 | 6 | |||||||||||||
|
|
|
|
|
|
|
| |||||||||
Average annual Ontario 60-minute peak demand (MW)1 | 21,493 | 21,132 | 361 | 2 | ||||||||||||
|
|
|
|
|
|
|
| |||||||||
Distribution – units distributed to customers (TWh)1 | 29.8 | 29.2 | 0.6 | 2 | ||||||||||||
|
|
|
|
|
|
|
| |||||||||
| 1 | System-related statistics are preliminary. |
Transmission
Transmission revenues primarily consist of our transmission tariff, which is based on the monthly peak electricity demand across our high-voltage network. The tariff is designed to recover revenues necessary to support a transmission system with sufficient capacity to accommodate the maximum expected demand. Demand is primarily influenced by weather and economic conditions. Transmission revenues also include export revenues associated with transmitting excess generation to surrounding markets, ancillary revenues primarily attributable to maintenance services provided to generators, and secondary use of our land rights.
Our 2013 transmission revenues were higher by $47 million, or 3%, compared to 2012. The average Ontario 60-minute peak demand was higher in 2013, resulting in an increase in transmission revenues of $26 million, compared to 2012. The higher energy consumption in 2013 mainly resulted from a warmer summer and a colder winter, as compared to 2012. In addition, we experienced higher revenues of $21 million in 2013, associated with the OEB’s approval of export service revenues and ancillary services.
Distribution
Distribution revenues include our distribution tariff and amounts to recover the cost of purchased power used by the customers of our Distribution Business. Accordingly, our distribution revenues are influenced by the amount of electricity we distribute, the cost of purchased power and our distribution tariff rates. Distribution revenues also include minor ancillary distribution service revenues, such as fees related to the joint use of our distribution poles by the telecommunications and cable television industries, as well as miscellaneous charges such as charges for late payments.
Our 2013 distribution revenues were higher by $300 million, or 7%, compared to 2012. The increase was primarily due to the recovery of higher purchased power costs of $246 million, as described below under “Purchased Power.” In addition, energy consumption was higher by $29 million in 2013, mainly resulting from a warmer summer and a colder winter, as compared to 2012. Distribution revenues also increased by $15 million as a result of our placement in service of new smart grid and smart meter investments, which are currently being recovered through separate rate mechanisms.
In December 2012, the OEB approved new tariff rates effective January 1, 2013, based on its third generation IRM process. As part of the IRM decision, the OEB approved our application for an additional rate rider related to an incremental capital module (ICM) adjustment to our rates, reflecting our placement in service of certain specific capital investments. This ICM approval resulted in an increase of $13 million, compared to 2012. In addition, the OEB’s IRM decision resulted in higher distribution revenues of $10 million, which will support the maintenance and investment requirements of our distribution system and enable the safe and reliable delivery of electricity to our customers throughout Ontario. The 2013 distribution revenue increases were partially offset by lower 2013 ancillary distribution revenues of $13 million, primarily associated with OEB-approved regulatory accounts.
11
HYDRO ONE INC.
MANAGEMENT’S DISCUSSION AND ANALYSIS (continued)
For the years ended December 31, 2013 and 2012
Purchased Power
Purchased power costs are incurred by our Distribution Business and represent the cost of purchased electricity delivered to customers within our distribution service territory. These costs comprise the wholesale commodity cost of energy, the IESO wholesale market service charges, and transmission charges levied by the IESO. The commodity cost of energy is based on the OEB’s RPP, as described above under “Regulation.”
Our 2013 purchased power costs increased by $246 million, or 9%, to $3,020 million, compared to 2012. The increase in our 2013 purchased power costs was mainly due to a $104 million increase resulting from higher purchased power costs for customers who are not eligible for the RPP, an $85 million increase resulting from the impact of changes in the OEB’s RPP rates for residential and other eligible customers, a $44 million increase due to higher electricity demand, a $9 million increase resulting from the IESO’s Smart Metering Entity charge effective May 1, 2013, and a $4 million reduction in wholesale market service charges levied by the IESO.
Operation, Maintenance and Administration
Our operation, maintenance and administration costs consist of labour, materials, equipment and purchased services which support the operation and maintenance of the transmission and distribution systems. Also included in these costs are property taxes and payments in lieu thereof related to our transmission and distribution lines, stations and buildings. Our transmission operation, maintenance and administration costs are incurred to sustain our high-voltage transmission stations, lines and rights-of-way. Our distribution operation, maintenance and administration costs are required to maintain our low-voltage distribution system. Our company continues to focus on managing its costs, while continuing to substantially complete our planned work programs for both our Transmission and Distribution Businesses.
Year ended December 31 (millions of Canadian dollars) | 2013 | 2012 | $ Change | % Change | ||||||||||||
Transmission | 375 | 402 | (27 | ) | (7 | ) | ||||||||||
Distribution | 672 | 608 | 64 | 11 | ||||||||||||
Other | 59 | 61 | (2 | ) | (3 | ) | ||||||||||
|
|
|
|
|
|
|
| |||||||||
| 1,106 | 1,071 | 35 | 3 | |||||||||||||
|
|
|
|
|
|
|
| |||||||||
Transmission
Our 2013 transmission operation, maintenance and administration costs decreased by $27 million, or 7%, to $375 million, compared to 2012. Within our work programs, we continued to invest in the safe and reliable operation of our transmission system.
Expenditures in support of our transmission system decreased by $33 million in 2013, compared to 2012, primarily due to a reduction to our provision for payments in lieu of property taxes related to transmission stations for the years 1999 to 2012, inclusive, following the finalization of the related regulations and receipt of a final assessment of our property tax returns. The decrease in our transmission system support costs was partially offset by an increase of $6 million in our work program costs, compared to 2012. This increase was primarily due to higher expenditures related to our forestry work program on our transmission rights-of-way resulting from heavy tree densities, power equipment preventive and corrective maintenance, and emergency restoration requirements as a result of severe flooding at our Richview and Manby transmission stations caused by a major rainstorm in July 2013. We also experienced increased cyber security and internal compliance program requirements related to the reliability standards and criteria mandated by the North American Electric Reliability Corporation (NERC). These increases in work program costs were partially offset by lower expenditures related to the OPA’s recommendation to increase short circuit and/or transformer capacity at ten of our transmission stations to enable the connection of small renewable projects, as this work was substantially completed by the end of 2012. Expenditures for these station upgrades were recorded within operation, maintenance and administration rather than as capital expenditures, given that recovery was restricted pursuant to a shareholder declaration made in April 2011. No such declarations were issued in 2013. In addition, we experienced lower expenditures within our overhead lines program.
12
HYDRO ONE INC.
MANAGEMENT’S DISCUSSION AND ANALYSIS (continued)
For the years ended December 31, 2013 and 2012
Distribution
Our 2013 distribution operation, maintenance and administration costs increased by $64 million, or 11%, to $672 million, compared to 2012. Our work program expenditures increased by $63 million compared to 2012, mainly as a result of increased power restoration expenditures following major storms in 2013, increased customer-driven work related to trouble calls and cable locates in support of the new One Call Program, higher requirements within the line patrol program, higher expenditures on our customer care programs, higher Information Technology (IT) improvements and enhancements, and continued work on the ADS Project. These impacts were partially offset by lower station corrective and preventive maintenance expenditures, as well as lower line clearing expenditures, compared to 2012. Our expenditures in support of our distribution system increased marginally by $1 million, compared to 2012.
Depreciation and Amortization
Our 2013 depreciation and amortization costs increased by $17 million, or 3%, compared to 2012. This increase was attributable to higher 2013 depreciation expense, primarily related to our placement of new assets in service consistent with our ongoing capital work program, as well as higher asset removal costs in 2013.
Financing Charges
Financing charges increased by $2 million, or 1%, to $360 million for 2013, compared to 2012. Higher financing costs in 2013 were mainly due to a decrease in interest capitalized, partially offset by a decrease in interest expense on long-term debt due to lower average interest rates.
Provision for Payments in Lieu of Corporate Income Taxes
The provision for payments in lieu of corporate income taxes (PILs) decreased by $12 million, or 10%, to $109 million in 2013, compared to 2012. This decrease primarily resulted from changes in net temporary differences, and a true-up relating to the 2012 research and development tax credits. This reduction was partially offset by the impact of higher levels of pre-tax income in 2013, compared to 2012.
Net Income
Our 2013 net income increased by $58 million, or 8%, to $803 million, compared to 2012. We experienced higher distribution revenues in 2013 mainly reflecting increased purchased power costs, primarily related to the OEB’s RPP rate-setting process and the IESO’s spot market. We also experienced increased transmission revenues in 2013 reflecting a higher peak demand due to intermittent periods of hot weather in the summer of 2013, as well as extreme cold winter weather. Our 2013 net income was also positively impacted by a lower provision for PILs and by a reduction to our provision for payments in lieu of transmission station property taxes, following the finalization of the assessment of certain prior years’ property tax returns. This reduction was partially offset by power restoration expenditures following several major storms in 2013.
QUARTERLY RESULTS OF OPERATIONS
The following table sets forth unaudited quarterly information for each of the eight quarters, from the quarter ended March 31, 2012 through December 31, 2013. This information has been derived from our unaudited interim Consolidated Financial Statements and our audited annual Consolidated Financial Statements which include all adjustments, consisting only of normal recurring adjustments, necessary for fair presentation of our financial position and results of operations for those periods. These operating results are not necessarily indicative of results for any future period and should not be relied upon to predict our future performance.
(millions of Canadian dollars) | 2013 | 2012 | ||||||||||||||||||||||||||||||
Quarter ended | Dec. 31 | Sept. 30 | Jun. 30 | Mar. 31 | Dec. 31 | Sept. 30 | Jun. 30 | Mar. 31 | ||||||||||||||||||||||||
Total revenue | 1,557 | 1,542 | 1,403 | 1,572 | 1,435 | 1,466 | 1,359 | 1,468 | ||||||||||||||||||||||||
Net income | 160 | 218 | 168 | 257 | 165 | 201 | 169 | 210 | ||||||||||||||||||||||||
Net income to common shareholder | 155 | 214 | 163 | 253 | 160 | 197 | 164 | 206 | ||||||||||||||||||||||||
13
HYDRO ONE INC.
MANAGEMENT’S DISCUSSION AND ANALYSIS (continued)
For the years ended December 31, 2013 and 2012
Electricity demand generally follows normal weather-related variations, and consequently, our electricity-related revenues and profit, all other things being equal, would tend to be higher in the first and third quarters than in the second and fourth quarters.
LIQUIDITY AND CAPITAL RESOURCES
Our primary sources of liquidity and capital resources are funds generated from our operations, debt capital market borrowings and bank financing. These resources will be used to satisfy our capital resource requirements, which continue to include our capital expenditures, servicing and repayment of our debt, and dividends.
Summary of Sources and Uses of Cash
Year ended December 31(millions of Canadian dollars) | 2013 | 2012 | ||||||
Operating activities | 1,404 | 1,294 | ||||||
Financing activities | ||||||||
Long-term debt issued | 1,185 | 1,085 | ||||||
Long-term debt retired | (600 | ) | (600 | ) | ||||
Dividends paid | (218 | ) | (370 | ) | ||||
Investing activities | ||||||||
Capital expenditures | (1,412 | ) | (1,463 | ) | ||||
Other financing and investing activities | 11 | 21 | ||||||
|
|
|
| |||||
Net change in cash and cash equivalents | 370 | (33 | ) | |||||
|
|
|
| |||||
Operating Activities
Net cash from operating activities increased by $110 million to $1,404 million in 2013, compared to 2012. The increase was primarily due to higher 2013 net income, compared to 2012, as well as changes in accrual balances, mainly related to timing of tax payments and to capital projects. The increase was partially offset by growth in accounts receivable balances, resulting from higher revenues and lower collections in the period.
Financing Activities
Short-term liquidity is provided through funds from operations, our Commercial Paper Program, under which we are authorized to issue up to $1,000 million in short-term notes with a term to maturity of less than 365 days, our revolving credit facility, and our holding of Province of Ontario Floating-Rate Notes.
Our Commercial Paper Program is supported by our $1,500 million committed revolving credit facility with a syndicate of banks, which matures in June 2018. In addition, our investment in Province of Ontario Floating-Rate Notes of $250 million (with a fair value of $251 million at December 31, 2013) maturing on November 19, 2014 also provides temporary liquidity. The short-term liquidity under this program and anticipated levels of funds from operations should be sufficient to fund our normal operating requirements.
At December 31, 2013, we had $9,045 million in long-term debt outstanding, including the current portion. Our notes and debentures mature between 2014 and 2062. Long-term financing is provided by our access to the debt markets, primarily through our Medium-Term Note (MTN) Program. The maximum authorized principal amount of medium-term notes issuable under this program is $3,000 million. At December 31, 2013, $1,815 million remained available until October 2015.
Cash generated from operations, after payment of expected dividends, will not be sufficient to fund capital expenditures, fund the repayment of our existing indebtedness, and meet other liquidity requirements. We rely on debt financing through our MTN Program and our Commercial Paper Program to repay our existing indebtedness and fund a portion of our capital expenditures.
14
HYDRO ONE INC.
MANAGEMENT’S DISCUSSION AND ANALYSIS (continued)
For the years ended December 31, 2013 and 2012
The credit ratings assigned to our debt securities by external rating agencies are important to our ability to raise capital and funding to support our business operations. Maintaining strong credit ratings allows us to access capital markets on competitive terms. A material downgrade of our credit ratings would likely increase our cost of funding significantly, and our ability to access funding and capital through the capital markets could be reduced. Our corporate credit ratings from approved rating organizations are as follows:
Rating | ||||
Rating Agency | Short-term Debt | Long-term Debt | ||
| DBRS Limited | R-1 (middle) | A (high) | ||
| Moody’s Investors Service Inc. | Prime-1 | A1 | ||
| Standard & Poor’s Rating Services Inc. (S&P)1 | A-1 | A+ | ||
| 1 | On April 25, 2012, S&P revised their outlook on our company to negative from stable. |
We have the customary covenants normally associated with long-term debt. Among other things, our long-term debt covenants limit our permissible debt as a percentage of our total capitalization, limit our ability to sell assets, and impose a negative pledge provision, subject to customary exceptions. The credit agreements related to our credit facilities have no material adverse change clauses that could trigger default. However, the credit agreements require that we provide notice to the lenders of any material adverse change within three business days of the occurrence. The agreements also provide limitations that debt cannot exceed 75% of total capitalization and that third party debt issued by our subsidiaries cannot exceed 10% of the total book value of our assets. We were in compliance with all these covenants and limitations as at December 31, 2013.
In 2013, we issued $1,185 million of long-term debt under our MTN Program, compared to $1,085 million of long-term debt issued in 2012. In 2013, we also repaid $600 million in maturing long-term debt, compared to $600 million of long-term debt called and redeemed in 2012, prior to its maturity date of November 15, 2012. We had no short-term notes outstanding at December 31, 2013 or 2012.
Common dividends are declared at the sole discretion of our Board of Directors, and are recommended by management based on results of operations, maintenance of the deemed regulatory capital structure, financial condition, cash requirements, and other relevant factors, such as industry practice and shareholder expectations. Common dividends pertaining to our quarterly financial results are generally declared and paid in the following quarter.
In 2013, we paid dividends to the Province in the amount of $218 million, consisting of $200 million in common dividends and $18 million in preferred dividends. In 2012, we paid dividends to the Province in the amount of $370 million, consisting of $352 million in common dividends and $18 million in preferred dividends. In 2013, cash dividends per common share were $2,000, compared to $3,523 per common share in 2012. Cash dividends per preferred share were $1.375 in each of 2013 and 2012.
Our objectives with respect to our capital structure are to maintain effective access to capital on a long-term basis at reasonable rates and to deliver appropriate financial returns to our shareholder.
Investing Activities
Capital investments consist of cash capital expenditures and related accruals. Capital investments primarily relate to enhancing and reinforcing of our transmission and distribution infrastructure.
Year ended December 31(millions of Canadian dollars) | 2013 | 2012 | $ Change | % Change | ||||||||||||
Transmission | 714 | 776 | (62 | ) | (8 | ) | ||||||||||
Distribution | 673 | 671 | 2 | — | ||||||||||||
Other | 7 | 7 | — | — | ||||||||||||
|
|
|
|
|
|
|
| |||||||||
Total capital investments | 1,394 | 1,454 | (60 | ) | (4 | ) | ||||||||||
|
|
|
|
|
|
|
| |||||||||
Transmission
Our 2013 transmission capital investments decreased by $62 million, or 8%, to $714 million, compared to 2012. Investments to expand and reinforce our transmission system were $170 million in 2013, representing a decrease of $143 million, compared to 2012. The decrease was mainly due to the completion of our Bruce to Milton Transmission Reinforcement Project to connect refurbished nuclear and new wind generation sources in the Huron-Grey-Bruce area. This project was
15
HYDRO ONE INC.
MANAGEMENT’S DISCUSSION AND ANALYSIS (continued)
For the years ended December 31, 2013 and 2012
placed in-service in May 2012. In addition, we experienced lower expenditures as a result of completing our Commerce Way Transmission Station, a new load supply station in the City of Woodstock to address load growth issues in the Woodstock area, and the Switchyard Reconstruction Project at our Burlington Transmission Station, where two new 115 kV switchyards were constructed to increase the load supply capacity and to ensure reliability of supply to customers in the area. These projects were placed in-service in February 2013 and December 2012, respectively.
During 2013, we continued to invest in inter-area network projects to support the Province’s supply mix objectives for generation, and in load customer connections and local area supply projects to address growing loads. Our local area supply project expenditures include investments in our Midtown Transmission Reinforcement Project, which will provide additional supply capability to meet future load growth in midtown Toronto as well as areas to the west. Work at our Hearn Switching Station was partially completed in December 2013, where we rebuilt an existing switchyard that had reached its end-of-life. This project will also increase short circuit capability to accommodate future connection of renewable generation in central and downtown Toronto. We are also constructing our Lambton to Longwood Transmission Upgrade to increase transmission capability between our Lambton (Sarnia) and Longwood (London) transmission stations. This project is needed to satisfy government policy relating to the incorporation of 10,700 MW of non-hydroelectric renewable generation resources by 2021.
Investments to sustain our existing transmission system were $481 million in 2013, representing an increase of $89 million, compared to 2012. In 2013, we made significant investments in the refurbishment and replacement of end-of-life equipment for overhead lines and system re-investments in order to improve reliability, as well as replacement of circuit breakers. In addition, we have experienced higher expenditures associated with the timing of work related to the replacement of end-of-life power transformers. We continued work on replacing end-of-life underground transmission cables between our Strachan Transmission Station and Riverside Junction. These new underground cables will maintain a reliable supply of electricity to downtown Toronto. These increases were partially offset by lower expenditures related to the replacement of protection and control equipment.
Our other transmission capital investments were $63 million in 2013, representing a decrease of $8 million, compared to 2012. The decrease was mainly due to lower requirements associated with IT initiatives, including our entity-wide SAP information system replacement and improvement project, and timing of field facilities improvements. These reductions were partially offset by increased fleet acquisitions and emergency flood restoration work at our Richview transmission station caused by a major rainstorm in July 2013.
Distribution
Our 2013 distribution capital investments increased by $2 million, or less than 1%, to $673 million, compared to 2012. Investments to expand and reinforce our distribution network were $235 million in 2013, representing a decrease of $49 million, compared to 2012. We experienced reduced expenditures related to some of our major projects, including the ADS Project, as we completed the deployment of our Distribution Management System within our Owen Sound pilot area in 2012, and the Smart Metering Project, as most of the network expansion work was completed in 2012. In 2013, we also experienced a lower demand for new customer connections and upgrades. These decreases were partially offset by increased work on upgrading and adding capacity to our system to enable new customer connections and timing of generation connection projects. Given that the OEB has assessed the prudency of the ADS Project, the next phase of this project is anticipated in 2014.
Investments to sustain our distribution system were $324 million in 2013, representing an increase of $79 million, compared to 2012. The increase was primarily due to increased expenditures for replacements related to storm restoration work caused by major storms in 2013. We also experienced increased work within our wood pole replacement program and station refurbishment projects. Investments were also impacted by the timing of customer contribution payments received in 2012 relating to work for joint use and relocation of our lines. These increases were partially offset by lower work within our lines programs.
Our other distribution capital investments were $114 million in 2013, representing a decrease of $28 million, compared to 2012. The majority of these expenditures were related to the Customer Information System (CIS) phase of our entity-wide information system replacement and improvement project, which was placed into service in May 2013. In addition to replacing end-of-life systems, this implementation will result in process improvements that are expected to provide many benefits including enhancements to customer satisfaction through reduced call times and first call resolution of issues given faster availability of information. Productivity savings are also anticipated to result from performance improvements,
16
HYDRO ONE INC.
MANAGEMENT’S DISCUSSION AND ANALYSIS (continued)
For the years ended December 31, 2013 and 2012
consolidation and/or decommissioning of legacy IT systems. In addition, we experienced decreased expenditures associated with IT initiatives, including our entity-wide SAP information system replacement and improvement project, and the timing of field facilities improvements, partially offset by an increase in fleet acquisitions and emergency flood restoration work at our Richview Transmission Station.
Future Capital Investments
| Our capital investments for 2014 are budgeted at approximately $1,600 million. Our 2014 capital budgets for our Transmission and Distribution Businesses are approximately $950 million and $650 million, respectively. Consolidated capital investments are expected to be approximately $1,600 million in each of 2015 and 2016. These investment levels reflect the sustainment requirements of our aging infrastructure. Our sustainment program capital investments are expected to be approximately $900 million in each of 2014, 2015, and 2016. Our development capital investments are expected to be approximately $450 million in 2014, $500 million in 2015, and $500 million in 2016. Our development projects include the inter-area network upgrades that reflect supply mix policies, local area supply improvements, the ADS, new load and generation connections and requirements to enable Distributed Generation (DG), and customer demand work. Other capital investments are expected to be $250 million in 2014, $200 million in 2015, and $200 million in 2016. This includes investments in operating infrastructure integration, IT, fleet services and facilities, and real estate. Our future capital investments amounts do not include future LDC acquisitions. | 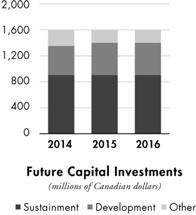 |
Transmission
Transmission capital investments are incurred to manage the replacement and refurbishment of our aging transmission infrastructure in order to ensure a continued reliable supply of energy to customers throughout the province. Our sustainment program future capital investments include the replacement of air blast circuit breakers and switchgear, high-voltage underground cables, and power transformers. These investments are necessary to ensure that we maintain our current levels of supply to our customers and continue to meet all regulatory, compliance, safety and environmental objectives.
Our development future capital investments include the Clarington Transmission Station Project to install additional auto-transformer capacity in east Greater Toronto Area; the Guelph Area Transmission Refurbishment Project, an upgrade of a transmission line and transmission stations in south-central Guelph; investments in ADS; requirements to enable DG; and up to four other transmission station upgrades, which when combined with the new Hearn Switching Station, will collectively enable up to 600 MW of new generation capacity in the Niagara, Toronto and Ottawa areas.
In 2011, the OPA provided the scope and timing to increase short circuit and/or transformer capacity at ten of 15 transmission stations. Seven of these station upgrades have now been completed, and alternate solutions have been determined for the remaining three projects. The Lambton to Longwood Transmission Upgrade has a required in-service date of December 2014, and is included in our budgeted future capital investments. This project is needed to satisfy government policy relating to the incorporation of 10,700 MW of non-hydroelectric renewable generation resources by 2021. In August 2013, the OPA requested us to terminate work related to the Southwestern Ontario Reactive Compensation Priority Project, and an OPA recommendation regarding the third priority specified transmission project, which was not included in the most recent LTEP, is not expected in the foreseeable future. Therefore, these two projects are not included in our budgeted future capital investments.
Based on the OEB’s framework for competitive designation for the development of eligible transmission projects, we did not include in our budgeted future capital investments any projects that could meet the definition of expansions. We do not plan to undertake large capital investments without a reasonable expectation of recovering them through our rates.
The actual timing and investments of many development projects are uncertain as they are dependent upon various regulatory approvals, negotiations with customers, neighbouring utilities and other stakeholders, and consultations with First Nations and Métis communities. Projects are also dependent upon the timing and level of generator contributions for enabling facilities.
17
HYDRO ONE INC.
MANAGEMENT’S DISCUSSION AND ANALYSIS (continued)
For the years ended December 31, 2013 and 2012
Distribution
Distribution capital investments include the sustainment of our infrastructure. Our core work will continue to focus on maintaining the performance of our aging distribution asset base through renewal and refurbishment activities. Planned capital investments include the continued replacements of equipment and components that are beyond their expected service life, as well as increased wood pole replacements and distribution station refurbishments. Sustainment capital investments in the Smart Metering project will decrease through 2016.
Distribution development capital investments are expected to be relatively stable through 2016, with the exception of capital contributions for capacity improvements at the Orleans Transmission Station in 2015 and the Hanmer Transmission Station in 2016. We will continue to make investments required to connect new load and DG customers, as well as investments to ensure the system is capable of supplying customer needs. During 2014 to 2016, a number of our projects will address local load growth issues. Generation connections investments will decrease as the volume of connections is expected to decrease. The budgeted capital expenditures only reflect projects with FIT and Micro FIT Program contracts from the OPA that are expected to connect to our distribution system.
In 2014 and 2015, the ADS Project will continue to pilot various technologies and related capital investments will begin to decrease in 2016. Pilot technologies include improvements to outage response management through more effective resource dispatch, automation to isolate faults where needed, and the dynamic regulation of voltage to reduce losses.
Off-Balance Sheet Arrangements
There are no off-balance sheet arrangements that have, or are reasonably likely to have, a material current or future effect on our financial condition, changes in financial condition, revenues or expenses, results of operations, liquidity, capital expenditures or capital resources.
Summary of Contractual Obligations and Other Commercial Commitments
The following table presents a summary of our debt and other major contractual obligations, as well as other major commercial commitments:
December 31, 2013(millions of Canadian dollars) | Total | 2014 | 2015/2016 | 2017/2018 | After 2018 | |||||||||||||||
Contractual obligations(due by year) | ||||||||||||||||||||
Long-term debt – principal repayments1 | 9,045 | 750 | 1,050 | 1,350 | 5,895 | |||||||||||||||
Long-term debt – interest payments1 | 7,634 | 422 | 770 | 691 | 5,751 | |||||||||||||||
Pension2 | 172 | 160 | 12 | — | — | |||||||||||||||
Environmental and asset retirement obligations3 | 329 | 32 | 63 | 46 | 188 | |||||||||||||||
Inergi LP (Inergi) outsourcing agreement4 | 152 | 130 | 22 | — | — | |||||||||||||||
Operating lease commitments | 48 | 11 | 14 | 14 | 9 | |||||||||||||||
|
|
|
|
|
|
|
|
|
| |||||||||||
Total contractual obligations | 17,380 | 1,505 | 1,931 | 2,101 | 11,843 | |||||||||||||||
|
|
|
|
|
|
|
|
|
| |||||||||||
Other commercial commitments(by year of expiry) | ||||||||||||||||||||
Bank line5 | 1,500 | — | — | 1,500 | — | |||||||||||||||
Letters of credit6 | 149 | 149 | — | — | — | |||||||||||||||
Guarantees6 | 326 | 326 | — | — | — | |||||||||||||||
|
|
|
|
|
|
|
|
|
| |||||||||||
Total other commercial commitments | 1,975 | 475 | — | 1,500 | — | |||||||||||||||
|
|
|
|
|
|
|
|
|
| |||||||||||
| 1 | The “long-term debt – principal repayments” amounts are not charged to our results of operations, but are reflected on our Consolidated Balance Sheets and Consolidated Statements of Cash Flows. Interest associated with the long-term debt is recorded in financing charges on our Consolidated Statements of Operations and Comprehensive Income or as a cost of our capital programs. |
| 2 | Contributions to the Hydro One Pension Fund are generally made one month in arrears. The 2014 minimum pension contributions are based on an actuarial valuation effective December 31, 2011. Minimum pension contributions beyond 2014 will be based on an actuarial valuation effective no later than December 31, 2014, and will depend on future investment returns, changes in benefits, or actuarial assumptions. Pension contributions beyond 2014 are not estimable at this time. On January 30, 2014, we made contributions of $140 million. |
18
HYDRO ONE INC.
MANAGEMENT’S DISCUSSION AND ANALYSIS (continued)
For the years ended December 31, 2013 and 2012
| 3 | We record a liability for the estimated future expenditures associated with the removal and destruction of polychlorinated biphenyl (PCB)-contaminated insulating oils and related electrical equipment, and for the assessment and remediation of chemically-contaminated lands. We also record a liability for asset retirement obligations associated with the removal and disposal of asbestos-containing materials installed in some of our facilities, as well as the future decommissioning and removal of two of our switching stations. The forecasted expenditure pattern reflects our planned work programs for the periods. |
| 4 | In 2002, Inergi began providing services to our company, including business processing and IT outsourcing services. The current agreement with Inergi will expire in February 2015. We have begun developing a plan of action for end-of-term and issued a request for proposal on November 7, 2013. Based on the September 2013 Shareholder Resolution, the Province requires us to contract only with parties who are employed and physically located in Ontario when providing services to our company. The amounts disclosed include an estimated contractual annual inflation adjustment in the range of 1.5% to 3.0%. Payments in respect of our agreement with Inergi are recorded in operation, maintenance and administration costs on our Consolidated Statements of Operations and Comprehensive Income or as a cost of our capital programs. |
| 5 | On May 31, 2013, we increased the size of the revolving standby credit facility used to support our liquidity requirements from $1,250 million to $1,500 million, and extended the maturity date from June 2017 to June 2018. |
| 6 | We currently have outstanding bank letters of credit of $127 million relating to retirement compensation arrangements. We provide prudential support to the IESO in the form of letters of credit, the amount of which is calculated based on forecasted monthly power consumption. At December 31, 2013, we have provided letters of credit to the IESO in the amount of $21 million to meet our current prudential requirement. In addition, we have approximately $1 million pertaining to operating letters of credit. We have also provided prudential support to the IESO on behalf of our subsidiaries as required by the IESO’s Market Rules, using parental guarantees of up to a maximum of $325 million, and on behalf of two distributors using guarantees of up to approximately $1 million. |
RELATED PARTY TRANSACTIONS
We are owned by the Province. The OEFC, IESO, OPA, OPG and the OEB are related parties to our company because they are controlled or significantly influenced by the Province.
Related party transactions primarily consist of our transmission revenues received from, and our power purchases payments made to the IESO. The year-over-year changes related to these amounts are described more fully in the discussion of our transmission revenues and purchased power costs. Other significant related party transactions include our dividends, which are paid to the Province, and our PILs and some of our payments in lieu of property taxes, which are paid to the OEFC. In addition, in January 2010, we purchased $250 million of Province of Ontario Floating-Rate Notes, maturing on November 19, 2014, as a form of alternate liquidity to supplement our bank credit facilities.
Our company receives revenues for transmission services from the IESO, based on OEB-approved UTRs. Transmission revenues include $1,509 million (2012 – $1,474 million) related to these services. Our company receives amounts for rural rate protection from the IESO. Distribution revenues include $127 million (2012 – $127 million) related to this program. Our company also receives revenues related to the supply of electricity to remote northern communities from the IESO. Distribution revenues include $33 million (2012 – $28 million) related to these services.
In 2013, our company purchased power in the amount of $2,477 million (2012 – $2,392 million) from the IESO-administered electricity market; $15 million (2012 – $10 million) from OPG; and $8 million (2012 – $7 million) from power contracts administered by the OEFC.
Under theOntario Energy Board Act, 1998, the OEB is required to recover all of its annual operating costs from gas and electricity distributors and transmitters. In 2013, our company incurred $12 million (2012 – $11 million) in OEB fees.
Our company has service level agreements with OPG. These services include field, engineering, logistics and telecommunications services. In 2013, revenues related to the provision of construction and equipment maintenance services with respect to these service level agreements were $9 million (2012 – $10 million), primarily for the Transmission Business. Operation, maintenance and administration costs related to the purchase of services with respect to these service level agreements were $1 million in 2013 (2012 – $2 million).
The OPA funds substantially all of the Company’s CDM programs. The funding includes program costs, incentives, and management fees. In 2013, our company received $34 million (2012 – $39 million) from the OPA related to these programs.
19
HYDRO ONE INC.
MANAGEMENT’S DISCUSSION AND ANALYSIS (continued)
For the years ended December 31, 2013 and 2012
Our company pays a $5 million annual fee to the OEFC for indemnification against adverse claims in excess of $10 million paid by the OEFC with respect to certain of Ontario Hydro’s businesses transferred to our company on April 1, 1999.
Sales to and purchases from related parties occur at normal market prices or at a proxy for fair value based on the requirements of the OEB’s Affiliate Relationships Code. Outstanding balances at period end are unsecured, interest free and settled in cash.
The amounts due to and from related parties as a result of the transactions referred to above are as follows:
December 31(millions of Canadian dollars) | 2013 | 2012 | ||||||
Due from related parties | 197 | 154 | ||||||
Due to related parties1 | (230 | ) | (261 | ) | ||||
Long-term investment | 251 | 251 | ||||||
| 1 | Included in “due to related parties” at December 31, 2013 are amounts owing to the IESO in respect of power purchases of $217 million (2012 – $199 million). |
CONSIDERATIONS OF CURRENT ECONOMIC CONDITIONS
Effect of Load on Revenue
Our load, based on normal weather patterns, is expected to decline in 2014 due to the impact of CDM and embedded generation, partially offset by load growth associated with economic growth in all sectors of the Ontario economy. Overall load growth due to the economy alone is forecasted to be approximately 1.6%, with the commercial and industrial sectors slightly outperforming the residential sector. The load impacts of CDM and embedded generation are expected to have a negative impact on load growth of approximately 0.4% and 3.5%, respectively. On the whole, our load is expected to decline by about 2.3% in 2014. Our approved revenue requirement for 2014 has taken the expected load decline into account. A reduction in load, beyond our load forecast included in our approved revenue requirement, would negatively impact our financial results.
Effect of Interest Rates
Changes in interest rates will impact the calculation of the revenue requirements upon which our rates are based. The first component impacted by interest rates is our return on equity (ROE). The OEB-approved adjustment formula for calculating ROE will increase or decrease by 50% of the change between the current Long Canada Bond Forecast and the risk-free rate established at 4.25% and 50% of the change in the spread in 30-year “A”-rated Canadian utility bonds over the 30-year benchmark Government of Canada bond yield established at 1.415%. All other things being equal, we estimate that a 1% decrease in the forecasted long-term Government of Canada bond yield used in determining our ROE would reduce Hydro One Networks’ transmission and distribution businesses’ 2014 results of operations by approximately $20 million and $10 million, respectively. As interest rates decline, there is more risk of a decline in our net income. The second component of revenue requirement that would be impacted by interest rates is the return on debt. The difference between actual interest rates on new debt issuances and those approved for return by the OEB would impact our results of operations.
Input Costs and Commodity Pricing
In support of our ongoing work programs, we are required to procure materials, supplies and services. To manage our total costs, we regularly establish security of supply, strategic material and services contracts, general outline agreements, and vendor alliances and we also manage a stock of commonly used items. Such arrangements are for a defined period of time and are monitored. Where advantageous, we develop long-term contractual relationships with suppliers to optimize the cost of goods and services and to ensure the availability and timely supply of critical items. As a result of our strategic sourcing practices, we do not foresee any adverse impacts on our business from current economic conditions in respect of adequacy and timing of supply and credit risk of our counterparties. Further, we have been able to realize significant savings through our strategic sourcing initiatives.
20
HYDRO ONE INC.
MANAGEMENT’S DISCUSSION AND ANALYSIS (continued)
For the years ended December 31, 2013 and 2012
Pension Plan
In 2013, we contributed approximately $160 million to our pension plan and incurred $287 million in net periodic pension benefit costs, based on an actuarial valuation effective December 31, 2011. Actuarial valuations are minimally required to be filed every three years. We currently estimate our total annual pension contributions to be approximately $160 million for 2014, based on the projected level of pensionable earnings and the same actuarial valuation effective December 31, 2011. Future minimum contributions beyond 2014 will be based on an actuarial valuation effective no later than December 31, 2014. Our pension plan experienced positive returns of approximately 17.91% in 2013. Our pension obligation is impacted by interest rates. The 0.5% increase in the discount rate, from 4.25% at December 31, 2012 to 4.75% at December 31, 2013, resulted in a decrease in the pension obligation of $443 million and an increase to our post-retirement and post-employment benefit obligation of $126 million. Our pension obligation is also impacted by mortality assumptions. The changes in mortality assumptions at December 31, 2013, compared to December 31, 2012, resulted in an increase in the pension obligation of $380 million and an increase to our post-retirement and post-employment benefit obligation of $136 million. Contribution increases are being implemented for all segments of our company’s active employees.
RISK MANAGEMENT AND RISK FACTORS
We have an Enterprise Risk Management (ERM) Program that aims at balancing business risks and returns. An enterprise-wide approach enables regulatory, strategic, operational and financial risks to be managed and aligned with our strategic goals. Our ERM program helps us to better understand uncertainty and its potential impact on our strategic goals. It sets out the uniform principles, processes and criteria for identifying, assessing, evaluating, treating, monitoring and communicating risks across all lines of business. It supports our Board of Directors’ corporate governance needs and the due diligence responsibilities of senior management.
While our philosophy is that risk management is the responsibility of all employees, the Board of Directors annually reviews our company’s risk tolerances, risk management policies, processes and accountabilities. Twice per year, the Board of Directors reviews our risk profile, which is the list of key risks prepared by senior management, and represents the greatest threats to meeting our strategic objectives. The Board of Directors’ committees review risks relevant to their mandate at every meeting. The Audit and Finance Committee of our Board of Directors annually reviews the status of our internal control framework.
Our President and Chief Executive Officer (CEO) has ultimate accountability for risk management. Our Leadership Team provides senior management oversight of our risk portfolio and our risk management processes. The leadership team provides direction on the evolution of these processes and identifies priority areas of focus for risk assessment and mitigation planning.
Our Chief Administration Officer and Chief Financial Officer (CAO and CFO) is responsible for ensuring that the risk management program is an integral part of our business strategy, planning and objective setting. The CAO and CFO has specific accountability for ensuring that ERM processes are established, properly documented and maintained by our company.
Our senior managers, line and functional managers are responsible for managing risks within the scope of their authority and accountability. Risk acceptance or mitigation decisions are made within the risk tolerances specified by the head of the subsidiary or function.
The CAO and CFO provides support to the Audit and Finance Committee of our Board of Directors, the President and CEO, the senior management team and key managers within our company. This support includes developing risk management frameworks, policies and processes, introducing and promoting new techniques, establishing risk tolerances, preparing annual corporate risk profiles, maintaining a registry of key business risks and facilitating risk assessments across our company. Our internal audit staff is responsible for performing independent reviews of the effectiveness of risk management policies, processes and systems. Starting in 2013, our Board of Directors has taken on an enhanced role in our governance structure. Each committee of the Board of Directors will take accountability for reviewing specific risks of our company.
Key elements of our ERM Program enable us to identify, assess and monitor our risks effectively. These include having an ERM policy and framework which communicates our philosophy and process for risk management across our company. A
21
HYDRO ONE INC.
MANAGEMENT’S DISCUSSION AND ANALYSIS (continued)
For the years ended December 31, 2013 and 2012
discussion of risks is an integral part of each line of business’ planning documents on an annual basis. Risk identification is also considered as part of each business case for investments. Finally, discrete risk assessments and workshops are performed for specific lines of business, key projects and various profiles, such as customer relationships and regulatory compliance. In order to drive consistency throughout our risk identification and risk management processes, we use a standard list of risk sources known as our risk universe. These sources are maintained in a single database that provides a consistent basis for risk identification and classification and serves as a repository for our risk assessments. All risk assessments in our company start with this risk universe. We also use standard risk criteria, which establish the metrics and terminology used for assessing and communicating on risks, and help ensure a consistent basis for our risk assessments and risk evaluations across all lines of business. Risk criteria include formally established risk tolerances and standard scales for assessing the probability of a risk materializing and the strength of controls in place to mitigate them.
Ownership by the Province
The Province owns all of our outstanding shares. Accordingly, the Province has the power to determine the composition of our Board of Directors, appoint the Chair, and influence our major business and corporate decisions. We and the Province have entered into a memorandum of agreement relating to certain aspects of the governance of our company. Pursuant to such agreement, in September 2008 the Province made a declaration removing certain powers from our company’s directors pertaining to the off-shoring of jobs under the Inergi Agreement. In 2011, the Province made a declaration preventing our company from seeking cost recovery through the regulatory process for the cost of upgrades required for either Micro FIT or Small FIT generators for costs related to investment and expenditures made. Effective September 30, 2013, the Province made a declaration regarding the outsourcing of services covered by the Inergi Agreement.
In 2009, the Province required our company, among other entities, to adhere to certain accountability measures regarding consulting contracts and employee travel, meal and hospitality expenses. The Province may require us to adhere to further accountability measures or may make similar declarations in the future, some of which may have a material adverse effect on our business. Our credit ratings may change with the credit ratings of the Province, to the extent the credit rating agencies link the two ratings by virtue of our company’s ownership by the Province.
Conflicts of interest may arise between us and the Province as a result of the obligation of the Province to act in the best interests of the residents of Ontario in a broad range of matters, including the regulation of Ontario’s electricity industry and environmental matters, any future sale or other transaction by the Province with respect to its ownership interest in our company, including any potential outcomes arising out of the recommendations of the Ontario Distribution Sector Review Panel’s report, the Province’s ownership of OPG, and the determination of the amount of dividend or proxy tax payments. We may not be able to resolve any potential conflict with the Province on terms satisfactory to us, which could have a material adverse effect on our business.
Regulatory Risk
We are subject to regulatory risks, including the approval by the OEB of rates for our transmission and distribution businesses that permit a reasonable opportunity to recover the estimated costs of providing safe and reliable service on a timely basis and earn the approved rates of return. The OEB approves our transmission and distribution rates based on projected electricity load and consumption levels. If actual load or consumption materially falls below projected levels, our net income for either, or both, of these businesses could be materially adversely affected. Also, our current revenue requirements for these businesses are based on cost assumptions that may not materialize. There is no assurance that the OEB would allow rate increases sufficient to offset unfavourable financial impacts from unanticipated changes in electricity demand or in our costs.
The OEB’s new Renewed Regulatory Framework requires that the term of a custom rate application (distribution business) is a five-year period. There are risks associated with forecasting over a longer period. Changes in the industry may alter the investment needs or require changes to rate setting that could result in a significant impact on our capability to execute its plan. To mitigate the risk of externally driven factors that may impact its plan, Hydro One Networks proposed a number of adjustment mechanisms in the design of its recent custom application to reflect plan changes outside the normal course of business in order for the Company to avoid a regulatory review by the OEB during the five-year custom application period. Hydro One Networks also proposed a set of outcome measures to track its performance and delivery of the plan. There can be no assurance that the OEB will accept these mechanisms or that they will be sufficient to protect our company from unforeseen changes to its plan.
22
HYDRO ONE INC.
MANAGEMENT’S DISCUSSION AND ANALYSIS (continued)
For the years ended December 31, 2013 and 2012
Our load could also be negatively affected by successful CDM programs. We are also subject to risk of revenue loss from other factors, such as economic trends and weather.
We expect to make investments in the coming years to connect new renewable generating stations. There is the possibility that we could incur unexpected capital expenditures to maintain or improve our assets particularly given that new technology is required to support renewable generation and unforeseen technical issues may be identified through implementation of projects. The risk exists that the OEB may not allow full recovery of such investments in the future. To the extent possible, we aim to mitigate this risk by ensuring prudent expenditures, seeking from the regulator clear policy direction on cost responsibility, and pre-approval of the need for capital expenditures. While we expect all of our expenditures to be fully recoverable after OEB review, any future regulatory decision to disallow or limit the recovery of such costs would lead to potential asset impairment and charges to our results of operations, which could have a material adverse effect on our company.
In Ontario, the Market Rules mandate that we comply with the reliability standards established by NERC and Northeast Power Coordinating Council. As a result, we will be required to comply with the Federal Energy Regulatory Commission’s definition of the Bulk Electric System unless we are granted an exception which will allow the application of the new definition in a cost-effective manner. We plan to submit exception applications and will look for recovery for costs incurred in meeting the definition in our rates; however, an adverse decision on an exception or recovery of costs could have an adverse effect on our company.
Risk of Natural and Other Unexpected Occurrences
Our facilities are exposed to the effects of severe weather conditions, natural disasters, man-made events including cyber and physical terrorist type attacks and, potentially, catastrophic events, such as a major accident or incident at a facility of a third party (such as a generating plant) to which our transmission or distribution assets are connected. Although constructed, operated and maintained to industry standards, our facilities may not withstand occurrences of this type in all circumstances. We do not have insurance for damage to our transmission and distribution wires, poles and towers located outside our transmission and distribution stations resulting from these events. Losses from lost revenues and repair costs could be substantial, especially for many of our facilities that are located in remote areas. We could also be subject to claims for damages caused by our failure to transmit or distribute electricity. Our risk is partly mitigated because our transmission system is designed and operated to withstand the loss of any major element and possesses inherent redundancy that provides alternate means to deliver large amounts of power. In the event of a large uninsured loss, we would apply to the OEB for recovery of such loss; however, there can be no assurance that the OEB would approve any such applications, in whole or in part, which could have a material adverse effect on our net income.
Risk Associated with Information Technology Infrastructure
Our ability to operate effectively in the Ontario electricity market is in part dependent upon us developing, maintaining and managing complex IT systems which are employed to operate our transmission and distribution facilities, financial and billing systems, and business systems. Our increasing reliance on information systems and expanding data networks increases our exposure to information security threats. We mitigate this risk through various methods including the use of security event management tools on our power and business systems, by separating our power system network from our business system network, by performing scans of our systems for known cyber threats and by providing company-wide awareness training to our personnel. We also engage the services of external experts to evaluate the security of our IT infrastructure and controls. We perform vulnerability assessments on our critical cyber assets and we ensure security and privacy controls are incorporated into new IT capabilities. Although these security and system disaster recovery controls are in place, there can be no guarantee that there will not be system failures or security breaches. Upon occurrence, the focus would shift from prevention to isolation, remediation and recovery until the incident has been fully addressed. Any such system failures or security breaches could have a material adverse effect on our company.
Risk Associated with Arranging Debt Financing
We expect to borrow to repay our existing indebtedness and fund a portion of capital expenditures. We have substantial amounts of existing debt, including $750 million maturing in 2014 and $550 million maturing in 2015. We plan to incur capital expenditures of approximately $1,600 million in each of 2014 and 2015. Cash generated from operations, after the payment of expected dividends, will not be sufficient to fund the repayment of our existing indebtedness and capital
23
HYDRO ONE INC.
MANAGEMENT’S DISCUSSION AND ANALYSIS (continued)
For the years ended December 31, 2013 and 2012
expenditures. Our ability to arrange sufficient and cost-effective debt financing could be materially adversely affected by numerous factors, including the regulatory environment in Ontario, our results of operations and financial position, market conditions, the ratings assigned to our debt securities by credit rating agencies and general economic conditions. Any failure or inability on our part to borrow substantial amounts of debt on satisfactory terms could impair our ability to repay maturing debt, fund capital expenditures and meet other obligations and requirements and, as a result, could have a material adverse effect on our company.
First Nation and Métis Claims Risk
Some of our current and proposed transmission and distribution lines may traverse lands over which First Nations and Métis have aboriginal, treaty or other legal claims. Although we have a recent history of successful negotiations and consultations with First Nations and Métis communities in Ontario, some communities and/or their citizens have expressed an increasing willingness to assert their claims through the courts, tribunals, or by direct action, which in turn can affect business activities. As a result, there exists uncertainty relating to business operations and project planning which could have an adverse effect on our company.
Risk Associated with Outsourcing Arrangement
Consistent with our strategy of reducing operating costs, we amended and extended our agreement with Inergi, effectively renewing the arrangement until February 28, 2015. If our agreement with Inergi is terminated for any reason or expires before a new supplier is selected, we could be required to incur significant expenses to transfer to another service provider, which could have a material adverse effect on our business, operating results, financial condition or prospects.
Risk Associated with Transmission Projects
The amount of power that can flow through transmission networks is constrained due to the physical characteristics of transmission lines and operating limitations. Within Ontario, new and expected generation facility connections, including those renewable energy generation facilities connecting as a result of the FIT program stemming from the GEA, and load growth have increased such that parts of our transmission and distribution systems are operating at or near capacity. These constraints or bottlenecks limit the ability of our network to reliably transmit power from new and existing generation sources (including expanded interconnections with neighbouring utilities) to load centres or to meet customers’ increasing loads. As a result, investments have been initiated to increase transmission capacity and enable the reliable delivery of power from existing and future generation sources to Ontario consumers. In many cases, these investments are contingent upon one or more of the following approvals and/or processes: environmental approval(s); receipt of OEB approvals which can include expropriation; and appropriate consultation processes with First Nations and Métis communities. Obtaining OEB and/or environmental approvals and carrying out these processes may also be impacted by opposition to the proposed site of transmission investments, which could adversely affect transmission reliability and/or our service quality, both of which could have a material adverse effect on our company.
With the introduction on August 26, 2010, of the OEB’s competitive transmission project development planning process, in the absence of a government directive, all interested transmitters will be required to submit a bid to the OEB for identified enabler facilities and network enhancement projects. Historically, we would have been awarded such projects through our rates and Section 92 applications. The facilitation of competitive transmission could impact our future work program and our ability to expand our current transmission footprint. In addition, bid costs are recoverable only by the successful proponent. This could have a material adverse effect on our company.
Asset Condition
We continually monitor the condition of our assets and maintain, refurbish or replace them to maintain equipment performance and provide reliable service quality. Our capital programs have been increasing to maintain the performance of our aging asset base. Execution of these plans is partially dependent upon external factors, such as outage planning with the IESO and transmission-connected customers, funding approval by the OEB, and supply chain availability for equipment suppliers and consulting services. In addition, opportunities to remove equipment from service to accommodate construction and maintenance are becoming increasingly limited due to customer and generator priorities.
24
HYDRO ONE INC.
MANAGEMENT’S DISCUSSION AND ANALYSIS (continued)
For the years ended December 31, 2013 and 2012
Adjustments to accommodate these external dependencies have been made in our planning process, and we are focused on overcoming these challenges to execute our work programs. However, if we are unable to carry out these plans in a timely and optimal manner, equipment performance will degrade, which may compromise the reliability of the provincial grid, our ability to deliver sufficient electricity and/or customer supply security, and increase the costs of operating and maintaining these assets. This could have a material adverse effect on our company.
Workforce Demographic Risk
By the end of 2013, approximately 16% of our employees were eligible for retirement, and by the end of 2014, there could be up to 20% eligible to retire. Accordingly, our success will be tied to our ability to attract and retain sufficient qualified staff to replace those retiring. This will be challenging as we expect the skilled labour market for our industry to be highly competitive in the future. In addition, many of our employees possess experience and skills that will also be highly sought after by other organizations both inside and outside the electricity sector. We are therefore focused on earlier identification and more rapid development of staff who demonstrate management potential. Moreover, we must also continue to advance our technical training and apprenticeship programs and succession plans to ensure that our future operational staffing needs will be met. If we are unable to attract and retain qualified personnel, it could have a material adverse effect on our business.
Labour Relations Risk
The substantial majority of our employees are represented by either the Power Workers Union (PWU) or the Society of Professional Energy Workers (Society). Over the past several years, significant effort has been expended to increase our flexibility to conduct operations in a more cost-efficient manner. Although we have achieved improved flexibility in our collective agreements, including a reduction in pension benefits for Society staff hired after November 2005 similar to a previous reduction affecting management staff and increased pension contributions for PWU and Society staff, we may not be able to achieve further improvement. The existing collective agreement with the PWU will expire on March 31, 2015, and the existing Society collective agreement will expire on March 31, 2016. We face financial risks related to our ability to negotiate collective agreements consistent with our rate orders. In addition, in the event of a labour dispute, we could face operational risk related to continued compliance with our licence requirements of providing service to customers. Any of these could have a material adverse effect on our company.
Pension Plan Risk
We have a defined benefit registered pension plan for the majority of our employees. Contributions to the pension plan are established by actuarial valuations which are minimally required to be filed with the Financial Services Commission of Ontario on a triennial basis. The most recently filed valuation was prepared as at December 31, 2011, and was filed in May 2012. Our company contributed approximately $160 million in respect of 2012 and approximately $160 million in respect of 2013 to its pension plan to satisfy minimum funding requirements. Contributions beyond 2013 will depend on investment returns, changes in benefits and actuarial assumptions and may include additional voluntary contributions from time to time. Nevertheless, future contributions are expected to be significant. A determination by the OEB that some of our pension expenditures are not recoverable from customers could have a material adverse effect on our company, and this risk may be exacerbated as the quantum of required pension contributions increases.
Environmental Risk
Our health, safety and environmental management system is designed to ensure hazards and risks are identified and assessed, and controls are implemented to mitigate significant risks. This system includes a standing committee of our Board of Directors that has governance over environmental matters. However, given the territory that our system encompasses and the amount of equipment that we own, we cannot guarantee that all such risks will be identified and mitigated without significant cost and expense to our company. The following are some of the areas that may have a significant impact on our operations.
We are subject to extensive Canadian federal, provincial and municipal environmental regulation. Failure to comply could subject us to fines and other penalties. In addition, the presence or release of hazardous or other harmful substances could lead to claims by third parties and/or governmental orders requiring us to take specific actions such as investigating, controlling and remediating the effects of these substances. We are currently undertaking a voluntary land assessment and remediation (LAR) program covering most of our stations and service centres. This program involves the systematic identification of any contamination at or from these facilities, and, where necessary, the development of remediation plans for our company and adjacent private properties. Any contamination of our properties could limit our ability to sell these assets in the future.
25
HYDRO ONE INC.
MANAGEMENT’S DISCUSSION AND ANALYSIS (continued)
For the years ended December 31, 2013 and 2012
We record a liability for our best estimate of the present value of the future expenditures required to comply with Environment Canada’s PCB regulations and for the present value of the future expenditures to complete our LAR program. The future expenditures required to discharge our PCB obligation are expected to be incurred over the period ending 2025, while our LAR expenditures are expected to be incurred over the period ending 2020. Actual future environmental expenditures may vary materially from the estimates used in the calculation of the environmental liabilities on our balance sheet. We do not have insurance coverage for these environmental expenditures. Under applicable regulations, we expect to incur future expenditures to identify, remove and dispose of asbestos-containing materials installed in some of our facilities. We record an asset retirement obligation for the present value of the estimated future expenditures. The estimates are based on an external, expert study of the current expenditures associated with removing such materials from our facilities. Actual future expenditures may vary materially from the estimates used for the amount of the asset retirement obligation.
There is also risk associated with obtaining governmental approvals, permits, or renewals of existing approvals and permits related to constructing or operating facilities. This may require environmental assessment or result in the imposition of conditions, or both, which could result in delays and cost increases. We anticipate that all of our future environmental expenditures will continue to be recoverable in future electricity rates. However, any future regulatory decision to disallow or limit the recovery of such costs could have a material adverse effect on our company.
Scientists and public health experts have been studying the possibility that exposure to electric and magnetic fields emanating from power lines and other electric sources may cause health problems. If it were to be concluded that electric and magnetic fields present a health risk, or governments decide to implement exposure limits, we could face litigation, be required to take costly mitigation measures such as relocating some of our facilities or experience difficulties in locating and building new facilities. Any of these could have a material adverse effect on our company.
Market and Credit Risk
Market risk refers primarily to the risk of loss that results from changes in commodity prices, foreign exchange rates and interest rates. We do not have commodity price risk. We do have foreign exchange risk as we enter into agreements to purchase materials and equipment associated with our capital programs and projects that are settled in foreign currencies. This foreign exchange risk is not material. We could in the future decide to issue foreign currency denominated debt which we would anticipate hedging back to Canadian dollars, consistent with our company’s risk management policy. We are exposed to fluctuations in interest rates as our regulated rate of return is derived using a formulaic approach.
The OEB-approved adjustment formula for calculating ROE in a deemed regulatory capital structure of 40% common equity and 60% debt will increase or decrease by 50% of the change between the current Long Canada Bond Forecast and the risk-free rate established at 4.25% and 50% of the change in the spread in 30-year “A”-rated Canadian utility bonds over the 30-year benchmark Government of Canada bond yield established at 1.415%. We estimate that a 1% decrease in the forecasted long-term Government of Canada bond yield used in determining our rate of return would reduce our Transmission Business’ 2014 net income by approximately $20 million and our Hydro One Networks distribution business’ 2014 net income by approximately $10 million. Our net income is adversely impacted by rising interest rates as our maturing long-term debt is refinanced at market rates. We periodically utilize interest rate swap agreements to mitigate elements of interest rate risk.
Financial assets create a risk that a counterparty will fail to discharge an obligation, causing a financial loss. Derivative financial instruments result in exposure to credit risk, since there is a risk of counterparty default. We monitor and minimize credit risk through various techniques, including dealing with highly-rated counterparties, limiting total exposure levels with individual counterparties, and by entering into master agreements which enable net settlement and by monitoring the financial condition of counterparties. We do not trade in any energy derivatives. We do, however, have interest rate swap contracts outstanding from time to time. Currently, there are no significant concentrations of credit risk with respect to any class of financial assets. We are required to procure electricity on behalf of competitive retailers and embedded LDCs for resale to their customers. The resulting concentrations of credit risk are mitigated through the use of various security arrangements, including letters of credit, which are incorporated into our service agreements with these retailers in accordance with the OEB’s Retail Settlements Code. The failure to properly manage these risks could have a material adverse effect on our company.
26
HYDRO ONE INC.
MANAGEMENT’S DISCUSSION AND ANALYSIS (continued)
For the years ended December 31, 2013 and 2012
Risk from Transfer of Assets Located on Reserves
The transfer orders by which we acquired certain of Ontario Hydro’s businesses as of April 1, 1999, did not transfer title to some assets located on Reserves. Currently, OEFC holds legal title to these assets and we manage them until we have obtained necessary authorizations to complete the title transfer. To occupy Reserves, we must have valid permits issued by Her Majesty the Queen in the Right of Canada. For each permit, we must negotiate an agreement (in the form of a Memorandum of Understanding) with the First Nation, OEFC and any members of the First Nation who have occupancy rights. The agreement includes provisions whereby the First Nation consents to the federal Department of Aboriginal Affairs and Northern Development issuing a permit. Where the agreement and permit are for transmission assets, we must negotiate rental terms. It is difficult to predict the aggregate amount that we may have to pay, either on an annual or one-time basis, to obtain the required agreements from First Nations. In 2013, we paid approximately $2 million to First Nations in respect of these agreements. OEFC will continue to hold these assets until we are able to negotiate agreements with First Nations and occupants. If we cannot reach satisfactory agreements and obtain federal permits, we may have to relocate these assets to other locations at a cost that could be substantial. In a limited number of cases, it may be necessary to abandon a line and replace it with diesel generation facilities. In either case, the costs relating to these assets could have a material adverse effect on our net income if we are not able to recover them in future rate orders.
Risk from Provincial Ownership of Transmission Corridors
Pursuant to the Reliable Energy and Consumer Protection Act, 2002, the Province acquired ownership of our transmission corridor lands underlying our transmission system. Although we have the statutory right to use the transmission corridors, we may be limited in our ability to expand our systems. Also, other uses of the transmission corridors by third parties in conjunction with the operation of our systems may increase safety or environmental risks, which could have an adverse effect on our company.
CRITICAL ACCOUNTING ESTIMATES
The preparation of our Consolidated Financial Statements requires us to make estimates and judgements that affect the reported amounts of assets, liabilities, revenues and costs, and related disclosures of contingencies. We base our estimates and judgements on historical experience, current conditions and various other assumptions that are believed to be reasonable under the circumstances, the results of which form the basis for making judgements about the carrying values of assets and liabilities, as well as identifying and assessing our accounting treatment with respect to commitments and contingencies. Actual results may differ from these estimates and judgements. We have identified the following critical accounting estimates used in the preparation of our Consolidated Financial Statements:
Revenues
Our monthly distribution revenue is estimated based on wholesale electricity purchases. At the end of each month, the electricity delivered to customers, but not billed, is estimated and revenue is recognized. The newly implemented CIS phase of our entity-wide system improvement project will allow us to use historical trends at a customer level to better estimate our unbilled revenue each period. This change in methodology for estimating revenue is anticipated to be implemented in 2014. Any changes in estimate will be accounted for prospectively.
Regulatory Assets and Liabilities
Our regulatory assets represent certain amounts receivable from future customers and costs that have been deferred for accounting purposes because it is probable that they will be recovered in future rates. Our regulatory assets mainly include costs related to the pension benefit liability, deferred income tax liabilities, post-retirement and post-employment benefit liability, and environmental liabilities. Our regulatory liabilities represent certain amounts that are refundable to future electricity customers, and pertain primarily to OEB deferral and variance accounts. The regulatory assets and liabilities can be recognized for rate-setting and financial reporting purposes only if the amounts have been approved for inclusion in the rates by the OEB, or if such approval is judged to be probable by management. If management judges that it is no longer probable that the OEB will allow the inclusion of a regulatory asset or liability in future rates, the applicable carrying amount of the regulatory asset or liability will be reflected in results of operations in the period that the judgement is made by management.
27
HYDRO ONE INC.
MANAGEMENT’S DISCUSSION AND ANALYSIS (continued)
For the years ended December 31, 2013 and 2012
Environmental Liabilities
We record a liability for the estimated future expenditures for the contaminated LAR and for the phase-out and destruction of PCB-contaminated mineral oil removed from electrical equipment. There are uncertainties in estimating future environmental costs due to potential external events such as changes in legislation or regulations and advances in remediation technologies. In determining the amounts to be recorded as environmental liabilities, the Company estimates the current cost of completing required work and makes assumptions as to when the future expenditures will actually be incurred, in order to generate future cash flow information. All factors used in estimating the Company’s environmental liabilities represent management’s best estimates of the present value of costs required to meet existing legislation or regulations. However, it is reasonably possible that numbers or volumes of contaminated assets, cost estimates to perform work, inflation assumptions and the assumed pattern of annual cash flows may differ significantly from the Company’s current assumptions. Environmental liabilities are reviewed annually or more frequently if significant changes in regulations or other relevant factors occur. Estimate changes are accounted for prospectively.
In June 2013, Environment Canada issued Canada Gazette I, which included a proposed amendment to the existing PCB regulations. The proposed amendment would extend the end-of-use deadline for our company’s PCBs in concentrations of 500 parts per million or more from December 31, 2014 to December 31, 2025. The proposed amendment is subject to final approvals before the enacted regulation is published in Canada Gazette II. Canada Gazette II is anticipated to be issued in the first half of 2014. An environmental liability is recorded based on regulations as currently enacted, and as such, our environmental liability as at December 31, 2013 is based on the current compliance date of December 31, 2014.
Employee Future Benefits
We provide future benefits to our current and retired employees, including pension, group life insurance, health care and long-term disability.
The discount rate used to calculate the accrued benefit obligation is determined each year end by referring to the most recently available market interest rates based on “AA”-rated corporate bond yields reflecting the duration of the applicable employee future benefit plan. The discount rates at December 31, 2013 increased to 4.75% from 4.25% used at December 31, 2012, in conjunction with increases in bond yields over this period. The increase in discount rates has resulted in a corresponding decrease in liabilities for accounting purposes. The accrual costs are determined by independent actuaries using the projected benefit method prorated on service and based on assumptions that reflect management’s best estimates.
The assumed return on pension plan assets is based on expectations of long-term rates of return at the beginning of the fiscal year and reflects a pension asset mix consistent with the pension plan’s investment policy. Returns on the respective portfolios are determined with reference to published Canadian and US stock indices and long-term bond and treasury bill indices. The assumed rate of return on pension plan assets reflects our long-term expectations. We believe that this assumption is reasonable because, with the Fund’s balanced investment approach, the higher volatility of equity investment returns is intended to be offset by the greater stability of fixed-income and short-term investment returns. The net result, on a long-term basis, is a somewhat lower return than might be expected by investing in equities alone. In the short term, the plan can experience aberrations in actual return.
Further, based on differences between long-term Government of Canada nominal bonds and real return bonds, the implied inflation rate has decreased from 1.9% per annum as at December 31, 2012 to approximately 1.2% per annum as at December 31, 2013. Given the Bank of Canada’s commitment to keep long-term inflation between 1.00% and 3.00%, management believes that the current implied rate is reasonable to use as a long-term assumption and as such, has used a 2.0% per annum inflation rate for liability valuation purposes as at December 31, 2013.
Our pension and post-retirement and post-employment obligations are also impacted by changes in life expectancies used in mortality assumptions. Increases in life expectancies of plan members result in increases in pension and post-retirement and post-employment benefit obligations.
The costs of post-retirement and post-employment benefits are determined at the beginning of the year. The costs are based on assumptions for expected claims experience and future health care cost inflation. A 1% increase in the health care cost trends would result in an increase in service cost and interest cost of approximately $21 million per year and an increase in the year-end obligation of about $258 million.
28
HYDRO ONE INC.
MANAGEMENT’S DISCUSSION AND ANALYSIS (continued)
For the years ended December 31, 2013 and 2012
Employee future benefits are included in labour costs that are either charged to results of operations or capitalized as part of the cost of property, plant and equipment and intangible assets. Changes in assumptions will affect the accrued benefit obligation of the employee future benefits and the future years’ amounts that will be charged to our results of operations or capitalized as part of the cost of property, plant and equipment and intangible assets.
Asset Impairment
Within our regulated businesses, the carrying costs of most of our long-lived assets are included in rate base where they earn an OEB-approved rate of return. Asset carrying values and the related return are recovered through approved rates. As a result, such assets are only tested for impairment in the event that the OEB disallows recovery, in whole or in part, or if such a disallowance is judged to be probable. We regularly monitor the assets of our unregulated Hydro One Telecom subsidiary for indications of impairment. As at December 31, 2013, no asset impairment had been recorded for assets within our regulated or unregulated businesses.
Goodwill represents the cost of acquired LDCs that is in excess of the fair value of the net identifiable assets acquired at the acquisition date. Goodwill is evaluated for impairment on an annual basis, or more frequently if circumstances require. We have concluded that goodwill was not impaired at December 31, 2013.
DISCLOSURE CONTROLS AND INTERNAL CONTROLS OVER FINANCIAL REPORTING
To optimize our customer service operations, we implemented the CIS module of SAP. This new system replaced multiple legacy applications which provided service to our distribution customers and key constituents for billing, customer contacts, field services, settlements, and customer choice administration. Internal controls have been documented and tested for adequacy and effectiveness, and continue to be refined.
In compliance with the requirements of National Instrument 52-109, our Certifying Officers have reviewed and certified the Consolidated Financial Statements for the year ended December 31, 2013, together with other financial information included in our securities filings. Our Certifying Officers have also certified that disclosure controls and procedures (DC&P) have been designed to provide reasonable assurance that material information relating to our company is made known within our company. Further, our Certifying Officers have certified that internal controls over financial reporting (ICFR) have been designed to provide reasonable assurance regarding the reliability of financial reporting and the preparation of the Consolidated Financial Statements. Based on the evaluation of the design and operating effectiveness of our company’s DC&P and ICFR, our Certifying Officers concluded that our company’s DC&P and ICFR were effective as at December 31, 2013.
29
HYDRO ONE INC.
MANAGEMENT’S DISCUSSION AND ANALYSIS (continued)
For the years ended December 31, 2013 and 2012
SELECTED ANNUAL INFORMATION
| Consolidated Statements of Operations and Comprehensive Income | ||||||||||||
Year ended December 31(millions of Canadian dollars, except amounts per share) | 2013 | 2012 | 2011 | |||||||||
Revenue | 6,074 | 5,728 | 5,471 | |||||||||
Net income | 803 | 745 | 641 | |||||||||
Basic and fully diluted earnings per common share | 7,850 | 7,280 | 6,228 | |||||||||
Cash dividends per common share | 2,000 | 3,523 | 1,500 | |||||||||
Cash dividends per preferred share | 1.375 | 1.375 | 1.375 | |||||||||
| Consolidated Balance Sheets | ||||||||||||
December 31(millions of Canadian dollars) | 2013 | 2012 | 2011 | |||||||||
Total assets | 21,625 | 20,811 | 18,836 | |||||||||
Total long-term debt | 9,057 | 8,479 | 8,008 | |||||||||
Preferred shares | 323 | 323 | 323 | |||||||||
| Other | ||||||||||||
Year ended December 31 (millions of Canadian dollars) | 2013 | 2012 | 2011 | |||||||||
Total capital investments | 1,394 | 1,454 | 1,447 | |||||||||
NEW ACCOUNTING PRONOUNCEMENTS
Recently Adopted Accounting Pronouncements
In December 2011, the Financial Accounting Standards Board (FASB) issued Accounting Standards Update (ASU) 2011-11, Balance Sheet (Topic 210): Disclosures about Offsetting Assets and Liabilities. This ASU requires an entity to disclose both gross and net information about financial instruments and transactions eligible for offset on the Consolidated Balance Sheets as well as financial instruments and transactions executed under a master netting or similar arrangement. The ASU was issued to enable users of financial statements to understand the effects or potential effects of those arrangements on an entity’s financial position. This ASU was required to be applied retrospectively and was effective for fiscal years, and interim periods within those years, beginning on or after January 1, 2013. The adoption of this ASU did not have an impact on our Consolidated Financial Statements.
In February 2013, the FASB issued ASU 2013-02, Comprehensive Income (Topic 220): Reporting of Amounts Reclassified Out of Accumulated Other Comprehensive Income. This ASU requires an entity to provide information about the amounts reclassified out of accumulated other comprehensive income by component. In addition, an entity is required to present, either on the face of the statement where net income is presented or in the notes, significant amounts reclassified out of accumulated other comprehensive income by the respective line items of net income, but only if the amount reclassified is required under US GAAP to be reclassified to net income in its entirety in the same reporting period. For other amounts that are not required under US GAAP to be reclassified in their entirety to net income, an entity is required to cross-reference to other disclosures required under US GAAP that provide additional detail about those amounts. This ASU was required to be applied prospectively and was effective for fiscal years, and interim periods within those years, beginning after December 15, 2012. The adoption of this ASU did not have a significant impact on our Consolidated Financial Statements.
Recent Accounting Guidance Not Yet Adopted
In July 2013, the FASB issued ASU 2013-11, Income Taxes (Topic 740): Presentation of an Unrecognized Tax Benefit When a Net Operating Loss Carryforward, a Similar Tax Loss, or a Tax Credit Carryforward Exists. This ASU provides guidance on the presentation of unrecognized tax benefits. This ASU is effective for fiscal years, and interim periods within those years, beginning after December 15, 2013, and should be applied prospectively to all unrecognized tax benefits that exist at the effective date. Retrospective application is permitted. The adoption of this ASU is not anticipated to have a significant impact on our Consolidated Financial Statements.
30
HYDRO ONE INC.
MANAGEMENT’S DISCUSSION AND ANALYSIS (continued)
For the years ended December 31, 2013 and 2012
OUTLOOK
We will achieve our mission and vision and remain focused on achieving our corporate goal of providing safe, reliable and affordable service to our customers, today and tomorrow, while increasing enterprise value for our shareholder. We will do this by continuing to concentrate on our strategic objectives of safety, customer satisfaction, continuous innovation, reliability, protection of the environment, championing people and culture, shareholder value and productivity and cost-effectiveness.
Given the nature of the work undertaken by our employees and contractors, safety remains our top priority. We will continue to focus on creating an injury-free workplace and maintaining public safety through several health and safety initiatives, including maintaining our OHSAS 18001 standing.
We are focused on achieving our long-term vision of improving customer satisfaction, maintaining affordable rates for the portion of the customers’ bill within our control and building a trusted partner relationship with our customers. Our plan has taken into account discussions with our customers and reflects the planned development and delivery of targeted customer segment strategies, products and services which respond to our customers’ unique needs. This includes realizing value from our new customer information system, simplifying and shortening timeframes for the delivery of services, enhancing accessibility in person, by phone or through our web portal and/or our mobile application to ensure effective self-service for simple transactions and delivering programs which help customers better manage their energy consumption.
We will continue to focus on driving our transformation to a culture that is accountability-based. All of our management staff received training under our Craft of Management program. This program will serve as the foundation for establishing that culture of accountability. Investments in this program, coupled with existing programs which enhance employee skills and ability, will help us deliver best-in-class service to our customers, continue the drive to zero workplace injuries and create a great workplace that will lead to improved employee engagement. We remain focused on managing the resourcing requirements of an increasing work program through appropriate compensation policies, labour negotiations, use of outsourced multi-skilled staff and support of internal and external college and university training programs. Aging workforce demographics provide opportunities, through retirements, to restructure and transform the workforce.
Our assets are in the midst of a demographic change with an increasing proportion of assets reaching the end of their expected service life and an increasing average asset age. To ensure the electricity system’s reliability in the public interest, we have planned for significant investments in transmission and distribution infrastructure. Our plan includes targeted, risk-based investments to maintain, refurbish and replace existing assets that are in poor condition and beyond their expected service life, within the policy set by the OEB. Investments in technology, such as the successful implementation of Asset Analytics, has provided us with real-time asset condition and performance data giving us the visibility to make asset optimization life-cycle decisions, and opportunities through planning and scheduling data to improve materials procurement and to deploy work crews to better manage work programs to meet customer needs.
The actual timing and expenditures in our business plan are predicated on obtaining various approvals including: OEB approvals and environmental assessment approvals; successful negotiations with customers, neighbouring utilities and other stakeholders; and consultations with First Nations and Métis communities.
We continue to seek to strike the right balance between making prudent risk-based reliability investments and keeping customers’ rates low. Effectively and efficiently managing costs is an important part of achieving this balance. Over the last five years, we have replaced most of our core IT systems with an enterprise-wide IT system. Further development of the existing IT platform will provide tools which are being developed to allow us to effectively plan and reprioritize work and integrate customers’ needs into multi-year investment plans. This outcome is consistent with the OEB’s direction in its new Outcomes-Based Approach to regulation.
Our plan is focused on delivering integrated asset-to-work planning, optimized scheduling and dispatch as well as field mobility. Through our investment in our Workflow of the Future initiative we will bring together data, analytics and mobility to allow our employees, especially those in the field, to do more at the job site with their mobile devices.
Significant opportunity resides with smart meters and the proliferation of an ADS including energy efficiency, demand response and distributed-resource technologies. We will continue to invest in the development of an ADS and related grid modernization standards, customer demand work (connections and upgrades), smart meters, DG connections, including station upgrades, protection and control, new lines and some contestable work, for which we will receive customer capital contributions. There is little flexibility to reduce this work as most of it is customer demand driven.
31
HYDRO ONE INC.
MANAGEMENT’S DISCUSSION AND ANALYSIS (continued)
For the years ended December 31, 2013 and 2012
As stewards of significant electricity assets, we are committed to the protection and sustainment of the environment for future generations. We are working towards being an environmental leader in our industry, by distributing clean and renewable energy, by upgrading our electricity grid, by minimizing the impacts of our own operations, and by ensuring that environmental factors are considered in making our business decisions.
Consistent with our corporate strategy, we will pursue an LDC consolidation approach that is robust but prudent, to facilitate the consolidation of Ontario’s distribution sector. This is consistent with the Ontario Distribution Sector Panel’s assessment that there are substantial efficiencies to be found through consolidation of Ontario LDCs and we are key to the solution. Our plan does not include funding for LDC acquisitions or assume any disposition of our service territory. These opportunities will be managed as they arise. Our plan also does not incorporate any projects related to competitive transmission. However, as leaders in the sector, we plan to bid on key projects. The OEB notes in itsFramework for Transmission Project Development Plans that where projects are otherwise equivalent or close in other factors, information such as socio-economic benefits, including First Nations involvement, could prove decisive in a competitive bid. As such, First Nations involvement in competitive bids is likely to become more prevalent.
APPOINTMENT OF CARMINE MARCELLO
On November 14, 2012, our Board of Directors appointed Carmine Marcello to the role of President and CEO, effective January 1, 2013. Mr. Marcello assumed his responsibilities following the planned retirement of outgoing President and CEO Laura Formusa. Mr. Marcello has over 25 years of experience with our company as a senior executive, strategic planner and advisor on transmission and distribution utility processes in the electric utility industry.
CHANGES TO OUR BOARD OF DIRECTORS
On November 20, 2013, Sandra Pupatello was appointed to our Board of Directors. Ms. Pupatello is the Director of Business Development and Global Markets at PricewaterhouseCoopers Canada. She is also the Chief Executive Officer of the WindsorEssex Economic Development Corporation.
On November 27, 2013, Catherine Karakatsanis was appointed to our Board of Directors. Ms. Karakatsanis is the Chief Operating Officer of Morrison Hershfield Group Inc. and also serves as Director and Secretary of the Toronto-based consulting engineering firm.
On August 12, 2013, Janet Holder resigned from our Board of Directors. Ms. Holder has been a member of our Board of Directors since July 2010.
FORWARD-LOOKING STATEMENTS AND INFORMATION
Our oral and written public communications, including this document, often contain forward-looking statements that are based on current expectations, estimates, forecasts and projections about our business and the industry in which we operate, and include beliefs and assumptions made by the management of our company. Such statements include, but are not limited to: expectations regarding energy-related revenues and profit and their trend; statements regarding our transmission and distribution rates and customer bills resulting from our rate applications; statements related to the FIT program; statements about CDM; statements about our strategy, including our strategic objectives; statements regarding considerations of current economic conditions; statements related to employee future benefits; expectations regarding First Nation involvement in competitive bids; statements regarding our liquidity and capital resources and operational requirements; statements about our standby credit facility; expectations regarding our financing activities; statements regarding our maturing debt; statements regarding our ongoing and planned projects and/or initiatives including the expected results of these projects and/or initiatives (including productivity savings, process improvements, and customer satisfaction) and their completion dates; expectations regarding the recoverability of large capital investments; expectations regarding generation connection investments; statements regarding expected future capital and development investments, the timing of these expenditures and our investment plans; expectations regarding OPA recommendations; statements regarding contractual obligations and other commercial commitments; statements related to the OEB; statements regarding future pension contributions, our pension plan and actuarial valuation; statements about our outsourcing arrangement with Inergi and such future outsourcing arrangements; expectations regarding work and costs of compliance
32
HYDRO ONE INC.
MANAGEMENT’S DISCUSSION AND ANALYSIS (continued)
For the years ended December 31, 2013 and 2012
with environmental and health and safety regulations; statements related to the LTEP; and statements related to LDC consolidation including our acquisition of Norfolk Power. Words such as “expect”, “anticipate”, “intend”, “attempt”, “may”, “plan”, “will”, “believe”, “seek”, “estimate”, “goal”, “aim”, “target”, and variations of such words and similar expressions are intended to identify such forward-looking statements. These statements are not guarantees of future performance and involve assumptions and risks and uncertainties that are difficult to predict. Therefore, actual outcomes and results may differ materially from what is expressed, implied or forecasted in such forward-looking statements. We do not intend, and we disclaim any obligation, to update any forward-looking statements, except as required by law.
These forward-looking statements are based on a variety of factors and assumptions including, but not limited to the following: no unforeseen changes in the legislative and operating framework for Ontario’s electricity market; favourable decisions from the OEB and other regulatory bodies concerning outstanding rate and other applications; no delays in obtaining the required approvals; no unforeseen changes in rate orders or rate structures for our distribution and transmission businesses; continued use of US GAAP; a stable regulatory environment; no unfavourable changes in environmental regulation; and no significant event occurring outside the ordinary course of business. These assumptions are based on information currently available to us, including information obtained from third-party sources. Actual results may differ materially from those predicted by such forward-looking statements. While we do not know what impact any of these differences may have, our business, results of operations, financial condition and our credit stability may be materially adversely affected. Factors that could cause actual results or outcomes to differ materially from the results expressed or implied by forward-looking statements include, among other things:
| • | the risk that unexpected capital investments may be needed to support renewable generation or resolve unforeseen technical issues; |
| • | the risk that previously granted regulatory approvals may be subsequently challenged, appealed or overturned; |
| • | the inability to prepare financial statements in US GAAP; |
| • | the impact of the 2010 LTEP and the 2013 LTEP on our company and the costs and expenses arising therefrom; |
| • | the risk that future environmental expenditures are not recoverable in future electricity rates; |
| • | the risk that the presence of release of hazardous or harmful substances could lead to claims by third parties and/or governmental orders; |
| • | the risk that assumptions that form the basis of our recorded environmental liabilities and related regulatory assets may change; |
| • | the risks associated with information system security, with maintaining a complex information technology system infrastructure, and with transitioning most of our financial and business processes to an integrated business and financial reporting system; |
| • | the risks associated with changes in the forecast long-term Government of Canada bond yield; |
| • | the risks related to our workforce demographic and our potential inability to attract and retain qualified personnel; |
| • | public opposition to and delays or denials of the requisite approvals and accommodations for our planned projects; |
| • | the risks associated with being controlled by the Province including the possibility that the Province may make declarations pursuant to the memorandum of agreement, as well as potential conflicts of interest that may arise between us, the Province and related parties; |
| • | the risks associated with being subject to extensive regulation including risks associated with OEB action or inaction, including regulatory decisions regarding our revenue requirements, cost recovery, rates, acquisitions and divestitures; |
| • | unanticipated changes in electricity demand or in our costs; |
| • | the risk that we are not able to arrange sufficient cost-effective financing to repay maturing debt and to fund capital investments and other obligations; |
| • | the risks associated with the execution of our capital and operation, maintenance and administration programs necessary to maintain the performance of our aging asset base; |
33
HYDRO ONE INC.
MANAGEMENT’S DISCUSSION AND ANALYSIS (continued)
For the years ended December 31, 2013 and 2012
| • | the risk to our facilities posed by severe weather conditions, natural disasters or catastrophic events and our limited insurance coverage for losses resulting from these events; |
| • | future interest rates, future investment returns, inflation, changes in benefits and changes in actuarial assumptions; |
| • | the risks of counterparty default on our outstanding derivative contracts; |
| • | the risks associated with current economic uncertainty and financial market volatility; |
| • | the risk that our long-term credit rating would deteriorate; |
| • | the risk that we may incur significant costs associated with transferring assets located on Reserves (as defined in theIndian Act(Canada)); |
| • | the potential that we may incur significant expenses to replace some or all of the functions currently outsourced if our agreement with Inergi is terminated or expires before a new service provider is selected; |
| • | the impact of the ownership by the Province of lands underlying our transmission system; and |
| • | the ability to negotiate appropriate collective agreements. |
We caution the reader that the above list of factors is not exhaustive. Some of these and other factors are discussed in more detail in the section Risk Management and Risk Factors in this MD&A. You should review this section in detail.
In addition, we caution the reader that information provided in this MD&A regarding our outlook on certain matters, including potential future expenditures, is provided in order to give context to the nature of some of our future plans and may not be appropriate for other purposes.
Additional information about the Company, including the Company’s Annual Information Form, can be found on SEDAR at www.sedar.com and on the US Securities and Exchange Commission’s website at www.sec.gov.
34