SECURITIES AND EXCHANGE COMMISSION
FORM 6-K
REPORT OF FOREIGN ISSUER
PURSUANT TO RULE 13a-16 OR 15d-16 OF
THE SECURITIES EXCHANGE ACT OF 1934
Date: May 14, 2003
Commission file number:
1-15060
UBS AG
Bahnhofstrasse 45, Zurich, Switzerland, and
Aeschenvorstadt 1, Basel, Switzerland
(Registrant’s Address)
Indicate by check mark whether the registrant files or will file annual reports under cover of Form 20-F or Form 40-F.
| Form 20-F x | Form 40-F o |
Indicate by check mark whether the registrant by furnishing the information contained in this Form is also thereby furnishing the information to the Commission pursuant to Rule 12g3-2(b) under the Securities Exchange Act of 1934.
| Yes o | No x |
If “Yes” is marked, indicate below the file number assigned to the registrant in connection with Rule 12g3-2(b): 82-
This Form 6-K consists of the the First Quarter 2003 Report, which appears immediately following this page.

Financial Reporting

First Quarter 2003 Report
13 May 2003
UBS Group Financial Highlights
| Quarter ended | % change from | |||||||||||||||||||
| CHF million, except where indicated | 31.3.03 | 31.12.02 | 31.3.02 | 4Q02 | 1Q02 | |||||||||||||||
Income statement key figures | ||||||||||||||||||||
| Operating income | 7,773 | 7,524 | 9,589 | 3 | (19 | ) | ||||||||||||||
| Operating expenses | 6,177 | 7,776 | 7,750 | (21 | ) | (20 | ) | |||||||||||||
| Operating profit/(loss) before tax | 1,596 | (252 | ) | 1,839 | (13 | ) | ||||||||||||||
| Net profit/(loss) | 1,214 | (101 | ) | 1,363 | (11 | ) | ||||||||||||||
Cost/income ratio (%)1 | 78.4 | 103.5 | 80.1 | |||||||||||||||||
Per share data (CHF) | ||||||||||||||||||||
Basic earnings per share2 | 1.05 | (0.09 | ) | 1.10 | (5 | ) | ||||||||||||||
Diluted earnings per share2 | 1.02 | (0.09 | ) | 1.06 | (4 | ) | ||||||||||||||
Return on shareholders’ equity (%)3 | 13.2 | 8.9 | 12.3 | |||||||||||||||||
| % change from | ||||||||||||||||||||
| CHF million, except where indicated | ||||||||||||||||||||
| As at | 31.3.03 | 31.12.02 | 31.3.02 | 31.12.02 | 31.3.02 | |||||||||||||||
Balance sheet key figures | ||||||||||||||||||||
| Total assets | 1,232,318 | 1,181,118 | 1,229,625 | 4 | 0 | |||||||||||||||
| Shareholders’ equity | 39,764 | 38,991 | 44,769 | 2 | (11 | ) | ||||||||||||||
Market capitalization | 67,808 | 79,448 | 103,216 | (15 | ) | (34 | ) | |||||||||||||
BIS capital ratios | ||||||||||||||||||||
Tier 1 (%)4 | 11.5 | 11.3 | 11.8 | |||||||||||||||||
| Total BIS (%) | 13.6 | 13.8 | 14.7 | |||||||||||||||||
| Risk-weighted assets | 238,746 | 238,790 | 255,157 | 0 | (6 | ) | ||||||||||||||
Invested assets (CHF billion) | 1,994 | 2,037 | 2,468 | (2 | ) | (19 | ) | |||||||||||||
Headcount (full-time equivalents) | 68,395 | 69,061 | 70,221 | 5 | (1 | ) | (3 | ) | ||||||||||||
Long-term ratings | ||||||||||||||||||||
| Fitch, London | AAA | AAA | AAA | |||||||||||||||||
| Moody’s, New York | Aa2 | Aa2 | Aa2 | |||||||||||||||||
| Standard & Poor’s, New York | AA+ | AA+ | AA+ | |||||||||||||||||
Earnings adjusted for significant financial events and pre-goodwill6, 7
| Quarter ended | % change from | |||||||||||||||||||
CHF million, except where indicated | 31.3.03 | 31.12.02 | 31.3.02 | 4Q02 | 1Q02 | |||||||||||||||
| Operating income | 7,773 | 7,452 | 9,434 | 4 | (18 | ) | ||||||||||||||
| Operating expenses | 5,935 | 6,259 | 7,414 | (5 | ) | (20 | ) | |||||||||||||
| Operating profit before tax | 1,838 | 1,193 | 2,020 | 54 | (9 | ) | ||||||||||||||
| Net profit | 1,456 | 1,075 | 1,574 | 35 | (7 | ) | ||||||||||||||
Cost/income ratio (%)8 | 75.3 | 84.1 | 77.9 | |||||||||||||||||
Basic earnings per share (CHF)9 | 1.26 | 0.92 | 1.27 | 37 | (1 | ) | ||||||||||||||
Diluted earnings per share (CHF)10 | 1.23 | 0.92 | 1.23 | 34 | 0 | |||||||||||||||
Return on shareholders’ equity (%)11 | 15.8 | 13.9 | 15.2 | |||||||||||||||||
| 1 | Operating expenses/operating income less credit loss expense. | |
| 2 | For the EPS calculation, see Note 8 to the Financial Statements. | |
| 3 | Year to date annualized net profit/average shareholders’ equity less dividends. | |
| 4 | Includes hybrid Tier 1 capital, please refer to the BIS capital and ratios table in the Group Review. | |
| 5 | Klinik Hirslanden was sold on 5 December 2002. The Group headcount does not include the Klinik Hirslanden headcount of 2,687 at 31 March 2002. | |
| 6 | Excludes the amortization of goodwill and other intangible assets. | |
| 7 | Details of significant financial events can be found in the Group Review section on page 7. | |
| 8 | Operating expenses less the amortization of goodwill and other intangible assets and significant financial events/operating income less credit loss expense and significant financial events. | |
| 9 | Net profit less the amortization of goodwill and other intangible assets and significant financial events (after tax)/weighted average shares outstanding. | |
| 10 | Net profit for diluted EPS less the amortization of goodwill and other intangible assets and significant financial events (after tax) / weighted average shares outstanding for diluted EPS. | |
| 11 | Year to date annualized net profit less the amortization of goodwill and other intangible assets and significant financial events (after tax)/average shareholders’ equity less dividends. |
Throughout this report, 2002 segment results have been restated to reflect the transfer of the Private Banks & GAM to Corporate Center.
All financial information included in this report is unaudited, except for balance sheet information as at 31 December 2002, which is audited.
First Quarter 2003 Report
13 May 2003
Contents
Shareholders’ Letter | 2 | |||
Group Review | 4 | |||
UBS Wealth Management & Business Banking | 16 | |||
UBS Global Asset Management | 26 | |||
UBS Warburg | 30 | |||
UBS PaineWebber | 39 | |||
Corporate Center | 44 | |||
Financial Statements | ||||
| UBS Group Income Statement | 46 | |||
| UBS Group Balance Sheet | 47 | |||
| UBS Group Statement of Changes in Equity | 48 | |||
| UBS Group Statement of Cash Flows | 49 | |||
| Notes to the Financial Statements | 50 | |||
UBS Registered Shares | 56 |
| Financial Calendar | ||
| Publication of Second Quarter 2003 results | Wednesday, 13 August 2003 | |
| Publication of Third Quarter 2003 results | Tuesday, 11 November 2003 |
| UBS Investor Relations | ||||
| Hotline: +41 1 234 4100 | E-mail: sh-investorrelations@ubs.com | Web: www.ubs.com/investors |
| Zurich | New York | |||||
| Christian Gruetter | +41 1 234 4360 | Richard Feder | +1 212 713 6142 | |||
| Mark Hengel | +41 1 234 8439 | Christopher McNamee | +1 212 713 3091 | |||
| Oliver Lee | +41 1 234 2733 | |||||
| Catherine Lybrook | +41 1 234 2281 | |||||
| Fax | +41 1 234 3415 | Fax | +1 212 713 1381 |
| UBS AG | UBS Americas Inc. | |||
| Investor Relations G41B | Investor Relations | |||
| P.O. Box | 135 West 50th Street, 9th Floor | |||
| CH-8098 Zurich | New York, NY 10020 | |||
| Switzerland | United States of America | |||
| UBS Shareholder Services | US Transfer Agent | |||
| UBS AG | Mellon Investor Services. | |||
| Shareholder Services GUMV | Overpeck Centre | |||
| P.O. Box | 85 Challenger Road | |||
| CH-8098 Zurich | Ridgefield Park, NJ 07660 | |||
| Switzerland | United States of America | |||
| Phone: +41 1 235 62 02 | ||||
| Fax: +41 1 235 31 54 | calls from the US | +1 866 541 9689 | ||
| E-Mail: sh-shareholder-services@ubs.com | calls outside the US | +1 201 329 8451 |
Interactive First Quarter 2003 Report
An interactive version of this report can be viewed online in the First Quarter 2003 Results section of the UBS Investors & Analysts website: www.ubs.com/investors.
Other reports
All UBS’s published financial reports (including SEC filings) are available on the internet at: www.ubs.com/investors. Alternatively, printed copies of our reports can be obtained from: UBS AG, Economic Information Center, GHDE CA50-AUL, P.O. Box, CH-8098 Zurich, Switzerland. E-mail: sh-iz-ubs-publikationen@ubs.com.
1
Shareholders’ Letter
13 May 2003
Shareholders’ Letter

Dear Shareholders,
We started 2003 with a cautious outlook, and the events of this past quarter have again made revenue growth hard to find. However, UBS has once more delivered robust results in turbulent times. Indeed, through the past three years, a period of uncommon difficulty for our industry, we have never been disappointed with our overall performance. We have had no need for restructuring, for deep cuts, for changes of course — all things that can sap the confidence of clients and employees alike. Again this quarter, we have proved that we can protect and even enhance shareholder returns, despite tough markets. We kept a strong grip on costs, pushing our cost/income ratio to its lowest since mid-2001. And by managing our capital resources tightly, we have again improved the return on shareholders’ equity.
Taking a look at some business highlights for this quarter, Private Banking reported very strong net new money inflows with flows into its European wealth management initiative at record levels. UBS PaineWebber again attracted strong, positive inflows of net new money. In total, private clients placed CHF 11.1 billion in new assets with us, showing the value they place on our financial strength and individualized advisory services. Business Banking Switzerland generated higher volumes in its Swiss mortgage business, reinforcing its market leadership. UBS Global Asset Management funds continued to report strong relative investment performance while its institutional business experienced strong inflows into equity mandates. And UBS Warburg’s Fixed Income, Rates and Currencies business reported its best quarterly performance since 1999.
The new holding company comprising our five fully owned private banks and GAM, our specialist asset manager, is now set up and has begun to make changes. The three Swiss-German private banks — Armand von Ernst, Bank Ehinger and Cantrade — are now merging under the name Ehinger & Armand von Ernst.
Turning to our financial performance, net profit in first quarter 2003 was CHF 1,214 million, down 11% from the same quarter a year earlier. Before goodwill and adjusted for the gain from the sale of Hyposwiss in first quarter 2002, net profit fell just 7%.
Compared to the same period a year earlier, income and expenses in first quarter 2003 were both significantly impacted by the US dollar’s 20% weakening against the Swiss franc, with about half of the overall change in both measures driven by currency moves. In fact, this effect accounts for almost the entire 7% year-on-year drop in adjusted profit.
Operating income was down 19% from a year earlier, and, adjusted for the sale of Hyposwiss, it was 18% lower. Apart from the currency effects, the decrease was mainly due to poor equities trading conditions and low equity
2
market levels, which affected asset-based revenues. Encouragingly, private equity writedowns at UBS Capital returned to more moderate levels, decreasing to CHF 123 million in first quarter 2003 from CHF 383 million in the same quarter a year earlier. Our fixed income business contributed significantly in near-perfect trading conditions. Revenues in the Fixed Income, Rates and Currencies business rose 4% from a year earlier and doubled compared to fourth quarter 2002, despite the negative currency effect.
Our credit businesses, despite another quarter of generally weak economic conditions, have again proved resilient. Aggregate net credit loss expense during the quarter amounted to CHF 104 million, compared to CHF 85 million in the same quarter in 2002 and the net recovery of CHF 11 million we recorded in fourth quarter 2002.
Costs remained under tight control. Operating expenses fell 20% when compared to first quarter 2002, reaching their lowest level since the merger with PaineWebber. General and administrative expenses were cut in practically all business areas and sectors. Performance-related compensation also fell.
9 June 2003 — one firm, one brand
All our businesses will operate under the single brand UBS from 9 June. Preparations are well on track and at UBS we are proud of this significant milestone in our corporate history. A single brand mirrors our integrated business model, the way we deliver ‘one firm’ to our clients, allowing them to access all of our services wherever and whenever they are required.
Our new brand strategy is also an important cornerstone in our organic growth drive. In the financial services industry, a strong brand is one of the major factors influencing new client acquisition and retention. It can be the deciding factor behind clients’ choice of financial provider. For any company, however, a brand is not only a name or a logo. It should represent how a company defines itself. For our clients, UBS stands for the relentless pursuit of their success, giving them access to proactive advice and all the resources of a global powerhouse. With UBS they should always feel confident they have made the right financial decision.
Outlook
Markets and trading conditions are tough and will likely remain so. But while some further degree of volatility cannot be excluded, we do feel that the downward pressure on our industry from the business and market environment could be beginning to ease and that the worst earnings declines may be behind us.
Our businesses are proving highly competitive and we remain convinced that our strategy is the right one. Although the timing of a return to sustained revenue growth is hard to predict, we are still in a position to protect and enhance shareholder returns by flexing costs and tightly managing capital. At the same time, because of our successful strategic initiatives, we continue to be well placed to profit from growth opportunities as they arise.
13 May 2003
UBS AG
 |  | |
| Marcel Ospel Chairman | Peter Wuffli President |
3
Group Review
13 May 2003
Group Review
Cantrade, Bank Ehinger and Armand von Ernst merge
On 18 February 2003, UBS announced the creation of a holding company for its five fully owned independent private banking subsidiaries (Armand von Ernst, Banco di Lugano, Bank Ehinger, Cantrade and Ferrier Lullin) and GAM, its specialist asset manager.
Three of the five subsidiaries (Armand von Ernst, Bank Ehinger and Cantrade) will now merge to form Ehinger & Armand von Ernst with the new legal structure retroactively effective to 1 January 2003. Full operational integration of the three banks is expected to be complete by 1 January 2004. The new bank, headquartered in Zurich, with branches in Basel and Berne, will be one of the most important providers of private banking services located in the Swiss-German part of Switzerland. The merger is designed to capture the potential for cost synergies among the three banks.
GAM, Ferrier Lullin and Banco di Lugano are not affected by the merger and will continue to service their clients under their present brands.
Transfer of the Private Banks & GAM to the Corporate Center
On 25 April 2003 we published results for 2002, 2001 and 2000 that reflect the revised structure for GAM and the private banks. Moving these businesses affects the income statement and key performance indicators (KPIs) of Private Banking, UBS Global Asset Management and the Corporate Center. From now on, separate information will be provided on the holding company’s performance before tax, net new money, invested assets, and headcount.
None of the above-mentioned changes have an impact on the UBS Group Financial Statements.
4
UBS Group Performance Against Targets
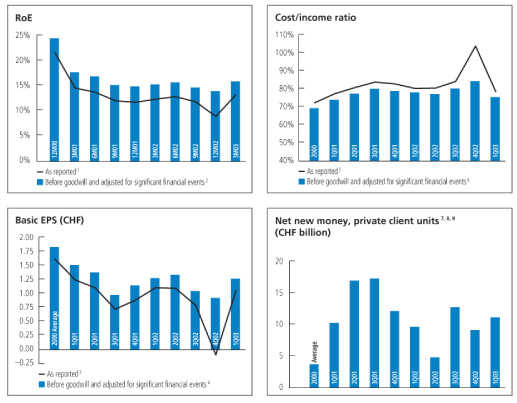
| Year to date, annualized | 31.3.03 | 31.12.02 | 31.3.02 | |||||||||
RoE (%) | ||||||||||||
as reported1 | 13.2 | 8.9 | 12.3 | |||||||||
before goodwill and adjusted for significant financial events2 | 15.8 | 13.9 | 15.2 | |||||||||
For the quarter ended | 31.3.03 | 31.12.02 | 31.3.02 | |||||||||
Basic EPS (CHF) | ||||||||||||
as reported3 | 1.05 | (0.09 | ) | 1.10 | ||||||||
before goodwill and adjusted for significant financial events4 | 1.26 | 0.92 | 1.27 | |||||||||
| Cost/income ratio (%) | ||||||||||||
as reported5 | 78.4 | 103.5 | 80.1 | |||||||||
before goodwill and adjusted for significant financial events6 | 75.3 | 84.1 | 77.9 | |||||||||
Net new money, private client units (CHF billion)7, 8 | ||||||||||||
| Private Banking | 7.4 | 2.8 | 2.2 | |||||||||
| UBS PaineWebber | 3.7 | 6.3 | 7.4 | |||||||||
Total | 11.1 | 9.1 | 9.6 | |||||||||
| 1 | Year to date annualized net profit/average shareholders’ equity less dividends. | |
| 2 | Year to date annualized net profit less the amortization of goodwill and other intangible assets and significant financial events (after tax)/average shareholders’ equity less dividends. | |
| 3 | For the EPS calculation, see Note 8 to the Financial Statements. | |
| 4 | Net profit less the amortization of goodwill and other intangible assets and significant financial events (after tax)/ weighted average shares outstanding. | |
| 5 | Operating expenses/operating income less credit loss expense. | |
| 6 | Operating expenses less the amortization of goodwill and other intangible assets and significant financial events/operating income less credit loss expense and significant financial events. | |
| 7 | Excludes interest and dividend income. | |
| 8 | Restated to reflect the transfer of Private Banks & GAM to Corporate Center. | |
| 9 | Private Banking and UBS PaineWebber. |
5
Group Review
13 May 2003
Results
In first quarter 2003, UBS reported a net profit of CHF 1,214 million, compared to a net profit of CHF 1,363 million in first quarter 2002. Before goodwill and adjusted for the first quarter 2002 after-tax gain of CHF 125 million due to the sale of Hyposwiss, net profit declined 7% from first quarter 2002. Our continued success at cutting costs across our businesses offset much of the negative impact of falling markets on asset-based fees, and falling equities-related income.
Annualized return on equity for first quarter 2003 was 13.2%, compared to 12.3% a year earlier. Basic earnings per share were CHF 1.05 in first quarter, against CHF 1.10 in the same quarter a year earlier. The cost/income ratio was 78.4% in first quarter 2003, down from 80.1% a year earlier.
Group targets
UBS’s performance is reported in accordance with International Financial Reporting Standards (IFRS — formerly known as International Accounting Standards (IAS)). Additionally, we provide comments and analysis on an adjusted basis which excludes from the reported amounts certain items we term significant financial events (SFEs). An additional adjustment we use in our results discussion is the exclusion of the amortization of goodwill and other acquired intangible assets.
These adjustments reflect our internal analysis approach where SFE-adjusted figures before the amortization of goodwill and intangibles are used to assess past performance against peers and to estimate future growth potential. In particular, our financial targets have been set in terms of adjusted results, excluding SFEs and the amortization of goodwill and intangibles. All the analysis provided in our internal management accounting is based on operational SFE-adjusted performance. This helps us to illustrate the underlying operational performance of our business, insulated from the impact of individual gain or loss items that are not relevant to our management’s business planning decisions. A policy approved by the Group Executive Board defines which items may be classified as SFEs.
We focus on four key performance targets, designed to deliver continually improving returns to our shareholders. These targets are evaluated on this adjusted basis.
Accordingly, before goodwill and adjusted for the sale of Hyposwiss in first quarter 2002:
| • | Our annualized return on equity for first quarter 2003 was 15.8%, up from 15.2% in the same quarter a year ago and back within our target range of 15-20%. Our ongoing commitment to reducing equity through share buyback programs more than offset the market-related decline in earnings. | |
| • | Basic earnings per share in first quarter 2003 were CHF 1.26, just below CHF 1.27 in the same quarter last year. The 7% decline in profit was again offset by the reduced average number of shares outstanding, driven by our ongoing share buyback programs. |
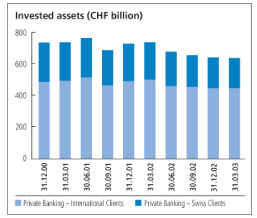
Invested Assets
| Quarter ended | % change | |||||||||||||||||||
| CHF billion | 31.3.03 | 31.12.02 | 31.3.02 | 31.12.02 | 31.3.02 | |||||||||||||||
UBS Group | 1,994 | 2,037 | 2,468 | (2 | ) | (19 | ) | |||||||||||||
UBS Wealth Management & Business Banking | ||||||||||||||||||||
| Private Banking | 638 | 642 | 737 | (1 | ) | (13 | ) | |||||||||||||
| Business Banking Switzerland | 197 | 205 | 219 | (4 | ) | (10 | ) | |||||||||||||
UBS Global Asset Management | ||||||||||||||||||||
| Institutional | 264 | 274 | 324 | (4 | ) | (19 | ) | |||||||||||||
| Wholesale Intermediary | 255 | 259 | 327 | (2 | ) | (22 | ) | |||||||||||||
UBS Warburg | 3 | 3 | 1 | 0 | 200 | |||||||||||||||
UBS PaineWebber | 569 | 584 | 779 | (3 | ) | (27 | ) | |||||||||||||
Corporate Center | ||||||||||||||||||||
| Private Banks & GAM | 68 | 70 | 81 | (3 | ) | (16 | ) | |||||||||||||
6
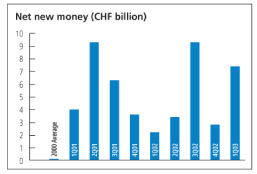
Net New Money1
| Quarter ended | ||||||||||||
| CHF billion | 31.3.03 | 31.12.02 | 31.3.02 | |||||||||
UBS Group | 17.1 | 9.0 | 11.8 | |||||||||
UBS Wealth Management & Business Banking | ||||||||||||
| Private Banking | 7.4 | 2.8 | 2.2 | |||||||||
| Business Banking Switzerland | (1.9 | ) | (2.7 | ) | 2.3 | |||||||
UBS Global Asset Management | ||||||||||||
| Institutional | 3.9 | 2.4 | (1.9 | ) | ||||||||
| Wholesale Intermediary | 3.4 | (0.8 | ) | 0.5 | ||||||||
UBS Warburg | 0.0 | 0.1 | 0.1 | |||||||||
UBS PaineWebber | 3.7 | 6.3 | 7.4 | |||||||||
Corporate Center | ||||||||||||
| Private Banks & GAM | 0.6 | 0.9 | 1.2 | |||||||||
1 Excludes interest and dividend income.
| • | The cost/income ratio this quarter was 75.3%, a decrease from 77.9% in first quarter last year and at the lowest since second quarter 2001. Our ongoing cost initiatives, particularly in UBS PaineWebber, UBS Warburg’s Corporate and Institutional Clients unit as well as in the Business Banking Switzerland unit, as well as the return of private equity writedowns to more moderate levels, more than offset the effects on revenues of declining market valuations and poor equity trading conditions. |
Net new money in the private client units (Private Banking and UBS PaineWebber) was again strong, with inflows of CHF 11.1 billion this quarter, up CHF 2.0 billion from the strong fourth quarter result. In particular, our European wealth management initiative continues to report strong inflows with a record result of CHF 3.0 billion in first quarter 2003. In the US, UBS PaineWebber’s net new money inflow was CHF 3.7 billion, down from CHF 6.3 billion in fourth quarter 2002, but still highly satisfactory given the market environment, and the difficulty competitors are experiencing in attracting new funds.
Significant financial events
There were no significant financial events in first quarter 2003, but there were two significant financial events in fourth quarter 2002 and one in first quarter 2002.
| • | In fourth quarter 2002, UBS recorded a non-cash net writedown of CHF 953 million (pre-tax CHF 1,234 million) for the PaineWebber brand that was held as an intangible asset on our balance sheet. The writedown was due to our decision, announced in November 2002, to move to the single UBS brand. The new brand structure will be implemented in June 2003. | |
| • | We realized a net gain of CHF 60 million (pre-tax CHF 72 million) in fourth quarter 2002 from the sale of Klinik Hirslanden, a private hospital group. | |
| • | In first quarter 2002, we realized a net gain of CHF 125 million (pre-tax CHF 155 million) from the sale of Hyposwiss. |
Details of significant financial events and a reconciliation between the IFRS numbers and the adjusted IFRS numbers for these quarters are shown in the table on page 8.
Group results
Operating income
Total operating income was CHF 7,773 million in first quarter 2003, a decrease of 19% compared to a year earlier. Adjusted for the gain from the sale of Hyposwiss, operating income dropped by 18% compared to the same quarter a year earlier. The remaining drop was mainly due to low equity market levels, which continue to affect asset-based revenues. Revenues were influenced by the significant drop of major currencies against the Swiss franc, accounting for half of the decline. Income was also negatively influenced
7
Group Review
13 May 2003
Significant Financial Events (SFE)
| UBS | ||||||||||||||||||||||||||||
| UBS Group | PaineWebber | Corporate Center | ||||||||||||||||||||||||||
| CHF million | ||||||||||||||||||||||||||||
| For the quarter ended | Line affected in Income Statement | 31.3.03 | 31.12.02 | 31.3.02 | 31.12.02 | 31.12.02 | 31.3.02 | |||||||||||||||||||||
Operating income | ||||||||||||||||||||||||||||
As reported | 7,773 | 7,524 | 9,589 | 1,213 | 591 | 721 | ||||||||||||||||||||||
| Less: Gain on disposal of Hyposwiss | Other income | 155 | 155 | |||||||||||||||||||||||||
| Less: Gain on disposal of Klinik Hirslanden | Other income | 72 | 72 | |||||||||||||||||||||||||
Adjusted operating income | 7,773 | 7,452 | 9,434 | 1,213 | 519 | 566 | ||||||||||||||||||||||
Operating expenses | ||||||||||||||||||||||||||||
As reported | 6,177 | 7,776 | 7,750 | 2,581 | 621 | 528 | ||||||||||||||||||||||
| Less: Writedown of PaineWebber brand name | Amortization of goodwill | |||||||||||||||||||||||||||
| and other intangible assets | 1,234 | 1,234 | ||||||||||||||||||||||||||
Adjusted operating expenses | 6,177 | 6,542 | 7,750 | 1,347 | 621 | �� | 528 | |||||||||||||||||||||
Operating profit/(loss) | ||||||||||||||||||||||||||||
Operating profit/(loss) before tax and minority interests | 1,596 | (252 | ) | 1,839 | (1,368 | ) | (30 | ) | 193 | |||||||||||||||||||
| SFE adjustments, net | 1,162 | (155 | ) | 1,234 | (72 | ) | (155 | ) | ||||||||||||||||||||
Adjusted operating profit before tax and minority interests | 1,596 | 910 | 1,684 | (134 | ) | (102 | ) | 38 | ||||||||||||||||||||
Net profit/(loss) | ||||||||||||||||||||||||||||
As reported | 1,214 | (101 | ) | 1,363 | ||||||||||||||||||||||||
| SFE adjustments, net | 1,162 | (155 | ) | |||||||||||||||||||||||||
| Tax effect of significant financial events, net | Tax expense/(benefit) | (269 | ) | 30 | ||||||||||||||||||||||||
Adjusted net profit | 1,214 | 792 | 1,238 | |||||||||||||||||||||||||
| Amortization of goodwill and other intangible assets | 242 | 283 | 1 | 336 | ||||||||||||||||||||||||
Adjusted net profit before goodwill | 1,456 | 1,075 | 1,574 | |||||||||||||||||||||||||
1 Excludes significant financial event: Writedown of PaineWebber brand name of CHF 1,234 million (net of taxes: CHF 953 million).
by continued poor trading conditions in equity markets, as well as weak investor sentiment, particularly in the US. Private equity writedowns, however, returned to more moderate levels.
Net interest income and net trading income. Net interest income of CHF 2,909 million in first quarter 2003 was 5% higher than the same quarter a year ago. Net trading income declined 36% from CHF 1,983 million in first quarter 2002 to CHF 1,261 million in first quarter 2003.
As well as income from interest margin based activities (loans and deposits), net interest income includes income earned as a result of trading activities (for example, coupon and dividend income). This component is volatile from period to period, depending on the composition of the trading portfolio. In order to provide a better explanation of the movements in net interest income and net trading income, we analyze the total according to the business activities that give rise to the income, rather than by the type of income generated.
Net income from interest margin products dropped by 10% to CHF 1,285 million in first quarter 2003 from CHF 1,423 million in the same quarter a year earlier, mainly reflecting lower interest margins on cash accounts due to the particularly low interest rate environment as well as a decline in the Swiss franc equivalent of US dollar interest rate revenues. This was partially offset by increased volumes of mortgages and savings accounts.
Net income from trading activities was CHF 2,761 million in first quarter 2003, a drop of 16% compared to the same quarter a year ago. Equity trading revenues, at CHF 315 million, dropped by 57% compared to the same quarter a year earlier. Conditions were dictated by low market volumes and a lack of corporate
8
Net Interest and Trading Income
| Quarter ended | % change from | ||||||||||||||||||||
| CHF million | 31.3.03 | 31.12.02 | 31.3.02 | 4Q02 | 1Q02 | ||||||||||||||||
| Net interest income | 2,909 | 2,697 | 2,763 | 8 | 5 | ||||||||||||||||
| Net trading income | 1,261 | 666 | 1,983 | 89 | (36 | ) | |||||||||||||||
Total net interest and trading income | 4,170 | 3,363 | 4,746 | 24 | (12 | ) | |||||||||||||||
| Breakdown by business activity: | |||||||||||||||||||||
| Net income from interest margin products | 1,285 | 1,296 | 1,423 | (1 | ) | (10 | ) | ||||||||||||||
| Equities | 315 | 522 | 731 | (40 | ) | (57 | ) | ||||||||||||||
| Fixed income | 2,000 | 1,050 | 2,155 | 90 | (7 | ) | |||||||||||||||
| Foreign exchange | 370 | 328 | 342 | 13 | 8 | ||||||||||||||||
| Other | 76 | 71 | 54 | 7 | 41 | ||||||||||||||||
| Net income from trading activities | 2,761 | 1,971 | 3,282 | 40 | (16 | ) | |||||||||||||||
| Net income from treasury activities | 384 | 435 | 419 | (12 | ) | (8 | ) | ||||||||||||||
Other1 | (260 | ) | (339 | ) | (378 | ) | 23 | 31 | |||||||||||||
Total net interest and trading income | 4,170 | 3,363 | 4,746 | 24 | (12 | ) | |||||||||||||||
1 Principally external funding costs of the Paine Webber Group, Inc. acquisition.
activity, and revenues from proprietary trading dropped significantly. Fixed income trading revenues dropped from CHF 2,155 million in first quarter 2002 to CHF 2,000 million in this quarter. The drop was due to the US dollar’s decline against the Swiss franc. Excluding the effect of the weakening US dollar, fixed income had a much stronger quarter than a year ago, reflecting a buoyant trading environment benefiting from low rates and a steep yield curve. Particularly strong results were posted in Principal Finance, Cash and Collateral Trading, and Mortgage Trading. Negative revenues of CHF 38 million relating to Credit Default Swaps (CDS) hedging existing credit exposures in the loan book reflected the general narrowing of credit spreads. Foreign exchange trading revenues showed another strong quarter, with revenues increasing from CHF 342 million in first quarter 2002 to CHF 370 million in first quarter 2003, due to higher client volumes.
Net income from treasury activities dropped from CHF 419 million in first quarter 2002 to CHF 384 million this quarter. The decline was driven by a drop in unrealized gains from derivatives used to economically hedge interest rate risk related to structured notes issued.
Other net trading and interest income showed negative revenue of CHF 260 million in first quarter 2003 compared to negative CHF 378 million in the same quarter last year. Lower goodwill funding costs, reflecting the weakening of the US dollar against the Swiss franc, were responsible for the decline.
Net fee and commission income was CHF 3,826 million in first quarter 2003, a decrease of 21% from first quarter 2002’s CHF 4,870 million, mainly due to market-driven declines in asset-based fees, as well as low levels of investor activity, pushing down brokerage income and investment fund sales fees. Underwriting fees, at CHF 437 million in first quarter 2003, were down 12% from the same period a year earlier, reflecting the dormant equity underwriting market, partially offset by strong fixed income underwriting revenues, which rose 68%. Corporate finance fees, at CHF 114 million, dropped by 36% from first quarter 2002, reflecting a global fee pool at its second lowest quarterly level in six years. Net brokerage fees fell 31% to CHF 895 million in first quarter 2003 due to very low individual and institutional client activity in common with global market experience. At CHF 882 million, investment fund fees dropped 20% compared to first quarter 2002. Both sales fees as well as asset-based commissions were lower. Portfolio and other management and advisory fees decreased 22% to CHF 901 million in first quarter 2003, resulting from both lower performance fees, and from management fees, pushed down by market levels.
9
Group Review
13 May 2003
Other income decreased by CHF 177 million from a gain of CHF 58 million in first quarter 2002 to a loss of CHF 119 million in first quarter 2003. This drop is mainly due to the fall-off of revenues from the Klinik Hirslanden business sold in fourth quarter 2002, a significant writedown of our stake in Swiss International Airlines Ltd, and the absence of divestment gains. Impairment charges in our private equity portfolio were, however, much reduced.
Operating expenses
We continue to cut into our cost base, with stringent cost control measures in place across the firm. Total operating expenses, at CHF 6,177 million in first quarter 2003, were 20% lower than the CHF 7,750 million in first quarter 2002. This very significant drop brought our total operating expenses to their lowest level since the merger with PaineWebber, and reflected a sharp decline in both personnel and general and administrative expenses, down 21% and 18% respectively from the same quarter a year earlier. The drop was accentuated by the fall of major currencies against the Swiss franc as well as the 2002 sale of Klinik Hirslanden.
Personnel expenses dropped from CHF 5,317 million in first quarter 2002 to CHF 4,202 million this quarter, reflecting a drop in UBS Warburg’s compensation ratio and declining salaries due to headcount reductions, mainly in the Business Banking Switzerland and UBS PaineWebber units. Accruals for performance-related compensation fell in line with revenues. Personnel expenses are managed on a full year basis with final fixing of annual performance-related payments in the fourth quarter.
First quarter 2003 general and administrative expenses, at CHF 1,397 million, were the lowest since the merger with PaineWebber, and 18% less than in first quarter a year ago, with declines reported in almost all categories of costs. Professional fees, administration costs, travel and entertainment and IT expenses were at their lowest levels since 2000. Marketing and public relations expenses also showed significant drops. Both the Corporate and Institutional Clients and Business Banking Switzerland units posted record low general and administrative expenses.
Depreciation dropped 15% from CHF 397 million in first quarter 2002 to CHF 336 million in
Allowances and provisions for credit risk
| UBS Wealth Management & | ||||||||
| Business Banking | ||||||||
| CHF million | ||||||||
| As at | 31.3.03 | 31.12.02 | ||||||
| Loans to banks (gross) | 3,433 | 3,292 | ||||||
| Loans to customers (gross) | 168,550 | 165,814 | ||||||
| Gross loans | 171,983 | 169,106 | ||||||
| Non-performing loans | 4,952 | 5,032 | ||||||
| Other impaired loans | 3,146 | 3,332 | ||||||
Total impaired loans | 8,098 | 8,364 | ||||||
| Allowances for non-performing loans | 2,927 | 2,749 | ||||||
| Allowances for other impaired loans | 565 | 824 | ||||||
Total allowances for impaired loans | 3,492 | 3,573 | ||||||
Other allowances and provisions | 381 | 452 | ||||||
Total allowances and provisions | 3,873 | 4,025 | ||||||
of which country allowances and provisions | 527 | 515 | ||||||
Ratios | ||||||||
| Impaired loans as a % of gross loans | 4.7 | 4.9 | ||||||
| Non-performing loans as a % of gross loans | 2.9 | 3.0 | ||||||
| Allowances and provisions for credit loss as a % of gross loans | 2.3 | 2.4 | ||||||
| Allocated allowances as a % of impaired loans | 43.1 | 42.7 | ||||||
| Allocated allowances as a % of non-performing loans | 59.1 | 54.6 | ||||||
10
the same quarter this year, mainly reflecting lower IT and property-related charges.
Amortization of goodwill and other intangible assets decreased from CHF 336 million in first quarter 2002 to CHF 242 million this quarter, reflecting the writedown of the PaineWebber brand name in fourth quarter 2002, as well the drop of the US dollar against the Swiss franc.
Tax
The Group tax expense of CHF 310 million in first quarter 2003 reflects an effective tax rate of 19.4%, compared to last year’s rate of 16.5% (before significant financial events), which was driven by particularly low progressive tax rates in Switzerland, the ability to benefit from tax losses in the US and UK and a high proportion of earnings generated in lower tax jurisdictions. We believe that an underlying tax rate of around 20% (before significant financial events) is a reasonable indicator for the remainder of the year, driven by a change in regional profit mix resulting in higher progressive Swiss tax rates.
Credit risk
Our credit portfolios have again been very resilient despite continued economic weakness worldwide. Aggregate net credit loss expense during the quarter was CHF 104 million compared to CHF 85 million in first quarter 2002 and a net writeback of CHF 11 million in fourth quarter 2002.
This continued strong performance is the result of ongoing low requirements for new provisions. The small increase in net credit loss expenses was due to less releases of provisions compared to fourth quarter 2002 which was affected by significant recoveries of country provisions due to the successful exposure reductions in Indonesia and Brazil.
UBS Wealth Management & Business Banking reported a credit loss expense of CHF 64 million in first quarter, roughly on par with the CHF 60 million last quarter and CHF 61 million in first quarter a year earlier. The continued relatively low level of credit losses in Switzerland in face of a deteriorating economic climate reflects the result of our efforts to upgrade our domestic credit portfolio in recent years and to reduce our portfolio of impaired loans.
| UBS Global | ||||||||||||||||||||||||||||||||||||||||
| Asset Management | UBS Warburg | UBS PaineWebber | Corporate Center | UBS Group | ||||||||||||||||||||||||||||||||||||
| 31.3.03 | 31.12.02 | 31.3.03 | 31.12.02 | 31.3.03 | 31.12.02 | 31.3.03 | 31.12.02 | 31.3.03 | 31.12.02 | |||||||||||||||||||||||||||||||
| 147 | 285 | 25,259 | 24,495 | 1,301 | 1,327 | 3,948 | 3,512 | 34,088 | 32,911 | |||||||||||||||||||||||||||||||
| 41 | 28 | 33,857 | 37,223 | 11,409 | 11,530 | 1,967 | 1,864 | 215,824 | 216,459 | |||||||||||||||||||||||||||||||
| 188 | 313 | 59,116 | 61,718 | 12,710 | 12,857 | 5,915 | 5,376 | 249,912 | 249,370 | |||||||||||||||||||||||||||||||
| 0 | 0 | 1,008 | 967 | 29 | 29 | 1 | 1 | 5,990 | 6,029 | |||||||||||||||||||||||||||||||
| 0 | 0 | 927 | 996 | 0 | 0 | 4 | 8 | 4,077 | 4,336 | |||||||||||||||||||||||||||||||
| 0 | 0 | 1,935 | 1,963 | 29 | 29 | 5 | 9 | 10,067 | 10,365 | |||||||||||||||||||||||||||||||
| 0 | 0 | 785 | 706 | 29 | 29 | 1 | 1 | 3,742 | 3,485 | |||||||||||||||||||||||||||||||
| 0 | 0 | 513 | 575 | 0 | 0 | 8 | 8 | 1,086 | 1,407 | |||||||||||||||||||||||||||||||
| 0 | 0 | 1,298 | 1,281 | 29 | 29 | 9 | 9 | 4,828 | 4,892 | |||||||||||||||||||||||||||||||
| 0 | 0 | 249 | 264 | 12 | 13 | 0 | 0 | 642 | 729 | |||||||||||||||||||||||||||||||
| 0 | 0 | 1,547 | 1,545 | 41 | 42 | 9 | 9 | 5,470 | 5,621 | |||||||||||||||||||||||||||||||
| 0 | 0 | 212 | 221 | 0 | 0 | 0 | 0 | 739 | 736 | |||||||||||||||||||||||||||||||
| 3.3 | 3.2 | 0.2 | 0.2 | 0.1 | 0.2 | 4.0 | 4.2 | |||||||||||||||||||||||||||||||||
| 1.7 | 1.6 | 0.2 | 0.2 | 0.0 | 0.0 | 2.4 | 2.4 | |||||||||||||||||||||||||||||||||
| 2.6 | 2.5 | 0.3 | 0.3 | 0.2 | 0.2 | 2.2 | 2.3 | |||||||||||||||||||||||||||||||||
| 67.1 | 65.3 | 100.0 | 100.0 | 180.0 | 100.0 | 48.0 | 47.2 | |||||||||||||||||||||||||||||||||
| 77.9 | 73.0 | 100.0 | 100.0 | 100.0 | 100.0 | 62.5 | 57.8 | |||||||||||||||||||||||||||||||||
11
Group Review
13 May 2003
Actual credit loss expense/(recovery)
| Quarter ended | % change from | |||||||||||||||||||
| CHF million | 31.3.03 | 31.12.02 | 31.3.02 | 4Q02 | 1Q02 | |||||||||||||||
| UBS Wealth Management & Business Banking | 64 | 60 | 61 | 7 | 5 | |||||||||||||||
| UBS Warburg | 40 | (72 | ) | 31 | 29 | |||||||||||||||
| UBS PaineWebber | 0 | 1 | 3 | (100 | ) | (100 | ) | |||||||||||||
| Corporate Center | 0 | 0 | (10 | ) | 100 | |||||||||||||||
UBS Group | 104 | (11 | ) | 85 | 22 | |||||||||||||||
Credit loss expense at UBS Warburg was CHF 40 million, after a net recovery of CHF 72 million in fourth quarter and a credit loss expense of CHF 31 million in first quarter 2002. In light of the continued high level of corporate defaults being experienced on a global scale, the performance of UBS Warburg’s credit portfolio has been very strong, and there were very few new impairments in the quarter.
UBS’s loan portfolio amounted to CHF 249.9 billion on 31 March 2003, almost unchanged from CHF 249.4 billion on 31 December 2002. As announced previously and reported elsewhere, the five independent Swiss private banks and GAM have been moved to Corporate Center. Although of minor importance in the credit business, the corresponding effects have been factored into the comparative December 2002 loan and related figures shown in the table on page 10 and 11.
Helped by growth in our Swiss residential mortgage lending business, the loan book of UBS Wealth Management & Business Banking increased by CHF 2.9 billion or 1.7% in the three months between 31 December 2002 and 31 March 2003. On the other hand, the volume of UBS Warburg’s gross loans decreased by CHF 2.6 billion, while unutilized committed credit facilities increased by CHF 2.5 billion. UBS PaineWebber’s loan portfolio was CHF 12.7 billion on 31 March 2003, down 1.1% from CHF 12.9 billion on 31 December 2002, mainly a reflection of the weaker US dollar.
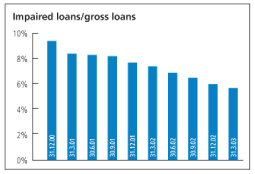
Total impaired loans decreased to CHF 10,067 million on 31 March 2003 from CHF 10,365 million on 31 December 2002 as the continued high level of workouts of recovery positions more than compensated for new impairments. As a result, the impaired loans to total loans ratio again improved, falling to 4.0% in first quarter from 4.2% in the previous quarter.
Market risk
Market risk is incurred primarily through UBS’s trading activities, which are centered in the UBS Warburg Business Group.
Market risk for UBS Warburg, as measured by average 10-day 99% confidence level Value at Risk (VaR) increased to CHF 350 million from CHF 295 million in fourth quarter 2002. The overall increase in average VaR came mainly from interest rate products which, together with equity products, remained the predominant risk drivers.
12
UBS Group: Value at Risk (10-day 99% confidence)
| Quarter ended 31.3.03 | Quarter ended 31.12.02 | |||||||||||||||||||||||||||||||||||
| CHF million | Limits | Min. | Max. | Average | 31.3.03 | Min. | Max. | Average | 31.12.02 | |||||||||||||||||||||||||||
Business Groups | ||||||||||||||||||||||||||||||||||||
| UBS Warburg | 450 | 290.4 | 447.0 | 350.0 | 300.0 | 243.7 | 389.6 | 295.0 | 310.0 | |||||||||||||||||||||||||||
| UBS PaineWebber | 50 | 11.4 | 18.4 | 15.3 | 11.7 | 12.2 | 22.9 | 16.9 | 14.2 | |||||||||||||||||||||||||||
| UBS Global Asset Management | 30 | 8.2 | 15.6 | 10.5 | 10.3 | 7.0 | 13.1 | 10.2 | 8.6 | |||||||||||||||||||||||||||
| UBS Wealth Management & Business Banking | 50 | 3.5 | 4.7 | 4.1 | 3.6 | 4.1 | 6.2 | 4.7 | 4.1 | |||||||||||||||||||||||||||
Corporate Center1, 2 | 150 | 59.6 | 82.7 | 70.5 | 65.1 | 37.5 | 63.7 | 44.7 | 62.1 | |||||||||||||||||||||||||||
| Reserve | 150 | |||||||||||||||||||||||||||||||||||
| Diversification effect | 3 | 3 | (89.2 | ) | (73.2 | ) | 3 | 3 | (75.0 | ) | (86.6 | ) | ||||||||||||||||||||||||
Total | 600 | 297.5 | 461.7 | 361.1 | 317.5 | 247.9 | 373.9 | 296.5 | 312.4 | |||||||||||||||||||||||||||
1 Includes interest rate exposures in the banking books of the Private Banks.2 Includes interest rate exposures in the banking book of Group Treasury.3 As the minimum and maximum occur on different days for different Business Groups, it is not meaningful to calculate a portfolio diversification effect.
UBS Warburg — Corporate and Institutional Clients: Value at Risk (10-day 99% confidence)
| Quarter ended 31.3.03 | Quarter ended 31.12.02 | |||||||||||||||||||||||||||||||
| CHF million | Min. | Max. | Average | 31.3.03 | Min. | Max. | Average | 31.12.02 | ||||||||||||||||||||||||
Risk type | ||||||||||||||||||||||||||||||||
| Equities | 160.6 | 186.3 | 172.5 | 160.8 | 165.2 | 293.0 | 195.4 | 178.3 | ||||||||||||||||||||||||
| Interest rates | 251.1 | 428.1 | 319.6 | 280.4 | 168.7 | 303.4 | 234.9 | 280.9 | ||||||||||||||||||||||||
| Foreign exchange | 6.6 | 28.8 | 14.3 | 21.8 | 6.2 | 62.2 | 25.3 | 9.6 | ||||||||||||||||||||||||
Other (incl. energy)1 | 10.5 | 51.3 | 17.4 | 16.8 | 10.3 | 31.5 | 15.9 | 12.6 | ||||||||||||||||||||||||
| Diversification effect | 2 | 2 | (173.9 | ) | (179.8 | ) | 2 | 2 | (176.5 | ) | (171.4 | ) | ||||||||||||||||||||
Total | 290.4 | 447.0 | 350.0 | 300.0 | 243.7 | 389.6 | 295.0 | 310.0 | ||||||||||||||||||||||||
1 Includes energy risk from UBS Warburg Energy and precious metals risk.2 As the minimum and maximum occur on different days for different risk types, it is not meaningful to calculate a portfolio diversification effect.
Equity markets have been particularly volatile and trading conditions unattractive, but we have taken advantage of excellent opportunities in the fixed income markets. We continue to avoid risk concentrations of any kind and to hedge tail risk. Overall, there was no change in strategy and risk appetite and we continue to operate within our VaR limits.
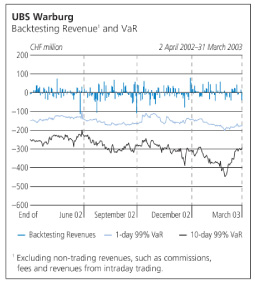
The quality of the VaR model is continuously monitored by backtesting - comparing actual revenues arising from closing positions (i. e. excluding intraday revenues, fees and commissions) with the 1-day VaR calculated on these positions. The graph on page 12 shows these daily revenues and the corresponding 1-day VaR over the last 12 months. The 10-day VaR, which is the basis of the limits and exposures in the tables above, is also shown in this graph for information. Revenues over this period were within the range predicted by the VaR model.
UBS also routinely assesses potential stress loss against a standard set of forward-looking scenarios. Stress events modeled in our standard scenarios include crises in equity, corporate bond and emerging markets, and severe currency and interest rate movements. These scenarios are kept under constant review and fine-tuned as necessary. We also monitor our positions against more specific scenarios that target individual sectors or are based on current concerns. Stress loss utilization development broadly followed VaR during the quarter, with the average utilization marginally higher than fourth quarter 2002. Utilization remained well within limits.
Capital management
We remain committed to being one of the best-capitalized financial services firms in the world and will therefore continue to manage our balance sheet prudently. This clear focus and our ongoing strong cash flow generation mean that we have been able to keep our BIS Tier 1 ratio high while continuing our share buyback programs.
13
Group Review
13 May 2003
BIS Capital and Ratios
| % change from | ||||||||||||||||||||
| CHF million, except where indicated | ||||||||||||||||||||
| As at | 31.3.03 | 31.12.02 | 31.3.02 | 31.12.02 | 31.3.02 | |||||||||||||||
| Risk-weighted assets | 238,746 | 238,790 | 255,157 | 0 | (6 | ) | ||||||||||||||
| BIS Tier 1 capital | 27,562 | 27,047 | 30,221 | 2 | (9 | ) | ||||||||||||||
of which hybrid Tier 1 capital1 | 3,113 | 3,182 | 3,859 | (2 | ) | (19 | ) | |||||||||||||
| BIS total capital | 32,490 | 33,009 | 37,567 | (2 | ) | (14 | ) | |||||||||||||
| BIS Tier 1 capital ratio (%) | 11.5 | 11.3 | 11.8 | |||||||||||||||||
of which hybrid Tier 1 capital (%)1 | 1.3 | 1.3 | 1.5 | |||||||||||||||||
| BIS total capital ratio (%) | 13.6 | 13.8 | 14.7 | |||||||||||||||||
1 Trust preferred securities.
Risk-weighted assets remained virtually unchanged at CHF 239 billion on 31 March 2003. Slightly higher VaR capital requirements were offset by slightly lower capital requirements from our loan and derivative businesses. However, our BIS Tier 1 capital increased from CHF 27.0 billion to CHF 27.6 billion in the period despite our ongoing share buyback program. The increase, reflecting higher retained earnings, pushed our Tier 1 capital ratio up to 11.5% on 31 March 2003 from 11.3% on 31 December 2002.
Buyback program
We terminated our second 2002 share buyback program on 5 March 2003 after repurchasing a total of 8,270,080 shares for an average price of CHF 64.07. Following the approval at the Annual General Meeting on 16 April 2003, these shares, along with the shares bought back under the first 2002 buyback program (67,700,000 shares), will be canceled in July 2003.
In light of our continued strong capitalization, we started a new program on 6 March 2003, which will again lead to a cancelation of the repurchased shares. The program will allow the repurchase of shares for a maximum value of CHF 5 billion, corresponding to about 6.8% of total share capital and will run for one year. The cancelation of shares bought back under this program will have to be approved at the Annual General Meeting in April 2004.
At 31 March 2003, a total of 1,470,000 shares had been repurchased under the new program at an average price of CHF 53.68.
Treasury shares
IFRS requires a company that holds its own shares for trading or non-trading purposes to record those shares as treasury shares and deduct them from shareholders’ equity.
UBS Shares and Market Capitalization
| % change from | |||||||||||||||||||||
| Number of shares, except where indicated | |||||||||||||||||||||
| As at | 31.3.03 | 31.12.02 | 31.3.02 | 31.12.02 | 31.3.02 | ||||||||||||||||
Total ordinary shares issued | 1,256,702,037 | 1,256,297,678 | 1,282,251,732 | 0 | (2 | ) | |||||||||||||||
| Second trading line treasury shares | |||||||||||||||||||||
| 2001 program | (28,818,690 | ) | |||||||||||||||||||
| 2002 first program | (67,700,000 | ) | (67,700,000 | ) | (6,860,123 | ) | |||||||||||||||
| 2002 second program | (8,270,080 | ) | (6,335,080 | ) | |||||||||||||||||
| 2003 program | (1,470,000 | ) | |||||||||||||||||||
Shares outstanding for market capitalization | 1,179,261,957 | 1,182,262,598 | 1,246,572,919 | 0 | (5 | ) | |||||||||||||||
Share price (CHF) | 57.50 | 67.20 | 82.80 | (14 | ) | (31 | ) | ||||||||||||||
Market capitalization (CHF million) | 67,808 | 79,448 | 103,216 | (15 | ) | (34 | ) | ||||||||||||||
Total treasury shares | 106,106,685 | 97,181,094 | 46,229,822 | 9 | 130 | ||||||||||||||||
14
Our holding of own shares increased from 97,181,094, or 7.7% of shares issued, on 31 December 2002, to 106,106,685 shares, or 8.4% of shares issued, on 31 March 2003, reflecting the additional shares we bought under our second trading line program and shares purchased to fund our employee share and option programs.
Of these treasury shares, 77,440,080 shares were purchased under the two 2002 and the new 2003 buyback programs. The remaining 28,666,605 shares were held for general treasury purposes, including coverage of employee share and option programs, and for market making activities by UBS Warburg. UBS Warburg acts as a market maker in UBS shares as well as derivatives related to those shares and may hold a significant amount of UBS shares as a hedge for derivatives issued to retail and institutional investors. Changes in the trading approach can lead to fluctuations in the size of our direct holding of UBS shares.
15
UBS Wealth Management & Business Banking
13 May 2003
UBS Wealth Management & Business Banking
In first quarter 2003, Private Banking’s profit before tax was CHF 534 million, up 7% from fourth quarter 2002. Net new money, at CHF 7.4 billion, included strong inflows to our European wealth management initiative. Business Banking Switzerland’s profit before tax was CHF 499 million in first quarter 2003, a 10% increase from fourth quarter 2002.
Business Group reporting
| Quarter ended | % change from | |||||||||||||||||||
| CHF million, except where indicated | 31.3.03 | 31.12.02 | 31.3.02 | 4Q02 | 1Q02 | |||||||||||||||
| Income | 2,866 | 2,857 | 3,184 | 0 | (10 | ) | ||||||||||||||
Credit loss expense1 | (57 | ) | (64 | ) | (93 | ) | (11 | ) | (39 | ) | ||||||||||
Total operating income | 2,809 | 2,793 | 3,091 | 1 | (9 | ) | ||||||||||||||
| Personnel expenses | 1,146 | 1,148 | 1,166 | 0 | (2 | ) | ||||||||||||||
| General and administrative expenses | 517 | 547 | 540 | (5 | ) | (4 | ) | |||||||||||||
| Depreciation | 94 | 118 | 116 | (20 | ) | (19 | ) | |||||||||||||
| Amortization of goodwill and other intangible assets | 19 | 26 | 24 | (27 | ) | (21 | ) | |||||||||||||
Total operating expenses | 1,776 | 1,839 | 1,846 | (3 | ) | (4 | ) | |||||||||||||
Business Group performance before tax | 1,033 | 954 | 1,245 | 8 | (17 | ) | ||||||||||||||
| Business Group performance before tax and amortization of goodwill and other intangible assets | 1,052 | 980 | 1,269 | 7 | (17 | ) | ||||||||||||||
Additional information | ||||||||||||||||||||
| Regulatory equity allocated (average) | 8,500 | 8,450 | 8,600 | 1 | (1 | ) | ||||||||||||||
Cost/income ratio (%)2 | 62 | 64 | 58 | |||||||||||||||||
Cost/income ratio before goodwill (%)3 | 61 | 63 | 57 | �� | ||||||||||||||||
1In management accounts, statistically derived actuarial expected loss adjusted by deferred releases rather than the net IFRS actual credit loss is reported in the Business Groups (see Note 2 to the Financial Statements).2Operating expenses/operating income less credit loss expense.3Operating expenses less the amortization of goodwill and other intangible assets/operating income less credit loss expense.

Georges Gagnebin
Chairman UBS Wealth Management
& Business Banking

Marcel Rohner
CEO UBS Wealth Management
& Business Banking
16
Private Banking
Business Unit reporting
| Quarter ended | % change from | |||||||||||||||||||
| CHF million, except where indicated | 31.3.03 | 31.12.02 | 31.3.02 | 4Q02 | 1Q02 | |||||||||||||||
| Income | 1,575 | 1,576 | 1,756 | 0 | (10 | ) | ||||||||||||||
Credit loss expense1 | (2 | ) | (10 | ) | (7 | ) | (80 | ) | (71 | ) | ||||||||||
Total operating income | 1,573 | 1,566 | 1,749 | 0 | (10 | ) | ||||||||||||||
| Personnel expenses | 474 | 465 | 464 | 2 | 2 | |||||||||||||||
| General and administrative expenses | 525 | 545 | 521 | (4 | ) | 1 | ||||||||||||||
| Depreciation | 21 | 30 | 19 | (30 | ) | 11 | ||||||||||||||
| Amortization of goodwill and other intangible assets | 19 | 26 | 24 | (27 | ) | (21 | ) | |||||||||||||
Total operating expenses | 1,039 | 1,066 | 1,028 | (3 | ) | 1 | ||||||||||||||
Business unit performance before tax | 534 | 500 | 721 | 7 | (26 | ) | ||||||||||||||
| Business unit performance before tax and amortization of goodwill and other intangible assets | 553 | 526 | 745 | 5 | (26 | ) | ||||||||||||||
KPI’s | ||||||||||||||||||||
| Invested assets (CHF billion) | 638 | 642 | 737 | (1 | ) | (13 | ) | |||||||||||||
Net new money (CHF billion) 2 | 7.4 | 2.8 | 2.2 | |||||||||||||||||
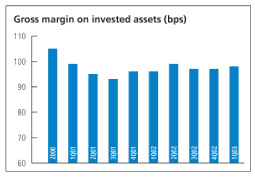
Gross margin on invested assets (bps) 3 | 98 | 97 | 96 | 1 | 2 | |||||||||||||||
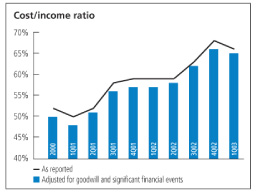
Cost/income ratio (%) 4 | 66 | 68 | 59 | |||||||||||||||||
Cost/income ratio before goodwill (%) 5 | 65 | 66 | 57 | |||||||||||||||||
Cost/income ratio before goodwill and excluding the European wealth management initiative (%) 6 | 57 | 57 | 51 | |||||||||||||||||
| Client advisors (full-time equivalents) | 3,065 | 3,001 | 2,806 | 2 | 9 | |||||||||||||||
Private Banking — International Clients | ||||||||||||||||||||
| Income | 1,088 | 1,090 | 1,214 | 0 | (10 | ) | ||||||||||||||
| Invested assets (CHF billion) | 447 | 447 | 501 | 0 | (11 | ) | ||||||||||||||
Net new money (CHF billion)2 | 7.0 | 2.4 | 3.9 | |||||||||||||||||
Gross margin on invested assets (bps) 3 | 97 | 97 | 98 | 0 | (1 | ) | ||||||||||||||
European wealth management initiative (part of Private Banking — International Clients) | ||||||||||||||||||||
| Income | 52 | 47 | 43 | 11 | 21 | |||||||||||||||
| Invested assets (CHF billion) | 31 | 28 | 23 | 11 | 35 | |||||||||||||||
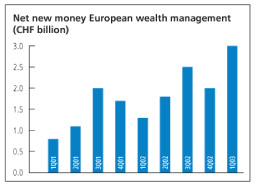
Net new money (CHF billion)2 | 3.0 | 2.0 | 1.3 | |||||||||||||||||
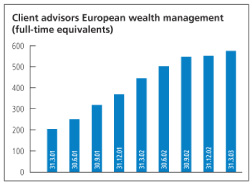
| Client advisors (full-time equivalents) | 575 | 551 | 445 | 4 | 29 | |||||||||||||||
Private Banking — Swiss Clients | ||||||||||||||||||||
| Income | 487 | 486 | 542 | 0 | (10 | ) | ||||||||||||||
| Invested assets (CHF billion) | 191 | 195 | 236 | (2 | ) | (19 | ) | |||||||||||||
Net new money (CHF billion) 2 | 0.4 | 0.4 | (1.7 | ) | ||||||||||||||||
Gross margin on invested assets (bps) 3 | 101 | 99 | 92 | 2 | 10 | |||||||||||||||
| % change from | ||||||||||||||||||||
| Additional information | ||||||||||||||||||||
| As at | 31.3.03 | 31.12.02 | 31.3.02 | 4Q02 | 1Q02 | |||||||||||||||
| Client assets (CHF billion) | 777 | 788 | 898 | (1 | ) | (13 | ) | |||||||||||||
| Regulatory equity allocated (average) | 2,550 | 2,650 | 3,000 | (4 | ) | (15 | ) | |||||||||||||
| Headcount (full-time equivalents) | 9,316 | 9,399 | 8,912 | (1 | ) | 5 | ||||||||||||||
1 In management accounts, statistically derived actuarial expected loss adjusted by deferred releases rather than the net IFRS actual credit loss is reported in the Business Groups (see Note 2 to the Financial Statements).
2 Excludes interest and dividend income.
3 Annualized income/average invested assets.
4 Operating expenses/operating income less credit loss expense.
5 Operating expenses less the amortization of goodwill and other intangible assets/operating income less credit loss expense.
6 Operating expenses less the amortization of goodwill and other intangible assets and expenses for the European wealth management initiative/operating income less credit loss expense and income for the European wealth management initiative.
17
UBS Wealth Management & Business Banking
13 May 2003
Key performance indicators
Net new money in first quarter 2003 was CHF 7.4 billion, up from CHF 2.8 billion in the previous quarter. This strong inflow — our third best quarter since 2000 - - came despite a very discouraging environment for clients’ investment decisions. The Private Banking — International Clients area recorded CHF 7.0 billion in net new money, with a positive inflow in all markets and a record inflow into our European wealth management initiative, while the Private Banking - - Swiss Clients area showed a modest inflow of CHF 0.4 billion.
Despite the strong inflow of net new money, invested assets on 31 March 2003 were CHF 638 billion, down 1% from CHF 642 billion on 31 December 2002. The decline was due to the further falls in global equity markets as well as the 2% drop in the US dollar against the Swiss franc during the quarter.
Gross margin on invested assets increased slightly by one basis point to 98 basis points in first quarter 2003.
The pre-goodwill cost/income ratio, at 65% in first quarter 2003, was down one percentage point from fourth quarter 2002. The slight drop in income was more than offset by our cost control measures. We will continue to cut running costs while at the same time investing in the long-term success of our European wealth management initiative. Excluding the European wealth management initiative, the pre-goodwill cost/income ratio was 57% in first quarter 2003, unchanged from fourth quarter 2002.
European wealth management
Net new money in first quarter 2003 stood at CHF 3.0 billion — the best quarterly result since the initiative’s launch at the beginning of 2001. Excellent inflows were recorded in Germany and the UK. Despite falling equity markets, the level of invested assets also rose to a new high of CHF 31 billion.
Income for the European wealth management initiative in first quarter 2003 was a record CHF 52 million, up from CHF 47 million in fourth quarter 2002 due to higher revenues from the growing asset base.
18
The number of client advisors rose to 575 at the end of March 2003, up from 551 at the end of December 2002, reflecting our continued investment in qualified advisory staff.
Initiatives and achievements
Corporate Employee Financial Services launched
In January 2003, we launched a business in Europe to administer stock and option plans for European executives and corporations. The business is known as Corporate Employee Financial Services (CEFS).
The CEFS Europe team draws on the experience of the UBS PaineWebber team of the same name, which runs a similar and successful service in the US. In Europe, CEFS is expected to meet the growing demand from companies for stock and option plan services. A 2002 survey by Mercer Consulting showed that up to 75% of European companies list administrative issues as their primary concern when offering such plans to their employees. Thus the potential demand for this service in the European market is significant.
The goal of our CEFS Europe service is to present an integrated solution that combines plan administration with other related financial services for corporate and private clients. Such services can include equity risk management, corporate finance, training and financial planning advice to corporations and their executives.
Warsaw representative office opened
At the end of March 2003, UBS opened a new representative office in Warsaw, Poland. The office will promote the firm’s range of products and services in wealth management, investment banking, and asset management.
New software for client advisors
During the first quarter, we also introduced a software application in Switzerland called the “Front End Tool” that supports our systematic advisory process. By using it, client advisors and their clients can pinpoint individual investment objectives and conduct a thorough risk analysis. This, in turn, assists client advisors in developing a personalized investment strategy tailored to each client, derived from our strategic asset allocations recommended for different risk profiles. After that, the software helps client advisors choose a suitable portfolio from a selection of carefully screened mutual funds. If the client accepts an advisor’s recommendations, contract documents can be automatically generated during the meeting, with client advisors also able to place the initial investment directly afterwards through the new tool. The application also tracks a client’s portfolio performance and helps both the clients and client advisors assess overall performance when meeting to review progress.
Investment performance
Financial market sentiment suffered further in the first quarter because of the deteriorating outlook for a global economic recovery, and the crisis in the Middle East — which culminated in the war in Iraq. Although equity markets showed short periods of recovery, overall they continued to lose ground over the quarter.
The performance of UBS Strategy Funds was strongly influenced by these global financial
19
UBS Wealth Management & Business Banking
13 May 2003
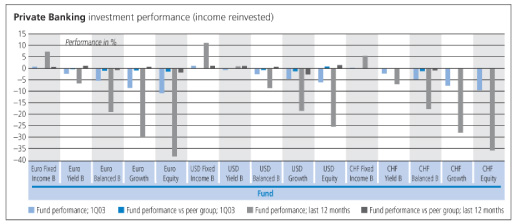
market developments. In first quarter 2003, UBS Strategy Funds performed below those of our peers, due to their slightly higher-than-average weighting of equities. This contrasts with our performance in the previous quarter and over the last 12 months.
The graph above illustrates how pure equity funds saw, in absolute terms, a clearly negative performance in first quarter 2003, in line with global share market developments. In contrast, bond-only funds still produced positive absolute returns. US dollar-denominated funds, also in absolute terms, again reported the best performance because of their weighting towards US shares, which outperformed their European and Swiss counterparts. Additionally, the euro and Swiss franc gained further ground against the US dollar in the first quarter, supporting the absolute returns of funds denominated in US dollars.
Relative to benchmark, our overall performance was negatively affected by stock selection. In contrast, our market selection on the fixed income side added positively to relative performance.
Results
In first quarter 2003, Private Banking’s profit before tax was CHF 534 million, up 7% from the fourth quarter 2002, as performance benefited from lower running costs. The cost/income ratio dropped from 68% in fourth quarter 2002 to 66% in first quarter 2003.
Operating income
Total operating income, at CHF 1,573 million in first quarter 2003, increased by CHF 7 million from fourth quarter 2002, mainly due to lower credit loss expenses. While transaction income rose on higher sales commissions for UBS investment funds, recurring income declined slightly because of lower asset-based revenues reflecting falling invested assets. The share of recurring fees to total income remained unchanged at 73%.
Operating expenses
Total operating expenses were CHF 1,039 million, down 3% from the previous quarter, as costs remained under tight control despite continued investment in our European wealth management initiative. While personnel expenses increased in first quarter 2003 by 2% from the previous quarter, mainly because of higher expenses for our early retirement program, general and administrative expenses fell 4% from
20
the previous quarter due to lower professional fees as well as reduced travel and entertainment expenses. Depreciation fell CHF 9 million from CHF 30 million in the previous quarter to CHF 21 million in first quarter 2003, due to lower charges for information technology equipment, which is increasingly being leased instead of bought.
Headcount
Headcount, at 9,316 on 31 March 2003, decreased by 83 from 31 December 2002. While we continued to hire client advisors for our European wealth management initiative, non-client advisor headcount was reduced, mainly reflecting our currently restrictive hiring policy.
Outlook
The uncertain political and economic environment will continue to weigh on investor sentiment and limit our ability to grow revenues. However, we believe that the most severe pressure from market-related declines on asset levels could be behind us.
It is clear from our ability to attract new money that clients value our financial strength and individualized advisory services. Indeed, in difficult markets, clients seem increasingly to turn to us. We are confident that this strong asset-gathering performance and the corresponding market share gains provide a good basis for future growth. As long as revenue prospects remain uninspiring however, we will be able to rely on our proven cost control discipline to underpin earnings.
21
UBS Wealth Management & Business Banking
13 May 2003
Business Banking Switzerland
Business Unit reporting
| Quarter ended | % change from | |||||||||||||||||||
| CHF million, except where indicated | 31.3.03 | 31.12.02 | 31.3.02 | 4Q02 | 1Q02 | |||||||||||||||
| Income | 1,291 | 1,281 | 1,428 | 1 | (10 | ) | ||||||||||||||
Credit loss expense1 | (55 | ) | (54 | ) | (86 | ) | 2 | (36 | ) | |||||||||||
Total operating income | 1,236 | 1,227 | 1,342 | 1 | (8 | ) | ||||||||||||||
| Personnel expenses | 672 | 683 | 702 | (2 | ) | (4 | ) | |||||||||||||
| General and administrative expenses | (8 | ) | 2 | 19 | ||||||||||||||||
| Depreciation | 73 | 88 | 97 | (17 | ) | (25 | ) | |||||||||||||
| Amortization of goodwill and other intangible assets | 0 | 0 | 0 | |||||||||||||||||
Total operating expenses | 737 | 773 | 818 | (5 | ) | (10 | ) | |||||||||||||
Business unit performance before tax | 499 | 454 | 524 | 10 | (5 | ) | ||||||||||||||
| Business unit performance before tax and amortization of goodwill and other intangible assets | 499 | 454 | 524 | 10 | (5 | ) | ||||||||||||||
KPI’s | ||||||||||||||||||||
| Invested assets (CHF billion) | 197 | 205 | 219 | (4 | ) | (10 | ) | |||||||||||||
Net new money (CHF billion)2 | (1.9 | ) | (2.7 | ) | 2.3 | |||||||||||||||
Cost/income ratio (%)3 | 57 | 60 | 57 | |||||||||||||||||
Cost/income ratio before goodwill (%)4 | 57 | 60 | 57 | |||||||||||||||||
| Non-performing loans/gross loans outstanding (%) | 3.5 | 3.6 | 4.4 | |||||||||||||||||
| Impaired loans/gross loans outstanding (%) | 5.7 | 6.0 | 7.4 | |||||||||||||||||
| % change from | ||||||||||||||||||||
| Additional information | ||||||||||||||||||||
| As at or for the period ended | 31.3.03 | 31.12.02 | 31.3.02 | 4Q02 | 1Q02 | |||||||||||||||
Deferred releases included in credit loss expense1 | 77 | 70 | 53 | 10 | 45 | |||||||||||||||
| Client assets (CHF billion) | 481 | 494 | 559 | (3 | ) | (14 | ) | |||||||||||||
| Regulatory equity allocated (average) | 5,950 | 5,800 | 5,600 | 3 | 6 | |||||||||||||||
| Headcount (full-time equivalents) | 18,302 | 18,442 | 19,262 | (1 | ) | (5 | ) | |||||||||||||
1 In management accounts, statistically derived actuarial expected loss adjusted by deferred releases rather than the net IFRS actual credit loss is reported in the Business Groups (see Note 2 to the Financial Statements). Deferred releases represent amortization of historical differences between actual credit losses and actuarial expected loss (for more information, please refer to pages 39-40 of the UBS Financial Report 2002).2Excludes interest and dividend income.3 Operating expenses/operating income less credit loss expense.4Operating expenses less the amortization of goodwill and other intangible assets/operating income less credit loss expense.
Key performance indicators
Net new money was a negative CHF 1.9 billion in first quarter 2003, mainly due to CHF 3.6 billion in transfers by corporate clients from their short-term deposits to their current accounts, which are not classified as invested assets. Although this is the second consecutive quarterly outflow we have reported, the corporate clients business is traditionally subject to relatively large swings in net new money. In first quarter, the main reason for the transfers was the extremely low interest rates for short-term investments.
Invested assets were CHF 197 billion on 31 March 2003, down 4% from 31 December 2002, due to the impact of declining global equity markets, the fall in value of the US dollar against the Swiss franc, as well as the outflow of net new money from corporations.
Our cost/income ratio improved significantly, falling to 57% in first quarter 2003 from 60% in
22
fourth quarter 2002, proving our ability to control costs in a difficult environment.
At the end of first quarter 2003, Business Banking Switzerland’s loan portfolio increased to CHF 141.4 billion from CHF 139.5 billion at the end of 2002. Inflows in the mortgage area, which benefited from interest rates at historic lows and a national advertising campaign (see article on the next page) more than offset the ongoing workout of the recovery portfolio, which fell to CHF 8.2 billion this quarter from CHF 8.6 billion in the previous quarter. The non-performing loans ratio declined to 3.5% on 31 March 2003 from 3.6% on 31 December 2002, and the impaired loan ratio fell to 5.7% on 31 March 2003, down from 6.0% on 31 December 2002.
In first quarter 2003, Business Banking Switzerland’s net interest income rose slightly in comparison to fourth quarter 2002. This was mainly due to an increase in the interest margin on savings accounts and higher savings account volumes. Also, our mortgage business saw an increase in volume, in particular for fixed-rate and money market mortgages, contributing positively to net interest income. Lower investment interest margins on current accounts, however, offset some of the positive impact.
Initiatives and achievements
UBS launches another transaction securitizing loans to Swiss SMEs
In March 2003, UBS securitized part of the credit risks related to a CHF 2.5 billion portfolio of loans to Swiss small and medium-sized enterprises. This deal, a collateralized loan obligation called HAT (Helvetic Asset Trust) II, involves transferring not the loans themselves, but rather the default risks to the capital market. In order to achieve this transfer, a special purpose vehicle entered into a credit default swap with UBS, and issued four classes of euro-denominated credit-linked notes that were placed on the euro capital market and listed on the Irish Stock Exchange.
UBS’s first HAT transaction, launched in June 2000, had a similar structure, but involved Swiss franc-denominated instruments. For HAT II, the euro capital market was chosen due to its higher liquidity and receptivity for such structured debt instruments. For investors, HAT II offers an opportunity to diversify their portfolios by gaining exposure to Swiss small-business credit risks.
Strategic Project Portfolio
Our Strategic Project Portfolio, which groups our most important initiatives, is aimed at enhancing revenues and controlling costs by improving processes, products and distribution methods.
In 2000, as part of this portfolio, we launched the “Site Optimization Program” in Switzerland. Its aim was to improve computer system availability while containing IT costs. Other objectives were to enhance our ability to cope with operational crises and allow growth in IT capacity for entry into new markets. In order to achieve this, we are building a new computer center near Zurich that is scheduled to start operating in 2004. It will be linked by fiber-optic cable to our existing major IT center which is located roughly 10 kilometers away. In the event that one center fails, the other would immediately take over its tasks. The new center is being built on the assumption of 99.999
23
UBS Wealth Management & Business Banking
13 May 2003
percent system availability, meaning that it would be down for around five minutes a year, planned or unplanned. When the Program is fully in place, it will allow us to close a number of smaller back-up IT sites located around Switzerland.
Results
In first quarter 2003, Business Banking Switzerland reported its third-highest quarterly pre-tax profit ever of CHF 499 million — a 10% increase from fourth quarter 2002. Revenues rose slightly due to higher interest income, while costs fell to a record low, mainly due to lower personnel expenses. The cost/income ratio dropped to a record low of 57% in first quarter 2003 from 60% in fourth quarter 2002.
Operating income
Total operating income in first quarter 2003 was CHF 1,236 million, up 1% or CHF 9 million from fourth quarter 2002 despite the adverse market environment. Interest income increased due to higher mortgage and savings volumes, while fee income remained stable and trading income fell in the difficult financial market environment.
Operating expenses
Operating expenses fell to CHF 737 million in first quarter 2003, down 5% from fourth quarter 2002. Personnel expenses, at CHF 672 million, decreased 2%, showing the impact of a restrictive hiring policy and the ongoing streamlining of processes and structures, which held headcount down.
General and administrative expenses dropped again in first quarter to a negative CHF 8 million, against a positive CHF 2 million in fourth quarter 2002. The decline was due to lower professional fees, and falling travel and
Low rates, high season for Swiss mortgage business
The message is clear. “We are the right address for competitive mortgages.” As the advertising campaign along Switzerland’s high streets shows, the country’s historically low interest rates have provided UBS mortgage loan marketers with their latest opportunity.
The street advertising placards are the more visible manifestations of a concerted campaign to consolidate and even extend the firm’s strong position in the domestic home loans business. Already the market leader, UBS Wealth Management & Business Banking sees falling interest rates as a unique opportunity to re-invigorate consumer interest in its products.
The current campaign started in the autumn of 2002 with nationwide TV spots for UBS home loan products. From early 2003, client advisors followed up with coordinated marketing activities, including personalized mailings and approaches to potential new clients.
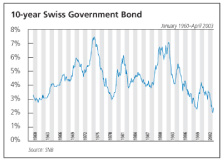
One priority is to ensure that existing UBS clients stay with the firm when they seek refinancing to take advantage of the prevailing low rates. That said, the campaign is by no means purely defensive. Low interest rates also provide our client advisors with an ideal opportunity to persuade potential new clients of the advantages of the firm’s broad range of products and advice-driven approach.
As an additional means of winning new business, the “UBS Private Financing Solution” was launched in February 2003. According to the terms of this product, clients who transfer investment assets or a mortgage of at least CHF 500,000 in value to UBS qualify for a combined mortgage
24
entertainment expenses, reflecting our continued strict efforts to control costs. Overall, the very low general and administrative expenses are a result of UBS’s integrated business model, through which Business Banking Switzerland provides a significant number of services to other business units of the Group, mainly Private Banking. In accounting terms, the costs for these services, which include personnel expenses, are charged to the receiving unit as general and administrative expenses only, offset by lower general and administrative expenses in the provider unit.
Depreciation fell 17% to CHF 73 million in first quarter 2003 from fourth quarter 2002 due to lower charges for information technology equipment, which is increasingly being leased instead of bought.
Headcount
Business Banking Switzerland’s headcount was 18,302 on 31 March 2003, a decline of 140 from 31 December 2002. This decline is attributable to our restrictive hiring policy as well as the ongoing streamlining of processes and structures.
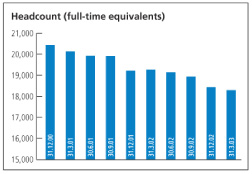
Outlook
Given the generally difficult economic situation, Business Banking Switzerland performed well in first quarter 2003. For the remainder of the year, we will ensure that our costs remain closely in line with revenues, which should give us the ability to maintain our highly satisfactory earnings performance despite weak economic and market conditions.
and short-term financing package at very competitive rates.
In this way, the firm has combined its home loan and asset management skills to drive growth for both arms of its business. In the process, it has created a product new to the Swiss market. Selected existing and potential clients have also been invited to a nationwide series of mortgage promotion events, where client advisors and product specialists are on hand to explain UBS home loan products in more detail.
Clients who decide to take advantage of the prevailing low interest rates can choose from a variety of products. Those who believe rates are set to rise can opt for fixed-rate mortgage loans of various terms up to 10 years. They can also take out forward contracts to “lock in” favorable low rates by arranging financing up to one year in advance.
The results of these very low interest rates are already clear to see in the maturity profile of the UBS loan book. Fixed-rate loans with a maturity of five years or more now account for 59% of new fixed-rate mortgages in first quarter 2003, up from only 18% in first quarter 2002.
Net new mortgage lending volume of CHF 1.7 billion in first quarter 2003 also speaks for the success of this latest campaign. Yet this is only one strand in the firm’s strategy for its mortgage business.
For example, as part of its “Bank for Banks” program, UBS is now putting its financing, risk management, and loan administration capabilities at the service of third-party institutions. Switzerland’s Postfinance, an arm of the national post office, will soon start marketing UBS-managed home loans under its own brand.
Together with the marketing activities outlined above, initiatives of this type will ensure that UBS remains “the right address” for attractive and competitive mortgage finance.
25
UBS Global Asset Management
13 May 2003
UBS Global Asset Management
Pre-tax profit in first quarter 2003 was CHF 44 million, up from CHF 34 million in fourth quarter 2002. Falling costs outpaced the decline in revenues, which continued to reflect depressed market conditions. The inflow of net new money, at CHF 7.3 billion, was the highest in more than a year.
Business Group reporting
| Quarter ended | % change from | |||||||||||||||||||
| CHF million, except where indicated | 31.3.03 | 31.12.02 | 31.3.02 | 4Q02 | 1Q02 | |||||||||||||||
| Institutional fees | 198 | 223 | 265 | (11 | ) | (25 | ) | |||||||||||||
| Wholesale Intermediary fees | 180 | 178 | 211 | 1 | (15 | ) | ||||||||||||||
Total operating income | 378 | 401 | 476 | (6 | ) | (21 | ) | |||||||||||||
| Personnel expenses | 188 | 191 | 219 | (2 | ) | (14 | ) | |||||||||||||
| General and administrative expenses | 99 | 124 | 120 | (20 | ) | (18 | ) | |||||||||||||
| Depreciation | 7 | 11 | 5 | (36 | ) | 40 | ||||||||||||||
| Amortization of goodwill and other intangible assets | 40 | 41 | 52 | (2 | ) | (23 | ) | |||||||||||||
Total operating expenses | 334 | 367 | 396 | (9 | ) | (16 | ) | |||||||||||||
Business Group performance before tax | 44 | 34 | 80 | 29 | (45 | ) | ||||||||||||||
| Business Group performance before tax and amortization of goodwill and other intangible assets | 84 | 75 | 132 | 12 | (36 | ) | ||||||||||||||
KPI’s | ||||||||||||||||||||
Cost/income ratio (%)1 | 88 | 92 | 83 | |||||||||||||||||
Cost/income ratio before goodwill (%)2 | 78 | 81 | 72 | |||||||||||||||||
Institutional | ||||||||||||||||||||
| Invested assets (CHF billion) | 264 | 274 | 324 | (4 | ) | (19 | ) | |||||||||||||
Net new money (CHF billion)3 | 3.9 | 2.4 | (1.9 | ) | ||||||||||||||||
Gross margin on invested assets (bps) 4 | 29 | 33 | 33 | (12 | ) | (12 | ) | |||||||||||||
Wholesale Intermediary | ||||||||||||||||||||
| Invested assets (CHF billion) | 255 | 259 | 327 | (2 | ) | (22 | ) | |||||||||||||
Net new money (CHF billion)3 | 3.4 | (0.8 | ) | 0.5 | ||||||||||||||||
Gross margin on invested assets (bps) 4 | 28 | 27 | 26 | 4 | 8 | |||||||||||||||
| % change from | ||||||||||||||||||||
| Additional information | ||||||||||||||||||||
| As at | 31.3.03 | 31.12.02 | 31.3.02 | 4Q02 | 1Q02 | |||||||||||||||
| Client assets (CHF billion) | 519 | 533 | 651 | (3 | ) | (20 | ) | |||||||||||||
| Regulatory equity allocated (average) | 950 | 1,000 | 1,200 | (5 | ) | (21 | ) | |||||||||||||
| Headcount (full-time equivalents) | 2,732 | 2,733 | 2,759 | 0 | (1 | ) | ||||||||||||||
1 Operating expenses/operating income.2 Operating expenses less the amortization of goodwill and other intangible assets/operating income.3 Excludes interest and dividend income. 4 Annualized income/average invested assets.

John A. Fraser
Chairman and CEO
UBS Global Asset Management
26
UBS Global Asset Management
13 May 2003
Key performance indicators
The pre-goodwill cost/income ratio was 78% in first quarter 2003, down from 81% in fourth quarter. The decline reflected lower operating expenses, which were down primarily because fourth quarter 2002 included severance charges and temporary lease costs for unoccupied premises.
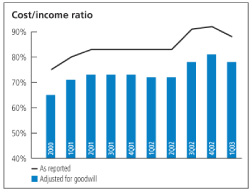
Institutional
On 31 March 2003, Institutional invested assets totaled CHF 264 billion, down from CHF 274 billion on 31 December 2002. The fall was due to the decline of key currencies, among them the US dollar, Japanese yen, and British sterling against the Swiss franc, as well as generally negative financial market movements.
In first quarter 2003, net new money inflows totaled CHF 3.9 billion, compared to CHF 2.4 billion in fourth quarter 2002. Equity mandates experienced strong inflows globally, partially offset by outflows in fixed income mandates. Additionally, we recorded inflows into alternative asset, asset allocation, and private market mandates, primarily in the US and Europe.
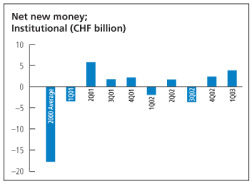
The gross margin in first quarter 2003 was 29 basis points, down from 33 basis points in fourth quarter 2002, mainly due to lower performance fees, which are primarily collected in the fourth quarter.
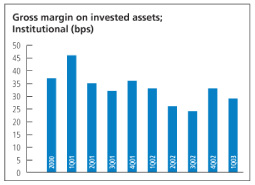
Wholesale Intermediary
Invested assets, at CHF 255 billion on 31 March 2003, were CHF 4 billion lower than on 31 December 2002. The decrease was due to negative financial market developments and the strengthening of the Swiss franc against the US dollar and other major currencies, partially offset by a positive net new money result.
Net new money was CHF 3.4 billion in first quarter 2003 compared to negative CHF 0.8 billion in fourth quarter 2002. Almost all of the inflow was into fixed income and money market funds although inflows into alternative investments also continued to be strong, especially in Asia Pacific.
We achieved this against a background of industry-wide outflows in the US market where the Investment Company Institute reported net outflows in first quarter 2003 of USD 38.8 billion. In Switzerland, Lipper (a Reuters company)
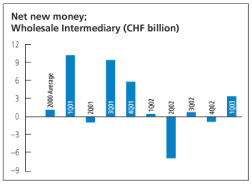
27
UBS Global Asset Management
13 May 2003
reflected slightly positive industry inflows of CHF 0.7 billion in first quarter 2003, primarily driven by fixed income and money market funds.
Our gross margin was 28 basis points in first quarter 2003, up from 27 basis points in fourth quarter 2002, reflecting a slight improvement in performance fees.
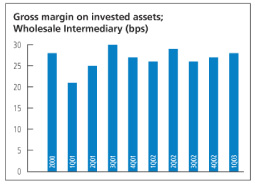
Investment capabilities and performance
In February 2003, we refined our business and investment model to better distinguish our core investment management, alternative and quantitative investments, and global real estate capabilities. This involved transferring a number of businesses from the core investment management platform.
Looking at investment conditions in the first quarter, global equity markets fell for most of the three-month period, recovering only slightly in the last half of March as investor uncertainty regarding military action in Iraq waned. Regarding performance, our actively managed Global Equity composite is roughly even with its benchmark over the last 12 months although strong sector and currency allocation as well as good stock selection have driven significant outperformance over longer historical periods.
The ‘flight to quality’ observed in 2002 continued in 2003 as investors looked for safe havens in sovereign fixed income but, unlike the recent past, they also embraced credit risks even as sovereign prices rose modestly. The Global Bond composite stands ahead of the Salomon Smith Barney World Government Bond Index for the past 1- and 3-year periods. Recently, performance has benefited from very strong currency allocation.
Global multi-asset mandates have been underweighted to equities and overweighted to fixed income for much of the past five years, only building up to a slight equity overweight by third quarter 2002. That broad positioning, as well as stock selection and recent currency allocation, has led to attractive returns both in absolute terms as well as relative to benchmarks.
Initiatives and achievements
Awards
We won a wide range of industry awards in the first quarter 2003, reflecting the strength and depth of our capabilities and the success of our integrated global investment platform. We were named “Best Overall Group” in the European Fund Awards, co-sponsored by Lipper, the fund information and ratings company. Taiwan’s Smart Magazine, in association with Standard and Poor’s, awarded us “Best Performing Fund Group of the Year” and we were also named Morningstar Asia’s “Fund Manager of the Year” for Taiwan. In Hong Kong, the South China Morning Post, in association with Standard & Poor’s, named us “Best Performing Fund Management Group”. In the UK, we were also named “Best Balanced Fund Manager” by two pension fund magazines.
Results
UBS Global Asset Management’s pre-tax profit was CHF 44 million in first quarter 2003, an increase of CHF 10 million over fourth quarter
| Annualized | ||||||||||||||||
| Relative performance | 1 Year | 3 Years | 5 Years | 10 Years | ||||||||||||
| Global Equity Composite vs. MSCI World Equity (Free) Index | - | + | + | + | ||||||||||||
| Global Bond Composite vs. SSB World Government Bond Index | + | + | - | - | ||||||||||||
| Global Securities Composite vs. Global Securities Markets Index | + | + | + | - | ||||||||||||
(+) equals above benchmark; (-) equals under benchmark. All after fees.
28
2002. This was the result of lower operating expenses, which were down mainly because the fourth quarter 2002 result included severance costs and temporary expenses for unoccupied premises. Partially offsetting the lower operating expenses was the decline in institutional revenues from lower performance fees and seed capital gains at O’Connor as well as the weakening of the US dollar against the Swiss franc. The bigger drop in expenses compared to revenues is also reflected in the cost/income ratio which dropped from 92% in fourth quarter 2002 to 88% in first quarter 2003.
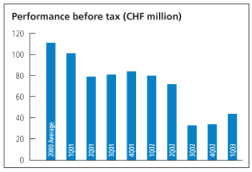
Operating income
Operating income in first quarter was CHF 378 million, down 6% from CHF 401 million in fourth quarter 2002, reflecting lower performance fees and the appreciation of the Swiss franc against the US dollar.
Institutional revenues were CHF 198 million in first quarter 2003, a decrease of CHF 25 million from CHF 223 million in fourth quarter 2002. The decrease was due to lower performance fees, the appreciation of the Swiss franc against the US dollar, and lower seed capital gains at O’Connor.
Wholesale Intermediary revenues, at CHF 180 million in first quarter 2003, increased slightly from fourth quarter 2002 due to higher performance fees, primarily in Asia Pacific.
Operating expenses
Operating expenses in first quarter 2003 were CHF 334 million, a decrease of 9% from CHF 367 million in fourth quarter 2002. Personnel expenses dropped CHF 3 million to CHF 188 million due to a decrease in severance expenses, partially offset by higher pension-related costs, mainly in the UK. General and administrative expenses were CHF 99 million in first quarter 2003, a CHF 25 million decline from fourth quarter 2002’s CHF 124 million. The drop was mainly due to lower IT and advertising expenses and professional fees, as well as the drop of the US dollar against the Swiss franc. Fourth quarter 2002 expenses were also influenced by provisions for lease expenses related to unoccupied premises.
Headcount
Headcount was 2,732 on 31 March 2003, down by 1 from 2,733 on 31 December 2002. When compared to the first quarter a year earlier, headcount was down 1%, reflecting continuing efforts to reduce the number of support staff.
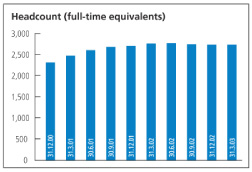
Outlook
The year to come will represent a challenge to investors. We believe that UBS Global Asset Management is now well positioned to build on its strengths of continued strong investment performance, client service and a sharply focused business model. At the same time, we have already seen the benefits from cost-cutting initiatives, and we will continue to make sure that our costs are well-contained.
29
UBS Warburg
13 May 2003
UBS Warburg
The Corporate and Institutional Clients unit recorded a net profit before tax in first quarter 2003 of CHF 894 million, 6% lower than in the same period last year but 72% higher than in fourth quarter 2002. Market conditions continued to be extremely difficult. The corporate fee pool this quarter was at the second lowest level seen in the past six years, and merger and acquisition activity in the US was at lows not seen since 1994. IPO volumes were down more than 75% compared to first quarter 2002.
Business Group reporting
| Quarter ended | % change from | |||||||||||||||||||
| CHF million, except where indicated | 31.3.03 | 31.12.02 | 31.3.02 | 4Q02 | 1Q02 | |||||||||||||||
| Income | 3,266 | 2,566 | 3,741 | 27 | (13 | ) | ||||||||||||||
Credit loss expense1 | (37 | ) | (40 | ) | (40 | ) | (8 | ) | (8 | ) | ||||||||||
Total operating income | 3,229 | 2,526 | 3,701 | 28 | (13 | ) | ||||||||||||||
| Personnel expenses | 1,794 | 1,521 | 2,439 | 18 | (26 | ) | ||||||||||||||
| General and administrative expenses | 478 | 672 | 572 | (29 | ) | (16 | ) | |||||||||||||
| Depreciation | 83 | 99 | 96 | (16 | ) | (14 | ) | |||||||||||||
| Amortization of goodwill and other intangible assets | 70 | 76 | 102 | (8 | ) | (31 | ) | |||||||||||||
Total operating expenses | 2,425 | 2,368 | 3,209 | 2 | (24 | ) | ||||||||||||||
Business Group performance before tax | 804 | 158 | 492 | 409 | 63 | |||||||||||||||
| Business Group performance before tax and amortization of goodwill and other intangible assets | 874 | 234 | 594 | 274 | 47 | |||||||||||||||
Additional information | ||||||||||||||||||||
Cost/income ratio (%)2 | 74 | 92 | 86 | |||||||||||||||||
Cost/income ratio before goodwill (%)3 | 72 | 89 | 83 | |||||||||||||||||
Net new money (CHF billion)4 | 0.0 | 0.1 | 0.1 | |||||||||||||||||
| Invested assets (CHF billion) | 3 | 3 | 1 | 0 | 200 | |||||||||||||||
| Client assets (CHF billion) | 130 | 133 | 114 | (2 | ) | 14 | ||||||||||||||
| Regulatory equity allocated (average) | 12,600 | 12,950 | 13,300 | (3 | ) | (5 | ) | |||||||||||||
1 In management accounts, statistically derived actuarial expected loss adjusted by deferred releases rather than the net IFRS actual credit loss is reported in the Business Groups (see Note 2 to the Financial Statements).2 Operating expenses/operating income less credit loss expense. 3 Operating expenses less the amortization of goodwill and other intangible assets/operating income less credit loss expense. 4 Excludes interest and dividend income.

John P. Costas
Chairman and CEO
UBS Warburg
30
Corporate and Institutional Clients
Business Unit reporting
| Quarter ended | % change from | |||||||||||||||||||
| CHF million, except where indicated | 31.3.03 | 31.12.02 | 31.3.02 | 4Q02 | 1Q02 | |||||||||||||||
| Investment Banking | 287 | 539 | 516 | (47 | ) | (44 | ) | |||||||||||||
| Equities | 819 | 1,208 | 1,502 | (32 | ) | (45 | ) | |||||||||||||
Fixed Income, Rates and Currencies1 | 2,235 | 1,120 | 2,155 | 100 | 4 | |||||||||||||||
| Income | 3,341 | 2,867 | 4,173 | 17 | (20 | ) | ||||||||||||||
Credit loss expense2 | (37 | ) | (40 | ) | (40 | ) | (8 | ) | (8 | ) | ||||||||||
Total operating income | 3,304 | 2,827 | 4,133 | 17 | (20 | ) | ||||||||||||||
Personnel expenses3 | 1,788 | 1,477 | 2,425 | 21 | (26 | ) | ||||||||||||||
| General and administrative expenses | 469 | 655 | 556 | (28 | ) | (16 | ) | |||||||||||||
| Depreciation | 83 | 99 | 96 | (16 | ) | (14 | ) | |||||||||||||
| Amortization of goodwill and other intangible assets | 70 | 76 | 102 | (8 | ) | (31 | ) | |||||||||||||
Total operating expenses | 2,410 | 2,307 | 3,179 | 4 | (24 | ) | ||||||||||||||
Business unit performance before tax | 894 | 520 | 954 | 72 | (6 | ) | ||||||||||||||
| Business unit performance before tax and amortization of goodwill and other intangible assets | 964 | 596 | 1,056 | 62 | (9 | ) | ||||||||||||||
KPI’s | ||||||||||||||||||||
Compensation ratio (%)4 | 54 | 52 | 58 | |||||||||||||||||
Cost/income ratio (%)5 | 72 | 80 | 76 | |||||||||||||||||
Cost/income ratio before goodwill (%)6 | 70 | 78 | 74 | |||||||||||||||||
| Non-performing loans/gross loans outstanding (%) | 1.7 | 1.6 | 2.0 | |||||||||||||||||
| Impaired loans/gross loans outstanding (%) | 3.3 | 3.2 | 4.2 | |||||||||||||||||
| Average VaR (10-day 99%) | 350 | 295 | 274 | 19 | 28 | |||||||||||||||
| % change from | ||||||||||||||||||||
| Additional information | ||||||||||||||||||||
| As at or for the period ended | 31.3.03 | 31.12.02 | 31.3.02 | 4Q02 | 1Q02 | |||||||||||||||
Deferred releases included in credit loss expense 2 | (8 | ) | 0 | (6 | ) | (33 | ) | |||||||||||||
| Regulatory equity allocated (average) | 12,150 | 12,500 | 12,700 | (3 | ) | (4 | ) | |||||||||||||
| Headcount (full-time equivalents) | 15,856 | 15,964 | 16,168 | (1 | ) | (2 | ) | |||||||||||||
1 Includes Non-core business. 2 In management accounts, statistically derived actuarial expected loss adjusted by deferred releases rather than the net IFRS actual credit loss is reported in the Business Groups (see Note 2 to the Financial Statements). Deferred releases represent amortization of historical differences between actual credit losses and actuarial expected loss (for more information, please refer to pages 39-40 of the UBS Financial Report 2002). 3 Includes retention payments in respect of the PaineWebber acquisition. 4Q02: CHF 21 million. 1Q02: CHF 12 million. There are no further retention payments in 2003. 4 Personnel expenses/operating income less credit loss expense. 5 Operating expenses/ operating income less credit loss expense. 6 Operating expenses less the amortization of goodwill and other intangible assets/operating income less credit loss expense.
31
UBS Warburg
13 May 2003
Key performance indicators
Although our performance in first quarter 2003 continues to reflect weakening worldwide market conditions, strong cost pressure acted to reduce our pre-goodwill cost/income ratio to 70%, down from 74% in the same quarter last year and 78% in fourth quarter 2002.
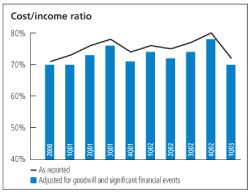
The compensation ratio for first quarter 2003 was 54%, down one percentage point from the full-year 2002 compensation ratio of 55%. Accruals for incentive compensation are managed in line with prevailing labor market conditions and depend on the revenue mix across businesses. The exact level of annual performance-related payments is only determined in the fourth quarter.
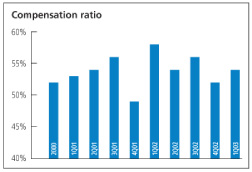
Market risk utilization, as measured by the 10-day 99% confidence level Value at Risk (VaR) decreased to CHF 300 million on 31 March 2003 from CHF 310 million on 31 December 2002. Average VaR, however, increased in first quarter 2003, rising to CHF 350 million from CHF 295 million in fourth quarter. The increase is due to selective engagements in market opportunities, particularly in the Fixed Income, Rates and Currencies business area, although the rise in VaR does not indicate any change in strategy or risk appetite.
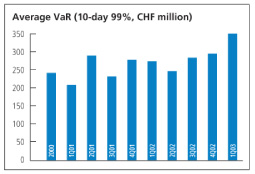
Total loans held by UBS Warburg were CHF 59.1 billion on 31 March 2003, a 4% decline from CHF 61.7 billion on 31 December 2002.
The absolute value of non-performing loans increased by 4% or CHF 41 million in the first quarter from fourth quarter 2002, while the non-performing loans to gross loans ratio increased slightly from 1.6% to 1.7% in the period. The impaired loans to gross loans ratio increased slightly from 3.2% to 3.3%.
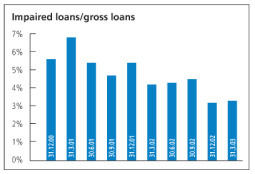
League table rankings
Mergers and acquisitions
Despite hopes that 2003 might see an upturn in global capital markets, the environment remained extremely subdued during the first quarter. Corporate activity was at a subdued level in the mergers and acquisitions segment, particularly in the US where mergers and acquisitions were at their lowest level since 1994. Capital raising activities to fund company development
32
Key performance indicators: league table rankings
| 31.3.03 | 31.12.02 | 31.3.02 | ||||||||||||||||||||||
| Market | Market | Market | ||||||||||||||||||||||
| Rank | share % | Rank | share % | Rank | share % | |||||||||||||||||||
Global mergers and acquisitions (completed) 1 | 10 | 7.2 | 9 | 10.4 | 8 | 8.9 | ||||||||||||||||||
International equity new issues 2 | 7 | 5.1 | 6 | 8.6 | 3 | 12.7 | ||||||||||||||||||
1 Source: Thomson Financial Securities. 2 Source: Dealogic EquitywarePlus.
were also limited. The volume of announced merger and acquisition transactions in the first quarter was 9% lower than the already severely depressed levels seen in first quarter 2002. We continued to play a role in many of the major transactions, and were ranked thirteenth globally in the announced transactions category, with a market share of 5.1%. We were tenth globally in completed deals, with a market share of 7.2% in first quarter 2003.
With volumes at these very low levels, overall rankings and market share can be heavily influenced by a small number of deals. Significant deals where we provided advice and financing skills included:
| • | Sole financial advisor to Fidelity National Financial Inc, a Fortune 500 company, on its acquisition of the financial services division of Alltel Corp’s Information Services subsidiary for USD 1.05 billion in cash and stock. | |
| • | Financial advisor to International Steel Group on its USD 1.5 billion acquisition of most of the assets of bankrupt US steel maker Bethlehem Steel Corporation. UBS Warburg also acted as joint lead arranger and joint bookrunner on the USD 1 billion financing. | |
| • | Financial advisor to Candover and Cinven, leading European private equity firms, on their GBP 1.24 billion purchase of the UK retail gaming company Gala Group from CSFB Private Equity. | |
| • | Financial advisor to Swiss medical technology company Centerpulse AG on its combination with Smith & Nephew Plc to create a leading global orthopedics company. |
Equity underwriting
In international equity underwriting, we ranked seventh with a market share of 5.1% in first quarter 2003, representing a drop of one place from 2002 results. Valuations were significantly depressed, driving levels of issuance to new lows. Rights issues continue to be a key financing tool in the current market and UBS Warburg is the global leader in the structuring and execution of rights issues. The firm has lead-managed six of the ten largest rights issues in the European market in the past year, and is ranked first for underwriting rights issues in that period. Major deals in the first quarter included:
| • | Joint global coordinator, joint lead manager and joint underwriter of the EUR 3.5 billion rights issue of Allianz, the German insurer, as part of their EUR 5 billion capital raising program. This was the largest ever underwritten rights issue and the largest global equity offering in the year to date. | |
| • | Joint bookrunner for a USD 590 million combined offering for ONEOK, the US utility company, comprising a USD 240 million follow-on offering and USD 350 million convertible bond. | |
| • | Joint global coordinator and joint underwriter of the EUR 931 million rights issue by Banco Comercial Portugues (BCP). |
Fixed income underwriting
In fixed income, maintaining profitability remains our clear priority. Market share in the highly competitive fixed income markets does not necessarily equate with profitability, and our focus is therefore to meet clients’ financing needs in segments and products that also have a positive impact on our bottom line. Despite this, we retained our top ten position in underwriting International Bonds with a 4.2% market share for first quarter 2003, compared to a 5.1% market share in 2002. During first quarter 2003, we were involved in a broad spread of transactions, covering all the major capital markets and currencies. Some of the more notable ones included:
| • | Bookrunner for German federal financing agency KfW’s EUR 1 billion 2.84% bond, due |
33
UBS Warburg
13 May 2003
2006. The transaction was originally marketed with an issue size of EUR 500 million. However, due to investor demand, the issue size was increased twice and we were able to price an EUR 1 billion transaction.
| • | Joint bookrunner for US telecommunications company Sprint’s USD 5 billion multi tranche issue due 2006, 2013 and 2033. | |
| • | Global coordinator for the first ever inflation-linked bond issued by the Hellenic Republic. The deal was oversubscribed 2.5 times and ultimately increased to EUR 1.25 billion in size from the originally foreseen EUR 700 million. | |
| • | Joint bookrunner for German telecommunications company Deutsche Telekom, on a EUR 500 million senior debt issue, due 2018. |
Initiatives and achievements
Corporate Clients
Despite the continuing worldwide economic downturn, we have maintained our investment in the largest and most important industry sectors of the corporate finance markets. Our global market share fell to 3.3% and our US market share to 3.2%, compared to 5.0% and 4.4% respectively in full year 2002. The decline is the result of unusually low market volumes, where one deal is able to cause significant changes in market share. Our target remains a sustainable global market share in excess of 5%.
Institutional Clients
The core of our success continues to be the strong relationships we have with institutional clients. We were recently ranked first (moving up from second place in 2002) in the Institutional Investor survey for pan-European sales in 2003. The survey showed that the most important criteria for clients was quality of service, followed by knowledge of the research product. We also swept the board in the inaugural Foreign Exchange survey by The Banker magazine, winning 13 out of 23 categories, ten more than our closest competitor.
In terms of NYSE trading volumes, we now rank third with an 8.6% market share for the quarter, up from fifth (7.5% share) in full year 2002. For NASDAQ, our rank has risen from eighth (with 4.4% market share) in 2002 to seventh (4.6% share) in first quarter 2003.
Research
UBS Warburg’s research products continue to win awards around the world. For the second consecutive year, we claimed the first place rank in Institutional Investor magazine’s annual All-Europe Research Team awards.
In January, we formally announced that our new simplified rating system for equity analysis had been fully implemented. By combining a recommendation with a new predictability indicator (highlighting the degree of certainty an analyst has in his/her price target forecast), we have made the equity research process easier to understand and at the same time more comprehensive.
Following the announcement of the global settlement regarding equity research at the end of 2002, we firmly believe that our current organizational model is already in line with the structures proposed for research independence. We recently went beyond the recommendations by dividing our Fixed Income Research team into a Credit Research Team publishing for clients and a new separate team working with our investment bankers, clearly separating the two functions and removing any perception of lack of independence.
Results
Net profit before tax in first quarter 2003, at CHF 894 million, was 6% lower than the same period last year, but 72% higher than fourth quarter 2002. The decrease over last year is largely due to currency movements, with the US dollar falling 20% against the Swiss franc in that period. In US dollars, our net profit before tax in first quarter 2003 was 17% higher than the
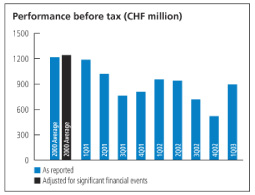
34
same period last year, compared to the 6% drop reported in Swiss francs. In our Corporate and Institutional Clients business, approximately 50% of revenues are earned in US dollars and 40% of expenses denominated in US dollars. The cost/income ratio dropped to 72% in first quarter 2003 from 76% in first quarter 2002 and from 80% in fourth quarter 2002.
Operating income
The Corporate and Institutional Clients unit generated revenues of CHF 3,341 million in the first quarter of 2003, down 20% from the same quarter last year, but up 17% from fourth quarter 2002. Investment Banking, together with Equities, bore the brunt of the decline, although a very strong performance — the best since 1999 — in our Fixed Income, Rates and Currencies business compensated.
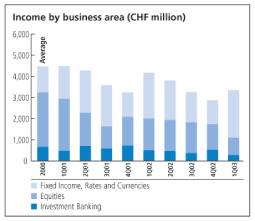
Investment Banking revenues, at CHF 287 million, decreased 44% from the same quarter last year, and 47% from the last quarter of 2002. Difficult market conditions featuring weak and volatile equity markets, uncertain geopolitical developments and falling corporate earnings continue to negatively impact the investment banking fee pool. In particular, in the US, merger and acquisitions activity in first quarter 2003 slowed to its lowest level since first quarter 1994 and was 25% lower than first quarter 2002. Investment Banking revenues, traditionally seasonal in character, are also consistently lower in the first quarter than other periods of the year.
Operating income from our Equities business in first quarter 2003 was CHF 819 million, a 45% decline from the same quarter last year and 32% lower than fourth quarter 2002, due primarily to decreased proprietary trading and primary revenues. This weakness was partially offset by continued expansion of our Equity Finance & Clearing business. In particular, our exchange traded derivatives (ETD) function achieved record levels of revenues, as we continued to capture market share. Additionally, client revenues remained steady compared to fourth quarter 2002.
The Fixed Income, Rates and Currencies business reported revenues of CHF 2,235 million, an increase of 4% on a year earlier, and 100% from the last quarter. The revenues in this business are mostly denominated in US dollars and are therefore particularly affected by the drop of the US dollar against the Swiss franc. The increase in revenues was driven by significantly improved performance in the Fixed Income, Principal Finance and Mortgages businesses.
Operating expenses
Total operating expenses dropped by 24% from first quarter 2002 but increased 4% from the previous quarter, largely as a result of higher personnel expenses. Our extensive and ongoing cost management program continues to yield savings, helping us to partially offset the effects of lower revenues in these subdued markets.
Personnel expenses fell 26% to CHF 1,788 million in first quarter 2003 from CHF 2,425 million a year earlier, predominantly as a result of lower severance costs and reduced incentive-based compensation, while increasing 21% from the previous quarter, in line with higher revenues.
General and administrative expenses were CHF 469 million, a decrease of CHF 87 million or 16% from a year earlier and CHF 186 million or 28% from fourth quarter 2002. Much of the quarter-on-quarter decline was due to a number of non-recurring expenses in fourth quarter, including the research settlement cost of CHF 90 million and a charge of CHF 35 million for the restructuring of UBS Warburg Energy. In first quarter, we cut expenses in many categories, notably in IT. We also restricted advertising costs and professional fees. Travel expenses also declined slightly because of the uncertain geopolitical environment and global public health issues.
35
UBS Warburg
13 May 2003
Amortization of goodwill fell 31% in first quarter 2003 compared to the same period last year, reflecting the fact that various assets became fully amortized in 2002.
Headcount
Headcount, at 15,856 on 31 March 2003, dropped by 108 or 1% from the end of fourth quarter 2002 and 2% from the same time last year, reflecting slight falls across most areas as a result of matching capacity to the continuing difficult market conditions.
Outlook
Due to the prevailing uncertainty regarding future global financial market trends, revenues in our Corporate and Institutional Clients unit are likely to remain somewhat unpredictable in the short and medium term. In particular, fixed income trading conditions are unlikely to remain so constructive, and any sustainable return to a long-term growth trend in investment banking will depend on a return to normal levels of corporate activity. Meanwhile, continued poor investor confidence in financial markets is limiting the flow of assets into equities.
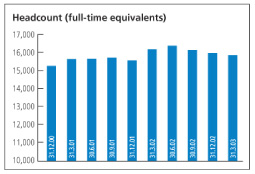
Nevertheless, we are confident that the strength of our global franchise and our strategic market position will continue to provide us with ample opportunities to expand our share of key markets. And, as we have demonstrated in the past, the elasticity of our cost base will allow us to closely manage expenses in line with revenues, with the possibility of further cost cuts should they be required.
36
UBS Capital
Business Unit reporting
| Quarter ended | % change from | |||||||||||||||||||
| CHF million, except where indicated | 31.3.03 | 31.12.02 | 31.3.02 | 4Q02 | 1Q02 | |||||||||||||||
Total operating income | (75 | ) | (301 | ) | (432 | ) | 75 | 83 | ||||||||||||
| Personnel expenses | 6 | 44 | 14 | (86 | ) | (57 | ) | |||||||||||||
| General and administrative expenses | 9 | 17 | 16 | (47 | ) | (44 | ) | |||||||||||||
| Depreciation | 0 | 0 | 0 | |||||||||||||||||
| Amortization of goodwill and other intangible assets | 0 | 0 | 0 | |||||||||||||||||
Total operating expenses | 15 | 61 | 30 | (75 | ) | (50 | ) | |||||||||||||
Business unit performance before tax | (90 | ) | (362 | ) | (462 | ) | 75 | 81 | ||||||||||||
| Business unit performance before tax and amortization of goodwill and other intangible assets | (90 | ) | (362 | ) | (462 | ) | 75 | 81 | ||||||||||||
KPI’s | ||||||||||||||||||||
| Value creation (CHF billion) | (0.1 | ) | (0.3 | ) | (0.4 | ) | 67 | 75 | ||||||||||||
| % change from | ||||||||||||||||||||
| As at | 31.3.03 | 31.12.02 | 31.3.02 | 4Q02 | 1Q02 | |||||||||||||||
Investment (CHF billion) 1 | 2.9 | 3.1 | 4.8 | (6 | ) | (40 | ) | |||||||||||||
| % change from | ||||||||||||||||||||
| Additional information | ||||||||||||||||||||
| As at | 31.3.03 | 31.12.02 | 31.3.02 | 4Q02 | 1Q02 | |||||||||||||||
| Portfolio fair value (CHF billion) | 3.6 | 3.8 | 5.4 | (5 | ) | (33 | ) | |||||||||||||
| Regulatory equity allocated (average) | 450 | 450 | 600 | 0 | (25 | ) | ||||||||||||||
| Headcount (full-time equivalents) | 54 | 73 | 95 | (26 | ) | (43 | ) | |||||||||||||
1 Historical cost of investments made, less divestments and impairments.
Key performance indicators
The level of our private equity investments stood at CHF 2.9 billion on 31 March 2003, down 6% or CHF 0.2 billion from CHF 3.1 billion on 31 December 2002. The decline reflects writedowns of CHF 123 million made in the quarter on direct investments, UBS funds and third-party funds, as well as successfully executed exits. Unfunded commitments dropped from CHF 2.1 billion on 31 December 2002 to CHF 1.9 billion on 31 March 2003.
The fair value of the portfolio on 31 March 2003 was CHF 3.6 billion, down from CHF 3.8 billion on 31 December 2002, reflecting divestments in the portfolio and minor changes in the market values of existing investments. The level of net unrealized gains was CHF 0.7 billion on 31 March 2003, slightly lower than CHF 0.8 billion on 31 December 2002.
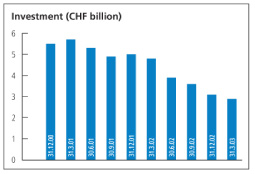
37
UBS Warburg
13 May 2003
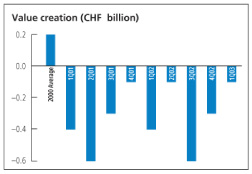
Results
UBS Capital’s results reflected continued weakness in international equity markets and generally challenging economic conditions, which affected the performance of many companies in our portfolio. A fundamentally difficult climate for divestments limited our ability to realize capital gains from exit opportunities. Despite this, we realized gains of CHF 70 million in the first quarter by making divestments in a variety of sectors in Europe, the US and Asia.
A pre-tax loss of CHF 90 million was recorded in the quarter. This compares favorably to pre-tax losses of CHF 362 million in fourth quarter 2002 and CHF 462 million in first quarter 2002, and mainly reflects lower writedowns.
Writedowns of CHF 123 million in first quarter 2003 compare to writedowns of CHF 383 million made in first quarter 2002 and CHF 389 million in fourth quarter 2002.
Total operating expenses were CHF 15 million in first quarter 2003, down from CHF 30 million in the same period last year and CHF 61 million in fourth quarter 2002. Personnel expenses, at CHF 6 million in first quarter 2003, compare with CHF 14 million in the same quarter a year earlier and CHF 44 million in fourth quarter 2002. This reduction reflects lower headcount levels, lower incentive payments related to exits and the absence of restructuring expenses. General and administrative expenses dropped to CHF 9 million in first quarter 2003 from CHF 16 million in the first quarter a year earlier and against CHF 17 million in fourth quarter 2002, largely reflecting a reduction in professional fees.
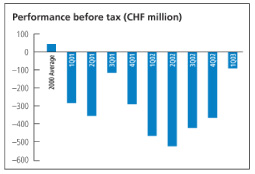
Headcount
Headcount levels have fallen from 73 at the end of 2002 to 54 on 31 March 2003 following the reduction of our portfolio and the restructuring of some regional investment teams.
Outlook
We will continue to focus on managing existing assets in order to maximize value for UBS shareholders. We will also pursue opportunities to reduce undrawn capital commitments and capitalize on exit opportunities that present themselves.
Prevailing economic conditions, however, will continue to determine our financial performance, with our results expected to remain volatile due to the unpredictability of exit opportunities. However, we do see signs that the remaining portfolio is trending towards a performance more in line with overall equity markets.
38
UBS PaineWebber
13 May 2003
UBS PaineWebber
UBS PaineWebber’s pre-tax loss in first quarter 2003 was CHF 95 million compared to a pre-tax loss of CHF 1,368 million in fourth quarter 2002, which was affected by the brand-related writedown. Excluding acquisition costs, pre-tax operating profit dropped 15% to CHF 120 million. In US dollar terms the drop was 10%, reflecting slightly higher expenses against flat revenues. The inflow of net new money remained strongly positive.
Business Group reporting
| Quarter ended | % change from | |||||||||||||||||||
| CHF million, except where indicated | 31.3.03 | 31.12.02 | 31.3.02 | 4Q02 | 1Q02 | |||||||||||||||
| Income | 1,166 | 1,215 | 1,603 | (4 | ) | (27 | ) | |||||||||||||
Credit loss expense 1 | (2 | ) | (2 | ) | (3 | ) | 0 | (33 | ) | |||||||||||
Total operating income | 1,164 | 1,213 | 1,600 | (4 | ) | (27 | ) | |||||||||||||
Personnel expenses 2 | 888 | 927 | 1,223 | (4 | ) | (27 | ) | |||||||||||||
| General and administrative expenses | 246 | 277 | 384 | (11 | ) | (36 | ) | |||||||||||||
| Depreciation | 38 | 36 | 39 | 6 | (3 | ) | ||||||||||||||
| Amortization of goodwill and other intangible assets | 87 | 1,341 | 3 | 125 | (94 | ) | (30 | ) | ||||||||||||
Total operating expenses | 1,259 | 2,581 | 1,771 | (51 | ) | (29 | ) | |||||||||||||
Business Group performance before tax | (95 | ) | (1,368 | ) | (171 | ) | 93 | 44 | ||||||||||||
Business Group reporting excluding significant financial events | ||||||||||||||||||||
| Total operating income | 1,164 | 1,213 | 1,600 | (4 | ) | (27 | ) | |||||||||||||
| Total operating expenses | 1,259 | 1,347 | �� | 1,771 | (7 | ) | (29 | ) | ||||||||||||
| Business Group performance before tax | (95 | ) | (134 | ) | (171 | ) | 29 | 44 | ||||||||||||
Less: Net goodwill funding 4 | 61 | 89 | 108 | (31 | ) | (44 | ) | |||||||||||||
| Less: Retention payments | 67 | 80 | 102 | (16 | ) | (34 | ) | |||||||||||||
| Less: Amortization of goodwill and other intangible assets | 87 | 107 | 125 | (19 | ) | (30 | ) | |||||||||||||
Business Group performance before tax and excluding acquisition costs | 120 | 142 | 164 | (15 | ) | (27 | ) | |||||||||||||
KPI’s | ||||||||||||||||||||
| Invested assets (CHF billion) | 569 | 584 | 779 | (3 | ) | (27 | ) | |||||||||||||
Net new money (CHF billion) 5 | 3.7 | 6.3 | 7.4 | |||||||||||||||||
Interest and dividend income (CHF billion) 6 | 4.0 | 3.4 | 4.8 | 18 | (17 | ) | ||||||||||||||
Gross margin on invested assets (bps) 7 | 81 | 82 | 83 | (1 | ) | (2 | ) | |||||||||||||
Gross margin on invested assets excluding acquisition costs (bps) 8 | 85 | 88 | 88 | (3 | ) | (3 | ) | |||||||||||||
Cost/income ratio (%) 9 | 108 | 212 | 110 | |||||||||||||||||
Cost/income ratio before goodwill (%) 10 | 101 | 102 | 103 | |||||||||||||||||
Cost/income ratio excluding acquisition costs (%) 11 | 90 | 89 | 90 | |||||||||||||||||
Recurring fees 12 | 454 | 486 | 625 | (7 | ) | (27 | ) | |||||||||||||
| Financial advisors (full-time equivalents) | 8,625 | 8,857 | 8,535 | (3 | ) | 1 | ||||||||||||||
| % change from | ||||||||||||||||||||
| Additional information | ||||||||||||||||||||
| As at | 31.3.03 | 31.12.02 | 31.3.02 | 4Q02 | 1Q02 | |||||||||||||||
| Client assets (CHF billion) | 634 | 650 | 850 | (2 | ) | (25 | ) | |||||||||||||
| Regulatory equity allocated (average) | 5,950 | 6,750 | 8,300 | (12 | ) | (28 | ) | |||||||||||||
| Headcount (full-time equivalents) | 19,243 | 19,563 | 20,076 | (2 | ) | (4 | ) | |||||||||||||
| 1 | In management accounts, statistically derived actuarial expected loss adjusted by deferred releases rather than the net IFRS actual credit loss is reported in the Business Groups (see Note 2 to the Financial Statements). | |
| 2 | Includes retention payments in respect of the PaineWebber acquisition. 1Q03: CHF 67 million. 4Q02: CHF 80 million. 1Q02: CHF 102 million. | |
| 3 | Includes significant financial event: Writedown of PaineWebber brand name of CHF 1,234 million. | |
| 4 | Goodwill and intangible asset-related funding, net of risk-free return on the corresponding equity allocated. | |
| 5 | Excludes the interest and dividend income noted below. | |
| 6 | For purposes of comparison with US peers. | |
| 7 | Annualized income/average invested assets. | |
| 8 | Annualized income less net goodwill funding costs/ average invested assets. | |
| 9 | Operating expenses/operating income less credit loss expense. | |
| 10 | Operating expenses less the amortization of goodwill and other intangible assets and significant financial events/operating income less credit loss expense and significant financial events. | |
| 11 | Operating expenses less the amortization of goodwill and other intangible assets, retention payments and significant financial events/operating income less credit loss expense, net goodwill funding costs and significant financial events. | |
| 12 | Asset-based and advisory revenues including fees from mutual funds, wrap fee products and insurance products. |

Joseph J. Grano, Jr.
Chairman and CEO, UBS PaineWebber

Mark B. Sutton
President and Chief Operating Officer
UBS PaineWebber
39
UBS PaineWebber
13 May 2003
Key performance indicators
The US dollar’s decline against the Swiss franc caused invested assets to fall to CHF 569 billion on 31 March 2003 from CHF 584 billion on 31 December 2002. In US dollar terms, invested assets declined 0.4% during the first quarter because of falling US equity markets, offset by the inflow of net new money.
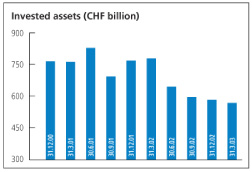
Although investors remained pessimistic about market developments in first quarter 2003, our inflow of net new money remained positive at CHF 3.7 billion, down from the fourth quarter 2002 result of CHF 6.3 billion. Including interest and dividends, net new money in first quarter 2003 was CHF 7.7 billion, comparing very favorably to peers.
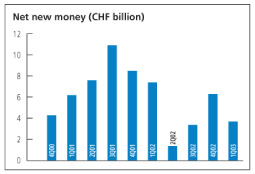
Gross margin on invested assets was 81 basis points in first quarter 2003, compared to 82 basis points in fourth quarter 2002. Gross margin on invested assets before acquisition costs (goodwill and intangible asset amortization, net goodwill funding costs and retention payments) was 85 basis points, down from 88 basis points in fourth quarter 2002, as client transaction activity was further depressed by the poor market environment.
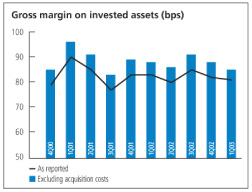
The cost/income ratio before acquisition costs was 90% in first quarter 2003, up from 89% in fourth quarter 2002. In US dollar terms and against essentially flat revenues, personnel expenses increased slightly compared to the fourth quarter, which had low performance-based compensation (which is fixed for the year at that time). Strict cost management discipline remained one of our main areas of focus in the quarter, and we will continue to push down costs wherever possible.
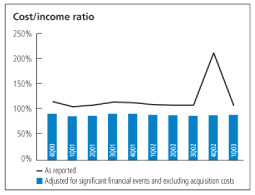
Recurring fees were CHF 454 million in first quarter 2003, down 7% from CHF 486 million in fourth quarter 2002. Excluding the effects of the US dollar’s weakening against the Swiss franc,
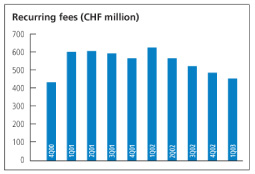
40
recurring fees increased 1% in first quarter as clients increased their take-up of managed account products.
The number of financial advisors was 8,625 on 31 March 2003, down from 8,857 on 31 December 2002, as we reduced the number of new trainees in our financial advisor training program. We continue to invest in experienced advisory personnel and recruit highly productive financial advisors.
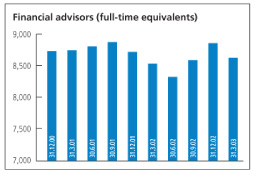
Correspondent Services Corporation sold
On 8 April 2003, we signed an agreement to sell Correspondent Services Corporation (CSC) to Fidelity Investments for an undisclosed price. CSC, a New York Stock Exchange member, provides clearing and settlement services to brokerages and other financial services industry clients. The transaction is expected to close during the second quarter of 2003. When it closes, we expect a net post-tax result from the transaction that is near the breakeven point, after deducting approximately USD 120 million in taxes, amortizing goodwill, and subtracting other transaction-related costs. It will be reported as a significant financial event in our second quarter results.
Initiatives and achievements
Online services rank second overall
In a survey conducted in the first quarter, Gomez, an internet consultancy, ranked our online services second overall among full-service US brokerages.
“UBS PaineWebber is a pioneer in integrating the online experience with advisors and always strong from an ease-of-use standpoint,” it said.
Among full-service brokerages, our online services placed first with regard to ease of use for the third consecutive year.
Alternative Investment Group wins award
Our Alternative Investment Group, together with Morgan Stanley, won the 2002 InvestHedge award for “Product of the Year” on 3 March 2003 for its line of funds-of-funds offerings.
A fund-of-funds provides investors with a managed portfolio of hedge funds that attempts to minimize potential risks an investor might assume when investing in a single hedge fund. Funds-of-funds also give investors access to investment funds that no longer accept new subscriptions or require extremely large investment minimums.
The InvestHedge award was given to us in recognition of our pioneering efforts regarding the structuring and raising of investments for high-net-worth clients as well as the capital that the Alternative Investment Group has raised. When structuring funds-of-funds, the Alternative Investment Group’s due diligence team utilizes a rigorous and disciplined process that analyzes both qualitative and quantitative data.
Municipal Securities has record quarter
Our Municipal Securities Group reported a record quarter, with success driven by the depth of our client franchise amid a favorable market environment. We ranked first in lead managed negotiated underwriting volume as our market share rose to 13.4% from 9.5% in fourth quarter 2002. We closed more deals than any other firm in the industry and ranked first in the Education Loan, Housing, and Transportation Finance sectors.
Results
In first quarter 2003, political, economic and financial uncertainty continued to adversely affect investor optimism and activity. The UBS Index of Investor Optimism declined throughout the quarter and reached an all-time low in March. Daily average trading volumes were 2% lower than the prior quarter and 11.6% lower than in first quarter 2002.
Because our business is almost entirely conducted in US dollars, comparisons of first quarter results to prior periods are affected by the depreciation of the US dollar against the Swiss franc.
41
UBS PaineWebber
13 May 2003
We reported a pre-tax loss of CHF 95 million in first quarter 2003, down from the loss of CHF 1,368 million in fourth quarter 2002 which was affected by the writedown of the PaineWebber brand, requiring a pre-tax amortization expense of CHF 1,234 million. Excluding the writedown and other acquisition costs, we posted an operating pre-tax profit of CHF 120 million for first quarter 2003, down from CHF 142 million in fourth quarter 2002. In US dollar terms, our performance before tax and acquisition costs was 10% lower than in fourth quarter 2002, reflecting essentially flat revenues but slightly higher personnel expenses. The cost/income ratio dropped from 212% in fourth quarter 2002 to 108% in first quarter 2003 — excluding acquisition costs the ratio slightly increased to 90% in first quarter 2003 from 89% a quarter earlier.
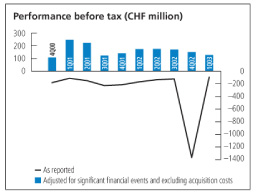
Operating income
Total operating income was CHF 1,164 million in first quarter 2003, 4% or CHF 49 million below the fourth quarter 2002 result. The decline in operating income was attributable to currency movements. Excluding currency fluctuations, operating income was 2% higher than in fourth quarter due to reduced funding costs after the PaineWebber brand name writedown. Excluding acquisition costs and the effects of currency translations, revenues were flat in first quarter 2003 compared to fourth quarter 2002. Revenue declines due to less active clients were partially offset by an increase in municipal securities revenues, which were at record levels.
Operating expenses
In first quarter 2003, total operating expenses were CHF 1,259 million, their lowest level since our merger with UBS, and 51% less than fourth quarter 2002 (which was influenced by the writedown of the PaineWebber brand name). After adjusting for the effect of the weaker US dollar and excluding the brand writedown, operating expenses in first quarter were 1% lower than in fourth quarter on declining intangible asset amortization levels following the PaineWebber brand name writeoff.
Personnel expenses dropped 4% to CHF 888 million in first quarter 2003 from CHF 927 million in fourth quarter 2002. Excluding the effects of currency movements, personnel expenses were 1% higher than in fourth quarter, reflecting higher employee benefit plan expenses and a rise in performance-based compensation. The fixing of full-year performance-related expenses based on final earnings and prevailing market rates reduced performance-based compensation in fourth quarter 2002.
Non-personnel expenses, which include general and administrative, depreciation and amortization expenses, decreased 78% from CHF 1,654 million in fourth quarter 2002 to CHF 371 million in first quarter 2003. This decrease reflects mainly the writedown of the PaineWebber brand following our decision made in fourth quarter 2002 to move to a single brand, as well as lower amortization of intangible assets due to the writedown. Excluding amortization and currency effects, non-personnel costs decreased 4% in the same period, reflecting the global equity research settlement charge recorded in fourth quarter 2002.
Headcount
Headcount was 19,243 on 31 March 2003, a decrease of 320 from 31 December 2002. The decline primarily reflected the decrease in financial advisors.
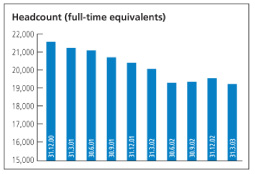
42
Non-financial advisor headcount fell by 88 during the quarter and is 1% lower than the same time last year.
Outlook
Investors in the US remain relatively pessimistic because of continued uncertainty about future economic developments and the general geopolitical situation, with the market environment therefore continuing to be challenging.
To date, we have performed extremely well compared to our peers in these difficult markets. We have experienced strong, positive inflows of net new money for nine consecutive quarters now — an outstanding performance compared to other full-service brokerages in the US. And, although we have managed our costs very tightly, we have been gaining market share and investing in areas with future growth potential. We expect these competitive gains to continue.
43
Corporate Center
13 May 2003
Corporate Center
Business Group reporting
| Quarter ended | % change from | |||||||||||||||||||
| CHF million, except where indicated | 31.3.03 | 31.12.02 | 31.3.02 | 4Q02 | 1Q02 | |||||||||||||||
| Income | 201 | 4741 | 670 | 2 | (58 | ) | (70 | ) | ||||||||||||
Credit loss (expense)/recovery3 | (8 | ) | 117 | 51 | ||||||||||||||||
Total operating income | 193 | 591 | 721 | (67 | ) | (73 | ) | |||||||||||||
| Personnel expenses | 186 | 234 | 270 | (21 | ) | (31 | ) | |||||||||||||
| General and administrative expenses | 57 | 220 | 84 | (74 | ) | (32 | ) | |||||||||||||
| Depreciation | 114 | 134 | 141 | (15 | ) | (19 | ) | |||||||||||||
| Amortization of goodwill and other intangible assets | 26 | 33 | 33 | (21 | ) | (21 | ) | |||||||||||||
Total operating expenses | 383 | 621 | 528 | (38 | ) | (27 | ) | |||||||||||||
Business Group performance before tax | (190 | ) | (30 | ) | 193 | (533 | ) | |||||||||||||
Business Group reporting excluding significant financial events | ||||||||||||||||||||
| Total operating income | 193 | 519 | 566 | (63 | ) | (66 | ) | |||||||||||||
| Total operating expenses | 383 | 621 | 528 | (38 | ) | (27 | ) | |||||||||||||
Business Group performance before tax | (190 | ) | (102 | ) | 38 | (86 | ) | |||||||||||||
| Business Group performance before tax and amortization of goodwill and other intangible assets | (164 | ) | (69 | ) | 71 | (138 | ) | |||||||||||||
Private Banks & GAM | ||||||||||||||||||||
| Performance before tax | 56 | 79 | 56 | 4 | (29 | ) | 0 | |||||||||||||
| Performance before tax and amortization of goodwill and other intangible assets | 77 | 107 | 81 | 4 | (28 | ) | (5 | ) | ||||||||||||
| Invested assets (CHF billion) | 68 | 70 | 81 | (3 | ) | (16 | ) | |||||||||||||
Net new money (CHF billion) 5 | 0.6 | 0.9 | 1.2 | |||||||||||||||||
| Headcount (full-time equivalents) | 1,697 | 1,702 | 1,765 | 0 | (4 | ) | ||||||||||||||
| % change from | ||||||||||||||||||||
| Additional information | ||||||||||||||||||||
| As at | 31.3.03 | 31.12.02 | 31.3.02 | 4Q02 | 1Q02 | |||||||||||||||
| Regulatory equity allocated (average) | 9,550 | 9,350 | 10,800 | 2 | (12 | ) | ||||||||||||||
| Headcount (full-time equivalents) | 2,892 | 2,887 | 2,949 | 0 | (2 | ) | ||||||||||||||
1 Includes significant financial event: gain on disposal of Klinik Hirslanden of CHF 72 million. 2 Includes significant financial event: gain on disposal of Hyposwiss of CHF 155 million. 3 In order to show the relevant Business Group performance over time, adjusted expected loss figures rather than the net IFRS actual credit loss expenses are reported for all Business Groups. The difference between the adjusted expected loss figures and the net IFRS actual credit loss expenses recorded at Group level is reported in the Corporate Center (see Note 2 to the Financial Statements). 4 Excludes significant financial event: gain on disposal of Hyposwiss of CHF 155 million. 5 Excludes interest and dividend income.
44
Results
In first quarter 2003, Corporate Center recorded a pre-tax loss of CHF 190 million, compared to a pre-tax gain of CHF 193 million in first quarter 2002. Pre-goodwill and excluding the pre-tax gain of CHF 155 million of first quarter 2002 due to the sale of Hyposwiss, net profit declined by CHF 235 million.
The credit loss expense or recovery booked in the Corporate Center represents the difference between the statistically calculated adjusted expected losses charged to the business units and the actual credit loss recognized in the Group Financial Statements. In first quarter 2003, UBS Group recorded an actual credit loss expense of CHF 104 million, 22% higher than the CHF 85 million in the same quarter a year ago. Actual credit loss expense was, for the first time since third quarter 2001, higher than the adjusted expected loss charged to the business units, resulting in a credit loss expense in Corporate Center of CHF 8 million, compared to a credit loss recovery of CHF 51 million in first quarter 2002, when the actual loss fell below the adjusted expected loss.
Total operating income dropped to CHF 193 million in first quarter 2003, down 73% from CHF 721 million in the same quarter a year earlier. Excluding the gains from the sale of Hyposwiss, operating income dropped by 66% compared to the same quarter a year earlier. This drop was mainly due to higher credit loss expenses, the de-consolidation of Klinik Hirslanden (sold in fourth quarter 2002) and Hyposwiss (sold in first quarter 2002) as well as a significant writedown of our stake in Swiss International Airlines Ltd.
Personnel expenses declined 31% from CHF 270 million in first quarter 2002 to CHF 186 million in first quarter 2003. General and administrative expenses decreased CHF 27 million to CHF 57 million in the same period. Both declines were mainly due to the de-consolidation of Klinik Hirslanden and Hyposwiss.
Headcount increased by 5 to 2,892 during the quarter, mainly related to projects.
Private Banks & GAM
Invested assets dropped 3% from CHF 70 billion on 31 December 2002 to CHF 68 billion on 31 March 2003, reflecting the lower market levels.
Net new money in first quarter 2003 was CHF 0.6 billion, mainly due to continued strong inflows into GAM.
Net profit before tax declined from CHF 79 million in fourth quarter 2002 to CHF 56 million in first quarter 2003. Before goodwill, net profit fell by CHF 30 million to CHF 77 million in first quarter 2003 from CHF 107 million in fourth quarter 2002, which was positively influenced by a litigation-related recovery.
45
Financial Statements
13 May 2003
Financial Statements
UBS Group Income Statement(unaudited)
| Quarter ended | % change from | |||||||||||||||||||||||
| CHF million, except per share data | Note | 31.3.03 | 31.12.02 | 31.3.02 | 4Q02 | 1Q02 | ||||||||||||||||||
Operating income | ||||||||||||||||||||||||
| Interest income | 3 | 9,632 | 8,697 | 10,213 | 11 | (6 | ) | |||||||||||||||||
| Interest expense | 3 | (6,723 | ) | (6,000 | ) | (7,450 | ) | 12 | (10 | ) | ||||||||||||||
| Net interest income | 2,909 | 2,697 | 2,763 | 8 | 5 | |||||||||||||||||||
| Credit loss (expense)/recovery | (104 | ) | 11 | (85 | ) | 22 | ||||||||||||||||||
| Net interest income after credit loss expense | 2,805 | 2,708 | 2,678 | 4 | 5 | |||||||||||||||||||
| Net fee and commission income | 4 | 3,826 | 4,236 | 4,870 | (10 | ) | (21 | ) | ||||||||||||||||
| Net trading income | 3 | 1,261 | 666 | 1,983 | 89 | (36 | ) | |||||||||||||||||
| Other income | 5 | (119 | ) | (86 | ) | 58 | (38 | ) | ||||||||||||||||
| Total operating income | 7,773 | 7,524 | 9,589 | 3 | (19 | ) | ||||||||||||||||||
Operating expenses | ||||||||||||||||||||||||
| Personnel expenses | 6 | 4,202 | 4,021 | 5,317 | 5 | (21 | ) | |||||||||||||||||
| General and administrative expenses | 7 | 1,397 | 1,840 | 1,700 | (24 | ) | (18 | ) | ||||||||||||||||
| Depreciation of property and equipment | 336 | 398 | 397 | (16 | ) | (15 | ) | |||||||||||||||||
| Amortization of goodwill and other intangible assets | 242 | 1,517 | 336 | (84 | ) | (28 | ) | |||||||||||||||||
| Total operating expenses | 6,177 | 7,776 | 7,750 | (21 | ) | (20 | ) | |||||||||||||||||
Operating profit/(loss) before tax and minority interests | 1,596 | (252 | ) | 1,839 | (13 | ) | ||||||||||||||||||
| Tax expense/(benefit) | 310 | (209 | ) | 357 | (13 | ) | ||||||||||||||||||
Net profit/(loss) before minority interests | 1,286 | (43 | ) | 1,482 | (13 | ) | ||||||||||||||||||
| Minority interests | (72 | ) | (58 | ) | (119 | ) | 24 | (39 | ) | |||||||||||||||
Net profit/(loss) | 1,214 | (101 | ) | 1,363 | (11 | ) | ||||||||||||||||||
| Basic earnings per share (CHF) | 8 | 1.05 | (0.09 | ) | 1.10 | (5 | ) | |||||||||||||||||
| Diluted earnings per share (CHF) | 8 | 1.02 | (0.09 | ) | 1.06 | (4 | ) | |||||||||||||||||
46
UBS Group Balance Sheet(unaudited)
| % change from | ||||||||||||
| CHF million | 31.3.03 | 31.12.02 | 31.12.02 | |||||||||
Assets | ||||||||||||
| Cash and balances with central banks | 3,243 | 4,271 | (24 | ) | ||||||||
| Due from banks | 33,615 | 32,468 | 4 | |||||||||
| Cash collateral on securities borrowed | 146,825 | 139,052 | 6 | |||||||||
| Reverse repurchase agreements | 304,717 | 294,086 | 4 | |||||||||
| Trading portfolio assets | 407,118 | 371,436 | 10 | |||||||||
| Positive replacement values | 80,393 | 82,092 | (2 | ) | ||||||||
| Loans | 211,127 | 211,647 | 0 | |||||||||
| Financial investments | 7,672 | 8,391 | (9 | ) | ||||||||
| Accrued income and prepaid expenses | 7,012 | 6,453 | 9 | |||||||||
| Investments in associates | 762 | 705 | 8 | |||||||||
| Property and equipment | 7,682 | 7,869 | (2 | ) | ||||||||
| Goodwill and other intangible assets | 13,181 | 13,696 | (4 | ) | ||||||||
| Other assets | 8,971 | 8,952 | 0 | |||||||||
Total assets | 1,232,318 | 1,181,118 | 4 | |||||||||
Total subordinated assets | 2,969 | 3,652 | (19 | ) | ||||||||
Liabilities | ||||||||||||
| Due to banks | 97,197 | 83,178 | 17 | |||||||||
| Cash collateral on securities lent | 36,957 | 36,870 | 0 | |||||||||
| Repurchase agreements | 366,532 | 366,858 | 0 | |||||||||
| Trading portfolio liabilities | 132,971 | 106,453 | 25 | |||||||||
| Negative replacement values | 81,376 | 81,282 | 0 | |||||||||
| Due to customers | 322,329 | 306,876 | 5 | |||||||||
| Accrued expenses and deferred income | 9,990 | 15,331 | (35 | ) | ||||||||
| Debt issued | 126,297 | 129,411 | (2 | ) | ||||||||
| Other liabilities | 15,380 | 12,339 | 25 | |||||||||
Total liabilities | 1,189,029 | 1,138,598 | 4 | |||||||||
| Minority interests | 3,525 | 3,529 | 0 | |||||||||
Shareholders’ equity | ||||||||||||
| Share capital | 1,005 | 1,005 | 0 | |||||||||
| Share premium account | 12,533 | 12,638 | (1 | ) | ||||||||
| Net gains/(losses) not recognized in the income statement, net of tax | (126 | ) | (159 | ) | 21 | |||||||
| Retained earnings | 33,852 | 32,638 | 4 | |||||||||
| Treasury shares | (7,500 | ) | (7,131 | ) | (5 | ) | ||||||
Total shareholders’ equity | 39,764 | 38,991 | 2 | |||||||||
Total liabilities, minority interests and shareholders’ equity | 1,232,318 | 1,181,118 | 4 | |||||||||
Total subordinated liabilities | 8,709 | 10,102 | (14 | ) | ||||||||
47
Financial Statements
13 May 2003
UBS Group Statement of Changes in Equity(unaudited)
| CHF million | ||||||||
| For the quarter ended | 31.3.03 | 31.3.02 | ||||||
Issued and paid up share capital | ||||||||
| Balance at the beginning of the period | 1,005 | 3,589 | ||||||
| Issue of share capital | 0 | 1 | ||||||
Balance at the end of the period | 1,005 | 3,590 | ||||||
Share premium | ||||||||
| Balance at the beginning of the period | 12,638 | 14,408 | ||||||
| Premium on shares issued and warrants exercised | 13 | 14 | ||||||
| Net premium/(discount) on treasury share and own equity derivative activity | (118 | ) | (85 | ) | ||||
Balance at the end of the period | 12,533 | 14,337 | ||||||
Net gains/(losses) not recognized in the income statement, net of taxes | ||||||||
Foreign currency translation | ||||||||
| Balance at the beginning of the period | (849 | ) | (769 | ) | ||||
| Movements during the period | (30 | ) | 18 | |||||
Subtotal — balance at the end of the period | (879 | ) | (751 | ) | ||||
Net unrealized gains/(losses) on available for sale investments, net of taxes | ||||||||
| Balance at the beginning of the period | 946 | 1,035 | ||||||
| Net unrealized gains/(losses) on available for sale investments | (80 | ) | 90 | |||||
| Impairment charges reclassified to the income statement | 132 | 174 | ||||||
| Gains reclassified to the income statement | (26 | ) | (122 | ) | ||||
| Losses reclassified to the income statement | 11 | 1 | ||||||
Subtotal — balance at the end of the period | 983 | 1,178 | ||||||
Change in fair value of derivative instruments designated as cash flow hedges, net of taxes | ||||||||
| Balance at the beginning of the period | (256 | ) | (459 | ) | ||||
| Net unrealized gains/(losses) on the revaluation of cash flow hedges | (27 | ) | 103 | |||||
| Net (gains)/losses reclassified to the income statement | 53 | 51 | ||||||
Subtotal — balance at the end of the period | (230 | ) | (305 | ) | ||||
Balance at the end of the period | (126 | ) | 122 | |||||
Retained earnings | ||||||||
| Balance at the beginning of the period | 32,638 | 29,103 | ||||||
| Net profit for the period | 1,214 | 1,363 | ||||||
Balance at the end of the period | 33,852 | 30,466 | ||||||
Treasury shares, at cost | ||||||||
| Balance at the beginning of the period | (7,131 | ) | (3,377 | ) | ||||
| Acquisitions | (910 | ) | (1,533 | ) | ||||
| Disposals | 541 | 1,164 | ||||||
Balance at the end of the period | (7,500 | ) | (3,746 | ) | ||||
Total shareholders’ equity | 39,764 | 44,769 | ||||||
Out of the total number of 106,106,685 treasury shares on 31 March 2003, 77,440,080 shares have been repurchased for cancelation. On 31 March 2003, a maximum of 9,186,559 shares can be issued against the exercise of options from former PaineWebber employee option plans.
48
UBS Group Statement of Cash Flows(unaudited)
| CHF million | |||||||||
| For the quarter ended | 31.3.03 | 31.3.02 | |||||||
Cash flow from/(used in) operating activities | |||||||||
| Net profit | 1,214 | 1,363 | |||||||
Adjustments to reconcile net profit to cash flow from/(used in) operating activities | |||||||||
| Non-cash items included in net profit and other adjustments: | |||||||||
| Depreciation of property and equipment | 336 | 397 | |||||||
| Amortization of goodwill and other intangible assets | 242 | 336 | |||||||
| Credit loss expense/(recovery) | 104 | 85 | |||||||
| Equity in income of associates | (10 | ) | (1 | ) | |||||
| Deferred tax expense/(benefit) | 116 | (158 | ) | ||||||
| Net loss/(gain) from investing activities | 172 | 150 | |||||||
| Net (increase)/decrease in operating assets: | |||||||||
| Net due from/to banks | 13,827 | (17,881 | ) | ||||||
| Reverse repurchase agreements and cash collateral on securities borrowed | (18,404 | ) | 8,708 | ||||||
| Trading portfolio and net replacement values | (3,481 | ) | 20,194 | ||||||
| Loans/due to customers | 15,007 | (16,546 | ) | ||||||
| Accrued income, prepaid expenses and other assets | (668 | ) | (917 | ) | |||||
| Net increase/(decrease) in operating liabilities: | |||||||||
| Repurchase agreements, cash collateral on securities lent | (239 | ) | 2,773 | ||||||
| Accrued expenses and other liabilities | (1,973 | ) | (3,584 | ) | |||||
| Income taxes paid | (250 | ) | (257 | ) | |||||
Net cash flow from/(used in) operating activities | 5,993 | (5,338 | ) | ||||||
Cash flow from/(used in) investing activities | |||||||||
| Investments in subsidiaries and associates | 0 | (3 | ) | ||||||
| Disposal of subsidiaries and associates | 27 | 137 | |||||||
| Purchase of property and equipment | (226 | ) | (400 | ) | |||||
| Disposal of property and equipment | 15 | 20 | |||||||
| Net (investment in)/divestment of financial investments | 254 | (38 | ) | ||||||
Net cash flow from/(used in) investing activities | 70 | (284 | ) | ||||||
Cash flow from/(used in) financing activities | |||||||||
| Net money market paper issued/(repaid) | 335 | (632 | ) | ||||||
| Net movements in treasury shares and own equity derivative activity | (474 | ) | (440 | ) | |||||
| Capital issuance | 0 | 1 | |||||||
| Issuance of long-term debt | 4,132 | 5,394 | |||||||
| Repayment of long-term debt | (4,469 | ) | (3,869 | ) | |||||
| Increase in minority interests | 65 | 0 | |||||||
| Dividend payments to/and purchase from minority interests | (156 | ) | (117 | ) | |||||
Net cash flow from/(used in) financing activities | (567 | ) | 337 | ||||||
| Effects of exchange rate differences | (1,144 | ) | (679 | ) | |||||
Net increase/(decrease) in cash equivalents | 4,352 | (5,964 | ) | ||||||
| Cash and cash equivalents, beginning of the period | 82,344 | 116,259 | |||||||
Cash and cash equivalents, end of the period | 86,696 | 110,295 | |||||||
Cash and cash equivalents comprise: | |||||||||
| Cash and balances with central banks | 3,243 | 3,759 | |||||||
Money market paper 1 | 51,470 | 73,318 | |||||||
| Due from banks maturing in less than three months | 31,983 | 33,218 | |||||||
Total | 86,696 | 110,295 | |||||||
1 Money market paper is included in the Balance sheet under Trading portfolio assets and Financial investments. CHF 8,692 million and CHF 28,663 million were pledged at 31 March 2003 and 31 March 2002, respectively.
49
Notes to the Financial Statements
13 May 2003
Notes to the Financial Statements(unaudited)
Note 1 Basis of Accounting
UBS AG’s (“UBS” or “the Group”) consolidated financial statements (“the Financial Statements”) are prepared in accordance with International Financial Reporting Standards (IFRS) and stated in Swiss francs (CHF). These Financial Statements are presented in accordance with IAS 34 “Interim Financial Statements”. In preparing the Interim Financial Statements, the same accounting principles and methods of computation are applied as in the Financial Statements at 31 December 2002 and for the year then ended. These interim Financial Statements should be read in conjunction with the audited Financial Statements included in the UBS Financial Report 2002.
In the first quarter 2003, the Group’s five independently operating private banks and GAM were transferred out of UBS Wealth Management & Business Banking and UBS Global Asset Management into a separate holding company held by Corporate Center. Note 2 to the Interim Financial Statements reflects the changed Business Group structure and associated management accounting changes. Comparative prior period amounts have been restated to conform to the current year presentation.
The Group sponsors the formation of companies, which may or may not be directly or indirectly owned subsidiaries, for the purpose of asset securitization transactions and to accomplish certain narrow and well-defined objectives. These companies may acquire assets directly or indirectly from UBS or its affiliates. Some of these companies are bankruptcy-remote entities whose assets are not available to satisfy the claims of creditors of the Group or any of its subsidiaries. Such companies are consolidated in the Group’s financial statements when the relationship between the Group and the company indicates that it is controlled by the Group.
50
Note 2 Reporting by Business Group
The Business Group results are presented on a management reporting basis. Consequently, internal charges and transfer pricing adjustments are reflected in the performance of each business. Revenue-sharing agreements are used to allocate external customer revenues to a Business Group on a reasonable basis. Transactions between Business Groups are conducted at arm’s length. 2002 segment results have been restated to reflect the transfer of the Private Banks & GAM to Corporate Center.
For the quarter ended 31 March 2003
| UBS | UBS Global | |||||||||||||||||||||||
| Wealth Management & | Asset | UBS | UBS | Corporate | UBS | |||||||||||||||||||
| CHF million | Business Banking | Management | Warburg | PaineWebber | Center | Group | ||||||||||||||||||
| Income | 2,866 | 378 | 3,266 | 1,166 | 201 | 7,877 | ||||||||||||||||||
Credit loss expense1 | (57 | ) | 0 | (37 | ) | (2 | ) | (8 | ) | (104 | ) | |||||||||||||
| Total operating income | 2,809 | 378 | 3,229 | 1,164 | 193 | 7,773 | ||||||||||||||||||
| Personnel expenses | 1,146 | 188 | 1,794 | 888 | 186 | 4,202 | ||||||||||||||||||
| General and administrative expenses | 517 | 99 | 478 | 246 | 57 | 1,397 | ||||||||||||||||||
| Depreciation | 94 | 7 | 83 | 38 | 114 | 336 | ||||||||||||||||||
| Amortization of goodwill and other intangible assets | 19 | 40 | 70 | 87 | 26 | 242 | ||||||||||||||||||
| Total operating expenses | 1,776 | 334 | 2,425 | 1,259 | 383 | 6,177 | ||||||||||||||||||
Business Group performance before tax | 1,033 | 44 | 804 | (95 | ) | (190 | ) | 1,596 | ||||||||||||||||
| Tax expense | 310 | |||||||||||||||||||||||
Net profit before minority interests | 1,286 | |||||||||||||||||||||||
| Minority interests | (72 | ) | ||||||||||||||||||||||
Net profit | 1,214 | |||||||||||||||||||||||
1 In order to show the relevant Business Group performance over time, adjusted expected loss figures rather than the IFRS actual net credit loss expense are reported for each Business Group. The adjusted expected loss is the statistically derived actuarial expected loss which reflects the inherent counterparty and country risks in the respective portfolios, plus the deferred releases representing the amortized historical differences between actual credit losses and actuarial expected loss. The difference between the adjusted expected loss figures and the IFRS actual net credit loss expense recorded at Group level for financial reporting purposes is reported in the Corporate Center. The Business Group breakdown of the net credit loss expense for financial reporting purposes of CHF 104 million for the quarter ended 31 March 2003 is as follows: UBS Wealth Management & Business Banking CHF 64 million expense and UBS Warburg CHF 40 million expense.
For the quarter ended 31 March 2002
| UBS | UBS Global | |||||||||||||||||||||||
| Wealth Management & | Asset | UBS | UBS | Corporate | UBS | |||||||||||||||||||
| CHF million | Business Banking | Management | Warburg | PaineWebber | Center | Group | ||||||||||||||||||
| Income | 3,184 | 476 | 3,741 | 1,603 | 670 | 9,674 | ||||||||||||||||||
Credit loss expense 1 | (93 | ) | 0 | (40 | ) | (3 | ) | 51 | (85 | ) | ||||||||||||||
| Total operating income | 3,091 | 476 | 3,701 | 1,600 | 721 | 9,589 | ||||||||||||||||||
| Personnel expenses | 1,166 | 219 | 2,439 | 1,223 | 270 | 5,317 | ||||||||||||||||||
| General and administrative expenses | 540 | 120 | 572 | 384 | 84 | 1,700 | ||||||||||||||||||
| Depreciation | 116 | 5 | 96 | 39 | 141 | 397 | ||||||||||||||||||
| Amortization of goodwill and other intangible assets | 24 | 52 | 102 | 125 | 33 | 336 | ||||||||||||||||||
| Total operating expenses | 1,846 | 396 | 3,209 | 1,771 | 528 | 7,750 | ||||||||||||||||||
Business Group performance before tax | 1,245 | 80 | 492 | (171 | ) | 193 | 1,839 | |||||||||||||||||
| Tax expense | 357 | |||||||||||||||||||||||
Net profit before minority interests | 1,482 | |||||||||||||||||||||||
| Minority interests | (119 | ) | ||||||||||||||||||||||
Net profit | 1,363 | |||||||||||||||||||||||
1 In order to show the relevant Business Group performance over time, adjusted expected loss figures rather than the IFRS actual net credit loss expense are reported for each Business Group. The adjusted expected loss is the statistically derived actuarial expected loss which reflects the inherent counterparty and country risks in the respective portfolios, plus the deferred releases representing the amortized historical differences between actual credit losses and actuarial expected loss. The difference between the adjusted expected loss figures and the IFRS actual net credit loss expense recorded at Group level for financial reporting purposes is reported in the Corporate Center. The Business Group breakdown of the net credit loss expense for financial reporting purposes of CHF 85 million for the quarter ended 31 March 2002 is as follows: UBS Wealth Management & Business Banking CHF 61 million expense, UBS Warburg CHF 31 million expense, UBS PaineWebber CHF 3 million expense and Corporate Center CHF 10 million recovery.
51
Notes to the Financial Statements
13 May 2003
Note 3 Net Interest and Trading Income
Net interest income
| Quarter ended | % change from | |||||||||||||||||||
| CHF million | 31.3.03 | 31.12.02 | 31.3.02 | 4Q02 | 1Q02 | |||||||||||||||
Interest income | ||||||||||||||||||||
| Interest earned on loans and advances | 2,572 | 2,663 | 3,176 | (3 | ) | (19 | ) | |||||||||||||
| Interest earned on securities borrowed and reverse repurchase agreements | 2,844 | 2,011 | 2,780 | 41 | 2 | |||||||||||||||
| Interest and dividend income from financial investments | 25 | 26 | 52 | (4 | ) | (52 | ) | |||||||||||||
| Interest and dividend income from trading portfolio | 4,191 | 3,997 | 4,205 | 5 | 0 | |||||||||||||||
Total | 9,632 | 8,697 | 10,213 | 11 | (6 | ) | ||||||||||||||
Interest expense | ||||||||||||||||||||
| Interest on amounts due to banks and customers | 1,192 | 1,428 | 1,753 | (17 | ) | (32 | ) | |||||||||||||
| Interest on securities lent and repurchase agreements | 2,482 | 1,685 | 2,538 | 47 | (2 | ) | ||||||||||||||
| Interest and dividend expense from trading portfolio | 2,245 | 1,970 | 1,806 | 14 | 24 | |||||||||||||||
| Interest on debt issued | 804 | 917 | 1,353 | (12 | ) | (41 | ) | |||||||||||||
Total | 6,723 | 6,000 | 7,450 | 12 | (10 | ) | ||||||||||||||
Net interest income | 2,909 | 2,697 | 2,763 | 8 | 5 | |||||||||||||||
Net trading income
| Quarter ended | % change from | |||||||||||||||||||
| CHF million | 31.3.03 | 31.12.02 | 31.3.02 | 4Q02 | 1Q02 | |||||||||||||||
| Equities | 182 | 451 | 682 | (60 | ) | (73 | ) | |||||||||||||
Fixed income 1 | 619 | (213 | ) | 800 | (23 | ) | ||||||||||||||
| Foreign exchange and other | 460 | 428 | 501 | 7 | (8 | ) | ||||||||||||||
Net trading income | 1,261 | 666 | 1,983 | 89 | (36 | ) | ||||||||||||||
1 Includes commodities trading income.
Net interest and trading income
| Quarter ended | % change from | |||||||||||||||||||
| CHF million | 31.3.03 | 31.12.02 | 31.3.02 | 4Q02 | 1Q02 | |||||||||||||||
| Net interest income | 2,909 | 2,697 | 2,763 | 8 | 5 | |||||||||||||||
| Net trading income | 1,261 | 666 | 1,983 | 89 | (36 | ) | ||||||||||||||
Total net interest and trading income | 4,170 | 3,363 | 4,746 | 24 | (12 | ) | ||||||||||||||
| Breakdown by business activity: | ||||||||||||||||||||
| Net income from interest margin products | 1,285 | 1,296 | 1,423 | (1 | ) | (10 | ) | |||||||||||||
| Net income from trading activities | 2,761 | 1,971 | 3,282 | 40 | (16 | ) | ||||||||||||||
| Net income from treasury activities | 384 | 435 | 419 | (12 | ) | (8 | ) | |||||||||||||
Other 1 | (260 | ) | (339 | ) | (378 | ) | 23 | 31 | ||||||||||||
Total net interest and trading income | 4,170 | 3,363 | 4,746 | 24 | (12 | ) | ||||||||||||||
1 Principally external funding costs of the Paine Webber Group, Inc. acquisition.
52
Note 4 Net Fee and Commission Income
| Quarter ended | % change from | |||||||||||||||||||
| CHF million | 31.3.03 | 31.12.02 | 31.3.02 | 4Q02 | 1Q02 | |||||||||||||||
| Underwriting fees | 437 | 528 | 497 | (17 | ) | (12 | ) | |||||||||||||
| Corporate finance fees | 114 | 252 | 178 | (55 | ) | (36 | ) | |||||||||||||
| Brokerage fees | 1,229 | 1,343 | 1,647 | (8 | ) | (25 | ) | |||||||||||||
| Investment fund fees | 882 | 898 | 1,106 | (2 | ) | (20 | ) | |||||||||||||
| Fiduciary fees | 63 | 68 | 84 | (7 | ) | (25 | ) | |||||||||||||
| Custodian fees | 279 | 317 | 334 | (12 | ) | (16 | ) | |||||||||||||
| Portfolio and other management and advisory fees | 901 | 935 | 1,148 | (4 | ) | (22 | ) | |||||||||||||
| Insurance-related and other fees | 103 | 81 | 134 | 27 | (23 | ) | ||||||||||||||
| Total securities trading and investment activity fees | 4,008 | 4,422 | 5,128 | (9 | ) | (22 | ) | |||||||||||||
| Credit-related fees and commissions | 62 | 59 | 75 | 5 | (17 | ) | ||||||||||||||
| Commission income from other services | 260 | 257 | 260 | 1 | 0 | |||||||||||||||
Total fee and commission income | 4,330 | 4,738 | 5,463 | (9 | ) | (21 | ) | |||||||||||||
| Brokerage fees paid | 334 | 323 | 348 | 3 | (4 | ) | ||||||||||||||
| Other | 170 | 179 | 245 | (5 | ) | (31 | ) | |||||||||||||
Total fee and commission expense | 504 | 502 | 593 | 0 | (15 | ) | ||||||||||||||
Net fee and commission income | 3,826 | 4,236 | 4,870 | (10 | ) | (21 | ) | |||||||||||||
Note 5 Other Income
| Quarter ended | % change from | ||||||||||||||||||||
| CHF million | 31.3.03 | 31.12.02 | 31.3.02 | 4Q02 | 1Q02 | ||||||||||||||||
Gains/losses from disposal of associates and subsidiaries | |||||||||||||||||||||
| Net gain from disposal of: | |||||||||||||||||||||
| Consolidated subsidiaries | 0 | 72 | 155 | (100 | ) | (100 | ) | ||||||||||||||
| Investments in associates | 0 | 0 | 0 | ||||||||||||||||||
Total | 0 | 72 | 155 | (100 | ) | (100 | ) | ||||||||||||||
Financial investments available for sale | |||||||||||||||||||||
| Net gain from disposal of: | |||||||||||||||||||||
| Private equity investments | 63 | 116 | 18 | (46 | ) | 250 | |||||||||||||||
| Other financial investments | 5 | 26 | 87 | (81 | ) | (94 | ) | ||||||||||||||
| Impairment charges on private equity investments and other financial investments | (240 | ) | (457 | ) | (429 | ) | 47 | 44 | |||||||||||||
Total | (172 | ) | (315 | ) | (324 | ) | 45 | 47 | |||||||||||||
| Net income from investments in property | 16 | 32 | 19 | (50 | ) | (16 | ) | ||||||||||||||
| Equity in income of associates | 10 | (20 | ) | 1 | 900 | ||||||||||||||||
| Other | 27 | 145 | 207 | (81 | ) | (87 | ) | ||||||||||||||
Total other income | (119 | ) | (86 | ) | 58 | (38 | ) | ||||||||||||||
53
Notes to the Financial Statements
13 May 2003
Note 6 Personnel Expenses
| Quarter ended | % change from | |||||||||||||||||||
| CHF million | 31.3.03 | 31.12.02 | 31.3.02 | 4Q02 | 1Q02 | |||||||||||||||
| Salaries and bonuses | 3,267 | 2,963 | 4,191 | 10 | (22 | ) | ||||||||||||||
| Contractors | 134 | 150 | 136 | (11 | ) | (1 | ) | |||||||||||||
| Insurance and social contributions | 216 | 182 | 280 | 19 | (23 | ) | ||||||||||||||
| Contribution to retirement plans | 203 | 160 | 171 | 27 | 19 | |||||||||||||||
| Other personnel expenses | 382 | 566 | 539 | (33 | ) | (29 | ) | |||||||||||||
Total personnel expenses | 4,202 | 4,021 | 5,317 | 5 | (21 | ) | ||||||||||||||
Note 7 General and Administrative Expenses
| Quarter ended | % change from | |||||||||||||||||||
| CHF million | 31.3.03 | 31.12.02 | 31.3.02 | 4Q02 | 1Q02 | |||||||||||||||
| Occupancy | 304 | 334 | 357 | (9 | ) | (15 | ) | |||||||||||||
| Rent and maintenance of machines and equipment | 174 | 149 | 174 | 17 | 0 | |||||||||||||||
| Telecommunications and postage | 219 | 236 | 277 | (7 | ) | (21 | ) | |||||||||||||
| Administration | 143 | 203 | 216 | (30 | ) | (34 | ) | |||||||||||||
| Marketing and public relations | 89 | 118 | 112 | (25 | ) | (21 | ) | |||||||||||||
| Travel and entertainment | 118 | 160 | 139 | (26 | ) | (15 | ) | |||||||||||||
| Professional fees | 109 | 159 | 134 | (31 | ) | (19 | ) | |||||||||||||
| IT and other outsourcing | 198 | 255 | 269 | (22 | ) | (26 | ) | |||||||||||||
| Other | 43 | 226 | 22 | (81 | ) | 95 | ||||||||||||||
Total general and administrative expenses | 1,397 | 1,840 | 1,700 | (24 | ) | (18 | ) | |||||||||||||
54
Note 8 Earnings per Share (EPS) and Shares Outstanding
| Quarter ended | % change from | |||||||||||||||||||
| Basic earnings (CHF million) | 31.3.03 | 31.12.02 | 31.3.02 | 4Q02 | 1Q02 | |||||||||||||||
| Net profit/(loss) | 1,214 | (101 | ) | 1,363 | (11 | ) | ||||||||||||||
| Quarter ended | % change from | |||||||||||||||||||
| Diluted earnings (CHF million) | 31.3.03 | 31.12.02 | 31.3.02 | 4Q02 | 1Q02 | |||||||||||||||
| Net profit/(loss) | 1,214 | (101 | ) | 1,363 | (11 | ) | ||||||||||||||
| Less: Profit on own equity derivative contracts deemed dilutive | (17 | ) | 0 | (33 | ) | 48 | ||||||||||||||
| Net profit/(loss) for diluted EPS | 1,197 | (101 | ) | 1,330 | (10 | ) | ||||||||||||||
| Quarter ended | % change from | |||||||||||||||||||
| Weighted average shares outstanding | 31.3.03 | 31.12.02 | 31.3.02 | 4Q02 | 1Q02 | |||||||||||||||
| Weighted average shares outstanding | 1,153,931,972 | 1,170,877,718 | 1,238,977,674 | (1 | ) | (7 | ) | |||||||||||||
| Potentially dilutive ordinary shares resulting from options and warrants outstanding | 16,327,254 | 0 | 15,424,482 | 6 | ||||||||||||||||
| Weighted average shares outstanding for diluted EPS | 1,170,259,226 | 1,170,877,718 | 1,254,402,156 | 0 | (7 | ) | ||||||||||||||
| Quarter ended | % change from | |||||||||||||||||||
| Earnings per share (CHF) | 31.3.03 | 31.12.02 | 31.3.02 | 4Q02 | 1Q02 | |||||||||||||||
| Basic EPS | 1.05 | (0.09 | ) | 1.10 | (5 | ) | ||||||||||||||
| Diluted EPS | 1.02 | (0.09 | ) | 1.06 | (4 | ) | ||||||||||||||
| As at | % change from | ||||||||||||||||||||
| Shares outstanding | 31.3.03 | 31.12.02 | 31.3.02 | 4Q02 | 1Q02 | ||||||||||||||||
| Total ordinary shares issued | 1,256,702,037 | 1,256,297,678 | 1,282,251,732 | 0 | (2 | ) | |||||||||||||||
| Second trading line treasury shares | |||||||||||||||||||||
| 2001 program | 28,818,690 | ||||||||||||||||||||
| 2002 first program | 67,700,000 | 67,700,000 | 6,860,123 | ||||||||||||||||||
| 2002 second program | 8,270,080 | 6,335,080 | |||||||||||||||||||
| 2003 program | 1,470,000 | ||||||||||||||||||||
| Other treasury shares | 28,666,605 | 23,146,014 | 10,551,009 | 24 | 172 | ||||||||||||||||
| Total treasury shares | 106,106,685 | 97,181,094 | 46,229,822 | 9 | 130 | ||||||||||||||||
| Shares outstanding | 1,150,595,352 | 1,159,116,584 | 1,236,021,910 | (1 | ) | (7 | ) | ||||||||||||||
Note 9 Currency Translation Rates
The following table shows the principal rates used to translate the financial statements of foreign entities into Swiss francs:
| Spot rate | Average rate | |||||||||||||||||||||||
| As at | Quarter ended | |||||||||||||||||||||||
| 31.3.03 | 31.12.02 | 31.3.02 | 31.3.03 | 31.12.02 | 31.3.02 | |||||||||||||||||||
| 1 USD | 1.35 | 1.38 | 1.68 | 1.36 | 1.44 | 1.70 | ||||||||||||||||||
| 1 EUR | 1.48 | 1.45 | 1.47 | 1.47 | 1.46 | 1.47 | ||||||||||||||||||
| 1 GBP | 2.14 | 2.23 | 2.39 | 2.18 | 2.27 | 2.41 | ||||||||||||||||||
| 100 JPY | 1.15 | 1.17 | 1.26 | 1.14 | 1.19 | 1.27 | ||||||||||||||||||
55
UBS Registered Shares
13 May 2003
UBS Registered Shares
The par value of each UBS registered share is CHF 0.80. Before the implementation of the par value reduction on 10 July 2002, the par value of each UBS registered share was CHF 2.80.
Ticker symbols
| Trading exchange | Bloomberg | Reuters | Telekurs | |||
| virt-x | UBSN VX | UBSZn.VX | UBSN, 004 | |||
| New York Stock Exchange | UBS US | UBS.N | UBS, 65 | |||
| Tokyo Stock Exchange | 8657 JP | UBS.T | N16631, 106 |
virt-x
Although Swiss blue chip stocks (members of the SMI Swiss Market Index) are listed on the SWX, all trading takes place on virt-x.
virt-x is majority-owned by the SWX Swiss Exchange. It provides an efficient and cost-effective pan-European blue chip market. virt-x is a Recognized Investment Exchange supervised by the Financial Services Authority in the United Kingdom. It is delivered on the modern, scalable SWX trading platform.
Security identification codes
| ISIN | CH0012032030 | |
| Valoren | 1203203 | |
| Cusip | CINS H8920M855 |
UBS Share Price
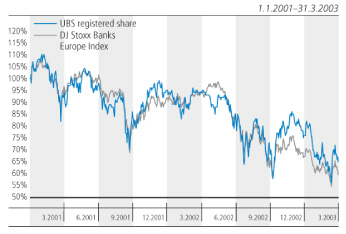
56
Cautionary statement regarding
forward-looking statements
This communication contains statements that constitute “forward-looking statements”, including, but not limited to, statements relating to the implementation of strategic initiatives, such as the implementation of the new European wealth management strategy, expansion of our corporate finance presence in the US and worldwide, and other statements relating to our future business development and economic performance.
While these forward-looking statements represent our judgments and future expectations concerning the development of our business, a number of risks, uncertainties and other important factors could cause actual developments and results to differ materially from our expectations.
These factors include, but are not limited to, (1) general market, macro-economic, governmental and regulatory trends, (2) movements in local and international securities markets, currency exchange rates and interest rates, (3) competitive pressures, (4) technological developments, (5) changes in the financial position or creditworthiness of our customers, obligors and counterparties and developments in the markets in which they operate, (6) legislative developments, (7) management changes and changes to our business group structure in 2001, 2002 and 2003 and (8) other key factors that we have indicated could adversely affect our business and financial performance which are contained in other parts of this document and in our past and future filings and reports, including those filed with the SEC.
More detailed information about those factors is set forth elsewhere in this document and in documents furnished by UBS and filings made by UBS with the SEC, including UBS’s Annual Report on Form 20-F for the year ended 31 December 2002. UBS is not under any obligation to (and expressly disclaims any such obligations to) update or alter its forward-looking statements whether as a result of new information, future events, or otherwise.
Imprint
Publisher/Copyright: UBS AG, Switzerland.
Language: English.
SAP-R/3 80834E-0301
UBS AG
P.O. Box, CH-8098 Zurich
P.O. Box, CH-4002 Basel
www.ubs.com
SIGNATURES
Pursuant to the requirements of the Securities Exchange Act of 1934, the registrant has duly caused this report to be signed on its behalf by the undersigned, thereunto duly authorized.
| UBS AG | ||||||
| By: | /s/ Robert Dinerstein | |||||
| Name: Title | Robert Dinerstein Managing Director | |||||
| By: | /s/ Robert Mills | |||||
| Title: | Name: Robert Mills Managing Director | |||||
| Date: May 14, 2003 | ||||||