Table of Contents
SECURITIES AND EXCHANGE COMMISSION
FORM 6-K
REPORT OF FOREIGN ISSUER
PURSUANT TO RULE 13a-16 OR 15d-16 OF
Date: March 17, 2004
UBS AG
Bahnhofstrasse 45, Zurich, Switzerland, and
Indicate by check mark whether the registrant files or will file annual reports under cover of Form 20-F or Form 40-F.
Form 20-F x Form 40-F o
Indicate by check mark whether the registrant by furnishing the information contained in this Form is also thereby furnishing the information to the Commission pursuant to Rule 12g3-2(b) under the Securities Exchange Act of 1934.
Yes o No x
If ‘Yes‘ is marked, indicate below the file number assigned to the registrant in connection with Rule 12g3-2(b): 82-
Table of Contents
This Form 6-K consists of the following three documents, which appear immediately following this page:
| • | Invitation to the Annual General Meeting of UBS AG | |
| • | Additional Information for our US Shareholders | |
| • | Annual Review 2003 |
Table of Contents

Invitation to the
Annual General Meeting of UBS AG
Thursday, 15 April 2004, 2.30 p.m. (doors open 1.30 p.m.)
St. Jakobshalle, Brüglingerstrasse 21, Basel
Agenda
| 1. | Annual Report, Group and Parent Company Accounts for 2003 Reports of the Group and Statutory Auditors | |
| 2. | Appropriation of retained earnings Dividend for financial year 2003 | |
| 3. | Discharge of the members of the Board of Directors and the Group Executive Board | |
| 4. | Elections |
| 4.1. | Re-election of Board member: Sir Peter Davis | ||
| 4.2. | Election of new Board members: |
| 4.2.1. | Stephan Haeringer | ||
| 4.2.2. | Helmut Panke | ||
| 4.2.3. | Peter Spuhler |
| 4.3. | Re-election of Group and Statutory Auditors: Ernst & Young Ltd., Basel |
| 5. | Capital reduction |
| 5.1. | Cancellation of shares repurchased under the 2003/2004 share buyback program and respective amendment of Article 4 of the Articles of Association | ||
| 5.2. | Approval of a new 2004/2005 share buyback program |
Table of Contents
Annual General Meeting of UBS AG,15 April 2004
Introduction
Requests for including items in the agenda
Call to register claims
Organizational issues
Admission cards for the Annual General Meeting
UBS AG, Shareholder Services, P.O. Box, CH-8098 Zurich.
Shareholders listed in the Share Registerin the United Statescan order their admission cards in writing up to 8 April 2004 from: Mellon Investor Services, Proxy Processing, P.O. Box 3567, S. Hackensack, NJ 07606-9267.
Any admission cards already issued will lose their validity and will be recalled if the shares concerned are sold prior to the Annual General Meeting and the Share Register is notified of the sale.
Representation at the Annual General Meeting
| – | UBS AG, P.O. Box, CH-8098 Zurich as a corporate proxy or a custody proxy | |
| – | Fiduciary company Altorfer Duss & Beilstein (Urs Zeltner, Attorney and Notary), P.O. Box 1156, CH-8021 Zurich as an independent proxy. |
Zurich and Basel, 27 February 2004
UBS AG
For the Board of Directors:
Marcel Ospel, Chairman
Gertrud Erismann-Peyer, Company Secretary
2
Table of Contents
Item 1
Annual Report, Group and Parent Company Accounts for 2003
A. Motion
B. Explanations
The Group income statement shows total operating income of CHF 33,972 million and total operating expenses of CHF 25,624 million, resulting in a pre-tax profit of CHF 8,003 million and a net profit of CHF 6,385 million. At year-end, total consolidated assets amounted to CHF 1,386.0 billion, up CHF 204.9 billion from a year earlier. Shareholders’ equity totaled CHF 35.4 billion.
Parent Company net profit was CHF 4,197 million. Total operating income of CHF 19,117 million and total operating expenses of CHF 12,832 million resulted in an operating profit of CHF 6,285 million. Depreciations, write-offs and provisions amounted to CHF 1,577 million and extraordinary income to CHF 92 million. Extraordinary expenses totaled CHF 1 million and taxes amounted to CHF 602 million.
Ernst & Young Ltd. as Group and Statutory Auditors recommend in unqualified reports to the Annual General Meeting that the Group and Parent Company Accounts be approved. The Group Auditors confirm that “the Group financial statements present fairly, in all material respects, the consolidated financial position of UBS AG as of 31 December 2003 and 2002, and the consolidated results of operations and cash flows for each of the three years in the period ended 31 December 2003, in conformity with International Financial Reporting Standards (IFRS), and they comply with Swiss law”. The Statutory Auditors express their opinion that “the accounting records and financial statements and the proposed appropriation of available earnings comply with Swiss law and the company’s Articles of Association”.
3
Table of Contents
Annual General Meeting of UBS AG,15 April 2004
Item 2
Appropriation of retained earnings
Dividend for financial year 2003
A. Motion
| Profit for the financial year 2003 as per the income statement | CHF | 4,197 million | ||
| Allocation to General statutory reserves | CHF | 288 million | ||
| Proposed dividend | CHF | 2,929 million | ||
| Allocation to Other reserves | CHF | 980 million | ||
| Total allocated | CHF | 4,197 million | ||
The Board of Directors proposes to distribute a dividend of CHF 2.60 per share.
B. Explanations
Upon approval of the proposal by the AGM, the distribution of CHF 1.69 per share (after deduction of 35% Swiss withholding tax) will be made on 20 April 2004 to shareholders on record as at 15 April 2004. The shares will be traded ex dividend on 16 April.
Item 3
Discharge of the members of the Board of Directors
and the Group Executive Board
Motion
Item 4
Elections
4.1. Re-election of Board member
A. Motion
B. Explanations
Sir Peter Davis (born 1941) has been a member of the Board since 2001 and is a member of the Audit and the Nominating Committees. He has been Group Chief Executive of J Sainsbury plc, London, since 2000 and is about to become its Chairman on 29 March 2004. Sir Peter is a British citizen.
A detailed CV of Sir Peter is published in the “Handbook 2003/2004” and is available on the Internet underwww.ubs.com/boards.
4.2. Election of new Board members
Johannes A. de Gier and Hans Peter Ming are stepping down from the Board at the AGM 2004. Johannes de Gier is terminating his mandate early following his appointment to chairman of the UBS Group company SBC Wealth Management, in which the Private Label Banks and GAM, UBS’s specialist asset management firm, were integrated. Hans Peter Ming’s mandate expires at the AGM 2004. He is not standing for re-election, having reached retirement age.
4.2.1. Election of Stephan Haeringer
A. Motion
B. Explanations
4
Table of Contents
Switzerland of Union Bank of Switzerland. From 1991 to 1996, he served as Division Head Private Banking and Institutional Asset Management. In 1991, he was appointed member of the Group Executive Board, after having been an Executive Vice President since 1987. In 1988 he became Head of the Financial Division. During the years 1967 to 1988 Mr. Haeringer assumed various management roles within the areas of Investment Counseling, Specialized Investments, Portfolio Management, Securities Administration and Collateral Loans. For training purposes, Mr. Haeringer was assigned to other financial institutions in London and New York. He is a Swiss citizen.
The election of Stephan Haeringer will contribute to strengthening the Board’s financial services expertise.
4.2.2. Election of Helmut Panke
A. Motion
B. Explanations
In addition to his engagement with BMW, Helmut Panke is a member of the Board of Directors of Microsoft Corporation.
4.2.3. Election of Peter Spuhler
A. Motion
B. Explanations
In addition to his engagement for Stadler Rail, Mr. Spuhler is a member of the Board of Directors of Von Roll Holding, Zurich, and of various professional interest groups. He is also a member of the Lower House of the Swiss Parliament (Nationalrat).
4.3. Re-election of Group and Statutory Auditors
A. Motion
B. Explanations
Ernst & Young have been in charge of the UBS audit since the merger in 1998. The “Handbook 2003/2004” provides additional information on the Auditors’ independence and the fees paid, as well as on the lead audit partners in charge.
5
Table of Contents
Annual General Meeting of UBS AG,15 April 2004
Item 5
Capital reduction
5.1. Cancellation of shares repurchased under the 2003/2004 share buyback program and respective amendment of article 4 of the Articles of Association
A. Motion
Article 4 of the Articles of Association shall be amended as follows:
Current version | Proposed new version(changes in italics) | |
Article 4 | ||
| Share capital | ||
| 1 The share capital of the Corporation is CHF 946,437,411.20 (nine hundred and forty-six million, four hundred and thirty-seven thousand, four hundred and eleven Swiss francs and twenty centimes), divided into 1,183,046,764 registered shares with a par value of CHF 0.80 each. The share capital is fully paid up. | 1 The share capital of the Corporation isCHF 898,851,811.20 (eight hundred and ninety-eight million, eight hundred and fifty-one thousand, eight hundred and eleven Swiss francs and twenty centimes),divided into1,123,564,764registered shares with a par value of CHF 0.80 each. The share capital is fully paid up. | |
| 2 unchanged | ||
B. Explanations
The Board of Directors now proposes to the AGM to approve the cancellation of the 59,482,000 shares repurchased and to reduce the share
Ernst & Young Ltd. as Statutory Auditors have confirmed in a special audit report on behalf of the AGM that as at 31 December 2003 the claims of creditors were fully covered even after the reduction in capital and that the Bank has adequate liquidity.
6
Table of Contents
5.2. Approval of a new 2004/2005 share buyback program
A. Motion
“The Board of Directors shall be authorized to buy back a maximum amount of CHF 6 billion in UBS shares via a second trading line on the virt-x exchange. These shares are to be cancelled definitively and are not therefore regarded as own shares within the meaning of Article 659 of the Swiss Code of Obligations. The required amendment to the Articles of Association (reduction of share capital) will be submitted to the AGM in 2005 for approval.”
B. Explanations
amount of CHF 6 billion in UBS shares. The new buyback program 2004/2005 was announced on 10 February 2004.
The Board of Directors has again decided to proceed in two stages, with shareholders taking the decision in principle at the first AGM and deciding on the definitive cancellation of the shares at the next AGM. By obtaining shareholders’ approval for the future cancellation of the repurchased shares, these shares no longer fall under the statutory limit of Swiss Company Law, which prohibits companies from holding more than 10% of their own shares. The proposed procedure provides greater flexibility, which UBS believes to be in the interests of efficient capital management and the ongoing trading activities of the Bank.
Ernst & Young Ltd. as Statutory Auditors have confirmed in a special audit report on behalf of the Board of Directors that the claims of creditors were fully covered even after this additional capital reduction and that the Bank has adequate liquidity.
7
Table of Contents
| UBS AG | ||
| P.O. Box, CH-8098 Zurich | ||
| P.O. Box, CH-4002 Basel | ||
| www.ubs.com |
Table of Contents
Additional Information
for our US Shareholders
March 2004
Dear Shareholders
The accompanying Annual Review 2003 contains summary information on financials and corporate governance.
UBS aims to comply with all relevant standards on corporate governance. As a foreign private issuer listed on the New York Stock Exchange (NYSE), UBS is only required to fully comply with the rules regarding Audit Committees. UBS, however, is also in compliance with the overwhelming majority of the NYSE rules for US companies. Information on the differences between UBS’s corporate governance practices and the NYSE standards for US companies may be found in the Handbook 2003/2004, which can be accessed on our website atwww.ubs.com/investors.
The accompanying Annual Review 2003 contains summary financial information. Our audited Financial Statements and detailed analysis are included in our Financial Report 2003, which is available upon request. Please use the accompanying order form.
The consolidated Financial Statements of UBS have been prepared in accordance with International Financial Reporting Standards (IFRS). The principles of IFRS differ in certain respects from United States Generally Accepted Accounting Principles (US GAAP). To clarify the effects of these differences in standards, this Additional Information includes:
| – | a reconciliation of Net profit and Shareholders’ equity as determined under IFRS to the amounts as determined under US GAAP, with a brief description of the significant differences affecting Net profit and Shareholders’ equity, and | |
| – | the Income statements and Balance sheets presented in accordance with US GAAP. |
Please refer to our Financial Report 2003, Notes 40 and 41, for a detailed description of these differences.
Reconciliation of IFRS Shareholders’ Equity and Net Profit to US GAAP
| Shareholders' equity | Net profit | |||||||||||||||||||||||
| CHF million | Reference | 31.12.03 | 31.12.02 | 31.12.03 | 31.12.02 | 31.12.01 | ||||||||||||||||||
Amounts determined in accordance with IFRS | 35,446 | 38,991 | 6,385 | 3,535 | 4,973 | |||||||||||||||||||
| Adjustments in respect of: | ||||||||||||||||||||||||
| SBC purchase accounting goodwill and other purchase accounting adjustments | a | 15,196 | 15,285 | (89 | ) | (128 | ) | (1,614 | ) | |||||||||||||||
| Reversal of IFRS goodwill amortization | b | 1,825 | 1,017 | 808 | 1,017 | 0 | ||||||||||||||||||
| Restructuring provision | c | 0 | 0 | 0 | 0 | (112 | ) | |||||||||||||||||
| Derivative instruments | d | (94 | ) | (138 | ) | 188 | 354 | 25 | ||||||||||||||||
| Financial investments and private equity | e | (84 | ) | (30 | ) | (159 | ) | 767 | 0 | |||||||||||||||
| Pension plans | f | 1,303 | 621 | (235 | ) | (156 | ) | 119 | ||||||||||||||||
| Other post-retirement benefit plans | g | (1 | ) | (1 | ) | 0 | 7 | 8 | ||||||||||||||||
| Equity participation plans | h | (112 | ) | (164 | ) | (152 | ) | 63 | (12 | ) | ||||||||||||||
| Software capitalization | i | 0 | 0 | 0 | (60 | ) | (169 | ) | ||||||||||||||||
| Consolidation of variable interest entities (VIEs) | j | (10 | ) | 0 | (10 | ) | 0 | 0 | ||||||||||||||||
| Tax adjustments | (295 | ) | (5 | ) | (223 | ) | 147 | 16 | ||||||||||||||||
Total adjustments | 17,728 | 16,585 | 128 | 2,011 | (1,739 | ) | ||||||||||||||||||
Amounts determined in accordance with US GAAP | 53,174 | 55,576 | 6,513 | 5,546 | 3,234 | |||||||||||||||||||
Table of Contents
Additional Information for our US Shareholders,March 2004
Description of differences:
a. Purchase accounting:
b. Reversal of IFRS goodwill amortization:
c. Restructuring provision:
d. Derivative instruments:
e. Financial investments and private equity:
f. Pension plans:
g. Other post-retirement benefits:
h. Equity participation plans:
i. Software capitalization:
j. Consolidation of Variable Interest Entities (VIEs):
Table of Contents
Comparison of UBS Income Statement to US GAAP
The following is a Consolidated Income Statement of UBS, for the years ended 31 December 2003, 31 December 2002 and 31 December 2001, restated to reflect the impact of valuation and income recognition differences and presentation principles between IFRS and US GAAP.
| CHF million | 31.12.03 | 31.12.02 | 31.12.01 | |||||||||||||||||||||
| For the year ended | US GAAP | IFRS | US GAAP | IFRS | US GAAP | IFRS | ||||||||||||||||||
Operating income | ||||||||||||||||||||||||
| Interest income | 39,940 | 40,159 | 39,679 | 39,963 | 51,907 | 52,277 | ||||||||||||||||||
| Interest expense | (27,700 | ) | (27,860 | ) | (29,334 | ) | (29,417 | ) | (44,096 | ) | (44,236 | ) | ||||||||||||
| Net interest income | 12,240 | 12,299 | 10,345 | 10,546 | 7,811 | 8,041 | ||||||||||||||||||
| Credit loss expense / (recovery) | (116 | ) | (116 | ) | (206 | ) | (206 | ) | (498 | ) | (498 | ) | ||||||||||||
| Net interest income after credit loss expense / (recovery) | 12,124 | 12,183 | 10,139 | 10,340 | 7,313 | 7,543 | ||||||||||||||||||
| Net fee and commission income | 17,345 | 17,345 | 18,221 | 18,221 | 20,211 | 20,211 | ||||||||||||||||||
| Net trading income | 4,065 | 3,883 | 6,031 | 5,572 | 8,959 | 8,802 | ||||||||||||||||||
Other income1 | 380 | 561 | 96 | (12 | ) | 534 | 558 | |||||||||||||||||
| Total operating income | 33,914 | 33,972 | 34,487 | 34,121 | 37,017 | 37,114 | ||||||||||||||||||
Operating expenses | ||||||||||||||||||||||||
| Personnel expenses | 17,615 | 17,231 | 18,610 | 18,524 | 19,713 | 19,828 | ||||||||||||||||||
| General and administrative expenses | 6,086 | 6,086 | 7,072 | 7,072 | 7,631 | 7,631 | ||||||||||||||||||
| Depreciation of property and equipment | 1,396 | 1,364 | 1,613 | 1,521 | 1,815 | 1,614 | ||||||||||||||||||
| Amortization of goodwill | 0 | 756 | 0 | 930 | 2,484 | 1,025 | ||||||||||||||||||
| Amortization of other intangible assets | 112 | 187 | 1,443 | 1,530 | 298 | 298 | ||||||||||||||||||
| Restructuring costs | 0 | 0 | 0 | 0 | 112 | 0 | ||||||||||||||||||
| Total operating expenses | 25,209 | 25,624 | 28,738 | 29,577 | 32,053 | 30,396 | ||||||||||||||||||
Operating profit/(loss) before tax and minority interests | 8,705 | 8,348 | 5,749 | 4,544 | 4,964 | 6,718 | ||||||||||||||||||
| Tax expense/(benefit) | 1,842 | 1,618 | 511 | 678 | 1,386 | 1,401 | ||||||||||||||||||
Net profit/(loss) before minority interests | 6,863 | 6,730 | 5,238 | 3,866 | 3,578 | 5,317 | ||||||||||||||||||
| Minority interests | (350 | ) | (345 | ) | (331 | ) | (331 | ) | (344 | ) | (344 | ) | ||||||||||||
| Change in accounting principle: cumulative effect of adoption of “AICPA Audit and Accounting Guide, Audits of Investment Companies” on certain financial investments, net of tax | 0 | 0 | 639 | 0 | 0 | 0 | ||||||||||||||||||
Net profit | 6,513 | 6,385 | 5,546 | 3,535 | 3,234 | 4,973 | ||||||||||||||||||
Full disclosure of valuation, income recognition and presentation differences are detailed in Notes 40 and 41 which may be found on pages 165 to 183 of our Financial Report 2003.
Table of Contents
Additional Information for our US Shareholders,March 2004
Comparison of UBS Balance Sheet to US GAAP
The following is a Condensed Consolidated Balance Sheet of UBS, for the years ended 31 December 2003 and 31 December 2002, restated to reflect the impact of valuation and income recognition principles and presentation differences between IFRS and US GAAP.
| 31.12.03 | 31.12.02 | |||||||||||||||
| CHF million | US GAAP | IFRS | US GAAP | IFRS | ||||||||||||
Assets | ||||||||||||||||
| Cash and balances with central banks | 3,584 | 3,584 | 4,271 | 4,271 | ||||||||||||
| Due from banks | 31,685 | 31,667 | 32,481 | 32,468 | ||||||||||||
| Cash collateral on securities borrowed | 211,058 | 213,932 | 139,073 | 139,052 | ||||||||||||
| Reverse repurchase agreements | 320,587 | 320,587 | 294,086 | 294,086 | ||||||||||||
| Trading portfolio assets (including assets pledged as collateral of CHF 125,411 million at 31.12.03 and CHF 110,365 million at 31.12.02) | 544,492 | 461,772 | 441,845 | 371,436 | ||||||||||||
| Positive replacement values | 84,034 | 84,334 | 83,757 | 82,092 | ||||||||||||
| Loans | 212,554 | 212,504 | 211,755 | 211,647 | ||||||||||||
| Financial investments | 1,303 | 5,139 | 2,846 | 8,391 | ||||||||||||
| Securities received as collateral | 13,071 | 16,308 | ||||||||||||||
| Accrued income and prepaid expenses | 6,219 | 6,218 | 6,462 | 6,453 | ||||||||||||
| Investments in associates | 1,616 | 1,616 | 705 | 705 | ||||||||||||
| Property and equipment | 8,116 | 7,659 | 8,358 | 7,869 | ||||||||||||
| Goodwill | 26,775 | 9,348 | 28,127 | 11,181 | ||||||||||||
| Other Intangible assets | 1,174 | 2,181 | 1,222 | 2,515 | ||||||||||||
| Private equity investments | 3,308 | 4,328 | ||||||||||||||
| Other assets | 64,381 | 25,459 | 21,314 | 8,952 | ||||||||||||
Total assets | 1,533,957 | 1,386,000 | 1,296,938 | 1,181,118 | ||||||||||||
Liabilities | ||||||||||||||||
| Due to banks | 127,385 | 127,153 | 83,178 | 83,178 | ||||||||||||
| Cash collateral on securities lent | 51,157 | 53,278 | 36,870 | 36,870 | ||||||||||||
| Repurchase agreements | 415,863 | 415,863 | 366,858 | 366,858 | ||||||||||||
| Trading portfolio liabilities | 149,380 | 143,957 | 117,721 | 106,453 | ||||||||||||
| Obligation to return securities received as collateral | 13,071 | 16,308 | ||||||||||||||
| Negative replacement values | 161,086 | 93,646 | 132,354 | 81,282 | ||||||||||||
| Due to customers | 347,358 | 347,358 | 306,872 | 306,876 | ||||||||||||
| Accrued expenses and deferred income | 13,673 | 13,673 | 15,330 | 15,331 | ||||||||||||
| Debt issued | 123,259 | 120,237 | 129,527 | 129,411 | ||||||||||||
| Other liabilities | 74,044 | 31,316 | 32,815 | 12,339 | ||||||||||||
Total liabilities | 1,476,276 | 1,346,481 | 1,237,833 | 1,138,598 | ||||||||||||
| Minority interests | 4,507 | 4,073 | 3,529 | 3,529 | ||||||||||||
Total shareholders’ equity | 53,174 | 35,446 | 55,576 | 38,991 | ||||||||||||
Total liabilities, minority interests and shareholders’ equity | 1,533,957 | 1,386,000 | 1,296,938 | 1,181,118 | ||||||||||||
Full disclosure of valuation, income recognition and presentation differences are detailed in Notes 40 and 41 which may be found on pages 165 to 183 of our Financial Report 2003.
| UBS AG, P.O. Box, CH-8098 Zurich | www.ubs.com/investors |
Table of Contents
Annual Review 2003

Table of Contents

Contents

Table of Contents
Dear Shareholders
| We could not have anticipated that 2003 would turn out to be so positive for the financial services industry. It was also an excellent year for UBS – the second most profitable in our history and one in which we made significant strategic progress and important competitive gains. | ||
| Our net profit for the yearwas CHF 6,385 million, up from CHF 3,535 million in 2002 – and only 18% lower than the record result we achieved in the booming markets of 2000. When conditions were difficult at the outset of the year, our results were resilient. As the year progressed, investor sentiment turned increasingly positive and activity levels picked up along with stock market valuations. Helped by this improving environment, we fully captured the resulting revenue opportunities. | ||
| Results in both 2002 and 2003 were influenced by items we call significant financial events – items that indicate neither future performance nor our underlying operational result. In 2002, we realized total net gains of CHF 185 million from the sale of non-core businesses. At the end of that year, our decision to adopt a single brand required us to write down the CHF 953 million net value of the PaineWebber brand. In 2003, we realized a net gain of CHF 2 million from the sale of our US clearing business. Excluding these effects, and before goodwill amortization, net profit increased 33% in 2003 from 2002. On the same basis, return on equity of 20.9% and basic earnings per | ||
 | ||
share growth of 44% represent first-class shareholder returns. Our businesses closely traced the strong recovery in financial markets, gaining market share in the process. In addition, our results reflected a significant improvement in the performance of our private equity portfolio.
The strength of our brandis an important contributing factor to our success. On 9 June 2003, we adopted the single UBS brand for all our major businesses around the world. This successful implementation, supported by wide-ranging internal communications and a global advertising campaign, publicly illustrated the “one firm” philosophy that is integral to UBS. A brand is not only a name or a logo. It should represent how a company defines itself. For our clients, UBS stands for the relentless pursuit of their success, giving them access to the advice and resources of a global powerhouse. In the rest of this year’s Annual Review, we show you how our employees bring our brand values to life in their daily work – how they take the time to listen and understand our clients’ needs, helping them to feel confident that they have made the right financial decision with us at their side.
2
Table of Contents
Letter to Shareholders
In the US – where the change has been the most significant – we have already raised the familiarity of our brand. This year, we are continuing our major drive to build a strong and positive image around the world.
Our future is one of growth.We will keep expanding our business by growing organically. Our Investment Bank is firmly positioned in the top bracket of the industry. Its equities business with institutional clients continues to stretch its lead as the number one player globally, while its fixed income business results are on par with the leaders in the industry. We ended the year as the fourth-ranked investment bank worldwide for advisory fees as well as share and bond underwriting, up from seventh place in 2002.
Because our business is set for growth, we see revenue opportunities increasing along with market and investor sentiment. We therefore expect a gradual rise in our levels of market and credit risk – although we will maintain our risk culture that has protected our earnings throughout the business cycle.
Increasing our dividend by 30% demonstrates the confidence we have in the long-term sustainability of our performance. The Board of Directors will recommend a dividend of CHF 2.60 per share to the Annual General Meeting on 15 April 2004, compared to CHF 2.00 paid out last year.
Having successfully navigatedthe turbulent down-markets of the last few years with no unpredictable changes in our profitability, our strategy, or our staffing levels, we now enter what seem likely to be calmer waters with, we believe, the full confidence of our clients, our employees, and you, our shareholders. Our businesses are all performing extremely well. And while, of course, we cannot predict with certainty whether markets will continue in their friendly mood, we are committed to again securing for our investors the best possible returns in 2004.
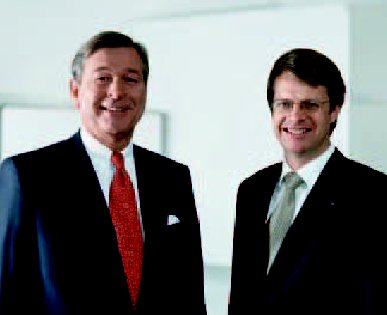
 |  | |
| Marcel Ospel | Peter Wuffli | |
| Chairman | Chief Executive Officer | |
| 17 March 2004 |
3
Table of Contents

Earning someone’s confidence is difficult. It involves listening – building trust. Being fair, evenhanded, objective. Showing you are interested. For their sake – not yours. At UBS, it is our job to give our clients confidence in the financial decisions they make. For us, that means listening to them. As individuals. Taking a thorough look at what they want and how they want to achieve it. They need to know that we can commit the necessary resources – using our strength and reputation – for them.
For this year’s Annual Review, we have chosen pictorial themes that illustrate people working together, building the trust needed to reach for something unique. Architects and planners helping a couple build a dream. Designers and tailors painstakingly creating a special dress. Craftsmen faithfully restoring a vintage yacht to its former splendor. We believe the stories reflect what we at UBS strive to do every day – around the world.
4
Table of Contents
UBS share performance
| Shareholder returns | % change from | |||||||||||||||||||
| For the year ended | 31.12.03 | 31.12.02 | 31.12.01 | 31.12.02 | ||||||||||||||||
Basic EPS (CHF) | ||||||||||||||||||||
as reported 1 | 5.72 | 2.92 | 3.93 | 96 | ||||||||||||||||
before goodwill and adjusted for significant financial events 2 | 6.56 | 4.57 | 4.97 | 44 | ||||||||||||||||
RoE (%) | ||||||||||||||||||||
as reported 3 | 18.2 | 8.9 | 11.7 | |||||||||||||||||
before goodwill and adjusted for significant financial events 4 | 20.9 | 13.9 | 14.8 | |||||||||||||||||
| Financial strength & ratings | ||||||||||||||||||||
| As at | 31.12.03 | 31.12.02 | 31.12.01 | |||||||||||||||||
BIS Tier 1 capital ratio (%) 5 | 11.8 | 11.3 | 11.6 | |||||||||||||||||
Long-term ratings | ||||||||||||||||||||
| Fitch, London | AA+ | AAA | AAA | |||||||||||||||||
| Moody’s, New York | Aa2 | Aa2 | Aa2 | |||||||||||||||||
| Standard & Poor’s, New York | AA+ | AA+ | AA+ | |||||||||||||||||
| Key income statement figures | % change from | |||||||||||||||||||
| CHF million, except where indicated | For the year ended | 31.12.03 | 31.12.02 | 31.12.01 | 31.12.02 | |||||||||||||||
Income statement key figures | ||||||||||||||||||||
| Operating income | 33,972 | 34,121 | 37,114 | 0 | ||||||||||||||||
| Operating expenses | 25,624 | 29,577 | 30,396 | (13 | ) | |||||||||||||||
| Operating profit before tax | 8,348 | 4,544 | 6,718 | 84 | ||||||||||||||||
| Net profit | 6,385 | 3,535 | 4,973 | 81 | ||||||||||||||||
Cost/income ratio (%) 6 | 75.2 | 86.2 | 80.8 | |||||||||||||||||
| Earnings adjusted for significant financial events and pre-goodwill7, 8 | ||||||||||||||||||||
| Operating income | 33,811 | 33,894 | 37,114 | 0 | ||||||||||||||||
| Operating expenses | 24,681 | 27,117 | 29,073 | (9 | ) | |||||||||||||||
| Operating profit before tax | 9,130 | 6,777 | 8,041 | 35 | ||||||||||||||||
| Net profit | 7,326 | 5,529 | 6,296 | 33 | ||||||||||||||||
Cost/income ratio (%) 9 | 72.7 | 79.5 | 77.3 | |||||||||||||||||
| Other key figures | % change from | |||||||||||||||||||
| CHF million, except where indicated | As at | 31.12.03 | 31.12.02 | 31.12.01 | 31.12.02 | |||||||||||||||
| Total assets | 1,386,000 | 1,181,118 | 1,253,297 | 17 | ||||||||||||||||
| Shareholders’ equity | 35,446 | 38,991 | 43,530 | (9 | ) | |||||||||||||||
Market capitalization | 95,401 | 79,448 | 105,475 | 20 | ||||||||||||||||
Invested assets (CHF billion) | 2,209 | 2,037 | 2,448 | 8 | ||||||||||||||||
Headcount (full-time equivalents) | ||||||||||||||||||||
| Switzerland | 26,662 | 27,972 | 29,163 | (5 | ) | |||||||||||||||
| Europe (excluding Switzerland) | 9,906 | 10,009 | 9,650 | (1 | ) | |||||||||||||||
| Americas | 25,511 | 27,350 | 27,463 | (7 | ) | |||||||||||||||
| Asia Pacific | 3,850 | 3,730 | 3,709 | 3 | ||||||||||||||||
| Total | 65,929 | 69,061 | 69,985 | (5 | ) | |||||||||||||||
Throughout this report, 2001 and 2002 segment results have been restated to reflect the transfer of the Private Banks & GAM to Corporate Center.
5
Table of Contents

January | April | |
nInvestment Dealer’s Digest, a leading US business publication, names UBS’s Investment Bank as its “Bank of the Year”, the first time a non-US owned financial institution is given this prestigious award. The Investment Bank is recognized for its “overall excellence, competitiveness, significant financial progress and increase in market share”. | n In the US, UBS agrees to sell Correspondent Services Corporation (CSC) to Fidelity Investments. CSC provides clearance, execution, settlement, administrative and management information services to brokerage clients. May | |
February n A new holding company structure is announced for UBS’s five independent private banks, Armand von Ernst, Banco di Lugano, Bank Ehinger, Cantrade, and Ferrier Lullin, along with Global Asset Management’s subsidiary GAM. The move anticipates a further wave of consolidation in the Swiss private banking industry. Cantrade, Bank Ehinger and Armand von Ernst subsequently merge to form Ehinger & Armand von Ernst. | nPostFinance, the finance subsidiary of Switzerland’s post office, starts offering “Yellow Mortgages” under its own brand. Funding, as well as capital and risk management, are provided by UBS in line with its “Bank for Banks” approach. n UBS announces the purchase of Lloyds Bank SA, a French subsidiary of Lloyds TSB. With offices in Paris, Lyons and Cannes and about EUR 1 billion in invested assets, the acquisition significantly strengthens UBS’s position in the French wealth management market. | |
June | ||
March nSponsored by UBS, Team Alinghi wins the America’s Cup in Auckland, New Zealand. For the first time since 1851, the America’s Cup returns to Europe, making Switzerland the first landlocked country to succeed in the battle for the world’s oldest and most sought-after sailing trophy. | n To announce its move to a single brand, UBS launches a global advertising campaign on 9 June which underscores the advantages of “one team, one focus” for all stakeholders. In a firm-wide message, the Group Executive Board tells employees, “The introduction of the single brand will affect every business, every employee and every client, uniting us all under a set of shared values and ambitions that will enhance our already formidable global reputation.” | |
| n The UBS SARS Research Foundation is launched in cooperation with the University of Hong Kong’s medical faculty. Administered by UBS, the charity’s objective is to provide funding for research on SARS and other infectious diseases. |
6
Table of Contents

July
n UBS in Hong Kong places the first-ever order for the purchase of Chinese domestic securities by a foreign institution. UBS is the first institution to be granted Qualified Foreign Institutional Investor (QFII) status by China’s regulators, allowing the firm to provide its clients with direct access to China’s domestic equity and debt markets.
nEuromoneydistinguishes UBS as the world’s best bank. “This highly prestigious accolade, won in a fiercely competitive industry during very tough times, is a testament to the excellence and dedication of our people,” comments Peter Wuffli.
n The Global Asset Management business expands its continental European real estate capability and hires a number of executives for the new venture.
September
n For the fourth consecutive year, Germany’sManager Magazinranks UBS’s financial reporting as the best among large European companies.
n UBS Bank USA opens in Utah. The banking affiliate of our Wealth Management USA business will offer enhanced lending services to affluent clients.
n UBS announces the acquisition of ABN AMRO’s prime brokerage operations in America. ABN AMRO’s client base, consisting mainly of smaller US hedge funds, complements UBS’s existing business which is of similar scale but concentrated on larger hedge funds.
n UBS announces a number of senior executive appointments and creates the post of Chief Financial Officer, with Clive Standish, Chairman and CEO Asia Pacific, assuming the position effective April 2004. Peter Wuffli assumes the title of UBS Chief Executive Officer.
nWorking Mother magazine names the Investment Bank as one of the 100 Best Companies for working mothers in the United States.
October
n UBS agrees to buy Merrill Lynch’s private client business in Germany, expanding the firm’s local client base.
November
n UBS announces that the firm will continue its successful partnership with Team Alinghi for the 2007 America’s Cup, which will be held in Valencia, Spain.
December
n UBS’s website (www.ubs.com) is voted the fourth-best European corporate website in a survey in theFinancial Timesas well as the leading website in the financial services sector.
7
Table of Contents
| UBS — our |

8
Table of Contents
| CREDENTIALS |

9
Table of Contents

Who we are
Before seeking advice from a financial institution, you need to know what it stands for. You want a clear idea of its reputation, background, and how people will work with you. And that is what we are doing here – giving you a better picture of who we are and where we are going. Because, in short, credentials matter.
In the financial services industry, we are a truly global firm, working with corporate, institutional and private clients around the world. Our core strengths are asset management and wealth management, investment banking and securities trading as well as retail and corporate banking in Switzerland. To us, being global means providing the same predictable
level of service and quality around the world, helping our clients succeed in what they want to achieve. We believe our clients should effortlessly be able to access all the services our firm can provide, where and when they are required, and regardless of what combinations of teams lie behind the solutions. Our clients should not feel the boundaries inherent in a large, global organization. This means that teams from across businesses work together to pool different skills for the benefit of each individual client. The partnership between our businesses also gives us the ability to build a coherent infrastructure that does not duplicate activities unnecessarily and helps us to provide our services as efficiently as possible.
10
Table of Contents
| UBS - Our Credentials |

Financial strength
Risk management discipline
11
Table of Contents

12
Table of Contents
| UBS — Our Credentials |

Common values
Our culture benefits directly from our diverse roots. Each of the entities that have joined us in the last decade have provided us with strengths that have significantly influenced the course of our business. They have helped us to develop a common set of values and aspirations, among them the commitment to our clients’ success, and the ambition to learn and keep learning – in order to constantly create better and more innovative solutions for our clients. Initiative and entrepreneurial spirit is encouraged and rewarded in our daily work. At UBS, we aim to build responsible relationships – with our clients, with the communities in which we operate and with each other. Integrity and our ethical standards are always the foundation of the business decisions we make.
Having in-depth knowledge of our clients’ goals and needs also brings with it the responsibility to safeguard their private information. The deep respect we have for their right to financial privacy justifies the trust that our clients continue to place in us.
13
Table of Contents
| You need expert craftsmanship to build that one special image you first thought up. To create the different angles and shades – the unique atmosphere – you originally dreamed of. When building what you want, you need skilled professionals who spend the time to listen to your idea – making it become reality. |

How we plan to grow
In thewealth management business,our services are targeted at high net worth and affluent clients around the world, whether investing internationally or in their home country. Providing advice and choice is our central focus – and we aim to deliver both with our advisory process which generates individually tailored investment proposals based on in-house products and a quality-screened selection of third-party offerings. The trust clients place in our advice is demonstrated by the rapid expansion of our franchises across the world. In Asia Pacific, for example, we are expanding rapidly to meet the growing demand for wealth management services. In Europe, our domestic wealth management business, launched in 2001, has systematically built up a strong presence in France, Germany, Italy, Spain and the UK, and we continue to grow by investing in qualified advisory staff, as well as through selective strategic acquisitions. In the US, our business benefits from the excellent market position of the former PaineWebber business that became part of UBS in 2000. That business, which now operates under the UBS brand, has successfully reinvented itself as a holistic wealth management provider, serving clients with comprehensive investment and financing advice.
excellent technology-based execution of transactions and deals, help our clients succeed. With the increasing importance of securities trading and financial markets, and ongoing moves by corporations to restructure their activities, we see significant potential in being able to capably serve our target clients. Our equity-related businesses, for instance, already very strong, continue to gain momentum. Our fixed income and foreign exchange business, which has grown significantly over the past two years, is now one of the broadest and most diversified businesses of its type in the industry. In investment banking for corporations, we are a truly global provider – with longstanding European strength, a growing presence in Asia Pacific, and strong growth in the key US market.
14
Table of Contents

| UBS — Our Credentials |
Table of Contents

| The advice you worldwide Wealth Management Worldwide Business Banking in Switzerland |
Table of Contents

| need, A special dress has to be as individual as its wearer. You can’t guess measurements; or use just any fabric. It has to fit precisely, and reflect exactly who you are. |
Table of Contents

18
Table of Contents
 | Wealth Management & Business Banking |
Caring about all of a client’s assets
In London, client advisor Blake Shorthouse convinced David Ross, an owner of European mobile telephone retailer Carphone Warehouse, to become a UBS client by taking a complete look at his assets and coming up with practical solutions that helped manage the risks inherent in his personal balance sheet.
stake. The goal was to achieve growth independent of stock market fluctuations. Hedge funds held a particular appeal to David as an entrepreneur, as the managers tend to hold capital in their own funds, and fees are usually very closely linked to performance, thereby aligning the interests of the managers with those of the investor.
19
Table of Contents

Advising, not selling
Abby Cheung, a client advisor in Hong Kong, had known her client, Edward Wong, owner and group chairman of Edward Wong Group with business worldwide, for a number of years. She knew that he had a very low tolerance for risk and was only interested in investing in highly rated bonds. Still, she believed that it would be better if he diversified his portfolio. Together with the Investment Solutions Team in Asia, she came up with a portfolio that ensured diversification and offered protection on the downside – exactly fitting Abby’s client’s needs.
20
Table of Contents
Wealth Management & Business Banking

The client was won over. A tailor-made portfolio gave him the opportunity to participate in equity market and other investments with downside protection. The client also appreciated UBS’s independent, open-architecture approach to his portfolio, allowing him to achieve the level of performance he wanted.
| Facts & figures on Wealth Management | ||
| – | With CHF 701 billion in invested assets internationally, and more than 140 years of experience, UBS is the world’s largest private bank | |
| – | We serve international and domestic clients from an extensive network of 112 offices in Switzerland and 56 offices around the world | |
| – | We provide a comprehensive range of products and services individually tailored for wealthy clients | |
| – | Our 3,300 client advisors combine strong personal relationships with the resources available throughout UBS, helping them provide a full range of wealth management services — from asset management to estate planning and from corporate finance advice to art banking | |
| – | Invested assets in all of our wealth management businesses, including the US, total CHF 1.3 trillion |
21
Table of Contents

Delivering the firm
Raising CHF 1.75 billion was both a challenge and an opportunity for the Multinationals team at UBS in Geneva. “From the outset, we felt that the project was interesting and complex, and we were confident that we would be able to manage it thanks to our expertise and our global presence,” explains Philippe Widmer, head of the team.
In an uncertain environment, raising such a sum would be a challenge in itself. Tapping the Swiss capital market, the usual financing source for cantons, was ruled out because the size of the sum might have a potentially disruptive effect on the market.
22
Table of Contents

Wealth Management & Business Banking
international markets, the Canton of Vaud had to seek a Standard and Poor’s rating. Thanks to the assistance of UBS specialists, this was achieved in the record time of 12 weeks.
23
Table of Contents
Wealth Management & Business Banking

Farmhouse reborn
Many dream of living in a farmhouse. Few, however, get to realize that dream. Yet we helped one of our retail customers in Basel achieve just that. Originally built in the 18th century, the farmhouse of his dreams lay in the heart of the Bernese Oberland in the Swiss Alps. The only hitch was that it needed a great deal of repair work and renovation, and the costs of making it livable would come to much more than the actual purchase price.
24
Table of Contents

It was not fully clear what the property’s value would be after the renovation plans as the final plans for the work had not yet been set. In spite of that, the client wanted to take out a fixed-rate mortgage as fast as possible as he reckoned interest rates were on the way up.
| Facts & figures on Business Banking | ||
| – | UBS is the market leader in Swiss retail and commercial banking | |
| – | With 3.5 million individual client accounts, relationships with 150,000 enterprises across Switzerland, as well as 3,000 financial institutions worldwide, it provides a complete set of banking and securities services for individual and corporate clients | |
| – | With a total loan book of CHF 139 billion, it has a leading position in the Swiss lending and retail mortgage market | |
| – | With 1,225 ATMs and 303 branches, as well as a comprehensive set of e-banking services, it provides a Swiss network more extensive than any of its domestic competitors |
25
Table of Contents

| Invest and Global Asset Management Your look is you – not just fashion, but your personal sense of style. An expert eye can help you find the right fabric that flatters your natural colors, understand instinctively which cut enhances your elegance. Skillful hands design and personalize it to perfection – until they get it just right and you instinctively say “that dress is me”. |
Table of Contents

| perform |
Table of Contents

Action at Arcadia
Shortly after taking control of Arcadia Group, the UK retailing chain, Philip Green initiated a thorough review of its pension funds and identified problems to be addressed. As in many other cases, slumping equity prices had inflicted a deficit on both pension funds and, even if markets recovered, there was no assurance that the deficits would disappear.
already familiar with its needs. The firm’s first proposal took a product-by-product approach, closely following the agenda set by the trustees.
28
Table of Contents

| Facts & figures on Global Asset Management | ||
| – | With total invested assets of CHF 574 billion, UBS aims to deliver superior investment results to its institutional and wholesale intermediary clients with distinctive and innovative services | |
| – | Its operations span 21 countries, with main offices in London, Chicago, New York, Tokyo and Zurich. It employs over 2,600 staff, of which some 520 are investment professionals | |
| – | The core investment management business has a clear price/value investment philosophy that emphasizes fundamental analysis when assessing securities | |
| – | The alternative and quantitative investment business encompasses several specialist areas, including hedge funds | |
| – | The real estate business purchases, sells and actively manages investments in property |
29
Table of Contents

| Makingbusiness Investment Bank |
Table of Contents

| happen Traditions are priceless. They serve to remind us of the extraordinary achievements and creativity of our past. Restoring a vintage yacht is both a labor of love and a way to maintain a tangible, living link to our heritage. |
Table of Contents

Transformation in Japan
In mid-2000, Japan moved to the top of Vodafone’s agenda. A company with global ambitions could not sit on the sidelines of the world’s third-largest mobile telephony market.
Yet Vodafone’s Japanese presence was limited to minority stakes in the J-Phone family of companies. Worse still, AT&T and British Telecom were leading shareholders in J-Phone’s parent, Japan Telecom, together with three domestic railway companies. The Vodafone team at UBS took another look at this fragmented ownership structure. This supplied a key insight: the very complexity of these shareholdings could provide a way in.
Aware of the pressure they were under to sell non-core assets, our bankers proposed sounding out two of the railway companies on the sale of their stakes. Following a senior-level meeting in London, a deal was announced within an
unprecedented 12 weeks of the first contacts.
This purchase gave Vodafone 15% of Japan Telecom. It was also the starting point for a series of transactions for Vodafone, which then launched a public offer acquiring most of the remaining shares in Japan Telecom held by the railway companies.
Together these deals, worth USD 11.5 billion, added up to the largest-ever direct investment into Japan. To finance just one, we led an equity issue for Vodafone that raised more than USD 5 billion in a matter of hours. By October 2001, less than a year after the first transaction, Vodafone had gained control of the J-Phone Group, Japan’s third-largest mobile phone operator.
In the meantime, our bankers had helped Vodafone to restructure the four J-Phone companies into a single

Table of Contents
 | Investment Bank | |||||
| entity, strongly boosting efficiency and competitiveness. The final step was to sell off Japan Telecom’s fixed-line business, in line with Vodafone’s focus on mobile telephony. Led by UBS in August 2003, this record-breaking leveraged transaction raised more than USD 2.2 billion in cash and preferred equity. These achievements are best summed up in the words of Vodafone’s senior management: “Utilizing their insight, relationships and technical knowledge, the UBS team helped us achieve what many thought was not possible, namely a swift friendly takeover that has ultimately left us with a pure consolidated mobile phone business in the vital Japanese market.” Japan Telecom was much more than just another acquisition for Vodafone. The Vodafone brand is now everywhere in Japan. The transformation is complete. | Facts & figures on the Investment Bank | |||||
| – | UBS is one of the world’s leading investment banking and securities businesses, providing a full spectrum of services to institutional and corporate clients, governments and financial intermediaries globally | |||||
| – | Our global reach, supported by a complete array of products and services, gives our clients unique access to financial markets around the world | |||||
 | – | Headquartered in London and New York, the Investment Bank employs over 15,000 people in 31 countries around the world, with its business run on a global basis and organized into the three distinct areas of Equities, Investment Banking and Fixed Income, Rates and Currencies | ||||
| – | The Equities business is a leading player in the global primary and secondary markets for equity, equity-linked and equity derivative products. It is a member of over 80 stock exchanges in 31 countries, with a local presence in 40 cities around the world | |||||
33
Table of Contents

Research to measure
Would Germany become the next Japan? Early in 2003, the prospect of deflation in Europe’s largest economy was perceived to be a potential threat to the investment strategy of one global institutional investor. To seek help in assessing the risk, the fund managers turned to our Customized Research and Data Solutions team. Involving the firm’s economists and sector analysts, the team prepared a detailed report, complete with a checklist of “sign-posts” or measures that would suggest policy-makers were moving in the right direction to avert the danger of falling prices. “Instead of mass-produced research, our clients received tailor-made answers to specific questions,” explains Julie Hudson, the team’s head.
The ability of the Customized Research team to handle a wide range of investment questions is grounded not only in the six-strong team’s collective experience but also in their ability to leverage the entire firm’s resources in sector and industry research, valuation and quantitative research, economics, credit, and other research areas.
The team’s goal is to help support the investment decision-making process at client firms, including the development of investment ideas. Success hinges on a thorough understanding of the client’s investment aims and processes.
Established two years ago to meet rising demand for tailor-made information, Customized Research is one answer to the challenge faced by all professional investors: how to sort the insights they need from the blizzard of research products issued by their investment banks.
Another initiative of ours addresses the same challenge by a different route. As the name suggests, the Gatekeeper service packages existing research output from all parts of the firm to match the specific needs of key investment decision-makers at client institutions. As the Gatekeeper team acts as a principal point of contact for more than 90 participating institutions, its members are ideally placed to understand and support the decision-making framework at client institutions. Working closely with their clients, and drawing on the full resources of UBS, the team’s purpose is to deliver relevant input when and how our clients want it. Judging by the enthusiastic response from clients, this “pull” model is a significant advance on the traditional “push” approach where clients are serviced by a multiplicity of contacts across a range of product areas. Both the Customized Research and Gatekeeper initiatives underline UBS’s commitment to delivering services in tailored and efficient ways to meet the specific needs of our clients.
34
Table of Contents


Facts & figures
on the Investment
Bank
| – | Equity Research supplies independent assessments of the prospects of approximately 2,900 companies across diverse industry sectors, as well as economic, strategy and derivative research | |
| – | In investment banking, we provide advice and execution capabilities to a global corporate client base, with services encompassing mergers and acquisitions, strategic reviews and corporate restructuring solutions | |
| – | With over 2,200 professionals employed around the world, the Fixed Income, Rates and Currencies business provides a broad spectrum of products and innovative solutions to corporate, institutional and retail clients in all major markets |
35
Table of Contents

| Right next Wealth Management in the US Restoring a vintage yacht demands the highest craftsmanship. You can’t take short cuts when you are recreating the timeless elegance of the vessel’s lines. You have to painstakingly understand what the original builders and designers had in mind, and then retrace the original work. |
Table of Contents

| to you |
Table of Contents

Ensuring the future
It is not uncommon for wealthy senior citizens to worry about estate planning. However, in the case of this couple living near Chicago, Financial Advisor Paul Skurie was faced with a rather unusual situation. Picture the following: your assets are not invested in a well-diversified portfolio but mostly concentrated in one stock. Some people may find themselves in similar circumstances, but in this case the single-stock position was worth close to USD 60 million. It was held outside UBS, had been inherited from the wife’s father, and thus came with a considerable amount of emotional attachment.
This also meant reluctance to pursue alternative investment paths – made all the more understandable by the fact that a family member owning a similar portion of that same stock had taken advice from another firm and been left with a substantial drop in value. The couple’s healthy skepticism toward active strategies was therefore not entirely unfounded. Thus Paul needed a lot of credibility to establish the trust needed to address the estate planning issues.
One such opportunity to build trust arose when the couple decided to move out of their home to be closer to one of their daughters. They needed a loan to bridge the gap between selling their old house and closing on the new one. Paul called Regional Lending Manager Anita Ortiz and helped them to open a USD 2 million credit line. As a result, a small fraction of the stock holding was transferred to UBS to serve as collateral.
This deal helped to inspire confidence, and after a while Paul raised the million dollar question: “Wealth preservation also means minimizing estate taxes,” he suggested. After her father’s death several years earlier, the client had regretted not addressing the issue of estate taxes as well as she might have. This time, Paul took the initiative by contacting an estate planning specialist from UBS’s network, liaising with an insurance consultant and then coming up with a tailor-made insurance policy solution.
The couple were concerned about the premiums on their life insurance policy, which, due to their age, were well above USD 1 million a year. Again teamwork was called for. Anita explained that financing for the premiums on the policy could be provided through UBS’s Premier Credit Line lending product. The solution would allow the clients to pay the premiums each year through the loan. They could also service the loan at an interest rate that matched the relatively low levels being seen in the wider market. Also, if they took that route, they would be able to protect their estate and cover their cost of living for many years to come. The product proved a big success, encouraging the couple’s daughters to seek advice from UBS as well. Says the contented client: “My husband and I are very pleased with the assistance you provided in the development of our insurance trust account. We really appreciate all of the effort, ingenuity, and time that you spent in the process. We thank you, again.”
38
Table of Contents

Wealth Management USA
| Facts & figures on Wealth Management USA | ||
| – | Providing a complete set of sophisticated wealth management services to affluent and high net worth clients, Wealth Management USA is the fifth-largest wealth manager in the US | |
| – | We have CHF 634 billion in invested assets and nearly 2 million private client relationships, supported by a network of 7,766 financial advisors in 366 branch office locations | |
| – | Our strength lies in the emphasis we put on building and maintaining consultative relationships between high net worth clients and their financial advisors, who offer a wide array of investment products and services | |
| – | We commit considerable resources to develop and expand the capabilities of our financial advisors. With a dedi- cation to and emphasis on training, they are a key factor in developing long-term, mutually beneficial client relationships | |
| – | Invested assets in all of our wealth management businesses, including the international business, total CHF 1.3 trillion |
39
Table of Contents
2003 Financials

Table of Contents

Table of Contents
Corporate Governance
Corporate governance – the way our leadership and management is organized and how it operates in practice – ultimately aims at leading us to success, protecting the interests of our shareholders while creating value for them and for all stakeholders. Good corporate governance seeks to balance entrepreneurship, control and transparency, while supporting the firm’s success by ensuring efficient decision-making processes
Management structure
We operate under a strict dual board structure, as mandated by Swiss banking law. The functions of Chairman of the Board of Directors (Chairman) and Chief Executive Officer (CEO) are conferred on two different people, thus providing separation of powers. No member of one board may be a member of the other. This structure establishes checks and balances and creates an institutional independence of the two boards.
The Board of Directorsis the most senior body with ultimate responsibility for the strategy and the management of the company and for the supervision of its executive management. Our shareholders elect each member of the Board. The Board appoints its Chairman and Vice Chairmen, who together form the Chairman’s Office. The Board also appoints the chairmen and members of the Audit Committee, the Compensation Committee, and the Nominating Committee. The majority of the Board members are non-executive and independent.
| Members of the Board of Directors | As at 31 December 2003 | |||||||||||
| Current term | ||||||||||||
| Year of initial | of office | |||||||||||
| Name | Business address | Positions held in UBS | appointment | runs until | ||||||||
Marcel Ospel | UBS AG Bahnhofstrasse 45, CH-8098 Zurich | Chairman | 2001 | 2005 | ||||||||
Alberto Togni | UBS AG Bahnhofstrasse 45, CH-8098 Zurich | Executive Vice Chairman | 1998 | 2005 | ||||||||
Peter Böckli | Böckli Bodmer & Partners St. Jakobs-Strasse 41, CH-4002 Basel | Non-executive Vice Chairman Chairman of the Nominating Committee | 1998 | 2006 | ||||||||
Ernesto Bertarelli | Serono International SA Ch. des Mines 15bis, CH-1211 Geneva 20 | Member of the Compensation Committee | 2002 | 2006 | ||||||||
Sir Peter Davis | J Sainsbury plc 33 Holborn, London EC1N 2HT | Member of the Audit Committee Member of the Nominating Committee | 2001 | 20041 | ||||||||
Johannes A. de Gier | GAM Klausstrasse 10, CH-8008 Zurich | Member of the Board Executive Vice Chairman until February 2003 | 2001 | 20062 | ||||||||
Rolf A. Meyer | Heiniweidstrasse 18 CH-8806 Bäch | Chairman of the Compensation Committee Member of the Audit Committee | 1998 | 2006 | ||||||||
Hans Peter Ming | Sika AG Wiesenstrasse 7, CH-8008 Zurich | Member of the Compensation Committee Member of the Nominating Committee | 1998 | 20042 | ||||||||
Lawrence A. Weinbach | Unisys Corporation Unisys Way, Blue Bell, PA 19424 | Chairman of the Audit Committee | 2001 | 2005 | ||||||||
| Secretary to the Board of Directors | Gertrud Erismann-Peyer | |||||||||||
Each member of the Board is elected at the Annual General Meeting of Shareholders for a three-year term. The initial term of office for each Director is, however, fixed in such a way as to ensure that about a third of all the members have to be newly elected or reelected every year.
42
Table of Contents
2003 within UBS that integrated our independent private banks and the GAM asset management business. Hans Peter Ming, whose term of office expires in 2004, is not standing for re-election as he has reached retirement age.
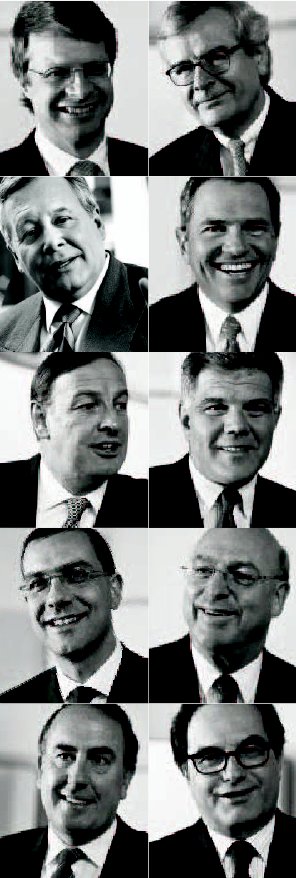
The Group Executive Board (GEB)has business management responsibility for UBS. All its members are appointed by the Board of Directors. The GEB, and in particular the CEO, are accountable to the Chairman and the Board for the implementation and the results of the firm’s business strategies. Together with the Chairman and the Vice Chairmen, the GEB assumes overall responsibility for the development of UBS’s strategies. On 31 December 2003, the GEB consisted of the ten members portrayed in the photographs opposite. In January 2004, Joseph J. Grano stepped down from the GEB, handing over the CEO function of the Wealth Management USA Business Group to Mark Sutton, previously President and Chief Operating Officer. As of 1 April 2004, Clive Standish, Chairman and CEO of Asia Pacific will assume the function of Chief Financial Officer. Stephan Haeringer, currently Deputy CEO, is proposed for election to the Board of Directors at the AGM of 15 April 2004. The GEB will consist of eight members after these changes.
| Peter A. Wuffli | Stephan Haeringer | |||||
| CEO | Deputy CEO | |||||
| Joseph J. Grano Jr. | Mark B. Sutton | |||||
| Chairman | CEO | |||||
| Wealth Management USA | Wealth Management USA | |||||
| Clive Standish | John P. Costas | |||||
| Chairman and CEO | Chairman and CEO | |||||
| Asia Pacific | Investment Bank | |||||
| Marcel Rohner | Georges Gagnebin | |||||
| CEO | Chairman | |||||
| Wealth Management | Wealth Management | |||||
| & Business Banking | & Business Banking | |||||
| John A. Fraser | Peter Kurer | |||||
| Chairman and CEO | Group General | |||||
| Global Asset Management | Counsel |
43
Table of Contents
Compensation for senior executives
Compensation principles and governance
Compensation for senior executives in 2003
Of the total compensation sum, CHF 79.2 million was paid in cash, representing base salaries and the cash portions of bonus. Another CHF 64.2 million was paid in the form of restricted UBS shares and CHF 12.8 million in restricted UBS options (both at fair value). Additionally, UBS made contributions to retirement plans for senior executives amounting to CHF 1.2 million and granted CHF 1 million worth in benefits in kind and fringe benefits (including car leasing, company car allowances, staff discount on banking products and services, health and welfare benefits and general expenses allowances).
Compensation for non-executive Board members
44
Table of Contents
2003 Financials
Audit
The Board of Directors and its Audit Committee supervise the functioning of the overall audit work. The Chairman’s Office has primary responsibility for the supervision of Group Internal Audit, while the Audit Committee monitors and assesses the qualification, independence and performance of the External Auditors.Ernst & Young Ltd, Basel, have been assigned the mandate to serve as global auditors for UBS. They were first appointed as UBS’s principal external auditor for the audit of the 1998 financial statements. Since then, shareholders voting at AGMs have annually confirmed their mandate until and including 2003, and they will be proposed for re-election at the AGM in 2004. The Audit Committee has determined that Ernst & Young Ltd. meets all independence requirements established by the US Securities and Exchange Commission (SEC).
In 2003, UBS paid Ernst & Young CHF 32.2 million for audit services (CHF 32.1 million in 2002) and CHF 19.6 million for non-audit services pre-approved by the Audit Committee (CHF 23.8 million in 2002).
Group Internal Auditprovides an independent review of effectiveness of the system of internal controls and compliance with key rules and regulations. It has unrestricted access to all accounts, books and records and must be provided with all information and data required to fulfill its auditing duties. All key issues raised by Group Internal Audit are communicated to the management in charge, to the CEO and to the Chairman’s Office via formal Audit Reports. Group Internal Audit employs around 240 professionals worldwide. To maximize its independence from management, the head of Group Internal Audit, Markus Ronner, reports directly to the Chairman of the Board.
45
Table of Contents
Financial Results in 2003
| UBS Income Statement | % change from | |||||||||||||||||||
| CHF million, except per share data | For the year ended | 31.12.03 | 31.12.02 | 31.12.01 | 31.12.02 | |||||||||||||||
Operating income | ||||||||||||||||||||
| Interest income | 40,159 | 39,963 | 52,277 | 0 | ||||||||||||||||
| Interest expense | (27,860 | ) | (29,417 | ) | (44,236 | ) | (5 | ) | ||||||||||||
| Net interest income | 12,299 | 10,546 | 8,041 | 17 | ||||||||||||||||
| Credit loss (expense)/recovery | (116 | ) | (206 | ) | (498 | ) | (44 | ) | ||||||||||||
| Net interest income after credit loss expense | 12,183 | 10,340 | 7,543 | 18 | ||||||||||||||||
| Net fee and commission income | 17,345 | 18,221 | 20,211 | (5 | ) | |||||||||||||||
| Net trading income | 3,883 | 5,572 | 8,802 | (30 | ) | |||||||||||||||
| Other income | 561 | (12 | ) | 558 | ||||||||||||||||
| Total operating income | 33,972 | 34,121 | 37,114 | 0 | ||||||||||||||||
Operating expenses | ||||||||||||||||||||
| Personnel expenses | 17,231 | 18,524 | 19,828 | (7 | ) | |||||||||||||||
| General and administrative expenses | 6,086 | 7,072 | 7,631 | (14 | ) | |||||||||||||||
| Depreciation of property and equipment | 1,364 | 1,521 | 1,614 | (10 | ) | |||||||||||||||
| Amortization of goodwill and other intangible assets | 943 | 2,460 | 1,323 | (62 | ) | |||||||||||||||
| Total operating expenses | 25,624 | 29,577 | 30,396 | (13 | ) | |||||||||||||||
Operating profit before tax and minority interests | 8,348 | 4,544 | 6,718 | 84 | ||||||||||||||||
| Tax expense | 1,618 | 678 | 1,401 | 139 | ||||||||||||||||
Net profit before minority interests | 6,730 | 3,866 | 5,317 | 74 | ||||||||||||||||
| Minority interests | (345 | ) | (331 | ) | (344 | ) | 4 | |||||||||||||
Net profit | 6,385 | 3,535 | 4,973 | 81 | ||||||||||||||||
| Basic earnings per share (CHF) | 5.72 | 2.92 | 3.93 | 96 | ||||||||||||||||
| Diluted earnings per share (CHF) | 5.61 | 2.87 | 3.78 | 95 | ||||||||||||||||
Letter from Group auditors
In our opinion, the information set forth in the accompanying Group balance sheet and income statement on pages 46 and 47 of the Annual Review are fairly stated, in all material respects, in relation to the Group financial statements from which they have been derived.
| Basel, 4 February 2004 | ||||
| Ernst & Young Ltd |  |  | ||
| Roger K. Perkin | Peter Heckendorn | |||
| Chartered Accountant | lic.oec. | |||
| in charge of the audit | in charge of the audit |
46
Table of Contents
2003 Financials
| UBS Balance Sheet | % change from |
| CHF million | 31.12.03 | 31.12.02 | 31.12.02 | |||||||||
Assets | ||||||||||||
| Cash and balances with central banks | 3,584 | 4,271 | (16 | ) | ||||||||
| Due from banks | 31,667 | 32,468 | (2 | ) | ||||||||
| Cash collateral on securities borrowed | 213,932 | 139,052 | 54 | |||||||||
| Reverse repurchase agreements | 320,587 | 294,086 | 9 | |||||||||
| Trading portfolio assets | 461,772 | 371,436 | 24 | |||||||||
| Positive replacement values | 84,334 | 82,092 | 3 | |||||||||
| Loans | 212,504 | 211,647 | 0 | |||||||||
| Financial investments | 5,139 | 8,391 | (39 | ) | ||||||||
| Accrued income and prepaid expenses | 6,218 | 6,453 | (4 | ) | ||||||||
| Investments in associates | 1,616 | 705 | 129 | |||||||||
| Property and equipment | 7,659 | 7,869 | (3 | ) | ||||||||
| Goodwill and other intangible assets | 11,529 | 13,696 | (16 | ) | ||||||||
| Other assets | 25,459 | 8,952 | 184 | |||||||||
Total assets | 1,386,000 | 1,181,118 | 17 | |||||||||
Total subordinated assets | 4,794 | 3,652 | 31 | |||||||||
Liabilities | ||||||||||||
| Due to banks | 127,153 | 83,178 | 53 | |||||||||
| Cash collateral on securities lent | 53,278 | 36,870 | 45 | |||||||||
| Repurchase agreements | 415,863 | 366,858 | 13 | |||||||||
| Trading portfolio liabilities | 143,957 | 106,453 | 35 | |||||||||
| Negative replacement values | 93,646 | 81,282 | 15 | |||||||||
| Due to customers | 347,358 | 306,876 | 13 | |||||||||
| Accrued expenses and deferred income | 13,673 | 15,331 | (11 | ) | ||||||||
| Debt issued | 120,237 | 129,411 | (7 | ) | ||||||||
| Other liabilities | 31,316 | 12,339 | 154 | |||||||||
Total liabilities | 1,346,481 | 1,138,598 | 18 | |||||||||
| Minority interests | 4,073 | 3,529 | 15 | |||||||||
Shareholders’ equity | ||||||||||||
| Share capital | 946 | 1,005 | (6 | ) | ||||||||
| Share premium account | 6,938 | 12,638 | (45 | ) | ||||||||
| Net gains/(losses) not recognized in the income statement, net of tax | (983 | ) | (159 | ) | (518 | ) | ||||||
| Retained earnings | 36,725 | 32,638 | 13 | |||||||||
| Treasury shares | (8,180 | ) | (7,131 | ) | (15 | ) | ||||||
Total shareholders’ equity | 35,446 | 38,991 | (9 | ) | ||||||||
Total liabilities, minority interests and shareholders’ equity | 1,386,000 | 1,181,118 | 17 | |||||||||
Total subordinated liabilities | 9,301 | 10,102 | (8 | ) | ||||||||
47
Table of Contents
2003 financial results
In 2003, we recorded the second-best annual result since UBS and SBC merged in 1998. All businesses reported a stronger set of results in 2003 than in the previous year. Our net profit in full-year 2003 was CHF 6,385 million, up from CHF 3,535 million in 2002 – an increase of 81%. Results in both 2002 and 2003 were influenced by individual items we call significant financial events. The first was the gain from our sale of private bank Hyposwiss in first quarter 2002. Then, in fourth quarter 2002, we wrote down the value of the PaineWebber brand and sold the Klinik Hirslanden hospital chain. In second quarter 2003, we sold the Correspondent Services Corporation (CSC) clearing business. Excluding these effects, and before goodwill amortization, net profit increased by 33% in 2003 from 2002. Return on equity in 2003 was 18.2%, compared to 8.9% a year earlier. Basic earnings per share were CHF 5.72 in 2003, against CHF 2.92 in 2002. The cost/income ratio was 75.2% in 2003 compared to 86.2% in 2002.
Significant financial events
UBS’s performance is reported in accordance with International Financial Reporting Standards (IFRS). Additionally, we provide comments and analysis on an adjusted basis which excludes from the reported amounts certain items we term significant financial events (SFEs). An additional adjustment we use in our results discussion is the exclusion of the amortization of goodwill and other acquired intangible assets. These adjustments reflect our internal approach to analyzing our results and managing the company, in which SFE-adjusted figures before the amortization of goodwill and intangibles are used to assess performance against peers and to estimate future growth potential. In particular, our financial targets have been set in terms of
Significant Financial Events (SFE)
| Wealth | Corporate | |||||||||||||||||||||||||
| CHF million | UBS | Management USA | Center | |||||||||||||||||||||||
| For the year ended | Income Statement line affected | 31.12.03 | 31.12.02 | 31.12.01 | 31.12.03 | 31.12.02 | 31.12.02 | |||||||||||||||||||
Operating income | ||||||||||||||||||||||||||
As reported | 33,972 | 34,121 | 37,114 | 5,182 | 5,548 | 2,676 | ||||||||||||||||||||
| Less: Gain on disposal of | ||||||||||||||||||||||||||
| Correspondent Services Corporation | Other income | 161 | 161 | |||||||||||||||||||||||
| Less: Gain on disposal of Hyposwiss | Other income | 155 | 155 | |||||||||||||||||||||||
| Less: Gain on disposal of Klinik Hirslanden | Other income | 72 | 72 | |||||||||||||||||||||||
Adjusted operating income | 33,811 | 33,894 | 37,114 | 5,021 | 5,548 | 2,449 | ||||||||||||||||||||
Operating expenses | ||||||||||||||||||||||||||
As reported | 25,624 | 29,577 | 30,396 | 5,187 | 7,348 | 2,399 | ||||||||||||||||||||
| Less: Writedown of | Amortization of goodwill and | |||||||||||||||||||||||||
| PaineWebber brand name | other intangible assets | 1,234 | 1,234 | |||||||||||||||||||||||
Adjusted operating expenses | 25,624 | 28,343 | 30,396 | 5,187 | 6,114 | 2,399 | ||||||||||||||||||||
| Operating profit / (loss) before tax and minority interests | ||||||||||||||||||||||||||
As reported | 8,348 | 4,544 | 6,718 | (5 | ) | (1,800 | ) | 277 | ||||||||||||||||||
| SFE adjustments, net | (161 | ) | 1,007 | (161 | ) | 1,234 | (227 | ) | ||||||||||||||||||
Adjusted operating profit / (loss) before tax and minority interests | 8,187 | 5,551 | 6,718 | (166 | ) | (566 | ) | 50 | ||||||||||||||||||
Net profit | ||||||||||||||||||||||||||
As reported | 6,385 | 3,535 | 4,973 | |||||||||||||||||||||||
| SFE adjustments, net | (161 | ) | 1,007 | |||||||||||||||||||||||
| Tax effect of significant financial events, net | Tax expense / (benefit) | 159 | (239 | ) | ||||||||||||||||||||||
Adjusted net profit | 6,383 | 4,303 | 4,973 | |||||||||||||||||||||||
| Amortization of goodwill and other intangible assets | 943 | 1,226 | 1,323 | |||||||||||||||||||||||
Adjusted net profit before goodwill | 7,326 | 5,529 | 6,296 | |||||||||||||||||||||||
48
Table of Contents
2003 Financials
adjusted results, excluding SFEs and the amortization of goodwill and intangibles. All the analysis provided in our internal management accounting is based on operational SFE-adjusted performance. This helps us to illustrate the underlying operational performance of our business, insulated from the impact of individual gain or loss items that are not relevant to our management’s business planning decisions. A policy approved by the GEB defines which items may be classified as SFEs.
In 2002 there were three and in 2003 there was one – they are described in more detail below.
| – | We realized a net gain of CHF 2 million (pre-tax CHF 161 million) in second quarter 2003 from the sale of Wealth Management USA’s Correspondent Services Corporation (CSC) clearing business. A substantial portion of CSC’s net assets comprised goodwill stemming from the PaineWebber acquisition. After deducting taxes of CHF 159 million (based on the purchase price) and the writedown of the goodwill associated with CSC, the net gain from the transaction was CHF 2 million. | |
| – | In fourth quarter 2002, we recorded a non-cash writedown of CHF 953 million (pre-tax CHF 1,234 million) relating to the value of the PaineWebber brand that was held as an intangible asset on our balance sheet. | |
| – | In fourth quarter 2002, we realized a net gain of CHF 60 million (pre-tax CHF 72 million) from the sale of Klinik Hirslanden, a private hospital group. |
| – | In first quarter 2002, we realized a net gain of CHF 125 million (pre-tax CHF 155 million) from the sale of private bank Hyposwiss. |
Details of significant financial events are shown in the table on page 48.
Our financial targets
| – | We seek to increase the value of UBS by achieving a sustainable, after-tax return on equity of 15–20%, across periods of varying market conditions. | |
| – | We aim to increase shareholder value through double-digit average annual percentage growth in basic earnings per share (EPS), across periods of varying market conditions. | |
| – | Through cost reduction and earnings enhancement initiatives we aim to reduce UBS’s cost/income ratio, to a level that compares positively with best-in-class competitors. | |
| – | We aim to achieve a clear growth trend in net new money in our wealth management units. |
The first three targets are all reported pre-goodwill amortization, and adjusted for significant financial events.
49
Table of Contents
Performance against targets
| For the year ended | 31.12.03 | 31.12.02 | 31.12.01 | |||||||||
RoE (%) | ||||||||||||
as reported1 | 18.2 | 8.9 | 11.7 | |||||||||
before goodwill and adjusted for significant financial events2 | 20.9 | 13.9 | 14.8 | |||||||||
Basic EPS (CHF) | ||||||||||||
as reported3 | 5.72 | 2.92 | 3.93 | |||||||||
before goodwill and adjusted for significant financial events4 | 6.56 | 4.57 | 4.97 | |||||||||
Cost/income ratio (%) | ||||||||||||
as reported5 | 75.2 | 86.2 | 80.8 | |||||||||
before goodwill and adjusted for significant financial events6 | 72.7 | 79.5 | 77.3 | |||||||||
Net new money, wealth management units (CHF billion)7, 8 | ||||||||||||
| Wealth Management | 29.7 | 17.7 | 23.2 | |||||||||
| Wealth Management USA | 21.1 | 18.5 | 33.2 | |||||||||
Total | 50.8 | 36.2 | 56.4 | |||||||||
Our performance against these targetsin 2003 reflected our ability to capture revenue opportunities and gain market share in improved economic and financial market conditions. These targets are evaluated before goodwill and adjusted for significant financial events (SFEs):
Our return on equityfor 2003 was 20.9%, up from 13.9% a year ago and above our target range of 15% to 20%. This was the best result since the very strong return of 24.3% in 2000. The increase reflects our much improved net profit combined with a lower average level of equity resulting from our continued buy-back programs.
Basic earnings per share (EPS)stood at the highest level since 2000. In 2003, they were CHF 6.56, an increase of CHF 1.99 or 44% from a year ago, reflecting the increase in profit as well as the 8% reduction in average number of shares outstanding due to our continuous buyback activities. Without the buyback programs in place since 2000, our earnings per share would now be 14% lower.
The cost/income ratiowas 72.7% in 2003, an improvement from 79.5% in 2002. It stands at its lowest level since PaineWebber became part of UBS. The slight drop in income, reflecting the difficult market environment in first half 2003, was more than compensated by a 9% decline in operating expenses due to ongoing cost management initiatives and the downward pressure on compensation ratios.
Net new moneyinto our Wealth Management businesses totaled CHF 50.8 billion compared with CHF 36.2 billion in 2002. This is an increase of 40% and corresponds to an annual growth rate of 4.2%. Both the Wealth Management and Wealth Management USA businesses were able to attract more client money in 2003 than in 2002.
50
Table of Contents
2003 Financials
| Income statement key figures as reported | % change from | ||||||||||||||||||||||
| CHF million, except where indicated | For the year ended | 31.12.03 | 31.12.02 | 31.12.01 | 31.12.02 | ||||||||||||||||||
| Operating income | 33,972 | 34,121 | 37,114 | 0 | |||||||||||||||||||
| Operating expenses | 25,624 | 29,577 | 30,396 | (13 | ) | ||||||||||||||||||
| Operating profit before tax | 8,348 | 4,544 | 6,718 | 84 | |||||||||||||||||||
Net profit | 6,385 | 3,535 | 4,973 | 81 | |||||||||||||||||||
KPI’s | |||||||||||||||||||||||
Cost/income ratio (%)1 | 75.2 | 86.2 | 80.8 | ||||||||||||||||||||
Basic earnings per share (CHF)2 | 5.72 | 2.92 | 3.93 | 96 | |||||||||||||||||||
Diluted earnings per share (CHF)2 | 5.61 | 2.87 | 3.78 | 95 | |||||||||||||||||||
Return on shareholders’ equity (%)3 | 18.2 | 8.9 | 11.7 | ||||||||||||||||||||
| Earnings adjusted for significant financial events and pre-goodwill4, 5 | % change from | ||||||||||||||||||||||
| CHF million, except where indicated | For the year ended | 31.12.03 | 31.12.02 | 31.12.01 | 31.12.02 | ||||||||||||||||||
| Operating income | 33,811 | 33,894 | 37,114 | 0 | |||||||||||||||||||
| Operating expenses | 24,681 | 27,117 | 29,073 | (9 | ) | ||||||||||||||||||
| Operating profit before tax | 9,130 | 6,777 | 8,041 | 35 | |||||||||||||||||||
Net profit | 7,326 | 5,529 | 6,296 | 33 | |||||||||||||||||||
KPI’s | |||||||||||||||||||||||
Cost/income ratio (%)6 | 72.7 | 79.5 | 77.3 | ||||||||||||||||||||
Basic earnings per share (CHF)7 | 6.56 | 4.57 | 4.97 | 44 | |||||||||||||||||||
Diluted earnings per share (CHF)8 | 6.43 | 4.50 | 4.81 | 43 | |||||||||||||||||||
Return on shareholders’ equity (%)9 | 20.9 | 13.9 | 14.8 | ||||||||||||||||||||
Operating income
Net interest incomeof CHF 12,299 million in 2003 was 17% higher than the CHF 10,546 million in 2002.Net trading income, at CHF 3,883 million in 2003, declined 30% from CHF 5,572 million a year earlier. As well as income from interest margin based activities (loans and deposits), net interest income includes income earned as a result of trading activities (for example, coupon and dividend income). This component is volatile from period to period, depending on the composition of the trading portfolio. In order to provide a better explanation of the movements in net interest income and net trading income, we analyze the total according to the business activities that give rise to the income, rather than by the type of income generated.
Net income from interest margin products dropped by 4% to CHF 5,077 million in 2003 from CHF 5,275
51
Table of Contents
2003 Financials
million in 2002. The result reflects lower interest margins on client savings and cash accounts, and declining revenues from our diminishing recovery portfolio in Switzerland, as well as lower interest revenue on margin loans in the US as we sold our Correspondent Services Corporation (CSC) clearing business. These effects were partially offset by higher mortgages and saving accounts volumes in Switzerland.
Over the full year,net income from trading activities, at CHF 10,810 million in 2003, was up 2% from CHF 10,605 million a year earlier. Equity trading income of CHF 2,464 million was down 12% from CHF 2,794 million a year earlier. The drop reflected the weakening of most major currencies against the Swiss franc. Excluding currency fluctuations, equity trading revenues increased as the business benefited from improved trading opportunities that followed the strong market recovery. Fixed income trading revenue was CHF 6,530 million in 2003, up 8% from CHF 6,041 million in the same period a year earlier. This increase was due to better performances across our businesses with very strong revenues in our Principal Finance, Mortgage-backed Securities and Derivatives businesses. However, results were also affected by the US dollar’s decline against the Swiss franc and negative revenues of CHF 678 million relating to Credit Default Swaps (CDSs) hedging existing credit exposure in the loan book. Over the full year, foreign exchange trading revenues, at CHF 1,501 million, remained virtually unchanged from CHF 1,500 million in 2002.
Net income from treasury activities,at CHF 1,415 million in 2003, was down 15% from CHF 1,667 million a year earlier. The drop mainly reflected lower income from our invested equity as we continued to buy back shares, as well as experiencing a further decline in interest rates. The impact of falling interest rates was partially offset by the diversification of our invested equity into currencies other than Swiss francs.
In 2003,other net trading and interest incomeshowed negative revenues of CHF 1,120 million compared to negative CHF 1,429 million a year earlier. The improvement was mainly due to lower goodwill funding costs related to the writedown of the value of the PaineWebber brand, and lower funding needs for our private equity portfolio.
Totalcredit loss expensefor UBS in 2003 amounted to CHF 116 million, compared to CHF 206 million in 2002. The exceptionally strong result reflects the high quality of our credit portfolio in Switzerland. In the Investment Bank, a continued strong performance was the result of minimal exposure to new defaults plus more favorable outlooks for emerging market economies.
At CHF 17,345 million,net fee and commission incomein 2003 was 5% lower than CHF 18,221 million in 2002. The drop was mainly due to the weakening of the US dollar and other major currencies against the Swiss franc. Excluding currency effects, net fee and commission income actually increased, with a record result in our underwriting activities. However, our asset-based revenues suffered from the low market levels in early 2003 and only started to recover in the second half of the year. Further, our brokerage revenues only started to rebound as the year progressed, following the gradual rise in market activity levels.
Other incomewas CHF 561 million in 2003 compared with a loss of CHF 12 million a year earlier. The increase was mainly due to a drop in private equity impairment charges, as well as higher disposal gains from our private equity investments. This was partially offset by a reduction in divestment gains from other financial investments as well as a CHF 66 million decline in gains from disposals of associates and subsidiaries (the two 2002 gains of CHF 72 million from Klinik Hirslanden and CHF 155 million from Hyposwiss less 2003’s CSC gain of CHF 161 million). Other income was further impacted by the fall-off in income from Klinik Hirslanden.
Operating expenses
Personnel expensesdropped by 7% to CHF 17,231 million in 2003 from CHF 18,524 million in 2002. The drop was mainly due to the weakening of the US
52
Table of Contents
dollar against the Swiss franc. Salary expenses fell due to the 5% reduction in headcount over the period. The drop was further accentuated by lower contractor expenses and retention payments. This was partially offset by higher performance-related compensation expenses that increased in line with our improving revenue, as well as slightly higher contributions to retirement plans. Over the full year, approximately 44% of this year’s personnel expense was paid as bonus or other variable compensation, up from 42% in 2002. Average variable compensation per head in 2003 was 3% higher than in 2002.
In full-year 2003,general and administrative expenses, at CHF 6,086 million, were down 14% from CHF 7,072 million a year earlier. Strict cost control in all our businesses led to a drop in nearly all cost categories. The biggest declines were in overall provisions, with major decreases in legal and security provisions (2002 included the charge of CHF 111 million (USD 80 million) related to the US equity research settlement). Administration, IT and telecommunication expenses saw significant drops from our continued cost-saving initiatives, partially offset by slightly higher rent and maintenance expenses as well as professional fees, the latter due to higher project-related costs.
At CHF 1,521 million in 2002,depreciationfell 10% to CHF 1,364 million in 2003, mainly due to lower IT-related charges, as well as the weakening of the US dollar against the Swiss franc.
Amortization of goodwill and other intangible assetsdecreased from CHF 2,460 million in 2002 to CHF 943 million in 2003. The main reason for the drop was because, in 2002, we wrote down the value of the PaineWebber brand name. Excluding that charge, the drop would have been 23%, reflecting the full amortization of some businesses, as well as the strengthening of the Swiss franc against the US dollar.
We incurred atax expenseof CHF 1,618 million in 2003, up from CHF 678 million in 2002. This corresponds to an effective tax rate of 19.4% in 2003. Excluding the effect of the sale of Correspondent Services Corporation (sold in second quarter 2003), our
effective tax rate for the full year is 17.8%, compared to 2002’s full-year rate of 16.5% (before significant financial events). The particularly low 2002 rate was driven by lower progressive tax rates in Switzerland, the ability to benefit from tax losses in the US and UK and a high proportion of earnings generated in lower tax jurisdictions. The 2003 tax rate was positively influenced by a continued favorable regional profit mix and the successful conclusion of tax audits. We believe that an underlying tax rate of around 19-20% (before significant financial events) continues to be a reasonable indicator for 2004.
Headcount
Dividend
Balance sheet
53
Table of Contents
Business Group Results in 2003
Business Group Key Figures
| Wealth Management | ||||||||||||||||||||||||||||
| & Business Banking | Global Asset Management | Investment Bank | ||||||||||||||||||||||||||
| CHF million | For the year ended | 31.12.03 | 31.12.02 | 31.12.03 | 31.12.02 | 31.12.03 | 31.12.02 | |||||||||||||||||||||
| Income | 12,052 | 12,184 | 1,737 | 1,655 | 14,120 | 12,498 | ||||||||||||||||||||||
Credit loss (expense)/recovery1 | (131 | ) | (312 | ) | 0 | 0 | (139 | ) | (128 | ) | ||||||||||||||||||
| Total operating income | 11,921 | 11,872 | 1,737 | 1,655 | 13,981 | 12,370 | ||||||||||||||||||||||
| Personnel expenses | 4,584 | 4,596 | 816 | 774 | 7,357 | 7,878 | ||||||||||||||||||||||
| General and administrative expenses | 2,116 | 2,251 | 407 | 447 | 2,130 | 2,378 | ||||||||||||||||||||||
| Depreciation | 384 | 448 | 29 | 29 | 327 | 382 | ||||||||||||||||||||||
| Amortization of goodwill and other intangible assets | 75 | 97 | 153 | 186 | 278 | 364 | ||||||||||||||||||||||
| Total operating expenses | 7,159 | 7,392 | 1,405 | 1,436 | 10,092 | 11,002 | ||||||||||||||||||||||
Business Group performance before tax excluding significant financial events | 4,762 | 4,480 | 332 | 219 | 3,889 | 1,368 | ||||||||||||||||||||||
| Significant financial events | 0 | 0 | 0 | 0 | 0 | 0 | ||||||||||||||||||||||
| Tax expense | ||||||||||||||||||||||||||||
Net profit before minority interests | ||||||||||||||||||||||||||||
| Minority interests | ||||||||||||||||||||||||||||
Net profit | ||||||||||||||||||||||||||||
Wealth Management & Business Banking
Wealth Management
Our European wealth management business continued to make significant progress. After three years of intense effort, the total level of invested assets in Germany, France, UK, Spain and Italy was CHF 46 billion.
Business Banking Switzerland
54
Table of Contents
2003 Financials
| Wealth Management USA | Corporate Center | UBS | ||||||||||||||||||||||
| 31.12.03 | 31.12.02 | 31.12.03 | 31.12.02 | 31.12.03 | 31.12.02 | |||||||||||||||||||
| 5,029 | 5,561 | 989 | 2,202 | 33,927 | 34,100 | |||||||||||||||||||
| (8 | ) | (13 | ) | 162 | 247 | (116 | ) | (206 | ) | |||||||||||||||
| 5,021 | 5,548 | 1,151 | 2,449 | 33,811 | 33,894 | |||||||||||||||||||
| 3,712 | 4,245 | 762 | 1,031 | 17,231 | 18,524 | |||||||||||||||||||
| 988 | 1,263 | 445 | 733 | 6,086 | 7,072 | |||||||||||||||||||
| 151 | 149 | 473 | 513 | 1,364 | 1,521 | |||||||||||||||||||
| 336 | 457 | 101 | 122 | 943 | 1,226 | |||||||||||||||||||
| 5,187 | 6,114 | 1,781 | 2,399 | 25,624 | 28,343 | |||||||||||||||||||
| (166 | ) | (566 | ) | (630 | ) | 50 | 8,187 | 5,551 | ||||||||||||||||
| 161 | (1,234 | ) | 0 | 227 | 161 | (1,007 | ) | |||||||||||||||||
| 1,618 | 678 | |||||||||||||||||||||||
| 6,730 | 3,866 | |||||||||||||||||||||||
| (345 | ) | (331 | ) | |||||||||||||||||||||
| 6,385 | 3,535 | |||||||||||||||||||||||
from a year earlier, as an increase in volumes of private client mortgages was offset by declining volumes in the corporate clients area and a further reduction in the recovery portfolio to CHF 6.4 billion on 31 December 2003 from CHF 8.6 billion a year earlier. This positive development was also reflected in the key credit quality ratios: the non-performing loan ratio improved to 3.2% from 3.6%, while the ratio of impaired loans to gross loans was 4.6% compared to 6.0% in 2002.
Global Asset Management
Global Asset Management reported a pre-tax profit of CHF 332 million in 2003, an increase of 52% from 2002’s pre-tax profit of CHF 219 million.
For full-year 2003, net new money inflows in the institutional business stood at CHF 12.7 billion, improving significantly from the outflow of CHF 1.4 billion recorded in 2002. The wholesale intermediary fund business reported a net new money outflow of CHF 5.0 billion in 2003 compared with an outflow of CHF 6.3 billion in 2002. The net outflow in 2003 was entirely attributable to outflows in money market funds related to the launch of UBS Bank USA, a new unit of the Wealth Management USA business. Before the bank’s launch in third quarter 2003, private-client cash balances in the US were swept into money market funds. Now they are redirected automatically into FDIC-insured deposit accounts.
Investment Bank
Investment Banking & Securities
55
Table of Contents
2003 Financials
Private Equity
In full-year 2003, Private Equity posted a pre-tax loss of CHF 189 million - a marked improvement on the pre-tax loss of CHF 1,761 million in 2002, reflecting lower levels of writedowns and a number of successful exits in 2003. Writedowns in 2003 totaled CHF 353 million, compared to CHF 1.7 billion in 2002.
Wealth Management USA
Including acquisition costs (goodwill amortization, net goodwill funding and retention payments), Wealth Management USA reported a pre-tax loss of CHF 5 million in 2003 compared to a loss of CHF 1,800 million a year earlier. Total operating income was CHF 5,182 million compared to CHF 5,548 million in 2002. Total operating expenses decreased 29% to CHF 5,187 million in 2003 from CHF 7,348 million in 2002.
56
Table of Contents
Sources of Information about UBS
Publications
This Annual Reviewis available in English, German, French, Italian, Spanish and Japanese. (SAP no. 80530-0401).
Handbook 2003 / 2004:Our Handbook 2003 / 2004 contains a detailed description of UBS, our strategy, organization, and businesses, as well as our financial management including credit, market and operational risk, our treasury processes, and details of our corporate governance. It is available in English and German. (SAP no. 80532-0401).
Financial Report 2003:Our Financial Report 2003 contains our audited Financial Statements for the year 2003 and related detailed analysis. It is available in English and German. (SAP no. 80531-0401).
Quarterly reports:We provide detailed quarterly financial reporting and analysis, including comment on the progress of our businesses and key strategic initiatives. These quarterly reports are available in English.
How to order reports:Each of these reports is available on the internet at: www.ubs.com/investors, in the “Financials” section. Alternatively, printed copies can be ordered, quoting the SAP number and the language preference where applicable, from UBS AG, Information Center, P.O. Box, CH-8098 Zurich, Switzerland.
Information tools for investors
Website:Our Investors and Analysts website at www.ubs.com/ investors offers a wide range of information about UBS, including financial information (including SEC filings), corporate information, share price graphs and data, an event calendar, dividend information and recent presentations given by senior management to investors at external conferences. Our internet-based information is available in English and German, with some sections also in French and Italian.
Messenger service:On the Investors and Analysts website, you can register to receive news alerts about UBS via Short Messaging System (SMS) or e-mail. Messages are sent in either English or German and users are able to state their preferences for the topics of the alerts received.
Results presentations:Senior management present UBS’s results every quarter. These presentations are broadcast live over the internet, and can be downloaded on demand. The most recent results webcasts can be found in the “Financials” section of our Investors and Analysts website.
UBS and the environment:The Handbook 2003 / 2004 contains a summary of UBS environmental policies as part of the Corporate Responsibility section. More detailed information is available at: www.ubs.com/environment
Form 20-F and other submissions to the US Securities and Exchange Commission
We file periodic reports and submit other information about UBS to the US Securities and Exchange Commission (SEC). Principal among these filings is the Form 20-F, our Annual Report filed pursuant to the US Securities Exchange Act of 1934.
Our Form 20-F filing is structured as a “wrap-around” document. Most sections of the filing are satisfied by referring to parts of this Handbook 2003 / 2004 or to parts of the Financial Report 2003. However, there is a small amount of additional information in the Form 20-F which is not presented elsewhere, and is particularly targeted at readers in the US. You are encouraged to refer to this additional disclosure.
You may read and copy any document that we file with the SEC on the SEC’s website, www.sec.gov, or at the SEC’s public reference room at 450 Fifth Street NW, Washington, DC, 20549. Please call the SEC at 1-800-SEC-0330 (in the US) or at +1-202-942 8088 (outside the US) for further information on the operation of its public reference room. You may also inspect our SEC reports and other information at the New York Stock Exchange, Inc., 20 Broad Street, New York, NY 10005. Much of this additional information may also be found on the UBS website at www.ubs.com/investors, and copies of documents filed with the SEC may be obtained from UBS’s Investor Relations team, at the addresses shown on page 58.
Corporate information
The legal and commercial name of the company is UBS AG. The company was formed on 29 June 1998, when Union Bank of Switzerland (founded 1862) and Swiss Bank Corporation (founded 1872) merged to form UBS. UBS AG is incorporated and domiciled in Switzerland and operates under Swiss Company Law and Swiss Federal Banking Law as an Aktiengesell-schaft, a corporation that has issued shares of common stock to investors.
The addresses and telephone numbers of our two registered offices are: Bahnhofstrasse 45, CH-8098 Zurich, Switzerland, Phone +41-1-234 11 11; and Aeschenvorstadt 1, CH-4051 Basel, Switzerland, Phone +41-61-288 20 20. UBS AG shares are listed on the SWX Swiss Exchange (traded through its trading platform virt-x), on the New York Stock Exchange and on the Tokyo Stock Exchange.
57
Table of Contents
Contacts
Switchboards | Zurich | +41-1-234 11 11 | ||||||
| For all general queries. | London | +44-20-7568 0000 | ||||||
| New York | +1-212-821 3000 | |||||||
| Hong Kong | +852-2971 8888 | |||||||
Investor Relations | Zurich | |||||||
| Our Investor Relations team supports institutional, professional and retail investors from offices in Zurich and New York. | Hotline Christian Gruetter Cate Lybrook Oliver Lee Fax | +41-1-234 41 00 +41-1-234 43 60 +41-1-234 22 81 +41-1-234 27 33 +41-1-234 34 15 | UBS AG Investor Relations P.O. Box CH-8098 Zurich, Switzerland | |||||
| www.ubs.com/investors | ||||||||
| New York | ||||||||
| Hotline | +1-212-713 3641 | UBS Americas Inc. | ||||||
| Christopher McNamee | +1-212-713 3091 | Investor Relations | ||||||
| Fax | +1-212-713 1381 | 135 W. 50th Street, 10th Floor New York, NY 10020, USA | ||||||
| sh-investorrelations@ubs.com | ||||||||
Group Media Relations | Zurich | +41-1-234 85 00 | sh-gpr@ubs.com | |||||
| Our Media Relations team supports global media and journalists from offices in Zurich, London, New York and Hong Kong. | London New York Hong Kong | +44-20-7567 4714 +1-212-713 8391 +852-2971 8200 | ubs-media-relations@ubs.com mediarelations-ny@ubs.com sh-mediarelations-ap@ubs.com | |||||
| www.ubs.com/media | ||||||||
Shareholder Services | Hotline | +41-1-235 62 02 | UBS AG | |||||
| UBS Shareholder Services, a unit of the Company Secretary, is responsible for the registration of the Global Registered Shares. | Fax | +41-1-235 31 54 | Shareholder Services P.O. Box CH-8098 Zurich, Switzerland | |||||
| sh-shareholder-services@ubs.com | ||||||||
US Transfer Agent | calls from the US | +1-866-541 9689 | Mellon Investor Services | |||||
| For all Global Registered Share-related queries in the USA. | calls outside the US Fax | +1-201-329 8451 +1-201-296 4801 | Overpeck Centre 85 Challenger Road Ridgefield Park, NJ 07660, USA | |||||
| www.melloninvestor.com | ||||||||
| shrrelations@melloninvestor.com | ||||||||
58
Table of Contents
Cautionary statement regarding forward-looking statements
Imprint
Publisher/Copyright: UBS AG, Switzerland
Languages: English, German, French, Italian, Spanish
SAP-No. 80530E-0401
59
Table of Contents
| P.O. Box, CH-8098 | ||||
| Zurich P.O. Box, | ||||
| CH-4002 Basel | ||||
| www.ubs.com |
60
Table of Contents
SIGNATURES
Pursuant to the requirements of the Securities Exchange Act of 1934, the registrant has duly caused this report to be signed on its behalf by the undersigned, thereunto duly authorized.
| UBS AG |
| By: | /s/ Robert Dinerstein |
| Name: Robert Dinerstein | |
| Title: Managing Director |
| By: | /s/ Per Dyrvik |
| Name: Per Dyrvik | |
| Title: Managing Director |
Date: March 17, 2004