Table of Contents
SECURITIES AND EXCHANGE COMMISSION
| o | REGISTRATION STATEMENT PURSUANT TO SECTION 12(b) OR (g) OF THE SECURITIES EXCHANGE ACT OF 1934 |
| þ | ANNUAL REPORT PURSUANT TO SECTION 13 OR 15(d) OF THE SECURITIES EXCHANGE ACT OF 1934 |
| o | TRANSITION REPORT PURSUANT TO SECTION 13 OR 15(d) OF THE SECURITIES EXCHANGE ACT OF 1934 |
| o | SHELL COMPANY REPORT PURSUANT TO SECTION 13 OR 15(d) OF THE SECURITIES EXCHANGE ACT OF 1934 |
(Jurisdiction of Incorporation or Organization)
CH-8001 Zurich, Switzerland
and
Aeschenvorstadt 1
CH-4051 Basel, Switzerland
(Address of Principal Executive Offices)
UBS AG
1285 Avenue of the Americas
New York, NY 10019
Telephone: (212) 713-3000
Fax: (212) 713-6211
(Name, Telephone, E-mail and/or Facsimile number and Address of Company Contact Person)
Table of Contents
Please see page 3.
Please see page 4.
Please see page 4.
| Yesþ | Noo |
15(d) of the Securities Exchange Act of 1934.
| Yeso | Noþ |
| Yesþ | Noo |
| Large accelerated filerþ | Accelerated filero | Non-accelerated filero |
| U.S. GAAPo | International Financial Reporting Standards as issued by the International Accounting Standards Boardþ | Othero |
| * | As of December 31, 2008, UBS had two outstanding mandatory convertible notes (“MCNs”), one in the face amount of CHF 13 billion and the other CHF 6 billion. Upon their conversion or settlement, these MCNs are expected to lead to the issuance of 270,438,942 and a maximum of 329,447,681 new shares out of conditional capital, respectively. |
-2-
Table of Contents
| Item 17o | Item 18o |
Yeso | Noþ |
-3-
Table of Contents
| Name of each exchange on | ||
| Title of each class | which registered | |
| Ordinary Shares (par value of CHF 0.10 each) | New York Stock Exchange | |
| $300,000,000 Floating Rate Noncumulative Trust Preferred Securities | New York Stock Exchange | |
| $300,000,000 Floating Rate Noncumulative Company Preferred Securities | New York Stock Exchange* | |
| $1,000,000,000 6.243% Noncumulative Trust Preferred Securities | New York Stock Exchange | |
| $1,000,000,000 6.243% Noncumulative Company Preferred Securities | New York Stock Exchange* | |
| Subordinated Guarantee of UBS AG with respect to each of the Noncumulative Company Preferred Securities above | New York Stock Exchange* | |
| $9,000,000 PPNs due April 2009 | NYSE Alternext US | |
| $6,900,000 PPNs due May 2009 | NYSE Alternext US | |
| $5,100,000 PPNs due September 2009 | NYSE Alternext US | |
| $24,223,000 PPNs due October 2009 | NYSE Alternext US | |
| $30,000,000 PPNs due April 2010 | NYSE Alternext US | |
| $31,000,000 PPNs due May 2010 | NYSE Alternext US | |
| $23,000,000 PPNs due June 2010 | NYSE Alternext US | |
| $10,000,000 PPNs due July 2010 | NYSE Alternext US | |
| $7,750,000 PPNs due August 2010 | NYSE Alternext US | |
| $12,660,000 PPNs due September 2010 | NYSE Alternext US | |
| $8,000,000 PPNs due November 2010 | NYSE Alternext US | |
| $17,842,000 PPNs due October 2011 | NYSE Alternext US | |
| $100,000,000 E-TRACS UBS Bloomberg CMCI Food ETN due April 2038 | NYSE Arca | |
| $50,000,000 E-TRACS UBS Bloomberg CMCI Agriculture ETN due April 2038 | NYSE Arca | |
| $50,000,000 E-TRACS UBS Bloomberg CMCI Energy ETN due April 2038 | NYSE Arca | |
| $100,000,000 E-TRACS UBS Bloomberg CMCI ETN due April 2038 | NYSE Arca | |
| $100,000,000 E-TRACS UBS Bloomberg Gold ETN due April 2038 | NYSE Arca | |
| $50,000,000 E-TRACS UBS Bloomberg CMCI Industrial Metals due April 2038 | NYSE Arca | |
| $50,000,000 E-TRACS UBS Bloomberg CMCI Livestock ETN due April 2038 | NYSE Arca | |
| $50,000,000 E-TRACS UBS Bloomberg CMCI Silver ETN due April 2038 | NYSE Arca | |
| $50,000,000 E-TRACS UBS Long Platinum ETN due May 2018 | NYSE Arca | |
| $50,000,000 E-TRACS UBS Short Platinum ETN due May 2018 | NYSE Arca |
| * Not for trading, but solely in connection with the registration of the corresponding Trust Preferred Securities. |
-4-
Table of Contents
-5-
| Page | ||||||||
| 7 | ||||||||
| 9 | ||||||||
| 9 | ||||||||
| 9 | ||||||||
| 9 | ||||||||
| 9 | ||||||||
| 10 | ||||||||
| 11 | ||||||||
| 12 | ||||||||
| 13 | ||||||||
| 13 | ||||||||
| 15 | ||||||||
| 24 | ||||||||
| 24 | ||||||||
| 25 | ||||||||
| 25 | ||||||||
| 25 | ||||||||
| 25 | ||||||||
| 25 | ||||||||
| 25 | ||||||||
| 25 | ||||||||
| 25 | ||||||||
| 26 | ||||||||
| 26 | ||||||||
| 26 | ||||||||
| 26 | ||||||||
| 26 | ||||||||
| 26 | ||||||||
| 26 | ||||||||
| 26 | ||||||||
| 28 | ||||||||
| 29 | ||||||||
| EX-1.1: ARTICLES OF ASSOCIATION | ||||||||
| EX-1.2: ORGANIZATION REGULATIONS | ||||||||
| EX-7: STATEMENT REGARDING RATIO OF EARNINGS TO FIXED CHARGES | ||||||||
| EX-12: CERTIFICATIONS | ||||||||
| EX-13: CERTIFICATIONS | ||||||||
| EX-15: CONSENT OF ERNST & YOUNG LTD | ||||||||
-6-
Table of Contents
-7-
Table of Contents
-8-
Table of Contents
| Item 1. | Identity of Directors, Senior Management and Advisors. |
| Item 2. | Offer Statistics and Expected Timetable. |
| Item 3. | Key Information. |
| Item 4. | Information on the Company. |
| 1-3 | Please seeCorporate Informationon page 6 of the Annual Report 2008. | |
| 4-6 | Please seeThe Making of UBSon page 18 andKey factors affecting UBS’s financial positions and results of operations in 2008on pages 29 to 30 of the Strategy, performance and responsibility report. | |
| 7 | None. |
| 1, 2, 5, 7 | Please refer to the UBS business divisions and Corporate Center report on pages 74 to 76 with respect to Global Wealth Management & Business Banking, pages 77 to 79 with respect to Wealth Management International & Switzerland, pages 83 to 85 with respect to Wealth Management US, pages 89 to 90 with respect to Business Banking Switzerland, pages 94 to 98 with respect to Global Asset Management, pages 102 to 104 with respect to the Investment Bank, and |
-9-
Table of Contents
| pages 110 to 112 with respect to the Corporate Center. For a breakdown of revenues by category of activity and geographic market for each of the last three financial years, please refer to Notes 2a and 2b to the Financial information reportSegment Reporting by Business Divisionon pages 281 to 287 andSegment Reporting by Geographic Locationon page 288. | ||
| 3 | Please refer toSeasonal Characteristicson page 30 of the Strategy, performance and responsibility report. | |
| 4 | Not applicable. | |
| 6 | Please see Item 10.C of this Form 20-F. | |
| 8 | Please seeRegulation and Supervisionon pages 218 to 220 of the Corporate governance and compensation report. |
| Item 4.A. | Unresolved Staff Comments. |
| Item 5. | Operating and Financial Review and Prospects. |
-10-
Table of Contents
| Item 6. | Directors, Senior Management and Employees. |
| 1, 2, 3 | Please see pages 199 to 202 and pages 206 to 209 of the Corporate governance and compensation report. | |
| 4 and 5 | None. |
| 1 | Please see pages 225 to 234 ofCompensation, shareholdings and loansin the Corporate governance and compensation report and also Note 31 to the Financial StatementsEquity Participation and Other Compensation Planson pages 339 to |
-11-
Table of Contents
| 343 and Note 32 to the Financial StatementsRelated Partieson pages 344 to 346 of the Financial information report. | ||
| 2 | Please see Note 30 to the Financial StatementsPension and Other Post-Employment Benefits Planson pages 333 to 338 of the Financial information report. |
| 1 | Please see pages 199 to 202 and pages 206 to 209 in the Corporate governance and compensation report. | |
| 2 | Please see pages 226 to 228 ofCompensation, shareholdings and loansin the Corporate governance and compensation report and Note 32 to the Financial StatementsRelated Partieson pages 344 to 346 of the Financial Information report. | |
| 3 | Please seeAudit committeeon page 203 andHuman resources and compensation committeeon pages 203 to 204 of the Corporate governance and compensation report. |
| Item 7. | Major Shareholders and Related Party Transactions. |
-12-
Table of Contents
| Item 8. | Financial Information. |
| Item 9. | The Offer and Listing. |
| 1, 2, 3, 5, 6, 7 | Not required because this Form 20-F is filed as an annual report. | |
| 4 | Please seeStock exchange priceson page 175 of the Risk and treasury management report. |
-13-
Table of Contents
-14-
Table of Contents
| Item 10. | Additional Information. |
-15-
Table of Contents
| • | amendments to the Articles; |
| • | elections of directors and statutory auditors; |
| • | approval of the annual report and the consolidated statements of accounts; |
| • | approval of the annual financial statements and the resolution on the use of the balance sheet profit (declaration of dividend); |
| • | decisions to discharge directors and management from liability for matters disclosed to the shareholders’ meeting; and |
| • | passing resolutions on matters which are by law or by the Articles reserved to the shareholders’ meeting (e.g., the ordering of an independent investigation into the specific matters proposed to the shareholders’ meeting). |
-16-
Table of Contents
| • | change the limits on BoD size in the Articles; |
| • | remove one fourth or more of the members of the BoD; or |
| • | delete or modify the above supermajority voting requirements. |
| • | a change in our stated purpose in the Articles; |
| • | the creation of shares with privileged voting rights; |
| • | a restriction of transferability; |
| • | an increase in authorized capital; |
| • | an increase of capital out of equity against contribution in kind, for the purpose of acquisition and granting of special rights; |
| • | changes to pre-emptive rights; |
| • | a change of domicile of the corporation; or |
| • | dissolution of the corporation without liquidation. |
-17-
Table of Contents
-18-
Table of Contents
-19-
Table of Contents
| • | a citizen or resident of the United States, |
| • | a domestic corporation or other entity taxable as a corporation, |
| • | an estate, the income of which is subject to U.S. federal income tax without regard to its source, or |
-20-
Table of Contents
| • | a trust, if a court within the United States is able to exercise primary supervision over the administration of the trust and one or more U.S. persons have the authority to control all substantial decisions of the trust. |
-21-
Table of Contents
-22-
Table of Contents
-23-
Table of Contents
| Item 11. | Quantitative and Qualitative Disclosures About Market Risk. |
report.
| Item 12. | Description of Securities Other than Equity Securities. |
-24-
Table of Contents
| Item 13. | Defaults, Dividend Arrearages and Delinquencies. |
| Item 14. | Material Modifications to the Rights of Security Holders and Use of Proceeds. |
| Item 15. | Controls and Procedures. |
| Item 15.T. | Controls and Procedures. |
| Item 16.A. | Audit Committee Financial Expert. |
| Item 16.B. | Code of Ethics. |
| Item 16.C. | Principal Accountant Fees and Services. |
-25-
Table of Contents
| Item 16.D. | Exemptions from the Listing Standards for Audit Committee. |
| Item 16.E. | Purchases of Equity Securities by the Issuer and Affiliated Purchasers. |
| Item 16.F. | Change in Registrant’s Certifying Accountant. |
| Item 16.G. | Corporate Governance. |
| Item 17. | Financial Statements. |
| Item 18. | Financial Statements. |
| Item 19. | Exhibits. |
| Exhibit | ||
| Number | Description | |
| 1.1. | Articles of Association of UBS AG. | |
| 1.2. | Organization Regulations of UBS AG. | |
| 2(b). | Instruments defining the rights of the holders of long-term debt issued by UBS AG and its subsidiaries. We agree to furnish to the SEC upon request, copies of the instruments, including indentures, defining the rights of the holders of our long-term debt and of our subsidiaries’ long-term debt. | |
| 7. | Statement regarding ratio of earnings to fixed charges. | |
| 8. | Significant Subsidiaries of UBS AG. Please see Note 34 to the Financial StatementsSignificant Subsidiaries and Associateson pages 347 to 350 of the Financial information report. |
-26-
Table of Contents
| Exhibit | ||
| Number | Description | |
| 12. | The certifications required by Rule 13(a)-14(a) (17 CFR 240.13a-14(a)). | |
| 13. | The certifications required by Rule 13(a)-14(b) (17 CFR 240.13a-14(b)) and Section 1350 of Chapter 63 of Title 18 of the U.S. Code (18 U.S.C. 1350). | |
| 15. | Consent of Ernst & Young Ltd. |
-27-
Table of Contents
| UBS AG | ||||
| /s/ Oswald Grübel | ||||
| Name: | Oswald Grübel | |||
| Title: | Group Chief Executive Officer | |||
| Date: March 11, 2009 | /s/ John Cryan | |||
| Name: | John Cryan | |||
| Title: | Group Chief Financial Officer | |||
-28-
Table of Contents
| Exhibit | ||
| Number | Description | |
| 1.1. | Articles of Association of UBS AG.* | |
| 1.2. | Organization Regulations of UBS AG.* | |
| 2(b). | Instruments defining the rights of the holders of long-term debt issued by UBS AG and its subsidiaries. We agree to furnish to the SEC upon request, copies of the instruments, including indentures, defining the rights of the holders of our long-term debt and of our subsidiaries’ long-term debt. | |
| 7. | Statement regarding ratio of earnings to fixed charges.* | |
| 8. | Significant Subsidiaries of UBS AG. Please see Note 34 to the Financial StatementsSignificant Subsidiaries and Associateson pages 347 to 350 of the Financial information report. | |
| 12. | The certifications required by Rule 13(a)-14(a) (17 CFR 240.13a-14(a)).* | |
| 13. | The certifications required by Rule 13(a)-14(b) (17 CFR 240.13a-14(b)) and Section 1350 of Chapter 63 of Title 18 of the U.S. Code (18 U.S.C. 1350).* | |
| 15. | Consent of Ernst & Young Ltd.* |
| * | Filed as exhibit herewith |
-29-
Table of Contents
annual report
2008
1 | Strategy, performance and responsibility
2 | UBS business divisions and Corporate Center
3 | Risk and treasury management
4 | Corporate governance and compensation
5 | Financial information

Table of Contents
Table of Contents
Contents
1
Table of Contents
Annual Report 2008
Letter to shareholders
Dear Shareholders,
UBS recorded a net loss attributable to shareholders of CHF 20.9 billion in 2008. This extremely poor result stemmed primarily from the results of the fixed income trading business of the Investment Bank, mainly due to losses and writedowns on exposures related to US real estate and other credit positions. The loss has affected all stakeholders in UBS: in 2008, in US dollar terms, shareholders suffered a 58% fall in market capitalization, compared with the average 47% decline of the other members of the Dow Jones Banks Titans 30 Index; the total number of employees was reduced by 7%; and employee compensation was cut 36%. Clients have, understandably, expressed to us their disappointment about our losses, while at the same time stressing their appreciation for the advice and service levels they receive from their advisors.
In 2008, we focused on addressing our structural and strategic weaknesses and on establishing the long-term financial stability of UBS.Activities centered on the key areas we identified as requiring change: corporate governance, risk management and control processes, the liquidity and funding framework and management compensation. As a result, 2008 saw the introduction of new organization regulations to clarify the responsibilities of the Board of Directors (BoD) and the Group Executive Board (GEB), the establishment of an Executive Committee (EC) to allocate and monitor the use of capital and risk in each of the business divisions, and the formation of a dedicated BoD risk committee. We also merged the credit and market risk functions of the Investment Bank into a single unit led by the newly es-
tablished Chief Risk Officer position and a new liquidity and funding framework was introduced that requires each business division to be charged market-based rates for funding from other UBS divisions. We will continue to make changes in 2009, including the implementation of a new compensation model for senior executives that aligns compensation with the creation of sustainable results for shareholders. In addition, management compensation within business divisions will be based largely on divisional results and the responsible and independent management of each division’s resources and balance sheet.
Changes in our business divisions will play a vital role in the transformation of our firm.As announced on 10 February 2009, UBS now operates with four business divisions and a Corporate Center. The former Global Wealth Management & Business Banking division has been split into two business divisions: Wealth Management & Swiss Bank and Wealth Management Americas. We will continue to reposition the Investment Bank as a client-orientated and fee- and commission-earning business – in other words, the Investment Bank is moving away from the proprietary trading business that adversely affected our capital. A new unit has been established within the Investment Bank to manage the positions of those fixed income businesses we have decided to exit.
We took active steps to increase the financial stability of UBS in 2008.The issuance of two Mandatory Convertible Notes (MCNs) and a rights issue raised CHF 34.6 billion of new capital. During the year, our total balance sheet was reduced 11% to CHF 2,015 billion, risk-weighted assets fell 19% to CHF 302.3 billion and our identified risk concentrations fell sharply – with these reductions assisted by an agreement made in 2008 to sell a large portfolio of illiquid securities and other positions to a fund owned and controlled by the Swiss National Bank. Operating expenses fell 19% and the year-end tier 1 ratio was 11.0%, compared with 9.1% for year-end 2007 under the different standards that were then applicable under Basel I.
As announced on 18 February 2009, UBS settled a US cross-border case with the US Department of Justice (DOJ) and the US Securities and Exchange Commission (SEC) by entering into a Deferred Prosecution Agreement (DPA) with the DOJ and a Consent Order with the SEC.As part of these agreements, we will complete our previously announced exit of our US cross-border business and implement an enhanced program of internal controls to
2
Table of Contents

3
Table of Contents
Annual Report 2008
ensure compliance with the Qualified Intermediary Agreement with the Internal Revenue Service. In addition, pursuant to an order issued by the Swiss Financial Market Supervisory Authority, information was transferred to the DOJ regarding accounts of certain US clients as set forth in the DPA, who, based on evidence available to UBS, committed tax fraud or the like within the meaning of the Swiss-US Double Taxation Treaty. The total cost for the settlement of USD 780 million has been fully charged to our 2008 results. This episode makes it particularly clear that our control framework must be extremely robust and that employee incentives must be aligned with risk management and control and the creation of long-term value for shareholders.
Outlook –The recent worsening of financial conditions and UBS-specific factors have adversely affected our results, particularly in the Investment Bank. Even after substantial risk reduction, our balance sheet remains exposed to illiquid and
volatile markets and our earnings will therefore remain at risk for some time to come. Net new money remains positive for our Wealth Management Americas division, but this is being partially offset by net outflows in Wealth Management & Swiss Bank. Global Asset Management has also experienced further net outflows.
11 March 2009
UBS
 |  | |
| Peter Kurer | Oswald J. Gruebel | |
| Chairman | Group Chief Executive Officer |
4
Table of Contents
UBS reporting at a glance
Annual publications
Annual report (SAP no. 80531)
| – | UBS’s strategy, performance and responsibility; | |
| – | the strategy and performance of the business divisions and the Corporate Center; | |
| – | risk, treasury and capital management at UBS; | |
| – | corporate governance and executive compensation; and | |
| – | financial information, including the financial statements. |
Review (SAP no. 80530)
Compensation report (SAP no. 82307)
Quarterly publications
Letter to shareholders
Financial report (SAP no. 80834)
How to order reports
The annual and quarterly publications are available in PDF format on the internet atwww.ubs.com/investors/topicsin the reporting section. Printed copies can be ordered from the services section of the website. Alternatively, they can be ordered by quoting the SAP number and the language preference where applicable, from UBS AG, Information Center, P.O. Box, CH-8098 Zurich, Switzerland.
5
Table of Contents
Annual Report 2008
Other sources of information
Website
Result presentations
playback of the most recent presentation is downloadable
atwww.ubs.com/presentations.
Messaging service / UBS news alert
Form 20-F and other submissions to the US Securities and Exchange Commission
UBS files periodic reports and submits other information about UBS to the US Securities and Exchange Commission (SEC). Principal among these filings is the annual report on Form 20-F, filed pursuant to the US Securities Exchange Act of 1934.
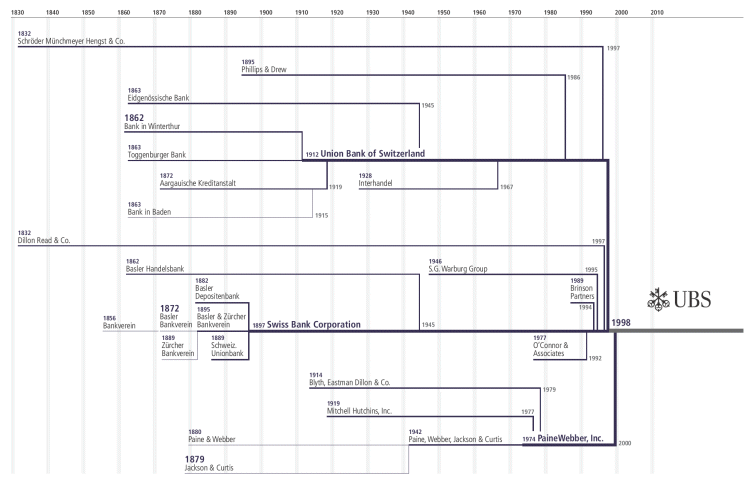
The legal and commercial name of the company is UBS AG. The company was formed on 29 June 1998, when Union Bank of Switzerland (founded 1862) and Swiss Bank Corporation (founded 1872) merged to form UBS.
under Swiss Company Law and Swiss Federal Banking Law as an Aktieng-esellschaft, a corporation that has issued shares of common stock to investors.
and Aeschenvorstadt 1, CH-4051 Basel, Switzerland, phone +41-61-288 2020. UBS AG shares are listed on the SIX Swiss Exchange (traded through its trading platform SWX Europe, formerly virt-x), on the New York Stock Exchange (NYSE) and on the Tokyo Stock Exchange (TSE).
6
Table of Contents
Contacts
Switchboards
| For all general queries. | Zurich | +41-44-234 1111 | ||||
| London | +44-20-7568 0000 | |||||
| New York | +1-212-821 3000 | |||||
| Hong Kong | +852-2971 8888 | |||||
Investor Relations
| UBS’s Investor Relations team supports | Hotline | +41-44-234 4100 | UBS AG | |||
| institutional, professional and retail | ||||||
| investors from our offices in Zurich | New York | +1-212-882 5734 | Investor Relations | |||
| and New York. | ||||||
| Fax (Zurich) | +41-44-234 3415 | P.O. Box | ||||
| www.ubs.com/investors | CH-8098 Zurich, Switzerland | |||||
| sh-investorrelations@ubs.com | ||||||
Media Relations
| UBS’s Media Relations team supports | Zurich | +41-44-234 8500 | mediarelations@ubs.com | |||
| global media and journalists from | ||||||
| offices in Zurich, London, New York | London | +44-20-7567 4714 | ubs-media-relations@ubs.com | |||
| and Hong Kong. | ||||||
| New York | +1-212-882 5857 | mediarelations-ny@ubs.com | ||||
| www.ubs.com/media | Hong Kong | +852-2971 8200 | sh-mediarelations-ap@ubs.com | |||
Shareholder Services
| UBS Shareholder Services, a unit of the | Hotline | +41-44-235 6202 | UBS AG | |||
| Company Secretary, is responsible for | ||||||
| the registration of the global registered | Fax | +41-44-235 3154 | Shareholder Services | |||
| shares. | ||||||
| P.O. Box | ||||||
| CH-8098 Zurich, Switzerland | ||||||
| sh-shareholder-services@ubs.com | ||||||
US Transfer Agent
| For all global registered share-related | Calls from the US | +866-541 9689 | BNY Mellon Shareowner Services | |||
| queries in the US. | ||||||
| Calls outside the US | +1-201-680 6578 | 480 Washington Boulevard | ||||
| www.melloninvestor.com | Fax | +1-201-680 4675 | Jersey City, NJ 07310, USA | |||
| sh-relations@melloninvestor.com | ||||||
7
Table of Contents
Table of Contents
Table of Contents
Strategy and performance
| – | UBS is a global firm providing financial services to private, corporate and institutional clients | ||
| – | Its strategy is to concentrate on three global core businesses – wealth management, asset management and investment banking – and retail and corporate banking services in Switzerland |
UBS’s strategic priorities
Client focus
UBS’s purpose is to serve clients and give them confidence in making financial decisions. Whether it serves individual, corporate or institutional clients, UBS puts their success and interests first and strives to truly understand their goals. As client needs and the financial services industry constantly evolve, UBS makes a systematic effort to capture client feedback, identify potential for improvement and adapt its offerings accordingly.
Profitable growth and earnings quality
UBS shareholders expect the firm to achieve profitable growth. Fulfilling this expectation requires UBS to establish sustainable earning streams based on client benefit. It therefore strives to build a strong and growing client base and to continuously develop its unique assets and capabilities.
Risk and capital management
Taking, managing and controlling risk is a core element of UBS’s business activities. UBS’s aim is not, therefore, to eliminate all risks, but to achieve an appropriate balance between risk and return. Risk reduction and capital measures taken in 2008 aimed at maintaining UBS’s capital strength as a source of competitive advantage. Adapting risk exposures to the current market environment and managing UBS’s balance sheet remain strategic priorities for the firm.
Measures taken in 2008
In August 2008, UBS launched a comprehensive program to help the firm adjust to the new realities in the financial industry. It aims to capitalize on the strengths inherent in its leading client franchises across its business divisions, to further grow these franchises, and to address certain weaknesses in its business model that had become apparent both before and as a result of the financial crisis.
A significant reduction in risk exposures has been achieved during the year.UBS reduced its risk positions very significantly during the year, including through a transaction with the Swiss National Bank. UBS also took several measures to strengthen its risk organization.
The Investment Bank is in the process of repositioning itself toward client-driven growth,combined with a further reduction of its balance sheet and risk positions.
UBS has implemented new corporate governance guidelines,actively reinforcing a clear separation of the roles and responsibilities of the Board of Directors and its committees, from those of the Group Executive Board.
Senior management compensation has been reviewed.In November 2008, UBS announced the new compensation model that is directly aligned with sustainable value creation within each manager’s area of responsibility, and incorporates a longer performance evaluation horizon.
Table of Contents
| UBS financial highlights | ||||||||||||||||
| For the year ended | % change from | |||||||||||||||
| CHF million, except where indicated | 31.12.08 | 31.12.07 | 31.12.06 | 31.12.07 | ||||||||||||
Performance indicators from continuing operations | ||||||||||||||||
Diluted earnings per share (CHF)1 | (7.60 | ) | (2.61 | ) | 4.64 | (191 | ) | |||||||||
Return on equity attributable to UBS shareholders (%)2 | (57.9 | ) | (11.7 | ) | 23.9 | (395 | ) | |||||||||
Cost/income ratio (%)3 | 680.4 | 111.0 | 70.5 | |||||||||||||
Net new money (CHF billion)4 | (226.0 | ) | 140.6 | 151.7 | ||||||||||||
Group results | ||||||||||||||||
| Operating income | 1,201 | 31,721 | 47,484 | (96 | ) | |||||||||||
| Operating expenses | 28,555 | 35,463 | 33,365 | (19 | ) | |||||||||||
| Operating profit before tax (from continuing and discontinued operations) | (27,155 | ) | (3,597 | ) | 15,007 | (655 | ) | |||||||||
| Net profit attributable to UBS shareholders | (20,887 | ) | (5,247 | ) | 11,527 | (298 | ) | |||||||||
Personnel (full-time equivalents)5 | 77,783 | 83,560 | 78,140 | (7 | ) | |||||||||||
| Invested assets (CHF billion) | 2,174 | 3,189 | 2,989 | (32 | ) | |||||||||||
UBS balance sheet and capital management | ||||||||||||||||
Balance sheet key figures | ||||||||||||||||
| Total assets | 2,015,098 | 2,274,891 | 2,348,733 | (11 | ) | |||||||||||
| Equity attributable to UBS shareholders | 32,800 | 36,875 | 51,037 | (11 | ) | |||||||||||
Market capitalization6 | 43,519 | 108,654 | 154,222 | (60 | ) | |||||||||||
BIS capital ratios7 | ||||||||||||||||
| Tier 1 (%) | 11.0 | 9.1 | 8 | 12.2 | 8 | |||||||||||
| Total BIS (%) | 15.1 | 12.2 | 8 | 15.0 | 8 | |||||||||||
| Risk-weighted assets | 302,273 | 374,421 | 8 | 344,015 | (19 | ) | ||||||||||
Long-term ratings | ||||||||||||||||
| Fitch, London | A+ | AA | AA+ | |||||||||||||
| Moody’s, New York | Aa2 | Aaa | Aa2 | |||||||||||||
| Standard & Poor’s, New York | A+ | AA | AA+ | |||||||||||||
The 2008 results and the balance sheet in this report differ from those presented in UBS’s fourth quarter 2008 report issued on 10 February 2009 due to: (1) the settlement agreements with the US Department of Justice and Securities and Exchange Commission related to the US cross-border case, as described in the “Settlement regarding the US cross-border case” sidebar in the “Wealth Management International & Switzerland” section of this report; and (2) the determination by the Swiss National Bank (SNB) of the 30 September 2008 valuation of approximately USD 7.8 billion of securities not yet transferred by UBS to the SNB StabFund, as described in the “Transaction with the Swiss National Bank” sidebar in the “Strategy and structure” section of this report. The full effect of the settlement agreements, and all but approximately CHF 0.1 billion of the SNB pricing adjustment, are taken into account in UBS’s 2008 results and the balance sheet in this report. The total impact on net profit after tax was negative CHF 1,190 million.
Table of Contents
Strategy, performance and responsibility
Strategy and structure
Strategy and structure
UBS is a global firm providing financial services to private, corporate and institutional clients. Its strategy is to concentrate on three global core businesses – wealth management, asset management and investment banking – and to provide retail and corporate banking services in Switzerland. By delivering valuable advice, products and services to its clients, the firm aims to generate sustainable earnings and create value for its shareholders.
UBS strategy and business model
UBS has crafted its business strategy to benefit from one underlying global trend: the growth of wealth. Despite the current financial crisis, the firm believes that over the long term wealth creation will continue to be a prominent characteristic of the world economy. UBS’s three core businesses of wealth management, asset management and investment banking are geared to take advantage of this trend.
Wealth Management & Swiss Bank
UBS’s wealth management business caters to high net worth and affluent individuals around the world (except those served by Wealth Management Americas) whether they are investing internationally or in their home country. UBS offers these clients a complete range of tailored advice and investment services. Its Swiss Bank business provides a complete set of banking services for Swiss individual and corporate clients.
Wealth Management Americas
Wealth Management Americas offers sophisticated products and services specifically designed to address the needs of high net worth and affluent individuals. It includes Wealth Management US, domestic Canada, domestic Brazil and the international business booked in the United States.
Global Asset Management
As a worldwide asset manager, UBS offers innovative investment management solutions in nearly every asset class to
private, corporate and institutional clients, as well as through financial intermediaries. Investment capabilities include traditional assets (for instance equities, fixed income and asset allocation), alternative and quantitative investments (multi-manager funds, funds of hedge funds and hedge funds) and real estate.
Investment Bank
In the investment banking and securities businesses, UBS provides securities products and research in equities, fixed income, rates, foreign exchange and metals. It also provides advisory services as well as access to the world’s capital markets for corporate, institutional, intermediary and alternative asset management clients.
| è | Refer to the “Reporting structure” and “UBS business divisions and Corporate Center” sections of this report for more information on UBS’s business divisions and the Corporate Center |
UBS competitive profile
UBS’s current business mix is a result of many decades of development, internal growth initiatives and acquisitions. Since 1998, UBS has progressively divested non-core businesses and participations, and invested in growing its core businesses and creating a balanced reach worldwide.
12
Table of Contents
Strategy, performance and responsibility |
UBS corporate governance
As mandated by Swiss banking law, UBS operates under a strict dual board structure comprising the Board of Directors (BoD) and the Group Executive Board (GEB).
| è | Refer to the “Corporate governance” section of this report for more information |
UBS’s strategic priorities
Client focus
UBS’s purpose is to serve clients and give them confidence in making financial decisions. Whether it serves individual, corporate or institutional clients, UBS puts their success and interests first and strives to truly understand their goals. As client needs and the financial services industry constantly evolve, UBS makes a systematic effort to capture client feedback, identify potential for improvement and adapt its offerings accordingly.
Profitable growth and earnings quality
UBS shareholders expect the firm to achieve profitable growth. Fulfilling this expectation requires UBS to establish sustainable earning streams based on client benefit. It therefore strives to
build a strong and growing client base and to continuously develop its unique assets and capabilities.
Risk and capital management
Taking, managing and controlling risk is a core element of UBS’s business activities. UBS’s aim is not, therefore, to eliminate all risks, but to achieve an appropriate balance between risk and return. Risk reduction and capital measures taken in 2008 aimed at maintaining UBS’s capital strength as a source of competitive advantage. Adapting risk exposures to the current market environment and managing UBS’s balance sheet remain strategic priorities for the firm.
| è | Refer to the “Risk and treasury management” section of this report for more information on risk and capital management |
Business divisions’ franchises
UBS continues to develop the platform and reach of the business divisions known since 10 February 2009 asWealth Management & Swiss BankandWealth Management Americas. This includes the expansion of its global presence in international wealth management growth markets. UBS’s leading position in Switzerland, both as a wealth manager and as the largest retail bank, will remain a cornerstone of UBS’s strategy and a source of sustainable profit growth.
| è | Refer to the “UBS business divisions and Corporate Center” section of this report for more information on UBS’s business divisions and the Corporate Center |
13
Table of Contents
Strategy, performance and responsibility
Strategy and structure
Measures taken
In August 2008, UBS launched a comprehensive program to re-engineer its businesses and to adjust to the new realities in the financial industry. It aims to capitalize on the strengths inherent in its leading client franchises across its business divisions, to further grow these franchises, and to address certain weaknesses in its business model that had become apparent both before and as a result of the financial crisis.
Executive governance
Controls have been improved and accountability and transparency increased at the level of top management. One result has been the creation of an Executive Committee to allocate and continuously monitor the use of capital and risk in each of the business divisions. Other wide-ranging changes to the Group’s governance have been proposed and implemented. Refer to the “Corporate governance” section of this report for more information on corporate governance.
Liquidity and funding framework
The business divisions have been incentivized to manage their balance sheets with greater autonomy and responsibility. A new liquidity and funding concept has been approved and is being implemented. Refer to the “Liquidity and funding management” section of this report for more information on liquidity and funding.
Senior management compensation
Senior management compensation is now aligned to sustainable value creation within each manager’s area of responsibility and a longer performance evaluation horizon has been introduced. UBS announced a new compensation model for senior executives in November 2008 (effective 1 January 2009). Refer to the “Compensation, shareholdings and loans” section of this report for more information on senior management compensation.
Transformation of UBS’s wealth management business
As announced on 10 February 2009, Global Wealth Management & Business Banking has been divided into two new business divisions: Wealth Management & Swiss Bank and Wealth Management Americas.
14
Table of Contents
Strategy, performance and responsibility |
Key performance indicators: 2009 and beyond
UBS uses key performance indicators (KPIs) to monitor the firm’s performance and the delivery of returns to shareholders. Until the end of 2008, UBS focused on four KPIs at the Group level, as described in the discussion of performance measures in the “Measurement and analysis of performance” section of this report. In response to the changing market environment, UBS conducted a detailed review of its KPI framework in 2008. The objective of this review was to adjust these indicators – which are used by the firm to evaluate its economic performance as a whole and the contribution of individual employ-
ees to that performance – to more closely reflect the firm’s strategic priorities.
| Key performance indicators | ||||||||
| Wealth Management & | Wealth Management | |||||||
| Group | Swiss Bank | Americas | Investment Bank | Global Asset Management | ||||
Net profit growth | Pre-tax profit growth | Pre-tax profit growth | Pre-tax profit growth | Pre-tax profit growth | ||||
Cost / income ratio | Cost / income ratio | Cost / income ratio | Cost / income ratio | Cost / income ratio | ||||
| Gross margin (RoIA)1 | Gross margin (RoIA) | Gross margin (RoIA) | ||||||
Return on equity (RoE) | Return on attributed equity | |||||||
Return on assets, gross | Return on assets, gross | |||||||
Return on risk-weighted assets, gross | ||||||||
FINMA leverage ratio2 | ||||||||
| Impaired lending portfolio3 | Value at Risk4 | |||||||
Tier 1 ratio | ||||||||
Net new money rate | Net new money rate | Net new money rate | Net new money rate | |||||
Economic profit | ||||||||
15
Table of Contents
Strategy, performance and responsibility
Strategy and structure
Risk management in 2008
UBS entered 2008 with significant legacy risk positions which exceeded the firm’s risk bearing capacity. While UBS incurred substantial writedowns on its risk positions, it pursued an active risk reduction program through sales in 2008. Significant transactions included the sale in May of US residential mortgage-backed securities to a fund managed by BlackRock for proceeds of USD 15 billion and the agreement reached in October with the Swiss National Bank (SNB) (see details below).
UBS identified significant weaknesses in its risk management and control organization. In order to address these weaknesses, UBS launched an extensive remediation plan, which included the overhaul of its risk governance, significant changes to risk management and control personnel, as well as improvements in risk capture, risk representation and risk monitoring. Implementation of this plan is ongoing and remains a high priority for UBS.
As announced on 16 October 2008, the Swiss National Bank (SNB) and UBS reached an agreement to transfer illiquid securities and other positions from UBS’s balance sheet to a fund owned and controlled by the SNB. From the originally agreed USD 60 billion, the transaction size has been reduced to USD 38.6 billion (including the effect of price adjustments so far totaling USD 0.7 billion). With this transaction, UBS caps future potential losses from these assets, reduces its risk-weighted assets, materially de-risks its balance sheet and is no longer exposed to the funding risk of the assets to be transferred.
Transaction structure
The SNB will finance the fund with a loan in the amount of 90% of the purchase price to be paid by the fund, secured by the assets of the fund. 10% of the purchase price will be financed through an equity contribution by the SNB. The loan will be non-recourse to UBS and will be priced at LIBOR plus 250 basis points. The fund and loan facility will terminate in eight years, but the termination date may be extended to 10 or 12 years. The cash flow from the assets, including interest, rental income, principal repayments and proceeds from asset sales (net of expenses and working capital requirements),
will be applied to service the loan until full repayment.
Governance
In fourth quarter 2008, the fund was established under the name SNB StabFund as a Swiss limited partnership for collective investments. Its objective is to manage the acquired positions based on fundamental value considerations. The SNB StabFund is owned by a general partner and a limited partner,
both of which are wholly owned by the SNB. The general partner has a board of directors with five members, of which three are designated by the SNB and two by UBS.
Portfolio composition and size
The overall portfolio valuation of positions already transferred or still expected to be transferred to the SNB StabFund is USD 38.6 billion, as shown in the table opposite, subject to any further pricing adjustments. The SNB StabFund acquired a first tranche of 2,042 securities positions from UBS on 16 December 2008 for USD 16.4 billion. The remaining positions identified for sale to the fund are planned to be transferred in March 2009 in one or more additional transfers.
16
Table of Contents
Strategy, performance and responsibility |
Implications for UBS’s 2008
income statement
Issuance of MCNs to the
Swiss Confederation
In connection with the transaction with the SNB, UBS raised CHF 6 billion of new capital in the form of mandatory convertible notes (MCNs) convertible into UBS registered shares. These were placed with the Swiss Confederation and issued on 9 December 2008. Refer to the “Capital management” section of this report and “Note 26 Capital increases and mandatory convertible notes” in the financial statements of this report for more information.
| Positions affected by the transfer to the Swiss National Bank StabFund | ||||||||||||
| Valuation as of 30 September 2008 | ||||||||||||
| USD million | Priced | Not yet priced | Total | |||||||||
| US sub-prime | 4.0 | 1.6 | 5.6 | |||||||||
| US Alt-A | 1.5 | 0.8 | 2.4 | |||||||||
| US prime | 1.2 | 0.7 | 1.9 | |||||||||
| US reference-linked note program | 5.8 | 0.0 | 5.8 | |||||||||
| Commercial real estate | 3.4 | 2.3 | 5.7 | |||||||||
| Student loan-backed securities | 0.5 | 0.0 | 0.5 | |||||||||
| Other positions | 8.5 | 9.0 | 17.5 | |||||||||
| Price difference | (0.7 | ) | 1 | (0.7 | ) | |||||||
Total | 24.2 | 14.4 | 38.6 | |||||||||
17
Table of Contents
Strategy, performance and responsibility
The making of UBS
The making of UBS
All the firms that have come to make up today’s UBS look back on a long and diverse history. Both the two Swiss predecessor banks and PaineWebber Group Inc. (PaineWebber) came into being in the second half of the 19th century, while S.G. Warburg’s roots go back to 1934. But it was in the 1990s when UBS’s current identity began to form.
The next major move was in 1995, when SBC acquired S.G. Warburg, the British merchant bank. The deal helped to fill SBC’s strategic gaps in corporate finance, brokerage and research and, most importantly, brought with it an institutional client franchise, which is still crucial to today’s equities business.
| è | Refer to www.ubs.com/history for more information |
18
Table of Contents
Strategy, performance and responsibility |
19
Table of Contents
Strategy, performance and responsibility
Current market climate and industry drivers
Current market climate and industry drivers
The current crisis and its aftermath will have profound implications for the financial services industry and the world economy.
Market crisis and economic downturn
2008 was one of the most difficult years ever for the financial services industry. As the crisis deepened over the course of the year, the problems in the financial industry spread to other parts of the world economy. A precipitous drop in prices across most main asset classes, coupled with deleveraging, resulted in poorly functioning lending markets and a lack of inter-bank liquidity. Banks were forced to recapitalize, sometimes with the help of governments. Hopes that the crisis might be short-lived were dashed after the failure of one of the major US investment banks in mid-September, which resulted in very severe liquidity issues for many financial institutions. Banks experienced a scarcity of equity, credit supply further contracted and numerous countries fell into recession.
tries, sometimes very rapidly. Even countries which have not experienced high leverage growth and significant asset price increases have been affected as investment spending and exports dropped. In particular, countries which relied on foreign capital inflows (either to the government or to the private sector) are at risk of seeing foreign investment and exports fall, which could in turn hurt the value of their currency.
Macro economic perspectives
The macro economic outlook for 2009 is not positive. A modest recovery can be expected only if the measures taken by governments and central banks prove to be both effective and efficient. Few observers expect the financial services industry to rebound quickly from this crisis.
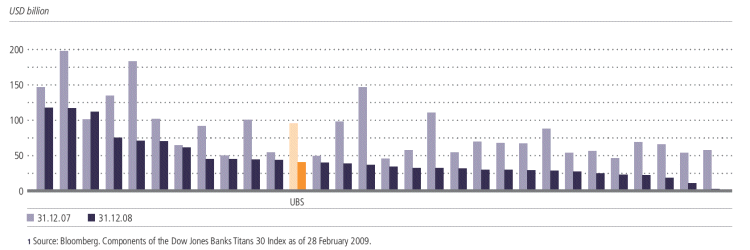
Market capitalization of the components of the Dow Jones Banks Titans 30 Index, 2008 versus 20071
20
Table of Contents
Strategy, performance and responsibility |
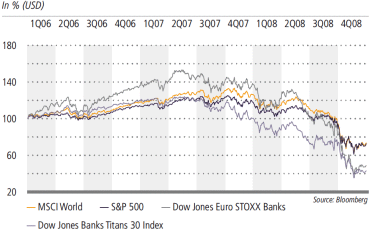
Stock market indices development
Industry drivers
A number of drivers are expected to have a significant impact on banks’ earnings and the structure of the financial services industry in the short to medium term. The most relevant factors are described below.
De-leveraging
The current downturn is different from previous ones not only in terms of its severity and wide geographical reach, but also in terms of the de-leveraging process that lies at its heart. De-leveraging is the process through which households, companies and the banks that intermediate between them simultaneously attempt to sell real and financial assets to pay back their debts. This unleashes two strong deflationary forces.
savings can provide opportunities for certain banks, risk aversion and the downward pressure it exerts on asset prices tend to reinforce each other.
Government intervention and re-regulation
The financial crisis has sparked heavy public intervention in the global financial system. State intervention packages have included a mix of capital injections by governments, public guarantees for selected bank liabilities such as deposits and commercial paper, and maximum loss guarantees for illiquid assets held in banks’ balance sheets. Governments have increasingly attached conditions to the measures they have taken, providing them the opportunity to at least temporarily influence the business activities of certain banks.
21
Table of Contents
Strategy, performance and responsibility
Current market climate and industry drivers
Client behavior and demand
The relationship between financial firms and their clients has seen accelerating change over the past couple of years, for example with the rise of increasingly sophisticated clients (such as leveraged finance investors and hedge funds). However, the corporate and institutional client segment as a whole is expected to continue requiring innovative solutions which cater to specific and unique needs, and span product groups and geographies.
Wealth preservation
The financial crisis has already resulted in a substantial destruction of wealth as the price of many real and financial assets has fallen from the peaks of 2007. Many investors see a risk of further wealth destruction in the current economic climate. During this phase business opportunities for the financial services industry will mostly be in the realm of value preservation rather than return maximization.
Retirement provisions
The economic crisis does not fundamentally alter the private retirement industry’s growth drivers, namely the demographic shift related to falling birth rates and aging and the falling coverage provided by public pension schemes. Despite the drop in the value of their assets in 2008, private fully funded schemes will continue providing individuals with the best investment tools to accumulate wealth for
retirement, and savings will continue to flow into them. The ability of public pension schemes to fund themselves over the long term may be limited as several countries are already heavily indebted and running large deficits, including some driven by measures taken to help their economy in the current downturn, while demographics indicate that the ratio of workers to retirees will decrease in the foreseeable future. In some countries, particularly those which have experienced the largest destruction of accumulated wealth due to the crisis (for example, the US and UK, where pension funds are comparatively more exposed to equity markets than in other countries), a pick-up in individual savings rates would provide additional funds, which will partly be invested in private retirement schemes. This, combined with continued demand for specialist advice in wealth management, continues to represent an opportunity for wealth and asset managers.
Corporate restructuring
The corporate sector is generally better equipped to deal with the negative impact of a slowing economy than in previous downturns, mostly due to a relatively lower level of debt. However, a sharp reduction in demand for goods and services across developed and emerging markets and a continued lack of liquidity in credit markets will inevitably impact the corporate sector. Over the medium term, default rates are expected to rise from the historically low levels prevailing before the crisis, and further major bankruptcies are likely. The internationalization of business – particularly expansion in emerging markets – is likely to slow down as the attractiveness of new markets remains subdued and cash flows previously available for expansion are used to restructure balance sheets. In such a corporate environment, most of the opportunities for the banking sector are likely to arise from simple financing requirements, balance-sheet restructuring and asset disposals.
Emerging markets
Strong growth in emerging markets has been a key feature of the boom years in the global economy prior to the crisis, and banks have benefited greatly from strong growth in these markets. Growth in emerging markets is expected to slow markedly in 2009, reflecting the increased interconnections between economies in the era of globalization. Export surplus countries, including those relying on commodities exports, are most vulnerable to a further deterioration in the global economic environment, but also best placed to benefit from a potential recovery. Over the long term, however, banks which have built up a significant presence in emerging markets and serve a wide range of institutional and private clients are likely to continue benefiting from above-average economic growth in these countries.
22
Table of Contents
Strategy, performance and responsibility |
Strategy, performance and responsibility
Risk factors
Risk factors
Certain risks, including those described below, can impact UBS’s ability to carry out its business strategies and directly affect its business activities, financial condition, results of operations and prospects. Because the business of a broad-based international financial services firm such as UBS is inherently exposed to risks that only become apparent with the benefit of hindsight, risks of which UBS is not presently aware could also materially affect its business activities, financial condition, results of operations and prospects. The sequence in which the risk factors are presented below is not indicative of their likelihood of occurrence or the potential magnitude of their financial consequences.
Risks related to the current market crisis
UBS, like many other financial market participants, was severely affected by the financial crisis that unfolded in 2007 and worsened in 2008. The deterioration of financial markets in 2008 was extremely severe by historical standards, and UBS recorded substantial losses on legacy risk positions. UBS has taken a series of measures to reduce its risk exposures, including the sale of up to USD 38.6 billion of illiquid and other positions to a fund owned and controlled by the Swiss National Bank (SNB) as announced in the fourth quarter. However, UBS continues to hold positions identified as risk concentrations (refer to the “Risk concentrations” section of this report for more information on these positions, as well as positions in other asset classes that might be negatively affected by the current market crisis). In addition, UBS is exposed to the general systemic and counterparty risks that are exacerbated by the ongoing market crisis and related instability of financial institutions and of the financial system as a whole.
UBS holds positions which may be adversely affected by the ongoing financial crisis and economic climate
As discussed in the paragraphs below on general risk factors, the development of market conditions and the overall economic environment, as well as factors affecting particular assets, may lead to reductions in the market or carrying value of UBS’s assets. Although UBS’s exposure to the US mortgage market (including residential sub-prime, Alt-A and prime) was reduced dramatically in 2008, UBS remains exposed to that market, albeit on a reduced scale. In addition, certain of its monoline-insured positions are exposed to the US residential mortgage market as described below. The markets for most US mortgage-related securities have so far remained illiquid and it is impossible to determine
whether and how long current market conditions will persist, or whether they will further deteriorate.
UBS relies on credit protection from third parties, including monoline insurers, that may not be effective
UBS’s business entails exposure to counterparty credit risk, including to monoline insurers and other providers of credit protection. UBS’s credit exposure to the monoline sector arises from over-the-counter (OTC) derivative contracts – mainly credit default swaps (CDSs) which are carried at fair value – in respect of mortgage related and “monoline-wrapped” securities. The fair value of these CDSs – and thus UBS’s exposure to the counterparties – depends on the valuation and the perceived credit risk of the instrument against which protection has been bought. Monoline insurers have been very adversely affected by their exposure to US residential mortgage-linked products, resulting in credit rating downgrades and the need to raise additional capital. UBS has recorded large credit valuation adjustments on its claims against monoline counterparties. If the financial condition of these counterparties or their perceived creditworthiness deteriorates further, UBS could record further credit valuation adjustments on the CDSs bought from monoline insurers.
UBS holds positions in asset classes that have been or might be negatively affected by the current market crisis
In 2007 and 2008, UBS incurred substantial losses (realized and mark-to-market) on its holdings of securities related to the US residential mortgage market. The market dislocation that began in 2007 has been progressively felt in asset classes beyond US residential mortgages. In 2008, UBS recorded markdowns on other assets carried at fair value, including auction rate securities (ARS), leveraged finance commitments, commercial mortgages in the United States and non-US mortgage- and asset-backed securities (ABSs). UBS has recorded and in the future could record negative fair value adjustments on these assets and on other asset classes which may be affected by the crisis in the credit markets. Such securities may also be wrapped by monoline insurers and therefore could give rise to losses if the difficulties in the monoline sector persist or increase (see the previous risk factor on monoline exposures).
23
Table of Contents
Strategy, performance and responsibility
Risk factors
UBS’s inventory of ARS is likely to increase in the future as a result of its commitment to repurchase client-owned ARS, as further described in the “Risk management” section of this report. UBS is also exposed to the risk of losses and write-downs on its leveraged finance commitments. UBS holds positions related to real estate markets in countries other than the United States on which it could also suffer losses. These include exposures to non-US residential and commercial real estate and mortgages and non-US ABS programs. For example, as described in the “Credit risk” section of this report, UBS has a very substantial Swiss mortgage portfolio which is booked in Global Wealth Management & Business Banking. UBS is also exposed to risk when it provides financing against the affected asset classes such as in its prime brokerage, reverse repo and lombard lending activities.
Risk factors related to UBS’s business activity
Performance in the financial services industry depends on the economic climate – negative developments can adversely affect UBS’s business activities
The financial services industry prospers in conditions of economic growth, stable geopolitical conditions, capital markets that are transparent, liquid and buoyant and positive investor sentiment. An economic downturn, inflation or a severe financial crisis (as seen in 2008) can negatively affect UBS’s revenues and it may be unable to immediately adjust all of its costs to the resulting deterioration in market or business conditions.
| – | a general reduction in business activity and market volumes affects fees, commissions and margins from market-making and customer-driven transactions and activities; | |
| – | a market downturn is likely to reduce the volume and valuations of assets UBS manages on behalf of clients, reducing its asset- and performance-based fees; | |
| – | reduced market liquidity limits trading and arbitrage opportunities and impedes UBS’s ability to manage risks, impacting both trading income and performance-based fees; |
| – | assets UBS holds for its own account as investments or trading positions could continue to fall in value; | |
| – | impairments and defaults on credit exposures and on trading and investment positions could increase, and losses may be exacerbated by falling collateral values; and | |
| – | if individual countries impose restrictions on cross-border payments or other exchange or capital controls, UBS could suffer losses from enforced default by counterparties, be unable to access its own assets, or be impeded in – or prevented from – managing its risks. |
Due to its sizeable trading inventory, trading activities and the counterparty credit risks in many of its businesses, UBS is dependent upon its risk management and control processes to avoid or limit potential losses
Controlled risk-taking is a major part of the business of a financial services firm. Credit is an integral part of many of UBS’s retail, wealth management and Investment Bank activities. This includes lending, underwriting and derivatives businesses and positions.
| – | it does not fully identify the risks in its portfolio, in particular risk concentrations and correlated risks; |
24
Table of Contents
Strategy, performance and responsibility |
| – | its assessment of the risks identified, or its response to negative trends, proves to be inadequate or incorrect; | |
| – | markets move in ways that are unexpected – in terms of their speed, direction, severity or correlation – and UBS’s ability to manage risks in the resultant environment is therefore restricted; | |
| – | third-parties to whom UBS has credit exposure or whose securities it holds for its own account are severely affected by events not anticipated by UBS’s models and the bank accordingly suffers defaults and impairments beyond the level implied by its risk assessment; or | |
| – | collateral or other security provided by its counterparties proves inadequate to cover their obligations at the time of their default. |
The valuation of certain assets relies on models. For some or all of the inputs to these models there is no observable source
Where possible, UBS marks its trading book assets at their quoted market price in an active market. In the current environment, such price information is not available for certain instruments and UBS applies valuation techniques to measure such instruments. Valuation techniques use “market observable inputs” where available, derived from similar assets in similar and active markets, from recent transaction prices for comparable items or from other observable market data. For positions for which some or all of the reference data is not observable or has limited observability, UBS uses valuation models with non-market observable inputs. “Note 27 Fair value of financial instruments” in the financial statements of this
report provides detailed information on the determination of fair value from valuation techniques. There is no single market standard for valuation models in this area. Such models have inherent limitations; different assumptions and inputs would generate different results, and these differences could have a significant impact on UBS’s financial results. UBS regularly reviews and updates its valuation models to incorporate all factors that market participants would consider in setting a price, including factoring in current market conditions. Judgment is an important component of this process. Changes in model inputs or in the models themselves could have a material impact on UBS’s financial results.
Credit ratings and liquidity and funding management are critical to UBS’s ongoing performance
Moody’s Investors Service, Fitch Ratings and Standard & Poor’s all lowered their long-term credit rating of UBS, on one or more times in 2008 and 2009. A further reduction in UBS’s credit rating could increase its funding costs, in particular with regard to funding from wholesale unsecured sources, and reduce access to capital markets. Some of these ratings downgrades have resulted, and additional reductions in the credit ratings would result, in UBS having to make additional cash payments or post additional collateral. These events may increase UBS’s need for funding to ensure that it will always have sufficient liquidity to meet liabilities when due, while reducing its ability to obtain such funding. UBS’s credit ratings also have an impact on the performance of UBS’s businesses. Along with UBS’s capital strength and reputation, both of which are described in greater detail in the risk factors below, UBS’s credit ratings contribute to maintaining client and counterparty confidence in UBS.
| è | Refer to the “Risk and treasury management” section of this report for more information on UBS’s approach to liquidity and funding management |
25
Table of Contents
Strategy, performance and responsibility
Risk factors
UBS’s capital strength is important to support its client franchise
UBS’s capital position measured by the BIS capital ratios is and has traditionally been strong, both in absolute terms and relative to its competitors. Capital ratios are determined by (1) risk-weighted assets (RWAs) (balance sheet, off-balance sheet and other market and operational risk positions, measured and risk-weighted according to regulatory criteria) and (2) eligible capital.
Operational risks may affect UBS’s business
All UBS’s businesses are dependent on the bank’s ability to process a large number of complex transactions across multiple and diverse markets in different currencies, in addition to being subject to the many different legal and regulatory regimes of these countries. UBS’s operational risk management and control systems and processes, which are described in the “Operational risk” section of this report, are designed to ensure that the risks associated with the bank’s activities, including those arising from process error, failed execution, unauthorized trading, fraud, systems failure and failure of security and physical protection, are appropriately controlled. If these internal controls fail or prove ineffective in identifying and remedying such risks, UBS could suffer operational failures that might result in losses.
Legal claims and regulatory risks and restrictions arise in the conduct of UBS’s business
In the ordinary course of its business, UBS is subject to regulatory oversight and liability risk. It is involved in a variety of other claims, disputes and legal proceedings and government investigations in jurisdictions where UBS is active, including the United States and Switzerland. These types of proceedings expose UBS to substantial monetary damages and legal defense costs, injunctive relief, criminal and civil penalties and the potential for regulatory restrictions on UBS’s businesses. The outcome of these matters cannot be predicted and they could adversely affect UBS’s future busi-
ness. Currently, UBS is responding to a number of government inquiries and investigations, and is involved in a number of litigations and disputes, related to the sub-prime crisis, sub-prime securities, and structured transactions involving sub-prime securities. These matters concern, among other things, UBS’s valuations, disclosures, writedowns, underwriting and contractual obligations.
| è | Refer to “Note 21 provisions and litigation” in the financial statements of this report for more information on legal proceedings in which UBS is involved |
UBS might be unable to identify or capture revenue or competitive opportunities, or retain and attract qualified employees
26
Table of Contents
Strategy, performance and responsibility |
is unable to attract or retain the qualified people needed to carry them out.
UBS’s reputation is key to its business
UBS’s reputation is critical in maintaining its relationships with clients, investors, regulators and the general public. The reputation of UBS can be damaged, for instance, by misconduct by its employees, by activities of business partners over which UBS has limited or no control, by severe or prolonged financial losses or by uncertainty about its financial soundness and its reliability. This could result in client attrition in different parts of UBS’s business and could negatively impact its financial performance. Maintaining the firm’s reputation and addressing adverse reputational developments are therefore key factors in UBS’s risk management efforts.
UBS’s global presence exposes the bank to other risks, including currency fluctuation
UBS operates in more than 50 countries, earns income and holds assets and liabilities in many different currencies and is subject to many different legal, tax and regulatory regimes.
27
Table of Contents
Strategy, performance and responsibility
Financial performance
Financial performance
UBS’s performance is reported in accordance with International Financial Reporting Standards (IFRS) as issued by the International Accounting Standards Board. This section provides a discussion and analysis of UBS’s results for 2008, commenting on the underlying operational performance of the business, with a focus on continuing operations.
| UBS financial highlights | ||||||||||||||||
| As of or for the year ended | % change from | |||||||||||||||
| CHF million, except where indicated | 31.12.08 | 31.12.07 | 31.12.06 | 31.12.07 | ||||||||||||
Performance indicators from continuing operations | ||||||||||||||||
Diluted earnings per share (CHF)1 | (7.60 | ) | (2.61 | ) | 4.64 | (191 | ) | |||||||||
Return on equity attributable to UBS shareholders (%)2 | (57.9 | ) | (11.7 | ) | 23.9 | (395 | ) | |||||||||
Cost/income ratio (%)3 | 680.4 | 111.0 | 70.5 | |||||||||||||
Net new money (CHF billion)4 | (226.0 | ) | 140.6 | 151.7 | ||||||||||||
Group results | ||||||||||||||||
| Operating income | 1,201 | 31,721 | 47,484 | (96 | ) | |||||||||||
| Operating expenses | 28,555 | 35,463 | 33,365 | (19 | ) | |||||||||||
| Operating profit before tax (from continuing and discontinued operations) | (27,155 | ) | (3,597 | ) | 15,007 | (655 | ) | |||||||||
| Net profit attributable to UBS shareholders | (20,887 | ) | (5,247 | ) | 11,527 | (298 | ) | |||||||||
Personnel (full-time equivalents)5 | 77,783 | 83,560 | 78,140 | (7 | ) | |||||||||||
| Invested assets (CHF billion) | 2,174 | 3,189 | 2,989 | (32 | ) | |||||||||||
UBS balance sheet and capital management | ||||||||||||||||
Balance sheet key figures | ||||||||||||||||
| Total assets | 2,015,098 | 2,274,891 | 2,348,733 | (11 | ) | |||||||||||
| Equity attributable to UBS shareholders | 32,800 | 36,875 | 51,037 | (11 | ) | |||||||||||
Market capitalization6 | 43,519 | 108,654 | 154,222 | (60 | ) | |||||||||||
BIS capital ratios7 | ||||||||||||||||
| Tier 1 (%) | 11.0 | 9.1 | 8 | 12.2 | 8 | |||||||||||
| Total BIS (%) | 15.1 | 12.2 | 8 | 15.0 | 8 | |||||||||||
| Risk-weighted assets | 302,273 | 374,421 | 8 | 344,015 | (19 | ) | ||||||||||
Long-term ratings | ||||||||||||||||
| Fitch, London | A+ | AA | AA+ | |||||||||||||
| Moody’s, New York | Aa2 | Aaa | Aa2 | |||||||||||||
| Standard & Poor’s, New York | A+ | AA | AA+ | |||||||||||||
28
Table of Contents
Strategy, performance and responsibility |
Measurement and analysis of performance
Key factors affecting UBS’s financial position and
results of operations in 2008
| – | In 2008, UBS continued to be severely affected by negative revenues in the Investment Bank due to trading losses on risk positions. Refer to the “Risk concentrations” section and “Note 3 Net interest and trading income” in the financial statements of this report for more information on risk positions and associated losses. |
| – | UBS recorded a significant increase in credit losses from CHF 238 million in the prior year to CHF 2,996 million. This reflects the deteriorating economic environment and impairment charges taken on reclassified financial assets in fourth quarter 2008. Refer to the “Credit risk” section of this report for more information. |
| – | On 5 March 2008, UBS issued mandatory convertible notes (MCNs) with a face value of CHF 13 billion to two investors. This transaction resulted in an accounting gain of CHF 3,860 million in first quarter 2008 and in an increase in share premium of CHF 7.0 billion. Refer to “Note 26 Capital increases and mandatory convertible notes” in the financial statements of this report for more information. |
| – | On 23 April 2008, the annual general meeting of shareholders approved a proposal that UBS strengthen its shareholders’ equity by way of an ordinary capital increase. The capital increase was completed in June 2008 by means of a rights offering and resulted in the issue of 760,295,181 new fully paid registered shares with a par value of CHF 0.10 each. Net proceeds from the capital increase were approximately CHF 15.6 billion. Refer to “Note 26 Capital increases and mandatory convertible notes” in the financial statements of this report for more information. |
| – | On 20 May 2008, UBS completed the sale of a portfolio of US residential mortgage-backed securities (RMBSs) for proceeds of USD 15 billion to the RMBS Opportunities Master Fund, LP, a third-party entity managed by BlackRock, Inc. The portfolio had a notional value of approximately USD 22 billion and comprised primarily Alt-A and sub-prime related assets. The fund was capitalized with approximately USD 3.75 billion in equity raised by BlackRock from third-party investors and an eight-year amortizing USD 11.25 billion senior secured loan provided by UBS (balance at year-end 2008 was USD 9.2 billion). |
| – | As announced on 16 October 2008, the Swiss National Bank (SNB) and UBS have reached an agreement to transfer, in one or more sales, up to USD 60 billion of illiquid and other positions from UBS’s balance sheet to a sepa- |
| rate fund entity controlled and owned by the SNB. The size of the transaction has since been reduced to USD 38.6 billion. This transaction allowed UBS to reduce its exposure to certain asset classes and potential associated losses. In parallel, UBS placed CHF 6 billion of MCNs with the Swiss Confederation on 9 December 2008. The overall impact on UBS’s income statement of the SNB transaction and the placement of the MCNs with the Swiss Confederation was a net charge of CHF 4.5 billion. This reflects a net loss arising from the acquisition of the equity purchase option, a loss arising from valuation differences determined to date on securities sold or to be sold to the SNB StabFund, losses on hedges that were subject to trading restrictions as a result of the SNB transaction, and the impact of the contingent issuance of UBS shares in connection with the transaction. The fair valuation impact of the issuance of the MCNs, as described in “Note 26 Capital increases and mandatory convertible notes” in the financial statements of this report, is also included in this total. | ||
| – | In 2008, the Investment Bank recorded a gain on own credit from financial liabilities designated at fair value of CHF 2,032 million, resulting from the widening of UBS’s credit spread, which was partly offset by the effects of redemptions and repurchases of such liabilities. The cumulative own credit balance for such debt held at 31 December 2008 amounts to CHF 2,953 million. Refer to “Note 27 Fair value of financial instruments” in the financial statements of this report for more information. Financial liabilities designated at fair value are liabilities for which UBS applied the option granted by IFRS to fair value them through profit or loss, predominately issued structured products. The gain reflects an increase in the difference between the market value of UBS’s debt accounted for under the fair value option (which is presented on the balance sheet line “Financial liabilities designated at fair value”) and the amount it would cost UBS to issue this debt at current market terms. As a general rule, the market value of UBS’s outstanding debt decreases if UBS’s own credit spread widens and increases if UBS’s credit spread tightens. Therefore, if UBS’s credit spread were to tighten again in the future, the market value of UBS’s outstanding fair valued debt would increase accordingly, resulting in the reversal of some or all of the gains on own credit recorded so far, unless UBS redeems own debt before maturity. | |
| – | Following the auction rate securities (ARS) settlement in August 2008, Wealth Management US recorded losses of CHF 1,524 million, of which CHF 1,464 million were in- |
29
Table of Contents
Strategy, performance and responsibility
Financial performance
| cluded in general and administrative expenses, and CHF 60 million were recognized as trading losses. Under the ARS settlement, Wealth Management US agreed to purchase ARS from clients at their par value. Up to fourth quarter 2008, the ARS settlement liability represented a provision. The liability was reclassified from provisions to negative replacement values in fourth quarter 2008, when ARS settlement rights, which are treated as derivative instruments, were issued to and accepted by clients. Losses incurred post-reclassification represented trading losses. | ||
| – | As announced on 18 February 2009, UBS settled the US cross-border case with the US Department of Justice (DOJ) and the US Securities and Exchange Commission (SEC), by entering into a deferred prosecution agreement with the DOJ and a consent order with the SEC. As part of these settlement agreements, UBS agreed to pay an amount of CHF 917 million (USD 780 million) to the United States. Refer to the “Settlement regarding the US cross-border case” sidebar in the “Wealth Management International & Switzerland” section of this report for more information. | |
| – | UBS recognized an income tax benefit of CHF 6,837 million in 2008, which mainly reflects the CHF 6,126 million impact from the recognition of incremental deferred tax assets on available tax losses. The incremental deferred tax assets relate mainly to Swiss tax losses incurred during 2008 (primarily due to the writedown of investments in US subsidiaries) but was reduced by a decrease in the deferred tax assets recognized for US tax losses. Refer to “Note 22 Income taxes” in the financial statements of this report for more information. |
Discontinued operations
As discontinued activities are no longer relevant to the management of the company, UBS does not consider them to be indicative of its future potential performance and they are therefore not included in its business planning decisions. This assists in comparing UBS’s performance against that of its peers, and in the estimation of future results. In the last three years, one such item had a significant impact on UBS’s consolidated financial statements: On 23 March 2006, UBS sold its 55.6% stake in Motor-Columbus to a consortium representing Atel’s Swiss minority shareholders, EOS Holding, Atel and French utility Electricité de France (EDF) for a sale price of approximately CHF 1,295 million, leading to an after-tax gain on sale of CHF 387 million.
Seasonal characteristics
The main businesses of UBS do not generally show significant seasonal patterns, although the Investment Bank’s revenues have been affected in some years by the seasonal characteristics of general financial market activity and deal
flows in investment banking. Other business divisions are only slightly impacted by seasonal components, such as asset withdrawals that tend to occur in fourth quarter and lower client activity levels related to the end-of-year holiday season.
Performance measures
Key performance indicators (2008)
Until the end of 2008, UBS consistently assessed its performance against indicators designed to measure the delivery (on average and through periods of varying market conditions) of returns to its shareholders. At the Group level, these indicators were: after-tax return on equity; net new money; diluted earnings per share (EPS); and cost / income ratio. Business division key performance indicators (KPIs) were also used for internal performance measurement and planning as well as external reporting.
| è | A new key performance indicator framework was introduced in first quarter 2009 and will be used to measure performance in 2009 and forward. Refer to the “Key performance indicators: 2009 and beyond” sidebar in the “Strategy and structure” section of this report for more information |
Client/invested assets reporting
UBS reports two distinct metrics for client funds:
| – | Client assetsare all client assets managed by or deposited with UBS, including custody-only assets and assets held for purely transactional purposes. |
| – | Invested assetsis a more restrictive term and includes all client assets managed by or deposited with UBS for investment purposes. |
30
Table of Contents
Strategy, performance and responsibility |
| Business division / business unit key performance indicators (2008) | ||||
| Business | Key performance indicators | Definition | ||
Business divisions and business units (excluding Corporate Center) | Cost/income ratio (%) | Total operating expenses/total operating income before credit loss (expense)/recovery | ||
| Return on attributed equity (%) | Performance before tax/average attributed equity | |||
Wealth and asset management businesses and Business Banking Switzerland | Invested assets (CHF billion) | Client assets managed by or deposited with UBS for investment purposes only (for further details please see “Client/invested assets reporting”) | ||
| Net new money (CHF billion) | Inflow of invested assets from new clients | |||
| + inflows from existing clients | ||||
| – outflows from existing clients | ||||
| – outflows due to client defection | ||||
Wealth and asset management businesses | Gross margin on invested assets (bps) | Total operating income before credit loss (expense)/recovery/average invested assets | ||
Wealth Management International & Switzerland | Client advisors | Expressed in full-time equivalents | ||
| Revenues per advisor (CHF thousand) | Total operating income before credit loss (expense)/recovery/average number of client advisors | |||
| Net new money per advisor (CHF thousand) | Net new money/average number of client advisors | |||
| Invested assets per advisor (CHF thousand) | Average invested assets/average number of client advisors | |||
Wealth Management US | Recurring income (CHF million) | Interest, asset-based revenues for portfolio management and account-based, distribution and advisory fees (as opposed to transactional revenues) | ||
| Revenues per advisor (CHF thousand) | Total operating income before credit loss (expense)/recovery/average number of financial advisors | |||
| Net new money per advisor (CHF thousand) | Net new money/average number of financial advisors | |||
| Invested assets per advisor (CHF thousand) | Average invested assets/average number of financial advisors | |||
Business Banking Switzerland | Impaired lending portfolio as a % of total lending portfolio, gross | Impaired lending portfolio, gross/total lending portfolio, gross | ||
Investment Bank | Compensation ratio (%) | Personnel expenses/total operating income before credit loss (expense)/recovery | ||
| Impaired lending portfolio as a % of total lending portfolio, gross | Impaired lending portfolio, gross/total lending portfolio, gross | |||
| Average regulatory VaR (10-day, 99% confidence, based on 5 years of historical data) | Value at Risk (VaR) expresses maximum potential loss measured to a 99% confidence level, over a 10-day time horizon and based on 5 years of historical data | |||
ed assets and client assets as a result of a change in the service level delivered are treated as net new money inflow or outflow.
mutual funds are managed by the Global Asset Management business division and sold by Global Wealth Management & Business Banking. Both businesses involved count these funds as invested assets. This approach is in line with both finance industry practices and UBS’s open architecture strategy and allows the firm to accurately reflect the performance of each individual business. Overall, CHF 273 billion of invested assets were double counted in 2008 (CHF 392 billion in 2007).
31
Table of Contents
Strategy, performance and responsibility
Financial performance
UBS reporting structure
Changes to reporting structure and
presentation in 2008
Industrial Holdings reported in the Corporate Center
As UBS has continuously reduced its private equity business in Industrial Holdings over the last three years to a very low level, it was decided to report these activities under the Corporate Center from 2008 onwards.
Exiting of the municipal securities business by the
Investment Bank
In June 2008, UBS announced the closure of its Investment Bank’s institutional municipal securities business. This hap-
pened with immediate effect and the retail operations of the municipal securities business, including secondary market activities, were transferred to Wealth Management US. A goodwill impairment charge of CHF 341 million was recorded in second quarter 2008 in relation to the exiting of this business and was attributed to the Investment Bank.
Exiting of certain commodities businesses by the
Investment Bank
In October 2008, UBS announced that the Investment Bank would exit the commodities business, with the exception of precious metals. This resulted in an expense of CHF 133 million in fourth quarter 2008.
UBS reporting structure in 2008
| Global Wealth Management & | Global Asset Management | Investment Bank | Corporate Center | |||||||
| Business Banking | ||||||||||
Wealth Management International & Switzerland | ||||||||||
Wealth Management US | ||||||||||
Business Banking Switzerland | ||||||||||
Wealth Management & Swiss Bank and Wealth Management Americas
On 10 February 2009, UBS announced with immediate effect the split of Global Wealth Management & Business Banking into two divisions: Wealth Management & Swiss Bank and Wealth Management Americas. UBS will start reporting results based on this new structure with the first quarter 2009 results.
Investment Bank
As announced on 3 October 2008 and reiterated on 10 February 2009, the Investment Bank is being repositioned to focus on its core franchises. The fixed income, currencies and commodities (FICC) business unit of the Investment Bank has exited several businesses including institutional municipal securities, proprietary trading, commodities (excluding
precious metals, exchange-traded derivatives and indices) and real estate and securitization activities, as well as exotic structured products. The internal organization of the FICC business unit has changed to reflect this repositioning, but these changes are not expected to have an immediate impact on the Investment Bank’s or UBS’s reporting structure.
32
Table of Contents
Strategy, performance and responsibility |
Accounting changes
Share-based payments: revisions to International
Financial Reporting Standard 2
UBS adopted amended IFRS 2 on 1 January 2008. As a result, from 1 January 2008, UBS’s share-based awards that are not generally forfeited upon the employee leaving UBS are expensed in the performance year. In contrast, share-based awards featuring stringent forfeiture rules are amortized over the shorter of the legal vesting period and the period from grant through to the retirement eligibility date of the employee.
Recognition of a defined benefit asset for the
Swiss pension plan
In third quarter 2008, UBS concluded that it meets the requirements of IAS 19Employee Benefits for recognizing a defined benefit asset associated with its Swiss pension plan. Prior to this, it had been UBS policy to disclose only this amount in “Note 30 Pension and other post-employment benefit plans” in the financial statements of UBS’s annual reports. UBS concluded that recognition of an asset should also consider unrecognized net actuarial losses and past service cost as permitted by IAS 19 as this results in a better reflection of the corridor approach. At the end of third quarter 2008, the measurement of the defined benefit asset represented the total cumulative unrecognized net actuarial losses plus unrecognized past service cost plus the present value of economic benefits available in the form of refunds of the plan or reductions in future contributions to the plan.
CHF 0.5 billion in deferred tax liabilities and an increase of approximately CHF 1.6 billion in retained earnings. Refer to “Note 1 Summary of significant accounting policies” in the financial statements and the “Capital management” section of this report for more information.
IAS 39Reclassification of financial instruments
The markets for many financial instruments began to dry up in 2007 and many instruments that previously traded in active and liquid markets ceased to trade actively by mid-2008. In an effort to address accounting concerns arising from the global credit crisis, the International Accounting Standards Board published an amendment to International Accounting Standard 39 (IAS 39Financial Instruments: Recognition and Measurement) on 13 October 2008.
33
Table of Contents
Strategy, performance and responsibility
Financial performance
the fourth quarter, the operating profit before taxes would have been CHF 3.8 billion lower if the reclassification had not occurred. Refer to “Note 29 Measurement categories of financial assets and liabilities” in the financial statements of this report for more information on the reclassification of financial assets in 2008.
Discontinuation of the adjusted expected
credit loss concept
In first quarter 2008, UBS ceased using the adjusted expected credit loss concept in its internal management reporting and began to book, in line with IFRS, actual credit losses (recoveries) instead. Prior year results have been restated. This change had no impact on the Group’s overall net profit.
IFRS 8 Operating Segments
The new standard on segment reporting, IFRS 8Operating Segments, came into force on 1 January 2009 and replaced IAS 14Segment Reporting. The external segmental reporting is based on internal reporting within UBS to the Group Executive Board (or, the “chief operating decision maker”) which makes decisions on the allocation of resources and assesses the performance of the reportable segments. Based on the new UBS structure which was announced on 10 February 2009 and following IFRS 8 guidance, UBS will show in 2009 four reportable segments. The business divisions Wealth Management & Swiss Bank, Wealth
Management Americas, Global Asset Management and the Investment Bank represent one reportable segment each. The Corporate Center, which does not meet the requirements of an operating segment, will also be shown separately. In addition, the new standard requires UBS to provide descriptive information about the types of products and services from which each reportable segment derives its revenue. As UBS’s reportable segment operations are mainly financial, the total interest income and expense for all reportable segments will be presented on a net basis.
unlikely to be material. Going forward, the segment assets and segment liabilities will be disclosed without the intercompany balances and this basis is in line with the internal reporting. An explanation of the basis on which the segment information is prepared, and reconciliations to the amounts presented in the statement of comprehensive income and the statement of financial position are also required by the new standard. UBS will be providing geographical information about total operating income and total non-current assets based on the following new geographical breakdown: Switzerland, UK, Rest of Europe, USA, Asia Pacific and Rest of the World.
34
Table of Contents
Key performance indicators
Until the end of 2008, UBS focused on four key performance indicators: return on equity, diluted earnings per share, cost / income ratio and net new money. These indica-
Return on equity
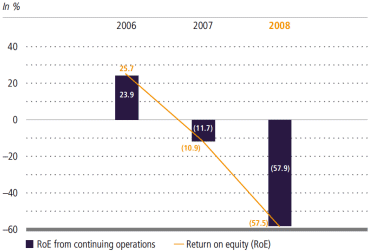
Diluted earnings per share
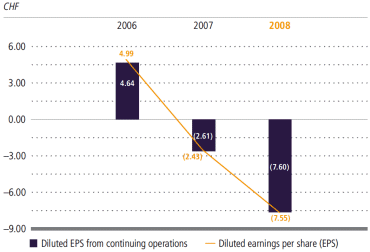
tors are designed to monitor the returns UBS delivers to shareholders and are calculated using results from continuing operations.
Cost/income ratio
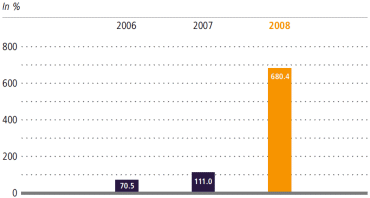
Net new money

| Key performance indicators | |||||||||||||
| For the year ended | |||||||||||||
| 31.12.08 | 31.12.07 | 31.12.06 | |||||||||||
Return on equity (RoE) (%)1 | (57.5 | ) | (10.9 | ) | 25.7 | ||||||||
RoE from continuing operations (%)1 | (57.9 | ) | (11.7 | ) | 23.9 | ||||||||
Diluted earnings per share (EPS) (CHF)2 | (7.55 | ) | (2.43 | ) | 4.99 | ||||||||
Diluted EPS from continuing operations (CHF)2 | (7.60 | ) | (2.61 | ) | 4.64 | ||||||||
Cost/income ratio (%)3 | 680.4 | 111.0 | 70.5 | ||||||||||
Net new money (CHF billion)4 | (226.0 | ) | 140.6 | 151.7 | |||||||||
35
Table of Contents
Strategy, performance and responsibility
Financial performance
2008
The key performance indicators show:
| – | return on equity from continuing operations for full-year 2008 at negative 57.9%, down from negative 11.7% in 2007. The profits recorded by UBS’s wealth and asset management businesses were more than offset by substantial losses in the Investment Bank. | |
| – | negativediluted earnings per share from continuing operations of CHF 7.60, compared with negative CHF 2.61 in 2007. | |
| – | acost/income ratio of 680.4%, compared with 111.0% a year ago. | |
| – | net new money at negative CHF 226.0 billion, down from positive CHF 140.6 billion in 2007. Net new money outflows were most pronounced in the Global Wealth Management & Business Banking division, which recorded total net new money outflows of CHF 123.0 billion. Wealth |
Management International & Switzerland contributed to the majority of this total with net outflows of CHF 101.0 billion, the most significant outflows occurring in the Latin America, Mediterranean, Middle East & Africa regions. Wealth Management US reported net new money outflows of CHF 10.6 billion, mainly due to net outflows in the second and third quarters. The Swiss retail business recorded net new money outflows of CHF 11.4 billion. Global Asset Management saw total net outflows of CHF 103.0 billion. Of this, outflows in institutional were CHF 55.6 billion and occurred primarily via third-party distribution channels. Institutional net outflows were observed in all categories except money market funds, infrastructure and real estate. Wholesale intermediary had total net outflows of CHF 47.4 billion, reflecting higher outflows mainly in multi-asset, equities and fixed income. Approximately three-fourths of the wholesale intermediary outflows were through UBS distribution channels.
| Net new money1 | ||||||||||||
| For the year ended | ||||||||||||
| CHF billion | 31.12.08 | 31.12.07 | 31.12.06 | |||||||||
| Wealth Management International & Switzerland | (101.0 | ) | 125.1 | 97.6 | ||||||||
| Wealth Management US | (10.6 | ) | 26.6 | 15.7 | ||||||||
| Business Banking Switzerland | (11.4 | ) | 4.6 | 1.2 | ||||||||
Global Wealth Management & Business Banking | (123.0 | ) | 156.3 | 114.5 | ||||||||
| Institutional | (55.6 | ) | (16.3 | ) | 29.8 | |||||||
| Wholesale intermediary | (47.4 | ) | 0.6 | 7.4 | ||||||||
Global Asset Management | (103.0 | ) | (15.7 | ) | 37.2 | |||||||
UBS | (226.0 | ) | 140.6 | 151.7 | ||||||||
| Invested assets | |||||||||||||||||
| As of | % change from | ||||||||||||||||
| CHF billion | 31.12.08 | 31.12.07 | 31.12.06 | 31.12.07 | |||||||||||||
| Wealth Management International & Switzerland | 870 | 1,294 | 1,138 | (33 | ) | ||||||||||||
| Wealth Management US | 600 | 840 | 824 | (29 | ) | ||||||||||||
| Business Banking Switzerland | 129 | 164 | 161 | (21 | ) | ||||||||||||
Global Wealth Management & Business Banking | 1,599 | 2,298 | 2,123 | (30 | ) | ||||||||||||
| Institutional | 335 | 522 | 519 | (36 | ) | ||||||||||||
| Wholesale intermediary | 240 | 369 | 347 | (35 | ) | ||||||||||||
Global Asset Management | 575 | 891 | 866 | (35 | ) | ||||||||||||
UBS | 2,174 | 3,189 | 2,989 | (32 | ) | ||||||||||||
36
Table of Contents
Strategy, performance and responsibility |
2007
Key performance indicators show:
| – | return on equity from continuing operations for full-year 2007 at negative 11.7%, down from positive 23.9% in 2006. The strong results posted by UBS’s wealth and asset management businesses were more than offset by substantial losses in the Investment Bank; | |
| – | negativediluted earnings per share from continuing operations of CHF 2.61, compared with positive CHF 4.64 in 2006; | |
| – | acost/income ratio of 111.0%, compared with 70.5% in the prior year; | |
| – | net new money at CHF 140.6 billion, down from a record in 2006 of CHF 151.7 billion. The decrease was mostly driven by full-year outflows in Global Asset Management, mainly in institutional which had net new money outflows of CHF 16.3 billion. The net new money out-flows in core / value equity mandates and, to a lesser extent, in fixed income mandates were only partly offset by net new money inflows into all other asset classes, particularly alternative and quantitative investments and money market funds. Record net new money inflows were seen in Wealth Management International & Switzerland, particularly in Europe and Asia Pacific. Net new money inflows of CHF 26.6 billion in Wealth Management US reflected the recruitment of experienced advisors and reduced outflows from existing clients. The Swiss retail business recorded net new money inflows of CHF 4.6 billion. |
A new key performance indicator (KPI) framework was introduced in first quarter 2009 and will be used to
measure performance in 2009 and forward. Refer to the “Key performance indicators: 2009 and beyond”
sidebar in the “Strategy and structure” section of this report for more information on UBS’s new KPIs.
37
Table of Contents
Strategy, performance and responsibility
Financial performance
UBS results
| Income statement | ||||||||||||||||
| As of or for the year ended | % change from | |||||||||||||||
| CHF million, except where indicated | 31.12.08 | 31.12.07 | 31.12.06 | 31.12.07 | ||||||||||||
Continuing operations | ||||||||||||||||
| Interest income | 65,890 | 109,112 | 87,401 | (40 | ) | |||||||||||
| Interest expense | (59,687) | (103,775 | ) | (80,880 | ) | (42 | ) | |||||||||
| Net interest income | 6,203 | 5,337 | 6,521 | 16 | ||||||||||||
| Credit loss (expense) / recovery | (2,996) | (238 | ) | 156 | ||||||||||||
| Net interest income after credit loss expense | 3,207 | 5,099 | 6,677 | (37 | ) | |||||||||||
| Net fee and commission income | 22,929 | 30,634 | 25,456 | (25 | ) | |||||||||||
| Net trading income | (25,818) | (8,353 | ) | 13,743 | (209 | ) | ||||||||||
| Other income | 884 | 4,341 | 1,608 | (80 | ) | |||||||||||
| Total operating income | 1,201 | 31,721 | 47,484 | (96 | ) | |||||||||||
| Cash components | 16,356 | 22,342 | 21,346 | (27 | ) | |||||||||||
| Share-based components | (94) | 3,173 | 2,685 | |||||||||||||
| Total personnel expenses | 16,262 | 25,515 | 24,031 | (36 | ) | |||||||||||
| General and administrative expenses | 10,498 | 8,429 | 7,942 | 25 | ||||||||||||
| Depreciation of property and equipment | 1,241 | 1,243 | 1,244 | 0 | ||||||||||||
| Impairment of goodwill | 341 | 0 | 0 | |||||||||||||
| Amortization of intangible assets | 213 | 276 | 148 | (23 | ) | |||||||||||
| Total operating expenses | 28,555 | 35,463 | 33,365 | (19 | ) | |||||||||||
| Operating profit from continuing operations before tax | (27,353) | (3,742 | ) | 14,119 | (631 | ) | ||||||||||
| Tax expense | (6,837) | 1,369 | 2,998 | |||||||||||||
| Net profit from continuing operations | (20,517) | (5,111 | ) | 11,121 | (301 | ) | ||||||||||
Discontinued operations | ||||||||||||||||
| Profit from discontinued operations before tax | 198 | 145 | 888 | 37 | ||||||||||||
| Tax expense | 1 | (258 | ) | (11 | ) | |||||||||||
| Net profit from discontinued operations | 198 | 403 | 899 | (51 | ) | |||||||||||
| Net profit | (20,319) | (4,708 | ) | 12,020 | (332 | ) | ||||||||||
| Net profit attributable to minority interests | 568 | 539 | 493 | 5 | ||||||||||||
| from continuing operations | 520 | 539 | 390 | (4 | ) | |||||||||||
| from discontinued operations | 48 | 0 | 103 | |||||||||||||
Net profit attributable to UBS shareholders | (20,887) | (5,247 | ) | 11,527 | (298 | ) | ||||||||||
| from continuing operations | (21,037) | (5,650 | ) | 10,731 | (272 | ) | ||||||||||
| from discontinued operations | 150 | 403 | 796 | (63 | ) | |||||||||||
Earnings per share | ||||||||||||||||
| Basic earnings per share (CHF) | (7.54) | (2.42 | ) | 5.19 | (212 | ) | ||||||||||
| from continuing operations | (7.60) | (2.61 | ) | 4.83 | (191 | ) | ||||||||||
| from discontinued operations | 0.05 | 0.19 | 0.36 | (74 | ) | |||||||||||
| Diluted earnings per share (CHF) | (7.55) | (2.43 | ) | 4.99 | (211 | ) | ||||||||||
| from continuing operations | (7.60) | (2.61 | ) | 4.64 | (191 | ) | ||||||||||
| from discontinued operations | 0.05 | 0.19 | 0.34 | (74 | ) | |||||||||||
Additional information | ||||||||||||||||
Personnel (full-time equivalents)1 | 77,783 | 83,560 | 78,140 | (7 | ) | |||||||||||
38
Table of Contents
Strategy, performance and responsibility |
2008
Results
2008 saw the unfolding of a global financial crisis that affected UBS deeply. While UBS’s wealth and asset management businesses contributed positively to UBS results despite extremely difficult conditions, losses on the Investment Bank’s risk positions were very significant and led to an overall negative result.
Operating income
Total operating income was CHF 1,201 million in 2008, down from CHF 31,721 million in 2007.Net interest income at CHF 6,203 million was up 16% compared with CHF 5,337 million a year earlier.Net trading income was negative CHF 25,818 million, sharply down from negative CHF 8,353 million in 2007.
Net income from trading businesses
Trading versus non-trading income
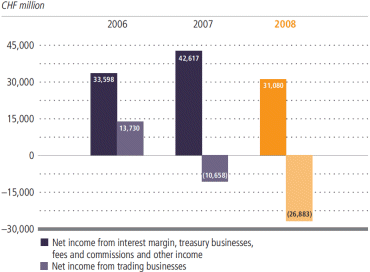
centrations in the fixed income, currencies and commodities (FICC) area of the Investment Bank in 2008.
| Net interest and trading income | ||||||||||||||||
| For the year ended | % change from | |||||||||||||||
| CHF million | 31.12.08 | 31.12.07 | 31.12.06 | 31.12.07 | ||||||||||||
| Net interest income | 6,203 | 5,337 | 6,521 | 16 | ||||||||||||
| Net trading income | (25,818) | (8,353 | ) | 13,743 | (209 | ) | ||||||||||
Total net interest and trading income | (19,615) | (3,016 | ) | 20,264 | (550 | ) | ||||||||||
Breakdown by businesses | ||||||||||||||||
Net income from trading businesses1 | (26,883) | (10,658 | ) | 13,730 | (152 | ) | ||||||||||
Net income from interest margin businesses | 6,160 | 6,230 | 5,718 | (1 | ) | |||||||||||
Net income from treasury activities and other | 1,107 | 1,412 | 816 | (22 | ) | |||||||||||
Total net interest and trading income | (19,615) | (3,016 | ) | 20,264 | (550 | ) | ||||||||||
39
Table of Contents
Strategy, performance and responsibility
Financial performance
2,032 million, resulting from the widening of UBS’s credit spread, which was partly offset by the effects of redemptions and repurchases of such liabilities. Refer to “Note 27 Fair value of financial instruments” in the financial statements of this report for more information. In 2007, the Investment Bank recorded a gain of CHF 659 million on own credit.
Net income from interest margin businesses
Net income from treasury activities and other
Credit loss expense
| è | Refer to the “Risk management and control” section of this report for more information on UBS’s risk management approach, method of credit risk measurement and the development of credit risk exposures |
Net fee and commission income
| – | Underwriting fees fell 48% to CHF 1,957 million, driven by a 56% decline in equity underwriting fees and a 31% decline in debt underwriting fees. |
| – | Mergers and acquisitions and corporate finance fees fell 40% to CHF 1,662 million, in an environment of reduced market activity and lower mandated deal volumes. |
| – | Net brokerage fees fell 16% to CHF 6,445 million, mainly due to lower client transaction volumes in the wealth management businesses and the Investment Bank’s cash equities and Asian equity derivatives business. |
| – | Investment fund fees fell 25% to CHF 5,583 million due to lower asset-based fees from the asset management and wealth management businesses. |
| – | Fiduciary fees increased 1% to CHF 301 million, reflecting an increase in business volume. |
| – | Custodian fees fell 12% to CHF 1,198 million, mainly due to the lower asset base. |
| – | Portfolio and other management and advisory fees fell 21% to CHF 6,169 million mainly due to the lower asset base in the wealth management businesses and reduced performance fees in the asset management business. |
| – | Insurance-related and other fees, at CHF 317 million in 2008, decreased by 25% from a year earlier mainly due to lower commission income from life insurance products at Wealth Management US. |
Other income
| Credit loss (expense) / recovery | ||||||||||||||||
| For the year ended | % change from | |||||||||||||||
| CHF million | 31.12.08 | 31.12.07 | 31.12.06 | 31.12.07 | ||||||||||||
| Global Wealth Management & Business Banking | (421) | 28 | 109 | |||||||||||||
| Investment Bank | (1,246) | (266 | ) | 47 | 368 | |||||||||||
| Investment Bank – credit losses from reclassified financial instruments | (1,329) | |||||||||||||||
UBS | (2,996) | (238 | ) | 156 | ||||||||||||
40
Table of Contents
Strategy, performance and responsibility |
| Net fee and commission income | ||||||||||||||||
| For the year ended | % change from | |||||||||||||||
| CHF million | 31.12.08 | 31.12.07 | 31.12.06 | 31.12.07 | ||||||||||||
| Equity underwriting fees | 1,138 | 2,564 | 1,834 | (56 | ) | |||||||||||
| Debt underwriting fees | 818 | 1,178 | 1,279 | (31 | ) | |||||||||||
Total underwriting fees | 1,957 | 3,742 | 3,113 | (48 | ) | |||||||||||
| Mergers and acquisitions and corporate finance fees | 1,662 | 2,768 | 1,852 | (40 | ) | |||||||||||
| Brokerage fees | 8,355 | 10,281 | 8,053 | (19 | ) | |||||||||||
| Investment fund fees | 5,583 | 7,422 | 5,858 | (25 | ) | |||||||||||
| Fiduciary fees | 301 | 297 | 252 | 1 | ||||||||||||
| Custodian fees | 1,198 | 1,367 | 1,266 | (12 | ) | |||||||||||
| Portfolio and other management and advisory fees | 6,169 | 7,790 | 6,622 | (21 | ) | |||||||||||
| Insurance-related and other fees | 317 | 423 | 449 | (25 | ) | |||||||||||
Total securities trading and investment activity fees | 25,540 | 34,090 | 27,465 | (25 | ) | |||||||||||
| Credit-related fees and commissions | 273 | 279 | 269 | (2 | ) | |||||||||||
| Commission income from other services | 1,010 | 1,017 | 1,064 | (1 | ) | |||||||||||
Total fee and commission income | 26,823 | 35,386 | 28,798 | (24 | ) | |||||||||||
| Brokerage fees paid | 1,909 | 2,610 | 1,904 | (27 | ) | |||||||||||
| Other | 1,984 | 2,142 | 1,438 | (7 | ) | |||||||||||
Total fee and commission expense | 3,894 | 4,752 | 3,342 | (18 | ) | |||||||||||
Net fee and commission income | 22,929 | 30,634 | 25,456 | (25 | ) | |||||||||||
Operating expenses
Total operating expenses were down 19% to CHF 28,555 million from CHF 35,463 million. The decline was mainly due to significantly lower performance-related compensation, partly offset by provisions for auction rate securities and the provision made in connection with the US cross-border case.
Personnel expenses
General and administrative expenses
curities of CHF 1,464 million, the provision of CHF 917 million made in connection with the US cross-border case and restructuring charges. These offset cost reductions in all other categories during 2008. In absolute terms, the largest reductions came from lower travel and entertainment expenses, reduced costs from outsourcing of IT and other services and lower marketing and public relations expenses.
Depreciation, amortization and impairment of goodwill
Income tax
UBS recognized an income tax benefit in the income statement of CHF 6,837 million for 2008, which mainly reflects the CHF 6,126 million impact from the recognition of incremental deferred tax assets on available tax losses.
41
Table of Contents
Strategy, performance and responsibility
Financial performance
2007
Results
In 2007, UBS reported a Group net loss attributable to UBS shareholders (“attributable loss”) of CHF 5,247 million – a loss of CHF 5,650 million from continuing operations and a profit of CHF 403 million from discontinued operations. In 2006, UBS recorded a Group net profit attributable to UBS shareholders (“attributable profit”) of CHF 11,527 million.
Operating income
Total operating income was CHF 31,721 million in 2007, down 33% from CHF 47,484 million in 2006.Net interest income at CHF 5,337 million was down 18% compared with CHF 6,521 million a year earlier.Net trading income was negative CHF 8,353 million, sharply down from positive CHF 13,743 million in 2006.
Net income from trading businesses
Net income from interest margin businesses
Net income from treasury activities and other
Net fee and commission income
| – | Underwriting fees, at their highest level ever, were CHF 3,742 million, up 20% from 2006. Equity underwriting fees were up significantly and offset a decrease in fixed income underwriting fees. |
42
Table of Contents
Strategy, performance and responsibility |
| – | At CHF 2,768 million, mergers and acquisitions and corporate finance fees in 2007 were up significantly by 49% compared with 2006, in a brisk merger and acquisition environment. |
| – | Net brokerage fees were CHF 7,671 million in 2007, up 25% from 2006, mainly driven by higher revenues in Europe, the US and Asia, due to additional services from a new equities trading platform, and a considerable increase in client activity in all client segments. Additionally, the equity derivatives business also posted higher revenues due to increased business volume. |
| – | Investment fund fees, at their highest level ever, were CHF 7,422 million in 2007, up 27% from 2006, mainly reflecting higher asset-based fees for the wealth management businesses and higher management and performance fees at Global Asset Management. |
| – | Fiduciary fees increased 18% to CHF 297 million due to an increase in business volume. |
| – | At CHF 1,367 million, custodian fees in 2007 were up 8% compared with 2006. This increase was due to an enlarged asset base. |
| – | Portfolio and other management and advisory fees increased by 18% to CHF 7,790 million in 2007. The increase was again the result of rising invested asset levels and to a lesser extent higher management fees. |
| – | Insurance-related and other fees, at CHF 423 million in 2007, decreased by 6% from a year earlier. |
Other income
Operating expenses
Total operating expenses increased 6% to CHF 35,463 million in 2007 from CHF 33,365 million in 2006.
Personnel expenses
advisors. Performance-related compensation decreased, reflecting the losses incurred in the Investment Bank. Share-based components were up 18%, or CHF 488 million, to CHF 3,173 million from CHF 2,685 million, mainly reflecting accelerated amortization of deferred compensation awarded for senior managers who have left UBS. Contractors’ expenses, at CHF 630 million, were CHF 192 million below 2006 levels, mainly due to the transfer of contractors into permanent staff. Insurance and social security contributions declined by 8% to CHF 1,290 million in 2007 compared with CHF 1,398 million in 2006, reflecting lower bonus payments. Contributions to retirement benefit plans rose 15% or CHF 120 million to CHF 922 million in 2007 as a result of both higher salaries paid and the increased staff levels. At CHF 1,958 million in 2007, other personnel expenses increased by CHF 390 million from 2006, mainly driven by severance payments relating to the reduction in staff levels.
General and administrative expenses
Depreciation, amortization and impairment of goodwill
Income tax
UBS recognized a tax expense in the income statement of CHF 1,369 million for 2007, compared with a tax expense for 2006 of CHF 2,998 million.
43
Table of Contents
Strategy, performance and responsibility
Financial performance
Balance sheet
| % change from | ||||||||||||
| CHF million | 31.12.08 | 31.12.07 | 31.12.07 | |||||||||
Assets | ||||||||||||
| Cash and balances with central banks | 32,744 | 18,793 | 74 | |||||||||
| Due from banks | 64,451 | 60,907 | 6 | |||||||||
| Cash collateral on securities borrowed | 122,897 | 207,063 | (41 | ) | ||||||||
| Reverse repurchase agreements | 224,648 | 376,928 | (40 | ) | ||||||||
| Trading portfolio assets | 271,838 | 660,182 | (59 | ) | ||||||||
| Trading portfolio assets pledged as collateral | 40,216 | 114,190 | (65 | ) | ||||||||
| Positive replacement values | 854,100 | 428,217 | 99 | |||||||||
| Financial assets designated at fair value | 12,882 | 11,765 | 9 | |||||||||
| Loans | 340,308 | 335,864 | 1 | |||||||||
| Financial investments available-for-sale | 5,248 | 4,966 | 6 | |||||||||
| Accrued income and prepaid expenses | 6,141 | 11,953 | (49 | ) | ||||||||
| Investments in associates | 892 | 1,979 | (55 | ) | ||||||||
| Property and equipment | 6,706 | 7,234 | (7 | ) | ||||||||
| Goodwill and intangible assets | 12,935 | 14,538 | (11 | ) | ||||||||
| Other assets | 19,094 | 20,312 | (6 | ) | ||||||||
Total assets | 2,015,098 | 2,274,891 | (11 | ) | ||||||||
Liabilities | ||||||||||||
| Due to banks | 125,628 | 145,762 | (14 | ) | ||||||||
| Cash collateral on securities lent | 14,063 | 31,621 | (56 | ) | ||||||||
| Repurchase agreements | 102,561 | 305,887 | (66 | ) | ||||||||
| Trading portfolio liabilities | 62,431 | 164,788 | (62 | ) | ||||||||
| Negative replacement values | 851,803 | 443,539 | 92 | |||||||||
| Financial liabilities designated at fair value | 101,546 | 191,853 | (47 | ) | ||||||||
| Due to customers | 474,774 | 641,892 | (26 | ) | ||||||||
| Accrued expenses and deferred income | 10,196 | 22,150 | (54 | ) | ||||||||
| Debt issued | 197,254 | 222,077 | (11 | ) | ||||||||
| Other liabilities | 34,040 | 61,496 | (45 | ) | ||||||||
Total liabilities | 1,974,296 | 2,231,065 | (12 | ) | ||||||||
Equity | ||||||||||||
| Share capital | 293 | 207 | 42 | |||||||||
| Share premium | 25,250 | 12,433 | 103 | |||||||||
| Net income recognized directly in equity, net of tax | (4,471 | ) | (1,161 | ) | (285 | ) | ||||||
| Revaluation reserve from step acquisitions, net of tax | 38 | 38 | 0 | |||||||||
| Retained earnings | 14,892 | 35,795 | (58 | ) | ||||||||
| Equity classified as obligation to purchase own shares | (46 | ) | (74 | ) | 38 | |||||||
| Treasury shares | (3,156 | ) | (10,363 | ) | 70 | |||||||
Equity attributable to UBS shareholders | 32,800 | 36,875 | (11 | ) | ||||||||
| Equity attributable to minority interests | 8,002 | 6,951 | 15 | |||||||||
Total equity | 40,802 | 43,826 | (7 | ) | ||||||||
Total liabilities and equity | 2,015,098 | 2,274,891 | (11 | ) | ||||||||
44
Table of Contents
Strategy, performance and responsibility |
2008 asset development
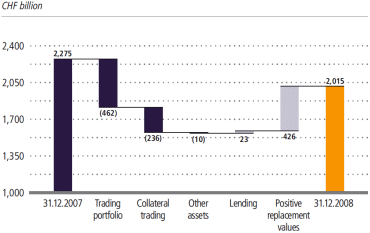
31.12.08 vs 31.12.07:
Lending and borrowing
Lending
tially offset by lower volumes from the Investment Bank prime brokerage business and from lombard lending in Global Wealth Management & Business Banking. The Swiss loan portfolio remained stable during 2008 at around CHF 163 billion.
Borrowing
Repurchase/reverse repurchase agreements
and securities borrowing/lending
Secured lending on the asset side of the balance sheet, the sums of cash collateral on securities borrowed and reverse repurchase agreements declined during 2008 to CHF 348 billion on 31 December 2008. The CHF 236 billion decline occurred almost entirely in the Investment Bank, where the matched book was reduced as part of its overall balance sheet reduction (the matched book is a repurchase agreement portfolio comprised of assets and liabilities with equal maturities and equal value so that the market risks substantially cancel each other out). Furthermore, as part of the Investment Bank’s balance sheet reduction measures, its trad-
45
Table of Contents
Strategy, performance and responsibility
Financial performance
ing short positions were reduced CHF 102 billion, which resulted in lower short-coverings via reverse repurchase agreements and securities borrowing transactions.
Trading portfolio
Significant reductions were achieved in the trading portfolio, which declined CHF 462 billion during 2008, or CHF 445 billion on a currency-adjusted basis. At the end of 2008, the trading portfolio stood at CHF 312 billion. The majority of the decrease related to the Investment Bank’s overall balance sheet reductions and occurred within the fixed income, currencies and commodities (FICC) business area and the equities business area. In FICC, trading inventories in a number of areas, including real estate, securitization and commodities, were substantially reduced, including USD 16.4 billion of illiquid assets transferred to the Swiss National Bank StabFund and approximately CHF 26 billion (represents fair values at the reclassification dates) of trading assets reclassified in fourth quarter 2008 to banking book as “Loans and receivables”. The reduction in equities inventories was mainly a result of stock market declines. Reductions occurred across all trading products, with debt instruments declining CHF 278 billion, equity instruments falling CHF 130 billion, traded loans falling CHF 35 billion and precious metals falling CHF 19 billion.
Replacement values
The positive and the negative replacement values (RVs) of derivative instruments developed in parallel, showing continued strong rises during 2008, driven by increased market valuations, while notional values declined 2% year-on-year. Positive RVs grew CHF 426 billion to CHF 854 billion in 2008, while the negative RVs of derivative instruments increased CHF 408 billion to CHF 852 billion. In both cases, the increases were largely driven by movements in currencies (for example, the weakening of the US dollar), lower interest rates and widening credit spreads. Increases occurred across almost all derivative products, with interest rate contracts growing by CHF 211 billion, foreign exchange contracts by CHF 123 billion and credit derivative contracts by CHF 92 billion.
Shareholders’ equity
On 31 December 2008, equity attributable to UBS shareholders was CHF 32.8 billion, representing a decrease of CHF 4.1 billion compared with 31 December 2007.
Equity attributable to UBS shareholders development
| Net income | Equity | ||||||||||||||||||||||||
| recognized | attributable | ||||||||||||||||||||||||
| Share | directly | Retained | Treasury | to UBS | |||||||||||||||||||||
| CHF billion | Share capital | premium | in equity | earnings | shares | shareholders | |||||||||||||||||||
Starting balance | 0.2 | 12.4 | (1.2 | ) | 35.8 | (10.4 | ) | 36.9 | |||||||||||||||||
| Net loss attributable to UBS shareholders | (20.9 | ) | (20.9 | ) | |||||||||||||||||||||
of which: amount relates to MCNs issued in March 20081 | 3.7 | ||||||||||||||||||||||||
of which: amount relates to MCNs issued in December 20082 | 0.7 | ||||||||||||||||||||||||
| Rights issue | 0.1 | 15.5 | 15.6 | ||||||||||||||||||||||
MCNs issued in March 20081 | 7.0 | 7.0 | |||||||||||||||||||||||
MCNs issued in December 20082 | (3.6 | ) | (3.6 | ) | |||||||||||||||||||||
| Share-based compensation plans/sale of treasury shares | (6.6 | ) | 7.2 | 0.6 | |||||||||||||||||||||
| Others | 0.5 | (3.3 | ) | (2.8 | ) | ||||||||||||||||||||
Ending balance | 0.3 | 25.2 | (4.5 | ) | 14.9 | (3.2 | ) | 32.8 | |||||||||||||||||
46
Table of Contents
Strategy, performance and responsibility |
Off-balance sheet
Contractual obligations
The table below includes contractual obligations as of 31 December 2008.
Off-balance sheet arrangements
In the normal course of business, UBS enters into arrangements that, under International Financial Reporting Standards, lead to either de-recognition of financial assets and liabilities for which UBS has transferred substantially all risks and rewards, or the non-recognition of financial assets (and liabilities) received for which UBS has not assumed the related risks and rewards. UBS recognizes these types of arrangements on the balance sheet to the extent of its involvement, which, for example, may be in the form of derivatives, guarantees, financing commitments or servicing rights.
on the balance sheet, with the resulting loss or gain recorded in the income statement. It should be noted that in many instances the amount recognized on the balance sheet does not represent the full gain or loss potential inherent in such arrangements. Generally, these arrangements either meet the financial needs of customers or offer investment opportunities through entities that are not controlled by UBS.
Risk positions
Liquidity facilities and similar obligations
| Contractual obligations | ||||||||||||||||
| Payment due by period | ||||||||||||||||
| CHF million | <1 year | 1–3 years | 3–5 years | >5 years | ||||||||||||
| Long-term debt | 36,024 | 42,188 | 31,869 | 77,100 | ||||||||||||
| Capital lease obligations | 63 | 104 | 40 | 0 | ||||||||||||
| Operating leases | 1,034 | 1,799 | 1,405 | 2,573 | ||||||||||||
| Purchase obligations | 202 | 166 | 85 | 0 | ||||||||||||
| Other liabilities | 3,718 | 121 | 1,406 | 0 | ||||||||||||
Total | 41,041 | 44,378 | 34,805 | 79,673 | ||||||||||||
47
Table of Contents
Strategy, performance and responsibility
Financial performance
| Off-balance sheet arrangements, risks, | Disclosure in the annual report | ||||
| consolidation and fair value measurements | |||||
| Contractual obligations | Strategy, performance and responsibility, “Off-balance sheet” section | ||||
| Credit guarantees, performance guarantees, undrawn irrevocable credit facilities, and similar instruments | Strategy, performance and responsibility, “Off-balance sheet” section | ||||
| Private equity funding commitments and equity underwriting commitments | Strategy, performance and responsibility, “Off-balance sheet” section | ||||
| Derivative financial instruments | Financial statements, “Note 23 Derivative instruments and hedge accounting” | ||||
| Credit derivatives | Financial statements, “Note 23 Derivative instruments and hedge accounting” | ||||
| Leases | Financial statements, “Note 25 Operating lease commitments” | ||||
| Non-consolidated securitization vehicles and collaterialized debt obligations – non-agency transactions | Strategy, performance and responsibility, “Off-balance sheet” section | ||||
| Support to non-consolidated investment funds | Strategy, performance and responsibility, “Off-balance sheet” section | ||||
| Securitizations (banking book only) | Risk and treasury management, “Basel II Pillar 3 disclosures” section | ||||
| Risk concentrations | Risk and treasury management, “Risk concentrations” section | ||||
| Credit risk information | Risk and treasury management, “Credit risk” section | ||||
| Market risk information | Risk and treasury management, “Market risk” section | ||||
| Liquidity risk information | Risk and treasury management, “Liquidity and funding management” section | ||||
| Consolidation | Financial statements, “Critical accounting policies” section | ||||
| Fair value measurements, including sensitivity and level 3 impact on the income statement consolidation | Financial statements, “Note 27 Fair value of financial instruments” | ||||
Non-consolidated securitization vehicles and collateralized debt obligations
| – | Sale and expected sale of positions to a fund owned and controlled by the Swiss National Bank (for a total volume of USD 38.6 billion). | |
| – | Sale of a portfolio of US residential mortgage-backed securities for proceeds of USD 15 billion to the RMBS Opportunities Master Fund, LP, a third-party entity managed by BlackRock, Inc. | |
| – | Several other true sales of asset-backed securities portfolios to third parties without recourse. | |
| – | In addition, UBS announced the repositioning of its fixed income, currencies and commodities (FICC) business around client servicing and facilitation. The repositioning includes a substantial downsizing or exiting of real estate, securitization, and proprietary trading activities. |
48
Table of Contents
Strategy, performance and responsibility |
Consolidation of securitization vehicles and CDOs
Risks resulting from non-consolidated securitization vehicles and CDOs
| Non-consolidated securitization vehicles and collateralized debt obligations – non-agency transactions1 | ||||||||||||||||||||||||
| CHF billion | Total SPE assets | Involvements in non-consolidated SPEs held by UBS | ||||||||||||||||||||||
| Purchased and | ||||||||||||||||||||||||
| Original | Current | retained interests, and | ||||||||||||||||||||||
| principal | principal | Delinquency | loans held by UBS2 | Derivatives held by UBS | ||||||||||||||||||||
| As of 31 December 2008 | outstanding | outstanding | amounts | Fair value | Fair value | Nominal value | ||||||||||||||||||
Originated by UBS3 | ||||||||||||||||||||||||
CDOs and CLOs | ||||||||||||||||||||||||
| Residential mortgage | 23.1 | 8.8 | 0.5 | 1.1 | 0.6 | 4.0 | ||||||||||||||||||
| Commercial mortgage | 0.0 | 0.0 | 0.0 | 0.1 | (0.5 | ) | 0.7 | |||||||||||||||||
| Other ABS | 0.5 | 0.5 | 0.0 | 0.0 | 0.1 | 0.1 | ||||||||||||||||||
Securitizations | ||||||||||||||||||||||||
| Residential mortgage | 57.3 | 43.1 | 2.3 | 0.0 | (0.3 | ) | 12.7 | |||||||||||||||||
| Commercial mortgage | 21.2 | 17.3 | 1.4 | 0.2 | 0.0 | 0.0 | ||||||||||||||||||
| Other ABS | 3.8 | 1.1 | 0.1 | 0.0 | 0.0 | 5.1 | ||||||||||||||||||
Total | 105.9 | 70.8 | 4.3 | 1.4 | (0.1 | ) | 22.6 | |||||||||||||||||
Not originated by UBS | ||||||||||||||||||||||||
CDOs and CLOs | ||||||||||||||||||||||||
| Residential mortgage | 330.8 | 169.5 | 17.1 | 3.4 | 1.9 | 8.7 | ||||||||||||||||||
| Commercial mortgage | 6.7 | 1.3 | 0.0 | 0.6 | 0.1 | 0.9 | ||||||||||||||||||
| Other ABS | 53.1 | 18.6 | 0.7 | 4.8 | 1.2 | 3.4 | ||||||||||||||||||
Securitizations | ||||||||||||||||||||||||
| Residential mortgage | 1,259.7 | 616.5 | 81.6 | 3.5 | (2.4 | ) | 29.1 | |||||||||||||||||
| Commercial mortgage | 555.0 | 476.1 | 3.7 | 4.2 | 0.0 | 0.0 | ||||||||||||||||||
| Other ABS | 301.7 | 142.8 | 5.5 | 3.4 | 0.0 | 2.2 | ||||||||||||||||||
Total | 2,507.0 | 1,424.8 | 108.6 | 19.9 | 0.8 | 44.3 | ||||||||||||||||||
49
Table of Contents
Strategy, performance and responsibility
Financial performance
Support to non-consolidated investment funds
Guarantees and similar obligations
50
Table of Contents
Strategy, performance and responsibility |
Clearinghouse and future exchange memberships
Swiss deposit insurance
Private equity funding commitments and equity underwriting commitments
Commitments1
The table below shows the maximum committed amount of commitments.
| 31.12.08 | 31.12.07 | |||||||||||||||||||||||
| Sub- | Sub- | |||||||||||||||||||||||
| CHF million | Gross | participations | Net | Gross | participations | Net | ||||||||||||||||||
| Credit guarantees and similar instruments | 13,124 | (344 | ) | 12,780 | 13,381 | (593 | ) | 12,788 | ||||||||||||||||
| Performance guarantees and similar instruments | 3,596 | (446 | ) | 3,150 | 3,969 | (464 | ) | 3,505 | ||||||||||||||||
| Documentary credits | 2,979 | (415 | ) | 2,564 | 3,474 | (517 | ) | 2,957 | ||||||||||||||||
Total commitments | 19,699 | (1,205 | ) | 18,494 | 20,824 | (1,574 | ) | 19,250 | ||||||||||||||||
Undrawn irrevocable credit facilities | 60,316 | (1 | ) | 60,315 | 83,980 | (2 | ) | 83,978 | ||||||||||||||||
51
Table of Contents
Strategy, performance and responsibility
Financial performance
Cash flows
2008
At 31 December 2008, the level of cash and cash equivalents rose to CHF 179.7 billion, up CHF 30.6 billion from CHF 149.1 billion at the end of 2007.
Operating activities
Investing activities
Financing activities
2007
At 31 December 2007, the level of cash and cash equivalents rose to CHF 149.1 billion, up CHF 13.0 billion from CHF 136.1 billion at the end of 2006.
Operating activities
Investing activities
52
Table of Contents
Strategy, performance and responsibility |
Financing activities
53
Table of Contents
Strategy, performance and responsibility
UBS employees
UBS employees
UBS relies on the expertise and commitment of its employees to meet clients’ needs. For employees, UBS’s wide range of businesses, global career opportunities and an open and collaborative culture offer a platform for individual success.
Investing in UBS employees
UBS relies on the expertise, talent and commitment of its employees to meet clients’ needs and deliver results for the firm. Engaging, developing and retaining a high-value workforce is therefore a priority, and in 2008 UBS continued to judiciously invest in its personnel. This investment will help ensure that the firm has the range of skills and experience necessary to meet client needs now and to grow the firm when market conditions improve. UBS invests in its employees whether they are new hires, seasoned staff, key talent or senior managers. The graph below highlights the most important factors driving the value created by UBS personnel.
UBS workforce
Gender distribution by geographical region1
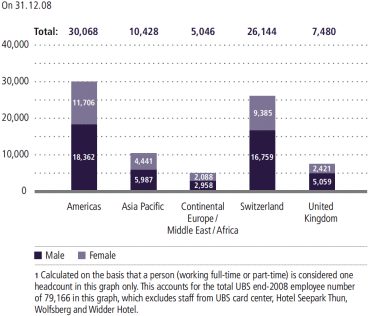
number of employees transferred from Switzerland, with 143 going to Asia Pacific, 92 going to the Americas, 63 to the UK and 57 to locations in Europe, the Middle East & Africa. Cross-division mobility was lower in 2008 than in 2007, with 784 employees changing divisions during the course of
Investing in employees

54
Table of Contents
Strategy, performance and responsibility |
Personnel
Regional distribution
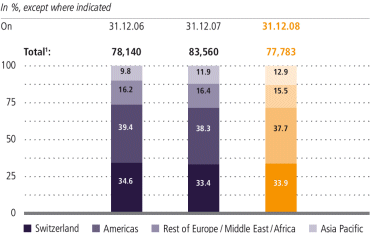
Business unit distribution
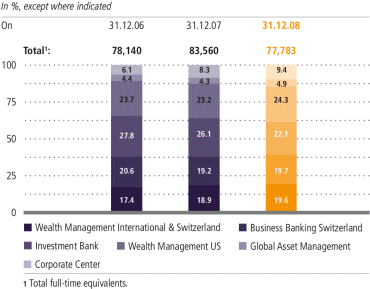
the year, versus 903 in 2007. At 238 employees, transfers from the Investment Bank to Global Wealth Management & Business Banking were most common.
Recruiting staff
year to reduce personnel costs, increase personnel efficiency and improve the ratio of front-office to back-office staff. As UBS believes the long-term trends for wealth and asset management remain positive, particular emphasis was placed on hiring client advisors in 2008. Among other things, a new “Fast Forward” initiative was introduced to improve the hiring, retention and productivity of client advisors and front-office managers. More effective recruitment, integration, and skill and competency development processes are supported by line manager coaching.
Gender distribution by employee category1
| On 31.12.08 | Officers | Non-officers | Total | |||||||||||||||||||||
| Number | % | Number | % | |||||||||||||||||||||
| Male | 30,788 | 75.0 | 18,337 | 48.1 | 49,125 | 62.1 | ||||||||||||||||||
| Female | 10,283 | 25.0 | 19,758 | 51.9 | 30,041 | 37.9 | ||||||||||||||||||
| Total | 41,071 | 100.0 | 38,095 | 100.0 | 79,166 | 100.0 | ||||||||||||||||||
55
Table of Contents
Strategy, performance and responsibility
UBS employees
Developing and sustaining a diverse workforce
Performance management
Compensation and incentives
| – | use carefully selected performance measures, rigorous performance management and a strict pay-for-performance relationship to support UBS’s business strategy; | |
| – | support reward opportunities by consistently communicating UBS’s business strategy and promoting a meritocratic culture; | |
| – | provide competitive total compensation opportunities to enable UBS to attract and retain talent; | |
| – | balance compensation components to meet short-term needs while focusing on mid- to long-term objectives; and | |
| – | encourage employee share ownership to strengthen the alignment between employee and shareholder interests. |
Employee share ownership
56
Table of Contents
Strategy, performance and responsibility |
Leadership development
UBS takes a structured approach to both talent management and leadership development, understanding that both capabilities are important factors in ensuring high-quality client service and long-term business success.
Commitment
While meeting the needs of clients is UBS’s ultimate purpose, it is the firm’s corporate values that lay the foundation for its long-term sustainable growth. These values are integrated into decision making processes, management techniques and the ways in which employees interact with each other in the daily course of business. UBS’s values are clustered into four categories:
| – | Focus on the client: The ultimate purpose of all UBS activities is to increase client satisfaction; | |
| – | Lead yourself: Each individual takes responsibility for his or her own motivation, development and success; | |
| – | Lead others: Everyone can lead others by being a role model, appreciating others’ successes and supporting one another’s endeavors. Leading others is about creating a collaborative environment and developing people on the basis of meritocracy and diversity; | |
| – | Act with integrity: UBS upholds the law, respects regulations and behaves in a principled way. UBS is self-aware and has the courage to face the truth. UBS maintains the highest ethical standards. |
Measuring employee perceptions
Launched in February 2008, this Group-wide initiative brings together senior client-facing employees from different divisions for a one-and-a-half-day workshop designed to improve UBS’s ability to meet the diverse needs of its clients and to increase UBS’s share of business
with them. Participants learn about relevant products and services in the other divisions, build cross-division partnerships and learn how to work more effectively across boundaries. Seventeen regional workshops, each focusing on a specific client segment such as family offices, hedge funds
and financial institutions, or on a specific region such as Western Europe, brought nearly 500 senior client-facing participants together. Almost 400 cross-divisional client service opportunities were shared, ultimately bringing in more than USD 300 million in net new money to UBS.
57
Table of Contents
Strategy, performance and responsibility
UBS employees
core set of questions across all divisions provides a comprehensive view of employee opinions.
Employee assistance
support for child care, academic services and issues surrounding elder care, work performance and personal conflicts. In the UK, the program is part of a health and wellbeing program including onsite medical specialists, emergency childcare, counseling and referral services. In Switzerland, UBS offers professional assistance for current and retired employees, as well as family members, through its HR Social Counseling and HR Retiree Service.
58
Table of Contents
Strategy, performance and responsibility |
Employee representation
Select 2008 awards
“100 Best Companies for Working Mothers in the US”
(Working Mother magazine 2003–2008)
“No. 1 employer of choice for business graduates in Switzerland”
(Universum Switzerland 2008)
“Top 100 Employers for Lesbian, Gay and Bisexual People in Britain”
(Stonewall Workplace Equality Index 2008)
“Best Graduate Recruitment and Development Program”
(UBS EXPLORE Graduate Program)
(Graduate Solutions 2008)
“UBS’s learning programs: awards in three categories”
(Corporate University Xchange 2008)
59
Table of Contents
Strategy, performance and responsibility
Corporate responsibility
Corporate responsibility
Corporate responsibility contributes to UBS’s goal of sustainable value creation.
As a leading global financial services firm, UBS is confronted with the concerns and expectations of a wide and diverse range of stakeholders. Along with clients, investors and employees, for example, various government regulators and suppliers can also be said to have a stake in the company to varying degrees. In a broader sense, the communities in which UBS has a presence are stakeholders too.
Adherence to the United Nations Global Compact initiative
In 2000, UBS became one of the first companies to sign the United Nations (UN) Global Compact. This global corporate responsibility initiative unites governments, business, labor
organizations and civil society, fostering adherence to 10 principles covering the areas of human rights, labor standards, the environment and anti-corruption. UBS considers the initiative, which had over 5,200 corporate participants at the end of 2008, to be an important yardstick providing guidance for its key corporate responsibility initiatives and activities. In addition, by participating in the Swiss UN Global Compact network, UBS contributes actively to important corporate responsibility discussions across industrial sectors among Swiss-based companies.
Labor standards and human rights
Operational corporate responsibility at UBS

60
Table of Contents
Strategy, performance and responsibility |
line. It also continued the development of industry sector guidelines to support the consistent identification and assessment of environmental and social risks in the firm’s banking activities.
| è | Refer to the “UBS employees” section of this report for more information on labor standards and diversity programs | ||
| è | Refer to the discussion on supply chain management and environmental risk management below for more information on the responsible supply chain guidelines and on industry sector guidelines |
Environment
| è | Refer to www.ubs.com/environment for more information on UBS’s environmental policies |
Fighting corruption
against corruption by the business divisions is well under way, and training materials developed by the Group Money Laundering Prevention Unit (GMLPU) have formed the basis for business division training modules that raise awareness of new and revised topics. In some instances web-based training programs have also been developed.
| è | Refer to the discussion on preventing money laundering below for more information on UBS’s AML activities |
External recognition
The firm’s corporate responsibility work has been widely recognized, and UBS has been included in many indexes that track such efforts. It has, for example, been a component of the Dow Jones Sustainability Indexes since their inception in 1999. These indexes track the financial performance of the leading sustainability-driven companies worldwide. UBS is also included in the FTSE4Good Index, which measures the performance of global companies in the areas of environmental sustainability, stakeholder relations and support for human rights.
Corporate responsibility governance
The corporate responsibility committee was established in 2001 and, as a Board of Directors (BoD) committee, it supports the BoD’s efforts to safeguard and advance UBS’s reputation for responsible conduct. As part of the governance changes introduced by UBS in 2008, the committee’s charter was revised and updated. Under the revised charter, the committee is mandated to review and assess how UBS should meet the evolving corporate responsibility expectations of its stakeholders. It also has responsibility for monitoring the firm’s corporate responsibility policies and regulations, as well as the implementation of its corporate responsibility activities and commitments. Headed by the Chairman of the BoD, the committee includes three other BoD members. A new advisory panel to the committee has also been established consisting of members of the GEB and other senior managers. The panel participates in committee meetings and implements its recommendations. Meetings are held at least twice a year, with the agenda and documentation prepared by the committee chair and the corporate responsibility management function of UBS’s chief communication officer area.
61
Table of Contents
Strategy, performance and responsibility
Corporate responsibility
The GEB is responsible for UBS’s environmental policy and nominates a Group environmental representative, a function currently held by the firm’s Chief Risk Officer. A committee, comprising both Group and divisional environmental representatives, is tasked with overseeing the implementation of UBS’s environmental policy and providing guidance to the different business divisions in their implementation of the “UBS Statement on Human Rights”.
Corporate responsibility: training and
raising awareness
UBS strives to increase employee awareness of its corporate responsibility processes, activities and commitments. General information is published on the firm’s intranet and in em-
ployee magazines. In 2008, 2,800 employees participated in training and awareness-raising activities dealing with corporate responsibility. Specific training is also given to staff working in the areas of AML and environmental management. It is mandatory for AML and compliance staff to complete a training program every two years, and new joiners in all UBS business divisions receive training in the issue of anti-corruption as part of their induction process. Furthermore, in 2008, 5,232 employees participated in training on environmental issues, with 3,905 receiving general education on UBS’s environmental policy and programs, mostly in induction training, and 1,327 employees receiving specialist training targeted at their area of expertise and impact.
Preventing money laundering, corruption and
terrorist financing
UBS takes its responsibility to preserve the integrity of the financial system, and its own operations, very seriously. The firm has developed extensive policies intended to prevent, detect and report money laundering, corruption and terrorist financing. These policies seek to protect the firm, and its reputation, from those who may intend to legitimize their ill-gotten gains through UBS.
UBS’s corporate responsibility governance process
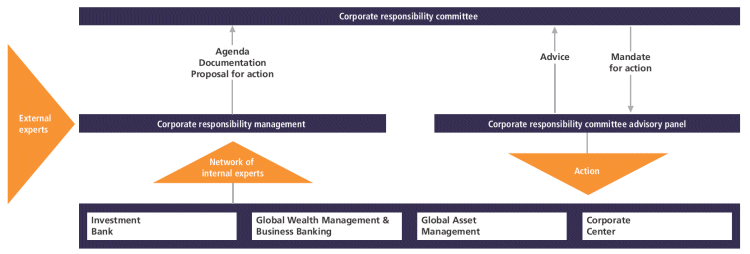
62
Table of Contents
Strategy, performance and responsibility |
ample, the creation of a uniform country risk framework). UBS also seeks to ensure its employees adhere to the firm’s strict know-your-customer regulations, while at the same time not treating clientsa priorias criminals or undermining their right to privacy. Employees regularly undergo training in AML-related issues and new trends, be it through online training, awareness campaigns or seminars. UBS also utilizes advanced technology to assist in the identification of transaction patterns or unusual dealings.
Supply chain management
In 2008, UBS spent over CHF 6.9 billion purchasing a wide range of products and services from suppliers and contractors around the world. UBS has established processes to manage environmental and human rights issues in relevant areas of its supply chain such as client gifts, IT equipment and energy sourcing. In order to further incorporate these issues into procurement processes, UBS has developed a supply chain guideline, which provides Group-wide guidance on identifying, assessing and monitoring supplier practices in the areas of human and labor rights, the environment and corruption. Examples of human rights issues that have been included are avoidance of child and forced labor, non-discrimination, remuneration, hours of work, freedom of association, humane treatment, and health and safety. In 2008, the guideline was gradually applied to new contracts and contract renewals with suppliers. By the end of the year
around 100 suppliers had been screened according to the guideline’s social and environmental criteria, and responsible supply chain requirements were included in the contractual arrangement with those suppliers who were awarded contracts. Also, some 170 procurement and sourcing officers were trained on the relevance and application of the new guidelines.
Community investment
UBS, together with its employees, seeks to have a positive influence on the social and environmental well-being of the local communities in which it operates. The firm does this through its community affairs program.
Client foundation
63
Table of Contents
Strategy, performance and responsibility
Corporate responsibility
Americas:In partnership with Northwestern University, UBS launched a program to identify and develop future leaders in the non-profit sector. According to the Donors Forum of Chicago, the non-profit sector will see a large turnover in its local and national executive leadership in the next five years, with nearly 60% of executive directors set to retire. This program produced its first graduates in 2008 and four UBS fellows took classes at Northwestern and were mentored by a UBS senior executive.
dialogue, discussion, sharing and learning. Modeled on UBS leadership programs, it gave 20 promising young leaders from the non-profit sector a chance to learn from UBS and external speakers about topics related to leadership, governance, strategic planning, communication and mentorship.
participants and donations collected.
| è | Refer to www.ubs.com/ corporateresponsibility for more information on UBS’s community affairs program |
organizations, focusing on the key themes of children and of medical and biological research. The projects involve close collaboration with respected partner organizations and are selected by a team of specialists within the foundation, who also closely monitor their implementation. The costs of managing and administering the UBS Optimus Foundation are borne by UBS, so that the full contribution of each client reaches the projects. In 2008, the UBS Optimus Foundation spent over CHF 17 million supporting 71 projects in Africa, Asia Pacific, Europe and North and South America.
UBS and the environment
Through its commitment to the environment, embodied in its environmental policy, UBS aims to create long-term value for the firm and its clients and the communities they live in. The policy is based on five principles, under which the firm is continuously:
| – | seeking to consider environmental risks in all UBS businesses, especially in lending, investment banking, advisory and research, and UBS’s own investments; | |
| – | seeking to pursue opportunities in the financial markets for environmentally friendly products and services, such as socially responsible investments; |
| – | seeking ways to reduce UBS’s direct environmental impact on air, soil and water from in-house operations, with a primary focus on reducing greenhouse gas emissions. UBS also assesses the environmental impact of its suppliers’ products and services; | |
| – | ensuring efficient implementation of UBS’s policy through a global environmental management system certified according to ISO 14001 – the international environmental management standard; | |
| – | integrating environmental considerations into internal communications and training. |
Environmental management system
UBS’s environmental management system covers both its banking activities and in-house operations and has been certified under the ISO 14001 standard since 1999. ISO 14001 requires that the system be audited annually and recertified every three years. UBS successfully passed the extensive ISO 14001 recertification audit in 2008. Conducted by Société Générale de Surveillance (SGS), 24 days of audits involving 163 employees were undertaken. SGS confirmed that a well-performing environmental management system, integrated in the organization and suitable for manag-
64
Table of Contents
Strategy, performance and responsibility |
The five principles of UBS’s environmental policy

ing environmental risks and improving environmental performance on a continual basis, is in place.
Environmental products and services
During the last ten years UBS has developed a range of products and services that meet or anticipate clients’ needs in environmental and socially responsible investments (SRI). This offering currently stretches across UBS’s businesses in wealth management, investment banking, asset management, and retail and commercial banking. It includes SRI funds, research and advisory services provided to private and institutional clients, access to the world’s capital markets for renewable energy firms and, in Switzerland, “green” mortgages.
Investment products and advisory
the launch of two new SRI products, the UBS (Lux) Equity Sicav – Emerging Markets Innovators and the UBS Strategy Certificate Energy Efficiency. UBS’s SRI offering is diverse and includes products managed according to “best-in-class” practices and theme-based approaches. “Best-in-class” is an active equity management approach that is based on stock selection of companies that generate above-average environmental, social and economic performance. The “best-in-class” offering includes a global fund and a European fund. The theme-based approach focuses investment on segmented climate change, water and demographics strategies.
Socially responsible investments invested assets1
| % change | ||||||||||||||||||||
| For the year ended | from | |||||||||||||||||||
CHF billion, except where indicated | GRI2 | 31.12.08 | 31.12.07 | 31.12.06 | 31.12.07 | |||||||||||||||
UBS | 2,174 | 3,189 | 2,989 | (32 | ) | |||||||||||||||
UBS SRI3 products and mandates | ||||||||||||||||||||
| positive criteria | FS11 | 2.12 | 5.20 | 1.84 | (59 | ) | ||||||||||||||
| exclusion criteria | FS11 | 14.05 | 33.33 | 16.17 | (58 | ) | ||||||||||||||
Third-party | FS11 | 1.85 | 1.08 | N/A | 72 | |||||||||||||||
Total SRI invested assets | FS11 | 18.03 | 39.61 | 18.01 | (54 | ) | ||||||||||||||
Proportion of total invested assets (%)4 | 0.83 | % | 1.24 | % | 0.60 | % | ||||||||||||||
Positive criteria:apply to the active selection of companies, focusing on how a company’s strategies, processes and products impact its financial success, the environment and society. This includes best-in-class or thematic investments.
Exclusion criteria:companies or sectors are excluded based on environmental, social or ethical criteria, for example, companies involved in weapons, tobacco, gambling, or companies with high negative environmental impacts. This also includes faith-based investing consistent with principles and values of a particular religion.
Third-party:UBS’s open product platform gives clients access to socially responsible investment products from third-party providers. This includes both positive and exclusion criteria, and microfinance investments.
65
Table of Contents
Strategy, performance and responsibility
Corporate responsibility
Research
Financing and advisory services
Carbon trading
the amount of emissions their facilities are allowed to produce. Companies who are able to reduce their emissions below their cap have the ability to sell their unused quota to other companies, thereby creating an emissions market. Through the use of financial instruments, UBS is able to help clients manage their exposure to the emissions markets. UBS ETD (Exchange Traded Derivatives) is an active member of and offers execution and full service clearing on the major emission exchanges in Europe and North America for contracts on EU ETS allowances (EUA), UN Certified Emissions Reductions (CER), Regional Greenhouse Gas Initiative allowances, CCX Carbon Financial Instruments (CFI) and Nitrogen Oxide and Sulfur Dioxide.
Environmental risk management
UBS seeks to identify, manage and control environmental risks in its business transactions. Examples of environmental risk include the impairment of a client’s cash flow or assets by environmental factors (such as inefficient processes or property that is polluted or contaminated) or through liability risk, such as when a bank takes environmentally unsound collateral onto its own books. As environmental risks can manifest themselves across the wide variety of risks inherent in UBS’s business activities, including credit risks, liability risks and reputational risks, UBS has designed environmental procedures and tools for their identification, management and control. These environmental procedures and tools are integrated into existing processes, such as due diligence on transactions or investments and ongoing risk management.
66
Table of Contents
Strategy, performance and responsibility |
writing, financial advisory services and lending. For its part, Global Asset Management has put environmental due diligence processes in place for its real estate and infrastructure funds. If significant potential environmental risks are identified in a transaction, the risks are assessed. Wherever possible, UBS seeks to engage with the client to discuss possible mitigating measures. Where this is not possible or successful, the firm may decline the transaction altogether.
Global Wealth Management & Business Banking
Investment Bank
Global Asset Management
ronmental risks that investments made by UBS on behalf of its clients might imply. The matrix is reviewed annually for applicability and comprehensiveness and forms part of the environmental management system employed within the business division. In 2008, all properties acquired or developed by Global Real Estate for its direct investment vehicles were subject to a thorough environmental due diligence process, in accordance with local regulations and internal best practice guidance. Similar processes are in operation in Infrastructure Asset Management.
Environmental and CO2 footprints
UBS directly impacts the environment in a number of ways: its businesses consume electricity; employees travel for business purposes and use paper and generate waste in the course of their work; and offices require heating and cooling systems. Improving the use of these resources can reduce costs and enhance environmental performance, and UBS therefore has a series of measures to efficiently manage its environmental impact.
CO2 strategy and emission reduction
| – | adopting in-house energy efficiency measures that reduce energy consumption in buildings it operates; | |
| – | increasing the proportion of renewable energy used to avoid emissions at source; | |
| – | offsetting and neutralizing emissions that cannot be reduced by other means. |
UBS’s CO2 footprint
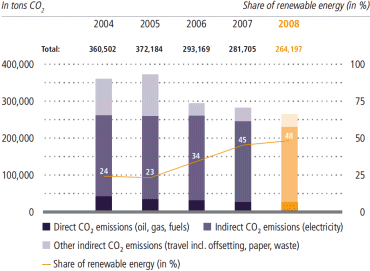
67
Table of Contents
Strategy, performance and responsibility
Corporate responsibility
These measures allowed UBS to further increase the share of renewable energy it purchases, and to reduce its 2008 CO2 emissions by 27% compared with 2004, another step toward achieving the 40% reduction target by 2012.
Energy consumption and energy efficiency
Renewable energy
Business travel and offsetting
Paper and waste
| è | Refer to www.ubs.com/environment for more information on UBS’s environmental management system |
Environmental indicators per full-time employee
| Unit | 2008 | Trend | 2007 | 2006 | ||||||||||||||||
| Total direct and intermediate energy | kWh / FTE | 11,792 | è | 11,942 | 12,736 | |||||||||||||||
| Total business travel | Pkm / FTE | 10,281 | ê | 12,685 | 12,544 | |||||||||||||||
| Total paper consumption | kg / FTE | 167 | ê | 190 | 188 | |||||||||||||||
| Total waste | kg / FTE | 298 | è | 299 | 303 | |||||||||||||||
| Total water consumption | m3 / FTE | 28.1 | ì | 26.7 | 26.0 | |||||||||||||||
CO2 footprint | t / FTE | 3.07r | ê | 3.43 | 3.93 | |||||||||||||||
68
Table of Contents
Strategy, performance and responsibility |
Environmental indicators1
| 20082 | 20072 | 20062 | |||||||||||||||||||||||
| Absolute | Data | Absolute | Absolute | ||||||||||||||||||||||
| GRI3 | normalized4 | quality5 | Trend6 | normalized4 | normalized4 | ||||||||||||||||||||
Total direct and intermediate energy consumption7 | 1,016 GWh | *** | è | 981 GWh | 951 GWh | ||||||||||||||||||||
Total direct energy consumption8 | EN3 | 127 GWh | ** | è | 130 GWh | 154 GWh | |||||||||||||||||||
| natural gas | 83.3% | ** | è | 83.3% | 85.5% | ||||||||||||||||||||
| heating oil | 12.2% | *** | è | 12.1% | 11.8% | ||||||||||||||||||||
| fuels (petrol, diesel, gas) | 4.5% | *** | è | 4.6% | 2.7% | ||||||||||||||||||||
| renewable energy (solar power, etc.) | 0.03% | *** | î | 0.03% | 0.03% | ||||||||||||||||||||
Total intermediate energy purchased9 | EN4 | 890 GWh | *** | è | 851 GWh | 797 GWh | |||||||||||||||||||
| electricity from gas-fired power stations | 11.7% | ** | è | 12.3% | 13.2% | ||||||||||||||||||||
| electricity from oil-fired power stations | 3.7% | *** | ê | 4.2% | 4.5% | ||||||||||||||||||||
| electricity from coal-fired power stations | 18.4% | ** | è | 18.6% | 21.7% | ||||||||||||||||||||
| electricity from nuclear power stations | 11.1% | ** | î | 13.6% | 20.5% | ||||||||||||||||||||
| electricity from hydroelectric power stations | 25.8% | *** | è | 25.5% | 21.4% | ||||||||||||||||||||
| electricity from other renewable resources | 23.1% | *** | è | 22.0% | 12.7% | ||||||||||||||||||||
| district heating | 6.2% | *** | é | 3.8% | 6.0% | ||||||||||||||||||||
Share of renewable energy and district heating | 48% | *** | ì | 45% | 34% | ||||||||||||||||||||
Total business travel | EN29 | 886 m Pkm | *** | ê | 1,042 m Pkm | 936 m Pkm | |||||||||||||||||||
rail travel10 | 3.5% | ** | è | 3.3% | 4.1% | ||||||||||||||||||||
road travel10 | 0.6% | ** | é | 0.5% | 0.6% | ||||||||||||||||||||
| air travel | 96.0% | *** | è | 96.2% | 95.3% | ||||||||||||||||||||
Number of flights (segments) | 398,369 | *** | ê | 446,274 | 402,629 | ||||||||||||||||||||
Total paper consumption | EN1 | 14,403 t | *** | î | 15,593 t | 14,013 t | |||||||||||||||||||
| post-consumer recycled | EN2 | 16.2% | *** | é | 10.5% | 6.2% | |||||||||||||||||||
new fibers FSC11 | 16.6% | *** | é | 10.7% | 0.0% | ||||||||||||||||||||
new fibers ECF + TCF11 | 66.8% | *** | ê | 78.6% | 93.8% | ||||||||||||||||||||
| new fibers chlorine bleached | 0.4% | ** | é | 0.2% | 0.0% | ||||||||||||||||||||
Total waste | EN22 | 25,644 t | *** | è | 24,589 t | 22,631 t | |||||||||||||||||||
| valuable materials separated and recycled | 54.6% | *** | è | 56.3% | 58.2% | ||||||||||||||||||||
| incinerated | 14.3% | *** | î | 15.8% | 12.7% | ||||||||||||||||||||
| landfilled | 31.1% | ** | ì | 27.9% | 29.1% | ||||||||||||||||||||
Total water consumption | EN8 | 2.42 m m | 3 | ** | ì | 2.19 m m | 3 | 1.94 m m | 3 | ||||||||||||||||
Total CO2 footprint12 | 264,197 t | *** | î | 281,705 t | 293,169 t | ||||||||||||||||||||
total direct CO2 emissions (GHG scope 1)13 | EN16 | 26,490 t | *** | è | 26,701 t | 31,519 t | |||||||||||||||||||
total indirect CO2 emissions (GHG scope 2)13 | EN16 | 204,344 t | ** | è | 218,681 t | 230,015 t | |||||||||||||||||||
total other indirect CO2 emissions (GHG scope 3)13 | EN17 | 129,364 t | *** | ê | 149,323 t | 132,635 t | |||||||||||||||||||
total CO2e offsets (business air travel)14 | 96,000 t | *** | ê | 113,000 t | 101,000 t | ||||||||||||||||||||
3Global reporting initiative (see also www.globalreporting.org). “EN” stands for the environmental performance indicators as defined in the GRI. 4Non-significant discrepancies from 100% are possible due to roundings. 5Specifies the estimated reliability of the aggregated data and corresponds approximately to the following uncertainty (confidence level 95%): up to 5% – ***, up to 15% – **, up to 30% – *. “Uncertainty” is the likely difference between a reported value and a real value. 6Trend: at a *** / ** / * data quality, the respective trend is stable (è) if the variance equals 5 / 10 / 15%, low decreasing / increasing (î,ì) if it equals 10 / 20 / 30% and decreasing / increasing if the variance is bigger than 10 / 20 / 30% (ê,é). 7Refers to energy consumed within the operational boundaries of UBS. 8Refers to primary energy purchased which is consumed within the operational boundaries of UBS (oil, gas, fuels). 9Refers to energy purchased that is produced by converting primary energy and consumed within the operational boundaries of UBS (electricity and district heating). 10Rail and road travel: Switzerland only. 11Paper produced from new fibers. “FSC” stands for Forest Stewardship Council, “ECF” for elementary chlorine free and “TCF” for totally chlorine free. 12CO2 footprint equals total CO2 emissions (GHG scope 1, 2 and 3) minus CO2e offsets. 13Refers to ISO 14064 and the “GHG (greenhouse gas) protocol initiative” (www.ghgprotocol.org), the international standards for CO2 reporting: Scope 1 accounts for direct CO2 emissions by UBS; Scope 2 accounts for indirect CO2 emissions associated with the generation of imported / purchased electricity, heat or steam; Scope 3 accounts for indirect CO2 emissions associated with business travel, paper consumption and waste disposal. 14Offsets from third-party GHG reduction projects measured in CO2 equivalents (CO2e). These offsets neutralize CO2 emissions from business air travel.
69
Table of Contents
Strategy, performance and responsibility
Corporate responsibility
70
Table of Contents
Table of Contents
| – | As announced on 10 February 2009, Global Wealth Management & Business Banking has been divided into two business divisions: Wealth Management & Swiss Bank and Wealth Management Americas. | |
| – | The Investment Bank underwent a detailed strategic review in 2008. The result was a repositioning of the business division, personnel and cost reductions and a refocusing of the business division’s activities and businesses. |
Global Wealth Management & Business Banking
Wealth Management International & Switzerland recorded apre-tax profitof CHF 3,601 million in 2008, a decrease from the record profit of CHF 6,310 million in 2007. This is partially due to a provision of CHF 917 million in connection with the US cross-border case. During this period:
Net new moneyoutflows were CHF 101.0 billion compared with inflows of CHF 125.1 billion.Invested assetsdeclined to CHF 870 billion from CHF 1,294 billion. Thegross margin on invested assetsfell six basis points to 97 basis points. Thecost/income ratioincreased to 63.1% from 51.1%.
Wealth Management USrecorded apre-tax lossof CHF 698 million in 2008, compared with a pre-tax profit of CHF 674 million in 2007. 2008 included auction rate securities-related charges of CHF 1,524 million. During this period:
Net new moneyoutflows were CHF 10.6 billion compared with inflows of CHF 26.6 billion.Invested assetsdeclined to CHF 600 billion from CHF 840 billion. Thegross margin on invested assetsincreased seven basis points to 84 basis points. Thecost/income ratioincreased to 111.3% from 89.9%.Recurring incomedeclined 8% to CHF 3,835 million.Revenues per advisordecreased to CHF 735,000 from CHF 828,000.
Business Banking Switzerlandrecorded a pre-tax profit of CHF 2,449 million, up CHF 182 million from 2007. During this period:
Net new moneyoutflows were CHF 11.4 billion compared with inflows of CHF 4.6 billion.Invested assetsdeclined to CHF 129 billion compared with CHF 164 billion. Thecost/income ratiodecreased to 51.2% from 57.7%. Theloan portfoliodeclined 2% to CHF 143 billion. The ratio of theimpaired gross lending portfolioto the total gross lending portfolio improved to 1.0% from 1.2%.
| UBS reporting structure in 2008 | ||||||||||||||||
Global Wealth Management & Business Banking | Global Asset Management | Investment Bank | Corporate Center | |||||||||||||
Wealth Management | ||||||||||||||||
International & Switzerland | ||||||||||||||||
Wealth Management US | ||||||||||||||||
Business Banking Switzerland | ||||||||||||||||
Table of Contents
| Performance from continuing operations before tax | ||||||||||||||||
| For the year ended | % change from | |||||||||||||||
| CHF million | 31.12.08 | 31.12.07 | 31.12.06 | 31.12.07 | ||||||||||||
| Wealth Management International & Switzerland | 3,601 | 6,310 | 5,197 | (43 | ) | |||||||||||
| Wealth Management US | (698) | 674 | 542 | |||||||||||||
| Business Banking Switzerland | 2,449 | 2,267 | 2,281 | 8 | ||||||||||||
Global Wealth Management & Business Banking | 5,352 | 9,251 | 8,020 | (42 | ) | |||||||||||
Global Asset Management | 1,333 | 1,454 | 1,320 | (8 | ) | |||||||||||
Investment Bank | (34,092) | (16,669 | ) | 5,568 | (105 | ) | ||||||||||
Corporate Center | 54 | 2,222 | (789 | ) | (98 | ) | ||||||||||
Global Asset Management
Pre-tax profit decreased 8% to CHF 1,333 million in 2008 from CHF 1,454 million in 2007. During this period:
Net new moneyoutflows were CHF 103.0 billion compared with CHF 15.7 billion.Institutional invested assetsdeclined to CHF 335 billion compared with CHF 522 billion.Wholesale intermediary invested assetsfell to CHF 240 billion compared with CHF 369 billion. Thegross margin on institutional invested assets declined six basis points to 38 basis points. Thegross margin on wholesale intermediary invested assetsfell six basis points to 41 basis points. Thecost/income ratiowas 54.1% compared with 64.5%.
Investment Bank
Pre-tax loss of CHF 34,092 million in 2008, compared with a pre-tax loss of CHF 16,669 million in 2007. During this period:
Thecost/income ratioandcompensation ratio remained not meaningful due to negative overall results in both years.Average regulatory Value at Risk (VaR)(10-day, 99% confidence, five years of historical data) was CHF 374 million compared with CHF 514 million. The ratio of theimpaired gross lending portfolioto the total gross lending portfolio was 3.6%, up from 0.4%.
Corporate Center
The Corporate Center produced a slightly positive result of CHF 54 million in 2008 from continuing operations, compared with a gain of CHF 2,222 million in 2007. During this period,total operating incomedecreased to CHF 1,083 million from CHF 3,562 million andtotal operating expensesdeclined to CHF 1,029 million from CHF 1,340 million.
Table of Contents
UBS business divisions and Corporate Center
Global Wealth Management & Business Banking
Global Wealth Management & Business Banking
Global Wealth Management & Business Banking is a leading global provider of financial services for wealthy clients and the leading bank for individual and corporate clients in Switzerland.
| Business division reporting | ||||||||||||||||
| As of or for the year ended | % change from | |||||||||||||||
| CHF million, except where indicated | 31.12.08 | 31.12.07 | 31.12.06 | 31.12.07 | ||||||||||||
| Income | 21,802 | 24,841 | 21,775 | (12 | ) | |||||||||||
| Credit loss (expense)/recovery | (421) | 28 | 109 | |||||||||||||
Total operating income | 21,381 | 24,869 | 21,884 | (14 | ) | |||||||||||
| Cash components | 9,191 | 10,564 | 9,074 | (13 | ) | |||||||||||
Share-based components1 | 187 | 444 | 377 | (58 | ) | |||||||||||
| Total personnel expenses | 9,378 | 11,008 | 9,451 | (15 | ) | |||||||||||
| General and administrative expenses | 5,367 | 3,178 | 3,078 | 69 | ||||||||||||
| Services (to)/from other business units | 926 | 1,106 | 1,040 | (16 | ) | |||||||||||
| Depreciation of property and equipment | 261 | 241 | 232 | 8 | ||||||||||||
| Amortization of intangible assets | 98 | 85 | 63 | 15 | ||||||||||||
Total operating expenses | 16,030 | 15,618 | 13,864 | 3 | ||||||||||||
Business division performance before tax | 5,352 | 9,251 | 8,020 | (42 | ) | |||||||||||
Key performance indicators | ||||||||||||||||
Cost/income ratio (%)2 | 73.5 | 62.9 | 63.7 | |||||||||||||
Attributed equity and risk-weighted assets | ||||||||||||||||
Average attributed equity (CHF billion)3 | 17.3 | |||||||||||||||
Return on attributed equity (RoaE) (%)4 | 31.0 | |||||||||||||||
BIS risk-weighted assets (CHF billion)5 | 89.2 | 169.7 | 155.2 | |||||||||||||
Return on BIS risk-weighted assets (%)6 | 5.9 | 5.6 | 5.3 | |||||||||||||
Goodwill and intangible assets (CHF billion)7 | 6.2 | 5.8 | 6.0 | |||||||||||||
Additional information | ||||||||||||||||
| Invested assets (CHF billion) | 1,599 | 2,298 | 2,123 | (30 | ) | |||||||||||
Net new money (CHF billion)8 | (123.0) | 156.3 | 114.5 | |||||||||||||
| Client assets (CHF billion) | 2,393 | 3,554 | 3,337 | (33 | ) | |||||||||||
| Personnel (full-time equivalents) | 49,541 | 51,243 | 48,200 | (3 | ) | |||||||||||
74
Table of Contents
UBS business divisions and Corporate Center |
Global Wealth Management & Business Banking business portfolio
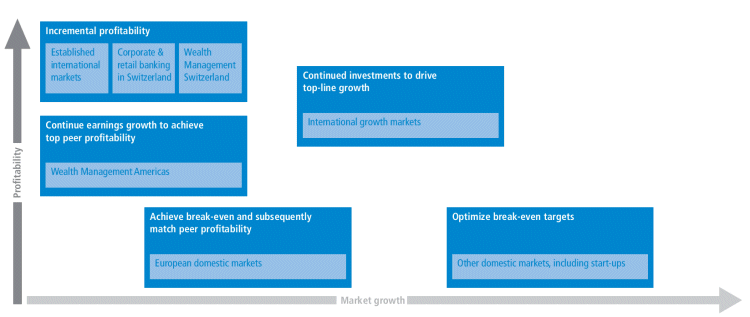
Business
A global branch network delivers comprehensive financial services to wealthy private individuals around the world and to private and corporate clients in Switzerland. All clients are provided with the advice, financial products and tools that fit their individual needs.
Strategy
The cornerstones of this business division’s strategy are:
| – | to strengthen its global leadership in wealth management by actively investing in fast-growing markets and developing a strong focus on high and ultra-high net worth clients; | |
| – | to position UBS as the universal bank of choice in Switzerland by strengthening its position across all client segments, as well as developing clients across segments and therefore each client relationship to its full potential; and | |
| – | to maximize risk-adjusted profits by a balanced focus on top-line growth, risk and efficiency. |
America and the Middle East), UBS will continue to invest actively in order to tap their long-term growth potential. In addition, within the next seven to 10 years UBS plans to establish a significant domestic presence in select markets where its business is not yet mature.
Organizational structure
Formed on 1 July 2005, this business division encompassed UBS’s global wealth management businesses and the Swiss corporate and retail banking unit. Throughout 2008, until the recent reorganization, it comprised the following business units: Wealth Management International & Switzerland, serving wealthy and affluent clients around the world, except domestic clients in the US; Wealth Management US, serving wealthy and affluent domestic US clients; and Business Banking Switzerland, serving retail and corporate clients in Switzerland. Each of these business units is provided with infrastructure, products and services by the business division’s support functions, which also provide services to other UBS business divisions under a transfer pricing mechanism.
75
Table of Contents
UBS business divisions and Corporate Center
Global Wealth Management & Business Banking
Current reporting structure (on 31 December 2008)
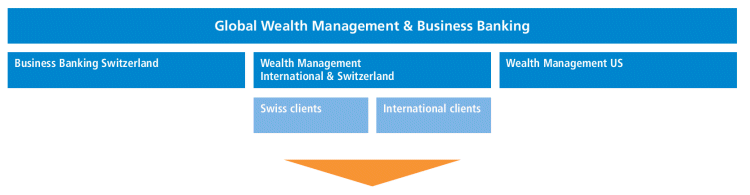
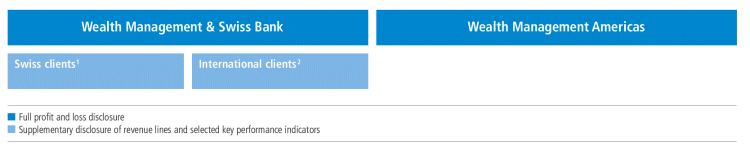
financial report for first quarter 2009. UBS will provide separate segment reporting for Wealth Management & Swiss Bank and Wealth Management Americas. UBS has chosen to subdivide Wealth Management & Swiss Bank into Swiss and international business areas for reporting purposes (income data and key performance indicators):
| – | “Swiss clients” will cover services provided to Swiss retail, wealth management and small businesses, as well as corporate and institutional clients. | |
| – | “International clients” will encompass the international wealth management business conducted out of Switzerland and all wealth management businesses of UBS’s other booking centers in Asia and Europe. |
| è | Prior to publication of first quarter 2009 results, UBS will publish restated business division results on www.ubs.com/investors showing quarterly and annual results for 2007 and 2008 under the new organizational structure announced on 10 February 2009. |
76
Table of Contents
UBS business divisions and Corporate Center |
Wealth Management International & Switzerland
Business description
Business
Wealth management solutions are delivered via this business unit’s global branch network and through financial intermediaries. In addition to the specific wealth management products and services outlined below, clients benefit from UBS’s entire range of resources, from asset management to estate planning and corporate finance advice. An open product platform gives clients access to a wide array of pre-screened, top-quality products from third-party providers that complement UBS’s own product lines. On 31 December 2008, invested assets were CHF 870 billion.
Organizational structure
Throughout 2008, until the recent reorganization, this business unit comprised the following areas: Asia Pacific; Latin America, the Mediterranean, the Middle East and Africa; North, East and Central Europe; and Switzerland. The extensive wealth management branch network consisted of 5,755 client advisors, around 110 offices in Switzerland and more than 100 offices worldwide.
Competitors
Major competitors of this business unit include globally active wealth managers, such as the wealth management operations of Credit Suisse, HSBC and Citigroup. The business unit also competes with private banks that operate mainly within their respective domestic markets, such as
Coutts in the UK, Deutsche Bank AG and Sal. Oppenheim in Germany, Unicredit in Italy, and Swiss banks focused on international clients (such as Julius Baer and Pictet).
Clients and markets
The following client segments are offered sophisticated products and services specifically designed to address their needs: international core affluent clients with investable assets of CHF 250,000 to CHF 2 million; high net worth clients with investable assets of up to CHF 5 million; private wealth management clients with investable assets of CHF 5 million to CHF 50 million; and ultra-high net worth clients with investable assets of more than CHF 50 million. The business unit also provides financial intermediaries, both inside and outside Switzerland, with UBS’s wealth management solutions, products and services.
Products and services
The business unit offers expert financial advice to support clients throughout the different stages of their lives. Wealth planning advice is also given on topics such as the funding of education, gift giving, inheritance and succession. Corporate finance advice is offered to support clients in the process of disposing of corporate assets. Clients can also trade a full range of financial instruments, from single securities, such as equities and bonds, to structured products and alternative investments. The business unit also fulfills the basic banking needs of private clients with a wide variety of products, rang-
Invested assets by asset class
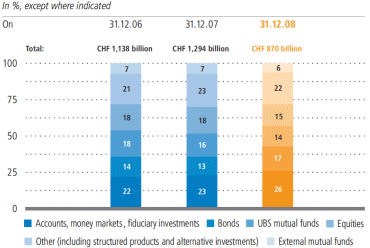
Invested assets by currency
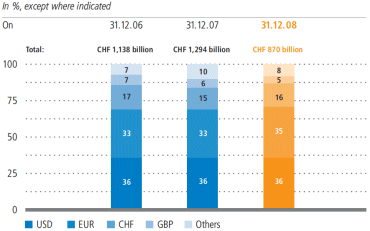
77
Table of Contents
UBS business divisions and Corporate Center
Global Wealth Management & Business Banking
Loan penetration
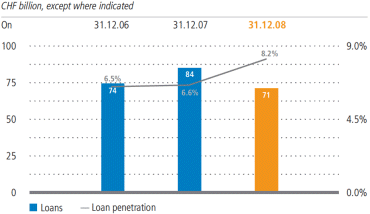
ing from cash accounts and savings accounts to credit cards, mortgages and securities-backed lending.
Invested assets by client domicile
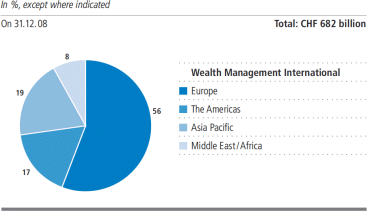
Invested assets by client wealth
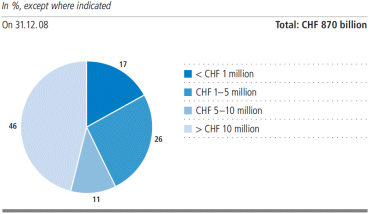
78
Table of Contents
UBS business divisions and Corporate Center |
As announced on 18 February 2009, UBS settled the US cross-border case with the US Department of Justice (DOJ) and the US Securities and Exchange Commission (SEC) by entering into a Deferred Prosecution Agreement (DPA) with the DOJ and a Consent Order with the SEC. As part of these settlement agreements:
| – | UBS will pay a total of USD 780 million (CHF 917 million) to the United States, USD 380 million representing disgorgement of profits from maintaining the US cross-border business and USD 400 million representing US federal backup withholding tax required to be withheld by UBS, together with interest and penalties, and restitution for unpaid taxes associated with certain account relationships involving fraudulent sham and nominee offshore structures and otherwise as covered by the DPA. | |
| – | UBS will complete the exit of the US cross-border business out of non-SEC registered entities, as announced in July 2008, which these settlements now allow UBS to do in a lawful, orderly and expeditious manner. | |
| – | UBS will implement and maintain an effective program of internal controls with respect to compliance with its obligations under its Qualified Intermediary Agreement (QIA) with the Internal Revenue Service (IRS) as well as a revised |
| legal and compliance governance structure in order to strengthen independent legal and compliance controls. | ||
| – | Pursuant to an order issued by the Swiss Financial Market Supervisory Authority (FINMA), information has been transferred to the DOJ regarding accounts of certain US clients as set forth in the DPA, who, based on evidence available to UBS, appear to have committed tax fraud or the like within the meaning of the Swiss-US Double Taxation Treaty. |
79
Table of Contents
UBS business divisions and Corporate Center
Global Wealth Management & Business Banking
Business performance
| Business unit reporting | |||||||||||||||||
| As of or for the year ended | % change from | ||||||||||||||||
| CHF million, except where indicated | 31.12.08 | 31.12.07 | 31.12.06 | 31.12.07 | |||||||||||||
| Income | 10,819 | 12,893 | 10,827 | (16 | ) | ||||||||||||
| Credit loss (expense) / recovery | (390 | ) | (1 | ) | 1 | ||||||||||||
Total operating income | 10,429 | 12,892 | 10,828 | (19 | ) | ||||||||||||
| Cash components | 3,037 | 3,704 | 2,999 | (18 | ) | ||||||||||||
Share-based components1 | 75 | 169 | 174 | (56 | ) | ||||||||||||
| Total personnel expenses | 3,112 | 3,873 | 3,173 | (20 | ) | ||||||||||||
| General and administrative expenses | 2,001 | 1,064 | 885 | 88 | |||||||||||||
of which: impact from US cross-border settlement | 917 | ||||||||||||||||
| Services (to) / from other business units | 1,581 | 1,531 | 1,479 | 3 | |||||||||||||
| Depreciation of property and equipment | 97 | 95 | 84 | 2 | |||||||||||||
| Amortization of intangible assets | 38 | 19 | 10 | 100 | |||||||||||||
Total operating expenses | 6,828 | 6,582 | 5,631 | 4 | |||||||||||||
Business unit performance before tax | 3,601 | 6,310 | 5,197 | (43 | ) | ||||||||||||
of which: impact from US cross-border settlement | (917 | ) | |||||||||||||||
of which: business unit performance before tax excluding US cross-border settlement | 4,518 | 6,310 | 5,197 | (28 | ) | ||||||||||||
Key performance indicators | |||||||||||||||||
| Invested assets (CHF billion) | 870 | 1,294 | 1,138 | (33 | ) | ||||||||||||
Net new money (CHF billion)2 | (101.0 | ) | 125.1 | 97.6 | |||||||||||||
Gross margin on invested assets (bps)3 | 97 | 103 | 103 | (6 | ) | ||||||||||||
Cost/income ratio (%)4 | 63.1 | 51.1 | 52.0 | ||||||||||||||
| Client advisors (full-time equivalents) | 5,755 | 5,774 | 4,742 | 0 | |||||||||||||
Client advisor productivity | |||||||||||||||||
Revenues per advisor (CHF thousand)5 | 1,824 | 2,424 | 2,441 | (25 | ) | ||||||||||||
Net new money per advisor (CHF thousand)6 | (17,029 | ) | 23,516 | 22,008 | |||||||||||||
Invested assets per advisor (CHF thousand)7 | 187,159 | 234,504 | 236,879 | (20 | ) | ||||||||||||
International clients | |||||||||||||||||
| Income | 8,185 | 9,739 | 7,907 | (16 | ) | ||||||||||||
| Invested assets (CHF billion) | 682 | 1,013 | 862 | (33 | ) | ||||||||||||
Net new money (CHF billion)2 | (71.3 | ) | 115.6 | 90.8 | |||||||||||||
Gross margin on invested assets (bps)3 | 94 | 101 | 101 | (7 | ) | ||||||||||||
Swiss clients | |||||||||||||||||
| Income | 2,634 | 3,154 | 2,920 | (16 | ) | ||||||||||||
| Invested assets (CHF billion) | 189 | 281 | 276 | (33 | ) | ||||||||||||
Net new money (CHF billion)2 | (29.7 | ) | 9.5 | 6.8 | |||||||||||||
Gross margin on invested assets (bps)3 | 110 | 111 | 110 | (1 | ) | ||||||||||||
80
Table of Contents
UBS business divisions and Corporate Center |
| Business unit reporting (continued) | |||||||||||||||||
| As of or for the year ended | % change from | ||||||||||||||||
| CHF million, except where indicated | 31.12.08 | 31.12.07 | 31.12.06 | 31.12.07 | |||||||||||||
Attributed equity and risk-weighted assets | |||||||||||||||||
Average attributed equity (CHF billion)1 | 6.1 | ||||||||||||||||
Return on attributed equity (RoaE) (%)2 | 59.0 | ||||||||||||||||
BIS risk-weighted assets (CHF billion)3 | 25.2 | 63.1 | 51.5 | ||||||||||||||
Return on BIS risk-weighted assets (%)4 | 12.3 | 10.5 | 10.8 | ||||||||||||||
Goodwill and intangible assets (CHF billion)5 | 1.9 | 1.8 | 1.7 | ||||||||||||||
Additional information | |||||||||||||||||
Recurring income6 | 8,194 | 9,617 | 8,143 | (15 | ) | ||||||||||||
| Client assets (CHF billion) | 1,048 | 1,651 | 1,436 | (37 | ) | ||||||||||||
| Personnel (full-time equivalents) | 15,271 | 15,811 | 13,564 | (3 | ) | ||||||||||||
2008
Key performance indicators
In 2008,net new money outflows amounted to CHF 101.0 billion, compared with inflows of CHF 125.1 billion in 2007. This occurred in the context of continuing credit market turbulence and its impact on the firm’s operating performance and reputation. Outflows of net new money were most pronounced in September and the first half of October.
Results
In 2008, pre-tax profit fell 43% to CHF 3,601 million, compared with the record CHF 6,310 million in 2007. This is partially due to a provision of CHF 917 million in connection with the US cross-border case. Excluding the impact of these costs, the pre-tax result would have fallen 28%, mainly reflecting the lower asset base and client transaction activity.
Operating income
Operating expenses
81
Table of Contents
UBS business divisions and Corporate Center
Global Wealth Management & Business Banking
2007
Key performance indicators
In 2007,net new money was a record CHF 125.1 billion, compared with CHF 97.6 billion in 2006, representing an annual growth rate of 11% of the underlying invested asset base at year-end 2006. This outstanding result reflected increases in all geographical regions throughout the year, particularly in Asia Pacific and Americas, both a result of the growth strategy.
Results
In 2007, pre-tax profit, at a record CHF 6,310 million, rose 21% compared with 2006. Total operating income was up 19% in 2007, reflecting a higher asset base and increased collateralized lending volumes and more client activity. Operating expenses, up 17% in 2007 from 2006, also rose as the business expanded.
Operating income
Operating expenses
82
Table of Contents
UBS business divisions and Corporate Center |
Wealth Management US
Business description
Business
Wealth Management US provides wealth management services to US private clients. On 31 December 2008, the business unit had CHF 600 billion in invested assets.
Organizational structure
Wealth Management US is headquartered in Weehawken, New Jersey, where most corporate and operational functions are located. The client-facing organization consists of the branch network in the US and Puerto Rico, with more than 8,100 financial advisors. The branch network is staffed by regional managers, market area managers, branch office managers, financial advisors and administrative support staff.
| – | August 2006 acquisition of the private client services branch network of Piper Jaffray. | |
| – | February 2007 acquisition of the McDonald Investments’ private client branch network. | |
| – | October 2008 saw the Investment Bank’s municipal securities operations serving private clients transfer to Wealth Management US (following UBS’s decision in June 2008 that its Investment Bank would exit the institutional municipal securities business). |
Legal structure
Geographical presence in key markets
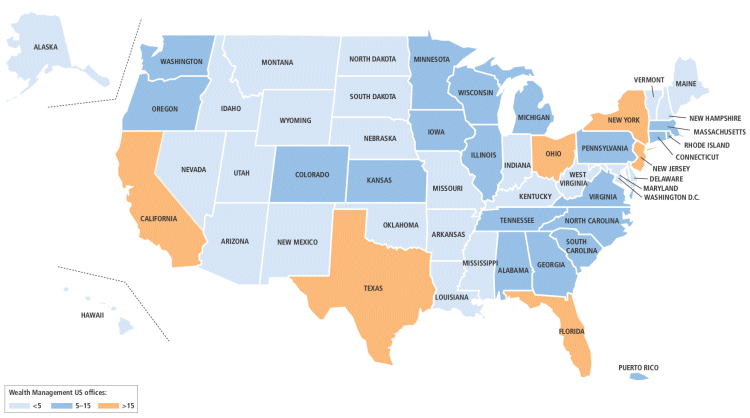
83
Table of Contents
UBS business divisions and Corporate Center
Global Wealth Management & Business Banking
Competitors
Wealth Management US competes with national full-service brokerage firms, domestic and global private banks, regional broker-dealers, independent broker-dealers, registered investment advisors, commercial banks, trust companies and other financial services firms offering wealth management services to US private clients. In 2008, the financial crisis triggered consolidation within the industry that directly impacted the business unit’s major competitors: Citi Global Wealth Management, Merrill Lynch Global Wealth Management, Morgan Stanley Global Wealth Management Group and Wachovia Securities. Specifically, Merrill Lynch was acquired by Bank of America, effective 1 January 2009 and Wachovia Corporation was acquired by Wells Fargo, effective 31 December 2008. In January 2009, Morgan Stanley and Citi announced an agreement to combine Morgan Stanley’s Global Wealth Management Group and Citi’s Smith Barney unit into a joint venture called Morgan Stanley Smith Barney.
Clients and strategy
Wealth Management US is focused on the delivery of services tailored to meet the needs of four distinct client segments: ultra-high net worth (more than USD 10 million in investable assets), high net worth (USD 1 million to USD 10
million in investable assets), core affluent (USD 250,000 to USD 1 million in investable assets) and the emerging affluent (up to USD 250,000 in investable assets).
Invested assets by asset class
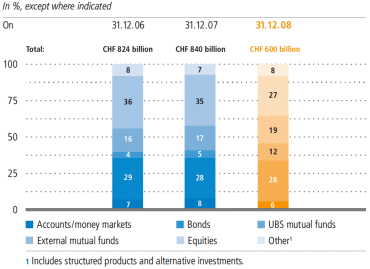
Invested assets by client wealth
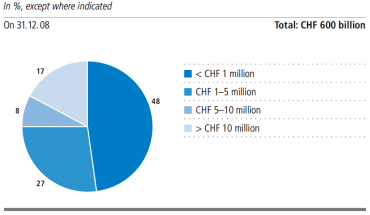
84
Table of Contents
UBS business divisions and Corporate Center |
designed by UBS for advisors focused on the high net worth segment. In the first and third quarters of 2008, investment centers in New Jersey and North Carolina were opened to serve emerging affluent clients.
Products and services
Wealth Management US offers clients a full array of wealth management services that focus on the individual investment needs of each client. Comprehensive planning supports clients through the various stages of their lives, including education funding, charitable giving, tax management strategies, estate strategies, insurance, retirement, and trusts and foundations. Advisors work closely with consultants who are subject-matter experts in areas such as wealth planning, asset allocation, retirement and annuities, alternative investments, structured products, and banking and lending. They also have access to Wealth Management Research content to support investment decisions.
85
Table of Contents
UBS business divisions and Corporate Center
Global Wealth Management & Business Banking
Business performance
| Business unit reporting | ||||||||||||||||
| As of or for the year ended | % change from | |||||||||||||||
| CHF million, except where indicated | 31.12.08 | 31.12.07 | 31.12.06 | 31.12.07 | ||||||||||||
| Income | 5,959 | 6,662 | 5,863 | (11 | ) | |||||||||||
of which: ARS settlement impact | (60 | ) | ||||||||||||||
| Credit loss (expense) / recovery | (25 | ) | (2 | ) | (1 | ) | ||||||||||
Total operating income | 5,933 | 6,660 | 5,862 | (11 | ) | |||||||||||
| Cash components | 3,806 | 4,352 | 3,686 | (13 | ) | |||||||||||
Share-based components1 | 85 | 199 | 153 | (57 | ) | |||||||||||
| Total personnel expenses | 3,891 | 4,551 | 3,839 | (15 | ) | |||||||||||
| General and administrative expenses | 2,348 | 976 | 1,073 | 141 | ||||||||||||
of which: ARS settlement impact | 1,464 | |||||||||||||||
| Services (to) / from other business units | 238 | 314 | 281 | (24 | ) | |||||||||||
| Depreciation of property and equipment | 94 | 79 | 74 | 19 | ||||||||||||
| Amortization of intangible assets | 60 | 66 | 53 | (9 | ) | |||||||||||
Total operating expenses | 6,631 | 5,986 | 5,320 | 11 | ||||||||||||
Business unit performance before tax | (698 | ) | 674 | 542 | ||||||||||||
of which: ARS settlement impact | (1,524 | ) | ||||||||||||||
of which: business unit performance before tax excluding ARS settlement impact | 826 | 674 | 542 | 23 | ||||||||||||
Key performance indicators | ||||||||||||||||
| Invested assets (CHF billion) | 600 | 840 | 824 | (29 | ) | |||||||||||
Net new money (CHF billion)2 | (10.6 | ) | 26.6 | 15.7 | ||||||||||||
Net new money including interest and dividend income (CHF billion)3 | 11.7 | 51.5 | 37.9 | (77 | ) | |||||||||||
Gross margin on invested assets (bps)4 | 84 | 77 | 76 | 9 | ||||||||||||
Cost / income ratio (%)5 | 111.3 | 89.9 | 90.7 | |||||||||||||
Recurring income6 | 3,835 | 4,173 | 3,488 | (8 | ) | |||||||||||
Financial advisor productivity | ||||||||||||||||
Revenues per advisor (CHF thousand)7 | 735 | 828 | 776 | (11 | ) | |||||||||||
Net new money per advisor (CHF thousand)8 | (1,307 | ) | 3,305 | 2,077 | ||||||||||||
Invested assets per advisor (CHF thousand)9 | 87,876 | 107,719 | 101,922 | (18 | ) | |||||||||||
Attributed equity and risk-weighted assets | ||||||||||||||||
Average attributed equity (CHF billion)10 | 7.3 | |||||||||||||||
Return on attributed equity (RoaE) (%)11 | (9.5 | ) | ||||||||||||||
BIS risk-weighted assets (CHF billion)12 | 25.9 | 18.7 | 18.3 | |||||||||||||
Return on BIS risk-weighted assets (%)13 | (3.3 | ) | 3.6 | 3.0 | ||||||||||||
Goodwill and intangible assets (CHF billion)14 | 4.3 | 4.0 | 4.3 | |||||||||||||
Additional information | ||||||||||||||||
| Client assets (CHF billion) | 636 | 917 | 909 | (31 | ) | |||||||||||
| Personnel (full-time equivalents) | 18,929 | 19,347 | 18,557 | (2 | ) | |||||||||||
| Financial advisors (full-time equivalents) | 8,182 | 8,248 | 7,880 | (1 | ) | |||||||||||
86
Table of Contents
UBS business divisions and Corporate Center |
2008
In 2008,net new money outflows amounted to CHF 10.6 billion compared with inflows of CHF 26.6 billion in 2007, with net new money outflows concentrated in the second and third quarters. This reflects the credit market turbulence and its impact on the firm’s operating performance and reputation, which led to an increase in financial advisor attrition and clients diversifying assets away from the firm. Net new money improved to positive levels in the fourth quarter, with its strongest inflows occurring in December after financial advisor recruiting and retention. Including interest and dividends, net new money in 2008 was CHF 11.7 billion, down from CHF 51.5 billion in 2007.
Results
For full-year 2008, Wealth Management US recorded a pre-tax loss of CHF 698 million compared with a pre-tax profit of CHF 674 million in 2007. Driving the decline were total ARS-related charges of CHF 1,524 million taken during 2008. Excluding these charges, the pre-tax result would have increased 23%. In US dollar terms and excluding ARS-related charges, the pretax performance would have increased 41% driven by resilient operating income growth during a challenging environment, coupled with a decline in expenses, including lower performance-based compensation accruals.
Operating income
In 2008, total operating income was CHF 5,933 million, down 11% from CHF 6,660 million in 2007. Excluding currency effects and ARS related trading losses, operating income increased 4% from 2007. The increase in operating income reflects stronger net interest income related to an increase in deposit balances, and a positive impact of the new equity attribution framework introduced in first quarter 2008, partly offset by lower transactional revenue and an increase in credit losses.
Operating expenses
Total operating expenses rose 11% to CHF 6,631 million in 2008 from CHF 5,986 million in 2007. Excluding ARS-related expenses, operating expenses declined 14%. In US dollar terms and excluding ARS-related expenses, operating expenses declined 1%. On this basis, personnel expenses decreased 2% driven by lower performance-based compensation accruals, partly offset by higher severance costs related to staff reductions. Excluding ARS-related expenses, non-personnel costs (including general and administrative expenses, depreciation and amortization expenses, and services provided to and received from other business units), rose 2% in US dollar terms due to an increase in depreciation costs, while total general and administrative expenses were essentially flat from the prior year.
87
Table of Contents
UBS business divisions and Corporate Center
Global Wealth Management & Business Banking
2007
Key performance indicators
The inflow ofnet new money in 2007 was CHF 26.6 billion, up from CHF 15.7 billion a year earlier, reflecting reduced outflows from existing clients and the recruitment of experienced advisors. Including interest and dividends, net new money in 2007 was CHF 51.5 billion, up from CHF 37.9 billion in 2006.
Results
In 2007, Wealth Management US reported a pre-tax profit of CHF 674 million, compared with CHF 542 million in 2006. In US dollar terms, performance in 2007 was up 27% from 2006. Performance in 2007 benefited from record levels of recurring income and lower general and administrative expenses. This was partly offset by higher personnel expenses.
Operating income
In 2007, total operating income was CHF 6,660 million, up 14% from CHF 5,862 million in 2006. Excluding currency effects, operating income increased 16% from 2006. The increase in operating income reflected the record recurring income (driven by increased asset levels in managed account products) and increased transactional revenue.
Operating expenses
Total operating expenses rose 13% to CHF 5,986 million in 2007 from CHF 5,320 million in 2006. Excluding currency effects, operating expenses were 15% higher.
88
Table of Contents
UBS business divisions and Corporate Center |
Business Banking Switzerland
Business description
Business
Business Banking Switzerland is UBS’s retail and commercial banking unit and the leading bank in Switzerland. At the end of 2008, business banking Switzerland had CHF 129 billion in invested assets. UBS also leads the Swiss lending and retail mortgage markets, with a total loan book of CHF 143 billion on 31 December 2008.
Organizational structure
Business Banking Switzerland is home to the firm’s Swiss branch network for corporate and individual clients. It is organized in eight geographical regions. The customer services network includes e-banking services, customer service centers, 1,260 automated teller machines (ATMs) and 303 branches across Switzerland.
Competitors
UBS’s major competitors are the banks that are active in the retail and corporate banking market in Switzerland. This group includes Credit Suisse, the country’s cantonal banks, Raiffeisen Bank, other regional or local Swiss banks and foreign bank branches in Switzerland.
Clients and products
The business unit serves both retail and commercial clients, including financial institutions.
Invested assets by asset class
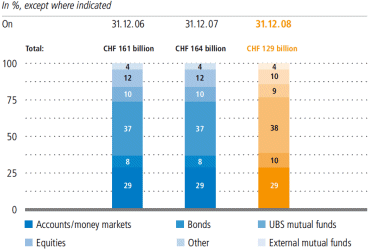
89
Table of Contents
UBS business divisions and Corporate Center
Global Wealth Management & Business Banking
Total lending portfolio, gross
On 31 December 2008, the total lending portfolio was CHF 143 billion, gross. Of this amount, mortgages comprised CHF 116 billion, with 84% being residential mortgages. Continued discipline in implementing risk-adjusted pricing has resulted in a strengthened focus of origination efforts on higher-quality exposures with an attractive risk/return relationship. The introduction of this model has resulted in a clear improvement in the risk profile of the business unit’s lending portfolio.
| è | Refer to the “Credit risk” section of this report for more information on UBS’s credit portfolio. |
Recovery portfolio
A dedicated team of recovery specialists assists clients that are unable to meet their financial obligations. Economic recovery can be achieved through restructuring or through liquidation of available collateral in order to limit the financial loss on the loan. The recovery portfolio amounted to CHF 2.3 billion on 31 December 2008. Since the end of 1998, successful recovery efforts have reduced the portfolio by more than 91% and non-performing loans have decreased from CHF 14.0 billion to CHF 1.5 billion, resulting in a ratio of non-performing loans to total lending portfolio of 0.9%.
Total lending portfolio by category, gross
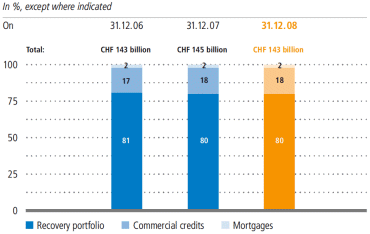
Development of UBS’s recovery portfolio, 2000-2008

90
Table of Contents
UBS business divisions and Corporate Center |
Business performance
| Business unit reporting | |||||||||||||||||
| As of or for the year ended | % change from | ||||||||||||||||
| CHF million, except where indicated | 31.12.08 | 31.12.07 | 31.12.06 | 31.12.07 | |||||||||||||
| Interest income | 3,234 | 3,470 | 3,339 | (7 | ) | ||||||||||||
| Non-interest income | 1,790 | 1,816 | 1,746 | (1 | ) | ||||||||||||
| Income | 5,024 | 5,286 | 5,085 | (5 | ) | ||||||||||||
| Credit loss (expense) / recovery | (5 | ) | 31 | 109 | |||||||||||||
Total operating income | 5,019 | 5,317 | 5,194 | (6 | ) | ||||||||||||
| Cash components | 2,348 | 2,508 | 2,389 | (6 | ) | ||||||||||||
Share-based components1 | 27 | 76 | 50 | (64 | ) | ||||||||||||
| Total personnel expenses | 2,376 | 2,584 | 2,439 | (8 | ) | ||||||||||||
| General and administrative expenses | 1,018 | 1,138 | 1,120 | (11 | ) | ||||||||||||
| Services (to) / from other business units | (893 | ) | (739 | ) | (720 | ) | (21 | ) | |||||||||
| Depreciation of property and equipment | 70 | 67 | 74 | 4 | |||||||||||||
| Amortization of intangible assets | 0 | 0 | 0 | ||||||||||||||
Total operating expenses | 2,570 | 3,050 | 2,913 | (16 | ) | ||||||||||||
Business unit performance before tax | 2,449 | 2,267 | 2,281 | 8 | |||||||||||||
Key performance indicators | |||||||||||||||||
| Invested assets (CHF billion) | 129 | 164 | 161 | (21 | ) | ||||||||||||
Net new money (CHF billion)2 | (11.4 | ) | 4.6 | 1.2 | |||||||||||||
Cost/income ratio (%)3 | 51.2 | 57.7 | 57.3 | ||||||||||||||
| Impaired lending portfolio as a % of total lending portfolio, gross | 1.0 | 1.2 | 1.7 | ||||||||||||||
Attributed equity and risk-weighted assets | |||||||||||||||||
Average attributed equity (CHF billion)4 | 3.8 | ||||||||||||||||
Return on attributed equity (RoaE) (%)5 | 64.0 | ||||||||||||||||
BIS risk-weighted assets (CHF billion)6 | 38.0 | 87.9 | 85.4 | ||||||||||||||
Return on BIS risk-weighted assets (%)7 | 6.1 | 2.6 | 2.7 | ||||||||||||||
Goodwill and intangible assets (CHF billion)8 | 0.0 | 0.0 | 0.0 | ||||||||||||||
Additional information | |||||||||||||||||
| Client assets (CHF billion) | 709 | 986 | 992 | (28 | ) | ||||||||||||
| Personnel (full-time equivalents) | 15,341 | 16,085 | 16,079 | (5 | ) | ||||||||||||
91
Table of Contents
UBS business divisions and Corporate Center
Global Wealth Management & Business Banking
2008
Key performance indicators
Net new money outflows totaled CHF 11.4 billion in 2008, compared with an inflow of CHF 4.6 billion in 2007. This was mainly due to clients’ diversification of assets and reevaluation of banking relationships in the context of continuing global market turmoil.
Results
Pre-tax profit in 2008 was a record CHF 2,449 million, CHF 182 million, or 8% above the result achieved in 2007 due to a strong decrease in operating expenses reflecting stringent
cost-cutting measures as well as higher charges paid to this business unit for services provided to other businesses.
Operating income
Operating expenses
92
Table of Contents
UBS business divisions and Corporate Center |
2007
Key performance indicators
Net new money was CHF 4.6 billion in 2007, CHF 3.4 billion higher than the inflow of CHF 1.2 billion in 2006. This was due to an increase in inflows from existing clients.
Results
Pre-tax profit in 2007 was CHF 2,267 million, CHF 14 million or 1% below the result achieved in 2006, as the increase in
Operating income
Operating expenses
93
Table of Contents
UBS business divisions and Corporate Center
Global Asset Management
Global Asset Management
One of the world’s leading asset managers, Global Asset Management provides investment capabilities and services to private clients, financial intermediaries and institutional investors.
Business
This business division offers a wide range of investment capabilities and services across all major asset classes including equities, fixed income, asset allocation, currency, risk management, hedge funds, real estate, infrastructure, private equity and fund administration. Invested assets totaled CHF 575 billion on 31 December 2008, making Global Asset Management one of the largest institutional asset managers and hedge fund of funds managers in the world. This business division is also one of the largest mutual fund managers in Europe and the largest in Switzerland.
Strategy
The financial crisis of 2008 is likely to have a major adverse impact on the immediate growth prospects of the asset management industry. A key change that could depress
Key focus areas
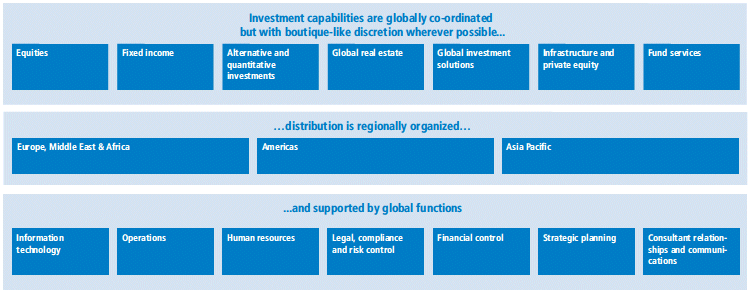
94
Table of Contents
UBS business divisions and Corporate Center |
tioned to capture opportunities with the move towards more tangible asset classes such as infrastructure, real estate and private equity. It will also continue to drive its third-party wholesale initiative forward, particularly in Europe and the Americas.
Organizational structure
This business division is headquartered in London, with other main offices in Chicago, Frankfurt, Hartford, Hong Kong, New York, Paris, Rio de Janeiro, Sydney, Tokyo, Toronto and Zurich, and employs around 3,800 persons in 25 countries.
Significant recent acquisitions and business transfers
| – | In December 2006, UBS completed its acquisition of Banco Pactual and renamed the asset management business UBS Pactual Asset Management. It is currently the seventh largest asset manager in Brazil with invested assets of approximately CHF 19 billion on 31 December 2008. |
| – | In May 2007, UBS announced the closure of Dillon Read Capital Management (DRCM). The business was formed in June 2005 and officially launched in June 2006. The business had two arms – one managing existing proprietary assets transferred from UBS Investment Bank, the other established to manage outside investor assets. As the development of the business did not meet original expectations, it was closed in May 2007. |
| – | In July 2007, UBS purchased a 51% stake in Daehan Investment Trust Management Company Ltd. (DIMCO) from Hana Daetoo Securities (formerly Daehan Investment & Securities Company Ltd.), a wholly owned subsidiary of Hana Financial Group. DIMCO was renamed UBS Hana Asset Management Company Ltd. internationally |
| and Hana UBS Asset Management in Korea and is one of the market leaders in the Korean asset management industry, with invested assets of CHF 13 billion on 31 December 2008. |
| – | In February 2008, UBS acquired 100% of the Caisse Centrale de Réescompte (CCR) Group in France from Commerzbank. The businesses of the CCR Group are being combined into the asset management and wealth management businesses of UBS in France. CCR Group had invested assets of CHF 4 billion on 31 December 2008. |
| – | In August 2008, UBS sold its 24.9% stake in Adams Street Partners to its remaining shareholders. The transaction closed on 6 August 2008. |
Competitors
Global Asset Management’s competitors range from global competitors in active investments (such as Fidelity Investments, AllianceBernstein Investments, BlackRock, JP Morgan Asset Management, Deutsche Asset Management and Goldman Sachs Asset Management) to those managed on a regional or local basis or specializing in particular asset classes. In the real estate, hedge fund, infrastructure and regional private equity investment areas, competitors tend to be specialist niche players who focus mainly on one asset class.
Invested assets by client type

Institutional/wholesale intermediary revenues
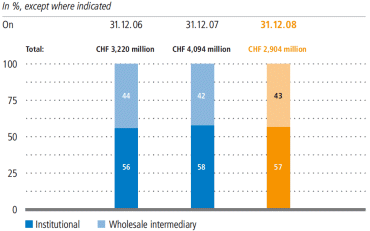
95
Table of Contents
UBS business divisions and Corporate
Center Global Asset Management
Products and services
Investment management products and services are offered in the form of segregated, pooled and advisory mandates along with a range of more than 500 registered investment funds, exchange-traded funds and other investment vehicles across all major asset classes.
| – | Equitiesoffers a full spectrum of investment styles with varying risk and return objectives. It has three investment pillars with distinct strategies – core/value (portfolios managed according to a price to intrinsic value philosophy), growth investors (a quality global growth manager) and structured equities (strategies that employ proprietary analytics and quantitative methods). |
| – | Fixed incomeoffers a diverse range of global, regional and local market-based investment strategies that cover a wide range of benchmarks. Its capabilities include “core” government and corporate bond strategies, complemented by extended strategies such as high-yield and emerging market debt. |
| – | Alternative and quantitative investmentshas two primary business lines – multi-manager (or fund of funds) and single manager. The former constructs portfolios of hedge funds and other alternative investments operated by third-party managers, allowing clients diversified exposure to a range of hedge funds, private equity and infrastructure strategies. O’Connor is a key provider of single manager global hedge funds. |
| – | Global real estateactively manages real estate investments in Asia, Europe and the US across all major sectors. Its capabilities include core, value-added and opportunistic strategies on a global, regional and country basis, and are offered through open and closed-end private funds, |
| funds of funds, individually managed accounts and publicly traded real estate securities globally. |
| – | Global investment solutionsoffers asset allocation, currency, risk management and advisory services. It manages a wide array of domestic, regional and global balanced portfolios, currency mandates, structured portfolios and absolute return strategies which invest in internal and external portfolios. |
| – | Infrastructure and private equityis involved in the origination and management of specialist funds that invest in infrastructure and other private assets globally. |
| – | Fund services, the global fund administration business, provides professional services, including legal set up, reporting and accounting for retail and institutional investment funds, for hedge funds and for other alternative funds. |
Investment performance full-year 2008
The decline in almost all financial markets that began in the latter half of 2007 continued in 2008 and accelerated towards the end of the year. Investors became increasingly risk averse and sensitive to news flow thus creating very volatile market conditions, even in perceived lower risk sectors such as money markets. Across the asset management industry, this difficult environment led to a wide dispersion of investment performance.
Invested assets by region1
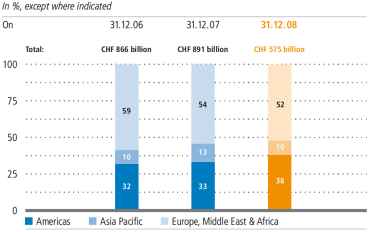
1 Assets represented are totals for the Global Asset Management business division worldwide. The regional split is based on the client servicing location.
Institutional invested assets by asset class
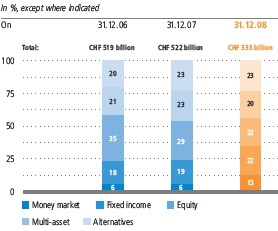
96
Table of Contents
UBS business divisions and Corporate Center |
Investment capabilities and services
| Alternative and | |||||||||||||||||||||||||||||
| quantitative | Global | Global investment | Infrastructure and | ||||||||||||||||||||||||||
| Equities | Fixed income | investments | real estate | solutions | private equity | Fund services | |||||||||||||||||||||||
Core/value | Global | Single manager hedge funds | Global | Global | Direct infrastructure investment | Alternative funds | |||||||||||||||||||||||
| Global | Country and regional | Country and regional | Country and regional | Investment funds | |||||||||||||||||||||||||
Country and regional | Sector specific | Multi-manager hedge funds | Private strategies | Asset allocation | Listed infrastructure securities | | |||||||||||||||||||||||
| Emerging markets | Emerging markets | Real estate securities | Currency management | ||||||||||||||||||||||||||
Specialist | High yield | Quantitative | Agriculture | Return and risk targeted | Direct private equity | ||||||||||||||||||||||||
| investment | | ||||||||||||||||||||||||||||
Growth investors | Structured credit | Infrastructure fund of funds | | Structured portfolios | | ||||||||||||||||||||||||
| Global | Liquidity/short duration | Risk management and | Global and regional | ||||||||||||||||||||||||||
| advisory services | |||||||||||||||||||||||||||||
Country and regional | Indexed | Private equity fund of funds | | | | | |||||||||||||||||||||||
| Structured equities | |||||||||||||||||||||||||||||
| Systematic alpha | |||||||||||||||||||||||||||||
| Quantitative equities | |||||||||||||||||||||||||||||
| Portfolio construction | |||||||||||||||||||||||||||||
| solutions | |||||||||||||||||||||||||||||
| (including passive) | |||||||||||||||||||||||||||||
and in Canadian and Australian equities. European equities performance was particularly strong in the second half of the year and, overall, sector positioning contributed positively, especially overweights to telecoms and pharmaceuticals and an underweight to materials. Global equity strategies showed distinct performance improvement during the year, despite some setbacks in the fourth quarter where a range of positive contributors were insufficient to fully offset the drag on performance of only modest overweights to banks and diversified financials. US equity strategies had a very difficult first half, followed by a strong third quarter and a weaker fourth quarter. Contributors to performance varied quarter by quarter but, over the year as a whole, underweights to energy
and materials were the largest detractors. Overweights to utilities and telecoms were positives, although the latter was offset by weak stock selection in the sector.
Wholesale intermediary invested assets by asset class
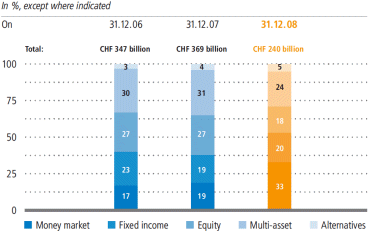
97
Table of Contents
UBS business divisions and Corporate
Center Global Asset Management
stocks and more than erased the outperformance of the first half of the year. Longer-term returns from growth strategies generally remain strong.
alpha strategies posted significantly negative returns in 2008 due to the overall long exposure in equities built up over the course of the year. Positive contributions came from the positioning within equity markets. Currency strategy performed very strongly across all strategies for the year. Currency strategy had been quite aggressively positioned against the large exchange rate misevaluations that had resulted from the popularity of carry trades (borrowing in a lower yielding currency to invest in a high yielding currency). The unwinding of carry trades in more risk-averse markets meant that this strategy paid off.
98
Table of Contents
UBS business divisions and Corporate Center |
Business performance
| Business division reporting | ||||||||||||||||
| As of or for the year ended | % change from | |||||||||||||||
| CHF million, except where indicated | 31.12.08 | 31.12.07 | 31.12.06 | 31.12.07 | ||||||||||||
| Institutional fees | 1,659 | 1 | 2,370 | 1,803 | (30 | ) | ||||||||||
| Wholesale intermediary fees | 1,246 | 1,724 | 1,417 | (28 | ) | |||||||||||
Total operating income | 2,904 | 4,094 | 3,220 | (29 | ) | |||||||||||
| Cash components | 922 | 1,632 | 1,305 | (44 | ) | |||||||||||
Share-based components2 | 4 | 224 | 270 | (98 | ) | |||||||||||
| Total personnel expenses | 926 | 1,856 | 1,575 | (50 | ) | |||||||||||
| General and administrative expenses | 434 | 559 | 399 | (22 | ) | |||||||||||
| Services (to)/from other business units | 150 | 153 | (105 | ) | (2 | ) | ||||||||||
| Depreciation of property and equipment | 29 | 53 | 27 | (45 | ) | |||||||||||
| Amortization of intangible assets | 33 | 19 | 4 | 74 | ||||||||||||
Total operating expenses | 1,572 | 2,640 | 1,900 | (40 | ) | |||||||||||
Business division performance before tax | 1,333 | 1,454 | 1,320 | (8 | ) | |||||||||||
Key performance indicators | ||||||||||||||||
Cost/income ratio (%)3 | 54.1 | 64.5 | 59.0 | |||||||||||||
Institutional | ||||||||||||||||
| Invested assets (CHF billion) | 335 | 522 | 519 | (36 | ) | |||||||||||
of which: money market funds | 42 | 32 | 28 | 31 | ||||||||||||
Net new money (CHF billion)4 | (55.6 | ) | (16.3 | ) | 29.8 | |||||||||||
of which: money market funds | 6.0 | 6.7 | 11.0 | |||||||||||||
Gross margin on invested assets (bps)5 | 38 | 44 | 38 | (14 | ) | |||||||||||
Wholesale intermediary | ||||||||||||||||
| Invested assets (CHF billion) | 240 | 369 | 347 | (35 | ) | |||||||||||
of which: money market funds | 80 | 70 | 59 | 14 | ||||||||||||
Net new money (CHF billion)4 | (47.4 | ) | 0.6 | 7.4 | ||||||||||||
of which: money market funds | 15.2 | 4.8 | (2.5 | ) | ||||||||||||
Gross margin on invested assets (bps)5 | 41 | 47 | 43 | (13 | ) | |||||||||||
Attributed equity and risk-weighted assets | ||||||||||||||||
Average attributed equity (CHF billion)6 | 3.0 | |||||||||||||||
Return on attributed equity (RoaE) (%)7 | 44.4 | |||||||||||||||
BIS risk-weighted assets (CHF billion)8 | 8.5 | 3.8 | 2.7 | |||||||||||||
Return on BIS risk-weighted assets (%)9 | 18.9 | 49.5 | 62.5 | |||||||||||||
Goodwill and intangible assets (CHF billion)10 | 2.2 | 2.1 | 1.7 | |||||||||||||
Additional information | ||||||||||||||||
| Invested assets (CHF billion) | 575 | 891 | 866 | (35 | ) | |||||||||||
Net new money (CHF billion)4 | (103.0 | ) | (15.7 | ) | 37.2 | |||||||||||
| Personnel (full-time equivalents) | 3,786 | 3,625 | 3,436 | 4 | ||||||||||||
99
Table of Contents
UBS business divisions and Corporate
Center Global Asset Management
2008
Key performance indicators
Net new money
Invested assets
Gross margin
Cost/income ratio
a minority stake in Adams Street Partners in 2008 and lower incentive compensation provisions combined with changes to the forfeiture provisions of future share-based awards.
Results
Pre-tax profit for full year 2008 was CHF 1,333 million, an 8% decrease from CHF 1,454 million in 2007. Excluding costs related to the closure of DRCM in 2007 and the gain from the sale of the minority stake in Adams Street Partners in 2008, full-year pre-tax profit would have decreased CHF 501 million.
Operating income
Operating expenses
100
Table of Contents
UBS business divisions and Corporate Center |
2007
Key performance indicators
Net new money
Invested assets
Gross margin
Cost/income ratio
Results
Pre-tax profit increased to CHF 1,454 million from CHF 1,320 million in 2006, despite the CHF 212 million of DRCM-related closure costs in second quarter 2007. This charge partly offset the positive impacts of increased performance and management fees in all business areas and the inclusion of acquisitions in Brazil and Korea.
Operating income
Operating expenses
101
Table of Contents
UBS business divisions and Corporate Center
Investment Bank
Investment Bank
UBS is a leading investment banking and securities firm, delivering comprehensive advice and execution to clients across the world’s capital markets.
Business
The Investment Bank provides a broad range of products and services to corporate and institutional clients, governments, financial intermediaries and alternative asset managers. The needs of private investors are met indirectly through working with UBS’s wealth management businesses and other private banks.
Strategy
The current crisis in the financial markets and the resulting dramatic changes in industry dynamics, and the losses incurred in 2007 and 2008, require the Investment Bank to recalibrate its business in order to generate profitable and sustainable growth. A number of senior leadership changes took place within the Investment Bank in 2008: Jerker Johansson joined UBS as Chairman and Chief Executive of the Investment Bank in March 2008, Carsten Kengeter and Jeffrey Mayer were appointed co-heads of the fixed income, currencies and commodities (FICC) business area and Tom Daula was appointed Chief Risk Officer to oversee credit risk and market risk on a combined basis as well as operational risk.
Organizational structure
The Investment Bank is headquartered in London and employs approximately 17,000 people across 38 countries. It has three distinct business areas which are run functionally on a global basis: equities, FICC and the investment banking department. The investment banking department is an industry leader and provides advice on cross-border mergers and acquisitions in addition to raising capital for companies and governments. Traditionally one of the leaders in European corporate finance, the Investment Bank has built strong franchises in the US and Asia Pacific in recent years. An important partner for institutional clients, the Investment Bank’s market-leading equities business is complemented by its top-tier foreign exchange business and broad product capabilities across fixed income markets.
| – | the September 2006 acquisition of the global futures and options business of ABN AMRO, which positioned UBS as a market leader in futures and options as well as a global provider of execution and clearing services. | |
| – | the December 2006 acquisition of the Brazilian financial services firm Banco Pactual, which placed the Investment Bank as a leader in its field in the Brazilian market. | |
| – | the April 2007 acquisition of a 20% stake in UBS Securities, China. |
102
Table of Contents
UBS business divisions and Corporate Center |
Legal structure
Competitors
The competitive landscape changed significantly in 2008. Market dislocation led UBS and its competitors to take significant steps to strengthen their balance sheets, reduce costs and maintain client confidence. Some governments and investors also took significant stakes in select financial institutions in 2008. The Investment Bank competes against other major international players such as Bank of America / Merrill Lynch, Citigroup, Credit Suisse, Deutsche Bank, Goldman Sachs, JP Morgan Chase and Morgan Stanley.
Products and services
Equities
| – | Cash equities provides clients with expert advisory and execution offerings with top-tier research, corporate access and tailored investment ideas. With market-leading trading execution for single stock and portfolio trading, UBS provides capital commitment, full service and block trading, advanced electronic trading strategies and tools, state-of-the-art analytics and value-enhancing commission management services. |
| – | Derivatives provides standardized products and customized investment solutions to clients. In addition to products with returns linked to equities or equity indices, it also offers derivative products linked to hedge funds, mutual funds, real estate and commodity indices in a variety of formats such as over-the-counter, securitized, fund-wrapped and exchange-traded. |
| – | Prime services provides integrated global services, including securities borrowing and lending, equity swaps execu- |
Selected deals
| Mergers and acquisitions (M&A) | ||
| Joint financial advisor, bookrunner and sponsor toLloyds TSB Group Plc on its GBP 14.7 billion acquisition of HBOS Plc and GBP 5.5 billion capital raising | ||
| Lead financial advisor, joint lead arranger and joint bookrunner toGas Natural SDG, S.A. on its EUR 16.8 billion cash offer for Union Fenosa S.A. | ||
| Lead financial advisor toEli Lilly and Company on its USD 6.5 billion acquisition of Imclone Systems Inc. | ||
| Sole financial advisor toSt. George Bank Limited on its AUD 18.6 billion merger with Westpac Banking Corporation | ||
| Equity capital markets | ||
| Advisor and joint bookrunner on the USD 19.7 billion initial public offering (IPO) ofVisa Inc. This was a landmark transaction representing the largest IPO in US history, and the second largest IPO worldwide after the USD 21.9 billion IPO for Industrial & Commercial Bank of China in 2006 | ||
| Joint bookrunner on the GBP 2.2 billion rights issue forCentrica Plc, the second-largest UK equity issue in 2008 outside the financial sector | ||
| Joint lead manager and joint underwriter for the fully underwritten AUD 2.6 billion entitlement offer forWesfarmers Limited | ||
| Debt capital markets | ||
| Joint bookrunner on a USD 2.5 billion issue forWells Fargo & Co, its first institutional fixed income hybrid offering since November 2006 | ||
| Joint bookrunner forChina Merchants Bank Co Ltd. on its USD 4.4 billion domestic lower tier 2 bond, the largest bank capital deal in Asia Pacific since 2005 and voted the Best Local Currency Bond by FinanceAsia in 2008 | ||
| Joint bookrunner on a EUR 5 billion benchmark issue forKFW, the promotional bank of the Federal Republic of Germany, its first euro benchmark transaction in 2008 | ||
| Joint lead arranger and joint bookrunner toVerizon Wireless on a USD 17.0 billion bridge facility to finance the acquisition of Alltel Corp. | ||
Selected awards
| Investment Bank | ||
| No. 1 M&A Financial Advisor (ECM roles) –Thomson Reuters 2008 | ||
| Corporate Broker of the Year –Acquisitions Monthly 2009 | ||
| Equities | ||
| Asia Pacific Equity House of the Year –International Financial Review 2003, 2005–2008 | ||
| No. 1 European Equity Research Firm –Institutional Investor 2002–2009 | ||
| Fixed income currencies and commodities | ||
| Financial Bond House of the Year –International Financial Review 2008 | ||
| No. 2 Foreign Exchange House –Euromoney 2008 | ||
103
Table of Contents
UBS business divisions and Corporate
Center Investment Bank
| tion, multi-asset-class prime brokerage and multi-asset-class exchange-traded derivatives execution and clearing. These services are provided to an expanding list of hedge funds, banks, asset management and commodity trading clients. | ||
| – | Equity research provides independent assessments of the prospects for over 3,400 companies across most industry sectors and geographical regions (corresponding to 82% of world market capitalization), as well as economic, strategic and quantitative research. |
Fixed income, currencies and commodities
| – | Macro consists of foreign exchange, money market and interest rate risk management activities. It provides a range of foreign exchange, treasury and liquidity management solutions to institutional and private clients. Interest rate activities include standardized rate-driven products and services such as interest rate derivatives trading, underwriting and trading of government and agency securities. |
| – | Credit is active in the origination, underwriting, and distribution of primary cash and synthetic credit transactions. It is also active in secondary trading and market-making in high yield and investment grade bonds and loans in both cash and derivative products. |
| – | Emerging markets has local market presence in Latin America through UBS Pactual, as well as in Asia and Cen- |
Foreign exchange: Euromoney-eligible volumes1
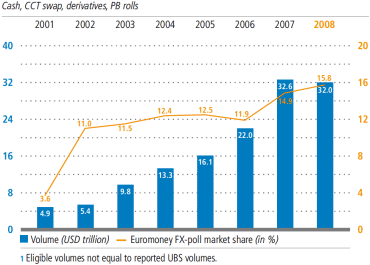
| tral and Eastern Europe, enabling it to offer local investors access to international markets and international investors an opportunity for local exposure. | ||
| – | Client services is the global sales effort, unifying product specialist sales groups, including foreign exchange, money market, rates and emerging markets products. | |
| – | Quantitative analysis provides tailored solutions for clients as well as more broadly scalable solutions for the FICC flow platforms. | |
| – | Research provides investors with analysis across a selected range of issuers, products, markets and industries. |
Investment banking
104
Table of Contents
UBS business divisions and Corporate Center |
Business performance
Business division reporting
| As of or for the year ended | % change from | |||||||||||||||
| CHF million, except where indicated | 31.12.08 | 31.12.07 | 31.12.06 | 31.12.07 | ||||||||||||
Investment banking | 2,880 | 6,636 | 4,999 | (57 | ) | |||||||||||
| Advisory | 1,609 | 2,697 | 1,821 | (40 | ) | |||||||||||
| Capital market revenues | 1,844 | 4,261 | 3,631 | (57 | ) | |||||||||||
| equities | 977 | 2,783 | 2,095 | (65 | ) | |||||||||||
| fixed income, currencies and commodities | 866 | 1,478 | 1,536 | (41 | ) | |||||||||||
| Other fee income and risk management | (573 | ) | (322 | ) | (453 | ) | (78 | ) | ||||||||
Sales and trading | (26,504 | ) | (7,833 | ) | 16,727 | (238 | ) | |||||||||
| Equities | 5,184 | 9,004 | 8,387 | (42 | ) | |||||||||||
| Fixed income, currencies and commodities | (31,687 | ) | (16,837 | ) | 8,340 | (88 | ) | |||||||||
Total Investment Bank income | (23,624 | ) | (1,197 | ) | 21,726 | |||||||||||
Credit loss (expense) / recovery1 | (2,575 | ) | (266 | ) | 47 | (868 | ) | |||||||||
Total Investment Bank operating income excluding own credit | (26,199 | ) | (1,463 | ) | 21,773 | |||||||||||
Own credit2 | 2,032 | 659 | 0 | 208 | ||||||||||||
Total Investment Bank operating income as reported | (24,167 | ) | (804 | ) | 21,773 | |||||||||||
| Cash components | 5,173 | 8,902 | 9,788 | (42 | ) | |||||||||||
Share-based components3 | (292 | ) | 2,384 | 1,898 | ||||||||||||
| Total personnel expenses | 4,882 | 11,286 | 11,686 | (57 | ) | |||||||||||
| General and administrative expenses | 3,399 | 3,386 | 3,210 | 0 | ||||||||||||
| Services (to) / from other business units | 990 | 811 | 1,034 | 22 | ||||||||||||
| Depreciation of property and equipment | 231 | 210 | 203 | 10 | ||||||||||||
| Impairment of goodwill | 341 | 0 | 0 | |||||||||||||
| Amortization of intangible assets | 83 | 172 | 72 | (52 | ) | |||||||||||
Total operating expenses | 9,925 | 15,865 | 16,205 | (37 | ) | |||||||||||
Business division performance before tax | (34,092 | ) | (16,669 | ) | 5,568 | (105 | ) | |||||||||
Key perfomance indicators | ||||||||||||||||
Compensation ratio (%)4 | N/A | 5 | N/A | 5 | 53.8 | |||||||||||
Cost / income ratio (%)6 | N/A | 5 | N/A | 5 | 74.6 | |||||||||||
| Impaired lending portfolio as a % of total lending portfolio, gross | 3.6 | 0.4 | 0.1 | |||||||||||||
Average VaR (10-day, 99% confidence, 5 years of historical data)7 | 374 | 514 | 410 | (27 | ) | |||||||||||
Attributed equity and risk-weighted assets | ||||||||||||||||
Average attributed equity (CHF billion)8 | 26.8 | |||||||||||||||
Return on attributed equity (RoaE) (%)9 | (127.4 | ) | ||||||||||||||
BIS risk-weighted assets (CHF billion)10 | 195.8 | 190.7 | 174.6 | |||||||||||||
Return on BIS risk-weighted assets (%)11 | (15.7 | ) | (8.7 | ) | 3.5 | |||||||||||
Goodwill and intangible assets (CHF billion)12 | 4.6 | 5.3 | 5.5 | |||||||||||||
Additional information | ||||||||||||||||
| Personnel (full-time equivalents) | 17,171 | 21,779 | 21,733 | (21 | ) | |||||||||||
10 BIS risk-weighted assets (RWA) are according to Basel II for 2008, and according to the Basel I framework for 2007 and 2006. 11 Business division performance before tax / average BIS RWA.
12 2007 and 2006 represent goodwill and intangible assets in excess of 4% of BIS tier 1 capital.
105
Table of Contents
UBS business divisions and Corporate Center
Investment Bank
2008
Key performance indicators
As in 2007, neither thecost/income ratio nor thecompensation ratiowere meaningful in 2008 due to negative total operating income.
Results
In 2008, the Investment Bank recorded a pre-tax loss of CHF 34,092 million compared with a pre-tax loss of CHF 16,669 million in 2007, primarily due to the losses on risk positions within the fixed income, currencies and commodities (FICC) area. For full-year 2008, equities and investment banking revenues were down from a record year in 2007. A credit loss expense of CHF 2,575 million was recorded in 2008, mainly due to impairment charges taken on reclassified financial assets, as mentioned above, compared with CHF 266 million in 2007. In 2008, the Investment Bank recorded a gain on own credit from financial liabilities designated at fair value of CHF 2,032 million, resulting from the widening of UBS’s credit spread, which was partly offset by the effects of redemptions and repurchases of such liabilities. Refer to “Note 27 Fair value of financial instruments” in the financial statements of this report for more information. Operating expenses for the Investment Bank in 2008 decreased sig-nificantly from 2007, mainly reflecting lower performance-related compensation.
Operating income
Equities
Fixed income, currencies and commodities
Investment banking
106
Table of Contents
UBS business divisions and Corporate Center |
in 2007. However, UBS improved its rank from sixth in 2007 to fifth in 2008.
Operating expenses
107
Table of Contents
UBS business divisions and Corporate Center
Investment Bank
2007
Key performance indicators
Neither thecost/income ratio nor thecompensation ratio was meaningful in 2007 due to negative total operating income. In 2006, the cost / income ratio was 74.6% and the compensation ratio 53.8%.
Results
In 2007 the Investment Bank recorded a pre-tax loss of CHF 16,669 million compared with a profit of CHF 5,568 million in 2006, primarily due to losses recorded on positions related to the US residential real estate market which more than offset the solid performance in other areas.
Operating income
Operating income by segment
Investment banking
region, especially in the Americas. While the advisory and equity capital markets businesses reported significant gains over the prior year (up 48% and 33% respectively), the debt capital markets business declined 4% as it was impacted by challenging markets in the second half of 2007.
Sales and trading
Equities
Fixed income, currencies and commodities
108
Table of Contents
UBS business divisions and Corporate Center |
Operating expenses
109
Table of Contents
UBS business divisions and Corporate Center
Corporate Center
Corporate Center
The Corporate Center partners with the business divisions to ensure that UBS operates as an effective and agile firm, responding effectively to trends in the financial industry according to a common vision and set of values.
Aims and objectives
The Corporate Center assists UBS in managing its businesses through provision of Group-level control in the areas of finance, risk, legal and compliance. It strives to maintain an appropriate balance between risk and return in the firm’s businesses while establishing and controlling UBS’s corporate governance processes, including compliance with relevant regulations. Each functional head in the Corporate Center has authority across UBS’s businesses for his or her area of responsibility, including the authority to issue Group-wide policies for that area, and is directly reported to by his or her business division counterpart.
Organizational structure
The Corporate Center consists of operational functions plus the information technology infrastructure and Group offshoring units. It is led by the Chief Operating Officer (COO) of the Corporate Center and its operational functions are managed by the Corporate Center executive committee.
Chief Operating Officer of the Corporate Center
Group Chief Financial Officer
Group Chief Risk Officer
Group General Counsel
110
Table of Contents
UBS business divisions and Corporate Center |
and liability risk. Furthermore, the Group General Counsel represents UBS’s interests to policy-makers and, in close cooperation with the Group CRO and Group CFO as appropriate, establishes Group-wide management and control processes for the Group’s relationship with regulators.
Group Treasurer
Head of Group Controlling & Accounting
Head of Group Tax
Head of Group Accounting Policy
Chief Communication Officer
Head of Group Strategic Advisory &
Financial Communication
Group Head Human Resources
Chief Technology Officer
111
Table of Contents
UBS business divisions and Corporate
Center Corporate Center
tributed computing and servers, mainframes and data centers, market data services, user services and desktop computing. The unit focuses on serving all UBS’s businesses in a client-driven and cost-efficient way, as well as building towards a consistent technical architecture across UBS through the execution of the information technology infrastructure strategy.
Head of Group Offshoring
112
Table of Contents
UBS business divisions and Corporate Center |
Results
Corporate Center reporting
| As of or for the year ended | % change from | |||||||||||||||
| CHF million, except where indicated | 31.12.08 | 31.12.07 | 31.12.06 | 31.12.07 | ||||||||||||
Total operating income | 1,083 | 3,562 | 607 | (70 | ) | |||||||||||
| Cash components | 1,069 | 1,244 | 1,179 | (14 | ) | |||||||||||
Share-based components1 | 7 | 121 | 140 | (94 | ) | |||||||||||
| Total personnel expenses | 1,076 | 1,365 | 1,319 | (21 | ) | |||||||||||
| General and administrative expenses | 1,299 | 1,306 | 1,255 | (1 | ) | |||||||||||
| Services (to)/from other business units | (2,066 | ) | (2,070 | ) | (1,969 | ) | 0 | |||||||||
| Depreciation of property and equipment | 720 | 739 | 782 | (3 | ) | |||||||||||
| Amortization of intangible assets | 0 | 0 | 9 | |||||||||||||
Total operating expenses2 | 1,029 | 1,340 | 1,396 | (23 | ) | |||||||||||
| Performance from continuing operations before tax | 54 | 2,222 | (789 | ) | (98 | ) | ||||||||||
| Performance from discontinued operations before tax | 198 | 145 | 888 | 37 | ||||||||||||
Performance before tax | 252 | 2,367 | 99 | (89 | ) | |||||||||||
Contributions from private equity/Industrial Holdings | ||||||||||||||||
| Total operating income | 22 | 689 | 313 | (97 | ) | |||||||||||
| Total operating expenses | 54 | 163 | 67 | (67 | ) | |||||||||||
| Operating profit from continuing operations before tax | (32 | ) | 526 | 246 | ||||||||||||
| Profit from discontinued operations before tax | 155 | 138 | 884 | 12 | ||||||||||||
Additional information | ||||||||||||||||
BIS risk-weighted assets (CHF billion)3 | 8.8 | 10.2 | 11.5 | |||||||||||||
Personnel (full-time equivalents)4 | 7,285 | 6,913 | 4,771 | 5 | ||||||||||||
| Personnel for the Operational Corporate Center (full-time equivalents) | 1,572 | 1,622 | 1,452 | (3 | ) | |||||||||||
Personnel for ITI5 (full-time equivalents) | 4,066 | 4,343 | 3,055 | (6 | ) | |||||||||||
| Personnel for Group Offshoring (full-time equivalents) | 1,646 | 948 | 264 | 74 | ||||||||||||
113
Table of Contents
UBS business divisions and Corporate
Center Corporate Center
2008
Results
The Corporate Center recorded a result from continuing operations of CHF 54 million in full-year 2008, down from a gain of CHF 2,222 million in 2007. This decline was mainly related to a charge of CHF 3.5 billion following a transaction between UBS and the Swiss National Bank (SNB) in the fourth quarter. This charge reflects a net loss arising from the acquisition of the equity purchase option, and the impact of the contingent issuance of UBS shares in connection with the transaction. The total charge also includes the fair valuation impact of the mandatory convertible notes (MCNs) placed with the Swiss Confederation. The call component of the MCNs will be revalued each quarter and UBS expects a corresponding fluctuation in the results of the Corporate Center. This fluctuation is subject to the expected volatility of the UBS share price and will continue until the conversion of the MCNs into UBS shares. The loss from the SNB transaction is reported in the Corporate Center as it benefits the whole bank and not just the Investment Bank. At the 27 November 2008 extraordinary general meeting, shareholders approved for this purpose the creation of conditional capital in the maximum amount of 365 million shares. Furthermore, 2008 was impacted by losses resulting from cash flow hedge ineffectiveness, driven by the accelerated amortization of gains recorded until November 2007.
Operating income
Operating expenses
Information technology infrastructure
In 2008, the average ITI cost per UBS employee was CHF 25,178, a CHF 1,953 decrease from CHF 27,131 the previous year. This reflects an 8% cost reduction in ITI in 2008 compared to 2007, reflecting ongoing cost-cutting initiatives and foreign exchange movements. Average UBS staff levels decreased slightly to 81,382 in 2008 from 81,715 in 2007.
114
Table of Contents
UBS business divisions and Corporate Center |
2007
Results
The Corporate Center recorded a pre-tax profit from continuing operations of CHF 2,222 million in full-year 2007. This improvement, up from a loss of CHF 789 million in 2006, was related mainly to the CHF 1,950 million gained from UBS’s sale of its 20.7% stake in Julius Baer. In addition, positive cash flow hedges and higher treasury income also assisted the 2007 result. While all these developments helped operating income to rise, higher levels of credit loss expenses in 2007 moderated the increase.
Operating income
Operating expenses
Information technology infrastructure
In 2007, the average ITI cost per UBS employee was CHF 27,131, a CHF 941 decrease from CHF 28,072 the previous year. This reflected a 12% increase in average staff levels from 72,885 in 2006 to 81,715 in 2007, while ITI costs increased only 8% during this period.
115
Table of Contents
Table of Contents
| Risk and treasury management |
Risk and treasury management
Audited information according to IFRS 7 and IAS 1
Risk disclosures provided in line with the requirements of the International Financial Reporting Standard 7 (IFRS 7)Financial Instruments: Disclosures,and disclosures on capital required by the International Accounting Standard 1 (IAS 1)Financial Statements: Presentationform part of the financial statements audited by UBS’s independent registered public accounting firm Ernst & Young Ltd., Basel. This information (the audited texts, tables and graphs) is marked by a bar on the left-hand side throughout this report and is incorporated by cross-reference into the financial statements of this report.
Table of Contents
Risk management
| – | UBS entered 2008 with significant legacy risk positions which exceeded the firm’s risk bearing capacity. Risk reduction will remain a priority for UBS until risk exposure is commensurate with the firm’s targeted risk appetite. |
UBS incurred substantial writedowns on its risk positions and actively reduced exposures through sales.Significant transactions included the sale in May 2008 of US residential mortgage-backed securities to a fund managed by BlackRock for proceeds of USD 15 billion and the agreement reached in October 2008 to transfer illiquid securities and other positions from UBS’s balance sheet to a fund owned and controlled by the Swiss National Bank (SNB).
In order to address weaknesses identified in its risk management and control organization,UBS launched an extensive remediation plan which included: the overhaul of its risk governance; significant changes to risk management and control personnel; and improvements in risk capture, risk representation and risk monitoring.
Corporate governance and risk control

Table of Contents
Treasury management
| – | UBS’s treasury department is responsible for the management of the firm’s financial resources. This includes the management of: liquidity and funding; capital and balance sheet; and interest rate and currency risks arising from balance sheet and capital management responsibilities. |
Liquidity management
Liquidity management remained challenging throughout 2008, as the financial and credit market crisis, which had its origins in the US residential mortgage market in the second half of 2007, spread and gained in intensity throughout the year.
In anticipation of an extended period of market turbulence, UBS proactively undertook several measures, starting in 2007 and continuing in 2008, to further strengthen and safeguard its liquidity position, including adjustment of short-term funding targets and increased focus on balance sheet asset reduction. Combined with the broad diversity of its funding sources, its contingency planning processes and its global scope, these additional measures have enabled UBS to maintain a balanced asset/liability profile throughout the current market dislocation.
Funding management
Despite challenging market conditions in the second half of 2008, UBS was able to maintain access to funding, primarily as a result of its broadly diversified funding base.
Risk-weighted assets and eligible capital
In 2008, risk-weighted assets declined from CHF 374.4 billion (Basel I) to CHF 302.3 billion. In this period, eligible tier 1 capital decreased from CHF 34.1 billion to CHF 33.4 billion, reflecting the effects of losses incurred during 2008 and further negative impacts on equity, only partially offset by the positive effects from issues of capital instruments.
Capital instruments
The following events occurred in 2008: issuance of CHF 13 billion of mandatory convertible notes to two long-term financial investors in March; issuance of EUR 1 billion of perpetual preferred securities as hybrid tier 1 capital in April; net increase in capital of CHF 15.6 billion from the rights issue in June; and issuance of CHF 6 billion of mandatory convertible notes to the Swiss Confederation in December.
| Capital adequacy | ||||||||||||
| Basel II | Basel I | |||||||||||
| CHF million, except where indicated | 31.12.08 | 31.12.08 | 31.12.07 | |||||||||
| BIS tier 1 capital | 33,371 | 35,884 | 34,101 | |||||||||
of which hybrid tier 1 capital | 7,393 | 7,393 | 6,387 | |||||||||
| BIS total capital | 45,588 | 46,233 | 45,797 | |||||||||
| BIS tier 1 capital ratio (%) | 11.0 | 9.9 | 9.1 | |||||||||
| BIS total capital ratio (%) | 15.1 | 12.7 | 12.2 | |||||||||
| Credit risk | 222,563 | 326,608 | 323,345 | |||||||||
| Non-counterparty related risk | 7,411 | 8,826 | 8,966 | |||||||||
| Market risk | 27,614 | 27,614 | 42,110 | |||||||||
| Operational risk | 44,685 | N/A | N/A | |||||||||
Total BIS risk-weighted assets | 302,273 | 363,048 | 374,421 | |||||||||
Table of Contents
Risk and treasury management
Risk management and control
Risk management and control
UBS was severely affected by the financial crisis that unfolded in 2007 and worsened in 2008. UBS entered 2008 with significant legacy risk positions, particularly related to US real estate and other credit positions, which exceeded the firm’s risk bearing capacity. As reported during 2008, UBS incurred significant losses on these positions. Risk reduction will remain a priority for UBS until risk exposure is commensurate with the firm’s targeted risk appetite. UBS identified significant weaknesses in its risk management and control organization, as well as limitations in its traditional market risk, credit risk, liquidity risk and funding risk measures (including the interplay between these measures). As a result of these weaknesses, the firm failed to adequately assess correlated risks and risk concentrations. In order to address these weaknesses, UBS launched an extensive remediation plan, which included the overhaul of its risk governance, significant changes to risk management and control personnel, as well as improvements in risk capture, risk representation and risk monitoring. Implementation of this plan is ongoing and remains a high priority for UBS. In addition, in light of the continued dislocation in financial markets, UBS has placed less emphasis on statistical models for the identification and management of risks, and more on its stress-based measures, particularly to identify and manage those portfolios considered most at risk.
Market commentary in 2008
Market conditions deteriorated progressively in 2008 culminating with weak macroeconomic data in fourth quarter 2008 which confirmed the severe downturn in the global economy. Credit markets worsened considerably over the year with the market dislocation spreading from US real estate-related markets to broader asset-backed security and credit markets, especially after the market-wide liquidity concerns engendered following the collapse of a major US investment bank in September 2008. Levels of market volatility were high throughout the year and peaked in fourth quarter, as global deleveraging and a lack of liquidity in global markets continued to distort asset prices, reducing the effectiveness of some risk mitigation techniques. Extreme market moves throughout the year caused a breakdown in the relationship between a number of trading positions and related hedges, particularly in credit and equity markets. Hedge funds experienced significant redemptions in the second half of the year as performance suffered. In the last four months of the year, central banks and governments reacted with increasing urgency to the escalating financial crisis with a series of measures which attempted to stabilize financial markets and support specific financial institutions.
Summary of key developments in 2008
The important developments that took place in 2008 with regard to risk management and control include:
| – | UBS incurred substantial writedowns on its risk positions and actively reduced exposures through sales. Significant |
| transactions included the sale in May of US residential mortgage-backed securities to a fund managed by BlackRock for proceeds of USD 15 billion and the agreement reached in October to transfer illiquid securities and other positions from UBS’s balance sheet to a fund owned and controlled by the SNB. From an originally agreed USD 60 billion, the size of the transaction has been reduced to USD 38.6 billion. UBS will continue its program of active risk reduction. | ||
| – | UBS strengthened the roles and responsibilities of its Board of Directors (BoD) and executive management with regard to risk management and control. The BoD has been allocated responsibility for setting the highest-level portfolio and concentration risk measures and limits, while the Group Chief Executive Officer (Group CEO) is authorized to apply these measures and limits to specific transactions, positions and exposures. A new BoD risk committee was established to take on some of the responsibilities of the former Chairman’s Office. | |
| – | UBS integrated its approach to risk control by merging the market and credit risk functions of the Investment Bank into a single unit. A new Chief Risk Officer (CRO) was appointed in the Investment Bank to oversee credit risk and market risk on a combined basis as well as operational risk. Several other changes to senior personnel in the Investment Bank CRO organization were also made. The Corporate Center risk function was reorganized, resulting in the formation of a unit to focus on the control of portfolio and concentration risks and a combined function to determine methodologies to measure and assess market and credit risk. UBS also made a number of other changes to senior personnel in order to strengthen its risk management and control organization. These included |
120
Table of Contents
Risk and treasury management |
| the appointments in the Investment Bank of a new Chief Executive Officer and new heads of Fixed Income Currencies and Commodities. | ||||
| – | In the third quarter, the Swiss Financial Market Supervisory Authority (FINMA, until 31 December 2008 Swiss Federal Banking Commission) concluded its investigation into the causes of the significant writedowns incurred by UBS. It confirmed UBS’s own conclusions in all material aspects. UBS developed a comprehensive and detailed plan to eliminate the weaknesses it identified, including those related to risk management and control (for example UBS’s market and credit risk functions had failed to identify certain significant portfolio and concentration risks, and there were weaknesses identified in risk systems and infrastructure). Delivery against this plan remains broadly in line with expectations and is a high priority for UBS. | |||
 | Risk management and control principles | |||
| Five key principles underpin UBS’s risk management and control framework. These principles are intended to allow the firm to achieve an appropriate balance between risk and return. The five key principles are: | ||||
| – | Business management is accountable for risk. Business management throughout the firm is accountable for all the risks assumed or incurred by its business operations. This means that each business is responsible for the continuous and active management of its risk exposures, as well as for ensuring an appropriate balance between risk and return. | |||
| – | Independent control of risk. A control process independent of the businesses is an integral part of UBS’s risk management and control framework. Independent risk control aims to provide an objective assessment of risk-taking activities, helping senior management align the interests of all stakeholders, including shareholders, clients and employees. | |||
| – | Disclosure of risk. Comprehensive, transparent and objective risk disclosure is an essential component of the risk control process. This includes disclosure and periodic reporting to senior management, the BoD, shareholders, regulators, rating agencies and other stakeholders. | |||
| – | Earnings protection. UBS aims to protect earnings by limiting the scope for losses and exposure to stress events. Controls and limits are applied to individual exposures and portfolios in each business, to aggregate risks across all businesses, and to major risk types relative to the firm’s risk capacity (the level of risk UBS is capable of absorbing, based on its anticipated earnings power). | |||
| – | Reputation protection. Protection of UBS’s reputation depends, among other things, on the effective management and control of the risks incurred in the course of its business. All employees should make the protection of UBS’s reputation an overriding concern. | |||
| The risk assessment and management performed by the BoD is in line with the statutory requirements and so is the related disclosure in this section. | |||
| Risk management and control responsibilities | ||||
| Key roles and responsibilities related to risk management and control are outlined below: | ||||
| – | The BoD has a strategic and supervisory function and is responsible for determining UBS’s fundamental approach to risk. The firm’s risk principles, risk appetite and risk capacity are also determined by the BoD. A newly established BoD risk committee oversees the firm’s risk profile and the implementation of risk management and control principles. | |||
| – | The GEB is responsible for the implementation of risk management and control principles. Its newly established Executive Committee (EC) allocates the Group’s total risk capacity amongst the business divisions, controls the firm’s overall risk profile and approves the core risk policies. | |||
| – | In line with UBS’s dual board structure, the authority to control risk is split between the BoD and the Group CEO. The BoD has risk control authority for portfolio and concentration limits, while the Group CEO has risk control authority for the firm’s transactions, positions and exposures. These risk control authorities, however, are partially delegated to the Group CRO and the CEOs of each business division. Risk officers in the business divisions may also be delegated certain risk control authorities depending on their experience and portfolio responsibility. | |||
| – | The CEO of each business division is accountable for the results and risks of his or her division as well as maintaining an appropriate risk management structure. | |||
| – | The Group CRO is responsible for the development and implementation of appropriate control frameworks for credit, market and operational risks with support from the business divisions through their CROs. In addition, risk functions within the Corporate Center support the control of portfolio and concentration risks, the determination of methodologies to measure and assess risk, and the development and operation of appropriate risk infrastructure (including reporting). | |||
| – | The CROs of the business divisions are responsible for the independent control of risk in their respective business divisions. | |||
| – | The Group CFO is responsible for ensuring that UBS and its business divisions disclose their financial performance in a clear and transparent way, and that this reporting and disclosure meets all regulatory requirements and corporate governance standards. The Group CFO is also responsible for the implementation of UBS’s risk management and control frameworks in the areas of capital management, liquidity, funding and tax. | |||
121
Table of Contents
Risk and treasury management
Risk management and control
Corporate governance and risk control
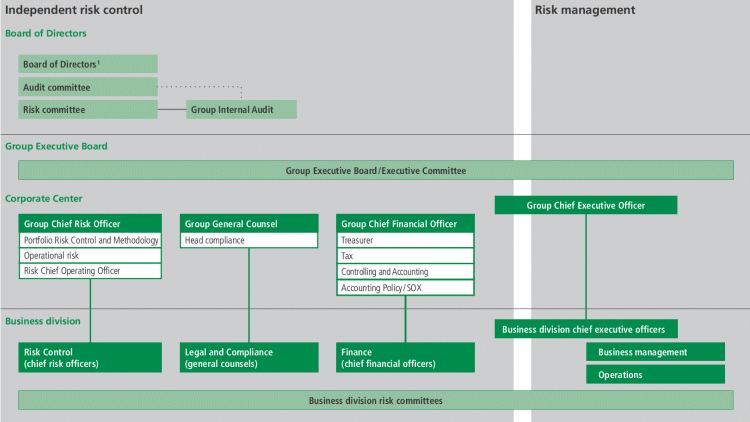
| – | The Group General Counsel is responsible for implementing UBS’s risk management and control principles in the areas of legal and compliance. | |||
| Risk management and control framework | |||||
| UBS’s risk management and control principles are implemented via a detailed risk management and control framework. The framework comprises both qualitative elements such as policies and authorities, and quantitative components including limits. With the risk management and controls principles as its basis, the framework is continually adapted and enhanced as UBS’s businesses and the market environment evolve. | |||||
| There are five key components in the independent risk control framework: | |||||
| – | Risk policies and authorities to implement the firm’s risk management and control principles (see above). These reflect UBS’s risk capacity and risk appetite, and may be adapted to accommodate the firm’s evolving business requirements. | ||||
| – | Risk identification through continuous monitoring of portfolios, assessment of risks in new businesses and complex or unusual transactions, and ongoing review of the overall risk profile in the light of market developments and external events and trends. | ||||
| – | Risk measurement using methodologies and models which are independently verified and approved by specialists in the CRO organization. Appropriate risk measures are applied to portfolios and risk concentrations. Risks that are not well reflected by standard measures are subject to additional controls, which may include pre-approval of transactions and specific risk limits. Models to quantify risk are generally developed by dedicated units within the business divisions and the Corporate Center. UBS requires that models addressing risks which could impact its books and records be subjected to independent verification and ongoing monitoring and control by the CRO organization. | |
| – | Risk control by monitoring and enforcing compliance with risk principles, policies and limits, as well as with regulatory requirements. | |
| – | Transparentrisk reporting to stakeholders and to management at all levels, on all relevant aspects of the approved risk control framework, including limits. This includes daily reports on certain portfolio risk measures to senior management. Monthly and quarterly reports are also prepared by the business divisions and provide the basis for consolidated reports to the Group CRO, EC, BoD risk committee and the BoD as a whole. Periodic reporting is made publicly available for the benefit of other stakeholders. |
122
Table of Contents
Risk and treasury management |
| UBS has control processes to deal with the establishment of new businesses or significant changes to existing businesses, and the execution of complex or unusual transactions. These processes are designed to subject the business or transaction in question to all the necessary control functions – risk control, legal, compliance, treasury, finance, tax and logistics – as necessary. A key aspect of this process is to ensure that transactions are booked in a way that permits appropriate ongoing risk management, measurement, control and reporting. | ||||
| Risk categories | ||||
| The risks faced by UBS’s businesses can be broken down into different categories. | ||||
| On the most fundamental level there arebusiness risks arising from the commercial and economic risks inherent in any business activity. It is business management’s responsibility to respond to changes in the economic environment and competitive landscape. Business risks are not subject to independent risk control but are factored into the firm’s strategic planning process and the assessment of UBS’s risk appetite and overall risk exposure. | ||||
| Primary andoperational risks which result from particular business activities are, on the other hand, subject to independent risk control. | ||||
| Primary risks are: | |||
| – | Credit risk – the risk of loss resulting from the failure of a client or counterparty to meet its contractual obligations. | |||
| – | Market risk – the risk of loss resulting from changes in market variables. These can be categorized as overall changes in market levels and rates (the “general” market risk component), or relative changes with respect to specific companies or instruments (often referred to as the “idiosyncratic” market risk component). | |||
| – | Liquidity and funding risk – the risk that UBS might be unable to meet its payment obligations when due or to borrow funds in the market at an acceptable price to fund actual or proposed commitments. | |||
| – | Operational risk is the risk of loss resulting from inadequate or failed internal processes, people and systems (for example failed IT systems, or fraud perpetrated by a UBS employee), or from external causes, whether deliberate, accidental or natural. | |||
èRefer to the “Market risk”, “Credit risk”, “Operational risk” and “Liquidity and funding management” sections of this report for a description of the control frameworks for these risk categories | ||||
| Quantitative controls | |||
| UBS quantifies potential future losses using three complementary risk measures: expected loss, statistical loss and stress loss. | ||||
| Expected loss is the loss that is expected to arise on average over time in connection with an activity (for example, expected number of loan defaults under normal economic conditions). It is an inherent cost of such activity, and must be factored into business plans. | |||
| Statistical loss measures, such as Value at Risk (“VaR”), estimate the amount by which actual losses in a portfolio could exceed the expected loss over a specified time horizon, measured to a specified level of confidence (probability). | ||||
| Stress loss is the loss that could arise from extreme events, typically beyond the confidence level of the statistical loss estimate, and is normally a scenario-based measure. | ||||
| These risk measures are typically applied at a portfolio level. They are complemented by controls such as targeted stress measures for concentrated exposures and vulnerable portfolios, sub-portfolios or positions. Concentration risk controls are generally applied where UBS identifies that positions in different financial instruments or different portfolios are affected by changes in the same risk factor or group of correlated factors. Such concentrations can have the potential for significant loss in the event of extreme but plausible adverse developments. Identifying such developments and assessing their potential impact – in particular the danger of aggregated losses from a single event through concentrated exposures – is a critical component of the risk control process. | ||||
èRefer to the “Risk concentrations”, section of this report for more information on risk exposures and identified risk concentrations | ||||
| Qualitative controls | ||||
| Although measurement of risk is clearly important, not all risks are quantifiable. Due diligence, sound judgment, common sense and an appreciation of a wide range of potential outcomes, including a willingness to challenge assumptions, are key components of a strong risk culture for both risk management and risk control. UBS has reinforced its qualitative risk controls through changes to its risk management and control organization, as described above in the summary of key developments in 2008 section, as well as through education programs. | ||||
| Earnings-at-risk and capital-at-risk | ||||
| To complement its day-to-day operating controls, UBS has developed the concepts of “earnings-at-risk” and “capital-at-risk”. These are general measures designed to assess the firm’s overall ability to absorb the potential losses inherent across all its business lines and from all major sources in the current economic cycle. | ||||
| Earnings-at-risk focuses on UBS’s ability to absorb losses through its current earnings. It is an integral part of the risk control process and is monitored by the BoD, the BoD risk | ||||
123
Table of Contents
Risk and treasury management
Risk management and control
committee and the GEB as part of UBS’s monthly risk reporting. The concept reflects UBS’s view that the primary resource to absorb losses should be a firm’s earnings stream. Earnings-at-risk has three elements – risk capacity, risk exposure and risk appetite.
The reduction in risk exposure that was achieved through sales (including transactions with BlackRock and the SNB) in addition to the significant writedowns incurred on risk positions, was offset by a simultaneous decrease of risk capacity due to downward revisions of earnings expectations as a consequence of the deteriorating economic outlook.
124
Table of Contents
Risk and treasury management |
Risk concentrations
| Risk concentrations | ||||
| A concentration of risk exists where: (i) a position or group of positions in financial instruments is affected by changes in the same risk factor or group of correlated factors; and (ii) the exposure could, in the event of large but plausible adverse developments, result in significant losses. | |||
| The identification of risk concentrations requires judgment because potential future developments cannot be predicted with certainty and may vary from period to period. In determining whether a risk concentration exists, UBS considers a number of elements, both individually and in combination. These elements include: the shared characteristics of the instruments; the size of the position or group of positions; the sensitivity of the position or group of positions to changes in risk factors and the volatility and correlations of those factors. Also important in this assessment is the liquidity of the markets where the instruments are traded and the availability and effectiveness of hedges, as the value of a hedge instrument may not always move in line with the position being hedged. This is referred to as basis risk. | ||||
| UBS is exposed to price risk, basis risk, credit spread risk and default risk, other idiosyncratic and correlation risks on both equities and fixed income inventories, and to country risk in many of its lending and trading activities. Refer to the “Market risk”, “Credit risk” and “Operational risk” sections of this re- | ||||
| port for more information on the risk categories to which UBS is exposed. UBS has also bought and may be required to buy securities and units from funds that UBS has sold to clients. Such purchases, especially of illiquid assets such as interests in hedge funds, could create a significant risk exposure for UBS. | |||
| If a risk concentration is identified, it is assessed to determine whether it should be reduced or mitigated, and the available means to do so are also evaluated. Identified risk concentrations are subject to increased monitoring. | ||||
| Identified risk concentrations | ||||
| Based on UBS’s assessment of its portfolios and asset classes with potential for material loss in a stress scenario relevant to the current environment, the firm believes the various exposures shown below can be considered risk concentrations according to the abovementioned definition. | ||||
| UBS has significant lending, counterparty and country risk exposures that could sustain significant losses if the current economic conditions were to persist. Refer to the “Credit risk” section of this report for more information. | ||||
| It is possible that material losses could occur on asset classes, positions and hedges other than those disclosed in this section of this report, particularly if the correlations that emerge in a stressed environment differ markedly from those anticipated by UBS. | ||||
| Exposure to monoline insurers, by rating1 | |||||||||||||||||||||
| USD million, unless otherwise stated | 31.12.08 | |||||||||||||||||||||
| Fair value of CDSs | Fair value of CDSs | |||||||||||||||||||||
| prior to credit | Credit valuation | after credit | ||||||||||||||||||||
| Fair value of | valuation | adjustment on | valuation | |||||||||||||||||||
| Notional amount3 | underlying CDOs4 | adjustment5 | 31.12.08 | adjustment | ||||||||||||||||||
| Column 1 | Column 2 | Column 3 (=1–2) | Column 4 | Column 5 (=3–4) | ||||||||||||||||||
Credit protection on US RMBS CDOs2 | 9,111 | 1,695 | 7,415 | 4,659 | 2,756 | |||||||||||||||||
of which: from monolines rated AAA to A | 23 | 12 | 11 | 4 | 6 | |||||||||||||||||
on US sub-prime residential mortgage-backed securities (RMBS) CDOs high grade | 0 | 0 | 0 | 0 | 0 | |||||||||||||||||
on US sub-prime RMBS CDOs mezzanine | 0 | 0 | 0 | 0 | 0 | |||||||||||||||||
on other US RMBS CDOs | 23 | 12 | 11 | 4 | 6 | |||||||||||||||||
of which: from monolines rated BBB and below | 9,088 | 1,683 | 7,404 | 4,655 | 2,750 | |||||||||||||||||
on US sub-prime residential mortgage-backed securities (RMBS) CDOs high grade | 6,222 | 952 | 5,269 | 2,961 | 2,308 | |||||||||||||||||
on US sub-prime RMBS CDOs mezzanine | 1,092 | 28 | 1,064 | 897 | 167 | |||||||||||||||||
on other US RMBS CDOs | 1,774 | 703 | 1,071 | 797 | 275 | |||||||||||||||||
Credit protection on other assets2 | 12,424 | 7,509 | 4,914 | 2,335 | 2,579 | |||||||||||||||||
of which: from monolines rated AAA to A | 2,399 | 1,568 | 830 | 334 | 496 | |||||||||||||||||
of which: from monolines rated BBB and below | 10,025 | 5,941 | 4,084 | 2,001 | 2,083 | |||||||||||||||||
Total 31.12.08 | 21,535 | 9,204 | 12,329 | 6,994 | 5,335 | |||||||||||||||||
| Total 31.12.07 (USD billion) | 24.2 | 19.7 | 4.5 | 0.9 | 3.6 | |||||||||||||||||
1 Excludes the benefit of credit protection purchased from unrelated third parties. 2 Categorization based on the lowest insurance financial strength rating assigned by external rating agencies. 3 Represents gross notional amount of credit default swaps (CDSs) purchased as credit protection. 4 Collateralized debt obligations (CDOs). 5 Credit default swaps. | ||||||||||||||||||||||
125
Table of Contents
Risk and treasury management
Risk management and control
| Exposure to monoline insurers | |||
| The vast majority of UBS’s direct exposure to monoline insurers arises from over-the-counter (OTC) derivative contracts, mainly credit default swaps (CDSs), purchased to hedge specific positions. On 31 December 2008, the total fair value of CDS protection purchased from monoline insurers against these positions was USD 5.3 billion after cumulative credit valuation adjustments (CVAs) of USD 7.0 billion. The level of CVAs increased significantly in 2008 from USD 0.9 billion on 31 December 2007 reflecting the progressive deterioration in both the fair value of the underlying CDOs and the credit quality of the monoline insurers during the year. | ||||
| Exposure under CDS contracts with monoline insurers is calculated as the sum of the fair values of individual CDSs after credit valuation adjustments. This, in turn, depends on the valuation of the instruments against which protection has been bought. A positive fair value, or a valuation gain, on the CDS is recognized if the fair value of the instrument it is intended to hedge decreases. | ||||
| The table on the previous page shows the CDS protection bought from monoline insurers to hedge specific positions. It illustrates the notional amounts of the protection originally bought, the fair value of the underlying instruments and the fair value of the CDSs both prior to and after credit valuation adjustments taken for these contracts. Refer to “Note 27 Fair value of financial instruments” in the financial statements of this report for more information on CVA valuation and sensitivities. The CVA as at 31 December 2008 was adjusted to take into account the anticipated economic impact of commuting trades with certain monolines. | |||
| Other than credit protection bought on the positions detailed in the table on the previous page, UBS held direct derivative exposure to monolines of USD 437 million after CVAs of USD 499 million on 31 December 2008. In its trading portfolio, UBS also had indirect exposure to monoline insurers through securities which they have guaranteed (“wrapped”) and which were issued primarily by US states and municipalities and US student loan programs. These | ||||
Exposure to auction rate securities
| Auction rate securities held by UBS Auction rate securities (ARS) are long-term securities structured to allow frequent reset of their coupon and, at the same time, the possibility for holders to sell their investment in a periodic auction, giving the securities some of the characteristics of a short-term instrument in normal market conditions. These are typically issued by municipal entities and student loan trusts, and may be wrapped by monoline insurers. Coupons paid on ARS are determined by an auction at the beginning of each interest reset period, the intention being to allow investors to earn a market rate of interest. In the past UBS | | acted as broker-dealer for certain ARS programs. Although it is not obligated to do so, UBS has in the past provided liquidity, from time to time, to these markets by submitting bids to ARS auctions and acquired ARS inventory in the first half of 2008 as a result. As described in the “Changes in 2008” section of UBS’s fourth quarter report, UBS and the Swiss National Bank (SNB) agreed that UBS’s student loan ARS positions will not be sold to the SNB fund. UBS’s inventory of student loan ARS was reclassified from “held for trading” to “loans and receivables” on 31 December 2008 and the student loan ARS repurchased from clients in fourth quarter 2008 were also | |||||||
| Auction rate securities exposure | |||||||||
| Net exposures on | Net exposures on | |||||||||
| 31.12.081,2 (USD million) | 31.12.071 (USD billion) | |||||||||
| US student loan auction rate securities | 8,362 | 4.5 | ||||||||
| US municipal auction rate securities | 451 | 1.4 | ||||||||
| US taxable auction preferred securities | 782 | |||||||||
| US tax-exempt auction preferred securities | 3,167 | |||||||||
Total | 12,763 | 5.9 | ||||||||
1 Net exposure represents market value of gross exposure net of short positions and hedges considered effective. 2 On 31 December 2008, USD 4.6 billion of the US student loan auction rate securities were monoline wrapped. | ||||||||||
| classified as loans and receivables. Under their new classification, all student loan ARS positions held by UBS are subject to an impairment test which includes a detailed review of the quality of the underlying collateral. In fourth quarter 2008 UBS carried out a fundamental analysis of its student loan ARS inventory as well as client positions included in the buy-back program (refer to “Maximum exposure to client auction rate securities” on the next page for more information). The majority of the collateral backing the securities is backed by Federal Family Education Loan Program (FFELP) which is reinsured by the US Department of Education. Auction preferred stocks (APS) are issued by closed-end mutual funds with an underlying portfolio of tax-exempt municipal bonds, common stock, preferred stock, or taxable debt. A closed-end fund is a publicly traded investment company registered under the Investment Company Act of 1940. The Investment Company Act of 1940 requires significant over-collateralization which benefits the APS holders. | |||
126
Table of Contents
Risk and treasury management |
| had a net market value of approximately USD 5.5 billion on 31 December 2008. Exposure to leveraged finance deals UBS defines leveraged finance deals according to internal credit ratings, which correspond with external corporate credit ratings of BB– or worse at the point of reporting and included underwritten positions that experienced a rating downgrade in 2008. The net exposure to leveraged finance commitments held by UBS was reduced significantly in 2008 to USD 4,009 million at 31 December 2008, of which USD 3,161 million was funded. Leveraged finance exposures on 31 December 2008 are shown net of cumulative gross writedowns and impairment charges, as well as effective hedges. Exposure to leveraged finance commitments, net of effective hedges, at 31 December 2007 was USD 11.4 billion, of which USD 7.4 billion was funded. The net exposure at this date, after deductions of cumulative gross markdowns, was USD 11 billion. | |||
| Previously disclosed risk concentrations In 2008, UBS significantly reduced its exposures to US residential and commercial real estate-related positions and the US reference-linked note (RLN) program. These reductions were achieved both through sales and writedowns as well as UBS’s agreement with the Swiss National Bank (SNB) in October 2008, which allows for the transfer of illiquid securities and other positions from UBS to a fund owned and controlled by the SNB. As a result of this agreement, UBS’s residual positions in these asset classes were no longer considered as concentrations of risk. Refer to the “Strategy and structure” section of this report for more information on the SNB transaction. UBS previously reported net exposures on 31 December 2007 to US sub-prime residential mortgages of USD 27.6 billion and to US Alt-A residential mortgages of USD 26.6 billion. At the same date UBS had net exposures to US commercial real estate of USD 7.7 billion and to US RLN of USD 11.2 billion. UBS also reported in third quarter 2008 net exposures of USD 6.1 billion on 30 June 2008 and USD 2.3 billion on 30 September 2008 to US prime residential mortgages. | |||
| On 31 December 2008, UBS had student loan ARS positions with a carrying value totaling USD 8.4 billion, of which approximately 66% of the securities in the portfolio was backed by FFELP guaranteed collateral. On the same date, UBS had exposures to US auction preferred securities of USD 4.0 billion. Maximum exposure to client auction rate securities UBS has committed to restore liquidity to client holdings of ARS. This commitment is in line with previously announced agreements in principle with various US regulatory agencies, and the final settlements entered into | |||
| with the Massachusetts Securities Division, the US Securities and Exchange Commission, and the New York Attorney General. On 7 October 2008, UBS filed a registration statement with the US Securities and Exchange Commission for Auction Rate Securities Rights necessary to offer clients the right to sell their ARS to UBS at par value during their buy-back period. The table below shows the maximum required repurchase amount at par of ARS, which would occur over various time periods between 31 October 2008 and 2 July 2012 according to client type and security. UBS anticipates that the maximum required repurchase | |||
| amount is likely to decline over time as issuers refinance their debt obligations and UBS works with issuers, industry peers and US government officials on restructuring initiatives and redemption opportunities. Approximately 88% of the USD 11.8 billion student loan ARS held by clients are backed by FFELP guaranteed collateral. Following the start of the buy-back program in fourth quarter 2008, UBS repurchased approximately USD 0.5 billion of US student loan ARS, USD 0.2 billion of US municipal ARS, USD 0.6 billion of US taxable auction preferred securities (APS) and USD 3.2 billion of US tax exempt APS from clients. | |||
| Client holdings: auction rate securities | |||||||||||||||||
| Buy-back period | ||||||||||||||||||
| Par value of maximum required purchase on 31.12.08 | Private clients | Institutional clients | ||||||||||||||||
| USD million | 31.10.08–4.1.11 | 2.1.09–4.1.11 | 30.6.10–2.7.12 | |||||||||||||||
| US student loan auction rate securities | 11,775 | 41 | 3,196 | 8,538 | ||||||||||||||
| US municipal auction rate securities | 2,041 | 144 | 1,589 | 308 | ||||||||||||||
| US taxable auction preferred securities | 1,659 | 161 | 1,202 | 296 | ||||||||||||||
| US tax-exempt auction preferred securities | 64 | 64 | – | – | ||||||||||||||
Total | 15,539 | 410 | 5,987 | 9,142 | ||||||||||||||
127
Table of Contents
Risk and treasury management
Risk management and control
Market risk
| Market risk is the risk of loss from changes in market variables. There are two broad categories of changes: general market risk factors and idiosyncratic components. General market risk factors are driven by macroeconomic, geopolitical and other market-wide considerations, independent of any instrument or single issuer or counterparty. They include such things as interest rates, the levels of equity market indices, exchange rates, commodities (including the price of energy and metals), as well as general credit spreads. The associated volatility of these risk factors and the correlations between them are also considered to be general market risk factors. Idiosyncratic components, on the other hand, are those that cannot be explained by general market moves. Broadly they are the elements of the prices of debt and equity instruments, as well as derivatives linked to them, which result from factors and events specific to individual companies or entities. Sources of market risk UBS takes both general and idiosyncratic market risks in its trading activities, and some non-trading businesses are also subject to general market risks. Trading Most of UBS’s trading activity is in the Investment Bank. During 2008 it included market-making, facilitation of client business and proprietary position taking in the cash and derivative markets for equities, fixed income, interest rates, foreign exchange, energy, metals and commodities. However, the Investment Bank is being | |||
| repositioned to focus primarily on client activities. In addition to the planned exit from municipals, proprietary trading and commodities (excluding precious metals) businesses, the Investment Bank will also largely exit its remaining real estate and securitization activities as well as the exotic structured products business. Refer to the “Investment Bank” section of this report for further information. | ||||
| The largest contributor to market risk within the Investment Bank has been the fixed income trading area. This business area has been progressively reducing risk positions. Those that remain relate to corporate and consumer credit markets, US municipal and student loan markets, as well as significantly reduced positions in asset-backed securities (including residential and commercial real estate). | ||||
| The relative contribution from a market risk perspective from equities, currencies and commodities has been modest compared to that seen in the fixed income trading area. | ||||
| Trading businesses are subject to multiple market risk limits. Traders are required to manage their risks within these limits which in turn may involve employing hedging and risk | |||
| mitigation strategies. These strategies can expose UBS to risk as the hedge instrument and the position being hedged may not always move in parallel (often referred to as “basis risk”). Senior management and risk controllers may also give instructions for risk to be reduced, even when limits are not exceeded, if particular positions or the general levels of exposure are considered inappropriate. | |||
| The asset management and wealth management businesses carry small trading positions, principally to support client activity. The market risk from these positions is not material to UBS as a whole. UBS has also bought and may be required to buy securities and units from funds that UBS has sold to clients, which may be exposed to market risk. These positions are managed as investment positions. Refer to the “Equity investments” section below for further information. Non-trading In the Investment Bank, significant non-trading interest rate risk and all non-trading foreign exchange risks are captured, controlled and reported under the same risk management and control framework as trading risk. | ||||
| In the other business divisions, exposures to general market risk factors – primarily interest rates and exchange rates – also arise from non-trading activities (the largest items are the interest rate risks in Global Wealth Management & Business Banking). These market risks are generally transferred to the Investment Bank or Group Treasury, which manage the positions as part of their overall portfolios within their allocated limits. | ||||
| Market risks that are retained by the other business divisions are not significant relative to UBS’s overall risk, and exposures are subject to market risk measures and controls. With the exception of structural currency exposures which arise from Group Treasury’s management of consolidated capital, non-trading currency and commodity positions are subject to market risk regulatory capital and are therefore captured in VaR, although such positions do not contribute significantly to overall VaR. | ||||
| Group Treasury also assumes market risk from its funding, balance sheet and capital management responsibilities. For example, it finances non-monetary balance sheet items such as bank property and equity investments in associated companies. It also manages interest rate and foreign exchange risks resulting from the deployment of UBS’s consolidated equity, from structural foreign exchange positions and from non-Swiss franc revenues and costs. The market risk limits allocated to Group Treasury cover both the risks resulting from these responsibilities, and those transferred from other business divisions. | ||||
èRefer to the “Treasury management” section of this report for more information on Group Treasury’s risk management activities. | ||||
128
Table of Contents
Risk and treasury management |
| Measuring market risk UBS has two major portfolio measures of market risk – VaR and stress loss – which are common to all business divisions. They are complemented by concentration and other supplementary limits on portfolios, sub-portfolios, asset classes or products for specific purposes where standard limits are not considered to provide comprehensive control. They may also be applied to complex products for which not all model input parameters are observable, and which thus create challenges for valuation and risk measurement. Operational limits can take a variety of forms including values (market, nominal or notional) or risk sensitivities (a measure of exposure to a given risk factor such as interest rates or credit spreads). These “operational limits” are intended to address concerns about the extent of market liquidity, available operational capacity or valuation uncertainty, for example. | |||
| Market risk limits are set for each of the business divisions and Group Treasury. The limit framework in the Investment Bank is clearly more detailed than the other divisions reflecting the nature of the risks it takes and the capacity in which it takes risks. Value at Risk (VaR) VaR is a statistical estimate of potential loss from adverse movements in market risk factors. A single VaR model is used for both internal limit purposes and for determining market risk regulatory capital requirements. However, the population of risk positions included in the internal management VaR measure differs from the regulatory VaR measure, largely due to required exclusions from regulatory VaR. UBS’s internal management VaR includes interest rate risk from banking book positions and credit spread sensitivities related to counterparty exposures in the OTC derivatives portfolios (referred to as credit valuation adjustment – CVA). The inclusion of CVA in internal management VaR resulted in a material difference between this measure and the regulatory VaR. In third quarter 2008, UBS changed its VaR disclosure and now presents both the regulatory and internal VaR. | ||||
| UBS measures VaR using a 10-day time horizon for regulatory and for internal purposes, while VaR backtesting is based on a 1-day time horizon (refer to the discussion on backtesting below for more information). VaR is calculated daily, based on end-of-day positions, and is not subsequently restated to reflect any retrospective adjustments to position valuations. VaR models are based on historical data and thus implicitly assume that market moves over the next 10 days or one day will follow a similar pattern to those that have occurred over 10-day and one-day periods in the past. UBS uses a look-back period of five years which generally captures the cyclical nature of financial markets but may be slow to react to periods of heightened volatility. UBS applies these historical changes directly to current positions, a method known as historical simulation. | ||||
| Realized market losses can differ from those implied by the VaR measure for many reasons. All VaR measures are subject to limitations and must be interpreted accordingly. The losses experienced by UBS in 2008 highlight the limitations of VaR as an absolute measure of risk and reinforce the need for multiple views of risk exposure. As an essential complement to VaR, UBS applies stress scenarios reflecting different combinations of market moves intended to capture a range of potential stress events, and more targeted stress tests for concentrated exposures and vulnerable portfolios. VaR developments in 2008 UBS made a number of changes to its VaR model in 2008, while also changing the scope of the regulatory and internal management VaR to better reflect the underlying risks. These changes significantly impacted the levels of VaR in 2008 compared with 2007, and are summarized below. | |||
| – | From 1 January 2008, UBS changed its approach to internal risk control for illiquid US residential mortgage-related exposures: US sub-prime and Alt-A residential mortgage-backed securities (RMBS); super senior RMBS collateralized debt obligations (CDOs); the US reference-linked note program; and related hedges. These positions were excluded from internal management VaR and related limits with new controls were instituted directly over the volume of remaining positions in these categories. As the regulatory capital treatment changed from trading book to banking book, these positions were also excluded from regulatory capital VaR. | |||
| – | In second quarter 2008, positions in student loan auction rate securities (ARS) were reclassified from trading book to banking book for regulatory capital purposes and excluded from regulatory capital VaR and backtesting due to the illiquidity of the positions. | |||
| – | Enhancements to the VaR model were introduced at the end of June 2008 to increase the granularity of credit spread risk representation between single name CDS, several CDS indices and cash positions. | |||
| – | UBS increased the scope of its internal management VaR in third quarter 2008 to more accurately represent risk exposures and related hedges. Before these changes, certain credit hedges were included in VaR but the underlying credit exposures were not, resulting in an inconsistent treatment for risk monitoring and control. UBS therefore incorporated into its internal management VaR the impact of changes in credit spread sensitivities relating to counterparty exposures in its OTC derivatives portfolio. However, when computing regulatory capital these credit spread sensitivities are currently excluded. Refer to the “Value at Risk developments – treatment of CVA” sidebar in UBS’s third quarter 2008 financial report for more information. | |||
| – | In fourth quarter 2008, UBS introduced additional granularity between certain cost of funding measures – Libor | |||
129
Table of Contents
Risk and treasury management
Risk management and control
| and the overnight index swap (OIS) rate. In addition, UBS excluded positions related to the asset and liability management (ALM) portfolio from its regulatory VaR. The ALM desk is a treasury function within the Investment Bank which manages the funding and liquidity exposures of the Investment Bank and is not managed with trading intent. The positions related to ALM this portfolio remain in internal management VaR. | |||
| – | UBS continues to review the performance of its VaR implementation and will continue to enhance its VaR model to more accurately capture the relationships between market risks associated with certain risk positions, as well as the revenue of large market movements for some trading positions. | |||
| Backtesting The accuracy of the VaR model is monitored by backtesting, which compares the 1-day regulatory VaR calculated on trading portfolios at close of each business day with the actual revenues arising on those positions on the next business day. These backtesting revenues exclude non-trading components such as commissions and fees as well as estimated revenues from intraday trading. If backtesting revenues are negative and exceed the 1-day regulatory VaR, this results in a “backtesting exception”. | ||||
| VaR based on a one-day horizon provides an estimate of the range of daily mark-to-market revenues on trading | |||
| positions under normal market conditions similar to those experienced during the historical period used in the model. As UBS’s VaR model uses a look-back period of five years it does not respond quickly to periods of heightened volatility as experienced in 2008. When 1-day regulatory VaR is measured at a 99% confidence level, such an exception can be expected, on average, to occur on one in a hundred business days. More frequent backtesting exceptions may occur if market moves are greater than those seen in the look-back period, the frequency of large moves increases, or historical correlations and relationships between markets or variables break down (for example, in a period of extreme market disruption or an extreme stress event). Backtesting exceptions are also likely to arise if the way positions are represented in VaR does not adequately capture all their differentiating characteristics or the relationships between them. | |||
| UBS experienced 50 backtesting exceptions in 2008 compared with 29 backtesting exceptions in 2007. | ||||
| The extreme market movements in a number of risk factors combined with a breakdown in traditional relationships between trading positions and their corresponding hedges (basis risk) were the primary contributors to the backtesting exceptions experienced. These results highlight the limitations of VaR and illustrate the need for multiple views of risk exposure such as macro and more targeted stress scenarios. Refer to the “Stress loss” section below for more information. UBS will continue improving its VaR model to better | ||||
Investment Bank: backtesting revenue1 distribution
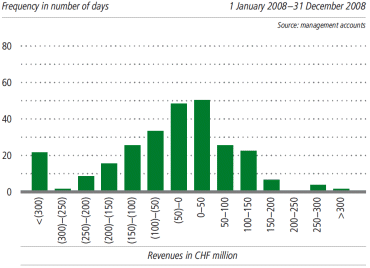
Investment Bank: analysis of negative backtesting revenues1
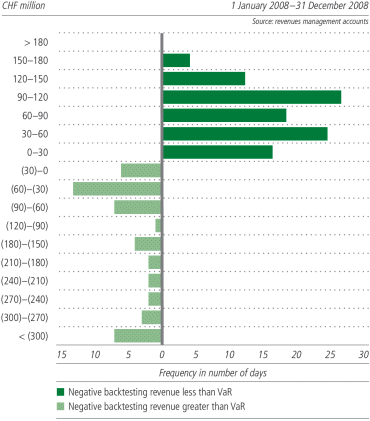
130
Table of Contents
Risk and treasury management |
| capture all relevant risks in its trading portfolio. | ||||
| The first histogram on the previous page shows daily backtesting revenues in the Investment Bank for the whole of 2008. In the second histogram, the daily backtesting revenues are compared with the corresponding VaR over the same 12-month period for days when backtesting revenues were negative. A positive result in this histogram represents a loss less than VaR while a negative result represents a loss greater than VaR and therefore a backtesting exception. | ||||
| All backtesting exceptions and any exceptional revenues on the profit side of the VaR distribution are investigated. In | ||||
| addition all backtesting results are reported to senior business management, the Group CRO and business division CROs. | ||||
| Backtesting exceptions are also reported to internal and external auditors and relevant regulators. | |||
Stress loss The purpose of stress testing is to quantify exposure to extreme and unusual market movements. UBS’s VaR measure is based on observed historical movements and correlations, whereas its stress loss measures are informed by past events but include forward looking elements. UBS’s objectives in | ||||
| Investment Bank: Value-at-Risk (10-day, 99% confidence, 5 years of historical data)1 | ||||||||||||||||||||||||||||||||||||
| Year ended 31.12.08 | Year ended 31.12.07 | |||||||||||||||||||||||||||||||||||
| CHF million | Min. | Max. | Average | 31.12.08 | Min. | Max. | Average | 31.12.07 | ||||||||||||||||||||||||||||
Risk type | ||||||||||||||||||||||||||||||||||||
| Equities | 82 | 185 | 131 | 117 | 147 | 415 | 209 | 164 | ||||||||||||||||||||||||||||
| Interest rates (including credit spreads) | 217 | 659 | 397 | 544 | 260 | 858 | 450 | 548 | ||||||||||||||||||||||||||||
| Foreign exchange | 12 | 58 | 28 | 30 | 9 | 73 | 28 | 21 | ||||||||||||||||||||||||||||
| Energy, metals and commodities | 14 | 60 | 30 | 22 | 24 | 90 | 51 | 41 | ||||||||||||||||||||||||||||
| Diversification effect | 2 | 2 | (212 | ) | (229 | ) | 2 | 2 | (225 | ) | (223 | ) | ||||||||||||||||||||||||
Total regulatory VaR | 240 | 601 | 374 | 485 | 276 | 820 | 514 | 552 | ||||||||||||||||||||||||||||
| Diversification effect (%) | (36% | ) | (32% | ) | (30% | ) | (29% | ) | ||||||||||||||||||||||||||||
Management VaR1,3 | 239 | 499 | 316 | 424 | 291 | 836 | 537 | 614 | ||||||||||||||||||||||||||||
1 From 1 January 2008, excludes US residential sub-prime and Alt-A mortgage-related exposures, super senior RMBS CDOs and the US reference-linked note program, and related hedges. 2 As the minimum and maximum occur on different days for different risk types, it is not meaningful to calculate a portfolio diversification effect. 3 Includes all positions subject to internal management VaR limits (including CVAs since 3Q 2008). | ||||||||||||||||||||||||||||||||||||
| UBS Group: Value-at-Risk (10-day, 99% confidence, 5 years of historical data)1 | |||||||||||||||||||||||||||||||||||
| Year ended 31.12.08 | Year ended 31.12.07 | |||||||||||||||||||||||||||||||||||
| CHF million | Min. | Max. | Average | 31.12.08 | Min. | Max. | Average | 31.12.07 | ||||||||||||||||||||||||||||
Business divisions | ||||||||||||||||||||||||||||||||||||
Investment Bank1 | 240 | 601 | 374 | 485 | 276 | 820 | 514 | 552 | ||||||||||||||||||||||||||||
| Global Asset Management | 1 | 7 | 2 | 6 | 2 | 10 | 4 | 3 | ||||||||||||||||||||||||||||
| Global Wealth Management & Business Banking | 1 | 17 | 4 | 16 | 2 | 5 | 3 | 2 | ||||||||||||||||||||||||||||
Corporate Center2 | 3 | 93 | 26 | 10 | 1 | 87 | 18 | 21 | ||||||||||||||||||||||||||||
| Diversification effect | 3 | 3 | (34 | ) | (25 | ) | 3 | 3 | (29 | ) | (29 | ) | ||||||||||||||||||||||||
Total regulatory VaR | 246 | 609 | 373 | 492 | 273 | 814 | 509 | 548 | ||||||||||||||||||||||||||||
| Diversification effect (%) | (8% | ) | (5% | ) | (5% | ) | (5% | ) | ||||||||||||||||||||||||||||
Management VaR1, 4 | 246 | 521 | 320 | 459 | 288 | 833 | 535 | 588 | ||||||||||||||||||||||||||||
1 From 1 January 2008, excludes US residential sub-prime and Alt-A mortgage-related exposures, super senior RMBS CDOs and the US reference-linked note program, and related hedges. 2 The Corporate Center regulatory VaR only includes FX risk of Group Treasury. 3 As the minimum and maximum occur on different days for different risk types, it is not meaningful to calculate a portfolio diversification effect. 4 Includes all positions subject to internal management VaR limits (including CVAs since 3Q 2008). | ||||||||||||||||||||||||||||||||||||
| UBS: Value-at-Risk (1-day, 99% confidence, 5 years of historical data)1 | ||||||||||||||||||||||||||||||||||||
| Year ended 31.12.08 | Year ended 31.12.07 | |||||||||||||||||||||||||||||||||||
| CHF million | Min. | Max. | Average | 31.12.08 | Min. | Max. | Average | 31.12.07 | ||||||||||||||||||||||||||||
| Investment Bank | Regulatory VaR2 | 96 | 210 | 132 | 162 | 122 | 249 | 160 | 134 | |||||||||||||||||||||||||||
| Management VaR3 | 101 | 171 | 125 | 160 | 124 | 253 | 164 | 149 | ||||||||||||||||||||||||||||
UBS | Regulatory VaR2 | 97 | 207 | 133 | 163 | 122 | 249 | 159 | 136 | |||||||||||||||||||||||||||
| Management VaR3 | 101 | 169 | 125 | 159 | 126 | 254 | 165 | 152 | ||||||||||||||||||||||||||||
1 10-day and 1-day Value at Risk (VaR) results are separately calculated from underlying positions and historical market moves. They cannot be inferred from each other. From 1 January 2008, excludes US residential sub-prime and Alt-A mortgage-related exposures, super senior RMBS CDOs and the US reference-linked note program, and related hedges. 2 Backtesting is based on regulatory capital VaR. 3 Includes all positions subject to internal management VaR limits (including CVAs since 3Q 2008). | ||||||||||||||||||||||||||||||||||||
131
Table of Contents
Risk and treasury management
Risk management and control
stress testing are to explore a wide range of possible outcomes, to understand vulnerabilities, and to provide a control framework that is comprehensive, transparent and responsive to changing market conditions.
| moves actually seen in a stress event, and actual events may differ significantly from those modeled in the stress scenarios. | ||||
| Most major financial institutions employ stress tests, but their approaches differ widely and there is no benchmark or industry standard in terms of scenarios or the way they are applied to an institution’s positions. The impact of a given stress scenario, even if measured in the same way across institutions, depends entirely on the make-up of each institution’s portfolio, and a scenario that is relevant to one institution may have no relevance to another. Comparisons of stress results between institutions can therefore be highly misleading, and for this reason UBS, like most of its peers, does not publish quantitative stress results. Concentration limits and other controls | ||||
| UBS applies concentration limits on exposures to general market risk factors and to single name exposures. The limits take account of variations in price volatility and market depth and liquidity. | |||
| In the Investment Bank, limits are placed on exposures to individual risk factors. They are applied to general market risk factors such as interest rates, credit spreads, equity indices and foreign exchange rates or groups of highly correlated factors based on assumed moves in the risk factors broadly consistent with the terms of UBS’s VaR measure. Each limit applies to exposures arising from all instrument types in all trading businesses of the Investment Bank. The assumed moves in risk factors are updated in line with the VaR historical time series and the limits are reviewed annually or as necessary to reflect market conditions.The effectiveness of risk factor limits in controlling concentrations of risk depends critically upon the way risk positions are represented. If long and short positions are considered to be sensitive to the same risk factor, potential gains and losses from changes in that factor are netted. The steps UBS has taken in 2008 to enhance the granularity of risk representation in its VaR measure are also relevant to its risk concentration controls as underlying relationships between risk factors are more clearly represented in VaR exposures. | ||||
| UBS also applies volume-based limits to certain portfolios and sub-portfolios. Additionally, UBS measures and limits the potential impact of increased default rates on the value of its portfolio of single name exposures. | ||||
| The Investment Bank carries exposure to single names, and therefore to event risk (including default risk). This risk is measured across all relevant instruments (debt and equity in physical form and from forwards, options, default swaps and other derivatives including basket securities) as the aggregate change in value resulting from an event affecting a single name or group. The maximum amount that could be lost if all underlying debt and equity of each name became worthless is also tracked. Positions are controlled in the con- | ||||
132
Table of Contents
Risk and treasury management |
| text of the liquidity of the market in which they are traded, and all material positions are monitored in light of changing market conditions and information on individual names. | ||||
| This form of single name exposure measure is most appropriate to corporate issuers, financial institutions and other entities, the value of whose equity and debt instruments is dependent on their own assets, liabilities and capital resources. | ||||
| Exposures arising from security underwriting commitments are subject to the same measures and controls as secondary market positions. There are also governance processes for the commitments themselves, generally including review by a commitment committee with representation from business and control functions. Underwriting commitments are approved under specific delegated risk management and risk control authorities. | |||
Other applications of market risk measures Market risk measurement tools may be selectively applied to portfolios for which the primary controls are in other forms. VaR can, for example, provide additional insight into the sensitivity of investment positions to market risk factors, even though some of the assumptions of VaR – in particular the relatively short time horizon – may not be representative of their full risk. The results can be used by business management and risk controllers for information purposes or to trigger action or review. Equity investments | ||||
| UBS makes investments for a variety of purposes. Some are made for revenue generation or as part of strategic initiatives, while others, such as exchange and clearing house memberships, are held in support of UBS’s business activities. Investments may also be made in funds managed by UBS to fund or “seed” them at inception or to demonstrate alignment of UBS’s interests with those of investors. UBS has also bought and may be required to buy securities and units from funds that UBS has sold to clients. These include purchases of illiquid assets such as interests in hedge funds. | |||
| UBS may make direct investments in a variety of entities or buy equity holdings in both listed and unlisted companies. Such investments tend to be illiquid. The fair values of equity investments are generally dominated by factors specific to the individual stocks, and the correlation of individual holdings to equity indices varies. Furthermore, equity investments are generally intended to be held for the medium- or long-term and may be subject to lock-up agreements. For these reasons, they are not directly controlled using the market risk measures applied to trading activities. They are, however, subject to controls, including pre-approval of new investments by business management and risk control, and regu- | ||||
| lar monitoring and reporting. They are also included in earnings-at-risk and capital-at-risk metrics. | |||
| Where investments are made as part of an ongoing business they are also subject to standard controls, including portfolio and concentration limits. Seed money and co-investments in UBS-managed funds made by Global Asset Management are, for example, subject to a portfolio limit. All investments must be explained and justified, approved according to delegated authorities, and monitored and reported to senior management throughout their life. | ||||
| Private equity positions were, in the past, the major component of equity investments, but the portfolio has been managed down over recent years. | ||||
| Under International Financial Reporting Standards (IFRS), equity investments may be classified as “financial investments available-for-sale”, “financial assets designated at fair value through profit or loss” or “investments in associates”. Composition of equity investments At 31 December 2008, UBS held equity investments totaling CHF 3,653 million, of which CHF 1,681 million were classified as “financial investments available-for-sale”, CHF 1,079 million as “financial assets designated at fair value” and CHF 892 million as “investments in associates”. Within “financial investments available-for-sale”, CHF 258 million are listed equities. | ||||
| At 31 December 2007, UBS held equity investments totaling CHF 7,690 million, of which CHF 3,583 million were classified as “financial investments available-for-sale”, CHF 2,128 million as “financial assets designated at fair value” and CHF 1,979 million as “investments in associates”. Within “financial investments available-for-sale”, CHF 1,865 million are listed equities. | ||||
| In December 2008, UBS disposed of its equity stake in Bank of China through a placing of approximately 3.4 billion Bank of China Limited H-shares to institutional investors for a cash consideration of approximately CHF 887 million (HKD 6,519 million). UBS acquired the shares in 2005 in preparation for Bank of China’s IPO to the international market. The investment in Bank of China was accounted for as a “financial investment available-for-sale”. The disposal resulted in a gain of approximately CHF 360 million. | ||||
| Within the total of CHF 1,079 million “financial assets designated at fair value”, CHF 1,058 million represents the assets of trust entities associated with employee compensation schemes. They are broadly offset by liabilities to plan participants included in “other liabilities”. The equivalent positions at 31 December 2007 amounted to CHF 1,788 million. | ||||
èRefer to “Note 34 Significant subsidiaries and associates” in the financial statements of this report for details of significant associates | ||||
133
Table of Contents
Risk and treasury management
Risk management and control
Credit risk
| Credit risk is the risk of financial loss resulting from failure by a client or counterparty to meet its contractual obligations to UBS. This can be caused by factors directly related to the counterparty, such as business or management problems, or from failures in the settlement process, for example on foreign exchange transactions where UBS has honored its obligation but the counterparty fails to deliver the counter-value (“settlement risk”). Alternatively, it can be triggered by economic or political difficulties in the country in which the counterparty or issuer of the security is based or where it has substantial assets (“country risk”). Sources of credit risk Credit risk is inherent in traditional banking products such as loans, commitments to lend and contingent liabilities (for example, letters of credit) as well as in “traded products”: derivative contracts such as forwards, swaps and options; repurchase agreements (repos and reverse repos); and securities borrowing and lending transactions. The risk control processes applied to these products are fundamentally the same, although the accounting treatment varies, as they can be carried at amortized cost or fair value, depending on the type of instrument and, in some cases, the nature of the exposure. | |||
| Many of the business activities of Global Wealth Management & Business Banking and the Investment Bank expose UBS to credit risk, while credit risk exposure is a less material concern to Global Asset Management. Global Wealth Management & Business Banking offers private and corporate customers in Switzerland and wealth management clients internationally a variety of credit products, although the majority of credit risks are well secured by financial collateral or other assets. The Investment Bank gives corporate, institutional, intermediary and alternative asset management clients access to a full range of credit and capital markets instruments across all product classes, and engages with other professional counterparties in its trading and risk management activities. Credit risk control Limits and controls Concentrations of credit risk can arise if clients are engaged in similar activities, or are located in the same geographical region or have comparable economic characteristics such that their ability to meet contractual obligations would be similarly affected by changes in economic, political or other conditions. To avoid, as far as possible, undue credit risk concentrations, UBS has established limits and operational controls to constrain credit exposure to individual counterparties | ||||
| and counterparty groups. Where appropriate, it has also established industry and country limits and guidelines at portfolio and sub-portfolio levels. | |||
| At the level of the individual counterparty and counter-party group, limits are established covering banking and traded products. These limits put constraints not only on the current outstanding amount but also on contingent commitments and the potential future exposure of traded products. Credit engagements may not be entered into without the appropriate approvals and adherence to these limits. | ||||
| In the Investment Bank, at a portfolio level a distinction is made between those exposures which are to be held to maturity (“take and hold exposures”) and those which will be held only over the short term, pending distribution or risk transfer (“temporary exposures”). Most limits and operational controls constrain the credit exposure of a sub-portfolio, but UBS also has limits that restrict the credit risk of a whole portfolio using credit risk measures such as stress loss, as described below. Such limits are applied for instance to the Investment Bank’s leveraged lending portfolio, where the impact of variations in default rates and asset prices is considered, together with market liquidity and UBS’s distribution capabilities. Risk mitigation Taking collateral is the most common way to mitigate credit risk. Loans to wealth management clients (“lombard lending”) are made against the pledge of sufficient eligible marketable securities or cash. For real estate financing, a mortgage over the relevant property is taken to secure the claim. The Investment Bank also takes financial collateral in the form of marketable securities in much of its over-the-counter (OTC) derivatives activities and in its securities financing business (securities lending and borrowing or repurchase and reverse repurchase). To ensure with a high degree of certainty that the collateral value will cover the exposure, discounts (“haircuts”) are generally applied to the current market value. These reflect the quality, liquidity, volatility and, in some cases, the complexity of the individual instruments. Exposures and collateral values are continuously monitored, and margin calls or close-out procedures are enforced, when the market value of collateral falls below a predefined trigger level. Concentrations within individual collateral portfolios and across clients are also monitored where relevant and may affect the discount applied to a specific collateral pool. | ||||
| The OTC derivatives business is generally conducted under bilateral master agreements, which typically allow for the close-out and netting of all transactions in the event of default. UBS also has two-way collateral agreements with all major market participants, under which either party can be | ||||
134
Table of Contents
Risk and treasury management |
| required to provide collateral in the form of cash or marketable securities when exposure exceeds a predefined level. The OTC derivatives business with lower-rated counterparties is generally conducted under one-way collateral agreements where only the counterparty is required to provide UBS with cash or very liquid collateral. For certain counterparties, like hedge funds, UBS may use two-way collateral agreements. UBS has policies for netting and collateral agreements, including requiring a legal opinion that contracts are enforceable in the case of insolvency in the relevant jurisdictions. | |||
| The Investment Bank also utilizes credit hedging to actively manage the credit risk of its portfolios, with the goal of reducing concentrations in individual names, sectors or specific portfolios. The Investment Bank utilizes a number of different hedging measures which include single name credit default swaps (CDS), index CDS, credit linked notes and total return swaps. Single name CDS are generally executed under bilateral netting and collateral agreements, with high-grade market counterparties. For the purposes of monitoring against limits, UBS observes strict standards. Credit hedges are only recognized as a risk mitigant if they are single name credit default swaps, total return swaps or credit linked notes. They must cover potential credit exposure increases to a high level of confidence, and offer protection against a wide range of credit events. Other credit risk mitigants such as proxy hedges (credit protection on a correlated but different name) or index CDS are not recognized for the purposes of monitoring against limits. | ||||
| Buying credit protection creates credit exposure against the hedge provider. The exposure to credit protection providers and thus the effectiveness of credit hedges is monitored as part of the overall credit exposure against the relevant names. Where there is significant correlation between the counterparty and the hedge provider (so-called “wrong-way risk”), UBS’s policy is not to recognize any benefit in credit risk measures. | ||||
| Credit risk measurement Credit risk measurement is an essential component of the credit risk control framework. The measurement of credit exposure from a loan which is fully drawn is straightforward. By contrast, the estimation of credit exposure on a traded product, the value of which varies with changes in market variables, interim cash flows and the passage of time, is more complex and requires the use of models. The assessment of portfolio risk also entails estimations of the likelihood of defaults occurring, of the associated loss ratios if they do, and of default correlations between counterparties. | ||||
| UBS has developed tools to support the quantification of the credit risk of individual counterparties, applying the three generally accepted parameters: probability of default, exposure at default and loss given default. Models are also used to derive the portfolio risk measures expected loss, statistical loss and stress loss. | ||||
| Credit risk parameters Three parameters are used to measure and control individual counterparty credit risk: | |||
| – | Theprobability of default is an estimate of the likelihood of the client or counterparty defaulting on its contractual obligations. This probability is assessed using rating tools tailored to the various categories of counterparties. These categories are also calibrated to the UBS 15-class Masterscale (UBS’s proprietary credit rating scale) to ensure consistency in the quantification of default probabilities across counterparties. Besides their use for credit risk measurement, ratings are an important element in setting credit risk approval authorities. | |||
| – | Exposure at default is derived from the current exposure to the counterparty and its possible future development. For traded products such as OTC derivatives, the exposure at default is not a definitive number – it must be derived by modeling the range of possible outcomes. In measuring individual counterparty exposure against credit limits, UBS considers the maximum likely exposure measured to a high confidence level over the full life of all outstanding obligations. However, when aggregating exposures to different counterparties for portfolio risk measurement, the expected exposure to each counterparty at a given time horizon (usually one year) generated by the same model is used. | |||
| – | Theloss given default is determined based on the likely recovery rate of defaulted claims, which is a function of the type of counterparty and any credit mitigation or support (such as security or guarantee). | |||
| These parameters are the basis for most internal measures of credit risk. They are also key inputs to the regulatory capital calculation under the advanced Internal Rating Based approach of the new Basel Capital Accord (Basel II), which UBS adopted from 1 January 2008, when the accord came into force. | ||||
èRefer to the discussion on rating system design and estimation of credit risk parameters below for a more detailed description of the three credit risk parameters discussed above | ||||
| Expected loss Credit losses must be anticipated as an inherent cost of doing business. But the occurrence of credit losses is erratic in both timing and amount, and those losses that do arise usually relate to transactions entered into in previous accounting periods. In order to reflect the fact that future credit losses are implicit in today’s portfolio, UBS uses the concept of “expected loss”. | ||||
| Expected loss is a statistical concept which is used to estimate the annual costs that are expected to arise, on average, from positions in the current credit portfolio that become impaired. The expected loss for a given credit facility is a function of the three components described above: proba- | ||||
135
Table of Contents
Risk and treasury management
Risk management and control
| bility of default, exposure at default and loss given default. The expected loss figures for individual counterparties are aggregated to derive the expected credit loss for the whole portfolio. | ||||
| Expected loss is the basis for quantifying credit risk in all portfolios. It is an input used to value or price some products. Expected loss is also the starting point for the measurement of portfolio statistical loss and stress loss. | ||||
èRefer to the discussion on credit loss expense below for more information | ||||
Statistical loss UBS uses a statistical model – credit Value at Risk (“credit VaR”) – to estimate the potential loss on the portfolio over one year measured to a specified level of confidence. The shape of the modeled loss distribution is driven by systematic default relationships amongst counterparties within and between segments. The results of this analysis provide an indication of the level of risk in the portfolio, and the way it develops over time. It is also an important input to the overall risk measures earnings-at-risk and capital-at-risk. | ||||
èRefer to the discussion on earnings-at-risk and capital-at-risk in the “Risk management and control” section of this report for more information | ||||
| Stress loss Stress loss is a scenario-based measure which complements the statistical model. It is used to assess potential loss in various extreme but plausible scenarios in which it is assumed that one or more of the three key credit risk parameters deteriorates substantially according to a pattern that is typical for the chosen scenario. Stress tests are run regularly, and on an ad hoc basis as necessary, in order to identify adverse portfolio situations, particularly risk concentrations. All scenario results are monitored, and for certain portfolios and segments, stress loss is subject to limits. Composition of credit risk – UBS Group | ||||
| The measures of credit risk used by UBS may differ depending on the purpose for which exposures are aggregated: financial accounting under the International Financial Reporting Standards (IFRS); determination of regulatory capital; or UBS’s own internal management view (i.e. the economic risk of the credit portfolio which reflects how that risk is managed by UBS). The table “Exposure to credit risk – UBS Group” below begins with the IFRS view (“maximum exposure to credit risk”), and shows the adjustments required to reconcile to the internal management view (“Credit exposure before hedges”). | |||
| Exposure to credit risk – UBS Group | |||||||||||||||||||||||||||||
| For the year ended | ||||||||||||||||||||||||||||||
| 31.12.2008 | 31.12.2007 | |||||||||||||||||||||||||||||
| IFRS1 reported | Adjustments: | IFRS1 reported | ||||||||||||||||||||||||||||
| values | Maximum | Credit | Credit | values | Credit | Credit | ||||||||||||||||||||||||
| Maximum | exposure | exposure | exposure | Maximum | exposure | exposure | ||||||||||||||||||||||||
| exposure to | to internal | before | after | exposure to | before | after | ||||||||||||||||||||||||
| CHF million | credit risk2 | risk view | hedges3 | hedges4 | credit risk2 | hedges3 | hedges4 | |||||||||||||||||||||||
| Balances with central banks | 29,156 | 29,156 | 16,433 | 16,434 | ||||||||||||||||||||||||||
| Due from banks | 64,451 | (45,419) | 19,032 | 60,907 | 26,304 | |||||||||||||||||||||||||
| Loans | 340,308 | (68,627) | 271,681 | 335,864 | 285,093 | |||||||||||||||||||||||||
| Contingent claims | 19,699 | (807) | 18,892 | 20,824 | 20,347 | |||||||||||||||||||||||||
| Undrawn irrevocable credit facilities | 60,316 | (3,326) | 56,990 | 83,980 | 80,971 | |||||||||||||||||||||||||
Banking products | 513,930 | (118,179) | 395,750 | 347,900 | 518,008 | 429,149 | 377,622 | |||||||||||||||||||||||
Derivative instruments3 | 854,100 | (626,448) | 227,652 | 428,217 | 184,809 | |||||||||||||||||||||||||
Securities lending/borrowing4 | 122,897 | } | (300,694) | 46,851 | 207,063 | } | 58,896 | |||||||||||||||||||||||
| Repurchase/reverse repurchase agreements | 224,648 | 376,928 | ||||||||||||||||||||||||||||
Traded products | 1,201,645 | (927,142) | 274,503 | 263,677 | 1,012,208 | 243,704 | 237,790 | |||||||||||||||||||||||
| Financial assets designated at fair value – debt instruments | 5,153 | 4,116 | ||||||||||||||||||||||||||||
| Financial Investments available-for-sale – debt instruments | 3,567 | 1,383 | ||||||||||||||||||||||||||||
| Trading portfolio assets – debt instruments | 224,862 | 376,928 | ||||||||||||||||||||||||||||
| Accrued income | 3,238 | 9,200 | ||||||||||||||||||||||||||||
| Other assets | 6,189 | 12,874 | ||||||||||||||||||||||||||||
| Irrevocable commitments to acquire ARS | 16,571 | N/A | ||||||||||||||||||||||||||||
Other products | 259,580 | 404,501 | ||||||||||||||||||||||||||||
Total at the year-end | 1,975,155 | (1,304,902) | 670,253 | 611,577 | 1,934,717 | 672,853 | 615,412 | |||||||||||||||||||||||
1 International Financial Reporting Standards (IFRS). 2 These amounts are considered the best representation of “maximum exposure to credit risk” as defined by the IFRS, without taking into account credit conversion factors for off-balance sheet positions. 3 Includes temporary exposure, before risk transfer, deduction of collateral and risk mitigation. 4 Exposure after risk transfer, deduction of allowances, provisions, credit valuation adjustments, credit default swaps and credit linked notes. | ||||||||||||||||||||||||||||||
136
Table of Contents
Risk and treasury management |
| In the tables in this section the internal management view of credit risk exposure is based on a revised measurement methodology for traded products compared with 2007. The 2007 numbers have been restated accordingly. The methodology was refined to reflect the internal reporting methods used in the business divisions. | |||
| In general, the exposures shown in the tables are gross and do not reflect the benefit of security held or other risk mitigation employed, such as hedging and risk transfers. The main differences between the internal management and IFRS views of gross credit exposure are: | ||||
| – | Cash collateral posted by UBS against negative replacement values of derivative instruments and other positions is reported on a gross basis for IFRS purposes. For internal management purposes these exposures are treated on a net basis after factoring in an assessment of the counterparty risk on the underlying positions. | |||
| – | For internal management purposes netting is applied for positive and negative replacement values with the same counterparty, where the business is conducted under a legally enforceable netting agreement. Under IFRS, netting is applied on a more restrictive basis. Refer to “Note 1 Sum- | |||
| mary of significant accounting policies” in the financial statements of this report for further information on IFRS netting. | |||
| – | Under IFRS, securities lending/borrowing and repurchase/reverse repurchase transactions are shown on the balance sheet as UBS’s full claim on the counterparty without recognizing the counterclaim which the counterparty has for return of cash or securities on the same transactions. By contrast, for internal risk control purposes, the claims on and counterclaims from each counterparty are considered on each transaction on a net basis, and further netted across transactions where such netting is considered to be legally enforceable in insolvency. | |||
| – | All positions that were reclassified in fourth quarter from the “held for trading” to the “loans and receivables” category are included as loans under the IFRS reported exposures. Refer to the “Financial performance” section and “Note 29 Measurement categories of financial assets and liabilities” in the financial statements of this report for more information. However, for the purposes of providing a breakdown of UBS’s lending portfolios, only the loan underwriting positions are included in the internal management view of loan exposures. All reclassified positions are | |||
| Gross credit exposure by UBS internal ratings – UBS Group | |||||||||||||||||||||||||||||||||
| CHF million | Banking products | Traded products | Total exposure | |||||||||||||||||||||||||||||||
| UBS internal rating | 31.12.08 | 31.12.07 | 31.12.08 | 31.12.07 | 31.12.08 | 31.12.07 | ||||||||||||||||||||||||||||
| 0–1 | 27,462 | 21,367 | 55,729 | 60,463 | 83,191 | 81,830 | ||||||||||||||||||||||||||||
| 2–3 | 128,763 | 157,221 | 150,364 | 144,317 | 279,127 | 301,538 | ||||||||||||||||||||||||||||
| 4–5 | 108,963 | 121,940 | 42,055 | 23,394 | 151,018 | 145,334 | ||||||||||||||||||||||||||||
| 6–8 | 89,865 | 81,959 | 14,933 | 12,300 | 104,798 | 94,259 | ||||||||||||||||||||||||||||
| 9–13 | 27,327 | 40,913 | 2,852 | 2,123 | 30,180 | 43,036 | ||||||||||||||||||||||||||||
Total 0–13 (net of past due) | 382,380 | 423,400 | 265,933 | 242,597 | 648,313 | 665,997 | ||||||||||||||||||||||||||||
| Defaulted | 7,622 | 2,468 | 6,909 | 1,013 | 14,531 | 3,481 | ||||||||||||||||||||||||||||
| Past due but not defaulted | 3,526 | 2,268 | 3,526 | 2,268 | ||||||||||||||||||||||||||||||
Other1 | 2,222 | 1,013 | 1,661 | 94 | 3,883 | 1,107 | ||||||||||||||||||||||||||||
Total | 395,750 | 429,149 | 274,503 | 243,704 | 670,253 | 672,853 | ||||||||||||||||||||||||||||
1 Includes Global Asset Management and the Corporate Center. | ||||||||||||||||||||||||||||||||||
| Gross credit exposure by business division | ||||||||||||||||||||||||||||||||||
| Global Wealth Management | ||||||||||||||||||||||||||||||||||
| & Business Banking | Investment Bank | Other1 | UBS | |||||||||||||||||||||||||||||||
| CHF million | 31.12.08 | 31.12.07 | 31.12.08 | 31.12.07 | 31.12.08 | 31.12.07 | 31.12.08 | 31.12.07 | ||||||||||||||||||||||||||
| Balances with central banks | 17,629 | 9,992 | 11,528 | 6,441 | 0 | 1 | 29,157 | 16,434 | ||||||||||||||||||||||||||
| Due from banks | 6,606 | 8,236 | 12,044 | 17,532 | 382 | 535 | 19,032 | 26,303 | ||||||||||||||||||||||||||
| Loans | 226,183 | 240,643 | 37,230 | 39,725 | 730 | 466 | 264,143 | 280,834 | ||||||||||||||||||||||||||
| Financial assets designated at fair value | 0 | 0 | 6,576 | 4,166 | 961 | 0 | 7,537 | 4,166 | ||||||||||||||||||||||||||
| Contingent claims | 14,687 | 15,929 | 4,056 | 4,500 | 149 | 11 | 18,892 | 20,440 | ||||||||||||||||||||||||||
| Undrawn irrevocable credit facilities | 2,789 | 2,081 | 54,201 | 78,890 | 0 | 0 | 56,990 | 80,971 | ||||||||||||||||||||||||||
Banking products | 267,893 | 276,881 | 125,636 | 151,254 | 2,222 | 1,013 | 395,750 | 429,149 | ||||||||||||||||||||||||||
| Derivatives | 8,353 | 14,039 | 218,482 | 170,677 | 817 | 94 | 227,652 | 184,810 | ||||||||||||||||||||||||||
| Securities financing transactions | 12,747 | 13,023 | 33,260 | 45,873 | 844 | 0 | 46,851 | 58,896 | ||||||||||||||||||||||||||
Traded products | 21,100 | 27,061 | 251,742 | 216,550 | 1,661 | 94 | 274,503 | 243,704 | ||||||||||||||||||||||||||
Total credit exposure, gross | 288,993 | 303,942 | 377,378 | 367,804 | 3,883 | 1,107 | 670,253 | 672,853 | ||||||||||||||||||||||||||
Net of impairment losses recognized | 287,774 | 302,974 | 370,494 | 366,882 | 3,883 | 1,107 | 662,151 | 670,963 | ||||||||||||||||||||||||||
1 Includes Global Asset Management and the Corporate Center. | ||||||||||||||||||||||||||||||||||
137
Table of Contents
Risk and treasury management
Risk management and control
 | |||||
| subject to appropriate portfolio limits and risk controls, including earnings-at-risk and capital-at-risk metrics. | |||||
| The redesignated assets comprised: monoline protected assets (USD 5.7 billion); US reference-linked program (USD 1.1 billion); US commercial real estate (USD 3.4 billion); leveraged finance (USD 2.3 billion); student loan auction rate securities (USD 7.9 billion); and other assets (USD 2.3 billion). Exposure amounts provided were the carrying values on 31 December 2008. The exposures relating to monoline-protected assets, leveraged finance and student loan auction rate securities are included in the respective asset class disclosures in the “Risk concentrations” section of this report. | |||||
| Note that under US Generally Accepted Accounting Principles (GAAP), a greater degree of netting is permitted than under IFRS for OTC derivatives replacement values and for securities lending/borrowing and repurchase/reverse repurchase transactions. UBS’s balance sheet figures for these types of transactions are not directly comparable with those of firms which report under US GAAP. | |||||
| As explained in the credit risk measurement section, UBS also measures, and generally applies limits to, credit exposures to individual counterparties and counterparty groups. It also measures risk across counterparties at various portfolio and sub-portfolio levels. In these calculations UBS further considers the potential development of replacement values of traded products over time as market risk factors change, interim payments are made and transactions mature, all of which can significantly alter the risk exposure profile. These potential developments are not reflected in the various tables in this section, which reflect only the current exposures. | |||||
| The credit risk exposure reported in the table “Exposure to credit risk – UBS Group” in this section excludes UBS’s participation in the deposit insurance guarantee scheme under Swiss banking law, according to which Swiss banks and securities dealers are required to jointly guarantee an amount of up to CHF 6 billion for privileged client deposits in the event that another Swiss bank or securities dealer becomes insolvent. For the period 20 December 2008 to 30 June 2009 FINMA has established UBS’s share in the deposit insurance as CHF 1,192 million. | ||||
| Total gross credit exposure amounted to CHF 670.3 billion on 31 December 2008, a decrease of CHF 2.6 billion since the end of the previous year. Banking products decreased by CHF 33 billion mainly driven by reductions in loans and undrawn irrevocable commitments partially compensated by higher balances with central banks, while the traded products category increased by CHF 31 billion due to a significant increase in the derivatives line of CHF 43 billion, partially compensated by a reduction of CHF 12 billion for securities financing transactions. The reduction in loan exposure was mainly due to a reduction in the collateralized lending activity in Global Wealth Management & Business Banking. The Investment Bank continued to actively reduce credit risk. | |||||
| The quality of the gross unimpaired credit portfolio improved as the investment grade component (internal rating grades 0–5) remained at 79%. | |||||
| The table “Gross credit exposure by business division” on the previous page shows the gross credit exposure (i.e. without recognition of credit hedges, collateral or other risk mitigation) by business division. | ||||
| The largest contributor to gross credit exposure at CHF 291 billion is the lending portfolio (due from banks CHF 19 billion, loans CHF 264 billion, and “financial assets designated at fair value” CHF 8 billion) which represents 43% of total gross credit exposure and 73% of total banking products exposure. Within this lending portfolio, CHF 233 billion (80%) is attributable to Global Wealth Management & Business Banking. Traded products exposure is incurred predominantly by the Investment Bank. The sections below provide further details of products, industry and rating distributions in the business division portfolios. | ||||
| The property financing portfolio is diversified and limits per counterparty ensure that no single property exposure presents an undue concentration. | ||||
| Exposure to providers of credit protection, usually in the form of credit derivatives, is controlled by the overall credit limit for the counterparty, which is typically a high-grade financial institution. Composition of credit risk (business divisions) Global Wealth Management & Business Banking The total gross banking products exposure of Global Wealth Management & Business Banking was CHF 268 billion on 31 December 2008 down by CHF 9.0 billion or 3% from a year earlier. The high quality of the banking products exposure, with 64% in the investment grade category is demonstrated by the rating distribution on the next page. The introduction of a revised credit risk framework was aimed at improving statistical credit risk measurement and reinforcing the link between the credit assessment and pricing. This resulted in a decrease in counterparty rating on average by one rating class as shown in the table on the next page by the increase in category 6 sub-investment grade exposures. The distribution of the exposure across UBS’s internal rating and | ||||
Global Wealth Management & Business Banking:
composition of lending portfolio, gross
(excluding repurchased ARS positions)
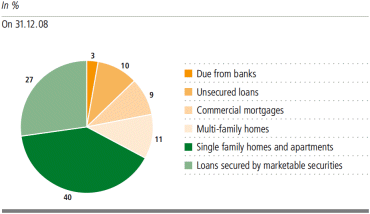
138
Table of Contents
Risk and treasury management |
loss given default (LGD) buckets as displayed in the table on the next page shows that the majority of the exposure is from products attracting the lowest LGDs, demonstrating the continued improvement in the quality of this portfolio (refer to the “UBS internal rating scale and mapping of external ratings” table in the “Rating system design and estimation of credit risk parameters” section for more information).
previous page shows that exposure to real estate is well diversified, with 40% of the gross lending portfolio being secured on single family homes and apartments, which generally have exhibited a low risk profile. The 11% of exposure secured by residential multi-family homes consists of rented apartment buildings. Loans and other credit engagements with individual clients, excluding mortgages, amounted to CHF 91 billion and are predominantly extended against the pledge of marketable securities. The volume of collateralized lending to private individuals decreased by CHF 16 billion or 20% from the previous year. This was mainly due to substantial deleveraging by clients. As of 31 December 2008 more
Global Wealth Management & Business Banking: banking products, gross by UBS internal rating
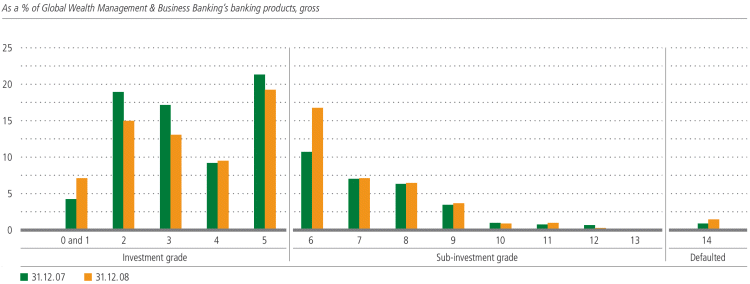
| Global Wealth Management & Business Banking: | ||||||||||||||||||||||||
| distribution of banking products exposure across UBS internal rating and loss given default (LGD) buckets | ||||||||||||||||||||||||
| On 31.12.08 | Weighted | |||||||||||||||||||||||
| CHF million | Loss given default (LGD) buckets | average | ||||||||||||||||||||||
| UBS internal rating | Gross exposure | 0–25% | 26–50% | 51–75% | 76–100% | LGD–(%) | ||||||||||||||||||
| 0 | 13,625 | 88 | 13,537 | 39 | ||||||||||||||||||||
| 1 | 5,232 | 19 | 5,193 | 20 | 39 | |||||||||||||||||||
| 2 | 39,937 | 37,521 | 2,115 | 301 | 20 | |||||||||||||||||||
| 3 | 34,717 | 26,127 | 8,064 | 526 | 22 | |||||||||||||||||||
| 4 | 25,135 | 20,837 | 3,659 | 639 | 14 | |||||||||||||||||||
| 5 | 51,347 | 45,059 | 5,597 | 691 | 13 | |||||||||||||||||||
| 6 | 44,727 | 40,617 | 3,371 | 736 | 3 | 13 | ||||||||||||||||||
| 7 | 18,870 | 16,281 | 2,395 | 193 | 1 | 15 | ||||||||||||||||||
| 8 | 16,892 | 14,224 | 2,090 | 567 | 11 | 17 | ||||||||||||||||||
| 9 | 9,458 | 6,757 | 1,671 | 13 | 1,017 | 23 | ||||||||||||||||||
| 10 | 1,997 | 1,591 | 402 | 3 | 1 | 20 | ||||||||||||||||||
| 11 | 2,252 | 2,045 | 206 | 1 | 19 | |||||||||||||||||||
| 12 | 155 | 119 | 36 | 19 | ||||||||||||||||||||
| 13 | 93 | 34 | 59 | 30 | ||||||||||||||||||||
Total non-defaulted | 264,437 | 211,319 | 48,395 | 3,690 | 1,033 | 18 | ||||||||||||||||||
| Investment grade | 169,993 | 129,651 | 38,165 | 2,177 | ||||||||||||||||||||
| Sub-investment grade | 94,444 | 81,668 | 10,230 | 1,513 | 1,033 | |||||||||||||||||||
Defaulted1 | 3,456 | |||||||||||||||||||||||
Total banking products | 267,893 | 211,319 | 48,395 | 3,690 | 1,033 | |||||||||||||||||||
139
Table of Contents
Risk and treasury management
Risk management and control
Business Banking Switzerland: lending portfolio, gross (excluding mortgages) by industry sector
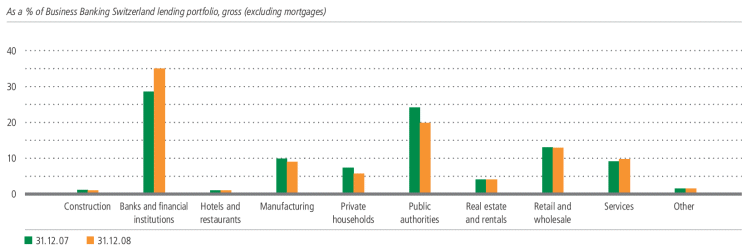
than 80% of loans secured by marketable securities were attributed to business outside Switzerland, of which nearly one-third relates to Wealth Management US.
Investment Bank
Banking products exposure
| Investment Bank: banking products | ||||||||||||||||||||||||||||||||
| On | 31.12.08 | 31.12.07 | ||||||||||||||||||||||||||||||
| Sub- | Impaired | Sub- | Impaired | |||||||||||||||||||||||||||||
| Investment | investment | and defaul- | Investment | investment | and defaul- | |||||||||||||||||||||||||||
| CHF million | grade | grade | ted loans | Total | grade | grade | ted loans | Total | ||||||||||||||||||||||||
| Gross banking products exposure | 96,244 | 25,280 | 4,112 | 125,636 | 103,848 | 46,755 | 651 | 151,254 | ||||||||||||||||||||||||
Risk transfers1 | 1,710 | (1,764 | ) | 54 | 2,901 | (2,864 | ) | (37 | ) | |||||||||||||||||||||||
less: specific allowances for credit losses and loan loss provisions | (1,526) | (1,526) | 0 | 0 | (126) | (126) | ||||||||||||||||||||||||||
| Net banking products exposure | 97,953 | 23,516 | 2,640 | 124,110 | 106,749 | 43,891 | 488 | 151,128 | ||||||||||||||||||||||||
less: credit protection bought (credit default swaps, credit-linked notes)2 | (38,388) | (6,690) | (28) | (45,106) | (43,012) | (7,391) | (29) | (50,432) | ||||||||||||||||||||||||
Net banking products exposure, after application of credit hedges | 59,566 | 16,826 | 2,612 | 79,004 | 63,737 | 36,500 | 459 | 100,696 | ||||||||||||||||||||||||
of which: held for distribution | 3,685 | 2,808 | 11,091 | 20,160 | ||||||||||||||||||||||||||||
140
Table of Contents
Risk and treasury management |
Investment Bank: banking products exposure by UBS internal rating
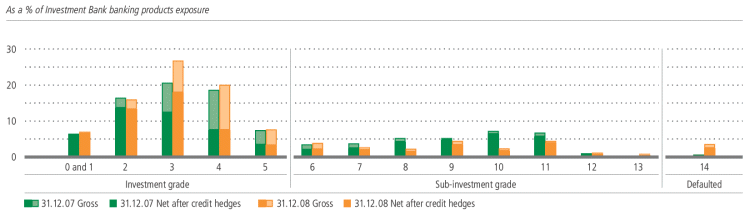
Investment Bank: banking products exposure1 by industry sector
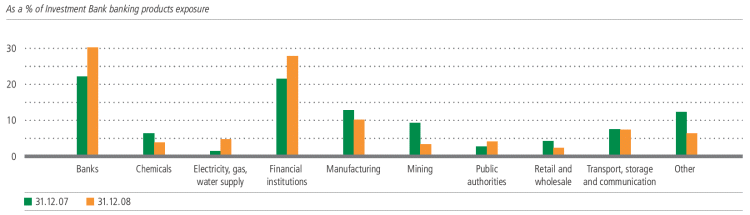
Investment Bank: banking products exposure1 by geographical region
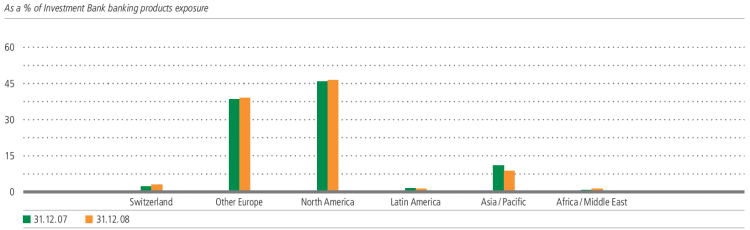
141
Table of Contents
Risk and treasury management
Risk management and control
| Investment Bank: distribution of net banking products exposure | ||||||||||||||||||||||||
| across UBS internal rating and loss given default buckets | ||||||||||||||||||||||||
| On 31.12.08 | Weighted | |||||||||||||||||||||||
| CHF million | Loss given default (LGD) buckets | average | ||||||||||||||||||||||
| UBS internal rating | Exposure | 0-25% | 26-50% | 51-75% | 76-100% | LGD (%) | ||||||||||||||||||
| 0 and 1 | 8,291 | 8,291 | 49 | |||||||||||||||||||||
| 2 | 16,292 | 3,201 | 10,675 | 776 | 1,641 | 45 | ||||||||||||||||||
| 3 | 22,223 | 11,083 | 9,360 | 630 | 1,150 | 30 | ||||||||||||||||||
| 4 | 9,068 | 1,213 | 6,604 | 943 | 307 | 35 | ||||||||||||||||||
| 5 | 3,692 | 341 | 2,306 | 821 | 224 | 48 | ||||||||||||||||||
| 6 | 2,254 | 1,017 | 732 | 427 | 78 | 32 | ||||||||||||||||||
| 7 | 2,321 | 334 | 1,499 | 388 | 100 | 37 | ||||||||||||||||||
| 8 | 1,419 | 133 | 948 | 285 | 53 | 34 | ||||||||||||||||||
| 9 | 3,811 | 1,930 | 1,473 | 223 | 184 | 19 | ||||||||||||||||||
| 10 | 1,682 | 598 | 707 | 293 | 85 | 34 | ||||||||||||||||||
| 11 | 4,430 | 1,303 | 2,705 | 205 | 217 | 21 | ||||||||||||||||||
| 12 | 687 | 473 | 128 | 82 | 3 | 23 | ||||||||||||||||||
| 13 | 221 | 122 | 99 | 21 | ||||||||||||||||||||
Total non-defaulted | 76,391 | 21,749 | 45,528 | 5,073 | 4,042 | 39 | ||||||||||||||||||
| Investment grade | 59,566 | 15,839 | 37,237 | 3,169 | 3,321 | 39 | ||||||||||||||||||
| Sub-investment grade | 16,826 | 5,910 | 8,291 | 1,903 | 721 | 26 | ||||||||||||||||||
| Defaulted | 2,612 | 531 | 1,520 | 467 | 95 | 37 | ||||||||||||||||||
Net banking products exposure | 79,004 | 22,280 | 47,048 | 5,539 | 4,137 | 36 | ||||||||||||||||||
As reported in second quarter 2008, UBS sold a portfolio of US RMBSs for proceeds of USD 15 billion to the RMBS Opportunities Master Fund, LP (the “RMBS fund”), a special purpose entity managed by BlackRock, Inc. The RMBS fund was capitalized with approximately USD 3.75 billion in equity raised by BlackRock from third-party investors and an eight-year
amortizing USD 11.25 billion senior secured loan provided by UBS. Since its inception, the RMBS fund has amortized the loan through monthly payments in line with UBS’s original expectations. On 31 December 2008, the loan had a balance outstanding of USD 9.2 billion. UBS does not consolidate the RMBS fund into its balance sheet as the equity investors in the
RMBS fund continue to bear and receive the majority of the risks and rewards. UBS continues to monitor the development of the RMBS fund’s performance and would reassess the consolidation status if deterioration of the underlying mortgage pools related to the RMBSs were to indicate that UBS may not fully recover the loan granted to the RMBS fund.
142
Table of Contents
Risk and treasury management |
Settlement risk
Settlement risk arises in transactions involving exchange of value when UBS must honor its obligation to deliver without first being able to determine that the counter-value has been received. UBS continues to reduce its actual settlement volume by the same proportions as in previous years through the use of multilateral and bilateral agreements.
Country risk
UBS assigns ratings to all countries to which it has exposure. Sovereign ratings express the probability of occurrence of a country risk event that would lead to impairment of UBS’s claims. The default probabilities and the mapping of external ratings of the major rating agencies are the same as for counterparty rating classes (as described under “Probability of default”). In the case of country ratings, rating classes 10
Emerging markets exposure by
UBS internal rating category
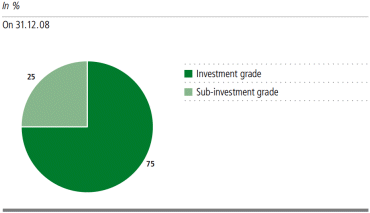
to 13 are designated “very high risk” while the lowest rating class 14 contains countries in outright default.
| Emerging markets exposure by major geographical area and product type | ||||||||||||||||||||||||||||||||||||||||
| CHF million | Total | Banking products | Traded products | Financial investments | Tradable assets | |||||||||||||||||||||||||||||||||||
| On | 31.12.08 | 31.12.07 | 31.12.08 | 31.12.07 | 31.12.08 | 31.12.07 | 31.12.08 | 31.12.07 | 31.12.08 | 31.12.07 | ||||||||||||||||||||||||||||||
| Emerging Europe | 3,706 | 5,439 | 1,454 | 1,590 | 1,177 | 1,071 | 211 | 151 | 864 | 2,627 | ||||||||||||||||||||||||||||||
| Emerging Asia | 16,460 | 22,039 | 3,594 | 5,653 | 7,059 | 6,210 | 879 | 2,123 | 4,928 | 8,053 | ||||||||||||||||||||||||||||||
| Emerging America | 6,802 | 8,778 | 1,491 | 1,486 | 2,157 | 2,288 | 167 | 150 | 2,987 | 4,854 | ||||||||||||||||||||||||||||||
| Middle East/Africa | 5,747 | 5,007 | 1,338 | 2,414 | 3,980 | 1,603 | 0 | 0 | 429 | 990 | ||||||||||||||||||||||||||||||
Total | 32,715 | 41,263 | 7,877 | 11,143 | 14,373 | 11,172 | 1,257 | 2,424 | 9,208 | 16,524 | ||||||||||||||||||||||||||||||
Temporary exposures1 | 738 | 3,049 | ||||||||||||||||||||||||||||||||||||||
143
Table of Contents
Risk and treasury management
Risk management and control
| The potential financial impact of severe emerging markets crises is assessed by stress testing. This entails identifying countries that might be subject to a potential crisis event and determining potential loss and making conservative assumptions about potential recovery rates depending on the types of transaction involved and their economic importance to the affected countries. | ||||
| Country risk exposure | ||||
| Exposure to emerging market countries amounted to CHF 32.7 billion on 31 December 2008, compared with CHF 41.3 billion on 31 December 2007. Of this amount, CHF 24.6 billion or 75% was to investment grade countries based on UBS’s internal ratings-based approach. The reduction of CHF 8.5 billion in total emerging markets exposure arose to a large extent in Asia. | ||||
| The pie chart on the previous page shows UBS’s emerging market country exposures (excluding those which are temporary exposures) on 31 December 2008, based on the main country rating categories. The table on the previous page analyzes emerging market country exposures by major geographical area and product type on 31 December 2008 compared with 31 December 2007. Temporary exposures arising from loan underwriting in these markets are shown separately in the table. | ||||
| Impairment and default – distressed claims | ||||
| UBS has a number of classifications for distressed claims. A loan carried at amortized cost is considered to be “past due” when a significant payment has been missed. Any claim, regardless of accounting treatment, is classified as “impaired” if UBS considers it probable that a loss will result on that claim due to the obligor’s inability to meet its obligations according to the contractual terms, and after realization of any available collateral. “Obligations” in this context include interest payments, principal repayments or other payments due, for example under an OTC derivative contract or a guarantee. | |||
| The recognition of impairment in the financial statements depends on the accounting treatment of the claim. For products carried at amortized cost, impairment is recognized through the creation of an allowance or provision, which is charged to the income statement as credit loss expense. For products recorded at fair value such as derivatives, impairment is recognized through a credit valuation adjustment, which is charged to the income statement through the “Net trading income” line. | ||||
| UBS has policies and processes to ensure that the carrying values of impaired claims are determined in compliance with IFRS on a consistent and fair basis, especially for those impaired claims for which no market estimate or benchmark for the likely recovery value is available. The credit controls applied to valuation and workout are the same for both amortized cost and fair-valued credit products. Each case is assessed | ||||
| on its merits, and the workout strategy and estimation of cash flows considered recoverable are independently approved. | |||
| Credit officers monitor derivative counterparties for default or impairment using generally the same principles and processes as used for loans. In the event that a derivatives counterparty defaults on its obligations a specific credit valuation adjustment (CVA) is established by the credit officer. | ||||
| Portfolios of claims carried at amortized cost with similar credit risk characteristics are also assessed for collective impairment. A portfolio is considered impaired on a collective basis if there is objective evidence to suggest that it contains impaired obligations but the individual impaired items cannot yet be identified. Portfolios considered impaired on a collective basis are not included in the totals of impaired loans in the tables shown in the discussion of the composition of credit risk for business divisions in the “Credit risk” section of this report. | ||||
| The assessment of collective impairment differs depending on the nature of the underlying obligations. In UBS’s retail businesses, where delayed payments are routinely seen, UBS typically reviews individual positions for impairment only after they have been in arrears for a certain time. To cover the time lag between the occurrence of an impairment event and its identification, collective loan loss allowances are established, based on the expected loss measured for the portfolio over the average period between trigger events and their identification for individual impairments. Collective loan loss allowances of this kind are not required for corporate and investment banking businesses because individual counterparties and exposures are continuously monitored and impairment events are identified at an early stage. | ||||
| Additionally, for all portfolios, UBS assesses each quarter – or on an ad hoc basis if necessary – whether there have been any previously unforeseen developments which might result in impairments that cannot be immediately identified individually. Such events could be stress situations such as a natural disaster or a country crisis, or they could result from structural changes in, for example, the legal or regulatory environment. To determine whether an event-driven collective impairment exists, a set of global economic drivers is regularly assessed for the most vulnerable countries and, on a case-by-case basis, the impact of specific potential impairment events since the last assessment is reviewed. Again, the expected loss parameters of the affected sub-portfolios are the starting point for determining the collective impairment, adjusted as necessary to reflect the severity of the event in question. | ||||
| Past due but not impaired loans | ||||
| Past due but not impaired loans have suffered missed payments but are not considered impaired because UBS expects ultimately to collect all amounts due under the contractual terms of the loans or with equivalent value. | ||||
| Compared with 31 December 2007, the past due exposure increased CHF 1.3 billion at 31 December 2008. | ||||
144
Table of Contents
Risk and treasury management |
| Past due but not impaired loans | |||||||||
| On | ||||||||||
| CHF million | 31.12.08 | 31.12.07 | ||||||||
| 1–10 days | 1,226 | 515 | ||||||||
| 11–30 days | 475 | 1,381 | ||||||||
| 31–60 days | 320 | 74 | ||||||||
| 61–90 days | 795 | 36 | ||||||||
| > 90 days | 772 | 262 | ||||||||
Total | 3,588 | 2,268 | ||||||||
| Impaired loans, allowances and provisions The table below shows that allowances and provisions for credit losses increased 184%, to CHF 2,927 million on 31 December 2008 from CHF 1,031 million on 31 December 2007. Refer to “Note 9b Due from banks and loans” in the financial statements of this report for more information on the changes in allowances and provisions for credit losses during the year. | ||||
| The gross impaired lending portfolio increased significantly to CHF 9,145 million on 31 December 2008 from CHF 2,392 million on 31 December 2007. This was largely driven by the reclassification of certain financial instruments, some of which carried impairments, in addition to various real estate-related positions that were also considered impaired during the year. Refer to “Note 29 measurement | ||||
| categories of financial assets and liabilities” in the financial statements and the “Financial performance” sections of this report for more information. | ||||
| The ratio of the impaired lending portfolio to the total lending portfolio (both measured gross) deteriorated to 2.2% on 31 December 2008 from 0.6% on 31 December 2007. | ||||
| Loans or receivables with a carrying amount of CHF 224 million and CHF 126 million were reclassified from impaired to performing during 2008 and 2007 respectively. This reclassification was made either because the loans had been renegotiated and the new terms and conditions met normal market criteria for the quality of the obligor and type of loan, or because there had been an improvement in the financial position of the obligor, enabling it to repay any past due amounts | |||
| Allowances and provisions for credit losses1 | ||||||||||||||||||||||||||||||||
| Global Wealth Management & | ||||||||||||||||||||||||||||||||
| CHF million | Business Banking | Investment Bank | Other2 | UBS | ||||||||||||||||||||||||||||
| On | 31.12.08 | 31.12.07 | 31.12.08 | 31.12.07 | 31.12.08 | 31.12.07 | 31.12.08 | 31.12.07 | ||||||||||||||||||||||||
| Due from banks | 6,606 | 8,237 | 57,485 | 52,164 | 382 | 534 | 64,473 | 60,935 | ||||||||||||||||||||||||
| Loans | 230,684 | 240,641 | 111,798 | 95,760 | 730 | 466 | 343,213 | 336,867 | ||||||||||||||||||||||||
Total lending portfolio, gross3 | 237,290 | 248,878 | 169,282 | 147,924 | 1,113 | 1,000 | 407,685 | 397,802 | ||||||||||||||||||||||||
| Allowances for credit losses | (1,195 | ) | (908 | ) | (1,733 | ) | (123 | ) | 0 | 0 | (2,927 | ) | (1,031 | ) | ||||||||||||||||||
Total lending portfolio, net | 236,095 | 247,970 | 167,550 | 147,801 | 1,113 | 1,000 | 404,758 | 396,771 | ||||||||||||||||||||||||
| Impaired lending portfolio, gross | 2,998 | 1,820 | 6,147 | 572 | 0 | 0 | 9,145 | 2,392 | ||||||||||||||||||||||||
| Estimated liquidation proceeds of collateral for impaired loans | (1,594 | ) | (740 | ) | (2,336 | ) | (364 | ) | 0 | 0 | (3,930 | ) | (1,104 | ) | ||||||||||||||||||
Impaired lending portfolio, net of collateral | 1,404 | 1,080 | 3,811 | 208 | 0 | 0 | 5,215 | 1,288 | ||||||||||||||||||||||||
| Allocated allowances for impaired lending portfolio | 1,171 | 874 | 1,733 | 123 | 0 | 0 | 2,904 | 997 | ||||||||||||||||||||||||
| Other allowances and provisions | 24 | 34 | 0 | 0 | 0 | 0 | 24 | 34 | ||||||||||||||||||||||||
Total allowances and provisions for credit losses in lending portfolio | 1,195 | 908 | 1,733 | 123 | 0 | 0 | 2,927 | 1,031 | ||||||||||||||||||||||||
Allowances and provisions for credit losses outside of lending portfolio | 24 | 60 | 119 | 73 | 0 | 0 | 143 | 133 | ||||||||||||||||||||||||
Ratios | ||||||||||||||||||||||||||||||||
| Allowances and provisions as a % of total lending portfolio, gross | 0.5 | 0.4 | 1.0 | 0.1 | 0.0 | 0.0 | 0.7 | 0.3 | ||||||||||||||||||||||||
| Impaired lending portfolio as a % of total lending portfolio, gross | 1.3 | 0.7 | 3.6 | 0.4 | 0.0 | 0.0 | 2.2 | 0.6 | ||||||||||||||||||||||||
| Allocated allowances as a % of impaired lending portfolio, gross | 39.1 | 48.0 | 28.2 | 21.5 | 0.0 | 0.0 | 31.8 | 41.7 | ||||||||||||||||||||||||
| Allocated allowances as a % of impaired lending portfolio, net of collateral | 83.4 | 80.9 | 45.5 | 59.1 | 0.0 | 0.0 | 55.7 | 77.4 | ||||||||||||||||||||||||
1 Figures reflect IFRS reported values. 2 Includes Global Asset Management and the Corporate Center. 3 Excludes loans designated at fair value. | ||||||||||||||||||||||||||||||||
145
Table of Contents
Risk and treasury management
Risk management and control
| Impaired assets by type of financial instrument | |||||||||||||||||
| Specific | ||||||||||||||||||
| Estimated | allowances, | |||||||||||||||||
| liquidation | provisions and | |||||||||||||||||
| proceeds of | credit valuation | Net impaired | ||||||||||||||||
| CHF million | Impaired exposure | collateral | adjustments | exposure | ||||||||||||||
| Impaired loans | 9,145 | (3,930 | ) | (2,916 | ) | 2,299 | ||||||||||||
| Impaired contingent claims | 41 | (20 | ) | 21 | ||||||||||||||
| Defaulted derivatives contracts | 6,163 | (4,205 | ) | 1,958 | ||||||||||||||
| Defaulted securities financing transactions | 309 | (111 | ) | 198 | ||||||||||||||
Total 31.12.08 | 15,658 | (3,930 | ) | (7,252 | ) | 4,476 | ||||||||||||
| Total 31.12.07 | 3,408 | (1,104 | ) | (1,914 | ) | 390 | ||||||||||||
| such that future principal and interest are deemed to be fully collectible in accordance with the original contractual terms. | |||
| Collateral held against the impaired loans portfolio consists in most cases of real estate. It is UBS policy to dispose of foreclosed real estate as soon as practicable. The carrying amount of foreclosed property recorded in the balance sheet under “Other assets” at the end of 2008 and 2007 amounted to CHF 280 million and CHF 122 million respectively. | ||||
| UBS seeks to liquidate collateral in the form of financial assets in the most expeditious manner, at prices considered fair. This may require that it purchases assets for its own account, where permitted by law, pending orderly liquidation. | ||||
| The table “Impaired assets by type of financial instrument” above includes not only impaired loans, but also impaired off-balance sheet claims and defaulted derivatives and repurchase / reverse repurchase contracts, which are subject to the same workout and recovery processes. | ||||
| The impaired assets of CHF 15.7 billion increased significantly as a consequence of the market turbulence in 2008. | ||||
| After deducting allocated specific allowances, provisions and credit valuation adjustments of CHF 7.2 billion and the estimated liquidation proceeds of collateral of CHF 3.9 billion, net impaired assets amounted to CHF 4.5 billion in 2008. | ||||
Credit loss expense UBS’s financial statements are prepared in accordance with IFRS. Under IFRS the credit loss expense charged to the income statement in any period is the sum of net allowances and direct write-offs minus recoveries arising in that period, i.e. the credit losses actually experienced. | ||||
| In 2008, UBS experienced a net credit loss expense of CHF 2,996 million, of which CHF 1,329 million was due to impairment charges taken on reclassified financial instruments in the Investment Bank. This was mainly due to an impairment charge taken against a client in the petrochemical industry, excluding any benefit from hedges. In comparison, UBS recorded a net credit loss expense of CHF 238 million in 2007. | ||||
| The Investment Bank recorded a net credit loss expense of CHF 2,575 million for 2008, compared with a net credit loss expense of CHF 266 million in 2007. Excluding the credit loss expense from reclassified financial instruments of CHF 1,329 | ||||
| million, the credit loss expense amounted to CHF 1,246 million, mainly driven by new allowances on securities financing transactions, real estate loan positions and asset backed securities as a consequence of the deteriorations in the financial markets. | ||||
| Global Wealth Management & Business Banking reported a net credit loss expense of CHF 370 million for 2008, compared with a CHF 28 million net credit loss recovery for 2007. This significant increase in credit loss expenses was mainly due to collateral shortfalls against lombard lending resulting from the turmoil in the financial markets in the fourth quarter of 2008 with sharp moves in securities prices and an unprecedented decrease in the liquidity of certain asset categories. | ||||
Rating system design and estimation of credit risk parameters Probability of default UBS assesses the likelihood of default of individual counter-parties using rating tools tailored to the various counterparty segments. Probability of default is summarized in the UBS internal rating scale and mapping of external ratings (Masterscale), shown on the next page, which segments clients into 15 rating classes (0 to 14), one of which is reserved for default. The UBS Masterscale reflects not only an ordinal ranking of counterparties, but also the range of default probabilities defined for each rating class. Also, in order to ensure consistency in determining default probabilities, all rating tools must be calibrated to the common Masterscale. This approach means that clients migrate between rating classes as UBS’s assessment of their probability of default changes. The performance of rating tools, including their predictive power with regard to default events, is regularly validated and model parameters are adjusted as necessary. | ||||
| External ratings, where available, are used to benchmark UBS’s internal default risk assessment. The ratings of the major rating agencies shown in the table are linked to the internal rating classes based on the long-term average one-year default rates for each external grade. Observed defaults per agency rating category vary from year to year, especially over an economic cycle, and therefore UBS does not expect the actual number of defaults in its equivalent rating band in any | ||||
146
Table of Contents
Risk and treasury management |
| UBS internal rating scale and mapping of external ratings | |||||||
| UBS | Moody's Investor | Standard & Poor's | ||||||
| Rating | Description | Services equivalent | equivalent | |||||
0 and 1 | Investment grade | Aaa | AAA | |||||
2 | Aa1 to Aa3 | AA+ to AA– | ||||||
3 | A1 to A3 | A+ to A– | ||||||
4 | Baa1 to Baa2 | BBB+ to BBB | ||||||
5 | Baa3 | BBB– | ||||||
6 | Sub-investment grade | Ba1 | BB+ | |||||
7 | Ba2 | BB | ||||||
8 | Ba2 | BB | ||||||
9 | Ba3 | BB– | ||||||
10 | B1 | B+ | ||||||
11 | B2 | B | ||||||
12 | B3 | B– | ||||||
13 | Caa to C | CCC to C | ||||||
14 | Defaulted | D | D | |||||
| given period to equal the rating agency average. UBS monitors the long-term average default rates associated with external rating classes. If these long-term averages were observed to have changed in a material and permanent way, their mapping to the Masterscale would be adjusted. | ||||
| At the Investment Bank, rating tools are differentiated by broad segments. Current segments include banks, sovereigns, corporates, funds, hedge funds, commercial real estate and several more specialized businesses. The design of these tools follows a common approach. The selection and combination of relevant criteria (financial ratios and qualitative factors) are determined through a structured analysis by credit officers with expert knowledge of each segment, supported by statistical modeling techniques where sufficient data are available. | ||||
| The Swiss banking portfolio includes exposures to both large and small- to medium-sized enterprises, and the rating tools vary accordingly. For segments where sufficient default data are available, rating tool development is primarily based on statistical models. Typically, these “score cards” consist of eight to 12 criteria combining financial ratios with qualitative and behavioral factors which have proven good indicators of default in the past, are accepted by credit officers and are easy to apply. For smaller risk segments with few observed defaults the approach relies more on judgment and expertise, similar to that applied at the Investment Bank. For the Swiss commercial real estate segment and for lombard lending, which is part of the retail segment, the probability of default is derived from simulation of potential changes in the value of the collateral and the probability that it will fall below the loan amount. | ||||
| Default expectations for the Swiss residential mortgage segment are based on the internal default and loss history, where the major differentiating factor is the loan-to-value ratio (i.e. the amount of the outstanding obligation expressed as a percentage of the value of the collateral). | ||||
| Exposure at default Exposure at default represents the amounts UBS expects to be owed at the time of default. | ||||
| For outstanding loans, the exposure at default is the drawn amount or face value. For loan commitments and for contingent liabilities, it includes any amount already drawn plus any additional amount which is expected to be drawn at the time of default, should it occur. This calculation is based on a “credit conversion factor” – a fixed percentage per product type derived from historical experience of drawings under commitments by counterparties within the year prior to their default. | ||||
| For traded products, the estimation of exposure at default is more complex, since the current value of a contract or portfolio of contracts can change significantly over time and may, at the time of a future default, be considerably higher or lower than the current value. For repurchase and reverse repurchase agreements and for securities borrowing and lending transactions, the net amount which could be owed to or by UBS is assessed, taking into account the impact of market moves over the time it would take to close out all transactions (“closeout exposure”). For exchange-traded derivatives (ETDs), the exposure at default is derived from the difference between the initial margin and the current variation margin. Exposure at default on OTC derivative transactions is determined by modeling the potential evolution of the replacement value of the portfolio of trades with each counterparty over the lifetime of all transactions (“potential credit exposure”), taking into account legally enforceable closeout netting agreements where applicable. | ||||
| For traded products, excluding ETDs, the exposure at default is derived from a Monte Carlo simulation (a statistical technique involving a large number of simulations) of potential market moves in all relevant risk factors, such as interest rates and exchange rates, based on estimated correlations between the risk factors. This ensures a scenario-consistent estimation of market value across all traded products at counterparty and portfolio level. The randomly simulated sets of risk factors are then used as inputs to product-specific valuation models to generate valuation paths, taking into account the impact of maturing contracts and changing collateral values. | ||||
| The resultant distribution of future valuation paths supports various exposure measures. All portfolio risk measures are based on the expected exposure profile. By contrast, in controlling individual counterparty exposures UBS limits the potential “worst case” exposure over the full tenor of all transactions, and therefore applies the limits to the “maximum likely exposure” generated by the same simulations, measured to a specified high confidence level. | ||||
| Cases where there is material correlation between the factors driving a counterparty’s credit quality and the factors driving the future path of traded products exposure (“wrong- | ||||
147
Table of Contents
Risk and treasury management
Treasury management
| way risk”) require special treatment. In such cases, the potential credit exposure generated by the standard model is overridden by a calculation from a customized exposure model that explicitly takes this correlation into account. For portfolios where this risk is inherently present, for instance for the hedge funds portfolio, UBS has established special controls to capture these wrong-way risks. | ||||
| The performance of exposure models is monitored by backtesting and benchmarking whereby model outcomes are compared against actual outcomes, based on UBS’s internal as well as external historical experience. | ||||
Loss given default Loss given default or loss severity represents UBS’s expectation of the extent of loss on a claim should default occur. It is expressed as a percentage loss per unit of exposure and typically varies by type of counterparty, type and seniority of claim and the availability of collateral or other credit mitigation. Loss given default estimates cover loss of principal, interest and other amounts due (including workout costs), and also consider the costs of carrying the impaired position during the workout process. | ||||
| At the Investment Bank loss given default estimates are based on expert assessment of the risk drivers (country, industry, legal structure, collateral and seniority), supported by empirical evidence from internal loss data and external benchmark information where available. In the Swiss portfolio, loss given default differs by counterparty and collateral type and is statistically estimated using internal loss data. For the residen- | ||||
| tial mortgage portfolio, a further differentiation is derived by statistical simulation based on loan-to-value ratios. | ||||
| Debt investments Debt investments classified for IFRS as “financial investments available-for-sale” can be broadly categorized as money market instruments and debt securities, which are mainly held for statutory, regulatory or liquidity reasons. Debt investments also include non-performing loans, which were purchased in the secondary market by the Investment Bank. | |||
| The risk control framework applied to debt instruments classified as “Financial investments available-for-sale” varies depending on the nature of the instruments and the purpose for which they are held. | ||||
| Where applicable, debt investments are reflected in reports to senior management of consolidated credit exposures and in “large exposure” reports to FINMA. | ||||
Composition of debt investments On 31 December 2008, debt financial investments classified as “Financial investments available-for-sale” consisted of money market paper of CHF 2,165 million and other debt investments of CHF 1,402 million. The increase in money market instruments is due to UK Treasury Gilts held in UBS Ltd. | ||||
| At 31 December 2007, the equivalent positions were CHF 349 million money market instruments and CHF 1,034 million other debt investments. | ||||
148
Table of Contents
Risk and treasury management |
Operational risk
Operational risk is the risk of loss resulting from inadequate or failed internal processes, people and systems (for example failed IT systems, or fraud perpetrated by a UBS employee), or from external causes, whether deliberate, accidental or natural. It is inherent in all of UBS’s activities. Operational risks are monitored and, to the extent possible, controlled and mitigated. UBS’s approach to operational risk is not designed to eliminate risk altogether but, rather, to contain risks within levels deemed acceptable by senior management. The Group Chief Risk Officer (Group CRO), supported by the Group Head of Operational Risk, is responsible for the effective design of the operational risk framework.
Operational risk framework
All UBS functions, whether business, control or logistics functions, must manage the operational risks that arise from their activities. Operational risks are pervasive, as a failure in one area may have a potential impact on several other areas. Each business division has therefore established a cross-functional body to actively manage operational risk as part of its governance structure.
Operational risk measurement
UBS has developed a model for the quantification of operational risk which meets the regulatory capital standard specified by the Basel II Advanced Measurement Approach (AMA). The model has two main components:
| – | The historical component is based on UBS’s own internal losses and is used primarily to determine the expected loss portion of the capital requirement. UBS has been collecting operational risk event data (both profits and losses) since 2002. | |
| – | The scenario component is used primarily to determine the unexpected loss portion of the capital requirement. It is based on a set of generic scenarios that represent categories of operational risks which UBS is exposed to. The scenarios themselves are generated from an analysis of internal and external event information, the current business environment and UBS’s own internal control environment. The scenarios are reviewed at least annually by experts to ensure their validity and may be updated based on material new information or events. During 2008, scenarios were adjusted for a number of industry-wide events including unauthorized trading losses and disputes over client practices. |
149
Table of Contents
Risk and treasury management
Treasury management
Treasury management
UBS: funding by currency
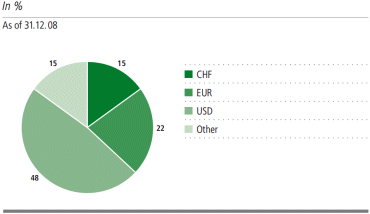
UBS: BIS capital ratios1
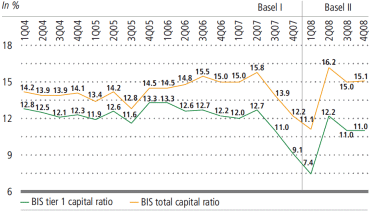
UBS: funding by product type
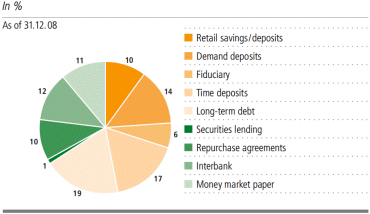
150
Table of Contents
Risk and treasury management |
Liquidity and funding management
| UBS defines liquidity risk as the risk of being unable to raise funds to meet payment obligations when they fall due. Funding risk is the risk of being unable, on an ongoing basis, to borrow funds in the market at an acceptable price to fund actual or proposed commitments and thereby support UBS’s current business and desired strategy. Liquidity and funding are not the same, but they are closely related. Both are finite resources that are critical for a financial institution. | |||
| Liquidity must be continuously managed to ensure that the firm can survive a crisis, whether it is a general market event, a localized difficulty affecting a smaller number of institutions, or a problem unique to an individual firm. An institution that is unable to meet its liabilities when they fall due may collapse, even though it is not insolvent, because it is unable to borrow sufficient funds on an unsecured basis, or does not have sufficient good quality assets to borrow against or liquid assets to sell to raise immediate cash. Market liquidity overview: 2008 The financial and credit market crisis, which had its origins in the US residential mortgage market in the second half of 2007, spread and gained in intensity throughout 2008, as a broader economic crisis developed and pointed towards a severe global downturn. A precipitous fall in trading volumes in some previously highly liquid markets accompanied a sharp reduction in asset market values. After the failure of one of the major US investment banks in mid-September, the tenor of the interbank lending market was dramatically reduced. Although other short-term funding remained available at this time, it was largely limited to tenors within one month, while in secured funding markets certain assets were subjected to significantly higher haircuts and in some cases were no longer accepted as collateral. Access to other longer-term wholesale funds was also severely constrained, as the level of credit spreads surged, and companies’ financing costs reached new heights. | ||||
| In an attempt to contain the sustained and growing crisis, which resulted in significant bank failures or forced restructurings of several major financial institutions throughout the year, central banks and governments were induced to intervene on a large scale to support both specific institutions and the global financial system as a whole. These public sector initiatives included a series of restructurings, recapitalizations – both direct and indirect – and the introduction, then subsequent expansion, of broad-based credit and liquidity support facilities. New policies were implemented in many major economies to permit direct government investment in banks, loan and bank debt guarantees, as well as the provision of | ||||
| large volumes of additional liquidity to their financial systems via extraordinary financing facilities. Certain major banks became majority-owned by their governments. Several countries announced that they would insure all domestic bank deposits and others substantially increased the insurance protection for their deposits and bank debts, pressuring the deposits and debts of banks covered by weaker protection schemes. In the fourth quarter, the Swiss government announced a number of steps to support its banking system, including a strengthening of the country’s bank deposit insurance scheme and a willingness to guarantee interbank liabilities if and when deemed necessary. Throughout most of the fourth quarter, public bond market issuance was largely limited to banks whose debt was government-guaranteed. UBS’s response to the ongoing crisis Despite the very challenging conditions, UBS maintained its access to funding at all times, primarily as a result of its broadly diversified funding base. In addition, in anticipation of an extended period of market turbulence, UBS proactively undertook several measures starting in 2007 and continuing in 2008 to further strengthen and safeguard its liquidity position. Short-term funding targets were adjusted, and increased focus was placed on asset reduction. Combined with the broad diversity of its funding sources, its contingency planning processes and its global scope, these additional measures have enabled UBS to maintain a balanced asset / liability profile. UBS also maintains a substantial multi-currency portfolio of unencumbered high-quality short-term assets and has available and unutilized collateralized liquidity facilities at several major central banks. | ||||
| Like many other major financial institutions, UBS saw decreased access to wholesale term funding and a decline in client deposits during 2008. This was counterbalanced by ongoing asset reductions – mostly in the Investment Bank – which reduced UBS’s overall funding needs. As part of these asset reductions, the trading portfolio was pared back by CHF 462 billion compared with year-end 2007. | ||||
| The transaction with the SNB, which was announced in fourth quarter 2008, further bolsters the firm’s liquidity and funding position by reducing overall funding requirements. Liquidity and funding risk management framework A new liquidity and funding risk management framework was approved by the Board of Directors (BoD) of UBS in 2008. This new framework outlines the principles, roles and responsibilities, models, methodologies and tools UBS uses | ||||
151
Table of Contents
Risk and treasury management
Treasury management
| to manage liquidity and funding risk. The framework describes a target state; many of these measures have already been, or are in the process of being implemented. The benefits of the new framework are the following: | ||||
| – | First, sustainable profits will be achieved through allocation of the real costs of funding to the business that generates the funding requirement. There will be no more cross-subsidization of one business division by another, allowing an unbiased and more accurate view of the firm’s profitability. | |||
| – | Second, liquidity and funding risk are being reduced as UBS limits the size of its balance sheet, funds illiquid assets long-term and reduces reliance on short-term unsecured funding. | |||
| – | Finally, UBS is establishing best practice liquidity and funding risk management processes. The new framework is designed to keep the firm in line with industry best practice, and prepare it for further changes in regulatory requirements and oversight. | |||
| The approach taken by UBS will proceed in parallel: tactically addressing a number of key initiatives in the short term, while developing the framework into a target liquidity and funding model to be strategically integrated into each business division, region and entity within the Group. | ||||
| Liquidity approach | ||||
| UBS’s approach to liquidity management, which covers all branches and subsidiaries, aims to ensure that it will always have sufficient liquidity to meet liabilities when due, under both normal and stressed conditions, without incurring unacceptable losses or risking sustained damage to its various business franchises. | |||
| Central to the integrated framework is an assessment of all material, known and expected cash flows and the level of high-grade collateral that could be used to raise additional funding. It entails both careful monitoring and control of the daily liquidity position, and regular liquidity stress testing. Limits are set at Group level by the BoD risk committee, while the Executive Committee of the Group Executive Board (GEB) is responsible for the allocation of resources to the business divisions and sets limits for each of the business divisions. These limits are monitored by Group Treasury, who reports the results and trends on a regular basis to the BoD risk committee and the Executive Committee of the GEB. Contingency plans for a liquidity crisis are incorporated into UBS’s wider crisis management process. | ||||
| The liquidity position and asset and liability profile are continuously tracked. This involves monitoring the balance sheet contractual and behavioral maturity profiles and projecting and modeling the liquidity exposures of the firm under a variety of potential scenarios – encompassing both normal and stressed market conditions. UBS considers the possibility that its access to markets could be impacted by a stress event | ||||
| affecting some part of its business or, in the extreme case, if it was to suffer a severe rating downgrade combined with a period of general market uncertainty. The results are factored into the overall contingency plans of UBS. | |||
| UBS’s major sources of liquidity are channeled through entities that are fully consolidated. | ||||
| Liquidity management | ||||
| UBS manages its liquidity position in order to be able to ride out a crisis without damaging the ongoing viability of its business. This is complemented by the firm’s funding risk management which aims to achieve the optimal liability structure to finance its businesses cost-efficiently and reliably. The long-term stability and security of UBS’s funding in turn helps protect its liquidity position in the event of a UBS-specific crisis. | |||
| The firm’s business activities generate asset and liability portfolios which are intrinsically highly diversified with respect to market, product and currency. This reduces UBS’s exposure to individual funding sources, and also provides a broad range of investment opportunities, which in turn reduces liquidity risk. | ||||
| UBS adopts a centralized approach to liquidity and funding management to exploit these advantages to the full. The liquidity and funding process is undertaken jointly by Group Treasury and the foreign exchange and money market (FX&MM) unit within the Investment Bank’s fixed income, currencies and commodities (FICC) business area. Group Treasury establishes a comprehensive control framework, while FX&MM undertakes operational cash and collateral management within the established parameters. | ||||
| This centralization permits close control of both UBS’s global cash position and its stock of highly liquid securities. The central treasury process also ensures that the firm’s general access to wholesale cash markets is concentrated in FX&MM. Funds raised externally are largely channeled into FX&MM including the proceeds of debt securities issued by UBS, an activity for which Group Treasury is responsible. FX&MM in turn meets all internal demands for funding by channeling funds from units generating surplus cash to those requiring finance. In this way, UBS reduces its external borrowing and use of available credit lines, and presents a consistent and coordinated face to the market. | ||||
| Liquidity modeling and contingency planning | ||||
| For the purpose of monitoring its liquidity situation, UBS employs the following main measures: | |||
| – | A cash ladder, which is used by FX&MM to manage the firm’s funding requirements on a daily basis within limits that are set by the BoD risk committee and controlled by Group Treasury. This cumulative cash ladder shows the daily liquidity position – the net cumulative funding requirement for a specific day – projected for each business day from the current day forward six months. | |||
152
Table of Contents
Risk and treasury management |
| – | A contractual maturity gap analysis of UBS’s assets and liabilities. | ||
| – | A behavioral maturity gap analysis under an assumed severe liquidity crisis scenario. | |||
| – | A cash capital model which measures the amount of stable funding in relation to the amount and composition of its assets. | |||
| The breakdown of the contractual maturity of UBS’s assets and liabilities serves as a starting point for stress testing analyses. One such breakdown is shown in the “Maturity analysis” table at the end of this section. This maturity analysis is an accounting view. It does not fully represent a liquidity risk management perspective, which would also include behavioral stress analyses and a more detailed breakdown of asset and liability types. | ||||
| The aforementioned liquidity crisis scenario combines a firm-specific crisis with market disruption and focuses on a time horizon starting with overnight and extending up to one year. This UBS-specific scenario envisages large draw-downs on otherwise stable client deposits, an inability to renew or replace maturing unsecured wholesale funding and limited capacity to generate liquidity from trading assets. Liquidity crisis scenario analysis supports the liquidity management process so that immediate corrective measures, such as the use of a liquidity buffer to absorb potential sudden liquidity shortfalls, can be put into effect. | ||||
| Since a liquidity crisis could have a myriad of causes, UBS focuses on a scenario that encompasses all potential stress effects across all markets, currencies and products. | |||
| The assessment includes the likelihood of maturing assets and liabilities being rolled over in a UBS-specific crisis within an otherwise stressed market environment, and gauges the extent to which the potential crisis-induced shortfall could be covered by available funding. This would be raised on a secured basis against available collateral, which includes securities eligible for pledging at the major central banks, or by selling liquid inventory. In both cases UBS applies crisis-level discounts to the value of the assets. It assumes that it would be generally unable to renew any of the Group’s wholesale unsecured debt, including all its maturing money market paper (outstanding volume CHF 112 billion on 31 December 2008) and that no contingency funding could be raised on an unsecured basis. Since liquidity needs may also result from commitments and contingencies, including credit lines extended to secure the liquidity needs of customers, UBS regularly monitors undrawn committed credit facilities and other latent liquidity risks and factors these potential liquidity outflows into the scenario analysis. Particular emphasis is placed on potential drawdowns of committed credit lines. | ||||
| If UBS’s credit rating were to be downgraded, “rating trigger” clauses, especially in derivative contracts, could result in an immediate cash outflow due to the unwinding of derivative positions, or the need to deliver additional collateral. UBS also analyzes the potential impact on its net liquidity position of ad- | ||||
| verse movements in the replacement value of its over-the-counter (OTC) derivative transactions which are subject to collateral arrangements and includes potential outflows in its crisis scenario. Given the diversity of UBS’s derivatives business and that of its counterparties, there is not necessarily a direct correlation between the factors influencing net replacement values with each counterparty and a firm-specific crisis scenario. Liquidity limits and controls | ||||
| Liquidity and funding limits are set by senior management, taking into consideration UBS’s business model and strategy, the prevailing market conditions and the firm’s tolerance for risk. Structural limits focus on the composition and profile of the balance sheet, while supplementary limits are designed to drive the utilization and allocation of funding resources. The supplementary limits, which consist of three categories – operational, funding and regulatory – are monitored and performance is regularly communicated to senior management. Operational limits focus on structural liquidity risk for terms from intra-day out to one year including stress testing, while funding limits focus on the liability mix. The principles underlying UBS’s limit framework aim to maximize and sustain the value of its business franchise and appropriately balance the asset / liability structure in light of prevailing market conditions. Group Treasury is responsible for the control and oversight of the liquidity and funding limits. | |||
| To complement and support the limit framework, regional teams monitor the markets in which UBS operates for potential threats and regularly report any significant findings to Group Treasury. | ||||
| UBS has also developed detailed contingency plans for liquidity crisis management, the cornerstone of which is the Group’s substantial liquidity reserves, including a large multi-currency portfolio of unencumbered high-quality and short-term assets as well as available and unutilized liquidity facilities at several major central banks. | |||
| The liquidity contingency plan is an integral part of the global crisis management concept, which covers all types of crisis events. Its implementation falls under the responsibility of a core crisis team with representatives from Group Treasury, from FX&MM and from related areas including the functions responsible for payments and settlements, market and credit risk control, collateral and margin management, and information technology and infrastructure. FX&MM’s centralized global management model lends itself naturally to efficient liquidity crisis management. Should a crisis require contingency funding measures to be invoked, Group Treasury takes responsibility for coordinating liquidity generation together with representatives from FX&MM and the relevant business areas. | ||||
| UBS manages its relationships with the major central banks as part of its general policy, which is to base contingency plans on having sufficient liquidity reserves at its disposal and to raise contingency funding on a secured basis against provision of collateral. | ||||
153
Table of Contents
Risk and treasury management
Treasury management
Funding
UBS’s domestic retail and global wealth management businesses continue to be valuable, cost-efficient and reliable sources of funding. These businesses contributed CHF 340 billion, or 72% of the CHF 475 billion total customer deposits shown in the UBS asset funding diagram below. Compared with the CHF 340 billion of net loans as of 31 December 2008, customer deposits provided 140% coverage. In terms of secured funding, i.e. repurchase agreements and securities lent against cash collateral received, UBS borrows less cash on a collateralized basis than it lends, leading to a surplus of net securities sourced (and rehypothecable) – shown as the CHF 231 billion cash-equivalent surplus in the diagram below. Furthermore, through the establishment of short-, medium- and long-term funding programs in Europe, the US and Asia, UBS can provide specialized investments to its customers through which it can efficiently raise funds globally from both institutional and private investors, minimizing its dependence on any particular source. A maturity breakdown of UBS’s long-term straight debt portfolio of CHF 58 billion is shown further below.
UBS asset funding
Net replacement values (RVs)
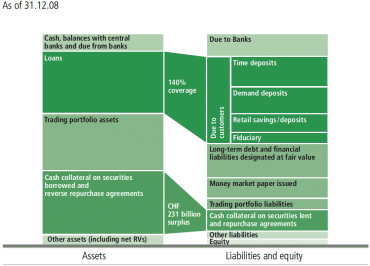
Funding approach
Medium- and long-term funding activities are planned by assessing the overall funding profile of the balance sheet, taking due account of the effective maturity of the asset base and the amount of maturing debt that will have to be
replaced. The ability to continue to fund ongoing business activities through periods of difficult market conditions is also factored in. Prior to the outbreak of the current crisis, at the beginning of 2007, UBS decided to further strengthen its funding profile through public issuance of senior, straight, long-term debt and to thereby enhance the overall diversification of its funding sources. Despite the persistent turbulence prevailing in the capital markets throughout the year, UBS raised CHF 24 billion of proceeds through public senior debt issuance during 2008 (compared with CHF 15 billion during 2007). Two recent examples of this funding diversification effort were the inaugural Samurai domestic Japanese Yen issuance (totaling JPY 91.5 billion) in June 2008 and the approximately CHF 2 billion Swiss covered bond (Pfandbrief) issuance via the Swiss Mortgage Bond Bank in December 2008.
| è | Refer to the “Shares and capital instruments” section of this report for more information about capital instruments |
154
Table of Contents
Risk and treasury management |
UBS: funding by product and currency
| All currencies | CHF | EUR | USD | Others | ||||||||||||||||||||||||||||||||||||
| In % | 31.12.08 | 31.12.07 | 31.12.08 | 31.12.07 | 31.12.08 | 31.12.07 | 31.12.08 | 31.12.07 | 31.12.08 | 31.12.07 | ||||||||||||||||||||||||||||||
| Securities lending | 1.4 | 2.1 | 0.0 | 0.0 | 0.4 | 0.2 | 0.6 | 1.5 | 0.4 | 0.4 | ||||||||||||||||||||||||||||||
| Repurchase agreements | 10.1 | 19.9 | 0.9 | 1.5 | 1.6 | 2.5 | 6.6 | 12.2 | 1.0 | 3.7 | ||||||||||||||||||||||||||||||
| Interbank | 12.4 | 9.5 | 0.8 | 0.5 | 4.9 | 1.8 | 4.9 | 4.5 | 1.8 | 2.8 | ||||||||||||||||||||||||||||||
| Money market paper | 11.0 | 9.9 | 0.3 | 0.3 | 1.0 | 0.9 | 8.5 | 7.3 | 1.2 | 1.3 | ||||||||||||||||||||||||||||||
| Retail savings/deposits | 9.9 | 7.1 | 6.0 | 4.6 | 1.0 | 0.8 | 3.0 | 1.6 | 0.0 | – | ||||||||||||||||||||||||||||||
| Demand deposits | 13.8 | 11.7 | 2.8 | 2.2 | 2.8 | 2.4 | 6.5 | 5.3 | 1.7 | 1.8 | ||||||||||||||||||||||||||||||
| Fiduciary | 6.0 | 6.0 | 0.3 | 0.3 | 2.0 | 1.8 | 3.0 | 3.1 | 0.7 | 0.8 | ||||||||||||||||||||||||||||||
| Time deposits | 17.0 | 16.9 | 1.6 | 2.3 | 2.9 | 1.9 | 9.1 | 9.5 | 3.5 | 3.1 | ||||||||||||||||||||||||||||||
Long-term debt1 | 18.4 | 17.0 | 2.7 | 1.4 | 5.9 | 4.7 | 5.0 | 6.2 | 4.8 | 4.7 | ||||||||||||||||||||||||||||||
Total | 100.0 | 100.0 | 15.3 | 13.2 | 22.4 | 17.0 | 47.2 | 51.2 | 15.1 | 18.6 | ||||||||||||||||||||||||||||||
Funding position and diversification
UBS continues to maintain a balanced portfolio of liabilities that is broadly diversified by market, product and currency. The vast product offerings and global scope of the firm’s business activities are the primary reasons for funding stability. Funding is provided through numerous short-, medium-, and long-term funding programs in Europe, the US and Asia, which provide specialized investments to institutional and private clients. UBS’s domestic retail and global wealth management businesses are also a valuable source of funding.
sets and reverse repurchases/securities borrowed that were financed through repurchase agreements).
UBS: funding by currency
UBS: funding by product type

155
Table of Contents
Risk and treasury management
Treasury management
Credit ratings
| As of 31.12.08 | Moody's | Standard & Poor's | Fitch Ratings | |||||||||
| Rating | Outlook | Rating | Outlook | Rating | Outlook | |||||||
| Long-term rating | Aa2 | stable | A+ | stable | A+ | stable | ||||||
| Short-term rating | P–1 | stable | A–1 | stable | F1+ | stable | ||||||
| Financial strength rating/Individual | B– | stable | B/C | stable1 | ||||||||
UBS Ratings
The table above summarizes UBS’s long- and short-term debt ratings as of 31 December 2008 (refer to the “Credit ratings” sidebar).
Maturity breakdown of long-term straight debt portfolio
The graph below shows a contractual maturity breakdown of the portion of UBS’s long-term debt portfolio consisting of straight debt (and therefore excluding all structured debt, which is predominately booked as “financial liabilities desig-
Long-term straight debt – contractual maturities
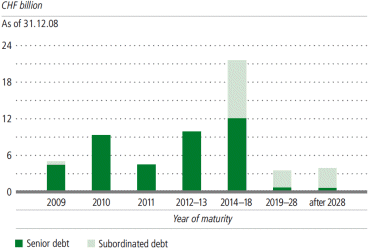
nated at fair value”). This amounted to CHF 58 billion on 31 December 2008, and is accounted for on the balance sheet as part of the CHF 197 billion shown on the “Debt issued” line (which in addition includes money market paper issued and the December 2008 MCN issuance). UBS’s long-term straight debt portfolio is composed of CHF 42 billion of senior debt (including both publicly and privately placed notes and bonds as well as Swiss cash bonds) and CHF 16 billion of subordinated debt. CHF 5 billion, or 9%, of the positions mature during 2009.
156
Table of Contents
Risk and treasury management |
| Maturity analysis | |||||||||||||||||||||||||||||||||||||
| On-demand and trading instruments | ||||||||||||||||||||||||||||||||||||||
| Instruments | Due | Due | Due | |||||||||||||||||||||||||||||||||||
| at cost and at | Instruments | Instruments | Due | between | between | between | ||||||||||||||||||||||||||||||||
| fair value/ | at fair value/ | at fair value/ | within | 1 and 3 | 3 and 12 | 1 and 5 | Due after | |||||||||||||||||||||||||||||||
| CHF billion | level 1 | level 2 | level 3 | 1 month | months | months | years | 5 years | Total | |||||||||||||||||||||||||||||
Assets | ||||||||||||||||||||||||||||||||||||||
| Cash and balances with central banks | 32.7 | 0.0 | 0.0 | 0.0 | 0.0 | 0.0 | 0.0 | 0.0 | 32.7 | |||||||||||||||||||||||||||||
| Due from banks | 54.6 | 0.0 | 0.0 | 5.3 | 1.1 | 1.4 | 1.7 | 0.4 | 64.5 | |||||||||||||||||||||||||||||
| Cash collateral on securities borrowed | 77.8 | 0.0 | 0.0 | 43.7 | 1.4 | 0.0 | 0.0 | 0.0 | 122.9 | |||||||||||||||||||||||||||||
| Reverse repurchase agreements | 28.0 | 0.0 | 0.0 | 179.6 | 8.7 | 6.8 | 0.8 | 0.7 | 224.6 | |||||||||||||||||||||||||||||
Trading portfolio assets1 | 128.1 | 128.4 | 15.3 | 0.0 | 0.0 | 0.0 | 0.0 | 0.0 | 271.8 | |||||||||||||||||||||||||||||
Trading portfolio assets pledged as collateral1 | 25.4 | 13.2 | 1.6 | 0.0 | 0.0 | 0.0 | 0.0 | 0.0 | 40.2 | |||||||||||||||||||||||||||||
Positive replacement values1 | 5.1 | 811.2 | 37.8 | 0.0 | 0.0 | 0.0 | 0.0 | 0.0 | 854.1 | |||||||||||||||||||||||||||||
Financial assets designated at fair value2 | 1.1 | 0.1 | 0.0 | 1.5 | 0.5 | 1.0 | 4.0 | 4.7 | 12.9 | |||||||||||||||||||||||||||||
| Loans | 71.4 | 0.0 | 0.0 | 71.8 | 33.1 | 32.6 | 80.5 | 50.9 | 340.3 | |||||||||||||||||||||||||||||
| Financial investments available-for-sale | 0.0 | 0.5 | 1.1 | 1.4 | 0.8 | 0.2 | 0.1 | 1.1 | 5.2 | |||||||||||||||||||||||||||||
| Accrued income and prepaid expenses | 0.0 | 0.0 | 0.0 | 6.1 | 0.0 | 0.0 | 0.0 | 0.0 | 6.1 | |||||||||||||||||||||||||||||
| Investments in associates | 0.0 | 0.0 | 0.0 | 0.0 | 0.0 | 0.0 | 0.0 | 0.9 | 0.9 | |||||||||||||||||||||||||||||
| Property and equipment | 0.0 | 0.0 | 0.0 | 0.0 | 0.0 | 0.0 | 0.0 | 6.7 | 6.7 | |||||||||||||||||||||||||||||
| Goodwill and other intangible assets | 0.0 | 0.0 | 0.0 | 0.0 | 0.0 | 0.0 | 0.0 | 12.9 | 12.9 | |||||||||||||||||||||||||||||
| Other assets | 0.0 | 0.0 | 0.0 | 19.1 | 0.0 | 0.0 | 0.0 | 0.0 | 19.1 | |||||||||||||||||||||||||||||
Total 31.12.08 | 424.1 | 953.5 | 55.9 | 328.5 | 45.5 | 42.1 | 87.1 | 78.3 | 2,015.1 | |||||||||||||||||||||||||||||
| Total 31.12.07 | 676.4 | 787.5 | 75.7 | 438.5 | 80.9 | 76.1 | 79.9 | 59.8 | 2,274.9 | |||||||||||||||||||||||||||||
Liabilities | ||||||||||||||||||||||||||||||||||||||
| Due to banks | 55.1 | 0.0 | 0.0 | 52.3 | 12.2 | 4.9 | 0.8 | 0.4 | 125.6 | |||||||||||||||||||||||||||||
| Cash collateral on securities lent | 12.6 | 0.0 | 0.0 | 1.5 | 0.0 | 0.0 | 0.0 | 0.0 | 14.1 | |||||||||||||||||||||||||||||
| Repurchase agreements | 8.6 | 0.0 | 0.0 | 82.6 | 5.7 | 5.1 | 0.3 | 0.3 | 102.6 | |||||||||||||||||||||||||||||
Trading portfolio liabilities1 | 33.9 | 27.5 | 1.0 | 0.0 | 0.0 | 0.0 | 0.0 | 0.0 | 62.4 | |||||||||||||||||||||||||||||
Negative replacement values1 | 4.9 | 812.0 | 34.9 | 0.0 | 0.0 | 0.0 | 0.0 | 0.0 | 851.8 | |||||||||||||||||||||||||||||
Financial liabilities designated at fair value3 | 0.0 | 0.0 | 0.0 | 0.6 | 7.8 | 20.7 | 37.2 | 35.3 | 101.5 | |||||||||||||||||||||||||||||
| Due to customers | 208.6 | 0.0 | 0.0 | 206.1 | 34.3 | 16.2 | 0.5 | 9.1 | 474.8 | |||||||||||||||||||||||||||||
| Accrued expenses and deferred income | 0.0 | 0.0 | 0.0 | 10.2 | 0.0 | 0.0 | 0.0 | 0.0 | 10.2 | |||||||||||||||||||||||||||||
| Debt issued | 0.0 | 0.0 | 0.0 | 83.6 | 20.7 | 13.9 | 37.1 | 41.9 | 197.3 | |||||||||||||||||||||||||||||
| Other liabilities | 13.1 | 0.0 | 0.0 | 21.0 | 0.0 | 0.0 | 0.0 | 0.0 | 34.0 | |||||||||||||||||||||||||||||
Total 31.12.08 | 336.7 | 839.5 | 35.9 | 457.8 | 80.6 | 60.7 | 75.9 | 87.0 | 1,974.3 | |||||||||||||||||||||||||||||
| Total 31.12.07 | 501.9 | 465.0 | 16.8 | 671.4 | 190.7 | 167.8 | 106.5 | 111.0 | 2,231.1 | |||||||||||||||||||||||||||||
Off-balance sheet | ||||||||||||||||||||||||||||||||||||||
Undrawn irrevocable facilities4 | 59.9 | 0.0 | 0.0 | 0.2 | 0.0 | 0.1 | 0.1 | 0.0 | 60.3 | |||||||||||||||||||||||||||||
1 Trading and derivative positions are presented in the first three columns of the table: “Instruments at cost and fair value / Level 1,” “Instruments at fair value / Level 2” and “Instruments at fair value / Level 3.” Management believes that such presentation most accurately reflects the short-term nature of trading activities. The contractual maturity of the instruments may, however, extend over significantly longer periods. The breakdown of these positions into the fair value measurement categories of levels 1, 2 and 3 indicates the liquidity of the markets in which the financial instruments are traded and the availability of market observable inputs to measure these instruments (refer to “Note 27 Fair value of financial instruments” in the financial statements of this report). Contractual maturities of trading portfolio liabilities are: CHF 61.2 billion due within one month; and CHF 1.2 billion due between one month and one year. 2 The contractual redemption amount at maturity of financial assets designated at fair value approximates the carrying value as of 31 December 2008 and 31 December 2007. 3 Non-trading and non-derivative financial liabilities are categorized based on the earliest date on which UBS can be required to pay. 4 Excludes commitments from contingent claims (credit guarantees, performance guarantees and similar instruments, and documentary credits) of CHF 18,494 million and commitments to acquire auction rate securities (ARS) of CHF 16,571 million on 31 December 2008. Refer to the “Exposure to auction rate securities” sidebar in the “Risk concentrations” section of this report for more information. | ||||||||||||||||||||||||||||||||||||||
157
Table of Contents
Risk and treasury management
Treasury management
Credit ratings
Despite a 2008 full-year loss of slightly above CHF 20 billion, UBS maintained a sound and strong capital position as it believes that this is a key part of its value proposition for both clients and investors.
pursued by major financial institutions.
position has, in our view, remained relatively robust, and is further enhanced by the cash received from the SNB transaction.”
158
Table of Contents
Risk and treasury management |
Interest rate and currency management
| Management of non-trading interest rate risk UBS’s largest non-trading interest rate exposures arise within the Global Wealth Management & Business Banking business division. These risks are transferred from the originating business into one of two centralized interest rate risk management units: Group Treasury or the Investment Bank’s foreign exchange and money market (FX&MM) unit. These units manage the risks on an integrated basis, exploiting the full netting potential across risks from different sources. | |||
| Risks from fixed-maturity, short-term Swiss franc and all non-Swiss franc transactions are generally transferred to FX&MM. Risks from Swiss franc transactions with fixed maturities greater than one year are transferred to Group Treasury by individual back-to-back transactions. These fixed-rate products do not contain embedded options such as early prepayment that would allow customers to prepay at par. All prepayments are therefore subject to market-based unwinding costs. | ||||
| Current and savings accounts and many other retail products of Global Wealth Management & Business Banking have no contractual maturity date or direct market-linked rate, and therefore their interest rate risk cannot be transferred by simple back-to-back transactions. Instead, they are transferred on a pooled basis via “replicating” portfolios. A replicating portfolio is a series of loans or deposits at market rates and fixed terms between the originating business unit and Group Treasury, structured to approximate, on average, the interest rate cash flow and repricing behavior of the pooled client transactions. The portfolios are rebalanced monthly. Their structure and parameters are based on long-term market observations and client behavior, and are regularly reviewed and adjusted as necessary. The originating business units are thus immunized as far as possible against market interest rate movements, but retain and manage their product margin. | ||||
| A significant amount of interest rate risk also arises from the financing of non-monetary related balance sheet items, such as the financing of bank property and equity investments in associated companies. These risks are generally transferred to Group Treasury through replicating portfolios which, in this case, are designed to approximate the funding profile mandated by senior management. | ||||
| Group Treasury manages its residual open interest rate exposures, taking advantage of any offsets that arise between positions from different sources, within its approved market risk limits (Value at Risk (VaR) and stress loss). The preferred risk management instrument is interest rate swaps, | ||||
| for which there is a liquid and flexible market. All transactions are executed via the Investment Bank – Group Treasury does not directly access the external market. | |||
èRefer to the “Market risk” section of this report for further details on UBS’s market risk measures and controls | ||||
| Market risk arising from management of consolidated capital UBS is required, by international banking regulations (Bank for International Settlements regulations), to hold a minimum level of capital against assets and other exposures (risk-weighted assets). The relationship between UBS’s capital and its risk-weighted assets, the BIS tier 1 ratio, is monitored by regulators and analysts and is a key indicator of its financial strength. | |||
| The majority of UBS’s capital and many of its assets are denominated in Swiss francs, but the Group also holds risk-weighted assets and some eligible capital in other currencies, primarily US dollar, euro, UK sterling and Brazilian real. Any significant depreciation of the Swiss franc against these currencies would adversely impact the Group’s BIS tier 1 ratio. Group Treasury’s mandate is therefore to minimize adverse currency impacts on this ratio and to generate an income flow from the capital. This mandate determines a currency, tenor and product mix – a target profile – against which Group Treasury manages the Group’s capital. | ||||
| On an overall Group basis, Group Treasury’s target profile is based on a currency mix which broadly reflects the currency distribution of the consolidated risk-weighted assets, using products and tenors which generate the desired income stream. As the Swiss franc depreciates (or appreciates) against these currencies, the consolidated risk-weighted assets increase (or decrease) relative to UBS’s capital. These currency fluctuations also lead to translation gains (or losses) on consolidation, which are recorded through equity. Thus, UBS’s consolidated equity rises or falls in line with the fluctuations in the risk-weighted assets, protecting the tier 1 ratio. The capital of the parent bank itself is held predominantly in Swiss francs in order to avoid any significant effects of currency fluctuations on its standalone financial results. | ||||
| The capital of the parent bank and its subsidiaries is placed in the form of interest-bearing cash deposits internally within the Group, primarily with the Investment Bank’s FX&MM unit. Where necessary, Group Treasury also executes derivatives (mainly interest rate swaps) through the Investment Bank’s trading desks to achieve the target profile. FX&MM and the derivative trading units manage the resultant cash and market risk positions as part of their normal | ||||
159
Table of Contents
Risk and treasury management
Treasury management
| business activities and, in the case of FX&MM, within the approved liquidity and funding risk framework. | |||
èRefer to the “Liquidity and funding management” section of this report for details on UBS’s liquidity and funding risk framework | ||||
| For the purposes of measuring and managing Group Treasury’s market risk position, the Group’s consolidated equity is represented in the treasury book by replicating portfolios (liabilities) with the target currency and interest rate profile. The interest rate positions created by Group Treasury’s deposits with FX&MM or other units, and the associated derivatives, generally offset the interest rate risk of the replicating portfolios. Any mismatches between the two are managed, together with other non-trading interest rate risk positions, within Group Treasury’s market risk limits (VaR and stress loss). | |||
| The structural foreign currency exposures are controlled by senior management but are not subject to internal market risk limits and are not included in Group Treasury’s reported VaR. | ||||
Group Treasury interest rate risk development In measuring Group Treasury’s interest rate risk – expressed as VaR – both the representation of the consolidated equity (replicating portfolios) and the deployment of the equity described above are included in the calculations. | ||||
| On 31 December 2008, UBS’s consolidated equity was deployed as follows: in Swiss francs (including most of the capital of the parent bank) with an average duration of approximately three years and an interest rate sensitivity of CHF 7.9 million per basis point; in US dollars with an average duration of approximately four years and a sensitivity of CHF 8.0 million per basis point; in euro with an average duration of approximately three years and a sensitivity of CHF 0.7 million per basis point; and in UK sterling with a duration of approximately three years and a sensitivity of CHF 0.4 million per basis point. The interest rate sensitivity of these positions is directly related to the chosen duration – targeting significantly shorter maturities would reduce the apparent interest rate sensitivity but would lead to greater fluctuations in interest income. | |||
Corporate currency management UBS’s corporate currency management activities are designed to reduce the impact of adverse currency fluctuations on its reported financial results, given regulatory constraints. UBS specifically focuses on three principal areas of currency risk management: match funding / investment of non-Swiss franc assets / liabilities; sell-down of non-Swiss franc profit and loss; and selective hedging of anticipated non-Swiss franc profit and loss. | ||||
| Group Treasury: Value-at-Risk (10-day, 99% confidence, 5 years of historical data) | ||||||||||||||||||||||||||||||||
| Year ended 31.12.08 | Year ended 31.12.07 | |||||||||||||||||||||||||||||||
| CHF million | Min. | Max. | Average | 31.12.08 | Min. | Max. | Average | 31.12.07 | ||||||||||||||||||||||||
| Interest rates | 8 | 54 | 19 | 26 | 9 | 55 | 17 | 54 | ||||||||||||||||||||||||
| Foreign exchange | 3 | 93 | 26 | 10 | 1 | 87 | 18 | 21 | ||||||||||||||||||||||||
| Diversification effect | 1 | 1 | (10 | ) | (14 | ) | 1 | 1 | (10 | ) | (14 | ) | ||||||||||||||||||||
Total management VaR | 10 | 97 | 34 | 28 | 10 | 92 | 25 | 61 | ||||||||||||||||||||||||
1 As the minimum and maximum occur on different days for different risk types, it is not meaningful to calculate a portfolio diversification effect. | ||||||||||||||||||||||||||||||||
160
Table of Contents
Risk and treasury management |
| Match funding and investment of non-Swiss franc assets and liabilities As far as it is practical and efficient to do so, UBS follows the principle of matching the currency of its assets with the currency of the liabilities which fund them – thus a US dollar asset is typically funded in US dollars, a euro liability is offset by an asset in euros, etc. This avoids profits and losses arising from retranslation at the prevailing exchange rates to the Swiss franc at each quarter end.Sell-down of reported profits and losses For accounting purposes, reported profits and losses are translated each month from the original transaction currencies into Swiss francs at the exchange rate prevailing at the end of the month. Group Treasury centralizes profits or losses in foreign currencies that arise in the parent bank, and sells or buys them for Swiss francs in order to eliminate earnings volatility which would arise from retranslation at different exchange rates of previously reported non-Swiss franc profits and losses. Other UBS operating entities follow a similar monthly sell-down process into their own reporting currencies. Profits retained in operating entities | |||
| with a reporting currency other than the Swiss franc are managed as part of UBS’s consolidated equity, as described earlier. Hedging of anticipated future reported profits and losses The monthly sell-down process cannot protect UBS’s earnings from swings caused by a sustained depreciation against the Swiss franc of one of the main currencies in which UBS earns net revenues or by an appreciation of one in which it incurs significant net costs. | |||
| The firm’s corporate currency management executes a dynamic and cost-efficient rollover hedge strategy on a portion of the profits or losses that UBS anticipates for the next three months, on a rolling one-month basis. | ||||
| Although intended to hedge future earnings, these transactions are considered open currency positions. They are therefore subject to internal market risk VaR and stress loss limits. | ||||
| In public segmental reporting, the profits and losses arising from the hedge strategy are shown as Corporate Center items, while the business division results are fully exposed to exchange rate fluctuations. | ||||
161
Table of Contents
Risk and treasury management
Treasury management
Capital management
| Sufficient capital must be in place to support business activities, according to both UBS’s own internal assessment and the requirements of its regulators, in particular its lead regulator the Swiss Financial Market Supervisory Authority (FINMA; until 31 December 2008 Swiss Federal Banking Commission). | |||
| UBS aims to maintain sound capital ratios at all times, and it therefore considers not only the current situation but also projected developments in both its capital base and capital requirements. The main tools by which UBS manages the supply side of its capital ratios are active management of shares, capital instruments and dividend payments. | ||||
| Capital adequacy management Ensuring compliance with minimum regulatory capital requirements and targeted capital ratios is central to capital adequacy management. In this ongoing process, UBS manages towards tier 1 and total capital target ratios. In the target setting process UBS takes into account the regulatory minimum capital requirements, regulators’ expectations that UBS holds additional capital above minimum requirements, UBS’s internal assessment of aggregate risk exposure in terms of capital-at-risk (refer to “Earnings-at-risk and capital-at-risk” in the “Risk management and control” section of this report), the views of rating agencies, and comparison with peer institutions considering UBS’s business mix and market presence. Regulatory requirements On 1 January 2008, UBS adopted the Basel II capital framework of the Basel Committee on Banking Supervision of the Bank for International Settlements (BIS). (Refer to the “General description of risk exposure measures and capital requirements” in the “Basel II Pillar 3” section of this report for details regarding UBS’s implementation of Basel II.) The introduction of Basel II led to a decrease in UBS’s overall capital requirements, as measured by risk-weighted assets (RWA). Eligible capital calculations have also been modified by the introduction of new deductions from tier 1 capital and total capital, resulting in lower eligible capital. | |||
| To allow for comparability, published RWA are determined according to the rules of the BIS Basel II framework. UBS’s regulatory capital requirements are based on the regulations of FINMA, which lead to higher risk-weighted assets compared with BIS guidelines (refer to the additional capital management disclosure in the “Basel II Pillar 3” section of this report). Eligible capital is the same under BIS guidelines and FINMA regulations. | ||||
| In 2008, UBS complied with all externally imposed capital requirements. | |||
| Developments As publicly announced, in fourth quarter 2008 FINMA enhanced the capital requirements under Basel II, Pillar 2, for UBS and Credit Suisse. The new regulatory measures will have to be implemented progressively until full applicability on 1 January 2013. | ||||
| First, FINMA will increase the capital buffer (the regulatory excess capital expected to be held over and above the regulatory minimum requirement) from 20% to 50%–100% over the cycle. At the same time, FINMA will allow for enlarged recognition of hybrid capital. | ||||
| Second, FINMA will introduce a minimum leverage ratio, defining the minimum amount of tier 1 capital required for a given balance sheet size. For this calculation, the IFRS balance sheet is adjusted for a number of factors: replacement values determined according to the rules of IFRS are substituted by the corresponding values under Swiss Generally Accepted Accounting Principles (Swiss GAAP), allowing for increased recognition of netting benefits, similar to US GAAP. Moreover, the Swiss loan book, certain cash and balances with central banks and specified reverse repurchase agreements where the repurchase price is payable in Swiss francs will be excluded from the balance sheet. Furthermore, a number of adjustments will be made to avoid double-counting of assets that are already deducted from tier 1 capital, most notably goodwill and intangible assets. FINMA will require a minimum leverage ratio of 3% on Group level, with an expectation that the ratio will be well above the minimum requirements in normal times. | ||||
| The table on the next page shows the calculation of the FINMA consolidated leverage ratio as of 31 December 2008. | ||||
| In January 2009, the Basel Committee on Banking Supervision issued consultative documents on proposed revisions to the Basel II market risk framework. Broadly, the committee aims to address perceived shortcomings of the current Value at Risk (VaR) framework, most notably by enhancing capital requirements to incorporate effects of “stressed VaR” and by introducing new capital charges for price risks that are incremental to any default and event risks already captured by VaR models used by banks. Furthermore, the Basel Committee also plans to update – for regulatory capital purposes – the prudent valuation guidance for illiquid positions accounted for at fair value. It is envisaged that the revised requirements will have to be implemented by the end of 2009 and 2010, respectively. | ||||
| Finally, in January 2009 the Basel Committee issued a consultative document on further enhancements to the Ba- | ||||
162
Table of Contents
Risk and treasury management |
| sel II framework, with revised requirements for securitization exposures and, in particular, higher risk weights for re-securitization positions. Capital ratios The BIS ratios compare the amount of eligible capital (in total and tier 1) with the total of risk-weighted assets. | ||||
| At year-end 2008, the BIS tier 1 ratio amounted to 11.0% and the total capital ratio to 15.1%, compared with 9.1% and 12.2%, respectively, under Basel I rules at year-end 2007. In this period, risk-weighted assets declined from CHF 374.4 billion (Basel I) to CHF 302.3 billion, while tier 1 capital decreased from CHF 34.1 billion to CHF 33.4 billion. | ||||
| Eligible capital and capital ratios were restated following a change in accounting policy on pension and other post-retirement benefit plans (refer to “Note 30 Pension and other post-retirement benefit plans” in the financial statements of this report for more information). Due to this restatement, tier 1 capital and total capital increased by approximately CHF 1.6 billion and the corresponding capital ratios by 40 basis points at year-end 2007. | ||||
| Capital requirements UBS’s capital requirements are generally based on its consolidated financial statements in accordance with IFRS. Under IFRS, subsidiaries and special purpose entities that are directly or indirectly controlled by UBS must be consolidated, whereas for regulatory capital purposes, different consolidation principles apply. For example, subsidiaries that are not active in the banking and finance business are excluded. | |||
è Refer to the additional capital management disclosure in the “Basel II Pillar 3” section of this report | ||||
UBS: BIS capital ratios1
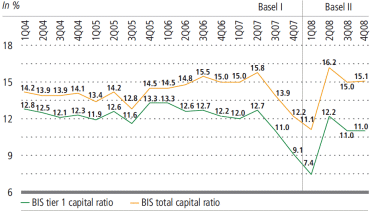
| On 31 December 2008 risk-weighted assets were CHF 302.3 billion, compared with CHF 374.4 billion (Basel I) at year-end 2007. Figures by component are as follows: | ||||
| Credit risk Risk-weighted assets for credit risk amounted to CHF 222.6 billion at 31 December 2008, compared with CHF 323.3 billion under Basel I on 31 December 2007. The introduction of Basel II led to considerably lower risk-weighted assets for credit risk. However, the impact on individual business divisions varied: Global Wealth Management & Business Banking saw lower risk-weighted assets for customer loans, mortgages and lombard lending, while the Investment Bank was subject to higher capital requirements for over-the-counter (OTC) derivatives and repo-style transactions (i.e. repurchase/reverse repurchase and securities, lending and borrowing transactions). | ||||
èRefer to the “Credit risk” section of this report for more information | ||||
| FINMA1 adjusted assets for leverage ratio calculation | ||||
| CHF billion, except where indicated | Average fourth quarter 2008 | |||
Total assets (IFRS)2 prior to deductions | 2,212 | |||
Less: difference between IFRS and Swiss GAAP positive replacement values3 | (653 | ) | ||
| Less: loans to Swiss clients (excluding banks) | (165 | ) | ||
| Less: cash and balances with central banks | (27 | ) | ||
Less: Other4 | (23 | ) | ||
Total adjusted assets | 1,344 | |||
FINMA consolidated leverage ratio (%) | 2.48 | |||
163
Table of Contents
Risk and treasury management
Treasury management
| Non-counterparty related assets Risk-weighted assets for non-counterparty related assets amounted to CHF 7.4 billion at 31 December 2008, compared with CHF 9.0 billion under Basel I on 31 December 2007. Market risk In 2008, risk-weighted assets for market risk decreased by CHF 14.5 billion to CHF 27.6 billion on 31 December 2008, due to lower regulatory VaR. The decrease resulted primarily from the transfer of certain illiquid assets from the trading book to the banking book on 1 January 2008 and was partially offset by increases in VaR following higher market volatility and enhancements made to the VaR model. | ||||
èRefer to the “Market risk” section of this report for further information | ||||
| Operational risk The new Basel II capital requirement for operational risk amounted to risk-weighted assets of CHF 44.7 billion on 31 December 2008. | ||||
èRefer to the “Operational risk” section of this report for further information | ||||
| Eligible capital The capital available to support risk-weighted assets – eligible capital – consists of tier 1 and tier 2 capital. Tier 1 capital is required to be at least 4% of risk-weighted assets and total capital (tier 1 plus tier 2) at least 8%. To determine eligible tier 1 and total capital, adjustments have to be made to shareholders’ equity as defined under IFRS, most notably by deducting goodwill and investments in unconsolidated entities engaged in banking and financial activities. | |||
| Tier 1 capital/UBS shares On 31 December 2008, the regulatory eligible tier 1 capital was CHF 33.4 billion, down CHF 0.7 billion compared with year-end 2007. This is the net effect of: CHF 20.9 billion in losses incurred during 2008; reversal for capital purposes of CHF 4.5 billion gains recognized under IFRS related to the accounting for the mandatory convertible notes (MCNs) issued in March and December 2008 (refer to the “IFRS equity to BIS tier 1 capital” section below for more information); CHF 3.8 billion reductions of capital related to own shares; CHF 2.9 billion losses recognized directly in equity; additional deductions of CHF 2.6 billion for intangible assets and other Basel II deductions; and the reversal of CHF 2.3 billion of gains on own credit for capital purposes. These negative effects were compensated by the issue of CHF 13.0 billion MCNs on 5 March 2008, proceeds of EUR 1.0 billion from the issuance of perpetual preferred securities on 11 April 2008, the net proceeds from the rights issue of CHF 15.6 billion on 17 June 2008, and the issuance of CHF 6.0 billion MCNs on 9 December 2008. Hybrid tier 1 capital Hybrid tier 1 instruments are perpetual instruments that can only be redeemed if they are called by the issuer. The payment of interest is subject to compliance with minimum capital ratios and any payment missed is non-cumulative. As of 31 December 2008, UBS’s hybrid tier 1 instruments amounted to CHF 7.4 billion. Under IFRS, these instruments are accounted for as equity attributable to minority interests. Tier 2 capital Tier 2 capital consists mainly of subordinated long-term debt that ranks senior to both UBS shares and hybrid tier 1 instru- | |||
| Capital adequacy | ||||||||||||
| Basel II | Basel I | |||||||||||
| CHF million, except where indicated | 31.12.08 | 31.12.08 | 31.12.07 | |||||||||
| BIS tier 1 capital | 33,371 | 35,884 | 34,101 | |||||||||
of which hybrid tier 1 capital | 7,393 | 7,393 | 6,387 | |||||||||
| BIS total capital | 45,588 | 46,233 | 45,797 | |||||||||
| BIS tier 1 capital ratio (%) | 11.0 | 9.9 | 9.1 | |||||||||
| BIS total capital ratio (%) | 15.1 | 12.7 | 12.2 | |||||||||
Credit risk1 | 222,563 | 326,608 | 323,345 | |||||||||
| Non-counterparty related risk | 7,411 | 8,826 | 8,966 | |||||||||
| Market risk | 27,614 | 27,614 | 42,110 | |||||||||
| Operational risk | 44,685 | N/A | N/A | |||||||||
Total BIS risk-weighted assets | 302,273 | 363,048 | 374,421 | |||||||||
1 Includes securitization exposures and equity exposures not part of the trading book and capital requirements for failed trades. | ||||||||||||
164
Table of Contents
Risk and treasury management |
| ments but is subordinated to all senior obligations of UBS. Tier 2 capital accounted for CHF 12.2 billion in total capital as of year-end 2008. | |||
èRefer to the “Shares and capital instruments” section of this report for details about UBS’s issuance of capital securities during 2008, including hybrid tier 1 instruments and tier 1 instruments | ||||
| Intragroup transfer of capital UBS enters into intragroup transactions in order to manage funding and capital of individual UBS entities. As at 31 December 2008, UBS was not aware of any material restrictions, or other major impediments, concerning the transfer of funds or regulatory capital within the Group apart from those which apply to these entities by way of local laws and regulations. IFRS equity to BIS tier 1 capital The key adjustments made to IFRS equity attributable to shareholders to determine tier 1 eligible capital result from: | ||||
| – | An increase in IFRS share premium of CHF 7.0 billion and retained earnings of CHF 3.8 billion from the recognition of CHF 13.0 billion MCNs issued in March 2008, versus an increase of tier 1 capital (recognized in | |||
| BIS share premium) by CHF 13.0 billion. Refer to “Note 26 Capital increases and mandatory convertible notes” in the financial statements of this report for more information. | ||||
| – | The different treatment of MCNs placed with the Swiss Confederation in December 2008 for IFRS and regulatory capital purposes: IFRS equity attributable to UBS shareholders decreased overall by CHF 2.9 billion, which reflects the net effect of a reduction to share premium of CHF 3.6 billion and a positive impact on retained earnings of CHF 0.7 billion. In contrast, tier 1 capital increased by CHF 6.0 billion. Refer to “Note 26 Capital increases and mandatory convertible notes” in the financial statements of this report for more information. | |||
| – | A negative impact on BIS share premium of CHF 0.9 billion from adjustments for the recognition of interest payments on both MCNs for capital purposes. | |||
| – | The inability to recognize, for tier 1 capital, fair value changes recorded directly in equity under IFRS from financial investments available-for-sale and cash flow hedges (reduction of CHF 1.1 billion). | |||
| – | Further corrections in retained earnings for gains on own credit of CHF 3.0 billion relating to the application of the fair value option under International Accounting Standard (IAS) 39 for capital adequacy purposes. |
| Capital components | |||||||||||||
| Basel II | Basel I | |||||||||||||
| CHF million | 31.12.08 | 31.12.08 | 31.12.07 | |||||||||||
| Core capital prior to deductions | 48,971 | 48,971 | 51,437 | |||||||||||
of which: paid-in share capital | 293 | 293 | 207 | |||||||||||
of which: share premium, retained earnings, currency translation differences and other elements | 41,285 | 41,285 | 44,842 | |||||||||||
of which: non-innovative capital instruments | 1,810 | 1,810 | 340 | |||||||||||
of which: innovative capital instruments | 5,583 | 5,583 | 6,047 | |||||||||||
Less: treasury shares/deduction for own shares1 | (1,488 | )2 | (1,488 | ) | (4,133 | ) | ||||||||
Less: goodwill & intangible assets3 | (12,950 | ) | (11,600 | ) | (13,203 | ) | ||||||||
Less: other Basel II deductions4 | (1,163 | ) | – | |||||||||||
Total eligible tier 1 capital | 33,371 | 35,884 | 34,101 | |||||||||||
| Upper tier 2 capital | 1,090 | 69 | 301 | |||||||||||
| Lower tier 2 capital | 12,290 | 12,290 | 13,770 | |||||||||||
Less: other Basel I deductions5 | – | (2,010 | ) | (2,375 | ) | |||||||||
Less: other Basel II deductions4 | (1,163 | ) | – | |||||||||||
Total eligible capital | 45,588 | 46,233 | 45,797 | |||||||||||
1 Consists of: i) net long position in own shares held for trading purposes; ii) own shares bought for cancellation (second trading line) and for unvested or upcoming share awards; iii) other treasury share positions net of delta-weighted obligations out of employee stock options granted prior to August 2006. 2 Netting of own shares with share-based payment obligations is subject to a grandfathering agreement with the Swiss Financial Market Supervisory Authority. 3 Includes under Basel I only goodwill and the portion of intangible assets exceeding 4% of tier 1 capital. 4 Positions to be deducted as 50% from tier 1 and 50% from total capital mainly consist of: net long position of non-consolidated participations in the finance sector, first loss positions from securitization exposures, excess of expected losses above general provisions (AIRB), expected loss for equities (simple risk weight method). 5 Consists of the net long position of non-consolidated participations in the finance sector and first loss positions from securitization exposures. | ||||||||||||||
165
Table of Contents
Risk and treasury management
Treasury management
| – | Removing minority interests of entities not consolidated for regulatory capital purposes, causing a further reduction of regulatory capital by CHF 0.5 billion. | |||
| – | A positive adjustment of CHF 1.7 billion primarily for the ability to net, for capital purposes, treasury shares held as hedges against obligations from employee stock options granted prior to August 2006. | |||
| Equity attribution framework In first quarter 2008, UBS implemented a new framework for attributing equity capital to its businesses. This reflects UBS’s overarching objectives of maintaining a strong capital base and guiding businesses towards activities with the best balance among profit potential, risk and capital usage. In this framework, the Group Executive Board (GEB) attributes equity to the businesses after considering their risk exposure, asset size, goodwill and intangible assets. | ||||
| The design of the equity attribution framework enables UBS to: | ||||
| – | Calculate and assess return on attributed equity (RoaE) in each of its businesses. With effect from first quarter 2008, RoaE and return on BIS risk-weighted assets (RoRWA) are disclosed for all business groups and units and replace the previously disclosed “return on allocated regulatory capital” measure. | |||
| – | Integrate Group-wide capital management activities with those at business group and business unit level. | |||
| – | Measure performance in a consistent manner across business divisions and business units. | |||
| – | Make better comparisons between the Group’s businesses and those of competitors. | |||
| The framework operates as follows: First, each business is attributed an amount of equity equal to the average book value of goodwill and intangible assets, as reported for that business division or business unit according to IFRS. Next, the GEB considers a number of factors that drive required capital, including: | ||||
| – | Equity requirements based on aggregated risk exposure, including the potential for losses exceeding UBS’s earnings capacity as defined by the firm’s “capital-at-risk” concept. | |||
| – | Regulatory capital requirements which are based on risk-weighted asset usage of the businesses and also take into account the different market standards for tier 1 ratios associated with “pure-play” competitors of each of the businesses. | |||
| – | The asset size of the businesses. | |||
| After reviewing the results of this formulaic approach, the GEB makes adjustments to the final tangible equity attribution to reflect the amount of equity it believes is appropriate for each business. This assessment is based on the | ||||
| Reconciliation of International Financial Reporting Standards equity to BIS tier 1 capital | |||||||||||||||||||||||||||||||||
| 31.12.08 | ||||||||||||||||||||||||||||||||||
| Basel II | Basel I | |||||||||||||||||||||||||||||||||
| Reconciliation | ||||||||||||||||||||||||||||||||||
| CHF million | IFRS1 view | items | BIS view | BIS view | ||||||||||||||||||||||||||||||
| Share capital | 293 | 0 | 293 | 293 | ||||||||||||||||||||||||||||||
| Share premium | 25,250 | 8,500 | 33,750 | 33,750 | ||||||||||||||||||||||||||||||
| Net income recognized directly in equity, net of tax | (4,471 | ) | (1,129 | ) | (5,600 | ) | (5,600 | ) | ||||||||||||||||||||||||||
| Revaluation reserve from step acquisitions, net of tax | 38 | 0 | 38 | 38 | ||||||||||||||||||||||||||||||
| Retained earnings | 14,892 | (7,908 | ) | 6,984 | 6,984 | |||||||||||||||||||||||||||||
| Equity classified as obligation to purchase own shares | (46 | ) | 46 | 0 | 0 | |||||||||||||||||||||||||||||
| Equity attributable to minority interests | 8,002 | (495 | ) | 7,507 | 7,507 | |||||||||||||||||||||||||||||
| Treasury shares/deduction for own shares | (3,156 | ) | 1,668 | 2 | (1,488 | ) | (1,488 | ) | ||||||||||||||||||||||||||
| Mandatory convertible notes (MCNs) to the Swiss Confederation | 0 | 3 | 6,000 | 6,000 | 6,000 | |||||||||||||||||||||||||||||
Total equity/gross tier 1 including MCNs and hybrid tier 1 instruments | 40,802 | 6,682 | 47,484 | 47,484 | ||||||||||||||||||||||||||||||
| Less: goodwill, intangible assets and other Basel II deduction items | (14,113 | )4 | (11,600 | )5 | ||||||||||||||||||||||||||||||
Eligible tier 1 capital | 33,371 | 35,884 | ||||||||||||||||||||||||||||||||
1 International Financial Reporting Standards (IFRS). 2 Generally, treasury shares are fully deducted from equity under IFRS, whereas for capital adequacy purposes only the following positions in own shares are deducted: i) net long position in own shares held for trading purposes; ii) own shares bought for cancellation (second trading line) and for unvested or upcoming share awards; and iii) other treasury share positions net of delta-weighted obligations out of employee stock options granted prior to August 2006, subject to an interim agreement with the Swiss Financial Market Supervisory Authority. 3 Under IFRS, the recognition of the MCNs to the Swiss Confederation reduced the share premium CHF 3.6 billion and increased retained earnings CHF 0.7 billion. 4 “Other Basel II deduction items” includes primarily 50% of the deductions for net long position of non-consolidated participations in the finance sector, first loss positions from securitization exposures, excess of expected losses above general provisions (AIRB), expected loss for equities (simple risk weight method). 5 Equals to goodwill and the intangible assets exceeding 4% of tier 1 capital. | ||||||||||||||||||||||||||||||||||
166
Table of Contents
Risk and treasury management |
expectations of the business’s clients and the business environment, including allowing for sufficient capital to support the business’s underlying risks and sustain extreme stress scenarios. The amount of equity attributed to all the businesses corresponds to the amount that UBS believes is required to maintain a strong capital base and support its businesses adequately. If the total equity attributed to the businesses differs from the Group’s actual equity during a particular period, the surplus or deficit is shown in the Corporate Center.
| Average equity attributed | ||||||||||||||||||||
| CHF billion | 2008 | 4Q08 | 3Q08 | 2Q08 | 1Q08 | |||||||||||||||
| Wealth Management International & Switzerland | 6.1 | 6.0 | 5.9 | 6.2 | 6.3 | |||||||||||||||
| Wealth Management US | 7.3 | 8.3 | 7.6 | 6.8 | 6.6 | |||||||||||||||
| Business Banking Switzerland | 3.8 | 3.7 | 3.5 | 4.0 | 4.1 | |||||||||||||||
| Global Wealth Management & Business Banking | 17.3 | 18.0 | 17.0 | 17.0 | 17.0 | |||||||||||||||
| Global Asset Management | 3.0 | 3.0 | 3.0 | 3.0 | 3.0 | |||||||||||||||
| Investment Bank | 26.8 | 26.0 | 26.0 | 27.0 | 28.0 | |||||||||||||||
| Corporate Center | (10.7 | ) | (7.4 | ) | 0.2 | (15.0 | ) | (20.5 | ) | |||||||||||
Equity attributable to UBS shareholders | 36.3 | 39.6 | 46.2 | 32.0 | 27.5 | |||||||||||||||
167
Table of Contents
Risk and treasury management
Treasury management
Shares and capital instruments
Shares
UBS shares and tier 1 capital
The majority of UBS’s tier 1 capital comprises share premium and retained earnings attributed to UBS shareholders. As of 31 December 2008, total IFRS equity attributable to UBS shareholders amounted to CHF 32,800 million and was represented by a total of 2,932,580,549 issued UBS shares, of which 61,903,121 (2.1%) were held by UBS. Each outstanding share has a par value of CHF 0.10 and entitles the holder to one vote at the shareholders’ meeting and to a proportionate share of the dividend that is distributed. There are no preferential rights for shareholders and no other classes of shares are issued by the parent bank (UBS AG) directly.
| Shares | ||||
| For the year ended | ||||
| Number of shares | 31.12.08 | |||
Balance at the beginning of the year | 2,073,547,344 | |||
| Issue of shares for stock dividend | 98,698,754 | |||
| Issue of shares for capital increase (rights offering) | 760,295,181 | |||
| Issue of shares for employee options | 39,270 | |||
Balance at the end of the year | 2,932,580,549 | |||
| Shareholder-approved issuance of shares | ||||||||||||
| Maximum number | Year approved by | % of shares issued | ||||||||||
| of shares to be | shareholder | (including MCNs1) | ||||||||||
| issued | general meeting | 31.12.08 | ||||||||||
Authorized capital | ||||||||||||
| Stock dividend 2007 (not used) | 5,001,246 | 2008 | 13.99 | |||||||||
Conditional capital | ||||||||||||
| March 2008 MCNs | 277,750,000 | 2008 | 7.77 | |||||||||
| December 2008 MCNs | 365,000,000 | 2008 | 10.21 | |||||||||
| Employee equity participation plans of UBS AG | 149,994,296 | 2006 | 4.20 | |||||||||
| Employee stock ownership plan of former PaineWebber | 100,415 | 2000 | 0.00 | |||||||||
168
Table of Contents
Risk and treasury management |
Holding of UBS shares
UBS holds its own shares for three main purposes: Group Treasury holds shares to cover employee share and option programs; it repurchases shares on a second trading line, where they are earmarked for cancellation purposes (the latter activity is temporarily suspended); and the Investment Bank holds shares, to a limited extent, for trading purposes where it engages in market-making activities in UBS shares and related derivative products.
Treasury shares held by the Investment Bank
The Investment Bank, acting as liquidity provider to the equity index futures market and as a market maker in UBS shares and derivatives, has issued derivatives linked to UBS stock. Most of these instruments are classified as cash-settled derivatives and are held for trading purposes only. To hedge the economic exposure, a limited number of UBS shares are held by the Investment Bank.
| Share buy-back programs | ||||||||||||||||||||||||||||||||||||||||||||
| Maximum | Unutilized | |||||||||||||||||||||||||||||||||||||||||||
| Maximum | volume | Average | Unutilized | volume | ||||||||||||||||||||||||||||||||||||||||
| volume (in | (in millions | Amount | Total shares | price | volume | (in millions | ||||||||||||||||||||||||||||||||||||||
| Program | Announcement | Beginning | Expiration | Cancellation | CHF billion) | of shares) | (CHF billion) | purchased | (in CHF) | (CHF billion) | of shares) | |||||||||||||||||||||||||||||||||
| 2000/2001 | 14.12.99 | 17.1.00 | 2.3.01 | 13.7.01 | 4.0 | 4.0 | 110,530,698 | 1,2 | 36.18 | 1, 2 | 0 | |||||||||||||||||||||||||||||||||
| 2001/2002 | 22.2.01 | 5.3.01 | 5.3.02 | 5.7.02 | 5.0 | 2.3 | 57,637,380 | 2 | 39.73 | 2 | 2.7 | |||||||||||||||||||||||||||||||||
| 2002/2003 | 14.2.01 | 6.3.02 | 8.10.02 | 10.7.03 | 5.0 | 5.0 | 135,400,000 | 2 | 36.92 | 2 | 0 | |||||||||||||||||||||||||||||||||
| 2002/2003 | 9.10.02 | 11.10.02 | 5.3.03 | 10.7.03 | 3.0 | 0.5 | 16,540,160 | 2 | 32.04 | 2 | 2.5 | |||||||||||||||||||||||||||||||||
| 2003/2004 | 18.2.03 | 6.3.03 | 5.3.04 | 30.6.04 | 5.0 | 4.5 | 118,964,000 | 2 | 37.97 | 2 | 0.5 | |||||||||||||||||||||||||||||||||
| 2004/2005 | 10.2.04 | 8.3.04 | 7.3.05 | 8.7.05 | 6.0 | 3.5 | 79,870,188 | 2 | 44.36 | 2 | 2.5 | |||||||||||||||||||||||||||||||||
| 2005/2006 | 8.2.05 | 8.3.05 | 7.3.06 | 13.7.06 | 5.0 | 4.0 | 74,200,000 | 2 | 54.26 | 2 | 1.0 | |||||||||||||||||||||||||||||||||
| 2006/2007 | 14.2.06 | 8.3.06 | 7.3.07 | 29.6.07 | 5.0 | 2.4 | 33,020,000 | 2 | 73.14 | 2 | 2.6 | |||||||||||||||||||||||||||||||||
| 2007/20105 | 13.2.07 | 8.3.07 | 8.3.10 | 210.5 | 3 | 2.6 | 4 | 36,400,000 | 4 | 71.41 | 4 | 174.1 | 3 | |||||||||||||||||||||||||||||||
169
Table of Contents
Risk and treasury management
Treasury management
Capital instruments
Mandatory convertible notes
As part of the measures taken to strengthen its capital base in 2008, UBS issued two mandatory convertible notes (MCNs), with principal amounts of CHF 13 billion (MCN1) and CHF 6 billion (MCN2) respectively, in private placements to large institutional investors and the Swiss Confederation. To allow for the delivery of shares upon conversion of the MCNs, separate extraordinary general meetings of UBS shareholders were held on 27 February and 27 November 2008 to approve the creation of conditional capital for this purpose. The shareholders approved a maximum number of 277.8 million UBS shares to be delivered under the first issued MCN and 365 million UBS shares to be delivered under the second MCN. The initial investors in the MCNs are allowed to sell or transfer the instruments without restrictions to other investors. The share capital will be increased upon voluntary or mandatory conversion of the MCNs. The future mandatory capital increase allows the full proceeds to be counted as tier 1 capital for regulatory capital purposes from the date of issuance.
Hybrid tier 1 capital
Hybrid tier 1 instruments represent innovative and non-innovative perpetual instruments and made up approximately 21.4% of adjusted core capital on 31 December 2008. They are accounted for under minority interests in the IFRS equity. In 2008, UBS raised EUR 1 billion of capital preferred securities issued by UBS Capital Securities (Jersey) Ltd. The instrument bears an 8.836% coupon and is callable in 2013. As of 31 December 2008, UBS had issued a total of CHF 7,393 million of such instruments in various currencies. Hybrid tier 1 instruments are perpetual instruments which can only be redeemed if they are called by the issuer. If such a call is not exercised at the respective call date, the terms might include a change from fixed to floating coupon payments and, in the case of innovative instruments only, a limited step-up of the interest rate. Non-innovative instruments do not have a step-up of the interest rate and are therefore viewed as having a higher equity characteristic for regulatory capital purposes. The instruments are issued either through trusts or subsidiaries of UBS and rank senior to UBS shares in dissolution. Payments under the instruments are subject to adherence to minimum capital ratios by UBS. Any payment missed is non-cumulative.
Tier 2 capital
The major element in tier 2 capital consists of subordinated long-term debt. Tier 2 instruments have been issued in various currencies and with a range of maturities across capital markets globally. They accounted for CHF 12,290 million in total capital as of year-end 2008. Tier 2 instruments rank senior to both UBS shares and to hybrid tier 1 instruments but are subordinated to all senior obligations of UBS.
Distributions to shareholders
The decision whether to pay a dividend and the level of the dividend are dependent on UBS’s targeted capital ratios and its cash flow generation. The decision on dividend payments is proposed by the Board of Directors (BoD) to the shareholders and is subject to their approval at the annual general meeting. The BoD has decided not to propose any dividend for the financial year 2008.
Distribution to shareholders in 2008 – stock dividend
At the extraordinary general meeting of 27 February 2008, the shareholders approved distribution of a stock dividend offering the opportunity to obtain sale proceeds comparable with the cash dividend paid in previous years. One entitle-
170
Table of Contents
Risk and treasury management |
Conversion price and number of shares
| Amount | Conversion price per | Conversion into | ||||||||||||||||||||||||||
| Coupon | (CHF billion) | Issuance date | Conversion period / maturity | UBS share (CHF) | numbers of UBS shares | |||||||||||||||||||||||
MCN 1 | 9 | % | 13.0 | 5.3.08 | 6.9.08 | 5.3.10 | 48.071 | 270,438,942 | ||||||||||||||||||||
MCN 2 | 12.50 | % | 6.0 | 9.12.08 | 9.6.09 | 9.6.11 | 18.212 | 329,447,681 | ||||||||||||||||||||
| 21.312 | 281,579,096 | |||||||||||||||||||||||||||
| additional shares | ||||||||||||||||||||||||||||
| if above 21.31 | 3 | |||||||||||||||||||||||||||
Number of shares to be delivered
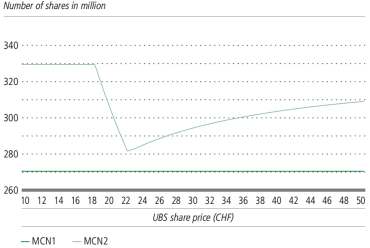
Number of shares to be delivered
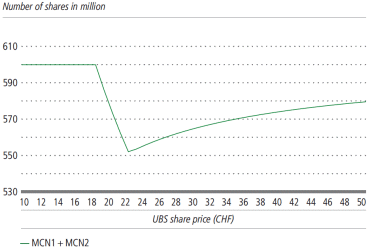
Value of shares

Value of shares
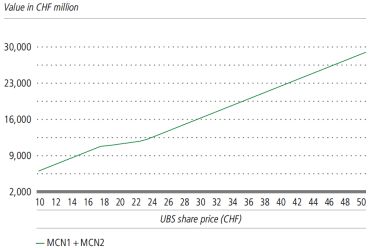
171
Table of Contents
Risk and treasury management
Treasury management
UBS shares in 2008
UBS share price versus Dow Jones Banks Titans 30 Index
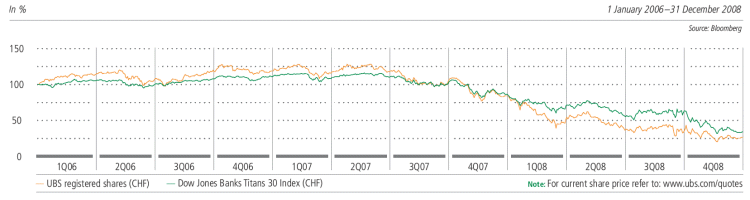
UBS shares are listed on the SIX Swiss Exchange (traded on SWX Europe), the New York Stock Exchange and the Tokyo Stock Exchange.
| è | Refer to the “Capital structure” section of this report for more information on UBS shares including par value, type and rights of security |
nearly collapsed in the second part of the year. Capital injections, the partial or full nationalization of several financial institutions and sharp reductions in interest rates did not, however, restore confidence and liquidity in the short term and credit markets remained paralyzed for most of 2008. Emerging markets suffered and commodities prices saw a sharp reversal and falling prices in the second half of 2008.
Market capitalization
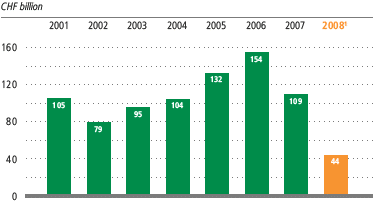
| Ticker symbols | ||||||
Trading exchange | Bloomberg | Reuters | ||||
| SWX Europe | UBSN VX | UBSN.VX | ||||
| New York Stock Exchange | UBS US | UBS.N | ||||
| Tokyo Stock Exchange | 8657 JP | 8657.T | ||||
| Security identification codes | ||||||
| ISIN | CH0024899483 | |||||
| Valoren | 2.489.948 | |||||
| Cusip | CINS H89231 33 8 | |||||
172
Table of Contents
Risk and treasury management |
First quarter 2008
2008 continued in the same vein as the closing months of 2007, with growing concerns over contagion from real estate losses to the real economy. At the end of January, UBS pre-announced its fourth quarter 2007 results as a loss of CHF 12.5 billion. In March, UBS’s peer Bear Stearns approached bankruptcy as it suffered a liquidity crisis in the wake of speculation over growing losses. This put further pressure on industry stock prices as the quarter ended. The global banking sector and the broader global indices declined by 13% and 10% respectively, while UBS underperformed the market with its shares declining 45%.
Second quarter 2008
The Bear Stearns bankruptcy and acquisition by JPMorgan announced in March proved somewhat purgative for the markets in the second quarter, which remained steady as expectations of a deep global recession were tempered. In the banking sector, however, reported losses mounted leading to capital-raising by a number of large international banks including UBS. Alongside the pre-anouncement of the first quarter results, a rights issue to raise approximately CHF 15 billion was announced together with a number of measures to reduce risks and costs and stabilize performance. UBS performed in line with the global banking sector, down 16% in the quarter while the broader indices remained generally flat.
Third quarter 2008
The third quarter of 2008 proved to be one of the most tumultuous in banking history. The collapse of Lehman Brothers in September triggered a series of banking failures and government rescues which brought the global banking system close to breaking point. Despite posting modest losses for the second quarter in August, UBS shares declined 14% in the quarter and underperformed the global banking sector, down 2% in the wake of the failure of Lehman Brothers.
Fourth quarter 2008
The fourth quarter commenced with persistent concerted efforts by central banks to maintain liquidity and, shortly afterwards, a series of government-led programs to stabilize the banking system. As the prospect of a deep global recession loomed, central banks united to deliver their first ever coordinated rate cut. UBS announced a further material risk reduction of its balance sheet through the transfer of risk assets to the Swiss National Bank as well as further strengthening its capital base through the issue of CHF 6 billion in mandatory convertible notes to the Swiss Confederation. UBS reported a modest profit for the third quarter. Market volatility remained extreme with a slew of profit warnings and losses reported across the banking sector. UBS shares closed the quarter down 20%, outperforming the global banking sector which fell 41% as well as the broader indices which declined by more than 20% on average.
Share liquidity
During 2008, daily average volume in UBS shares on SWX Europe was 28.5 million shares. On the New York Stock Exchange (NYSE), it was 2.1 million shares.
173
Table of Contents
Risk and treasury management
Treasury management
| UBS share data | |||||||||||||
| As of | |||||||||||||
| Registered shares | 31.12.08 | 31.12.07 | 31.12.06 | ||||||||||
| Total ordinary shares issued | 2,932,580,549 | 2,073,547,344 | 2,105,273,286 | ||||||||||
| Treasury shares | 61,903,121 | 158,105,524 | 164,475,699 | ||||||||||
Weighted average shares (for basic EPS1 calculations) | 2,769,575,922 | 2,165,301,597 | 2,221,591,786 | ||||||||||
| Weighted average shares (for diluted EPS calculations) | 2,770,727,478 | 2,166,768,923 | 2,309,834,516 | ||||||||||
| For the year ended | ||||||||||||
| CHF | 31.12.08 | 31.12.07 | 31.12.06 | |||||||||
EPS | ||||||||||||
| Basic EPS | (7.54 | ) | (2.42 | ) | 5.19 | |||||||
| Basic EPS from continuing operations | (7.60 | ) | (2.61 | ) | 4.83 | |||||||
| Diluted EPS | (7.55 | ) | (2.43 | ) | 4.99 | |||||||
| Diluted EPS from continuing operations | (7.60 | ) | (2.61 | ) | 4.64 | |||||||
| UBS shares and market capitalization | ||||||||||||||||
| As of | % change from | |||||||||||||||
| 31.12.08 | 31.12.07 | 31.12.06 | 31.12.07 | |||||||||||||
Share price (CHF)1 | 14.84 | 46.60 | 65.86 | (68 | ) | |||||||||||
Market capitalization (CHF million)2 | 43,519 | 108,654 | 154,222 | (60 | ) | |||||||||||
Source: Bloomberg
| Trading volumes | ||||||||||||
| For the year ended | ||||||||||||
| 1000 shares | 31.12.08 | 31.12.07 | 31.12.06 | |||||||||
| SWX total (SWX Europe) | 7,174,486 | 4,079,863 | 2,731,841 | |||||||||
| SWX daily average (SWX Europe) | 28,584 | 16,451 | 10,884 | |||||||||
| NYSE total | 539,856 | 304,446 | 214,912 | |||||||||
| NYSE daily average | 2,134 | 1,213 | 853 | |||||||||
| Source: Reuters | ||||||||||||
Source: Reuters
174
Table of Contents
Risk and treasury management |
| Stock exchange prices1 | ||||||||||||||||||||||||
| SIX Swiss Exchange | New York Stock Exchange | |||||||||||||||||||||||
| High (CHF) | Low (CHF) | Period end (CHF) | High (USD) | Low (USD) | Period end (USD) | |||||||||||||||||||
2008 | 45.98 | 10.67 | 14.84 | 46.40 | 8.33 | 14.30 | ||||||||||||||||||
Fourth quarter 2008 | 24.00 | 10.67 | 14.84 | 21.30 | 8.33 | 14.30 | ||||||||||||||||||
| December | 16.28 | 12.63 | 14.84 | 14.30 | 10.89 | 14.30 | ||||||||||||||||||
| November | 19.90 | 10.67 | 15.15 | 17.85 | 8.33 | 12.74 | ||||||||||||||||||
| October | 24.00 | 14.20 | 19.35 | 21.30 | 12.28 | 16.90 | ||||||||||||||||||
Third quarter 2008 | 25.76 | 15.18 | 18.46 | 23.07 | 12.22 | 17.54 | ||||||||||||||||||
| September | 25.76 | 15.18 | 18.46 | 22.59 | 12.22 | 17.54 | ||||||||||||||||||
| August | 24.40 | 19.43 | 24.14 | 22.17 | 18.62 | 21.89 | ||||||||||||||||||
| July | 24.44 | 17.52 | 20.38 | 23.07 | 17.90 | 19.39 | ||||||||||||||||||
Second quarter 2008 | 35.11 | 20.96 | 21.44 | 36.02 | 20.41 | 20.66 | ||||||||||||||||||
| June | 27.14 | 20.96 | 21.44 | 25.72 | 20.41 | 20.66 | ||||||||||||||||||
| May | 35.11 | 24.60 | 25.10 | 35.21 | 23.58 | 23.66 | ||||||||||||||||||
| April | 34.48 | 25.44 | 32.68 | 36.02 | 30.87 | 33.59 | ||||||||||||||||||
First quarter 2008 | 45.98 | 21.52 | 25.67 | 46.40 | 22.33 | 28.80 | ||||||||||||||||||
| March | 30.65 | 21.52 | 25.67 | 32.24 | 22.33 | 28.80 | ||||||||||||||||||
| February | 41.16 | 30.10 | 30.56 | 42.42 | 32.20 | 32.34 | ||||||||||||||||||
| January | 45.98 | 33.65 | 39.42 | 46.40 | 38.05 | 41.29 | ||||||||||||||||||
2007 | 71.95 | 42.69 | 46.60 | 66.26 | 43.50 | 46.00 | ||||||||||||||||||
| Fourth quarter 2007 | 61.05 | 42.69 | 46.60 | 58.01 | 43.50 | 46.00 | ||||||||||||||||||
| Third quarter 2007 | 66.88 | 53.67 | 55.67 | 62.34 | 49.84 | 53.25 | ||||||||||||||||||
| Second quarter 2007 | 71.55 | 63.72 | 65.46 | 66.26 | 58.73 | 60.01 | ||||||||||||||||||
| First quarter 2007 | 71.95 | 59.76 | 64.21 | 64.30 | 55.40 | 59.43 | ||||||||||||||||||
2006 | 71.06 | 53.23 | 65.86 | 63.39 | 48.34 | 60.33 | ||||||||||||||||||
| Fourth quarter 2006 | 71.06 | 62.88 | 65.86 | 63.39 | 58.50 | 60.33 | ||||||||||||||||||
| Third quarter 2006 | 66.52 | 53.23 | 66.52 | 59.77 | 48.34 | 59.31 | ||||||||||||||||||
| Second quarter 2006 | 66.97 | 54.31 | 59.32 | 61.70 | 49.36 | 54.85 | ||||||||||||||||||
| First quarter 2006 | 64.05 | 55.60 | 63.39 | 55.55 | 48.66 | 54.99 | ||||||||||||||||||
2005 | 56.39 | 41.19 | 55.38 | 49.30 | 38.47 | 47.58 | ||||||||||||||||||
| Fourth quarter 2005 | 56.39 | 46.52 | 55.38 | 49.30 | 40.73 | 47.58 | ||||||||||||||||||
| Third quarter 2005 | 49.84 | 43.60 | 48.69 | 43.49 | 38.55 | 42.75 | ||||||||||||||||||
| Second quarter 2005 | 45.68 | 41.37 | 44.27 | 43.06 | 38.47 | 38.93 | ||||||||||||||||||
| First quarter 2005 | 46.70 | 41.19 | 44.71 | 45.10 | 39.61 | 42.20 | ||||||||||||||||||
2004 | 43.76 | 35.52 | 42.21 | 42.29 | 32.31 | 41.92 | ||||||||||||||||||
| Fourth quarter 2004 | 42.81 | 37.09 | 42.21 | 42.29 | 34.94 | 41.92 | ||||||||||||||||||
| Third quarter 2004 | 40.68 | 35.52 | 38.91 | 36.28 | 32.31 | 35.17 | ||||||||||||||||||
| Second quarter 2004 | 43.76 | 39.06 | 39.06 | 38.09 | 34.05 | 35.53 | ||||||||||||||||||
| First quarter 2004 | 43.14 | 37.40 | 41.65 | 39.70 | 33.35 | 37.25 | ||||||||||||||||||
175
Table of Contents
Risk and treasury management
Basel II Pillar 3
Basel II Pillar 3
UBS publishes Basel II Pillar 3 disclosures on a semi-annual basis. Year-end disclosures are contained within this report. Disclosure elements not covered in the “Risk management and control” and “Treasury management” sections are shown below.
Introduction
On 1 January 2008, UBS adopted the revised capital framework of the Basel Committee on Banking Supervision – Basel II – which introduced new and amended capital requirements for the different risk types and revised the calculation of eligible capital.
This section presents UBS’s Basel II Pillar 3 disclosures as of 31 December 2008 and consists mainly of quantitative disclosures complemented with explanatory text where needed.
| è | Qualitative disclosures related to the bank’s risk management and control, definitions and risk exposures as well as capital management can be found in the “Risk management and control” and “Treasury management” sections of this report |
Overview of disclosures
The following table provides an overview of UBS’s Basel II Pillar 3 disclosures:
| Basel II Pillar 3 requirement | Disclosure in the annual report | ||||
| Capital structure | “Capital management” section of this report | ||||
| Capital adequacy | “Capital management” and “Basel II Pillar 3” sections of this report | ||||
| Risk management objectives, policies and methodologies (qualitative disclosures) | “Risk management and control” section of this report | ||||
| Credit risk | “Basel II Pillar 3” section of this report | ||||
| Investment positions | “Basel II Pillar 3” section of this report | ||||
| Market risk | “Risk management and control” section of this report | ||||
| Securitization | “Basel II Pillar 3” section of this report | ||||
| Operational risk | “Risk management and control” section of this report | ||||
General description of risk exposure measures and capital requirements
Measures of risk exposure may differ depending on the purpose for which exposures are calculated: financial accounting under International Financial Reporting Standards (IFRS) determination of regulatory capital, or UBS’s internal management. UBS’s Basel II Pillar 3 disclosures are based on the measures of risk exposure that are used to calculate the regulatory capital that is required to underpin those risks.
176
Table of Contents
Risk and treasury management |
| Detailed segmentation of required capital | ||||||||||||
| Basel II | ||||||||||||
| 31.12.08 | ||||||||||||
| CHF million | Advanced | Standardized | Total | |||||||||
| Credit risk | 156,187 | 1 | 52,309 | 2 | 208,496 | |||||||
| Sovereigns | 9,393 | 803 | 10,196 | |||||||||
| Banks | 23,924 | 4,286 | 28,209 | |||||||||
| Corporates | 104,180 | 43,882 | 3 | 148,062 | ||||||||
| Residential mortgages | 13,150 | 1,499 | 14,650 | |||||||||
| Other retail | 5,510 | 1,833 | 7,342 | |||||||||
| Failed trades from non-delivery-versus-payment (non-DvP) transactions | 30 | 7 | 37 | |||||||||
| Securitization exposures | 6,202 | 6,202 | ||||||||||
| Non-counterparty related risk | 7,411 | 7,411 | ||||||||||
| Equity exposures outside trading book | 7,646 | 4 | 7,646 | |||||||||
| Settlement risk | 219 | 219 | ||||||||||
| Market risk | 27,614 | 5 | 27,614 | |||||||||
| Operational risk | 44,685 | 6 | 44,685 | |||||||||
Total BIS risk weighted assets | 242,334 | 59,939 | 302,273 | |||||||||
Additional risk-weighted assets according to FINMA regulations7 | 32,620 | |||||||||||
Total FINMA8 risk weighted assets | 334,893 | 9 | ||||||||||
weights based on external ratings. Non-counterparty related assets such as UBS premises, other properties and equipment require capital underpinning according to prescribed regulatory risk weights.
Additional capital management disclosures
Although UBS determines published risk-weighted assets (RWA) according to the Basel II Capital Accord (BIS guide-
lines), the calculation of UBS’s regulatory capital requirement is based on the regulations of FINMA, leading to higher RWA.
| – | Real estate and commercial companies as well as collective investment schemes are not consolidated for regulatory capital purposes but are risk-weighted. |
| – | Insurance companies are not consolidated for regulatory capital purposes but are deducted from capital. |
| – | Securitization vehicles are not consolidated for regulatory capital purposes but are treated under the securitization framework. |
| – | Joint ventures that are controlled by two ventures are fully consolidated for regulatory capital purposes, whereas they are valued under equity method accounting for IFRS. |
177
Table of Contents
Risk and treasury management
Basel II Pillar 3
Credit risk
UBS’s Pillar 3 disclosure presents the details on the parameters and input data used in its regulatory capital calculation. Although the parameters applied under the advanced IRB approach are generally determined using the same methodologies, data and systems as UBS uses for internal risk quantification, there are nevertheless several differences due to regulatory floors, multipliers, eligibility criteria and exposure definitions that cause the figures presented in this section to deviate from the information disclosed within the “Risk management and control” section of this report. The regulatory capital calculation of credit risk exposure also differs from that required under IFRS.
| Derivation of risk-weighted assets | ||||||||||||||||||||
| Average regulatory | Risk-weighted | |||||||||||||||||||
| Exposure | risk-weighting2 | assets3 | ||||||||||||||||||
| Less: regulatory | ||||||||||||||||||||
| Regulatory gross | credit risk offsets | Regulatory net | ||||||||||||||||||
| CHF million | credit exposure | and adjustments1 | credit exposure | |||||||||||||||||
| Cash and balances with central banks | 22,872 | (70 | ) | 22,802 | 6 | % | 1,349 | |||||||||||||
| Due from banks | 33,884 | (5,125 | ) | 28,759 | 25 | % | 7,066 | |||||||||||||
| Loans | 295,395 | (21,117 | ) | 274,278 | 24 | % | 66,547 | |||||||||||||
| Financial assets designated at fair value | 11,803 | (6,153 | ) | 5,649 | 20 | % | 1,123 | |||||||||||||
Off-balance sheet4 | 45,589 | (581 | ) | 45,008 | 34 | % | 15,105 | |||||||||||||
Banking products | 409,542 | (33,046 | ) | 376,496 | 24 | % | 91,191 | |||||||||||||
| Derivatives | 190,047 | 190,047 | 42 | % | 79,663 | |||||||||||||||
| Securities financing | 63,825 | 63,825 | 16 | % | 10,404 | |||||||||||||||
Traded products | 253,872 | 253,872 | 35 | % | 90,067 | |||||||||||||||
| Trading portfolio assets | 32,916 | (68 | ) | 32,848 | 40 | % | 13,255 | |||||||||||||
Financial investments available-for-sale5 | 3,027 | 3,027 | 15 | % | 467 | |||||||||||||||
| Accrued income and prepaid expenses | 5,011 | 26 | 5,036 | 93 | % | 4,665 | ||||||||||||||
| Other assets | 10,696 | (28 | ) | 10,668 | 82 | % | 8,814 | |||||||||||||
Other products | 51,650 | (70 | ) | 51,579 | 53 | % | 27,201 | |||||||||||||
Total 31.12.08 | 715,064 | (33,116 | ) | 681,947 | 31 | % | 208,459 | |||||||||||||
178
Table of Contents
Risk and treasury management |
ing products in that cash balances in margin accounts are not offset with the corresponding traded products exposures. This section also presents information on impaired and defaulted assets in a segmentation which is consistent with the regulatory capital calculation.
| Regulatory gross credit exposure by geographical region | ||||||||||||||||||||||||||||||||
| Africa / | Total regulatory | |||||||||||||||||||||||||||||||
| Switzer- | Other | North | Latin | Asia / | Middle | gross credit | Total regulatory | |||||||||||||||||||||||||
| CHF million | land | Europe | America1 | America | Pacific | East | exposure | net exposure | ||||||||||||||||||||||||
| Cash and balances with central banks | 6,015 | 8,957 | 2,309 | 35 | 5,555 | 22,872 | 22,802 | |||||||||||||||||||||||||
| Due from banks | 898 | 15,253 | 12,512 | 126 | 4,648 | 448 | 33,884 | 28,759 | ||||||||||||||||||||||||
| Loans | 163,351 | 31,579 | 76,661 | 5,312 | 15,251 | 3,242 | 295,395 | 274,278 | ||||||||||||||||||||||||
| Financial assets designated at fair value | 73 | 2,317 | 9,144 | 24 | 219 | 25 | 11,803 | 5,649 | ||||||||||||||||||||||||
| Off-balance sheet | 6,000 | 10,533 | 25,791 | 905 | 1,884 | 475 | 45,589 | 45,008 | ||||||||||||||||||||||||
Banking products | 176,337 | 68,639 | 126,417 | 6,402 | 27,556 | 4,190 | 409,542 | 376,496 | ||||||||||||||||||||||||
| Derivatives | 10,659 | 79,629 | 80,127 | 1,468 | 15,423 | 2,740 | 190,047 | 190,047 | ||||||||||||||||||||||||
| Securities financing | 16,645 | 18,033 | 26,030 | 124 | 2,931 | 62 | 63,825 | 63,825 | ||||||||||||||||||||||||
Traded products | 27,304 | 97,662 | 106,157 | 1,592 | 18,354 | 2,803 | 253,872 | 253,872 | ||||||||||||||||||||||||
| Trading portfolio assets | 48 | 12,485 | 17,977 | 658 | 1,542 | 206 | 32,916 | 32,848 | ||||||||||||||||||||||||
| Financial investments available-for-sale 2 | 30 | 2,226 | 570 | 8 | 3 | 190 | 3,027 | 3,027 | ||||||||||||||||||||||||
| Accrued income and prepaid expenses | 464 | 1,429 | 2,797 | 82 | 218 | 20 | 5,011 | 5,036 | ||||||||||||||||||||||||
| Other assets | 4,593 | 1,852 | 3,736 | 145 | 363 | 6 | 10,696 | 10,668 | ||||||||||||||||||||||||
Other products | 5,135 | 17,992 | 25,080 | 893 | 2,126 | 422 | 51,650 | 51,579 | ||||||||||||||||||||||||
Total regulatory gross credit exposure 31.12.08 | 208,777 | 184,294 | 257,654 | 8,887 | 48,037 | 7,415 | 715,064 | 681,947 | ||||||||||||||||||||||||
| Regulatory gross credit exposure by counterparty type | ||||||||||||||||||||||||
| Public entities | ||||||||||||||||||||||||
| (including | Banks and | Total regulatory | ||||||||||||||||||||||
| sovereigns and | multilateral | gross credit | Total regulatory | |||||||||||||||||||||
| CHF million | Private individuals | Corporates1 | central banks) | institutions | exposure | net exposure | ||||||||||||||||||
| Cash and balances with central banks | 22,402 | 470 | 22,872 | 22,802 | ||||||||||||||||||||
| Due from banks | 758 | 33,127 | 33,884 | 28,759 | ||||||||||||||||||||
| Loans | 157,265 | 129,701 | 8,430 | 295,395 | 274,278 | |||||||||||||||||||
| Financial assets designated at fair value | 6,484 | 29 | 5,290 | 11,803 | 5,649 | |||||||||||||||||||
| Off-balance sheet | 2,905 | 40,003 | 1,057 | 1,623 | 45,589 | 45,008 | ||||||||||||||||||
Banking products | 160,170 | 176,188 | 32,675 | 40,510 | 409,542 | 376,496 | ||||||||||||||||||
| Derivatives | 1,422 | 115,140 | 27,929 | 45,555 | 190,047 | 190,047 | ||||||||||||||||||
| Securities financing | 882 | 31,458 | 5,256 | 26,229 | 63,825 | 63,825 | ||||||||||||||||||
Traded products | 2,304 | 146,598 | 33,185 | 71,784 | 253,872 | 253,872 | ||||||||||||||||||
| Trading portfolio assets | 11,301 | 21,168 | 448 | 32,916 | 32,848 | |||||||||||||||||||
Financial investments available-for-sale2 | 5 | 536 | 2,304 | 181 | 3,027 | 3,027 | ||||||||||||||||||
| Accrued income and prepaid expenses | 742 | 4,033 | 30 | 205 | 5,011 | 5,036 | ||||||||||||||||||
| Other assets | 1,795 | 5,356 | 265 | 3,280 | 10,696 | 10,668 | ||||||||||||||||||
Other products | 2,542 | 21,226 | 23,767 | 4,114 | 51,650 | 51,579 | ||||||||||||||||||
Total regulatory gross credit exposure 31.12.08 | 165,016 | 344,012 | 89,627 | 116,408 | 715,064 | 681,947 | ||||||||||||||||||
179
Table of Contents
Risk and treasury management
Basel II Pillar 3
The “Regulatory gross credit exposure by geographical region” table on the previous page provides a breakdown of UBS’s portfolio by major types of credit exposure according to classes of financial instruments and also by geographical regions. The latter distribution is based on the legal domicile of the customer.
| – | Corporates: consists of all exposures that do not fit into any of the other exposure segments below. Mostly, it includes private commercial entities such as corporations, partnerships or proprietorships, insurance companies, funds, exchanges and clearing houses. | |
| – | Sovereigns (“Central governments and central banks” under Swiss and EU regulations): consists of exposures relating to sovereign states and their central banks, the Bank for International Settlement (BIS), the International |
| Monetary Fund (IMF), the European Union including the European Central Bank and eligible multilateral development banks (MDB). | ||
| – | Banks (“Institutions” under Swiss and EU regulations): consists of exposures towards banks, i. e. legal entities holding a banking license. It also includes those securities firms that are subject to supervisory and regulatory arrangements comparable to those applied to banks according to the Basel II Revised Framework, including, in particular, risk-based capital requirements. Basel II also defines this regulatory exposure segment such that it contains exposures to public sector entities with tax raising power or whose liabilities are fully guaranteed by a public entity. | |
| – | Residential mortgages (“Claims secured on residential real estate” under Swiss and EU regulations): consists of residential mortgages, regardless of exposure size, if the obligor owns and occupies or rents out the mortgaged property. | |
| – | Other retail: consists of exposures to small businesses, private clients and other retail customers without mortgage financing. Notably, this includes the lombard loan portfolio. |
180
Table of Contents
Risk and treasury management |
| Regulatory gross credit exposure by residual contractual maturity | ||||||||||||||||||||||||
| Total | Total | |||||||||||||||||||||||
| regulatory | regulatory | |||||||||||||||||||||||
| Due in | Due over | Due over | gross credit | net credit | ||||||||||||||||||||
| CHF million | 1 year or less | 1-5 years | 5 years | Other1 | exposure | exposure | ||||||||||||||||||
| Cash and balances with central banks | 22,872 | 22,872 | 22,802 | |||||||||||||||||||||
| Due from banks | 2,240 | 1,638 | 377 | 29,629 | 33,884 | 28,759 | ||||||||||||||||||
| Loans | 118,100 | 78,699 | 44,905 | 53,690 | 295,395 | 274,278 | ||||||||||||||||||
| Financial assets designated at fair value | 2,677 | 3,987 | 4,664 | 475 | 11,803 | 5,649 | ||||||||||||||||||
| Off-balance sheet | 10,541 | 32,112 | 1,859 | 1,077 | 45,589 | 45,008 | ||||||||||||||||||
Banking products | 133,559 | 116,436 | 51,805 | 107,743 | 409,542 | 376,496 | ||||||||||||||||||
| Derivatives | 73,386 | 47,130 | 69,412 | 120 | 190,047 | 190,047 | ||||||||||||||||||
| Securities financing | 17,511 | 8 | 719 | 45,586 | 63,825 | 63,825 | ||||||||||||||||||
Traded products | 90,897 | 47,138 | 70,131 | 45,706 | 253,872 | 253,872 | ||||||||||||||||||
| Trading portfolio assets | 21,051 | 7,891 | 3,043 | 931 | 32,916 | 32,848 | ||||||||||||||||||
Financial investments available-for-sale2 | 2,312 | 94 | 621 | 3,027 | 3,027 | |||||||||||||||||||
| Accrued income and prepaid expenses | 5,011 | 5,011 | 5,036 | |||||||||||||||||||||
| Other assets | 85 | 10,611 | 10,696 | 10,668 | ||||||||||||||||||||
Other products | 23,448 | 7,985 | 3,664 | 16,553 | 51,650 | 51,579 | ||||||||||||||||||
Total regulatory gross credit exposure 31.12.08 | 247,904 | 171,558 | 125,600 | 170,001 | 715,064 | 681,947 | ||||||||||||||||||
| Regulatory gross credit exposure covered by guarantees and credit derivatives | ||||||||||||
| Total regulatory | Of which: exposure | Of which: exposure | ||||||||||
| gross credit | covered by | covered by credit | ||||||||||
| CHF million | exposure | guarantees1 | derivatives | |||||||||
Exposure segment | ||||||||||||
| Corporates | 338,370 | 3,373 | 28,156 | |||||||||
| Sovereigns | 71,953 | 183 | 6 | |||||||||
| Banks | 121,776 | 563 | 206 | |||||||||
| Residential mortgages | 118,703 | 13 | ||||||||||
| Other retail | 64,262 | 169 | ||||||||||
Total regulatory gross credit exposure 31.12.08 | 715,064 | 4,302 | 28,368 | |||||||||
| Derivation of regulatory net credit exposure | ||||||||||||
| Advanced IRB1 | Standardized | Total | ||||||||||
| CHF million | approach | approach | 31.12.08 | |||||||||
Total regulatory gross credit exposure | 618,333 | 96,731 | 715,064 | |||||||||
Less: regulatory credit risk offsets and adjustments2 | (26,226 | ) | (6,891 | ) | (33,116 | ) | ||||||
Total regulatory net credit exposure | 592,107 | 89,841 | 681,947 | |||||||||
| Breakdown of the regulatory net credit exposure by exposure segment | ||||||||||||
| Corporates | 237,704 | 48,618 | 286,321 | |||||||||
| Sovereigns | 45,270 | 24,818 | 70,089 | |||||||||
| Banks | 130,493 | 11,979 | 142,473 | |||||||||
| Residential mortgages | 116,539 | 2,001 | 118,540 | |||||||||
| Other retail | 62,101 | 2,424 | 64,525 | |||||||||
Total regulatory net credit exposure | 592,107 | 89,841 | 681,947 | |||||||||
181
Table of Contents
Risk and treasury management
Basel II Pillar 3
Advanced IRB approach
The upper part of the table “Advanced internal ratings-based approach: regulatory net credit exposure by UBS-internal rating” below provides a breakdown of the regulatory net credit exposure of UBS’s credit portfolio using the advanced IRB approach according to UBS-internal rating classes.
| Advanced internal ratings-based approach: regulatory net credit exposure by UBS-internal rating | ||||||||||||||||||||||||||||
| Total | ||||||||||||||||||||||||||||
| UBS-internal rating | regulatory | |||||||||||||||||||||||||||
| Investment grade | Sub-investment grade | Defaulted1 | net credit | |||||||||||||||||||||||||
| exposure | ||||||||||||||||||||||||||||
| CHF million | 0/1 | 2/3 | 4/5 | 6–8 | 9–13 | 31.12.08 | ||||||||||||||||||||||
| Regulatory net credit exposure-weighted average PD | 0.011% | 0.064% | 0.269% | 0.929% | 5.376% | 0.484% | ||||||||||||||||||||||
Exposure segment | ||||||||||||||||||||||||||||
| Corporates | 19,978 | 102,563 | 47,706 | 43,562 | 17,694 | 6,202 | 237,704 | |||||||||||||||||||||
| Sovereigns | 30,321 | 14,730 | 86 | 88 | 37 | 8 | 45,270 | |||||||||||||||||||||
| Banks | 11,390 | 89,216 | 27,330 | 1,748 | 509 | 299 | 130,493 | |||||||||||||||||||||
| Residential mortgages | 3 | 6,803 | 51,922 | 52,723 | 4,883 | 206 | 116,539 | |||||||||||||||||||||
| Other retail | 47,797 | 7,039 | 4,529 | 1,807 | 928 | 62,101 | ||||||||||||||||||||||
Total 31.12.08 | 61,691 | 261,108 | 134,083 | 102,651 | 24,929 | 7,644 | 592,107 | |||||||||||||||||||||
| Advanced internal ratings-based approach: exposure-weighted average loss given default by UBS-internal rating | ||||||||||||||||||||||||
| UBS-internal rating | Regulatory net credit exposure-weighted | |||||||||||||||||||||||
| Investment grade | Sub-investment grade | average LGD1 (%) | ||||||||||||||||||||||
| CHF million | 0/1 | 2/3 | 4/5 | 6–8 | 9–13 | 31.12.08 | ||||||||||||||||||
| Regulatory net credit exposure-weighted average LGD (%) | ||||||||||||||||||||||||
| Corporates | 24 | 33 | 42 | 34 | 32 | 35 | ||||||||||||||||||
| Sovereigns | 26 | 61 | 36 | 37 | 20 | 37 | ||||||||||||||||||
| Banks | 22 | 25 | 32 | 36 | 15 | 26 | ||||||||||||||||||
| Residential mortgages | 10 | 10 | 10 | 11 | 11 | 11 | ||||||||||||||||||
| Other retail | 15 | 22 | 13 | 15 | 16 | |||||||||||||||||||
Average 31.12.08 | 25 | 28 | 26 | 21 | 26 | 26 | ||||||||||||||||||
| Advanced internal ratings-based approach: exposure-weighted average risk-weight by UBS-internal rating | ||||||||||||||||||||||||
| Regulatory net credit | ||||||||||||||||||||||||
| UBS-internal rating | exposure-weighted | |||||||||||||||||||||||
| Investment grade | Sub-investment grade | average risk-weight (%) | ||||||||||||||||||||||
| CHF million | 0/1 | 2/3 | 4/5 | 6–8 | 9–13 | 31.12.08 | ||||||||||||||||||
| Regulatory net credit exposure-weighted average risk-weight (%) | ||||||||||||||||||||||||
| Corporates | 11 | 14 | 53 | 61 | 108 | 39 | ||||||||||||||||||
| Sovereigns | 5 | 47 | 38 | 69 | 81 | 19 | ||||||||||||||||||
| Banks | 9 | 11 | 29 | 100 | 125 | 17 | ||||||||||||||||||
| Residential mortgages | 1 | 2 | 5 | 13 | 30 | 10 | ||||||||||||||||||
| Other retail | 3 | 15 | 16 | 30 | 8 | |||||||||||||||||||
Average 31.12.08 | 8 | 13 | 28 | 35 | 87 | 24 | ||||||||||||||||||
182
Table of Contents
Risk and treasury management |
Standardized approach
The standardized approach is generally applied where it is not possible – usually for technical reasons – to use the advanced IRB approach and/or where an exemption from the advanced IRB has been granted by FINMA. The standardized approach requires banks to use risk assessments prepared by External Credit Assessment Institutions (ECAI) or Export Credit Agencies to determine the risk weightings applied to rated counterparties.
| – | Central governments and central banks; | |
| – | Regional governments and local authorities; | |
| – | Multilateral development banks; | |
| – | Institutions; and | |
| – | Corporates. |
| Regulatory gross and net credit exposure by risk weight under the standardized approach1 | ||||||||||||||||||||||||
| Total exposure | ||||||||||||||||||||||||
| CHF million | 0% | >0%–35% | 36%–75% | 76%–100% | 150% | 31.12.08 | ||||||||||||||||||
Regulatory gross credit exposure | ||||||||||||||||||||||||
| Corporates | 6,538 | 671 | 44,840 | 1,602 | 53,651 | |||||||||||||||||||
| Sovereigns | 23,884 | 149 | 26 | 825 | 1 | 24,885 | ||||||||||||||||||
| Banks | 8,086 | 4,492 | 1,068 | 8 | 13,654 | |||||||||||||||||||
| Residential mortgages | 1,068 | 997 | 2,065 | |||||||||||||||||||||
| Other retail | 2,476 | 2,476 | ||||||||||||||||||||||
Total 31.12.08 | 23,884 | 14,773 | 8,732 | 47,731 | 1,612 | 96,731 | ||||||||||||||||||
Regulatory net credit exposure2 | ||||||||||||||||||||||||
| Corporates | 6,538 | 671 | 39,807 | 1,602 | 48,618 | |||||||||||||||||||
| Sovereigns | 23,884 | 149 | 26 | 758 | 1 | 24,818 | ||||||||||||||||||
| Banks | 7,478 | 3,425 | 1,068 | 8 | 11,979 | |||||||||||||||||||
| Residential mortgages | 1,004 | 997 | 2,001 | |||||||||||||||||||||
| Other retail | 2,424 | 2,424 | ||||||||||||||||||||||
Total 31.12.08 | 23,884 | 14,165 | 7,550 | 42,630 | 1,611 | 89,841 | ||||||||||||||||||
| Eligible financial collateral recognized under standardized approach | ||||||||
| Eligible financial collateral | ||||||||
| Regulatory net credit exposure | recognized in capital | |||||||
| CHF million | under standardized approach | calculation1 | ||||||
Exposure segment | ||||||||
| Corporates | 48,618 | 8,911 | ||||||
| Sovereigns | 24,818 | 1,148 | ||||||
| Banks | 11,979 | 5,942 | ||||||
| Residential mortgages | 2,001 | 64 | ||||||
| Other retail | 2,424 | 648 | ||||||
Total 31.12.08 | 89,841 | 16,713 | ||||||
183
Table of Contents
Risk and treasury management
Basel II Pillar 3
Impairment, default and credit loss
The “Impaired assets by geographical region” table below provides a breakdown of credit exposures arising from impaired assets and allowances/provisions by geographical region, based on the legal domicile of the customer. Impaired asset exposures include loans, off-balance sheet claims, securities financing transactions and derivative contracts.
| Impaired assets by geographical region | ||||||||||||||||||||||||
| Exposure net | Total | |||||||||||||||||||||||
| Specific | of specific | allowances, | ||||||||||||||||||||||
| allowances, | allowances, | provision and | ||||||||||||||||||||||
| provisions and | provisions and | Collective | specific credit | |||||||||||||||||||||
| Regulatory gross | credit valuation | credit valuation | allowances and | valuation | ||||||||||||||||||||
| CHF million | credit exposure | Impaired assets1 | adjustments | adjustments | provisions | adjustments | ||||||||||||||||||
| Switzerland | 208,777 | 1,534 | (849 | ) | 684 | (23 | ) | (873 | ) | |||||||||||||||
| Other Europe | 184,294 | 2,334 | (1,138 | ) | 1,196 | (1,138 | ) | |||||||||||||||||
North America2 | 257,654 | 10,053 | (4,808 | ) | 5,245 | (4,808 | ) | |||||||||||||||||
| Latin America | 8,887 | 206 | (56 | ) | 150 | (56 | ) | |||||||||||||||||
| Asia/Pacific | 48,037 | 1,387 | (361 | ) | 1,027 | (361 | ) | |||||||||||||||||
| Africa/Middle East | 7,415 | 145 | (41 | ) | 104 | (41 | ) | |||||||||||||||||
Total 31.12.08 | 715,064 | 15,658 | (7,252 | ) | 8,406 | (23 | ) | (7,275 | ) | |||||||||||||||
184
Table of Contents
Risk and treasury management |
| Impaired assets by exposure segment | ||||||||||||||||||||||||
| Total | ||||||||||||||||||||||||
| allowances, | ||||||||||||||||||||||||
| Specific | provisions | |||||||||||||||||||||||
| allowances, | and specific | |||||||||||||||||||||||
| provisions | Collective | credit | ||||||||||||||||||||||
| Regulatory | Of which | and credit | allowances | valuation | ||||||||||||||||||||
| gross credit | impaired | valuation | and | adjust- | ||||||||||||||||||||
| CHF million | exposure | assets1 | adjustments | provisions2 | ments2 | Write-offs3 | ||||||||||||||||||
| Corporates | 338,370 | 13,855 | (6,777 | ) | (6,777 | ) | (714 | ) | ||||||||||||||||
| Sovereigns | 71,953 | 16 | (12 | ) | (12 | ) | (2 | ) | ||||||||||||||||
| Banks | 121,776 | 139 | (20 | ) | (20 | ) | (122 | ) | ||||||||||||||||
| Residential mortgages | 118,703 | 352 | (103 | ) | (103 | ) | ||||||||||||||||||
| Other retail | 64,262 | 1,296 | (340 | ) | (340 | ) | (30 | ) | ||||||||||||||||
Not allocated segment4 | (23 | ) | (23 | ) | ||||||||||||||||||||
Total 31.12.08 | 715,064 | 15,658 | (7,252 | ) | (23 | ) | (7,275 | ) | (868 | ) | ||||||||||||||
| Changes in allowances, provisions and specific credit valuation adjustments | ||||||||||||||||||||
| Specific allowances | Total specific | |||||||||||||||||||
| and provisions for | Specific credit | allowances, | ||||||||||||||||||
| banking products | valuation | provisions and | Collective | |||||||||||||||||
| and securities | adjustments for | credit valuation | allowances and | |||||||||||||||||
| CHF million | financing | derivatives | adjustments | provisions2 | Total | |||||||||||||||
Balance at the beginning of 2008 | 1,130 | 818 | 1,948 | 34 | 1,981 | |||||||||||||||
| Write-offs | (868 | ) | (868 | ) | (868 | ) | ||||||||||||||
| Recoveries (on written-off positions) | 44 | 44 | 44 | |||||||||||||||||
Increase/(decrease) in credit loss allowances, provisions and specific credit valuation adjustments1 | 3,006 | 4,550 | 7,556 | (11 | ) | 7,545 | ||||||||||||||
| Foreign currency translations and other adjustments | (42 | ) | (825 | ) | (867 | ) | (867 | ) | ||||||||||||
| Transfers | (223 | ) | (337 | ) | (561 | ) | (561 | ) | ||||||||||||
Balance at year-end 2008 | 3,047 | 4,205 | 7,252 | 23 | 7,276 | |||||||||||||||
| Total credit loss at year-end 2008 | ||||||||||||
| Specific credit valuation | ||||||||||||
| adjustmens for | ||||||||||||
| CHF million | Credit loss expense | defaulted derivates | Total credit loss | |||||||||
Corporates1 | 2,564 | 4,117 | 6,681 | |||||||||
| Sovereigns | ||||||||||||
| Banks | 114 | 433 | 547 | |||||||||
| Residential mortgages | (1 | ) | (1 | ) | ||||||||
| Other retail | 342 | 342 | ||||||||||
Not specified2 | (24 | ) | (24 | ) | ||||||||
Total | 2,996 | 4,550 | 7,545 | |||||||||
185
Table of Contents
Risk and treasury management
Basel II Pillar 3
Other credit risk tables
| Credit exposure of derivative instruments | ||
| CHF million | 31.12.08 | |
| Gross positive replacement values | 860,943 | |
Netting benefits recognized1 | (651,756) | |
| Collateral held | (51,765) | |
Net current credit exposure | 157,422 | |
Regulatory net credit exposure (total counterparty credit risk)2 | 190,047 | |
of which treated with internal models (effective expected positive exposure (EPE))2 | 164,707 | |
of which treated with supervisory approaches (current exposure method)2 | 25,340 | |
Breakdown of the collateral held | ||
| Cash collateral | 46,967 | |
| Securities collateral and debt instruments collateral (excluding equity) | 4,246 | |
| Equity instruments collateral | 121 | |
| Other collateral | 430 | |
Total collateral held | 51,765 | |
| Credit derivatives | ||||||||||||||||||||||||||||
| Regulatory banking book | Regulatory trading book | Total | ||||||||||||||||||||||||||
| Protection | Protection | Protection | Protection | |||||||||||||||||||||||||
| Notional amounts, CHF million | bought | sold | Total | bought | sold | Total | 31.12.08 | |||||||||||||||||||||
| Credit default swaps | 26,297 | 1,030 | 27,326 | 2,120,407 | 1,469,723 | 3,590,130 | 3,617,457 | |||||||||||||||||||||
| Total return swaps | 1,166 | 1,166 | 15,060 | 7,819 | 22,879 | 24,044 | ||||||||||||||||||||||
Total 31.12.08 | 26,297 | 2,196 | 28,492 | 2,135,468 | 1,477,542 | 3,613,009 | 3,641,502 | |||||||||||||||||||||
186
Table of Contents
Risk and treasury management |
Investment positions
The “Equities disclosure for banking book positions” table below provides an overview of UBS equity investments held in the banking book for regulatory capital purposes. The calculation of equity investment exposure for financial accounting under IFRS differs from that required for regulatory capital purposes. The table illustrates these two measures of exposure as well as the key differences between them.
is used for regulatory capital purposes; (ii) positions that may be treated under a different framework for regulatory capital purposes, for example tradable assets treated under Market Risk VaR; and (iii) differences in the scope of consolidation for IFRS, for example, special purpose entities consolidated for IFRS but not for regulatory capital purposes.
| Equities disclosure for banking book positions | ||||
| CHF million | Book value 31.12.08 | |||
Equity investments | ||||
| Financial investments available-for-sale | 1,681 | |||
| Financial assets designated at fair value | 1,079 | |||
| Investments in associates | 892 | |||
Total equity investments under IFRS | 3,653 | |||
Realized gains and (losses), net | 815 | |||
Unrealized gains and (losses), net | 421 | |||
| Consolidation scope adjustment | (80 | ) | ||
| Capital view adjustments | 405 | |||
Total equity exposure regulatory capital view under BIS | 3,978 | |||
of which: to be risk weighted | ||||
publicly traded | 1,423 | |||
privately held | 1,681 | |||
of which: deducted from equity | 874 | |||
Capital requirement | ||||
Total simple risk weight method | 612 | |||
Unrealized gains included in tier 2 | 69 | |||
187
Table of Contents
Risk and treasury management
Basel II Pillar 3
Securitization
Sources and control of risks resulting from
securitization structures
Regulatory treatment of securitization
Accounting Policies
Good practice guidelines
188
Table of Contents
Risk and treasury management |
Securitization activity during 2008
Total outstanding exposures securitized –
synthetic securitizations
Amount of impaired/past due assets securitized –
synthetic securitizations
| Securitization activity during 2008 – traditional securitizations | ||||||||
| Amount of exposures | Recognized gain or loss | |||||||
| CHF million | securitized | on sale | ||||||
| For year ended | 31.12.08 | 31.12.08 | ||||||
| Residential mortgages | 577 | (13 | ) | |||||
| Commercial mortgages | 964 | 13 | ||||||
| Other | 0 | 0 | ||||||
Total | 1,541 | 0 | ||||||
| Total outstanding exposures – synthetic securitizations | ||||
| CHF million | Amount of exposures securitized | |||
| For year ended | 31.12.08 | |||
| Residential mortgages | 433 | |||
| Commercial mortgages | 596 | |||
Other1 | 9,657 | |||
Total | 10,686 | |||
| Amount of impaired/past due assets securitized – synthetic securitizations | ||||
| CHF million | Amount of exposures impaired/past due | |||
| For year ended | 31.12.08 | |||
| Residential mortgages | 22 | |||
| Commercial mortgages | 0 | |||
| Other | 190 | |||
Total | 212 | |||
189
Table of Contents
Risk and treasury management
Basel II Pillar 3
Losses recognized on originated transactions in 2008
Securitization exposures retained or purchased
Capital charge for securitization exposures retained or purchased
| Losses recognized on originated transactions in 2008 | ||||
| CHF million | Amounts of losses recognized | |||
| For year ended | 31.12.08 | |||
| Residential mortgages | 789 | |||
| Commercial mortgages | 153 | |||
| Other | 291 | |||
Total | 1,233 | |||
| Securitization exposures retained or purchased | ||||
| Exposure type | Exposure amount | |||
| CHF million | ||||
| For year ended | 31.12.08 | |||
| Residential mortgages | 592 | |||
| Commercial mortgages | 583 | |||
Other1 | 33,960 | |||
Total | 35,135 | |||
| Capital charge for securitization exposures retained or purchased | ||||||||
| Exposure amount | Capital charge | |||||||
| CHF million | 31.12.08 | |||||||
| > 0–20% | 32,576 | 332 | ||||||
| > 20–35% | 464 | 13 | ||||||
| > 35–50% | 253 | 11 | ||||||
| > 50–75% | 321 | 19 | ||||||
| > 75–100% | 1,181 | 100 | ||||||
| > 100–150% | – | – | ||||||
| > 150–250% | 24 | 5 | ||||||
| > 250–300% | – | – | ||||||
| > 300–350% | – | – | ||||||
| > 350–375% | – | – | ||||||
| > 375–400% | – | – | ||||||
| > 400–625% | 10 | 4 | ||||||
| > 625–1250% | – | 13 | ||||||
| Deducted from capital | 306 | 306 | ||||||
Total | 35,135 | 803 | ||||||
190
Table of Contents
| Corporate governance and compensation |
Corporate governance and compensation
of theSwiss Code of Obligations
Disclosures provided in line with the requirements of articles 663bbis and 663c (paragraph three) of theSwiss Code of Obligations’“Supplementary disclosures for companies whose shares are listed on a stock exchange: compensations and participations” are also included in the audited financial statements of this report. This information is marked by a bar on the left-hand side throughout this section.
Table of Contents
Corporate governance
| – | UBS implemented new corporate governance guidelines in 2008, actively reinforcing a clear separation of the roles and responsibilities of the Board of Directors and its committees from those of the Group Executive Board |
The dual-board structure achieves a clear
separation of power:
The Board of Directors (BoD) is responsible for the firm’s strategic direction as well as the monitoring and supervision of the business. All members are independent with the exception of its full-time Chairman. Dissolution of the Chairman’s Office in 2008 streamlined the management process, with its duties and responsibilities spread amongst existing and newly established committees.
The Group Executive Board is responsible for the executive management of the firm and must account to the BoD for the firm’s financial results. It is led by the Group Chief Executive Officer and supported by the newly established Executive Committee.
The following events strengthened UBS’s
leadership capacity during 2008:
The position of senior independent director was established to facilitate direct communication between shareholders and the BoD, as well as between BoD members and their Chairman.
The term of office for all BoD members was reduced to one year. This was approved at the annual general meeting held in April and is effective for all elections and re-elections held from 2008 onwards.
The firm believes that shareholder interests are
served by good corporate governance. At the
extraordinary general meetings (EGM) held in 2008,
shareholders approved the following:
On 27 February, shareholders approved the creation of a maximum of CHF 10,370,000 in authorized capital, allowing the distribution of a stock dividend. Shareholders also approved the creation of conditional capital allowing two financial investors to subscribe to an issue of CHF 13 billion of mandatory convertible notes (MCNs).
On 27 November, shareholders approved the creation of conditional share capital for the issuance of MCNs in the amount of CHF 6 billion to the Swiss Confederation.
Table of Contents
Compensation, shareholdings and loans
| – | UBS’s compensation principles for senior executives were extensively reviewed in 2008 | |
| – | New compensation principles are effective from 2009 onwards | |
Compensation for 2008
Total senior executive compensation decreased 77% in 2008.
No incentive award or discretionary stock options were granted to the Chairman and executive members of the Board of Directors nor to the members of the Group Executive Board in reflection of UBS’s negative financial performance for the year.
Compensation principles 2009
These will align compensation with the creation of sustainable shareholder returns through sound risk taking; promote a performance-driven culture with a long-term view to results and shareholder interests; and support the firm’s focused business strategy.
These principles include a “malus” system for cash awards as well as performance conditions for equity awards.
A non-binding vote on executive compensation will be held at the annual general meeting to be held in April 2009.
| Compensation authorities | ||||||
| Compensation recommendations | ||||||
| Recipients | developed by | Approved by | Communicated by | |||
Chairman of the BoD | Chairman of the HRCC1 | HRCC | HRCC | |||
Group CEO | Chairman of the BoD | HRCC | HRCC | |||
Members of the GEB | Group CEO | HRCC | Group CEO | |||
Independent BoD members (remuneration system and fees) | Chairman of the BoD/HRCC | BoD | Chairman of the BoD | |||
Table of Contents
Corporate governance and compensation
Corporate governance
Corporate governance
The corporate governance principles of UBS are designed to lead the firm towards sustainable growth and protect the interests of its shareholders, as well as to create value for shareholders and stakeholders. UBS uses the term “corporate governance” to refer to the organizational structure and operational practices of its leadership and management.
UBS is subject to, and fully complies with, the following regulatory requirements regarding corporate governance: the SIX Swiss Exchange’s (SIX) “Directive on Information Relating to Corporate Governance”; theSwiss Code of Obligations(CO) articles 663bbis and 663c (paragraph three) regarding transparency of compensation paid to members of the Board of Directors (BoD) and senior management; and the standards established in theSwiss Code of Best Practice for Corporate Governance, including the appendix on executive compensation.
| – | The SIX “Directive on Information Relating to Corporate Governance”, with regard to: Group structure and shareholders; capital structure; BoD; Group Executive Board (GEB); compensation, shareholdings and loans; shareholders’ participation rights; change of |
| control and defense measures; auditors and information policy. | ||
| – | Articles 663bbis and 663c (paragraph three) of the CO “Supplementary disclosures for companies whose shares are listed on a stock exchange: compensations and participations”, with regard to share and option ownership and loans. | |
| – | The NYSE “Corporate Governance Listing Standards” with regard to foreign listed companies, independence of directors, BoD committees and differences from the NYSE standards applicable to US domestic issuers. |
194
Table of Contents
Corporate governance and compensation |
Group structure and shareholders
| UBS Group legal entity structure | ||||
| Under Swiss company law, UBS is organized as a limited company, a corporation that has issued shares of common stock to investors. UBS AG is the parent company of the UBS Group (Group). | ||||
| The legal entity structure of UBS is designed to support its businesses within an efficient legal, tax, regulatory and funding framework. Neither the business divisions of UBS nor its Corporate Center are separate legal entities: they primarily operate out of the parent bank, UBS AG, through its branches worldwide. This structure is designed to capitalize on the increased business opportunities and cost efficiencies offered by the use of a single legal platform and to enable the flexible and efficient use of capital. Where it is neither possible nor efficient to operate out of the parent bank, businesses operate through local subsidiaries. Instances of this are usually due to local legal, tax or regulatory rules or a result of additional legal entities joining the Group through acquisition. | ||||
| Operational Group structure | ||||
| On 31 December 2008, the operational structure of the Group comprised the Corporate Center and the three business divisions: Global Wealth Management & Business Banking, Global Asset Management and the Investment Bank. In this report, performance is reported according to this structure. However, on 10 February 2009, UBS announced that Global Wealth Management & Business Banking had been divided into two new business divisions: Wealth Management & Swiss Bank and Wealth Management Americas. Refer to the “Strategy and structure” section of this report for more information on the restructuring of the business divisions. | ||||
| Listed and non-listed companies belonging to the Group (consolidated entities) | ||||
| The Group includes a number of subsidiaries, none of which, however, are listed companies. | ||||
| è | Refer to “Note 34 Significant subsidiaries and associates” in the financial statements of this report for details of significant operating subsidiary companies of the Group | |||
| Significant shareholders | ||||
 | Chase Nominees Ltd., London, acting in its capacity as a nominee for other investors, was registered with 7.19% of | |||
| all shares issued on 31 December 2008, compared with 7.99% at year-end 2007 and 8.81% at year-end 2006. | |||
| DTC (Cede & Co.), New York, The Depository Trust Company, a US securities clearing organization, was registered as a shareholder for a large number of beneficial owners with 9.89% of all shares issued on 31 December 2008 (14.15% on 31 December 2007). | ||||
| According to UBS’s “Regulation on the Registration of Shares”, voting rights of nominees are restricted to 5%, but clearing and settlement organizations are exempt from this restriction. On 31 December 2008, no other shareholder had reported holding 3% or more of all voting rights. Ownership of UBS shares is widely spread. The tables on the next page provide information about the distribution of UBS shareholders by category and geography. This information relates only to registered shareholders and cannot be assumed to be representative of the entire UBS investor base. Only shareholders registered in the share register as “shareholders with voting rights” are entitled to exercise voting rights. | ||||
| Under the Swiss Stock Exchange Act, anyone holding shares in a company listed in Switzerland, or derivative rights related to shares of such a company, has to notify the company and the stock exchange if the holding attains, falls below or exceeds one of the following thresholds: 3, 5, 10, 15, 20, 25, 331/3, 50, or 662/3% of the voting rights, whether they are exercisable or not. The detailed disclosure requirements and the methodology for calculating the thresholds are defined in the “Ordinance of the Swiss Financial Market Supervisory Authority on Stock Exchanges and Securities Trading” (disclosure of shareholdings). In particular, the ordinance prohibits the netting of so-called acquisition positions (i.e. in particular shares, conversion rights and acquisition rights or obligations) with disposal positions (i.e. rights or obligations to sell). It further requires that each such position be calculated separately and reported as soon as it reaches a threshold. | ||||
| In addition to the notification requirements according to Swiss law, as of 16 May 2008, shareholders of UBS also have notification obligations with regard to major shareholdings in shares of UBS under the German Securities Trading Act (Wertpapierhandelsgesetz, WpHG). These obligations arise due to the fact that UBS has chosen Germany as its home member state within the meaning of the European Union’s “Prospectus Directive”. The obligations came into force with the first filing of the listing application for the new shares created as a result of the stock dividend by UBS on SWX Europe, a regulated market in the EU. According to the WpHG, anyone whose shareholding in UBS attains, exceeds or falls below the thresholds of 3, 5, 10, 15, 20, 25, 30, 50 or 75% of the voting rights has to | ||||
195
Table of Contents
Corporate governance and
compensation Corporate governance
notify, without undue delay, such change simultaneously to UBS and the German Supervisory Authority (Bundesanstalt für Finanzdienstleistungsaufsicht; BaFin). The detailed disclosure requirements and the methodology for calculating the thresholds are defined in paragraphs 21 et seq. of the WpHG.
sisted mainly of 8.91% of voting rights attached to employee options, 9.22% of voting rights attached to the mandatory convertible notes issued by UBS in March 2008 and 11.23% of voting rights attached to the mandatory convertible notes issued by UBS in December 2008.
Cross shareholdings
UBS has no cross shareholdings in excess of a reciprocal 5% of capital or voting rights with any other company.
| Distribution of UBS shares | ||||||||||||||||
| On 31 December 2008 | Shareholders registered | Shares registered | ||||||||||||||
| Number of shares registered | Number | % | Number | % of shares issued | ||||||||||||
| 1–100 | 39,458 | 11.6 | 2,279,778 | 0.1 | ||||||||||||
| 101–1,000 | 200,945 | 59.1 | 89,228,454 | 3.0 | ||||||||||||
| 1,001–10,000 | 92,559 | 27.2 | 242,151,755 | 8.2 | ||||||||||||
| 10,001–100,000 | 6,280 | 1.9 | 145,370,413 | 5.0 | ||||||||||||
| 100,001–1,000,000 | 500 | 0.2 | 148,881,546 | 5.1 | ||||||||||||
| 1,000,001–5,000,000 | 99 | 0.0 | 200,105,606 | 6.8 | ||||||||||||
| 5,000,001–29,325,805 (1%) | 31 | 0.0 | 324,972,121 | 11.1 | ||||||||||||
| 1–2% | 1 | 0.0 | 38,551,136 | 1.3 | ||||||||||||
| 2–3% | 3 | 0.0 | 202,408,105 | 6.9 | ||||||||||||
| 3–4% | 0 | 0.0 | 0 | 0.0 | ||||||||||||
| 4–5% | 0 | 0.0 | 0 | 0.0 | ||||||||||||
| Over 5% | 2 | 1 | 0.0 | 500,789,047 | 17.1 | |||||||||||
| Total registered | 339,878 | 100.0 | 1,894,737,961 | 64.6 | ||||||||||||
Unregistered2 | 1,037,842,588 | 35.4 | ||||||||||||||
Total shares issued | 2,932,580,549 | 3 | 100.0 | |||||||||||||
| Shareholders: type and geographical distribution | ||||||||||||||||
| Shareholders | Shares | |||||||||||||||
| On 31 December 2008 | Number | % | Number | % | ||||||||||||
| Individual shareholders | 330,226 | 97.1 | 460,037,591 | 15.7 | ||||||||||||
| Legal entities | 9,063 | 2.7 | 433,384,170 | 14.8 | ||||||||||||
| Nominees, fiduciaries | 589 | 0.2 | 1,001,316,200 | 34.1 | ||||||||||||
| Unregistered | 1,037,842,588 | 35.4 | ||||||||||||||
Total | 339,878 | 100.0 | 2,932,580,549 | 100.0 | ||||||||||||
| Switzerland | 310,284 | 91.3 | 802,619,576 | 27.4 | ||||||||||||
| Europe | 20,060 | 5.9 | 625,650,671 | 21.3 | ||||||||||||
| North America | 2,505 | 0.7 | 400,179,323 | 13.6 | ||||||||||||
| Other countries | 7,029 | 2.1 | 66,288,391 | 2.3 | ||||||||||||
| Unregistered | 1,037,842,588 | 35.4 | ||||||||||||||
Total | 339,878 | 100.0 | 2,932,580,549 | 100.0 | ||||||||||||
196
Table of Contents
Corporate governance and compensation |
Capital structure
Capital
Under Swiss company law, shareholders must approve in a shareholders’ meeting any increase in the total number of issued shares, which may arise from an ordinary share capital increase or the creation of conditional or authorized capital. At year-end 2008, 2,932,580,549 shares were issued with a par value of CHF 0.10 each, leading to ordinary share capital of CHF 293,258,054.90 (including shares issued for the capital increase out of authorized and conditional capital in 2008).
Conditional share capital
shares of CHF 6 billion in MCNs with maturity 9 June 2011 issued to the Swiss Confederation.
Authorized share capital
Changes of shareholders’ equity
| è | Refer to the “Statement of changes in equity” in the financial statements of this report for more information on changes in shareholders’ equity over the last three years |
Shares, participation and bonus certificates,
capital securities
UBS shares are issued in registered form, traded and settled as so-called global registered shares. Each registered share has a par value of CHF 0.10 and carries one vote. Voting rights may, however, only be exercised if the holder expressly declares that he or she acquired these shares in his or her own name and for his or her own account. Global registered shares provide direct and equal ownership for all shareholders, irrespective of the country and stock exchange in which they are traded. Refer to the “Shareholders’ participation rights” section of this report for more information.
| Ordinary share capital | ||||||||||||
| Share capital | Number | Par value | ||||||||||
| in CHF | of shares | in CHF | ||||||||||
On 31 December 2007 | 207,354,734 | 2,073,547,344 | 0.10 | |||||||||
| Issue of shares for stock dividend | 9,869,875 | 98,698,754 | 0.10 | |||||||||
| Issue of shares for capital increase (rights offering) | 76,029,518 | 760,295,181 | 0.10 | |||||||||
| Issue of shares out of employee options exercised from conditional capital | 3,927 | 39,270 | 0.10 | |||||||||
On 31 December 2008 | 293,258,055 | 2,932,580,549 | 0.10 | |||||||||
197
Table of Contents
Corporate governance and compensation
Corporate governance
paid up and eligible for dividends. There are no preferential rights for shareholders.
Limitation on transferability and nominee registration
UBS does not apply any restrictions or limitations on the transferability of its shares. Shares registered in the share register with voting rights may be voted without any restrictions, according to the provisions of the “Articles of Association of UBS AG” (which require an express declaration of beneficial ownership).
Convertible bonds and options
On 31 December 2008, there were 236 million employee options outstanding, of which 124 million were exercisable. UBS satisfies share delivery obligations under its option-based participation plans either by purchasing UBS shares in the market on grant date or shortly thereafter, or through the issuance of new shares out of conditional capital. At exercise, shares held in treasury or newly issued shares are delivered to the employee against receipt of the strike price. On 31 December 2008, UBS held approximately 48.9 million shares in treasury and an additional 150 million unissued shares in conditional share capital, which were available to be used for future employee option exercises. The shares available cover all vested (i.e. exercisable) employee options.
| è | Refer to the discussion on shares and capital instruments in the “Treasury management” section of this report for more information on the MCNs |
198
Table of Contents
Corporate governance and compensation |
Board of Directors
The Board of Directors (BoD) is ultimately responsible for the firm’s strategy and the supervision of its executive management. It also approves the financial statements for issue. Shareholders elect each member of the BoD, which in turn appoints its Chairman, at least one vice chairman and the members of its various committees.
Members of the Board of Directors
This section provides information on the composition of the BoD on 31 December 2008. It shows each member’s functions in UBS, nationality, year of initial appointment to the BoD and current term of office, professional history and education, date of birth and other activities and functions, such as mandates on boards of important corporations, organizations and foundations, permanent functions for important interest groups and official functions and political mandates.
elected to their first term on the BoD, and Peter Kurer replaced Marcel Ospel as full-time Chairman of the BoD. Stephan Haeringer, Rolf Meyer, Peter Spuhler and Lawrence A. Weinbach tendered their resignations effective 2 October 2008. At the extraordinary general meeting (EGM) held on 2 October 2008, Sally Bott, Rainer-Marc Frey, Bruno Gehrig and William G. Parrett were elected to the BoD for the first time.
| Address | UBS AG | |
| Bahnhofstrasse 45 | ||
| CH-8098 Zurich | ||
| Function(s) in UBS | Chairman of the Board of Directors (BoD) / chair of the corporate responsibility committee / chair of the strategy committee | |
| Nationality | Swiss | |
| Year of initial appointment | 2008 | |
| Current term of office runs until | 2009 | |
Peter Kurer was elected to the BoD at the annual general meeting (AGM) held in 2008 and thereafter appointed Chairman of the BoD. He chairs the corporate responsibility committee and the strategy committee. Mr. Kurer had served as Group General Counsel of UBS since 2001, when he joined the firm. He also served as a member of UBS’s Group Executive Board (GEB) from 2002 until his election to the BoD in April 2008. Between 1991 and 2001, Mr. Kurer was a partner at the law firm Homburger AG in Zurich. Between 1980 and 1990, he was with the Zurich office of Baker & McKenzie law firm, first as associate and later as partner. He was a law clerk at the District Court of Zurich from 1977 to 1979. Mr. Kurer graduated as doctor iuris from the University of Zurich and was admitted as attorney-at-law at the Zurich Bar. He holds an LL.M. from the University of Chicago. He was born on 28 June 1949.
Mandates on boards of important corporations, organizations and foundations or interest groups:
Peter Kurer is a member of the board of Avenir Suisse as well as a member of the visiting committee of the University of Chicago’s Law School. He is also a member of the board of trustees of a foundation which acts as an advisory board to the University of St. Gallen’s program for law and economics, and a member of the committee of continuing education, Executive School of Management, Technology and Law, University of St. Gallen.
| Address | Fiat S.p.A. | |
| Via Nizza 250 | ||
| I-10126 Turin | ||
| Function(s) in UBS | Independent vice chairman and senior independent director / member of the governance and nominating committee/member of the strategy committee | |
| Nationality | Canadian and Italian | |
| Year of initial appointment | 2007 | |
| Current term of office runs until | 2010 | |
Sergio Marchionne serves as Chief Executive Officer (CEO) of Fiat S.p.A., Turin, and Fiat Group Automobiles. Mr. Marchionne began his professional career in 1983 as a chartered accountant and tax specialist for Deloitte & Touche in Canada. Two years later, he became Group controller and then director of corporate development at Lawson Mardon Group of Toronto. In 1989 and 1990, he served as executive vice president of Glenex Industries. In the following two years Mr. Marchionne acted as vice president of finance and Chief Financial Officer (CFO) at Acklands Ltd. He returned to Lawson Mardon Group in 1992 as vice president of legal and corporate development and CFO. The company was acquired by Alusuisse Lonza in 1994. After the acquisition, having become CEO in 1996, he held various positions of increasing responsibility until 2000. Upon completion of the merger of Alusuisse with Alcan, he acted as CEO and Chairman of the spin-off Lonza Group Ltd. until 2002. In 2002, Mr. Marchionne was appointed CEO of the Société Générale de Surveillance (SGS) Group of Geneva. He has been a member of the supervisory board of Fiat S.p.A. since 2003 and has served as CEO of the company since June 2004. Mr. Marchionne studied philosophy at the University of Toronto (Canada), business at the University of Windsor (Canada) and law at Osgoode Hall Law School in Toronto (Canada) and is a lawyer and chartered accountant. He was born on 17 June 1952.
Other activities and functions
Mandates on boards of important corporations, organizations and foundations or interest groups:
Sergio Marchionne is Chairman of SGS and a member of the BoD of Philip Morris International Inc., New York. He is also a member of Acea (European Automobile Manufacturers Association) and Chairman of CNH Case New Holland Global N.V.
199
Table of Contents
Corporate governance and compensation
Corporate governance
| Address | Bemido SA | |
| Avenue Giuseppe- | ||
| Motta 31–33 | ||
| PO Box 145 | ||
| CH-1211 Geneva 20 | ||
| Function(s) in UBS | Member of the governance and nominating committee / member of the human resources and compensation committee | |
| Nationality | Swiss | |
| Year of initial appointment | 2002 | |
| Current term of office runs until | 2009 | |
Ernesto Bertarelli was CEO of Serono International SA, Geneva, between 1996 and 2007. The company was sold to Merck KGaA, Germany, on 5 January 2007. He started his career with Serono in 1985 and held several positions in sales and marketing. Prior to his appointment as CEO, he served for five years as deputy CEO. Mr. Bertarelli was also the vice chairman of the BoD of Serono SA, Coinsins (Switzerland) and the Chairman of SeroMer Biotech SA, Chéserex (Switzerland), until 5 January 2007. Mr. Bertarelli holds a Bachelor of Science from Babson College, Boston and an MBA from Harvard University. He was born on 22 September 1965.
Other activities and functions
Mandates on boards of important corporations, organizations and foundations or interest groups:
Ernesto Bertarelli is Chairman of Team Alinghi SA (winner of the America’s Cup 2003 and 2007), Ecublens (Switzerland), and of Alinghi Holdings Ltd. Jersey. He is the Chairman of Kedge Capital Partners Ltd., Jersey and of Kedge Capital Holdings (Jersey) Ltd., Switzerland. He was awarded two extraordinary national honors: the Légion d’honneur by President Chirac of France, and the Cavaliere di Gran Croce by Carlo Azeglio Ciampi, former President of the Italian Republic. He is a member of the strategic advisory board of Ecole Polytechnique Fédérale de Lausanne (EPFL) and holds various board mandates in professional organizations of the biotech and pharmaceutical industries.
| Address | BP p.l.c. | |
| 1 St. James's Square | ||
| GB-London SW1Y 4PD | ||
| Function(s) in UBS | Member of the human resources and compensation committee / member of the corporate responsibility committee | |
| Nationality | American (US) | |
| Year of initial appointment | 2008 | |
| Current term of office runs until | 2009 | |
Sally Bott serves as Group HR Director of BP plc, which she joined in early 2005, and is a member of its Group Executive Committee. Ms. Bott spent most of her career in financial services. Between 2000 and 2005, she was a Managing Director at Marsh & McLennan, a US-based global risk and insurance services business, and head of global HR for Marsh, Inc. She was at Barclays Bank from 1994 to 2000, first as BZW HR director and then Group HR director from 1997 to 2000. In 1970, she joined Citibank out of college as a research analyst in the economics department. She was credit trained and in the Finance Function. She joined HR in 1978 and worked as a HR director in most of the wholesale bank and investment banking businesses during the next 15 years. She was the Global HR Director of the wholesale bank from 1990 to 1993. Ms. Bott has a BS in economics from Manhattanville College, USA. She was born on 11 November 1949.
Other activities and functions
Mandates on boards of important corporations, organizations and foundations or interest groups:
Sally Bott is a member of the board of the Royal College of Music in London and the Carter Burden Center for the Aged in NYC.
| Address | Horizon21 | |
| Poststrasse 4 | ||
| CH-8808 Pfaeffikon | ||
| Function(s) in UBS | Member of the risk committee / member of the strategy committee | |
| Nationality | Swiss | |
| Year of initial appointment | 2008 | |
| Current term of office runs until | 2009 | |
Rainer-Marc Frey is the founder and Chairman of Horizon21, an investment management company which takes long-term investment views on various megatrends in the investment management industry. In 1992, he founded RMF Investment Group (RMF), one of the first hedge fund groups in Europe, and became CEO. RMF was acquired by Man Group Plc in 2002. Between 2002 and 2004, he held a number of senior roles within Man Group Plc and was the largest individual shareholder. From 1989 to 1992, prior to founding RMF, Mr. Frey served as a director at Salomon Brothers Inc. in Zurich, Frankfurt and London, where he was involved mainly with equity derivatives. Between 1987 and 1989, he worked for Merrill Lynch Inc. covering equity, fixed income and swaps markets. He holds a degree in economics from the University of St. Gallen. Mr. Frey was born on 10 January 1963.
Other activities and functions
Mandates on boards of important corporations, organizations and foundations or interest groups:
Rainer-Marc Frey is a member of the BoD of DKSH Group, Zurich, and a member of the advisory board of Invision Private Equity AG, Zug. He is a member of the BoD of the Frey Charitable Foundation, Freienbach.
| Address | Swiss Life | |
| General-Guisan-Quai 40 | ||
| Postfach | ||
| CH-8022 Zurich | ||
| Function(s) in UBS | Member of the audit committee | |
| Nationality | Swiss | |
| Year of initial appointment | 2008 | |
| Current term of office runs until | 2009 | |
Bruno Gehrig has been Chairman of Swiss Life Holding since 2003 and will resign on 7 May 2009 from this position. Between 1996 and 2003, he served at the Swiss National Bank, starting as a member of the governing board and becoming vice chairman in 2000. From 1992 to 1996, he was a professor of banking and finance at the University of St. Gallen and concurrently served as a member of the Swiss Federal Banking Commission (FINMA since 1 January 2009). Between 1989 and 1991, he held the position of CEO at Cantrade Private Banking Group. Mr. Gehrig worked for the former Union Bank of Switzerland (UBS) between 1981 and 1989, where he started as chief economist before assuming responsibility for securities sales and trading. He studied economics at the University of Berne, where he also did his PhD studies. He completed postgraduate studies at the University of Rochester, New York. He was assistant professor at the University of Berne and received his Dr. h.c. from the University of Rochester, New York. Mr. Gehrig was born on 26 December 1946.
Other activities and functions
Mandates on boards of important corporations, organizations and foundations or interest groups:
Bruno Gehrig is the vice chairman of the BoD of Roche Holding AG, Basel, and the Chairman of the Swiss Air Transport Foundation, Zug.
200
Table of Contents
Corporate governance and compensation |
| Address | Lévy Kaufmann-Kohler | |
| 3-5, rue du | ||
| Conseil-Général | ||
| CH-1205 Geneva | ||
| Function(s) in UBS | Chair of the governance and nominating committee / member of the corporate responsibility committee | |
| Nationality | Swiss | |
| Year of initial appointment | 2006 | |
| Current term of office runs until | 2009 | |
Gabrielle Kaufmann-Kohler has been arbitrator and partner with Lévy Kaufmann-Kohler since 1 January 2008, and a professor of private international law, including international arbitration, at the University of Geneva Law School since 1997. Between 1996 and 2007, she worked as a practicing attorney at the Schellenberg Wittmer law firm, Geneva, where she was a partner. Ms. Kaufmann-Kohler was adjunct professor for private international law at the University of Geneva Law School from 1993 to 1996. From 1985 to 1995, she was with Baker & McKenzie law firm, first as associate and then as partner. She is a member of the Geneva Bar (since 1976) and of the New York State Bar (since 1981) and is known worldwide for her expertise in international arbitration. In 1980, she worked for the UBS New York Branch as a legal advisor. Ms. Kaufmann-Kohler completed her legal studies at the University of Geneva in 1977 and received her doctorate from the University of Basel in 1979. She was born on 3 November 1952.
Other activities and functions
Mandates on boards of important corporations, organizations and foundations or interest groups:
Gabrielle Kaufmann-Kohler is a member of the board of the American Arbitration Association.
| Address | BMW AG | |
| Petuelring 130 | ||
| D-80788 Munich | ||
| Function(s) in UBS | Member of the human resources and compensation committee / member of the risk committee | |
| Nationality | German | |
| Year of initial appointment | 2004 | |
| Current term of office runs until | 2010 | |
Between 2002 and 2006, Helmut Panke was Chairman of the board of management of BMW AG, Munich. In 1982, he joined as head of planning and controlling in the research and development division. He subsequently assumed management functions in corporate planning, organization and corporate strategy. Before his appointment as Chairman, he was a member of BMW’s board of management from 1996. Between 1993 and 1996, he was Chairman and CEO of BMW Holding Corporation in the US. Mr. Panke graduated from the University of Munich with a PhD in physics and was assigned to the University of Munich and the Swiss Institute for Nuclear Research before joining McKinsey & Co in Dusseldorf and Munich as a consultant. He was born on 31 August 1946.
Other activities and functions
Mandates on boards of important corporations, organizations and foundations or interest groups:
Helmut Panke is a member of the BoD of Microsoft Corporation, Redmond, WA (USA) and is also a member of the supervisory board of Bayer AG (Germany). He is a member of the BoD of the American Chamber of Commerce in Germany and a member of the international advisory board for Dubai International Capital’s “Global Strategic Equities Fund”.
| Address | 433 Country Club Rd. W. | |
| New Canaan, | ||
| Ct. 06840 USA | ||
| Function(s) in UBS | Member of the audit committee | |
| Nationality | American (US) | |
| Year of initial appointment | 2008 | |
| Current term of office runs until | 2009 | |
William G. Parrett served his entire career with Deloitte Touche Tohmatsu, a global organization of member firms that operates with 160,000 people in nearly 140 countries. He was CEO from 2003 until his retirement in 2007. Between 1999 and 2003, he was a managing partner of Deloitte & Touche USA LLP and served on Deloitte’s Global Executive Committee. Mr. Parrett founded the US National Financial Services Industry Group (1995) and the Global Financial Services Industry Group (1997) of Deloitte, both of which he led as Chairman. In his 40 years of experience in professional services, Mr. Parrett served public, private, governmental, and state-owned clients worldwide in order to help Deloitte achieve superior financial performance and growth. Mr. Parrett has a Bachelors degree in accounting from St. Francis College, New York, and is a certified public accountant. He was born on 4 June 1945.
Other activities and functions
Mandates on boards of important corporations, organizations and foundations or interest groups:
William Parrett is an independent director of Eastman Kodak Co., Blackstone Group LP, and Thermo Fisher Scientific Inc., USA. He is also the Chairman of the BoD of the United States Council for International Business and of United Way of America, a member of the board of trustees of Carnegie Hall, and a member of the Executive Committee of the International Chamber of Commerce.
| Address | Apartment 26-O | |
| 25 Central Park West | ||
| New York | ||
| N.Y. 10023 USA | ||
| Function(s) in UBS | Chair of the risk committee / member of the corporate responsibility committee | |
| Nationality | American (US) and British | |
| Year of initial appointment | 2008 | |
| Current term of office runs until | 2009 | |
David Sidwell was executive vice president and CFO of Morgan Stanley in New York between March 2004 and October 2007. Before joining Morgan Stanley he was with JPMorgan Chase & Co. He joined JPMorgan Chase & Co. in 1984 in New York where he held a number of different positions during his 20 years of service, including controller and CFO of the Investment Bank. Prior to this he was with PricewaterhouseCoopers LLP in both London and New York. Mr. Sidwell graduated from Cambridge University in England and is a chartered accountant qualifying in the Institute of Chartered Accountants in England and Wales. He was born on 28 March 1953.
Other activities and functions
Mandates on boards of important corporations, organizations and foundations or interest groups:
David Sidwell is a director of the Federal National Mortgage Association Fannie Mae. He is a trustee of the International Accounting Standards Committee Foundation, London and the Chairman of the BoD of Village Care of New York, a not-for-profit organization, as well as director of the National Council on Aging.
201
Table of Contents
Corporate governance and compensation
Corporate governance
| Address | Royal Dutch Shell plc | |
| 2501 AN NL-The Hague | ||
| Function(s) in UBS | Chair of the audit committee / member of the strategy committee | |
| Nationality | Swiss | |
| Year of initial appointment | 2005 | |
| Current term of office runs until | 2009 | |
Peter R. Voser has been CFO and an executive BoD member of Royal Dutch Shell plc in London since 2004. Between 2002 and 2004, he was CFO of Asea Brown Boveri (ABB) in Switzerland. Between 1982 and 2002, he worked for the Royal Dutch / Shell Group, holding various assignments in Switzerland, the UK, Argentina and Chile. Mr. Voser graduated from the University of Applied Sciences, Zurich. He was born on 29 August 1958.
Other activities and functions
Mandates on boards of important corporations, organizations and foundations or interest groups:
Mr. Voser is a member of the BoD of the Swiss Federal Auditor Oversight Authority.
| Address | DKSH Holding AG | |
| Wiesenstrasse 8 | ||
| CH-8034 Zurich | ||
| Function(s) in UBS | Chair of the human resources and compensation committee / member of the governance and nominating committee | |
| Nationality | German and Swiss | |
| Year of initial appointment | 2006 | |
| Current term of office runs until | 2009 | |
Joerg Wolle has been president and CEO of DKSH Holding Ltd. since 2002. From 2000 until the merger with Diethelm Keller in 2002, he was president and CEO of SiberHegner Holding AG. He completed his studies in engineering in 1983 and received his doctorate in 1987 from the Technical University of Chemnitz in Germany. Mr. Wolle was born on 19 April 1957.
Other activities and functions
Mandates on boards of important corporations, organizations and foundations or interest groups:
Joerg Wolle is a member of the BoD of Diethelm Keller Holding Ltd., Zurich. He is also the Chairman of the BoD of BURU Holding Ltd., Cham, and a member of the BoD of OAV (German Asia-Pacific Business Association), Hamburg.
Elections and terms of office
In accordance with the new article 19 (paragraph one) of the “Articles of Association of UBS AG” approved at the 23 April 2008 AGM, all BoD members are to be elected on an individual basis for a one-year term of office. As a result, by 2010 at the latest, shareholders must confirm the entire membership of the BoD on a yearly basis at the AGM.
Organizational principles
The BoD has ultimate responsibility for the mid- and long-term strategic direction of the UBS Group (Group), for appointments and dismissals at top management level and for the definition of the firm’s risk principles and risk capacity.
Organizational structure
Following each AGM, the BoD meets to elect or appoint its Chairman, one or more vice chairmen, the senior independent director and the members and chairs of its committees. The BoD appoints a company secretary who acts as secretary to the BoD and its committees.
202
Table of Contents
Corporate governance and compensation |
total of 47 meetings were held in 2008, of which 17 included Group Executive Board (GEB) members, 26 were without GEB participation, and four were independent BoD meetings held without the presence of its Chairman. On average, 91% of BoD members were present at BoD meetings and 83% at the BoD meetings without GEB participation.
The BoD is organized as follows:
Chairman’s Office
Audit committee
Group Controlling and Accounting and the head of Group Accounting Policy participating. The six meetings included regular separate sessions with these representatives. In addition, the Group General Counsel attended one meeting. A special session was organized with the Group CFO to discuss the annual financial results. Participation at the meetings averaged 94% and all were held with external auditors present.
Corporate responsibility committee
| è | Refer to the “Corporate responsibility” section of this report for more information on corporate responsibility |
Governance and nominating committee
Human resources and compensation committee
203
Table of Contents
Corporate governance and compensation
Corporate governance
and approve the succession planning for all executives (other than the Group CEO). The human resources and compensation committee also reviews the compensation disclosure included in this report. The committee operates under the human resources and compensation committee charter, as described in the organization regulations and its annexes.
| è | Refer to the “Compensation, shareholdings and loans” section of this report for more information on the BoD human resources and compensation committee’s decision-making procedures |
Risk committee
Strategy committee
decisions on the Group’s strategy; (ii) to monitor the implementation of the Group’s current strategy and report results to the BoD; (iii) to consider, in conjunction with the risk committee, the Group’s strategy to deal with anticipated or existing high-level risks; and (iv) to validate the Group’s current strategy with external experts where the committee considers such external advice to be appropriate.
Roles and responsibilities of the Chairman of the Board of Directors
Peter Kurer, the Chairman, has entered into a full-time employment contract with UBS in connection with his service on the BoD and is entitled to receive pension benefits upon retirement. He assumes clearly defined management responsibilities.
Roles and responsibilities of the senior independent director
At least once per year, the senior independent director organizes and leads a meeting of the independent BoD members without the presence of the Chairman. The senior independent director reports to the Chairman of the BoD on the evaluation of the Chairman’s performance. The senior independent director acts as a contact point for shareholders wishing to engage in discussions with an independent BoD member.
204
Table of Contents
Corporate governance and compensation |
Important business connections of independent members of the Board of Directors with UBS
UBS, as a global financial services provider and a major bank in Switzerland, has business relationships with many large companies including those in which UBS BoD members assume management or independent board responsibilities. The nature of the relationships between UBS and companies whose chair or chief executive is a member of UBS’s BoD is not considered to compromise the BoD members’ capacity for independent judgment. Furthermore, no independent BoD member has personal business relationships with UBS that could compromise his or her independence.
Checks and balances: Board of Directors and Group Executive Board
Effective 1 July 2008, the separation of responsibilities between the BoD and executive management has been clarified. The BoD has a clear strategy-setting responsibility and will supervise and monitor the business, whereas the GEB, headed by the Group CEO, has executive management responsibility. UBS operates under a strict dual board structure, as mandated by Swiss banking law. The functions of Chairman of the BoD and Group CEO are assigned to two different people, thus ensuring a separation of powers. This structure establishes checks and balances and preserves the institutional independence of the BoD from the day-to-day management of the firm, for which responsibility is delegated to the GEB under the leadership of the Group CEO. No member of one board may be a member of the other.
| è | Refer to www.ubs.com/governance for more details on checks and balances for the BoD and GEB |
Information and control instruments vis-à-vis the Group Executive Board
The BoD is kept informed of the activities of the GEB in various ways. The minutes of the GEB meetings are made available to the BoD members. At BoD meetings, the Group CEO and the GEB members regularly update the BoD on important issues.
| è | Refer to the “Risk management and control” section of this report for more information |
205
Table of Contents
Corporate governance and compensation
Corporate governance
Group Executive Board
Members of the Group Executive Board on
28 February 2009
The text in the boxes below provides information on the composition of the GEB on 28 February 2009. It shows each member’s function in UBS, nationality, year of initial appointment to the GEB, professional history and education, date of birth and other activities and functions, such as mandates on boards of important corporations, organizations and foundations, permanent functions for important interest groups as well as official functions and political mandates.
Changes in 2008
On 23 April 2008, Peter Kurer stepped down as Group General Counsel (Group GC) and was replaced by Markus U. Diethelm on 1 September 2008. In the meantime, David Aufhauser, Neil Stocks and Bernhard Schmid acted as interim co-General Counsels while Peter Kurer retained an overall supervisory role over the team of the three General Counsels. This was accepted by the Swiss Financial Market Supervisory Authority as a transitional arrangement.
Changes in 2009
Francesco Morra and Juerg Zeltner have been appointed as CEOs of Wealth Management & Swiss Bank and as CEO Switzerland and CEO Wealth Management Global, respectively. They assumed their roles on 10 February 2009 and became members of the GEB at this date. As CEO Switzerland, Francesco Morra will head the wealth management business for domestic Swiss wealth management and private clients. As CEO Wealth Management Global, Juerg Zeltner will lead all UBS domestic wealth management businesses outside of Switzerland and the Americas. Marten Hoekstra heads the business division Wealth Management Americas and no longer assumes the role of deputy Chairman and CEO of Global Wealth Management & Business Banking. Oswald J. Gruebel was named Group CEO on 26 February 2009, replacing Marcel Rohner who stepped down as Group CEO on that date.
| Oswald J. Gruebel1 | M | Professional history, education and date of birth Oswald J. Gruebel was named UBS Group Chief Executive Officer (Group CEO) on 26 February 2009. Before joining UBS he was the CEO of Credit Suisse Group and of Credit Suisse and stepped down from this role in May 2007. He was CEO of Credit Suisse Financial Services from 2002 to 2004 and was additionally Co-CEO of Credit Suisse Group from 2003 until 2004. Mr. Gruebel was a member of the Credit Suisse Group Executive Board (GEB) between 1997 and 2001 and again from 2002 to 2007. From 1991 until 1997 he was member of the Executive Board of Credit Suisse, responsible for equities, fixed income, global foreign exchange, money markets and asset/liability management in Zurich. Before that he was a member of the GEB, Financière Credit Suisse First Boston in Zug. In 1970 Mr. Gruebel joined White Weld Securities and became its CEO in 1978. From 1961 to 1970 he worked for Deutsche Bank AG. He was born on 23 November 1943. | ||
| Address | UBS AG Bahnhofstrasse 45 CH-8098 Zurich | |||
| Function(s) in UBS | Group Chief Executive | |||
| Officer | ||||
| Nationality | German | |||
| Year of initial appointment | 2009 | |||
1 Oswald J. Gruebel was named Group CEO on 26 February 2009, replacing Marcel Rohner who stepped down as Group CEO on that date. | ||||
206
Table of Contents
Corporate governance and compensation |
| John Cryan | M | Professional history, education and date of birth John Cryan, formerly global head of the financial institutions group at UBS’s Investment Bank, was appointed Group CFO in September 2008. As an alumnus of Arthur Andersen & Co, Mr. Cryan joined S.G. Warburg in London in 1987. Since 1992, he has specialized in providing strategic and financial advice to a wide range of companies in the financial services sector globally. In recent months, he has played an active role in advising UBS’s Board of Directors (BoD) and Group Executive Board (GEB) on issues related to the current financial crisis. Mr. Cryan graduated in 1981 and holds an MA Hons from the University of Cambridge. He was born on 16 December 1960. | ||
| Address | UBS AG Bahnhofstrasse 45 CH-8098 Zurich | |||
| Function(s) in UBS | Group Chief Financial Officer (Group CFO) | |||
| Nationality | British | |||
| Year of initial appointment | 2008 | |||
| Markus U. Diethelm | M | Professional history, education and date of birth Markus U. Diethelm was appointed Group General Counsel of UBS on 1 September 2008. From 1998 to 2008, he worked for Swiss Re. He started his career in 1983 with Bär & Karrer, a Zurich law firm. In 1988, he joined Paul, Weiss, Rifkind, Wharton & Garrison in New York as a foreign associate. As of 1989, he practiced with New York’s Shearman & Sterling, specializing in mergers and acquisitions. In 1992 he joined the Los Angeles-based law firm Gibson, Dunn & Crutcher, focusing on corporate matters, securities transactions, litigation and regulatory investigations while operating out of the firm’s Brussels and Paris offices. He joined Swiss Re in 1998 as Group Chief Legal Officer and was appointed to its GEB effective 1 January 2007. Mr. Diethelm holds a law degree from the University of Zurich and a Masters degree and PhD from the law school at Stanford University. He is a qualified attorney-at-law in Switzerland and admitted to the New York Bar. He was born on 22 October 1957. Other activities and functions Mandates on boards of important corporations, organizations and foundations or interest groups: Markus U. Diethelm is the Chairman of the legal committee of the Swiss American Chamber of Commerce. | ||
| Address | UBS AG Bahnhofstrasse 45 CH-8098 Zurich | |||
| Function(s) in UBS | Group General Counsel | |||
| Nationality | Swiss | |||
| Year of initial appointment | 2008 | |||
| John A. Fraser | M | Professional history, education and date of birth John A. Fraser was appointed Chairman and CEO of the Global Asset Management division in late 2001. Prior to that, he was President and COO of UBS Asset Management and Head of Asia Pacific. In 2008, he became Chairman of UBS Saudi Arabia. From 1994 to 1998, he was Executive Chairman and CEO of The Australia Funds Management business. Before joining UBS, Mr. Fraser spent over 20 years in various positions at the Australian Treasury, including two international postings to Washington D.C., first, at the International Monetary Fund and, second, as Minister (Economic) at the Australian Embassy. From 1990 to 1993, he was Deputy Secretary (Economic) of the Australian Treasury from 1990 to 1993. Mr. Fraser graduated from Monash University in Australia in 1972 and holds a first-class honors degree in economics. He was born on 8 August 1951. Other activities and functions Mandates on boards of important corporations, organizations and foundations or interest groups: John A. Fraser is a member of the Board of Governors of the Marymount International School at Kingston-upon-Thames in the UK. | ||
| Address | UBS AG Bahnhofstrasse 45 CH-8098 Zurich | |||
| Function(s) in UBS | Chairman and CEO Global Asset Management | |||
| Nationality | Australian | |||
| Year of initial appointment | 2002 | |||
| Marten Hoekstra | M | Professional history, education and date of birth On 12 November 2008, Marten Hoekstra assumed the duties of Raoul Weil, as Chairman and CEO Global Wealth Management & Business Banking, on an interim basis. He was appointed head of Wealth Management US in July 2005 and Deputy CEO Global Wealth Management & Business Banking in November 2007. Between 2001 and 2005, he assumed different management roles in Global Wealth Management & Business Banking, including head of market strategy and development, and in July 2002 became a member of the Group Managing Board. Previously, from 1983 to 2000, he held various roles with PaineWebber, including that of financial advisor. Mr. Hoekstra graduated with a BA in political science from the University of North Dakota and received his MBA from the Kellogg Graduate School of Management at Northwestern University. He was born on 21 May 1961. Other activities and functions Mandates on boards of important corporations, organizations and foundations or interest groups: Marten Hoekstra is a member of the BoD of Prisoner Fellowship Ministries and of the Zurich International School Foundation, both non-profit organizations. He is also a member of the BoD of the Securities Industry & Financial Markets Association (SIFMA). | ||
| Address | UBS AG Bahnhofstrasse 45 CH-8098 Zurich | |||
| Function(s) in UBS | Deputy CEO Global Wealth Management & Business Banking and Head Wealth Management US | |||
| Nationality | American (US) | |||
| Year of initial appointment | 2008 | |||
207
Table of Contents
Corporate governance
| M | ||||
| Jerker Johansson | M | Professional history, education and date of birth Jerker Johansson joined UBS and was named Chairman and CEO of the UBS Investment Bank on 13 February 2008. Previously he was vice chairman of Morgan Stanley Europe, and a member of its management committee. From 2005 to 2007, he was head of Morgan Stanley’s institutional equity division. In 2005, he was also named co-head of the combined sales and trading business, consisting of the institutional equity division and the fixed income division. In 2007, he became co-head of sales and trading with responsibility for clients and services, continuing his responsibility for prime brokerage and becoming solely responsible for the sales and trading side of capital markets. Mr. Johansson joined Morgan Stanley in 1985 as a summer associate and held various positions including head of equity capital markets Europe before being promoted in 1997 to COO, institutional equity division Europe. He was also a member of the European management committee. From 2002 to 2005, he was head of the institutional equity division in Europe. Before joining Morgan Stanley, Mr. Johansson was part of Bankers Trust’s Graduate Training Program, and also worked for Chase Manhattan Bank. He holds a Masters degree in economics from Stockholm University and an MBA from Stanford. He was born on 19 May 1956. Other activities and functions Mandates on boards of important corporations, organizations and foundations or interest groups: Jerker Johansson is a member of the Stanford Business School advisory board, a trustee of Tower Hamlets Educational Business Partnership and a Business Leader at Community Links, London. | ||
| Address | UBS AG Bahnhofstrasse 45 CH-8098 Zurich | |||
| Function(s) in UBS | Chairman and CEO of the UBS Investment Bank | |||
| Nationality | Swedish | |||
| Year of initial appointment | 2008 | |||
| Philip J. Lofts | M | Professional history, education and date of birth Philip J. Lofts, formerly deputy Group CRO and Group risk Group chief operating officer, was appointed Group CRO as of November 2008. He has been with UBS for over 20 years. In 2008, he became Group risk chief operating officer after having previously been Group chief credit officer for three years. Before this, Mr. Lofts worked for the Investment Bank in a number of business and risk control positions in Europe, Asia Pacific and the US. He was born on 9 April 1962. Other activities and functions Mandates on boards of important corporations, organizations and foundations or interest groups: Mr. Lofts is a member of the foundation board of the University of Connecticut. | ||
| Address | UBS AG Bahnhofstrasse 45 CH-8098 Zurich | |||
| Function(s) in UBS | Group CRO | |||
| Nationality | British | |||
| Year of initial appointment | 2008 | |||
| Francesco Morra | M | Professional history, education and date of birth Francesco Morra was appointed CEO Switzerland and became a member of the GEB in February 2009. In November 2007, he was appointed Head of Wealth Management Western Europe, Mediterranean, Middle East & Africa. In addition, as of September 2008, he was also responsible for the business unit Latin America, Caribbean & Canada. Francesco Morra joined UBS in 2005 as Head of Wealth Management Italy and as a member of the Group Managing Board. Before joining UBS, he held various management positions at The Boston Consulting Group Inc. between 1992 and 2005. He holds a PhD in economics from the University of St. Gallen (Switzerland). He was born on 31 August 1967. | ||
| Address | UBS AG Bahnhofstrasse 45 CH-8098 Zurich | |||
| Function(s) in UBS | CEO Switzerland | |||
| Nationality | Swiss and Italian | |||
| Year of initial appointment | 20091 | |||
1 Appointed on 10 February 2009. | ||||
| Walter H. Stuerzinger | M | Professional history, education and date of birth Walter H. Stuerzinger was appointed COO Corporate Center in October 2007. Prior to that, he was Group CRO from 2001 until 2007 and head of Group Internal Audit from 1998 until 2001. Before the merger with SBC, he was head of Group Internal Audit at the former Union Bank of Switzerland. Previously he worked with Credit Suisse on various assignments in the controlling and auditing areas. Mr. Stuerzinger holds a Swiss banking diploma and is a member of the Institute of Chartered Accountants. He was born on 6 July 1955. Other activities and functions Mandates on boards of important corporations, organizations and foundations or interest groups: Walter H. Stuerzinger is a member of the foundation board of the UBS Pension Fund. | ||
| Address | UBS AG | |||
| Bahnhofstrasse 45 | ||||
| CH-8098 Zurich | ||||
| Function(s) in UBS | COO Corporate Center | |||
| Nationality | Swiss | |||
| Year of initial appointment | 2005 | |||
| Rory Tapner | M | Professional history, education and date of birth Rory Tapner was appointed Chairman and CEO Asia Pacific in May 2004. Previously he was Joint Global Head of Investment Banking. From 1983 to 1998 he was with S.G. Warburg and Warburg Dillon Read as global head of equity capital markets, joint head of UK corporate finance and head of the UK capital markets team. He was also a member of the Warburg Dillon Read executive board. Mr. Tapner has a law degree from Kings College, London University and went to Lancaster Gate Law School. Mr. Tapner was born on 30 September 1959. Other activities and functions Mandates on boards of important corporations, organizations and foundations or interest groups: Rory Tapner is the treasurer and Chairman of the financial committee of Council of Kings College, London University. | ||
| Address | UBS AG | |||
| Bahnhofstrasse 45 | ||||
| CH-8098 Zurich | ||||
| Function(s) in UBS | Chairman and CEO Asia Pacific | |||
| Nationality | British | |||
| Year of initial appointment | 2006 | |||
208
Table of Contents
Corporate governance and compensation |
| Alexander Wilmot-Sitwell | M | Professional history, education and date of birth In January 2008, Alexander Wilmot-Sitwell became Joint Global Head of Investment Banking and Chairman and CEO of UBS Group Europe, Middle East & Africa. In 2006, Mr. Wilmot-Sitwell became a member of the Group managing board. He joined the firm in 1996 as head of corporate finance in South Africa and moved to London in 1998 as head of UK investment banking. Prior to joining Warburg Dillon Read, he was head of corporate finance at SBC Warburg in South Africa, SBC Warburg. Mr. Wilmot-Sitwell graduated from Bristol University with a degree in modern history. He was born on 16 March 1961. Other activities and functions Mandates on boards of important corporations, organizations and foundations or interest groups: Alexander Wilmot-Sitwell is vice president of the “Save the Children Fund”, London. | ||
| Address | UBS AG | |||
| Bahnhofstrasse 45 | ||||
| CH-8098 Zurich | ||||
| Function(s) in UBS | Joint Global Head of Investment Banking, Chairman and CEO of UBS Group Europe, Middle East & Africa | |||
| Nationality | British | |||
| Year of initial appointment | 2008 | |||
| Robert Wolf | M | Professional history, education and date of birth Robert Wolf was appointed President of the UBS Investment Bank in 2007 and was COO of the UBS Investment Bank from 2004 to 2008. Since 2006, he has also served as Chairman and CEO of UBS Group Americas. Prior to this, Mr. Wolf served as global head of fixed income from 2002 to 2004 and held the position of global head of credit trading, research & distribution from 1998 to 2001. He joined the firm in 1994, after spending approximately 10 years at Salomon Brothers in fixed income. Mr. Wolf graduated from the Wharton School at the University of Pennsylvania with a Bachelors of Science in economics in 1984. He was born on 8 March 1962. Other activities and functions Mandates on boards of important corporations, organizations and foundations or interest groups: Robert Wolf is a member of the undergraduate executive board of Wharton School, of the athletics board of overseers of UPENN and of the Financial Services Round Table. Mr. Wolf is a member of the Council on Foreign Relations and of the committee encouraging corporate philanthropy. He is in the executive leadership council of the Multiple Myeloma Research Foundation, Norwalk, CT, and on the board of trustees of the Children’s Aid Society, New York. | ||
| Address | UBS AG | |||
| Bahnhofstrasse 45 | ||||
| CH-8098 Zurich | ||||
| Function(s) in UBS | Chairman and CEO of UBS Group Americas, President of the UBS Investment Bank | |||
| Nationality | American (US) | |||
| Year of initial appointment | 2008 | |||
| Juerg Zeltner | M | Professional history, education and date of birth Juerg Zeltner was appointed CEO Wealth Management Global and became a member of the GEB in February 2009. In November 2007, he was appointed Head of Wealth Management North, East & Central Europe and became a member of the Group Managing Board in the same year. From 2005 to 2008, he was CEO of UBS Deutschland AG, Frankfurt and became CEO of all UBS business in Benelux, Germany and Central Europe in 2007. Prior to that, he held various management positions in the Private Banking Division of UBS. Between 1987 and 1998, Juerg Zeltner was with SBC in various roles within the Private and Corporate Client Division in Bern, New York and Zurich. He graduated from the School of Economics and Business Administration in Bern and completed the Advanced Management Program at Harvard Business School. He was born on 4 May 1967. | ||
| Address | UBS AG | |||
| Bahnhofstrasse 45 | ||||
| CH-8098 Zurich | ||||
| Function(s) in UBS | CEO Wealth Management Global | |||
| Nationality | Swiss | |||
| Year of initial appointment | 20091 | |||
1 Appointed on 10 February 2009. | ||||
Establishment of the Executive Committee
The Executive Committee (EC) was established on 1 January 2009. The EC consists of the Group CEO, the Group CFO, the Group CRO and the Group GC. Under the leadership of the Group CEO, the EC is responsible for the allocation of the UBS Group’s financial resources to the business divisions – i.e. the capital, the terms and availability of funding and the risk capacity and parameters, in each case within the limits set by the BoD. Additionally, the EC sets the performance targets of the business divisions and then monitors and evaluates them. Under the auspices of the Group CEO, the EC prepares proposals for approval by the BoD and supports the BoD in its decision-making process. The EC has overall responsibility for implementing UBS’s risk management and control principles, allocating risk capacity to the business divisions and controlling the firm’s overall risk profile.
Responsibilities, authorities and organizational
principles of the GEB
Under the leadership of the Group CEO, the GEB has executive management responsibility for the Group and its business. The GEB assumes overall responsibility for the development and implementation of strategies for the Group and business divisions. The GEB, in particular the Group CEO, is responsible for the implementation and results of the firm’s business strategies. The GEB plays a key role in defining the human resources policy and the compensation principles of the Group.
| è | Refer to the “Organization Regulations of UBS AG”, which are available at www.ubs.com/governance, for more information on the authorities of the GEB |
Management contracts
UBS has not entered into management contracts with any third parties.
209
Table of Contents
Corporate governance
Senior leadership
The Group Managing Board (GMB) comprises members of business division and Corporate Center management and individuals assuming special Group functions. In the first half of 2009, the GMB will be dissolved and replaced by a new group of senior leaders reflecting the responsibilities at Group, divisional and regional levels.
210
Table of Contents
Corporate governance and compensation |
Shareholders’ participation rights
UBS is committed to shareholder participation in its decision-making process and aims to make such participation as easy as possible. More than 300,000 directly registered shareholders, as well as some 90,000 US shareholders registered via nominee companies, regularly receive written information about the firm’s activities and performance and are personally invited to shareholder meetings. Refer to the “Information policy” section of this report for further information on these documents.
Relationships with shareholders
UBS fully subscribes to the principle of equal treatment of all shareholders, who range from large investment institutions to individual investors, and regularly informs them about the development of the company of which they are co-owners.
Voting rights, restrictions and representation
UBS places no restrictions on share ownership and voting rights. Nominee companies and trustees, which normally represent a large number of individual shareholders, may hold an unlimited number of shares, but voting rights are limited to a maximum of 5% of outstanding UBS shares in order to avoid the risk of unknown shareholders with large stakes being entered in the share register. Securities clearing organizations, such as The Depository Trust Company in New York, are not subject to the 5% voting limit.
panies normally submit the proxy material to the beneficial owners and transmit the collected votes to UBS.
Statutory quorums
Shareholder resolutions, the election and re-election of members of the BoD and the appointment of the Group and statutory auditors are decided at the AGM by an absolute majority of the votes cast, excluding blank and invalid ballots. Swiss company law requires that for certain specific issues a majority of two-thirds of the votes represented at the meeting vote in favor of the resolution. These issues include, among others, the introduction of voting shares, the introduction of restrictions on the transferability of registered shares, conditional and authorized capital increases, and restrictions or exclusion of shareholders’ pre-emptive rights.
Convocation of general meetings of shareholders
The AGM normally takes place in April each year, but in any case within six months of the close of the financial year. A personal invitation including a detailed agenda and explanation of each motion is sent to every registered shareholder at least 20 days ahead of the scheduled meeting. The meeting agenda is also published in various Swiss and international newspapers and on the internet atwww.ubs.com/agm.
211
Table of Contents
Corporate governance
Placing of items on the agenda
Shareholders individually or jointly representing shares with an aggregate par value of CHF 62,500 may submit proposals for matters to be placed on the agenda for consideration at the shareholders’ meeting.
Registrations in the share register
The general rules for being entered with voting rights in the Swiss or US share registers of UBS also apply before general meetings of shareholders. There is no “closing of the share register” in the days ahead of the meeting. Registrations, including the transfer of voting rights, are processed for as long as technically possible, normally until two days before the meeting.
212
Table of Contents
Corporate governance and compensation |
Change of control and defense measures
UBS refrains from restrictions that would hinder developments initiated in or supported by the financial markets. It also does not have any specific defenses in place to prevent hostile takeovers.
Duty to make an offer
An investor who acquires more than 331/3% of all voting rights (directly, indirectly or in concert with third parties), whether they are exercisable or not, has to submit a take-over offer for all shares outstanding, according to Swiss stock exchange law. UBS has not elected to change or opt out of this rule.
Clauses on changes of control
The service agreements and employment contracts of the Chairman of the Board of Directors (BoD) and of the members of the Group Executive Board (GEB) and the Group Managing Board (GMB) do not generally contain clauses triggered by a change of control. For 2008, employment contracts contain employment notice periods of 12 months for GEB members and six to 12 months for GMB members, depending on local market practice. From 2009, employment contracts for GEB members will have a reduced notice period of six months. During this notice period they are entitled to salary and pro rata discretionary incentive awards.
213
Table of Contents
Corporate governance and compensation
Corporate governance
Auditors
External, independent auditors
At the annual general meeting (AGM) in 2008, Ernst & Young Ltd., Basel, (Ernst & Young) were re-elected as auditors for the UBS Group (Group) for a further one-year term of office. Ernst & Young assume all auditing functions according to laws, regulatory requests and the “Articles of Association of UBS AG”. The Ernst & Young lead partners in charge of the UBS audit are Andrew McIntyre and Andreas Blumer (since 2005 and 2004, respectively). Ernst & Young will be proposed for re-election at the AGM in 2009.
Fees paid to external independent auditors
The fees (including expenses) paid by UBS to its auditors are listed in the following table. In addition, Ernst & Young received CHF 31,561,000 in 2008 (CHF 31,050,000 in 2007) for audit and tax work performed on behalf of UBS investment funds, many of which have independent fund boards or trustees.
Pre-approval procedures and policies
To ensure their independence, all services provided by Ernst & Young have to be pre-approved by the audit committee of the BoD. A pre-approval may be granted either for a specific mandate or in the form of a general pre-approval authorizing a limited and well-defined type and amount of services.
Fees paid to external auditors
UBS paid the following fees (including expenses) to its external auditors Ernst & Young Ltd.:
| For the year ended | ||||||||
| In CHF thousand | 31.12.08 | 31.12.07 | ||||||
Audit | ||||||||
| Global audit fees | 45,848 | 49,000 | ||||||
| Additional services classified as audit (services required by law or statute, including work of a non-recurring nature mandated by regulators) | 9,918 | 12,718 | ||||||
Total audit | 55,766 | 61,718 | ||||||
Non-audit | ||||||||
| Audit-related fees | 8,430 | 9,779 | ||||||
| Tax advisory | 504 | 1,892 | ||||||
| Other | 1,246 | 1,699 | ||||||
Total non-audit | 10,180 | 13,370 | ||||||
214
Table of Contents
Corporate governance and compensation |
audit committee for approval. At each quarterly meeting, the committee is informed of the approvals granted by its chair.
Group Internal Audit
With 331 staff members worldwide at 31 December 2008, Group Internal Audit supports the BoD and its committees by independently assessing the effectiveness of UBS’s system of internal controls and the firm’s compliance with statutory, legal and regulatory requirements. All key issues raised by Group Internal Audit are communicated to the management responsible, to the Group Chief Executive Officer (Group CEO) and to the Chairman of the BoD via formal audit reports. In addition, the BoD’s risk and audit committees are regularly
informed about important issues. Group Internal Audit closely cooperates with internal and external legal advisors and risk control units on investigations into major control issues.
215
Table of Contents
Corporate governance and compensation
Corporate governance
Information policy
UBS provides regular information to its shareholders and to the financial community.
Financial results will be published as follows
| First quarter | 5 May 2009 | |
| Second quarter | 4 August 2009 | |
| Third quarter | 3 November 2009 | |
| Fourth quarter | 9 February 2010 | |
The annual general meeting of shareholders will take place as follows
| 2009 | 15 April 2009 | |
| 2010 | 14 April 2010 | |
UBS meets with institutional investors worldwide throughout the year. It regularly holds results presentations, special investor seminars, road shows, individual and group meetings. Where possible, meetings involve senior management as well as members of the investor relations team. UBS makes use of diverse technologies such as webcasting, audio links and cross-location video-conferencing to widen its audience and maintain contact with shareholders around the world.
| è | Refer to www.ubs.com/investors for a complete set of published reporting documents, access to recent webcasts and a selection of senior management industry conference presentations |
Financial disclosure principles
Based on discussions with analysts and investors, UBS believes that the market rewards companies that provide clear, consistent and informative disclosure about their business. Therefore, UBS aims to communicate its strategy and results in a manner that allows shareholders and investors to gain a full and accurate understanding of how the company works, what its growth prospects are and what risks the strategy
and results might entail. Feedback from analysts and investors is continually assessed and, where relevant, reflected in the firm’s quarterly and annual reports. To continue to achieve these goals, UBS applies the following principles in its financial reporting and disclosure:
| – | Transparencyin disclosure enhances understanding of the economic drivers and, as with the provision of detailed business results, builds trust and credibility. |
| – | Consistencyin disclosure within each reporting period and between reporting periods. |
| – | Simplicityin disclosure allows readers to gain the appropriate level of understanding of the performance of the firm’s businesses. |
| – | Relevancein disclosure avoids information overload by focusing on what is relevant to UBS’s stakeholders or required by regulation or statute. |
| – | Best practicein line with industry norms, leading the way to improved standards where possible. |
Financial reporting policies
UBS reports its results after the end of every quarter, including a breakdown of results by business divisions and extensive disclosures relating to credit and market risk.
US regulatory disclosure requirements
As a reporting company under the US federal securities laws (a foreign private issuer), UBS must file or submit certain reports and other information, including certain financial re-
216
Table of Contents
Corporate governance and compensation |
| è | These reports and filings, as well as materials sent to shareholders in connection with annual and extraordinary general meetings, are all available at www.ubs.com/investors |
217
Table of Contents
Corporate governance and compensation
Corporate governance
Regulation and supervision
As a Swiss-registered company, UBS’s home country regulator is the Swiss Financial Market Supervisory Authority (FINMA). However, UBS’s operations are global and are therefore regulated and supervised by the relevant authorities in each of the jurisdictions in which it conducts business. This section describes the regulation and supervision of UBS’s business in Switzerland, the firm’s home market. The regulatory and supervisory environments in the US and the UK, UBS’s next two largest areas of operations, are also discussed.
Regulation and supervision in Switzerland
FINMA, the successor organization of the Swiss Federal Banking Commission (SFBC), commenced operations on 1 January 2009. On that date, the Federal Act on the Swiss Financial Market Supervisory Authority, which the Swiss Parliament approved on 22 June 2007, went into full legal force. The effect of the Act is to merge three bodies – the Swiss Federal Banking Commission (SFBC), the Federal Office of Private Insurance, and the Anti-Money Laundering Control Authority – into FINMA. In addition to a new organizational framework which will also impact supervisory activity, the Act streamlines and harmonizes the sanctions regime applicable to financial institutions.
Swiss federal legislation
The legislation most relevant to UBS is that enacted by the Swiss Parliament and the Swiss Federal Council.
| è | Refer to the “Capital management” section of this report for more details about capital requirements |
Capital requirements for the two large banks, UBS and Credit Suisse, exceed the Swiss minimum due to a mandatory capital buffer under Pillar 2 of Basel II. The revised decree on capital
requirements issued at the end of 2008 increased the risk-based buffer and complemented it with a leverage ratio requirement, i.e. a minimum ratio of capital and balance sheet.
Regulation by FINMA
FINMA is strongly involved in the shaping of the legislative framework for banks, especially through the following mechanisms:
| – | First, FINMA has substantial influence on the drafting of Swiss federal legislation (for example, the specific ordinance concerning the prevention of money laundering of 18 December 2002, as amended). |
| – | On a more technical level, FINMA is empowered to issue circulars, 44 of which are presently effective. These include, for example, FINMA circular 08/38 on market behavior and FINMA circular 08/24 on supervision and internal controls at banks. |
Self-regulation by the SIX Swiss Exchange and the Swiss Bankers Association
Certain aspects of securities brokering, such as the organization of trading, are subject to self-regulation through the SIX Swiss Exchange (SIX), under the overall supervision of FINMA. Examples are:
| – | the Listing Regulations of 24 January 1996, as amended, and the General Conditions dated 7 September 2007 (the Listing Regulations are currently under review and amendments may go into force on 1 July 2009); and | |
| – | the Directive on the Disclosure of Management Transactions of 1 July 2005. |
| – | Agreement on the Swiss banks’ code of conduct with regard to the exercise of due diligence, 2008. |
| – | Directives on the independence of financial research, 2008. |
| – | Guidelines on the simplified prospectus for structured products, 2007. |
| – | Agreement of Swiss Banks on Deposit Insurance, 2005. |
| – | Guidelines on the handling of dormant accounts, custody accounts and safe-deposit boxes held in Swiss banks, 2000. |
218
Table of Contents
Corporate governance and compensation |
Two-tier system of supervision and direct supervision of UBS and Credit Suisse
Generally, supervision in Switzerland is based on a division of tasks between FINMA and a number of authorized audit firms. Under this two-tier supervisory system, FINMA has the responsibility for overall supervision and enforcement measures while the authorized audit firms carry out official duties on behalf of and subject to sanctions imposed by FIN-MA. The responsibility of external auditors encompasses the audit of financial statements, the reviewing of banks’ compliance with all prudential requirements and on-site audits.
Disclosures to the Swiss National Bank
While Switzerland’s banks are primarily supervised by FINMA, compliance with liquidity rules is monitored by the Swiss National Bank (SNB). The SNB also takes a direct interest in the stress testing practice of both big banks. Liquidity regulation is currently being reformed.
Regulation and supervision in the US
Banking regulation
UBS’s operations in the US are subject to a variety of regulatory regimes. It maintains branches in California, Connecticut, Illinois, New York and Florida. UBS’s branches located in California, New York and Florida are federally licensed by the Office of the Comptroller of the Currency. US branches located in Connecticut and Illinois are licensed by the state banking authority of the state in which the branch is located. Each US branch is subject to regulation and examination by its licensing authority. UBS also maintains state and federally chartered trust companies and other limited purpose banks, which are regulated by state regulators or the Office of the Comptroller of the Currency. In addition, the Board of Governors of the Federal Reserve System exercises examination and regulatory authority over UBS’s state-licensed US branches. Only the deposits of UBS’s subsidiary bank located in the
state of Utah are insured by the Federal Deposit Insurance Corporation. The regulation of the firm’s US branches and subsidiaries imposes restrictions on the activities of those branches and subsidiaries, as well as prudential restrictions, such as limits on extensions of credit to a single borrower, including UBS subsidiaries and affiliates.
219
Table of Contents
Corporate governance and compensation
Corporate governance
US regulation of other US operations
In the US, UBS Securities LLC and UBS Financial Services Inc., as well as UBS’s other US-registered broker-dealer entities, are subject to regulations that cover all aspects of the securities business, including: sales methods; trade practices among broker-dealers; use and safekeeping of customers’ funds and securities; capital structure; record-keeping; the financing of customers’ purchases; and the conduct of directors, officers and employees.
ties; and administering a dispute resolution forum for investors and registered firms. It also performs market regulation under contract for the NASDAQ Stock Market, the American Stock Exchange and the Chicago Climate Exchange.
Regulation and supervision in the UK
UBS’s operations in the UK are regulated by the Financial Services Authority (FSA), which establishes a regime of rules and guidance governing all relevant aspects of financial services businesses.
220
Table of Contents
Corporate governance and compensation |
Compliance with New York Stock Exchange listing standards on corporate governance
As a Swiss company listed on the New York Stock Exchange (NYSE), UBS complies with the NYSE corporate governance standards for foreign private issuers. In addition, UBS has voluntarily adopted the majority of NYSE governance rules for US companies.
Independence of directors
Based on the listing standards of the NYSE, UBS’s BoD has established specific criteria for defining the independence of its external members. Each external director has to personally confirm his or her compliance with the criteria, which are published on the firm’s website underwww.ubs.com/governance.
Board of Directors and its committees
UBS operates under a strict dual board structure mandated by Swiss banking law. No member of the Group Executive Board (GEB) may also be a member of the BoD and vice versa. This structure ensures the institutional independence of the entire BoD from the day-to-day management. UBS has established committees for the following BoD mandates: audit; human resources and compensation; governance and nominating; risk; strategy and corporate responsibility. Refer to the “Board of Directors” section of this report for further information on these committees – including their mandates, responsibilities and authorities – as well as their activities during 2008. In addition, the BoD elects at least one vice chairman who must be independent and who acts as the senior independent director. Sergio Marchionne has assumed this role. The BoD may elect another vice chairman who need not be independent, but has not done so at this time. More details about the vice chairman function can be found in the “Organization Regulations of UBS AG” and its annexes, which are published onwww.ubs.com/governance.
Differences from corporate governance standards relevant to US listed companies
According to the NYSE listing standards on corporate governance, foreign private issuers have to disclose any significant ways in which their corporate governance practices differ from those to be followed by domestic companies.
Responsibility of the audit committee for appointment, compensation, retention and oversight of the independent auditors
221
Table of Contents
Corporate governance and compensation
Compensation, shareholdings and loans
tee assesses the performance and qualification of the external auditors and submits its proposal for appointment, reappointment or removal to the full BoD, which brings this proposal to the shareholders for vote at annual general meetings (AGM).
Discussion of risk assessment and risk management policies by the audit committee
Assistance by audit committee of the internal audit function
Both the Chairman and risk committee of the BoD have the responsibility for and authority to supervise the internal audit function.
Responsibility of the human resources and compensation committee for oversight of management and evaluation by the Board of Directors
the GEB, are completed by the Chairman of the BoD and the human resources and compensation committee and reported to the full BoD. All BoD committees perform a self-assessment of their activities and report back to the full BoD. The BoD has direct responsibility and authority to evaluate its own performance, without preparation by a BoD committee.
Proxy statement reports of the audit and human resources and compensation committees
Shareholders’ votes on equity compensation plans
Swiss company law authorizes the BoD to approve compensation plans. Though Swiss law does not allocate such authority to the AGM, it requires that Swiss companies determine capital in their articles of association and therefore each increase of capital is required to be submitted for shareholders’ approval. This means that, if equity-based compensation plans result in a need for a capital increase, AGM approval is mandatory. If, however, shares for such plans are purchased in the market, shareholders do not have the authority to vote on their approval.
222
Table of Contents
Corporate governance and compensation |
Compensation, shareholdings and loans
The principles of compensation for UBS senior executives are designed to align their interests with those of shareholders – the creation of long-term value and sustainable shareholder returns. These principles are established by the human resources and compensation committee of the Board of Directors.
committee of the Board of Directors
Dear shareholders,
The global financial services industry is facing challenges of a magnitude not seen for decades. These challenges had a clear and widespread impact on the industry in 2008 and UBS and its peers were no exception. Executive compensation is always a high-profile issue and, during 2008, this was debated by the public, media and regulators to a greater extent than ever before.
During 2008, UBS was very proactive in addressing the current issues surrounding executive compensation. The UBS Board of Directors (BoD) established a new human resources and compensation committee in July 2008. This committee is responsible for the supervision of executive performance, the structure of employment agreements for senior executives and succession planning for members of the BoD and the Group Executive Board (GEB). Shortly after its creation, the committee commissioned an extensive review of all incentive systems used throughout the UBS Group (Group). The review was accelerated following UBS’s transaction with the Swiss National Bank in October and the principles of UBS’s new compensation model were published the following month for implementation in 2009. In parallel with this review, UBS held extensive discussions with the Swiss
Financial Market Supervisory Authority (FINMA) on a range of compensation matters, including the new compensation model and the amount of variable compensation to be paid to employees for 2008.
Although the financial services industry is facing a difficult period, competition for the very best talent remains fierce and competitive pay remains a vital tool in attracting and retaining executives. Variable compensation, in both a cash and equity form, remains a core component of UBS’s new compensation model, though the final amount awarded to executives depends on their achievement of performance targets linked to long-term, risk-adjusted value creation. As part of this change, awards granted under the performance equity plan will be directly linked to company performance for an initial period of three years. In addition, executives will be required to keep a minimum of 75% of all shares awarded to them (after taxes) for a further five years. To strengthen this clear and direct link between shareholder value and compensation expense, UBS has announced the implementation of a three-year deferral period and a bonus-malus, or “claw-back”, structure for all executive cash awards for 2009 and beyond.
The firm explicitly sought to “alter the UBS corporate culture” through its design of the new compensation model. All members of the human resources and compensation committee strongly believe the new compensation model will play a central role in the firm’s future success. Furthermore, due to its explicit goals for long-term value creation, the model inherently considers and promotes the best interests of both shareholders and the Group alike. Given its commitment to shareholder input, the BoD will introduce a non-binding vote on the principles of executive compensation for senior executives at its annual general meeting for 2009. Materials relating to this vote are located in the “Compensation principles 2009 and beyond for UBS senior executives” section of this report. Please consider the relevant documentation and take part in implementing this pioneering approach to executive compensation practices.

Joerg Wolle
Chair of the human resources
and compensation committee
223
Table of Contents
Corporate governance and compensation
Compensation, shareholdings and loans
Compensation governance
Human resources and compensation committee
The human resources and compensation committee is composed of four independent members of the Board of Directors (BoD). On 31 December 2008, the members were Joerg Wolle (committee chair), Ernesto Bertarelli, Sally Bott and Helmut Panke. The following external advisors supported the committee in 2008: Hostettler & Partner with regard to the design of UBS’s new senior executive compensation program, PricewaterhouseCoopers for the design of the performance equity plan and Towers Perrin for market data.
Authorities and responsibilities
UBS is committed to the highest standards of corporate governance. The human resources and compensation committee is responsible for reviewing UBS’s principles on total compensation and benefits for submission to the BoD. Additionally, on behalf of the BoD, the committee oversees five key areas of responsibility:
| – | reviewing and approving the design of the total compensation framework, including compensation programs and plans; | |
| – | determining the relationship between pay and performance; | |
| – | approving base salaries and annual incentive awards for senior executives; | |
| – | reviewing and approving individual employment agreements; and | |
| – | reviewing and approving the terms and conditions for GEB members who relinquish their positions. |
nex B – Responsibilities and authorities”, and “Annex C – Charter for the committees of the Board of Directors of UBS AG”. The structure is shown below.
Grant policy and decision-making process
The committee decides the target amount of variable cash and equity compensation to be awarded to each senior executive based on Group, business division and individual performance, combined with market data.
The 2009 non-binding vote on executive compensation
UBS places value upon the opinions of its shareholders. At the annual general meeting (AGM) to be held in April 2009, the firm will provide shareholders with an opportunity to express their views through a vote on the compensation principles for senior executives for 2009 and beyond. Refer to the “Compensation principles 2009 and beyond for UBS senior executives” section of this report for the relevant materials. As the ultimate decision on executive compensation is legally within the powers of the BoD, such a vote is non-binding and advisory in nature. UBS believes that this vote presents an innovative and sensible means of including shareholder participation in compensation matters.
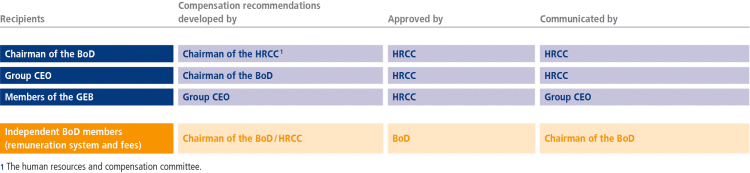
224
Table of Contents
Corporate governance and compensation |
2008 compensation for the Board of Directors and
Group Executive Board
Board of Directors remuneration
Chairman of the Board of Directors and executive members of the Board of Directors
The new compensation model was not yet applicable in 2008 and the Chairman of the Board of Directors (BoD) was therefore eligible, in principle, to receive a variable incentive award fully dependent on the Group’s financial performance. However, as announced in the compensation report published on 17 November 2008, the human resources and compensation committee decided against granting any variable compensation award to the Chairman of the BoD for 2008. The total compensation awarded to the Chairman of the BoD, Peter Kurer, for the 2008 financial year was CHF 1,565,647. This amount made him the highest-paid member of the BoD for 2008 and consisted of eight months salary as Chairman of the BoD. This amount does not include the four months of salary he received as a member of the Group Executive Board (GEB).
Remuneration for former executive members and the former Chairman of the Board of Directors
Marcel Ospel, former Chairman of the BoD, did not stand for re-election at the AGM of 23 April 2008. Stephan Haeringer, former executive vice chairman of the BoD, retired from the BoD on 2 October 2008. Marco Suter, formerly an executive member of the BoD, stepped down from the BoD on 1 October 2007
and thereafter acted as Group Chief Financial Officer (Group CFO) and as a member of the GEB until his stepping down from this role on 31 August 2008. While Marcel Ospel has retired from UBS as of April 2008, Stephan Haeringer and Marco Suter agreed with UBS to continue their services for UBS until their termination dates of 30 September 2009 and 31 August 2009 respectively.
Independent members of the Board of Directors
Reflecting their independent status, the remuneration of independent members of the BoD includes no variable component and is therefore not dependent on the financial performance of the UBS Group (Group). Fees for independent
| Compensation details and additional information for executive members of the BoD | |||||||||||||||||||||||||||||||
| CHF, except where indicateda | ||||||||||||||||||||||||||||||||
| Annual incentive | Discretionary | Contributions | ||||||||||||||||||||||||||||||
| For the | Annual incentive | award (shares | award (options | Benefits | to retirement | |||||||||||||||||||||||||||
| Name, function1 | year ended | Base salary | award (cash) | — fair value)b | — fair value)c | in kindd | benefits planse | Total | ||||||||||||||||||||||||
| Peter Kurer, Chairman | 2008 | 1,333,333 | 0 | 0 | 0 | 58,267 | 174,047 | 1,565,647 | ||||||||||||||||||||||||
| 2007 | ||||||||||||||||||||||||||||||||
| Marcel Ospel, Chairman | 2008 | 666,667 | 0 | 0 | 0 | 80,755 | 87,023 | 834,445 | ||||||||||||||||||||||||
| 2007 | 2,000,000 | 0 | 0 | 0 | 307,310 | 261,069 | 2,568,379 | |||||||||||||||||||||||||
| Stephan Haeringer, | 2008 | 1,125,000 | 0 | 0 | 0 | 108,846 | 195,802 | 1,429,648 | ||||||||||||||||||||||||
| Executive Vice Chairman | 2007 | 1,500,000 | 0 | 0 | 0 | 111,808 | 261,069 | 1,872,877 | ||||||||||||||||||||||||
| Marco Suter, | 2008 | |||||||||||||||||||||||||||||||
| Executive Vice Chairman | 2007 | 1,125,000 | 0 | 0 | 0 | 70,820 | 155,252 | 1,351,072 | ||||||||||||||||||||||||
1 2008: Peter Kurer was the only executive member in office on 31 December; Marcel Ospel did not stand for re-election in April 2008 and Stephan Haeringer stepped down during the year as a member of the BoD. Both their payments are pro-rata for the four respective nine-month periods served in their functions. 2007: Marco Suter stepped down during the year as a member of the BoD. His 2007 payment was pro-rata for the nine-month period served as Executive Vice Chairman. | ||||||||||||||||||||||||||||||||
225
Table of Contents
Corporate governance and compensation
Compensation, shareholdings and loans
| Remuneration details and additional information for independent members of the BoD | |||||||||||||||||||||||||||||||||||||||||||
| CHF, except where indicateda | ||||||||||||||||||||||||||||||||||||||||||||
| For the | ||||||||||||||||||||||||||||||||||||||||||||
| HR & | Governance & | Corporate | period | Share | ||||||||||||||||||||||||||||||||||||||||
| Audit | compensation | nominating | responsibility | Risk | Strategy | AGM to | Committee | Benefits | Additional | percent- | Number of | |||||||||||||||||||||||||||||||||
| Name, function1 | committee | committee | committee | committee | committee | committee | AGM | Base fee | retainer(s) | in kind | payments | Total | age3 | shares4,5 | ||||||||||||||||||||||||||||||
| Ernesto Bertarelli, member | M | M | 2008/2009 | 325,000 | 200,000 | 0 | 0 | 525,000 | 100 | 51,596 | ||||||||||||||||||||||||||||||||||
| M | 2007/2008 | 325,000 | 150,000 | 0 | 0 | 475,000 | 100 | 14,677 | ||||||||||||||||||||||||||||||||||||
| Sally Bott, member2 | M | M | 2008/2009 | 162,500 | 75,000 | 0 | 0 | 237,500 | 50 | 12,280 | ||||||||||||||||||||||||||||||||||
| 2007/2008 | ||||||||||||||||||||||||||||||||||||||||||||
| Rainer-Marc Frey, member2 | M | M | 2008/2009 | 162,500 | 150,000 | 0 | 0 | 312,500 | 50 | 16,158 | ||||||||||||||||||||||||||||||||||
| 2007/2008 | ||||||||||||||||||||||||||||||||||||||||||||
| Bruno Gehrig, member2 | M | 2008/2009 | 162,500 | 100,000 | 0 | 0 | 262,500 | 50 | 13,572 | |||||||||||||||||||||||||||||||||||
| 2007/2008 | ||||||||||||||||||||||||||||||||||||||||||||
| Gabrielle Kaufmann- Kohler, member | C | M | 2008/2009 | 325,000 | 250,000 | 0 | 0 | 575,000 | 50 | 29,731 | ||||||||||||||||||||||||||||||||||
| M | M | 2007/2008 | 325,000 | 250,000 | 0 | 0 | 575,000 | 50 | 9,349 | |||||||||||||||||||||||||||||||||||
| Sergio Marchionne, senior independent director, vice chairman | M | M | 2008/2009 | 325,000 | 200,000 | 0 | 250,000 | 6 | 775,000 | 100 | 76,228 | |||||||||||||||||||||||||||||||||
| M | 2007/2008 | 325,000 | 200,000 | 0 | 0 | 525,000 | 100 | 16,226 | ||||||||||||||||||||||||||||||||||||
| Rolf A. Meyer, member2 | M | M | 2008/2009 | 162,500 | 150,000 | 0 | 0 | 312,500 | 50 | 16,158 | ||||||||||||||||||||||||||||||||||
| M | C | 2007/2008 | 325,000 | 650,000 | 0 | 0 | 975,000 | 50 | 15,853 | |||||||||||||||||||||||||||||||||||
| Helmut Panke, member | M | M | 2008/2009 | 325,000 | 300,000 | 0 | 0 | 625,000 | 50 | 32,316 | ||||||||||||||||||||||||||||||||||
| C | 2007/2008 | 325,000 | 250,000 | 0 | 0 | 575,000 | 50 | 9,349 | ||||||||||||||||||||||||||||||||||||
| William G. Parrett, member2 | M | 2008/2009 | 162,500 | 100,000 | 0 | 0 | 262,500 | 50 | 13,572 | |||||||||||||||||||||||||||||||||||
| 2007/2008 | ||||||||||||||||||||||||||||||||||||||||||||
| David Sidwell, member | M | C | 2008/2009 | 325,000 | 450,000 | 0 | 0 | 775,000 | 50 | 40,072 | ||||||||||||||||||||||||||||||||||
| 2007/2008 | ||||||||||||||||||||||||||||||||||||||||||||
| Peter Spuhler, member2 | 2008/2009 | 162,500 | 0 | 0 | 0 | 162,500 | 100 | 15,945 | ||||||||||||||||||||||||||||||||||||
| M | 2007/2008 | 325,000 | 200,000 | 0 | 0 | 525,000 | 100 | 16,226 | ||||||||||||||||||||||||||||||||||||
| Peter R. Voser, member | C | M | 2008/2009 | 325,000 | 400,000 | 0 | 0 | 725,000 | 50 | 37,487 | ||||||||||||||||||||||||||||||||||
| M | 2007/2008 | 325,000 | 300,000 | 0 | 0 | 625,000 | 50 | 10,162 | ||||||||||||||||||||||||||||||||||||
| Lawrence A. Weinbach, member2 | M | 2008/2009 | 162,500 | 100,000 | 0 | 0 | 262,500 | 50 | 13,572 | |||||||||||||||||||||||||||||||||||
| C | 2007/2008 | 325,000 | 600,000 | 0 | 0 | 925,000 | 50 | 15,040 | ||||||||||||||||||||||||||||||||||||
| Joerg Wolle, member | C | M | 2008/2009 | 325,000 | 300,000 | 0 | 0 | 625,000 | 50 | 32,316 | ||||||||||||||||||||||||||||||||||
| M | 2007/2008 | 325,000 | 150,000 | 0 | 0 | 475,000 | 100 | 14,677 | ||||||||||||||||||||||||||||||||||||
| Total 2008 | 6,437,500 | |||||||||||||||||||||||||||||||||||||||||||
| Total 2007 | 5,675,000 | |||||||||||||||||||||||||||||||||||||||||||
| Legend: C = Chairman of the respective committee; M = Member of the respective committee | ||||||||||||||||||||||||||||||||||||||||||||
1 There were 11 independent BoD members in office on 31 December 2008. David Sidwell was appointed at the AGM on 23 April 2008 and Rolf A. Meyer, Peter Spuhler and Lawrence A. Weinbach stepped down from the BoD at the EGM on 2 October 2008. Sally Bott, Rainer-Marc Frey, Bruno Gehrig and Bill G. Parrett were appointed at the EGM on 2 October 2008.2 Remunerations is for six months only, as such members either stepped down or were appointed on 2 October 2008. 3 Fees are paid 50% in cash and 50% in restricted UBS shares. However, independent BoD members can elect to have 100% of their remuneration paid in restricted UBS shares. 4 For 2008, shares valued at CHF 11.38 (average price of UBS shares at SWX Europe over the last 10 trading days of February 2009), attributed with a price discount of 15%, discount price CHF 9.67. The shares are blocked for four years. For 2007, shares valued at CHF 36.15 (average price of UBS shares at SWX Europe over the last 10 trading days of February 2008), attributed with a price discount of 15%, discount price CHF 30.75. The shares are blocked for four years. 5 Number of shares is reduced in case of the 100% election to deduct social security contribution. All remuneration payments are submitted to social security contribution/taxes at source. 6 This payment is associated with the newly created function of a senior independent director. | ||||||||||||||||||||||||||||||||||||||||||||
In addition, one-off cash payments were made to the chair of the risk committee (CHF 500,000), the governance and nominating committee (CHF 300,000) and the human resources and compensation committee (CHF 200,000). These payments reflect the substantial workload of setting up the new risk committee, and expanding the mandate of the governance and nominating committee and the human resources and compensation committee. | ||||||||||||||||||||||||||||||||||||||||||||
| Total payments to all members of the BoD | |||||||
| For the | ||||||||
| CHF, except where indicateda | year ended | Total | ||||||
| Aggregate of all members of the BoD | 2008 | 10,267,240 | ||||||
| Aggregate of all members of the BoD | 2007 | 11,467,328 | ||||||
Table of Contents
Corporate governance and compensation |
members are reviewed annually by the Chairman of the BoD and the human resources and compensation committee for approval by the BoD. None of the independent members of the BoD has any contract with UBS providing for benefits upon the termination of their term of office at the BoD.
Group Executive Board compensation
In 2008, total compensation for members of the GEB was reduced significantly from the prior year. The reduction occurred because, due to the overall negative Group result, no variable compensation was granted to GEB members for the performance year 2008. The total compensation for the highest-paid member of the GEB, Marcel Rohner, amounted to CHF 1,814,702 for the financial year 2008.
Base salary
Base salaries are established to be appropriate for the role of each senior executive on an individual basis. Base salaries consist of a fixed amount of compensation and any adjustments are limited to significant changes in job responsibility.
Benefits
In order to help attract and retain the best employees in each local market where it operates, UBS provides employee benefits that are competitive within each of these markets. Changes, terminations and the introduction of new benefits are governed by the procedures contained in the “Organization Regulations of UBS AG”. UBS considers benefits to be a supplemental element of total compensation and the benefits offered may vary substantially from location to location.
| è | Refer to “Note 30 Pension and other post-retirement benefit plans” in the financial statements of this report for details on the various retirement benefit plans established in Switzerland and other major markets |
| Total compensation for all members of the GEB | |||||||||||||||||||||||||||||||
| CHF, except where indicateda | ||||||||||||||||||||||||||||||||
| Annual | ||||||||||||||||||||||||||||||||
| incentive | Discretionary | Contributions | ||||||||||||||||||||||||||||||
| Annual | award | award | to retirement | |||||||||||||||||||||||||||||
| For the | incentive | (shares; | (options; | Benefits | benefits | |||||||||||||||||||||||||||
| Name, function | year ended | Base salary | award (cash) | fair value)b | fair value)c | in kindd | planse | Total | ||||||||||||||||||||||||
| Marcel Rohner, Group Chief Executive Officer | ||||||||||||||||||||||||||||||||
| (highest-paid) | 2008 | 1,500,000 | 0 | 0 | 0 | 161,768 | 152,934 | 1,814,702 | ||||||||||||||||||||||||
| Rory Tapner, Chairman & | ||||||||||||||||||||||||||||||||
| CEO Asia Pacific (highest-paid) | 2007 | 1,291,960 | 4,501,900 | 4,501,904 | 0 | 10,256 | 900 | 10,306,920 | ||||||||||||||||||||||||
| Aggregate of all members of the GEB who | ||||||||||||||||||||||||||||||||
| were in office on 31 December 20081 | 2008 | 7,815,943 | 0 | 0 | 0 | 457,652 | 817,315 | 9,090,911 | ||||||||||||||||||||||||
| Aggregate of all members of the GEB who | ||||||||||||||||||||||||||||||||
| were in office on 31 December 20071 | 2007 | 6,995,885 | 15,305,667 | 15,305,708 | 0 | 532,706 | 912,974 | 39,052,939 | ||||||||||||||||||||||||
| Aggregate of all members of the GEB who | ||||||||||||||||||||||||||||||||
| stepped down during 20082 | 2008 | 1,614,871 | 0 | 0 | 0 | 234,838 | 258,423 | 2,108,132 | ||||||||||||||||||||||||
| Aggregate of all members of the GEB who | ||||||||||||||||||||||||||||||||
| stepped down during 20072 | 2007 | 2,511,947 | 23,042,376 | 6,750,036 | 0 | 406,567 | 275,635 | 32,986,561 | ||||||||||||||||||||||||
| 1 Number and distribution to senior executives: 2008: 12 GEB members in office on 31 December. 2007: eight GEB members in office on 31 December. 2 Number and distribution of senior executives: 2008: includes four months in office as a GEB member for Peter Kurer, eight months in office for Marco Suter and 10 months for Joe Scoby. 2007: includes nine months in office for Huw Jenkins and Clive Standish and six months for Peter Wuffli. | ||||||||||||||||||||||||||||||||
227
Table of Contents
Corporate governance and compensation
Compensation, shareholdings and loans
Cash and equity incentives
“Pay for performance” is the guiding principle of the UBS executive compensation policy. As discussed above, the human resources and compensation committee decided not to grant any variable cash or equity compensation to GEB members for 2008. This decision recognizes the overall poor performance of the Group and the failure to achieve key performance targets despite some highly successful businesses within each of the business divisions.
Replacement of forfeited awards for former employer compensation
price of CHF 28.10, as well as a cash amount of CHF 370,000. In line with market practice, these awards were granted as a replacement for compensation and benefits forfeited from their previous employment as a result of joining UBS.
Employment contracts
There were no material changes to employment agreements for existing GEB members during 2008 and the 12-month notice period remained unchanged for the financial year 2008.
Compensation to former members of the Board of
Directors and Group Executive Board
Compensation and benefits in kind paid to former members of the BoD and the GEB reflect legacy agreements still honored by UBS.
| Compensation paid to former members of the BoD and GEB1 | ||||||||||||||||||||||||||||||
| CHF, except where indicateda | |||||||||||||||||||||||||||||||
| For the | Benefits in | ||||||||||||||||||||||||||||||
| Name, function | year ended | Compensation | kind | Total | |||||||||||||||||||||||||||
| Georges Blum, former member of the BoD | 2008 | 101,579 | 101,579 | ||||||||||||||||||||||||||||
| (Swiss Bank Corporation) | 2007 | 90,803 | 90,803 | ||||||||||||||||||||||||||||
| Franz Galliker, former member of the BoD | 2008 | 69,596 | 69,596 | ||||||||||||||||||||||||||||
| (Swiss Bank Corporation) | 2007 | 62,174 | 62,174 | ||||||||||||||||||||||||||||
| Walter G. Frehner, former member of the BoD | 2008 | 74,663 | 74,663 | ||||||||||||||||||||||||||||
| (Swiss Bank Corporation) | 2007 | 73,061 | 73,061 | ||||||||||||||||||||||||||||
| Hans (Liliane) Strasser, former member of the BoD | 2008 | 32,673 | 32,673 | ||||||||||||||||||||||||||||
| (Swiss Bank Corporation) | 2007 | 42,311 | 42,311 | ||||||||||||||||||||||||||||
| Robert Studer, former member of the BoD | 2008 | 126,208 | 126,208 | ||||||||||||||||||||||||||||
| (Union Bank of Switzerland) | 2007 | 260,162 | 260,162 | ||||||||||||||||||||||||||||
| Alberto Togni, former member of the BoD | 2008 | 318,461 | 427,949 | 746,410 | |||||||||||||||||||||||||||
| (UBS) | 2007 | 318,401 | 502,478 | 820,879 | |||||||||||||||||||||||||||
| Philippe de Weck, former member of the BoD | 2008 | 109,703 | 109,703 | ||||||||||||||||||||||||||||
| (Union Bank of Switzerland) | 2007 | 129,701 | 129,701 | ||||||||||||||||||||||||||||
| Aggregate of all former members of the GEB2 | 2008 | 0 | 171,180 | 171,180 | |||||||||||||||||||||||||||
| 2007 | 0 | 257,791 | 257,791 | ||||||||||||||||||||||||||||
| Aggregate of all former members of the BoD and GEB | 2008 | 318,461 | 1,113,551 | 1,432,012 | |||||||||||||||||||||||||||
| 2007 | 318,401 | 1,418,481 | 1,736,882 | ||||||||||||||||||||||||||||
| 1 Compensation or remuneration that is connected with the former members’ activity on the BoD or GEB, or that is not at market conditions. 2 Includes two former GEB members. | |||||||||||||||||||||||||||||||
228
Table of Contents
Corporate governance and compensation |
| Explanations of compensation details for executive members of the BoD and members of the GEB: | |||
| a. | Local currencies are converted into CHF using the exchange rates as detailed in “Note 39 Currency translation rates” in the financial statements of this report. | |||
| b. | Values per share at grant: CHF 36.15/USD 33.55 for shares granted in 2008 related to the performance year 2007. CHF prices are the average price of UBS shares at SWX Europe over the last 10 trading days of February, and USD prices are the average price of UBS shares at the NYSE over the last 10 trading days of February in the year in which they are granted. | |||
| c. | No options were granted in 2009 for the performance year 2008. | |||
| d. | Benefits in kind – car leasing, company car allowance, staff discount on banking products and services, health and welfare benefits and general expense allowances – are all valued at market price. | |||
| e. | Swiss senior executives participate in the same pension plan as all other employees. Under this plan, employees receive a company contribution to the plan which covers compensation up to CHF 820,800. The retirement benefits consist of a pension, a bridging pension and a one-off payout of accumulated capital. Employees must also contribute to the plan. This figure excludes the mandatory employer’s social security contributions (AHV, ALV) but includes the portion attributed to the employer’s portion of the legal BVG requirement. The employee contribution is included in the base salary and annual incentive award components. | |||
| In both the US and the UK, senior executives participate in the same plans as all other employees. In the US there are two different plans, one of which operates on a cash balance basis, which entitles the participant to receive a company contribution based on compensation limited to USD 250,000. This plan is no longer available to new hires. US senior executives may also participate in the UBS 401K-defined contribution plan (open to all employees), which provides a company matching contribution for employee contributions. In the UK, senior executives participate in either the principal pension plan, which is limited to an earnings cap of GBP 100,000, or a grandfathered defined benefit plan which provides a pension on retirement based on career average base salary (uncapped). | ||||
229
Table of Contents
Corporate governance and compensation
Compensation, shareholdings and loans
| Shares, options and loans for the Board of Directors and Group Executive Board (at end of 2008) | ||||||||||||||||||||||||||
| Share and option ownership of members of the BoD at 31 December 2007/2008 | |||||||||||||||||||||||||
| For the | Number of | Voting rights | Number of | Potentially conferred | Type and quantity | |||||||||||||||||||||
| Name, function1 | year ended | shares held | in % | options held | voting rights in %2 | of options3 | ||||||||||||||||||||
| Peter Kurer, Chairman | 2008 | 416,088 | 0.025 | 372,995 | 0.022 | xxx: | 85 256 | |||||||||||||||||||
| xxxv: | 95 913 | |||||||||||||||||||||||||
| xli: | 95 913 | |||||||||||||||||||||||||
| xlv: | 95 913 | |||||||||||||||||||||||||
| 2007 | 292,762 | 0.026 | 350,000 | 0.031 | xxx: | 80 000 | ||||||||||||||||||||
| xxxv: | 90 000 | |||||||||||||||||||||||||
| xli: | 90 000 | |||||||||||||||||||||||||
| xlv: | 90 000 | |||||||||||||||||||||||||
| Sergio Marchionne, | 2008 | 87,926 | 0.005 | 0 | 0.000 | |||||||||||||||||||||
| senior independent director, vice chairman | 2007 | 45,800 | 0.004 | 0 | 0.000 | |||||||||||||||||||||
| Ernesto Bertarelli, member | 2008 | 89,434 | 0.005 | 0 | 0.000 | |||||||||||||||||||||
| 2007 | 48,411 | 0.004 | 0 | 0.000 | ||||||||||||||||||||||
| Sally Bott, member | 2008 | 1 | 0.000 | 0 | 0.000 | |||||||||||||||||||||
| 2007 | ||||||||||||||||||||||||||
| Rainer-Marc Frey, member | 2008 | 0 | 0.000 | 0 | 0.000 | |||||||||||||||||||||
| 2007 | ||||||||||||||||||||||||||
| Bruno Gehrig, member | 2008 | 3,000 | 0.000 | 0 | 0.000 | |||||||||||||||||||||
| 2007 | ||||||||||||||||||||||||||
| Gabrielle Kaufmann-Kohler, member | 2008 | 18,713 | 0.001 | 0 | 0.000 | |||||||||||||||||||||
| 2007 | 3,303 | 0.000 | 0 | 0.000 | ||||||||||||||||||||||
| Helmut Panke, member | 2008 | 31,971 | 0.002 | 0 | 0.000 | |||||||||||||||||||||
| 2007 | 13,206 | 0.001 | 0 | 0.000 | ||||||||||||||||||||||
| William G. Parrett, member | 2008 | 4,000 | 0.000 | 0 | 0.000 | |||||||||||||||||||||
| 2007 | ||||||||||||||||||||||||||
| David Sidwell, member | 2008 | 1 | 0.000 | 0 | 0.000 | |||||||||||||||||||||
| 2007 | ||||||||||||||||||||||||||
| Peter R. Voser, member | 2008 | 30,823 | 0.002 | 0 | 0.000 | |||||||||||||||||||||
| 2007 | 11,580 | 0.001 | 0 | 0.000 | ||||||||||||||||||||||
| Joerg Wolle, member | 2008 | 41,509 | 0.002 | 0 | 0.000 | |||||||||||||||||||||
| 2007 | 7,709 | 0.001 | 0 | 0.000 | ||||||||||||||||||||||
1This table includes vested, unvested, blocked and unblocked shares and options held by members of the BoD including related parties. 2 No conversion rights are outstanding. 3 Refer to “Note 31 Equity participation and other compensation plans” in the financial statements of this report for more information. | ||||||||||||||||||||||||||
Group Executive Board
Senior executive share ownership policy
plus cash incentive award). Due to changes in the compensation model, the share ownership policy will be changed from 2009 onwards (refer to the “Compensation principles 2009 and beyond for UBS senior executives” section of this report for more information). Senior executives are not permitted to enter into any transaction which hedges, mitigates or otherwise transfers the risk of price movements of unvested UBS shares, notional shares or stock options granted under UBS compensation plans.
230
Table of Contents
Corporate governance and compensation |
| Share and option ownership of members of the GEB at 31 December 2007/2008 | |||||||||||||||||||||||||
| For the | Number of | Voting rights | Number of | Potentially conferred | Type and quantity | |||||||||||||||||||||
| Name, function1 | year ended | shares held | in % | options held | voting rights in %2 | of options3 | ||||||||||||||||||||
| Marcel Rohner, | 2008 | 711,366 | 0.042 | 1,055,043 | 0.063 | xxv: | 31,971 | |||||||||||||||||||
| Group Chief Executive Officer | xxx: | 213,140 | ||||||||||||||||||||||||
| xxxv: | 277,082 | |||||||||||||||||||||||||
| xli: | 319,710 | |||||||||||||||||||||||||
| xlv: | 213,140 | |||||||||||||||||||||||||
| 2007 | 501,846 | 0.044 | 990,000 | 0.088 | xxv: | 30,000 | ||||||||||||||||||||
| xxx: | 200,000 | |||||||||||||||||||||||||
| xxxv: | 260,000 | |||||||||||||||||||||||||
| xli: | 300,000 | |||||||||||||||||||||||||
| xlv: | 200,000 | |||||||||||||||||||||||||
| John Cryan, | 2008 | 235,929 | 0.014 | 382,673 | 0.023 | v: | 21,362 | |||||||||||||||||||
| Group Chief Financial Officer | vi: | 20,731 | ||||||||||||||||||||||||
| vii: | 20,725 | |||||||||||||||||||||||||
| xii: | 5,454 | |||||||||||||||||||||||||
| xiii: | 5,294 | |||||||||||||||||||||||||
| xiv: | 5,292 | |||||||||||||||||||||||||
| xvii: | 23,626 | |||||||||||||||||||||||||
| xviii: | 23,620 | |||||||||||||||||||||||||
| xix: | 23,612 | |||||||||||||||||||||||||
| xxi: | 5,526 | |||||||||||||||||||||||||
| xxii: | 5,524 | |||||||||||||||||||||||||
| xxiii: | 5,524 | |||||||||||||||||||||||||
| xxvii: | 17,072 | |||||||||||||||||||||||||
| xxviii: | 17,068 | |||||||||||||||||||||||||
| xxix: | 17,063 | |||||||||||||||||||||||||
| xxxii: | 14,210 | |||||||||||||||||||||||||
| xxxiii: | 14,210 | |||||||||||||||||||||||||
| xxxiv: | 14,207 | |||||||||||||||||||||||||
| xxxviii: | 5,330 | |||||||||||||||||||||||||
| xxxix: | 5,328 | |||||||||||||||||||||||||
| xl: | 5,326 | |||||||||||||||||||||||||
| xlii: | 17,762 | |||||||||||||||||||||||||
| xliii: | 17,762 | |||||||||||||||||||||||||
| xliv: | 17,760 | |||||||||||||||||||||||||
| xlvi: | 53,285 | |||||||||||||||||||||||||
| 2007 | ||||||||||||||||||||||||||
| Markus U. Diethelm, | 2008 | 112,245 | 0.007 | 0 | 0.000 | 0 | ||||||||||||||||||||
| Group General Counsel | 2007 | |||||||||||||||||||||||||
| John A. Fraser, | 2008 | 583,812 | 0.035 | 1,144,808 | 0.068 | i: | 56,013 | |||||||||||||||||||
| Chairman and CEO | viii: | 76,380 | ||||||||||||||||||||||||
| Global Asset Management | xv: | 127,884 | ||||||||||||||||||||||||
| xx: | 127,884 | |||||||||||||||||||||||||
| xxxi: | 170,512 | |||||||||||||||||||||||||
| xxxvi: | 202,483 | |||||||||||||||||||||||||
| xli: | 213,140 | |||||||||||||||||||||||||
| xlv: | 170,512 | |||||||||||||||||||||||||
| 2007 | 461,764 | 0.041 | 1,074,232 | 0.095 | i: | 52,560 | ||||||||||||||||||||
| viii: | 71,672 | |||||||||||||||||||||||||
| xv: | 120,000 | |||||||||||||||||||||||||
| xx: | 120,000 | |||||||||||||||||||||||||
| xxxi: | 160,000 | |||||||||||||||||||||||||
| xxxvi: | 190,000 | |||||||||||||||||||||||||
| xli: | 200,000 | |||||||||||||||||||||||||
| xlv: | 160,000 | |||||||||||||||||||||||||
| Marten Hoekstra, | 2008 | 245,397 | 0.015 | 684,168 | 0.041 | ii: | 8,679 | |||||||||||||||||||
| Deputy CEO Global Wealth | iii: | 8,421 | ||||||||||||||||||||||||
| Management & Business Banking | iv: | 8,421 | ||||||||||||||||||||||||
| and Head Wealth Management US | ix: | 8,823 | ||||||||||||||||||||||||
| x: | 12,825 | |||||||||||||||||||||||||
| xi: | 8,561 | |||||||||||||||||||||||||
| xxvi: | 42,628 | |||||||||||||||||||||||||
| xxxi: | 53,285 | |||||||||||||||||||||||||
| xxxvi: | 53,285 | |||||||||||||||||||||||||
| xli: | 85,256 | |||||||||||||||||||||||||
| xlv: | 154,931 | |||||||||||||||||||||||||
| xlvii: | 239,053 | |||||||||||||||||||||||||
| 2007 | ||||||||||||||||||||||||||
| Jerker Johansson, | 2008 | 521,544 | 0.031 | 753,410 | 0.045 | xlviii: | 745,990 | |||||||||||||||||||
| Chairman and CEO Investment Bank | xlix: | 7,420 | ||||||||||||||||||||||||
| 2007 | ||||||||||||||||||||||||||
1This table includes vested and unvested shares and options held by members of the GEB including related parties. 2 No conversion rights are outstanding. 3 Refer to “Note 31 Equity participation and other compensation plans” in the financial statements of this report for more information. | ||||||||||||||||||||||||||
231
Table of Contents
Corporate governance and compensation
Compensation, shareholdings and loans
| Share and option ownership of members of the GEB on 31 December 2007/2008 (continued) | |||||||||||||||||||||||||
| For the | Number of | Voting rights | Number of | Potentially conferred | Type and quantity | |||||||||||||||||||||
| Name, function1 | year ended | shares held | in % | options held | voting rights in %2 | of options3 | ||||||||||||||||||||
| Philip J. Lofts, | 2008 | 186,434 | 0.011 | 577,723 | 0.034 | v: | 11,445 | |||||||||||||||||||
| Group Chief Risk Officer | vi: | 11,104 | ||||||||||||||||||||||||
| vii: | 11,098 | |||||||||||||||||||||||||
| xii: | 1,240 | |||||||||||||||||||||||||
| xiii: | 5,464 | |||||||||||||||||||||||||
| xiv: | 1,199 | |||||||||||||||||||||||||
| xvii: | 9,985 | |||||||||||||||||||||||||
| xviii: | 9,980 | |||||||||||||||||||||||||
| xix: | 9,974 | |||||||||||||||||||||||||
| xxi: | 1,833 | |||||||||||||||||||||||||
| xxii: | 1,830 | |||||||||||||||||||||||||
| xxiii: | 1,830 | |||||||||||||||||||||||||
| xxvii: | 35,524 | |||||||||||||||||||||||||
| xxviii: | 35,524 | |||||||||||||||||||||||||
| xxix: | 35,521 | |||||||||||||||||||||||||
| xxxv: | 117,090 | |||||||||||||||||||||||||
| xli: | 117,227 | |||||||||||||||||||||||||
| xlv: | 85,256 | |||||||||||||||||||||||||
| xlvii: | 74,599 | |||||||||||||||||||||||||
| 2007 | ||||||||||||||||||||||||||
| Walter Stuerzinger, | 2008 | 296,886 | 0.018 | 372,995 | 0.022 | xvi: | 31,971 | |||||||||||||||||||
| Chief Operating Officer, | xxx: | 63,942 | ||||||||||||||||||||||||
| Corporate Center | xxxv: | 85,256 | ||||||||||||||||||||||||
| xli: | 95,913 | |||||||||||||||||||||||||
| xlv: | 95,913 | |||||||||||||||||||||||||
| 2007 | 209,442 | 0.019 | 350,000 | 0.031 | xvi: | 30,000 | ||||||||||||||||||||
| xxx: | 60,000 | |||||||||||||||||||||||||
| xxxv: | 80,000 | |||||||||||||||||||||||||
| xli: | 90,000 | |||||||||||||||||||||||||
| xlv: | 90,000 | |||||||||||||||||||||||||
| Rory Tapner, | 2008 | 827,809 | 0.049 | 1,379,533 | 0.082 | vii: | 281,862 | |||||||||||||||||||
| Chairman and CEO Asia Pacific | xv: | 213,140 | ||||||||||||||||||||||||
| xxiv: | 213,140 | |||||||||||||||||||||||||
| xxx: | 170,512 | |||||||||||||||||||||||||
| xxxv: | 159,855 | |||||||||||||||||||||||||
| xli: | 170,512 | |||||||||||||||||||||||||
| xlv: | 170,512 | |||||||||||||||||||||||||
| 2007 | 514,365 | 0.046 | 1,294,486 | 0.115 | vii: | 264,486 | ||||||||||||||||||||
| xv: | 200,000 | |||||||||||||||||||||||||
| xxiv: | 200,000 | |||||||||||||||||||||||||
| xxx: | 160,000 | |||||||||||||||||||||||||
| xxxv: | 150,000 | |||||||||||||||||||||||||
| xli: | 160,000 | |||||||||||||||||||||||||
| xlv: | 160,000 | |||||||||||||||||||||||||
| Raoul Weil, | 2008 | 315,698 | 0.019 | 432,409 | 0.026 | xv: | 53,285 | |||||||||||||||||||
| Chairman and CEO Global Wealth | xxxv: | 102,281 | ||||||||||||||||||||||||
| Management & Business Banking, | xli: | 127,884 | ||||||||||||||||||||||||
| relinquished his duties on | xlv: | 148,959 | ||||||||||||||||||||||||
| an interim basis | 2007 | 212,934 | 0.019 | 405,752 | 0.036 | xv: | 50,000 | |||||||||||||||||||
| xxxv: | 95,976 | |||||||||||||||||||||||||
| xli: | 120,000 | |||||||||||||||||||||||||
| xlv: | 139,776 | |||||||||||||||||||||||||
| Alexander Wilmot-Sitwell, | 2008 | 304,655 | 0.018 | 353,807 | 0.021 | xxxiv: | 53,282 | |||||||||||||||||||
| Chairman and CEO, UBS Group EMEA | xxxvii: | 2,130 | ||||||||||||||||||||||||
| and Joint Global Head IB Department | xxxviii: | 35,524 | ||||||||||||||||||||||||
| xxxix: | 35,524 | |||||||||||||||||||||||||
| xl: | 35,521 | |||||||||||||||||||||||||
| xlv: | 106,570 | |||||||||||||||||||||||||
| xlvii: | 85,256 | |||||||||||||||||||||||||
| 2007 | ||||||||||||||||||||||||||
| Robert Wolf, | 2008 | 827,307 | 0.049 | 948,473 | 0.056 | xx: | 287,739 | |||||||||||||||||||
| Chairman and CEO, UBS Group | xxxi: | 213,140 | ||||||||||||||||||||||||
| Americas/President Investment Bank | xxxvi: | 127,884 | ||||||||||||||||||||||||
| xli: | 106,570 | |||||||||||||||||||||||||
| xlv: | 106,570 | |||||||||||||||||||||||||
| xlvii: | 106,570 | |||||||||||||||||||||||||
| 2007 | ||||||||||||||||||||||||||
1This table includes vested and unvested shares and options held by members of the GEB including related parties. 2 No conversion rights are outstanding. 3 Refer to “Note 31 Equity participation and other compensation plans” in the financial statements of this report for more information. | ||||||||||||||||||||||||||
232
Table of Contents
Corporate governance and compensation |
| Total of all blocked and unblocked shares held by non-executive members of the BoD1 | |||||||||||||||||||||||||
| Total | Of which non-restricted | Of which blocked until | ||||||||||||||||||||||||
| 2009 | 2010 | 2011 | 2012 | |||||||||||||||||||||||
Shares held on 31 December 2008 | 307,378 | 177,027 | 12,126 | 13,592 | 30,193 | 74,440 | ||||||||||||||||||||
| 2008 | 2009 | 2010 | 2011 | |||||||||||||||||||||||
Shares held on 31 December 2007 | 296,533 | 134,808 | 30,602 | 43,096 | 35,874 | 52,153 | ||||||||||||||||||||
1 Includes related parties. | ||||||||||||||||||||||||||
| No individual board member holds 1% or more of all shares issued. | ||||||||||||||||||||||||||
| Total of all vested and unvested shares held by the executive members of the BoD and members of the GEB1 | |||||||||||||||||||||||||||||
| Total | Of which vested | Of which vesting | ||||||||||||||||||||||||||||
| 2009 | 2010 | 2011 | 2012 | 2013 | ||||||||||||||||||||||||||
Shares held on 31 December 2008 | 5,585,170 | 2,977,807 | 1,058,881 | 595,638 | 461,376 | 319,776 | 171,692 | |||||||||||||||||||||||
| 2008 | 2009 | 2010 | 2011 | 2012 | ||||||||||||||||||||||||||
Shares held on 31 December 2007 | 6,396,479 | 3,831,550 | 796,533 | 653,726 | 526,425 | 362,709 | 225,536 | |||||||||||||||||||||||
1 Includes related parties. | ||||||||||||||||||||||||||||||
| No individual BoD or GEB member holds 1% or more of all shares issued. | ||||||||||||||||||||||||||||||
233
Table of Contents
Corporate governance and compensation
Compensation, shareholdings and loans
| Vested and unvested options held by independent members of the BoD and by members of the GEB on 31 December 2007 / 2008 | |||||||||||||||||||||||||
| Type | Number of options | Year of grant | Vesting date | Expiry date | Subscription ratio | Strike price | ||||||||||||||||||||
| i | 56,013 | 2001 | 20.02.2004 | 20.02.2009 | 1:1 | CHF 46.92 | ||||||||||||||||||||
| ii | 8,679 | 2002 | 31.01.2002 | 31.07.2012 | 1:1 | USD 21.24 | ||||||||||||||||||||
| iii | 8,421 | 2002 | 31.01.2004 | 31.07.2012 | 1:1 | USD 21.24 | ||||||||||||||||||||
| iv | 8,421 | 2002 | 31.01.2005 | 31.07.2012 | 1:1 | USD 21.24 | ||||||||||||||||||||
| v | 32,807 | 2002 | 31.01.2003 | 31.01.2012 | 1:1 | CHF 36.49 | ||||||||||||||||||||
| vi | 31,835 | 2002 | 31.01.2004 | 31.01.2012 | 1:1 | CHF 36.49 | ||||||||||||||||||||
| vii | 313,685 | 2002 | 31.01.2005 | 31.01.2012 | 1:1 | CHF 36.49 | ||||||||||||||||||||
| viii | 76,380 | 2002 | 31.01.2005 | 31.01.2012 | 1:1 | USD 21.24 | ||||||||||||||||||||
| ix | 8,823 | 2002 | 28.02.2002 | 28.08.2012 | 1:1 | USD 21.70 | ||||||||||||||||||||
| x | 12,825 | 2002 | 29.02.2004 | 28.08.2012 | 1:1 | USD 21.70 | ||||||||||||||||||||
| xi | 8,561 | 2002 | 28.02.2005 | 28.08.2012 | 1:1 | USD 21.70 | ||||||||||||||||||||
| xii | 6,694 | 2002 | 28.02.2003 | 28.02.2012 | 1:1 | CHF 36.65 | ||||||||||||||||||||
| xiii | 10,758 | 2002 | 28.02.2004 | 28.02.2012 | 1:1 | CHF 36.65 | ||||||||||||||||||||
| xiv | 6,491 | 2002 | 28.02.2005 | 28.02.2012 | 1:1 | CHF 36.65 | ||||||||||||||||||||
| xv | 394,309 | 2002 | 28.06.2005 | 28.06.2012 | 1:1 | CHF 37.90 | ||||||||||||||||||||
| xvi | 31,971 | 2002 | 28.06.2005 | 28.12.2012 | 1:1 | CHF 37.90 | ||||||||||||||||||||
| xvii | 33,611 | 2003 | 01.03.2004 | 31.01.2013 | 1:1 | CHF 27.81 | ||||||||||||||||||||
| xviii | 33,600 | 2003 | 01.03.2005 | 31.01.2013 | 1:1 | CHF 27.81 | ||||||||||||||||||||
| xix | 33,586 | 2003 | 01.03.2006 | 31.01.2013 | 1:1 | CHF 27.81 | ||||||||||||||||||||
| xx | 415,623 | 2003 | 31.01.2006 | 31.01.2013 | 1:1 | USD 22.53 | ||||||||||||||||||||
| xxi | 7,359 | 2003 | 01.03.2004 | 28.02.2013 | 1:1 | CHF 26.39 | ||||||||||||||||||||
| xxii | 7,354 | 2003 | 01.03.2005 | 28.02.2013 | 1:1 | CHF 26.39 | ||||||||||||||||||||
| xxiii | 7,354 | 2003 | 01.03.2006 | 28.02.2013 | 1:1 | CHF 26.39 | ||||||||||||||||||||
| xxiv | 213,140 | 2003 | 31.01.2006 | 31.01.2013 | 1:1 | CHF 30.50 | ||||||||||||||||||||
| xxv | 31,971 | 2003 | 31.01.2006 | 31.07.2013 | 1:1 | CHF 30.50 | ||||||||||||||||||||
| xxvi | 42,628 | 2003 | 31.01.2006 | 31.07.2013 | 1:1 | USD 22.53 | ||||||||||||||||||||
| xxvii | 52,596 | 2004 | 01.03.2005 | 27.02.2014 | 1:1 | CHF 44.32 | ||||||||||||||||||||
| xxviii | 52,592 | 2004 | 01.03.2006 | 27.02.2014 | 1:1 | CHF 44.32 | ||||||||||||||||||||
| xxix | 52,584 | 2004 | 01.03.2007 | 27.02.2014 | 1:1 | CHF 44.32 | ||||||||||||||||||||
| xxx | 532,850 | 2004 | 28.02.2007 | 27.02.2014 | 1:1 | CHF 48.69 | ||||||||||||||||||||
| xxxi | 436,937 | 2004 | 01.03.2007 | 27.02.2014 | 1:1 | USD 38.13 | ||||||||||||||||||||
| xxxii | 14,210 | 2005 | 01.03.2006 | 28.02.2015 | 1:1 | CHF 47.58 | ||||||||||||||||||||
| xxxiii | 14,210 | 2005 | 01.03.2007 | 28.02.2015 | 1:1 | CHF 47.58 | ||||||||||||||||||||
| xxxiv | 67,489 | 2005 | 01.03.2008 | 28.02.2015 | 1:1 | CHF 47.58 | ||||||||||||||||||||
| xxxv | 837,477 | 2005 | 01.03.2008 | 28.02.2015 | 1:1 | CHF 52.32 | ||||||||||||||||||||
| xxxvi | 383,652 | 2005 | 01.03.2008 | 28.02.2015 | 1:1 | USD 44.81 | ||||||||||||||||||||
| xxxvii | 2,130 | 2005 | 04.03.2007 | 04.03.2015 | 1:1 | CHF 47.89 | ||||||||||||||||||||
| xxxviii | 40,854 | 2006 | 01.03.2007 | 28.02.2016 | 1:1 | CHF 65.97 | ||||||||||||||||||||
| xxxix | 40,852 | 2006 | 01.03.2008 | 28.02.2016 | 1:1 | CHF 65.97 | ||||||||||||||||||||
| xl | 40,847 | 2006 | 01.03.2009 | 28.02.2016 | 1:1 | CHF 65.97 | ||||||||||||||||||||
| xli | 1,332,125 | 2006 | 01.03.2009 | 28.02.2016 | 1:1 | CHF 72.57 | ||||||||||||||||||||
| xlii | 17,762 | 2007 | 01.03.2008 | 28.02.2017 | 1:1 | CHF 67.00 | ||||||||||||||||||||
| xliii | 17,762 | 2007 | 01.03.2009 | 28.02.2017 | 1:1 | CHF 67.00 | ||||||||||||||||||||
| xliv | 17,760 | 2007 | 01.03.2010 | 28.02.2017 | 1:1 | CHF 67.00 | ||||||||||||||||||||
| xlv | 1,348,276 | 2007 | 01.03.2010 | 28.02.2017 | 1:1 | CHF 73.67 | ||||||||||||||||||||
| xlvi | 53,285 | 2008 | 01.03.2011 | 28.02.2018 | 1:1 | CHF 32.45 | ||||||||||||||||||||
| xlvii | 505,478 | 2008 | 01.03.2011 | 28.03.2018 | 1:1 | CHF 35.66 | ||||||||||||||||||||
| xlviii | 745,990 | 2008 | 01.03.2011 | 07.04.2018 | 1:1 | CHF 36.46 | ||||||||||||||||||||
| xlix | 7,420 | 2008 | 01.03.2011 | 06.06.2018 | 1:1 | CHF 28.10 | ||||||||||||||||||||
234
Table of Contents
Corporate governance and compensation |
Transactions in 2008
In accordance with applicable rules and regulations, management transactions in UBS shares by members of the Board of Directors (BoD) and the Group Executive Board (GEB) are publicly disclosed. On 16 May 2008, persons closely associated with them also have such reporting obligations. Transactions which require reporting are those involving all types of financial instruments whose price is primarily influenced by UBS shares. As a consequence of the issuance of new UBS shares in connection with the stock dividend approved by the extraordinary general meeting on 27 February 2008, the grandfathering of Swiss rules ended on 16 May 2008, and the EU requirements (paragraph 15a of the German Securities Trading Act) regarding the reporting of management transactions are now applicable.
235
Table of Contents
Corporate governance and compensation
Compensation, shareholdings and loans
| Loans As a global financial services provider and major Swiss domestic bank, UBS typically has business relationships with many large companies. Members of UBS’s BoD often assume management or independent board responsibilities in many of these companies. Moreover, the granting of loans to both individuals and companies is part of UBS’s ordinary business. The members of UBS’s BoD and GEB are granted loans, fixed advances and mortgages at arm’s length market terms. | ||||
| In 2008, loans granted to companies related to seven independent members of the BoD amounted to CHF 667.3 million, including guarantees, contingent liabilities and unused committed credit facilities. Refer to “Note 32 Related parties” in the financial statements of this report for more information. | ||||
| Loans granted to former members of the Board of Directors and to the Group Executive Board In 2008, all loans granted to former members of the BoD and GEB, or to their related parties, were on at arm’s length market terms. | ||||
| Loans granted to members of the BoD at 31 December 2007/2008 | |||||||||||||||
| CHF, except where indicateda | ||||||||||||||||
| For the | Other loans | |||||||||||||||
| Name, function1 | year ended | Secured loans | granted | Total | ||||||||||||
Peter Kurer, Chairman2 | 2008 | 1,261,000 | 0 | 1,261,000 | ||||||||||||
| 2007 | ||||||||||||||||
| Sergio Marchionne, Senior Independent Director, Vice Chairman | 2008 | 0 | 0 | 0 | ||||||||||||
| 2007 | 0 | 0 | 0 | |||||||||||||
| Ernesto Bertarelli, member | 2008 | 0 | 0 | 0 | ||||||||||||
| 2007 | 0 | 0 | 0 | |||||||||||||
| Sally Bott, member | 2008 | 0 | 0 | 0 | ||||||||||||
| 2007 | ||||||||||||||||
| Rainer-Marc Frey, member | 2008 | 0 | 0 | 0 | ||||||||||||
| 2007 | ||||||||||||||||
Bruno Gehrig, member2 | 2008 | 798,000 | 0 | 798,000 | ||||||||||||
| 2007 | ||||||||||||||||
| Gabrielle Kaufmann-Kohler, member | 2008 | 0 | 0 | 0 | ||||||||||||
| 2007 | 0 | 0 | 0 | |||||||||||||
| Helmut Panke, member | 2008 | 0 | 0 | 0 | ||||||||||||
| 2007 | 0 | 0 | 0 | |||||||||||||
William G. Parrett, member2 | 2008 | 1,167,659 | 0 | 1,167,659 | ||||||||||||
| 2007 | ||||||||||||||||
| David Sidwell, member | 2008 | 0 | 0 | 0 | ||||||||||||
| 2007 | ||||||||||||||||
| Peter R. Voser, member | 2008 | 0 | 0 | 0 | ||||||||||||
| 2007 | 0 | 0 | 0 | |||||||||||||
| Joerg Wolle, member | 2008 | 0 | 0 | 0 | ||||||||||||
| 2007 | 0 | 0 | 0 | |||||||||||||
| Aggregate of all members of the BoD | 3,226,659 | 0 | 3,226,659 | |||||||||||||
1 No loans have been granted to related parties of the members of the BoD at conditions not customary in the market. 2 Secured loans granted prior to their election to the BoD. | ||||||||||||||||
| Loans granted to members of the GEB at 31 December 2007/2008 | |||||||||||||||
| CHF, except where indicateda | ||||||||||||||||
| For the | Other loans | |||||||||||||||
| Name, function1 | year ended | Secured loans | granted2 | Total | ||||||||||||
| Markus U. Diethelm, Group General Counsel | 2008 | 3,900,000 | 0 | 3,900,000 | ||||||||||||
Joe Scoby, Group Chief Risk Officer3 | 2007 | 0 | 3,145,796 | 3,145,796 | ||||||||||||
Aggregate of all members of the GEB4 | 2008 | 7,740,562 | 0 | 7,740,562 | ||||||||||||
| Aggregate of all members of the GEB | 2007 | 3,487,000 | 3,145,796 | 6,632,796 | ||||||||||||
1 No loans have been granted to related parties of the members of the GEB at conditions not customary in the market. 2 Guarantees. 3 Joe Scoby stepped down as Group Chief Risk Officer on 4 November 2008. 4 Including those members of the GEB who stepped down during 2008. | ||||||||||||||||
236
Table of Contents
Corporate governance and compensation |
Advisory vote
Compensation principles 2009 and beyond
for UBS senior executives
During 2008, the UBS Board of Directors (BoD) reviewed the incentive systems of the UBS Group (Group) and examined their level of alignment with the firm’s values and long-term orientation. Towards the end of the year, UBS announced that a new compensation model would apply from 2009 onwards. At the annual general meeting (AGM) to be held in 2009, shareholders will be invited to participate in an advisory vote on the principles of this new compensation model. This section of this report outlines these principles and explains how the new model will apply to the Chairman of the BoD, independent BoD members and Group Executive Board (GEB) members.
Compensation policy
TheChairman of the UBS BoD receives a fixed base salary that comprises cash and a pre-determined, fixed number of shares.1 The Chairman is not entitled to any variable compensation.
| – | is based on long-term performance: Variable compensation remains an important component of the new model, but it is based on clear, long-term performance measures that take business risk into account. Two variable compensation schemes – one in cash (“cash balance plan”), one in equity (“performance equity plan”) – have been defined for the members of the GEB. The results of the senior executive’s business division will be a key factor in determining the amount of variable cash compensation to be awarded. In unprofitable years no new variable cash compensation will be paid. In the performance equity plan, the final number of shares that each senior executive will receive can be determined only after three years, and will be |
| based on achievement against two performance measures: economic profit and relative total shareholder return. | ||
| – | addresses risk management: Pay that depends upon long-term performance increases risk awareness. Economic profit used to determine vesting of the performance equity plan is a market-recognized standard for measuring risk-adjusted profit taking into account the cost of equity capital, while the new cash plan no longer pays out immediately, but holds compensation at risk, subject to future business performance. | |
| – | incorporates a “malus” system: A maximum of one-third of a senior executive’s variable cash incentive will be paid out at the beginning of the following year. Should certain material adverse events occur, a “malus” or negative award may be applied to the cash balance plan. Separately, the performance equity plan will deliver between zero and two times each senior executive’s target award. Failure to achieve threshold economic profit targets or a reasonable level of total shareholder return can result in a share delivery that is considerably below target or even zero. |
Compensation components
Chairman of the Board of Directors
From January 2009, the Chairman of the BoD receives a fixed base salary comprising cash and a pre-determined fixed number of UBS shares. These shares vest after four years and are subject to a “malus” in loss-making years over the vesting period. This compensation package does not include any variable, performance-dependent component, but does keep the Chairman’s pay aligned with long-term, sustainable value creation through its share component.
Independent members of the Board of Directors
The independent members of the BoD receive fixed remuneration only. Fees are paid 50% in cash and 50% in blocked
Compensation structure
| Element of compensation | Chairman of the BoD | Independent members of BoD | Members of the GEB | ||||||||||||
Fixed pay | Base salary in cash and a fixed number of restricted share awards | Fixed fee (min. 50%; max. 100% in restricted share awards) | Base salary in cash | ||||||||||||
Variable cash compensation | No | No | Cash balance plan | ||||||||||||
Variable equity compensation | No | No | Performance equity plan | ||||||||||||
Share retention policy | Yes (vesting four years after grant) | Yes (blocked for 4 years) | Yes | ||||||||||||
237
Table of Contents
Advisory vote
Corporate governance and compensation
Compensation, shareholdings and loans
UBS shares. However, members can elect to have 100% of their remuneration paid in blocked UBS shares. These shares are attributed with a price discount of 15% and restricted from sale for four years from the date they are granted.
Group Executive Board
Members of the GEB are entitled to a fixed salary. In addition, they may receive variable compensation under either the cash balance plan or the performance equity plan or a combination of both (these plans are discussed below).
Base salary
Members of the GEB receive a fixed base salary that is determined according to the skills, experience and knowledge they bring to their role in the relevant market segment.
Cash balance plan
The cash balance plan rewards long-term profitability by linking variable cash compensation to sustained business performance. The plan allows for a maximum of one-third of a senior executive’s variable cash incentive to be paid out at the beginning of the following year, with the entire cash incentive in question to be paid out over a three-year period. As such, the plan provides a multi-year reflection of performance and compensation. This is designed to ensure that the financial impact of decisions and actions taken in one period impacts the variable compensation over a longer period of time. The system is significantly strengthened through inclusion of a bonus – malus system, which allows for the application of a “malus” or negative award to the balance of variable compensation. Circumstances in which this could occur include: incurring of a financial loss; material restatement of the Group’s financial statements; substantial underachievement of individual performance targets; or the taking of excessive risk or causing of harm to UBS. If a senior executive leaves UBS, the cash balance will be kept at risk for the remaining life of the plan in order to capture any tail risk events.
Performance equity plan
The performance equity plan is forward-looking and dependent on results produced over a three-year time period. At the
start of each performance period, senior executives are advised of a potential quantity of restricted performance shares that, subject to the achievement of pre-defined business targets, is expected to vest after three years. A final decision on the actual number of shares that will vest and transfer to the senior executive is only possible after the end of the three-year period, depending upon the level of performance achieved. If UBS’s performance over the three-year period is below target, the number of shares that vest is reduced and may be zero. Should UBS’s performance over the three-year period be above target, the actual number of shares may be adjusted up to two times the original target. Performance measurement for the first award will begin in 2009, with the first possible vesting in 2012. Performance shares are not eligible for dividends during the three-year measurement period.
| – | Economic profit (EP) is an internal measure for value creation that reflects both profitability and the equity required to support business risk. It is calculated by subtracting the cost of equity capital from the annual net profit attributable to UBS shareholders. EP is only realized when the return on capital achieved is greater than the firm’s cost of capital. In order to offset accounting entries which distort the economic perspective, the EP calculation is adjusted for items not reflected in business performance. The three-year EP targets for the performance equity plan are based on the UBS strategic business plan and analyst expectations. Threshold, target and stretch performance goals have been defined for the 2009 – 2011 performance period based on expected EP performance and consideration of the expected market value associated with those EP performance levels. However, the human resources and compensation committee may revise the performance target if an exceptional event occurs that makes this either necessary or advisable. |
| – | Total shareholder return (TSR) is an external measurement of value creation that measures the total return on a UBS share, i.e. both the dividend yield and the capital appreciation of the share price. UBS measures TSR over a three-year period relative to banking industry performance as |
Performance Equity Plan: basic design
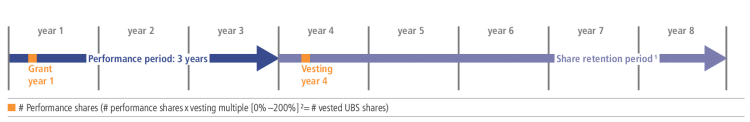
238
Table of Contents
Corporate governance and compensation |
Historic TSR ranking | |||||||||||||||
| UBS rank/ | |||||||||||||||
| Performance period | UBS TSR | # peer companies1 | |||||||||||||
| 1.4.99–1.4.02 | 4 | % | 16/27 | ||||||||||||
| 1.4.00–1.4.03 | (4 | %) | 11/27 | ||||||||||||
| 1.4.01–1.4.04 | 6 | % | 9/28 | ||||||||||||
| 1.4.02–1.4.05 | 10 | % | 9/30 | ||||||||||||
| 1.4.03–1.4.06 | 39 | % | 10/30 | ||||||||||||
| 1.4.04–1.4.07 | 18 | % | 19/30 | ||||||||||||
| 1.4.05–1.4.08 | (14 | %) | 28/30 | ||||||||||||
Vesting matrix
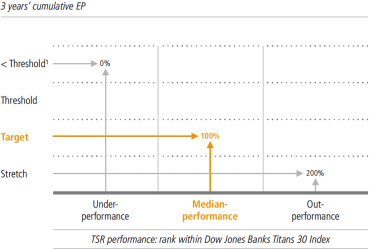
| indicated by the components of the Dow Jones Banks Titans 30 Index©. This global index comprises the top 30 companies in the banking sector, as defined by Dow Jones, and has been chosen for its relevance to UBS (banking), for transparency (known listed companies), for sector coverage (30 leading global banks assessed by market capitalization, revenues, and net profit) and for independence (managed by Dow Jones). For greater transparency and consistent with best practice, the TSR for all companies in the index will be measured in a common currency (Swiss franc). |
inal target award. If a senior executive leaves UBS before the vesting of an award, the quantity of shares received will be pro-rated to the actual service period as well as being dependent upon the full three-year performance conditions. Awards may be forfeited under certain circumstances.
Employment contracts
All GEB members will receive new employment agreements during 2009, under which notice periods will be reduced from 12 months to six months. Furthermore, any discretionary variable compensation paid to senior executives who leave UBS will, as per the new employment agreements, be based on Group, business division and personal performance. Any amounts paid would be pro-rated to the end of the notice period and would use only variable cash compensation as a basis. Furthermore, any payments would generally be made under the cash balance plan, with two-thirds of any variable cash award being kept “at risk” for the remainder of the three-year performance cycle in order to capture any tail risk events. “Golden parachutes” (in the sense of ex gratia payments made to senior executives due to termination of employment) do not exist at UBS.
239
Table of Contents
Advisory vote
Corporate governance and compensation
Compensation, shareholdings and loans
Share retention policy
Effective 1 January 2009, the Chairman of the BoD and all GEB members are required to retain 75% of all vested shares (after payment of taxes) during their time in office and for a period of eight years from the date of grant. This rule applies for all mandatory share-based compensation plans, in-
cluding the performance equity plan. For example, performance equity plan shares granted in 2009 will continue to be restricted after vesting until 2017 unless the executive leaves UBS.
Share retention policy
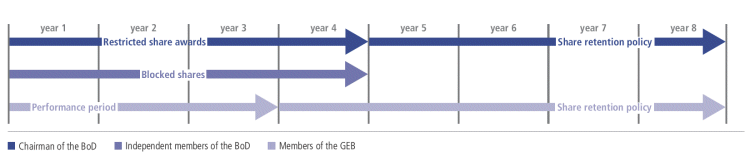
240
Table of Contents
Table of Contents
Financial information
Table of contents
242
Table of Contents
Financial information |
243
Table of Contents
Financial information
Introduction
Financial information 2008
This comprises the audited consolidated financial statements of UBS Group for 2008, 2007 and 2006, prepared according to International Financial Reporting Standards (IFRS) as issued by the International Accounting Standards Board (IASB). It
also includes the audited financial statements of UBS AG (the Parent Bank) for 2008 and 2007, prepared according to Swiss banking law. Additional disclosure required by Swiss and US regulations is included where appropriate.
244
Table of Contents
| Financial Information |
Accounting principles
UBS’s consolidated Financial Statements have been prepared in accordance with International Financial Reporting Standards (IFRS) as issued by the International Accounting Standards Board (IASB) and stated in Swiss francs (CHF). Until 2006, UBS also reconciled its Financial Statements to US Generally Accepted Accounting Principles (US GAAP).
All references to 2008, 2007 and 2006 refer to the UBS Group and the Parent Bank’s fiscal years ended 31 December 2008, 2007 and 2006. The Financial Statements for the UBS Group and the Parent Bank have been audited by Ernst & Young Ltd. An explanation of the critical accounting policies applied in the preparation of UBS’s Financial Statements is provided in the next section. The basis of UBS’s accounting is described in Note 1 to the Financial Statements.
245
Table of Contents
Financial information
Critical accounting policies
Basis of preparation and selection of policies
UBS prepares its Financial Statements in accordance with IFRS as issued by the International Accounting Standards Board. The application of certain of these accounting principles requires considerable judgment based upon estimates and assumptions that involve significant uncertainty at the time they are made. Changes in assumptions may have a significant impact on the Financial Statements in the periods where assumptions are changed. Accounting treatments where significant assumptions and estimates are used are discussed in this section, as a guide to understanding how their application affects the reported results. A broader and more detailed description of the accounting policies UBS employs is shown in Note 1 to the Financial Statements.
Fair value of financial instruments
Financial assets and financial liabilities in UBS’s trading portfolio, financial assets and liabilities designated at fair value, derivative instruments, and financial assets available-for-sale are recorded at fair value on the balance sheet. Changes in the fair value of these financial instruments are recorded in Net trading income in the income statement, except for financial assets available-for-sale, for which changes in fair value are recorded directly in equity until realized or the assets are considered impaired. Key judgments affecting this accounting policy relate to how UBS determines fair value for such assets and liabilities.
246
Table of Contents
| Financial Information |
| – | Scaling the model reserve amounts upward in line with less favorable assumptions would reduce fair value by approximately CHF 2.5 billion at 31 December 2008, by approximately CHF 2.7 billion at 31 December 2007 and approximately CHF 1.0 billion at 31 December 2006. | |
| – | Scaling the model reserve amounts downward in line with more favorable assumptions would increase fair value by approximately CHF 1.4 billion at 31 December 2008, approximately CHF 2.2 billion at 31 December 2007, and approximately CHF 1.0 billion at 31 December 2006. |
Goodwill impairment test
The ongoing crisis in the financial markets dramatically changed industry dynamics and the related decrease in market capitalization of UBS made it necessary to monitor closely whether there was indication that goodwill allocated to its cash-generating units was impaired. At 31 December 2008, equity attributable to UBS shareholders stood at CHF 33 billion. UBS’s market capitalization, excluding the shares to be issued upon conversion of the MCNs, amounted to CHF 44 billion at 31 December 2008. On the basis of the impairment testing methodology described in Note 16, UBS concluded that the year-end 2008 balances of goodwill allocated to all its segments remain recoverable. Goodwill allocated to the Investment Bank at 31 December 2008 amounted to CHF 4.3 billion (CHF 5.2 billion at 31 December 2007), to Wealth Management US CHF 3.7 billion, Wealth Management International & Switzerland CHF 1.6 billion and Global Asset Management CHF 2.0 billion. The assessment of the goodwill in the Investment Bank, which is most affected by the financial market crises, was a key focus.
247
Table of Contents
Financial information
Reclassification of financial instruments
The International Accounting Standards Board published an amendment to International Accounting Standard 39 (IAS 39 Financial Instruments: Recognition and Measurement) on 13 October 2008, under which eligible financial assets, subject to certain conditions being met, may be reclassified out of the “held for trading” category if the firm has the intent and ability to hold them for the foreseeable future or until maturity.
Consolidation of Special Purpose Entities
UBS sponsors the formation of Special Purpose Entities (SPEs) primarily to allow clients to hold investments in separate legal entities, to allow clients to jointly invest in alternative assets, for asset securitization transactions and for buying or selling credit protection. In accordance with IFRS,
248
Table of Contents
| Financial Information |
Equity compensation
IFRS 2 requires that shares and share options awarded to employees are recognized as compensation expense based on their fair value at grant date. In valuing share awards, the employee’s entitlement to receive dividends during the vesting period and post-vesting sale and hedge restrictions and non-vesting conditions are taken into account. The share options UBS issue to its employees have features that make them incomparable to options on UBS’s shares traded in active markets. Accordingly, UBS cannot determine fair value by reference to a quoted market price, but UBS rather estimates it using an option valuation model. The model, a
249
Table of Contents
Financial information
Deferred taxes
Deferred tax assets arise from a variety of sources, the most significant being: a) tax losses that can be carried forward to be utilized against profits in future years; and b) expenses recognized in the books but disallowed in the tax return until the associated cash flow occurs.
Swiss tax losses can be carried forward for seven years. The deferred tax assets recognized at 31 December 2008 have been based on future profitability assumptions over a five year horizon. The level of assets recognized may, however, need to be adjusted in the future in the event of changes to those profitability assumptions. Refer to Note 22 for further details.
250
Table of Contents
| Financial Information |
Financial information
Consolidated financial statements
Consolidated financial statements
| – | Pertain to the maintenance of records that, in reasonable detail, accurately and fairly reflect transactions and dispositions of assets; | |
| – | Provide reasonable assurance that transactions are recorded as necessary to permit preparation and fair presentation of financial statements, and that receipts and expenditures of the company are being made only in accordance with authorizations of UBS management; and | |
| – | Provide reasonable assurance regarding prevention or timely detection of unauthorized acquisition, use or disposition of the company’s assets that could have a material effect on the financial statements. |
251
Table of Contents
Table of Contents
| Financial Information |
253
Table of Contents
Table of Contents
| Financial Information |
255
Table of Contents
Financial information
Consolidated financial statements
Income statement
| For the year ended | % change from | |||||||||||||||||||
| CHF million, except per share data | Note | 31.12.08 | 31.12.07 | 31.12.06 | 31.12.07 | |||||||||||||||
Continuing operations | ||||||||||||||||||||
| Interest income | 3 | 65,890 | 109,112 | 87,401 | (40 | ) | ||||||||||||||
| Interest expense | 3 | (59,687 | ) | (103,775 | ) | (80,880 | ) | (42 | ) | |||||||||||
| Net interest income | 3 | 6,203 | 5,337 | 6,521 | 16 | |||||||||||||||
| Credit loss (expense) / recovery | (2,996 | ) | (238 | ) | 156 | |||||||||||||||
| Net interest income after credit loss expense | 3,207 | 5,099 | 6,677 | (37 | ) | |||||||||||||||
| Net fee and commission income | 4 | 22,929 | 30,634 | 25,456 | (25 | ) | ||||||||||||||
| Net trading income | 3 | (25,818 | ) | (8,353 | ) | 13,743 | (209 | ) | ||||||||||||
| Other income | 5 | 884 | 4,341 | 1,608 | (80 | ) | ||||||||||||||
| Total operating income | 1,201 | 31,721 | 47,484 | (96 | ) | |||||||||||||||
| Personnel expenses | 6 | 16,262 | 25,515 | 24,031 | (36 | ) | ||||||||||||||
| General and administrative expenses | 7 | 10,498 | 8,429 | 7,942 | 25 | |||||||||||||||
| Depreciation of property and equipment | 15 | 1,241 | 1,243 | 1,244 | 0 | |||||||||||||||
| Impairment of goodwill | 16, 38 | 341 | 0 | 0 | ||||||||||||||||
| Amortization of intangible assets | 213 | 276 | 148 | (23 | ) | |||||||||||||||
| Total operating expenses | 28,555 | 35,463 | 33,365 | (19 | ) | |||||||||||||||
| Operating profit from continuing operations before tax | (27,353 | ) | (3,742 | ) | 14,119 | (631 | ) | |||||||||||||
| Tax expense | 22 | (6,837 | ) | 1,369 | 2,998 | |||||||||||||||
| Net profit from continuing operations | (20,517 | ) | (5,111 | ) | 11,121 | (301 | ) | |||||||||||||
Discontinued operations | ||||||||||||||||||||
| Profit from discontinued operations before tax | 37 | 198 | 145 | 888 | 37 | |||||||||||||||
| Tax expense | 22 | 1 | (258 | ) | (11 | ) | ||||||||||||||
| Net profit from discontinued operations | 198 | 403 | 899 | (51 | ) | |||||||||||||||
| Net profit | (20,319 | ) | (4,708 | ) | 12,020 | (332 | ) | |||||||||||||
| Net profit attributable to minority interests | 568 | 539 | 493 | 5 | ||||||||||||||||
| from continuing operations | 520 | 539 | 390 | (4 | ) | |||||||||||||||
| from discontinued operations | 48 | 0 | 103 | |||||||||||||||||
Net profit attributable to UBS shareholders | (20,887 | ) | (5,247 | ) | 11,527 | (298 | ) | |||||||||||||
| from continuing operations | (21,037 | ) | (5,650 | ) | 10,731 | (272 | ) | |||||||||||||
| from discontinued operations | 150 | 403 | 796 | (63 | ) | |||||||||||||||
Earnings per share | ||||||||||||||||||||
| Basic earnings per share (CHF) | 8 | (7.54 | ) | (2.42 | ) | 5.19 | (212 | ) | ||||||||||||
| from continuing operations | (7.60 | ) | (2.61 | ) | 4.83 | (191 | ) | |||||||||||||
| from discontinued operations | 0.05 | 0.19 | 0.36 | (74 | ) | |||||||||||||||
| Diluted earnings per share (CHF) | 8 | (7.55 | ) | (2.43 | ) | 4.99 | (211 | ) | ||||||||||||
| from continuing operations | (7.60 | ) | (2.61 | ) | 4.64 | (191 | ) | |||||||||||||
| from discontinued operations | 0.05 | 0.19 | 0.34 | (74 | ) | |||||||||||||||
256
Table of Contents
Financial information |
Balance sheet
| % change from | ||||||||||||||||
| CHF million | Note | 31.12.08 | 31.12.07 | 31.12.07 | ||||||||||||
Assets | ||||||||||||||||
| Cash and balances with central banks | 32,744 | 18,793 | 74 | |||||||||||||
| Due from banks | 9 | 64,451 | 60,907 | 6 | ||||||||||||
| Cash collateral on securities borrowed | 10 | 122,897 | 207,063 | (41 | ) | |||||||||||
| Reverse repurchase agreements | 10 | 224,648 | 376,928 | (40 | ) | |||||||||||
| Trading portfolio assets | 11 | 271,838 | 660,182 | (59 | ) | |||||||||||
| Trading portfolio assets pledged as collateral | 11 | 40,216 | 114,190 | (65 | ) | |||||||||||
| Positive replacement values | 23 | 854,100 | 428,217 | 99 | ||||||||||||
| Financial assets designated at fair value | 12 | 12,882 | 11,765 | 9 | ||||||||||||
| Loans | 9 | 340,308 | 335,864 | 1 | ||||||||||||
| Financial investments available-for-sale | 13 | 5,248 | 4,966 | 6 | ||||||||||||
| Accrued income and prepaid expenses | 6,141 | 11,953 | (49 | ) | ||||||||||||
| Investments in associates | 14 | 892 | 1,979 | (55 | ) | |||||||||||
| Property and equipment | 15 | 6,706 | 7,234 | (7 | ) | |||||||||||
| Goodwill and intangible assets | 16 | 12,935 | 14,538 | (11 | ) | |||||||||||
| Other assets | 17, 22 | 19,094 | 20,312 | (6 | ) | |||||||||||
Total assets | 2,015,098 | 2,274,891 | (11 | ) | ||||||||||||
Liabilities | ||||||||||||||||
| Due to banks | 18 | 125,628 | 145,762 | (14 | ) | |||||||||||
| Cash collateral on securities lent | 10 | 14,063 | 31,621 | (56 | ) | |||||||||||
| Repurchase agreements | 10 | 102,561 | 305,887 | (66 | ) | |||||||||||
| Trading portfolio liabilities | 11 | 62,431 | 164,788 | (62 | ) | |||||||||||
| Negative replacement values | 23 | 851,803 | 443,539 | 92 | ||||||||||||
| Financial liabilities designated at fair value | 19 | 101,546 | 191,853 | (47 | ) | |||||||||||
| Due to customers | 18 | 474,774 | 641,892 | (26 | ) | |||||||||||
| Accrued expenses and deferred income | 10,196 | 22,150 | (54 | ) | ||||||||||||
| Debt issued | 19 | 197,254 | 222,077 | (11 | ) | |||||||||||
| Other liabilities | 20, 21, 22 | 34,040 | 61,496 | (45 | ) | |||||||||||
Total liabilities | 1,974,296 | 2,231,065 | (12 | ) | ||||||||||||
Equity | ||||||||||||||||
| Share capital | 293 | 207 | 42 | |||||||||||||
| Share premium | 25,250 | 12,433 | 103 | |||||||||||||
| Net income recognized directly in equity, net of tax | (4,471 | ) | (1,161 | ) | (285 | ) | ||||||||||
| Revaluation reserve from step acquisitions, net of tax | 38 | 38 | 0 | |||||||||||||
| Retained earnings | 14,892 | 35,795 | (58 | ) | ||||||||||||
| Equity classified as obligation to purchase own shares | (46 | ) | (74 | ) | 38 | |||||||||||
| Treasury shares | (3,156 | ) | (10,363 | ) | 70 | |||||||||||
Equity attributable to UBS shareholders | 32,800 | 36,875 | (11 | ) | ||||||||||||
| Equity attributable to minority interests | 8,002 | 6,951 | 15 | |||||||||||||
Total equity | 40,802 | 43,826 | (7 | ) | ||||||||||||
Total liabilities and equity | 2,015,098 | 2,274,891 | (11 | ) | ||||||||||||
257
Table of Contents
Financial information
Consolidated financial statements
Statement of changes in equity
| For the year ended | |||||||||||||
| CHF million | 31.12.08 | 31.12.07 | 31.12.06 | ||||||||||
Share capital | |||||||||||||
| Balance at the beginning of the year | 207 | 211 | 871 | ||||||||||
| Issue of share capital | 86 | 0 | 1 | ||||||||||
| Capital repayment by par value reduction | 0 | 0 | (631 | ) | |||||||||
| Cancellation of second trading line treasury shares | 0 | (4 | ) | (30 | ) | ||||||||
Balance at the end of the year attributable to UBS shareholders | 293 | 207 | 211 | ||||||||||
Share premium | |||||||||||||
| Balance at the beginning of the year | 8,884 | 9,870 | 9,992 | ||||||||||
| Change in accounting policy | 3,549 | 2,770 | 2,325 | ||||||||||
| Premium on shares issued and warrants exercised | 20,003 | 12 | 46 | ||||||||||
| Net premium / (discount) on treasury share and own equity derivative activity | (4,626 | ) | (560 | ) | (271 | ) | |||||||
| Employee share and share option plans | (1,961 | ) | 898 | (56 | ) | ||||||||
| Tax benefits from deferred compensation awards | (176 | ) | (557 | ) | 604 | ||||||||
| Transaction costs related to share issuances, net of tax | (423 | ) | 0 | 0 | |||||||||
Balance at the end of the year attributable to UBS shareholders | 25,250 | 12,433 | 12,640 | ||||||||||
Balance at the end of the year attributable to minority interests | 417 | 556 | 461 | ||||||||||
Balance at the end of the year | 25,667 | 12,989 | 13,101 | ||||||||||
Net income recognized directly in equity, net of tax | |||||||||||||
Foreign currency translation | |||||||||||||
| Balance at the beginning of the year | (2,627 | ) | (1,618 | ) | (432 | ) | |||||||
| Change in accounting policy | 27 | 4 | (14 | ) | |||||||||
| Movements during the year | (3,901 | ) | (986 | ) | (1,168 | ) | |||||||
Subtotal – balance at the end of the year attributable to UBS shareholders1 | (6,501 | ) | (2,600 | ) | (1,614 | ) | |||||||
Balance at the end of the year attributable to minority interests | (1,095 | ) | (480 | ) | (208 | ) | |||||||
Subtotal – balance at the end of the year | (7,596 | ) | (3,080 | ) | (1,822 | ) | |||||||
Net unrealized gains / (losses) on financial investments available-for-sale, net of tax | |||||||||||||
| Balance at the beginning of the year | 1,471 | 2,876 | 931 | ||||||||||
| Net unrealized gains / (losses) on financial investments available-for-sale | (648 | ) | 1,213 | 2,574 | |||||||||
| Impairment charges reclassified to the income statement | 42 | 14 | 19 | ||||||||||
| Realized gains reclassified to the income statement | (524 | ) | (2,638 | ) | (649 | ) | |||||||
| Realized losses reclassified to the income statement | 6 | 6 | 1 | ||||||||||
Subtotal – balance at the end of the year attributable to UBS shareholders | 347 | 1,471 | 2,876 | ||||||||||
Balance at the end of the year attributable to minority interests | 2 | 32 | 30 | ||||||||||
Subtotal – balance at the end of the year | 349 | 1,503 | 2,906 | ||||||||||
Changes in fair value of derivative instruments designated as cash flow hedges, net of tax | |||||||||||||
| Balance at the beginning of the year | (32 | ) | (443 | ) | (681 | ) | |||||||
| Net unrealized gains / (losses) on the revaluation of cash flow hedges | 1,836 | 239 | 1 | ||||||||||
| Net realized (gains) / losses reclassified to the income statement | (121 | ) | 172 | 237 | |||||||||
Subtotal – balance at the end of the year attributable to UBS shareholders | 1,683 | (32 | ) | (443 | ) | ||||||||
Balance at the end of the year attributable to minority interests | 0 | 0 | 0 | ||||||||||
Subtotal – balance at the end of the year | 1,683 | (32 | ) | (443 | ) | ||||||||
Net income recognized directly in equity, net of tax – attributable to UBS shareholders | (4,471 | ) | (1,161 | ) | 819 | ||||||||
Net income recognized directly in equity – attributable to minority interests | (1,093 | ) | (448 | ) | (178 | ) | |||||||
Balance at the end of the year | (5,564 | ) | (1,609 | ) | 641 | ||||||||
Revaluation reserve from step acquisitions, net of tax | |||||||||||||
| Balance at the beginning of the year | 38 | 38 | 101 | ||||||||||
| Movements during the year | 0 | 0 | (63 | ) | |||||||||
Balance at the end of the year attributable to UBS shareholders | 38 | 38 | 38 | ||||||||||
258
Table of Contents
Financial information |
Statement of changes in equity (continued)
| For the year ended | |||||||||||||
| CHF million | 31.12.08 | 31.12.07 | 31.12.06 | ||||||||||
Retained earnings | |||||||||||||
| Balance at the beginning of the year | 38,081 | 49,151 | 44,105 | ||||||||||
| Change in accounting policy | (2,286 | ) | (1,423 | ) | (693 | ) | |||||||
| Net profit attributable to UBS shareholders for the year | (20,887 | ) | (5,247 | ) | 11,527 | ||||||||
Dividends paid1 | (16 | ) | (4,275 | ) | (3,214 | ) | |||||||
| Cancellation of second trading line treasury shares | 0 | (2,411 | ) | (3,997 | ) | ||||||||
Balance at the end of the year attributable to UBS shareholders | 14,892 | 35,795 | 47,728 | ||||||||||
Balance at the end of the year attributable to minority interests | 234 | 16 | (25 | ) | |||||||||
Balance at the end of the year | 15,126 | 35,811 | 47,703 | ||||||||||
Equity classified as obligation to purchase own shares | |||||||||||||
| Balance at the beginning of the year | (74 | ) | (185 | ) | (133 | ) | |||||||
| Movements during the year | 28 | 111 | (52 | ) | |||||||||
Balance at the end of the year attributable to UBS shareholders | (46 | ) | (74 | ) | (185 | ) | |||||||
Treasury shares | |||||||||||||
| Balance at the beginning of the year | (10,363 | ) | (10,214 | ) | (10,739 | ) | |||||||
| Acquisitions | (367 | ) | (7,169 | ) | (8,314 | ) | |||||||
| Disposals | 7,574 | 4,605 | 4,812 | ||||||||||
| Cancellation of second trading line treasury shares | 0 | 2,415 | 4,027 | ||||||||||
Balance at the end of the year attributable to UBS shareholders | (3,156 | ) | (10,363 | ) | (10,214 | ) | |||||||
Minority interests – preferred securities | 8,444 | 6,827 | 5,831 | ||||||||||
Total equity attributable to UBS shareholders | 32,800 | 36,875 | 51,037 | ||||||||||
Total equity attributable to minority interests | 8,002 | 6,951 | 6,089 | ||||||||||
Total equity | 40,802 | 43,826 | 57,126 | ||||||||||
| Additional information: Equity attributable to minority interests | |||||||||||||
| For the year ended | |||||||||||||
| CHF million | 31.12.08 | 31.12.07 | 31.12.06 | ||||||||||
| Balance at the beginning of the year | 6,951 | 6,089 | 7,619 | ||||||||||
| Issuance of preferred securities | 1,618 | 996 | 1,219 | ||||||||||
| Other increases | 12 | 101 | 131 | ||||||||||
| Decreases and dividend payments | (532 | ) | (502 | ) | (3,191 | ) | |||||||
| Foreign currency translation | (615 | ) | (272 | ) | (182 | ) | |||||||
| Minority interest in net profit | 568 | 539 | 493 | ||||||||||
Balance at the end of the year | 8,002 | 6,951 | 6,089 | ||||||||||
259
Table of Contents
Financial information
Consolidated financial statements
Statement of changes in equity (continued)
| For the year ended | % change from | |||||||||||||||
| Number of shares | 31.12.08 | 31.12.07 | 31.12.06 | 31.12.07 | ||||||||||||
Shares issued | ||||||||||||||||
| Balance at the beginning of the year | 2,073,547,344 | 2,105,273,286 | 2,177,265,044 | (2 | ) | |||||||||||
| Issuance of share capital | 859,033,205 | 1,294,058 | 2,208,242 | |||||||||||||
| Cancellation of second trading line treasury shares | (33,020,000 | ) | (74,200,000 | ) | 100 | |||||||||||
Balance at the end of the year | 2,932,580,549 | 2,073,547,344 | 2,105,273,286 | 41 | ||||||||||||
Treasury shares | ||||||||||||||||
| Balance at the beginning of the year | 158,105,524 | 164,475,699 | 208,519,748 | (4 | ) | |||||||||||
| Acquisitions | 13,398,118 | 102,074,942 | 117,160,339 | (87 | ) | |||||||||||
| Disposals | (109,600,521 | ) | (75,425,117 | ) | (87,004,388 | ) | (45 | ) | ||||||||
| Cancellation of second trading line treasury shares | (33,020,000 | ) | (74,200,000 | ) | 100 | |||||||||||
Balance at the end of the year | 61,903,121 | 158,105,524 | 164,475,699 | (61 | ) | |||||||||||
Statement of recognized income and expense
| For the year ended | 31.12.08 | 31.12.07 | 31.12.06 | |||||||||||||||||||||||||||||||||||
| Attributable to | Attributable to | Attributable to | ||||||||||||||||||||||||||||||||||||
| UBS | UBS | UBS | ||||||||||||||||||||||||||||||||||||
| Share- | Minority | Share- | Minority | Share- | Minority | |||||||||||||||||||||||||||||||||
| CHF million | holders | interests | Total | holders | interests | Total | holders | interests | Total | |||||||||||||||||||||||||||||
| Net unrealized gains / (losses) on financial investments available-for-sale, before tax | (1,465 | ) | (30 | ) | (1,495 | ) | (1,825 | ) | 2 | (1,823 | ) | 2,610 | 9 | 2,619 | ||||||||||||||||||||||||
| Changes in fair value of derivative instruments designated as cash flow hedges, before tax | 2,236 | 0 | 2,236 | 541 | 0 | 541 | 332 | 0 | 332 | |||||||||||||||||||||||||||||
| Foreign currency translation | (3,884 | ) | (615 | ) | (4,499 | ) | (1,025 | ) | (272 | ) | (1,297 | ) | (1,251 | ) | (182 | ) | (1,433 | ) | ||||||||||||||||||||
| Tax on items transferred to / (from) equity | (196 | ) | 0 | (196 | ) | 329 | 0 | 329 | (676 | ) | 0 | (676 | ) | |||||||||||||||||||||||||
Net income recognized directly in equity, net of tax | (3,309 | ) | (645 | ) | (3,954 | ) | (1,980 | ) | (270 | ) | (2,250 | ) | 1,015 | (173 | ) | 842 | ||||||||||||||||||||||
Net income recognized in the income statement | (20,887 | ) | 568 | (20,319 | ) | (5,247 | ) | 539 | (4,708 | ) | 11,527 | 493 | 12,020 | |||||||||||||||||||||||||
Total recognized income and expense | (24,196 | ) | (77 | ) | (24,273 | ) | (7,227 | ) | 269 | (6,958 | ) | 12,542 | 320 | 12,862 | ||||||||||||||||||||||||
260
Table of Contents
Financial information |
Statement of cash flows
| For the year ended | |||||||||||||
| CHF million | 31.12.08 | 31.12.07 | 31.12.06 | ||||||||||
Cash flow from / (used in) operating activities | |||||||||||||
| Net profit | (20,319 | ) | (4,708 | ) | 12,020 | ||||||||
Adjustments to reconcile net profit to cash flow from / (used in) operating activities | |||||||||||||
| Non-cash items included in net profit and other adjustments: | |||||||||||||
| Depreciation of property and equipment | 1,241 | 1,253 | 1,325 | ||||||||||
| Impairment / amortization of goodwill and intangible assets | 554 | 282 | 196 | ||||||||||
| Credit loss expense (recovery) | 2,996 | 238 | (156 | ) | |||||||||
| Share of net profits of associates | 6 | (120 | ) | (117 | ) | ||||||||
| Deferred tax expense / (benefit) | (7,020 | ) | (371 | ) | (303 | ) | |||||||
| Net loss / (gain) from investing activities | (797 | ) | (4,085 | ) | (2,092 | ) | |||||||
| Net loss / (gain) from financing activities | (47,906 | ) | 3,779 | 3,659 | |||||||||
| Net (increase) / decrease in operating assets: | |||||||||||||
| Net due from / to banks | (16,588 | ) | (60,762 | ) | 80,269 | ||||||||
| Reverse repurchase agreements and cash collateral on securities borrowed | 236,497 | 173,433 | (61,382 | ) | |||||||||
| Trading portfolio, net replacement values and financial assets designated at fair value | 350,094 | 60,729 | (177,087 | ) | |||||||||
| Loans / due to customers | (174,443 | ) | 47,955 | 64,029 | |||||||||
| Accrued income, prepaid expenses and other assets | 7,229 | (2,408 | ) | (4,263 | ) | ||||||||
| Net increase / (decrease) in operating liabilities: | |||||||||||||
| Repurchase agreements, cash collateral on securities lent | (220,935 | ) | (271,060 | ) | 66,370 | ||||||||
| Accrued expenses and other liabilities | (32,550 | ) | 7,430 | 14,755 | |||||||||
| Income taxes paid | (887 | ) | (3,663 | ) | (2,607 | ) | |||||||
Net cash flow from / (used in) operating activities | 77,172 | (52,078 | ) | (5,384 | ) | ||||||||
Cash flow from / (used in) investing activities | |||||||||||||
| Investments in subsidiaries and associates | (1,502 | ) | (2,337 | ) | 2,856 | ||||||||
| Disposal of subsidiaries and associates | 1,686 | 885 | 1,154 | ||||||||||
| Purchase of property and equipment | (1,217 | ) | (1,910 | ) | (1,793 | ) | |||||||
| Disposal of property and equipment | 69 | 134 | 499 | ||||||||||
| Net (investment in) / divestment of financial investments available-for-sale | (712 | ) | 5,981 | 1,723 | |||||||||
Net cash flow from / (used in) investing activities | (1,676 | ) | 2,753 | 4,439 | |||||||||
Cash flow from / (used in) financing activities | |||||||||||||
| Net money market paper issued / (repaid) | (40,637 | ) | 32,672 | 16,921 | |||||||||
| Net movements in treasury shares and own equity derivative activity | 623 | (2,771 | ) | (3,179 | ) | ||||||||
| Capital issuance | 23,135 | 0 | 1 | ||||||||||
| Capital repayment by par value reduction | 0 | 0 | (631 | ) | |||||||||
| Dividends paid | 0 | (4,275 | ) | (3,214 | ) | ||||||||
| Issuance of long-term debt, including financial liabilities designated at fair value | 103,087 | 110,874 | 97,675 | ||||||||||
| Repayment of long-term debt, including financial liabilities designated at fair value | (92,894 | ) | (62,407 | ) | (59,740 | ) | |||||||
Increase in minority interests1 | 1,661 | 1,094 | 1,331 | ||||||||||
| Dividends paid to / decrease in minority interests | (532 | ) | (619 | ) | (1,072 | ) | |||||||
Net cash flow from / (used in) financing activities | (5,557 | ) | 74,568 | 48,092 | |||||||||
| Effects of exchange rate differences | (39,378 | ) | (12,228 | ) | (2,099 | ) | |||||||
Net increase / (decrease) in cash and cash equivalents | 30,561 | 13,015 | 45,048 | ||||||||||
| Cash and cash equivalents, beginning of the year | 149,105 | 136,090 | 91,042 | ||||||||||
Cash and cash equivalents, at the end of the year | 179,666 | 149,105 | 136,090 | ||||||||||
Cash and cash equivalents comprise: | |||||||||||||
| Cash and balances with central banks | 32,744 | 18,793 | 3,495 | ||||||||||
Money market paper2 | 86,732 | 77,215 | 87,144 | ||||||||||
| Due from banks with original maturity of less than three months | 60,190 | 53,097 | 45,451 | ||||||||||
Total | 179,666 | 149,105 | 136,090 | ||||||||||
261
Table of Contents
Financial information
Consolidated financial statements
Statement of cash flows (continued)
| For the year ended | |||||||||||||
| CHF million | 31.12.08 | 31.12.07 | 31.12.06 | ||||||||||
Additional information | |||||||||||||
| Cash received as interest | 68,450 | 103,828 | 79,805 | ||||||||||
| Cash paid as interest | 61,681 | 97,358 | 76,109 | ||||||||||
| Cash received as dividends on equities (incl. Associates, see Note 14) | 2,779 | 5,313 | 4,839 | ||||||||||
Significant non-cash investing and financing activities | |||||||||||||
| Private equity investments, deconsolidation | |||||||||||||
| Property and equipment | 33 | 24 | 264 | ||||||||||
| Goodwill and intangible assets | 22 | ||||||||||||
| Minority interests | 62 | ||||||||||||
| Motor-Columbus, deconsolidation | |||||||||||||
| Financial investments available-for-sale | 178 | ||||||||||||
| Property and equipment | 2,229 | ||||||||||||
| Goodwill and intangible assets | 951 | ||||||||||||
| Debt issued | 718 | ||||||||||||
| Minority interests | 2,057 | ||||||||||||
| Acquisition of ABN AMRO’s Global Futures and Options Business | |||||||||||||
| Property and equipment | 13 | ||||||||||||
| Goodwill and intangible assets | 428 | ||||||||||||
| Acquisition of Banco Pactual | |||||||||||||
| Financial investments available-for-sale | 36 | ||||||||||||
| Property and equipment | 9 | ||||||||||||
| Goodwill and intangible assets | 2,218 | ||||||||||||
| Debt issued | 1,496 | ||||||||||||
| Acquisition of Piper Jaffray | |||||||||||||
| Goodwill and intangible assets | 605 | ||||||||||||
| Acquisition of McDonald Investments branch network | |||||||||||||
| Property and equipment | 3 | ||||||||||||
| Goodwill and intangible assets | 262 | ||||||||||||
| Acquisition of Daehan Investment Trust Management Company | |||||||||||||
| Property and equipment | 2 | ||||||||||||
| Goodwill and intangible assets | 224 | ||||||||||||
| Minority interests | 60 | ||||||||||||
| Acquisition of Caisse Centrale de Réescompte Group (CCR) | |||||||||||||
| Property and equipment | 5 | ||||||||||||
| Goodwill and intangible assets | 405 | ||||||||||||
| Debt issued | 114 | ||||||||||||
| Acquisition of VermogensGroep | |||||||||||||
| Property and equipment | 2 | ||||||||||||
| Goodwill and intangible assets | 173 | ||||||||||||
262
Table of Contents
Financial information |
Financial information
Notes to the consolidated financial statements
Notes to the consolidated financial statements
Note 1 Summary of significant accounting policies
a) Significant accounting policies
1) Basis of accounting
2) Use of estimates in the preparation of Financial Statements
3) Subsidiaries, associates and jointly controlled entities
Equity attributable to minority interests is presented in the consolidated balance sheet within equity, separately from equity attributable to UBS shareholders. Net profit attributable to minority interests is shown separately in the income statement.
263
Table of Contents
Financial information
Notes to the consolidated financial statements
principally through a sale transaction rather than through continuing use – see parts 17) and 26). Major lines of business and subsidiaries that were acquired exclusively with the intent for resale are presented as discontinued operations in the income statement in the period when the sale occurred or it becomes highly probable that a sale will occur within 12 months – see part 26).
4) Recognition and derecognition of financial instruments
5) Determination of fair value
For details on the determination of fair value, including those on fair value measurements for US student loan auction rate securities, monolines, leveraged finance transactions, US and non-US reference linked notes, US commercial mortgage backed securities and other instruments which were determined relevant for specific disclosure refer to Note 27.
264
Table of Contents
Financial information |
A breakdown of fair values of financial instruments measured on the basis of quoted market prices in active markets (level 1), valuation techniques reflecting market observable inputs (level 2), and valuation techniques reflecting significant non-market-observable inputs (level 3) is provided in Note 27.
6) Trading portfolio assets and liabilities
sified on UBS’s balance sheet from Trading portfolio assets to Trading portfolio assets pledged as collateral, if the transferee has received the right to sell or repledge them.
7) Financial assets and Financial liabilities designated at fair value through profit or loss (“Fair Value Option”)
| a) | they are hybrid instruments which consist of a debt host and an embedded derivative component, or | |
| b) | they are items that are part of a portfolio which is risk managed on a fair value basis and reported to senior management on that basis, or | |
| c) | the application of the fair value option reduces or eliminates an accounting mismatch that would otherwise arise. |
265
Table of Contents
Financial information
Notes to the consolidated financial statements
value basis. Fair value changes related to financial instruments designated at fair value through profit or loss are recognized in Net trading income.
8) Financial investments available-for-sale
expected within the foreseeable future. For a non-quoted financial investment available-for-sale (debt and equity instruments), the recoverable amount is determined by applying recognized valuation techniques. The standard method applied for non-quoted equity instruments is based on the multiple of earnings observed in the market for comparable companies. Management may adjust valuations determined in this way based on its judgment. For non-quoted debt instruments, UBS typically determines the recoverable amount by applying the discounted cash flow method.
9) Loans and receivables
266
Table of Contents
Financial information |
Commitments
10) Allowance and provision for credit losses
reasonable assurance of timely collection of principal and interest in accordance with the original contractual terms of the claim or equivalent value.
11) Securitizations
267
Table of Contents
Financial information
Notes to the consolidated financial statements
ceivables” and several student loan auction rate securities, which are considered securitized instruments, are classified as loans and receivables after acquiring them from clients.
12) Securities borrowing and lending
Consideration exchanged in financing transactions (i.e. interest received or paid) is recognized on an accrual basis and recorded as Interest income or Interest expense.
13) Repurchase and reverse repurchase transactions
14) Derivative instruments and hedge accounting
268
Table of Contents
Financial information |
into derivatives for trading purposes, realized and unrealized gains and losses are recognized in Net trading income.
Hedge accounting
Fair value hedges
statement. The fair value change of the hedged item in a portfolio hedge of interest rate risks is reported separately from the hedged portfolio in Other assets or Other liabilities as appropriate. If the hedge relationship is terminated for reasons other than the derecognition of the hedged item, the difference between the carrying value of the hedged item at that point and the value at which it would have been carried had the hedge never existed (the “unamortized fair value adjustment”) is, in the case of interest-bearing instruments, amortized to the income statement over the remaining term of the original hedge, while for non-interest-bearing instruments that amount is immediately recognized in earnings. If the hedged item is derecognized, e.g. due to sale or repayment, the unamortized fair value adjustment is recognized immediately in profit or loss.
Cash flow hedges
Economic hedges which do not qualify for hedge accounting
269
Table of Contents
Financial information
Notes to the consolidated financial statements
Embedded derivatives
15) Cash and cash equivalents
16) Physical commodities
17) Property and equipment
Classification for own-used property
capital appreciation, the classification is based on whether or not these portions can be sold separately. If the portions of the property can be sold separately, they are separately accounted for as own-used property and investment property. If the portions cannot be sold separately, the whole property is classified as own-used property unless the portion used by the Group is minor. The classification of property is reviewed on a regular basis to account for major changes in its usage.
Leasehold improvements
Software
| Properties, excluding land | Not exceeding 50 years | |
| Leasehold improvements | Residual lease term, but not exceeding 10 years | |
| Other machines and equipment | Not exceeding 10 years | |
| IT, software and communication | Not exceeding 5 years | |
Property held for sale
Investment property
270
Table of Contents
Financial information |
change. UBS employs internal real estate experts to determine the fair value of investment property by applying recognized valuation techniques. In cases where prices of recent market transactions of comparable properties are available, fair value is determined by reference to these transactions.
18) Goodwill and intangible assets
19) Income taxes
tax purposes, which will result in taxable amounts in future periods. Deferred tax assets are recognized for temporary differences that will result in deductible amounts in future periods, but only to the extent it is probable that sufficient taxable profits will be available against which these differences can be utilized.
20) Debt issued
Long-term senior and subordinated
debt without embedded derivative
Long-term debt with embedded derivative
(related to UBS AG shares)
271
Table of Contents
Financial information
Notes to the consolidated financial statements
date if they require physical settlement. When the hybrid debt instrument is issued, a portion of the net proceeds is allocated to the debt component based on its fair value. The determination of fair value is generally based on quoted market prices for UBS debt instruments with comparable terms. The debt component is subsequently measured at amortized cost or at fair value through profit or loss, if the fair value option is applied. The remaining amount of the net proceeds is allocated to the equity component and reported in Share premium. Subsequent changes in fair value of the separated equity component are not recognized. However, if the hybrid debt instrument or the embedded derivative related to UBS AG shares is to be cash settled or if it contains a settlement alternative, then the separated derivative is accounted for as a freestanding derivative, with changes in fair value recorded in Net trading income unless the entire hybrid debt instrument is designated at fair value through profit or loss (“Fair Value Option”) – refer to part 7).
Other long-term debt with embedded derivative (not
related to UBS AG shares)
21) Post-employment benefits
UBS uses the projected unit credit method to determine the present value of its defined benefit obligations and the related current service cost and, where applicable, past service cost.
| a) | 10% of present value of the defined benefit obligation at that date (before deducting the fair value of plan assets); and | |
| b) | 10% of the fair value of any plan assets at that date. | |
The unrecognized actuarial gains and losses exceeding the greater of these two values are recognized in the income statement over the expected average remaining working lives of the employees participating in the plans.
22) Equity participation and other compensation plans
272
Table of Contents
Financial information |
ically have a three-year tiered vesting structure which means awards vest in one-third increments over that period. Such awards may contain provisions that shorten the required service period due to retirement eligibility. In such instances, UBS recognizes compensation expense over the shorter of the legal vesting period and the period from grant to the retirement eligibility date of the employee. Forfeiture of these awards results in a reversal of compensation expense.
Other compensation plans
23) Amounts due under unit-linked investment contracts
Note 20) on the balance sheet. These contracts allow investors to invest in a pool of assets through investment units issued by a UBS subsidiary. The unit holders receive all rewards and bear all risks associated with the reference asset pool. The financial liability represents the amount due to unit holders and is equal to the fair value of the reference asset pool.
24) Provisions
25) Equity, treasury shares and contracts on UBS shares
Contracts with gross physical settlement
Contracts with net cash settlement or settlement option for counterparty
Physically settled written put options and forward share purchase contracts
273
Table of Contents
Financial information
Notes to the consolidated financial statements
ity is subsequently accreted, using the effective interest rate method, over the life of the contract to the nominal purchase obligation by recognizing interest expense. Upon settlement of the contract, the liability is derecognized, and the amount of equity originally recognized as a liability is reclassified within Equity to Treasury shares. The premium received for writing put options is recognized directly in Share premium.
Minority interests
Trust preferred securities issued
26) Discontinued operations and non-current assets held for sale
cludes the net total of operating profit and loss before tax from operations including net gain or loss on sale before tax or measurement to fair value less costs to sell and discontinued operations tax expense. A component of an entity comprises operations and cash flows that can be clearly distinguished, operationally and for financial reporting purposes, from the rest of UBS’s operations and cash flows. If an entity or a component of an entity is classified as a discontinued operation, UBS restates prior periods in the income statement – see part 3). Refer to Note 37 for details.
27) Leasing
28) Fee income
274
Table of Contents
Financial information |
the service has been completed. Performance-linked fees or fee components are recognized when the recognition criteria are fulfilled. Loan commitment fees on lending arrangements where the initial expectation is that the loan will be drawn down at some point, are deferred until the loan is drawn down, and then recognized as an adjustment to the effective yield over the life of the loan.
29) Foreign currency translation
30) Earnings per share (EPS)
vertible debt securities or other contracts to issue ordinary shares were converted or exercised into ordinary shares.
31) Segment reporting
275
Table of Contents
Financial information
Notes to the consolidated financial statements
Segment assets and Segment liabilities:Both segment assets and segment liabilities are reported in the management reporting system and shown before the elimination of inter-company balances. Due to the central treasury approach, equity must be allocated to the segments. The allocation basis is average equity attributed, a concept which was introduced in 2008 (for a detailed discussion on the equity attribution framework, refer to the section “Capital management” of this report). Total segment assets and total segment liabilities are derived by taking into account any remaining funding surplus or requirements in each business division. Prior to 2008, the equity was allocated to the segments based pri-
marily on regulatory capital requirements. Refer to Note 2a.
32) Netting
Effective in 2008
Share-based Payment: Vesting Conditions and Cancellationsand fully restated the two comparative prior years. The amended standard clarifies the definition of vesting conditions and the accounting treatment of cancellations. Under the amended standard, UBS is required to distinguish between vesting conditions (such as service and performance conditions) and non-vesting conditions.
the year ended 31 December 2006 by CHF 0.33 and CHF 0.31, respectively. In order to provide comparative information, these amounts also reflect the retrospective adjustments to shares outstanding in 2007 due to the capital increase and the share dividend paid in 2008.
Reclassifications of financial instruments
276
Table of Contents
Financial information |
Recognition of a defined benefit asset for the Swiss pension plan
Revenues from Industrial Holdings and Goods and materials purchased
Changes to segment reporting
Trading portfolio assets pledged as collateral
IFRIC 13Customer Loyalty Programmes
IFRIC 14The Limit on a Defined Benefit Asset Minimum Funding Requirements and their Interaction –IAS 19
IAS 23Borrowing Costs
Effective in 2007 and earlier
277
Table of Contents
Financial information
Notes to the consolidated financial statements
to the audited sections inRisk and treasury management). The disclosure principles of IFRS 7 complement the principles for recognizing, measuring and presenting financial assets and financial liabilities in IAS 32Financial Instruments: Presentationand IAS 39Financial Instruments: Recognition and Measurement.
Netting
Syndicated finance revenues
IFRIC 7Applying the Restatement Approach under IAS 29 Financial Reporting in Hyperinflationary Economies
IFRIC 8Scope of IFRS 2
ments of the entity. This includes transactions in which the entity cannot identify specifically some or all of the goods or services received. The unidentifiable goods or services received (or to be received) should be measured as the difference between the fair value of the share-based payment and the fair value of any identifiable goods or services received (or to be received). Measurement of the unidentifiable goods or services received should take place at the grant date. However, for cash-settled transactions, the liability should be remeasured at each reporting date until it is settled.
IFRIC 9Reassessment of Embedded Derivatives
IFRIC 10Interim Financial Reporting and Impairment
IFRIC 11 IFRS 2:Group and Treasury Share Transactions
IAS 39Financial Instruments: Recognition and Measurement – Amendment to the Fair Value Option
278
Table of Contents
Financial information |
ary 2006. On the transition date of the revised standard, 1 January 2006, UBS did not apply the fair value option to any previously recognized financial asset or financial liability for which the fair value option had not been used under the previous fair value option guidance.
Staff Accounting Bulletin (SAB) 108
sidering the Effects of Prior Year Misstatements when Quantifying Misstatements in Current Year Financial Statements,UBS elected to adopt a modified quantitative framework for assessing whether the financial statement effect of a misstatement is material because it renders a better evaluation of those effects. This method, which UBS adopted in December 2006, uses a dual approach for quantifying the effect of a misstatement that considers both the carryover and reversing effects of prior year misstatements.
c) International Financial Reporting Standards and Interpretations to be adopted in 2009 and later
Effective in 2009
IAS 1 (revised)Presentation of Financial Statementsand IAS 32 (revised)Financial Instruments: Presentation
changes in equity and of comprehensive income: UBS will continue presenting owner changes in equity in the statement of changes in equity, but the detailed information related to non-owner changes in equity will be removed from the statement of changes in equity and presented in the statement of comprehensive income. The revised standard does not change the recognition, measurement or disclosure of specific transactions addressed in other IFRSs.
Amendments to IFRS 1First-time Adoption of International Financial Reporting Standardsand IAS 27Consolidated and Separate Financial Statements – Cost of an Investment in a Subsidiary, Jointly Controlled Entity or Associate
279
Table of Contents
Financial information
Notes to the consolidated financial statements
IFRIC 15Agreements for the Construction of Real Estate
IFRIC 16Hedges of a Net Investment in a Foreign Operation
Effective in 2010, if not adopted early
IFRIC 17Distributions of Non-cash Assets to Owners
IFRIC 18Transfers of Assets from Customers
ceived on or after 1 July 2009. The IFRIC clarifies how to account for transfers of items of property, plant and equipment by entities that receive such transfers from their customers. The interpretation also applies to agreements in which an entity receives cash from a customer when that amount of cash must be used only to construct or acquire an item of property, plant and equipment and the entity must then use that item to provide the customer with ongoing access to a supply of goods and/or services. UBS is currently assessing the impact of this interpretation on its Financial Statements.
IFRS 3 Business Combinations and IAS 27 Consolidated and Separate Financial Statements
| – | Contingent consideration will be recognized at fair value as part of the consideration transferred at the acquisition date. Currently contingent consideration is only recognized once it meets the probability and reliably measurable criteria. | |
| – | Non-controlling interests in an acquiree will either be measured at fair value or as the non-controlling interest’s proportionate share of the fair value of net identifiable assets of the entity acquired. The option is available on a transaction-by-transaction basis. | |
| – | Transaction costs incurred by the acquirer will no longer be part of the acquisition cost but will have to be expensed as incurred. |
280
Table of Contents
Financial information |
Note 2a Segment reporting
In 2008, UBS’s businesses were organized on a worldwide basis into three business divisions and a Corporate Center. The business division Global Wealth Management & Business Banking consists of three segments: Wealth Management International & Switzerland, Wealth Management US and Business Banking Switzerland. The business divisions Investment Bank and Global Asset Management constitute one segment each. In total, UBS reports five business segments and a Corporate Center in 2008. The Corporate Center includes all corporate functions, elimination items as well as the remaining industrial holdings activities and is not considered a business segment. Refer to Note 1 of this report for information about UBS’s new segment structure, effective as of first quarter 2009.
Global Wealth Management & Business Banking
vestment policy and strategy. Refer to Note 1 of this report for the changes to the structure of this business division, effective first quarter 2009.
Global Asset Management
Investment Bank
Corporate Center
281
Table of Contents
Financial information
Notes to the consolidated financial statements
Note 2a Segment reporting (continued)
For the year ended 31 December 2008
| CHF million | ||
| Internal charges and transfer pricing adjustments are reflected in the performance of each business. Revenue-sharing agreements are used to allocate external customer revenues to a business division on a reasonable basis. Transactions between business divisions are conducted at internally agreed transfer prices or at arm’s length. | Income1 | |
| Credit loss (expense)/recovery | ||
| Total operating income | ||
| Personnel expenses | ||
| General and administrative expenses | ||
| Services (to)/from other business units | ||
| Depreciation of property and equipment | ||
| Impairment of goodwill | ||
| Amortization of intangible assets2 | ||
| Total operating expenses | ||
| Performance from continuing operations before tax | ||
| Performance from discontinued operations before tax | ||
| Performance before tax | ||
| Tax expense on continuing operations | ||
| Tax expense on discontinued operations | ||
| Net profit | ||
| Additional information3 | ||
| Total assets | ||
| Total liabilities | ||
| Capital expenditure | ||
282
Table of Contents
Financial information |
| UBS | ||||||||||||||||||||||||||||
| Global Wealth Management & | Global Asset | |||||||||||||||||||||||||||
| Business Banking | Management | Investment Bank | Corporate Center | |||||||||||||||||||||||||
| Wealth Management | ||||||||||||||||||||||||||||
| International & | Wealth | Business Banking | ||||||||||||||||||||||||||
| Switzerland | Management US | Switzerland | ||||||||||||||||||||||||||
| 10,819 | 5,959 | 5,024 | 2,904 | (21,592 | ) | 1,083 | 4,197 | |||||||||||||||||||||
| (390 | ) | (25 | ) | (5 | ) | 0 | (2,575 | ) | 0 | (2,996 | ) | |||||||||||||||||
| 10,429 | 5,933 | 5,019 | 2,904 | (24,167 | ) | 1,083 | 1,201 | |||||||||||||||||||||
| 3,112 | 3,891 | 2,376 | 926 | 4,882 | 1,076 | 16,262 | ||||||||||||||||||||||
| 2,001 | 2,348 | 1,018 | 434 | 3,399 | 1,299 | 10,498 | ||||||||||||||||||||||
| 1,581 | 238 | (893 | ) | 150 | 990 | (2,066 | ) | 0 | ||||||||||||||||||||
| 97 | 94 | 70 | 29 | 231 | 720 | 1,241 | ||||||||||||||||||||||
| 0 | 0 | 0 | 0 | 341 | 0 | 341 | ||||||||||||||||||||||
| 38 | 60 | 0 | 33 | 83 | 0 | 213 | ||||||||||||||||||||||
| 6,828 | 6,631 | 2,570 | 1,572 | 9,925 | 1,029 | 28,555 | ||||||||||||||||||||||
| 3,601 | (698 | ) | 2,449 | 1,333 | (34,092 | ) | 54 | (27,353 | ) | |||||||||||||||||||
| 198 | 198 | |||||||||||||||||||||||||||
| 3,601 | (698 | ) | 2,449 | 1,333 | (34,092 | ) | 252 | (27,155 | ) | |||||||||||||||||||
| (6,837 | ) | |||||||||||||||||||||||||||
| 1 | ||||||||||||||||||||||||||||
| (20,319 | ) | |||||||||||||||||||||||||||
| 248,355 | 61,433 | 240,212 | 33,684 | 1,752,783 | (321,369 | ) | 2,015,098 | |||||||||||||||||||||
| 242,390 | 53,106 | 236,504 | 30,684 | 1,726,783 | (315,171 | ) | 1,974,296 | |||||||||||||||||||||
| 83 | 135 | 34 | 95 | 33 | 929 | 1,309 | ||||||||||||||||||||||
283
Table of Contents
Financial information
Notes to the consolidated financial statements
Note 2a Segment reporting (continued)
For the year ended 31 December 2007
| CHF million | ||
| Internal charges and transfer pricing adjustments are reflected in the performance of each business. Revenue-sharing agreements are used to allocate external customer revenues to a business division on a reasonable basis. Transactions between business divisions are conducted at internally agreed transfer prices or at arm’s length. | Income1 | |
| Credit loss (expense)/recovery | ||
| Total operating income | ||
| Personnel expenses | ||
| General and administrative expenses | ||
| Services (to)/from other business units | ||
| Depreciation of property and equipment | ||
| Amortization of intangible assets3 | ||
| Total operating expenses | ||
| Performance from continuing operations before tax | ||
| Performance from discontinued operations before tax | ||
| Performance before tax | ||
| Tax expense on continuing operations | ||
| Tax expense on discontinued operations | ||
| Net profit | ||
| Additional information4 | ||
| Total assets | ||
| Total liabilities | ||
| Capital expenditure | ||
284
Table of Contents
Financial information |
| UBS | |||||||||||||||||||||||||||||||||
| Global Wealth Management & | Global Asset | Investment | |||||||||||||||||||||||||||||||
| Business Banking | Management | Bank | Corporate Center | ||||||||||||||||||||||||||||||
| Wealth Management | Wealth | ||||||||||||||||||||||||||||||||
| International & | Management | Business Banking | |||||||||||||||||||||||||||||||
| Switzerland | US | Switzerland | Corporate Center | Industrial Holdings | |||||||||||||||||||||||||||||
| 12,893 | 6,662 | 5,286 | 4,094 | (538 | ) | 2,873 | 689 | 31,959 | |||||||||||||||||||||||||
| (1 | ) | (2 | ) | 31 | 0 | (266 | ) | 0 | 0 | (238 | ) | ||||||||||||||||||||||
| 12,892 | 6,660 | 5,317 | 4,094 | (804 | ) | 2,873 | 689 | 31,721 | |||||||||||||||||||||||||
| 3,873 | 4,551 | 2,584 | 1,856 | 11,286 | 1,334 | 31 | 25,515 | ||||||||||||||||||||||||||
| 1,064 | 976 | 1,138 | 559 | 3,386 | 1,298 | 8 | 8,429 | ||||||||||||||||||||||||||
| 1,531 | 314 | (739 | ) | 153 | 811 | (2,194 | ) | 124 | 0 | ||||||||||||||||||||||||
| �� | |||||||||||||||||||||||||||||||||
| 95 | 79 | 67 | 53 | 210 | 2 | 739 | 0 | 1,243 | |||||||||||||||||||||||||
| 19 | 66 | 0 | 19 | 172 | 0 | 0 | 276 | ||||||||||||||||||||||||||
| 6,582 | 5,986 | 3,050 | 2,640 | 15,865 | 1,177 | 163 | 35,463 | ||||||||||||||||||||||||||
| 6,310 | 674 | 2,267 | 1,454 | (16,669) | 1,696 | 526 | (3,742 | ) | |||||||||||||||||||||||||
| 7 | 138 | 145 | |||||||||||||||||||||||||||||||
| 6,310 | 674 | 2,267 | 1,454 | (16,669) | 1,703 | 664 | (3,597 | ) | |||||||||||||||||||||||||
| 1,369 | |||||||||||||||||||||||||||||||||
| (258 | ) | ||||||||||||||||||||||||||||||||
| (4,708 | ) | ||||||||||||||||||||||||||||||||
| 349,849 | 71,570 | 296,199 | 51,471 | 1,984,134 | (478,833 | ) | 501 | 2,274,891 | |||||||||||||||||||||||||
| 344,662 | 66,637 | 291,001 | 49,099 | 1,965,773 | (487,766 | ) | 1,659 | 2,231,065 | |||||||||||||||||||||||||
| 106 | 254 | 26 | 319 | 88 | 1,326 | 19 | 2,138 | ||||||||||||||||||||||||||
285
Table of Contents
Financial information
Notes to the consolidated financial statements
Note 2a Segment reporting (continued)
For the year ended 31 December 2006
| CHF million | ||
| Internal charges and transfer pricing adjustments are reflected in the performance of each business. Revenue-sharing agreements are used to allocate external customer revenues to a business division on a reasonable basis. Transactions between business divisions are conducted at internally agreed transfer prices or at arm’s length. | Income1 | |
| Credit loss (expense)/recovery | ||
| Total operating income | ||
| Personnel expenses | ||
| General and administrative expenses | ||
| Services (to)/from other business units | ||
| Depreciation of property and equipment | ||
| Amortization of intangible assets | ||
| Total operating expenses | ||
| Performance from continuing operations before tax | ||
| Performance from discontinued operations before tax | ||
| Performance before tax | ||
| Tax expense on continuing operations | ||
| Tax expense on discontinued operations | ||
| Net profit | ||
| Additional information3 | ||
| Total assets | ||
| Total liabilities | ||
| Capital expenditure | ||
286
Table of Contents
Financial information |
| UBS | ||||||||||||||||||||||||||||||||||
| Global Wealth Management & | Global Asset | Investment | ||||||||||||||||||||||||||||||||
| Business Banking | Management | Bank | Corporate Center | |||||||||||||||||||||||||||||||
| Wealth Management | Wealth | |||||||||||||||||||||||||||||||||
| International & | Management | Business Banking | ||||||||||||||||||||||||||||||||
| Switzerland | US | Switzerland | Corporate Center | Industrial Holdings | ||||||||||||||||||||||||||||||
| 10,827 | 5,863 | 5,085 | 3,220 | 21,726 | 294 | 313 | 47,328 | |||||||||||||||||||||||||||
| 1 | (1 | ) | 109 | 0 | 47 | 0 | 0 | 156 | ||||||||||||||||||||||||||
| 10,828 | 5,862 | 5,194 | 3,220 | 21,773 | 294 | 313 | 47,484 | |||||||||||||||||||||||||||
| 3,173 | 3,839 | 2,439 | 1,575 | 11,686 | 1,273 | 46 | 24,031 | |||||||||||||||||||||||||||
| 885 | 1,073 | 1,120 | 399 | 3,210 | 1,242 | 13 | 7,942 | |||||||||||||||||||||||||||
| 1,479 | 281 | (720 | ) | (105 | ) | 1,034 | (1,978 | ) | 9 | 0 | ||||||||||||||||||||||||
| 84 | 74 | 74 | 27 | 203 | 2 | 783 | (1 | ) | 1,244 | |||||||||||||||||||||||||
| 10 | 53 | 0 | 4 | 72 | 9 | 0 | 148 | |||||||||||||||||||||||||||
| 5,631 | 5,320 | 2,913 | 1,900 | 16,205 | 1,329 | 67 | 33,365 | |||||||||||||||||||||||||||
| 5,197 | 542 | 2,281 | 1,320 | 5,568 | (1,035 | ) | 246 | 14,119 | ||||||||||||||||||||||||||
| 4 | 884 | 888 | ||||||||||||||||||||||||||||||||
| 5,197 | 542 | 2,281 | 1,320 | 5,568 | (1,031 | ) | 1,130 | 15,007 | ||||||||||||||||||||||||||
| 2,998 | ||||||||||||||||||||||||||||||||||
| (11 | ) | |||||||||||||||||||||||||||||||||
| 12,020 | ||||||||||||||||||||||||||||||||||
| 286,334 | 63,260 | 211,837 | 48,616 | 2,059,019 | (322,221 | ) | 1,888 | 2,348,733 | ||||||||||||||||||||||||||
| 281,328 | 58,007 | 205,749 | 46,672 | 2,039,225 | (342,778 | ) | 3,404 | 2,291,607 | ||||||||||||||||||||||||||
| 257 | 273 | 14 | 498 | 593 | 1,385 | 97 | 3,117 | |||||||||||||||||||||||||||
287
Table of Contents
Financial information
Notes to the consolidated financial statements
Note 2b Segment reporting by geographic location
The geographic analysis of total assets is based on customer domicile, whereas operating income and capital expenditure are based on the location of the office in which the transactions and assets are recorded. Because of the global nature of financial markets, the Group’s business is managed on an integrated basis worldwide, with a view to profitability by
product line. The geographical analysis of operating income, total assets and capital expenditure is provided in order to comply with IFRS and does not reflect the way the Group is managed. Management believes that analysis by business division, as shown in Note 2a, is a more meaningful representation of the way in which the Group is managed.
| For the year ended 31 December 2008 | ||||||||||||||||||||||||
| Total operating income | Total assets | Capital expenditure | ||||||||||||||||||||||
| CHF million | Share % | CHF million | Share % | CHF million | Share % | |||||||||||||||||||
| Switzerland | 11,564 | 963 | 230,554 | 11 | 556 | 43 | ||||||||||||||||||
| United Kingdom | (8,814 | ) | (734 | ) | 466,600 | 23 | 71 | 5 | ||||||||||||||||
| Rest of Europe | 6,132 | 511 | 341,107 | 17 | 138 | 11 | ||||||||||||||||||
| United States | (10,519 | ) | (876 | ) | 637,302 | 32 | 407 | 31 | ||||||||||||||||
| Asia Pacific | 3,122 | 260 | 201,743 | 10 | 105 | 8 | ||||||||||||||||||
| Rest of the world | (284 | ) | (24 | ) | 137,792 | 7 | 32 | 2 | ||||||||||||||||
Total | 1,201 | 100 | 2,015,098 | 100 | 1,309 | 100 | ||||||||||||||||||
| For the year ended 31 December 2007 | ||||||||||||||||||||||||
| Total operating income | Total assets | Capital expenditure | ||||||||||||||||||||||
| CHF million | Share % | CHF million | Share % | CHF million | Share % | |||||||||||||||||||
| Switzerland | 18,787 | 59 | 224,679 | 10 | 436 | 20 | ||||||||||||||||||
| United Kingdom | (1,671 | ) | (5 | ) | 404,506 | 18 | 261 | 12 | ||||||||||||||||
| Rest of Europe | 2,541 | 8 | 358,504 | 16 | 117 | 5 | ||||||||||||||||||
| United States | 880 | 3 | 822,825 | 36 | 923 | 44 | ||||||||||||||||||
| Asia Pacific | 6,393 | 20 | 257,991 | 11 | 318 | 15 | ||||||||||||||||||
| Rest of the world | 4,791 | 15 | 206,386 | 9 | 83 | 4 | ||||||||||||||||||
Total | 31,721 | 100 | 2,274,891 | 100 | 2,138 | 100 | ||||||||||||||||||
| For the year ended 31 December 2006 | ||||||||||||||||||||||||
| Total operating income | Total assets | Capital expenditure | ||||||||||||||||||||||
| CHF million | Share % | CHF million | Share % | CHF million | Share % | |||||||||||||||||||
| Switzerland | 12,964 | 27 | 213,689 | 9 | 650 | 21 | ||||||||||||||||||
| United Kingdom | 6,863 | 14 | 373,219 | 16 | 314 | 10 | ||||||||||||||||||
| Rest of Europe | 5,553 | 12 | 314,642 | 13 | 70 | 2 | ||||||||||||||||||
| United States | 15,295 | 32 | 1,066,647 | 46 | 723 | 23 | ||||||||||||||||||
| Asia Pacific | 4,988 | 11 | 206,027 | 9 | 328 | 11 | ||||||||||||||||||
| Rest of the world | 1,821 | 4 | 174,509 | 7 | 1,032 | 33 | ||||||||||||||||||
Total | 47,484 | 100 | 2,348,733 | 100 | 3,117 | 100 | ||||||||||||||||||
288
Table of Contents
Financial information |
Income statement notes
Note 3 Net interest and trading income
Accounting standards require separate disclosure of net interest income and net trading income (see the tables on this and the next page). This required disclosure, however, does not take into account that net interest and trading income are generated by a range of different businesses. In many cases, a particular business can generate both net interest and trading income. Fixed income trading activity, for example, generates both trading profits and coupon income. UBS management therefore analyzes net interest and trading income according to the businesses that drive it. The sec-
ond table below (labeled Breakdown by businesses) provides information that corresponds to this management view. Net income from trading businesses includes both interest and trading income generated by the Group’s trading businesses and the Investment Bank’s lending activities. Net income from interest margin businesses comprises interest income from the Group’s loan portfolio. Net income from treasury and other activities reflects all income from the Group’s centralized treasury function.
| For the year ended | % change from | ||||||||||||||||
| CHF million | 31.12.08 | 31.12.07 | 31.12.06 | 31.12.07 | |||||||||||||
Net interest and trading income | |||||||||||||||||
| Net interest income | 6,203 | 5,337 | 6,521 | 16 | |||||||||||||
| Net trading income | (25,818 | ) | (8,353 | ) | 13,743 | (209 | ) | ||||||||||
Total net interest and trading income | (19,615 | ) | (3,016 | ) | 20,264 | (550 | ) | ||||||||||
Breakdown by businesses | |||||||||||||||||
Net income from trading businesses1 | (26,883 | ) | (10,658 | ) | 13,730 | (152 | ) | ||||||||||
| Net income from interest margin businesses | 6,160 | 6,230 | 5,718 | (1 | ) | ||||||||||||
| Net income from treasury activities and other | 1,107 | 1,412 | 816 | (22 | ) | ||||||||||||
Total net interest and trading income | (19,615 | ) | (3,016 | ) | 20,264 | (550 | ) | ||||||||||
Net interest income2 | |||||||||||||||||
Interest income | |||||||||||||||||
Interest earned on loans and advances3 | 20,424 | 21,263 | 15,266 | (4 | ) | ||||||||||||
| Interest earned on securities borrowed and reverse repurchase agreements | 22,521 | 48,274 | 39,771 | (53 | ) | ||||||||||||
| Interest and dividend income from trading portfolio | 22,397 | 39,101 | 32,211 | (43 | ) | ||||||||||||
| Interest income on financial assets designated at fair value | 404 | 298 | 25 | 36 | |||||||||||||
| Interest and dividend income from financial investments available-for-sale | 145 | 176 | 128 | (18 | ) | ||||||||||||
Total | 65,890 | 109,112 | 87,401 | (40 | ) | ||||||||||||
Interest expense | |||||||||||||||||
| Interest on amounts due to banks and customers | 18,150 | 29,318 | 20,024 | (38 | ) | ||||||||||||
| Interest on securities lent and repurchase agreements | 16,123 | 40,581 | 34,021 | (60 | ) | ||||||||||||
| Interest and dividend expense from trading portfolio | 9,162 | 15,812 | 14,533 | (42 | ) | ||||||||||||
| Interest on financial liabilities designated at fair value | 7,298 | 7,659 | 4,757 | (5 | ) | ||||||||||||
| Interest on debt issued | 8,954 | 10,405 | 7,545 | (14 | ) | ||||||||||||
Total | 59,687 | 103,775 | 80,880 | (42 | ) | ||||||||||||
Net interest income | 6,203 | 5,337 | 6,521 | 16 | |||||||||||||
289
Table of Contents
Financial information
Notes to the consolidated financial statements
Note 3 Net interest and trading income (continued)
| Net trading income1 | ||||||||||||||||
| For the year ended | % change from | |||||||||||||||
| CHF million | 31.12.08 | 31.12.07 | 31.12.06 | 31.12.07 | ||||||||||||
| Equities | 4,694 | 9,048 | 7,064 | (48 | ) | |||||||||||
| Fixed income | (37,252 | ) | (20,949 | ) | 2,755 | (78 | ) | |||||||||
Foreign exchange and other2 | 6,739 | 3,548 | 3,924 | 90 | ||||||||||||
Net trading income | (25,818 | ) | (8,353 | ) | 13,743 | (209 | ) | |||||||||
thereof net gains/(losses) from financial assets designated at fair value | (974 | ) | (30 | ) | (397 | ) | ||||||||||
thereof net gains/(losses) from financial liabilities designated at fair value3 | 44,284 | (3,779 | ) | (3,659 | ) | |||||||||||
thereof net gains/(losses) from own credit changes of financial liabilities designated at fair value4 | 3,993 | 659 | 0 | 506 | ||||||||||||
| Significant impacts on net trading income1 | ||||||||||||||||
| For the year ended 31.12.08 | For the year ended 31.12.07 | |||||||||||||||
| USD billion | CHF billion | USD billion | CHF billion | |||||||||||||
| US sub-prime residential mortgage market | (8.1 | ) | (8.2 | ) | (14.6 | ) | (16.6 | ) | ||||||||
| US Alt-A residential mortgage market | (7.4 | ) | (7.6 | ) | (2.0 | ) | (2.3 | ) | ||||||||
| US prime residential mortgage market | (1.8 | ) | (1.9 | ) | ||||||||||||
| Credit valuation adjustments for monoline credit protection | (7.6 | ) | (8.2 | ) | (0.8 | ) | (0.9 | ) | ||||||||
| US commercial mortgage market | (0.3 | ) | (0.4 | ) | ||||||||||||
| US reference linked notes (RLN) | (2.6 | ) | (2.7 | ) | (1.3 | ) | (1.5 | ) | ||||||||
| Leveraged finance | (1.2 | ) | (1.3 | ) | ||||||||||||
| US student loans | (1.6 | ) | (1.6 | ) | ||||||||||||
Subtotal | (30.6 | ) | (31.9 | ) | (18.7 | )2 | (21.3 | )2 | ||||||||
Mandatory convertible notes3 | 4.6 | |||||||||||||||
SNB transaction4 | (5.2 | ) | ||||||||||||||
Total | (32.6 | ) | (21.3 | ) | ||||||||||||
290
Table of Contents
Financial information |
291
Table of Contents
Financial information
Notes to the consolidated financial statements
292
Table of Contents
Financial information |
| As of | % change from | |||||||||||||||
| 31.12.08 | 31.12.07 | 31.12.06 | 31.12.07 | |||||||||||||
Shares outstanding | ||||||||||||||||
| Total ordinary shares issued | 2,932,580,549 | 2,073,547,344 | 2,105,273,286 | 41 | ||||||||||||
| Second trading line treasury shares | ||||||||||||||||
| 2006 program | 22,600,000 | |||||||||||||||
| Other treasury shares | 61,903,121 | 158,105,524 | 141,875,699 | (61 | ) | |||||||||||
| Total treasury shares | 61,903,121 | 158,105,524 | 164,475,699 | (61 | ) | |||||||||||
| Shares outstanding | 2,870,677,428 | 1,915,441,820 | 1,940,797,587 | 50 | ||||||||||||
Retrospective adjustments for stock dividend3 | 95,772,091 | 97,039,879 | ||||||||||||||
Retrospective adjustments for rights issue2 | 141,850,917 | 143,728,676 | ||||||||||||||
Mandatory convertible notes and exchangeable shares4 | 600,557,453 | 518,711 | 139,561 | |||||||||||||
| Shares outstanding for EPS | 3,471,234,881 | 2,153,583,539 | 2,181,705,703 | 61 | ||||||||||||
293
Table of Contents
Financial information
Notes to the consolidated financial statements
Balance sheet notes: assets
Note 9a Due from banks and loans (held at amortized cost)
| By type of exposure | |||||||||
| CHF million | 31.12.08 | 31.12.07 | |||||||
| Banks | 64,473 | 60,935 | |||||||
| Allowance for credit losses | (22 | ) | (28 | ) | |||||
| Net due from banks | 64,451 | 60,907 | |||||||
| Loans | |||||||||
| Residential mortgages | 121,811 | 122,435 | |||||||
| Commercial mortgages | 21,270 | 21,058 | |||||||
| Other loans | 170,099 | 193,374 | |||||||
Debt instruments traditionally not classified as loans and receivables1 | 30,033 | – | |||||||
| Subtotal | 343,213 | 336,867 | |||||||
| Allowance for credit losses | (2,905 | ) | (1,003 | ) | |||||
of which: Debt instruments traditionally not classified as loans and receivables | (1,329 | ) | – | ||||||
| Net loans | 340,308 | 335,864 | |||||||
Net due from banks and loans (held at amortized cost) | 404,759 | 396,771 | |||||||
By geographical region (based on the location of the borrower) | |||||||||
| Switzerland | 166,798 | 166,435 | |||||||
| United Kingdom | 30,540 | 29,796 | |||||||
| Rest of Europe | 47,724 | 43,966 | |||||||
| United States | 105,907 | 70,962 | |||||||
| Asia Pacific | 23,279 | 27,843 | |||||||
| Rest of the world | 38,590 | 62,916 | |||||||
| Subtotal | 412,838 | 401,918 | |||||||
| Allowance for credit losses | (2,927 | ) | (1,031 | ) | |||||
Net due from banks, loans (held at amortized cost) and loans designated at fair value2 | 409,911 | 400,887 | |||||||
By type of collateral | |||||||||
| Secured by real estate | 145,491 | 145,927 | |||||||
| Collateralized by securities | 56,312 | 96,306 | |||||||
| Guarantees and other collateral | 124,543 | 79,936 | |||||||
| Unsecured | 86,492 | 79,749 | |||||||
| Subtotal | 412,838 | 401,918 | |||||||
| Allowance for credit losses | (2,927 | ) | (1,031 | ) | |||||
Net due from banks, loans (held at amortized cost) and loans designated at fair value2 | 409,911 | 400,887 | |||||||
294
Table of Contents
Financial information |
| Note 9b Allowances and provisions for credit losses | ||||||||||||||||
| Collective loan | ||||||||||||||||
| Specific allowances | loss allowances | |||||||||||||||
| CHF million | and provisions | and provisions | Total 31.12.08 | Total 31.12.07 | ||||||||||||
| Balance at the beginning of the year | 1,130 | 34 | 1,164 | 1,332 | ||||||||||||
| Write-offs | (868 | ) | 0 | (868 | ) | (321 | ) | |||||||||
| Recoveries | 44 | 0 | 44 | 55 | ||||||||||||
| Increase/(decrease) in credit loss allowances and provisions | 3,007 | (11 | ) | 2,996 | 238 | |||||||||||
| Disposals | (223 | ) | 0 | (223 | ) | (131 | ) | |||||||||
| Foreign currency translation and other adjustments | (43 | ) | 0 | (43 | ) | (9 | ) | |||||||||
Balance at the end of the year | 3,047 | 23 | 3,070 | 1,164 | ||||||||||||
| Collective loan | ||||||||||||||||
| Specific allowances | loss allowances | |||||||||||||||
| CHF million | and provisions | and provisions | Total 31.12.08 | Total 31.12.07 | ||||||||||||
| As a reduction of due from banks | 22 | 0 | 22 | 28 | ||||||||||||
| As a reduction of loans | 2,882 | 23 | 2,905 | 1,003 | ||||||||||||
| As a reduction of securities borrowed | 112 | 0 | 112 | 70 | ||||||||||||
| Subtotal | 3,016 | 23 | 3,039 | 1,101 | ||||||||||||
| Included in other liabilities related to provisions for contingent claims | 31 | 0 | 31 | 63 | ||||||||||||
Total allowances and provisions for credit losses | 3,047 | 23 | 3,070 | 1,164 | ||||||||||||
Note 10 Securities borrowing, securities lending, repurchase and reverse repurchase agreements
The Group enters into collateralized reverse repurchase and repurchase agreements and securities borrowing and securities lending transactions that may result in credit exposure in the event that the counterparty to the transaction is unable to fulfill its contractual obligations. The Group controls credit
risk associated with these activities by monitoring counter-party credit exposure and collateral values on a daily basis and requiring additional collateral to be deposited with or returned to the Group when deemed necessary.
| Balance sheet assets | ||||||||||||||||
| Cash collateral on | Reverse repurchase | Cash collateral on | Reverse repurchase | |||||||||||||
| securities borrowed | agreements | securities borrowed | agreements | |||||||||||||
| CHF million | 31.12.08 | 31.12.08 | 31.12.07 | 31.12.07 | ||||||||||||
By counterparty | ||||||||||||||||
| Banks | 17,523 | 110,254 | 48,480 | 221,575 | ||||||||||||
| Customers | 105,374 | 114,393 | 158,583 | 155,353 | ||||||||||||
Total | 122,897 | 224,648 | 207,063 | 376,928 | ||||||||||||
| Balance sheet liabilities | ||||||||||||||||
| Cash collateral on | Repurchase | Cash collateral on | Repurchase | |||||||||||||
| securities lent | agreements | securities lent | agreements | |||||||||||||
| CHF million | 31.12.08 | 31.12.08 | 31.12.07 | 31.12.07 | ||||||||||||
By counterparty | ||||||||||||||||
| Banks | 12,181 | 36,088 | 29,512 | 139,156 | ||||||||||||
| Customers | 1,881 | 66,473 | 2,109 | 166,731 | ||||||||||||
Total | 14,063 | 102,561 | 31,621 | 305,887 | ||||||||||||
295
Table of Contents
Financial information
Notes to the consolidated financial statements
Note 11 Trading portfolio
The Group trades in debt instruments (including money market paper and tradable loans), equity instruments, precious metals, other commodities and derivatives to meet the financial needs of its customers and to generate revenue.
Refer to Note 23 for derivative instruments. The table below represents a pure accounting view. It does not reflect hedges and other risk-mitigating factors and the amounts must therefore not be considered risk exposures.
| CHF million | 31.12.08 | 31.12.07 | ||||||
Trading portfolio assets | ||||||||
Debt instruments | ||||||||
| Government and government agencies | ||||||||
| Switzerland | 121 | 437 | ||||||
| United States | 31,366 | 86,684 | ||||||
| Japan | 46,049 | 51,137 | ||||||
| Other | 38,160 | 52,993 | ||||||
| Banks | ||||||||
Listed1 | 12,450 | 28,923 | ||||||
| Unlisted | 10,725 | 13,594 | ||||||
| Corporates | ||||||||
Listed1 | 41,690 | 153,416 | ||||||
| Unlisted | 44,301 | 150,768 | ||||||
Total debt instruments | 224,862 | 537,952 | ||||||
thereof pledged as collateral with central banks | 5,541 | 3,252 | ||||||
thereof pledged as collateral (excluding central banks) | 56,612 | 152,704 | ||||||
thereof pledged as collateral and can be repledged or resold by counterparty | 30,903 | 88,866 | ||||||
Equity instruments | ||||||||
Listed1 | 70,713 | 181,034 | ||||||
| Unlisted | 6,545 | 25,968 | ||||||
Total equity instruments | 77,258 | 207,002 | ||||||
thereof pledged as collateral | 15,849 | 26,870 | ||||||
thereof can be repledged or resold by counterparty | 9,312 | 25,325 | ||||||
Precious metals and other commodities2 | 9,934 | 29,418 | ||||||
Total trading portfolio assets | 312,054 | 774,372 | ||||||
Trading portfolio liabilities | ||||||||
Debt instruments | ||||||||
| Government and government agencies | ||||||||
| Switzerland | 129 | 171 | ||||||
| United States | 18,914 | 50,659 | ||||||
| Japan | 2,344 | 13,557 | ||||||
| Other | 12,656 | 27,335 | ||||||
| Banks | ||||||||
Listed1 | 4,235 | 8,806 | ||||||
| Unlisted | 119 | 873 | ||||||
| Corporates | ||||||||
Listed1 | 8,961 | 15,076 | ||||||
| Unlisted | 1,984 | 3,949 | ||||||
Total debt instruments | 49,342 | 120,426 | ||||||
Equity instruments | 13,089 | 44,362 | ||||||
Total trading portfolio liabilities | 62,431 | 164,788 | ||||||
296
Table of Contents
Financial information |
| Note 12 Financial assets designated at fair value | |||||||||
| CHF million | 31.12.08 | 31.12.07 | |||||||
| Loans | 4,500 | 3,633 | |||||||
| Structured loans | 653 | 483 | |||||||
| Reverse repurchase and securities borrowing agreements | |||||||||
| Banks | 4,321 | 4,289 | |||||||
| Customers | 2,329 | 1,232 | |||||||
| Other financial assets | 1,079 | 2,128 | |||||||
Total financial assets designated at fair value | 12,882 | 11,765 | |||||||
The maximum exposure to credit loss of all items in the above table except for Other financial assets is equal to the fair value (CHF 11,803 million at 31 December 2008 and CHF 9,637 million at 31 December 2007). Other financial assets are generally comprised of equity investments and are not directly exposed to credit risk. The maximum exposure to
credit loss at 31 December 2008 and 31 December 2007 is mitigated by collateral of CHF 6,335 million and CHF 5,830 million, respectively.
| CHF million | 31.12.08 | 31.12.07 | ||||||
| Notional amount of loans and structured loans | 6,186 | 4,166 | ||||||
Credit derivatives related to loans and structured loans – notional amounts1 | 4,314 | 3,351 | ||||||
Credit derivatives related to loans and structured loans – fair value1 | 547 | 59 | ||||||
| Additional Information | |||||||||||||||||
| Cumulative from inception until | |||||||||||||||||
| For the year ended | the year ended | ||||||||||||||||
| CHF million | 31.12.08 | 31.12.07 | 31.12.08 | 31.12.07 | |||||||||||||
Change in fair value of loans and structured loans designated at fair value, attributable to changes in credit risk2 | (668 | ) | (87 | ) | (659 | ) | (98 | ) | |||||||||
Change in fair value of credit derivatives and similar instruments which mitigate the maximum exposure to credit loss of loans and structured loans designated at fair value2 | 486 | 58 | 547 | 59 | |||||||||||||
297
Table of Contents
Financial information
Notes to the consolidated financial statements
| Note 13 Financial investments available-for-sale | |||||||||
| CHF million | 31.12.08 | 31.12.07 | |||||||
Money market paper | 2,165 | 349 | |||||||
Other debt instruments | |||||||||
Listed1 | 322 | 317 | |||||||
| Unlisted | 1,080 | 717 | |||||||
Total | 1,402 | 1,034 | |||||||
Equity instruments | |||||||||
Listed1 | 258 | 1,865 | |||||||
| Unlisted | 1,423 | 1,718 | |||||||
Total | 1,681 | 3,583 | |||||||
Total financial investments available-for-sale | 5,248 | 4,966 | |||||||
| Net unrealized gains (losses) – before tax | 403 | 1,900 | |||||||
| Net unrealized gains (losses) – after tax | 349 | 1,503 | |||||||
| Note 14 Investments in associates | |||||||||
| CHF million | 31.12.08 | 31.12.07 | |||||||
| Carrying amount at the beginning of the year | 1,979 | 1,523 | |||||||
| Additions | 807 | 1,656 | |||||||
| Disposals | (1,307 | ) | (846 | ) | |||||
| Transfers | (422 | ) | (367 | ) | |||||
| Income | 12 | 137 | |||||||
| Impairments | (18 | ) | (17 | ) | |||||
| Dividends paid | (34 | ) | (42 | ) | |||||
| Foreign currency translation | (125 | ) | (65 | ) | |||||
Carrying amount at the end of the year | 892 | 1,979 | |||||||
Significant associated companies of the Group had the following balance sheet and income statement totals on an aggregated basis, not adjusted for the Group’s proportionate interest. Refer to Note 34 for a list of significant associates.
| CHF million | 31.12.08 | 31.12.07 | ||||||
| Assets | 4,272 | 9,189 | ||||||
| Liabilities | 3,448 | 2,524 | ||||||
| Revenues | 1,211 | 1,228 | ||||||
| Net profit | 198 | 321 | ||||||
298
Table of Contents
Financial information |
Note 15 Property and equipment
| At historical cost less accumulated depreciation | |||||||||||||||||||||||||||||||||||
| Plant and | |||||||||||||||||||||||||||||||||||
| Leasehold | IT, software | Other | manu- | ||||||||||||||||||||||||||||||||
| Own-used | improve- | and com- | machines and | facturing | Projects in | ||||||||||||||||||||||||||||||
| CHF million | properties | ments | munication | equipment | equipment | progress | 31.12.08 | 31.12.07 | |||||||||||||||||||||||||||
Historical cost | |||||||||||||||||||||||||||||||||||
| Balance at the beginning of the year | 9,242 | 3,297 | 4,604 | 885 | 29 | 666 | 18,723 | 18,477 | |||||||||||||||||||||||||||
| Additions | 196 | 265 | 334 | 75 | 0 | 311 | 1,181 | 1,727 | |||||||||||||||||||||||||||
| Additions from acquired companies | 0 | 1 | 6 | 0 | 0 | 0 | 7 | 6 | |||||||||||||||||||||||||||
Disposals / write-offs1 | (21 | ) | (138 | ) | (523 | ) | (80 | ) | (31 | ) | 0 | (792 | ) | (1,008 | ) | ||||||||||||||||||||
| Reclassifications | (28 | ) | 289 | 84 | 53 | 0 | (620 | ) | (222 | ) | (76 | ) | |||||||||||||||||||||||
| Foreign currency translation | (101 | ) | (321 | ) | (419 | ) | (67 | ) | 2 | (40 | ) | (945 | ) | (403 | ) | ||||||||||||||||||||
| Balance at the end of the year | 9,289 | 3,393 | 4,086 | 867 | 0 | 317 | 17,952 | 18,723 | |||||||||||||||||||||||||||
Accumulated depreciation | |||||||||||||||||||||||||||||||||||
| Balance at the beginning of the year | 5,121 | 1,969 | 4,022 | 540 | 27 | 0 | 11,679 | 11,578 | |||||||||||||||||||||||||||
Depreciation2 | 332 | 312 | 497 | 100 | 0 | 0 | 1,241 | 1,253 | |||||||||||||||||||||||||||
Disposals / write-offs1 | (7 | ) | (88 | ) | (520 | ) | (54 | ) | (28 | ) | 0 | (697 | ) | (873 | ) | ||||||||||||||||||||
| Reclassifications | (160 | ) | (4 | ) | 0 | 0 | 0 | 0 | (164 | ) | (14 | ) | |||||||||||||||||||||||
| Foreign currency translation | (14 | ) | (159 | ) | (387 | ) | (40 | ) | 2 | 0 | (598 | ) | (266 | ) | |||||||||||||||||||||
| Balance at the end of the year | 5,272 | 2,031 | 3,612 | 546 | 0 | 0 | 11,461 | 11,678 | |||||||||||||||||||||||||||
Net book value at the end of the year3 | 4,017 | 1,362 | 475 | 321 | 0 | 317 | 6,491 | 7,045 | |||||||||||||||||||||||||||
| Investment properties at fair value | |||||||||
| CHF million | 31.12.08 | 31.12.07 | |||||||
| Balance at the beginning of the year | 189 | 14 | |||||||
| Additions | 37 | 182 | |||||||
| Sales | 0 | 0 | |||||||
| Revaluations | (6 | ) | 7 | ||||||
| Foreign currency translation | (5 | ) | (14 | ) | |||||
Balance at the end of the year | 215 | 189 | |||||||
299
Table of Contents
Financial information
Notes to the consolidated financial statements
Note 16 Goodwill and intangible assets
At 31 December 2008, the following four segments carried goodwill: Wealth Management International & Switzerland (CHF 1.6 billion), Wealth Management US (CHF 3.7 billion), Global Asset Management (CHF 2.0 billion), and Investment Bank (CHF 4.3 billion). For the purpose of testing goodwill for impairment, UBS considers each of these segments as a separate cash-generating unit, and determines the recoverable amount of a segment on the basis of value in use.
Methodology for goodwill impairment testing
The recoverable amount is determined using a proprietary model based on discounted cash flows, which has been adapted to give effect to the special features of the banking business and its regulatory environment. The recoverable amount is determined by estimating streams of earnings available to shareholders in the next five years, discounted to their present values. The terminal value reflecting all periods
beyond the fifth year is calculated on the basis of the estimated individual return on equity for each segment, which is derived from the forecast fifth-year profit, the underlying equity, the cost of equity and the long-term growth rate. The recoverable amount of a segment is the sum of earnings available to shareholders from the first five years and the terminal value. In 2007, the recoverable amount was based on the discounted estimated streams of earnings determined in a rolling forecast process for the next four quarters and the terminal value. The five-year period for the cash flow projections applied in 2008 is considered a more appropriate measure, given the currently volatile market environment and the uncertainties in the short-term outlook.
Assumptions
The model is most sensitive to changes in the forecast earnings available to shareholders in years one to five, the estimated return on equity, the underlying equity, the cost of equity and to changes in the long-term growth rate. The applied long-term growth rate is based on long-term risk-free interest rates. Earnings available to shareholders are estimated based on forecast results, which takes into account business initiatives and planned capital investments, and returns to shareholders. Valuation parameters used within the Group’s impairment test model are linked to external market information, where applicable. Management believes that reasonable changes in key assumptions used to determine the recoverable amounts of all segments will not result in an impairment situation.
| Discount rate | |||||||||
| In % | 31.12.08 | 31.12.07 | |||||||
| Wealth Management International & Switzerland | 9.5 | 9.0 | |||||||
| Wealth Management US | 11.5 | 10.5 | |||||||
| Business Banking Switzerland | 9.5 | 9.0 | |||||||
| Global Asset Management | 11.0 | 10.5 | |||||||
| Investment Bank | 13.0 | 11.5 | |||||||
300
Table of Contents
Financial information |
Investment Bank
On 31 December 2008, the reassessment of the goodwill of UBS’s Investment Bank, which has been most affected by the implications of the financial market crises, was a key focus. Goodwill allocated to the Investment Bank amounted to CHF 4.3 billion at 31 December 2008 (CHF 5.2 billion at 31 December 2007). The reduction is due to an impairment of CHF 341 million of goodwill related to the US Municipal Securities Business, which was closed in June 2008 (refer to Note 38 for details) and foreign currency translation effects.
| Goodwill | Intangible assets | |||||||||||||||||||||||
| Customer | ||||||||||||||||||||||||
| relationships, | ||||||||||||||||||||||||
| contractual | ||||||||||||||||||||||||
| CHF million | Total | Infrastructure | rights and other | Total | 31.12.08 | 31.12.07 | ||||||||||||||||||
Historical cost | ||||||||||||||||||||||||
| Balance at the beginning of the year | 12,829 | 876 | 1,619 | 2,495 | 15,324 | 15,493 | ||||||||||||||||||
| Additions and reallocations | 495 | 0 | 90 | 90 | 585 | 612 | ||||||||||||||||||
| Disposals | (20 | ) | 0 | (13 | ) | (13 | ) | (33 | ) | (3 | ) | |||||||||||||
Write-offs1 | (356 | ) | 0 | (116 | ) | (116 | ) | (472 | ) | (175 | ) | |||||||||||||
| Foreign currency translation | (1,364 | ) | (52 | ) | (272 | ) | (324 | ) | (1,688 | ) | (603 | ) | ||||||||||||
| Balance at the end of the year | 11,585 | 824 | 1,308 | 2,131 | 13,716 | 15,324 | ||||||||||||||||||
Accumulated amortization and impairment | ||||||||||||||||||||||||
| Balance at the beginning of the year | 0 | 315 | 471 | 786 | 786 | 720 | ||||||||||||||||||
| Amortization | 0 | 42 | 152 | 193 | 193 | 282 | ||||||||||||||||||
| Impairment of goodwill and intangible assets | 341 | 0 | 20 | 20 | 361 | 0 | ||||||||||||||||||
| Disposals | 0 | 0 | (7 | ) | (7 | ) | (7 | ) | (3 | ) | ||||||||||||||
Write-offs1 | (356 | ) | 0 | (116 | ) | (116 | ) | (472 | ) | (175 | ) | |||||||||||||
| Foreign currency translation | 15 | (19 | ) | (76 | ) | (95 | ) | (80 | ) | (38 | ) | |||||||||||||
| Balance at the end of the year | 0 | 337 | 444 | 781 | 781 | 786 | ||||||||||||||||||
Net book value at the end of the year | 11,585 | 487 | 864 | 1,350 | 12,935 | 14,538 | ||||||||||||||||||
301
Table of Contents
Financial information
Notes to the consolidated financial statements
Note 16 Goodwill and intangible assets (continued)
The following table presents the disclosure of goodwill and intangible assets by business unit for the year ended 31 December 2008.
| Balance at | Additions | Foreign | Balance | |||||||||||||||||||||||||
| the beginning | and | currency | at the end | |||||||||||||||||||||||||
| CHF million | of the year | reallocations | Disposals | Amortization | Impairment | translation | of the year | |||||||||||||||||||||
Goodwill | ||||||||||||||||||||||||||||
| Wealth Management International & Switzerland | 1,697 | 157 | 0 | 0 | (205 | ) | 1,648 | |||||||||||||||||||||
| Wealth Management US | 3,907 | 0 | 0 | 0 | (228 | ) | 3,678 | |||||||||||||||||||||
| Business Banking Switzerland | 0 | 0 | 0 | 0 | 0 | 0 | ||||||||||||||||||||||
| Global Asset Management | 2,000 | 338 | 0 | 0 | (356 | ) | 1,982 | |||||||||||||||||||||
| Investment Bank | 5,207 | 1 | 0 | (341 | ) | (590 | ) | 4,277 | ||||||||||||||||||||
| Corporate Center | 18 | 0 | (20 | ) | 0 | 1 | 0 | |||||||||||||||||||||
UBS | 12,829 | 495 | (20 | ) | (341 | ) | (1,379 | ) | 11,585 | |||||||||||||||||||
Intangible assets | ||||||||||||||||||||||||||||
| Wealth Management International & Switzerland | 288 | 58 | 0 | (18 | ) | (20 | ) | (57 | ) | 251 | ||||||||||||||||||
| Wealth Management US | 729 | 0 | 0 | (60 | ) | 0 | (43 | ) | 626 | |||||||||||||||||||
| Business Banking Switzerland | 0 | 0 | 0 | 0 | 0 | 0 | 0 | |||||||||||||||||||||
| Global Asset Management | 264 | 32 | 0 | (33 | ) | 0 | (77 | ) | 186 | |||||||||||||||||||
| Investment Bank | 422 | 0 | 0 | (83 | ) | 0 | (52 | ) | 286 | |||||||||||||||||||
| Corporate Center | 6 | 0 | (6 | ) | 0 | 0 | 0 | 0 | ||||||||||||||||||||
UBS | 1,709 | 90 | (6 | ) | (193 | ) | (20 | ) | (229 | ) | 1,350 | |||||||||||||||||
The estimated, aggregated amortization expenses for intangible assets are as follows:
| CHF million | Intangible assets | |||
Estimated, aggregated amortization expenses for: | ||||
| 2009 | 168 | |||
| 2010 | 153 | |||
| 2011 | 145 | |||
| 2012 | 125 | |||
| 2013 | 103 | |||
| 2014 and thereafter | 656 | |||
Total | 1,350 | |||
| Note 17 Other assets | |||||||||||||
| CHF million | Note | 31.12.08 | 31.12.07 | ||||||||||
| Deferred tax assets | 22 | 8,880 | 3,220 | ||||||||||
| Settlement and clearing accounts | 1,203 | 6,370 | |||||||||||
| VAT and other tax receivables | 330 | 454 | |||||||||||
| Prepaid pension costs | 2,922 | 3,009 | |||||||||||
| Properties held for sale | 981 | 1,145 | |||||||||||
| Other receivables | 4,778 | 6,114 | |||||||||||
Total other assets | 19,094 | 20,312 | |||||||||||
302
Table of Contents
Financial information |
Balance sheet notes: liabilities
At 31 December 2008, the contractual redemption amount at maturity of Financial liabilities designated at fair value through profit or loss was CHF 12.2 billion higher than the
carrying value. At 31 December 2007, the contractual redemption amount at maturity of such liabilities approximated the carrying value. Refer to Note 1a) 7) for details.
| Debt issued (held at amortized cost) | ||||||||
| CHF million | 31.12.08 | 31.12.07 | ||||||
| Short-term debt: Money market paper issued | 111,619 | 152,256 | ||||||
| Long-term debt: | ||||||||
| Bonds | ||||||||
| Senior | 64,099 | 52,265 | ||||||
| Subordinated | 15,968 | 14,129 | ||||||
| Shares in bond issues of the Swiss Regional or Cantonal Bank’ Central Bond Institutions | 2,418 | 199 | ||||||
| Medium-term notes | 3,150 | 3,228 | ||||||
| Subtotal long-term debt | 85,635 | 69,821 | ||||||
Total | 197,254 | 222,077 | ||||||
303
Table of Contents
Financial information
Notes to the consolidated financial statements
Note 19 Financial liabilities designated at fair value and debt issued (continued)
The Group uses interest rate and foreign exchange derivatives to manage the risks inherent in certain debt issues (held at amortized cost). In the case of interest rate risk management, the Group applies hedge accounting as discussed in Note 1a) 14) and Note 23 – Derivative Instruments and Hedge Accounting. As a result of applying hedge accounting, at 31 December 2008 and 31 December 2007, the carrying value of debt issued was CHF 904 million higher and CHF 138 million higher, respectively, reflecting changes in fair value due to interest rate movements.
14,129 million, respectively, in subordinated debt. Subordinated debt usually pays fixed interest annually or floating rate interest based on three-month or six-month London Interbank Offered Rate (LIBOR) and provides for single principal payments upon maturity.
| Contractual maturity dates | ||||||||||||||||||||||||||||||||||||
| Total | Total | |||||||||||||||||||||||||||||||||||
| CHF million, except where indicated | 2009 | 2010 | 2011 | 2012 | 2013 | 2014–2018 | Thereafter | 31.12.08 | 31.12.07 | |||||||||||||||||||||||||||
UBS AG (Parent Bank) | ||||||||||||||||||||||||||||||||||||
| Senior debt | ||||||||||||||||||||||||||||||||||||
| Fixed rate | 49,415 | 11,706 | 6,041 | 6,626 | 10,994 | 17,170 | 1,627 | 103,579 | 155,432 | |||||||||||||||||||||||||||
| Interest rates (range in %) | 0–9.90 | 0–9.70 | 0–9.955 | 0–9.66375 | 0–9.75 | 0–9.90 | 0–9.75 | |||||||||||||||||||||||||||||
| Floating rate | 33,808 | 4,939 | 3,979 | 6,455 | 4,683 | 4,682 | 19,255 | 77,801 | 131,714 | |||||||||||||||||||||||||||
| Subordinated debt | ||||||||||||||||||||||||||||||||||||
| Fixed rate | 465 | 5,665 | 2,745 | 8,875 | 9,789 | |||||||||||||||||||||||||||||||
| Interest rates (range in %) | 6.0-6.0 | 2.375–8.622 | 4.5–8.75 | |||||||||||||||||||||||||||||||||
| Floating rate | 7,019 | 7,019 | 4,340 | |||||||||||||||||||||||||||||||||
| Subtotal | 83,688 | 16,645 | 10,020 | 13,081 | 15,677 | 34,536 | 23,627 | 197,274 | 301,275 | |||||||||||||||||||||||||||
Subsidiaries | ||||||||||||||||||||||||||||||||||||
| Senior debt | ||||||||||||||||||||||||||||||||||||
| Fixed rate | 60,092 | 2,904 | 8,459 | 813 | 377 | 1,010 | 9,348 | 83,003 | 76,863 | |||||||||||||||||||||||||||
| Interest rates (range in %) | 0–9.03 | 0–9.0 | 0–8.375 | 0–8.495 | 0–9.0 | 0–9.494 | 0–9.829 | |||||||||||||||||||||||||||||
| Floating rate | 3,505 | 2,548 | 2,000 | 1,033 | 783 | 4,303 | 4,277 | 18,449 | 35,792 | |||||||||||||||||||||||||||
| Subordinated debt | ||||||||||||||||||||||||||||||||||||
| Fixed rate | 74 | 74 | 0 | |||||||||||||||||||||||||||||||||
| Interest rates (range in %) | 6.25–6.25 | |||||||||||||||||||||||||||||||||||
| Floating rate | 0 | 0 | ||||||||||||||||||||||||||||||||||
| Subtotal | 63,671 | 5,452 | 10,459 | 1,846 | 1,160 | 5,313 | 13,625 | 101,526 | 112,655 | |||||||||||||||||||||||||||
Total | 147,359 | 22,097 | 20,479 | 14,927 | 16,837 | 39,849 | 37,252 | 298,800 | 413,930 | |||||||||||||||||||||||||||
The table above indicates fixed interest rate coupons ranging from 0 up to 9.955% on the Group’s bonds. The high or low coupons generally relate to structured debt issues prior to the separation of embedded derivatives. As a result, the stat-
ed interest rate on such debt issues generally does not reflect the effective interest rate the Group is paying to service its debt after the embedded derivative has been separated and, where applicable, the application of hedge accounting.
304
Table of Contents
Financial information |
| Note 20 Other liabilities | ||||||||||||
| CHF million | Note | 31.12.08 | 31.12.07 | |||||||||
| Provisions | 21 | 2,727 | 1,716 | |||||||||
| Provisions for contingent claims | 9b | 31 | 63 | |||||||||
| Current tax liabilities | 1,192 | 2,000 | ||||||||||
| Deferred tax liabilities | 22 | 1,470 | 2,429 | |||||||||
| VAT and other tax payables | 1,022 | 1,079 | ||||||||||
| Settlement and clearing accounts | 3,089 | 7,476 | ||||||||||
| Amounts due under unit-linked investment contracts | 13,051 | 27,455 | ||||||||||
Other payables1 | 11,459 | 19,278 | ||||||||||
Total other liabilities | 34,040 | 61,496 | ||||||||||
305
Table of Contents
Financial information
Notes to the consolidated financial statements
Litigation
| a) | Tax Shelter Investigation: In connection with a criminal investigation of tax shelters, the United States Attorney’s Office for the Southern District of New York (US Attorney’s Office) continues to examine certain tax-oriented transactions in which UBS and others engaged between 1996 and 2000. UBS is continuing to cooperate in this investigation. | |
| b) | Municipal Bond: In November 2006, UBS and others received subpoenas from the US Department of Justice, Antitrust Division, and the US Securities and Exchange Commission (SEC) seeking information relating to derivative transactions entered into with municipal bond issuers and to the investment of proceeds of municipal bond |
| issuances. Both investigations are ongoing, and UBS is cooperating. In addition, various state Attorneys General have issued subpoenas seeking similar information. In the SEC investigation, on 4 February 2008, UBS received a “Wells notice” advising that the SEC staff is considering recommending that the SEC bring a civil action against UBS AG in connection with the bidding of various financial instruments associated with municipal securities. Under the SEC’s Wells process, UBS will have the opportunity to set forth reasons of law, policy or fact why such an action should not be brought. | ||
| c) | HealthSouth: UBS is defending itself in two putative securities class actions brought in the US District Court of the Northern District of Alabama by holders of stock and bonds in HealthSouth Corp. In October 2008, UBS agreed to settle derivative litigation brought on behalf of Health-South in Alabama State Court. Due to existing insurance coverage this settlement has no impact on UBS’s result in 2008. | |
| d) | Parmalat: UBS has been facing multiple proceedings arising out of the Parmalat insolvency. In June 2008, UBS settled all civil claims brought by Parmalat in its capacity as Assumptor in composition with creditors and Mr. Bondi (Extraordinary Commissioner of Parmalat S.p.A. and other Parmalat companies under extraordinary administration) for EUR 185 million. Other civil claims by third parties have automatically terminated as a result of termination of criminal proceedings in Milan (with the exception of some costs issues which are the subject of appeals to Court of Cassation) and will also do so in Parma when the time for filing an appeal expires, unless an appeal has been lodged in the meantime. |
306
Table of Contents
Financial information |
Note 21 Provisions and litigation (continued)
| e) | Auction Rate Securities: UBS was sued by three state regulatory authorities and was the subject of investigations by the SEC and other regulators, relating to the marketing and sale of Auction Rate Securities (ARS) to clients and to UBS’s role and participation in ARS auctions. UBS also has been named in several putative class actions and individual civil suits and a large number of individual arbitrations. The regulatory actions and investigations and the class actions followed the disruption in the markets for these securities and related auction failures since mid-February 2008. Plaintiffs and the regulators are generally seeking rescission, i.e., for UBS to purchase the ARS that UBS sold to them at par value, as well as compensatory damages, disgorgement of profits and in some cases penalties. In May 2008, UBS entered into a settlement with the Massachusetts Attorney General in which UBS agreed to buy back USD 36 million in auction rate securities that had been sold to general purpose municipal accounts but were impermissible investments for those accounts. On 8 August 2008, UBS entered into settlements in principle with the SEC, the New York Attorney General (NYAG) and other state agencies represented by the North American Securities Administrators Association (NASAA), including the Massachusetts Securities Division (MSD), whereby UBS agreed to offer to buy back ARS from eligible customers within certain time frames, and to pay penalties of USD 150 million (USD 75 million to the NYAG, USD 75 million to the other states). On 2 October 2008, UBS finalized its settlement with the MSD, on 11 December 2008 with the SEC and the NYAG, and UBS is continuing to finalize agreements with the other state regulators. UBS’s offer to purchase back ARS was done by a registered securities offering effective 7 October 2008. UBS’s settlement is largely in line with similar industry regulatory settlements; however, UBS is the only firm of its major competitors that offered to purchase ARS from institutional clients before a date certain. UBS’s settlement with the SEC and MSD requires UBS to offer to buy eligible ARS from eligible institutional clients by no later than 30 June 2010. Settlements with the other NASAA states are being worked out. The NYAG settlement does not reference a date certain, but contains language similar to other industry settlements requiring that UBS make ‘best efforts’ to provide liquidity solutions for institutional investors. The NYAG and SEC continue to investigate individuals affiliated with UBS who traded in ARS or who had responsibility for disclosures. On 7 October 2008, the NYAG announced a settlement with the former Investment Bank Global General Counsel relating to his trading of ARS allegedly in violation of New York’s Martin Act. The former Investment Bank Global General Counsel neither admitted nor denied the state’s allegations, but agreed to certain penalties and sanctions. |
| f) | US Cross-Border: UBS AG has been responding to a number of governmental inquiries and investigations relating to its cross-border private banking services to US private clients during the years 2000–2008. In particular, the US Department of Justice (DOJ) has been examining whether certain US clients sought, with the assistance of UBS client advisors, to evade their US tax obligations by avoiding restrictions on their securities investments imposed by the Qualified Intermediary Agreement (QIA) UBS entered into with the US Internal Revenue Service (IRS) in 2001. DOJ and IRS are also have been examining whether UBS AG has been compliant with withholding obligations in relation to sales of non-US securities under the Deemed Sales and Paid In US tax regulations. A former UBS AG client advisor pleaded guilty to one count of conspiracy to defraud the United States and the IRS in connection with providing investment and other services to a US person who is alleged to have evaded US income taxes on income earned on assets maintained in, among other places, a former UBS AG account in Switzerland. In November 2008, the CEO of Global WM&BB was indicted by a US federal grand jury sitting in the Southern District of Florida on one count of conspiring to defraud the IRS in violation of US law. Among other things, the indictment alleges that the CEO of Global WM&BB had involvement in the operation and maintenance of the US cross-border business while knowing that such business was being conducted in violation of certain US laws. The District Attorney for the County of New York has issued a request for information seeking information located in the US concerning UBS’s cross-border business, including any information located in the US relating to clients of that business. Further, the IRS has delivered to UBS AG a notice concerning alleged violations of the QIA which UBS is responding to under the applicable cure process. The SEC has been examining whether Swiss-based UBS client advisors engaged in activities in relation to their US-domiciled clients that triggered an obligation for UBS Switzerland to register with the SEC as a broker-dealer and/or investment adviser. Finally, the Swiss Financial Market Supervisory Authority (FINMA) investigated UBS’s cross-border servicing of US private clients under Swiss Banking Supervisory legislation. The investigations also have been focused on the management supervision and control of the US cross-border business and the practices at issue. UBS has been working to respond in an appropriate and responsible manner to all of these investigations in an effort to achieve a satisfactory resolution of these matters. As announced on 17 July 2008, UBS will no longer provide securities and banking services to US-resident private clients (including non-operating entities with US beneficiaries) except through its SEC-registered affiliates. On |
307
Table of Contents
Financial information
Notes to the consolidated financial statements
Note 21 Provisions and litigation (continued)
| 18 February 2009, UBS announced that it had entered into a Deferred Prosecution Agreement (DPA) with the DOJ and a Consent Order with the SEC. These agreements resolve the above-described criminal and regulatory investigations by these authorities. As part of these settlement agreements, among other things: (i) UBS will pay a total of USD 780 million to the United States, USD 380 million representing disgorgement of profits from maintaining the US cross-border business and USD 400 million representing US federal backup withholding tax required to be withheld by UBS, together with interest and penalties, and restitution for unpaid taxes associated with certain account relationships involving fraudulent sham and nominee offshore structures and otherwise as covered by the DPA; (ii) UBS will complete the exit of the US cross-border business out of non-SEC registered entities, as announced in July 2008, which these settlements permit UBS to do in a lawful, orderly and expeditious manner; (iii) UBS will implement and maintain an enhanced program of internal controls with respect to compliance with its obligations under its Qualified Intermediary (QI) Agreement with the Internal Revenue Service (IRS), as well as a revised Legal and Compliance governance structure in order to strengthen independent legal and compliance controls; and (iv) pursuant to an order issued by FINMA, information was transferred to the DOJ regarding accounts of certain US clients as set forth in the DPA who, based on evidence available to UBS, appear to have committed tax fraud or the like within the meaning of the Swiss-US Double Taxation Treaty. Pursuant to the DPA, DOJ has agreed that any further prosecution of UBS will be deferred for a period of at least 18 months, subject to extension under certain circumstances such as UBS needing more time to complete the implementation of the exit of its US cross-border business. If UBS satisfies all of its obligations under the DPA, the DOJ will refrain permanently from pursuing charges against UBS relating to the investigation of its US cross-border business. As part of the SEC resolution, the SEC filed a Complaint against UBS in Federal District Court in Washington, D.C., charging UBS with acting as an unregistered broker-dealer and investment advisor in connection with maintaining its US cross-border business. Pursuant to the Consent Order, UBS did not admit or deny the allegations in that Complaint, and consented to the entry of a final judgment that provides, among other things, that: (i) UBS will pay USD 200 million to the SEC, representing disgorgement of profits from the US cross-border business (this amount is included within, and not in addition to, the USD 780 million UBS is paying to the United States as described above); and (ii) UBS will complete its exit of the US cross-border business and will be permanently |
| enjoined from violating the SEC registration requirements by providing broker-dealer or investment advisory services to US persons through UBS entities not registered with the SEC. | ||
| The DOJ and SEC agreements do not resolve issues concerning the pending “John Doe” summons which the IRS served on UBS in July 2008. In this regard, on 19 February 2009, the Civil Tax Division of the DOJ filed a civil petition for enforcement of this summons in US Federal District Court in Miami, through which it seeks an order directing UBS to produce information located in Switzerland regarding US clients who have maintained accounts with UBS in Switzerland without providing a Form W-9. On 24 February 2009, the District Court issued a scheduling order pursuant to which a hearing will be held on 13 July 2009. The DPA preserves UBS’s ability to defend fully its rights in connection with the IRS’s enforcement effort. UBS believes that it has substantial defenses, including that complying with the summons would constitute a violation of Swiss financial privacy laws, and intends to vigorously contest the enforcement of the summons. The resolution of the summons litigation could result in the imposition of substantial fines, penalties and / or other remedies. In addition, pursuant to the DPA, should UBS fail to comply with a final US court order directing it to comply with the summons after fully exhausting all rights to appeal, the DOJ may, after certain conditions have been satisfied, choose to pursue various remedies available for breach of the DPA. This may include charging UBS with conspiracy to commit tax fraud. Also on 18 February 2009, the FINMA published the results of the now concluded investigation conducted by the Swiss Federal Banking Commission (SFBC). The SFBC concluded, among other things, that UBS violated the requirements for proper business conduct under Swiss banking law and issued an order barring UBS from providing services to US resident private clients out of non-SEC registered entities. Further, the SFBC ordered UBS to enhance its control framework around its cross-border businesses, and announced that the effectiveness of such framework will be audited. | ||
| g) | Sub-prime-related Matters: UBS is responding to a number of governmental inquiries and investigations, and is involved in a number of litigations, arbitrations and disputes, related to the sub-prime crisis, sub-prime securities, and structured transactions involving sub-prime securities. These matters concern, among other things, UBS’s valuations, disclosures, write-downs, underwriting, and contractual obligations. In particular, UBS has been in regular communication with, and responding to inquiries by FINMA, its home country consolidated regulator, as well as the SEC and the United States Attorney’s Office for the Eastern Dis- |
308
Table of Contents
Financial information |
Note 21 Provisions and litigation (continued)
| trict of New York (USAO), regarding some of these issues and others, including the role of internal control units, governance and processes around risk control and valuation of sub-prime instruments, compliance with public disclosure rules, and the business rationales for the launching and the reintegration of Dillon Read Capital Management (DRCM). While FINMA concluded its investigation in October 2008, the investigation by the SEC and the USAO are ongoing. In addition, a consolidated class action was filed against UBS and a number of senior directors and officers in the Southern District of New York alleging securities fraud in connection with the firm’s valuations and disclosures relating to sub-prime and asset-backed securities. UBS and a number of senior officers and directors have also been sued in a consolidated class action brought on behalf of holders of UBS ERISA retirement plans in which there were purchases of UBS stock. Both class actions are in their early stages. | ||
| h) | Madoff: In relation to the Madoff investment fraud, UBS, UBS (Luxembourg) SA and certain other UBS subsidiaries are responding to inquiries by a number of regulators, including FINMA and the Luxembourg Commission de surveillance du secteur financier (CSSF). CSSF has made |
| inquiries concerning two third party funds established under Luxembourg law the assets of which were managed by Bernard L. Madoff Investment Securities LLC, and which now face severe losses. The documentation establishing both funds suggests that UBS entities act in various capacities including custodian, administrator, manager, distributor and promoter, and that UBS employees serve as board members. On 25 February 2009, the CSSF issued a communiqué with respect to the larger of the two funds, stating that UBS (Luxembourg) SA had failed to comply with its due diligence responsibilities as custodian bank. The CSSF ordered UBS (Luxembourg) SA to review its infrastructure and procedures relating to its supervisory obligations as custodian bank, but did not order it to compensate investors. To date, very few investor claims have been filed, and most have related to unsatisfied redemption requests delivered to these funds prior to the revelation of the Madoff scheme. Further, certain clients of UBS Sauerborn (the KeyClient segment of UBS Deutschland AG) are exposed to Madoff-managed positions through third party funds and funds administered by UBS Sauerborn. |
309
Table of Contents
Financial information
Notes to the consolidated financial statements
Of the deferred tax benefit in the income statement of CHF 7,020 million, CHF 6,126 million relates to the recognition of incremental net deferred tax assets in respect of available tax losses. The incremental deferred tax assets mainly relate to Swiss tax losses incurred during the year (primarily due to the writedown of investments in US subsidiaries). The tax benefit was reduced by a decrease in the deferred tax asset recognized for US tax losses.
estimated basis during the year, part of which are expected to be repaid because the final tax liability for the year is anticipated to be less than the amounts paid.
| For the year ended | |||||||||||||
| CHF million | 31.12.08 | 31.12.07 | 31.12.06 | ||||||||||
| Operating profit from continuing operations before tax | (27,353 | ) | (3,742 | ) | 14,119 | ||||||||
| Domestic | 3,269 | 10,337 | 5,503 | ||||||||||
| Foreign | (30,622 | ) | (14,079 | ) | 8,616 | ||||||||
| Income taxes at Swiss statutory rate of 22% for 2008, 2007 and 2006 | (6,018 | ) | (823 | ) | 3,106 | ||||||||
| Increase / (decrease) resulting from: | |||||||||||||
| Applicable tax rates differing from Swiss statutory rate | (7,018 | ) | (3,054 | ) | 799 | ||||||||
| Tax effects of losses not recognized | 7,327 | 6,327 | 21 | ||||||||||
| Previously unrecorded tax losses now utilized | (10 | ) | (257 | ) | (676 | ) | |||||||
| Lower taxed income | (773 | ) | (1,587 | ) | (941 | ) | |||||||
| Non-deductible goodwill and intangible asset amortization | 160 | 15 | 21 | ||||||||||
| Other non-deductible expenses | 695 | 227 | 183 | ||||||||||
| Adjustments related to prior years | (490 | ) | (72 | ) | 316 | ||||||||
| Change in deferred tax valuation allowance | (692 | ) | 279 | (192 | ) | ||||||||
| Other items | (17 | ) | 314 | 361 | |||||||||
Income tax expense from continuing operations | (6,837 | ) | 1,369 | 2,998 | |||||||||
310
Table of Contents
Financial information |
Note 22 Income taxes (continued)
Significant components of the Group’s gross deferred income tax assets and liabilities are as follows:
| CHF million | 31.12.08 | 31.12.07 | ||||||
Deferred tax assets | ||||||||
| Compensation and benefits | 1,534 | 3,370 | ||||||
| Tax loss carry-forwards | 32,749 | 10,385 | ||||||
| Trading assets | 608 | 163 | ||||||
| Other | 211 | 859 | ||||||
| Total | 35,103 | 14,777 | ||||||
| Valuation allowance | (26,222 | ) | (11,557 | ) | ||||
Deferred tax assets recognized | 8,880 | 3,220 | ||||||
Deferred tax liabilities | ||||||||
| Compensation and benefits | 111 | 470 | ||||||
| Property and equipment | 29 | 175 | ||||||
| Financial investments and associates | 206 | 690 | ||||||
| Trading assets | 244 | 498 | ||||||
| Goodwill and intangible assets | 289 | 173 | ||||||
| Other | 591 | 424 | ||||||
Deferred tax liabilities | 1,470 | 2,429 | ||||||
The change in the balance of net deferred tax assets and deferred tax liabilities does not equal the deferred tax expense in those years. This is mainly due to the effects of exchange rate changes on tax assets and liabilities denominated in currencies other than CHF. For the above purposes, the valuation allowance represents amounts that are not expected to provide future benefits, either because they are offset against potential tax adjustments or due to insufficiency of future taxable income. The deferred tax assets recognized at 31 December 2008 were as follows: Compensation and benefits: CHF 321 million; Tax loss carry-forwards: CHF 8,126 million; Trading assets: CHF 243 million; and Other: CHF 190 million.
writedown of investments in US subsidiaries) and US tax losses. Swiss tax losses can be carried forward for seven years and US federal tax losses for 20 years. The agreement which UBS entered into to transfer certain illiquid securities and other positions to a fund owned and controlled by the Swiss National Bank (refer to Note 38) materially reduced the Group’s exposures to US real estate related assets and hence provided additional evidence that future US taxable profits will be available against which part of the Group’s unused US tax losses can be utilized. A deferred tax asset has been recognized in respect of that portion of the US tax losses.
311
Table of Contents
Financial information
Notes to the consolidated financial statements
Note 22 Income taxes (continued)
At 31 December 2008, tax losses totalling CHF 71,001 million which are not recognized as deferred tax assets are available to be offset against potential tax adjustments or future taxable income.
The tax losses expire as follows:
| CHF million | 31.12.08 | |||
| Within 1 year | 1 | |||
| From 2 to 4 years | 19 | |||
| After 4 years | 70,982 | |||
Total | 71,001 | |||
Note 23 Derivative instruments and hedge accounting
A derivative is a financial instrument, the value of which is derived from the value of another (“underlying”) financial instrument, an index or some other variable. Typically, the underlying is a share, commodity or bond price, an index value or an exchange or interest rate.
if the transactions are with the same counterparty, are denominated in the same currency, and the cash flows will be settled on a net basis. Changes in replacement values of derivative instruments are recognized in the income statement unless they meet the criteria for certain hedge accounting relationships, as explained in Note 1a) 14) Derivative instruments and hedge accounting.
Types of derivative instruments
| – | Interest rate swap contracts generally entail the contractual exchange of fixed-rate and floating-rate interest payments in a single currency, based on a notional amount and a reference interest rate, e.g. LIBOR. | |
| – | Cross-currency swaps involve the exchange of interest payments based on two different currency principal balances and reference interest rates and generally also entail exchange of principal amounts at the start and / or end of the contract. | |
| – | Credit default swaps (CDSs) are the most common form of a credit derivative, under which the party buying pro- |
312
Table of Contents
Financial information |
Note 23 Derivative instruments and hedge accounting (continued)
| tection makes one or more payments to the party selling protection in exchange for an undertaking by the seller to make a payment to the buyer following a credit event (as defined in the contract) with respect to a third-party credit entity (as defined in the contract). Settlement following a credit event may be a net cash amount or cash in return for physical delivery of one or more obligations of the credit entity and is made regardless of whether the protection buyer has actually suffered a loss. After a credit event and settlement, the contract is terminated. | ||
| – | Total rate of return swaps give the total return receiver exposure to all of the cash flows and economic benefits and risks of an underlying asset, without having to own the asset, in exchange for a series of payments, often based on a reference interest rate, e.g. LIBOR. The total return payer has an equal and opposite position. | |
| – | Metal swaps (precious metal swaps and base metal swaps) involve the purchase and sale of specific metals. A precious metal swap involves the purchase and sale of a specified metal with fixed notional amount and fixed price but different settlement dates. A base metal swap is the simultaneous purchase and sale of a specified metal with same settlement dates but different pricing terms. |
Credit derivatives
Commitment to acquire auction rate securities
chase, the restructuring of the securities as well as the fair values of such securities.
Derivatives transacted for trading purposes
Derivatives transacted for hedging purposes
313
Table of Contents
Financial information
Notes to the consolidated financial statements
Note 23 Derivative instruments and hedge accounting (continued)
The Group has entered into CDSs that provide economic hedges for credit risk exposures in the loan and traded product portfolios but do not meet the requirements for hedge accounting treatment.
Fair value hedges
| Fair value hedges of interest rate risk | ||||||||||||
| For the year ended | ||||||||||||
| CHF million | 31.12.08 | 31.12.07 | 31.12.06 | |||||||||
| Gains / (losses) on hedging instruments | 778 | 15 | (28 | ) | ||||||||
| Gains / (losses) on hedged items attributable to the hedged risk | (796 | ) | (11 | ) | 11 | |||||||
Net gains / (losses) representing ineffective portions of fair value hedges | (18 | ) | 4 | (17 | ) | |||||||
In addition, the Group entered into a fair value hedge accounting relationship in 2005 using foreign exchange derivatives to protect a certain portion of equity investments available-for-sale from foreign currency exposure. The time value associated with the FX derivatives is excluded from the evaluation of hedge ineffectiveness. The hedging relation-
ship was terminated in 2008 as a result of UBS’s disposal of its foreign currency investment, which was the hedged item in this hedge accounting relationship. The fair value of outstanding FX derivatives designated as fair value hedges at 31 December 2008 and 31 December 2007 was CHF 0 million for both years.
| Fair value hedges of foreign exchange risk | ||||||||||||
| For the year ended | ||||||||||||
| CHF million | 31.12.08 | 31.12.07 | 31.12.06 | |||||||||
| Gains / (losses) on hedging instruments | 0 | 42 | 49 | |||||||||
| Gains / (losses) on hedged items attributable to the hedged risk | 0 | (44 | ) | (44 | ) | |||||||
Net gains / (losses) representing ineffective portions of fair value hedges | 0 | (2 | ) | 5 | ||||||||
Fair value hedges of portfolio interest rate risk
CHF 765 million net negative replacement value and at 31 December 2007 was a CHF 41 million net negative replacement value.
| Fair value hedge of portfolio of interest rate risk | ||||||||||||
| For the year ended | ||||||||||||
| CHF million | 31.12.08 | 31.12.07 | 31.12.06 | |||||||||
| Gains / (losses) on hedging instruments | (644 | ) | (37 | ) | (7 | ) | ||||||
| Gains / (losses) on hedged items attributable to the hedged risk | 688 | 30 | 7 | |||||||||
Net gains / (losses) representing ineffective portions of fair value hedges | 44 | (7 | ) | 0 | ||||||||
314
Table of Contents
Financial information |
Note 23 Derivative instruments and hedge accounting (continued)
Cash flow hedges of forecast transactions
mates of prepayments and defaults. The aggregate principal balances and interest cash flows across all portfolios over time form the basis for identifying the non-trading interest rate risk of the Group, which is hedged with interest rate swaps, the maximum maturity of which is 19 years.
| Forecasted cash flows | ||||||||||||||||||||
| CHF billion | < 1 year | 1–3 years | 3–5 years | 5–10 years | over 10 years | |||||||||||||||
| Cash inflows (assets) | 247 | 443 | 309 | 250 | 19 | |||||||||||||||
| Cash outflows (liabilities) | 69 | 129 | 101 | 85 | 2 | |||||||||||||||
Net cash flows | 178 | 314 | 208 | 165 | 17 | |||||||||||||||
Gains and losses on the effective portions of derivatives designated as cash flow hedges of forecast transactions are initially recorded in Equity as Net income recognized directly in equity and are transferred to current period earnings when the forecast cash flows affect net profit or loss. The gains and losses on ineffective portions of such derivatives are recognized immediately in the income statement. A CHF 164 million loss, a CHF 443 million gain and a CHF 36 million loss were recognized in 2008, 2007 and 2006, respectively, due to hedge ineffectiveness.
lion net gain in 2006. These amounts were recorded in Net interest income.
Risks of derivative instruments
315
Table of Contents
Financial information
Notes to the consolidated financial statements
Note 23 Derivative instruments and hedge accounting (continued)
requirements imposed by regulators reflect these additional factors.
which are enforceable in case of insolvency. The impact of such netting agreements on the gross replacement values shown in the tables on the next two pages is to reduce both positive and negative replacement values by CHF 652 billion and CHF 292 billion at 31 December 2008 and 2007, respectively. As a result, positive replacement values after netting for UBS Group were CHF 202 billion at 31 December 2008 and CHF 136 billion at 31 December 2007.
316
Table of Contents
Financial information |
| Note 23 Derivative instruments and hedge accounting1 (continued) | ||||||||||||||||||||||||||||||||||||||||||||||||
| As of 31 December 2008 | Term to maturity | |||||||||||||||||||||||||||||||||||||||||||||||
| Within 3 months | 3–12 months | 1–5 years | over 5 years | Total | Notional | Total | Notional | |||||||||||||||||||||||||||||||||||||||||
| CHF billion | PRV2 | NRV3 | PRV | NRV | PRV | NRV | PRV | NRV | PRV | value | NRV | value | ||||||||||||||||||||||||||||||||||||
Interest rate contracts | ||||||||||||||||||||||||||||||||||||||||||||||||
| Over-the-counter (OTC) contracts | ||||||||||||||||||||||||||||||||||||||||||||||||
| Forward contracts | 2.1 | 2.2 | 3.8 | 4.1 | 0.3 | 0.4 | 0.0 | 6.2 | 1,544.9 | 6.7 | 1,584.5 | |||||||||||||||||||||||||||||||||||||
| Swaps | 9.5 | 9.9 | 23.6 | 24.3 | 152.1 | 140.5 | 144.8 | 142.9 | 330.0 | 9,065.4 | 317.6 | 22,739.9 | ||||||||||||||||||||||||||||||||||||
| Options | 4.0 | 3.7 | 6.6 | 7.0 | 14.3 | 15.6 | 12.6 | 16.5 | 37.4 | 498.4 | 42.9 | 595.5 | ||||||||||||||||||||||||||||||||||||
Exchange-traded contracts4 | ||||||||||||||||||||||||||||||||||||||||||||||||
| Futures | 219.8 | 307.8 | ||||||||||||||||||||||||||||||||||||||||||||||
| Options | 0.8 | 0.8 | 0.5 | 0.5 | 0.1 | 0.1 | 1.4 | 6.4 | 1.4 | 8.7 | ||||||||||||||||||||||||||||||||||||||
Total | 16.4 | 16.6 | 34.5 | 36.0 | 166.8 | 156.6 | 157.4 | 159.5 | 375.1 | 11,334.9 | 368.6 | 25,236.4 | ||||||||||||||||||||||||||||||||||||
Credit derivative contracts | ||||||||||||||||||||||||||||||||||||||||||||||||
| Over-the-counter (OTC) contracts | ||||||||||||||||||||||||||||||||||||||||||||||||
| Credit default swaps | 0.5 | 0.3 | 3.4 | 3.5 | 95.4 | 91.2 | 89.8 | 88.2 | 189.1 | 1,856.1 | 183.3 | 1,754.0 | ||||||||||||||||||||||||||||||||||||
| Total rate of return swaps | 3.4 | 0.4 | 0.2 | 0.1 | 3.1 | 0.5 | 1.6 | 0.5 | 8.3 | 31.2 | 1.5 | 12.6 | ||||||||||||||||||||||||||||||||||||
Total | 3.9 | 0.7 | 3.6 | 3.6 | 98.4 | 91.7 | 91.4 | 88.8 | 197.4 | 1,887.2 | 184.8 | 1,766.7 | ||||||||||||||||||||||||||||||||||||
Foreign exchange contracts | ||||||||||||||||||||||||||||||||||||||||||||||||
| Over-the-counter (OTC) contracts | ||||||||||||||||||||||||||||||||||||||||||||||||
| Forward contracts | 21.0 | 22.8 | 8.4 | 10.6 | 1.6 | 1.1 | 0.1 | 0.1 | 31.2 | 468.1 | 34.5 | 485.6 | ||||||||||||||||||||||||||||||||||||
| Interest and currency swaps | 72.1 | 74.5 | 36.2 | 33.8 | 34.9 | 39.2 | 27.1 | 26.5 | 170.3 | 2,047.4 | 173.9 | 1,868.4 | ||||||||||||||||||||||||||||||||||||
| Options | 7.5 | 7.6 | 10.0 | 9.1 | 2.1 | 1.8 | 0.0 | 19.7 | 610.1 | 18.6 | 524.8 | |||||||||||||||||||||||||||||||||||||
Exchange-traded contracts4 | ||||||||||||||||||||||||||||||||||||||||||||||||
| Futures | 1.7 | |||||||||||||||||||||||||||||||||||||||||||||||
| Options | 0.2 | 0.3 | 0.0 | 0.0 | 0.2 | 12.8 | 0.3 | 6.1 | ||||||||||||||||||||||||||||||||||||||||
Total | 101.0 | 105.2 | 54.6 | 53.5 | 38.7 | 42.1 | 27.2 | 26.6 | 221.5 | 3,138.3 | 227.3 | 2,886.5 | ||||||||||||||||||||||||||||||||||||
Equity/index contracts | ||||||||||||||||||||||||||||||||||||||||||||||||
| Over-the-counter (OTC) contracts | ||||||||||||||||||||||||||||||||||||||||||||||||
| Forward contracts | 1.9 | 1.6 | 2.0 | 1.8 | 2.2 | 2.0 | 0.2 | 0.3 | 6.4 | 68.5 | 5.7 | 40.1 | ||||||||||||||||||||||||||||||||||||
| Options | 1.7 | 3.2 | 4.8 | 7.4 | 4.7 | 8.5 | 1.7 | 4.0 | 12.9 | 108.9 | 23.0 | 106.1 | ||||||||||||||||||||||||||||||||||||
Exchange-traded contracts4 | ||||||||||||||||||||||||||||||||||||||||||||||||
| Futures | 15.3 | 18.2 | ||||||||||||||||||||||||||||||||||||||||||||||
| Options | 5.0 | 5.2 | 5.3 | 6.7 | 4.8 | 5.6 | 0.9 | 1.2 | 16.1 | 97.9 | 18.7 | 110.5 | ||||||||||||||||||||||||||||||||||||
Total | 8.6 | 10.0 | 12.1 | 16.0 | 11.7 | 16.1 | 2.9 | 5.5 | 35.3 | 290.5 | 47.4 | 275.0 | ||||||||||||||||||||||||||||||||||||
Precious metals contracts | ||||||||||||||||||||||||||||||||||||||||||||||||
| Over-the-counter (OTC) contracts | ||||||||||||||||||||||||||||||||||||||||||||||||
| Forward contracts | 0.8 | 0.7 | 0.6 | 0.5 | 0.5 | 0.4 | 0.0 | 0.1 | 1.8 | 13.1 | 1.7 | 14.1 | ||||||||||||||||||||||||||||||||||||
| Options | 0.5 | 0.6 | 1.3 | 1.3 | 1.8 | 1.5 | 0.2 | 0.2 | 3.8 | 30.6 | 3.7 | 35.8 | ||||||||||||||||||||||||||||||||||||
Exchange-traded contracts4 | ||||||||||||||||||||||||||||||||||||||||||||||||
| Futures | 0.6 | |||||||||||||||||||||||||||||||||||||||||||||||
| Options | 0.1 | 0.1 | 0.1 | 0.2 | 0.0 | 0.0 | 0.1 | 4.7 | 0.3 | 9.5 | ||||||||||||||||||||||||||||||||||||||
Total | 1.3 | 1.4 | 1.9 | 2.0 | 2.3 | 1.9 | 0.3 | 0.4 | 5.8 | 48.4 | 5.7 | 60.0 | ||||||||||||||||||||||||||||||||||||
| Commodities contracts, excluding precious metals contracts | ||||||||||||||||||||||||||||||||||||||||||||||||
| Over-the-counter (OTC) contracts | ||||||||||||||||||||||||||||||||||||||||||||||||
| Forward contracts | 2.2 | 1.7 | 3.7 | 3.2 | 1.4 | 1.2 | 0.9 | 1.0 | 8.2 | 26.1 | 7.1 | 19.0 | ||||||||||||||||||||||||||||||||||||
| Options | 0.3 | 0.4 | 1.3 | 1.2 | 0.8 | 0.8 | 0.0 | 0.0 | 2.4 | 5.7 | 2.4 | 6.6 | ||||||||||||||||||||||||||||||||||||
Exchange-traded contracts4 | ||||||||||||||||||||||||||||||||||||||||||||||||
| Futures | 13.5 | 0.0 | ||||||||||||||||||||||||||||||||||||||||||||||
| Options | 2.0 | 2.0 | 3.7 | 3.7 | 2.7 | 2.7 | 8.4 | 69.9 | 8.4 | 86.1 | ||||||||||||||||||||||||||||||||||||||
Total | 4.5 | 4.1 | 8.8 | 8.1 | 4.8 | 4.6 | 0.9 | 1.0 | 19.0 | 115.2 | 17.9 | 111.8 | ||||||||||||||||||||||||||||||||||||
Total derivative instruments5,6 | 135.7 | 138.1 | 115.5 | 119.2 | 322.8 | 313.0 | 280.0 | 281.6 | 854.1 | 7 | 851.8 | 8 | ||||||||||||||||||||||||||||||||||||
| thereof commitments to repurchase auction rate securities | 1.0 | 1.0 | 16.6 | |||||||||||||||||||||||||||||||||||||||||||||
317
Table of Contents
Financial information
Notes to the consolidated financial statements
| Note 23 Derivative instruments and hedge accounting1 (continued) | ||||||||||||||||||||||||||||||||||||||||||||||||
| As of 31 December 2007 | Term to maturity | |||||||||||||||||||||||||||||||||||||||||||||||
| Within 3 months | 3–12 months | 1–5 years | over 5 years | Total | Notional | Total | Notional | |||||||||||||||||||||||||||||||||||||||||
| CHF billion | PRV2 | NRV3 | PRV | NRV | PRV | NRV | PRV | NRV | PRV | value | NRV | value | ||||||||||||||||||||||||||||||||||||
Interest rate contracts | ||||||||||||||||||||||||||||||||||||||||||||||||
| Over-the-counter (OTC) contracts | ||||||||||||||||||||||||||||||||||||||||||||||||
| Forward contracts | 0.7 | 0.8 | 0.1 | 0.1 | 0.0 | 0.0 | 0.8 | 759.7 | 0.9 | 775.1 | ||||||||||||||||||||||||||||||||||||||
| Swaps | 4.9 | 5.4 | 7.9 | 8.1 | 52.4 | 55.1 | 77.3 | 69.0 | 142.4 | 12,527.7 | 137.6 | 15,835.8 | ||||||||||||||||||||||||||||||||||||
| Options | 0.4 | 0.3 | 0.2 | 0.6 | 3.4 | 4.8 | 15.8 | 17.3 | 19.8 | 621.9 | 22.9 | 783.1 | ||||||||||||||||||||||||||||||||||||
Exchange-traded contracts4 | ||||||||||||||||||||||||||||||||||||||||||||||||
| Futures | 367.7 | 1,705.0 | ||||||||||||||||||||||||||||||||||||||||||||||
| Options | 0.6 | 0.6 | 0.3 | 0.3 | 0.0 | 0.0 | 0.9 | 39.0 | 0.9 | 50.9 | ||||||||||||||||||||||||||||||||||||||
Total | 6.5 | 7.0 | 8.5 | 9.2 | 55.9 | 59.9 | 93.0 | 86.3 | 163.9 | 14,316.0 | 162.4 | 19,149.9 | ||||||||||||||||||||||||||||||||||||
Credit derivative contracts | ||||||||||||||||||||||||||||||||||||||||||||||||
| Over-the-counter (OTC) contracts | ||||||||||||||||||||||||||||||||||||||||||||||||
| Credit default swaps | 0.2 | 0.2 | 6.5 | 6.0 | 60.9 | 62.5 | 26.8 | 30.9 | 94.4 | 2,509.7 | 99.6 | 2,662.6 | ||||||||||||||||||||||||||||||||||||
| Total rate of return swaps | 0.4 | 0.3 | 0.1 | 0.2 | 2.5 | 2.8 | 7.9 | 3.2 | 10.9 | 56.6 | 6.6 | 131.7 | ||||||||||||||||||||||||||||||||||||
Total | 0.6 | 0.6 | 6.6 | 6.2 | 63.3 | 65.3 | 34.7 | 34.1 | 105.3 | 2,566.3 | 106.2 | 2,794.3 | ||||||||||||||||||||||||||||||||||||
Foreign exchange contracts | ||||||||||||||||||||||||||||||||||||||||||||||||
| Over-the-counter (OTC) contracts | ||||||||||||||||||||||||||||||||||||||||||||||||
| Forward contracts | 8.2 | 8.8 | 2.6 | 2.9 | 0.9 | 0.6 | 0.0 | 0.0 | 11.7 | 635.0 | 12.3 | 687.2 | ||||||||||||||||||||||||||||||||||||
| Interest and currency swaps | 26.9 | 28.2 | 15.8 | 13.6 | 19.4 | 21.9 | 12.5 | 11.6 | 74.5 | 2,457.9 | 75.3 | 2,414.0 | ||||||||||||||||||||||||||||||||||||
| Options | 4.8 | 4.4 | 5.9 | 5.5 | 1.3 | 1.3 | 0.1 | 0.1 | 12.1 | 759.2 | 11.3 | 747.7 | ||||||||||||||||||||||||||||||||||||
Exchange-traded contracts4 | ||||||||||||||||||||||||||||||||||||||||||||||||
| Futures | 1.5 | 10.5 | ||||||||||||||||||||||||||||||||||||||||||||||
| Options | 0.1 | 0.1 | 0.0 | 0.0 | 0.1 | 0.0 | 0.1 | 4.5 | ||||||||||||||||||||||||||||||||||||||||
Total | 40.0 | 41.4 | 24.2 | 22.0 | 21.6 | 23.9 | 12.5 | 11.7 | 98.4 | 3,853.6 | 99.0 | 3,863.9 | ||||||||||||||||||||||||||||||||||||
Equity/index contracts | ||||||||||||||||||||||||||||||||||||||||||||||||
| Over-the-counter (OTC) contracts | ||||||||||||||||||||||||||||||||||||||||||||||||
| Forward contracts | 2.4 | 2.0 | 1.7 | 1.0 | 0.6 | 0.7 | 0.1 | 0.1 | 4.8 | 103.1 | 3.9 | 72.7 | ||||||||||||||||||||||||||||||||||||
| Options | 3.1 | 4.2 | 4.7 | 9.1 | 5.4 | 12.1 | 1.2 | 3.5 | 14.5 | 113.5 | 28.9 | 177.9 | ||||||||||||||||||||||||||||||||||||
Exchange-traded contracts4 | ||||||||||||||||||||||||||||||||||||||||||||||||
| Futures | 20.5 | 35.1 | ||||||||||||||||||||||||||||||||||||||||||||||
| Options | 6.1 | 6.2 | 7.9 | 8.7 | 6.5 | 7.2 | 0.2 | 0.3 | 20.8 | 158.6 | 22.4 | 166.9 | ||||||||||||||||||||||||||||||||||||
Total | 11.6 | 12.4 | 14.3 | 18.9 | 12.5 | 20.0 | 1.5 | 3.9 | 40.0 | 395.7 | 55.1 | 452.6 | ||||||||||||||||||||||||||||||||||||
Precious metals contracts | ||||||||||||||||||||||||||||||||||||||||||||||||
| Over-the-counter (OTC) contracts | ||||||||||||||||||||||||||||||||||||||||||||||||
| Forward contracts | 0.5 | 1.0 | 0.9 | 0.7 | 1.0 | 0.5 | 0.0 | 0.1 | 2.4 | 16.8 | 2.2 | 23.1 | ||||||||||||||||||||||||||||||||||||
| Options | 0.5 | 1.0 | 1.1 | 1.1 | 1.8 | 1.7 | 0.2 | 0.1 | 3.6 | 36.6 | 4.0 | 42.5 | ||||||||||||||||||||||||||||||||||||
Exchange-traded contracts4 | ||||||||||||||||||||||||||||||||||||||||||||||||
| Futures | 0.2 | |||||||||||||||||||||||||||||||||||||||||||||||
| Options | 0.1 | 0.1 | 0.2 | 0.2 | 0.0 | 0.0 | 0.4 | 18.5 | 0.4 | 9.5 | ||||||||||||||||||||||||||||||||||||||
Total | 1.1 | 2.1 | 2.2 | 2.0 | 2.9 | 2.2 | 0.2 | 0.2 | 6.4 | 71.9 | 6.6 | 75.3 | ||||||||||||||||||||||||||||||||||||
| Commodities contracts, excluding precious metals contracts | ||||||||||||||||||||||||||||||||||||||||||||||||
| Over-the-counter (OTC) contracts | ||||||||||||||||||||||||||||||||||||||||||||||||
| Forward contracts | 2.4 | 2.4 | 1.6 | 1.6 | 1.9 | 1.8 | 1.1 | 1.2 | 7.0 | 59.0 | 6.9 | 52.5 | ||||||||||||||||||||||||||||||||||||
| Options | 0.5 | 0.5 | 0.9 | 1.2 | 0.9 | 1.0 | 0.1 | 0.1 | 2.4 | 11.4 | 2.8 | 13.5 | ||||||||||||||||||||||||||||||||||||
Exchange-traded contracts4 | ||||||||||||||||||||||||||||||||||||||||||||||||
| Futures | 0.4 | 169.9 | ||||||||||||||||||||||||||||||||||||||||||||||
| Options | 1.6 | 1.5 | 2.3 | 2.3 | 1.0 | 0.7 | 4.9 | 88.7 | 4.5 | 92.6 | ||||||||||||||||||||||||||||||||||||||
Total | 4.5 | 4.3 | 4.8 | 5.1 | 3.8 | 3.5 | 1.2 | 1.3 | 14.2 | 159.5 | 14.3 | 328.5 | ||||||||||||||||||||||||||||||||||||
Total derivative instruments | 64.4 | 67.8 | 60.6 | 63.3 | 160.0 | 174.8 | 143.2 | 137.6 | 428.2 | 5 | 443.5 | 6 | ||||||||||||||||||||||||||||||||||||
318
Table of Contents
Off-balance-sheet information
Note 24 Pledgeable off-balance-sheet securities
The Group obtains securities which are not recorded on the balance sheet with the right to sell or repledge them as shown in the table below.
| CHF million | 31.12.08 | 31.12.07 | ||||||
| Fair value of securities received which can be sold or repledged | 651,380 | 1,491,567 | ||||||
as collateral under reverse repurchase, securities borrowing and lending arrangements, derivative transactions and other transactions | 621,981 | 1,396,768 | ||||||
in unsecured borrowings | 29,399 | 94,799 | ||||||
| thereof sold or repledged | 430,670 | 1,118,305 | ||||||
in connection with financing activities | 343,252 | 924,795 | ||||||
to satisfy commitments under short sale transactions | 62,431 | 164,788 | ||||||
in connection with derivative and other transactions | 24,987 | 28,722 | ||||||
Note 25 Operating lease commitments
| CHF million | 31.12.08 | |||
Operating leases due | ||||
| 2009 | 1,034 | |||
| 2010 | 950 | |||
| 2011 | 848 | |||
| 2012 | 772 | |||
| 2013 | 634 | |||
| 2014 and thereafter | 2,573 | |||
| Subtotal commitments for minimum payments under operating leases | 6,811 | |||
| Less: Sublease rentals under non-cancellable leases | 578 | |||
Net commitments for minimum payments under operating leases | 6,233 | |||
319
Table of Contents
Financial information
Notes to the consolidated financial statements
| Note 25 Operating lease commitments (continued) | ||||||||||||
| CHF million | 31.12.08 | 31.12.07 | 31.12.06 | |||||||||
Gross operating lease expense | 1,215 | 1,251 | 1,170 | |||||||||
| from continuing operations | 1,215 | 1,233 | 1,137 | |||||||||
| from discontinued operations | 0 | 18 | 33 | |||||||||
| Sublease rental income from continuing operations | 50 | 54 | 56 | |||||||||
Net operating lease expense | 1,165 | 1,197 | 1,114 | |||||||||
| from continuing operations | 1,165 | 1,179 | 1,081 | |||||||||
| from discontinued operations | 0 | 18 | 33 | |||||||||
320
Table of Contents
Financial information |
Additional information
Note 26 Capital increases and mandatory convertible notes
Share capital increase
Issuance of mandatory convertible notes (MCNs)
On 9 December 2007, UBS entered into an agreement with the Government of Singapore Investment Corporation Pte Ltd and an investor from the Middle East to issue mandatory convertible notes (MCNs) with a face value of CHF 13 billion. The MCNs were issued on 5 March 2008 after the shareholders approved, at the Extraordinary General Meeting held on 27 February 2008, the creation of conditional capital in a maximum amount of 277,750,000 shares to be issued upon conversion of the MCNs. The MCNs counted as Tier 1 capital for regulatory capital purposes from the date of issue.
December 2008 issuance
321
Table of Contents
Financial information
Notes to the consolidated financial statements
Note 26 Capital increases and mandatory convertible notes (continued)
Note 27 Fair value of financial instruments
a) Fair value measurements
Fair value is the amount for which an asset could be exchanged, or a liability settled, between knowledgeable, will-
ing parties in an arm’s length transaction. Refer to Note 1a) 5) for an overview on the determination of fair value.
| Determination of fair values from quoted market prices or valuation techniques | |||||||||||||||||||||||||||||||||
| 31.12.08 | 31.12.07 | ||||||||||||||||||||||||||||||||
| CHF billion | Level 1 | Level 2 | Level 3 | Total | Level 1 | Level 2 | Level 3 | Total | |||||||||||||||||||||||||
| Trading portfolio assets | 128.1 | 128.4 | 15.3 | 271.8 | 277.2 | 330.7 | 52.3 | 660.1 | |||||||||||||||||||||||||
| Trading portfolio assets pledged as collateral | 25.4 | 13.2 | 1.6 | 40.2 | 57.4 | 48.5 | 8.3 | 114.2 | |||||||||||||||||||||||||
| Positive replacement values | 5.1 | 811.2 | 37.8 | 854.1 | 6.8 | 407.4 | 14.0 | 428.2 | |||||||||||||||||||||||||
| Financial assets designated at fair value | 1.1 | 11.2 | 0.6 | 12.9 | 1.8 | 10.0 | 0.0 | 11.8 | |||||||||||||||||||||||||
| Financial investments available- for-sale | 2.4 | 1.2 | 1.6 | 5.2 | 1.2 | 2.4 | 1.4 | 5.0 | |||||||||||||||||||||||||
Total assets | 162.1 | 965.2 | 57.0 | 1,184.3 | 344.4 | 799.0 | 75.9 | 1,219.3 | |||||||||||||||||||||||||
| Trading portfolio liabilities | 33.9 | 27.5 | 1.0 | 62.4 | 119.9 | 44.9 | 0.0 | 164.8 | |||||||||||||||||||||||||
| Negative replacement values | 4.9 | 812.0 | 34.9 | 851.8 | 6.6 | 420.1 | 16.8 | 443.5 | |||||||||||||||||||||||||
| Financial liabilities designated at fair value | 0.0 | 91.2 | 10.3 | 101.5 | 0.0 | 149.5 | 42.4 | 191.9 | |||||||||||||||||||||||||
Total liabilities | 38.8 | 930.7 | 46.3 | 1,015.8 | 126.5 | 614.5 | 59.2 | 800.2 | |||||||||||||||||||||||||
Financial instruments accounted for at fair value
322
Table of Contents
Financial information |
Note 27 Fair value of financial instruments (continued)
a)Fair value measurements (continued)
Reflection of counterparty credit risk in the valuation of traded debt instruments and derivative instruments
UBS incorporates the counterparty credit risk inherent in over-the-counter (OTC) derivatives transactions and traded debt instruments into its fair value estimates via the credit valuation adjustment (CVA). This amount represents the estimated market value of protection required to hedge credit risk from counterparties in UBS’s OTC derivatives portfolio and traded debt instruments, taking into account expected future exposures, collateral, and netting arrangements. The most significant component of the overall CVA is the portion related to monolines, discussed further below.
UBS’s own credit risk in the valuations of financial liabilities at fair value, including derivative liabilities
The Group’s own credit changes are reflected in valuations for those financial liabilities at fair value, including derivative liabilities, where the Group’s own credit risk would be considered by market participants and excludes fully collateralized transactions and other instruments for which it is established market practice not to include an entity-specific adjustment for own credit. This amount represents the estimated difference in the market value of identical obligations
Disclosures on own credit for financial liabilities designated at fair value
At 31 December 2008, the own credit gain for financial liabilities designated at fair value still held at reporting date, predominantly issued structured products, amounts to CHF 2,032 million (year-to-date) and CHF 2,953 million (life-to-date). The life-to-date amount reduced the fair value of financial liabilities designated at fair value at 31 December 2008. Included in these amounts is the overall quantification of changes in fair value attributable to changes in UBS’s credit spread during the periods. In addition, it includes the credit effect of period changes in fair values attributable to factors other than credit spreads, including benchmark interest rates, prices of financial instruments issued by third parties, commodity prices, foreign exchange rates or index prices or rates (i.e. credit effect of volume changes). The year-to-date 2008 own credit profit and loss including only the change in credit spread but excluding the credit effect of volume changes was a gain of CHF 3,993 million.
Reflection of market illiquidity in fair value determinations
Fair value estimates incorporate the effects of illiquidity in the relevant markets. Where trading prices are observable in such markets, these prices invariably include a liquidity or risk premium relative to what could be concluded on the basis of an actuarial assessment of credit loss potential. Valuations based on models similarly incorporate liquidity or risk premiums either implicitly (e.g., by calibrating to market prices that incorporate such premiums) or explicitly.
Valuation processes
323
Table of Contents
Financial information
Notes to the consolidated financial statements
Note 27 Fair value of financial instruments (continued)
a) Fair value measurements (continued)
validation process before they are approved for use. Uncertainties associated with the use of model-based valuations (both level 2 and level 3) are predominantly addressed through the use of model reserves. These reserves reflect the amounts that UBS estimates are appropriate to deduct from the valuations produced directly by the models to reflect uncertainties in the relevant modeling assumptions and inputs used.
Financial instruments accounted for at amortized cost
| 31.12.08 | |||||||||
| CHF billion | Carrying value | Fair value | |||||||
Assets | |||||||||
| Loans to banks and customers | 403.0 | 402.6 | |||||||
| Cash collateral on securities borrowed and reverse repurchase agreements | 347.5 | 347.7 | |||||||
| Accrued income and prepaid expenses, other assets | 9.4 | 9.4 | |||||||
Liabilities | |||||||||
| Due to banks and customers | 600.4 | 600.4 | |||||||
| Cash collateral on securities lent and repurchase agreements | 116.6 | 116.6 | |||||||
| Debt issued | 201.2 | 199.7 | |||||||
| Accrued expenses and deferred income, other liabilities | 22.8 | 22.8 | |||||||
The fair values included in the table above were calculated for disclosure purposes only. The valuation techniques and assumptions described below provide a measurement of fair value of UBS’s financial instruments accounted for at amortized cost. However, because other institutions may use different methods and assumptions for their fair value estimation, such fair value disclosures cannot necessarily be compared from one financial institution to another. UBS applies significant judgments and assumptions to arrive at these fair values, which are more holistic and less sophisticated than UBS’s established fair value and model governance policies and processes applied for financial instruments accounted for at fair value, whose fair values impact UBS’s balance sheet and net profit. Debt instruments reclassified in fourth quarter 2008 from “held for trading” to “loans and receivables” followed the same fair value measurement principles and governance policies as financial instruments accounted for at fair value. The following principles were applied when determing fair value estimates for financial instruments accounted for at amortized cost:
| – | For short-term financial instruments with remaining maturities of one year or less, the carrying amount, which is net of credit loss allowances, is generally considered a reasonable estimate of fair value. The following financial instruments accounted for at amortized cost have remaining maturities of one year or less: |
| 100% of cash collateral on securities borrowed and reverse repurchase agreements; 97% of loans due from banks; 61% of loans to customers; 98% of amounts due to banks and customers; 99% cash collateral on securities lent and repurchase agreements; 60% of debt issued. Refer to the chapter “Liquidity and funding management” in the “Risk and treasury management” section of this report. | ||
| – | The fair value of variable-interest bearing financial instruments accounted for at amortized cost is assumed to be approximated by their carrying amounts, which are net of credit loss allowances, and does not reflect fair value changes in the credit quality of counterparties respectively UBS’s own credit movements. | |
| – | For fixed-interest bearing financial instruments with remaining maturities above one year, fair value was estimated by discounting contractual cash flows using current rates at which similar loans would be transacted to borrowers with similar credit ratings and/or collateral and for the same remaining maturities. These estimates generally include adjustments for counterparty credit respectively UBS’s own credit. | |
| – | The fair value estimates for repurchase and reverse repurchase agreements with variable and fixed interest rates, for all maturities, include the valuation of the interest rate component of these instrument. Credit and debit valua- |
324
Table of Contents
Financial information |
Note 27 Fair value of financial instruments (continued)
a) Fair value measurements (continued)
| tion adjustments have not been included into the valuation due to the short-term nature of these instruments. |
| – | For loans to customers from Global Wealth Management & Business Banking, mainly reflecting the impact of the Swiss Mortgage loan portfolio with a fixed rate of interest, an excess of fair value over the carrying amount of CHF 3.0 billion was determined. This amount is largely attributable to the current CHF interest rate movements, which are significantly below the average levels over the last decade. The fair values of UBS’s Investment Bank’s loans to customers were CHF 3.4 billion below their carrying values, mainly reflecting credit valuation adjustments for debt instruments reclassified from “held for trading” to “loans and receivables” in fourth quarter 2008. |
| – | For debt issued with remaining maturities greater than one year, the fair value was determined from quoted market prices, where available. Where quoted market prices were |
| not available the fair value was derived by discounting contractual cash flows by using rates at which UBS could issue debt with similar remaining maturities. Adjustments for own credit movements have been included into fair value estimation. |
b) Fair value measurements involving significant unobservable inputs (level 3)
Level 3 instruments at year-end
Material changes in level 3 instruments for the year
325
Table of Contents
Financial information
Notes to the consolidated financial statements
Note 27 Fair value of financial instruments (continued)
b) Fair value measurements involving significant unobservable inputs (level 3) (continued)
Level 3 profit or loss
Sensitivity information
| – | Scaling the model reserve amounts upward in line with less favorable assumptions would reduce fair value by approximately CHF 2.5 billion at 31 December 2008, by approximately CHF 2.7 billion at 31 December 2007, and approximately CHF 1.0 billion at 31 December 2006. | |
| – | Scaling the model reserve amounts downward in line with more favorable assumptions would increase fair value by approximately CHF 1.4 billion at 31 December 2008, by approximately CHF 2.2 billion at 31 December 2007, and approximately CHF 1.0 billion at 31 December 2006. |
326
Table of Contents
Financial information |
Note 27 Fair value of financial instruments (continued)
c) Valuation techniques and inputs by product
US super senior RMBS CDOs
All material super senior RMBS CDO tranches still held by UBS are covered by corresponding monoline credit protection referencing the specific position held by UBS. Where liquidation of the RMBS CDO is deemed imminent, valuation is based on the estimated aggregate proceeds of the liquidation (using current fair value estimates of the underlying instruments) less any estimated expenses associated with the liquidation. For the remainder of the super senior RMBS CDO population, a model that projects losses on the underlying mortgage pools and applies the implications of these projected lifetime losses through to the RMBS and then to the CDO structure is applied. The loss projection is calibrated separately for each RMBS CDO so that the model recovers the estimated market value of the underlying collateral pool. At 31 December 2007, a similar model was applied, with loss projection estimates calibrated such that the model valued relevant ABX market indices consistently with their observed levels in the market. The model has been adjusted in 2008 to better reflect the prevailing market conditions and illiquidity.
Credit valuation adjustments on monoline credit protection
Credit valuation adjustments (CVAs) for monoline credit protection are based on a methodology that uses credit default swap spreads on the monolines as a key input in determining an implied level of expected loss. Where a monoline has no observable credit default swap spread, a judgment is made on the most comparable monoline or combination of monolines and the corresponding spreads are used instead. Credit valuation adjustments are intended to achieve a fair value of the underlying contracts and are normally based on publicly available information. In 2008, in some cases where UBS has had knowledge of potential restructurings that may result in economic outcomes more adverse than those implied by CDS market spreads, UBS had determined to modify CVA amounts accordingly. At 31 December 2007, a similar methodology was applied. The
methodology was re-calibrated in 2008 to reflect prevailing market conditions, in particular the greater prevalence of CDS trading with up-front cash exchanges and declines in potential recovery rates implied by recovery swap contract pricing.
Student loan auction rate securities (ARSs)
Student loan ARSs held by UBS’s Investment Bank of USD 7.9 billion (CHF 8.4 billion), previously classified as “held for trading”, were reclassified to the category “loans and receivables” per 31 December 2008. This implies that, going forward, these positions will be accounted for at amortized cost and tested for impairment, rather than being subject to fair value accounting through profit or loss. These ARS positions have been fair valued for the last time at 31 December 2008, applying the following principles. The applied method separates various factors and risks influencing fair value of ARSs and allows calibrating the result to market transactions whenever they become available. The methodology relies on four key components: (a) fundamental cash flow modeling to estimate the level and timing of potential credit losses on a given portfolio of student loans backing the ARS, (b) use of forward yields embedded in market term structure to estimate expected required coupon payments, c) discounted cash flow projections calibrated to observed ARS market transactions to correct for any model drift, and (d) liquidity penalties that impose a further discount to reflect market conditions. Each of these inputs is calculated and then aggregated in order to arrive at the fair value for each individ-
327
Table of Contents
Financial information
Notes to the consolidated financial statements
Note 27 Fair value of financial instruments (continued)
c) Valuation techniques and inputs by product (continued)
ual security. At 31 December 2007, these instruments were not classified as level 3, as auctions had not failed at this time. After the failure of auctions due to lack of investor demand in first quarter 2008 up to third quarter 2008, UBS valued student loan ARSs by comparing them to the student loan floating rate notes (FRNs), but adopted the model described above for 31 December 2008, consistent with the belief that it provides a better and more granular approach to fair value estimation.
US reference linked notes (US RLNs)
The US RLN consists of a series of transactions whereby UBS purchases credit protection, predominantly in note form, on a portfolio of fixed income assets. It is described in detail in the Annual Report 2007, “Risk, Treasury and Capital Management” section, page 13. The referenced assets are comprised of USD ABSs (primarily home equity) and/or corporate bonds and loans across all rating categories. UBS’s direct exposure to these assets has been reduced via transactions including the transaction with the SNB.
Non-US reference linked notes (Non-US RLNs)
The same valuation model and the same approach to calculation of fair value adjustments is applied for the non-US RLN credit protection as for the US RLN credit protection described above, except spread is shocked by 10% for European corporate names. As of 31 December 2008, the fair value of the non-US RLN credit protection is approximately USD 1,971 million (CHF 2,102 million). The fair value adjustments (up and down) calculated by applying the shocks described above are USD 155 million (CHF 165 million).
Leveraged finance
A significant proportion of UBS’s leveraged finance exposures have been reclassified from the category “held for trading” to the category “loans and receivables” in fourth quarter 2008. The leveraged finance exposures in the “held for trading” category at 31 December 2008 are predominantly classified as level 3. Fair value estimates for these positions rely on market knowledge and expert judgment, including judgmental determinations based on the terms of the relevant instrument and various other factors. These other factors may include, without limitation, observable pricing for other debt of the relevant issuer or debt of issuers of comparable credit quality, credit default swap spreads and estimated loss severity factors, and prevailing interest rate levels.
Option to acquire equity of the SNB StabFund
Under IFRS, the option to purchase the SNB StabFund’s equity is recognized on the balance sheet as a derivative at fair value with changes in fair value recognized in profit and loss. At 31 December 2008, the fair value of the call option held by UBS was approximately CHF 1,092 million.
328
Table of Contents
Financial information |
Note 27 Fair value of financial instruments (continued)
c) Valuation techniques and inputs by product (continued)
The MCNs issued in December 2008 include embedded equity and derivative components with UBS shares as underlying, which are bifurcated and treated as one derivative accounted for at fair value with fair value changes recognized in profit or loss. Refer to Note 26 for more information. The fair value amounted to negative CHF 1,058 million at 31 December 2008. A 10% reduction in UBS’s share price from
d) Deferred day 1 profit or loss
| For the year ended | ||||||||
| CHF million | 31.12.08 | 31.12.07 | ||||||
Balance at the beginning of the year | 550 | 951 | ||||||
| Deferred profit/(loss) on new transactions | 588 | 1,259 | ||||||
| Recognized (profit)/loss in the income statement | (459 | ) | (1,383 | ) | ||||
| Revision to fair value estimates | 0 | (224 | ) | |||||
| Foreign currency translation | (52 | ) | (53 | ) | ||||
Balance at the end of the year | 627 | 550 | ||||||
329
Table of Contents
Financial information
Notes to the consolidated financial statements
Note 28 Pledged assets and transferred financial assets which do not qualify for derecognition
ral banks, against loans from mortgage institutions, in connection with derivative transactions and for security deposits relating to stock exchange and clearinghouse memberships.
| Pledged assets | ||||||||
| Carrying amount | ||||||||
| CHF million | 31.12.08 | 31.12.07 | ||||||
| Financial assets pledged: | ||||||||
| Financial assets pledged to third parties for liabilities with and without the right of rehypothecation | 78,002 | 182,827 | ||||||
thereof: Financial assets pledged to third parties with right of rehypothecation | 40,216 | 114,190 | ||||||
| Mortgage loans | 3,699 | 200 | ||||||
Other1 | 21,040 | 0 | ||||||
Total financial assets pledged | 102,741 | 183,027 | ||||||
Other assets pledged | ||||||||
| Precious metals and other commodities | 780 | 8,628 | ||||||
The following table presents details of financial assets which have been sold or otherwise transferred, but which do not
qualify for derecognition. Criteria for derecognition are discussed in Note 1a) 4).
| Transfer of financial assets which do not qualify for derecognition | ||||||||
| Continued asset recognition in full – Total assets | ||||||||
| CHF billion | 31.12.08 | 31.12.07 | ||||||
Nature of transaction | ||||||||
| Securities lending agreements | 22.0 | 59.7 | ||||||
| Repurchase agreements | 13.1 | 51.3 | ||||||
| Other financial asset transfers | 46.6 | 75.9 | ||||||
Total | 81.7 | 186.9 | ||||||
The transactions are mostly conducted under standard agreements employed by financial market participants and are undertaken with counterparties subject to UBS’s normal credit risk control processes. The resulting credit exposures are controlled by daily monitoring and collateralization of the positions. The financial assets which continue to be recognized are typically transferred in exchange for cash or other financial assets. The associated liabilities can therefore be assumed to be approximately the carrying amount of the transferred financial assets.
full. These include credit risk, settlement risk, country risk and market risk.
330
Table of Contents
Financial information |
Note 29 Measurement categories of financial assets and financial liabilities
a) Measurement categories of financial assets and financial liabilities
The following table provides information about the carrying amounts of individual classes of financial instruments within the measurement categories of financial assets and financial liabilities as defined in IAS 39. Only those assets and liabilities which are deemed to be financial instruments are included
in the table below, which may cause certain balances to differ from those presented on the balance sheet.
| 31.12.08 | 31.12.07 | |||||||
Financial assets | ||||||||
Held for trading | ||||||||
| Trading portfolio assets | 261,904 | 630,764 | ||||||
| Trading portfolio assets pledged as collateral | 40,216 | 114,190 | ||||||
Debt issued1,2 | 4,152 | |||||||
| Positive replacement values | 854,100 | 428,217 | ||||||
Total | 1,160,372 | 1,173,171 | ||||||
Fair value through profit or loss, other | ||||||||
| Financial assets designated at fair value | 12,882 | 11,765 | ||||||
Cash, loans and receivables | ||||||||
| Cash and balances with central banks | 32,744 | 18,793 | ||||||
| Due from banks | 64,451 | 60,907 | ||||||
| Cash collateral on securities borrowed | 122,897 | 207,063 | ||||||
| Reverse repurchase agreements | 224,648 | 376,928 | ||||||
| Loans | 338,520 | 334,367 | ||||||
| Accrued income and prepaid expenses | 3,238 | 9,200 | ||||||
| Other assets | 6,184 | 12,874 | ||||||
Total | 792,682 | 1,020,132 | ||||||
Available-for-sale | ||||||||
| Financial investments available-for-sale | 5,248 | 4,966 | ||||||
Total financial assets | 1,971,184 | 2,210,034 | ||||||
Financial liabilities | ||||||||
Held for trading | ||||||||
| Trading portfolio liabilities | 62,431 | 164,788 | ||||||
Debt issued1 | 185 | 74 | ||||||
| Negative replacement values | 851,803 | 443,539 | ||||||
Total | 914,419 | 608,401 | ||||||
Fair value through profit or loss, other | ||||||||
| Financial liabilities designated at fair value | 101,546 | 191,853 | ||||||
| Amounts due under unit-linked contracts | 13,051 | 27,455 | ||||||
Total | 114,597 | 219,308 | ||||||
Financial liabilities at amortized cost | ||||||||
| Due to banks | 125,628 | 145,762 | ||||||
| Cash collateral on securities lent | 14,063 | 31,621 | ||||||
| Repurchase agreements | 102,561 | 305,887 | ||||||
| Due to customers | 474,774 | 641,892 | ||||||
| Accrued expenses and deferred income | 10,012 | 21,665 | ||||||
| Debt issued | 201,221 | 222,003 | ||||||
| Other liabilities | 12,840 | 25,302 | ||||||
Total | 941,099 | 1,394,132 | ||||||
Total financial liabilities | 1,970,115 | 2,221,841 | ||||||
331
Table of Contents
Financial information
Notes to the consolidated financial statements
Note 29 Measurement categories of financial assets and financial liabilities (continued)
b) Reclassification of financial assets
Pursuant to the amendment to IAS 39 and IFRS 7, “Reclassification of Financial Assets”, UBS reclassified certain financial assets out of Trading portfolio assets to Loans and receivables. Although the amendment could have been applied retrospectively from 1 July 2008, UBS decided at the end of October 2008 to apply the amendment with effect from 1 October 2008 following an assessment of the implications on its financial statements. The financial assets were reclassi-
fied using their fair value on the date of the reclassification which became their new cost basis at that date. The reclassification of these financial assets reflects UBS’s change in intent and ability to hold these financial assets for the foreseeable future rather than for trading in the near term.
| 1.10.08 | 31.12.08 | |||||||||||
| CHF billion | Fair value | Carrying value | Fair value | |||||||||
| Trading portfolio assets reclassified to Loans on 1.10.08 | 17.6 | 15.8 | 12.4 | |||||||||
| Trading portfolio assets reclassified to Loans on 31.12.08 | 8.4 | 8.4 | ||||||||||
Total financial assets reclassified to Loans and receivables | 17.6 | 24.2 | 20.8 | |||||||||
Reclassified financial assets primarily relate to student loan ARSs and other debt instruments.
332
Table of Contents
Financial information |
Note 30 Pension and other post-employment benefit plans
a) Defined benefit plans
The Group has established various pension plans inside and outside of Switzerland. The major plans are located in Switzerland, the UK, the US and Germany. Independent actuarial valuations are performed for the plans in these locations. The measurement date of these plans is 31 December for each year presented.
Swiss pension plans
The pension plan of UBS covers all UBS employees in Switzerland and exceeds the minimum benefit requirements under Swiss law. The Swiss plan was amended on 1 January 2007 to change the definition of retirement benefits from a final covered salary to a retirement savings approach and on 1 January 2008 to allow employees a choice in the level of annual contributions paid by the employee. The pension plan provides benefits which are based on annual contributions as a percentage of salary and accrue at an interest rate that is defined annually by the plan trustees.
calculated as a percentage of covered salary and are deducted monthly. The percentages deducted from salary for the full standard level of benefit coverage (including risk benefits) depend on age and vary between 1% and 9% of covered base salary and 3% and 8% of covered variable compensation. The employer pays a contribution that ranges between 100% and 375% of employees’ contributions for the standard level of benefit coverage. The benefits covered include retirement benefits; disability, death and survivor pensions; and employment termination benefits.
Foreign pension plans
The foreign locations of UBS operate various pension plans in accordance with local regulations and practices. Among these plans are defined contribution plans as well as defined benefit plans. The locations with defined benefit plans of a material nature are in the UK, the US and Germany. The UK and the US defined benefit plans are closed to new entrants who are covered by defined contribution plans. The amounts shown for foreign plans reflect the net funded positions of the major foreign plans.
333
Table of Contents
Financial information
Notes to the consolidated financial statements
Note 30 Pension and other post-employment benefit plans (continued)
| a) Defined benefit plans (continued) | ||||||||||||||||||||||||||||||||||||||||||||||||
| CHF million | Swiss | Foreign | ||||||||||||||||||||||||||||||||||||||||||||||
| For the year ended | 31.12.08 | 31.12.07 | 31.12.06 | 31.12.08 | 31.12.07 | 31.12.06 | ||||||||||||||||||||||||||||||||||||||||||
| Defined benefit obligation at the beginning of the year | (20,877 | ) | (21,506 | ) | (20,972 | ) | (4,928 | ) | (5,207 | ) | (5,020 | ) | ||||||||||||||||||||||||||||||||||||
| Service cost | (336 | ) | (367 | ) | (347 | ) | (63 | ) | (88 | ) | (76 | ) | ||||||||||||||||||||||||||||||||||||
| Interest cost | (710 | ) | (633 | ) | (611 | ) | (251 | ) | (264 | ) | (242 | ) | ||||||||||||||||||||||||||||||||||||
| Plan participant contributions | (233 | ) | (236 | ) | (221 | ) | ||||||||||||||||||||||||||||||||||||||||||
| Amendments | 0 | (414 | ) | (125 | ) | |||||||||||||||||||||||||||||||||||||||||||
| Actuarial gain/(loss) | (288 | ) | 1,508 | (265 | ) | 318 | 236 | (120 | ) | |||||||||||||||||||||||||||||||||||||||
| Benefits paid | 1,158 | 792 | 723 | 148 | 151 | 149 | ||||||||||||||||||||||||||||||||||||||||||
| Termination benefits | (25 | ) | (21 | ) | (17 | ) | 0 | 0 | 0 | |||||||||||||||||||||||||||||||||||||||
| Acquisitions | 0 | (54 | ) | 0 | ||||||||||||||||||||||||||||||||||||||||||||
| Settlements | 0 | 0 | 329 | 0 | 0 | 186 | ||||||||||||||||||||||||||||||||||||||||||
| Curtailments | 0 | 0 | 0 | |||||||||||||||||||||||||||||||||||||||||||||
| Foreign currency translation | 1,134 | 298 | (84 | ) | ||||||||||||||||||||||||||||||||||||||||||||
Defined benefit obligation at the end of the year | (21,311 | ) | (20,877 | ) | (21,506 | ) | (3,642 | ) | (4,928 | ) | (5,207 | ) | ||||||||||||||||||||||||||||||||||||
| Fair value of plan assets at the beginning of the year | 22,181 | 21,336 | 20,229 | 4,579 | 4,602 | 4,288 | ||||||||||||||||||||||||||||||||||||||||||
| Expected return on plan assets | 990 | 1,067 | 998 | 282 | 313 | 283 | ||||||||||||||||||||||||||||||||||||||||||
| Actuarial gain/(loss) | (3,820 | ) | (250 | ) | 447 | (1,027 | ) | (97 | ) | 40 | ||||||||||||||||||||||||||||||||||||||
| Employer contributions | 603 | 584 | 492 | 194 | 200 | 66 | ||||||||||||||||||||||||||||||||||||||||||
| Plan participant contributions | 233 | 236 | 221 | |||||||||||||||||||||||||||||||||||||||||||||
| Benefits paid | (1,158 | ) | (792 | ) | (723 | ) | (148 | ) | (151 | ) | (149 | ) | ||||||||||||||||||||||||||||||||||||
| Settlements | 0 | 0 | (328 | ) | ||||||||||||||||||||||||||||||||||||||||||||
| Curtailments | ||||||||||||||||||||||||||||||||||||||||||||||||
| Foreign currency translation | (1,014 | ) | (288 | ) | 74 | |||||||||||||||||||||||||||||||||||||||||||
Fair value of plan assets at the end of the year | 19,029 | 22,181 | 21,336 | 2,866 | 4,579 | 4,602 | ||||||||||||||||||||||||||||||||||||||||||
Funded status | (2,282 | ) | 1,304 | (170 | ) | (776 | ) | (349 | ) | (605 | ) | |||||||||||||||||||||||||||||||||||||
| Unrecognized net actuarial (gains)/losses | 4,405 | 2,123 | 2,123 | 1,324 | 975 | 1,237 | ||||||||||||||||||||||||||||||||||||||||||
| Unrecognized past service cost | 0 | 0 | 0 | 0 | 0 | 1 | ||||||||||||||||||||||||||||||||||||||||||
| Unrecognized asset | 0 | (1,304 | ) | 0 | ||||||||||||||||||||||||||||||||||||||||||||
(Accrued)/prepaid pension cost | 2,123 | 2,123 | 1,953 | 548 | 626 | 633 | ||||||||||||||||||||||||||||||||||||||||||
Movement in the net (liability) or asset | ||||||||||||||||||||||||||||||||||||||||||||||||
| (Accrued)/prepaid pension cost at the beginning of the year | 2,123 | 1,953 | 1,588 | 626 | 633 | 491 | ||||||||||||||||||||||||||||||||||||||||||
| Net periodic pension cost | (603 | ) | (414 | ) | (127 | ) | (69 | ) | (97 | ) | (103 | ) | ||||||||||||||||||||||||||||||||||||
| Employer contributions | 603 | 584 | 492 | 194 | 200 | 66 | ||||||||||||||||||||||||||||||||||||||||||
| Acquisitions | 0 | (54 | ) | 0 | ||||||||||||||||||||||||||||||||||||||||||||
| Settlement | 0 | 0 | 170 | |||||||||||||||||||||||||||||||||||||||||||||
| Foreign currency translation | (203 | ) | (56 | ) | 9 | |||||||||||||||||||||||||||||||||||||||||||
(Accrued)/prepaid pension cost | 2,123 | 2,123 | 1,953 | 548 | 626 | 633 | ||||||||||||||||||||||||||||||||||||||||||
Amounts recognized in the balance sheet | ||||||||||||||||||||||||||||||||||||||||||||||||
| Prepaid pension cost | 2,123 | 2,123 | 1,953 | 798 | 887 | 815 | ||||||||||||||||||||||||||||||||||||||||||
| Accrued pension liability | (250 | ) | (261 | ) | (182 | ) | ||||||||||||||||||||||||||||||||||||||||||
(Accrued)/prepaid pension cost | 2,123 | 2,123 | 1,953 | 548 | 626 | 633 | ||||||||||||||||||||||||||||||||||||||||||
334
Table of Contents
Financial information |
Note 30 Pension and other post-employment benefit plans (continued)
| a) Defined benefit plans (continued) | |||||||||||||||||||||||||
| CHF million | Swiss | Foreign | |||||||||||||||||||||||
| For the year ended | 31.12.08 | 31.12.07 | 31.12.06 | 31.12.08 | 31.12.07 | 31.12.06 | |||||||||||||||||||
Components of net periodic pension cost | |||||||||||||||||||||||||
| Service cost | 336 | 367 | 347 | 63 | 88 | 76 | |||||||||||||||||||
| Interest cost | 710 | 633 | 611 | 251 | 264 | 242 | |||||||||||||||||||
| Expected return on plan assets | (990 | ) | (1,067 | ) | (998 | ) | (282 | ) | (313 | ) | (283 | ) | |||||||||||||
| Amortization of unrecognized net (gains)/losses | 0 | 0 | 25 | 37 | 58 | 68 | |||||||||||||||||||
| Amortization of unrecognized past service cost | 0 | 0 | 125 | ||||||||||||||||||||||
| Immediate recognition of net actuarial (gains)/losses in current period | 1,826 | (1,258 | ) | 0 | |||||||||||||||||||||
| Immediate recognition of past service cost in current period | 0 | 414 | 0 | ||||||||||||||||||||||
| Termination benefits | 25 | 21 | 17 | ||||||||||||||||||||||
| Settlements | 0 | 0 | 0 | ||||||||||||||||||||||
| Curtailments | 0 | 0 | 0 | ||||||||||||||||||||||
| Limit of defined benefit asset | (1,304 | ) | 1,304 | 0 | |||||||||||||||||||||
Net periodic pension cost | 603 | 414 | 127 | 69 | 97 | 103 | |||||||||||||||||||
| Funded and unfunded plans | Swiss | ||||||||||||||||||||||||
| CHF million | 31.12.08 | 31.12.07 | 31.12.06 | 31.12.05 | 31.12.04 | ||||||||||||||||||||
| Defined benefit obligation from funded plans | (21,311 | ) | (20,877 | ) | (21,506 | ) | (20,972 | ) | (20,225 | ) | |||||||||||||||
| Plan assets | 19,029 | 22,181 | 21,336 | 20,229 | 18,575 | ||||||||||||||||||||
Surplus/(deficit) | (2,282 | ) | 1,304 | (170 | ) | (743 | ) | (1,650 | ) | ||||||||||||||||
| Experience gains / (losses) on plan liabilities | 0 | 0 | (265 | ) | |||||||||||||||||||||
| Experience gains / (losses) on plan assets | (3,820 | ) | (250 | ) | 447 | ||||||||||||||||||||
| Foreign | |||||||||||||||||||||||||
| CHF million | 31.12.08 | 31.12.07 | 31.12.06 | 31.12.05 | 31.12.04 | ||||||||||||||||||||
| Defined benefit obligation from funded plans | (3,402 | ) | (4,654 | ) | (5,002 | ) | (4,635 | ) | (3,815 | ) | |||||||||||||||
| Defined benefit obligation from unfunded plans | (240 | ) | (274 | ) | (205 | ) | (385 | ) | (327 | ) | |||||||||||||||
| Plan assets | 2,866 | 4,579 | 4,602 | 4,288 | 3,580 | ||||||||||||||||||||
Surplus/(deficit) | (776 | ) | (349 | ) | (605 | ) | (732 | ) | (562 | ) | |||||||||||||||
| Experience gains/(losses) on plan liabilities | 62 | (32 | ) | (11 | ) | ||||||||||||||||||||
| Experience gains/(losses) on plan assets | (1,027 | ) | (97 | ) | 40 | ||||||||||||||||||||
335
Table of Contents
Financial information
Notes to the consolidated financial statements
Note 30 Pension and other post-employment benefit plans (continued)
| a) Defined benefit plans (continued) | |||||||||||||||||||||||||
| Swiss | Foreign | ||||||||||||||||||||||||
| 31.12.08 | 31.12.07 | 31.12.06 | 31.12.08 | 31.12.07 | 31.12.06 | ||||||||||||||||||||
| Principal weighted average actuarial assumptions used (%) | |||||||||||||||||||||||||
| Assumptions used to determine defined benefit obligations at the end of the year | |||||||||||||||||||||||||
| Discount rate | 3.3 | 3.5 | 3.0 | 6.0 | 5.8 | 5.2 | |||||||||||||||||||
| Expected rate of salary increase | 2.5 | 2.5 | 2.5 | 4.5 | 4.8 | 4.6 | |||||||||||||||||||
| Rate of pension increase | 0.5 | 0.8 | 0.8 | 1.9 | 2.4 | 2.1 | |||||||||||||||||||
Assumptions used to determine net periodic pension cost for the year ended | |||||||||||||||||||||||||
| Discount rate | 3.5 | 3.0 | 3.0 | 5.8 | 5.2 | 5.0 | |||||||||||||||||||
| Expected rate of return on plan assets | 4.5 | 5.0 | 5.0 | 7.1 | 7.0 | 6.7 | |||||||||||||||||||
| Expected rate of salary increase | 2.5 | 2.5 | 2.5 | 4.8 | 4.6 | 4.4 | |||||||||||||||||||
| Rate of pension increase | 0.8 | 0.8 | 0.8 | 2.4 | 2.1 | 1.9 | |||||||||||||||||||
Plan assets (weighted average) | |||||||||||||||||||||||||
Actual plan asset allocation (%) | |||||||||||||||||||||||||
| Equity instruments | 26 | 38 | 41 | 46 | 50 | 53 | |||||||||||||||||||
| Debt instruments | 55 | 47 | 45 | 35 | 38 | 38 | |||||||||||||||||||
| Real estate | 13 | 11 | 11 | 3 | 4 | 4 | |||||||||||||||||||
| Other | 6 | 4 | 3 | 16 | 8 | 5 | |||||||||||||||||||
Total | 100 | 100 | 100 | 100 | 100 | 100 | |||||||||||||||||||
Long-term target plan asset allocation (%) | |||||||||||||||||||||||||
| Equity instruments | 20–48 | 33–51 | 33–51 | 45–48 | 49–52 | 49–53 | |||||||||||||||||||
| Debt instruments | 37–63 | 31–50 | 31–50 | 37–38 | 38–44 | 37–44 | |||||||||||||||||||
| Real estate | 10–20 | 10–19 | 10–19 | 3–7 | 4–6 | 4–6 | |||||||||||||||||||
| Other | 0-5 | 0 | 0 | 10–12 | 1–3 | 1–5 | |||||||||||||||||||
Actual return on plan assets (%) | (12.8 | ) | 3.9 | 7.2 | (18.2 | ) | 4.8 | 7.8 | |||||||||||||||||
Additional details to fair value of plan assets | |||||||||||||||||||||||||
| UBS financial instruments and UBS bank accounts | 782 | 336 | 684 | ||||||||||||||||||||||
UBS AG shares1 | 55 | 128 | 193 | ||||||||||||||||||||||
| Securities lent to UBS included in plan assets | 0 | 9,379 | 7,169 | ||||||||||||||||||||||
| Other assets used by UBS included in plan assets | 148 | 111 | 69 | ||||||||||||||||||||||
| Mortality tables and life expectancies for major plans | |||||||||||||||||||||||||||||
| Life expectancy at age 65 for a male member currently | |||||||||||||||||||||||||||||
| aged 65 | aged 45 | ||||||||||||||||||||||||||||
| Country | Mortality table | 31.12.08 | 31.12.07 | 31.12.06 | 31.12.08 | 31.12.07 | 31.12.06 | ||||||||||||||||||||||
| Switzerland | BVG 2000 | 17.8 | 17.8 | 17.8 | 17.8 | 17.8 | 17.8 | ||||||||||||||||||||||
| UK | PA 92 | 22.7 | 21.9 | 21.8 | 25.6 | 23.0 | 23.0 | ||||||||||||||||||||||
| Germany | Dr. K. Heubeck 2005 G | 19.0 | 18.9 | 18.7 | 21.8 | 21.6 | 21.5 | ||||||||||||||||||||||
| US | RP 2000 with projections | 18.4 | 18.3 | 17.9 | 18.4 | 18.3 | 17.9 | ||||||||||||||||||||||
| Life expectancy at age 65 for a female member currently | |||||||||||||||||||||||||||||
| aged 65 | aged 45 | ||||||||||||||||||||||||||||
| Country | Mortality table | 31.12.08 | 31.12.07 | 31.12.06 | 31.12.08 | 31.12.07 | 31.12.06 | ||||||||||||||||||||||
| Switzerland | BVG 2000 | 21.1 | 21.1 | 21.1 | 21.1 | 21.1 | 21.1 | ||||||||||||||||||||||
| UK | PA 92 | 24.5 | 24.8 | 24.7 | 26.4 | 25.8 | 25.8 | ||||||||||||||||||||||
| Germany | Dr. K. Heubeck 2005 G | 23.1 | 23.0 | 22.8 | 25.7 | 25.6 | 25.5 | ||||||||||||||||||||||
| US | RP 2000 with projections | 20.6 | 20.5 | 20.3 | 20.6 | 20.5 | 20.3 | ||||||||||||||||||||||
336
Table of Contents
Financial information |
Note 30 Pension and other post-employment benefit plans (continued)
b) Post-retirement medical and life plans
In the US and the UK, the Group offers retiree medical benefits that contribute to the health care coverage of employees and beneficiaries after retirement. In addition to retiree medical benefits, the Group in the US also provides retiree life insurance benefits. The UK plan is closed to new entrants. The benefit obligation in excess of fair value of plan assets for those plans amounts to CHF 159 million as of 31 December 2008 (2007: CHF 190 million; 2006: CHF 219 million) and the total accrued post-retirement cost
amounts to CHF 164 million as of 31 December 2008 (2007: CHF 181 million; 2006: CHF 176 million). The net periodic post-retirement costs for the years ended 31 December 2008, 31 December 2007 and 31 December 2006 were CHF 9 million (including a curtailment gain of CHF 11 million), CHF 26 million and CHF 24 million, respectively.
| CHF million | 31.12.08 | 31.12.07 | 31.12.06 | |||||||||||||||||
| Post-retirement benefit obligation at the beginning of the year | (190 | ) | (219 | ) | (216 | ) | ||||||||||||||
| Service cost | (8 | ) | (12 | ) | (10 | ) | ||||||||||||||
| Interest cost | (11 | ) | (11 | ) | (11 | ) | ||||||||||||||
| Plan participant contributions | (0 | ) | (1 | ) | (1 | ) | ||||||||||||||
| Actuarial gain/(loss) | 14 | 39 | 1 | |||||||||||||||||
| Amendments | 0 | (8 | ) | (1 | ) | |||||||||||||||
| Benefits paid | 7 | 8 | 9 | |||||||||||||||||
| Curtailments | 9 | 0 | 0 | |||||||||||||||||
| Foreign currency translation | 20 | 14 | 10 | |||||||||||||||||
Post-retirement benefit obligation at the end of the year | (159 | ) | (190 | ) | (219 | ) | ||||||||||||||
| Fair value of plan assets at the beginning of the year | 0 | 0 | 0 | |||||||||||||||||
| Employer contributions | 6 | 7 | 8 | |||||||||||||||||
| Plan participant contributions | 1 | 1 | 1 | |||||||||||||||||
| Benefits paid | (7 | ) | (8 | ) | (9 | ) | ||||||||||||||
Fair value of plan assets at the end of the year | 0 | 0 | 0 | |||||||||||||||||
| CHF million | 31.12.08 | 31.12.07 | 31.12.06 | 31.12.05 | 31.12.04 | |||||||||||||||
| Defined benefit obligation | (159 | ) | (190 | ) | (219 | ) | (216 | ) | (166 | ) | ||||||||||
| Plan asset | 0 | 0 | 0 | 0 | 0 | |||||||||||||||
Surplus/(deficit) | (159 | ) | (190 | ) | (219 | ) | (216 | ) | (166 | ) | ||||||||||
| Experience gains/(losses) on plan liabilities | 3 | 8 | 1 | (3 | ) | 0 | ||||||||||||||
The assumed average health care cost trend rate used in determining post-retirement benefit expense is assumed to be 10% for 2008 and to decrease to an ultimate trend rate of 5% in 2014. On a country-by-country basis, the same discount rate is used for the calculation of the post-retirement benefit obligation from medical and life plans as for the defined benefit obligations arising from pension plans.
| CHF million | 1% increase | 1% decrease | ||||||
| Effect on total service and interest cost | 3 | (2 | ) | |||||
| Effect on the post-retirement benefit obligation | 19 | (16 | ) | |||||
337
Table of Contents
Financial information
Notes to the consolidated financial statements
The Group also sponsors a number of defined contribution plans primarily in the UK and the US. Certain plans permit employees to make contributions and earn matching or other contributions from the Group. The contributions to
these plans recognized as expense for the years ended 31 December 2008, 31 December 2007 and 31 December 2006 were CHF 312 million, CHF 285 million and CHF 229 million, respectively.
UBS is the principal bank for the pension fund of UBS in Switzerland. In this function, UBS is engaged to execute most of the pension fund’s banking activities. These activities also include, but are not limited to, trading and securities lending and borrowing. All transactions have been executed at arm’s length conditions.
| Related party disclosure | ||||||||||||
| For the year ended | ||||||||||||
| CHF million | 31.12.08 | 31.12.07 | 31.12.06 | |||||||||
Received by UBS | ||||||||||||
| Fees | 44 | 58 | 53 | |||||||||
Paid by UBS | ||||||||||||
| Interest | 1 | 2 | 2 | |||||||||
| Dividends and capital repayments | 4 | 38 | 33 | |||||||||
The transaction volumes in UBS shares and other UBS securities are as follows:
| Transaction volumes – related parties | ||||||||||||
| For the year ended | ||||||||||||
| 31.12.08 | 31.12.07 | 31.12.06 | ||||||||||
Financial instruments bought by pension funds | ||||||||||||
| UBS AG shares (in thousands of shares) | 6,925 | 1,728 | 1,793 | |||||||||
| UBS financial instruments (nominal values in CHF million) | 78 | 950 | 8 | |||||||||
Financial instruments sold by pension funds or matured | ||||||||||||
| UBS AG shares (in thousands of shares) | 1,881 | 1,930 | 2,752 | |||||||||
| UBS financial instruments (nominal values in CHF million) | 10 | 976 | 14 | |||||||||
UBS has also leased buildings from its pension funds. The rent paid by UBS under these leases amounted to CHF 7 million in 2008, CHF 6 million in 2007 and CHF 4 million in 2006.
defined benefit pension plans are contained in the additional details to the fair value of plan assets. Furthermore, UBS defined contribution plans hold 17,866,949 UBS shares with a market value of CHF 272 million as of 31 December 2008 (2007: 14,121,239 shares with a market value of CHF 736 million; 2006: 14,158,961 shares with a market value of CHF 1,043 million).
338
Table of Contents
| Financial information |
UBS has established several equity participation plans to further align the interests of executives, managers and staff with the interests of shareholders. The plans are offered to eligible employees in approximately 50 countries and are designed to meet the complex legal, tax and regulatory requirements of each country in which they are offered. The explanations below provide a general description of the terms of the most significant plans offered, however specific plan rules may vary by country. Refer to Note 1a) 22) for a description of the accounting policy related to equity participation and other compensation plans. Refer also to Note 1b for a description of the restatement impact of adopting IFRS 2 Share-based Payment: Vesting Conditions and Cancellations on 1 January 2008.
Equity participation plans
Equity Plus Plan (Equity Plus): This voluntary plan gives eligible employees the opportunity to purchase UBS shares at fair market value and generally receive at no additional cost two UBS options for each share purchased, up to a maximum annual limit. Share purchases can be made annually from bonus compensation and/or quarterly based on regular deductions from salary. Shares purchased under Equity Plus are restricted from sale for two years from the time of purchase. The options have a strike price equal to the fair market value of a UBS share on the date the option is granted, a two-year vesting period and generally expire ten years from the date of grant. The options are forfeitable in certain circumstances and are settled in equity, except in countries where this is not permitted for legal reasons. Compensation expense related to the UBS options is recognized over the shorter of the legal vesting period and the period from grant to the retirement eligibility date of the employee.
the performance year, which is generally the period prior to the grant date.
339
Table of Contents
Financial information
Notes to the consolidated financial statements
Note 31 Equity participation and other compensation plans (continued)
a) Plans offered (continued)
period from grant to the retirement eligibility date of the employee.
Other compensation plans
Executive Capital Accumulation Plan (ECAP): UBS sponsors a voluntary deferred compensation plan for selected eligible employees. Under this plan, participants are allowed to notionally invest a portion of their cash bonus in money market funds, UBS and non-UBS mutual funds and other
UBS sponsored funds. No additional company match is granted, the awards are generally not forfeitable and are settled in cash. This plan does not result in compensation expense for UBS.
b) Effect on income statement and balance sheet
The total share-based compensation expense recognized for the years ended 31 December 2008, 31 December 2007 and 31 December 2006 was negative CHF 94 million, CHF 3,173 million and CHF 2,685 million, respectively. The decrease in compensation expense in 2008 as compared to prior years is primarily a result of UBS adopting the amendment to IFRS 2 Share-based Payment: Vesting Conditions and Cancellations on 1 January 2008. Furthermore, UBS amended the EOP plan rules for awards to be granted in 2009 for the year 2008 for which compensation expense related to these awards will be recognized over the vesting period rather than in the performance year. For the years ended 31 December 2008, 31 December 2007 and 31 De-
cember 2006, the compensation expense recognized for share-based payments was primarily related to equity-settled plans. At 31 December 2008, total compensation expense related to non-vested awards not yet recognized in the income statement is CHF 648 million, which is expected to be recognized in Personnel expenses over a weighted average period of 3.2 years.
340
Table of Contents
Financial information |
Movements in shares granted under the equity participation plans described in Note 31a) are as follows:
| Weighted | Weighted | Weighted | ||||||||||||||||||||||
| Number of | average | Number of | average | Number of | average | |||||||||||||||||||
| shares | grant date | shares | grant date | shares | grant date | |||||||||||||||||||
| 31.12.08 | fair value CHF | 31.12.07 | fair value CHF | 31.12.06 | fair value CHF | |||||||||||||||||||
| Forfeitable, at the beginning of the year | 59,102,580 | 66 | 56,141,102 | 58 | 53,725,186 | 46 | ||||||||||||||||||
| Shares awarded during the year | 90,895,594 | 1,2 | 32 | 30,271,820 | 70 | 26,652,070 | 69 | |||||||||||||||||
| Distributions during the year | (60,105,109 | ) | 61 | (25,031,819 | ) | 55 | (22,712,566 | ) | 43 | |||||||||||||||
| Forfeited during the year | (5,156,131 | ) | 54 | (2,278,523 | ) | 66 | (1,523,588 | ) | 56 | |||||||||||||||
| Forfeitable, at the end of the year | 84,736,935 | 53 | 59,102,580 | 66 | 56,141,102 | 58 | ||||||||||||||||||
of which: shares vested for accounting purposes | 65,767,017 | 47,700,903 | 47,345,901 | |||||||||||||||||||||
Prior to 2008, UBS estimated the grant date fair value of shares awarded during the year by using the average UBS share price on the grant date as quoted on the SWX Europe. The grant date fair value of notional UBS shares without dividend entitlements includes a deduction for the present value of future expected dividends to be paid between grant date and distribution. The market value of shares vested was CHF 1,385 million, CHF 1,737 million, and CHF 1,587 million for the years ended 31 December 2008, 31 December 2007, and 31 December 2006, respectively.
value of notional UBS shares without dividend entitlements also includes a deduction for the present value of future expected dividends to be paid between grant date and distribution. The fair value of the share awards subject to post-vesting sale and hedge restrictions is discounted based upon the duration of the post-vesting restriction. The weighted average discount for share awards granted in 2008 is approximately 19% of the market price of the UBS share. Discounts for non-vesting conditions are based on the probability that the non-vesting conditions will be achieved and the award will become exercisable. The fair value of share-based awards granted prior to 2008 was not discounted for post-vesting sale and hedge restrictions, as there was no distinction between vesting and non-vesting conditions until the IASB amended IFRS 2 effective for UBS January 2008 Share-based Payment:Vesting Conditions and Cancellations.
341
Table of Contents
Financial information
Notes to the consolidated financial statements
Note 31 Equity participation and other compensation plans (continued)
Movements in options granted under the equity participation plans described in Note 31a) are as follows:
| Weighted | ||||||||||||||||||||||||
| Number of | average | Number of | Weighted | Number of | Weighted | |||||||||||||||||||
| options | exercise price | options | average exercise | options | average exercise | |||||||||||||||||||
| 31.12.081 | CHF1,2 | 31.12.071 | price CHF1,2 | 31.12.061 | price CHF1,2 | |||||||||||||||||||
| Outstanding, at the beginning of the year | 198,213,092 | 52 | 188,393,473 | 47 | 193,707,056 | 39 | ||||||||||||||||||
| Granted during the year | 62,973,879 | 30 | 48,094,483 | 67 | 48,507,481 | 67 | ||||||||||||||||||
| Exercised during the year | (3,673,657 | ) | 26 | (34,331,511 | ) | 36 | (50,279,072 | ) | 34 | |||||||||||||||
| Forfeited during the year | (6,732,080 | ) | 52 | (3,650,942 | ) | 62 | (3,520,009 | ) | 52 | |||||||||||||||
| Expired unexercised | (14,725,689 | ) | 46 | (292,411 | ) | 58 | (21,983 | ) | 38 | |||||||||||||||
| Outstanding, at the end of the year | 236,055,545 | 47 | 198,213,092 | 52 | 188,393,473 | 47 | ||||||||||||||||||
| Exercisable, at the end of the year | 124,054,442 | 46 | 96,396,428 | 39 | 85,589,034 | 34 | ||||||||||||||||||
The weighted average share price at the time when the options were exercised during the year was CHF 34, CHF 72, and CHF 71 for the years ended 31 December 2008, 31 De-
cember 2007, and 31 December 2006, respectively. The following table provides additional information about option awards:
| 31.12.08 | 31.12.07 | 31.12.06 | ||||||||||
| Intrinsic value of options exercised during the year (CHF million) | 29 | 1,046 | 1,660 | |||||||||
| Weighted average grant date fair value of options granted (CHF) | 7.53 | 10.43 | 11.63 | |||||||||
The following table summarizes additional information about options outstanding and options exercisable at 31 December 2008:
| Options outstanding | Options exercisable | |||||||||||||||||||||||||||||||
| Weighted | Weighted | |||||||||||||||||||||||||||||||
| Weighted | Aggregate | average | Weighted | Aggregate | average | |||||||||||||||||||||||||||
| Number of | average | intrinsic value | remaining | Number of | average | intrinsic value | remaining | |||||||||||||||||||||||||
| options | exercise price | (CHF/USD | contractual | options | exercise price | (CHF/USD | contractual | |||||||||||||||||||||||||
| Range of exercise price per share | outstanding | (CHF/USD) | million) | term (years) | exercisable | (CHF/USD) | million) | term (years) | ||||||||||||||||||||||||
CHF | ||||||||||||||||||||||||||||||||
| 14.47–25.00 | 9,612,902 | 18.31 | 1.7 | 9.8 | 0 | 0.00 | 0.0 | |||||||||||||||||||||||||
| 25.01–35.00 | 49,437,156 | 31.08 | 0.0 | 8.3 | 8,966,563 | 28.22 | 0.0 | 4.3 | ||||||||||||||||||||||||
| 35.01–45.00 | 27,821,969 | 39.23 | 0.0 | 5.9 | 19,023,570 | 40.68 | 0.0 | 4.3 | ||||||||||||||||||||||||
| 45.01–55.00 | 26,011,919 | 49.18 | 0.0 | 6.0 | 22,846,437 | 48.63 | 0.0 | 5.7 | ||||||||||||||||||||||||
| 55.01–65.00 | 5,398,949 | 60.31 | 0.0 | 8.0 | 2,208,584 | 61.30 | 0.0 | 7.4 | ||||||||||||||||||||||||
| 65.01–75.00 | 76,929,095 | 67.85 | 0.0 | 7.7 | 30,294,459 | 66.34 | 0.0 | 7.5 | ||||||||||||||||||||||||
14.47–75.00 | 195,211,990 | 49.32 | 1.7 | 7.5 | 83,339,613 | 51.39 | 0.0 | 5.9 | ||||||||||||||||||||||||
USD | ||||||||||||||||||||||||||||||||
| 4.74–20.00 | 108,301 | 13.49 | 0.3 | 1.2 | 108,301 | 13.49 | 0.3 | 1.2 | ||||||||||||||||||||||||
| 20.01–30.00 | 15,864,689 | 21.60 | 0.0 | 3.7 | 15,864,689 | 21.60 | 0.0 | 3.7 | ||||||||||||||||||||||||
| 30.01–40.00 | 9,821,977 | 34.03 | 0.0 | 5.3 | 9,821,977 | 34.03 | 0.0 | 5.3 | ||||||||||||||||||||||||
| 40.01–53.50 | 15,048,584 | 41.40 | 0.0 | 6.2 | 14,919,862 | 41.36 | 0.0 | 6.1 | ||||||||||||||||||||||||
4.74–53.50 | 40,843,551 | 31.86 | 0.3 | 5.0 | 40,714,829 | 31.82 | 0.3 | 5.0 | ||||||||||||||||||||||||
342
Table of Contents
Financial information |
Note 31 Equity participation and other compensation plans (continued)
The fair value of options is determined by means of a Monte Carlo simulation. The simulation technique uses a mix of implied and historic volatility and specific employee exercise behavior patterns based on statistical data, taking into account the specific terms and conditions under which the options are granted, such as the vesting period, forced exercises during the lifetime, and gain- and time-dependent exercise behavior. The expected term of each option is calcu-
lated as the probability-weighted average period of the time between grant and exercise. The term structure of volatility is derived from the implied volatilities of traded UBS options in combination with the observed long-term historic share price volatility. Dividends are assumed to grow at a fixed rate over the term of the option.
| 31.12.08 | ||||||||||||
| CHF awards | range low | range high | ||||||||||
| Expected volatility (%) | 33.86 | 30.00 | 49.32 | |||||||||
| Risk-free interest rate (%) | 2.83 | 1.74 | 3.27 | |||||||||
| Expected dividend (CHF) | 1.85 | 1.10 | 2.57 | |||||||||
| Strike price (CHF) | 30.11 | 14.47 | 46.02 | |||||||||
| Share price (CHF) | 28.05 | 14.47 | 43.61 | |||||||||
| 31.12.07 | ||||||||||||
| CHF awards | range low | range high | ||||||||||
| Expected volatility (%) | 23.86 | 22.51 | 29.23 | |||||||||
| Risk-free interest rate (%) | 2.58 | 2.46 | 3.27 | |||||||||
| Expected dividend (CHF) | 3.13 | 2.20 | 4.56 | |||||||||
Strike price (CHF)1 | 71.31 | 55.48 | 78.80 | |||||||||
Share price (CHF)1 | 70.25 | 55.48 | 78.80 | |||||||||
| 31.12.06 | ||||||||||||
| CHF awards1 | range low | range high | ||||||||||
| Expected volatility (%) | 25.38 | 22.51 | 27.18 | |||||||||
| Risk-free interest rate (%) | 2.15 | 1.96 | 2.68 | |||||||||
| Expected dividend (CHF) | 2.26 | 1.76 | 2.83 | |||||||||
Strike price (CHF)2 | 71.19 | 65.13 | 77.33 | |||||||||
Share price (CHF)2 | 70.16 | 65.13 | 76.25 | |||||||||
343
Table of Contents
Financial information
Notes to the consolidated financial statements
Note 32 Related parties
The Group defines related parties as associated companies, post-employment benefit plans for the benefit of UBS employees, key management personnel, close family members of key management personnel and enterprises which are, directly or indirectly, controlled by, jointly controlled by or significantly influenced by or in which significant voting
power resides with key management personnel or their close family members. Key management personnel is defined as members of the Board of Directors (BoD) and Group Executive Board (GEB). This definition is based on the requirements of IAS 24 Related Party Disclosures.
a) Remuneration of key management personnel
The non-independent members of the BoD have top management employment contracts and receive pension benefits upon retirement. Total remuneration of the non-inde-
pendent members of the BoD and GEB including those who stepped down during 2008 is as follows:
| CHF million | 31.12.08 | 31.12.07 | 31.12.06 | |||||||||
| Base salaries and other cash payments | 12 | 14 | 16 | |||||||||
| Incentive awards – cash | 0 | 38 | 107 | |||||||||
| Employer’s contributions to retirement benefit plans | 2 | 2 | 1 | |||||||||
| Benefits in kind, fringe benefits (at market value) | 1 | 2 | 2 | |||||||||
Equity compensation benefits1 | 0 | 22 | 113 | |||||||||
Total | 15 | 78 | 239 | |||||||||
Marcel Ospel, former Chairman of the BoD, did not stand for re-election at the AGM of 23 April 2008. Stephan Haeringer, former executive vice chairman of the BoD, retired from the BoD on 2 October 2008. Marco Suter, formerly an executive member of the BoD, stepped down from the BoD on 1 October 2007 and thereafter acted as Group Chief Financial Officer (Group CFO) and as a member of the GEB until his stepping down from this role on 31 August 2008. While Marcel Ospel has retired from UBS as of April 2008, Stephan Haeringer and Marco Suter agreed with UBS to continue their services for UBS until their termination dates of 30 September 2009 and 31 August 2009 respectively.
Stephan Haeringer and Marco Suter announced that they voluntarily relinquished substantial parts of the payments to which they were entitled during their periods of employment with UBS. The total amount waived or repaid was CHF 33 million.
344
Table of Contents
Financial information |
Note 32 Related parties (continued)
b) Equity holdings
| 31.12.08 | 31.12.07 | 31.12.06 | ||||||||||
Number of stock options from equity participation plans held by non-independent members of the BoD and the GEB1 | 8,458,037 | 6,828,152 | 10,886,798 | |||||||||
| Number of shares held by members of the BoD, GEB and parties closely linked to them | 5,892,548 | 6,693,012 | 7,974,724 | |||||||||
Of the share totals above, at 31 December 2008, 31 December 2007 and 31 December 2006, 15,878 shares, 4,852 shares and 7,146 shares respectively were held by close family members of key management personnel and 103,841 shares, 2,200,000 shares and 2,200,000 shares respectively were held by enterprises which are directly or indirectly controlled by,
jointly controlled by or significantly influenced by or in which significant voting power resides with key management personnel or their close family members. Further information about UBS’s equity participation plans can be found in Note 31. No member of the BoD or GEB is the beneficial owner of more than 1% of the Group’s shares at 31 December 2008.
c) Loans, advances and mortgages to key management personnel
Non-independent members of the BoD and GEB members have been granted loans, fixed advances and mortgages on the same terms and conditions that are available to other employees, based on terms and conditions granted to third parties adjusted for reduced credit risk. Independent BoD
members are granted loans and mortgages at general market conditions.
| CHF million | 31.12.08 | 31.12.07 | ||||||
| Balance at the beginning of the year | 15 | 19 | ||||||
| Additions | 8 | 0 | ||||||
| Reductions | (12 | ) | (4 | ) | ||||
| Balance at the end of the year | 11 | 15 | ||||||
No unsecured loans were granted to key management personnel as of 31 December 2008 and 31 December 2007.
d) Associated companies
| Movements in loans to associated companies are as follows: | ||||||||
| CHF million | 31.12.08 | 31.12.07 | ||||||
| Balance at the beginning of the year | 220 | 375 | ||||||
| Additions | 171 | 60 | ||||||
| Reductions | (77 | ) | (215 | ) | ||||
| Credit loss (expense)/recovery | 0 | 0 | ||||||
| Foreign currency translation | (13 | ) | 0 | |||||
| Balance at the end of the year | 301 | 220 | ||||||
thereof unsecured loans | 82 | 56 | ||||||
thereof allowances for credit losses | 3 | 4 | ||||||
All loans to associated companies are transacted at arm’s length.
345
Table of Contents
Financial information
Notes to the consolidated financial statements
Note 32 Related parties (continued)
Other transactions with associated companies transacted at arm’s length are as follows:
| For the year ended or as of | ||||||||||||
| CHF million | 31.12.08 | 31.12.07 | 31.12.06 | |||||||||
| Payments to associates for goods and services received | 90 | 87 | 58 | |||||||||
| Fees received for services provided to associates | 6 | 20 | 79 | |||||||||
| Commitments and contingent liabilities to associates | 40 | 33 | 32 | |||||||||
Note 34 provides a list of significant associates.
e) Other related party transactions
During 2008 and 2007, UBS entered into transactions at arm’s length with enterprises which are directly or indirectly controlled by, jointly controlled by or significantly influenced by or in which significant voting power resides with key management personnel or their close family members. In 2008 and 2007 these companies included Aebi + Co. AG (Switzerland), AC Management SA, (Switzerland), Bertarelli Family (Switzerland), Bertarelli Investment Ltd (Jersey) (dissolved in December 2007), DKSH Holding AG (Switzerland),
Fiat Group (Italy), Kedge Capital Selected Funds Ltd. (Jersey), Lévy Kaufmann-Kohler (Switzerland), Limonares Ltd (Jersey) (dissolved in December 2007), Löwenfeld AG (Switzerland), Martown Trading Ltd. (Isle of Man), Omega Fund I Ltd (Jersey), Omega Fund II Ltd (Jersey), Omega Fund III Ltd (Jersey), Omega Fund IV Ltd (Jersey), Royal Dutch Shell plc (UK), SGS Société Générale de Surveillance SA (Switzerland), Stadler Rail Group (Switzerland), Team Alinghi (Switzerland), Team Alinghi (Spain) and Walo Group (Switzerland).
Movements in loans to other related parties are as follows:
| CHF million | 31.12.08 | 31.12.07 | 31.12.06 | |||||||||
| Balance at the beginning of the year | 688 | 872 | 919 | |||||||||
| Additions | 206 | 301 | 34 | |||||||||
| Reductions | 220 | 485 | 81 | |||||||||
Balance at the end of the year1 | 674 | 688 | 872 | |||||||||
Other transactions with these related parties include:
| CHF million | 31.12.08 | 31.12.07 | 31.12.06 | |||||||||
| Goods sold and services provided to UBS | 1 | 8 | 8 | |||||||||
| Fees received for services provided by UBS | 22 | 16 | 8 | |||||||||
As part of its sponsorship of Team Alinghi, UBS paid CHF 828,090 (EUR 538,000) in basic sponsoring fees for 2008.
Team Alinghi’s controlling shareholder is UBS board member Ernesto Bertarelli.
f) Additional information
UBS also engages in trading and risk management activities (e.g. swaps, options, forwards) with various related parties mentioned in previous sections. These transactions may give rise to credit risk either for UBS or for a related party towards
UBS. As part of its normal course of business, UBS is also a market maker in equity and debt instruments and at times may hold positions in instruments of related parties.
346
Table of Contents
Financial information |
Note 33 Post-balance-sheet events
On 18 February 2009, UBS announced that it settled its US cross-border case with the US Department of Justice and the US Securities and Exchange Commission. Refer to “Note 21 Provisions and litigation” for details.
pact on net profit after tax was negative CHF 1,190 million.
Note 34 Significant subsidiaries and associates
The legal entity group structure of UBS is designed to support the Group’s businesses within an efficient legal, tax, regulatory and funding framework. Neither the business divisions of UBS (namely Investment Bank, Global Wealth Management & Business Banking and Global Asset Management) nor Corporate Center are replicated in their own individual legal entities, but rather they generally operate out of UBS AG (Parent Bank) through its Swiss and foreign branches.
the business divisions. It provides for the most cost-efficient and flexible structure and facilitates efficient allocation and use of capital, comprehensive risk management and control and straightforward funding processes.
| Significant subsidiaries | ||||||||||||||
| Share capital | Equity interest | |||||||||||||
| Company | Jurisdiction of incorporation | Business division1 | in millions | accumulated in % | ||||||||||
| Banco UBS Pactual S.A. | Rio de Janeiro, Brazil | IB | BRL | 349.6 | 100.0 | |||||||||
| Caisse Centrale de Réescompte | Paris, France | Global AM | EUR | 106.3 | 100.0 | |||||||||
| CCR Actions S.A. | Paris, France | Global AM | EUR | 1.1 | 100.0 | |||||||||
| CCR Gestion S.A. | Paris, France | Global AM | EUR | 2.2 | 100.0 | |||||||||
| Fondcenter AG | Zurich, Switzerland | Global AM | CHF | 0.1 | 100.0 | |||||||||
| OOO UBS Bank | Moscow, Russia | IB | RUB | 1,250.0 | 100.0 | |||||||||
| PT UBS Securities Indonesia | Jakarta, Indonesia | IB | IDR | 118,000.0 | 98.6 | |||||||||
| UBS (Bahamas) Ltd. | Nassau, Bahamas | Global WM&BB | USD | 4.0 | 100.0 | |||||||||
| UBS (France) S.A. | Paris, France | Global WM&BB | EUR | 50.7 | 100.0 | |||||||||
| UBS (Grand Cayman) Limited | George Town, Cayman Islands | IB | USD | 25.0 | 100.0 | |||||||||
| UBS (Italia) S.p.A. | Milan, Italy | Global WM&BB | EUR | 60.0 | 100.0 | |||||||||
| UBS (Luxembourg) S.A. | Luxembourg, Luxembourg | Global WM&BB | CHF | 150.0 | 100.0 | |||||||||
| UBS (Monaco) S.A. | Monte Carlo, Monaco | Global WM&BB | EUR | 9.2 | 100.0 | |||||||||
| UBS Alternative and Quantitative Investments Limited | London, Great Britain | Global AM | GBP | 0.3 | 100.0 | |||||||||
| UBS Alternative and Quantitative Investments LLC | Delaware, USA | Global AM | USD | 0.1 | 100.0 | |||||||||
| UBS Americas Inc | Delaware, USA | IB | USD | 0.0 | 100.0 | |||||||||
| UBS Asesores SA | Panama, Panama | Global WM&BB | USD | 0.0 | 100.0 | |||||||||
| UBS Bank (Canada) | Toronto, Canada | Global WM&BB | CAD | 8.5 | 100.0 | |||||||||
| UBS Bank Mexico, S.A. Institucion de Banca Multiple, UBS Grupo Financiero | Mexico City, Mexico | IB | MXN | 639.4 | 100.0 | |||||||||
347
Table of Contents
Financial information
Notes to the consolidated financial statements
Note 34 Significant subsidiaries and associates (continued)
| Significant subsidiaries (continued) | ||||||||||||||
| Share capital | Equity interest | |||||||||||||
| Company | Jurisdiction of incorporation | Business division1 | in millions | accumulated in % | ||||||||||
| UBS Bank USA | Utah, USA | Global WM&BB | USD | 1,700.0 | 100.0 | |||||||||
| UBS Bank, S.A. | Madrid, Spain | Global WM&BB | EUR | 77.2 | 100.0 | |||||||||
| UBS Belgium SA/NV | Brussels, Belgium | Global WM&BB | EUR | 23.0 | 100.0 | |||||||||
| UBS Capital (Jersey) Ltd | St. Helier, Jersey | IB | GBP | 119.0 | 100.0 | |||||||||
| UBS Capital B.V. | Amsterdam, the Netherlands | IB | EUR | 8.9 | 2 | 100.0 | ||||||||
| UBS Card Center AG | Glattbrugg, Switzerland | Global WM&BB | CHF | 0.1 | 100.0 | |||||||||
| UBS Clearing and Execution Services Limited | London, Great Britain | IB | USD | 50.0 | 100.0 | |||||||||
| UBS Convertible Securities (Jersey) Limited | St. Helier, Jersey | CC | CHF | 50.0 | 100.0 | |||||||||
| UBS Derivatives Hong Kong Limited | Hong Kong, China | IB | HKD | 880.0 | 100.0 | |||||||||
| UBS Deutschland AG | Frankfurt am Main, Germany | Global WM&BB | EUR | 176.0 | 100.0 | |||||||||
| UBS Factoring AG | Zurich, Switzerland | Global WM&BB | CHF | 5.0 | 100.0 | |||||||||
| UBS Fiduciaria S.p.A. | Milan, Italy | Global WM&BB | EUR | 0.2 | 100.0 | |||||||||
| UBS Finance (Cayman Islands) Ltd. | George Town, Cayman Islands | CC | USD | 0.5 | 100.0 | |||||||||
| UBS Finance (Curação) N.V. | Willemstad, Netherlands Antilles | CC | USD | 0.1 | 100.0 | |||||||||
| UBS Finance (Delaware) LLC | Delaware, USA | IB | USD | 37.3 | 2 | 100.0 | ||||||||
| UBS Financial Services Inc. | Delaware, USA | Global WM&BB | USD | 2,005.8 | 2 | 100.0 | ||||||||
| UBS Financial Services Incorporated of Puerto Rico | Hato Rey, Puerto Rico | Global WM&BB | USD | 31.0 | 2 | 100.0 | ||||||||
| UBS Fund Advisor, L.L.C. | Delaware, USA | Global WM&BB | USD | 0.0 | 100.0 | |||||||||
| UBS Fund Holding (Luxembourg) S.A. | Luxembourg, Luxembourg | Global AM | CHF | 42.0 | 100.0 | |||||||||
| UBS Fund Holding (Switzerland) AG | Basel, Switzerland | Global AM | CHF | 18.0 | 100.0 | |||||||||
| UBS Fund Management (Switzerland) AG | Basel, Switzerland | Global AM | CHF | 1.0 | 100.0 | |||||||||
| UBS Fund Services (Cayman) Ltd | George Town, Cayman Islands | Global AM | USD | 5.6 | 100.0 | |||||||||
| UBS Fund Services (Ireland) Limited | Dublin, Ireland | Global AM | EUR | 1.3 | 100.0 | |||||||||
| UBS Fund Services (Luxembourg) S.A. | Luxembourg, Luxembourg | Global AM | CHF | 2.5 | 100.0 | |||||||||
| UBS Fund Services (Luxembourg) S.A. Poland Branch | Zabierzow, Poland | CC | PLN | 0.1 | 100.0 | |||||||||
| UBS Futures Singapore Ltd. | Singapore, Singapore | IB | USD | 39.8 | 2 | 100.0 | ||||||||
| UBS Global Asset Management (Americas) Inc | Delaware, USA | Global AM | USD | 0.0 | 100.0 | |||||||||
| UBS Global Asset Management (Australia) Ltd | Sydney, Australia | Global AM | AUD | 8.0 | 100.0 | |||||||||
| UBS Global Asset Management (Canada) Co | Toronto, Canada | Global AM | CAD | 117.0 | 100.0 | |||||||||
| UBS Global Asset Management (Deutschland) GmbH | Frankfurt am Main, Germany | Global AM | EUR | 7.7 | 100.0 | |||||||||
| UBS Global Asset Management (France) S.A. | Paris, France | Global WM&BB | EUR | 2.3 | 100.0 | |||||||||
| UBS Global Asset Management (Hong Kong) Limited | Hong Kong, China | Global AM | HKD | 25.0 | 100.0 | |||||||||
| UBS Global Asset Management (Italia) SGR SpA | Milan, Italy | Global AM | EUR | 3.1 | 100.0 | |||||||||
| UBS Global Asset Management (Japan) Ltd | Tokyo, Japan | Global AM | JPY | 2,200.0 | 100.0 | |||||||||
| UBS Global Asset Management (Singapore) Ltd | Singapore, Singapore | Global AM | SGD | 4.0 | 100.0 | |||||||||
| UBS Global Asset Management (Taiwan) Ltd | Taipei, Taiwan | Global AM | TWD | 340.0 | 100.0 | |||||||||
| UBS Global Asset Management (UK) Ltd | London, Great Britain | Global AM | GBP | 68.0 | 100.0 | |||||||||
| UBS Global Asset Management (US) Inc | Delaware, USA | Global AM | USD | 23.2 | 2 | 100.0 | ||||||||
| UBS Global Asset Management Funds Ltd | London, Great Britain | Global AM | GBP | 19.0 | 100.0 | |||||||||
| UBS Global Asset Management Holding Ltd | London, Great Britain | Global AM | GBP | 86.0 | 100.0 | |||||||||
| UBS Global Asset Management Life Ltd | London, Great Britain | Global AM | GBP | 5.0 | 100.0 | |||||||||
| UBS Global Life AG | Vaduz, Liechtenstein | Global WM&BB | CHF | 5.0 | 100.0 | |||||||||
| UBS Global Trust Corporation | St. John, Canada | Global WM&BB | CAD | 0.1 | 100.0 | |||||||||
| UBS Grupo Financiero, S.A. de C.V. | Mexico City, Mexico | IB | MXN | 851.8 | 100.0 | |||||||||
| UBS Hana Asset Management Company Ltd | Seoul, South Korea | Global AM | KRW | 45,000.0 | 51.0 | |||||||||
| UBS International Holdings B.V. | Amsterdam, the Netherlands | CC | EUR | 6.8 | 100.0 | |||||||||
| UBS International Inc. | New York, USA | Global WM&BB | USD | 44.3 | 2 | 100.0 | ||||||||
| UBS International Life Limited | Dublin, Ireland | Global WM&BB | EUR | 1.0 | 100.0 | |||||||||
| UBS Investment Management Canada Inc. | Toronto, Canada | Global WM&BB | CAD | 0.0 | 100.0 | |||||||||
348
Table of Contents
Financial information |
Note 34 Significant subsidiaries and associates (continued)
| Significant subsidiaries (continued) | ||||||||||||||
| Share capital | Equity interest | |||||||||||||
| Company | Jurisdiction of incorporation | Business division1 | in millions | accumulated in % | ||||||||||
| UBS Investments Philippines, Inc. | Makati City, Philippines | IB | PHP | 360.0 | 99.4 | |||||||||
| UBS Italia SIM SpA | Milan, Italy | IB | EUR | 15.1 | 100.0 | |||||||||
| UBS Leasing AG | Zurich, Switzerland | Global WM&BB | CHF | 10.0 | 100.0 | |||||||||
| UBS Life AG | Zurich, Switzerland | Global WM&BB | CHF | 25.0 | 100.0 | |||||||||
| UBS Life Insurance Company USA | California, USA | Global WM&BB | USD | 39.3 | 2 | 100.0 | ||||||||
| UBS Limited | London, Great Britain | IB | GBP | 63.3 | 100.0 | |||||||||
| UBS Loan Finance LLC | Delaware, USA | IB | USD | 16.7 | 100.0 | |||||||||
| UBS Menkul Degerler AS | Istanbul, Turkey | IB | TRY | 30.0 | 100.0 | |||||||||
| UBS New Zealand Limited | Auckland, New Zealand | IB | NZD | 7.5 | 100.0 | |||||||||
| UBS O’Connor Limited | London, Great Britain | Global AM | GBP | 8.8 | 100.0 | |||||||||
| UBS O’Connor LLC | Delaware, USA | Global AM | USD | 1.0 | 100.0 | |||||||||
| UBS Pactual Asset Management S.A. DTVM | Rio de Janeiro, Brazil | Global AM | BRL | 73.2 | 100.0 | |||||||||
| UBS Preferred Funding Company LLC I | Delaware, USA | CC | USD | 0.0 | 100.0 | |||||||||
| UBS Preferred Funding Company LLC II | Delaware, USA | CC | USD | 0.0 | 100.0 | |||||||||
| UBS Preferred Funding Company LLC IV | Delaware, USA | CC | USD | 0.0 | 100.0 | |||||||||
| UBS Preferred Funding Company LLC V | Delaware, USA | CC | USD | 0.0 | 100.0 | |||||||||
| UBS Real Estate Kapitalanlagegesellschaft mbH | Munich, Germany | Global AM | EUR | 7.5 | 51.0 | |||||||||
| UBS Real Estate Securities Inc | Delaware, USA | IB | USD | 950.4 | 2 | 100.0 | ||||||||
| UBS Realty Investors LLC | Massachusetts, USA | Global AM | USD | 9.3 | 100.0 | |||||||||
| UBS Sauerborn Private Equity Komplementär GmbH | Bad Homburg, Germany | Global WM&BB | EUR | 0.0 | 100.0 | |||||||||
| UBS Securities (Thailand) Ltd | Bangkok, Thailand | IB | THB | 400.0 | 100.0 | |||||||||
| UBS Securities Asia Limited | Hong Kong, China | IB | HKD | 20.0 | 100.0 | |||||||||
| UBS Securities Australia Ltd | Sydney, Australia | IB | AUD | 209.8 | 2 | 100.0 | ||||||||
| UBS Securities Canada Inc | Toronto, Canada | IB | CAD | 10.0 | 100.0 | |||||||||
| UBS Securities España Sociedad de Valores SA | Madrid, Spain | IB | EUR | 15.0 | 100.0 | |||||||||
| UBS Securities France S.A. | Paris, France | IB | EUR | 22.9 | 100.0 | |||||||||
| UBS Securities Hong Kong Limited | Hong Kong, China | IB | HKD | 430.0 | 100.0 | |||||||||
| UBS Securities India Private Limited | Mumbai, India | IB | INR | 668.3 | 100.0 | |||||||||
| UBS Securities International Limited | London, Great Britain | IB | GBP | 18.0 | 100.0 | |||||||||
| UBS Securities Japan Ltd | George Town, Cayman Islands | IB | JPY | 60,000.0 | 100.0 | |||||||||
| UBS Securities LLC | Delaware, USA | IB | USD | 22,205.6 | 2 | 100.0 | ||||||||
| UBS Securities Malaysia Sdn. Bhd. | Kuala Lumpur, Malaysia | IB | MYR | 75.0 | 100.0 | |||||||||
| UBS Securities Philippines Inc | Makati City, Philippines | IB | PHP | 190.0 | 100.0 | |||||||||
| UBS Securities Pte. Ltd. | Singapore, Singapore | IB | SGD | 311.5 | 100.0 | |||||||||
| UBS Securities Pte. Ltd. Seoul Branch | Seoul, South Korea | IB | KRW | 150,000.0 | 100.0 | |||||||||
| UBS Service Centre (India) Private Limited | Mumbai, India | CC | INR | 1,249.6 | 100.0 | |||||||||
| UBS Service Centre (Poland) Sp. z o.o. | Krakow, Poland | CC | PLN | 0.1 | 100.0 | |||||||||
| UBS Services USA LLC | Delaware, USA | Global WM&BB | USD | 0.1 | 100.0 | |||||||||
| UBS South Africa (Proprietary) Limited | Sandton, South Africa | IB | ZAR | 0.0 | 100.0 | |||||||||
| UBS Swiss Financial Advisers AG | Zurich, Switzerland | Global WM&BB | CHF | 1.5 | 100.0 | |||||||||
| UBS Trustees (Bahamas) Ltd | Nassau, Bahamas | Global WM&BB | USD | 2.0 | 100.0 | |||||||||
| UBS Trustees (Cayman) Ltd | George Town, Cayman Islands | Global WM&BB | USD | 2.0 | 100.0 | |||||||||
| UBS Trustees (Jersey) Ltd. | St. Helier, Jersey | Global WM&BB | GBP | 0.0 | 100.0 | |||||||||
| UBS Trustees (Singapore) Ltd | Singapore, Singapore | Global WM&BB | SGD | 3.3 | 100.0 | |||||||||
| UBS UK Holding Limited | London, Great Britain | IB | GBP | 5.0 | 100.0 | |||||||||
| UBS UK Properties Limited | London, Great Britain | IB | GBP | 132.0 | 100.0 | |||||||||
| UBS Wealth Management (UK) Ltd | London, Great Britain | Global WM&BB | GBP | 2.5 | 100.0 | |||||||||
| UBS Wealth Management Australia Ltd | Melbourne, Australia | Global WM&BB | AUD | 53.9 | 100.0 | |||||||||
| UBS Trust Company National Association | New York, USA | Global WM&BB | USD | 105.0 | 2 | 100.0 | ||||||||
| Vermogens Advies Holding B.V. | Amsterdam, the Netherlands | Global WM&BB | EUR | 0.3 | 100.0 | |||||||||
349
Table of Contents
Financial information
Notes to the consolidated financial statements
Note 34 Significant subsidiaries and associates (continued)
| Consolidated companies: changes in 2008 | ||||
| Significant new companies | ||||
| Caisse Centrale de Réescompte – Paris, France | ||||
| CCR Actions S.A. – Paris, France | ||||
| CCR Gestion S.A. – Paris, France | ||||
| UBS Convertible Securities (Jersey) Limited – St. Helier, Jersey | ||||
| UBS Preferred Funding Company LLC V – Delaware, USA | ||||
| UBS Service Center (India) Private Limited – Mumbai, India | ||||
| Vermogens Advies Holding B.V. – Amsterdam, the Netherlands | ||||
| Deconsolidated companies | ||||
| Significant deconsolidated companies | Reason for deconsolidation | |||
| Crédit Industriel Société Anonyme in Liquidation – Zurich, Switzerland | Liquidated | |||
| Thesaurus Continentale Effekten-Gesellschaft in Zurich in Liquidation – Zurich, Switzerland | Liquidated | |||
| UBS Fiduciary Trust Company – New Jersey, USA | Sold | |||
| Significant associates | ||||||||
| Company | Industry | Equity interest in % | ||||||
| SIX Group AG – Zurich, Switzerland | Financial | 17.3 | ||||||
| UBS Securities Co. Limited – Beijing, China | Financial | 20.0 | ||||||
| Williamsburg Edge LLC – Delaware, USA | Real Estate | 50.0 | ||||||
| 219 West 81st LLC – Delaware, USA | Real Estate | 50.0 | ||||||
350
Table of Contents
Financial information |
Note 35 Invested assets and net new money
Invested assets include all client assets managed by or deposited with UBS for investment purposes. For example, invested assets include managed fund assets, managed institutional assets, discretionary and advisory wealth management portfolios, fiduciary deposits, time deposits, savings accounts and wealth management securities or brokerage accounts. All assets held for purely transactional purposes and custody-only assets, including corporate client assets held for cash management and transactional purposes, are excluded from invested assets as the Group only administers the assets and does not offer advice on how the assets should be invested. Also excluded are non-bankable assets (e.g. art collections) and deposits from third-party banks for funding or trading purposes.
distributes it. This results in double counting within UBS total invested assets, as both business divisions are providing a service independently to their respective clients, and both add value and generate revenue.
| On or for the year ended | ||||||||
| CHF billion | 31.12.08 | 31.12.07 | ||||||
| Fund assets managed by UBS | 339 | 509 | ||||||
| Discretionary assets | 528 | 877 | ||||||
| Other invested assets | 1,307 | 1,803 | ||||||
Total invested assets (double counts included) | 2,174 | 3,189 | ||||||
thereof double count | 273 | 392 | ||||||
thereof acquisitions (divestments) | 19.1 | 50.5 | ||||||
Net new money (double counts included) | (226.0 | ) | 140.6 | |||||
351
Table of Contents
Financial information
Notes to the consolidated financial statements
Note 36 Business combinations
Caisse Centrale de Réescompte Group
closing. The cost of the business combination has been allocated to intangible assets reflecting customer relationships of CHF 36 million (EUR 23 million), net assets of CHF 209 million (EUR 131 million) and goodwill of CHF 368 million (EUR 233 million). The business of CCR, which included EUR 13.3 billion of invested assets as of 31 December 2007 and approximately 190 employees, was integrated into UBS’s asset management and wealth management businesses in France.
| Caisse Centrale de Réescompte Group (CCR) 2008 | |||||||||||||
| CHF million | Book Value | Step-up to fair value | Fair Value | ||||||||||
Assets | |||||||||||||
| Intangible assets | 0 | 36 | 36 | ||||||||||
| Property and equipment | 5 | 0 | 5 | ||||||||||
| Goodwill | 0 | 368 | 368 | ||||||||||
| All other assets | 513 | 1 | 514 | ||||||||||
Total assets | 518 | 405 | 923 | ||||||||||
Liabilities | |||||||||||||
| Total liabilities | 297 | 13 | 310 | ||||||||||
| Net assets | 221 | 392 | 613 | ||||||||||
Total liabilities and equity | 518 | 405 | 923 | ||||||||||
On the acquisition date, intangible assets and goodwill were allocated to the divisions as follows:
| Caisse Centrale de Réescompte Group (CCR) 2008 | |||||||||||||
| Global Wealth Management & | Global Asset | ||||||||||||
| CHF million | Business Banking | Management | Total | ||||||||||
Assets | |||||||||||||
| Intangible assets | 10 | 26 | 36 | ||||||||||
| Goodwill | 37 | 331 | 368 | ||||||||||
352
Table of Contents
Financial information |
Note 36 Business combinations (continued)
VermogensGroep
In August 2008, UBS completed the acquisition of 100% of VermogensGroep, an independent Dutch wealth manager. The cost of the business combination, including directly attributable transaction costs, amounted to approximately CHF 171 million (EUR 105 million) out of which approximately CHF 81 million (EUR 50 million) were paid in cash upon closing. The remaining cost of the business combination is expected to be paid in installments over the next
3 years. The cost of the business combination was allocated to intangible assets of CHF 49 million (EUR 30 million), net liabilities of CHF 2.1 million (EUR 1.3 million) and goodwill of CHF 124 million (EUR 77 million). VermogensGroep serves wealthy private clients, foundations and institutions in the Dutch market and managed client assets of approximately EUR 4 billion at the time of the transaction. VermogensGroep was integrated into UBS’s wealth management business.
| VermogensGroep 2008 | ||||||||||||
| CHF million | Book Value | Step-up to fair value | Fair Value | |||||||||
Assets | ||||||||||||
| Intangible assets | 0 | 49 | 49 | |||||||||
| Property and equipment | 2 | 0 | 2 | |||||||||
| Goodwill | 0 | 124 | 124 | |||||||||
| All other assets | 10 | 0 | 10 | |||||||||
Total assets | 12 | 173 | 185 | |||||||||
Liabilities | ||||||||||||
| Total liabilities | 2 | 12 | 14 | |||||||||
| Net assets | 10 | 161 | 171 | |||||||||
Total liabilities and equity | 12 | 173 | 185 | |||||||||
Acquisition announced after the balance sheet date
Financial Products Corp.
purchase price for the transaction is USD 15 million, payable upon closing, and additional payments of up to USD 135 million over the following 18 months, based upon future earnings of the purchased business. Closing of the transaction, expected by May 2009, is subject to a number of regulatory and other conditions. No assurance can be given that any such conditions will be satisfied.
353
Table of Contents
Financial information
Notes to the consolidated financial statements
Note 36 Business combinations (continued)
During 2007, UBS completed two material acquisitions that were accounted for as business combinations.
McDonald Investments’ branch network
In February 2007, UBS completed the acquisition of the branch network of McDonald Investments, a unit of Key-Corp. The cost of the business combination consisted of CHF 269 million (USD 220 million) for the business operations including directly attributable transaction costs, and of CHF 70 million (USD 58 million) for the net loans to customer portfolios of McDonald Investments, resulting in a
total cash consideration paid of CHF 339 million (USD 278 million). The cost of the business combination was allocated to an intangible asset reflecting customer relationships of CHF 57 million (USD 47 million), remaining net assets of CHF 77 million (USD 63 million) including the net loans to customer portfolios, and goodwill of CHF 205 million (USD 168 million). The unit provides comprehensive wealth management services to affluent and high net worth individuals, including estate planning, retirement planning and asset management, and has been integrated into Wealth Management US.
| McDonald Investments’ branch network 2007 | ||||||||||||
| CHF million | Book Value | Step-up to fair value | Fair Value | |||||||||
Assets | ||||||||||||
| Intangible assets | 0 | 57 | 57 | |||||||||
| Property and equipment | 4 | (1 | ) | 3 | ||||||||
| Deferred tax assets | 0 | 10 | 10 | |||||||||
| Goodwill | 0 | 205 | 205 | |||||||||
| All other assets | 70 | 0 | 70 | |||||||||
Total assets | 74 | 271 | 345 | |||||||||
Liabilities | ||||||||||||
| Total liabilities | 6 | 0 | 6 | |||||||||
| Net assets | 68 | 271 | 339 | |||||||||
Total liabilities and equity | 74 | 271 | 345 | |||||||||
Daehan Investment Trust Management Company
In July 2007, UBS completed the acquisition of 51% of Daehan Investment Trust Management Company Ltd. (DIMCO) from Hana Daetoo Securities (formerly Daehan Investment & Securities Company Ltd.), a wholly owned subsidiary of Hana Financial Group. DIMCO was integrated into UBS’s Global Asset Management business and renamed as UBS Hana Asset Management Company Ltd. internationally, and as Hana UBS Asset Management in Korea. The estimated cost of the business combination amounted to approximately CHF 238 million (KRW 180 billion) in total and was paid in cash. The pur-
chase price is subject to an earn-out clawback of up to CHF 40 million (KRW 30 billion) over the next three to five years. The acquisition costs had been allocated to intangible assets reflecting customer relationships of CHF 54 million, net assets of CHF 74 million and goodwill of CHF 170 million. On the acquisition date, equity attributable to minority interests was CHF 60 million. At closing, DIMCO managed around CHF 26.4 billion of assets (KRW 19.9 trillion).
| Daehan Investment Trust Management Company 2007 | ||||||||||||
| CHF million | Book Value | Step-up to fair value | Fair Value | |||||||||
Assets | ||||||||||||
| Intangible assets | 0 | 52 | 52 | |||||||||
| Goodwill | 0 | 188 | 188 | |||||||||
| All other assets | 87 | 0 | 87 | |||||||||
Total assets | 87 | 240 | 327 | |||||||||
Liabilities | ||||||||||||
| Total liabilities | 13 | 14 | 27 | |||||||||
| Net assets attributable to minority interests | 36 | 22 | 58 | |||||||||
| Net assets attributable to UBS shareholders | 38 | 204 | 242 | |||||||||
Total liabilities and equity | 87 | 240 | 327 | |||||||||
354
Table of Contents
Financial information |
Note 36 Business combinations (continued)
Business combinations announced in 2007
Acquisition of significant associates in 2007
CHF 369 million (RMB 2.4 billion). The cost of the acquisition consisted of cash payments of approximately CHF 324 million (RMB 2.1 billion) including transaction costs and liabilities settled as well as the assumption of liabilities of approximately CHF 45 million (RMB 0.3 billion). On the basis of its current rights and obligations, UBS has significant influence and applies the equity method of accounting. Following approvals by Chinese regulators, UBSS commenced operations in December 2006 on the basis of a comprehensive set of securities licenses. UBSS is active in both primary and secondary domestic equities and fixed income businesses, in discretionary asset management, corporate advisory and mergers and acquisitions services, and in wealth management.
Pro-forma information (unaudited)
The following pro-forma information shows UBS’s total operating income, net profit attributable to UBS shareholders and basic earnings per share as if all of the acquisitions completed in 2008 had been made as of 1 January 2007 and all acquisitions completed in 2007, had been made as of 1 Jan-
uary 2006. Adjustments have been made to reflect additional amortization and depreciation of assets and liabilities, which have been assigned fair values different from their carryover bases in purchase accounting.
| Pro-forma information (unaudited) | ||||||||||||
| For the year ended | ||||||||||||
| CHF million, except where indicated | 31.12.08 | 31.12.07 | 31.12.06 | |||||||||
| Total operating income | 1,224 | 31,932 | 48,928 | |||||||||
| Net profit | (20,881 | ) | (5,233 | ) | 11,887 | |||||||
| Basic earnings per share (CHF) | (7.54 | ) | (2.42 | ) | 5.35 | |||||||
355
Table of Contents
Financial information
Notes to the consolidated financial statements
Note 37 Discontinued operations
2008
Industrial holdings
2007
Industrial holdings
Private banks & GAM
2006
Motor-Columbus
Other Industrial holdings
356
Table of Contents
Financial information |
| Note 37 Discontinued operations (continued) | ||||||||
| For the year ended 31.12.08 | ||||||||
| CHF million | Private Banks & GAM | 1 | Industrial Holdings | |||||
| Operating income | 0 | 19 | ||||||
| Operating expenses | 0 | (15 | ) | |||||
| Operating profit from discontinued operations before tax | 0 | 34 | ||||||
| Pre-tax gain on sale | 44 | 120 | ||||||
Profit from discontinued operations before tax | 44 | 155 | ||||||
| Tax expense on operating profit from discontinued operations before tax | 0 | 0 | ||||||
| Tax expense on gain from sale | 1 | 0 | ||||||
Tax expense from discontinued operations | 1 | 0 | ||||||
Net profit from discontinued operations | 43 | 155 | ||||||
Net cash flows from | ||||||||
| operating activities | 0 | (1 | ) | |||||
| investing activities | 0 | 3 | ||||||
| financing activities | 0 | 0 | ||||||
| For the year ended 31.12.07 | ||||||||
| CHF million | Private Banks & GAM | 1 | Industrial Holdings | |||||
| Operating income | 0 | 394 | ||||||
| Operating expenses | 0 | 358 | ||||||
| Operating profit from discontinued operations before tax | 0 | 36 | ||||||
| Pre-tax gain on sale | 7 | 102 | ||||||
Profit from discontinued operations before tax | 7 | 138 | ||||||
| Tax expense on operating profit from discontinued operations before tax | 0 | 0 | ||||||
| Tax expense on gain from sale | (258 | ) | 0 | |||||
Tax expense from discontinued operations | (258 | ) | 0 | |||||
Net profit from discontinued operations | 265 | 138 | ||||||
Net cash flows from | ||||||||
| operating activities | 0 | 32 | ||||||
| investing activities | 0 | (1 | ) | |||||
| financing activities | 0 | (42 | ) | |||||
| For the year ended 31.12.06 | ||||||||
| CHF million | Motor-Columbus | Other Industrial Holdings | 1 | |||||
| Operating income | 2,494 | 993 | ||||||
| Operating expenses | 2,412 | 979 | ||||||
| Operating profit from discontinued operations before tax | 82 | 14 | ||||||
| Pre-tax gain on sale | 364 | 428 | ||||||
Profit from discontinued operations before tax | 446 | 442 | ||||||
| Tax expense on operating profit from discontinued operations before tax | 11 | 1 | ||||||
| Tax expense on gain from sale | (23 | ) | 0 | |||||
Tax expense from discontinued operations | (12 | ) | 1 | |||||
Net profit from discontinued operations | 458 | 441 | ||||||
Net cash flows from | ||||||||
| operating activities | 1 | 16 | ||||||
| investing activities | (52 | ) | 73 | |||||
| financing activities | (22 | ) | (88 | ) | ||||
357
Table of Contents
Financial information
Notes to the consolidated financial statements
Note 38 Reorganizations and disposals
Reorganizations
Repositioning of the investment bank
Disposals
BlackRock fund
Sale of assets to a third-party fund controlled by the
Swiss National Bank (SNB)
358
Table of Contents
Financial information |
Note 38 Reorganizations and disposals (continued)
income. The fair value of the contingent share issue was estimated at approximately CHF 607 million and will not hereafter be re-measured to fair value.
Disposal of equity interest in Adams Street Partners
Disposal of financial investment in Bank of China
359
Table of Contents
Financial information
Notes to the consolidated financial statements
Note 39 Currency translation rates
The following table shows the principal rates used to translate the financial statements of foreign entities into Swiss francs:
| Spot rate | Average rate | |||||||||||||||||||
| As of | Year ended | |||||||||||||||||||
| 31.12.08 | 31.12.07 | 31.12.08 | 31.12.07 | 31.12.06 | ||||||||||||||||
| 1 USD | 1.07 | 1.13 | 1.06 | 1.22 | 1.25 | |||||||||||||||
| 1 EUR | 1.49 | 1.65 | 1.58 | 1.65 | 1.58 | |||||||||||||||
| 1 GBP | 1.56 | 2.25 | 1.96 | 2.31 | 2.31 | |||||||||||||||
| 100 JPY | 1.17 | 1.02 | 0.98 | 1.02 | 1.08 | |||||||||||||||
Note 40 Swiss banking law requirements
The consolidated Financial Statements of UBS are prepared in accordance with International Financial Reporting Standards (IFRS). The Guidelines of the Swiss Financial Market Supervisory Authority (FINMA) require banks which present their financial statements under IFRS to provide a narrative explanation of the main differences between IFRS and Swiss GAAP (FINMA circular 08/2) and the Banking Ordinance. Included in this note are the significant differences in regard to recognition and measurement between IFRS and the provisions of the Banking Ordinance and the Guidelines of the FINMA governing financial statement reporting pursuant to Article 23 through Article 27 of the Banking Ordinance. The differences outlined in points two through nine also apply to the Parent Bank statutory accounts.
1. Consolidation
2. Financial investments available-for-sale
3. Cash flow hedges
4. Investment property
360
Table of Contents
Financial information |
Note 40 Swiss banking law requirements (continued)
5. Fair value option
6. Goodwill and intangible assets
7. Discontinued operations
8. Extraordinary income and expense
9. Netting of replacement values
361
Table of Contents
Financial information
Notes to the consolidated financial statements
Guarantee of PaineWebber securities
Following the acquisition of Paine Webber Group Inc., UBS made a full and unconditional guarantee of the senior and subordinated notes and trust preferred securities (“Debt Securities”) of PaineWebber. Prior to the acquisition, PaineWebber was a SEC Registrant. Upon the acquisition, PaineWebber was merged into UBS Americas Inc., a wholly owned subsidiary of UBS.
| Supplemental Guarantor Consolidating Income Statement | ||||||||||||||||||||
| CHF million | UBS AG | UBS | Consolidating | |||||||||||||||||
| For the year ended 31 December 2008 | Parent Bank1 | Americas Inc. | Subsidiaries | Entries | UBS Group | |||||||||||||||
Operating income | ||||||||||||||||||||
| Interest income | 49,699 | 21,343 | 27,565 | (32,717 | ) | 65,890 | ||||||||||||||
| Interest expense | (48,686 | ) | (17,436 | ) | (26,282 | ) | 32,717 | (59,687 | ) | |||||||||||
| Net interest income | 1,013 | 3,907 | 1,283 | 0 | 6,203 | |||||||||||||||
| Credit loss (expense) / recovery | (861 | ) | (2,050 | ) | (85 | ) | 0 | (2,996 | ) | |||||||||||
| Net interest income after credit loss expense | 152 | 1,857 | 1,198 | 0 | 3,207 | |||||||||||||||
| Net fee and commission income | 9,709 | 7,910 | 5,310 | 0 | 22,929 | |||||||||||||||
| Net trading income | (8,129 | ) | (19,847 | ) | 2,158 | 0 | (25,818 | ) | ||||||||||||
| Income from subsidiaries | (19,477 | ) | 0 | 0 | 19,477 | 0 | ||||||||||||||
| Other income | 2,836 | 1,058 | (3,010 | ) | 0 | 884 | ||||||||||||||
Total operating income | (14,909 | ) | (9,022 | ) | 5,656 | 19,477 | 1,201 | |||||||||||||
Operating expenses | ||||||||||||||||||||
| Personnel expenses | 8,738 | 5,169 | 2,355 | 0 | 16,262 | |||||||||||||||
| General and administrative expenses | 3,918 | 4,604 | 1,976 | 0 | 10,498 | |||||||||||||||
| Depreciation of property and equipment | 770 | 205 | 266 | 0 | 1,241 | |||||||||||||||
| Impairment of goodwill | 0 | 341 | 0 | 0 | 341 | |||||||||||||||
| Amortization of intangible assets | 1 | 93 | 119 | 0 | 213 | |||||||||||||||
Total operating expenses | 13,427 | 10,412 | 4,716 | 0 | 28,555 | |||||||||||||||
Operating profit from continuing operations before tax | (28,336 | ) | (19,434 | ) | 940 | 19,477 | (27,353 | ) | ||||||||||||
| Tax expense | (7,407 | ) | (4 | ) | 574 | 0 | (6,837 | ) | ||||||||||||
Net profit from continuing operations | (20,930 | ) | (19,430 | ) | 366 | 19,477 | (20,517 | ) | ||||||||||||
| Net profit from discontinued operations | 43 | 0 | 155 | 0 | 198 | |||||||||||||||
| Net profit | (20,887 | ) | (19,430 | ) | 521 | 19,477 | (20,319 | ) | ||||||||||||
| Net profit attributable to minority interests | 0 | (9 | ) | 577 | 0 | 568 | ||||||||||||||
Net profit attributable to UBS shareholders | (20,887 | ) | (19,421 | ) | (56 | ) | 19,477 | (20,887 | ) | |||||||||||
362
Table of Contents
Financial information |
| Supplemental guarantor consolidating balance sheet | ||||||||||||||||||||
| CHF million | UBS AG | UBS | Consolidating | |||||||||||||||||
| As of 31 December 2008 | Parent Bank1 | Americas Inc. | Subsidiaries | Entries | UBS Group | |||||||||||||||
Assets | ||||||||||||||||||||
| Cash and balances with central banks | 27,030 | 332 | 5,382 | 0 | 32,744 | |||||||||||||||
| Due from banks | 111,563 | 11,490 | 192,206 | (250,808 | ) | 64,451 | ||||||||||||||
| Cash collateral on securities borrowed | 48,874 | 109,783 | 16,914 | (52,674 | ) | 122,897 | ||||||||||||||
| Reverse repurchase agreements | 206,087 | 79,178 | 145,851 | (206,468 | ) | 224,648 | ||||||||||||||
| Trading portfolio assets | 183,303 | 54,973 | 50,638 | (17,076 | ) | 271,838 | ||||||||||||||
| Trading portfolio assets pledged as collateral | 33,445 | 5,240 | 1,531 | 0 | 40,216 | |||||||||||||||
| Positive replacement values | 862,459 | 18,215 | 293,896 | (320,470 | ) | 854,100 | ||||||||||||||
| Financial assets designated at fair value | 5,120 | 7,755 | 12,741 | (12,734 | ) | 12,882 | ||||||||||||||
| Loans | 326,548 | 53,774 | 35,193 | (75,207 | ) | 340,308 | ||||||||||||||
| Financial investments available-for-sale | 1,237 | 638 | 3,373 | 0 | 5,248 | |||||||||||||||
| Accrued income and prepaid expenses | 3,684 | 2,700 | 2,666 | (2,909 | ) | 6,141 | ||||||||||||||
| Investments in associates | 66,660 | 58 | 50 | (65,878 | ) | 892 | ||||||||||||||
| Property and equipment | 5,093 | 971 | 642 | 0 | 6,706 | |||||||||||||||
| Goodwill and intangible assets | 250 | 9,393 | 3,292 | 0 | 12,935 | |||||||||||||||
| Other assets | 15,541 | 3,905 | 7,132 | (7,484 | ) | 19,094 | ||||||||||||||
Total assets | 1,896,894 | 358,405 | 771,507 | (1,011,708 | ) | 2,015,098 | ||||||||||||||
Liabilities | ||||||||||||||||||||
| Due to banks | 196,723 | 68,213 | 111,500 | (250,808 | ) | 125,628 | ||||||||||||||
| Cash collateral on securities lent | 25,248 | 32,884 | 8,605 | (52,674 | ) | 14,063 | ||||||||||||||
| Repurchase agreements | 30,988 | 140,197 | 137,844 | (206,468 | ) | 102,561 | ||||||||||||||
| Trading portfolio liabilities | 51,034 | 17,086 | 11,387 | (17,076 | ) | 62,431 | ||||||||||||||
| Negative replacement values | 855,005 | 16,792 | 300,476 | (320,470 | ) | 851,803 | ||||||||||||||
| Financial liabilities designated at fair value | 88,505 | 1,716 | 24,059 | (12,734 | ) | 101,546 | ||||||||||||||
| Due to customers | 422,688 | 70,242 | 57,051 | (75,207 | ) | 474,774 | ||||||||||||||
| Accrued expenses and deferred income | 7,417 | 2,584 | 3,104 | (2,909 | ) | 10,196 | ||||||||||||||
| Debt issued | 127,408 | 2,439 | 67,407 | 0 | 197,254 | |||||||||||||||
| Other liabilities | 12,598 | 4,313 | 24,613 | (7,484 | ) | 34,040 | ||||||||||||||
Total liabilities | 1,817,614 | 356,466 | 746,046 | (945,830 | ) | 1,974,296 | ||||||||||||||
Equity attributable to UBS shareholders | 79,280 | (1,097 | ) | 20,495 | (65,878 | ) | 32,800 | |||||||||||||
| Equity attributable to minority interests | 0 | 3,036 | 4,966 | 0 | 8,002 | |||||||||||||||
Total equity | 79,280 | 1,939 | 25,461 | (65,878 | ) | 40,802 | ||||||||||||||
Total liabilities and equity | 1,896,894 | 358,405 | 771,507 | (1,011,708 | ) | 2,015,098 | ||||||||||||||
363
Table of Contents
Financial information
Notes to the consolidated financial statements
Note 41 Supplemental guarantor information required under SEC rules (continued)
| Supplemental guarantor consolidating cash flow statement | |||||||||||||||||
| CHF million | UBS AG | UBS | |||||||||||||||
| For the year ended 31 December 2008 | Parent Bank1 | Americas Inc. | Subsidiaries | UBS Group | |||||||||||||
Net cash flow from/(used in) operating activities | 69,772 | (438 | ) | 7,838 | 77,172 | ||||||||||||
| Cash flow from/(used in) investing activities | |||||||||||||||||
| Investments in subsidiaries and associates | (1,502 | ) | 0 | 0 | (1,502 | ) | |||||||||||
| Disposal of subsidiaries and associates | 1,686 | 0 | 0 | 1,686 | |||||||||||||
| Purchase of property and equipment | (819 | ) | (258 | ) | (140 | ) | (1,217 | ) | |||||||||
| Disposal of property and equipment | 37 | 27 | 5 | 69 | |||||||||||||
| Net (investment in)/divestment of financial investments available-for-sale | 330 | 156 | (1,198 | ) | (712 | ) | |||||||||||
Net cash flow from/(used in) investing activities | (268 | ) | (75 | ) | (1,333 | ) | (1,676 | ) | |||||||||
| Cash flow from/(used in) financing activities | |||||||||||||||||
| Net money market paper issued/(repaid) | (52,815 | ) | 914 | 11,264 | (40,637 | ) | |||||||||||
| Net movements in treasury shares and own equity derivative activity | 623 | 0 | 0 | 623 | |||||||||||||
| Capital issuance | 23,135 | 0 | 0 | 23,135 | |||||||||||||
| Issuance of long-term debt, including financial liabilities designated at fair value | 91,961 | 0 | 11,126 | 103,087 | |||||||||||||
| Repayment of long-term debt, including financial liabilities designated at fair value | (62,822 | ) | (14,500 | ) | (15,572 | ) | (92,894 | ) | |||||||||
| Increase in minority interests | 0 | 842 | 819 | 1,661 | |||||||||||||
| Dividends paid to/decrease in minority interests | 0 | (112 | ) | (420 | ) | (532 | ) | ||||||||||
| Net activity in investments in subsidiaries | (11,978 | ) | 21,816 | (9,838 | ) | 0 | |||||||||||
Net cash flow from/(used in) financing activities | (11,896 | ) | 8,960 | (2,621 | ) | (5,557 | ) | ||||||||||
| Effects of exchange rate differences | (33,963 | ) | 442 | (5,857 | ) | (39,378 | ) | ||||||||||
Net increase/(decrease) in cash equivalents | 23,645 | 8,889 | (1,973 | ) | 30,561 | ||||||||||||
| Cash and cash equivalents, beginning of the year | 109,110 | 15,532 | 24,463 | 149,105 | |||||||||||||
Cash and cash equivalents, end of the year | 132,755 | 24,421 | 22,490 | 179,666 | |||||||||||||
| Cash and cash equivalents comprise: | |||||||||||||||||
| Cash and balances with central banks | 27,030 | 332 | 5,382 | 32,744 | |||||||||||||
Money market paper2 | 62,777 | 19,875 | 4,080 | 86,732 | |||||||||||||
| Due from banks with original maturity of less than three months | 42,948 | 4,214 | 13,028 | 60,190 | |||||||||||||
Total | 132,755 | 24,421 | 22,490 | 179,666 | |||||||||||||
364
Table of Contents
Financial information |
| Note 41 Supplemental guarantor information required under SEC rules (continued) | ||||||||||||||||||||
| Supplemental guarantor consolidating income statement | ||||||||||||||||||||
| CHF million | UBS AG | UBS | Consolidating | |||||||||||||||||
| For the year ended 31 December 2007 | Parent Bank1 | Americas Inc. | Subsidiaries | Entries | UBS Group | |||||||||||||||
Operating income | ||||||||||||||||||||
| Interest income | 77,306 | 47,747 | 51,985 | (67,926 | ) | 109,112 | ||||||||||||||
| Interest expense | (74,689 | ) | (46,420 | ) | (50,592 | ) | 67,926 | (103,775 | ) | |||||||||||
| Net interest income | 2,617 | 1,327 | 1,393 | 0 | 5,337 | |||||||||||||||
| Credit loss (expense)/recovery | 11 | (234 | ) | (15 | ) | 0 | (238 | ) | ||||||||||||
| Net interest income after credit loss expense | 2,628 | 1,093 | 1,378 | 0 | 5,099 | |||||||||||||||
| Net fee and commission income | 12,852 | 10,119 | 7,663 | 0 | 30,634 | |||||||||||||||
| Net trading income | 3,467 | (9,932 | ) | (1,888 | ) | 0 | (8,353 | ) | ||||||||||||
| Income from subsidiaries | 464 | 0 | 0 | (464 | ) | 0 | ||||||||||||||
| Other income | (4,273 | ) | 8,369 | 245 | 0 | 4,341 | ||||||||||||||
Total operating income | 15,138 | 9,649 | 7,398 | (464 | ) | 31,721 | ||||||||||||||
Operating expenses | ||||||||||||||||||||
| Personnel expenses | 13,239 | 8,329 | 3,947 | 0 | 25,515 | |||||||||||||||
| General and administrative expenses | 5,684 | 3,446 | (701 | ) | 0 | 8,429 | ||||||||||||||
| Depreciation of property and equipment | 930 | 138 | 175 | 0 | 1,243 | |||||||||||||||
| Amortization of intangible assets | 3 | 101 | 172 | 0 | 276 | |||||||||||||||
Total operating expenses | 19,856 | 12,014 | 3,593 | 0 | 35,463 | |||||||||||||||
Operating profit from continuing operations before tax | (4,718 | ) | (2,365 | ) | 3,805 | (464 | ) | (3,742 | ) | |||||||||||
| Tax expense | 794 | (486 | ) | 1,061 | 0 | 1,369 | ||||||||||||||
Net profit from continuing operations | (5,512 | ) | (1,879 | ) | 2,744 | (464 | ) | (5,111 | ) | |||||||||||
| Net profit from discontinued operations | 265 | 0 | 138 | 0 | 403 | |||||||||||||||
| Net profit | (5,247 | ) | (1,879 | ) | 2,882 | (464 | ) | (4,708 | ) | |||||||||||
| Net profit attributable to minority interests | 0 | 18 | 521 | 0 | 539 | |||||||||||||||
Net profit attributable to UBS shareholders | (5,247 | ) | (1,897 | ) | 2,361 | (464 | ) | (5,247 | ) | |||||||||||
365
Table of Contents
Financial information
Notes to the consolidated financial statements
| Note 41 Supplemental guarantor information required under SEC rules (continued) | ||||||||||||||||||||
| Supplemental guarantor consolidating balance sheet | ||||||||||||||||||||
| CHF million | UBS AG | UBS | Consolidating | |||||||||||||||||
| On 31 December 2007 | Parent Bank1 | Americas Inc. | Subsidiaries | Entries | UBS Group | |||||||||||||||
Assets | ||||||||||||||||||||
| Cash and balances with central banks | 8,530 | 109 | 10,154 | 0 | 18,793 | |||||||||||||||
| Due from banks | 154,138 | 16,530 | 200,488 | (310,249 | ) | 60,907 | ||||||||||||||
| Cash collateral on securities borrowed | 117,312 | 166,479 | 53,672 | (130,400 | ) | 207,063 | ||||||||||||||
| Reverse repurchase agreements | 292,839 | 106,775 | 266,470 | (289,156 | ) | 376,928 | ||||||||||||||
| Trading portfolio assets | 297,100 | 170,977 | 84,884 | 107,221 | 660,182 | |||||||||||||||
| Trading portfolio assets pledged as collateral | 161,071 | 55,842 | 4,498 | (107,221 | ) | 114,190 | ||||||||||||||
| Positive replacement values | 436,271 | 16,770 | 192,144 | (216,968 | ) | 428,217 | ||||||||||||||
| Financial assets designated at fair value | 5,510 | 7,149 | 8,421 | (9,315 | ) | 11,765 | ||||||||||||||
| Loans | 370,274 | 41,398 | 43,584 | (119,392 | ) | 335,864 | ||||||||||||||
| Financial investments available-for-sale | 2,611 | 980 | 1,375 | 0 | 4,966 | |||||||||||||||
| Accrued income and prepaid expenses | 7,379 | 4,369 | 4,883 | (4,678 | ) | 11,953 | ||||||||||||||
| Investments in associates | 28,049 | 139 | 150 | (26,359 | ) | 1,979 | ||||||||||||||
| Property and equipment | 5,352 | 959 | 923 | 0 | 7,234 | |||||||||||||||
| Goodwill and intangible assets | 276 | 10,516 | 3,746 | 0 | 14,538 | |||||||||||||||
| Other assets | 15,848 | 5,135 | 4,951 | (5,622 | ) | 20,312 | ||||||||||||||
Total assets | 1,902,560 | 604,127 | 880,343 | (1,112,139 | ) | 2,274,891 | ||||||||||||||
Liabilities | ||||||||||||||||||||
| Due to banks | 246,977 | 114,066 | 94,968 | (310,249 | ) | 145,762 | ||||||||||||||
| Cash collateral on securities lent | 45,055 | 64,281 | 52,685 | (130,400 | ) | 31,621 | ||||||||||||||
| Repurchase agreements | 105,750 | 238,880 | 250,413 | (289,156 | ) | 305,887 | ||||||||||||||
| Trading portfolio liabilities | 111,955 | 51,904 | 929 | 0 | 164,788 | |||||||||||||||
| Negative replacement values | 456,631 | 16,333 | 187,543 | (216,968 | ) | 443,539 | ||||||||||||||
| Financial liabilities designated at fair value | 146,701 | 14,947 | 39,520 | (9,315 | ) | 191,853 | ||||||||||||||
| Due to customers | 555,694 | 87,534 | 118,056 | (119,392 | ) | 641,892 | ||||||||||||||
| Accrued expenses and deferred income | 13,276 | 8,242 | 5,310 | (4,678 | ) | 22,150 | ||||||||||||||
| Debt issued | 168,266 | 3,478 | 50,333 | 0 | 222,077 | |||||||||||||||
| Other liabilities | 19,524 | 5,511 | 42,083 | (5,622 | ) | 61,496 | ||||||||||||||
Total liabilities | 1,869,829 | 605,176 | 841,840 | (1,085,780 | ) | 2,231,065 | ||||||||||||||
Equity attributable to UBS shareholders | 32,731 | (3,373 | ) | 33,876 | (26,359 | ) | 36,875 | |||||||||||||
| Equity attributable to minority interests | 0 | 2,324 | 4,627 | 0 | 6,951 | |||||||||||||||
Total equity | 32,731 | (1,049 | ) | 38,503 | (26,359 | ) | 43,826 | |||||||||||||
Total liabilities and equity | 1,902,560 | 604,127 | 880,343 | (1,112,139 | ) | 2,274,891 | ||||||||||||||
366
Table of Contents
Financial information |
Note 41 Supplemental guarantor information required under SEC rules (continued)
| Supplemental guarantor consolidating cash flow statement | ||||||||||||||||
| CHF million | UBS AG | UBS | ||||||||||||||
| For the year ended 31 December 2007 | Parent Bank1 | Americas Inc. | Subsidiaries | UBS Group | ||||||||||||
Net cash flow from/(used in) operating activities | (65,749 | ) | 19,670 | (5,999 | ) | (52,078 | ) | |||||||||
| Cash flow from/(used in) investing activities | ||||||||||||||||
| Investments in subsidiaries and associates | (2,337 | ) | 0 | 0 | (2,337 | ) | ||||||||||
| Disposal of subsidiaries and associates | 885 | 0 | 0 | 885 | ||||||||||||
| Purchase of property and equipment | (1,022 | ) | (581 | ) | (307 | ) | (1,910 | ) | ||||||||
| Disposal of property and equipment | 40 | 28 | 66 | 134 | ||||||||||||
| Net (investment in)/divestment of financial investments available-for-sale | 4,027 | 34 | 1,920 | 5,981 | ||||||||||||
Net cash flow from/(used in) investing activities | 1,593 | (519 | ) | 1,679 | 2,753 | |||||||||||
| Cash flow from/(used in) financing activities | ||||||||||||||||
| Net money market paper issued/(repaid) | 35,017 | (1,426 | ) | (919 | ) | 32,672 | ||||||||||
| Net movements in treasury shares and own equity derivative activity | (2,771 | ) | 0 | 0 | (2,771 | ) | ||||||||||
| Dividends paid | (4,275 | ) | 0 | 0 | (4,275 | ) | ||||||||||
| Issuance of long-term debt, including financial liabilities designated at fair value | 105,197 | 1,022 | 4,655 | 110,874 | ||||||||||||
| Repayment of long-term debt, including financial liabilities designated at fair value | (54,251 | ) | (7,022 | ) | (1,134 | ) | (62,407 | ) | ||||||||
| Increase in minority interests | 0 | 32 | 1,062 | 1,094 | ||||||||||||
| Dividends paid to/decrease in minority interests | 0 | (665 | ) | 46 | (619 | ) | ||||||||||
| Net activity in investments in subsidiaries | 871 | (6,627 | ) | 5,756 | 0 | |||||||||||
Net cash flow from/(used in) financing activities | 79,788 | (14,686 | ) | 9,466 | 74,568 | |||||||||||
| Effects of exchange rate differences | (9,070 | ) | (3,062 | ) | (96 | ) | (12,228 | ) | ||||||||
Net increase/(decrease) in cash equivalents | 6,562 | 1,403 | 5,050 | 13,015 | ||||||||||||
| Cash and cash equivalents, beginning of the year | 102,548 | 14,129 | 19,413 | 136,090 | ||||||||||||
Cash and cash equivalents, end of the year | 109,110 | 15,532 | 24,463 | 149,105 | ||||||||||||
| Cash and cash equivalents comprise: | ||||||||||||||||
| Cash and balances with central banks | 8,530 | 109 | 10,154 | 18,793 | ||||||||||||
Money market paper2 | 60,266 | 13,202 | 3,747 | 77,215 | ||||||||||||
| Due from banks with original maturity of less than three months | 40,314 | 2,221 | 10,562 | 53,097 | ||||||||||||
Total | 109,110 | 15,532 | 24,463 | 149,105 | ||||||||||||
367
Table of Contents
Financial information
Notes to the consolidated financial statements
| Note 41 Supplemental guarantor information required under SEC rules (continued) | ||||||||||||||||||||
| Supplemental guarantor consolidating income statement | ||||||||||||||||||||
| CHF million | UBS AG Parent | Consolidating | ||||||||||||||||||
| For the year ended 31 December 2006 | Bank1 | UBS Americas Inc. | Subsidiaries | Entries | UBS Group | |||||||||||||||
| Operating income | ||||||||||||||||||||
| Interest income | 60,057 | 42,667 | 39,269 | (54,592 | ) | 87,401 | ||||||||||||||
| Interest expense | (56,020 | ) | (41,049 | ) | (38,403 | ) | 54,592 | (80,880 | ) | |||||||||||
| Net interest income | 4,037 | 1,618 | 866 | 0 | 6,521 | |||||||||||||||
| Credit loss (expense)/recovery | 167 | (6 | ) | (5 | ) | 0 | 156 | |||||||||||||
| Net interest income after credit loss expense | 4,204 | 1,612 | 861 | 0 | 6,677 | |||||||||||||||
| Net fee and commission income | 11,646 | 8,590 | 5,220 | 0 | 25,456 | |||||||||||||||
| Net trading income | 10,306 | 1,634 | 1,803 | 0 | 13,743 | |||||||||||||||
| Income from subsidiaries | 3,086 | 0 | 0 | (3,086 | ) | 0 | ||||||||||||||
| Other income | (450 | ) | 1,637 | 421 | 0 | 1,608 | ||||||||||||||
Total operating income | 28,792 | 13,473 | 8,305 | (3,086 | ) | 47,484 | ||||||||||||||
Operating expenses | ||||||||||||||||||||
| Personnel expenses | 12,480 | 8,287 | 3,264 | 0 | 24,031 | |||||||||||||||
| General and administrative expenses | 2,805 | 3,362 | 1,775 | 0 | 7,942 | |||||||||||||||
| Depreciation of property and equipment | 979 | 133 | 132 | 0 | 1,244 | |||||||||||||||
| Amortization of intangible assets | 14 | 83 | 51 | 0 | 148 | |||||||||||||||
Total operating expenses | 16,278 | 11,865 | 5,222 | 0 | 33,365 | |||||||||||||||
Operating profit from continuing operations before tax | 12,514 | 1,608 | 3,083 | (3,086 | ) | 14,119 | ||||||||||||||
| Tax expense | 1,499 | 1,018 | 481 | 0 | 2,998 | |||||||||||||||
Net profit from continuing operations | 11,015 | 590 | 2,602 | (3,086 | ) | 11,121 | ||||||||||||||
| Net profit from discontinued operations | 512 | 0 | 387 | 0 | 899 | |||||||||||||||
| Net profit | 11,527 | 590 | 2,989 | (3,086 | ) | 12,020 | ||||||||||||||
| Net profit attributable to minority interests | 0 | 527 | (34 | ) | 0 | 493 | ||||||||||||||
Net profit attributable to UBS shareholders | 11,527 | 63 | 3,023 | (3,086 | ) | 11,527 | ||||||||||||||
368
Table of Contents
Financial information |
| Note 41 Supplemental guarantor information required under SEC rules (continued) | ||||||||||||||||
| Supplemental guarantor consolidating cash flow statement | ||||||||||||||||
| CHF million | UBS AG Parent | |||||||||||||||
| For the year ended 31 December 2006 | Bank1 | UBS Americas Inc. | Subsidiaries | UBS Group | ||||||||||||
Net cash flow from/(used in) operating activities | (2,215 | ) | (14,984 | ) | 11,815 | (5,384 | ) | |||||||||
| Cash flow from/(used in) investing activities | ||||||||||||||||
| Investments in subsidiaries and associates | 2,856 | 0 | 0 | 2,856 | ||||||||||||
| Disposal of subsidiaries and associates | 1,154 | 0 | 0 | 1,154 | ||||||||||||
| Purchase of property and equipment | (1,292 | ) | (255 | ) | (246 | ) | (1,793 | ) | ||||||||
| Disposal of property and equipment | 298 | 47 | 154 | 499 | ||||||||||||
| Net (investment in)/divestment of financial investments available-for-sale | 90 | 433 | 1,200 | 1,723 | ||||||||||||
Net cash flow from/(used in) investing activities | 3,106 | 225 | 1,108 | 4,439 | ||||||||||||
| Cash flow from/(used in) financing activities | ||||||||||||||||
| Net money market paper issued/(repaid) | 17,526 | 1,039 | (1,644 | ) | 16,921 | |||||||||||
| Net movements in treasury shares and own equity derivative activity | (3,179 | ) | 0 | 0 | (3,179 | ) | ||||||||||
| Capital issuance | 1 | 0 | 0 | 1 | ||||||||||||
| Capital repayment by par value reduction | (631 | ) | 0 | 0 | (631 | ) | ||||||||||
| Dividends paid | (3,214 | ) | 0 | 0 | (3,214 | ) | ||||||||||
| Issuance of long-term debt, including financial liabilities designated at fair value | 79,358 | 10,881 | 7,436 | 97,675 | ||||||||||||
| Repayment of long-term debt, including financial liabilities designated at fair value | (48,748 | ) | (447 | ) | (10,545 | ) | (59,740 | ) | ||||||||
| Increase in minority interests | 0 | 85 | 1,246 | 1,331 | ||||||||||||
| Dividends paid to/decrease in minority interests | 0 | 2,441 | (3,513 | ) | (1,072 | ) | ||||||||||
| Net activity in investments in subsidiaries | (8,410 | ) | 3,229 | 5,181 | 0 | |||||||||||
Net cash flow from/(used in) financing activities | 32,703 | 17,228 | (1,839 | ) | 48,092 | |||||||||||
| Effects of exchange rate differences | 406 | (1,871 | ) | (634 | ) | (2,099 | ) | |||||||||
Net increase/(decrease) in cash equivalents | 34,000 | 598 | 10,450 | 45,048 | ||||||||||||
| Cash and cash equivalents, beginning of the year | 68,548 | 13,531 | 8,963 | 91,042 | ||||||||||||
Cash and cash equivalents, end of the year | 102,548 | 14,129 | 19,413 | 136,090 | ||||||||||||
| Cash and cash equivalents comprise: | ||||||||||||||||
| Cash and balances with central banks | 2,660 | 78 | 757 | 3,495 | ||||||||||||
Money market paper2 | 73,431 | 11,488 | 2,225 | 87,144 | ||||||||||||
| Due from banks with original maturity of less than three months | 26,457 | 2,563 | 16,431 | 45,451 | ||||||||||||
Total | 102,548 | 14,129 | 19,413 | 136,090 | ||||||||||||
369
Table of Contents
Financial information
Notes to the consolidated financial statements
Note 41 Supplemental guarantor information required under SEC rules (continued)
Guarantee of other securities
UBS AG, acting through wholly-owned finance subsidiaries, issued the following trust preferred securities:
| USD billion, unless otherwise indicated | Outstanding on 31.12.08 | |||||||||||||||
| Issuing Entity | Type of security | Date issued | Interest (%) | Amount | ||||||||||||
| UBS Preferred Funding Trust I | Trust preferred securities | October 2000 | 8.622 | 1.5 | ||||||||||||
| UBS Preferred Funding Trust II | Trust preferred securities1 | June 2001 | 7.247 | 0.5 | ||||||||||||
| UBS Preferred Funding Trust IV | Floating rate noncumulative trust | one-month LIBOR | ||||||||||||||
| preferred securities | May 2003 | + 0.7% | 0.3 | |||||||||||||
| UBS Preferred Funding Trust V | Trust preferred securities | May 2006 | 6.243 | 1.0 | ||||||||||||
UBS AG has fully and unconditionally guaranteed these securities. UBS’s obligations under the trust preferred securities guarantee are subordinated to the prior payment in full of the deposit liabilities of UBS and all other liabilities of UBS. At
31 December 2008, the amount of senior liabilities of UBS to which the holders of the subordinated debt securities would be subordinated is approximately CHF 1,959 billion.
370
Table of Contents
Financial information |
Financial information
UBS AG (Parent Bank)
UBS AG (Parent Bank)
Parent Bank review
Income statement
The Parent Bank UBS AG net loss increased by CHF 32,238 million from a loss of CHF 4,251 million in the previous year to a loss of CHF 36,489 million.
| – | Depreciation increased from CHF 8,660 million in 2007 to CHF 26,900 million in 2008, mainly reflecting writedowns of investments in associated US companies. |
| – | Net trading income decreased from positive CHF 2,767 million in 2007 to negative CHF 9,466 million in 2008. This mainly reflects losses in the fixed-income business and the charges associated with the SNB transaction. |
Balance sheet
In 2008, UBS’s overall balance sheet reduction initiatives also led to lower Parent Bank total assets. In particular UBS subsidiaries in the Americas reduced their assets and therefore their funding needs from the Parent Bank. The Parent Bank total assets stood at CHF 1,189 billion on 31 December 2008, a drop of CHF 409 billion from CHF 1,598 billion on 31 December 2007.
er assets down CHF 5 billion. These declines, however, were partially offset by higher positive replacement values of CHF 78 billion and liquid assets of CHF 19 billion. Mortgage loans remained stable in 2008 at CHF 141 billion. The above mentioned write-downs of investments in associated US companies have been offset during the year by capital injections.
Interbank lending
During 2008, due from banks on time declined by CHF 40 billion, predominantly due to lower funding needs of UBS bank subsidiaries in the Americas. Due from banks on demand declined slightly by CHF 4 billion, as lower funding to bank subsidiaries in the European Region outweighed the increase to non-UBS related banks in the Americas and Japan. In addition, interbank collateral trading declined by CHF 127 billion, with roughly two thirds attributable to lower trading volumes with UBS subsidiaries, and one third due to reductions in trading volumes with third party clients.
Customer lending
The customer loan drop of CHF 55 billion was mainly the result of lower funding needs of UBS subsidiaries (non-banks), predominantly in the Americas region.
Financial investments
Compared with the previous year, the increase of CHF 10 billion is mainly due to the reclassification from Trading balances in securities to Financial investments in fourth quarter 2008.
371
Table of Contents
Financial information
UBS AG (Parent Bank)
Parent Bank financial statements
| Income statement | |||||||||||||
| For the year ended | % change from | ||||||||||||
| CHF million | 31.12.08 | 31.12.07 | 31.12.07 | ||||||||||
| Interest and discount income | 37,825 | 58,674 | (36 | ) | |||||||||
| Interest and dividend income from trading portfolio | 12,014 | 19,003 | (37 | ) | |||||||||
| Interest and dividend income from financial investments | 76 | 58 | 31 | ||||||||||
| Interest expense | (49,022 | ) | (75,179 | ) | (35 | ) | |||||||
| Net interest income | 893 | 2,556 | (65 | ) | |||||||||
| Credit-related fees and commissions | 208 | 205 | 1 | ||||||||||
| Fee and commission income from securities and investment business | 11,668 | 15,468 | (25 | ) | |||||||||
| Other fee and commission income | 610 | 686 | (11 | ) | |||||||||
| Fee and commission expense | (2,849 | ) | (3,269 | ) | (13 | ) | |||||||
| Net fee and commission income | 9,637 | 13,090 | (26 | ) | |||||||||
| Net trading income | (9,466 | ) | 2,767 | ||||||||||
| Net income from disposal of financial investments | 176 | 178 | (1 | ) | |||||||||
| Income from investments in associated companies | 3,763 | 2,592 | 45 | ||||||||||
| Income from real estate holdings | 29 | 27 | 7 | ||||||||||
| Sundry income from ordinary activities | 3,384 | 3,352 | 1 | ||||||||||
| Sundry ordinary expenses | (2,767 | ) | (3,223 | ) | (14 | ) | |||||||
| Other income from ordinary activities | 4,584 | 2,926 | 57 | ||||||||||
Operating income | 5,648 | 21,339 | (74 | ) | |||||||||
| Personnel expenses | 6,707 | 13,505 | (50 | ) | |||||||||
| General and administrative expenses | 5,822 | 5,191 | 12 | ||||||||||
Operating expenses | 12,528 | 18,696 | (33 | ) | |||||||||
Operating profit | (6,880 | ) | 2,643 | ||||||||||
| Depreciation and write-offs on investments in associated companies and fixed assets | 26,900 | 8,660 | 211 | ||||||||||
| Allowances, provisions and losses | 3,071 | 2,780 | 10 | ||||||||||
Profit before extraordinary items and taxes | (36,852 | ) | (8,797 | ) | (319 | ) | |||||||
| Extraordinary income | 1,002 | 4,665 | (79 | ) | |||||||||
| Extraordinary expenses | 482 | 4 | |||||||||||
| Tax expense | 157 | 115 | 37 | ||||||||||
Profit/(loss) for the period | (36,489 | ) | (4,251 | ) | (758 | ) | |||||||
372
Table of Contents
Financial information |
| Balance sheet | |||||||||||||
| % change from | |||||||||||||
| CHF million | 31.12.08 | 31.12.07 | 31.12.07 | ||||||||||
Assets | |||||||||||||
| Liquid assets | 27,030 | 8,530 | 217 | ||||||||||
| Money market paper | 62,777 | 60,266 | 4 | ||||||||||
| Due from banks | 355,679 | 527,081 | (33) | ||||||||||
| Due from customers | 191,308 | 274,510 | (30) | ||||||||||
| Mortgage loans | 141,328 | 141,381 | 0 | ||||||||||
| Trading balances in securities and precious metals | 158,741 | 412,977 | (62) | ||||||||||
| Financial investments | 11,085 | 1,685 | 558 | ||||||||||
| Investments in associated companies | 22,001 | 21,228 | 4 | ||||||||||
| Fixed assets | 5,032 | 5,273 | (5) | ||||||||||
| Accrued income and prepaid expenses | 3,877 | 7,221 | (46) | ||||||||||
| Positive replacement values | 201,801 | 124,244 | 62 | ||||||||||
| Other assets | 8,697 | 13,676 | (36) | ||||||||||
Total assets | 1,189,356 | 1,598,072 | (26) | ||||||||||
Total subordinated assets | 3,924 | 6,293 | (38) | ||||||||||
Total amounts receivable from Group companies | 435,721 | 602,667 | (28) | ||||||||||
Liabilities and equity | |||||||||||||
| Money market paper issued | 52,063 | 104,878 | (50) | ||||||||||
| Due to banks | 292,730 | 491,102 | (40) | ||||||||||
| Due to customers on savings and deposit accounts | 61,872 | 72,303 | (14) | ||||||||||
| Other amounts due to customers | 388,338 | 521,189 | (25) | ||||||||||
| Medium-term bonds | 3,150 | 3,228 | (2) | ||||||||||
| Bond issues and loans from central mortgage institutions | 143,589 | 189,023 | (24) | ||||||||||
| Accruals and deferred income | 7,895 | 17,368 | (55) | ||||||||||
| Negative replacement values | 193,108 | 145,445 | 33 | ||||||||||
| Other liabilities | 14,181 | 15,576 | (9) | ||||||||||
| Allowances and provisions | 2,724 | 3,970 | (31) | ||||||||||
| Share capital | 293 | 207 | 42 | ||||||||||
| General statutory reserve | 40,910 | 8,775 | 366 | ||||||||||
| Reserve for own shares | 2,877 | 9,441 | (70) | ||||||||||
| Other reserves | 22,115 | 19,818 | 12 | ||||||||||
| Profit/(loss) for the period | (36,489 | ) | (4,251 | ) | (758) | ||||||||
Total liabilities and equity | 1,189,356 | 1,598,072 | (26) | ||||||||||
Total subordinated liabilities | 24,427 | 21,114 | 16 | ||||||||||
Total amounts payable to Group companies | 271,434 | 330,567 | (18) | ||||||||||
Statement of appropriation of retained earnings
The Board of Directors proposes to the Annual General Meeting (AGM) on 15 April 2009 to approve the following appropriation:
| CHF million | ||||
| Profit/(Loss) for the financial year 2008 as per the Parent Bank’s Income Statement | (36,489 | ) | ||
| Appropriation to other reserves | (22,115 | ) | ||
| Appropriation to general statutory reserves: Retained earnings | (2,472 | ) | ||
| Appropriation to general statutory reserves: Share premium | (11,901 | ) | ||
373
Table of Contents
Financial information
UBS AG (Parent Bank)
Notes to the Parent Bank financial statements
Accounting Policies
The Parent Bank Financial Statements are prepared in accordance with Swiss Federal banking law. The accounting policies are principally the same as for the Group Financial Statements outlined in Note 1, Summary of Significant Accounting Policies. Major differences between the Swiss Federal banking law requirements and International Financial Reporting Standards (IFRS) are described in Note 40 to the financial statements. The accounting policies applied for the statutory accounts of the Parent Bank are discussed below. The risk management of UBS AG is described in the context of the risk management for UBS Group. For the statutory required risk assessment refer to the “Risk and treasury management” section of this report.
Treasury shares
Treasury shares are own equity instruments held by an entity. Under Swiss law, treasury shares are recognized in the balance sheet as trading balances. Short positions in treasury shares are recognized in Due to banks. Treasury shares recognized as trading balances and short positions in treasury shares are measured at fair value with unrealized gains or losses from remeasurement to fair value included in the income statement. Realized gains and losses on the sale or acquisition of treasury shares are recognized in the income statement.
Foreign currency translation
Assets and liabilities of foreign branches are translated into CHF at the spot exchange rate at the balance sheet date. Income and expense items are translated at weighted average exchange rates for the period. Gains resulting from exchange differences on the translation of each of these foreign branches are credited to a provision account (other liabilities). Losses resulting from exchange differences are debited, firstly, to the aforementioned provision account until such provision is fully utilized, and, secondly, to profit and loss.
Investments in associated companies
Investments in associated companies are equity interests which are held for the purpose of the Parent Bank’s business activities or for strategic reasons. They include all directly held subsidiaries and are carried at cost less impairment, if applicable.
Deferred taxes
Deferred tax assets are not recognized in the Parent Bank Financial Statements. Deferred tax liabilities are recognized for all taxable temporary differences. The change in the deferred tax liability is recognized in profit or loss.
Equity participation and other compensation plans
Equity participation plans
Under Swiss law, employee share awards are recognized as compensation expense and accrued over the performance year, which is generally the period prior to the grant date. Employee option awards which do not contain voluntary termination non-compete provisions are recognized as compensation expense on the grant date. If the award is performance based and contains substantive future service/vesting period, compensation expense is recognized over the performance period. Employee option awards which contain voluntary termination non-compete provisions (i.e. good leaver clause) are recognized as compensation expense over the performance year. Equity- and cash-settled awards are classified as liabilities. The employee share option awards are remeasured to fair value at each balance sheet date. However, for employee share options that UBS intends to settle in shares from conditional capital, there is no impact on the income statement and no liability is recognized. Upon exercise of employee options, cash received for payment of the strike price is credited against share capital and general statutory reserve.
Other compensation plans
Fixed and variable deferred cash compensation is recognized as compensation expense over the performance year. If the award is performance based and contains substantive future service/vesting period, compensation expense is recognized over the performance period.
374
Table of Contents
Financial information |
Changes in accounting policies, comparability and other adjustments
Equity participation plans
Post-employment benefits
In 2008, UBS concluded that it meets the requirements to recognize a defined benefit asset associated with its Swiss pension plan consistent with the consolidated financial statements. The change in accounting policy resulted in the following effects on the balance sheet and income statement for 31 December 2008: an increase of approximately CHF 2.1 billion in Other assets and a corresponding decrease in Personnel expenses.
Reclassification of trading securities
UBS decided at the end of October to reclassify securities from “trading balances in securities and precious metals” to “financial investments” with effect from 1 October 2008. The securities have been reclassified on the basis of their fair value on the reclassification date and are now accounted for on an amortized cost basis. An impairment charge of CHF 0.3 billion was recognized on the reclassified financial instruments. If the reclassification had not occurred, the impairment charge would not have been recognized but a trading loss of CHF 1.9 billion would have been recorded.
375
Table of Contents
Financial information
UBS AG (Parent Bank)
Additional income statement information
| Net trading income | |||||||||||||
| For the year ended | % change from | ||||||||||||
| CHF million | 31.12.08 | 31.12.07 | 31.12.07 | ||||||||||
| Equities | 3,930 | 7,867 | (50 | ) | |||||||||
| Fixed income | (15,505 | ) | (7,679 | ) | (102 | ) | |||||||
Foreign exchange and other1 | 2,109 | 2,579 | (18 | ) | |||||||||
| Total | (9,466 | ) | 2,767 | ||||||||||
Extraordinary income and expenses
Extraordinary income includes a gain from the sale of the Bank of China investment of approximately CHF 360 million in 2008, whereas 2007 included a gain on the sale of UBS’s 20.7% stake in Julius Baer of CHF 3,180 million. Further, 2008 includes a release of provisions of CHF 72 million, a release on reserves on investments in subsidiaries of CHF 490 million and a writeup of investments in associated com-
panies of CHF 30 million (2007: CHF 409 million). Amounts in 2007 include a release on reserves on own properties of CHF 824 million and for lapsed employee options of CHF 165 million.
376
Table of Contents
Financial information |
Additional balance sheet information
| Allowances and provisions | |||||||||||||||||||||||||||||
| Provisions | Recoveries, | ||||||||||||||||||||||||||||
| applied in | doubtful interest, | New | |||||||||||||||||||||||||||
| accordance | currency | Provisions | provisions | ||||||||||||||||||||||||||
| Balance at | with their | translation | released to | charged to | Balance at | ||||||||||||||||||||||||
| CHF million | 31.12.07 | specified purpose | Reclassifications | differences | income | income | 31.12.08 | ||||||||||||||||||||||
| Default risks (credit and country risk) | 1,036 | (481 | ) | 3 | (506 | ) | 1,504 | 1,556 | |||||||||||||||||||||
Trading portfolio risks1 | 4,554 | 10,304 | 14,858 | ||||||||||||||||||||||||||
Litigation risks2 | 158 | (457 | ) | (47 | ) | (3 | ) | (33 | ) | 1,460 | 1,078 | ||||||||||||||||||
| Operational risks | 164 | (203 | ) | 187 | (280 | ) | 289 | 157 | |||||||||||||||||||||
| Retirement benefit plans | 107 | (2 | ) | (49 | ) | (14 | ) | 52 | 94 | ||||||||||||||||||||
| Deferred taxes | 31 | 2 | 3 | 36 | |||||||||||||||||||||||||
Other3 | 3,446 | (2,672 | ) | (68 | ) | (244 | ) | 871 | 1,333 | ||||||||||||||||||||
Total allowances and provisions | 9,496 | (3,815 | ) | (47 | ) | 72 | (1,077 | ) | 14,483 | 19,112 | |||||||||||||||||||
| Allowances deducted from assets | 5,526 | 16,388 | |||||||||||||||||||||||||||
Total provisions as per balance sheet | 3,970 | 2,724 | |||||||||||||||||||||||||||
| Statement of shareholders’ equity | |||||||||||||||||||||||||
| Total | |||||||||||||||||||||||||
| shareholders' | |||||||||||||||||||||||||
| General statutory | General statutory | equity (before | |||||||||||||||||||||||
| reserves: | reserves: | Reserves for own | Other | distribution | |||||||||||||||||||||
| CHF million | Share capital | Share premium | Retained earnings | shares | reserves | of profit) | |||||||||||||||||||
As of 31.12.06 and 1.1.07 | 211 | 6,280 | 2,015 | 9,114 | 27,288 | 44,908 | |||||||||||||||||||
| Cancellation of own shares | (4 | ) | (2,411 | ) | (2,415 | ) | |||||||||||||||||||
| Capital increase | 23 | 23 | |||||||||||||||||||||||
| Increase in reserves | 457 | (457 | ) | ||||||||||||||||||||||
| Prior year dividend | (4,275 | ) | (4,275 | ) | |||||||||||||||||||||
| Profit / (loss) for the period | (4,251 | ) | (4,251 | ) | |||||||||||||||||||||
| Changes in reserves for own shares | 327 | (327 | ) | ||||||||||||||||||||||
As of 31.12.07 and 1.1.08 | 207 | 6,303 | 2,472 | 9,441 | 15,567 | 33,990 | |||||||||||||||||||
| Cancellation of own shares | |||||||||||||||||||||||||
Capital increase1 | 86 | 15,911 | (15 | ) | 15,982 | ||||||||||||||||||||
| Capital increase related to MCNs | 16,223 | 16,223 | |||||||||||||||||||||||
| Increase in reserves | 0 | ||||||||||||||||||||||||
| Prior year dividend | 0 | ||||||||||||||||||||||||
| Profit / (loss) for the period | (36,489 | ) | (36,489 | ) | |||||||||||||||||||||
| Changes in reserves for own shares | (6,564 | ) | 6,564 | 0 | |||||||||||||||||||||
Transfers2 | (11,901 | ) | (2,472 | ) | 14,373 | 0 | |||||||||||||||||||
As of 31.12.08 | 293 | 26,536 | 0 | 2,877 | 0 | 29,706 | |||||||||||||||||||
377
Table of Contents
Financial information
UBS AG (Parent Bank)
| Share capital | |||||||||||||||||
| Par value | Ranking for dividends | ||||||||||||||||
| No. of shares | Capital in CHF | No. of shares | Capital in CHF | ||||||||||||||
As of 31.12.08 | |||||||||||||||||
| Issued and paid up | 2,932,580,549 | 293,258,055 | 2,932,580,549 | 293,258,055 | |||||||||||||
| Conditional share capital | 792,844,711 | 79,284,471 | |||||||||||||||
As of 31.12.07 | |||||||||||||||||
| Issued and paid up | 2,073,547,344 | 207,354,734 | 2,073,547,344 | 207,354,734 | |||||||||||||
| Conditional share capital | 150,138,634 | 15,013,863 | |||||||||||||||
On 31 December 2008, a maximum of 100,415 shares can be issued against the future exercise of options from former PaineWebber employee option plans. These shares are shown as conditional share capital in the UBS AG (Parent Bank) disclosure.
378
Table of Contents
Financial information |
Off-balance sheet and other information
| Assets pledged or assigned as security for own obligations and assets subject to reservation of title | |||||||||||||||||||||||||
| 31.12.08 | 31.12.07 | Change in % | |||||||||||||||||||||||
| CHF million | Book value | Effective liability | Book value | Effective liability | Book value | Effective liability | |||||||||||||||||||
| Money market paper | 7,429 | 1,300 | 12,792 | 2,372 | (42 | ) | (45 | ) | |||||||||||||||||
| Mortgage loans | 3,699 | 2,418 | 200 | 199 | |||||||||||||||||||||
| Securities | 50,223 | 37,083 | 99,821 | 49,397 | (50 | ) | (25 | ) | |||||||||||||||||
| Other | 8,149 | 0 | 8,628 | (6 | ) | ||||||||||||||||||||
Total | 69,500 | 40,801 | 121,441 | 51,968 | (43 | ) | (21 | ) | |||||||||||||||||
Financial assets are mainly pledged in securities borrowing and lending transactions, in repurchase and reverse repurchase transactions, under collateralized credit lines with central
banks, against loans from mortgage institutions, in connection with derivative transactions and for security deposits relating to stock exchange and clearinghouse memberships.
| Commitments and contingent liabilities | |||||||||||||
| % change from | |||||||||||||
| CHF million | 31.12.08 | 31.12.07 | 31.12.07 | ||||||||||
| Contingent liabilities | 286,451 | 223,105 | 28 | ||||||||||
| Irrevocable commitments | 68,660 | 104,784 | (34 | ) | |||||||||
| Liabilities for calls on shares and other equities | 145 | 145 | 0 | ||||||||||
| Confirmed credits | 2,079 | 2,630 | (21 | ) | |||||||||
UBS AG is jointly and severally liable for the value added tax (VAT) liability of Swiss subsidiaries that belong to its VAT group.
payment of the par value of these shares, if the SNB incurs a loss on its loan provided to the SNB StabFund upon termination of this fund. If UBS would be required to deliver those shares, UBS intends to settle this obligation using conditional capital (subject to shareholders’ approval).
| Derivative instruments | |||||||||||||||||||||||||
| 31.12.08 | 31.12.07 | ||||||||||||||||||||||||
| Notional | Notional | ||||||||||||||||||||||||
| amount | amount | ||||||||||||||||||||||||
| CHF million | PRV1 | NRV2 | CHF bn | PRV1 | NRV2 | CHF bn | |||||||||||||||||||
| Interest rate contracts | 377,307 | 370,346 | 36,476 | 167,334 | 164,325 | 33,545 | |||||||||||||||||||
| Credit derivative contracts | 202,357 | 187,216 | 3,712 | 111,898 | 116,128 | 5,451 | |||||||||||||||||||
| Foreign exchange contracts | 222,178 | 229,656 | 6,005 | 99,494 | 99,613 | 7,725 | |||||||||||||||||||
| Precious metal contracts | 5,804 | 5,697 | 108 | 6,363 | 6,569 | 147 | |||||||||||||||||||
| Equity / Index contracts | 28,502 | 36,208 | 473 | 30,400 | 49,985 | 760 | |||||||||||||||||||
| Commodities contracts, excluding precious metals contracts | 27,055 | 25,387 | 160 | 21,181 | 21,251 | 484 | |||||||||||||||||||
| Total derivative instruments | 863,203 | 854,510 | 46,934 | 436,670 | 457,871 | 48,112 | |||||||||||||||||||
| Replacement value netting | 661,402 | 661,402 | 312,426 | 312,426 | |||||||||||||||||||||
| Replacement values after netting | 201,801 | 193,108 | 124,244 | 145,445 | |||||||||||||||||||||
379
Table of Contents
Financial information
UBS AG (Parent Bank)
| Fiduciary transactions | |||||||||||||
| % change from | |||||||||||||
| CHF million | 31.12.08 | 31.12.07 | 31.12.07 | ||||||||||
| Deposits: | |||||||||||||
| with other banks | 36,452 | 46,074 | (21 | ) | |||||||||
| with group banks | 2,738 | 2,186 | 25 | ||||||||||
Total | 39,190 | 48,260 | (19 | ) | |||||||||
| Due to UBS pension plans | ||||||||||||
| For the year ended | % change from | |||||||||||
| CHF million | 31.12.08 | 31.12.07 | 31.12.07 | |||||||||
| Due to UBS pension plans and UBS debt instruments held by pension plans | 876 | 443 | 98 | |||||||||
| Securities borrowed from pension plans | 0 | 9,379 | (100 | ) | ||||||||
Personnel
Parent Bank personnel was 40,998 on 31 December 2008 and 45,102 on 31 December 2007.
Significant shareholders
Chase Nominees Ltd., London, acting in its capacity as a nominee for other investors, was registered with 7.19% of all shares issued on 31 December 2008, compared with 7.99% at year-end 2007 and 8.81% at year-end 2006. DTC (Cede & Co.), New York, The Depository Trust Company,
a US securities clearing organization, was registered as a shareholder for a large number of beneficial owners with 9.89% of all shares issued on 31 December 2008 (14.15% on 31 December 2007).
380
Table of Contents
Financial information |
Corporate governance and compensation report
| Compensation details and additional information for executive members of the BoD | ||||||||||||||||||||||||||||||||
| CHF, except where indicateda | ||||||||||||||||||||||||||||||||
| Annual incentive | Discretionary | Contributions | ||||||||||||||||||||||||||||||
| For the | Annual incentive | award (shares | award (options | Benefits | to retirement | |||||||||||||||||||||||||||
| Name, function1 | year ended | Base salary | award (cash) | – fair value)b | – fair value)c | in kindd | benefits planse | Total | ||||||||||||||||||||||||
| Peter Kurer, Chairman | 2008 | 1,333,333 | 0 | 0 | 0 | 58,267 | 174,047 | 1,565,647 | ||||||||||||||||||||||||
| 2007 | ||||||||||||||||||||||||||||||||
| Marcel Ospel, Chairman | 2008 | 666,667 | 0 | 0 | 0 | 80,755 | 87,023 | 834,445 | ||||||||||||||||||||||||
| 2007 | 2,000,000 | 0 | 0 | 0 | 307,310 | 261,069 | 2,568,379 | |||||||||||||||||||||||||
| Stephan Haeringer, | 2008 | 1,125,000 | 0 | 0 | 0 | 108,846 | 195,802 | 1,429,648 | ||||||||||||||||||||||||
| Executive Vice Chairman | 2007 | 1,500,000 | 0 | 0 | 0 | 111,808 | 261,069 | 1,872,877 | ||||||||||||||||||||||||
| Marco Suter, | 2008 | |||||||||||||||||||||||||||||||
| Executive Vice Chairman | 2007 | 1,125,000 | 0 | 0 | 0 | 70,820 | 155,252 | 1,351,072 | ||||||||||||||||||||||||
Explanations of compensation details for executive members of the BoD and members of the GEB:
| a. | Local currencies are converted into CHF using the exchange rates as detailed in “Note 39 Currency translation rates” in the financial statements of this report. | |
| b. | Values per share at grant: CHF 36.15 / USD 33.55 for shares granted in 2008 related to the performance year 2007. CHF prices are the average price of UBS shares at SWX Europe over the last 10 trading days of February, and USD prices are the average price of UBS shares at the NYSE over the last 10 trading days of February in the year in which they are granted. | |
| c. | No options were granted in 2009 for the performance year 2008. | |
| d. | Benefits in kind – car leasing, company car allowance, staff discount on banking products and services, health and welfare benefits and general expense allowances – are all valued at market price. | |
| e. | Swiss senior executives participate in the same pension plan as all other employees. Under this plan, employees receive a company contribution to the plan which covers compensation up to CHF 820,800. The retirement benefits consist of a pension, a bridging pension and a one-off payout of accumulated capital. Employees must also contribute to the plan. This figure excludes the mandatory employer’s social security contributions (AHV, ALV) but includes the portion attributed to the employer’s portion of the legal BVG requirement. The employee contribution is included in the base salary and annual incentive award components. |
| In both the US and the UK, senior executives participate in the same plans as all other employees. In the US there are two different plans, one of which operates on a cash balance basis, which entitles the participant to receive a company contribution based on compensation limited to USD 250,000. This plan is no longer available to new hires. US senior executives may also participate in the UBS 401K-defined contribution plan (open to all employees), which provides a company matching contribution for employee contributions. In the UK, senior executives participate in either the principal pension plan, which is limited to an earnings cap of GBP 100,000, or a grandfathered defined benefit plan which provides a pension on retirement based on career average base salary (uncapped). |
381
Table of Contents
Financial information
UBS AG (Parent Bank)
| Remuneration details and additional information for independent members of the BoD | |||||||||||||||||||||||||||||||||||||||||||||||||||||||||
| CHF, except where indicateda | |||||||||||||||||||||||||||||||||||||||||||||||||||||||||
| For the | |||||||||||||||||||||||||||||||||||||||||||||||||||||||||
| HR & | Governance & | Corporate | period | Share | |||||||||||||||||||||||||||||||||||||||||||||||||||||
| Audit | compensation | nominating | responsibility | Risk | Strategy | AGM to | Committee | Benefits | Additional | percent- | Number of | ||||||||||||||||||||||||||||||||||||||||||||||
| Name, function1 | committee | committee | committee | committee | committee | committee | AGM | Base fee | retainer(s) | in kind | payments | Total | age3 | shares4,5 | |||||||||||||||||||||||||||||||||||||||||||
| Ernesto Bertarelli, | M | M | 2008/2009 | 325,000 | 200,000 | 0 | 0 | 525,000 | 100 | 51,596 | |||||||||||||||||||||||||||||||||||||||||||||||
| member | M | 2007/2008 | 325,000 | 150,000 | 0 | 0 | 475,000 | 100 | 14,677 | ||||||||||||||||||||||||||||||||||||||||||||||||
| Sally Bott, | M | M | 2008/2009 | 162,500 | 75,000 | 0 | 0 | 237,500 | 50 | 12,280 | |||||||||||||||||||||||||||||||||||||||||||||||
member2 | 2007/2008 | ||||||||||||||||||||||||||||||||||||||||||||||||||||||||
| Rainer-Marc Frey, | M | M | 2008/2009 | 162,500 | 150,000 | 0 | 0 | 312,500 | 50 | 16,158 | |||||||||||||||||||||||||||||||||||||||||||||||
member2 | 2007/2008 | ||||||||||||||||||||||||||||||||||||||||||||||||||||||||
| Bruno Gehrig, | M | 2008/2009 | 162,500 | 100,000 | 0 | 0 | 262,500 | 50 | 13,572 | ||||||||||||||||||||||||||||||||||||||||||||||||
member2 | 2007/2008 | ||||||||||||||||||||||||||||||||||||||||||||||||||||||||
| Gabrielle Kaufmann- | C | M | 2008/2009 | 325,000 | 250,000 | 0 | 0 | 575,000 | 50 | 29,731 | |||||||||||||||||||||||||||||||||||||||||||||||
| Kohler, member | M | M | 2007/2008 | 325,000 | 250,000 | 0 | 0 | 575,000 | 50 | 9,349 | |||||||||||||||||||||||||||||||||||||||||||||||
| Sergio Marchionne, | M | M | 2008/2009 | 325,000 | 200,000 | 0 | 250,000 | 6 | 775,000 | 100 | 76,228 | ||||||||||||||||||||||||||||||||||||||||||||||
| senior independent director, vice chairman | M | 2007/2008 | 325,000 | 200,000 | 0 | 0 | 525,000 | 100 | 16,226 | ||||||||||||||||||||||||||||||||||||||||||||||||
| Rolf A. Meyer, | M | M | 2008/2009 | 162,500 | 150,000 | 0 | 0 | 312,500 | 50 | 16,158 | |||||||||||||||||||||||||||||||||||||||||||||||
member2 | M | C | 2007/2008 | 325,000 | 650,000 | 0 | 0 | 975,000 | 50 | 15,853 | |||||||||||||||||||||||||||||||||||||||||||||||
| Helmut Panke, | M | M | 2008/2009 | 325,000 | 300,000 | 0 | 0 | 625,000 | 50 | 32,316 | |||||||||||||||||||||||||||||||||||||||||||||||
| member | C | 2007/2008 | 325,000 | 250,000 | 0 | 0 | 575,000 | 50 | 9,349 | ||||||||||||||||||||||||||||||||||||||||||||||||
| William G. Parrett, | M | 2008/2009 | 162,500 | 100,000 | 0 | 0 | 262,500 | 50 | 13,572 | ||||||||||||||||||||||||||||||||||||||||||||||||
member2 | 2007/2008 | ||||||||||||||||||||||||||||||||||||||||||||||||||||||||
| David Sidwell, | M | C | 2008/2009 | 325,000 | 450,000 | 0 | 0 | 775,000 | 50 | 40,072 | |||||||||||||||||||||||||||||||||||||||||||||||
| member | 2007/2008 | ||||||||||||||||||||||||||||||||||||||||||||||||||||||||
| Peter Spuhler, | 2008/2009 | 162,500 | 0 | 0 | 0 | 162,500 | 100 | 15,945 | |||||||||||||||||||||||||||||||||||||||||||||||||
member2 | M | 2007/2008 | 325,000 | 200,000 | 0 | 0 | 525,000 | 100 | 16,226 | ||||||||||||||||||||||||||||||||||||||||||||||||
| Peter R. Voser, | C | M | 2008/2009 | 325,000 | 400,000 | 0 | 0 | 725,000 | 50 | 37,487 | |||||||||||||||||||||||||||||||||||||||||||||||
| member | M | 2007/2008 | 325,000 | 300,000 | 0 | 0 | 625,000 | 50 | 10,162 | ||||||||||||||||||||||||||||||||||||||||||||||||
| Lawrence A. Weinbach, | M | 2008/2009 | 162,500 | 100,000 | 0 | 0 | 262,500 | 50 | 13,572 | ||||||||||||||||||||||||||||||||||||||||||||||||
member2 | C | 2007/2008 | 325,000 | 600,000 | 0 | 0 | 925,000 | 50 | 15,040 | ||||||||||||||||||||||||||||||||||||||||||||||||
| Joerg Wolle, | C | M | 2008/2009 | 325,000 | 300,000 | 0 | 0 | 625,000 | 50 | 32,316 | |||||||||||||||||||||||||||||||||||||||||||||||
| member | M | 2007/2008 | 325,000 | 150,000 | 0 | 0 | 475,000 | 100 | 14,677 | ||||||||||||||||||||||||||||||||||||||||||||||||
Total 2008 | 6,437,500 | ||||||||||||||||||||||||||||||||||||||||||||||||||||||||
| Total 2007 | 5,675,000 | ||||||||||||||||||||||||||||||||||||||||||||||||||||||||
In addition, one-off cash payments were made to the chair of the risk committee (CHF 500,000), the governance and nominating committee (CHF 300,000) and the human resources and compensation committee (CHF 200,000). These payments reflect the substantial workload of setting up the new risk committee, and expanding the mandate of the governance and nominating committee and the human resources and compensation committee.
382
Table of Contents
Financial information |
Total payments to all members of the BoD | ||||||||
| For the | ||||||||
| CHF, except where indicateda | year ended | Total | ||||||
| Aggregate of all members of the BoD | 2008 | 10,267,240 | ||||||
| Aggregate of all members of the BoD | 2007 | 11,467,328 | ||||||
| Total compensation for all members of the GEB | ||||||||||||||||||||||||||||||||
| CHF, except where indicateda | ||||||||||||||||||||||||||||||||
| Annual | ||||||||||||||||||||||||||||||||
| incentive | Discretionary | Contributions | ||||||||||||||||||||||||||||||
| Annual | award | award | to retirement | |||||||||||||||||||||||||||||
| For the | incentive | (shares; | (options; | Benefits | benefits | |||||||||||||||||||||||||||
| Name, function | year ended | Base salary | award (cash) | fair value)b | fair value)c | in kindd | planse | Total | ||||||||||||||||||||||||
| Marcel Rohner, Group Chief Executive Officer (highest-paid) | 2008 | 1,500,000 | 0 | 0 | 0 | 161,768 | 152,934 | 1,814,702 | ||||||||||||||||||||||||
| Rory Tapner, Chairman & CEO Asia Pacific (highest-paid) | 2007 | 1,291,960 | 4,501,900 | 4,501,904 | 0 | 10,256 | 900 | 10,306,920 | ||||||||||||||||||||||||
Aggregate of all members of the GEB who were in office on 31 December 20081 | 2008 | 7,815,943 | 0 | 0 | 0 | 457,652 | 817,315 | 9,090,911 | ||||||||||||||||||||||||
Aggregate of all members of the GEB who were in office on 31 December 20071 | 2007 | 6,995,885 | 15,305,667 | 15,305,708 | 0 | 532,706 | 912,974 | 39,052,939 | ||||||||||||||||||||||||
Aggregate of all members of the GEB who stepped down during 20082 | 2008 | 1,614,871 | 0 | 0 | 0 | 234,838 | 258,423 | 2,108,132 | ||||||||||||||||||||||||
Aggregate of all members of the GEB who stepped down during 20072 | 2007 | 2,511,947 | 23,042,376 | 6,750,036 | 0 | 406,567 | 275,635 | 32,986,561 | ||||||||||||||||||||||||
383
Table of Contents
Financial information
UBS AG (Parent Bank)
Share and option ownership of members of the BoD at 31 December 2007/2008 | ||||||||||||||||||||||||||
| For the | Number of | Voting rights | Number of | Potentially conferred | Type and quantity | |||||||||||||||||||||
| Name, function1 | year ended | shares held | in % | options held | voting rights in %2 | options3 | ||||||||||||||||||||
| Peter Kurer, Chairman | 2008 | 416,088 | 0.025 | 372,995 | 0.022 | xxx: | 85 256 | |||||||||||||||||||
| xxxv: | 95 913 | |||||||||||||||||||||||||
| xli: | 95 913 | |||||||||||||||||||||||||
| xlv: | 95 913 | |||||||||||||||||||||||||
| 2007 | 292,762 | 0.026 | 350,000 | 0.031 | xxx: | 80 000 | ||||||||||||||||||||
| xxxv: | 90 000 | |||||||||||||||||||||||||
| xli: | 90 000 | |||||||||||||||||||||||||
| xlv: | 90 000 | |||||||||||||||||||||||||
| Sergio Marchionne, | 2008 | 87,926 | 0.005 | 0 | 0.000 | |||||||||||||||||||||
| senior independent director, vice chairman | 2007 | 45,800 | 0.004 | 0 | 0.000 | |||||||||||||||||||||
| Ernesto Bertarelli, member | 2008 | 89,434 | 0.005 | 0 | 0.000 | |||||||||||||||||||||
| 2007 | 48,411 | 0.004 | 0 | 0.000 | ||||||||||||||||||||||
| Sally Bott, member | 2008 | 1 | 0.000 | 0 | 0.000 | |||||||||||||||||||||
| 2007 | ||||||||||||||||||||||||||
| Rainer-Marc Frey, member | 2008 | 0 | 0.000 | 0 | 0.000 | |||||||||||||||||||||
| 2007 | ||||||||||||||||||||||||||
| Bruno Gehrig, member | 2008 | 3,000 | 0.000 | 0 | 0.000 | |||||||||||||||||||||
| 2007 | ||||||||||||||||||||||||||
| Gabrielle Kaufmann-Kohler, member | 2008 | 18,713 | 0.001 | 0 | 0.000 | |||||||||||||||||||||
| 2007 | 3,303 | 0.000 | 0 | 0.000 | ||||||||||||||||||||||
| Helmut Panke, member | 2008 | 31,971 | 0.002 | 0 | 0.000 | |||||||||||||||||||||
| 2007 | 13,206 | 0.001 | 0 | 0.000 | ||||||||||||||||||||||
| William G. Parrett, member | 2008 | 4,000 | 0.000 | 0 | 0.000 | |||||||||||||||||||||
| 2007 | ||||||||||||||||||||||||||
| David Sidwell, member | 2008 | 1 | 0.000 | 0 | 0.000 | |||||||||||||||||||||
| 2007 | ||||||||||||||||||||||||||
| Peter R. Voser, member | 2008 | 30,823 | 0.002 | 0 | 0.000 | |||||||||||||||||||||
| 2007 | 11,580 | 0.001 | 0 | 0.000 | ||||||||||||||||||||||
| Joerg Wolle, member | 2008 | 41,509 | 0.002 | 0 | 0.000 | |||||||||||||||||||||
| 2007 | 7,709 | 0.001 | 0 | 0.000 | ||||||||||||||||||||||
384
Table of Contents
Financial information |
Compensation paid to former members of the BoD and GEB1 | ||||||||||||||||
| CHF, except where indicateda | ||||||||||||||||
| For the | Benefits in | |||||||||||||||
| Name, function | year ended | Compensation | kind | Total | ||||||||||||
| Georges Blum, former member of the BoD | 2008 | 101,579 | 101,579 | |||||||||||||
| (Swiss Bank Corporation) | 2007 | 90,803 | 90,803 | |||||||||||||
| Franz Galliker, former member of the BoD | 2008 | 69,596 | 69,596 | |||||||||||||
| (Swiss Bank Corporation) | 2007 | 62,174 | 62,174 | |||||||||||||
| Walter G. Frehner, former member of the BoD | 2008 | 74,663 | 74,663 | |||||||||||||
| (Swiss Bank Corporation) | 2007 | 73,061 | 73,061 | |||||||||||||
| Hans (Liliane) Strasser, former member of the BoD | 2008 | 32,673 | 32,673 | |||||||||||||
| (Swiss Bank Corporation) | 2007 | 42,311 | 42,311 | |||||||||||||
| Robert Studer, former member of the BoD | 2008 | 126,208 | 126,208 | |||||||||||||
| (Union Bank of Switzerland) | 2007 | 260,162 | 260,162 | |||||||||||||
| Alberto Togni, former member of the BoD | 2008 | 318,461 | 427,949 | 746,410 | ||||||||||||
| (UBS) | 2007 | 318,401 | 502,478 | 820,879 | ||||||||||||
| Philippe de Weck, former member of the BoD | 2008 | 109,703 | 109,703 | |||||||||||||
| (Union Bank of Switzerland) | 2007 | 129,701 | 129,701 | |||||||||||||
Aggregate of all former members of the GEB2 | 2008 | 0 | 171,180 | 171,180 | ||||||||||||
| 2007 | 0 | 257,791 | 257,791 | |||||||||||||
| Aggregate of all former members of the BoD and GEB | 2008 | 318,461 | 1,113,551 | 1,432,012 | ||||||||||||
| 2007 | 318,401 | 1,418,481 | 1,736,882 | |||||||||||||
385
Table of Contents
Financial information
UBS AG (Parent Bank)
Share and option ownership of members of the GEB at 31 December 2007/2008 | ||||||||||||||||||||||||||
| For the | Number of | Voting rights | Number of | Potentially conferred | Type and quantity | |||||||||||||||||||||
| Name, function1 | year ended | shares held | in % | options held | voting rights in %2 | of options3 | ||||||||||||||||||||
| Marcel Rohner, | 2008 | 711,366 | 0.042 | 1,055,043 | 0.063 | xxv: | 31,971 | |||||||||||||||||||
| Group Chief Executive Officer | xxx: | 213,140 | ||||||||||||||||||||||||
| xxxv: | 277,082 | |||||||||||||||||||||||||
| xli: | 319,710 | |||||||||||||||||||||||||
| xlv: | 213,140 | |||||||||||||||||||||||||
| 2007 | 501,846 | 0.044 | 990,000 | 0.088 | xxv: | 30,000 | ||||||||||||||||||||
| xxx: | 200,000 | |||||||||||||||||||||||||
| xxxv: | 260,000 | |||||||||||||||||||||||||
| xli: | 300,000 | |||||||||||||||||||||||||
| xlv: | 200,000 | |||||||||||||||||||||||||
| John Cryan, | 2008 | 235,929 | 0.014 | 382,673 | 0.023 | v: | 21,362 | |||||||||||||||||||
| Group Chief Financial Officer | vi: | 20,731 | ||||||||||||||||||||||||
| vii: | 20,725 | |||||||||||||||||||||||||
| xii: | 5,454 | |||||||||||||||||||||||||
| xiii: | 5,294 | |||||||||||||||||||||||||
| xiv: | 5,292 | |||||||||||||||||||||||||
| xvii: | 23,626 | |||||||||||||||||||||||||
| xviii: | 23,620 | |||||||||||||||||||||||||
| xix: | 23,612 | |||||||||||||||||||||||||
| xxi: | 5,526 | |||||||||||||||||||||||||
| xxii: | 5,524 | |||||||||||||||||||||||||
| xxiii: | 5,524 | |||||||||||||||||||||||||
| xxvii: | 17,072 | |||||||||||||||||||||||||
| xxviii: | 17,068 | |||||||||||||||||||||||||
| xxix: | 17,063 | |||||||||||||||||||||||||
| �� | xxxii: | 14,210 | ||||||||||||||||||||||||
| xxxiii: | 14,210 | |||||||||||||||||||||||||
| xxxiv: | 14,207 | |||||||||||||||||||||||||
| xxxviii: | 5,330 | |||||||||||||||||||||||||
| xxxix: | 5,328 | |||||||||||||||||||||||||
| xl: | 5,326 | |||||||||||||||||||||||||
| xlii: | 17,762 | |||||||||||||||||||||||||
| xliii: | 17,762 | |||||||||||||||||||||||||
| xliv: | 17,760 | |||||||||||||||||||||||||
| xlvi: | 53,285 | |||||||||||||||||||||||||
| 2007 | ||||||||||||||||||||||||||
| Markus U. Diethelm, | 2008 | 112,245 | 0.007 | 0 | 0.000 | 0 | ||||||||||||||||||||
| Group General Counsel | 2007 | |||||||||||||||||||||||||
| John A. Fraser, | 2008 | 583,812 | 0.035 | 1,144,808 | 0.068 | i: | 56,013 | |||||||||||||||||||
| Chairman and CEO | viii: | 76,380 | ||||||||||||||||||||||||
| Global Asset Management | xv: | 127,884 | ||||||||||||||||||||||||
| xx: | 127,884 | |||||||||||||||||||||||||
| xxxi: | 170,512 | |||||||||||||||||||||||||
| xxxvi: | 202,483 | |||||||||||||||||||||||||
| xli: | 213,140 | |||||||||||||||||||||||||
| xlv: | 170,512 | |||||||||||||||||||||||||
| 2007 | 461,764 | 0.041 | 1,074,232 | 0.095 | i: | 52,560 | ||||||||||||||||||||
| viii: | 71,672 | |||||||||||||||||||||||||
| xv: | 120,000 | |||||||||||||||||||||||||
| xx: | 120,000 | |||||||||||||||||||||||||
| xxxi: | 160,000 | |||||||||||||||||||||||||
| xxxvi: | 190,000 | |||||||||||||||||||||||||
| xli: | 200,000 | |||||||||||||||||||||||||
| xlv: | 160,000 | |||||||||||||||||||||||||
| Marten Hoekstra, | 2008 | 245,397 | 0.015 | 684,168 | 0.041 | ii: | 8,679 | |||||||||||||||||||
| Deputy CEO Global Wealth | iii: | 8,421 | ||||||||||||||||||||||||
| Management & Business Banking | iv: | 8,421 | ||||||||||||||||||||||||
| and Head Wealth Management US | ix: | 8,823 | ||||||||||||||||||||||||
| x: | 12,825 | |||||||||||||||||||||||||
| xi: | 8,561 | |||||||||||||||||||||||||
| xxvi: | 42,628 | |||||||||||||||||||||||||
| xxxi: | 53,285 | |||||||||||||||||||||||||
| xxxvi: | 53,285 | |||||||||||||||||||||||||
| xli: | 85,256 | |||||||||||||||||||||||||
| xlv: | 154,931 | |||||||||||||||||||||||||
| xlvii: | 239,053 | |||||||||||||||||||||||||
| 2007 | ||||||||||||||||||||||||||
| Jerker Johansson, | 2008 | 521,544 | 0.031 | 753,410 | 0.045 | xlviii: | 745,990 | |||||||||||||||||||
| Chairman and CEO Investment Bank | xlix: | 7,420 | ||||||||||||||||||||||||
| 2007 | ||||||||||||||||||||||||||
386
Table of Contents
Financial information |
Share and option ownership of members of the GEB on 31 December 2007/2008 (continued) | ||||||||||||||||||||||||||
| For the | Number of | Voting rights | Number of | Potentially conferred | Type and quantity | |||||||||||||||||||||
| Name, function1 | year ended | shares held | in % | options held | voting rights in %2 | of options3 | ||||||||||||||||||||
| Philip J. Lofts, | 2008 | 186,434 | 0.011 | 577,723 | 0.034 | v: | 11,445 | |||||||||||||||||||
| Group Chief Risk Officer | vi: | 11,104 | ||||||||||||||||||||||||
| vii: | 11,098 | |||||||||||||||||||||||||
| xii: | 1,240 | |||||||||||||||||||||||||
| xiii: | 5,464 | |||||||||||||||||||||||||
| xiv: | 1,199 | |||||||||||||||||||||||||
| xvii: | 9,985 | |||||||||||||||||||||||||
| xviii: | 9,980 | |||||||||||||||||||||||||
| xix: | 9,974 | |||||||||||||||||||||||||
| xxi: | 1,833 | |||||||||||||||||||||||||
| xxii: | 1,830 | |||||||||||||||||||||||||
| xxiii: | 1,830 | |||||||||||||||||||||||||
| xxvii: | 35,524 | |||||||||||||||||||||||||
| xxviii: | 35,524 | |||||||||||||||||||||||||
| xxix: | 35,521 | |||||||||||||||||||||||||
| xxxv: | 117,090 | |||||||||||||||||||||||||
| xli: | 117,227 | |||||||||||||||||||||||||
| xlv: | 85,256 | |||||||||||||||||||||||||
| xlvii: | 74,599 | |||||||||||||||||||||||||
| 2007 | ||||||||||||||||||||||||||
| Walter Stuerzinger, | 2008 | 296,886 | 0.018 | 372,995 | 0.022 | xvi: | 31,971 | |||||||||||||||||||
| Chief Operating Officer, | xxx: | 63,942 | ||||||||||||||||||||||||
| Corporate Center | xxxv: | 85,256 | ||||||||||||||||||||||||
| xli: | 95,913 | |||||||||||||||||||||||||
| xlv: | 95,913 | |||||||||||||||||||||||||
| 2007 | 209,442 | 0.019 | 350,000 | 0.031 | xvi: | 30,000 | ||||||||||||||||||||
| xxx: | 60,000 | |||||||||||||||||||||||||
| xxxv: | 80,000 | |||||||||||||||||||||||||
| xli: | 90,000 | |||||||||||||||||||||||||
| xlv: | 90,000 | |||||||||||||||||||||||||
| Rory Tapner, | 2008 | 827,809 | 0.049 | 1,379,533 | 0.082 | vii: | 281,862 | |||||||||||||||||||
| Chairman and CEO Asia Pacific | xv: | 213,140 | ||||||||||||||||||||||||
| xxiv: | 213,140 | |||||||||||||||||||||||||
| xxx: | 170,512 | |||||||||||||||||||||||||
| xxxv: | 159,855 | |||||||||||||||||||||||||
| xli: | 170,512 | |||||||||||||||||||||||||
| xlv: | 170,512 | |||||||||||||||||||||||||
| 2007 | 514,365 | 0.046 | 1,294,486 | 0.115 | vii: | 264,486 | ||||||||||||||||||||
| xv: | 200,000 | |||||||||||||||||||||||||
| xxiv: | 200,000 | |||||||||||||||||||||||||
| xxx: | 160,000 | |||||||||||||||||||||||||
| xxxv: | 150,000 | |||||||||||||||||||||||||
| xli: | 160,000 | |||||||||||||||||||||||||
| xlv: | 160,000 | |||||||||||||||||||||||||
| Raoul Weil, | 2008 | 315,698 | 0.019 | 432,409 | 0.026 | xv: | 53,285 | |||||||||||||||||||
| Chairman and CEO Global Wealth | xxxv: | 102,281 | ||||||||||||||||||||||||
| Management & Business Banking, | xli: | 127,884 | ||||||||||||||||||||||||
| relinquished his duties on | xlv: | 148,959 | ||||||||||||||||||||||||
| an interim basis | 2007 | 212,934 | 0.019 | 405,752 | 0.036 | xv: | 50,000 | |||||||||||||||||||
| xxxv: | 95,976 | |||||||||||||||||||||||||
| xli: | 120,000 | |||||||||||||||||||||||||
| xlv: | 139,776 | |||||||||||||||||||||||||
| Alexander Wilmot-Sitwell, | 2008 | 304,655 | 0.018 | 353,807 | 0.021 | xxxiv: | 53,282 | |||||||||||||||||||
| Chairman and CEO, UBS Group EMEA | xxxvii: | 2,130 | ||||||||||||||||||||||||
| and Joint Global Head IB Department | xxxviii: | 35,524 | ||||||||||||||||||||||||
| xxxix: | 35,524 | |||||||||||||||||||||||||
| xl: | 35,521 | |||||||||||||||||||||||||
| xlv: | 106,570 | |||||||||||||||||||||||||
| xlvii: | 85,256 | |||||||||||||||||||||||||
| 2007 | ||||||||||||||||||||||||||
| Robert Wolf, | 2008 | 827,307 | 0.049 | 948,473 | 0.056 | xx: | 287,739 | |||||||||||||||||||
| Chairman and CEO, UBS Group | xxxi: | 213,140 | ||||||||||||||||||||||||
| Americas / President Investment Bank | xxxvi: | 127,884 | ||||||||||||||||||||||||
| xli: | 106,570 | |||||||||||||||||||||||||
| xlv: | 106,570 | |||||||||||||||||||||||||
| xlvii: | 106,570 | |||||||||||||||||||||||||
| 2007 | ||||||||||||||||||||||||||
387
Table of Contents
Financial information
UBS AG (Parent Bank)
| Vested and unvested options held by independent members of the BoD and by members of the GEB on 31 December 2007 / 2008 | ||||||||||||||||||||||||
| Type | Number of options | Year of grant | Vesting date | Expiry date | Subscription ratio | Strike price | ||||||||||||||||||
| i | 56,013 | 2001 | 20.02.2004 | 20.02.2009 | 1:1 | CHF 46.92 | ||||||||||||||||||
| ii | 8,679 | 2002 | 31.01.2002 | 31.07.2012 | 1:1 | USD 21.24 | ||||||||||||||||||
| iii | 8,421 | 2002 | 31.01.2004 | 31.07.2012 | 1:1 | USD 21.24 | ||||||||||||||||||
| iv | 8,421 | 2002 | 31.01.2005 | 31.07.2012 | 1:1 | USD 21.24 | ||||||||||||||||||
| v | 32,807 | 2002 | 31.01.2003 | 31.01.2012 | 1:1 | CHF 36.49 | ||||||||||||||||||
| vi | 31,835 | 2002 | 31.01.2004 | 31.01.2012 | 1:1 | CHF 36.49 | ||||||||||||||||||
| vii | 313,685 | 2002 | 31.01.2005 | 31.01.2012 | 1:1 | CHF 36.49 | ||||||||||||||||||
| viii | 76,380 | 2002 | 31.01.2005 | 31.01.2012 | 1:1 | USD 21.24 | ||||||||||||||||||
| ix | 8,823 | 2002 | 28.02.2002 | 28.08.2012 | 1:1 | USD 21.70 | ||||||||||||||||||
| x | 12,825 | 2002 | 29.02.2004 | 28.08.2012 | 1:1 | USD 21.70 | ||||||||||||||||||
| xi | 8,561 | 2002 | 28.02.2005 | 28.08.2012 | 1:1 | USD 21.70 | ||||||||||||||||||
| xii | 6,694 | 2002 | 28.02.2003 | 28.02.2012 | 1:1 | CHF 36.65 | ||||||||||||||||||
| xiii | 10,758 | 2002 | 28.02.2004 | 28.02.2012 | 1:1 | CHF 36.65 | ||||||||||||||||||
| xiv | 6,491 | 2002 | 28.02.2005 | 28.02.2012 | 1:1 | CHF 36.65 | ||||||||||||||||||
| xv | 394,309 | 2002 | 28.06.2005 | 28.06.2012 | 1:1 | CHF 37.90 | ||||||||||||||||||
| xvi | 31,971 | 2002 | 28.06.2005 | 28.12.2012 | 1:1 | CHF 37.90 | ||||||||||||||||||
| xvii | 33,611 | 2003 | 01.03.2004 | 31.01.2013 | 1:1 | CHF 27.81 | ||||||||||||||||||
| xviii | 33,600 | 2003 | 01.03.2005 | 31.01.2013 | 1:1 | CHF 27.81 | ||||||||||||||||||
| xix | 33,586 | 2003 | 01.03.2006 | 31.01.2013 | 1:1 | CHF 27.81 | ||||||||||||||||||
| xx | 415,623 | 2003 | 31.01.2006 | 31.01.2013 | 1:1 | USD 22.53 | ||||||||||||||||||
| xxi | 7,359 | 2003 | 01.03.2004 | 28.02.2013 | 1:1 | CHF 26.39 | ||||||||||||||||||
| xxii | 7,354 | 2003 | 01.03.2005 | 28.02.2013 | 1:1 | CHF 26.39 | ||||||||||||||||||
| xxiii | 7,354 | 2003 | 01.03.2006 | 28.02.2013 | 1:1 | CHF 26.39 | ||||||||||||||||||
| xxiv | 213,140 | 2003 | 31.01.2006 | 31.01.2013 | 1:1 | CHF 30.50 | ||||||||||||||||||
| xxv | 31,971 | 2003 | 31.01.2006 | 31.07.2013 | 1:1 | CHF 30.50 | ||||||||||||||||||
| xxvi | 42,628 | 2003 | 31.01.2006 | 31.07.2013 | 1:1 | USD 22.53 | ||||||||||||||||||
| xxvii | 52,596 | 2004 | 01.03.2005 | 27.02.2014 | 1:1 | CHF 44.32 | ||||||||||||||||||
| xxviii | 52,592 | 2004 | 01.03.2006 | 27.02.2014 | 1:1 | CHF 44.32 | ||||||||||||||||||
| xxix | 52,584 | 2004 | 01.03.2007 | 27.02.2014 | 1:1 | CHF 44.32 | ||||||||||||||||||
| xxx | 532,850 | 2004 | 28.02.2007 | 27.02.2014 | 1:1 | CHF 48.69 | ||||||||||||||||||
| xxxi | 436,937 | 2004 | 01.03.2007 | 27.02.2014 | 1:1 | USD 38.13 | ||||||||||||||||||
| xxxii | 14,210 | 2005 | 01.03.2006 | 28.02.2015 | 1:1 | CHF 47.58 | ||||||||||||||||||
| xxxiii | 14,210 | 2005 | 01.03.2007 | 28.02.2015 | 1:1 | CHF 47.58 | ||||||||||||||||||
| xxxiv | 67,489 | 2005 | 01.03.2008 | 28.02.2015 | 1:1 | CHF 47.58 | ||||||||||||||||||
| xxxv | 837,477 | 2005 | 01.03.2008 | 28.02.2015 | 1:1 | CHF 52.32 | ||||||||||||||||||
| xxxvi | 383,652 | 2005 | 01.03.2008 | 28.02.2015 | 1:1 | USD 44.81 | ||||||||||||||||||
| xxxvii | 2,130 | 2005 | 04.03.2007 | 04.03.2015 | 1:1 | CHF 47.89 | ||||||||||||||||||
| xxxviii | 40,854 | 2006 | 01.03.2007 | 28.02.2016 | 1:1 | CHF 65.97 | ||||||||||||||||||
| xxxix | 40,852 | 2006 | 01.03.2008 | 28.02.2016 | 1:1 | CHF 65.97 | ||||||||||||||||||
| xl | 40,847 | 2006 | 01.03.2009 | 28.02.2016 | 1:1 | CHF 65.97 | ||||||||||||||||||
| xli | 1,332,125 | 2006 | 01.03.2009 | 28.02.2016 | 1:1 | CHF 72.57 | ||||||||||||||||||
| xlii | 17,762 | 2007 | 01.03.2008 | 28.02.2017 | 1:1 | CHF 67.00 | ||||||||||||||||||
| xliii | 17,762 | 2007 | 01.03.2009 | 28.02.2017 | 1:1 | CHF 67.00 | ||||||||||||||||||
| xliv | 17,760 | 2007 | 01.03.2010 | 28.02.2017 | 1:1 | CHF 67.00 | ||||||||||||||||||
| xlv | 1,348,276 | 2007 | 01.03.2010 | 28.02.2017 | 1:1 | CHF 73.67 | ||||||||||||||||||
| xlvi | 53,285 | 2008 | 01.03.2011 | 28.02.2018 | 1:1 | CHF 32.45 | ||||||||||||||||||
| xlvii | 505,478 | 2008 | 01.03.2011 | 28.03.2018 | 1:1 | CHF 35.66 | ||||||||||||||||||
| xlviii | 745,990 | 2008 | 01.03.2011 | 07.04.2018 | 1:1 | CHF 36.46 | ||||||||||||||||||
| xlix | 7,420 | 2008 | 01.03.2011 | 06.06.2018 | 1:1 | CHF 28.10 | ||||||||||||||||||
388
Table of Contents
Financial information |
| Loans granted to members of the BoD at 31 December 2007/2008 | ||||||||||||||||
| CHF, except where indicated a | ||||||||||||||||
| For the | Other loans | |||||||||||||||
| Name, function1 | year ended | Secured loans | granted | Total | ||||||||||||
Peter Kurer, Chairman2 | 2008 | 1,261,000 | 0 | 1,261,000 | ||||||||||||
| 2007 | ||||||||||||||||
| Sergio Marchionne, Senior Independent Director, Vice Chairman | 2008 | 0 | 0 | 0 | ||||||||||||
| 2007 | 0 | 0 | 0 | |||||||||||||
| Ernesto Bertarelli, member | 2008 | 0 | 0 | 0 | ||||||||||||
| 2007 | 0 | 0 | 0 | |||||||||||||
| Sally Bott, member | 2008 | 0 | 0 | 0 | ||||||||||||
| 2007 | ||||||||||||||||
| Rainer-Marc Frey, member | 2008 | 0 | 0 | 0 | ||||||||||||
| 2007 | ||||||||||||||||
Bruno Gehrig, member2 | 2008 | 798,000 | 0 | 798,000 | ||||||||||||
| 2007 | ||||||||||||||||
| Gabrielle Kaufmann-Kohler, member | 2008 | 0 | 0 | 0 | ||||||||||||
| 2007 | 0 | 0 | 0 | |||||||||||||
| Helmut Panke, member | 2008 | 0 | 0 | 0 | ||||||||||||
| 2007 | 0 | 0 | 0 | |||||||||||||
William G. Parrett, member2 | 2008 | 1,167,659 | 0 | 1,167,659 | ||||||||||||
| 2007 | ||||||||||||||||
| David Sidwell, member | 2008 | 0 | 0 | 0 | ||||||||||||
| 2007 | ||||||||||||||||
| Peter R. Voser, member | 2008 | 0 | 0 | 0 | ||||||||||||
| 2007 | 0 | 0 | 0 | |||||||||||||
| Joerg Wolle, member | 2008 | 0 | 0 | 0 | ||||||||||||
| 2007 | 0 | 0 | �� | 0 | ||||||||||||
| Aggregate of all members of the BoD | 3,226,659 | 0 | 3,226,659 | |||||||||||||
| Loans granted to members of the GEB at 31 December 2007/2008 | ||||||||||||||||
| CHF, except where indicated a | ||||||||||||||||
| For the | Other loans | |||||||||||||||
| Name, function1 | year ended | Secured loans | granted2 | Total | ||||||||||||
| Markus U. Diethelm, Group General Counsel | 2008 | 3,900,000 | 0 | 3,900,000 | ||||||||||||
Joe Scoby, Group Chief Risk Officer3 | 2007 | 0 | 3,145,796 | 3,145,796 | ||||||||||||
Aggregate of all members of the GEB4 | 2008 | 7,740,562 | 0 | 7,740,562 | ||||||||||||
| Aggregate of all members of the GEB | 2007 | 3,487,000 | 3,145,796 | 6,632,796 | ||||||||||||
389
Table of Contents
Table of Contents
Financial information |

391
Table of Contents
Financial information
UBS AG (Parent Bank)
392
Table of Contents
Financial information |
Additional disclosure required
under SEC regulations
A – Introduction
The following pages contain additional disclosures about UBS Group which are required under SEC regulations.
393
Table of Contents
Financial information
Additional disclosure required under SEC regulations
B – Selected financial data
The tables below set forth, for the periods and dates indicated, information concerning the noon buying rate for the Swiss franc, expressed in United States dollars, or USD, per one Swiss franc. The noon buying rate is the rate in New York City for cable transfers in foreign currencies as certified for customs purposes by the Federal Reserve Bank of New York.
| Average rate1 | ||||||||||||||||
| Year ended 31 December | High | Low | (USD per 1 CHF) | At period end | ||||||||||||
| 2004 | 0.8843 | 0.7601 | 0.8059 | 0.8712 | ||||||||||||
| 2005 | 0.8721 | 0.7544 | 0.8039 | 0.7606 | ||||||||||||
| 2006 | 0.8396 | 0.7575 | 0.8034 | 0.8200 | ||||||||||||
| 2007 | 0.9087 | 0.7978 | 0.8381 | 0.8827 | ||||||||||||
| 2008 | 1.0142 | 0.8171 | 0.9298 | 0.9369 | ||||||||||||
| Month | High | Low | ||||||||||||||
| September 2008 | 0.9248 | 0.8776 | ||||||||||||||
| October 2008 | 0.8921 | 0.8570 | ||||||||||||||
| November 2008 | 0.8616 | 0.8172 | ||||||||||||||
| December 2008 | 0.9602 | 0.8171 | ||||||||||||||
| January 2009 | 0.9359 | 0.8599 | ||||||||||||||
| February 2009 | 0.8757 | 0.8465 | ||||||||||||||
394
Table of Contents
| Financial information |
395
Table of Contents
Financial information
Additional disclosure required under SEC regulations
396
Table of Contents
Financial information |
Ratio of earnings to fixed charges
The following table sets forth UBS’s ratio of earnings to fixed charges on an IFRS basis for the periods indicated. The ratios are calculated based on earnings from continuing operations. Ratios of earnings to combined fixed charges and preferred stock dividend requirements are not presented as there were no preferred share dividends in any of the periods indicated.
| For the year ended | ||||||||||||||||||||
| 31.12.08 | 31.12.07 | 31.12.06 | 31.12.05 | 31.12.04 | ||||||||||||||||
| 0.54 | 0.96 | 1.17 | 1.23 | 1.32 | ||||||||||||||||
397
Table of Contents
Financial information
Additional disclosure required under SEC regulations
C – Information on the company
Property, plant and equipment
At 31 December 2008, UBS operated about 1,166 business and banking locations worldwide, of which about 36% were in Switzerland, 47% in the Americas, 12% in the rest of Europe, Middle East and Africa and 4% in Asia-Pacific. 36% of the business and banking locations in Switzerland were owned directly by UBS, with the remainder, along with most
of UBS’s offices outside Switzerland, being held under commercial leases.
398
Table of Contents
Financial information |
D – Information required by industry guide 3
Selected statistical information
The tables below set forth selected statistical information regarding the Group’s banking operations extracted from the Financial Statements. Unless otherwise indicated, average balances for the years ended 31 December 2008, 31 December 2007 and 31 December 2006 are calculated from
monthly data. The distinction between domestic and foreign is generally based on the booking location. For loans, this method is not significantly different from an analysis based on the domicile of the borrower.
Average balances and interest rates
The following table sets forth average interest-earning assets and average interest-bearing liabilities, along with the average rates, for the years ended 31 December 2008, 2007 and 2006.
| 31.12.08 | 31.12.07 | 31.12.06 | |||||||||||||||||||||||||||||||||||
| Average | Average | Average | Average | Average | Average | ||||||||||||||||||||||||||||||||
| CHF million, except where indicated | balance | Interest | rate (%) | balance | Interest | rate (%) | balance | Interest | rate (%) | ||||||||||||||||||||||||||||
Assets | |||||||||||||||||||||||||||||||||||||
| Due from banks | |||||||||||||||||||||||||||||||||||||
| Domestic | 7,243 | 421 | 5.8 | 11,784 | 664 | 5.6 | 10,800 | 587 | 5.4 | ||||||||||||||||||||||||||||
| Foreign | 58,287 | 1,559 | 2.7 | 46,049 | 2,344 | 5.1 | 29,814 | 1,490 | 5.0 | ||||||||||||||||||||||||||||
| Cash collateral on securities borrowed and reverse repurchase agreements | |||||||||||||||||||||||||||||||||||||
| Domestic | 31,642 | 1,208 | 3.8 | 31,473 | 1,693 | 5.4 | 27,147 | 1,333 | 4.9 | ||||||||||||||||||||||||||||
| Foreign | 669,010 | 21,313 | 3.2 | 977,302 | 46,581 | 4.8 | 926,575 | 38,393 | 4.1 | ||||||||||||||||||||||||||||
| Trading portfolio assets | |||||||||||||||||||||||||||||||||||||
| Domestic | 15,104 | 520 | 3.4 | 11,866 | 696 | 5.9 | 17,976 | 651 | 3.6 | ||||||||||||||||||||||||||||
| Foreign taxable | 522,804 | 21,494 | 4.1 | 861,923 | 38,206 | 4.4 | 707,432 | 31,433 | 4.4 | ||||||||||||||||||||||||||||
| Foreign non-taxable | 8,070 | 383 | 4.7 | 5,754 | 199 | 3.5 | 4,438 | 127 | 2.9 | ||||||||||||||||||||||||||||
| Foreign total | 530,874 | 21,877 | 4.1 | 867,677 | 38,405 | 4.4 | 711,870 | 31,560 | 4.4 | ||||||||||||||||||||||||||||
| Financial assets designated at fair value | |||||||||||||||||||||||||||||||||||||
| Domestic | 945 | 0 | 588 | 0 | 42 | 0 | |||||||||||||||||||||||||||||||
| Foreign | 11,024 | 404 | 3.7 | 9,114 | 298 | 3.3 | 2,325 | 70 | 3.0 | ||||||||||||||||||||||||||||
| Loans | |||||||||||||||||||||||||||||||||||||
| Domestic | 188,950 | 6,840 | 3.6 | 187,073 | 6,565 | 3.5 | 181,186 | 5,784 | 3.2 | ||||||||||||||||||||||||||||
| Foreign | 147,034 | 8,515 | 5.8 | 146,040 | 9,359 | 6.4 | 105,362 | 6,284 | 5.9 | ||||||||||||||||||||||||||||
| Financial investments available-for-sale | |||||||||||||||||||||||||||||||||||||
| Domestic | 1,599 | 72 | 4.5 | 3,930 | 66 | 1.7 | 4,126 | 28 | 0.7 | ||||||||||||||||||||||||||||
| Foreign taxable | 3,370 | 73 | 2.2 | 2,934 | 110 | 3.7 | 3,171 | 100 | 3.2 | ||||||||||||||||||||||||||||
| Foreign non-taxable | 0 | 0 | 0 | 0 | |||||||||||||||||||||||||||||||||
| Foreign total | 3,370 | 73 | 2.2 | 2,934 | 110 | 3.7 | 3,171 | 100 | 3.2 | ||||||||||||||||||||||||||||
Total interest-earning assets | 1,665,082 | 62,802 | 3.8 | 2,295,830 | 106,781 | 4.7 | 2,020,394 | 86,280 | 4.3 | ||||||||||||||||||||||||||||
| Net interest on swaps | 3,088 | 2,331 | 1,121 | ||||||||||||||||||||||||||||||||||
Interest income and average interest-earning assets | 1,665,082 | 65,890 | 4.0 | 2,295,830 | 109,112 | 4.8 | 2,020,394 | 87,401 | 4.3 | ||||||||||||||||||||||||||||
| Non-interest-earning assets | |||||||||||||||||||||||||||||||||||||
| Positive replacement values | 600,073 | 373,229 | 278,733 | ||||||||||||||||||||||||||||||||||
| Fixed assets | 7,091 | 7,090 | 7,445 | ||||||||||||||||||||||||||||||||||
| Other | 82,433 | 82,739 | 68,894 | ||||||||||||||||||||||||||||||||||
Total average assets | 2,354,679 | 2,758,888 | 2,375,466 | ||||||||||||||||||||||||||||||||||
399
Table of Contents
Financial information
Additional disclosure required under SEC regulations
| Average balances and interest rates (continued) | |||||||||||||||||||||||||||||||||||||
| 31.12.08 | 31.12.07 | 31.12.06 | |||||||||||||||||||||||||||||||||||
| Average | Average | Average | Average | Average | Average | ||||||||||||||||||||||||||||||||
| CHF million, except where indicated | balance | Interest | rate (%) | balance | Interest | rate (%) | balance | Interest | rate (%) | ||||||||||||||||||||||||||||
Liabilities and equity | |||||||||||||||||||||||||||||||||||||
| Due to banks | |||||||||||||||||||||||||||||||||||||
| Domestic | 51,027 | 1,503 | 2.9 | 60,858 | 2,477 | 4.1 | 46,544 | 1,583 | 3.4 | ||||||||||||||||||||||||||||
| Foreign | 88,798 | 3,423 | 3.9 | 146,286 | 8,008 | 5.5 | 108,885 | 5,261 | 4.8 | ||||||||||||||||||||||||||||
| Cash collateral on securities lent and repurchase agreements | |||||||||||||||||||||||||||||||||||||
| Domestic | 31,269 | 1,026 | 3.3 | 47,041 | 1,902 | 4.0 | 46,224 | 1,589 | 3.4 | ||||||||||||||||||||||||||||
| Foreign | 397,453 | 15,097 | 3.8 | 752,616 | 38,680 | 5.1 | 751,617 | 32,432 | 4.3 | ||||||||||||||||||||||||||||
| Trading portfolio liabilities | |||||||||||||||||||||||||||||||||||||
| Domestic | 5,525 | 256 | 4.6 | 5,561 | 328 | 5.9 | 4,408 | 283 | 6.4 | ||||||||||||||||||||||||||||
| Foreign | 132,901 | 8,906 | 6.7 | 214,326 | 15,484 | 7.2 | 202,263 | 14,250 | 7.0 | ||||||||||||||||||||||||||||
| Financial liabilities designated at fair value | |||||||||||||||||||||||||||||||||||||
| Domestic | 1,444 | 69 | 4.8 | 1,503 | 79 | 5.3 | 1,864 | 58 | 3.1 | ||||||||||||||||||||||||||||
| Foreign | 151,324 | 7,229 | 4.8 | 173,162 | 7,580 | 4.4 | 127,458 | 4,699 | 3.7 | ||||||||||||||||||||||||||||
| Due to customers | |||||||||||||||||||||||||||||||||||||
| Domestic demand deposits | 56,730 | 495 | 0.9 | 64,568 | 736 | 1.1 | 70,981 | 534 | 0.8 | ||||||||||||||||||||||||||||
| Domestic savings deposits | 68,213 | 604 | 0.9 | 78,775 | 502 | 0.6 | 86,631 | 392 | 0.5 | ||||||||||||||||||||||||||||
| Domestic time deposits | 35,575 | 1,081 | 3.0 | 41,056 | 1,206 | 2.9 | 28,876 | 639 | 2.2 | ||||||||||||||||||||||||||||
| Domestic total | 160,518 | 2,180 | 1.4 | 184,399 | 2,444 | 1.3 | 186,488 | 1,565 | 0.8 | ||||||||||||||||||||||||||||
Foreign1 | 401,421 | 11,044 | 2.8 | 426,130 | 16,388 | 3.8 | 314,788 | 11,500 | 3.7 | ||||||||||||||||||||||||||||
| Short-term debt | |||||||||||||||||||||||||||||||||||||
| Domestic | 1,735 | 63 | 3.6 | 2,228 | 98 | 4.4 | 1,973 | 115 | 5.8 | ||||||||||||||||||||||||||||
| Foreign | 134,920 | 6,216 | 4.6 | 144,546 | 8,643 | 6.0 | 110,418 | 5,934 | 5.4 | ||||||||||||||||||||||||||||
| Long-term debt | |||||||||||||||||||||||||||||||||||||
| Domestic | 5,766 | 148 | 2.6 | 4,235 | 115 | 2.7 | 3,957 | 82 | 2.1 | ||||||||||||||||||||||||||||
| Foreign | 74,531 | 2,527 | 3.4 | 70,079 | 1,549 | 2.2 | 57,899 | 1,529 | 2.6 | ||||||||||||||||||||||||||||
Total interest-bearing liabilities | 1,638,632 | 59,687 | 3.6 | 2,232,970 | 103,775 | 4.6 | 1,964,786 | 80,880 | 4.1 | ||||||||||||||||||||||||||||
| Non-interest-bearing liabilities | |||||||||||||||||||||||||||||||||||||
| Negative replacement values | 605,975 | 382,115 | 278,903 | ||||||||||||||||||||||||||||||||||
| Other | 67,098 | 88,191 | 77,304 | ||||||||||||||||||||||||||||||||||
| Total liabilities | 2,311,705 | 2,703,276 | 2,320,993 | ||||||||||||||||||||||||||||||||||
| Total equity | 42,973 | 55,612 | 54,473 | ||||||||||||||||||||||||||||||||||
| Total average liabilities and equity | 2,354,678 | 2,758,888 | 2,375,466 | ||||||||||||||||||||||||||||||||||
Net interest income | 6,203 | 5,337 | 6,521 | ||||||||||||||||||||||||||||||||||
Net yield on interest-earning assets | 0.4 | 0.2 | 0.3 | ||||||||||||||||||||||||||||||||||
The percentage of total average interest-earning assets attributable to foreign activities was 85% for 2008 (89% for 2007 and 88% for 2006). The percentage of total average interest-bearing liabilities attributable to foreign activities was 84% for 2008 (86% for 2007 and 85% for 2006). All assets and liabilities are translated into CHF at uniform month-end rates. Interest income and expense are translated at monthly average rates.
Average rates earned and paid on assets and liabilities can change from period to period based on the changes in interest rates in general, but are also affected by changes in the currency mix included in the assets and liabilities. This is especially true for foreign assets and liabilities. Tax-exempt income is not recorded on a tax-equivalent basis. For all three years presented, tax-exempt income is considered to be insignificant and the impact from such income is therefore negligible.
400
Table of Contents
Financial information |
Analysis of changes in interest income and expense
The following tables allocate, by categories of interest-earning assets and interest-bearing liabilities, the changes in interest income and expense due to changes in volume and interest rates for the year ended 31 December 2008 compared with the year ended 31 December 2007, and for the year ended 31 December 2007 compared with the year end-
ed 31 December 2006. Volume and rate variances have been calculated on movements in average balances and changes in interest rates. Changes due to a combination of volume and rates have been allocated proportionally. Refer to the appropriate section of Industry Guide 3 for a discussion of the treatment of impaired and non-performing loans.
| 2008 compared with 2007 | 2007 compared with 2006 | ||||||||||||||||||||||||
| Increase/(decrease) | Increase/(decrease) | ||||||||||||||||||||||||
| due to changes in | due to changes in | ||||||||||||||||||||||||
| Average | Average | Net | Average | Average | Net | ||||||||||||||||||||
| CHF million | volume | rate | change | volume | rate | change | |||||||||||||||||||
Interest income from interest-earning assets | |||||||||||||||||||||||||
| Due from banks | |||||||||||||||||||||||||
| Domestic | (254 | ) | 11 | (243 | ) | 53 | 24 | 77 | |||||||||||||||||
| Foreign | 624 | (1,409 | ) | (785 | ) | 812 | 42 | 854 | |||||||||||||||||
| Cash collateral on securities borrowed and reverse repurchase agreements | |||||||||||||||||||||||||
| Domestic | 9 | (494 | ) | (485 | ) | 212 | 148 | 360 | |||||||||||||||||
| Foreign | (14,798 | ) | (10,470 | ) | (25,268 | ) | 2,080 | 6,108 | 8,188 | ||||||||||||||||
| Trading portfolio assets | |||||||||||||||||||||||||
| Domestic | 191 | (367 | ) | (176 | ) | (220 | ) | 265 | 45 | ||||||||||||||||
| Foreign taxable | (14,921 | ) | (1,791 | ) | (16,712 | ) | 6,798 | (25 | ) | 6,773 | |||||||||||||||
| Foreign non-taxable | 81 | 103 | 184 | 38 | 34 | 72 | |||||||||||||||||||
| Foreign total | (14,840 | ) | (1,688 | ) | (16,528 | ) | 6,836 | 9 | 6,845 | ||||||||||||||||
| Financial assets designated at fair value | |||||||||||||||||||||||||
| Domestic | 0 | 0 | 0 | 0 | 0 | 0 | |||||||||||||||||||
| Foreign | 63 | 43 | 106 | 204 | 24 | 228 | |||||||||||||||||||
| Loans | |||||||||||||||||||||||||
| Domestic | 66 | 209 | 275 | 188 | 593 | 781 | |||||||||||||||||||
| Foreign | 64 | (908 | ) | (844 | ) | 2,441 | 634 | 3,075 | |||||||||||||||||
| Financial investments available-for-sale | |||||||||||||||||||||||||
| Domestic | (40 | ) | 46 | 6 | (1 | ) | 39 | 38 | |||||||||||||||||
| Foreign taxable | 16 | (53 | ) | (37 | ) | (8 | ) | 18 | 10 | ||||||||||||||||
| Foreign non-taxable | 0 | 0 | 0 | 0 | 0 | 0 | |||||||||||||||||||
| Foreign total | 16 | (53 | ) | (37 | ) | (8 | ) | 18 | 10 | ||||||||||||||||
| Interest income | |||||||||||||||||||||||||
| Domestic | (28 | ) | (595 | ) | (623 | ) | 232 | 1,069 | 1,301 | ||||||||||||||||
| Foreign | (28,871 | ) | (14,485 | ) | (43,356 | ) | 12,365 | 6,835 | 19,200 | ||||||||||||||||
| Total interest income from interest-earning assets | (28,899 | ) | (15,080 | ) | (43,979 | ) | 12,597 | 7,904 | 20,501 | ||||||||||||||||
| Net interest on swaps | 757 | 1,210 | |||||||||||||||||||||||
Total interest income | (43,222 | ) | 21,711 | ||||||||||||||||||||||
401
Table of Contents
Financial information
Additional disclosure required under SEC regulations
| Analysis of changes in interest income and expense (continued) | |||||||||||||||||||||||||
| 2008 compared with 2007 | 2007 compared with 2006 | ||||||||||||||||||||||||
| Increase/(decrease) | Increase/(decrease) | ||||||||||||||||||||||||
| due to changes in | due to changes in | ||||||||||||||||||||||||
| Average | Average | Net | Average | Average | Net | ||||||||||||||||||||
| CHF million | volume | rate | change | volume | rate | change | |||||||||||||||||||
Interest expense on interest-bearing liabilities | |||||||||||||||||||||||||
| Due to banks | |||||||||||||||||||||||||
| Domestic | (403 | ) | (571 | ) | (974 | ) | 487 | 407 | 894 | ||||||||||||||||
| Foreign | (3,162 | ) | (1,423 | ) | (4,585 | ) | 1,795 | 952 | 2,747 | ||||||||||||||||
| Cash collateral on securities lent and repurchase agreements | |||||||||||||||||||||||||
| Domestic | (631 | ) | (245 | ) | (876 | ) | 28 | 285 | 313 | ||||||||||||||||
| Foreign | (18,113 | ) | (5,470 | ) | (23,583 | ) | 43 | 6,205 | 6,248 | ||||||||||||||||
| Trading portfolio liabilities | |||||||||||||||||||||||||
| Domestic | (2 | ) | (70 | ) | (72 | ) | 74 | (29 | ) | 45 | |||||||||||||||
| Foreign | (5,863 | ) | (715 | ) | (6,578 | ) | 844 | 390 | 1,234 | ||||||||||||||||
| Financial liabilities designated at fair value | |||||||||||||||||||||||||
| Domestic | (3 | ) | (7 | ) | (10 | ) | (11 | ) | 32 | 21 | |||||||||||||||
| Foreign | (961 | ) | 610 | (351 | ) | 1,691 | 1,190 | 2,881 | |||||||||||||||||
| Due to customers | |||||||||||||||||||||||||
| Domestic demand deposits | (86 | ) | (155 | ) | (241 | ) | (51 | ) | 253 | 202 | |||||||||||||||
| Domestic savings deposits | (63 | ) | 165 | 102 | (39 | ) | 149 | 110 | |||||||||||||||||
| Domestic time deposits | (159 | ) | 34 | (125 | ) | 268 | 299 | 567 | |||||||||||||||||
| Domestic total | (308 | ) | 44 | (264 | ) | 178 | 701 | 879 | |||||||||||||||||
| Foreign | (939 | ) | (4,405 | ) | (5,344 | ) | 4,120 | 768 | 4,888 | ||||||||||||||||
| Short-term debt | |||||||||||||||||||||||||
| Domestic | (22 | ) | (13 | ) | (35 | ) | 15 | (32 | ) | (17 | ) | ||||||||||||||
| Foreign | (578 | ) | (1,849 | ) | (2,427 | ) | 1,843 | 866 | 2,709 | ||||||||||||||||
| Long-term debt | |||||||||||||||||||||||||
| Domestic | 41 | �� | (8 | ) | 33 | 6 | 27 | 33 | |||||||||||||||||
| Foreign | 98 | 880 | 978 | 317 | (297 | ) | 20 | ||||||||||||||||||
| Interest expense | |||||||||||||||||||||||||
| Domestic | (1,328 | ) | (870 | ) | (2,198 | ) | 777 | 1,391 | 2,168 | ||||||||||||||||
| Foreign | (29,518 | ) | (12,372 | ) | (41,890 | ) | 10,653 | 10,074 | 20,727 | ||||||||||||||||
Total interest expense | (30,846 | ) | (13,242 | ) | (44,088 | ) | 11,430 | 11,465 | 22,895 | ||||||||||||||||
402
Table of Contents
Financial information |
Deposits
The following table analyzes average deposits and the average rates on each deposit category listed below for the years ended 31 December 2008, 2007 and 2006. The geographic allocation is based on the location of the office or branch where the deposit is made. Deposits by foreign depositors in domestic offices were CHF 51,228 million CHF 81,243 million and CHF 78,234 million at 31 December 2008, 31 December 2007 and 31 December 2006, respectively.
| 31.12.08 | 31.12.07 | 31.12.06 | ||||||||||||||||||||||
| Average | Average | Average | Average | Average | Average | |||||||||||||||||||
| CHF million, except where indicated | deposit | rate (%) | deposit | rate (%) | deposit | rate (%) | ||||||||||||||||||
Banks | ||||||||||||||||||||||||
Domestic offices | ||||||||||||||||||||||||
| Demand deposits | 2,341 | 0.5 | 2,474 | 0.6 | 2,024 | 0.2 | ||||||||||||||||||
| Time deposits | 4,902 | 3.8 | 9,310 | 5.1 | 8,776 | 4.5 | ||||||||||||||||||
| Total domestic offices | 7,243 | 2.7 | 11,784 | 4.2 | 10,800 | 3.7 | ||||||||||||||||||
Foreign offices | ||||||||||||||||||||||||
Interest-bearing deposits1 | 58,287 | 3.9 | 46,049 | 5.5 | 29,814 | 4.8 | ||||||||||||||||||
Total due to banks | 65,530 | 3.7 | 57,833 | 5.2 | 40,614 | 4.5 | ||||||||||||||||||
Customer accounts | ||||||||||||||||||||||||
Domestic offices | ||||||||||||||||||||||||
| Demand deposits | 56,730 | 0.9 | 64,568 | 1.1 | 70,981 | 0.8 | ||||||||||||||||||
| Savings deposits | 68,213 | 0.9 | 78,775 | 0.6 | 86,631 | 0.5 | ||||||||||||||||||
| Time deposits | 35,575 | 3.0 | 41,056 | 2.9 | 28,876 | 2.2 | ||||||||||||||||||
| Total domestic offices | 160,518 | 1.4 | 184,399 | 1.3 | 186,488 | 0.8 | ||||||||||||||||||
Foreign offices | ||||||||||||||||||||||||
Interest-bearing deposits1 | 401,421 | 2.8 | 426,130 | 3.8 | 314,788 | 3.7 | ||||||||||||||||||
Total due to customers | 561,939 | 2.4 | 610,529 | 3.1 | 501,276 | 2.6 | ||||||||||||||||||
At 31 December 2008, the maturity of time deposits exceeding CHF 150,000, or an equivalent amount in other currencies, was as follows:
| CHF million | Domestic | Foreign | ||||||
| Within 3 months | 38,052 | 186,590 | ||||||
| 3 to 6 months | 2,216 | 9,387 | ||||||
| 6 to 12 months | 1,495 | 4,617 | ||||||
| 1 to 5 years | 648 | 1,532 | ||||||
| Over 5 years | 231 | 235 | ||||||
Total time deposits | 42,642 | 202,361 | ||||||
403
Table of Contents
Financial information
Additional disclosure required under SEC regulations
Short-term borrowings
The following table presents the period-end, average and maximum month-end outstanding amounts for short-term borrowings, along with the average rates and period-end rates at and for the years ended 31 December 2008, 2007 and 2006.
| Money market paper issued | Due to banks | Repurchase agreements1 | ||||||||||||||||||||||||||||||||||
| CHF million, except where indicated | 31.12.08 | 31.12.07 | 31.12.06 | 31.12.08 | 31.12.07 | 31.12.06 | 31.12.08 | 31.12.07 | 31.12.06 | |||||||||||||||||||||||||||
| Period-end balance | 111,619 | 152,256 | 119,584 | 61,155 | 84,826 | 153,231 | 140,039 | 487,455 | 754,623 | |||||||||||||||||||||||||||
| Average balance | 136,655 | 146,774 | 112,391 | 74,295 | 149,311 | 114,815 | 404,512 | 739,138 | 717,542 | |||||||||||||||||||||||||||
| Maximum month-end balance | 170,503 | 167,637 | 123,108 | 87,233 | 175,233 | 153,231 | 591,005 | 848,401 | 777,010 | |||||||||||||||||||||||||||
| Average interest rate during the period (%) | 4.6 | 6.0 | 5.4 | 3.5 | 5.1 | 4.4 | 3.5 | 5.0 | 4.4 | |||||||||||||||||||||||||||
| Average interest rate at period-end (%) | 2.9 | 6.1 | 4.0 | 2.3 | 4.5 | 4.1 | 1.4 | 4.9 | 5.0 | |||||||||||||||||||||||||||
404
Table of Contents
Financial information |
| Contractual maturities of investments in debt instruments available-for-sale1,2 | ||||||||||||||||||||||||||||||||
| Within 1 year | 1-5 years | 5-10 years | Over 10 years | |||||||||||||||||||||||||||||
| CHF million, except percentages | Amount | Yield (%) | Amount | Yield (%) | Amount | Yield (%) | Amount | Yield (%) | ||||||||||||||||||||||||
31 December 20083 | ||||||||||||||||||||||||||||||||
| Swiss national government and agencies | 0 | 0.00 | 2 | 3.46 | 0 | 0.00 | 1 | 4.00 | ||||||||||||||||||||||||
| Swiss local governments | 0 | 0.00 | 0 | 0.00 | 0 | 0.00 | 0 | 0.00 | ||||||||||||||||||||||||
| US Treasury and agencies | 0 | 0.00 | 0 | 0.00 | 0 | 0.00 | 0 | 0.00 | ||||||||||||||||||||||||
| Foreign governments and official institutions | 33 | 1.31 | 0 | 0.00 | 33 | 2.81 | 34 | 5.22 | ||||||||||||||||||||||||
| Corporate debt securities | 3 | 23.35 | 88 | 3.38 | 38 | 3.12 | 12 | 1.74 | ||||||||||||||||||||||||
| Mortgage-backed securities | 0 | 0.00 | 0 | 0.00 | 42 | 4.00 | 455 | 5.28 | ||||||||||||||||||||||||
| Other debt instruments | 188 | 9.06 | 3 | 13.47 | 0 | 0.00 | 37 | 7.42 | ||||||||||||||||||||||||
Total fair value | 224 | 93 | 113 | 539 | ||||||||||||||||||||||||||||
| Within 1 year | 1-5 years | 5-10 years | Over 10 years | |||||||||||||||||||||||||||||
| CHF million, except percentages | Amount | Yield (%) | Amount | Yield (%) | Amount | Yield (%) | Amount | Yield (%) | ||||||||||||||||||||||||
31 December 20073 | ||||||||||||||||||||||||||||||||
| Swiss national government and agencies | 0 | 0.00 | 2 | 2.02 | 0 | 0.00 | 1 | 4.00 | ||||||||||||||||||||||||
| Swiss local governments | 0 | 0.00 | 0 | 0.00 | 0 | 0.00 | 0 | 0.00 | ||||||||||||||||||||||||
| US Treasury and agencies | 0 | 0.00 | 0 | 0.00 | 0 | 0.00 | 0 | 0.00 | ||||||||||||||||||||||||
| Foreign governments and official institutions | 50 | 1.87 | 2 | 2.54 | 75 | 4.48 | 0 | 0.00 | ||||||||||||||||||||||||
| Corporate debt securities | 50 | 5.66 | 44 | 4.11 | 0 | 0.00 | 0 | 0.00 | ||||||||||||||||||||||||
| Mortgage-backed securities | 0 | 0.00 | 0 | 0.00 | 3 | 4.48 | 561 | 5.28 | ||||||||||||||||||||||||
| Other debt instruments | 14 | 4.20 | 216 | 12.41 | 0 | 0.00 | 0 | 0.00 | ||||||||||||||||||||||||
Total fair value | 114 | 264 | 78 | 562 | ||||||||||||||||||||||||||||
| Within 1 year | 1-5 years | 5-10 years | Over 10 years | |||||||||||||||||||||||||||||
| CHF million, except percentages | Amount | Yield (%) | Amount | Yield (%) | Amount | Yield (%) | Amount | Yield (%) | ||||||||||||||||||||||||
31 December 2006 | ||||||||||||||||||||||||||||||||
| Swiss national government and agencies | 2 | 2.22 | 0 | 0.00 | 0 | 0.00 | 1 | 4.00 | ||||||||||||||||||||||||
| Swiss local governments | 0 | 0.00 | 0 | 0.00 | 0 | 0.00 | 0 | 0.00 | ||||||||||||||||||||||||
| US Treasury and agencies | 0 | 0.00 | 0 | 0.00 | 0 | 0.00 | 0 | 0.00 | ||||||||||||||||||||||||
| Foreign governments and official institutions | 38 | 1.48 | 2 | 1.89 | 57 | 4.47 | 0 | 0.00 | ||||||||||||||||||||||||
| Corporate debt securities | 26 | 7.00 | 0 | 0.00 | 2 | 0.00 | 0 | 0.00 | ||||||||||||||||||||||||
| Mortgage-backed securities | 0 | 0.00 | 0 | 0.00 | 10 | 4.48 | 150 | 5.10 | ||||||||||||||||||||||||
| Other debt instruments | 0 | 0.00 | 233 | 9.28 | 0 | 0.00 | 0 | 0.00 | ||||||||||||||||||||||||
Total fair value | 66 | 235 | 69 | 151 | ||||||||||||||||||||||||||||
405
Table of Contents
Financial information
Additional disclosure required under SEC regulations
Due from banks and loans (gross)
The Group’s lending portfolio is widely diversified across industry sectors with no significant concentrations of credit risk. CHF 152.5 billion (37% of the total) consists of loans to thousands of private households, predominantly in Switzerland, and mostly secured by mortgages, financial collateral or other assets. Exposure to Banks and Financial institutions amounted to CHF 174.3 billion (42% of the total). This includes cash posted as collateral by UBS against negative replacement values on derivatives or other positions, which, from a risk perspective, is not considered lending but is a key component of the measurement of counterparty risk taken in connection with the underlying products. Exposure to
banks includes money market deposits with highly rated institutions. Excluding Banks and Financial institutions, the largest industry sector exposure is CHF 16.3 billion (4% of the total) to Real estate and rentals. For further discussion of the loan portfolio, see the Risk and treasury management section on Credit risk.
| CHF million | 31.12.08 | 31.12.07 | 31.12.06 | 31.12.05 | 31.12.04 | |||||||||||||||
Domestic | ||||||||||||||||||||
Banks1 | 1,734 | 1,237 | 561 | 1,407 | 1,406 | |||||||||||||||
| Construction | 1,377 | 1,393 | 1,535 | 1,816 | 1,943 | |||||||||||||||
| Financial institutions | 8,113 | 5,525 | 5,542 | 4,213 | 4,332 | |||||||||||||||
| Hotels and restaurants | 1,811 | 1,824 | 1,957 | 2,044 | 2,269 | |||||||||||||||
Manufacturing2 | 4,020 | 3,887 | 3,643 | 4,134 | 5,485 | |||||||||||||||
| Private households | 119,285 | 121,536 | 117,852 | 111,549 | 105,160 | |||||||||||||||
| Public authorities | 4,042 | 4,734 | 4,972 | 5,494 | 5,460 | |||||||||||||||
| Real estate and rentals | 12,097 | 11,691 | 11,356 | 11,792 | 11,466 | |||||||||||||||
| Retail and wholesale | 4,818 | 5,138 | 4,569 | 4,808 | 4,908 | |||||||||||||||
Services3 | 6,172 | 6,170 | 6,758 | 8,088 | 9,110 | |||||||||||||||
Other4 | 3,329 | 3,300 | 4,345 | 3,119 | 591 | |||||||||||||||
| Total domestic | 166,798 | 166,435 | 163,090 | 158,464 | 152,130 | |||||||||||||||
Foreign | ||||||||||||||||||||
Banks1 | 63,708 | 60,333 | 50,124 | 32,287 | 34,269 | |||||||||||||||
| Chemicals | 2,816 | 635 | 1,321 | 2,716 | 366 | |||||||||||||||
| Construction | 448 | 624 | 522 | 295 | 122 | |||||||||||||||
| Electricity, gas and water supply | 2,995 | 1,888 | 951 | 1,637 | 745 | |||||||||||||||
| Financial institutions | 100,779 | 96,370 | 67,676 | 62,344 | 45,095 | |||||||||||||||
Manufacturing5 | 5,026 | 4,678 | 3,006 | 3,784 | 2,758 | |||||||||||||||
| Mining | 4,394 | 4,509 | 3,177 | 3,431 | 1,695 | |||||||||||||||
| Private households | 33,242 | 42,828 | 35,031 | 38,283 | 30,237 | |||||||||||||||
| Public authorities | 11,094 | 4,172 | 2,175 | 1,686 | 1,228 | |||||||||||||||
| Real estate and rentals | 4,240 | 5,056 | 4,360 | 2,707 | 940 | |||||||||||||||
| Retail and wholesale | 2,515 | 2,239 | 1,815 | 1,257 | 1,102 | |||||||||||||||
| Services | 9,816 | 9,294 | 16,436 | 5,593 | 8,002 | |||||||||||||||
| Transport, storage and communication | 3,894 | 1,752 | 1,528 | 1,419 | 762 | |||||||||||||||
Other6 | 1,073 | 1,105 | 564 | 272 | 318 | |||||||||||||||
| Total foreign | 246,040 | 235,483 | 188,686 | 157,711 | 127,639 | |||||||||||||||
Total gross | 412,838 | 401,918 | 351,776 | 316,175 | 279,769 | |||||||||||||||
The table above also includes loans designated at fair value.
406
Table of Contents
Financial information |
Due from banks and loans (gross) (continued)
The following table analyzes the Group’s mortgage portfolio by geographic origin of the client and type of mortgage at 31 December 2008, 2007, 2006, 2005 and 2004. Mortgages are included in the industry categories mentioned on the previous page.
| CHF million | 31.12.08 | 31.12.07 | 31.12.06 | 31.12.05 | 31.12.04 | |||||||||||||||
Mortgages | ||||||||||||||||||||
| Domestic | 134,700 | 135,341 | 134,468 | 130,880 | 124,496 | |||||||||||||||
| Foreign | 8,381 | 8,152 | 10,069 | 15,619 | 12,185 | |||||||||||||||
Total gross mortgages | 143,081 | 143,493 | 144,537 | 146,499 | 136,681 | |||||||||||||||
Mortgages | ||||||||||||||||||||
| Residential | 121,811 | 122,435 | 124,548 | 127,990 | 117,731 | |||||||||||||||
| Commercial | 21,270 | 21,058 | 19,989 | 18,509 | 18,950 | |||||||||||||||
Total gross mortgages | 143,081 | 143,493 | 144,537 | 146,499 | 136,681 | |||||||||||||||
| Due from banks and loan maturities (gross) | |||||||||||||||||
| CHF million | Within 1 year | 1 to 5 years | Over 5 years | Total | |||||||||||||
Domestic | |||||||||||||||||
| Banks | 1,733 | 1 | 1,734 | ||||||||||||||
| Mortgages | 52,324 | 60,308 | 22,068 | 134,700 | |||||||||||||
| Other loans | 23,538 | 5,224 | 1,530 | 30,292 | |||||||||||||
Total domestic | 77,595 | 65,533 | 23,598 | 166,726 | |||||||||||||
Foreign | |||||||||||||||||
| Banks | 60,703 | 1,671 | 365 | 62,739 | |||||||||||||
| Mortgages | 5,533 | 2,249 | 599 | 8,381 | |||||||||||||
| Other loans | 116,217 | 13,112 | 40,511 | 169,840 | 1 | ||||||||||||
Total foreign | 182,453 | 17,032 | 41,475 | 240,960 | |||||||||||||
Total gross | 260,048 | 82,565 | 65,073 | 407,686 | |||||||||||||
At 31 December 2008, the total amount of Due from banks and Loans due after one year granted at fixed and floating rates are as follows:
| CHF million | 1 to 5 years | Over 5 years | Total | |||||||||||||||||
| Fixed-rate loans | 79,225 | 33,479 | 112,704 | |||||||||||||||||
| Adjustable or floating-rate loans | 3,340 | 31,594 | 34,934 | |||||||||||||||||
Total | 82,565 | 65,073 | 147,638 | |||||||||||||||||
407
Table of Contents
Financial information
Additional disclosure required under SEC regulations
Impaired and non-performing loans
A loan (included in Due from banks or Loans) is classified as non-performing: 1) when the payment of interest, principal or fees is overdue by more than 90 days and there is no firm evidence that they will be made good by later payments or the liquidation of collateral; 2) when insolvency proceedings have commenced; or 3) when obligations have been restructured on concessionary terms.
| CHF million | 31.12.08 | 31.12.07 | 31.12.06 | 31.12.05 | 31.12.04 | |||||||||||||||
| Gross interest income that would have been recorded on non-performing loans: | ||||||||||||||||||||
| Domestic | 16 | 39 | 50 | 81 | 107 | |||||||||||||||
| Foreign | 3 | 4 | 10 | 8 | 17 | |||||||||||||||
| Interest income included in Net profit for non-performing loans: | ||||||||||||||||||||
| Domestic | 32 | 40 | 56 | 72 | 106 | |||||||||||||||
| Foreign | 4 | 2 | 8 | 9 | 8 | |||||||||||||||
The table below provides an analysis of the Group’s non-performing loans. For further information see the Risk and treasury management section on Credit risk.
| CHF million | 31.12.08 | 31.12.07 | 31.12.06 | 31.12.05 | 31.12.04 | |||||||||||||||
| Non-performing loans: | ||||||||||||||||||||
| Domestic | 1,431 | 1,349 | 1,744 | 2,106 | 2,772 | |||||||||||||||
| Foreign | 3,272 | 132 | 174 | 257 | 783 | |||||||||||||||
Total non-performing loans | 4,703 | 1,481 | 1,918 | 2,363 | 3,555 | |||||||||||||||
UBS does not, as a matter of policy, typically restructure loans to accrue interest at rates different from the original contractual terms or reduce the principal amount of loans. For more information refer to the “Credit risk” section of this report. Instead, specific loan allowances are established as necessary. Unrecognized interest related to restructured loans was not material to the results of operations in 2008, 2007, 2006, 2005 or 2004.
408
Table of Contents
Financial information |
Cross-border outstandings consist of general banking products such as loans and deposits with third parties, credit equivalents of over-the-counter (OTC) derivatives and securities financing, and the market value of the inventory of debt securities. Outstandings are monitored and reported on an ongoing basis by the credit risk control organization with a dedicated country risk information system. With the exception of the 33 most developed economies, these exposures are rigorously limited. The following analysis excludes Due from banks and Loans from Industrial Holdings.
| 31.12.08 | ||||||||||||||||||||
| CHF million | Banks | Private Sector | Public Sector | Total | % of total assets | |||||||||||||||
| United States | 13,869 | 71,584 | 14,234 | 99,687 | 4.9 | |||||||||||||||
| Japan | 2,093 | 13,159 | 38,922 | 54,174 | 2.7 | |||||||||||||||
| Germany | 19,098 | 10,418 | 6,010 | 35,526 | 1.8 | |||||||||||||||
| France | 11,469 | 7,048 | 6,807 | 25,324 | 1.3 | |||||||||||||||
| United Kingdom | 9,599 | 8,608 | 2,625 | 20,832 | 1.0 | |||||||||||||||
| Luxembourg | 2,883 | 17,586 | 0 | 20,469 | 1.0 | |||||||||||||||
| 31.12.07 | ||||||||||||||||||||
| CHF million | Banks | Private Sector | Public Sector | Total | % of total assets | |||||||||||||||
| United States | 13,110 | 192,049 | 16,545 | 221,704 | 9.8 | |||||||||||||||
| Japan | 1,761 | 12,883 | 36,717 | 51,361 | 2.3 | |||||||||||||||
| Germany | 21,384 | 12,354 | 2,249 | 35,988 | 1.6 | |||||||||||||||
| United Kingdom | 6,624 | 14,647 | 8,552 | 29,823 | 1.3 | |||||||||||||||
| Cayman Islands | 173 | 27,715 | 74 | 27,963 | 1.2 | |||||||||||||||
| France | 10,620 | 7,075 | 4,605 | 22,300 | 1.0 | |||||||||||||||
| 31.12.06 | ||||||||||||||||||||
| CHF million | Banks | Private Sector | Public Sector | Total | % of total assets | |||||||||||||||
| United States | 7,692 | 208,200 | 22,574 | 238,466 | 10.2 | |||||||||||||||
| Japan | 2,283 | 8,263 | 30,158 | 40,704 | 1.7 | |||||||||||||||
| United Kingdom | 11,149 | 16,098 | 559 | 27,806 | 1.2 | |||||||||||||||
| Germany | 15,240 | 8,080 | 1,574 | 24,894 | 1.1 | |||||||||||||||
409
Table of Contents
Financial information
Additional disclosure required under SEC regulations
Summary of movements in allowances and provisions for credit losses
The following table provides an analysis of movements in allowances and provisions for credit losses.
| CHF million | 31.12.08 | 31.12.07 | 31.12.06 | 31.12.05 | 31.12.04 | |||||||||||||||
Balance at beginning of year | 1,164 | 1,332 | 1,776 | 2,802 | 3,775 | |||||||||||||||
Domestic | ||||||||||||||||||||
Write-offs | ||||||||||||||||||||
| Banks | 0 | 0 | 0 | 0 | 0 | |||||||||||||||
| Construction | (6 | ) | (9 | ) | (14 | ) | (16 | ) | (49 | ) | ||||||||||
| Financial institutions | (37 | ) | (8 | ) | (11 | ) | (14 | ) | (24 | ) | ||||||||||
| Hotels and restaurants | (3 | ) | (7 | ) | (16 | ) | (26 | ) | (101 | ) | ||||||||||
Manufacturing1 | (31 | ) | (45 | ) | (40 | ) | (39 | ) | (77 | ) | ||||||||||
| Private households | (112 | ) | (68 | ) | (89 | ) | (131 | ) | (208 | ) | ||||||||||
| Public authorities | 0 | (1 | ) | 0 | 0 | 0 | ||||||||||||||
| Real estate and rentals | (10 | ) | (27 | ) | (44 | ) | (56 | ) | (109 | ) | ||||||||||
| Retail and wholesale | (4 | ) | (62 | ) | (20 | ) | (25 | ) | (68 | ) | ||||||||||
Services2 | (7 | ) | (20 | ) | (47 | ) | (35 | ) | (83 | ) | ||||||||||
Other3 | 0 | (21 | ) | (2 | ) | (4 | ) | (9 | ) | |||||||||||
Total domestic write-offs | (210 | ) | (268 | ) | (283 | ) | (346 | ) | (728 | ) | ||||||||||
Foreign | ||||||||||||||||||||
Write-offs | ||||||||||||||||||||
| Banks | (13 | ) | (1 | ) | (3 | ) | (164 | ) | (21 | ) | ||||||||||
| Chemicals | (1 | ) | 0 | 0 | 0 | (1 | ) | |||||||||||||
| Construction | 0 | 0 | 0 | 0 | (3 | ) | ||||||||||||||
| Electricity, gas and water supply | 0 | 0 | 0 | 0 | 0 | |||||||||||||||
| Financial institutions | (623 | ) | (15 | ) | 0 | (50 | ) | (34 | ) | |||||||||||
Manufacturing4 | (6 | ) | (21 | ) | (11 | ) | (8 | ) | (23 | ) | ||||||||||
| Mining | 0 | 0 | (1 | ) | (23 | ) | (8 | ) | ||||||||||||
| Private households | (5 | ) | (14 | ) | (7 | ) | (21 | ) | (8 | ) | ||||||||||
| Public authorities | (2 | ) | (2 | ) | (58 | ) | (22 | ) | (2 | ) | ||||||||||
| Real estate and rentals | 0 | 0 | 0 | (3 | ) | 0 | ||||||||||||||
| Retail and wholesale | 0 | 0 | 0 | (9 | ) | 0 | ||||||||||||||
| Services | 0 | 0 | 0 | 0 | (7 | ) | ||||||||||||||
| Transport, storage and communication | (7 | ) | 0 | 0 | 0 | 0 | ||||||||||||||
Other5 | (1 | ) | 0 | 0 | (5 | ) | (21 | ) | ||||||||||||
Total foreign write-offs | (658 | ) | (53 | ) | (80 | ) | (305 | ) | (128 | ) | ||||||||||
Total write-offs | (868 | ) | (321 | ) | (363 | ) | (651 | ) | (856 | ) | ||||||||||
Recoveries | ||||||||||||||||||||
| Domestic | 43 | 52 | 51 | 53 | 54 | |||||||||||||||
| Foreign | 1 | 3 | 11 | 10 | 5 | |||||||||||||||
Total recoveries | 44 | 55 | 62 | 63 | 59 | |||||||||||||||
Net write-offs | (824 | ) | (266 | ) | (301 | ) | (588 | ) | (797 | ) | ||||||||||
| Increase/(decrease) in credit loss allowance and provision | 3,007 | 242 | (108 | ) | (298 | ) | (216 | ) | ||||||||||||
| Collective loan loss provisions | (11 | ) | (4 | ) | (48 | ) | (76 | ) | (25 | ) | ||||||||||
Other adjustments6 | (266 | ) | (140 | ) | 13 | (64 | ) | 65 | ||||||||||||
Balance at end of year | 3,070 | 1,164 | 1,332 | 1,776 | 2,802 | |||||||||||||||
| Net foreign exchange | (43 | ) | (9 | ) | 10 | 50 | 2 | |||||||||||||
| Other adjustments | (223 | )7 | (131 | ) | 3 | (114 | ) | 63 | ||||||||||||
Total adjustments | (266 | ) | (140 | ) | 13 | (64 | ) | 65 | ||||||||||||
410
Table of Contents
Financial information |
Allocation of the allowances and provisions for credit losses
The following table provides an analysis of the allocation of the allowances and provisions for credit loss by industry sector and geographic location at 31 December 2008, 2007, 2006, 2005 and 2004. For a description of procedures with respect to allowances and provisions for credit losses, see the Risk and treasury management section on Credit risk.
| CHF million | 31.12.08 | 31.12.07 | 31.12.06 | 31.12.05 | 31.12.04 | |||||||||||||||
Domestic | ||||||||||||||||||||
| Banks | 16 | 10 | 10 | 10 | 10 | |||||||||||||||
| Construction | 39 | 43 | 72 | 91 | 112 | |||||||||||||||
| Financial institutions | 18 | 52 | 61 | 75 | 82 | |||||||||||||||
| Hotels and restaurants | 8 | 10 | 27 | 49 | 98 | |||||||||||||||
Manufacturing1 | 71 | 113 | 155 | 174 | 224 | |||||||||||||||
| Private households | 121 | 190 | 187 | 262 | 333 | |||||||||||||||
| Public authorities | 1 | 1 | 3 | 8 | 9 | |||||||||||||||
| Real estate and rentals | 50 | 57 | 99 | 168 | 250 | |||||||||||||||
| Retail and wholesale | 262 | 247 | 311 | 330 | 363 | |||||||||||||||
Services2 | 78 | 112 | 113 | 196 | 222 | |||||||||||||||
Other3 | 92 | 76 | 107 | 61 | 188 | |||||||||||||||
Total domestic | 756 | 911 | 1,145 | 1,424 | 1,891 | |||||||||||||||
Foreign | ||||||||||||||||||||
Banks4 | 6 | 18 | 20 | 35 | 246 | |||||||||||||||
| Chemicals | 960 | 1 | 4 | 5 | 4 | |||||||||||||||
| Construction | 8 | 1 | 2 | 2 | 1 | |||||||||||||||
| Electricity, gas and water supply | 2 | 3 | 8 | 16 | 15 | |||||||||||||||
| Financial institutions | 542 | 112 | 9 | 8 | 140 | |||||||||||||||
Manufacturing5 | 25 | 20 | 37 | 57 | 112 | |||||||||||||||
| Mining | 4 | 0 | 0 | 1 | 14 | |||||||||||||||
| Private households | 233 | 15 | 26 | 30 | 48 | |||||||||||||||
| Public authorities | 19 | 20 | 21 | 72 | 66 | |||||||||||||||
| Real estate and rentals | 208 | 8 | 4 | 3 | 5 | |||||||||||||||
| Retail and wholesale | 80 | 4 | 4 | 1 | 95 | |||||||||||||||
| Services | 19 | 4 | 7 | 27 | 32 | |||||||||||||||
| Transport, storage and communication | 185 | 1 | 1 | 0 | 1 | |||||||||||||||
Other6 | 0 | 12 | 6 | 8 | (75 | ) | ||||||||||||||
Total foreign | 2,291 | 219 | 149 | 265 | 704 | |||||||||||||||
Collective loan loss provisions7 | 23 | 34 | 38 | 86 | 207 | |||||||||||||||
Total allowances and provisions for credit losses8 | 3,070 | 1,164 | 1,332 | 1,775 | 2,802 | |||||||||||||||
411
Table of Contents
Financial information
Additional disclosure required under SEC regulations
Due from banks and loans by industry sector (gross)
The following table presents the percentage of loans in each industry sector and geographic location to total loans. This table can be read in conjunction with the preceding table showing the breakdown of the allowances and provisions for credit losses by industry sectors to evaluate the credit risks in each of the categories.
| in % | 31.12.08 | 31.12.07 | 31.12.06 | 31.12.05 | 31.12.04 | |||||||||||||||
Domestic | ||||||||||||||||||||
Banks1 | 0.4 | 0.3 | 0.2 | 0.4 | 0.5 | |||||||||||||||
| Construction | 0.3 | 0.3 | 0.4 | 0.6 | 0.7 | |||||||||||||||
| Financial institutions | 2.0 | 1.4 | 1.6 | 1.3 | 1.5 | |||||||||||||||
| Hotels and restaurants | 0.4 | 0.5 | 0.6 | 0.6 | 0.8 | |||||||||||||||
Manufacturing2 | 1.0 | 1.0 | 1.0 | 1.3 | 2.0 | |||||||||||||||
| Private households | 28.9 | 30.2 | 33.5 | 35.3 | 37.6 | |||||||||||||||
| Public authorities | 1.0 | 1.2 | 1.4 | 1.7 | 2.0 | |||||||||||||||
| Real estate and rentals | 2.9 | 2.9 | 3.2 | 3.7 | 4.1 | |||||||||||||||
| Retail and wholesale | 1.2 | 1.3 | 1.3 | 1.5 | 1.7 | |||||||||||||||
Services3 | 1.5 | 1.5 | 1.9 | 2.6 | 3.3 | |||||||||||||||
Other4 | 0.8 | 0.8 | 1.3 | 1.1 | 0.2 | |||||||||||||||
Total domestic | 40.4 | 41.4 | 46.4 | 50.1 | 54.4 | |||||||||||||||
Foreign | ||||||||||||||||||||
Banks1 | 15.4 | 15.0 | 14.2 | 10.2 | 12.3 | |||||||||||||||
| Chemicals | 0.7 | 0.2 | 0.4 | 0.9 | 0.1 | |||||||||||||||
| Construction | 0.1 | 0.2 | 0.1 | 0.1 | 0.0 | |||||||||||||||
| Electricity, gas and water supply | 0.7 | 0.5 | 0.3 | 0.5 | 0.3 | |||||||||||||||
| Financial institutions | 24.4 | 24.0 | 19.2 | 19.7 | 16.1 | |||||||||||||||
Manufacturing5 | 1.2 | 1.2 | 0.9 | 1.2 | 1.0 | |||||||||||||||
| Mining | 1.1 | 1.1 | 0.9 | 1.1 | 0.6 | |||||||||||||||
| Private households | 8.1 | 10.7 | 10.0 | 12.1 | 10.8 | |||||||||||||||
| Public authorities | 2.7 | 1.0 | 0.6 | 0.5 | 0.4 | |||||||||||||||
| Real estate and rentals | 1.0 | 1.3 | 1.2 | 0.9 | 0.3 | |||||||||||||||
| Retail and wholesale | 0.6 | 0.6 | 0.5 | 0.4 | 0.4 | |||||||||||||||
| Services | 2.4 | 2.3 | 4.7 | 1.8 | 2.9 | |||||||||||||||
| Transport, storage and communication | 0.9 | 0.4 | 0.4 | 0.4 | 0.3 | |||||||||||||||
Other6 | 0.3 | 0.1 | 0.2 | 0.1 | 0.1 | |||||||||||||||
Total foreign | 59.6 | 58.6 | 53.6 | 49.9 | 45.6 | |||||||||||||||
Total gross | 100.0 | 100.0 | 100.0 | 100.0 | 100.0 | |||||||||||||||
412
Table of Contents
Financial information |
Loss history statistics
The following is a summary of the Group’s loan loss history (relating to Due from banks and Loans). The table below does not include loans designated at fair value.
| CHF million, except where indicated | 31.12.08 | 31.12.07 | 31.12.06 | 31.12.05 | 31.12.04 | |||||||||||||||
Gross loans1 | 407,685 | 397,802 | 349,524 | 315,210 | 279,769 | |||||||||||||||
| Impaired loans | 9,145 | 2,392 | 2,628 | 3,434 | 4,699 | |||||||||||||||
| Non-performing loans | 4,703 | 1,481 | 1,918 | 2,363 | 3,555 | |||||||||||||||
Allowances and provisions for credit losses2 | 3,070 | 1,164 | 1,332 | 1,776 | 2,802 | |||||||||||||||
| Net write-offs | 824 | 266 | 301 | 588 | 797 | |||||||||||||||
| Credit loss (expense)/recovery | (2,996 | ) | (238 | ) | 156 | 375 | 241 | |||||||||||||
Ratios | ||||||||||||||||||||
| Impaired loans as a percentage of gross loans | 2.2 | 0.6 | 0.8 | 1.1 | 1.7 | |||||||||||||||
| Non-performing loans as a percentage of gross loans | 1.2 | 0.4 | 0.5 | 0.7 | 1.3 | |||||||||||||||
| Allowances and provisions for credit losses as a percentage of: | ||||||||||||||||||||
| Gross loans | 0.8 | 0.3 | 0.4 | 0.6 | 1.0 | |||||||||||||||
| Impaired loans | 33.6 | 48.7 | 50.7 | 51.7 | 59.6 | |||||||||||||||
| Non-performing loans | 65.3 | 78.6 | 69.4 | 75.2 | 78.8 | |||||||||||||||
Allocated allowances as a percentage of impaired loans3 | 31.8 | 41.7 | 46.3 | 46.4 | 51.6 | |||||||||||||||
Allocated allowances as a percentage of non-performing loans4 | 41.8 | 58.9 | 58.0 | 59.0 | 61.4 | |||||||||||||||
| Net write-offs as a percentage of: | ||||||||||||||||||||
| Gross loans | 0.2 | 0.1 | 0.1 | 0.2 | 0.3 | |||||||||||||||
| Average loans outstanding during the period | 0.2 | 0.0 | 0.1 | 0.1 | 0.2 | |||||||||||||||
| Allowances and provisions for credit losses | 26.8 | 22.9 | 22.6 | 33.1 | 28.4 | |||||||||||||||
| Allowance and provisions for credit losses as a multiple of net write-offs | 3.73 | 4.38 | 4.43 | 3.02 | 3.52 | |||||||||||||||
413
Table of Contents
Table of Contents
Cautionary statement regarding forward-looking statements | This report contains statements that constitute “forward-looking statements”, including but not limited to statements relating to the anticipated effect of transactions described herein, risks arising from the current market crisis and other risks specific to UBS’s business, strategic initiatives, future business development and economic performance. While these forward-looking statements represent UBS’s judgments and expectations concerning the development of its business, a number of risks, uncertainties and other important factors could cause actual developments and results to differ materially from UBS’s expectations. These factors include, but are not limited to: (1) the extent and nature of future developments in the market segments that have been or may be affected by the current market crisis and their effect on UBS’s assets and exposures, including UBS’s remaining net and gross exposures related to the United States mortgage market; (2) developments affecting the availability of capital and funding to UBS and other financial institutions, including any changes in UBS’s credit spreads and ratings; (3) other market and macroeconomic developments, including movements in local and international securities markets, credit spreads, currency exchange rates and interest rates; (4) changes in internal risk control and limitations in the effectiveness of UBS’s internal processes for risk management, risk control, measurement and modeling, and of financial models generally; (5) the possible consequences of governmental investigations of certain of UBS’s past business activities, including the possibility that tax or regulatory authorities in various jurisdictions will focus on the cross-border wealth management services provided by UBS and other financial institutions; (6) the degree to which UBS is successful in implementing its remediation plans and strategic and organizational changes, and whether those plans and changes will have the effects anticipated; (7) changes in the financial position or creditworthiness of UBS’s customers, obligors and counterparties, and developments in the markets in which they operate, including possible failures resulting from the current market crisis and adverse economic environment; (8) management changes and changes to the internal or overall structure of UBS’s business divisions; (9) the occurrence of operational failures, such as fraud, unauthorized trading and systems failures; (10) legislative, governmental and regulatory developments, including the effect of new and more stringent capital requirements and of direct or indirect regulatory constraints on UBS’s business activities; (11) changes in accounting standards or policies, and accounting determinations affecting the recognition of gain or loss, the valuation of goodwill and other assets or other matters; (12) changes in and the effect of competitive pressures, including the possible loss of key employees as a result of compensation issues or for other reasons; (13) technological developments; and (14) the impact of all such future developments on positions held by UBS, on its short-term and longer-term earnings, on the cost and availability of funding and on UBS’s capital ratios. In addition, these results could depend on other factors that we have previously indicated could adversely affect our business and financial performance which are contained in our past and future filings and reports, including those filed with the SEC. More detailed information about those factors is set forth in documents furnished by UBS and filings made by UBS with the SEC, including UBS’s Annual Report on Form 20-F for the year ended 31 December 2008. UBS is not under any obligation to (and expressly disclaims any obligation to) update or alter its forward-looking statements, whether as a result of new information, future events, or otherwise.
Rounding | Numbers presented throughout this report may not add up precisely to the totals provided in the tables. Percentages and percent changes are calculated based on rounded figures displayed in the tables and text and may not precisely reflect the percentages and percent changes that would be derived based on figures that are not rounded.
Imprint | Publisher: UBS AG, P.O. Box, CH-8098 Zurich; P.O. Box, Switzerland, CH-4002 Basel, Switzerland; www.ubs.com | Language: English/German | SAP-No. 80531E-0901
© UBS 2009. The key symbol and UBS are among the registered and unregistered trademarks of UBS. All rights reserved

Table of Contents
Table of Contents