0001610520 ifrs-full:DerivativesMember ifrs-full:Level2OfFairValueHierarchyMember ifrs-full:RecurringFairValueMeasurementMember ubs:CommodityContractsMember 2021-12-31 0001610520 ifrs-full:FinancialAssetsAtAmortisedCostMember ubs:FinancialAssetsOffBalanceSheetMember 2021-12-31 0001610520 ifrs-full:DerivativesMember ifrs-full:Level3OfFairValueHierarchyMember 2020-01-01 2020-12-31 0001610520 ifrs-full:AllowanceForCreditLossesMember ifrs-full:FinancialAssetsMeasuredAtFairValueThroughOtherComprehensiveIncomeCategoryMember ifrs-full:FinancialInstrumentsNotCreditimpairedMember ifrs-full:LifetimeExpectedCreditLossesMember ubs:UBSAGMember 2020-12-31 0001610520 ifrs-full:AllowanceForCreditLossesMember ubs:LoansToFinancialAdvisorsMember 2020-12-31 0001610520 ifrs-full:NotMeasuredAtFairValueInStatementOfFinancialPositionButForWhichFairValueIsDisclosedMember ubs:UBSAGMember ubs:LoansAndAdvancesToBanksMember ubs:NotSpecifiedLevelOfFairValueHierarchyMember 2020-12-31 0001610520 ifrs-full:FinancialAssetsMeasuredAtFairValueThroughOtherComprehensiveIncomeCategoryMember ifrs-full:Level1OfFairValueHierarchyMember ifrs-full:RecurringFairValueMeasurementMember ubs:UBSAGMember ubs:AssetBackedSecuritiesMember 2020-12-31 0001610520 ifrs-full:FinancialInstrumentsCreditimpairedMember ifrs-full:LifetimeExpectedCreditLossesMember ubs:UBSAGMember ubs:LombardLoanMember ubs:CommittedRevocableCreditLinesMember 2020-12-31 0001610520 ubs:BaselineScenarioMember ubs:HousePriceIndexMember ubs:PlusTwoAndAHalfPercentMember 2021-01-01 2021-12-31 0001610520 ifrs-full:FinancialInstrumentsNotCreditimpairedMember ifrs-full:LifetimeExpectedCreditLossesMember ifrs-full:LoanCommitmentsMember ubs:UBSAGMember ubs:InternalCreditGrades4To5Member 2021-12-31 0001610520 ifrs-full:Level3OfFairValueHierarchyMember ifrs-full:MarketComparablePricesMember ifrs-full:WeightedAverageMember ubs:TradedLoansLoansAtFairValueLoanCommitmentsAndGuaranteesMember ubs:LoanPriceEquivalentMeasurementInputMember 2020-12-31 0001610520 ifrs-full:Level2And3OfFairValueHierarchyMember ubs:AssetBackedSecuritiesMember ubs:UKPensionPlanMember 2020-12-31 0001610520 ubs:SwissPensionPlanMember ubs:ActuarialAssumptionOfInterestCreditRateMember 2020-01-01 2020-12-31 0001610520 ifrs-full:FinancialLiabilitiesAtFairValueThroughProfitOrLossThatMeetDefinitionOfHeldForTradingCategoryMember ifrs-full:RecurringFairValueMeasurementMember 2021-12-31 0001610520 ifrs-full:CommodityPriceRiskMember ubs:UBSAGMember ubs:AgencyTransactionsMember ubs:ExchangeTradedMember 2020-12-31 0001610520 ifrs-full:FinancialInstrumentsNotCreditimpairedMember ifrs-full:MortgagesMember ifrs-full:TwelvemonthExpectedCreditLossesMember ubs:UBSAGMember ubs:ChangesDueToSICRStageMovesMember 2020-01-01 2020-12-31
1
UNITED STATES
SECURITIES AND EXCHANGE COMMISSION
Washington, D.C. 20549
FORM
20-F
(Mark One)
☐
REGISTRATION STATEMENT PURSUANT TO SECTION 12(b) OR (g) OF THE
SECURITIES EXCHANGE ACT OF 1934
OR
☑
ANNUAL REPORT
EXCHANGE ACT OF 1934
For the fiscal year ended
December 31, 2021
OR
☐
TRANSITION REPORT PURSUANT TO SECTION 13 OR 15(d) OF THE
SECURITIES EXCHANGE ACT OF 1934
For the transition period from to .
OR
☐
SHELL COMPANY REPORT PURSUANT TO SECTION 13 OR 15(d) OF THE
SECURITIES EXCHANGE ACT OF 1934
UBS Group AG
Commission file number:
1-36764
UBS AG
Commission file number:
1-15060
Switzerland
(Jurisdiction of Incorporation or Organization)
UBS Group AG
Bahnhofstrasse 45
,
CH-8001
Zurich
, Switzerland
(Address of Principal Executive Office)
UBS AG
Bahnhofstrasse 45
,
CH-8001
Zurich
,
Switzerland
Aeschenvorstadt 1, CH-4051 Basel, Switzerland
(Address of Principal Executive Offices)
David Kelly
600 Washington Boulevard
Stamford, CT 06901
Telephone: (
203
)
719 3000
(Name, Telephone, E-mail and/or Facsimile number and Address of Company Contact Person)
Securities registered or to be registered pursuant to Section 12(b) of the Act:
Please see page 3.
Securities registered or to be registered pursuant to Section 12(g) of the Act:
Please see page 3.
Securities for which there is a reporting obligation pursuant to Section 15(d) of the Act:
Please see page 3.
2
Indicate the number of outstanding shares of each of each issuer’s classes of capital or common stock as of 31 December 2021:
UBS Group AG
Ordinary shares, par value CHF 0.10 per share:
3,702,422,995
(including 302,815,328 treasury shares)
UBS AG
Ordinary shares, par value CHF 0.10 per share:
3,858,408,466
(none of which are treasury shares)
Indicate by check mark if the registrants are well-known seasoned issuers, as defined in Rule 405 of the Securities Act.
UBS Group AG
Yes
☐
No
☑
UBS AG
Yes
☐
No
☑
If this report is an annual or transition report, indicate by check mark if the registrants are not required to file reports pursuant
to Section 13 or 15(d) of the Securities Exchange Act of 1934.
Yes
☐
No
☑
Note — Checking the box above will not relieve any registrant required to file reports pursuant to Section 13 or 15(d) of the
Securities Exchange Act of 1934 from their obligations under those Sections.
Indicate by check mark whether the Registrants (1) have filed all reports required to be filed by Section 13 or 15(d) of the
Securities Exchange Act of 1934 during the preceding 12 months (or for such shorter period that the Registrants were required
to file such reports) and (2) have been subject to such filing requirements for the past 90 days.
Yes
☑
No
☐
Indicate by check mark whether the registrants have submitted electronically every Interactive Data File required to be
submitted pursuant to Rule 405 of Regulation S-T (§ 232.405 of this chapter) during the preceding 12 months (or for such
shorter period that the registrants were required to submit such files).
Yes
☑
No
☐
Indicate by check mark whether the registrant is a large accelerated filer, an accelerated filer, or a non-accelerated filer or an
emerging growth company. See definition of “accelerated filer and large accelerated filer” and “emerging growth company” in
Rule 12b-2 of the Exchange Act. (Check One):
UBS Group AG
Large accelerated filer
☑
Accelerated filer
☐
Non-accelerated filer
☐
Emerging growth company
☐
UBS AG
Large accelerated filer
☐
Accelerated filer
☐
Non-accelerated filer
☑
Emerging growth company
☐
Indicate by check mark whether the registrant has filed a report on and attestation to its management’s assessment of the
effectiveness of its internal control over financial reporting under Section 404(b) of the Sarbanes-Oxley Act (15 U.S.C.
7262(b)) by the registered public accounting firm that prepared or issued its audit report.
UBS Group AG
Yes
☑
No
☐
UBS AG
Yes
☑
No
☐
Indicate by check mark which basis of accounting the registrants have used to prepare the financial statements included in this
filing.
U.S. GAAP
☐
International Financial Reporting Standards
as issued by the International Accounting
Standards Board
☑
Other
☐
If “Other” has been checked in response to the previous question, indicate by check mark which financial statement item the
registrants have elected to follow.
Item 17
☐
Item 18
☐
3
If this is an annual report, indicate by check mark whether the registrants are shell companies (as defined in Rule 12b-2 of the
Exchange Act)
Yes
☐
No
☑
Securities registered or to be registered pursuant to Section 12(b) of the Act:
UBS Group AG
Title of each class
Trading
symbol(s)
Name of each
exchange on
which registered
Ordinary Shares (par value of CHF 0.10 each)
UBS
New York Stock
Exchange
UBS AG
Title of each class
Trading
symbol(s)
Name of each
exchange on
which registered
ETRACS Alerian Midstream Energy Index ETN due June 21, 2050
AMNA
NYSE Arca
ETRACS Alerian Midstream Energy High Dividend Index ETN due July 19, 2050
AMND
NYSE Arca
ETRACS Alerian Midstream Energy Total Return Index ETN due October 20, 2050
AMTR
NYSE Arca
ETRACS Alerian MLP Index ETN Series B due July 18, 2042
AMUB
NYSE Arca
ETRACS Quarterly Pay 1.5x Leveraged MVIS BDC Index ETN due June 10, 2050
BDCX
NYSE Arca
E-TRACS MVIS Business Development Companies Index ETN due April 26, 2041
BDCZ
NYSE Arca
ETRACS Monthly Pay 1.5x Leveraged Closed-End Fund Index ETN due June 10, 2050
CEFD
NYSE Arca
E-TRACS Bloomberg Commodity Index Total Return Series B due October 31, 2039
DJCB
NYSE Arca
ETRACS 2x Leveraged MSCI USA ESG Focus TR ETN due September 15, 2061
ESUS
NYSE Arca
UBS AG FI Enhanced Large Cap Growth ETN due June 19, 2024
FBGX
NYSE Arca
ETRACS 2x Leveraged IFED Invest with the Fed TR Index ETN due September 15, 2061
FEDL
NYSE Arca
UBS AG FI Enhanced Europe 50 ETN due February 12, 2026
FIEE
NYSE Arca
UBS AG FI Enhanced Global High Yield ETN due March 3, 2026
FIHD
NYSE Arca
ETRACS Monthly Pay 2xLeveraged US High Dividend Low Volatility ETN Series B due
October 21, 2049
HDLB
NYSE Arca
ETRACS IFED Invest with the Fed TR Index ETN due September 15, 2061
IFED
NYSE Arca
ETRACS 2x Leveraged US Value Factor TR ETN due February 9, 2051
IWDL
NYSE Arca
ETRACS 2x Leveraged US Growth Factor TR ETN due February 9, 2051
IWFL
NYSE Arca
ETRACS 2x Leveraged US Size Factor TR ETN due February 9, 2051
IWML
NYSE Arca
E-TRACS Alerian MLP Infrastructure Index Series B due April 2, 2040
MLPB
NYSE Arca
ETRACS Quarterly Pay 1.5x Leveraged Alerian MLP Index ETN due June 10, 2050
MLPR
NYSE Arca
ETRACS 2x Leveraged MSCI US Momentum Factor TR ETN due February 9, 2051
MTUL
NYSE Arca
ETRACS Monthly Pay 1.5x Leveraged Mortgage REIT ETN due June 10, 2050
MVRL
NYSE Arca
ETRACS Monthly Pay 2xLeveraged Preferred Stock ETN due September 25, 2048
PFFL
NYSE Arca
ETRACS Linked to the NYSE® Pickens Core Midstream Index due August 20, 2048
PYPE
NYSE Arca
ETRACS 2x Leveraged MSCI US Quality Factor TR ETN due February 9, 2051
QULL
NYSE Arca
ETRACS 2x Leveraged US Dividend Factor TR ETN due February 9, 2051
SCDL
NYSE Arca
ETRACS Monthly Pay 2xLeveraged US Small Cap High Dividend ETN Series B due
November 10, 2048
SMHB
NYSE Arca
E-TRACS CMCI Total Return ETN Series B due April 5, 2038
UCIB
NYSE Arca
ETRACS 2x Leveraged MSCI US Minimum Volatility Factor TR ETN due February 9, 2051
USML
NYSE Arca
Securities registered or to be registered pursuant to Section 12(g) of the Act:
None
Securities for which there is a reporting obligation pursuant to Section 15(d) of the Act:
None
4
Cautionary Statement:
Refer to the
Cautionary Statement Regarding Forward -Looking Statements
Report 2021 (page 586).
Cross-reference table
Set forth below are the respective items of SEC Form 20-F, and the locations in this document where the corresponding
information can be found.
●
Annual Report
integral part hereof.
●
Supplement
refers to certain supplemental information contained in this forepart of the Form 20-F, starting on page
10 following the cross-reference table.
●
Financial Statements
refers to the consolidated financial statements of either UBS Group AG or UBS AG, or both,
depending upon the context, contained in the Annual Report.
In the cross-reference table below, page numbers refer to either the Annual Report or the Supplement, as noted.
Please see page 9 of the Annual Report for definitions of terms used in this Form 20-F relating to UBS.
Form 20-F item
Response or location in this filing
Item 1
. Identity of Directors,
Senior Management and
Advisors.
Not applicable.
Item 2
. Offer Statistics and
Expected Timetable.
Not applicable.
Item 3.
B – Capitalization and
Indebtedness.
Not applicable.
C – Reasons for the Offer and
Use of Proceeds.
Not applicable.
D – Risk Factors.
Annual Report,
(63-73).
Item 4
. Information on the Company.
A – History and Development of
the Company
1-3: Annual Report,
Corporate information
and
Contacts
(6). The registrants' agent is
David Kelly, 600 Washington Boulevard, Stamford, CT 06901.
4: Annual Report,
Our evolution
(14);
Our strategy
(16-19);
Our businesses
(21-32);
Note 30 to each set of Financial Statements (
Changes in organization and acquisitions
and disposals of subsidiaries and businesses
) (396 and 528)
5-6: Refer to our management discussion and analysis for a description of material
acquisitions and divestitures in Annual Report,
Our businesses
(21-32), as applicable,
Note 12 to each set of Financial Statements (
Property, equipment and software)
and 455) and
Note 30 to each set of Financial Statements (
Changes in organization and
acquisitions and disposals of subsidiaries and businesses
) (396 and 528).
7: Nothing to disclose.
8: Annual Report,
Information sources
B – Business Overview.
1, 2 and 5: Annual Report,
Our strategy, business model and environment
2a to each set of Financial Statements (
Segment reporting)
(308-309 and 439-440)
and
Note 2b to each set of Financial Statements (
Segment reporting by geographic location )
(310 and 441). See also Supplement (10).
3: Annual Report,
Seasonal characteristics
(82).
4: Not applicable.
6: None.
7: Information as to the basis for these statements normally accompanies the statements,
except where marked in the report as a statement based upon publicly available
information or internal estimates, as applicable. Annual Report,
Our businesses
(21-32),
as applicable.
8: Annual Report,
Regulation and supervision
(56-58)
and
developments
Supplement (11).
5
C – Organizational Structure.
Annual Report,
Our evolution
(14) and
Note 29 to each set of Financial Statements
(
Interests in subsidiaries and other entities)
(391-395 and 523-527).
D – Property, Plant and
Equipment.
Annual Report,
Property, plant and equipment
(558 and 570)
,
Note 1, 7) to each set of
Financial Statements (
Summary of material accounting policies: Property, equipment and
software
) (305 and 436), Note 12 to each set of Financial Statements (
Property,
equipment and software)
Information required by SEC
Regulation S-K Part 1400
Annual Report,
Information required under SEC regulation S-K: Subpart 1400
(559-564
and 571-577),
Loss history statistics
(130), and Note 9 to each set of Financial Statements
(
Financial Statements at amortized cost and other positions in scope of expected credit
loss measurement)
Item 4A
. Unresolved Staff
Comments.
None.
Item 5
. Operating and Financial Review and Prospects.
A – Operating Results.
1: Annual Report,
Our key figures
(8),
(404)
, Targets,
aspirations and capital guidance
(20),
Our businesses
(21-32),
Group performance
(77-
83), financial and
operating performance by business division and Group Functions (84-
95), Note 2a to each set of Financial Statements (
Segment reporting)
(308-309 and 439-
440), and
(554-557 and 566-569).
2: Not applicable
3: Annual Report,
Risk factors
(63-73),
Capital management
(151-168),
Currency
Management
(182) and Note 26 to each set of Financial Statements (
Hedge Accounting)
(373-376 and 505-508).
4:
Annual Report,
Our environment
(33-37),
Regulation and supervision
(56-58),
Regulatory and legal developments
(59-62),
Accounting and financial reporting
Note 1b to each set of Financial Statements (
Changes in accounting policies,
comparability and other adjustments
) (307 and 438).
A discussion on the results for the year 2020 compared with 2019 can be found on UBS
annual report 2020 filed with the SEC in Form 20-F on March 5, 2021, under
Financial
and operating performance
and under
Financial statements
AG.
B – Liquidity and Capital
Resources.
1: Annual Report,
Risk factors
(63-73)
,
Group performance
(77-83)
,
financial and
operating performance by business division and Group Functions (84-95),
Seasonal
characteristics
Interest rate risk in the banking book
Capital,
liquidity
and funding, and balance sheet
(150-185)
, Asset encumbrance
(174),
Note 23 to each set
of Financial Statements (
Restricted and transferred financial assets)
(366-368 and 498-
500) and Note 29(b) to each set of Financial Statements (
Interests in associates and joint
ventures
) (393 and 525).
2: Annual Report,
Capital,
liquidity and funding, and balance sheet
(150-185),
Management
(182), Note 10 to each set of Financial Statements (
Derivative instruments)
(322-323 and 453-454), Note 11 to each set of Financial Statements (
Financial assets
measured at fair value through other comprehensive income
) (324 and 455), Note 15 to
each set of Financial Statements (
Amounts due to banks and customer deposits,
and
Amounts due to banks, customer deposits, and funding from UBS Group AG
,
respectively
)
(327 and 458), Note 16 to each set of Financial Statements (
Debt issued
designated at fair value)
(328 and 459), Note 17 to each set of Financial Statements
(
Debt issued measured at amortized cost
) (329 and 460), and Note 26 to each set of
Financial Statements (
Hedge Accounting
) (373-376 and 505-508).
3: Annual Report,
Material cash requirements
Liquidity and funding management
(169-172), Note 24 to each set of Financial Statements (
Maturity analysis of financial
liabilities
) (369 and 501), and Note 12 to each set of Financial Statements (
Property,
equipment and software)
Liquidity and capital management is undertaken at UBS as an integrated asset and
liability management function. While we believe our 'working capital' is sufficient for the
company's present requirements, it is our opinion that, as a bank, our liquidity coverage
ratio (LCR) is the more relevant measure. For more information see, Annual Report,
Liquidity coverage ratio
6
C—Research and Development,
Patents and Licenses, etc.
Not applicable.
D—Trend Information.
Annual Report,
Our businesses
(21-32),
Our environment
(33-37),
Regulatory and legal
developments
Risk factors
(63-73),
Financial and operating performance
95) and
Top and emerging risks
(102).
E—Critical Accounting
Estimates
Not applicable.
Item 6.
A – Directors and Senior
Management.
1, 2 and 3: Annual Report,
Board of Directors
(199-215) and
Group Executive Board
(216-222).
4, 5: None.
B – Compensation.
1: Annual Report,
Compensation
(227-272), Note 1a, 4) to each set of Financial
Statements (
Share-based and other deferred compensation plans
) (303 and 434), Note 28
to each set of Financial Statements (
Employee benefits: variable compensation)
and 519-522) and Note 31 to each set of Financial Statements (
Related parties)
(397-398
and 529-531).
2: Annual Report,
Compensation
(227-272), Note 27 to each set of Financial Statements
(
Post-employment benefit plans)
(377-386 and 509-518).
C – Board practices.
1: Annual Report,
Board of Directors
(199-215). The term of office for members of the
Board of Directors and its Chairman expires after completion of the next Annual General
Meeting. The next Annual General Meeting is scheduled on 6 April 2022.
2: Annual Report,
Compensation
(227-272),
Clauses on change of control
Note 31 to each set of Financial Statements (
Related parties
) (397-398 and 529-531).
3: Annual Report,
Audit Committee
Compensation Committee
(210).
Refer to the Supplement (15) for information on UBS AG's Board of Directors' executive
sessions.
D—Employees.
Annual Report,
(44-46), and
Selected financial data
(554-557 and 566-569).
During 2021, business-aligned operations were moved from Group Functions into the
respective business divisions, resulting in a shift of personnel from Group Functions to
the business divisions. Comparative figures have been restated accordingly for both UBS
Group AG and UBS AG on the tables below.
UBS group AG (consolidated) personnel by business division and Group Functions:
As of
Full-time equivalents
31.12.21
31.12.20
31.12.19
Personnel (full-time equivalents)
71,385
71,551
68,601
Global Wealth Management
24,093
24,200
25,067
Personal & Corporate Banking
5,791
6,021
6,022
Asset Management
2,693
2,642
2,582
Investment Bank
7,665
7,552
7,423
Group Functions
31,144
31,136
27,507
UBS AG (consolidated) personnel by business division and Group Functions:
As of
Full-time equivalents
31.12.21
31.12.20
31.12.19
Personnel (full-time equivalents)
47,067
47,546
47,005
Global Wealth Management
22,986
23,039
23,982
Personal & Corporate Banking
4,993
5,131
5,156
Asset Management
2,375
2,351
2,314
Investment Bank
5,854
5,713
5,672
Group Functions
10,859
11,312
9,880
E—Share Ownership.
1 and 2: Annual Report,
Compensation
(227-272), Note 28 to each set of Financial
Statements (
Employee benefits: variable compensation
) (387-390 and 519-522) and Note
31b to each set of Financial Statements (
Equity holdings of key management personnel
)
(397 and 529).
7
Item 7.
A—Major Shareholders.
Annual Report,
Group structure and shareholders
(191),
196) and
(197).
The number of shares of UBS Group AG held by the respective shareholders listed on
page 191 of the Annual Report registered in the UBS share register with 3% or more of
total share capital as of 31 December 2021 is as follows:
Shareholder
Number of shares held
Chase Nominees Ltd., London
329,276,739
DTC (Cede & Co.), New York
214,183,469
Nortrust Nominees Ltd., London
177,762,902
According to the mandatory FMIA disclosure notifications filed with UBS Group AG and
SIX, the following entities disclosed holding of more than 3% of the total share capital of
UBS Group AG, with the following number of shares:
Shareholder
Number of shares held
Norges Bank, Oslo on 24 July 2019
115,997,262
BlackRock Inc., New York on 26 May 2020
181,261,629
Artisan Partners Limited Partnership,
Milwaukee on 18 November 2020
121,591,630
Massachusetts Financial Services Company, on
22 June 2021
116,145,996
Dodge & Cox International Stock Fund, on 24
January 2022
111,816,261
The number of shares of UBS AG held by UBS Group AG as of 31 December 2021 was
3,858,408,466 shares.
B—Related Party Transactions.
Annual Report,
Loans granted to GEB members
(270)
, Loans granted to BoD members
(270)
and
Note 31 to each set of Financial Statements (
Related parties
)
(397-398 and
529-531).
C—Interests of Experts and
Counsel.
Not applicable.
Item 8
. Financial Information.
A—Consolidated Statements
and Other Financial
Information.
1, 2, 3, 4, 6: Please see Item 18 of this Form 20-F.
5: Not applicable.
7: Information on material legal and regulatory proceedings is in Note 18 to each set of
Financial Statements (
Provisions and contingent liabilities
) (330-335 and 461-466).
For developments during the year, please see also the note
Provisions and contingent
liabilities
reports for the First, Second and Third Quarters 2021, filed on Forms 6-K dated April 27,
2021 (UBS Group AG) and April 30, 2021 (UBS AG), July 20, 2021 (UBS Group AG)
and July 23, 2021 (UBS AG) and October 26, 2021 (UBS Group AG) and October 29,
2021 (UBS AG), respectively; as well as the
Provisions and contingent liabilities
in the Fourth Quarter 2021 Report, filed on Form 6-K dated February 1, 2022. The
disclosures in each such Quarterly Report speak only as of their respective dates.
8: Annual Report,
(
2-4
)
, Our strategy
(16-19),
Investors
Dividend distribution
(182)
, Distributions to shareholders
(195).
B—Significant Changes.
Annual Report, Note 34 to each set of Financial Statements (
Events after the reporting
period
)
(400 and 533).
Item 9
. The Offer and Listing.
A – Offer and Listing Details.
1, 2, 3, 5, 6, 7: Not applicable.
4: Annual Report,
Listing of UBS Group AG shares
(185).
B—Plan of Distribution.
Not applicable.
C—Markets.
Cover page (3).
Annual Report,
Listing of UBS Group AG shares
Shares and participation
certificates
(194-195).
D—Selling Shareholders.
Not applicable.
E—Dilution.
Not applicable.
F—Expenses of the Issue.
Not applicable.
8
Item 10
. Additional Information.
A—Share Capital.
Not applicable.
B—Memorandum and Articles
of Association.
1: Supplement (15).
2: Annual Report,
Compensation governance
(236-237),
Compensation for the
Board of
Directors
(258-260).
Supplement (14-15).
3: Annual Report,
Share
capital structure
(192-196),
Shareholders' participation rights
(197-198),
Elections and terms of office
4: Supplement (13).
5: Annual Report,
Shareholders' participation rights
6: Annual Report,
Transferability, voting rights and nominee registration
Shareholders' participation rights
7: Annual Report,
Change of control and defense measures
8: Annual Report,
Significant Shareholders
(191).
9: Supplement (12-16).
10:
Supplement (12-16).
C—Material Contracts.
The Terms & Conditions of the several series of capital instruments issued to date, and to
be issued pursuant to Deferred Capital Contingent Plans, are exhibits 4.1 through 4.21 to
this Form 20-F. These notes are described under
Swiss SRB total loss-absorbing capacity
framework
Our deferred compensation plans
on page 252 of the Annual Report.
The Asset Transfer Agreement by which certain assets and liabilities of UBS AG were
transferred to UBS Switzerland AG is filed as Exhibit 4.22, and is described under
Joint
liability of UBS Switzerland AG
D—Exchange Controls.
Other than in relation to economic sanctions, there are no restrictions under the Articles
of Association of UBS Group AG or UBS AG, nor under Swiss law, as presently in force,
that limit the right of non-resident or foreign owners to hold UBS’s securities freely.
There are currently no Swiss foreign exchange controls or other Swiss laws restricting the
import or export of capital by UBS or its subsidiaries, nor restrictions affecting the
remittance of dividends, interest or other payments to non-resident holders of UBS
securities. The Swiss federal government may impose sanctions on particular countries,
regimes, organizations or persons which may create restrictions on exchange of control.
A current list, in German, French and Italian, of such sanctions can be found at
www.seco-admin.ch
. UBS may also be subject to sanctions regulations from other
jurisdictions where it operates imposing further restrictions.
E—Taxation.
Supplement (16-18).
F—Dividends and Paying
Agents.
Not applicable.
G—Statement by Experts.
Not applicable.
H—Documents on Display.
UBS files periodic reports and other information with the Securities and Exchange
Commission. You may read and copy any document that we file with the SEC on the
SEC’s website,
www.sec.gov
. Much of this information may also be found on the UBS
website at
www.ubs.com/investors
.
I—Subsidiary Information.
Not applicable.
Item 11
. Quantitative and Qualitative Disclosures About Market Risk.
(a) Quantitative Information
About Market Risk.
Annual Report,
Market risk
(131-139).
(b) Qualitative Information
About Market Risk.
Annual Report,
Market risk
(131-139).
(c) Interim Periods.
Not applicable.
Item 12.
A – Debt Securities
Not applicable.
B – Warrants and Rights
Not applicable.
C – Other Securities
Not applicable.
D – American Depositary Shares
Not applicable.
9
Item 13
. Defaults, Dividend
Arrearages and Delinquencies.
There has been no material default in respect of any indebtedness of UBS or any of its
significant subsidiaries or any arrearages of dividends or any other material delinquency
not cured within 30 days relating to any preferred stock of UBS Group AG or any of its
significant subsidiaries.
Item 14.
to the Rights of Security Holders
and Use of Proceeds.
None.
Item 15.
(a)
Disclosure Controls and
Procedures
Annual Report,
US disclosure requirements
(226), and
Exhibit 12 to this Form 20-F.
(b) Management’s Annual
Report on Internal Control over
Financial Reporting
Annual Report,
Management’s report on internal control over financial reporting
and 406).
(c) Attestation Report of the
Registered Public Accounting
Firm
Annual Report,
Report of Independent Registered Public Accounting Firm
(277 and 407).
(d) Changes in Internal Control
over Financial Reporting
None.
Item 16A.
Audit Committee
Financial Expert.
Annual Report,
Audit Committee
(209) and
Differences from corporate governance
standards relevant to US-listed companies
(190).
All Audit Committee members have accounting or related financial management
expertise and, in compliance with the rules established pursuant to the US Sarbanes-
Oxley Act of 2002, at least one member, the Chairperson Jeremy Anderson, qualifies as a
financial expert.
Item 16B.
Code of Ethics.
Annual Report,
Code of Conduct and Ethics
(48) UBS's Code of Conduct and Ethics
("the Code") is published on our website under
https://www.ubs.com/code
.The UBS
Code of Business Conduct does not include a waiver option, and no waiver from any
provision of the Code was granted to any employee in 2021.
Item 16C.
Principal Accountant
Fees and Services.
Annual Report,
Auditors
None of the non-audit services so disclosed were approved by the Audit Committee
pursuant to paragraph (c) (7)(i)(C) of Rule 2-01 of Regulation S-X.
Item 16D.
Exemptions from the
Listing Standards for Audit
Committees.
Not applicable.
Item 16E.
Purchases of Equity
Securities by the Issuer and
Affiliated Purchasers.
Annual Report,
Holding of UBS Group AG shares
UBS Group AG completed on 2 February 2021 its three-year share repurchase program
launched in March 2018. As announced on 26 January 2021, UBS Group AG launched in
February 2021 a new three-year share repurchase program of up to CHF 4 billion until
the 2024 AGM. Further, UBS announced on February 1, 2022 its intention to commence
a new 2022 repurchase program of up to USD 6 billion over two years, and expects to
execute up to USD 5 billion of share repurchases under both the existing 2021 and the
new 2022 share buyback program by the end of 2022.
Item 16F.
Changes in
Registrant’s Certifying
Accountant.
Not applicable.
Item 16G.
Corporate
Governance.
Annual Report,
companies
Item 16H.
Mine Safety
Disclosure.
Not applicable.
Item 16I.
Disclosure Regarding
Foreign Jurisdictions that
Prevent Inspections
Not applicable.
Item 17.
Financial Statements.
Not applicable.
Item 18.
Annual Report,
Financial statements
(273-546),
Significant regulated subsidiary and
sub-group information
(547-549) and
Additional regulatory information
Item 19.
Exhibits
Supplement (19-20).
10
Supplemental information
Item 4. Information on the Company
B – Business Overview
Item 4.B.2. Geographic breakdown of revenues
The operating regions shown in the table below correspond to the regional management structure of the Group. The allocation
of operating income to these regions reflects, and is consistent with, the basis on which the business is managed and its
performance is evaluated. These allocations involve assumptions and judgments that management considers to be reasonable,
and may be refined to reflect changes in estimates or management structure.
The main principles of the allocation methodology are that client revenues are attributed to the domicile of the client, and trading
and portfolio management revenues are attributed to the country where the risk is managed. This revenue attribution is consistent
with the mandate of the regional Presidents. Certain revenues, such as those related to Non-core and Legacy Portfolio within
Group Functions, are managed at a Group level. These revenues are included in the
Global
USD billion
Business Division
FY
Americas
Asia Pacific
EMEA
Switzerland
Global
Total
Global Wealth
Management
2021
10.7
2.9
4.0
1.9
0.0
19.4
2020
9.0
2.7
3.6
1.7
0.0
17.0
2019
9.1
2.2
3.4
1.6
0.1
16.4
Personal &
Corporate Banking
2021
0.0
0.0
0.0
4.3
0.0
4.3
2020
0.0
0.0
0.0
3.7
0.0
3.7
2019
0.0
0.0
0.0
3.7
0.0
3.7
Asset Management
2021
0.6
0.5
0.5
0.8
0.0
2.6
2020
0.7
0.5
0.5
0.7
0.6
3.0
2019
0.5
0.4
0.4
0.6
(0.0)
1.9
Investment Bank
2021
3.2
3.0
2.5
0.8
(0.0)
9.5
2020
3.3
2.7
2.4
0.8
0.0
9.2
2019
2.5
2.1
2.0
0.7
(0.0)
7.3
Group Functions
2021
0.0
0.0
0.0
0.0
(0.4)
(0.4)
2020
0.0
0.0
0.0
0.0
(0.5)
(0.5)
2019
0.0
0.0
0.0
0.0
(0.4)
(0.4)
Group
2021
14.5
6.5
7.0
7.9
(0.3)
35.5
2020
13.0
6.0
6.5
6.9
0.1
32.4
2019
12.0
4.7
5.8
6.7
(0.3)
28.9
11
Disclosure Pursuant To Section 219 of the Iran Threat Reduction And Syrian Human Rights Act
Section 219 of the US Iran Threat Reduction and Syria Human Rights Act of 2012 (“ITRA”) added Section 13(r) to the US
Securities Exchange Act of 1934, as amended (the “Exchange Act”) requiring each SEC reporting issuer to disclose in its
annual and, if applicable, quarterly reports whether it or any of its affiliates have knowingly engaged in certain activities,
transactions or dealings relating to Iran or with the Government of Iran or certain designated natural persons or entities
involved in terrorism or the proliferation of weapons of mass destruction during the period covered by the report. The required
disclosure may include reporting of activities not prohibited by US or other law, even if conducted outside the US by non-US
affiliates in compliance with local law. Pursuant to Section 13(r) of the Exchange Act, we note the following for the period
covered by this annual report:
UBS has a Group Sanctions Policy that prohibits transactions involving sanctioned countries, including Iran, and sanctioned
individuals and entities. However, UBS maintains one account involving the Iranian government under the auspices of the
United Nations in Geneva after agreeing with the Swiss government that it would do so only under certain conditions. These
conditions include that payments involving the account must: (1) be made within Switzerland; (2) be consistent with paying
rent, salaries, telephone and other expenses necessary for its operations in Geneva; and (3) not involve any Specially
Designated Nationals (SDNs) blocked or otherwise restricted under US or Swiss law. In 2021, the gross revenues for this UN-
related account were approximately USD 19,034.19. We do not allocate expenses to specific client accounts in a way that
enables us to calculate net profits with respect to any individual account. UBS AG intends to continue maintaining this account
pursuant to the conditions it has established with the Swiss Government and consistent with its Group Sanctions Policy.
As previously reported, UBS had certain outstanding legacy trade finance arrangements issued on behalf of Swiss client
exporters in favor of their Iranian counterparties. In February 2012 UBS ceased accepting payments on these outstanding
export trade finance arrangements and worked with the Swiss government who insured these contracts (Swiss Export Risk
Insurance "SERV"). On December 21, 2012, UBS and the SERV entered into certain Transfer and Assignment Agreements
under which SERV purchased all of UBS's remaining receivables under or in connection with Iran -related export finance
transactions. Hence, the SERV is the sole beneficiary of said receivables. There was no financial activity involving Iran in
connection with these trade finance arrangements in 2021, and no gross revenue or net profit.
In connection with these trade finance arrangements, UBS has maintained one existing account relationship with an Iranian
bank.
arrangements. In 2007, following the designation of the bank pursuant to sanctions issued by the US, UN and Switzerland, the
account was blocked under Swiss law and remained subject to blocking requirements until January 2016. Client assets as of 31
December 2021 were CHF 3,097.40. There have been no transactions involving this account. The gross revenues to report for
2021 are CHF 2.35.
From August to December 2021, UBS processed six payments in connection with Iran under an international program
designed to provide equitable access to COVID-19 vaccines, and UBS anticipates that such activity may continue, There were
no revenues or profits associated with these transactions. In addition, two payments were received by UBS under the same
international program in January and June 2021.
12
Item 10. Additional Information.
B—Memorandum and Articles of Association.
Please see the Articles of Association of UBS Group AG and of UBS AG (Exhibits 1.1 and 1.2, respectively, to this Form 20-
F) and the Organization Regulations of UBS Group AG and UBS AG (Exhibit 1.3 and 1.4, respectively, to this Form 20-F).
Set forth below is a summary of the material provisions of the Articles of Association of UBS Group AG (which we call the
“Articles” throughout this document), Organization Regulations of UBS Group AG (which we call the “Organization
Regulations” throughout this document) and relevant Swiss laws, in particular the Swiss Code of Obligations, relating to our
shares. This description does not purport to be complete and is qualified in its entirety by references to Swiss law, including
Swiss company law, and to the Articles and Organization Regulations.
The Articles of Association and Organization Regulations of UBS AG are substantially similar to the Articles and
Organization Regulations of UBS Group AG, so the following description applies equally to UBS AG, except where indicated
that it refers to only one of the companies.
The principal legislation under which UBS Group AG and UBS AG operate, and under which the ordinary shares of UBS
Group AG are issued, is the Swiss Code of Obligations.
The shares are registered shares with a par value of CHF 0.10 per share. The shares are fully paid up, and there is no liability of
shareholders to further capital calls by the company. The shares rank
pari passu
voting rights, entitlement to dividends, liquidation proceeds in case of the liquidation of the company, subscription or
preemptive rights in the event of a share issue (
Bezugsrechte
) and preemptive rights in the event of the issuance of equity-
linked securities (
Vorwegzeichnungsrechte
).
Each share carries one vote at our shareholders’ meetings. Voting rights may be exercised only after a shareholder has been
recorded in our share register as a shareholder with voting rights. Registration with voting rights is subject to certain
restrictions. See “Share Register and Transfer of Shares” below.
The Articles provide that we may elect not to print and deliver certificates in respect of registered shares. Shareholders may,
however, following registration in the share register, request at any time that we issue a written statement in respect of their
shares; however, the shareholder has no entitlement to the printing and delivery of share certificates
Shares and Shareholders
Share Register and Transfer of Shares
UBS Group AG’s share register is kept by UBS Shareholder Services, P.O. Box, CH-8098 Zurich, Switzerland. Shareholder
Services is responsible for the registration of the global shares. It is split into two parts – a Swiss register, which is maintained
by UBS Group, acting as Swiss share registrar, and a US register, which is maintained by Computershare Trust Company NA,
c/o Computershare Investor Services, P.O. Box 505000, Louisville, KY 40233-5000, United States (US), as US transfer agent.
Swiss law and the Articles of Association of UBS Group AG and UBS AG require UBS to keep a share register in which the
names, addresses and nationality (for legal persons, the registered office) of the owners (and beneficial owners) of registered
shares are recorded. The main function of the share register is to record shareholders entitled to vote and participate in general
meetings, or to assert or exercise other rights related to voting rights.
The transfer of shares which exist in the form of intermediary-held securities is effected by entries in securities accounts in
accordance with applicable law. The transfer of uncertificated securities is effected by way of a written declaration of
assignment and requires notice to the issuer.
In order to register shares in the share register, a purchaser must file a share registration form with the share register. Failing
such registration, the purchaser may not vote at or participate in shareholders’ meetings, but will be entitled to dividends, pre-
emptive and priority subscription rights, and liquidation proceeds.
Swiss law distinguishes between registration with and without voting rights. Shareholders must be registered in the share
register as shareholders with voting rights in order to vote and participate in general meetings or to assert or exercise other
rights related to voting rights. A purchaser of shares will be recorded in our share register with voting rights upon disclosure of
its name and nationality (and for legal persons, the registered office). However, we may decline a registration with voting
rights if the shareholder does not declare that it has acquired the shares in its own name and for its own account. If the
shareholder refuses to make such declaration, it will be registered as a shareholder without voting rights.
There is no limitation under Swiss law or our Articles on the right of non-Swiss residents or nationals to own or vote our
shares.
13
General Meeting
Under Swiss law, annual ordinary shareholders’ meetings must be held within six months after the end of our financial year,
which is 31 December. Shareholders’ meetings may be convened by the Board of Directors (BoD) or, if necessary, by the
statutory auditors, with twenty-days’ advance notice. The BoD is further required to convene an extraordinary shareholders’
meeting if so resolved by a shareholders’ meeting or if so requested by shareholders holding in aggregate at least 10% of our
nominal share capital. Shareholders representing shares with an aggregate par value of at least CHF 62,500 have the right to
request that a specific proposal be put on the agenda and voted upon at the next shareholders’ meeting. A shareholders’
meeting is convened by publishing a notice in the Swiss Official Commercial Gazette (
Schweizerisches Handelsamtsblatt
) at
least 20 days prior to such meeting. An invitation will be sent to all registered shareholders.
The Articles do not require a minimum number of shareholders to be present in order to hold a shareholders’ meeting.
Unless otherwise provided by law or the Articles (as indicated in this section), resolutions require the approval of an “absolute
majority” of the votes cast, excluding blank and invalid ballots, at a shareholders’ meeting. Shareholders’ resolutions requiring
a vote by absolute majority include:
●
Amendments to the Articles (except for the changes requiring a higher quorum as indicated below);
●
Elections of directors, Chairman of the BoD, members of the compensation committee and statutory auditors;
●
Election of the independent proxy;
●
Approval of the management report and the consolidated financial statements;
●
Approval of the annual financial statements and the resolution on the use of the balance sheet profit (declaration of
dividend);
●
Approval of the compensation for the BoD and the Group Executive Board (GEB) of UBS Group AG, including the
approval of the maximum aggregate amount of compensation of the members of the BoD for the period until the next
Annual General Meeting (AGM), the maximum aggregate amount of fixed compensation of the GEB members for the
following financial year and the aggregate amount of variable compensation of the GEB members for the preceding
financial year, with the exception of a supplementary amount of up to 40% of the average of total annual
compensation paid or granted to the GEB during the previous three years for persons joining or promoted within the
GEB;
●
Decisions to discharge directors and management from liability for matters disclosed to the shareholders’ meeting;
and
●
Passing resolutions on matters which are by law or by the Articles reserved to the shareholders’ meeting (e.g., the
ordering of an independent investigation into the specific matters proposed to the shareholders’ meeting).
Under Swiss corporate law, a resolution passed by at least two thirds of votes represented and an absolute majority of the par
value of the shares represented is required in order to approve:
●
A change in our stated purpose in the Articles;
●
The creation of shares with preferential voting rights;
●
A restriction on transferability or registration of shares;
●
An increase in authorized or contingent capital or the creation of reserve capital in accordance with Swiss banking
law;
●
An increase in share capital funded by equity capital, against contribution in kind or to fund acquisitions in kind and
the granting of special privileges;
●
Changes to pre-emptive rights;
●
A change of domicile of the corporation; or
●
Dissolution of the corporation.
Under the Articles, a resolution passed at a shareholders’ meeting with a supermajority of at least two thirds of the votes
represented at such meeting is required to:
●
Change the limits on BoD size in the Articles;
●
Remove one-fourth or more of the members of the BoD; or
●
Delete or modify these supermajority requirements.
At shareholders’ meetings, a shareholder can be represented by his or her legal representative or under a written power of
attorney by another shareholder eligible to vote or, under a written or electronic power of attorney, by the independent proxy.
Votes are taken electronically, by written ballot or by a show of hands. Shareholders representing at least 3% of the votes
represented may always request that a vote or election take place electronically or by a written ballot.
UBS AG follows the abovementioned statutory quorum rules in lieu of the quorum requirement of Rule 14.10(f)(3) of Cboe
BZX Exchange, Inc.
14
Net Profits and Dividends
Swiss law requires that at least 5% of the annual net profits of a corporation must be retained as general reserves until these
equal 20% of the corporation’s paid -up share capital. Any net profits remaining are at the disposal of the shareholders’
meeting, except that, if an annual dividend exceeds 5% of the nominal share capital, then 10% of such excess must be retained
as general reserves, unless such corporation qualifies as a holding company.
Under Swiss law, dividends may be paid out only if the corporation has sufficient distributable profits from previous business
years or if the reserves of the corporation are sufficient to allow distribution of a dividend. In either event, dividends may be
paid out only after approval by the shareholders’ meeting. The BoD may propose to the shareholders that a dividend be paid
out. The auditors must confirm that the dividend proposal of the BoD conforms with statutory law.
Dividends are usually due and payable after the shareholders’ resolution relating to the allocation of profits has been passed.
Under Swiss law, the statute of limitations in respect of dividend payments is five years.
Preemptive Rights
Under Swiss law, any share issue, whether for cash or non-cash consideration or for no consideration, is subject to the prior
approval of the shareholders’ meeting. Shareholders of a Swiss corporation have certain preemptive rights to subscribe for new
issues of shares in proportion to the nominal amount of shares held. The Articles or a resolution adopted at a shareholders’
meeting with a supermajority of at least two-thirds of the votes represented and an absolute majority of the nominal value of
the shares represented at the meeting may, however, limit or suspend preemptive rights in certain limited circumstances.
Notices
Notices to shareholders are made by publication in the Swiss Official Gazette of Commerce. The BoD may designate further
means of communication for publishing notices to shareholders.
Mandatory Tender Offer
Under the applicable provisions of the Swiss Financial Market Infrastructure Act, anyone who directly or indirectly or acting in
concert with third parties acquires more than 33 1/3% of the voting rights of a Swiss-listed company will have to submit a
takeover bid to all remaining shareholders. A waiver from the mandatory bid rule may be granted by our supervisory authority.
If no waiver is granted, the mandatory takeover bid must be made pursuant to the procedural rules set forth in the Swiss
Financial Market Infrastructure Act and implementing ordinances.
Board of Directors
Borrowing Power
Neither Swiss law nor the Articles restrict in any way our power to borrow and raise funds, provided that any such borrowing
is entered into on arms’ length terms.
Swiss law requires that the Articles determine the amount of loans that UBS Group AG, as a listed company, may grant to
members of its BoD. The Articles restrict UBS Group AG's ability to grant loans to BoD members as follows: First, loans to
the independent members of the BoD shall be made in accordance with the customary business and market conditions. Second,
loans to the non-independent members of the BoD shall be made in the ordinary course of business on substantially the same
terms as those granted to UBS employees. Third, the total amount of such loans shall not exceed CHF 20 million per member.
Conflicts of Interests
Swiss law does not have a general provision on conflicts of interests. However, the Swiss Code of Obligations requires
directors and members of senior management to safeguard the interests of the corporation and, as such, imposes a duty of care
and a duty of loyalty on directors and officers. This rule is generally understood as disqualifying directors and senior officers
from participating in decisions that directly affect them. Directors and officers are personally liable to the corporation for any
breach of these provisions. In addition, Swiss law contains a provision under which payments made to a shareholder or a
director or any person associated therewith, other than at arm’s length, must be repaid to us if the shareholder or director was
acting in bad faith.
In addition, our Organization Regulations provide that, subject to exceptional circumstances in which the best interests of UBS
dictate that the member of the BoD or senior management with a conflict of interest shall not participate in the discussions and
decision-making involving the interest at stake, the member of the BoD or senior management with a conflict of interest shall
participate in discussions and a double vote (meaning a vote with and a vote without the conflicted individual) shall take place.
A binding decision on the matter requires the same outcome in both votes.
15
Retirement of Board members
There is no age-limit requirement for retirement of the members of the BoD. The term of office for each Board member is one
year, and no Board member may serve for more than 10 consecutive terms of office. In exceptional circumstances the Board
can extend this limit.
Executive sessions
UBS AG's Organization Regulations require one-third of the members of the Board of Directors of UBS AG to be
independent. While neither Swiss law applicable to UBS AG nor the Organization Regulations require regularly scheduled
meetings of UBS AG's independent directors, the Organization Regulations of UBS Group AG require independent members
of the Board of Directors of UBS Group AG to meet, without the participation of the Chairman, at least twice a year. All
members of UBS Group AG’s Board of Directors are also members of UBS AG’s Board of Directors and all meetings of UBS
Group AG’s Board of Directors are held as combined meetings with the UBS AG's Board of Directors. As a result, the practice
currently in place at UBS AG is that the independent members regularly meet in sessions of independent members only. In
addition to these joint meetings, standalone meetings of UBS AG’s Board of Directors are held regularly
to discuss and agree
on finance, risk, compliance, operational risk, regulatory and other topics related to UBS AG.
The Company
Repurchase of Shares
Swiss law limits a corporation’s ability to hold or repurchase its own shares. We and our Swiss subsidiaries may only
repurchase shares if we have sufficient free reserves to pay the purchase price and if the aggregate nominal value of the shares
does not exceed 10% of our nominal share capital. Repurchases for cancellation purposes approved by the shareholders’
meeting are exempted from the 10% threshold. Furthermore, such own shares must be disclosed as negative items in our
shareholders’ equity. Such shares held by us or our Swiss subsidiaries do not carry any rights to vote at shareholders’ meetings.
Sinking fund provisions
There are no provisions in the Swiss law or in the Articles requiring the company to put resources aside for the exclusive
purpose of redeeming bonds or repurchasing shares.
Registration and Business Purpose
UBS Group AG was incorporated and registered as a corporation limited by shares (
Aktiengesellschaft
) under the laws of
Switzerland. UBS Group AG was entered into the commercial register of Canton Zurich on 10 June 2014 under the registration
number CHE-395.345.924 and has its registered domicile in Zurich, Switzerland. The business purpose of UBS Group AG, as
set forth in article 2 of its Articles, is the acquisition, holding, management and sale of direct and indirect participations in
enterprises of any kind, in particular in the area of banking, financial, advisory, trading and service activities in Switzerland
and abroad. UBS Group may establish enterprises of any kind in Switzerland and abroad, hold equity interests in these
companies, and conduct their management. UBS Group is authorized to acquire, mortgage and sell real estate and building
rights in Switzerland and abroad. UBS Group may provide loans, guarantees and other types of financing and security for
group companies and borrow and invest capital on the money and capital markets.
UBS AG was incorporated and registered as a corporation limited by shares (
Aktiengesellschaft
) under the laws of Switzerland.
It is entered into the commercial registers of Canton Zurich and Canton Basel-City under the registration number CHE-
101.329.561 and has registered domiciles in Zurich and Basel, Switzerland. The business purpose of UBS AG, as set forth in
article 2 of its Articles of Association, is the operation of a bank, with a scope of operations extending to all types of banking,
financial, advisory, trading and service activities in Switzerland and abroad. UBS AG is a wholly owned subsidiary of UBS
Group AG.
Duration and Liquidation
UBS Group AG and UBS AG have unlimited duration.
Under Swiss law, we may be dissolved at any time by a shareholders’ resolution which must be passed by a supermajority of at
least two-thirds of the votes represented and an absolute majority of the nominal value of the shares represented at the meeting.
Dissolution by law or court order is possible, for example, if we become bankrupt.
Under Swiss law, any surplus arising out of a liquidation (after the settlement of all claims of all creditors) is distributed to
shareholders in proportion to the paid-up nominal value of shares held.
16
Other
Ernst & Young Ltd
, Aeschengraben 9, CH-4051
Basel, Switzerland
, PCAOB number
1460
, have been appointed as statutory
auditors and as auditors of the consolidated accounts of both UBS Group AG and UBS AG. The auditors are subject to election
by the shareholders at the ordinary general meeting on an annual basis.
E—Taxation.
This section outlines the material Swiss tax and US federal income tax consequences of the ownership of UBS Group AG's
ordinary shares (defined as "UBS ordinary shares " in this section) by a US holder (as defined below) who holds UBS ordinary
shares as capital assets. This discussion addresses only US federal income taxation and Swiss income and capital taxation and
does not discuss all of the tax consequences that may be relevant to holders in light of their individual circumstances, including
other foreign tax consequences, state or local tax consequences, estate and gift tax consequences, and tax consequences arising
under the Medicare contribution tax on net investment income or the alternative minimum tax. It is designed to explain the
major interactions between Swiss and US taxation for US persons who hold UBS ordinary shares.
The discussion does not address the tax consequences to persons who hold UBS ordinary shares in particular circumstances,
such as tax-exempt entities, banks, financial institutions, life insurance companies, broker-dealers, traders in securities that
elect to use a mark-to-market method of accounting for securities holdings, holders that actually or constructively own 10% or
more of the total combined voting power of the voting stock of UBS Group AG or of the total value of stock of UBS Group
AG, holders that hold UBS ordinary shares as part of a straddle or a hedging or conversion transaction, holders that purchase or
sell UBS ordinary shares as part of a wash sale for tax purposes or holders whose functional currency for US tax purposes is
not the US dollar. This discussion also does not apply to holders who acquired their UBS ordinary shares through a tax-
qualified retirement plan, nor generally to unvested UBS ordinary shares held under deferred compensation arrangements.
If a partnership (or other entity treated as a partnership) holds UBS ordinary shares, the US federal income tax treatment of a
partner will generally depend on the status of the partner and the tax treatment of the partnership. A partner in a partnership
holding the UBS ordinary shares should consult its tax advisor with regard to the US federal income tax treatment of an
investment in the ordinary shares.
The discussion is based on the tax laws of Switzerland and the United States, including the US Internal Revenue Code of 1986,
as amended, its legislative history, existing and proposed regulations under the Internal Revenue Code, published rulings and
court decisions, as in effect on the date of this document, as well as the Convention between the United States of America and
the Swiss Confederation for the Avoidance of Double Taxation with Respect to Taxes on Income, which we call the “Treaty,”
all of which may be subject to change or change in interpretation, possibly with retroactive effect.
For purposes of this discussion, a “US holder” is any beneficial owner of UBS ordinary shares that is for US federal income
tax purposes:
●
A citizen or resident of the United States;
●
A domestic corporation or other entity taxable as a corporation;
●
An estate, the income of which is subject to US federal income tax without regard to its source; or
●
A trust, if a court within the United States is able to exercise primary supervision over the administration of the trust
and one or more US persons have the authority to control all substantial decisions of the trust.
Holders of UBS ordinary shares are urged to consult their tax advisors regarding the US federal, state and local and the Swiss
and other tax consequences of owning and disposing of these shares in their particular circumstances.
Dividends and Distributions
Dividends paid by UBS Group AG to a holder of UBS ordinary shares (including dividends on liquidation proceeds and stock
dividends) are in principle subject to a Swiss federal withholding tax at a rate of 35%.
Under the Capital Contribution Principle, the repayment of capital contributions, including share premiums made by the
shareholders after December 31, 1996 is in principle no longer subject to Swiss withholding tax if certain requirements
regarding the booking of these capital contributions are met.
Swiss companies listed on a Swiss stock exchange such as UBS Group AG can repay reserves from capital contributions to
their shareholders without deduction of Swiss withholding tax only if they distribute at least the same amount of taxable
dividends. For this reason UBS Group AG pays half of the dividend from capital contribution reserves and half of the dividend
from taxable dividends which is subject to 35% Swiss withholding tax.
17
A US holder resident in the US that qualifies for Treaty benefits may apply for a refund of the withholding tax withheld in
excess of the 15% Treaty rate (or for a full refund in case of qualifying retirement arrangements). The claim for refund must be
filed with the Swiss Federal Tax Administration, Eigerstrasse 65, CH-3003 Berne, Switzerland no later than December 31 of
the third year following the end of the calendar year in which the income subject to withholding was due. The form used for
obtaining a refund is one of the Swiss Tax Forms 82 (82 C for US companies; 82 E for other US entities; 82 I for individuals;
82 R for regulated investment companies), which may be obtained from the Swiss Federal Tax Administration at the address
above or downloaded from the web page of the Swiss Federal tax Administration. The form must be filled out in triplicate with
each copy duly completed and signed before a notary public in the United States. The form must be accompanied by evidence
of the deduction of withholding tax withheld at the source.
A US holder resident outside the US may be eligible for a withholding tax reclaim. If the US holder is resident in Switzerland,
a full reclaim based on the Swiss withholding tax Act is possible provided all necessary conditions are met. A US holder
resident neither in the US nor in Switzerland may be eligible for a partial reclaim provided that a Treaty between Switzerland
and the country of residence is applicable and that all necessary conditions are met.
Transfers of UBS Ordinary Shares
The purchase or sale of UBS ordinary shares, whether by Swiss resident or non -resident holders (including US holders), may
be subject to a Swiss securities transfer stamp duty of up to 0.15% calculated on the purchase price or sale proceeds if it occurs
through or with a bank or other securities dealer as defined in the Swiss Federal Stamp Tax Act in Switzerland or the
Principality of Liechtenstein. In addition to the stamp duty, the sale of UBS ordinary shares by or through a member of a
recognized stock exchange may be subject to a stock exchange levy.
Capital gains realized by a US holder upon the sale of UBS ordinary shares are not subject to Swiss income or gains taxes,
unless such US holder holds such shares as business assets of a Swiss business operation qualifying as a permanent
establishment for the purposes of the Treaty. In the latter case, gains are taxed at ordinary Swiss individual or corporate income
tax rates, as the case may be, and losses are deductible for purposes of Swiss income taxes. Furthermore, a US holder who is an
individual resident in Switzerland and holds such shares as business assets (as he qualifies as a professional trader of securities
as per Swiss tax law) may be liable to Swiss income taxes on gains.
The tax treatment of the UBS ordinary shares will depend in part on whether or not UBS Group AG is classified as a passive
foreign investment company, or PFIC, for US federal income tax purposes. Except as discussed below under “—Passive
Foreign Investment Company (PFIC) Rules”, this discussion assumes that UBS Group AG is not classified as a PFIC for
United States federal income tax purposes.
Dividends and Distributions
A US holder will include in gross income and treat as a dividend the gross amount of any distribution paid, before reduction
for Swiss withholding taxes, by UBS Group AG out of its current or accumulated earnings and profits (as determined for US
federal income tax purposes), other than certain pro-rata distributions of UBS ordinary shares, when the distribution is actually
or constructively received by the US holder. Distributions in excess of current and accumulated earnings and profits (as
determined for US federal income tax purposes) will be treated as a return of capital to the extent of the US holder’s basis in its
UBS ordinary shares and thereafter as capital gain. However, UBS Group AG does not expect to calculate earnings and profits
in accordance with US federal income tax principles. Accordingly, a US holder should expect to generally treat distributions
we make on UBS ordinary shares as dividends.
Dividends paid to a noncorporate US holder that constitute qualified dividend income will be taxable to the holder at
preferential rates, provided that the holder has a holding period in the shares of more than 60 days during the 121-day period
beginning 60 days before the ex-dividend date and meets other holding period requirements. Dividends paid by UBS Group
AG with respect to the ordinary shares will generally be qualified as dividend income provided that, in the year that the US
holder receives the dividend, the UBS ordinary shares are readily tradable on an established securities market in the United
States. The UBS ordinary shares are listed on the New York Stock Exchange, and UBS Group AG therefore expects that
dividends will be qualified dividend income.
For US federal income tax purposes, a dividend will include a distribution characterized under Swiss law as a repayment of
capital contributions if the distribution is made out of current or accumulated earnings and profits, as described above.
18
Dividends will generally be income from sources outside the United States for foreign tax credit limitation purposes, and will
generally be "passive" income for purposes of computing the foreign tax credit allowable to the holder. However, if (a) we are
50% or more owned, by vote or value, by US persons and (b) at least 10% of our earnings and profits are attributable to
sources within the US, then for foreign tax credit purposes, a portion of our dividends would be treated as derived from sources
within the US. With respect to any dividend paid for any taxable year, the US source ratio of our dividends for foreign tax
credit purposes would be equal to the portion of our earnings and profits from sources within the United States for such taxable
year, divided by the total amount of our earnings and profits for such taxable year. Special rules apply in determining the
foreign tax credit limitation with respect to dividends that are subject to preferential rates. The dividend will not be eligible for
the dividends-received deduction generally allowed to US corporations in respect of dividends received from other US
corporations.
In the case of dividends that are paid in Swiss francs, the amount of the dividend distribution included in income of a US
holder will be the US dollar value of the Swiss franc payments made, determined at the spot Swiss franc/US dollar rate on the
date such dividend distribution is includible in the income of the US holder, regardless of whether the payment is in fact
converted into US dollars. Generally, any gain or loss resulting from currency exchange fluctuations during the period from the
date the dividend payment is included in income to the date such dividend payment is converted into US dollars will be treated
as ordinary income or loss and will not be eligible for the special tax rate applicable to qualified dividend income. Such gain or
loss will generally be income or loss from sources within the United States for foreign tax credit limitation purposes.
Subject to US foreign tax credit limitations, the nonrefundable Swiss tax withheld and paid over to Switzerland will be
creditable or deductible against the US holder’s US federal income tax liability. To the extent a reduction or refund of the tax
withheld is available to a US holder under the laws of Switzerland or under the Treaty, the amount of tax withheld that is
refundable will not be eligible for credit against the US holder’s US federal income tax liability, whether or not the refund is
actually obtained. See “(a) Ownership of UBS Ordinary Shares – Swiss Taxation” above, for the procedures for obtaining a tax
refund.
Transfers of UBS Ordinary Shares
A US holder that sells or otherwise disposes of UBS ordinary shares generally will recognize capital gain or loss for US federal
income tax purposes equal to the difference between the US dollar value of the amount realized and its tax basis, determined in
US dollars, in such UBS ordinary shares. Capital gain of a non-corporate US holder is generally taxed at preferential rates if
the UBS ordinary shares were held for more than one year. The gain or loss will generally be income or loss from sources
within the United States for foreign tax credit limitation purposes. A US holder will not be allowed a foreign tax credit in
respect of any stamp duty or stock exchange levy that is imposed upon a transfer of UBS ordinary shares.
Passive Foreign Investment Company (PFIC) Rules
UBS Group AG believes that UBS ordinary shares should not currently be treated as stock of a PFIC for US federal income tax
purposes, and does not expect to become a PFIC in the foreseeable future. However, this conclusion is a factual determination
made annually and thus may be subject to change. It is therefore possible that UBS Group AG could become a PFIC in a future
taxable year. In general, UBS Group AG will be a PFIC with respect to a US holder if, for any taxable year in which the US
holder held UBS ordinary shares, either (i) at least 75% of the gross income of UBS Group AG for the taxable year is passive
income or (ii) at least 50% of the value, determined on the basis of a quarterly average, of UBS’s assets is attributable to assets
that produce or are held for the production of passive income (including cash). If UBS Group AG were to be treated as a PFIC,
gain realized on the sale or other disposition of UBS ordinary shares would in general not be treated as capital gain. Instead,
unless a US holder elects to be taxed annually on a mark-to-market basis with respect to its UBS ordinary shares, such gain and
certain “excess distributions” would be treated as having been realized ratably over the holder’s holding period for the shares
and generally would be taxed at the highest tax rate in effect for each such year to which the gain was allocated, together with
an interest charge in respect of the tax attributable to each such year. With certain exceptions, a holder’s UBS ordinary shares
will be treated as stock in a PFIC if UBS Group AG was a PFIC at any time during the holder’s holding period in the UBS
ordinary shares. In addition, dividends received from UBS Group AG would not be eligible for the preferential tax rate
applicable to qualified dividend income if UBS Group AG were to be treated as a PFIC either in the taxable year of the
distribution or the preceding taxable year, but would instead be taxable at rates applicable to ordinary income.
19
Item 19. Exhibits.
Exhibit
number
Description
1.1
1.2
. (Incorporated by reference to Exhibit 1.2 to UBS's
Annual Report on Form 20-F for the fiscal year ended December 31, 2019)
1.3
1.4
2(b)
Instruments defining the rights of the holders of long-term debt issued by UBS Group AG and its subsidiaries.
We agree to furnish to the SEC upon request, copies of the instruments, including indentures, defining the rights of
the holders of our long-term debt and of our subsidiaries’ long-term debt.
2(d)
4.1
(Incorporated by reference to Exhibit 4.2 to UBS AG's Annual Report on Form 20 -F for the fiscal year
ended December 31, 2012)
4.2
. (Incorporated by
reference to Exhibit 4.3 to UBS AG's Annual Report on Form 20-F for the fiscal year ended December 31, 2014)
4.3
. (Incorporated by reference to Exhibit 4.4 to UBS AG's Annual Report on Form 20 -F for the fiscal
year ended December 31, 2014)
4.4
. (Incorporated by reference to Exhibit 4.6 to UBS AG's Annual Report on Form 20 -F for the fiscal
year ended December 31, 2014)
4.5
. (Incorporated by reference to Exhibit 4.8 to UBS's Annual Report on Form 20-F for the fiscal year ended
December 31, 2015)
4.6
ended December 31, 2017)
4.7
on Form 20-F for the fiscal year ended December 31, 2017)
4.8
. (Incorporated by reference to Exhibit 4.17 to UBS's
Annual Report on Form 20-F for the fiscal year ended December 31, 2018)
20
4.9
. (Incorporated by reference to Exhibit 4.18 to UBS's
Annual Report on Form 20-F for the fiscal year ended December 31, 2018)
4.10
. (Incorporated by reference to Exhibit 4.19 to UBS's Annual Report on Form 20 -F for the fiscal year
ended December 31, 2018)
4.11
ended December 31, 2019)
4.12
(Incorporated by reference to Exhibit 4.18 to UBS's Annual Report on Form 20-F for the fiscal
year ended December 31, 2019)
4.13
(Incorporated by reference to Exhibit 4.19 to UBS's Annual Report on Form 20-F for the fiscal year
ended December 31, 2019)
4.14
. (Incorporated by reference to Exhibit 4.19 to UBS's Annual Report on Form 20 -F for the fiscal year
ended December 31, 2020)
4.15
. (Incorporated by reference to Exhibit 4.20 to UBS's Annual Report on Form 20-F for the fiscal year
ended December 31, 2020)
4.16
. (Incorporated by reference to Exhibit 4.21 to UBS's Annual Report on Form 20-F for the fiscal year
ended December 31, 2020)
4.17
. (Incorporated by reference to Exhibit 4.22 to UBS's Annual Report on Form 20 -F for the fiscal year
ended December 31, 2020)
4.18
4.19
4.20
4.21
4.22
(Incorporated by
reference to Form 6-K of UBS AG filed on June 17, 2015)
8
Significant Subsidiaries of UBS Group AG.
Please see Note 29 to each set of Financial Statements (
Interests in subsidiaries and other entities),
395 and 523-527 of the Annual Report.
12
13
15.1
15.2
101
Interactive Data Files (sections of the Annual Report formatted in inline XBRL (Extensible Business Reporting
Language)). Furnished electronically herewith.
21
SIGNATURES
The registrants hereby certify that they meet all of the requirements for filing on Form 20-F and that
they have duly caused the undersigned to sign this annual report on their behalf.
UBS Group AG
_/s/ Ralph Hamers _______________
Name: Ralph Hamers
Title: Group Chief Executive Officer
_/s/ Kirt Gardner__________________
Name: Kirt Gardner
Title: Group Chief Financial Officer
_/s/ Christopher Castello ___________
Name: Christopher Castello
Title: Group Controller and Chief Accounting Officer
UBS AG
_/s/ Ralph Hamers ________________
Name: Ralph Hamers
Title: President of the Executive Board
_/s/ Kirt Gardner__________________
Name: Kirt Gardner
Title: Chief Financial Officer
_/s/ Christopher Castello____________
Name: Christopher Castello
Title: Controller and Chief Accounting Officer
Date: March 7, 2022

UBS Group AG and UBS AG
Annual Report 2021

Our external reporting approach
The scope and content of our external reports are determined
by
Swiss legal and regulatory requirements,
accounting
standards, relevant stock and debt listing rules, including
regulations promulgated by the Swiss Financial Market
Supervisory Authority (FINMA), the SIX Swiss Exchange, the
US Securities and Exchange Commission (the SEC) and other
regulatory requirements, as well as by our financial reporting
policies.
At the center of our external reporting approach is the
annual report of UBS Group AG, which consists of disclosures
for UBS Group AG and its consolidated subsidiaries. We also
provide a combined annual report for UBS Group AG and
UBS AG consolidated, which additionally includes the
consolidated financial
statements of UBS AG
,
as
well as
supplemental disclosures required under SEC regulations, and
is the basis for our SEC Form 20-F filing.
Annual Reports
The 202
1
Annual Reports (the UBS Group AG Annual
Report 2021 and the combined UBS Group AG and UBS AG
Annual Report 2021) include the consolidated financial
statements of UBS Group AG and UBS AG, respectively, and
provide comprehensive information about our firm, including
our strategy, businesses, financial and operating performance,
and other key information. The reports are presented in US
dollars. The UBS Group AG Annual Report 2021 is partly
translated into German, with the German translation available
as of 1
1
March 202
2
under “Annual reporting” at
ubs.com/investors.
The consolidated financial statements of UBS Group AG
and UBS AG have been prepared in accordance with
International Financial Reporting Standards (IFRS). The
sections within “Risk, capital, liquidity and funding, and
balance sheet“ include certain audited financial information,
which forms part of the consolidated financial statements. The
Annual Reports also include the statutory financial statements
of UBS Group AG, which are the basis for our appropriation
of retained earnings and a potential distribution of dividends,
subject to shareholder approval at the Annual General
Meeting.
Sustainability Report
The
S
ustainability
R
eport
,
which will be available from
11 March 2022, provides disclosures on environmental, social
and governance topics for UBS Group.
Standalone reports of significant group entities
We publish separate standalone reports of significant group
e
ntities
for UBS
AG and
UBS Switzerland
AG. Selected
financial and regulatory key figures for these entities, as well
as for UBS Europe SE and UBS Americas Holding LLC, are also
included in our annual reports. The UBS Europe SE 2021
financial statements and complementary disclosures will be
published on our website in the first half of 2022.
Pillar 3 Report
The Pillar
3
Report
provides detailed quantitative and
qualitative information about risk, capital, leverage and
liquidity for UBS Group and
prudential key figures and
regulatory information for
UBS AG standalone,
UBS Switzerland AG standalone, UBS Europe SE consolidated
and UBS Americas Holding LLC consolidated.
We provide our combined Annual Report, the Pillar 3 Report, standalone reports of significant group
entities and the Sustainability Report as web disclosures at
ubs.com/investors
. Alternatively, we provide
the QR code on the right for rapid access to the above-mentioned reports and further information on
investor relations-related topics.


Contents
2
7
8
10
12
14
1
Our strategy, business model and
environment
16
20
21
33
38
56
59
63
2
Financial and
operating performance
76
77
84
87
90
92
94
95
3
Risk, capital, liquidity and funding,
and balance sheet
98
150
4
Corporate governance
and compensation
190
228
5
Financial
statements
283
413
6
Significant regulated subsidiary and sub-
group information
548
7
Additional
regulatory information
553
565
Appendix
579
582
585
586
Annual Report 2021 | Letter to shareholders
2
Dear shareholders,
2021 was the second year shaped by the pandemic, which
challenged and affected every aspect of society – from healthcare
to economics, to politics, to human interactions. UBS’s
performance in 2021 speaks to our resilience, our progress and
our future path. In 2022 we intend to continue making progress
on our strategic goals, and we remain dedicated to our clients,
shareholders, employees and society.
The current geopolitical situation has led to heightened
volatility across global markets. We are shocked by the violence
and tragedy caused by Russia’s invasion of Ukraine. Our hearts go
out to those affected and those who are suffering.
We are working to implement sanctions imposed by
Switzerland, the US, the EU, the UK and others – all of which have
announced unprecedented levels of sanctions against Russia and
certain Russian entities and nationals. These events, together with
counter-sanctions and other measures taken by Russia, will have
ongoing effects on the markets and the global economy.
2021 backdrop and our financial performance
Despite the continuing pandemic, market conditions were
constructive in 2021, with positive investor sentiment throughout
the year. Growth rebounded, with the global economy expanding
6.1% after contracting 3.1% in 2020. Global equities delivered
total returns of 18.5%. Economic, social and geopolitical tensions
increased during
the year, raising questions around the
sustainability and shape of the recovery. The pandemic adversely
impacted certain economic sectors, while supply chains and labor
markets remained challenging. A potential resurgence in global
inflation and tight labor markets in many countries could lead to
more restrictive monetary policy, and this has become an
additional concern for the market.
Within this environment, we delivered a strong financial
performance in 2021. We had the highest pre-tax and net profit
in 15 years, a 17.5% return on CET1 capital and a 14.1% return
on tangible equity. We maintained our cost / income ratio under
74%, which is in line with 2020 and more than six percentage
points better than the two years before that. For the second year
in a
row, we exceeded all our targets, with all regions and
businesses contributing to our performance. We deepened our
relationships with clients, resulting in high levels of activity and
strong flows across all our segments. This business momentum
led to our highest revenues in over a decade.
Our results included two exceptional items. The first item is a
loss of USD 861 million that we incurred in the first half of 2021
on the default of a US-based client of our prime brokerage
business. We have conducted a thorough review, we have put in
place appropriate measures to strengthen our relevant risk
management processes, and we have reflected the matter in our
annual performance assessment and compensation processes.
The second item occurred in the fourth quarter of 2021, when we
took additional provisions of EUR 650 million, bringing the total
to EUR 1.1 billion for the French cross-border matter. As
announced in December 2021, we have filed an appeal with the
French Supreme Court regarding the decision of the Court of
Appeal. This enables us to thoroughly assess the verdict of the
Court of Appeal and to determine the next steps in the best
interests of our stakeholders.
Our purpose and strategic direction
In 2021, we reconfirmed and continued to implement our
strategy. Last April, we introduced our purpose “Reimagining the
power of investing. Connecting people for a better world,” which
unites all of UBS behind a common goal. It´s the starting point for
every strategic decision; it will shape our future, help us capture
opportunities and allow us to grow from our already strong
position.
Our vision is to convene THE global ecosystem for investing:
where thought leadership is impactful, people and ideas are
connected, and opportunities are brought to life. In order to
achieve this vision, we identified five strategic imperatives:
(i) supporting, growing and aligning our network of clients,
connections and contributors; (ii) increasing our focus by playing
where we are positioned to win; (iii) enabling technology and
making it our differentiator; (iv) becoming simpler and more
efficient so it is easier for our clients to bank with us; and
(v) mobilizing employees behind our vision and acting as one firm.
Supporting clients, society and employees
We retained our clients’ trust as they continued to turn to us for
our content, advice and solutions. This resulted in USD 107 billion
in net new fee-generating assets in wealth management and
USD 48 billion of net new money in Asset Management. We also
helped clients finance businesses, homes and other liquidity needs
by extending USD 28 billion of net new loans to clients across
wealth management and personal banking. We now manage
over USD 4.6 trillion in assets on behalf of our clients. And we
increased our philanthropic activities, both with and for clients
and as a firm.
At UBS, we are committed to supporting the communities in
which we work, to understand the issues they face, and develop
long-term partnerships to catalyze positive change in people’s
lives. We focus our efforts on social inequalities by supporting
education and skills development as areas where we can drive
sustainable change. We also enable our employees to support
their communities through volunteering by partnering with
organizations such as Powercoders in Switzerland, which trains
refugees in computer science and information technology skills.
The pandemic meant we continued to provide COVID-19 relief to
the most vulnerable in 2021, including recovery and rebuilding
efforts through our community partners. Currently, to help victims
of the war in Ukraine, UBS Optimus Foundation and our
Community Impact teams are providing emergency relief to
refugees through the International Rescue Committee and are
matching the first USD 5 million of donations from employees and
clients, creating a combined impact of USD 10 million.


3
Axel A. Weber
Chairman of the Board of Directors
Ralph A.J.G. Hamers
Group Chief Executive Officer
Due to the ongoing pressure placed on employees by closures,
restrictions and lockdowns, we implemented new ways to help
employees through these difficult times. We offered tools and
resources to support employees’ physical, mental and social well-
being, and provided extra flexibility for child and elderly care. As
a result of our experience during the pandemic, we are developing
more permanent ways of flexible working for our employees,
while supporting a safe return to our offices as economies reopen.
We believe a hybrid approach will support a better work / life
balance and make us a more attractive employer, appealing to a
more diverse pool of applicants, such as working parents,
caregivers and those in continuing education. Moreover, flexible
working, by the nature of its emphasis on technology and virtual
collaboration, encourages an innovative mindset across our firm –
which is a big part of our strategy. In addition, we are reshaping
our future real estate footprint, reducing the number of buildings
and square meters we occupy, while also investing in our locations
to reimagine our workplace and support our sustainability
ambitions.
Capturing growth opportunities
After introducing our purpose and strategy on a page, we took
steps to ensure UBS is well positioned to capture the areas we see
as having the greatest growth potential. For example, regionally,
we expect most wealth will be created in the US and Asia Pacific.
As a result, we have identified these as key growth markets and
we have prioritized investments in those regions. EMEA continues
to be a core region for us and important to our global footprint,
and a region where we can improve profitability and drive focused
growth. And in Switzerland, we are further building on our
position as a digital leader.
Affluent clients and entrepreneurs are expected to generate
high revenue growth. So we are also expanding into new
segments to reach a much broader set of clients. Our plans to
acquire Wealthfront, announced in January 2022, will help us
deliver a digital wealth management offering to Millennial and
Gen Z affluent investors in the US, allow us to expand our wallet
share, lower the cost to serve and drive long-term growth.
Technology plays a large part in how we grow and deliver the
personalized, relevant, on-time and seamless services that clients
expect. That is why we are further investing in digitalization,
including artificial intelligence, data and analytics – areas we have
already been building up for years. We will digitalize what can be
made digital and become more agile to deliver faster. While not
increasing our total expenditure on technology, we are increasing
the amount we spend on our strategic priorities. Our aim is to
deliver around USD 1 billion in-year gross cost saves by 2023 in
order to fund our growth initiatives.
Leading in sustainability – our path to Net Zero
Over the years, UBS has established itself as a recognized leader
for sustainability in the financial sector. Recent ratings such as the
Dow Jones Sustainability Index and CDP have reconfirmed this. To
maximize impact and direct capital to where it is needed most,
we focus on three areas: (i) Planet, where we are making climate
a clear priority as we shift toward a lower carbon future; (ii)
People, where we are taking action, both within our own
workplace and within wider society, to promote a diverse,
equitable and inclusive society; and (iii) Partnerships, where we
are uniting with others and bringing people together around
common goals to achieve greater impact. To meet our impact
goals, we started assigning all Group Executive Board members
environmental, social and governance (ESG)-related objectives in
2021.
Sustainability is not just something we focus on because we
think it is the right thing to do. We also have a duty: to help
private clients protect and grow their wealth, to help firms
transition to sustainable ways of doing business, to ensure clients’
long
-
term success and to support them in fulfilling
their
responsibility to society. We strongly believe that this is the best
way to remain profitable and attractive to clients, investors and
talent in the long term. We are seeing an ever-increasing demand
in sustainable investing – invested assets in sustainability-focus
and impact strategies increased 78% in 2021 – and we will
continue to meet this need by growing our offering.


Annual Report 2021 | Letter to shareholders
4
In 2021, we published our Net-Zero and Beyond statement,
which sets out our commitment to transition our firm to net zero
and help our clients meet their transition targets by 2050. We
have developed and are transparently disclosing a climate road
map with intermediate targets for 2025, 2030 and 2035. The
“Say-on-Climate” advisory vote at the upcoming Annual General
Meeting (the AGM) is a key milestone on our journey to net zero,
reflecting our commitment to our shareholders having their say
on our firm’s climate roadmap. Furthermore, we strongly believe
in cross-company and cross-industry collaboration when it comes
to achieving net zero. As such, we are a founding member of both
the Net Zero Asset Managers Initiative and the Net-Zero Banking
Alliance.
Updated targets and ambitions to create value across
stakeholders
We are aiming to create sustainable value through the cycle.
Reflecting our improved operating performance over the last two
years, we updated our financial targets and kept our capital
guidance unchanged, including deploying up to one-third of
Group risk-weighted assets (RWA) and leverage ratio
denominator (LRD) in the Investment Bank. In addition, we
outlined selected commercial and ESG aspirations to support the
achievement of these targets.
First, for society at large, we are committed to building a better
world through our sustainability focus and the numerous
commitments you can find in our 2021 Annual and Sustainability
Reports. For example, we aim to reach net-zero emissions across
our business by 2050 and net-zero emissions resulting from our
own operations by 2025. We will also help our clients do good,
as we aspire to raise USD 1 billion in philanthropy assets to reach
25 million beneficiaries and we are targeting USD 400 billion in
sustainability-focus and impact investments by 2025.
Second, for our clients, we will assess how we are doing
through our commercial aspirations. We are optimistic that we
can maintain growth rates from net new fee-generating assets of
5% and above over the cycle. As a result, we aspire to surpass
USD 5 trillion, and then USD 6 trillion, in invested assets as clients
entrust us with managing their investments.
And third, we are targeting a 15–18% return on CET1 capital.
This is significantly higher than our previous target range and
reflects the progress we have made over the last two years. To
consistently achieve this, we are targeting a cost / income ratio of
70–73%. We have ambitious growth plans across our franchise
and are retaining our target to grow profits in global wealth
management by 10–15% over the cycle.
Our capital returns today and in the future
Reflecting the step-up in profitability, we are proposing to
increase the dividend to USD 0.50 per share for the 2021 financial
year, and to have a progressive cash dividend thereafter.
Additional excess capital will be used to buy back our shares, and
we repurchased USD 2.6 billion of shares in 2021. Given our
strong capital position, we are looking to repurchase up to USD 5
billion in 2022.
Proposed elections to the Board of Directors
Axel A. Weber is reaching the ten-year term limit set in our
Organization Regulations as the Chairman of the Board and will
therefore be stepping down in April 2022. On 20 November
2021, the Board of Directors of UBS Group AG announced that it
will nominate Colm Kelleher as the new Chairman and Lukas
Gähwiler as the new Vice Chairman for election to the Board at
the AGM on 6 April 2022.
Virtual AGM in 2022
To protect the health of shareholders and employees, in light of
the COVID-19 pandemic and continued uncertainty, the Board of
Directors has decided that the 2022 AGM will be held as a
webcast. As such, it will not be possible to physically attend the
AGM. Nevertheless, we look forward to your feedback and to
welcoming you to this year’s virtual AGM on 6 April.
Thank you for your ongoing support.
Yours sincerely,
Axel A. Weber
Ralph A.J.G. Hamers
Chairman of the
Group Chief Executive Officer
Board of Directors
5
6
Corporate information
UBS Group AG
under Art. 620ff. of the Swiss Code of Obligations as an Aktiengesellschaft, a
corporation limited by shares. Its registered office is at Bahnhofstrasse 45,
CH-8001 Zurich, Switzerland, telephone +41-44-234 11 11, and its corporate
identification number is CHE-395.345.924. UBS Group AG was incorporated
on 10 June 2014 and was established in 2014 as the holding company of the
UBS Group. UBS Group AG shares are listed on the SIX Swiss Exchange and
on the New York Stock Exchange (ISIN: CH0244767585; CUSIP: H42097107).
UBS Group AG owns 100% of the outstanding shares of UBS AG.
UBS AG
Art. 620ff. of the Swiss Code of Obligations as an Aktiengesellschaft, a
corporation limited by shares. The addresses and telephone numbers of the
two registered offices of UBS AG are: Bahnhofstrasse 45, CH-8001 Zurich,
Switzerland, telephone +41-44-234 11 11; and Aeschenvorstadt 1, CH-4051
Basel, Switzerland, telephone +41-61-288 50 50. The corporate identification
number is CHE-101.329.561. UBS AG is a bank. The company was formed on
29 June 1998, when Union Bank of Switzerland (founded in 1862) and
Swiss Bank Corporation (founded in 1872) merged to form UBS AG.
Contacts
Switchboards
For all general inquiries
ubs.com/contact
Zurich +41-44-234 1111
London +44-207-567 8000
New York +1-212-821 3000
Hong Kong SAR +852-2971 8888
Singapore +65-6495 8000
Investor Relations
UBS’s Investor Relations team manages
relationships with institutional investors,
research analysts and credit rating agencies.
ubs.com/investors
Zurich +41-44-234 4100
New York +1-212-882 5734
Media Relations
UBS’s Media Relations team manages
relationships with global media and
journalists.
ubs.com/media
Zurich +41-44-234 8500
mediarelations@ubs.com
London +44-20-7567 4714
ubs-media-relations@ubs.com
New York +1-212-882 5858
mediarelations@ubs.com
Hong Kong SAR +852-2971 8200
sh-mediarelations-ap@ubs.com
Office of the Group Company Secretary
The Group Company Secretary handles
inquiries directed to the Chairman or to other
members of the Board of Directors.
UBS Group AG, Office of the
Group Company Secretary
P.O. Box, CH-8098 Zurich, Switzerland
sh-company-secretary@ubs.com
Zurich +41-44-235 6652
Shareholder Services
UBS’s Shareholder Services team, a unit
of the Group Company Secretary’s office,
manages relationships with shareholders
and the registration of UBS Group AG
registered shares.
UBS Group AG, Shareholder Services
P.O. Box, CH-8098 Zurich, Switzerland
sh-shareholder-services@ubs.com
Zurich +41-44-235 6652
US Transfer Agent
For global registered share-related
inquiries in the US.
Computershare Trust Company NA
P.O. Box 505000
Louisville, KY 40233-5000, USA
Shareholder online inquiries:
www-us.computershare.com/
investor/contact
Shareholder website:
computershare.com/investor
Calls from the US
+1-866-305-9566
Calls from outside the US
+1-781-575-2623
TDD for hearing impaired
+1-800-231-5469
TDD for foreign shareholders
+1-201-680-6610
Corporate calendar UBS Group AG
Publication of the Sustainability Report 202
1
:
Friday, 11 March 2022
Annual General Meeting 2022 (webcast):
Wednesday, 6 April 2022
Publication of the first quarter 2022 report:
Tuesday, 26 April 2022
Publication of the second quarter 2022 report:
Tuesday, 26 July 2022
Publication of the third quarter 2022 report:
Tuesday, 25 October 2022
Corporate calendar UBS AG
Publication of the
first q
uarter 202
2
report:
Friday
,
29
April
202
2
Publication of the second
quarter 202
2
report:
Friday, 2
9
July 202
2
Additional publication dates of quarterly and annual reports
will be made available as part of the corporate calendar of UBS AG at
ubs.com/investors.
Imprint
Publisher: UBS Group AG, Zurich, Switzerland | ubs.com
Language: English
© UBS 2022. The key symbol and UBS are among the registered and
unregistered trademarks of UBS. All rights reserved.
7
Annual Report 2021
8
Our key figures
As of or for the year ended
USD million, except where indicated
31.12.21
31.12.20
31.12.19
1
Group results
Operating income
Operating expenses
Operating profit / (loss) before tax
Net profit / (loss) attributable to shareholders
Diluted earnings per share (USD)
2
Profitability and growth
3
Return on equity (%)
Return on tangible equity (%)
Return on common equity tier 1 capital (%)
Return on risk-weighted assets, gross (%)
Return on leverage ratio denominator, gross (%)
4
Cost / income ratio (%)
Effective tax rate (%)
Net profit growth (%)
Resources
3
Total assets
Equity attributable to shareholders
Common equity tier 1 capital
5
Risk-weighted assets
5
Common equity tier 1 capital ratio (%)
5
Going concern capital ratio (%)
5
Total loss-absorbing capacity ratio (%)
5
Leverage ratio denominator
4,5
Common equity tier 1 leverage ratio (%)
4,5
Going concern leverage ratio (%)
4,5
Total loss-absorbing capacity leverage ratio (%)
5
Liquidity coverage ratio (%)
6
Net stable funding ratio (%)
6
111
Other
Invested assets (USD billion)
7
Personnel (full-time equivalents)
Market capitalization
8
Total book value per share (USD)
8
Total book value per share (CHF)
8
Tangible book value per share (USD)
8
Tangible book value per share (CHF)
8
1 Refer to the “Accounting and financial reporting” and “Consolidated financial statements” sections of this report for information about the restatement of comparative information, where applicable. 2 Refer to
“Share information and earnings per share” in the “Consolidated financial statements” section of this report for more information. 3 Refer to the “Targets, aspirations and capital guidance” section of this report
for more information about our performance targets. 4 Leverage ratio denominators and leverage ratios for year 2020 do not reflect the effects of the temporary exemption that applied from 25 March 2020 until
1 January 2021 and was granted by FINMA in connection with COVID-19. Refer to the “Regulatory and legal developments” section of our Annual Report 2020 for more information. 5 Based on the Swiss
systemically relevant bank framework as of 1 January 2020. Refer to the “Capital, liquidity and funding, and balance sheet” section of this report for more information. 6 The final Swiss net stable funding ratio
(NSFR) regulation became effective on 1 July 2021. Prior to this date, the NSFR was based on estimated pro forma reporting. Refer to the “Capital, liquidity and funding, and balance sheet” section of this report for
more information. 7 Consists of invested assets for Global Wealth Management, Asset Management and Personal & Corporate Banking. Refer to “Note 32 Invested assets and net new money” in the “Consolidated
financial statements” section of this report for more information. 8 Refer to “UBS shares” in the “Capital, liquidity and funding, and balance sheet” section of this report for more information.
9
Alternative performance measures
An alternative performance measure (an APM) is a financial measure of historical or future financial performance, financial position or
cash flows other than a financial measure defined or specified in the applicable recognized accounting standards or in other applicable
regulations. We report a number of APMs in the discussion of the financial and operating performance of the Group, our business
divisions and our Group Functions. We use APMs to provide a more complete picture of our operating performance and to reflect
management’s view of the fundamental drivers of our business results. A definition of each APM, the method used to calculate it and
the information content are presented under “Alternative performance measures” in the appendix to this report. Our APMs may
qualify as non-GAAP measures as defined by US Securities and Exchange Commission (SEC) regulations.
1
2
4
Terms used in this report, unless the context requires otherwise
“UBS,” “UBS Group,” “UBS Group AG consolidated,” “Group,”
“the Group,” “we,” “us” and “our”
UBS Group AG and its consolidated subsidiaries
“UBS AG consolidated”
UBS AG and its consolidated subsidiaries
“UBS Group AG” and “UBS Group AG standalone”
UBS Group AG on a standalone basis
“UBS AG” and “UBS AG standalone”
UBS AG on a standalone basis
“UBS Switzerland AG” and “UBS Switzerland AG standalone”
UBS Switzerland AG on a standalone basis
“UBS Europe SE consolidated”
UBS Europe SE and its consolidated subsidiaries
“UBS Americas Holding LLC” and
“UBS Americas Holding LLC consolidated”
UBS Americas Holding LLC and its consolidated subsidiaries
In this report, unless the context requires otherwise, references to any gender shall apply to all genders.

10
Our Board of Directors
The Board of Directors (the BoD) of UBS Group AG, under the
leadership of the Chairman, consists of between 6 and 12 members
as per our Articles of Association. The BoD decides on the strategy
of the Group upon recommendation by the Group Chief Executive
Officer (the Group CEO) and is responsible for the overall direction,
supervision and control of the Group and its management, as well
as for supervising compliance with applicable laws, rules and
regulations. The BoD exercises oversight over UBS Group AG and
its subsidiaries and is responsible for establishing a clear Group
governance framework to provide effective steering and
supervision of the Group, taking into account the material risks to
which UBS Group AG and its subsidiaries are exposed. The BoD has
ultimate responsibility for the success of the
Group and for
delivering sustainable shareholder value within a framework of
prudent and effective controls, approves all financial statements for
issue
,
and appoints and removes all Group Executive Board
(GEB) members.


11
1
Axel A. Weber
Chairman of the Board of Directors / Chairperson of the
Corporate Culture and Responsibility Committee /
Chairperson of the Governance and Nominating Committee
2
Fred Hu
Member of the Governance and Nominating Committee /
member of the Risk Committee
3
Claudia Böckstiegel
Member of the Board of Directors
4
Patrick Firmenich
Member of the Audit Committee / member of the
Corporate Culture and Responsibility Committee
5
Reto Francioni
Member of the Compensation Committee /
member of the Risk Committee
6
Jeremy Anderson
Vice Chairman and Senior Independent Director /
Chairperson of the Audit Committee /
member of the Governance and Nominating Committee
7
Julie G. Richardson
Chairperson of the Compensation Committee /
member of the Governance and Nominating Committee /
member of the Risk Committee
8
Nathalie Rachou
Member of the Risk Committee
9
William C. Dudley
Member of the Corporate Culture and
Responsibility Committee / member of the Governance and
Nominating Committee / member of the Risk Committee
10
Jeanette Wong
Member of the Audit Committee / member of the
Compensation Committee / member of the Corporate Culture
and Responsibility Committee
11
Mark Hughes
Chairperson of the Risk Committee /
member of the Corporate Culture and Responsibility Committee
12
Dieter Wemmer
Member of the Audit Committee /
member of the Compensation Committee /
member of the Governance and Nominating Committee


12
Our Group Executive Board
1
Ralph A.J.G. Hamers
Group Chief Executive Officer
2
Mike Dargan
Group Chief Digital and Information Officer
3
Tom Naratil
Co-President Global Wealth Management and
President UBS Americas
4
Christian Bluhm
Group Chief Risk Officer
5
Sabine Keller-Busse
President Personal & Corporate Banking and
President UBS Switzerland
6
Edmund Koh
President UBS Asia Pacific
7
Markus Ronner
Group Chief Compliance and Governance Officer
8
Suni Harford
President Asset Management
9
Barbara Levi (since 1 November 2021)
Group General Counsel
10
Robert Karofsky
President Investment Bank
11
Iqbal Khan
Co-President Global Wealth Management and
President UBS Europe, Middle East and Africa
12
Kirt Gardner
Group Chief Financial Officer
13
Markus U. Diethelm (until 31 October 2021)
Group General Counsel

13
UBS Group AG operates under a strict dual board structure, as
mandated by Swiss banking law, and therefore the BoD delegates
the management of the business to the GEB. Under the leadership
of the Group CEO, the GEB was comprised of 12 members as of
31 December 2021 and has executive management responsibility
for the steering of the Group and its business. It assumes overall
responsibility for developing the strategies of the Group, the
business divisions and Group Functions, and implements the BoD-
approved strategies.
›
Refer to “Board of Directors” and “Group Executive Board”
in the “Corporate governance” section of this report or
to
ubs.com/bod
ubs.com/geb
our BoD and GEB members
14
Our evolution
Since our origins in the mid
-
19th century,
many
financial
institutions have become part of the history of our firm and
helped shape our development. 1998 was a major turning point:
two of the three largest Swiss banks, Union Bank of Switzerland
and Swiss Bank Corporation (SBC), merged to form UBS. Both
banks were well established and successful in their own right.
Union Bank of Switzerland had grown organically to become the
largest Swiss bank. In contrast, SBC had grown mainly through
strategic partnerships and acquisitions, including S.G. Warburg in
1995.
In 2000, we acquired PaineWebber, a US brokerage and asset
management firm with roots going back to 1879, establishing us
as a significant player in the US. Over the past 50 years, we have
also built a strong presence in the Asia Pacific region, where we
are the largest private bank
1
, with access to asset management
and investment banking capabilities.
After incurring significant losses in the 2008 financial crisis, we
started a strategic transformation in 2011 toward a business
model focused on our traditional
businesses
:
wealth
management
,
and personal and corporate banking in
Switzerland. We sought to revert to our roots, emphasizing a
client-centric model that requires less risk-taking and capital, and
we successfully completed that transformation.
Today, we are a leading truly global wealth manager,
2
USD 3.3 trillion in invested assets, a leading Swiss personal and
corporate bank, a
large
-
scale and diversified global asset
manager, and a focused investment bank.
In 2014, we began adapting our legal entity structure in
response to too-big-to-fail requirements and other regulatory
initiatives. First, we established UBS Group AG as the ultimate
parent holding company for the Group. In 2015, we transferred
personal and corporate banking and
Swiss
-
booked
wealth
management businesses from UBS AG to the newly established
UBS Switzerland AG. That same year we set up UBS Business
Solutions AG as the Group’s service company. In 2016, UBS
Americas Holding LLC became the intermediate holding company
for our US subsidiaries and our wealth management subsidiaries
across Europe were merged into UBS Europe SE. In 2019, we
merged UBS Limited, our UK-headquartered subsidiary, into UBS
Europe SE, our Germany-headquartered European subsidiary.
The chart below gives an overview of our principal legal entities
and our legal entity structure.
›
Refer to
ubs.com/history
›
Refer to the “Risk factors” and “Regulatory and legal
developments” sections of this report for more information
1
2
The legal structure of the UBS Group
Our strategy,
business
model and
environment
Management report
1
Our strategy, business model and environment | Our strategy
16
Our strategy
Our purpose
As the world’s leading wealth manager,
1
to make a difference for our clients, our employees, and society at
large.
It all starts with our purpose:
Reimagining the power of
investing. Connecting people for a better world.
Our
purpose unites us behind a common goal, provides direction on
the way forward and helps us build on our strengths.
We will reimagine the power of investing by developing
solutions that change how people look at finance and investing.
The power of investing can support achieving one’s personal
aspirations, whether through buying a home, growing a
company, supporting future financial goals or having an impact.
We will connect people, both internally and externally, to
convene an ecosystem where ideas and opportunities come
together to be successful and to make a difference.
We will help build a better world by thinking sustainably and
creating opportunities that help reduce, rather than contribute to,
inequalities.
Sustainability is at the core of our purpose
We know finance has a powerful influence on the world. At UBS,
we are reimagining the power of people and investments, to help
create a better world for everyone: a fairer society, a more
prosperous economy and a healthier environment. We are
partnering with our clients to help them mobilize their capital
toward a more sustainable world. It is why we have put
sustainability at the heart of our own purpose. To help us
maximize our impact and direct capital to where it is needed most,
we are focusing on three key areas to drive the sustainability
transition: planet, people, partnerships.
Planet:
toward a lower-carbon future. We will provide transparency on
our milestones along the way to make sure our progress can be
tracked. We are not only focused on our own journey; we are also
supporting our clients in their own transitions.
People:
wealth inequality, sharpening the focus of our client and
corporate philanthropy, and our employee-led community affairs
activities centered on health and education.
Partnerships:
leaders and standard setters, our goal is to make an impact on a
truly global scale. To create change, we realize that all of us have
to unite around common goals. That is why we engage with
regulators, policymakers and others to create standards and
support research and development across the financial sector.
Our promise to our clients
Helping clients to achieve their financial goals is the essence of
what we do. We aim to differentiate our service by delivering a
client experience that is:
–
Personalized:
clients’ needs.
–
Relevant:
What we deliver to our clients is relevant and
matters to them.
–
On-time:
anytime and anywhere.
–
Seamless:
Interacting
with us is simple, seamless, and
intuitive.
1
Based on Euromoney’s Award for Excellence, published on 10 September 2021:
euromoney.com/article/28teruws4k57c6h8c83k3/awards/awards -for-excellence/worlds-best-bank-for-wealth-management-2021-ubs
.
17
Convening THE global ecosystem for investing
We are at our best when our clients are able to access all of UBS
through a single relationship, to get a differentiated, personalized
experience, and when they are connected to other areas of the
firm, to providers, and to other clients with similar goals.
With our global footprint and USD 4.6 trillion in invested
assets, combined with our thought leadership, we not only attract
clients, but are also interesting to external contributors.
We are uniquely positioned to be the orchestrator of this
ecosystem. We are a gateway to a large and diverse client base,
we have strong relationships with contributors and we are a
thought leader in the industry. This positions us to curate offerings
and opportunities in the ecosystem, while leveraging our
networks, data, and analytics, to provide ultimate matchmaking
between clients and contributors.
That is why our vision is to convene THE global ecosystem for
investing – where thought leadership is impactful, people and
ideas are connected, and opportunities are brought to life.


Our strategy, business model and environment | Our strategy
18
Our strategic imperatives
Five strategic imperatives will help us deliver on our strategy, bring our purpose to life, fulfill our client promise and achieve our vision.
Behind these are a set of initiatives that will develop UBS along our strategic direction.
Clients, connections, contributors – delivering the power of investing
UBS is a firm that attracts clients, employees and thought leaders who have the power to enable change and
bring ideas to life, and who have capacity to do a lot of good. By bringing the best of UBS to our clients in a
seamless experience, growing our ecosystem and encouraging connections across it, we can deliver the full
power of investing to our clients. Client needs can be more broadly met. Our clients and the trust they place in us
will be put at the center of everything we do. Clients will benefit from having us as a trusted guide and thought
partner, having all our products and services available at their fingertips and getting a differentiated and
personalized experience.
Focus – play where we are positioned to win
We intend to maintain our position as a leading global wealth manager and to build on this strength. We will
prioritize our efforts where we can add the most value and make a difference. To achieve this we are working to
reduce duplication and reallocate resources as necessary, all while growing our position as the world’s leading
wealth manager.
Technology – make technology our differentiator
We will use our investments in technology to deliver a seamless client experience as part of our client promise.
We have been building our technology foundations over past years. We will move forward by focusing on how
clients experience UBS every day, becoming more agile and focusing on outcomes through a modular approach.
With this mind, we intend to transform the way we use and consider technology, thinking about it as a
differentiator for us.
Simplification and efficiency – increase ease of doing business and enable our journey
We can make it easier for our clients to do business with us, as well as for our employees to make decisions and
take responsibility. We intend to further streamline and standardize our functions, processes, entities and general
ways of doing business to increase efficiency and increase capacity to invest for future growth.
Culture – mobilize employees behind our future vision and act as one firm
We already have a strong, inclusive culture, grounded in our three keys to success: our Pillars, Principles and
Behaviors. We will further strengthen our culture so we can do more and do it better. Our purpose will unite us.
We will act as one firm, with common values and ambitions. In order to be successful on our journey, we will
further develop our cultural priorities.
19
Leveling up technology
Introduction
The world is faster, more digital and more data-driven than ever
before, with clients increasingly demanding service
s
that
are
digital first, anytime and anywhere, and underpinned by first-class
technology. In addition, the financial industry ecosystem is
constantly evolving, becoming even more competitive, open,
connected and location-independent every day.
This presents an opportunity for us to fully embrace technology
and make it a differentiator for our firm. Doing so is central to our
client promise to deliver a client experience that is personalized,
relevant, on-time and seamless.
To support our ambitions, we have appointed a Group Chief
Digital and Information Officer to the Group Executive Board. To
guide our digital transformation and to enhance the way we live
up to our client promise, we have also established a Leveling up
strategy based on five key pillars: Agile@UBS; quarterly business
reviews and digital roadmaps; modern tech; automation; and
engineering excellence (digital culture).
Agile@UBS
In order to deliver digital solutions faster and remain responsive
and adaptable, we are introducing a unified agile approach across
the whole firm.
To support this, we have developed a robust framework and
rollout plan, which includes clearly defined role profiles, a bespoke
playbook and a dedicated academy training suite.
Currently
,
we have 10,000 employees
across the firm
transitioning to the new Agile@UBS ways of working and we
expect this to increase to more than 20,000 by the end of 2022.
Relevant resources and training will also be available to all staff,
enabling everyone to apply agile principles to their work, thereby
helping to deliver an even better client experience.
Quarterly business reviews and digital roadmaps
Quarterly business reviews (QBRs) and digital roadmaps help us to
manage our technology investment portfolio in a more strategic
and flexible way. The QBRs serve as a forum to agree on the most
important objectives that align with our strategy and are intended
to ensure we deliver more frequent and valuable outcomes for
our clients. The digital roadmaps help us to keep investment and
design decisions aligned to our client promise and our longer-
term vision.
Modern tech
We believe the bank of the future will leverage a lean, modern
tech estate and Cloud-based applications. Modern tech makes a
shorter time to market possible, removes
dependencies,
accelerates digitalization and facilitates connection with the
financial industry ecosystem to provide better and faster client
services.
In line with our modern tech ambitions, we migrated over
1,000 applications to the Cloud during 2021 and established a
governance framework to identify and decommission legacy
technologies.
Automation
To achieve our vision, we are building a best-on-street
development and technology operations experience, powered by
modern development tools and automation techniques.
We have also introduced a new Artificial Intelligence, Data and
Analytics (ADA) center of expertise. ADA will bring together data
scientists and analytics experts from across the firm to ensure a
consistent firm-wide approach to these topics. ADA will also help
empower our strategy and ecosystem, using AI and machine
learning for the benefit of our clients.
Engineering excellence (digital culture)
To succeed in making technology a differentiator for our firm, we
must attract and retain the best engineers, which is only possible
by creating and fostering an engineering and digital culture of
excellence. Best-in-class tech learning journeys and curricula for
our engineers, a respected Certified and Distinguished Engineers
framework, an effective hiring strategy, and targeted competency
assessments and development plans for our technical staff will be
implemented to support this ambition.
›
Refer to the “Our businesses” section of this report for more
information about how we deploy our technology approach in
our businesses

Our strategy, business model and environment | Targets, aspirations and capital guidance
20
Targets, aspirations and capital guidance
We aim to create sustainable value through the cycle. Reflecting
our improved operating performance over the last two years, in
February 2022 we
updated
our financial targets,
which had
previously been set in January 2020.
In addition, we have outlined selected commercial and
environmental, social and governance (ESG) aspirations, which
support these targets.
Our capital guidance remains unchanged.
We intend to
operate with a CET1 capital ratio of around 13% and a CET1
leverage ratio of greater than 3.7%. The Investment Bank is
expected to represent up to one-third of Group risk-weighted
assets (RWA) and liquidity ratio denominator (LRD).
Performance against targets, aspirations and capital guidance
is taken into account when determining variable compensation.
The table below shows our updated financial targets and
aspirations, based on reported results.
›
Refer to “Society” and “Our focus on sustainability and climate”
in the “How we create value for our stakeholders” section and
to the “Corporate governance” section of this report for more
information about ESG
›
Refer to the “Compensation” section of this report for more
information about variable compensation
›
Refer to “Alternative performance measures” in the appendix to
this report for definitions of and further information about our
performance measures
Targets and aspirations
ESG
Selected aspirations
Commercial
Selected aspirations
Financial
Targets
Net-zero
own operations
(scopes 1 and 2) by 2025
USD 235 billion invested assets
aligned to net zero
by 2030, Asset Management
USD 1 billion philanthropy donations
to reach 25 million beneficiaries
raised by 2025
USD 400 billion invested assets
in sustainability-focus and impact
investing
1
More than USD 6 trillion
invested assets across Global Wealth
Management, Asset Management and
Personal & Corporate Banking
More than 5% growth
2
in net new fee-generating assets
of Global Wealth Management
15–18%
return on CET1 capital
70–73%
cost / income ratio
10–15%
2
growth in Global Wealth Management
profit before tax
1
strategies that have an explicit intention to generate measurable, verifiable, positive sustainability outcomes. Impact generated is attributable to investor action and / or contribution.
2
21
Our businesses
Delivering one ecosystem
We operate through four business divisions: Global Wealth
Management, Personal & Corporate Banking, Asset Management
and the Investment Bank. Our global reach and the breadth of our
expertise are major assets setting us apart from our competitors.
We see joint efforts as key to our growth, both within and
between business divisions. We aim to unlock the power of one
UBS through our innovative solutions and differentiated offerings.
We are at our best when we combine our strengths to provide
our clients more comprehensive and better solutions through, for
example, a Unified Global Markets team across Global Wealth
Management and the Investment Bank, and a Global Family
O
ffice
joint venture
.
Initiatives such as the
Group Franchise
Awards
teams and offer the whole firm to our clients.
How we deliver the whole firm to our clients – examples
Wealth management platforms
In all locations outside the Americas, we utilize the Wealth Management Platform, which is shared
between Global Wealth Management and Personal & Corporate Banking in Switzerland. This platform
can be navigated intuitively and supports strong advice capabilities across all channels, helping our clients
to benefit from a broader universe of products and services, simplified onboarding, and a better banking
experience. In the Americas, our clients benefit from the Wealth Management Americas Platform, as well
as our innovative partnership with Broadridge, which is aimed at improving productivity and the user
experience by revamping the technology used for our advisors’ workstations.
Separately managed accounts
In the US, we combined portfolio management and execution resources within Asset Management
during 2020. Alongside this, we introduced a new approach where Global Wealth Management clients
can access selected separately managed account (SMA) strategies in the Americas with no additional
management fees. This transformative move allows our advisors to focus on delivering the best ideas,
solutions and capabilities to our clients, regardless of where they originate in the firm.
Shifts and referrals
To ensure that our clients are best served according to their needs and foster growth by offering a
universal bank delivery model in Switzerland, we have introduced a holistic collaboration framework for
Personal & Corporate Banking. We systematically initiate client shifts from Personal Banking to Global
Wealth Management when the clients’ investing needs become sufficiently complex. In addition, we
encourage our client advisors to continuously generate leads for services provided by other business
divisions. Typical examples are corporate and institutional clients being introduced to Asset Management
for mandate solutions or to the Investment Bank for capital market transactions, thus providing access to
our global expertise, and entrepreneurs being introduced to Global Wealth Management, ensuring
holistic coverage of their corporate and private needs.
Global Family Office
Our Global Family Office unit brings together the capabilities of Global Wealth Management, Asset
Management and the Investment Bank to leverage growth opportunities and deliver holistic solutions. It
provides customized, institutional-style services to wealthy families and individuals seeking access to
equity markets and advisory services, and assisting clients with raising capital from public and private
markets.
Global Lending Unit
As a further step in serving the financing and lending needs of all UBS clients worldwide, we set up a
division-agnostic Global Lending Unit in 2020. Its key objective is delivering lending capabilities to clients
of both the Investment Bank and Global Wealth Management. The unit provides product expertise to
clients through collaboration with Investment Bank bankers and Global Wealth Management advisors. It
is organized with a regional focus by grouping existing regional resources and competencies to best serve
respective markets and clients.
Unified Global Markets team
We are continuing to develop a strategic partnership between Global Wealth Management and the
Investment Bank that is focused on growth – in our ultra high net worth, middle market institutions and
public finance businesses – and identifying synergies across the supporting infrastructure. This important
initiative includes a Unified Global Markets team, integrating risk management systems and simplifying
our regional operating processes.
Our strategy, business model and environment | Our businesses
22
Global Wealth Management
As a leading truly global wealth manager,
1
trillion in invested assets, our goal is to provide tailored financial
services, advice and investable solutions to wealthy individuals
and families around the world. The spectrum of our services
ranges from investment management to estate planning and
corporate finance advice, in addition to specific wealth
management products and services. The business is managed
globally across the regions.
Organizational changes
As part of the Group-wide creation of the Artificial Intelligence,
Data and Analytics center of expertise in October 2021, Global
Wealth Management established the Smart Technologies
&
Advanced Analytics Team. Leveraging our Evidence Lab
Innovations team’s experience and expertise, the Smart
Technologies & Advanced Analytics Team focuses on developing
a smart ecosystem that applies artificial intelligence, advanced
analytics and data science to empower our advisors with insights
and tools that help them anticipate client needs and deepen client
relationships.
On 1 July 2021, the Global Wealth Management Operations
team was formally integrated into Global Wealth Management,
following the Group-wide decision to move each of the firm’s
business-aligned Operations teams into their respective divisions
in order to become even more client-centric, agile and digital,
while creating a seamless experience for our clients.
We continually review all our businesses for growth
opportunities, future potential and efficiency. As a result, in 2021,
we completed the sale of our domestic wealth management
business in Austria. We also announced our intention to sell our
domestic wealth management business in Spain. As part of the
latter sale, the parties aim to negotiate a cooperation agreement
to provide clients with access to selected UBS products and
services. We expect this deal to close in the third quarter of 2022.
In December 2021, we signed an agreement to sell UBS Swiss
Financial Advisers AG, a Switzerland-based SEC-registered
investment advisor and FINMA-licensed securities firm that offers
US clients tailored investment solutions. On 26 January 2022, we
entered into an agreement to acquire Wealthfront, an industry-
leading digital wealth management provider. This acquisition is
aligned with our growth strategy in the Americas, will broaden
our reach among affluent investors and add a new digital-first
offering, increasing our distribution capabilities.
Our focus
We serve high net worth and ultra high net worth individuals,
families and family offices worldwide, as well as affluent clients in
selected markets. Our dedicated Global Family Office unit works
with ultra high net worth individuals and their families to deliver
bespoke solutions using the best of our global capabilities from
the Investment Bank and Asset Management.
Already a market leader in the ultra high net worth segment
outside the US,
1
of choice for the wealthiest clients in the US, many of whom
already have relationships with UBS. Our global footprint enables
us to capture growth in the largest and fastest-growing wealth
markets (the US and Asia Pacific, respectively).
Our Chief Investment Office (CIO) celebrated its 10th
anniversary in the first quarter of 2021. Growing from just three
employees in 2011 to over 1,100 by year-end 2021, our CIO has
a presence in 18 locations and is responsible for investment advice
and management of more than USD 3.3 trillion in assets globally.
Our CIO’s insights provide the foundation for the global UBS
ecosystem, which connects clients with content and solutions.
Close integration between idea generation and product
development results in CIO-aligned solutions delivering real value
to clients
and
spurr
ing
innovations such as the investment
modules in
UBS Manage Advanced [My Way]
. In Asia the
Direct
Investment Insights
function in our online banking platform
enables clients to trade directly based on CIO insights via their
smartphones or devices.
By making operational processes more efficient, we also
enhance advisor productivity. Our investment in operating
platforms and tools that support our clients and advisors is aimed
at better serving our clients’ needs and improving efficiency. As of
31 December 2021, more than 85% of invested assets outside
the Americas were booked on our strategic
Wealth Management
Platform
.
In the US, in collaboration with software provider
Broadridge, we are building the
Wealth Management Americas
Platform
,
for which we continue software delivery,
with
full
conversion targeted for 2023. The development of our platforms
is happening alongside enhancements to our digital capabilities,
for the benefit of our clients and advisors.
›
Refer to “Clients” in the “How we create value for our
stakeholders” section and to “Leveling up technology” in the
“Our strategy” section of this report for more information about
innovation and digitalization
How we operate
Our global footprint and presence in the world’s largest and
fastest-growing markets position us well to serve clients with
global interests and demands. They also make broad access across
solutions and geographies in different market conditions possible.
The US is our largest market, accounting for around half of our
invested assets. We are the largest private bank in Asia Pacific
2
and one of the largest in Latin America,
1
assets.
In Switzerland, we hold the leading market position
1
deploy the full range of UBS’s products and services. Our domestic
footprint in Western and Central Europe, the Middle East, and
Africa enables us to provide locally tailored offerings and ensures
we are close to our clients.
In April 2021, we opened a wealth management advisory
office in Doha, Qatar, as a further sign of our commitment to the
Middle East, an important and growing region for us.
1
Statements of market position for Global Wealth Management are based on UBS’s internal estimates and publicly available information about competitors’ invested assets.
2
23
Joint efforts with the Investment Bank, Asset Management and
selected external partners enable us to offer clients broad access
to financing, global capital markets and bespoke portfolio
solutions. For example, in the Americas, our Private Markets
OneBank Partnership has established one centralized function to
manage the origination and distribution of all private markets
transactions, side by side with the cross-divisional origination of
the Investment Bank’s Global Banking business. Additionally, to
ensure we
a
re placing resources close to clients, dedicated
investment bankers are now embedded in G
lobal
W
ealth
Management’s Private Wealth Services Hubs across the US. These
investment bankers work side by side with our financial advisors
to drive focused, proactive coverage of investment banking
business from our wealthiest clients.
›
Refer to “
Delivering one ecosystem
” in this section for examples
of the joint efforts of the business divisions
Our competitors fall into two categories: peers with a strong
position in the Americas but more limited global footprints, such
as Morgan Stanley and JP Morgan; and peers with similar
international footprints and operating models, but with
significantly smaller presences than UBS in the US, such as Credit
Suisse and Julius Baer. We have strategically built strong positions
in the fastest-growing client segment (ultra high net worth) and
region (Asia Pacific). The size and the diversification of our
footprint, as well as our premium brand and reputation, would be
difficult and expensive to replicate.
What we offer
Our distinctive approach to wealth management is designed to
help our clients pursue what matters most to them.
We aim to offer clients the best solutions, services and
expertise globally. Our experts provide thought leadership,
investment analysis and investment strategies, and develop and
source solutions for our clients. The CIO provides our
UBS House
View
, identifying investment opportunities designed to protect
and increase our clients’ wealth over the longer term.
Regional client strategy teams use direct client feedback,
findings from periodic
Investor Watch
the Smart Technologies & Advanced Analytics Team to deepen our
understanding of clients’ needs. Our product specialists deliver
inves
tment solutions
,
including our flagship investment
mandates, as well as innovative long-term themes and sustainable
investment offerings.
Clients benefit from our comprehensive expertise, including
wealth planning, investing, sustainability and impact investing,
philanthropy, corporate and banking services, as well as family
advisory services. We also offer extensive mortgage, securities-
based and structured lending expertise.
In 2020, we became the first major global financial institution
to make sustainable investments the preferred solution for private
clients investing globally. This focus led to high levels of client
activity in 2021 and reflected both our own belief in sustainable
and impact investing from a performance perspective and
increased client demand for relevant advice and solutions. Our
discretionary offerings aligned to our
s
ustainable investing
strategic asset allocation exceeded USD 30 billion in invested
assets as of 31 December 2021.
Our clients accounted for 75% (USD 647 million) of MPM
Capital’s Oncology Impact Fund 2 (OIF 2), which closed in 2021,
following the record-setting success of the UBS Oncology Impact
Fund (OIF 1) in 2016. UBS clients invested more than USD 1 billion
across both Funds. OIF 2 is one of the largest dedicated impact
investment funds in biotech history.
1
›
Refer to the Sustainability Report 2021, available from 11 March
2022 under “Annual reporting” at
ubs.com/investors
, for more
information about sustainability matters
We also continue to broaden our offering across asset classes
and themes, collaborating with external partners, such as
Rockefeller Asset Management, Rethink Impact and Bridge
Investment Group, to provide clients with access to differentiated
sustainable and impact investing opportunities.
We constantly work on responding swiftly to changing client
needs and further differentiating our leading discretionary and
advisory mandate offerings. As part of our long-term cooperation
with Partners Group, we have enhanced our offering by
broadening access to private equity. Clients can diversify their
mandates into private equity by accessing fully paid-in solutions
provided by Partners Group and UBS.
In 2020, we launched
UBS Manage Advanced [My Way]
, a
solution enabling clients to truly individualize their portfolios.
Based on strong momentum, client demand and inflows, we
intend to expand this solution into other markets.
›
Refer to “Clients” in the “How we create value for our
stakeholders” section and “Leveling up technology” in the “Our
strategy” section of this report for more information about
innovation and digitalization
1
Based on a review of healthcare thematic funds using data from PitchBook as of August 2021; impact investing definitions may vary.
Our strategy, business model and environment | Our businesses
24
25
Personal & Corporate Banking
As a leading Swiss personal and corporate bank, we provide
comprehensive financial products and services to private,
corporate and institutional clients. Personal & Corporate Banking
is the core of our universal bank in Switzerland.
Organizational changes
On 1 July 2021, the Personal & Corporate Banking Operations
team was formally integrated into Personal & Corporate Banking,
following the Group-wide decision to move each of the firm’s
business-aligned Operations teams into their respective divisions
in order to become even more client-centric, agile and digital,
while creating a seamless experience for our clients.
Our focus
Continu
ed
innovation and constant customer focus are the
factors that differentiate us, as a market leader across all business
areas we strive to grow at a rate higher than the market. We aim
to be digital at the core: our client promise is to bring the bank to
the app, enabling a user experience that is personalized, relevant,
on-time and seamless. Even before the COVID-19 pandemic,
digitalization had become a major part of our everyday lives. The
pandemic has increased its relevance and accelerated the pace of
technological change.
To drive this transformation, we need to better connect
business and technology, focus on the needs of our clients, and
empower our teams end to end; in other words, we need to be
agile. The agile transformation is essential for every part of our
organization. Agile is not new to us – we previously gained
experience with the
Digital Factory
Lighthouses
now scaling it to the next level. In 2021, we set up a new virtual
Agile Delivery Organization
.
›
Refer to “Clients” in the “How we create value for our
stakeholders” section and “Leveling up technology” in the “Our
strategy” section of this report for more information about
innovation and digitalization
In 2021, we brought additional sustainable finance solutions
to the market. We introduced
Green Mortgages
key4
, the first Swiss real estate platform for investment properties
offering sustainable mortgages in Switzerland. In addition, we
now offer Swiss retail clients
Renovation Mortgages
preferential interest rates to support energy-efficient renovations
and construction. On the investment side, we complemented our
UBS Vitainvest
possible to invest for retirement in a sustainable way through
Swiss third-pillar pension funds and vested benefits accounts. We
also launched the innovative
UBS Sustainability Analytics
helping
institutional clients to achieve full transparency by
screening their portfolios with regard to sustainability aspects.
›
Refer to the Sustainability Report 2021, available from 11 March
2022 under “Annual reporting” at
ubs.com/investors
, for more
information about sustainability-related topics
We collaborate with other companies to better satisfy our
clients’ diverse needs. For example, in 2021, we started a project
with Swiss fintech start-up Yokoy to provide extensive cash
management
services
to
corporate clients, from automated
generation of expense reports to validation of supplier invoices.
How we operate
We operate primarily in our Swiss home market. With our Personal
Banking and Corporate & Institutional Clients business areas, we
are organized into 10 regions, covering distinct Swiss economic
areas. Due to increasing client demand for remote access and the
increased offering via our in-demand digital and remote channels,
in the first quarter of 2021 we reduced our branch network by 44
branches to 195 branches. This followed the closure of 28 branches
in 2020.
We also support the international business activities of our Swiss
corporate clients through local hubs in New York, Frankfurt,
Singapore and Hong Kong SAR. No other Swiss bank offers its
corporate clients local banking capabilities abroad.
In Personal Banking, our main competitors are Credit Suisse,
PostFinance, Raiffeisen, cantonal banks, and other regional and
local Swiss banks; we also face competition from international
neobanks and other national digital market participants. Areas of
competition are basic banking services, mortgages and foreign
exchange, as well as investment mandates and funds.
In Corporate & Institutional Clients, Credit Suisse, cantonal
banks and globally active foreign banks are our main competitors.
We compete in basic banking services, cash management, trade
and
export finance, asset servicing, investment advice for
institutional clients, corporate finance and lending, and cash and
securities transactions for banks.
Our strategy, business model and environment | Our businesses
26
What we offer
Our personal banking clients have access to a comprehensive, life-
cycle-based offering, a broad range of basic banking products,
from payments to deposits, cards, and convenient online and
mobile banking, as well as lending (predominantly mortgages),
investments and retirement services. This is complemented by our
UBS KeyClub
reward program, which provides clients in
Switzerland with exclusive and attractive offers (some from third-
party partners). We work closely with Global Wealth
Management to provide our clients with access to leading private
banking and wealth management services.
Our corporate and institutional clients benefit from our
financing and investment solutions , in particular access to equity
and debt capital markets, syndicated and structured credit, private
placements, leasing, and traditional financing. We offer
transaction banking solutions for payment and cash management
services, trade and export finance, and global custody solutions
for institutional clients.
We work closely with the Investment Bank to offer capital
market and foreign exchange products, hedging strategies, and
trading capabilities, as well as corporate finance advice. In
cooperation with Asset Management, we also provide fund and
portfolio management solutions.
›
Refer to “
Delivering one ecosystem
” in this section for examples
of the joint efforts of the business divisions
27
Asset Management
Asset Management is a large-scale and diversified global asset
manager, with USD 1.2 trillion in invested assets. We offer
investment capabilities and styles across all major traditional and
alternative asset classes, as well as advisory support to institutions,
wholesale intermediaries and Global Wealth Management clients
around the world.
Organizational changes
Following the sale of our majority stake in 2020, in 2021 we sold
our remaining minority investment (48.8%) in Clearstream Fund
Centre AG (previously Fondcenter AG) to Deutsche Börse AG.
Long-term commercial cooperation arrangements remain in place
for the provision of services by Clearstream to UBS, including
collaboration on jointly servicing banks and insurance companies.
On 1 July 2021, the Asset Management Operations team was
formally integrated into Asset Management, following the Group-
wide decision to move each of the firm’s business-aligned
Operations teams into their respective divisions in order to
become even more client-centric, agile and digital, while creating
a seamless experience for our clients.
Our focus
Our strategy is focused on capitalizing on the areas where we
have a leading position and differentiated capabilities, so as to
drive further profitable growth and scale.
Sustainable and impact investing remains a key area, as clients
increasingly seek solutions that combine their investment goals
with sustainability objectives. We are continuing the expansion of
our world-class capabilities through: product and service
innovation; dedicated research; integrating environmental, social
and governance (ESG) factors into our investment processes by
leveraging our proprietary analytics; and active corporate
engagement.
During 2021, we enhanced our ESG methodology and data
sets, deepened the integration of carbon data into our investment
processes, and worked to expand our ESG integration across
alternative asset classes. We also increased the entire range of
UBS sustainable exchange-traded funds (ETFs), which represented
USD 40 billion in invested assets as of 31 December 2021. These
ETFs provide exposure to various asset classes with significantly
lower carbon intensity compared with their respective market cap-
weighted parent indices and help investors to both reduce their
climate risks and benefit from opportunities arising from the shift
toward a lower-carbon economy.
In addition, we continued to expand our Climate Aware suite
of products and our Climate Aware invested assets grew to
USD 23 billion, a 53% increase year on year. Our sustainability
focus and impact invested assets totaled USD 172 billion, a 77%
increase year on year.
As a founding member of the Net Zero Asset Managers
1
initiative, we published an interim target and have committed to
align USD 235 billion of invested assets by 2030. We are one of
the largest and most diversified firms to have set a 2030 target
and we continue to work with our clients, standard setters and
industry bodies to help develop the new methodologies, tools and
data needed by investors to effect further change.
›
Refer to the Sustainability Report 2021, available from 11 March
2022 under “Annual reporting” at
ubs.com/investors
, for more
information about sustainability matters
In response to the increasing importance of private markets
and alternative investments, we are building on our existing
expertise in these areas, including our real estate and hedge fund
businesses, as well as our capabilities across infrastructure, private
equity and private debt.
We also continue to develop our award-winning
2
indexed
businesses globally, including ETFs in Europe, Switzerland and
Asia. We focus on sustainable investing across our index product
range and provide customization while leveraging our highly
scalable platform.
›
Refer to “Clients” in the “How we create value for our
stakeholders” section and to “Leveling up technology” in the
“Our strategy” section of this report for more information about
innovation and digitalization
Geographically, we are building on our extensive and long-
standing presence in the Asia Pacific region. In China, one of the
world’s fastest-growing asset management markets, we continue
to invest in our leading presence and products, both on- and
off-shore, and are ranked as the number one foreign manager of
inbound invested assets in Greater China.
3
In the rapidly evolving and attractive wholesale segment, we
aim to significantly expand our market share through a
combination of measures: a continued increase in the share of
clients’ business; expansion of our strategic partnerships with
distributors; the build-out of our client service and product shelf
offerings; and the launch of new white-labeling and
implementation capabilities.
1
netzeroassetmanagers.org
2
Passive Manager of the Year in the Insurance Asset Risk EMEA Awards, January 2021 and ranked fourth largest ETF provider in Europe as of December 2021 (source: ETFGI).
3
Ranking compiled by Broadridge in October 2021.
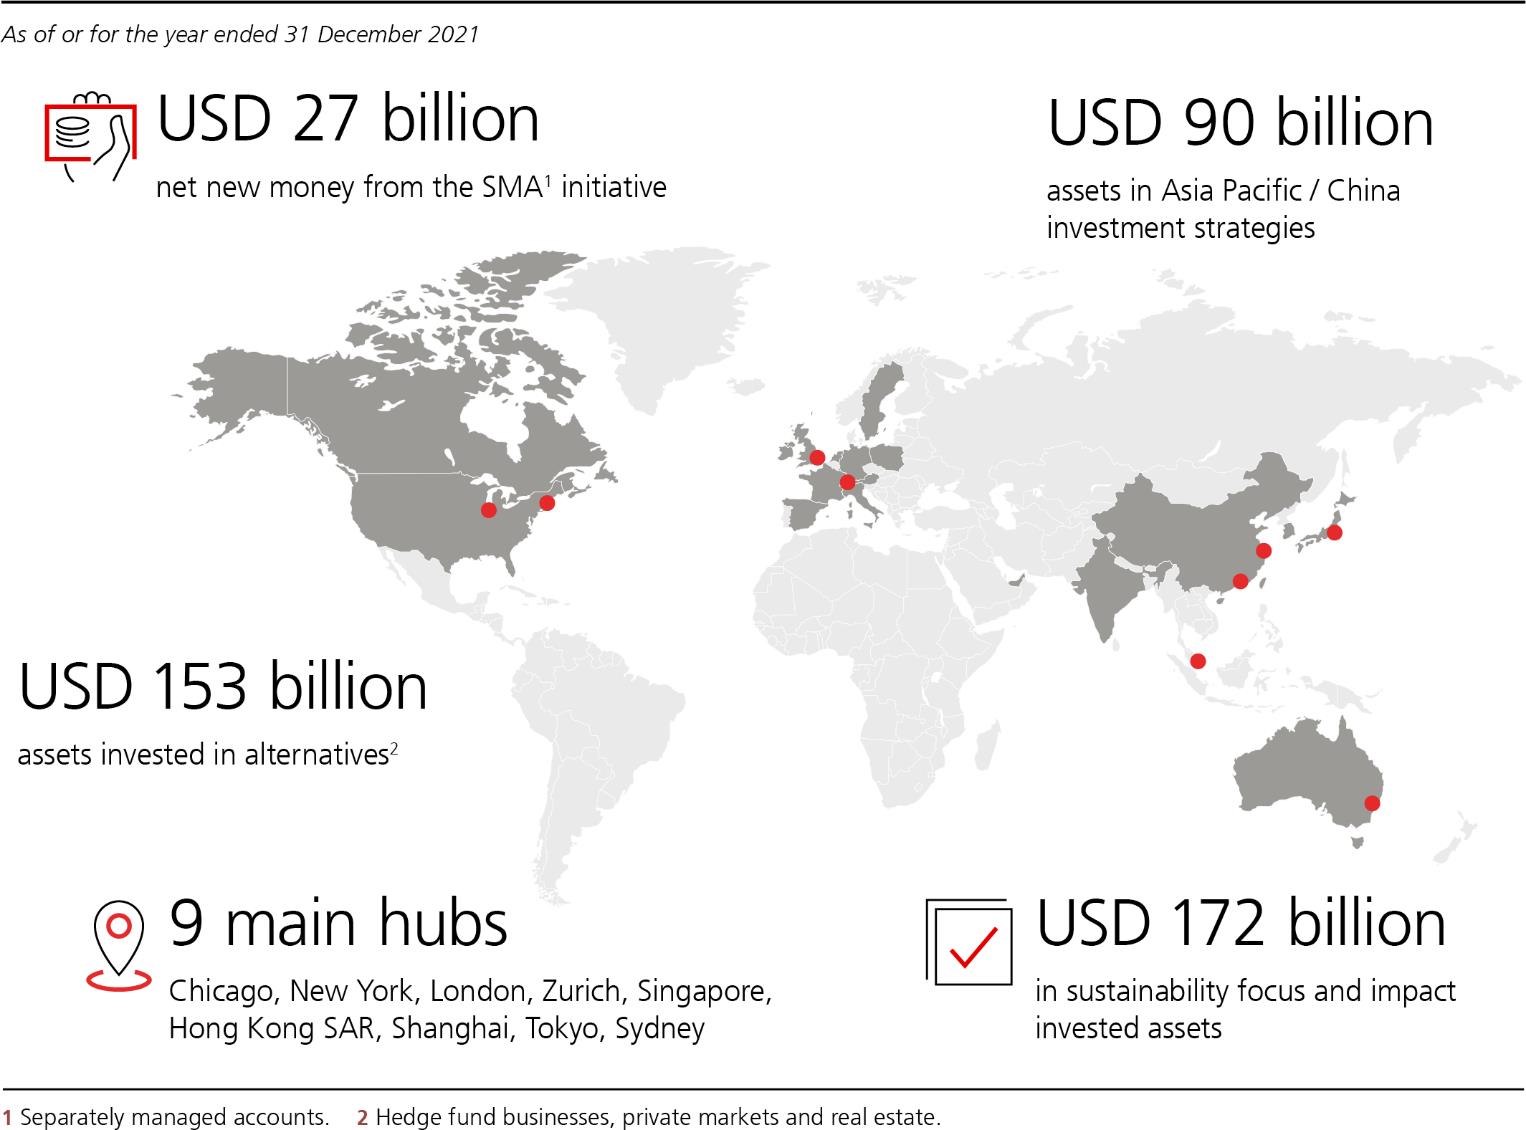
Our strategy, business model and environment | Our businesses
28
We also continue our joint efforts with the other business
divisions, in particular with Global Wealth Management, enabling
our teams to draw on the best ideas, solutions and capabilities
from across the firm in order to deliver superior investment
performance and experiences for our clients. For example, the
separately managed accounts initiative with Global Wealth
Management in the US generated USD 27 billion in net new
money inflows in 2021 and USD 127 billion in invested assets. This
firmly positions us to capture attractive opportunities in other
channels by leveraging our world-class expertise and capabilities
to meet growing client demand.
›
Refer to “
Delivering one ecosystem
” in this section for examples
of the joint efforts of the business divisions
To support our growth, we are focused on disciplined
execution of our operational excellence initiatives. This includes
further automation, simplification, process optimization and
offshoring / nearshoring of selected activities, complemented by
continued modernization of our platform and development of our
analytics and data capabilities.
How we operate
Our business division is organized into five areas: Client Coverage,
Investments, Real Estate & Private Markets, Products and the COO
(Operations).
We cover the main asset management markets globally, and
have a local presence in 23 locations across four regions: the
Americas, Asia Pacific, EMEA and Switzerland. We have nine main
hubs: Chicago, New York, London, Zurich, Singapore, Hong Kong
SAR, Shanghai, Tokyo and Sydney.
Our main competitors are global firms with wide-ranging
capabilities and distribution channels, such as Amundi, BlackRock,
DWS, Goldman Sachs Asset Management, Invesco, JPMorgan
Asset Management, Morgan Stanley Investment Management
and Schroders, as well as firms with a specific market or asset-
class focus.
What we offer
We offer clients a wide range of investment products and services
in different asset classes, in the form of segregated, pooled or
advisory mandates, as well as registered investment funds in
various jurisdictions.
Our traditional and alternative capabilities include equities,
fixed income, hedge funds, real estate and private markets, and
indexed and alternative beta strategies (including exchange-
traded funds), as well as sustainable and impact investing
products and solutions.
Our Investment Solutions business draws on the breadth of our
capabilities to offer: asset allocation and currency investment
strategies across the risk–return spectrum; customized multi-asset
solutions, advisory and fiduciary services; and multi-manager
hedge fund solutions and advisory services.
29
Investment Bank
The Investment Bank provides services to institutional, corporate
and wealth management clients, helping them raise capital, invest
and manage risks, while targeting attractive and sustainable risk-
adjusted returns for shareholders. Our traditional strengths are in
equities, foreign exchange, research, advisory services and capital
markets, complemented by a targeted rates and credit platform.
We use our data-driven research and technology capabilities to
help clients adapt to evolving market structures and changes in
regulatory, technological, economic and competitive landscapes.
Aiming to deliver market-leading solutions by using our
intellectual capital and electronic platforms, we work closely with
Global Wealth Management, Personal & Corporate Banking and
Asset Management to bring the best of UBS’s capabilities to our
clients. We do so with a disciplined approach to balance sheet
deployment and costs.
Organizational changes
In February 2021, we announced that Piero Novelli, Co-President
Investment Bank, would step down, and, effective 1 April 2021,
Robert Karofsky, Co-President Investment Bank, was appointed
sole President Investment Bank.
On 1 July 2021, the Investment Bank Operations team was
formally integrated into the Investment Bank, following the
Group-wide decision to move each of the firm’s business-aligned
Operations teams into their respective divisions in order to
become even more client-centric, agile and digital, while creating
a seamless experience for our clients.
In January 2022, Global Research and the Strategic Insights
team, formerly part of Evidence Lab Innovations, were integrated
into the Investment Bank as Investment Bank Research. This new
setup has better aligned our research coverage with the needs of
our clients, while continuing to provide research and analytical
services across the firm.
Our focus
Our priority is provi ding seamless client service and high-quality
execution, through disciplined growth in the capital-light advisory
and execution businesses, while accelerating our digital
transformation. We aspire to provide best-in-class services and
solutions to our corporate, institutional and wealth management
clients through an integrated, solutions-led approach. In Global
Banking, we position ourselves as trusted advisors via our deep
client coverage and ability to provide access to the full capabilities
of UBS.
Our global coverage model utilizes our
vast
international
industry expertise and product capabilities to meet the emerging
needs of clients. We provide clients with excellence in execution,
financing and structured solutions through our Global Markets
franchise.
In Global Markets, our sharpest competitive edge
comes from coordinating our services across a wide range of asset
classes and products. We provide nimble, innovative and bespoke
access to solutions, from market and insight tools to trading
strategies and execution.
Investment Bank Research continues to publish research based
on primary data to concentrate on data-driven outcomes and
offer clients key insights on securities and themes in major
financial markets around the globe. In April 2021, Research
entered into a strategic partnership with Lynk Global, an artificial-
intelligence-driven knowledge-as-a-service platform, to help
clients make better, more informed investment and business
decisions. In September 2021, we announced a strategic research
redistribution agreement with
Wind, the leading financial
information provider in China, to offer onshore content to clients
who invest through Wind. Investment Bank Research was also a
founding partner and investor in Visible Alpha, a model
aggregation platform that is now firmly embedded in many of the
workflows of our core clients.
Our digital strategy harnesses technology to provide access to
a wide range of sources of global liquidity and differentiated
content. The Investment Bank strives to be the digital investment
bank of the future, taking our best ideas and turning them into
reality, with innovation-led businesses driving efficiencies and
solutions.
We aim to develop new products and solutions
consistent with our capital-efficient business model, which are
most often related to new technologies or changing market
standards.
In February 2021, we announced the creation of a single
Digital Platforms
function within the Investment Bank across
Global Markets and Global Banking, utilizing digital competencies
to benefit all products and maximizing the return on our
technology spend in close partnership with Group Technology.
Digital Platforms
know-how, aiming to reduce the number of systems and increase
automation, maximizing client impact, revenue
and digital
adoption. The
Digital Platforms
Agile@UBS
, an evolution of the historically close collaboration
with our Chief Data and Information Office, creating long-lived
teams that learn and continuously improve, which in turn attracts
the best talent.
Our
Investment Bank Accelerated Digital Agile Platform
Transformation
with
the
ambition
of
hav
ing
a simplified and ultra
-
modern
technology landscape that is secure and stable, where we re-use
more of everything and where the platforms work together to
drive progress toward our overall strategic imperatives.
›
Refer to ��Clients” in the “How we create value for our
stakeholders” section and to “Leveling up technology” in the
“Our strategy” section of this report for more information about
innovation and digitalization
Our strategy, business model and environment | Our businesses
30
Our global reach gives attractive options for growth. In the
Americas, the largest investment banking fee pool globally, we
focus on increasing market share in our core Global Banking and
Global Markets businesses. In Asia Pacific, opportunities arise
mainly from expected market internationalization and growth in
China, where we plan to grow by strengthening our presence,
both onshore and offshore. In EMEA, we plan to leverage our
strong base and brand recognition even further.
Joint efforts between the Investment Bank and the other
business divisions (for example, our work with Global Wealth
Management on the Unified Global Markets team and the Global
Lending Unit) and, externally, strategic partnerships (for example,
UBS BB jointly with Banco do Brasil, focused on Latin America)
continue to be key strategic priorities. We expect these initiatives
to continue to lead to growth by delivering global products to
each region, leveraging our global connectivity across borders and
sharing and strengthening our best client relationships.
›
Refer to “
Delivering one ecosystem
” in this section for examples
of the joint efforts of the business divisions
How we operate
Our business division consists of two areas: Global Banking and
Global Markets
, supported by
Investment Bank Research.
Governed by the Executive, Operating, Risk, and Asset and
Liability forums, each business area is organized globally by
product. Our geographically balanced business has a global
reach, with a presence in more than 30 countries and offices in
ten major financial hubs.
Competing firms operate in many of our markets, but our
strategy differentiates us, with its focus on leadership in the areas
where we have chosen to compete, and a business model that
leverages talent and technology rather than balance sheet. Our
main competitors are the major global investment banks (e.g.,
Morgan Stanley, Credit Suisse and Goldman Sachs) and corporate
investment banks (e.g., Bank of America, Barclays, Citigroup, BNP
Paribas, Deutsche Bank and JPMorgan Chase). We also compete
with boutique investment banks and fintech firms in certain
regions and products.
Joint efforts with Global Wealth Management and Asset
Management enable us to provide clients with broad access to
financing, global capital markets and portfolio solutions.
›
Refer to “
Delivering one ecosystem
” in this section for examples
of the joint efforts of the business divisions
What we offer
Our Global Banking business advises clients on strategic business
opportunities, such as mergers, acquisitions and related strategic
matters, and helps them raise capital, both on public and private
markets, to fund their activities.
Our Global Markets business enables clients to buy, sell and
finance securities on capital markets worldwide, and to manage
their risks and liquidity. We distribute, trade, finance and clear
cash equity and equity-linked products, as well as structuring,
originating and distributing new equity and equity-linked issues.
From origination and distribution to managing risk and providing
liquidity in foreign exchange, rates, credit and precious metals, we
help clients to realize their financial goals.
Our Investment Bank Research business offers clients
differentiated content
about
major financial markets and
securities around the globe, with coverage of over 3,000 stocks
in 24 countries. The Strategic Insights team provides timely and
relevant information and insights to help clients quickly make
decisions regarding their most important questions.
We seek to develop new products and solutions consistent
with our capital-efficient business model, typically related to new
technologies or changing market standards.
›
Refer to “Clients” in the “How we create value for our
stakeholders” section and to “Leveling up technology” in the
“Our strategy” section of this report for more information about
innovation and digitalization
31
The Investment Bank is focused on meeting the needs of clients
with regard to environmental, social and governance (ESG)
considerations and sustainable finance, helping
to
reshape
business models and investment opportunities and to develop
sustainable finance products and solutions across the Investment
Bank. Since 2005, we have addressed increasing client demand
for sustainable investing
by
providing thematic and sector
research and investment solutions through socially responsible
and impact exchange-traded funds and index-linked notes. In
addition, we offer capital-raising and strategic advisory services
globally to companies that make positive contributions to climate
change mitigation and adaptation. We provide advice on
innovative financing strategies, guiding clients through inaugural
green issuances and positioning them in multi-currency markets.
In September 2021, we announced the formation of our ESG
Advisory team in Global Banking, aiming to support our clients’
sustainability strategies. As part of the Group’s net-zero
commitments, the Investment Bank has developed science-based
intermediate emission targets for 2030 for its lending business in
priority sectors (fossil fuels and power generation). In June 2021,
we announced the inaugural launch of two senior unsecured
green bonds under our Green Funding Framework.
›
Refer to the “Taking action on a net-zero future – our climate
report” section of the Sustainability Report 2021, available from
11 March 2022 under “Annual reporting” at
ubs.com/investors
,
for more information about the Investment Bank’s targets for its
lending business
Our strategy, business model and environment | Our businesses
32
Group Functions
Group Functions provides services to the Group, focusing on
effectiveness, risk mitigation and efficiency. Group Functions also
includes the Non-core and Legacy Portfolio unit.
How we are organized
Group Functions
The major areas within
Group Functions
are
Group
Services
(
which
consist
s
of
Technology, Corporate Services, Human
Resources, Finance, Legal, Risk Control, Compliance, Regulatory
& Governance
,
Communications & Branding
,
and
Group
Sustainability and Impact), Group Treasury , and Non-core and
Legacy Portfolio.
In recent years
,
we have aligned support functions and
business divisions. The vast majority of such functions are fully
aligned or shared among business divisions, where they have full
management responsibility.
By keeping the activities of the
businesses and support functions close, we increase efficiency and
create a working environment built on accountability and
collaboration.
On 1 July 2021, following the Group -wide decision to move
each of the firm’s business-aligned Operations teams into their
respective divisions in order to become even more client-centric,
agile and digital, while creating a seamless experience for our
clients, each of the Operations teams were formally moved out of
Group Functions and integrated into the respective business
divisions.
Non-core and Legacy Portfolio, a small residual set of activities
in Group Treasury and certain other costs that are mainly related
to deferred tax assets and costs relating to our legal entity
transformation program are all retained centrally.
Group Treasury
Grou
p
Treasury
manages
balance sheet
structural risk
(e
.
g.,
interest rate, structural foreign exchange and collateral risks)
and
the risks associated with our liquidity and funding
portfolios. Group Treasury serves all business divisions and its
risk management is integrated into the Group risk governance
framework.
Non-core and Legacy Portfolio
Non-core and Legacy Portfolio manages legacy positions from
businesses exited by the Investment Bank, following a largely
passive wind-down strategy. Overseen by a committee chaired by
the Group Chief
Financial
Officer
,
its
portfolio also includes
positions relating to legal matters arising from businesses
transferred to it at the time of its formation.
›
Refer to “Note 18 Provisions and contingent liabilities” in the
“Consolidated financial statements” section of this report for
more information about litigation, regulatory and similar
matters
33
Our environment
Market climate
Global economic developments in 2021
2021 was a positive year for the global economy and most
markets. Growth rebounded, with the global economy expanding
6.1%, after contracting 3.0% in 2020. The recovery was also
broad based, with all major nations experiencing a revival in
demand as pandemic restrictions were gradually relaxed and the
policies of major central banks remained supportive.
Swiss GDP increased 3.5% in 2021, after decreasing 2.5% in
2020. US GDP grew 5.7%, after decreasing 3.4%. The Eurozone
economy expanded 5.2%, after contracting 6.5% in the prior
year. UK GDP increased 7.2% in 2021, after a decrease of 9.4%
in 2020.
China’s economy grew 8.1%, up from 2.2% in 2020, although
momentum slowed toward the end of 2021 and into 2022. Other
leading Asian economies recovered strongly in 2021, with India’s
GDP growing 8.7%, Singapore’s GDP increasing 7.6% and South
Korea’s GDP expanding 3.9%. Japan experienced less growth,
with GDP increasing 1.7% after a 4.5% contraction in 2020.
Growth in the top emerging markets was mixed, with a
moderate 1.7% growth rate in Thailand and 3.7% in Indonesia,
compared with a more robust 5.3% in Mexico and 4.5% in Brazil.
Elevated inflation emerged as a concern through 2021 in much
of the world, as the pandemic continued to disrupt supply chains
and shift patterns of demand. By the end of the year, US inflation
was running at the fastest pace since 1982 on a year-on-year
basis. This caused the US Federal Reserve to move toward
monetary tightening, announcing a scaling back of asset
purchases and pointing toward rate rises. Inflation was contained
in Switzerland, at 0.6% for the year, but climbed swiftly in the
Eurozone, from 0.3% in 2020 to 2.6% in 2021. Meanwhile,
prices in Japan declined 0.2% in 2021, having been flat in 2020.
Financial markets
,
both equities and fixed income
,
were
resilient in the face of continuing waves of COVID-19 infections.
Global equities delivered total returns of 18.5% in 2021. The US
outperformed
:
MSCI USA delivered total returns of 27%,
outperforming the MSCI All Country World index by 8 percentage
points and taking its share of the global index’s market
capitalization to a record level of 48%. The Eurozone, Japanese,
Swiss and UK equity markets all gained ground. China, however,
was an underperformer: after reaching a record high in February
2021, MSCI China declined over the rest of the year, driven by
increased regulation on the technology and property sectors,
energy shortages, and a slowing economy. The index delivered
negative returns of 22.4% in 2021, negatively impacting the
performance of the MSCI Emerging Markets index overall, which
decreased 2.5% in 2021.
Government bond markets were also resilient, especially
against a backdrop of historically high inflation. The yield on 10-
year US Treasuries ended the year at 1.5%, only a modest increase
from 0.9% at the start of the year. With inflation rising, but
nominal yields staying low, US real yields traded as low as minus
1.2%, the lowest level since the inception of the
Treasury
inflation-protected securities (TIPS) market in 1997. The yield on
10-year German Bunds remained negative through 2021, ending
the year at minus 0.18%.
Our strategy, business model and environment | Our environment
34
Industry trends
Although
our industry has been heavily
affected by various
regulatory developments over the past decade
,
technological
transformation
and changing client expectations
are
further
emerging as key drivers of change today, increasingly affecting
the competitive landscape, as well as our products, service models
and operations. In parallel, our industry continues to be materially
driven by changes in financial market and macroeconomic
conditions.
Client expectations
As technology progresses, clients more rapidly redefine the way
they live, work and interact with others. This is reshaping clients’
expectations toward financial services firms, as their reference
points are increasingly influenced by experiences with companies
outside our sector, where technology-supported and data-driven
solutions are progressively enabling a more seamless and
improved client experience. These services often focus on
convenience and personalization, and drive toward holistically
addressing clients’ needs and facilitating community building.
Therefore our franchise needs to evolve, as clients measure us
against new standards.
Sustainability
Markets around the world are undergoing a profound
transformation as company business models evolve and investors
factor in the transition to a low-carbon economy and other
sustainable themes with regard to investment risk and return.
Shifting societal values and greater regulation are supporting
client demand. Investors are adding sustainable investing
strategies to their portfolios, with the fastest growth around funds
focused on climate. Industry inflows into sustainable funds have
accelerated during the COVID-19 pandemic and the sustainable
investing market share remains above pre-pandemic levels.
Our view is that this trend plays to UBS’s strengths, as we have
been at the forefront of sustainable finance for over two decades,
making us well placed to continue developing the innovative
products and solutions our institutional and private clients need.
›
Refer to the Sustainability Report 2021, available from 11 March
2022 under “Annual reporting” at
ubs.com/investors
, for more
information about sustainability matters
Digitalization
Digitalization in the financial services industry is accelerating and
has been given further momentum by the ongoing COVID-19
pandemic. Banks have demonstrated their ability to take on a vast
increase in the number of clients switching to digital channels
while ensuring operational resilience.
As a result, c
lients
increasingly trust digital solutions and are now demanding even
more seamless, personalized digital products and services tailored
to their needs. Regional and demographic differences in the
acceptance and use of digital technologies are narrowing across
all client segments, thus increasing the number of digital users.
This trend requires financial institutions to focus even more on
fully digital and digitally enhanced service models and digitally
enabled ecosystems.
As governments reacted to the outbreak of the pandemic by
impos
ing
restrictions
on physical
interactions, digital
communication, with clients and employees alike, established
new remote ways of working, which are expected to also be used
by some companies in post-pandemic scenarios, enabling them to
attract an even wider array of talent than before. The
digitalization of the financial services industry has led to a
structural shift in the workforce: more and better engineers are
required to keep banks at the forefront of technology, thus setting
them into direct competition with technology companies beyond
the borders of the financial sector.
Continuous investment in technology is driving automation
and simplification of labor-intensive processes, improving banks’
operational efficiency and freeing up resources to focus on client
needs. Decision making is becoming increasingly data-driven,
with advanced analytics and artificial intelligence enabling banks
to address client needs in an even more targeted manner.
Nascent technologies, such as distributed ledger technology,
are expected to mature over the coming years and are likely to
reshape our industry. They provide opportunities to overcome
existing financial system frictions, broaden access to underbanked
communities and make previously unviable products or services
available to the financial services industry.
Consolidation
Many regions and businesses in the financial services sector are
still highly fragmented. We expect further consolidation, with the
key drivers being ongoing margin pressure, a push for cost
efficiencies and increasing scale advantages resulting from the
fixed costs of technology, and regulatory requirements. Many
banks currently seek increasing exposure and access to regions
with attractive growth profiles, such as Asia and other emerging
markets, through local acquisitions or partnerships. The increased
focus on core capabilities and geographical footprint, as well as
the ongoing simplification of business models to reduce
operational and compliance risks, is likely to drive further disposals
of non-core businesses and assets. The impact of the COVID-19
pandemic may further accelerate consolidation, as banks face
increasing threats from digitalization, low interest rates and
intensified competition.
35
New competitors
Our competitive environment is evolving. In addition to traditional
competitors in the asset-gathering businesses, new entrants are
targeting selected parts of the value chain. However, we have not
yet seen a fundamental unbundling of the value chain and client
relationships, which might ultimately result in the
further
disintermediation of banks by new competitors. Over the long
term, we believe large platform companies entering the financial
services industry could pose a significant competitive threat, given
their strong client franchises and access to client data, if they
decide to broaden the scope of their services. Fintech firms are
gaining momentum,
which has been
accelerated by the
COVID-19 pandemic, causing increased use of remote solutions.
However, such firms have not to date materially disrupted our
asset-gathering businesses. The trend for forging partnerships
between new entrants and incumbent banks is continuing, as
technology and innovation help banks overcome new challenges.
Regulation
Although the impact of the COVID-19 pandemic is still evident,
regulators are re-focusing their attention toward policy areas that
were already in motion before the pandemic started, including
prudential regulation and anti-money laundering (AML), and to
emerging policy topics, particularly in the areas of digital
innovation and environmental, social and governance (ESG).
Sustainable finance and climate risk
were
a key focus of
policymakers in 2021, with the United Nations Climate Change
Conference (COP26) acting as a catalyst for action. We expect
further policy developments, including in the areas of climate-
related disclosures, climate-related financial risks and ESG.
The acceleration of the digital finance agenda, which in part
resulted from the COVID-19 pandemic, continues to trigger action
from regulators and this will likely further intensify. Among such
action, we expect further progress on the regulation of
cryptoassets and stablecoins, as well as on the ongoing work on
central bank digital currencies and digital engagement practices.
The national implementation of the Basel framework remains
another important focus area, but there is a significant risk of
divergence in the timing of implementation, as well as the content
of the provisions. EU authorities have proposed a package of
measures aimed at implementing the remaining Basel III elements
by 2025, i.e., two years after the timeline envisaged by the Basel
Committee on Banking Supervision,
while
the authorities in
Switzerland and the UK are expected to consult on their approach
in 2022. Implementation in Switzerland is expected in 2024 and
in the UK no earlier than March 2023. Implementation in the US
is still uncertain.
In addition, regulatory authorities continue to refine existing
regulations, including the finalization of the Swiss too-big-to-fail
framework, with a current focus on additional liquidity
requirements for systemically important banks. The regulators are
also advancing the regulatory framework in key policy areas,
including anti-money laundering, operational resilience and
outsourcing arrangements, and putting an emerging policy focus
on diversity and inclusion.
Finally, central banks and regulators continue to learn the
lessons from the COVID-19 pandemic. An important area of
concern is understanding the effects of contagion in financial
markets, particularly financial stability risks emanating from non-
bank financial institutions.
Many of these developments are taking place in an
environment characterized by significant political uncertainties,
including geopolitical tensions that could pose additional
challenges to the provision of cross-border financial services and
rapidly evolving societal expectations toward financial institutions.
We believe the adaptations made to our business model and
our proactive management of regulatory change put us in a
strong position to absorb upcoming changes to the regulatory
environment.
›
Refer to the “Regulatory and legal developments” and “Capital,
liquidity and funding, and balance sheet” sections of this report
for more information
Wealth creation
1
Despite the economic tumult related to the pandemic, the global
high net worth individual population and financial wealth
increased in 2020 6.3% and 7.6%, respectively.
The United States continued to lead, with high net worth
individual wealth growth of 12.3%; in Asia Pacific, such wealth
expanded 8.4% and in Europe 4.5%. In line with previous trends,
the ultra high net worth individual segment led wealth growth,
with an average of 9.1%. Today, 44% of global financial wealth
is concentrated in North America, followed by Asia (26%) and
Europe (21%).
2
By segment, approximately a third of global high net worth
individual wealth is held by individuals with wealth in excess of
USD 30 million, 23% by individuals with wealth ranging from
USD 5 million to USD 30 million and the remaining approximately
43% is within the wealth segment between USD 1 million and
USD 5 million.
Wealth is being created at a faster rate for a number of key
client groups, including female clients and entrepreneurs. We also
see significant wealth transition to the next generation over the
coming decade.
The outlook for wealth remains positive, with North America,
Asia (excluding Japan) and Western Europe expected to account
for 87% of new financial wealth growth worldwide between now
and 2025.
2
Wealth transfer
Demographic and socioeconomic developments continue to
generate shifts in wealth. Over the next 10 to 15 years, the “next
gen,” composed of individuals currently between the ages of 20
and 50, will be an influential driver of future growth, as those
people accumulate significant financial wealth from inheritance
or liquidity events.
2
1
All the figures are from the Capgemini World Wealth Report 2021 unless otherwise stated and refer to the 2020 financial year. The Capgemini World Wealth Report 2021 defines wealth segmentation as follows:
those with wealth of greater than USD 30 million are classified as ultra high net worth individuals; USD 1–30 million for high net worth individuals.
2
Based on BCG Global Wealth Report 2021. Wealth concentration is based on financial assets by regions and excludes real assets and liabilities.
Our strategy, business model and environment | Our environment
36
As a group, next gens have a longer investment horizon, a
greater appetite for risk and often a desire to use wealth to create
a positive societal impact alongside investment returns. As shown
in the Wealth-X report “World Ultra Wealth Report 2021,” the
proportion of ultra-wealthy women has also been on a gradual
upward trend in recent years, reflecting changing cultural
attitudes and growth in female entrepreneurship, as well as
wealth transfers between generations.
We are responding to the evolving wealth landscape with a
framework that addresses all aspects of our clients’ financial lives,
called
UBS Wealth Way
. It begins with discovery questions and a
conversation with clients about what is most important to them.
We help clients organize their financial life along three key
strategies:
Liquidity
to help provide cash flow for short-term
expenses;
Longevity
for long-term needs; and
Legacy
for needs
that go beyond their own and help improve the lives of others, a
key part of wealth transfer planning.
Search for yield
Since the beginning of the COVID-19 pandemic, investors have
faced a very different investment landscape when compared with
the last decade, with higher rates of economic growth in
developed markets and most notably higher inflation.
Nevertheless, we expect changes in monetary policies of the
central banks of Switzerland and Europe, which have kept interest
rates at historically low levels, to be gradual. The US Federal
Reserve has quickly adjusted to a higher-rate path, but the overall
expected rates remain low in a historical context. Therefore, while
this will create new opportunities for investors in the bond and
equity markets, the overall low-yield environment will continue.
As a result, investors searching for sustainable high returns for
the longer term continue to diversify into illiquid alternatives (e.g.,
private equity, property, hedge funds and infrastructure) that can
deliver compelling risk-adjusted returns. At the same time,
investors continue to look for low-cost, efficient passive strategies
across liquid equity markets. We believe the breadth of Asset
Management’s investment expertise enables us to find the right
solutions for clients across asset classes and regions.
37
Our response to COVID-19
In 2021, the COVID-19 pandemic, which had caused a globally
unprecedented situation in 2020, continued to affect UBS and its
employees and required our ongoing focus on safeguarding the
well-being of our employees and their families, on serving our
clients and ensuring operational continuity.
The rebound in economic activity in 2021 and expectations of
further economic recovery was accompanied by the spread of
new variants that resulted in all-time high numbers of COVID-19
infections and associated disruption.
Our support for clients and the economies in which we
operate
We continued to support our clients with advice needed to
manage their assets and liabilities, along with actively developing
investment solutions and global insights.
The program established by the Swiss Federal Council in March
2020 to support small and medium-sized entities (SMEs) by
guaranteeing loans granted by banks closed on 31 July 2020.
Outstanding commitments of loans granted by UBS under the
program amounted to CHF 2.2 billion on 31 December 2021,
with a total amount drawn of CHF 1.6 billion, compared with the
peak commitments of CHF 3.3 billion and the corresponding total
amount drawn of CHF 1.7 billion as of 31 July 2020. No net
economic profits have been made since the launch of the program
in 2020.
In the US, we continued to support the lending programs
created under the CARES Act for small businesses. Working with
a partner, we provided loans of USD 1.1 billion under the
Paycheck Protection Program until the program expired in May
2021. We donated around USD 1 million of fees earned on such
loans in 2021 to COVID-19 relief efforts and around USD 2 million
in 2020.
Our support for communities
Following earlier donations to various COVID-19-related aid
projects that support communities across regions in which we
operate
,
and recognizing the critical importance of ensuring
access to COVID-19 vaccines globally, in 2021 UBS partnered with
Gavi, the global vaccine alliance, to raise funds for its COVID-19
Vaccines Global Access
(COVAX) facility
.
U
BS Optimus
Foundation raised USD 2 million from clients for the Gavi COVAX
facility, which, with matching funds from UBS and the Bill &
Melinda Gates Foundation, will support COVID-19 vaccinations
for
more than
800,000 people in low
-
an
d middle
-
income
countries.
More recently, we have committed to a range of relief
programs in India through the UBS Optimus Foundation COVID-
19 Response Fund.
Following the first tranche in the second
quarter of 2021, which focused on the delivery of oxygen and
other medical supplies to those most in need, the current tranche
centers around building healthcare worker capacity across
underserved and remote locations, as well as supporting the
mental health of children and young people to help them cope
with the effects of the COVID-19 pandemic.
Our support for employees
Throughout 2021, we continued to prioritize the health and
safety of our employees and clients and to adapt our processes
related to office work and in-person meetings in line with country-
and location-specific developments.
Due to the ongoing pressure placed on employees by closed
workplaces and schools, restricted activities and varying degrees
of lockdown, we continued with a range of supportive measures
throughout 2021. The offer to our employees included a variety
of tools and resources to support employees’ physical, mental,
financial and social well-being, as well as continuing flexibility to
manage various work / life demands.
Effects of the COVID-19 pandemic on our financial and
capital position
The negative effects of the COVID-19 crisis on our financial and
capital positions remained limited in 2021, despite the
uncertainties caused by the pandemic.
We maintained a strong capital and liquidity position in the
face of the COVID-19 pandemic.
Our strategy, business model and environment | How we create value for our stakeholders
38
How we create value for our stakeholders
Stakeholder
group
Stakeholder needs:
what our stakeholders expect from us
Value proposition:
how we create value for our
stakeholders
Key topics discussed:
what was important to our
stakeholders in 2021
Stakeholder engagement:
how we engage with our stakeholders
Clients
Advice on a broad range of products
and services from trusted advisors
A mix of personal interaction with our
advisors in combination with digital
service anywhere and anytime
(convenient, seamless digital banking is
the expectation)
Top-quality solutions and the highest
standards in terms of asset safety, data
and information security,
confidentiality, and privacy
A combination of global reach and local
capabilities targeting positive
investment outcomes
Competitively priced products and
services, risk management, and liquidity
Delivering tailored advice and
customized solutions, using our
intellectual capital and digital platforms
Building long-term personalized
relationships with our clients
Developing new products, solutions
and strategic partnerships in response
to clients’ evolving needs, including in
the digital age
Providing access to global capital
markets and bespoke financing
solutions
Meeting increasing sustainable
investment and private markets
demand from clients
Investment performance in light of the
continued low-interest-rate
environment coupled with the threat of
rising inflation
Holistic goal-based financial planning
Sustainable finance and investing
opportunities
Data privacy and security
Products and services, including those
around digital banking
The need for even more personal advice
following the start of the COVID-19
pandemic
Individualized client meetings
Requests for regular client feedback,
feedback monitoring and complaint
handling
Primarily virtual client events and
conferences, including information on
key developments and opportunities
Client satisfaction surveys
Increasing levels of digital interaction
with clients
Investors
Disciplined execution of our strategy
leading to attractive capital returns
through dividends and share
repurchases
Comprehensive and clear disclosures on
quantitative and qualitative data
necessary to make informed investment
decisions
Recognizing and proactively addressing
strategic opportunities and challenges
Executing our strategy with discipline
and agility as the external environment
evolves, while aiming to deliver cost-
and capital-efficient growth
Providing transparent, timely and
reliable public disclosures
Strategic plans and updated targets
following the change of CEO in late
2020
Structural growth in and return
potential of our businesses
Cost efficiency and ability to generate
positive operating leverage
Ability to protect or even grow
revenues in a low-for-longer interest
rate environment
Incorporation of ESG factors into the
business model, compensation and risk
management
Financial reports, investor and analyst
conference calls, and webcasts, as well
as media updates on our performance
or other disclosures
General meetings of shareholders
Investor and analyst meetings
Digital interactions with investors as a
result of COVID-19 pandemic
restrictions, with limited impact on pre-
pandemic meeting schedules and
participation, given reliable virtual
solutions; the 2021 Annual General
Meeting was held virtually
Employees
A global, world-class employer, with
the expertise and breadth of
opportunity to empower people to
develop successful careers
A collaborative, engaging, supportive
and inclusive workplace culture
An environment that provides a sense
of belonging and the opportunities to
positively impact clients, shareholders
and society
Skill and career development
opportunities, including future-skills
development, and rewards for
performance and impact
Hiring great talent and investing in
development, now and for the future
Effective, fair people management and
compensation policies and practices
A strong workplace culture that aligns
with our purpose and values, enabling
employees to develop their careers and
unlock their full potential
Holistic support, including health and
well-being initiatives, that empowers
employees and fosters resilience
Comprehensive workforce data
analytics enable making better and
faster decisions to meet business needs
Our corporate culture, aligned to
purpose and enabled by our three keys
to success
A clear commitment to fair pay
A performance management process
that supports our strategic priorities
Hybrid working options for employees
Strategic focus on diversity, equity and
inclusion
A more agile future; accelerating new
ways of working
Regular CEO and GEB communications
and events, along with senior
leadership, regional and functional
sessions with employees
Employee surveys and other virtual
employee engagement activities
Group Franchise Awards and the Kudos
peer-to-peer recognition program
Health and well-being offerings,
employee volunteering and network
opportunities, flexible and hybrid-
working arrangements
Society
Facilitation of economic development
that is sustainable for the planet and
humankind
Maximization of our positive effects
and minimization of any negative
effects on society and the environment
Proactive management of the
environmental and societal impacts of
our businesses
Promoting significant and lasting
improvements to the well-being of
communities in which we operate
Taking an active role in the transition of
our economy toward environmentally
and socially sustainable solutions
Advising clients to align their business
models with ESG parameters and the
UN Sustainable Development Goals
Sustainable finance
Our climate strategy
Our client and corporate philanthropy
efforts
Reducing inequalities in our local
communities
Community investments and
partnerships with social institutions
Interaction with NGOs
Participation in forums and round
tables, as well as industry-, sector- and
topic-specific debates
Dialogues with regulators and
governments
Support of COVID-19-related aid
projects across our communities
39
Clients
Our clients are the heart of our business. We are committed to
building and sustaining long-term relationships based on mutual
respect, trust and integrity. Understanding our clients’ needs and
expectations enables us to best serve their interests and to create
value for them.
Our clients and what matters most to them
There is no typical UBS client. Our clients have varying needs, but
each of them expects outstanding advice and service, a wide
range of choices, and an excellent client experience.
Global Wealth Management focuses on serving the unique and
sophisticated needs of high net worth and ultra high net worth
individuals, families and family offices worldwide, as well as
affluent clients in selected markets. We give them access to
outstanding advice, service and investment opportunities from
around the globe, delivered by experts they can trust and based
on the expertise and insights of our Chief Investment Office (the
CIO). Using a holistic, goals-based approach to financial planning,
we deliver a personalized wealth management experience and
work side by side with clients to help them realize their ambitions.
Our client-facing advisors and the global teams supporting them
focus on developing long-term client relationships, which often
span generations. Clients look to us for expertise in helping them
to grow, protect and transfer their wealth, as well as helping them
make some of the most important decisions in their lives. From
significant liquidity events to professional milestones and personal
turning points, we aim to give clients the confidence to move
forward and achieve their goals. Through extensive research into
clients’ preferences and goals, and broader analysis of investor
sentiment globally, we constantly evolve our offerings to meet the
shifting priorities of today’s wealthy clients. This includes investing
in digital capabilities and developing products to help clients fund
their lifestyles and manage their cash flow, as well as offering
guidance on how they can create a lasting and positive impact for
their communities and the causes they care about most. We are
the leading global wealth manager for clients interested in
sustainable investing,
1
with a commitment to developing
solutions that enable clients to align their financial goals and their
personal values.
›
Refer to “Global Wealth Management” in the “Our businesses”
section of this report for more information about sustainable
investment offerings
Personal & Corporate Banking serves a total of approximately
2.6 million individual clients and over 100,000 corporate clients,
companies ranging from start-ups to multi-nationals, including
specialized entities, such as pension funds and insurers, real estate
companies, commodity traders and banks. Our clients include
more than 30% of Swiss households, more than 90% of the
largest 250 Swiss corporations and more than 50% of midsize to
large pension funds in Switzerland. They look for financial advice
based on their needs at each stage of their individual or corporate
journey. We aim to deliver outstanding advice to all via a multi-
channel approach. Clients have access to digital banking, a wide
network of branches and remote advice. These channels are
designed to deliver a superior, convenient client experience with
24/7 availability, security and value for money, resulting in high
levels of client satisfaction. Clients are also offered a broad range
of products and services in all relevant areas: basic banking,
investing, financing (including mortgages), retirement planning,
cash management, trade and export finance, global custody, and
company succession, among others. Additionally, they have full
access to the solutions of the Investment Bank, Asset
Management and Global Wealth Management.
In Asset Management, we deliver investment products and
services directly to approximately 2,800 clients around the world,
including sovereign institutions, central banks, supranational
corporations, pension funds and insurers, as well as to Global
Wealth Management and its clients, wholesale intermediaries and
financial institutions. By building long-term, personalized
relationships with our clients and partners, underpinned by
disciplined execution, we aim to achieve a deep understanding of
their needs and to earn their trust. We combine our global scale
with the independent thinking of our distinct investment teams to
utilize innovative ideas, drawing on the breadth and depth of our
investment capabilities, across traditional and alternative, active and
indexed, to deliver the solutions that clients need.
The Investment Bank provides corporate, institutional and
wealth management clients with expert advice, financial
solutions, execution and access to the world’s capital markets.
Our business model is specifically built around our clients and their
needs. Corporate clients can access advisory services, debt and
equity capital market solutions, and bespoke financing through
our reshaped Global Banking business. Our Global Markets
business focuses on helping institutional clients engage with local
markets around the world, offering equities and equity-linked
products, and foreign exchange, rates and credit products and
services.
Our equities and
differentiated
content offering is
underpinned by Investment Bank Research. The differentiated
nature of our research provides access to insight-ready data sets
for thousands of companies, and aims to give clients an
informational edge.
In 2021,
approximately
45,000 research
reports were produced, with more than six million reads.
1
Euromoney Private Banking and Wealth Management Survey 2021: Overall Global Results.
Our strategy, business model and environment | How we create value for our stakeholders
40
We know the security and confidentiality of our clients’ data is
of utmost importance to them, as it is for UBS. That is why we put
the highest priority on having comprehensive measures in place
that are designed to ensure that client data confidentiality and
integrity are maintained. We continually assess and improve our
control environment to mitigate emerging cyber threats and meet
expanding legal and regulatory expectations. Investments in our
IT platforms preserve and improve our IT security standards, with
a focus on giving clients secure access to their data via our digital
channels and protecting that data from unauthorized access.
Although the level of sophistication and the impact and volume
of cyberattacks continue to grow worldwide, we are ever vigilant,
maintaining a strong and agile cybersecurity and information
security program to mitigate and manage cyber risk by providing
robust, consistent, secure and resilient business processes.
Enhancing the client experience through innovation and
digitalization
We
streamline and simplify
interactions with clients
through
front-to-back digitalization and innovations.
In Global Wealth Management, we develop and deploy digital
tools that enhance the value of human relationships, a factor that
differentiates UBS. Clients expect the convenience and speed that
technology offers but, simultaneously, they feel that a personal
experience with advisors is more important than ever. Our advisors
use state-of-the-art digital tools to spend more time with clients
and better evaluate the full scope of their financial lives. Our
clients appreciate digital tools that improve their experience, for
example, easy ways to view their portfolios or access research that
is tailored to their needs. They also want multiple ways in which
to interact with their advisors. The COVID-19 pandemic, and the
associated need for physical distancing, has led clients to embrace
the use of digital and mobile tools more than ever before. We
continue to introduce new and better tools to meet and exceed
clients’ expectations. For example, our
UBS Manage Advanced
[My Way]
app offers clients in selected markets an at-a-glance
comprehensive view of their investment portfolio. With access to
more than 60 professionally managed investment modules
(building blocks), it is underpinned by continuous portfolio
monitoring and risk management. The app is interactive; clients
can work with their advisors on a tablet to design their own
portfolio, easily including elements such as sustainable investing
and themes to reflect their individual preferences and priorities.
Based on the strong momentum, client demand and inflows, we
intend to scale up and further develop
UBS Manage Advanced
[My Way]
. In 2021, the
Direct Investment Insights
digital
investment service was introduced in Asia and rolled out in Europe
and Switzerland. This service provides timely, relevant and
actionable investment insights and ideas from the CIO directly to
clients’ mobile and desktop devices, linking insights with
execution in our e-banking and mobile app. In the US, we
announced the development of a digital-led, scalable advice
model for affluent clients. As a trusted brand with premium
content, we see opportunities to deliver our expertise to a broader
set of clients, combining digital experience with human advice. In
Switzerland, our
UBS Mobile Banking
clients can now see relevant investment views and access our real-
time quote capabilities before logging in. At a broader level,
progress continues on our multi-year strategy to serve clients from
two platforms: the
Wealth Management Americas Platform
US and the
Wealth Management Platform
outside the US.
Personal & Corporate Banking continued to develop simple,
smart, secure and sustainable solutions in 2021, reflecting our
digital transformation progress. In May 2021, we launched a new
Remote Sales & Advice (RSA) unit to offer Personal Banking clients
more flexibility in the way they bank through extended service
times and the option to receive professional advice remotely. The
new RSA approach was also successfully piloted for Corporate &
Institutional clients. Following the excellent results of the 2020
pilot, we initiated a Switzerland-wide rollout of
UBS Multibanking
for corporate clients, an offering that integrates third-party banks
for full transparency across accounts and convenient payment
execution via a single platform. To assist clients throughout the
onboarding phase, we established a virtual support team for the
multi-banking solution. Moreover, in response to the growing
number of client-support requests via UBS channels, email and
telephone, we introduced the
UBS Conversational Platform
, an
end-to-end platform enabling clients to get the right answers for
their issues quickly without a lot of interaction with call agents or
client advisors. To accelerate innovation in the payment business,
we announced our
UBS Virtual Credit Cards
, a new generation of
purely digitally available cards that can be used in online shops
and receive deposits from TWINT, Apple Pay, Samsung Pay and
Google Pay. Since its introduction, more than 30,000 virtual cards
have been issued. For banking packages
,
we have launched
UBS me
Clients can now put together their individual package based on
their own needs and preferences, and are only charged for
solutions they actually need. Our
UBS Atrium
for investment properties has been integrated into the
key4
brand, creating a true multi-channel and multi-product offering.
As a result of the integration, clients can benefit from digital
offering capabilities of the innovative mortgage platform for
owner
-
occupied residential property.
In addition, the
Green
Mortgage
key4
and offers a financial advantage on financing to borrowers who
hold recognized sustainability certificates. To give clients access to
market-leading solutions beyond banking, we have expanded our
network of partnerships. We have joined forces with a Swiss
fintech start-up to provide corporate clients with extensive cash
management functionalities, from automated generation of
expense reports to validation of supplier invoices. To make
progress in our journey toward being more agile, we set up a new
virtual organization as a collaboration between Personal &
Corporate Banking, Global Wealth Management and the Chief
Digital and Information Office: the
Agile Delivery Organization
.
With more than 26 agile end-to-end delivery crews focused on
our clients’ needs, we are empowering teams, removing silos and
evolving toward an integrated setup to deliver responsive,
adaptable and innovative products. With sustainability being a top
strategic priority for our business and our client proposition, we
have continuously expanded our sustainability agenda.
Our
platform for volunteer work,
UBS Helpetica
, has so far received
286 project ideas and published more than 180 projects with over
70 non-profit partners across its focus topics: the environment,
social issues, education and entrepreneurship. An example of
further progress in our sustainability journey came when the
UBS Strategy Funds
UBS Strategy Funds
Sustainable
amount of existing custody assets to sustainable solutions.
41
In Asset Management, we are accelerating our investment in
digitalization. We have extended our digital client relationship
management pilot tools, technologies and data capabilities to
enhance the experience of, and service for, our clients, to foster
innovation and to support alpha generation. For example, we will
soon launch
a scalable platform to ena
ble more efficient
development and management of theme-based investment
products to meet growing client demand. We continue to expand
the suite of tools used by our Quantitative Evidence & Data
Science team, who utilize alternative and traditional data
combined with statistical modeling to enhance and augment our
fundamental and systematic investment processes. To simplify and
enhance our client servicing, we are introducing improvements in
client and data analytics.
The Investment Bank strives to be the digital investment bank
of the future, with innovation-led businesses driving efficiencies
and solutions. In February 2021, we announced the creation of a
Digital Platforms
function within the Investment Bank across
Global Markets and Global Banking, to work on exponential
transformation through experimentation, innovation, and
external partnerships. The
Digital Platforms
deliver
ing
on our client promise. In Global Markets, our
Technology-Enhanced Sales (TES)
with
our Data Intelligence, Group Technology, and Client
Coverage teams to embed our data and technology capabilities
across all client teams and enhance our client service.
TES
clients to choose where and how we deliver content and uses data
modeling to customize the content they receive.
UBS Neo
, our
award-winning multi-channel platform and enterprise ecosystem
for digital clients, lets our professional and institutional clients
access a comprehensive suite of products and services covering
the full investment life cycle. Historically, most clients used only
one or two of the capabilities available to them via
UBS Neo
. We
have now transformed the client experience through a new
personalized version of the platform, including the launch of an
app store.
Investment Bank DigiOps
, our Operations team
working in collaboration with Group Technology on digital
innovation projects, is enhancing the client experience through a
digital platform that continues to make progress on simplifying
Operation’s technology infrastructure, increasing front-to-back
efficiency and enhancing our decision making and relevance to
clients. New non-bank competitors have secured a foothold in our
markets, while fintech firms have carved out and dominated
entirely new segments. In response, we created a team focused
on strategic investments and fundamentally new market
infrastructure. By utilizing distributed ledger technology, Global
Markets is transforming the business models of products where
the Investment Bank has been strong historically. One example is
UBS Gold
, our global physical gold transaction network of retail
investors, gold merchants, institutional investors and vault
providers that enables clients to buy and sell at interbank prices.
A tokenized representation of underlying physical gold provides
fractional ownership with low-friction transactional capability.
Our vision is to accelerate the tokenization of financial products
traded by UBS clients. In November 2021, the Investment Bank
helped
SIX Group to launch the first
ever Swiss
franc
-
denominated digital bond offering, which is listed, traded and
settled on the newly established SIX Digital Exchange. Global
Banking has also prioritized the client experience.
Global Banking
Data & Analytics Lab
quantitative models to develop solutions for our businesses.
UBS-
GUARD
Banking business users, predicting
the
risk of companies
becoming the targets of activists, identifying deal opportunities
and helping navigate client pitches. Our
SPAC database
automated database of in-market special purpose acquisition
companies (SPACs) created to match SPACs with potential
acquisition targets and help increase efficiency and collaboration
across sectors and regions.
Engaging with our clients
We use a variety of channels to engage with clients, including
regular client relationship and service meetings, as well as various
corporate roadshows and dedicated events. Digital interaction
with clients increased as the pandemic continued.
Global Wealth Management interacted with clients via various
settings in 2021, from personalized private briefings with subject
matter experts to segment-specific virtual events and large-scale
initiatives. We utilize marketing campaigns, events, advertising,
publications and digital-only solutions to help drive greater
awareness of UBS among prospective clients and reinforce trust-
based relationships between advisors and clients.
Personal &
Corporate
Banking
holds regular client events
(mostly webcasts and virtual or hybrid events since the onset of
the COVID-19 pandemic), covering a wide range of topics. In
2021, we increasingly engaged with clients via online channels,
such as social media, online displays and search engines, and
further decreased our use of traditional out-of-home channels.
In Asset Management, we have a consistent program of client
events and engagement activities throughout the year. This
includes our flagship conferences, such as the annual
UBS Reserve
Management Seminar
,
and we held our inaugural
Alternatives
Conference
level of interaction with clients globally in 2021, facilitated by new
digital tools, and our publication of macro insights and thought
leadership to provide timely insights into rapidly evolving markets.
We also hosted a broad range of virtual events, including our
Nobel Perspectives
webinar series, to help our clients better
understand market challenges and investment opportunities, and
we continued to engage with clients through our social media and
online channels.
Our strategy, business model and environment | How we create value for our stakeholders
42
The Investment Bank hosted over 170 investor conferences and
educational seminars globally in 2021, covering a broad range of
macro, sector, regional and regulatory topics. Almost all of those
conferences were held virtually. More than 40,000 clients took
part in such events in 2021, providing insight and access to our
own opinion leaders, policymakers and leading industry experts.
We leverage our intellectual capital and relationships and use our
execution capabilities, differentiated research content, bespoke
solutions, client franchise model and global platform to expand
coverage across a broad set of clients.
UBS Neo Question Bank
the largest global database of market -related questions asked by
professional investors, while
UBS Live Desk
,
built within the
UBS Neo
commentary from UBS traders.
How we measure client satisfaction
We use multiple techniques to regularly assess our achievements
and the satisfaction of our clients.
Global Wealth Management is increasingly using technology
and analytics capabilities to collect and respond to client
feedback. Our digital client feedback tool lets clients submit, via
mobile and the web, input about overall satisfaction with advisors
and UBS, and share key topics they wish to discuss with their
advisors. Advisors and their teams have seamless, real-time access
to client feedback, enabling them to be highly responsive. The
tool is available in the US and Asia Pacific, as well as most EMEA
countries.
Personal & Corporate Banking has conducted annual surveys
of clients in Switzerland since 2008, consistently covering all
private and corporate client segments annually since 2015. Clients
provide feedback on their satisfaction with regard to various
topics (e.g., UBS overall, branches, client advisors, products and
services) and indicate further product or advisory needs. Survey
responses are distributed to client advisors, who follow up with
each respondent individually. In 2021, we had an all-time high
client satisfaction and net promoter score (NPS), and achieved a
77% follow-up rate with survey participants.
The Quality Feedback system in Global Wealth Management
and Personal & Corporate Banking provides a comprehensive and
systematic platform to receive and process client feedback and
suggestions. We receive feedback in various forms and through
different channels, including in writing, electronically, orally to
client advisors and staff in our branches and other client touch
points, via social media channels, and via the Swiss Banking
Ombudsman. Client feedback, including complaints and
suggestions, is vitally important, as it shows direct and unfiltered
client needs, supports the development and introduction of new
products and services and hence fosters the optimization of our
offering in a client-focused manner. By addressing client feedback,
we aim to strengthen client relationships, improve client
satisfaction and make tangible improvements to our services. By
sharing their views, clients contribute to quality improvements at
all levels. We aim to respond to each individual who provides
feedback. In 2021, key topics and enhancements centered mostly
around digital banking functionalities, digital client onboarding
and the reorganization of UBS’s branches and services.
In Asset Management, we have an integrated process to record
and manage client feedback through our client relationship
management tool. We also conduct regular surveys, covering our
wholesale and institutional clients globally, inviting them to assess
their satisfaction with our client service, products and solutions,
as well as other factors relevant to their investments. The results
are analyzed to identify focus areas for improvement and our
client relationship managers follow up with respondents to
address specific feedback where required.
The Investment Bank closely monitors client satisfaction via
individual product coverage points. Direct client feedback is
actively captured and tracked in our systems. Internal regional
forums serve as a platform for senior management to discuss
client relationships, possibilities for improvement, potential
opportunities and specific client issues. Other processes are in
place to enable consolidated findings to be shared within UBS as
appropriate. The Investment Bank also closely monitors external
surveys, which provide feedback across a range of investment
banking services. We continue to make progress in simplifying our
technology infrastructure, focusing on increasing front-to-back
efficiency and enhancing our decision making and relevance to
clients. In November 2021, we launched the first Annual Global
Markets Client Survey to gauge our clients’ experience of UBS and
the products and services that are important to them, measuring
client
satisfaction and loyalty.
In 2021, over 49% of Global
Markets clients surveyed expected to increase their market share
with UBS in the next six months. When ranking the most
important factor
in
choosing a market partner,
r
elationship
management coverage and connectivity were a priority, further
underlining the importance of our people. When asked about
future capabilities, our clients ranked highly the need for profiled
personalization of products and
services,
underlining the
importance of our
Digital Platforms
TES
We thoroughly evaluate the feedback we receive, including
complaints from clients, and take measures to address key themes
identified. For example, in 2021, Personal & Corporate Banking
clients expressed an increasing need for security and trust. The
ongoing optimization and digitalization of products has been well
received by clients across all segments. However, in light of
ongoing branch closures, clients would like further digitalization.
Furthermore, feedback
in
dicated
that clients developed high
levels of acceptance for telephone or video advice and were
increasingly satisfied with the service received via Global Banking.
43
Investors
We aim to create sustainable, long-term value for our investors by
executing our strategy with discipline, maintain risk and cost
discipline, and deliver attractive shareholder returns.
Investor base
Our investor base is well diversified. A substantial proportion of
our institutional shareholders are based in the US, the UK and
Switzerland.
›
Refer to the “Corporate governance” section of this report for
more information about disclosed shareholdings
Alignment of interests
We aim to align the interests of our employees with those of our
equity and debt investors, and this approach is reflected in our
compensation philosophy and practices.
›
Refer to “Our compensation philosophy” in the “Compensation”
section of this report for more information
Driving growth while maintaining risk and cost discipline
We are focusing on growth, as we expand into new client
segments and accelerate our strategic technology investments.
Across the firm, we intend to maintain our risk and cost discipline
to support our growth plans, with continual enhancement of day-
to-day efforts.
We are aiming to create sustainable value through the cycle.
To accomplish this, we have outlined selected commercial and
environmental, social and governance (ESG) aspirations, which
should support our financial targets.
Our primary measurement of performance for the Group is
return on common equity tier 1 (CET1), as regulatory capital is our
binding constraint
and drives
our ability to return capital to
shareholders.
›
Refer to the “Targets, aspirations and capital guidance” section
of this report for more information
Active capital management to enable growth and deliver
attractive shareholder returns
Our first priority is ensuring that we can maintain a strong balance
sheet. This includes our strong capitalization, in line with our
capital guidance of maintaining a CET1 capital ratio of around
13% and a CET1 capital leverage ratio of greater than 3.7%.
As a second priority, we consider opportunities for investment
in growth.
Our third priority is returning capital to shareholders in the
form of dividends, and we
intend
to pay progressive
cash
dividends. For 2021, the Board of Directors intends to propose a
dividend to UBS Group AG shareholders of USD 0.50 per share.
After these three priorities have been met, we intend to
distribute excess capital to shareholders via share buybacks. In
2021, we bought back USD 2.6 billion of our shares. Looking
ahead, we intend to buy back up to USD 5 billion of shares by the
end of 2022.
›
Refer to “UBS shares” in the “Capital, liquidity and funding, and
balance sheet” section of this report for more information
Communications
Our Investor Relations (IR) function is the primary point of contact
between UBS and our shareholders. Our senior management and
IR regularly interact with institutional investors, financial analysts
and other market participants, such as credit rating agencies.
Clear, transparent and relevant disclosures, and regular direct
interactions with existing and prospective shareholders, form the
basis for our communications. The IR team relays the views of and
feedback on UBS from institutional investors and other market
participants to our senior management.
IR and our Corporate Responsibility function work together
and interact with any investors interested in sustainability topics
relevant to UBS and wider society.
›
Refer to the first nine pages of the “Corporate governance”
section of this report and “Information policy” in that same
section for more information
›
Refer to the Sustainability Report 2021, available from 11 March
2022 under “Annual reporting” at
ubs.com/investors
, for more
information
Our strategy, business model and environment | How we create value for our stakeholders
44
Employees
At UBS, we know the meaning of long-term commitment; to our
clients, investors, employees, communities and society. With our
employees, this commitment is personal. We are dedicated to
being a world-class employer where our employees can leverage
and continually enhance their skills, partnering with clients and
colleagues on solutions that make a real difference.
Our people leadership approach aligns with our strategy and
our purpose, as both rely on engaged and empowered individuals
to drive them forward. Our employees are the key to realizing our
ambitions. Reimagining the power of people and making
connections are at the heart of what we do. Every day, our global
team connects people with innovative ideas and opportunities
that lead to better results for UBS and for our clients, as well as to
progress in society.
Our purpose drives our strategy and culture
Our purpose articulates why we do what we do and why it
matters. Our culture affects how we do things and is firmly
grounded in our three keys to success: our
Pillars, Principles and
Behaviors
. To help ensure that our culture advances our strategic
goals, we updated our three keys to success in 2021 to reflect our
purpose, client promise and strategic imperatives. For the past
decade, these keys have defined how we work together and what
we stand for, as a firm and as individuals. They continue to drive
daily business decisions and are integrated into our people
management processes.
›
Refer to the Sustainability Report 2021, available from 11 March
2022 under “Annual reporting” at
ubs.com/investors
, for more
information about our Pillars, Principles and Behaviors
We promote culture-building behavior through a number of
global, regional and divisional initiatives. Notably, since 2016, our
Group Franchise Awards
for promoting cross-divisional collaboration and innovation. A
related idea-sharing site enables employees to cooperate on
solutions for operational, client service, sustainability and
technology challenges. Nearly 6,000 ideas have been submitted
since its launch, with approximately 450 ideas implemented or
supported for future implementation.
A peer-to-peer recognition program instituted in late 2020
encourages
employees to recognize colleagues’ exemplary
behavior.
Called
Kudos
, this initiative serves to bring teams
together and increase motivation, engagement and employee
satisfaction,
with a total of
around
4
20
,000
messages of
recognition given since the program was launched.
45
Leadership, engagement and culture
Connecting people with transformative ideas and becoming a
more agile organization starts with our leaders. In 2021, we
updated our
House View on Leadership
that we expect every leader to demonstrate toward employees,
clients and business activities. Leaders at all levels are also
expected to foster simplification, empowerment and
accountability in their teams to support our ongoing
transformation.
Key to maintaining a strong culture are listening to employees
and acting on their feedback. Launched in mid-2021, our new
employee-listening strategy uses Group-wide surveys conducted
by an external provider to measure indicators such as line
manager effectiveness, and in-depth research to solve specific
business issues. As an example, an Organizational Health Index
assesses firm-wide alignment with strategic goals, working
practices and adaptability. Employee responses in 2021 directly
influenced the development of our purpose, our new
performance management approach and our increased focus on
innovation, sustainability and impact.
›
Refer to the Sustainability Report 2021, available from 11 March
2022 under “Annual reporting” at
ubs.com/investors
, for more
information about our management practices, and to the
foldout page of this report for more information about our
purpose
Toward a more agile future
Driven by our strategic imperatives and in response to evolving
client needs, we are accelerating the adoption of new ways of
working together. In particular, agile working practices, and agile
teams where th
ey
make sense, will enable us to be
more
responsive, adaptive and innovative in everything we do. Multi-
disciplinary teams working across the firm will create better
outcomes for clients and improve our employees’ work
experience. In 2021, we launched a first wave of the
Agile@UBS
program ahead of a broader implementation in 2022. Currently,
we have 10,000 employees transitioning to the new
Agile@UBS
ways of working by the end of the first quarter of 2022 and we
are on track to have over 20
,000
employees working in
Agile@UBS
with coaching and specialized training delivered through the Agile
Academy within our UBS University, will enable us to
systematically roll out
Agile@UBS
forward.
Our commitment to diversity, equity and inclusion (DE&I)
In our experience, diverse teams better understand and relate to
our equally diverse clients
and their
needs
.
Furthermore,
employees with different backgrounds and experiences drive
innovation and better decision making. Our aim, therefore, is to
shape a diverse and inclusive organization that is innovative,
provides outstanding service to our clients and offers equitable
opportunities so that all employees may thrive.
Our broad approach encompasses a range of aspects,
including inclusive leadership, gender, ethnicity, LGBTQ+ and
disability. Along with a concerted focus on building inclusive
leadership skills, increasing gender and ethnic diversity
,
and
ensuring equitable policies and practices were priorities in 2021.
Regarding gender, we aspire to have 30% of Director and above
roles held by women by 2025. At the end of 2021, that figure
stood at 26.7%, up from 26.0% in 2020. Similarly, our 2025
aspiration is to achieve a 26% representation of ethnic minorities
at Director level and above in the UK and the US. As of the end
of 2021, this figure was 20.1% in the US and 21.3% in the UK.
Initially launched in Switzerland in 2016, our global
UBS Career
Comeback
female leaders. To date, the program has helped 196 women and
19 men relaunch their careers.
In addition to strategic initiatives, each year we sponsor
numerous activities to promote inclusivity and a culture of
belonging. Chief among them are activities provided by our 48
employee networks across the firm. Employee volunteers regularly
host educational events and initiatives focused on gender, culture,
ethnicity, LGBTQ+ / Pride, disability, veterans, parenting, elder
care and other topics. Our employee networks also raise the
visibility of employees’ needs and help shape our DE&I program,
local benefits offerings, and more. Disability is a key focus area:
as such, the firm became a member of The Valuable 500 in 2021,
committing to make disability inclusion part of the firm’s business
leadership agenda.
›
Refer to
ubs.com/diversity
priorities, commitments and progress
Personnel by region
As of
% change from
Full-time equivalents
31.12.21
31.12.20
31.12.19
31.12.20
Americas
21,317
21,394
21,036
0
of which: USA
20,537
20,528
20,232
0
Asia Pacific
15,618
15,353
13,956
2
Europe, Middle East and Africa (excluding Switzerland)
14,091
13,899
12,918
1
of which: UK
6,051
6,069
5,704
0
of which: rest of Europe (excluding Switzerland)
7,826
7,652
7,048
2
of which: Middle East and Africa
215
178
166
21
Switzerland
20,359
20,904
20,691
(3)
Total
71,385
71,551
68,601
0
Our strategy, business model and environment | How we create value for our stakeholders
46
Practices that help us remain an employer of choice
Compensating employees fairly and consistently is key to ensuring
equal opportunities. We pay for performance, and we take pay
equity seriously. A strong commitment to both is embedded in
our compensation policies, and we conduct both internal reviews
and independent external audits as quality checks. If we uncover
gaps that cannot be explained by business factors or appropriate
personal factors
–
such as experience, role, responsibility,
performance or location – we explore the root causes of those
gaps and address them. Additionally, our regular monitoring and
review processes also allow us to maintain our certification status
with the EQUALSALARY Foundation for our equal pay practices in
Switzerland, the US, the UK, Hong Kong SAR and Singapore. The
firm also successfully completed an equal pay analysis in
Switzerland in 2020, as required by the Swiss Federal Act on
Gender Equality. The results of the analysis confirmed that we are
fully compliant with Swiss equal pay standards. These holistic
certifications are a testament to our well-established equal
opportunity environment and the strength of our human
resources practices, including performance and reward. In 2021,
we continued to monitor pay fairness and addressed any
unexplained gaps to ensure that all employees are paid fairly. All
employees have access to competitive benefits, including
insurance, retirement and personal leave.
›
Refer to the “Compensation” section of this report for more
information about compensation-related topics
Meeting employees’ needs while improving services for clients
Working both from home and from the office became the norm
for many employees
in
2021
, with surveys
indicating strong
support for continued flexibility. Following a global analysis that
considered factors such as regulation, risk and productivity, we
determined that approximately 75% of our employees could be
eligible to work in a hybrid setup. In addition to fostering better
work / life balance, a hybrid model makes us a more attractive
employer to a wider pool of applicants, such as early-career talent,
working parents and those in continuing education. The emphasis
on technology and virtual collaboration also sparks innovative
thinking that will make us more agile and further improve client
service. We are implementing hybrid working on a country-by-
country basis, along with wide-ranging support to ensure that
employees, teams and our culture all continue to thrive.
Health and well-being
Supporting employee health and well-being remained a priority in
2021. We are committed to helping employees thrive in their
current roles and deliver sustainable performance over time.
Regular “pulse” surveys gauged employees’ views on remote
work, stress, communication and other aspects. Resources to help
employees support holistic well-being featured a bespoke
eLearning curriculum, physical and mental health initiatives,
volunteering opportunities, increased benefits offerings in certain
locations, and financial education.
Employee representation
We maintain an open dialogue with our formal employee
representation groups, all of which are in Europe, as part of our
commitment to being a responsible employer. These groups
represent 17 countries and consider issues that may affect our
performance, operations and prospects. Collectively, these groups
represent approximately 49% of our global workforce.
Attracting, developing and retaining the best talent
Fostering an agile and connected workforce is a priority for the
near term. We therefore need to have processes in place that are
designed to ensure that we have the best people, in the right
roles, at the right time, to achieve our strategic goals.
Comprehensive workforce data dashboards help us analyze all
aspects of the employee life
cycle, including recruitment,
performance management, training, internal mobility and
attrition, along with demographic and diversity aspects, such as
gender and ethnicity. This helps us identify trends quickly and
make fact-based decisions grounded in human resources data.
Throughout 2021, we hired new talent where necessary to
launch or expand businesses and to fill gaps in our workforce. We
recruit for potential and cultural fit, hiring beyond immediately
relevant skills to include the person’s experience, competencies
and digital aptitude. We hired a total of 9,363 external candidates
in 2021, adding more than 1,700 graduates and other trainees,
apprentices and interns through our various junior talent
programs. We invest in young talent in every region, supporting
national apprenticeship programs in Switzerland and the UK and
summer internship programs in many locations. In Singapore, UBS
worked with the government to set up a program to support
ongoing employability during the pandemic and to increase the
resilience of regional banking infrastructure. Our approach has
garnered numerous external accolades in 2021, including a top-
50
ranking in the
World’s Most Attractive Employer
s
from
employer-branding experts Universum, for the 13th consecutive
year.
›
Refer to
ubs.com/employerawards
for more information about
our most recent employer rewards
Focusing on performance and development
Resetting the firm’s strategic course sparked a comprehensive
review of our performance management practices in 2021. As a
result, we introduced a new approach called
MyImpact
to better support our strategic priorities and reinforce our culture,
as well as making our year-end review, objective setting and
employee feedback processes simpler and more transparent.
Key to our talent management strategy is offering employees
opportunities to build interesting careers. Our innovative digital
Career Navigator
platform, which now features short
-
term
rotation opportunities, promotes internal mobility across teams,
functions and business divisions. Employees can explore career
paths, search for jobs and connect with colleagues while allowing
our recruiters to more easily source internal talent. The tool also
identifies potential competency gaps and automatically
recommends appropriate training. Since inception,
Career
Navigator
opportunities or find internal experts, discover possible career
paths and match themselves to open roles. More than 160,000
skills were added to our employee skills-sharing platform in 2021.
Our in-house UBS University plays a central role in fostering
diversity of thought within the firm, and in building employees’
skills for use now along with capabilities for the future. Our
offering includes line manager and leadership development,
advisory and sales training, and industry-leading certification for
client advisors, as well as data literacy, agile working and health
and well-being topics. Altogether in 2021, our permanent
employees completed more than 1,425,000 learning activities,
including mandatory training on compliance, business and other
topics, resulting in an average of more than two training days per
employee.
47
Society
The world’s social and environmental problems are too big and
complex to tackle alone. Lasting change can only be achieved
when philanthropists and public and private organizations work
collectively to maximize positive impact for people and the planet.
Our clients can maximize the positive effect of their giving
through our diverse social impact offering:
UBS
Philanthropy
Services and the grant-making UBS Optimus Foundation, as well
as UBS Global Visionaries and UBS Community Impact.
Reimagining client philanthropy
With nearly 70 philanthropy experts around the globe, we help
clients to maximize their impact locally, nationally and globally.
We have partnered for more than two decades with clients and
their families by using an investment-based approach and
connecting them to an international network of expertise and
support.
To best serve our clients, we base our approach on three pillars:
Advice, Insights and Execution.
Advice
who are considering setting up their first charitable fund and
guiding them on tax-efficient giving, thus maximizing the value of
charitable giving.
Insights
network of experts, both within and outside UBS (e.g., through
insight trips, publications, events with fellow philanthropists,
thought leaders and social entrepreneurs, such as UBS Global
Visionaries).
Execution
managing their philanthropic giving, including structures such as
our donor-advised funds
(DAFs) and our new
UBS Collectives
, and
supporting curated programs via UBS Optimus Foundation.
Donor-advised funds
A DAF offers clients an easy, flexible and efficient alternative to
setting up their own foundation. UBS has offered DAF services in
the US for some time, and in 2014 we established a DAF in the
UK, which has since had over GBP 450 million in donations. The
UBS Philanthropy Foundation was launched in Switzerland in
2020: it has raised more than USD 10 million in donations and in
its first year of operations launched its first thematic fund, which
is dedicated to the environment.
UBS Optimus Foundation
With a track record of over two decades
,
UBS Optimus
Foundation is recognized globally as both a philanthropic thought
leader and a pioneer in the social finance space, through which
we leverage solutions to mobilize private capital in new and more
efficient ways. The foundation uses an evidence-based approach
and focuses on programs that have the potential to be
transformative, scalable and sustainable. It conducts extensive
due diligence and only recommends what it considers to be the
most innovative programs that have the capacity to achieve long-
term, measurable impact. UBS also makes matching contributions
to the foundation, to help our clients’ donations go even further.
The
UBS Collectives
and bring together philanthropists to pool their funds, share their
expertise and achieve a longer-term impact. The
Collectives
three-year learning journey during which philanthropists follow a
curriculum, network with peers and engage in programs with the
goals of preventing family separation, mitigating climate change
and funding programs linked to measurable results. In 2021,
USD 21 million in funding was raised for this long-term systems-
level change approach.
UBS Global Visionaries
The private sector has a crucial role to play in supporting
innovative, sustainable solutions to some of the world’s most
pressing problems. This is why we launched the UBS Global
Visionaries program in 2016 with two main goals: (i) to create
opportunities for our clients and prospective clients to connect in
person (or virtually) with leading social entrepreneurs; and (ii) to
help our UBS Global Visionaries scale their positive change by
expanding their global network, building capacity and raising
awareness about their work. Since the program started, we have
supported
63
entrepreneurs across the globe, who all work
toward achieving a variety of the UN Sustainable Development
Goals. At the end of 2021, 20 of those entrepreneurs were
engaged in the program as active Global Visionaries, more than
60 prospective clients and clients had been directly connected
with them, and 80 events hosted by UBS at which they were
featured speakers. Over 29,000 stakeholders (such as prospective
clients
, clients and employees
)
part
icipated
in these events.
Feedback from our clients shows this gives them new ways to
engage
i
n their passions and learn
about
new topics or
technologies. In return, our UBS Global Visionaries benefit from
clients sharing their skills, experience and contacts.
UBS Community Impact
We are committed to supporting the communities in which we
work. Our employees, clients and shareholders expect us to play
our part in addressing social issues – and we believe it is the right
thing to do. Direct cash contributions, including support through
our Community Impact program, UBS’s affiliated foundations in
Switzerland, the UBS Foundation of Economics in Society at the
University of Zurich and contributions to UBS Optimus
Foundation, amounted to a total of USD 59 million in 2021.
During 2021, we focused on addressing social and wealth
inequality in our local communities through education and skill
building. Given the ongoing impact of the pandemic in 2021, we
continued to provide some COVID-19 relief to support the most
vulnerable, as well as supporting recovery and rebuilding efforts
through our community partners.
Following the announcement of UBS’s purpose in April 2021,
we undertook a review of our global Community Impact strategy
in light of UBS’s new sustainability commitment. We will increase
our focus on education and skills with the implementation of our
revised strategy in 2022.
UBS’s overall charitable contributions are measured using the
industry
-
leading Business Investment for Soci
etal
Impact
framework (B4SI). This includes cash, employee time, and in-kind
support.
›
Refer to “UBS’s charitable contributions” in the “What” section
of the Sustainability Report 2021, available from 11 March 2022
under “Annual reporting” at
ubs.com/investors
, for more
information
Our strategy, business model and environment | How we create value for our stakeholders
48
Our focus on sustainability and climate
Our commitment to sustainability starts with our purpose. We
know finance has a powerful influence on the world. At UBS, we
reimagine the power of people and investment, to help create a
better world for everyone: a fairer society, a more prosperous
economy and a healthier environment. That is why we partner
with our clients to help them mobilize their capital toward a more
sustainable world and why we have put sustainability at the heart
of our own business.
We are guided by the goal of being the financial provider of
choice for clients that want to
mobilize capital toward
the
achievement of the 17 Sustainable Development Goals (the SDGs)
of the United Nations (the UN) and the orderly transition to a low-
carbon economy. We are advancing toward 2030, the designated
deadline to achieve the SDGs. The SDGs focus on issues such as
climate change, equality and healthcare – major challenges for
our world now and over the coming years.
To help us maximize our impact and direct capital to where it
is needed most, we are focusing on three key areas to drive the
sustainability transition: planet, people, partnerships.
–
Planet:
lower-carbon future. We have committed to achieving net-zero
greenhouse gas emissions resulting from all aspects of our
business by 2050.
–
People:
We are taking action to get there, within our own workplace
and beyond.
–
Partnerships:
leaders and standard setters, our goal is to achieve impact on
a truly global scale.
›
Refer to the Sustainability Report 2021, available from 11 March
2022 under “Annual reporting” at
ubs.com/investors
, for more
information about how UBS is advancing sustainability in the
financial sector and beyond
Our sustainability and impact governance
Sustainability activities, including sustainable finance, are
overseen at the highest level of UBS , by the Board of Directors
(the BoD) and the Group Executive Board (the GEB), and are
grounded in our Code of Conduct and Ethics (the Code).
Code of Conduct and Ethics
In our Code of Conduct and Ethics, the BoD and the GEB set out
the principles and practices that define our ethical standards and
the way we do business
,
which
appl
y to all aspects of our
business. All employees must affirm annually that they have read
and will adhere to the Code and other key policies, supporting a
culture where ethical and responsible behavior is part of our
everyday operations. In our Code we make a commitment to
acting with the long term in mind and creating value for clients,
employees and shareholders. We aspire to do our part to create a
fairer, more prosperous society, championing a healthier
environment and addressing inequalities at their root. This ethos
underpins our purpose and is in line with our external
commitments, such as our pledge to help making progress
toward the SDGs.
In 2021, we revised the Code in line with our focus on
simplification, making it shorter, sharper and better aligned to our
strategic imperatives.
›
Refer to the Code of Conduct and Ethics of UBS, available at
ubs.com/code
, for more information
Board of Directors and Group Executive Board
The BoD is responsible for setting UBS’s values and standards to
ensure the Group’s obligations to stakeholders are met. Both the
Chairman of the BoD and the Group CEO play a key role in
safeguarding our reputation and ensuring we communicate
effectively with all of our stakeholders.
The BoD’s Corporate Culture and Responsibility Committee
(the CCRC) is the UBS body primarily responsible for corporate
culture, responsibility and sustainability. The CCRC oversees our
sustainability and impact strategy and activities and approves
Group-wide sustainability and impact objectives. The Group CEO
has delegated to the GEB lead for sustainability and impact, Suni
Harford, the responsibility for setting the firm’s sustainability and
impact strategy, in agreement with fellow GEB members.
The GEB sets the overall risk appetite for the firm and resolves
overarching matters relating to sustainability and climate risks,
including risk management framework, policies, and disclosure.
Group Risk Control is responsible for the development and
implementation of principles and an appropriate independent
control framework for sustainability and climate risks within UBS,
and the integration of the principles and the framework into the
firm’s overall risk management and risk appetite frameworks.
Group Sustainability and Impact
The Group Sustainability and Impact (GSI) organization was
created in 2021 to support the GEB lead for sustainability and
impact with carrying out her responsibilities. GSI comprises the
Chief Sustainability and Social Impact offices, headed by the Chief
Sustainability Officer (the CSO) and the Head Social Impact. The
CSO is responsible for driving the implementation of the Group-
wide sustainability and impact strategy, including reporting on our
progress toward net zero, and the execution thereof by the
business divisions and Group Functions. The Head Social Impact is
responsible for driving and implementing our social impact
strategy, including UBS Community Impact, UBS Philanthropy
Services and UBS Global Visionaries. Progress toward the firm’s
sustainability and impact strategy, including climate strategy, and
associated targets is reviewed at least annually by the GEB and
the CCRC.
49
Sustainability Risk, Finance, Compliance and Legal functions
The Chief Risk Officer for Sustainability oversees sustainability
activities relating to risk, including the climate risk program, and
supports the GEB by providing leadership on sustainability in
cooperation with the business divisions and Group Functions.
The Sustainability Chief Financial Officer, a member of the
Group Finance function, ensures that sustainability considerations
are embedded into the firm’s financial decision-making processes,
supports the expanding external sustainability disclosures arising
from both
new regulatory requirements and voluntary
commitments made by our firm, and oversees the continued
development of the firm’s financial control environment that
underpins our disclosures.
The Sustainability Expert Group within the GCRG function was
established in 2021 due to the strategic importance of
sustainability to UBS, the rapidly evolving nature of the regulatory
and policy agenda in this area, and GCRG’s desire to ensure the
firm is able to interact effectively and proactively with policy-
makers, the regulatory supervisors of the Group and other
relevant stakeholders.
The global environmental, social and governance (ESG) legal
team within the Group General Counsel function advises the
business on sustainability-related risks across UBS’s operations. It
plays an important role in advising the business teams on existing
and emerging rules and regulations governing sustainable
investing and sustainable lending.
›
Refer to “Board of Directors” in the “Corporate governance”
section of this report for more information about the CCRC
›
Refer to the Sustainability Report 2021, available from 11 March
2022 under “Annual reporting” at
ubs.com/investors
, for more
information about our governance of sustainability and impact
Our approach to sustainable finance
The UN estimates the gap in funding needed to achieve the SDGs
by 2030 at USD 2.5 trillion to USD 3 trillion annually,
1
experts putting the number even higher. We recognize this as
both a challenge for society and an opportunity for our clients. As
a global financial institution, we have a role in reaching the SDGs,
by directing capital to where it is needed the most.
Our clients turn to us for advice on how they can help to
finance the transition to a low-carbon economy, support
sustainable finance, align their investments with their personal
values, and better risk manage their portfolios and businesses.
They want to take advantage of these opportunities, while also
managing the risks associated with this transformational
challenge.
Our clients’ growing interest in sustainable finance is clearly
shown in a number of key surveys. According to a global UBS
Investor Sentiment survey,
2
66% of investors see sustainable
investing as highly important to their portfolio strategy. When it
comes to business owners, 61% believe sustainability could
generate more revenue
,
57% believe it could improve client
relationships and
55%
believe it could do the same for
relationships with employees.
A global survey published in 2021 titled “Resetting the agenda
How ESG is shaping our future”
3
institutional investors agree that the COVID-19 pandemic will
accelerate the general interest in ESG and capital inflows into
sustainable investments over the next three to five years. Of those
surveyed, 65% plan to integrate ESG into at least 25% of their
assets under management for the next 12 months. Importantly,
almost three-quarters of survey respondents agreed that
investments integrating ESG factors performed better financially
than equivalent traditional investments in the three years prior to
2020.
We are committed to serving our clients’ growing sustainable
finance needs and expectations. More fundamentally, we believe
sustainable finance is the future of finance. Recognition of impact
on financial performance, regulatory developments, evolving
societal norms, investor demand and consumer preference are
factors that contribute to drive the continued evolution of
mainstream investing toward more holistic long-term-oriented
approaches.
We are looking to create more scalable sustainable and impact
investing solutions that deliver competitive financial returns, and
to advise our corporate clients on risks to their business models,
while driving positive outcomes. Fundamentally, for the benefit of
our clients, we are helping to shape the landscape of sustainable
finance by using thought leadership, innovation and partnerships
to support them in their sustainability efforts.
›
Refer to the Sustainability Report 2021, available from 11 March
2022 under “Annual reporting” at
ubs.com/investors
, for more
information about our sustainability and impact strategy and
activities
›
Refer to the sub-section below for more information about our
climate governance, strategy, risk management, and metrics and
targets and to the UBS Climate Report 2021, available from
11 March 2022 under “Annual reporting” at
ubs.com/investors
,
for the full UBS climate disclosures
Defining sustainable finance
Sustainable finance refers broadly to any form of financial service
that aims to achieve positive sustainability outcomes, including
through the integration of ESG criteria into business or investment
decisions. This encompasses sustainable investing and sustainable
financing solutions. Sustainable finance has long been a topic
firm-wide and there is now a sharpened understanding in the
market of its importance, accelerated by factors such as the
COVID-19 pandemic and a changing climate. Our aim is to
continue to help our clients meet their investment and financing
objectives through sustainable finance.
1
un.org/sustainabledevelopment/sg-finance-strategy
2
About the survey: UBS surveyed 3,004 investors and 1,202 business owners with at least USD 1 million in investable assets (for investors) or at least USD 1 million in annual revenue and at least one employee other
than themselves (for business owners), between 28 September and 18 October 2021. The global sample was split across 15 locations: Argentina, Brazil, Mainland China, France, Germany, Hong Kong SAR, Italy, Japan,
Mexico, Russia, Singapore, Switzerland, the UAE, the UK and the US.
3
The survey was conducted by the Economist Intelligence Unit, commissioned by UBS, and surveyed 450 institutional investors working in asset and wealth management firms, corporate pension funds, endowment
funds, family offices, government agencies, hedge funds, insurance companies, pension funds, sovereign wealth funds and reinsurers in North America, Europe and Asia Pacific.
Our strategy, business model and environment | How we create value for our stakeholders
50
Sustainable investment
Sustainable investment
seek to make a difference, while generating competitive financial
returns. SI strategies aim to better risk manage portfolios in line
with 21st-century challenges and / or to align investments with
investors’ sustainability values, while also targeting improved
portfolio risk and return characteristics.
We have long recognized that clients and other stakeholders
need transparency about the sustainability objectives of our
various investment products. During 2021, the European Union’s
Sustainable Finance Disclosure Regulation (the SFDR) provided the
first formal, comprehensive legislative framework establishing an
important marker for the industry’s efforts in this area.
Consequently, we have further evolved our own definitions of SI,
which now include the following two categories.
–
Sustainability focus:
intentions or objectives that drive the strategy. Underlying
investments may contribute to positive sustainability outcomes
through products / services / use of proceeds.
–
Impact investing:
intention of generating
measurable, verifiable, positive
sustainability outcomes. Impact generated is attributable to
investor action and / or contribution.
ESG integration and exclusion
We also identify two approaches that consider ESG factors in the
investment process to varying degrees, but which on their own
are not considered sustainable investment.
–
ESG integration
: considers ESG factors alongside traditional
financial metrics to assess the risk-return profile in the
investment process. This approach is rapidly becoming an
industry standard, as the inclusion of such factors has been
shown to benefit overall investment risk-return considerations.
–
Exclusion
: when individual companies or entire industries are
excluded from portfolios because their activities do not meet
certain ESG criteria and / or do not align with the values of
clients and / or UBS.
Sustainable financing
We offer products and solutions, including access to capital
markets, to clients looking to finance assets that demonstrate
sustainability characteristics and / or support the transition to a
low-carbon economy. Financing activities can be on-balance sheet
(such as loans and mortgages) or off-balance sheet (such as access
to debt and equity markets). We also provide advice on ESG
factors (both financial and non-financial), such as integrated
disclosure requirements.
We use regulatory and market standards where these are
available; for example, in the debt capital markets business, we
refer to the International Capital Market Association (ICMA)
Green, Social or Sustainability-Linked Bond Principles. Where such
guidelines or standards are not available, we aim to align with
market best practice. This is the case, for example, with equity
capital markets activities.
Our established sustainability and climate risk (SCR, previously
known at UBS as environmental and social risk, or ESR) framework
is used to analyze potential transactions and client relationships in
order to limit any negative impact on the environment and society.
Moreover, as one of
the world’s largest asset gathering
businesses, we are in a privileged position to leverage the
experience gained from our Climate Aware framework,
established in 2019 by our Asset Management business, to the
benefit of our financing clients.
›
Refer to the “Key achievements in 2021” chart in the
Sustainability Report 2021, available from 11 March 2022 under
“Annual reporting” at
ubs.com/investors
In 2021, we noted continued strong momentum in our
sustainable finance activities. SI assets grew to USD 251 billion,
compared with USD 141 billion in 2020, and assets subject to ESG
integration and to exclusions grew to USD 813 billion in 2021,
compared with USD 645 billion in 2020. Jointly, SI assets and
assets subject to ESG integration and to exclusions reached over
23% of client invested assets, up from 18.8% in 2020. In addition
to generally supportive markets, the growth was driven by client
demand, our focus on advancing sustainable solutions, and
converting traditional funds to sustainable ones.
51
UBS total invested assets
1,2
For the year ended
% change from
USD billion, except where indicated
GRI
31.12.2021
31.12.20
31.12.19
31.12.20
Sustainable investments
Sustainability focus
3
FS11
222.7
127.7
46.4
74.4
Impact investing
4
FS11
28.5
13.1
9.1
117.1
Total sustainable investments
5
251.2
140.8
55.5
78.4
SI proportion of total invested assets (%)
5.5
3.4
1.5
ESG integration
6
FS11
558.0
512.8
372.3
8.8
Exclusion
7
FS11
255.1
132.2
52.2
93.0
Total ESG integration and exclusion
FS11
813.2
645.0
424.5
26.1
ESG integration and exclusion proportion of total invested assets (%)
FS11
17.7
15.4
11.8
UBS total invested assets
4,596.2
4,187.2
3,606.6
9.8
1
the investment process, are in and of themselves not considered sustainable investment strategies.
2
Reporting Initiative (GRI) reporting framework.
3
through products / services / use of proceeds. Examples include Global Wealth Management’s Discretionary Manage SI mandate solution and Asset Management’s strategies such as its Global Sustainable Equities
product.
4
Global Wealth Management’s Oncology Impact funds and Asset Management’s Global Engage for Impact Equity funds.
5
in line with corresponding changes to the funds’ underlying investment policies. The main impact was on sustainability focus and impact strategies in Asset Management of USD 38 billion and sustainability focus
fund conversions in Global Wealth Management.
6
7
not meet certain ESG criteria and / or do not align with the values of clients and / or UBS. The enhancement of the UBS ESG exclusion policy to include a broader set of exclusions in the third quarter of 2021 was the
main driver (>50%) of the increase in exclusion assets in 2021.
Our offering to clients
Our private clients benefit from fully diversified sustainable
portfolios, as well as advisory options. In 2020, we made
sustainable investments the preferred solution for private clients
investing globally. In July 2021, we expanded our sustainable
investing offering with a new advisory solution that enables clients
to tailor their sustainable investments to their personal
preferences. In 2021, our flagship SI mandates, based on our
sustainable investing strategic asset allocation (SI SAA), exceeded
USD 30 billion under management.
Our institutional clients benefit from the holistic integration of
ESG factors into the investment decision-making process across
the entire suite of investment funds and strategies. Underpinning
our ESG integration activities is a robust stewardship program,
including engagement and proxy voting. We have continued to
build on our position as a leading provider of sustainable
exchange-traded funds (ETFs), launching 17 new sustainable ETFs
in 2021, including a full suite of benchmarks aligned with the Paris
Agreement. We remain firmly positioned as Europe’s second-
largest sustainable ETF-provider, with an SI asset base of USD 40
billion as of 31 December 2021.
Our retail clients in Switzerland have access to appropriate and
relevant SI products. Interest in SI solutions continued to be strong
in 2021.
UBS ManageTM SI
,
a Global Wealth Management
product, represented almost 70% of Personal Banking’s mandate
sales. In addition, 47% of total custody assets in Personal Banking
are composed of sustainable investments.
For our Swiss corporate and institutional clients, supplier and
producer transactions in commodity trade finance are monitored
according to our SCR standards. Furthermore, our sustainable
finance advice extends to strategic positioning of business
models, disclosure practices and benchmarking.
Our corporate clients benefit from a range of financing and
advisory solutions at all stages on their sustainability journey. In
2021, Global Banking, within our Investment Bank, set up an ESG
Advisory team to assist established corporate clients with the
integration of ESG risks and opportunities into their decisions
related to strategy, operations and financing, thereby supporting
their positioning in the financial markets. They also help young
ESG-driven companies with the raising of private and / or public
financing.
›
Refer to the Sustainability Report 2021, available from 11 March
2022 under “Annual reporting” at
ubs.com/investors
, for more
information about our sustainable investing and financing
offering, including financing solutions, advisory and research
and insights
Managing sustainability and climate risks
At UBS, SCR is defined as the risk that UBS is negatively impacted
by or
negatively
impacts
climate change, loss of biodiversity,
human rights infringements, and other environmental, social and
governance matters. We apply an SCR policy framework with the
aim of identifying and managing potential adverse impacts on the
environment and / or to human rights, as well as the associated
environmental and social risks to which our clients’ and our own
assets are exposed.
›
Refer to “Sustainability and climate risk” in the “Risk
management and control” section of this report for more
information
Our strategy, business model and environment | How we create value for our stakeholders
52
Our sustainability targets and progress
We work with a long-term focus on providing appropriate returns
to all of our stakeholders in a responsible manner. To underline
our commitment, we provide transparent targets and report on
progress made against them wherever possible. In 2021, we
included new targets, in particular pertaining to our commitment
to becoming a net-zero bank. Our targets, as set out below, can
therefore only partly be compared with what we set out in
previous years.
Our key targets
Planet, people, partnerships
–
USD 400 billion invested assets in sustainable investments by
2025.
Planet
–
Set decarbonization targets for 2030 for financing of the fossil
fuel, power generation and real estate sectors (from 2020
levels):
–
reduce absolute financed emissions associated with UBS
loans to fossil fuel companies by 71%;
–
reduce emissions intensity associated with UBS loans to
power generation companies by 49%;
–
reduce emissions intensity of UBS’s commercial real estate
lending portfolio by 44%; and
–
reduce emissions intensity of UBS’s residential real estate
lending portfolio by 42%.
–
Align USD 235 billion of invested assets to net zero by 2030
(Asset Management).
–
A
chieve net
-
zero
emissions
across discretionary client
portfolios by 2050.
–
Achieve net-zero emissions resulting from our own operations
(scopes 1 and 2) by 2025; cut energy consumption by 15% by
2025 (compared with 2020).
–
Offset historical emissions back to the year 2000 by sourcing
carbon offsets (achieved by the end of 2021) and by offsetting
credit delivery and full retirement in registry (by the end of
2025).
–
Engage with our key vendors on targeting net zero by 2035.
People
–
30% global female representation at Director level and above
by 2025.
–
26% US ethnic minority representation at Director level and
above by 2025.
–
26% UK ethnic minority representation at Director level and
above by 2025.
–
Raise USD 1 billion in donations to our client philanthropy
foundations and funds and reach 25 million beneficiaries by
2025 (cumulative for 2021–2025).
–
Support one million beneficiaries through our community
impact activities by 2025 (cumulative for 2020–2024).
Partnerships
–
Establish UBS as a leading facilitator of discussion, debate and
idea generation.
–
Drive standards, research and development, and product
development through partnerships across the financial
ecosystem.
›
Refer to the Sustainability Report 2021, available from 11 March
2022 under “Annual reporting” at
ubs.com/investors
, for more
information about UBS’s sustainability achievements in 2021 and
our progress on key targets
Taking climate action
1
Our climate governance
As part of its annual approval of our sustainability and impact
objectives, the CCRC also oversees UBS’s climate strategy, as set
by the GEB. During its six meetings throughout the course of the
year, the CCRC reviews the GEB’s activities in executing our
climate strategy and, jointly with the BoD’s Risk Committee,
evaluates the progress of our climate risk program. The committee
also reviews the alignment of our climate disclosures with the
recommendations of the Task Force on Climate-related Financial
Disclosures (the TCFD).
We manage these annual plans and goals through our ISO
14001-certified environmental management system (the EMS),
with management accountabilities across our firm. The EMS helps
us reduce environmental risks, seize market opportunities, and
continually improve our environmental, climate and resource-
efficiency performance.
In May 2021, we established a net-zero task force to help
progress toward our ambition of reaching net zero by 2050. The
GEB lead for sustainability and impact chairs the task force. Senior
representatives from across our firm, including from the business,
risk and finance, attend the task force’s monthly meetings.
›
Refer to the UBS Climate Report 2021, available from 11 March
2022 under “Annual reporting” at
ubs.com/investors
, for UBS’s
full climate disclosures
1
from 11 March 2022 under “Annual reporting” at
ubs.com/investors
, integrated in the UBS Sustainability Report 2021 or as a standalone document.
53
Our climate strategy
In April 2021, we committed to achieving net-zero greenhouse
gas emissions resulting from all aspects of our business by 2050
(scope 1, 2 and 3 emissions). We are publishing our journey
toward this ambition in our climate roadmap.
Our climate strategy covers two main areas: managing climate-
related financial risks and
acting for a low
-
carbon future
.
Underpinning these two areas are four strategic pillars.
1. Protecting our clients’ assets
As a global financial institution, it is our responsibility to help
clients navigate through the challenges of the transition to a low-
carbon economy. We help our clients assess, manage and protect
their assets from climate-related risks by offering innovative
products and services in investment, financing and research. We
work collaboratively across our industry and with our clients,
ensuring they have access to best practice, robust science-based
approaches, standardized methodologies, and quality data for
measuring and mitigating climate risks. Our activities include
engaging on climate topics with the companies we invest in. For
example, our
Asset Management business division has
implemented an engagement program with 46 companies from
the oil and gas, electric and other utilities, metals and mining,
construction materials, chemicals, and automotive sectors. During
2021, we also supported 70 climate-related resolutions.
2. Protecting our own assets
We seek to protect our assets by limiting our risk appetite for
carbon-related assets. We use scenario-based stress-testing
approaches and other forward-looking portfolio analyses to
estimate our vulnerability to climate-related risks. As of
31 December 2021, we had reduced our lending exposure to
carbon-related assets to 9.9% (USD 45.6 billion) of our total
customer lending exposure. This was down from 10.4% at the
end of 2020 and 10.7% at the end of 2019.
3. Reducing our climate impact
We are committed to achieving net-zero emissions in our own
operations (scopes
1 and 2) by
2025 by replacing fossil fuel
heating systems, maintaining our 100%-renewable electricity
coverage and investing in credible carbon removal projects
(including negative emissions technology). We will also
compensate for our historical scope 1 and 2 emissions back to the
year 2000 by using credible and clear carbon offsets and
investments in nature-based solutions. Furthermore, we are
currently working to understand and quantify the scope 3
emissions in our supply chain. We are engaging with our key
vendors on targeting net zero by 2035.
4. Mobilizing capital
We mobilize private and institutional capital through investments
that help the world mitigate and adapt to climate change. We
were the first major global financial institution to have made
sustainable investments the preferred solution for our private
clients wishing to invest globally. We also support our goal of
mobilizing capital as a lender and corporate advisor. For corporate
clients, we support the issuance of green, social, sustainability and
sustainability
-
linked bonds
–
and the raising of capital in
international capital markets – in line with recognized market
guidelines, such as the ICMA Green Bond Principles. We also
extend green and sustainable loans in line with the Loan Market
Association. In 2021, we began offering borrowers
Green
Mortgages
via the
key4
platform, the first Swiss real estate
platform for investment properties that promotes sustainable
mortgages.
›
Refer to the UBS Climate Report 2021, available from 11 March
2022 under “Annual reporting” at
ubs.com/investors
, for a full
description of UBS’s climate strategy
Our strategy, business model and environment | How we create value for our stakeholders
54
Our management of climate risks
Climate risks can arise from either changing climate conditions
(physical risks) or from efforts to mitigate climate change
(transition risks). The physical and transition risks from a changing
climate contribute to a structural change across economies and,
consequently, can affect banks and the financial sector through
financial and non-financial impacts.
In March 2020, Group Risk Control established our firm’s
climate risk program to further integrate climate risk in the firm’s
risk management framework and standard processes.
The
program follows a multi-year roadmap to address regulatory
expectations and is engaging with stakeholders and experts both
internally and externally to further
develop
climate risk
methodologies, to deliver on ongoing climate stress testing
exercises and to build capacity to respond to climate risk
management expectations.
We currently identify and manage climate risks in our own
operations, our balance sheet, client assets and the supply chain.
To protect our clients’ and our own assets from climate-related
risks, in 2021, we continued to drive the integration of climate-
related risk into our standard risk management framework.
We further integrated climate risk in: (i) risk identification and
measurement
;
(ii)
monitoring and risk appetite setting
;
(iii) management and control; and (iv) reporting processes across
the organization.
›
Refer to “Sustainability and climate risk” in the “Risk
management and control” section of this report
›
Refer to the UBS Climate Report 2021, available from 11 March
2022 under “Annual reporting” at
ubs.com/investors
, for a full
description of UBS’s management of climate risks
Our climate-related metrics and targets
For many years, we have been developing methodologies that
enable us to disclose climate-related metrics more robustly and
transparently. Most recently, regulators and standard setters have
provided more guidance on metrics. We firmly aim to keep pace
with these new developments and requirements and further
evolve our climate-related metrics. This commitment remains, as
does our determination to continue leading the way in efforts to
mitigate climate change.
UBS supports the goals of the Paris Agreement, which includes
aligning our own operations and business activities with a
pathway of a five-step net-zero plan to: (i) measure carbon
emissions; (ii) define a roadmap and set targets; (iii) reduce
climate impact; (iv) finance climate action and support the
transition of our clients; and (v) communicate and engage.
›
Refer to the UBS Climate Report 2021, available from 11 March
2022 under “Annual reporting” at
ubs.com/investors
, for a full
description of UBS’s net-zero targets, including baselines and
pathways
55
Climate-related metrics 2021
For the year ended
% change from
31.12.21
31.12.20
31.12.19
31.12.20
Risk management
Carbon-related assets (USD billion)
1,2
45.6
45.4
40.1
0.4
of which: UBS AG (standalone)
3
7.0
7.6
7.5
(8.7)
of which: UBS Switzerland AG (standalone)
3
37.9
37.1
31.9
2.4
Proportion of total customer lending exposure, gross (%)
9.9
10.4
10.7
Total exposure to climate-sensitive sectors, transition risk (USD billion)
2,4
37.5
37.5
33.4
0.0
of which: UBS AG (standalone)
3
4.6
5.4
5.8
(15.9)
of which: UBS Switzerland AG (standalone)
3
32.8
31.7
27.3
3.4
Proportion of total customer lending exposure, gross (%)
8.2
8.6
9.0
Total exposure to climate-sensitive sectors, physical risk (USD billion)
2,4
25.5
26.2
25.6
(2.8)
of which: UBS AG (standalone)
3
10.8
11.5
13.1
(6.1)
of which: UBS Switzerland AG (standalone)
3
13.6
13.5
11.7
1.4
Proportion of total customer lending exposure, gross (%)
5.6
6.0
6.9
Identified significant climate-related financial risk on balance sheet
5
None
None
None
Opportunities
Number of green, sustainability, and sustainability-linked bond deals
6
98
29
26
237.9
Total deal value of green, sustainability, and sustainability-linked bond deals (USD billion)
6
63.3
19.3
15.6
UBS apportioned deal value of above (USD billion)
13.2
5.7
3.4
Stewardship – voting
Number of climate-related resolutions voted upon
7
89
50
44
78.0
Proportion of supported climate-related resolutions (%)
78.6
88.0
81.8
Own operations
(reporting period: July to June)
Net GHG footprint (1,000 metric tons CO
2
e)
8
30
75
104
(60.0)
Change from baseline 2004 (%)
(92.0)
(79.0)
(71.2)
Share of renewable electricity (%)
100
85
72
1 The carbon-related assets metric has been updated to cover the four non-financial groups as defined by the TCFD, i.e., energy, transportation, materials and buildings, and agriculture, food and for est products. 2 Includes total
loans and advances to customers and guarantees as well as irrevocable loan commitments (within the scope of expected credit loss). 3 Based on standalone IFRS numbers. 4 Climate-sensitive sectors are defined as those business
activities that are rated as having high, moderately high or moderate vulnerability to transition risks and physical risks. For more details, refer to the “UBS lending to climate-sensitive sectors” table under “Sustainability and climate
risk” in the “Risk management and control” section of this report and “Climate scenario analysis” in the “What” section of the Sustainability Report 2021, available from 11 March 2022 under “Annual reporting” at
ubs.com/investors
.
Physical risk number includes USD 4 billion of loans backed by real estate in regions with elevated physical climate risks. Global Wealth Management corporate lending to customers represents 1.1% of all on- and off-balance sheet
loans and advances to customers, and is excluded from the climate-sensitive sectors analysis in 2021. 5
ethodologies for assessing climate-related financial risk are emerging and may change over time, as described in the UBS
Climate Report 2021, available from 11 March 2022 under “Annual reporting” at
ubs.com/investors
. 6
Such as, but not limited to, ICMA Green Bond Principles, Sustainability Bond Principles, and Sustainability-linked Bond Principles.
7 This excludes proposals related to Japanese companies that included changes to the companies’ articles of association. 2021 numbers include shareholder and management proposals, 2020 and 2019 numbers shareholder proposals
only. This reflects the increasingly common market practice of climate-related proposals being presented by management. 8 Net greenhouse gas (GHG) footprint equals gross GHG emissions minus GHG reductions from renewable
electricity and CO
2
e offsets (gross GHG emissions include: direct GHG emissions by UBS; indirect GHG emissions associated with the generation of imported / purchased electricity (grid average emission factor), heat or steam; and
other indirect GHG emissions associated with business travel, paper consumption and waste disposal). A breakdown of our GHG emissions (scopes 1, 2 and 3) is provided in appendix 4 to the Sustainability Report 2021, available from
11 March 2022 under “Annual reporting” at
ubs.com/investors
.
Reporting to our stakeholders on our sustainability
strategy and activities
Information about all our sustainability efforts and commitments
is provided in our Sustainability Report 2021, available under
“Annual reporting” at
ubs.com/investors
. The content of the
Sustainability Report 2021 has been prepared in accordance with
Global Reporting Initiative (GRI) Standards (the “comprehensive”
option) and with the German rules implementing the EU Directive
on disclosure of non-financial and diversity information
(2014/95/EU). Our reporting on sustainability has been reviewed
on a limited assurance basis by Ernst & Young Ltd against the GRI
Standards.
›
Refer to the Sustainability Report 2021, available from 11 March
2022 under “Annual reporting” at
ubs.com/investors
, for an
overview of non-financial disclosures in accordance with the
German rules implementing EU Directive 2014/95 and for
information on UBS AG and UBS Europe SE disclosures pursuant
to EU Taxonomy Art. 8
Our strategy, business model and environment | Regulation and supervision
56
Regulation and supervision
As a financial services provider based in Switzerland, UBS is subject
to consolidated supervision by the Swiss Financial Market
Supervisory Authority (FINMA). Our entities are also regulated and
supervised by authorities in each country where they conduct
business. Through UBS AG and UBS Switzerland AG, both licensed
as banks in Switzerland, UBS may engage in a full range of financial
services activities in Switzerland and abroad, including personal
banking, commercial banking, investment banking and asset
management.
As a global systemically important bank (
a
G
-
SIB), as
designated by the Financial Stability Board, and a systemically
relevant bank (an SRB) in Switzerland, we are subject to stricter
regulatory requirements and supervision than most other Swiss
banks.
›
Refer to the “Our evolution” section of this report for more
information
›
Refer to the “Regulatory and legal developments” and “Risk
factors” sections of this report for more information
Regulation and supervision in Switzerland
Supervision
UBS Group AG and its subsidiaries are subject to consolidated
supervision by FINMA under the Swiss Banking Act and related
ordinances, which impose standards for matters such as minimum
capital, liquidity, risk concentration and internal organization
standards. FINMA meets its statutory supervisory responsibilities
through licensing, regulation, supervision, and enforcement. It is
responsible for prudential supervision and mandates audit firms to
perform regulatory audits and other supervisory tasks on its behalf.
Capital adequacy and liquidity regulation
As an internationally active Swiss SRB, we are subject to capital and
total loss-absorbing capacity requirements that are based on both
RWA and LRD and are among the most stringent in the world. We
are also subject to short-term liquidity coverage ratio rules and to
long-term minimum funding requirements.
›
Refer to the “Capital, liquidity and funding, and balance sheet”
section of this report for more information about the Swiss SRB
framework and the Swiss too-big-to-fail requirements
›
Refer to “Liquidity coverage ratio” in the “Capital, liquidity and
funding, and balance sheet” section of this report for more
information about liquidity coverage ratio requirements
›
Refer to the “Regulatory and legal developments” section of this
report for more information about the introduction of the net
stable funding ratio
›
Refer to “Industry trends” in the “Our environment” section of
this report for more information about revisions of the Swiss
too-big-to-fail liquidity framework
Regulation and supervision outside Switzerland
Regulation and supervision in the US
In the US, UBS is subject to regulation and supervision by the Board
of Governors of the Federal Reserve System (the Federal Reserve
Board) under a number of laws. UBS Group AG and UBS AG are
both subject to the Bank Holding Company Act, pursuant to which
the Federal Reserve Board has supervisory authority over the US
operations of both UBS Group AG and UBS AG.
In addition to being a financial holding company under the
Bank Holding Company Act, UBS AG has US branches, which are
authorized and supervised by the Office of the Comptroller of the
Currency. UBS AG is registered as a swap dealer with the
Commodity Futures Trading Commission (the CFTC) and as a
securities-based swap dealer with the Securities and Exchange
Commission (the SEC).
UBS Americas Holding LLC, the intermediate holding company
for our operations in the US outside of the UBS AG branch
network, as required under the Dodd–Frank Act, is subject to
requirements established by the Federal Reserve Board related to
risk-based capital, liquidity, the Comprehensive Capital Analysis
and Review stress testing and capital planning process, and
resolution planning and governance.
UBS Bank USA, a Federal Deposit Insurance Corporation-
insured depository institution subsidiary, is licensed and regulated
by state regulators in Utah.
UBS Financial Services Inc., UBS Securities LLC and several other
US subsidiaries of UBS are subject to regulation by a number of
different government agencies and self-regulatory organizations,
including the SEC, the Financial Industry Regulatory Authority, the
CFTC, the Municipal Securities Rulemaking Board and national
securities exchanges, depending on the nature of their business.
Regulation and supervision in the UK
Our regulated UK operations are mainly subject to the authority
of the Prudential Regulation Authority (the PRA), which is part of
the Bank of England, and the Financial Conduct Authority (the
FCA). We are also subject to the rules of the London Stock
Exchange and other securities and commodities exchanges of
which UBS AG is a member.
UBS AG has a UK-registered branch in London, which serves as
a global booking center for our Investment Bank. Our regulated
subsidiaries in the UK that provide asset management services are
authorized and regulated mainly by the FCA, with one entity also
subject to the authority of the PRA.
Regulation and supervision in Germany / the EU
UBS Europe SE is subject to the direct supervision of the European
Central Bank, as well as to continued conduct, consumer
protection and anti-money laundering-related supervision by the
German Federal Financial Supervisory Authority (the BaFin) and
supervisory support by the German Bundesbank. The entity is
subject to EU and German laws and regulations. UBS Europe SE
maintains branches in Denmark, France, Italy, Luxembourg, the
Netherlands, Poland, Spain, Sweden and Switzerland, and is
subject to conduct supervision by authorities in all those countries.
57
Regulation and supervision in Asia Pacific
We operate in 13 locations in Asia Pacific and are subject to the
regulation and supervision by local financial regulators. Our regional
hubs are Singapore and Hong Kong SAR.
In Singapore, we conduct our operations primarily through
UBS AG Singapore Branch and UBS Securities Pte. Ltd., which are
supervised by the Monetary Authority of Singapore and the
Singapore Exchange.
UBS AG Hong Kong Branch is primarily supervised by the Hong
Kong Monetary Authority. UBS Securities Hong Kong Limited, UBS
Securities Asia Limited and UBS Asset Management (Hong Kong)
Limited are primarily supervised by the Hong Kong Securities and
Futures Commission. In addition, UBS Securities Hong Kong
Limited is supervised by the Hong Kong Stock Exchange and the
Hong Kong Futures Exchange.
In Mainland China, UBS has multiple licenses to operate its core
business lines
,
and the various UBS entities are subject to
regulation by a number of different government agencies. The
People’s Bank of China oversees the macro capital markets
policies and ensures coordinated supervisory approaches by the
China Banking and Insurance Commission, the China Securities
and Regulatory Commission, and the exchanges.
Financial crime prevention
Combating money laundering and terrorist financing has been a
major focus of many governments in recent years. Laws and
regulations, including the US Bank Secrecy Act, require effective
policies, procedures and controls to detect, prevent and report
money laundering and terrorist financing, and the verification of
client identities. Failure to introduce and maintain adequate
programs to prevent money laundering and terrorist financing can
result in significant legal and reputation risk and fines.
We are also subject to laws and regulations prohibiting corrupt
or illegal payments to government officials and other persons,
including the US Foreign Corrupt Practices Act and the UK Bribery
Act. We maintain policies, procedures and internal controls
intended to comply with those regulations.
›
Refer to “Non-financial risk” in the “Risk management and
control” section of this report for more information
Data protection
We are subject to regulations concerning the use and protection
of customer, employee, and other personal and confidential
information. This includes provisions under Swiss law, the EU
General Data Protection Regulation (the GDPR) and laws of other
jurisdictions.
›
Refer to the “Risk factors” section of this report for more
information about regulatory change
Recovery and resolution
Swiss too-big-to-fail (TBTF) legislation requires each Swiss SRB to
establish an emergency plan to maintain systemic functions in
case of impending insolvency. In response to these Swiss
requirements, and similar ones in other jurisdictions, UBS has
developed recovery plans and resolution strategies, as well as
plans for restructuring or winding down businesses if the firm
could not be stabilized otherwise.
In 2013, FINMA stated its preference for a single point of entry
(SPE) strategy for globally active SRBs, such as UBS, with a bail-in
at the group holding-company level. UBS has made structural,
financial and operational changes to facilitate an SPE strategy and
is confident that a resolution of the bank is operationally
executable and legally enforceable. FINMA published its most
recent assessment of Swiss SRBs’ emergency and recovery and
resolution plans in March 2021, which confirmed that our Swiss
emergency plan is effective, subject to further reduction of joint
and several liabilities. Since the previous assessment, UBS has
reduced its joint and several liabilities to the requested level.
FINMA acknowledged progress made in UBS’s overall resolvability,
by building up the necessary capabilities or removing obstacles to
the implementation of the resolution strategy.
UBS’s crisis management framework
Our crisis management framework includes three key governance
bodies (see chart on the following page), which take responsibility
and action depending on the nature of the stress incident and the
scale of the response needed.
–
For incident, risk and crisis management, the Group Crisis
Management Committee works with incident management
teams that provide monitoring and early-warning indicators at
local / regional level, without needing to activate protocols at
the Group level. If a local response is insufficient, global task
forces and crisis management teams provide decision-making
guidance and coordination, including crisis management
plans, protocols and playbooks, and contingency funding
plans.
–
The Group Executive Board and the Board of Directors would
evaluate and decide upon the need to activate the Global
Recovery Plan (the GRP) if a stress event reached a severity
requiring that, based on the GRP’s risk indicators.
–
FINMA has the authority to determine whether the point of
non-viability (PONV) as defined by Swiss law (referred to as
“impending insolvency” in the Banking Act) has been reached
and, in such cases, as part of the resolution strategy, has the
power to order the bail-in of creditors to recapitalize and
stabilize the Group, limit payments of dividends and interest,
alter our legal structure, take actions to reduce business risk,
and order a restructuring of the bank.
Our strategy, business model and environment | Regulation and supervision
58
Global Recovery Plan
The GRP gives senior management a tool to restore financial
strength if UBS comes under severe capital and liquidity stress.
Quantitative and qualitative triggers are monitored daily and
subject to predefined governance and escalation processes.
Recovery options are linked to owners and checklists with the
objectives being capital preservation, capital raising and raising
funding, and disposal or wind-down of businesses.
Global Resolution Strategy
FINMA is responsible for developing the resolution strategy for UBS.
The planning includes measures that FINMA can take to resolve UBS
in an orderly manner if the Group enters into resolution. FINMA has
the ultimate authority and responsibility to execute the resolution,
in cooperation with the Swiss National Bank, the Swiss Federal
Department of Finance and other key authorities. The SPE bail-in
strategy would involve writing down the Group’s remaining equity
and additional tier 1 and tier 2 instruments, as well as bail-in of total
loss-absorbing (TLAC)-eligible senior unsecured bonds at the UBS
Group AG level. An internal recapitalization of undercapitalized
subsidiaries would be made simultaneously with losses transmitted
to UBS AG and, ultimately, UBS Group AG. Post-resolution
restructuring measures could include disposal and winding down of
businesses and assets. FINMA noted that we have already taken key
preparatory steps and made good progress regarding global
resolvability.
Local recovery and resolution plans
The Swiss emergency plan demonstrates how UBS’s systemically
important functions and critical operations in Switzerland can
continue if the UBS Group cannot be restructured. This is achieved
mainly by maintaining UBS Switzerland AG as a separate legal
entity. FINMA has confirmed that the Swiss emergency plan is
effective, subject to further reduction of joint and several
liabilities.
The US resolution plan sets out the steps that could be taken
to resolve the UBS Americas Holding LLC group if it suffered
material financial distress and the UBS Group was unable or
unwilling to provide financial support. As required by US
regulations, our US plan contemplates that UBS Americas Holding
LLC will commence US bankruptcy proceedings. Prior
��
tocommencement thereof, the plan envisages UBS Americas
Holding LLC down-streaming financial resources to subsidiaries to
facilitate orderly wind-down or disposal of businesses.
Following the cross-border merger of UBS Limited into
UBS Europe SE, the enlarged European operating subsidiary has
developed resolution plans based on Single Resolution Board
requirements. Given the relatively small size of UBS Europe SE
compared with the overall Group, emphasis is placed on the
recovery plan and the resolution strategy for the UBS Group to
provide the tools necessary to recapitalize and restructure the
entity in case of material financial distress.
Other local recovery and resolution plans exist for various
Group entities and jurisdictions.
59
Regulatory and legal developments
Developments regarding Sanctions and Export Controls
As a result of the Russian invasion of Ukraine on 24 February
2022, Switzerland, the US, the EU, the UK and others have
announced unprecedented levels of sanctions and other measures
against Russia and certain Russian entities and nationals. UBS’s
policy is to comply with all applicable laws, including sanctions
and export controls, in the jurisdictions in which it operates. At
present, numerous complex regimes are developing rapidly in
response to the escalating conflict and UBS is working carefully
and assiduously to comply with all relevant requirements and to
address their potential consequences.
Developments regarding the too-big-to-fail regulation
In March 2021, the Swiss Financial Market Supervisory Authority
(FINMA) published its annual assessment of the recovery and
resolution plans of systemically important financial institutions in
Switzerland. The report shows that FINMA approved UBS’s group
recovery plan and assessed its Swiss Emergency Plan as effective.
It also highlighted that UBS made further progress in improving
its global resolvability by building up the necessary capabilities and
removing obstacles to the implementation of the resolution
strategy, while pointing out areas for further improvement.
In June 2021, the Swiss Federal Council issued the results of its
bi-annual review of the Swiss too-big-to-fail regulatory
framework. The Swiss Federal Council concluded that no
fundamental changes to the framework are needed. Potential
areas for adjustment identified include further tightening of the
liquidity requirements for systemically important banks and the
alignment of incentive systems to support a bank’s resolvability.
In September 2021, the Swiss Federal Department of Finance
launched a consultation on proposed revisions to the Swiss
Liquidity Ordinance, with the aim of strengthening the resilience
of systemically important banks in Switzerland. As proposed, the
revisions would increase the regulatory minimum liquidity
requirements for systemically important banks, including UBS. The
final rule is expected to be published later this year.
Reactivation of the Swiss countercyclical buffer
In January 2022, the Swiss Federal Council decided, at the request
of the SNB, to reactivate the countercyclical capital buffer, at a
maximum level of 2.5% on risk-weighted positions that are
directly or indirectly backed by residential properties in
Switzerland. This is expected to increase our common equity tier
1 (CET1) minimum capital requirement by approximately 30 basis
points. The reactivated countercyclical capital buffer will become
effective on 30 September 2022.
International developments regarding capital regulation
In March 2021, US banking regulators, including the Federal
Reserve Board (the FRB), the OCC and the Federal Deposit
Insurance Corporation (the FDIC) decided not to extend the
temporary exclusion of central bank deposits and US Treasury
securities from the leverage exposure calculation for the
supplementary leverage ratio beyond March 2021. The temporary
exemption was applicable to UBS Americas Holding LLC (UBSAH)
with respect to US regulatory capital requirements. In addition,
the Federal Reserve announced that the limits on capital
distributions imposed during the COVID-19 pandemic would be
removed after 30 June 2021. As a result, capital distributions by
UBSAH will generally be permitted for as long as it meets
regulatory capital requirements, including the incremental stress
capital buffer set by the FRB as part of its Comprehensive Capital
Analysis and Review stress test (CCAR). Following the completion
of the annual Dodd–Frank Act Stress Tests (DFAST) and CCAR,
UBSAH was assigned a stress capital buffer (an SCB) of 7.1%
(previously 6.7%) under the SCB rule as of 1 October 2021.
In July 2021, the European Central Bank announced its
decision
to remove COVID
-
19
-
related restrictions on capital
distributions and share buybacks by banks with effect from
1 October 2021.
In October 2021, the European Commission (the EC) published
a legislative proposal to amend the EU’s prudential rules for banks
to implement the remaining elements of Basel III and revised rules
on resolution. Once finalized, the EC envisages that these
requirements are likely to take effect beginning in 2025 and UBS
Europe SE will be subject to these final provisions.
In addition, the proposal, which may be adjusted in the political
process and is expected to be finalized by the end of 2023,
includes a requirement that certain banking and investment
services must be provided through a branch in the EU. UBS Group
entities currently provide such services in the EU on a cross-border
basis. UBS will assess the final requirements to determine whether
changes are required ahead of the new framework entering into
force.
Swiss stamp duty and withholding tax
In June 2021, the Swiss Parliament approved an extension of the
current withholding tax exemption for total loss-absorbing
capacity instruments, including additional tier 1, from 2021 until
the end of 2026.
In December 2021, the Swiss Parliament also adopted a
legislation that will abolish the withholding tax on bond interest
payments (for bonds issued from the beginning of 2023 onward)
and will eliminate the securities transfer stamp tax on domestic
bonds. However, the withholding tax on interest paid on bank
deposits of natural persons with tax domicile in Switzerland is
maintained. The reform intends to strengthen the debt capital
market in Switzerland, and is expected to take effect in 2023,
subject to an optional referendum.
Our strategy, business model and environment | Regulatory and legal developments
60
OECD corporate tax reform
In October 2021, the G20 endorsed the final political agreement
on the two-pillar solution reached by the OECD / G20 Inclusive
Framework on Base Erosion and Profit Shifting (BEPS). The two-
pillar solution consists of Pillar 1, which provides taxing rights to
the market jurisdiction from where the profits are derived, and
Pillar 2, which introduces a minimum corporate tax rate of 15%.
The G20 called for all the rules to enter into force at a global level
by 2024, with some to be implemented in 2023. At the time of
publication in October 2021, 137 of the 141 members of the
Framework had agreed to the reform and planned to incorporate
the new rules into their respective national legislation, including
Switzerland. As financial services are expected to be out of scope
of Pillar 1, UBS will primarily be affected by Pillar 2. The impact of
the reform on UBS will depend on implementation by the
adhering countries of the reform.
In January 2022, the Swiss Federal Council presented the key
aspects of the implementation in Switzerland. The relevant
changes will require a constitutional amendment, which triggers
a mandatory referendum. The government aims to implement the
minimum tax rate as of 1 January 2024.
Revision of the Swiss Anti-Money-Laundering Act
In March 2021, the Swiss Parliament granted final approval for
the revision of the Swiss Anti-Money-Laundering (AML) Act,
which incorporates several but not all, of the recommendations
from the enhanced follow-up process of the Financial Action Task
Force on Money Laundering (the FATF). The revision will introduce
into Swiss law further specifications of the obligation to file
suspicious activity reports and increase the frequency of client
data reviews. It will also improve transparency by incorporating
additional legal requirements for associations with elevated risks
of terrorist financing. However, the FATF’s recommendation to
extend the scope of the Swiss AML Act to advisors (e.g., attorneys,
fiduciaries, and tax advisors) was not adopted by the Swiss
Parliament.
On 1 October 2021, the Federal Council issued a draft revision
of the Anti-Money-Laundering Ordinance (AMLO) to detail the
implementation of the changes. The consultation on the AMLO
ended on 17 January 2022, and the revisions are expected to
enter into force by mid-2022. UBS is in the process of adjusting
its AML processes to reflect the new requirements.
Developments regarding environmental, social and
governance matters
2021 saw a significant number of sustainability-related policy
developments, with a particular focus on disclosure requirements,
across various jurisdictions.
In March 2021, the EU Sustainable Finance Disclosures
Regulation (the SFDR) came into effect. The regulation defines
standards regarding, among other matters, how investors should
be informed about sustainability risks and how the impact of
investments on the environment and society should be disclosed.
This regulation concerns any prospectus of UBS’s EU-domiciled
and EU-marketed funds.
In April 2021, the EC published a legislative proposal for a
revised Non-Financial Reporting Directive (NFRD) requiring firms
to publish enhanced information about their activities with regard
to environmental, social and governance (ESG)-related matters.
In July 2021, the EC adopted regulations prescribing the
content, methodology and presentation of climate-related
disclosures that are required under Art. 8 of the EU Taxonomy
Regulation. As part of their non-financial reporting, credit
institutions will be required to disclose a green asset ratio covering
the banking book and certain trading portfolios, as well as other
key performance indicators (KPIs), including the proportion of
green taxonomy-aligned off-balance sheet exposures and fees
and commission income. Starting with the annual reporting for
2021, taxonomy-eligible assets are required to be disclosed; the
remaining set of KPIs is to be fully phased in for our annual
reporting for 2025. These disclosure requirements will apply to
UBS AG and UBS Europe SE.
In August 2021, the Swiss Federal Council decided to introduce
mandatory reporting requirements for large Swiss companies
based on the recommendations of the Financial Stability Board
(the FSB) Task Force on Climate-related Financial Disclosures (the
TCFD). A consultation on the draft proposal is planned in mid-
2022, with mandatory requirements expected to apply to the
2023 annual reporting. Our disclosures are already largely aligned
with the 2017 TCFD recommendations and we expect to fully
implement those by the end of 2022.
In November 2021, the Swiss Federal Council published several
recommendations to increase transparency regarding climate-
related information and reporting in the Swiss financial center,
including that: i) financial market participants use comparable and
meaningful climate compatibility indicators to create transparency
for all financial products and client portfolios; and ii) the financial
sector joins international net-zero alliances. UBS has joined the
Glasgow Financial Alliance for Net Zero (GFANZ) and is
participating in an industry-wide working group led by the Swiss
Federal Department of Finance (the FDF) to develop climate
compatibility indicators. The Swiss Federal Council has also
instructed the FDF to work with the Department of the
Environment, Transport, Energy and Communications (DETEC)
and FINMA to jointly assess, by the end of 2022, whether any
changes to financial market rules may help avoid greenwashing,
and, if necessary, to propose binding guidelines.
In November 2021, FINMA issued guidance on preventing and
combating greenwashing in the context of sustainability-related
collective investment schemes. The guidance sets out FINMA’s
expectations regarding: the advertised sustainability
characteristics in fund documents of respective Swiss collective
investment schemes; appropriate organizational structures of
institutions that manage sustainability-related Swiss or foreign
collective investment schemes; and the integration of ESG
considerations into the process of advising clients.
In November 2021, the Swiss Environmental Commission of
the Council of States agreed to start work on an indirect
counterproposal to the “Glacier Initiative.” Both the original
initiative and the counterproposal aim to embed in national law a
net-zero target to be achieved by 2050. The Environmental
Commission of the National Council will formulate a draft in early
2022, but the public vote will not take place before 2023.
In November 2021, the Basel Committee on Banking
Supervision (the BCBS) issued a consultation on Principles for the
effective management and supervision of climate-related financial
risks. The consultation paper proposes 18 principles to improve
climate-related financial risk management by banks and
supervisors. The proposal states that banks should incorporate
climate risks into their capital and liquidity adequacy assessments.
61
In November 2021, the International Financial Reporting
Standards (IFRS) Foundation Trustees announced the creation of a
new standard-setting board, the International Sustainability
Standards Board (ISSB), which will be tasked with developing a
comprehensive global baseline for sustainability-related disclosure
standards that will provide investors and other capital market
participants with information about companies’ sustainability-
related risks and opportunities in order to help them make
informed decisions.
In December 2021, the Swiss Federal Council opened the
consultation on the revised CO
2
public vote earlier in 2021. The new proposal contains measures
to reduce carbon emissions for the period from 2025 to 2030 and
mandates FINMA and the Swiss National Bank to report on
climate-related financial risks.
In December 2021, the Federal Council specified new due
diligence requirements to implement the counterproposal to the
Responsible Business Initiative. The changes to the Code of
Obligations require large Swiss companies to report on risks of
their business activities in the areas of the environment, social
issues, employee concerns, human rights, and the fight against
corruption, as well as on the measures taken to mitigate these
risks. Companies active in sensitive areas with a risk of child labor
and conflict minerals must comply with additional due diligence
and reporting obligations. The details of these requirements are
outlined in a separate ordinance. The new provisions entered into
force on 1 January 2022. The law grants companies one year to
adapt to the new obligations. These will therefore be applied for
the first time in the 2023 financial year.
In December 2021, the US Office of the Comptroller of the
Currency (the OCC) issued a consultation on supervisory guidance
regarding firms’ climate risk management practices. While the
proposal broadly aligns with that issued by the BCBS in November,
it also represents the first step of US banking regulators regarding
expectations of supervised firms in their capacity to measure and
control exposures to potential climate change issues.
Starting with our 2021 annual reporting, we comply with the
revised FINMA Circular 2016/1 “Disclosure
–
banks,” which
includes climate risk-related disclosure requirements. We provide
information required by Art. 8 of the EU Taxonomy Regulation,
starting with the disclosure of taxonomy-eligible assets of UBS AG
and UBS Europe SE on a standalone basis for year-end 2021.
Developments regarding digitalization and innovation in
finance
Regulatory discussions on various aspects of digital innovation in
finance and, in particular, virtual assets have increased and
continued to evolve. However, national regulatory approaches on
the subject still differ widely.
In June 2021, the BCBS consulted on an approach to the
prudential treatment of virtual assets as part of a multi-year
process to develop internationally aligned prudential rules.
In October 2021, the Committee on Payments and Market
Infrastructures and the International Organization of Securities
Commissions (IOSCO) consulted on guidance proposing that the
Principles for Financial Market Infrastructures should also apply to
systemically important stablecoin arrangements.
In October 2021, the FATF updated its 2019 Guidance for a
risk-based approach to virtual assets and virtual asset service
providers (VASPs), who are subject to the same relevant FATF
measures that apply to financial institutions. The guidance aims
to help countries and VASPs understand their obligations
regarding anti-money laundering and terrorist financing and
effectively implement the FATF’s requirements.
In November 2021, EU legislators made further progress
toward agreement on the Markets in Crypto-Assets Regulation,
which aims to establish a comprehensive EU-wide regulatory
framework for the issuance of, and provision of services related
to, various types of virtual assets. The legislation is expected to be
finalized by mid-2022.
In November 2021, the US President’s Working Group on
Financial Markets released a paper on stablecoins recommending
that US Congress enact legislation to restrict issuers of stablecoins
to supervised, deposit-taking banks. In the absence of legislation,
the US Financial Stability Oversight Council could designate the
activity as systemically important and place them under the
authority of the Federal Reserve.
In 2021, several central banks continued their efforts to actively
explore central bank digital currencies (CBDC), including with
each other, with the BIS Innovation Hub network and with
commercial banks. For example, UBS participated in SNB- and
Swiss Infrastructure and Exchange (SIX)-led CBDC projects named
Helvetia and Jura. The introduction of CBDC could potentially
have a significant impact on the financial sector, though the
implications are not yet fully understood. In January 2022, the
Federal Reserve released its discussion paper on CBDC, seeking
public input on the advantages and disadvantages of these
products and the preservation of monetary and financial stability
while complementing existing means of payment.
In February 2022, the Swiss Federal Council published its report
on framework conditions for digital finance in Switzerland, which
includes measures linked to 12 prioritized action areas. The
Federal Department of Finance will implement the measures in
2022 and subsequent years in close coordination with relevant
stakeholders, including the private sector. Among the policy topics
addressed are open finance, artificial intelligence, distributed
ledger technology, cybersecurity, green fintech, the Cloud, data
sharing and cross-border data flows.
Operational resilience and cybersecurity
In 2021, there were several regulatory developments on
operational resilience and cybersecurity.
In March 2021, the BCBS published its Principles for
Operational Resilience (the BCBS Principles), providing global
standards intended to strengthen the ability of banks to absorb
operational risk-related events that could cause significant
operational failures or widescale disruption in financial markets.
In March 2021, the Prudential Regulation Authority (the PRA)
and the Financial Conduct Authority (the FCA) published their
final rules on the UK operational resilience framework. The new
rules require firms to identify their important business services, set
impact tolerances for such and commence testing against severe
but plausible scenarios by 31 March 2022. Firms are expected to
introduce any required resilience reinforcements by 31 March
2025. The rules in the UK will apply to UBS AG London Branch
and other Group entities that provide services to UBS AG London
Branch.
Our strategy, business model and environment | Regulatory and legal developments
62
In the fourth quarter of 2021, both the Monetary Authority of
Singapore and the Hong Kong Monetary Authority issued
consultations on proposed rules to incorporate the BCBS
Principles for Operational Resilience into their regulatory and
supervisory frameworks. Rules in the UK, Singapore and Hong
Kong SAR are broadly aligned to the BCBS Principles.
UBS established a global Enhanced Operational Resilience
program in August 2020 with the aim of ensuring implementation
and alignment with key regulatory requirements on operational
resilience.
In November 2021, the US banking regulators, including the
FRB, the OCC and
the FDIC published final rules regarding
computer security incident reporting requirements, including
thresholds and timing, that apply to supervised banks and service
providers and become effective in April 2022.
In January 2022, the Swiss Federal Council initiated a
consultation on a proposal to introduce a reporting obligation for
cyberattacks on critical infrastructures, including banks. The
proposal defines the tasks of the National Cybersecurity Centre,
the designated central recipient of the reports. The consultation
will last until 14 April 2022. Once finalized, UBS will need to
adjust its reporting processes accordingly.
Developments regarding the relationship between
Switzerland and the European Union
In May 2021, the Swiss Federal Council terminated negotiations
on the Institutional Framework Agreement (the IFA) between
Switzerland and the European Union (the EU) due to substantial
differences of opinion regarding key aspects of the agreement.
The IFA would have formed a mutually agreed basis to consolidate
and further develop Switzerland’s bilateral market access
approach with the EU. As a result, the EU is unlikely to be ready
to conclude new market access agreements
–
including on
financial services – with Switzerland in the near future.
In November 2021, the Swiss Federal Council decided to
extend the existing measure protecting the Swiss stock exchange
infrastructure (which was due to expire on 31 December 2021)
until 31 December 2025 and to open a consultation on
incorporating this measure into the Financial Market
Infrastructure Act. In the absence of mutual recognition of
equivalence by both Swiss and EU authorities, the measure
requires EU investment firms to trade Swiss equities on Swiss stock
exchanges. UBS had previously adjusted its internal processes to
reflect this measure.
Revision of the Swiss Banking Act
In December 2021, the Swiss Parliament adopted a revision of the
Banking Act. The legislative amendment aims to strengthen
depositor protection and promote financial system stability by
reducing the time needed to pay out protected deposits through
the depositor protection scheme in the event a bank enters
bankruptcy. Among other measures, it will also require banks to
deposit 50% of the contribution obligations in securities or Swiss
francs. The revision also introduces amendments with regard to
insolvency law and segregation, in particular the introduction of
a more detailed and solid legal basis for bail-in, including the
ranking of claims subject to bail in, ensuring legal certainty for the
operationalization of a bail-in. The new provisions also provide for
the subordination of bail-in-bonds, with the exception of such
bail-in-bonds issued by a holding company if other debt ranking
pari passu does not exceed 5% of the total bail-in-bond debt. The
revised Banking Act will enter into force at the beginning of 2023.
We expect moderate costs for all Switzerland-based UBS Group
entities that are within the scope of the revision.
Review of restrictions on the business model of
PostFinance AG
In January 2021, the Swiss Federal Council announced that it
intends to privatize PostFinance AG, a Swiss systemically
important bank, which is held by the state-owned Swiss Post AG.
As a result, the prohibition on PostFinance AG granting
mortgages and other types of loans would be lifted, among other
changes. As the envisaged changes require a revision of the Post
Organization Act, the Swiss Parliament will ultimately decide on
any changes.
In June 2021, the Swiss Federal Council submitted a dispatch
to the Swiss Parliament. If the revision passes the legislative
process, which is expected to start in 2022, the reform could
further intensify competition in the Swiss mortgage market.
Registration under the US security-based swaps
regulations
In October 2021, FINMA and the US Securities and Exchange
Commission (the SEC) finalized a memorandum of understanding
relating to cooperation in oversight of Swiss entities registered
under the SEC’s security-based swaps regulations. The SEC also
published
a substituted compliance order modifying the
application of certain of its regulations for Swiss security-based
swap dealers. Under SEC regulations, UBS AG has been registered
as a security-based swap dealer since 1 November 2021.
Developments regarding LIBOR
In March 2021, the FCA confirmed that the one-week and two-
month US dollar London Interbank Offered Rate (USD LIBOR)
settings, along with all GBP, EUR, CHF, and JPY LIBOR settings,
would, immediately after 31 December 2021, either cease to be
provided by any administrator or no longer be representative of
the underlying market. The FCA further confirmed that the
remaining USD LIBOR settings will cease immediately after
30 June 2023.
In October 2021, the FRB issued guidance that banks should,
with limited exceptions, cease to enter into new contracts
referencing USD LIBOR as soon as practicable and, in any event,
no later than 31 December 2021.
63
Risk factors
Certain risks, including those described below, may affect our
ability to execute our strategy or our business activities, financial
condition, results of operations and prospects. We are inherently
exposed to multiple risks, many of which may become apparent
only with the benefit of hindsight. As a result, risks that we do
not consider to be material, or of which we are not currently
aware, could also adversely affect us. Within each category, the
risks that we consider to be most material are presented first.
Market, credit and macroeconomic risks
Performance in the financial services industry is affected by
market conditions and the macroeconomic climate
Our businesses are materially affected by market and
macroeconomic conditions. A market downturn and weak
macroeconomic conditions can be precipitated by a number of
factors, including geopolitical events, such as international armed
conflicts, the imposition of sanctions, global trade or global supply
chain disruptions, changes in monetary or fiscal policy, changes in
trade policies or
international trade disputes, significant
inflationary or deflationary price changes, disruptions in one or
more concentrated economic sectors, natural disasters,
pandemics, civil unrest, acts of violence, war or terrorism. Such
developments can have unpredictable and destabilizing effects.
For example, as a result of the Russian invasion of Ukraine on
24 February 2022 and the ongoing hostilities, Switzerland, the
US, the EU, the UK and others have announced sanctions against
certain Russian banks, companies and individuals, as well as the
Russian Central Bank, and have announced that certain Russian
banks will be barred from using the Society for Worldwide
Interbank Financial Telecommunication (SWIFT) messaging
system. In addition, it is estimated that one million people have
been displaced inside Ukraine and many of those displaced may
seek refuge in Poland and other neighboring countries, as the
conflict continues these numbers are likely to increase. The scale
of the conflict and the unprecedented speed and extent of
sanctions may produce many of the effects described above,
including in ways that cannot now be anticipated.
Adverse changes in interest rates, credit spreads, securities
prices, market volatility and liquidity, foreign exchange rates,
commodity prices, and other market fluctuations, as well as
changes in investor sentiment, can affect our earnings and
ultimately our financial and capital positions. As financial markets
are global and highly interconnected, local and regional events
can have widespread effects well beyond the countries in which
they occur. Any of these developments may adversely affect our
business or financial results.
If individual countries impose restrictions on cross-border
payments, trade, or other exchange or capital controls, or change
their currency (for example, if one or more countries should leave
the Eurozone or as result of the imposition of sanctions on
individuals, entities or countries), we could suffer losses from
enforced default by counterparties, be unable to access our own
assets, or be unable to effectively manage our risks.
Should the market experience significant volatility, a decrease
in business and client activity and market volumes could result,
which would adversely affect our ability to generate transaction
fees, commissions and margins, particularly in Global Wealth
Management and the Investment Bank, as we experienced in the
fourth quarter of 2018. A market downturn would likely reduce
the volume and valuation of assets that we manage on behalf of
clients, which would reduce recurring fee income that is charged
based on invested assets in Global Wealth Management and Asset
Management and performance-based fees in Asset Management.
Such a downturn could also cause a decline in the value of assets
that we own and account for as investments or trading positions.
In addition, reduced market liquidity or volatility may limit trading
opportunities and may therefore reduce transaction-based
income and may also impede our ability to manage risks.
We could be materially affected if a crisis develops, regionally
or globally, as a result of disruptions in markets due to
macroeconomic or political developments, or as a result of the
failure of a major market participant. Over time, our strategic
plans have become more heavily dependent on our ability to
generate growth and revenue in emerging markets, including
China, causing us to be more exposed to the risks associated with
such markets.
Global Wealth Management derives revenues from all the
principal regions, but has a greater concentration in Asia than
many peers and a substantial presence in the US, unlike many
European peers. The Investment Bank’s business is more heavily
weighted to Europe and Asia than our peers, while its derivatives
business is more heavily weighted to structured products for
wealth management clients, in particular with European and
Asian underlyings. Our performance may therefore be more
affected by political, economic and market developments in these
regions and businesses than some other financial service
providers.
Our strategy, business model and environment | Risk factors
64
Our results of operations and financial condition may be
adversely affected by the COVID-19 pandemic and the response
to it
The COVID-19 pandemic and the governmental measures taken
to manage it, as well as labor market displacements, supply chain
disruptions, and inflationary pressures, may continue to adversely
affect global and regional economic conditions, resulting in
contraction in the global economy, substantial volatility in the
financial markets, crises in markets for goods and services, as well
as significant disruptions in certain regional real estate markets,
increased unemployment, increased credit and counterparty risk,
and operational challenges. Governments and central banks
around the world reacted to the economic crisis caused by the
pandemic by implementing stimulus and liquidity programs and
cutting interest rates and have begun to phase out pandemic
relief. In addition, while vaccination campaigns have had
significant success in some regions and a number of economies
are recovering, outbreaks in locations where vaccination rates are
low or vaccines are unavailable on a large scale, as well as the
spread of new variants of COVID-19, create uncertainty around a
sustainable recovery. Resurgence of the pandemic, ineffectiveness
of vaccines and continuance or imposition of new pandemic
control measures may result in additional adverse effects on the
global economy negatively affecting UBS’s results of operations
and financial condition.
The COVID-19 pandemic affected all of UBS’s businesses, and
these effects could be greater in the future if adverse conditions
persist or worsen. These effects included declines in some asset
prices, spikes in volatility, inflationary pressures, supply chain
disruptions, lower or negative interest rates, widening of credit
spreads and credit deterioration. These effects have resulted in
decreases in the valuation of loans and commitments, an increase
in the allowance for credit losses and lower valuations of certain
classes of trading assets. While many of these effects have
reversed as economies have reopened and economic stimulus has
been maintained, or were offset by high levels of client activity
and by improved asset prices in many sectors in 2021, these
favorable conditions may not persist. In particular, real estate
markets in some regions may be significantly disrupted as a result
of repeated temporary closures of business, sheltering-in-place
directives, and remote work protocols enacted to respond to
seasonal increases in infection rates of COVID-19.
Should inflationary pressures or other adverse global market
conditions persist, or should the pandemic lead to additional
economic or market disruptions, we may experience reduced
client activity and demand for our products and services, increased
utilization of lending commitments, significantly increased client
defaults, continued and increasing credit and valuation losses in
our loan portfolios, loan commitments and other assets, and
impairments of other financial assets.
A fall in equity markets and consequent decline in invested
assets would also reduce recurring fee income in our Global
Wealth Management and Asset Management businesses. These
factors and other consequences of the COVID-19 pandemic may
negatively affect our financial condition, including possible
constraints on capital and liquidity, as well as a higher cost of
capital, and possible downgrades to our credit ratings.
The extent to which the pandemic, and the related adverse
economic conditions, affect our businesses, results of operations
and financial condition, as well as our regulatory capital and
liquidity ratios, will depend on future developments, including the
scope and duration of the pandemic and any recovery period, the
adequacy of vaccine distribution plans and execution of those
plans, as well as the efficacy of vaccines against potential virus
variants, future actions taken by governmental authorities, central
banks and other third parties in response to the pandemic, and
the effects on our customers, counterparties, employees and
third-party service providers.
Our credit risk exposure to clients, trading counterparties and
other financial institutions would increase under adverse or other
economic conditions
Credit risk is an integral part of many of our activities, including
lending, underwriting and derivatives activities. Adverse economic
or market conditions, or the imposition of sanctions or other
restrictions on clients, counterparties or financial institutions, may
lead to impairments and defaults on these credit exposures.
Losses may be exacerbated by declines in the value of collateral
securing loans and other exposures. In our prime brokerage,
securities finance and Lombard lending businesses, we extend
substantial amounts of credit against securities collateral, the
value or liquidity of which may decli ne rapidly. Market closures
the imposition of exchange controls, sanctions or other measures
may limit our ability to settle existing transactions or to realize on
collateral, which may result in unexpected increases in exposures.
Our Swiss mortgage and corporate lending portfolios are a large
part of our overall lending. We are therefore exposed to the risk
of adverse economic developments in Switzerland, including
property valuations in the housing market, the strength of the
Swiss franc and its effect on Swiss exports, prevailing negative
interest rates applied by the Swiss National Bank, economic
conditions within the Eurozone or the EU, and the evolution of
agreements between Switzerland and the EU or European
Economic Area, which represent Switzerland’s largest export
market. We have exposures related to real estate in various
countries, including a substantial Swiss mortgage portfolio.
Although we believe this portfolio is prudently managed, we
could nevertheless be exposed to losses if a substantial
deterioration in the Swiss real estate market were to occur.
As we experienced in 2020, under the IFRS 9 expected credit
loss (ECL) regime, credit loss expenses may increase rapidly at the
onset of an economic downturn as a result of higher levels of
credit impairments (stage 3), as well as higher ECL from stages 1
and 2. Substantial increases in ECL could exceed expected loss for
regulatory capital purposes and adversely affect our common
equity tier 1 (CET1) capital and regulatory capital ratios.
Interest rate trends and changes could negatively affect our
financial results
The low or negative interest rate environment, particularly in
Switzerland and the Eurozone, may further erode interest margins
and adversely affect the net interest income generated by the
Personal & Corporate Banking and Global Wealth Management
businesses. The Swiss National Bank permits Swiss banks to make
deposits up to a threshold at zero interest. Any reduction in or
limitation on the use of this exemption from the otherwise
applicable negative interest rates would exacerbate the effect of
negative interest rates in Switzerland on our business.
65
Low and negative interest rates may also affect customer
behavior and hence our overall balance sheet structure. Mitigating
actions that we have taken, or may take in the future, such as the
introduction of selective deposit fees or minimum lending rates,
have resulted and may further result in the loss of customer
deposits (a key source of funding for us), net new money outflows
and a declining market share in our Swiss lending business.
Interest rates in the US and some other markets are expected to
increase as central banks respond to higher inflation. As returns
for alternatives to deposits, such as money market funds, increase
with interest rates, we may experience outflows of customer
deposits or a higher cost of deposit funding if customers shift
from deposits to alternative products.
Our shareholders’ equity and capital are also affected by
changes in interest rates. In particular, the calculation of our Swiss
pension plan’s net defined benefit assets and liabilities is sensitive
to the applied discount rate and to fluctuations in the value of
pension plan assets. Any further reduction in interest rates may
lower the discount rates and result in pension plan deficits as a
result of the long duration of corresponding liabilities. This could
lead to a corresponding reduction in our equity and CET1 capital.
Currency
fluctuation may have an adverse effect on our profits,
balance sheet and regulatory capital
We are subject to currency fluctuation risks. Although our change
from the Swiss franc to the US dollar as our functional and
presentation currency in 2018 reduces our exposure to currency
fluctuation risks with respect to the Swiss franc, a substantial
portion of our assets and liabilities are denominated in currencies
other than the US dollar. Additionally, in order to hedge our CET1
capital ratio, our CET1 capital must have foreign currency
exposure, which leads to currency sensitivity. As a consequence,
it is not possible to simultaneously fully hedge both the amount
of capital and the capital ratio. Accordingly, changes in foreign
exchange rates may adversely affect our profits, balance sheet and
capital, leverage and liquidity coverage ratios.
Regulatory and legal risks
Material legal and regulatory risks arise in the conduct of our
business
As a global financial services firm operating in more than 50
countries, we are subject to many different legal, tax and regulatory
regimes, including extensive regulatory oversight, and are exposed
to significant liability risk. We are subject to a large number of
claims, disputes, legal proceedings and government investigations,
and we expect that our ongoing business activities will continue to
give rise to such matters in the future. The extent of our financial
exposure to these and other matters is material and could
substantially exceed the level of provisions that we have established.
We are not able to predict the financial and non-financial
consequences these matters may have when resolved.
We may be subject to adverse preliminary determinations or
court decisions that may negatively affect public perception and our
reputation, result in prudential actions from regulators, and cause
us to record additional provisions for such matters even when we
believe we have substantial defenses and expect to ultimately
achieve a more favorable outcome. This risk is illustrated by the
award of aggregate penalties and damages of EUR 4.5 billion by
the court of first instance in France. This award was reduced to an
aggregate of EUR 1.8 billion by the Court of Appeal, and UBS has
further appealed this judgment.
Resolution of regulatory proceedings may require us to obtain
waivers of regulatory disqualifications to maintain certain
operations; may entitle regulatory authorities to limit, suspend or
terminate licenses and regulatory authorizations; and may permit
financial market utilities to limit, suspend or terminate our
participation in them. Failure to obtain such waivers, or any
limitation, suspension or termination of licenses, authorizations or
participations, could have material adverse consequences for us.
Our settlements with governmental authorities in connection
with foreign exchange, London Interbank Offered Rates (LIBOR)
and other benchmark interest rates starkly illustrate the
significantly increased level of financial and reputational risk now
associated with regulatory matters in major jurisdictions. In
connection with investigations related to LIBOR and other
benchmark rates and to foreign exchange and precious metals,
very large fines and disgorgement amounts were assessed against
us, and we were required to enter guilty pleas despite our full
cooperation with the authorities in the investigations, and despite
our receipt of conditional leniency or conditional immunity from
anti-trust authorities in a number of jurisdictions, including the US
and Switzerland.
For a number of years we have been, and we continue to be,
subject to a very high level of regulatory scrutiny and to certain
regulatory measures that constrain our strategic flexibility. We
believe we have remediated the deficiencies that led to significant
losses in the past and made substantial changes in our controls
and conduct risk frameworks to address the issues highlighted by
the LIBOR-related, foreign exchange and precious metals
regulatory resolutions. We have also undertaken extensive efforts
to implement new regulatory requirements and meet heightened
expectations.
We continue to be in active dialog with regulators concerning
the actions we are taking to improve our operational risk
management,
risk control, anti
-
money laundering, data
management and other frameworks, and otherwise seek to meet
supervisory expectations, but there can be no assurance that our
efforts will have the desired effects. As a result of this history, our
level of risk with respect to regulatory enforcement may be
greater than that of some of our peers.
Substantial changes in regulation may adversely affect our
businesses and our ability to execute our strategic plans
Since the financial crisis of 2008, we are subject to significant
regulatory requirements, including recovery and resolution
planning, changes in capital and prudential standards, changes in
taxation regimes as a result of changes in governmental
administrations, as well as new and revised market standards and
fiduciary duties. Notwithstanding attempts by regulators to align
their efforts, the measures adopted or proposed for banking
regulation differ significantly across the major jurisdictions,
making it increasingly difficult to manage a global institution. In
addition, Swiss regulatory changes with regard to such matters as
capital and liquidity have often proceeded more quickly than
those in other major jurisdictions, and Switzerland’s requirements
for major international banks are among the strictest of the major
financial centers. This could put Swiss banks, such as UBS, at a
disadvantage when competing with peer financial institutions
subject to more lenient regulation or with unregulated non-bank
competitors.
Our strategy, business model and environment | Risk factors
66
Our implementation of additional regulatory requirements and
changes in supervisory standards, as well as our compliance with
existing laws and regulations, continue to receive heightened
scrutiny from supervisors. If we do not meet supervisory
expectations in relation to these or other matters, or if additional
supervisory or regulatory issues arise, we would likely be subject
to further regulatory scrutiny as well as measures that may further
constrain our strategic flexibility.
Resolvability and resolution and recovery planning:
We have
moved significant operations into subsidiaries to improve
resolvability and meet other regulatory requirements, and this has
resulted in substantial implementation costs, increased our capital
and funding costs and reduced operational flexibility. For example,
we have transferred all of our US subsidiaries under a US
intermediate holding company to meet US regulatory
requirements, and have transferred substantially all the operations
of Personal & Corporate Banking and Global Wealth
Management booked in Switzerland to UBS Switzerland AG to
improve resolvability.
These changes create operational, capital, liquidity, funding
and tax inefficiencies. Our operations in subsidiaries are subject to
local capital, liquidity, stable funding, capital planning and stress
testing requirements. These requirements have resulted in
increased capital and liquidity requirements in affected
subsidiaries, which limit our operational flexibility and negatively
affect our ability to benefit from synergies between business units
and to distribute earnings to the Group.
Under the Swiss too-big-to-fail (TBTF) framework, we are
required to put in place viable emergency plans to preserve the
operation of systemically important functions in the event of a
failure. Moreover, under this framework and similar regulations in
the US, the UK, the EU and other jurisdictions in which we
operate, we are required to prepare credible recovery and
resolution plans detailing the measures that would be taken to
recover in a significant adverse event or in the event of winding
down the Group or the operations in a host country through
resolution or insolvency proceedings. If a recovery or resolution
plan that we produce is determined by the relevant authority to
be inadequate or not credible, relevant regulation may permit the
authority to place limitations on the scope or size of our business
in that jurisdiction, or oblige us to hold higher amounts of capital
or liquidity or to change our legal structure or business in order to
remove the relevant impediments to resolution.
Capital and prudential standards:
As an internationally active
Swiss systemically relevant bank (an SRB), we are subject to capital
and total loss-absorbing capacity (TLAC) requirements that are
among the most stringent in the world. Moreover, many of our
subsidiaries must comply with minimum capital, liquidity and
similar requirements and, as a result, UBS Group AG and UBS AG
have contributed a significant portion of their capital and provide
substantial liquidity to these subsidiaries. These funds are available
to meet funding and collateral needs in the relevant entities, but
are generally not readily available for use by the Group as a whole.
We expect our risk-weighted assets (RWA) to further increase
as the effective date for additional capital standards promulgated
by the Basel Committee on Banking Supervision (the BCBS) draws
nearer.
Increases in capital and liquidity standards could significantly
curtail our ability to pursue strategic opportunities or to return
capital to shareholders.
Market regulation and fiduciary standards:
Our wealth and
asset management businesses operate in an environment of
increasing regulatory scrutiny and changing standards with
respect to fiduciary and other standards of care and the focus on
mitigating or eliminating conflicts of interest between a manager
or advisor and the client, which require effective implementation
across the global systems and processes of investment managers
and other industry participants. For example, we have made
material changes to our business processes, policies and the terms
on which we interact with these clients in order to comply with
SEC Regulation Best Interest, which is intended to enhance and
clarify the duties of brokers and investment advisers to retail
customers, the Volcker Rule, which limits our ability to engage in
proprietary trading, as well as changes in European and Swiss
market conduct regulation. Future changes in the regulation of
our duties to customers may require us to make further changes
to our businesses, which would result in additional expense and
may adversely affect our business. We may also become subject
to other similar regulations substantively limiting the types of
activities in which we may engage or the way we conduct our
operations.
In many instances, we provide services on a cross-border basis,
and we are therefore sensitive to barriers restricting market access
for third-country firms. In particular, efforts in the EU to harmonize
the regime for third-country firms to access the European market
may have the effect of creating new barriers that adversely affect
our ability to conduct business in these jurisdictions from
Switzerland. In addition, a number of jurisdictions are increasingly
regulating cross-border activities based on determinations of
equivalence of home country regulation, substituted compliance
or similar principles of comity. A negative determination with
respect to Swiss equivalence could limit our access to the market
in those jurisdictions and may negatively influence our ability to
act as a global firm. For example, the EU declined to extend its
equivalence determination for Swiss exchanges, which lapsed as
of 30 June 2019.
UBS experienced cross-border outflows over a number of years
as a result of heightened focus by fiscal authorities on cross-
border investment and fiscal amnesty programs, in anticipation of
the implementation in Switzerland of the global automatic
exchange of tax information, and as a result of the measures UBS
has implemented in response to these changes. Further changes
in local tax laws or regulations and their enforcement, additional
cross-border tax information exchange regimes, national tax
amnesty or enforcement programs or similar actions may affect
our clients’ ability or willingness to do business with us and could
result in additional cross-border outflows.
67
If we experience financial difficulties, FINMA has the power to
open restructuring or liquidation proceedings or impose
protective measures in relation to UBS Group AG, UBS AG or
UBS Switzerland AG, and such proceedings or measures may
have a material adverse effect on our shareholders and creditors
Under the Swiss Banking Act, FINMA is able to exercise broad
statutory powers with respect to Swiss banks and Swiss parent
companies of financial groups, such as UBS Group AG, UBS AG
and UBS Switzerland AG, if there is justified concern that the
entity is over-indebted, has serious liquidity problems or, after the
expiration of any relevant deadline, no longer fulfills capital
adequacy requirements. Such powers include ordering protective
measures, instituting restructuring proceedings (and exercising
any Swiss resolution powers in connection therewith), and
instituting liquidation proceedings, all of which may have a
material adverse effect on shareholders and creditors or may
prevent UBS Group AG, UBS AG or UBS Switzerland AG from
paying dividends or making payments on debt obligations.
UBS would have limited ability to challenge any such protective
measures, and creditors and shareholders would also have limited
ability under Swiss law or in Swiss courts to reject them, seek their
suspension, or challenge their imposition, including measures that
require or result in the deferment of payments.
If restructuring proceedings are opened with respect to UBS
Group AG, UBS AG or UBS Switzerland AG, the resolution powers
that FINMA may exercise include the power to: (i) transfer all or
some of the assets, debt and other liabilities, and contracts of the
entity subject to proceedings to another entity; (ii) stay for a
maximum of two business days (a) the termination of, or the
exercise of rights to terminate, netting rights, (b) rights to enforce
or dispose of certain types of collateral or (c) rights to transfer
claims, liabilities or certain collateral, under contracts to which the
entity subject to proceedings is a party; and / or (iii) partially or
fully write down the equity capital and regulatory capital
instruments and, if such regulatory capital is fully written down,
convert debt instruments of the entity subject to proceedings into
equity. Shareholders and creditors would have no right to reject,
or to seek the suspension of, any restructuring plan pursuant to
which such resolution powers are exercised. They would have only
limited rights to challenge any decision to exercise resolution
powers or to have that decision reviewed by a judicial or
administrative process or otherwise.
Upon full or partial write-down of the equity and regulatory
capital instruments of the entity subject to restructuring
proceedings, the relevant shareholders and creditors would
receive no payment in respect of the equity and debt that is
written down, the write-down would be permanent, and the
investors would likely not, at such time or at any time thereafter,
receive any shares or other participation rights, or be entitled to
any write-up or any other compensation in the event of a
potential subsequent recovery of the debtor. If FINMA orders the
conversion of debt of the entity subject to restructuring
proceedings into equity, the securities received by the investors
may be worth significantly less than the original debt and may
have a significantly different risk profile. In addition, creditors
receiving equity would be effectively subordinated to all creditors
of the restructured entity in the event of a subsequent winding
up, liquidation or dissolution of the restructured entity, which
would increase the risk that investors would lose all or some of
their investment.
FINMA has significant discretion in the exercise of its powers in
connection with restructuring proceedings. Furthermore, certain
categories of debt obligations, such as certain types of deposits,
are subject to preferential treatment. As a result, holders of
obligations of an entity subject to a Swiss restructuring
proceeding may have their obligations written down or converted
into equity even though obligations ranking on par with such
obligations are not written down or converted.
We may be unable to fully realize our sustainability, climate,
environmental and social goals, which could damage our
business prospects, reputation and lead to increased regulatory
scrutiny and increased risk of litigation
We have set ambitious goals for environmental, social and
governance matters. These goals include our ambitions for
environmental sustainability in our operations, including carbon
emissions, in the business we do with clients and in products that
we offer. They also include goals or ambitions for diversity in our
workforce and supply chain, and support for the United Nations
Sustainable Development Goals. There is substantial uncertainty
as to the scope of actions that may be required of us,
governments and others to achieve the goals we have set, and
many of our goals and objectives are only achievable with a
combination of government and private action. National and
international standards, industry and scientific practices, and
regulatory taxonomies and disclosure obligations addressing
these matters are in a state of rapid development. Although we
have defined and disclosed our goals based on the standards that
exist today, there can be no assurance that the various ESG
regulatory and disclosure regimes under which we operate will
not come into conflict with one another or that the current
standards will not be interpreted differently than our
understanding or change in a manner that substantially increases
the cost or effort for us to achieve such goals or that such goals
may prove to be considerably more difficult or even impossible to
achieve. If we are not able to achieve the goals we have set, or
can only do so at significant expense to our business, we may fail
to meet regulatory expectations, incur damage to our reputation
or be exposed to risk of litigation or other adverse action.
Our strategy, business model and environment | Risk factors
68
Our financial results may be negatively affected by changes to
assumptions and valuations, as well as changes to accounting
standards
We prepare our consolidated financial statements in accordance
with International Financial Reporting Standards (IFRS). The
application of these accounting standards requires the use of
judgment based on estimates and assumptions that may involve
significant uncertainty at the time they are made. This is the case,
for example, with respect to the measurement of fair value of
financial instruments, the recognition of deferred tax assets, the
assessment of the impairment of goodwill, expected credit losses
and estimation of provisions for litigation, regulatory and similar
matters. Such judgments, including the underlying estimates and
assumptions, which encompass historical experience,
expectations of the future and other factors, are regularly
evaluated to determine their continuing relevance based on
current conditions. Using different assumptions could cause the
reported results to differ. Changes in assumptions, or failure to
make the changes necessary to reflect evolving market conditions,
may have a significant effect on the financial statements in the
periods when changes occur. Estimates of provisions may be
subject to a wide range of potential outcomes and significant
uncertainty. For example, the broad range of potential outcomes
in our proceeding in France increases the uncertainty associated
with assessing the appropriate provision. If the estimates and
assumptions in future periods deviate from the current outlook,
our financial results may also be negatively affected.
Changes to IFRS or interpretations thereof may cause future
reported results and financial position to differ from current
expectations, or historical results to differ from those previously
reported due to the adoption of accounting standards on a
retrospective basis. Such changes may also affect our regulatory
capital and ratios. For example, the introduction of the expected
credit loss (ECL) framework under IFRS 9 in 2018 fundamentally
changed how credit risk arising from loans, loan commitments,
guarantees and certain revocable facilities is accounted for. Under
the regime, credit loss expenses may increase rapidly at the onset
of an economic downturn as a result of higher levels of credit
impairments (stage 3), as well as higher ECL from stages 1 and 2,
only gradually diminishing once the economic outlook improves.
As we observed in 2020, this effect may be more pronounced in
a deteriorating economic environment. Substantial increases in
ECL could exceed expected loss for regulatory capital purposes
and adversely affect our CET1 capital and regulatory capital ratios.
We may be unable to maintain our capital strength
Capital strength enables us to grow our businesses and absorb
increases in regulatory and capital requirements. It reassures our
clients and stakeholders, allows us to maintain our capital return
policy and contributes to our credit ratings. Our capital ratios are
driven primarily by RWA, the leverage ratio denominator and
eligible capital, all of which may fluctuate based on a number of
factors, some of which are outside our control. Our ability to
maintain our capital ratios is subject to numerous risks, including
the financial results of our businesses, the effect of changes to
capital standards, methodologies and interpretations that may
adversely affect the calculation of our CET1 ratios, the imposition
of risk add-ons or capital buffers, and the application of additional
capital, liquidity and similar requirements to subsidiaries. The
results of our businesses may be adversely affected by events
arising from other risk factors described herein. In some cases,
such as litigation and regulatory risk and operational risk events,
losses may be sudden and large. These risks could reduce the
amount of capital available for return to shareholders and hinder
our ability to achieve our capital returns target of a progressive
cash dividend coupled with a share repurchase program.
Our eligible capital may be reduced by losses recognized within
net profit or other comprehensive income. Eligible capital may
also be reduced for other reasons, including acquisitions which
change the level of goodwill, changes in temporary differences
related to deferred tax assets included in capital, adverse currency
movements affecting the value of equity, prudential adjustments
that may be required due to the valuation uncertainty associated
with certain types of positions, changes in regulatory
interpretations on the inclusion or exclusion of items contributing
to our shareholders equity in regulatory capital, and changes in
the value of certain pension fund assets and liabilities or in the
interest rate and other assumptions used to calculate the changes
in our net defined benefit obligation recognized in other
comprehensive income.
RWA are driven by our business activities, by changes in the risk
profile of our exposures, by changes in our foreign currency
exposures and foreign exchange rates, and by regulation. For
instance, substantial market volatility, a widening of credit spreads,
adverse currency movements, increased counterparty risk,
deterioration in the economic environment or increased operational
risk could result in an increase in RWA. We have significantly
reduced our market risk and credit risk RWA in recent years.
However, increases in operational risk RWA, particularly those
arising from litigation, regulatory and similar matters, and
regulatory changes in the calculation of RWA, as well as regulatory
add-ons to RWA, have offset a substantial portion of this reduction.
Changes in the calculation of RWA, the imposition of additional
supplemental RWA charges or multipliers applied to certain
exposures and other methodology changes, as well as the
implementation of the capital standards promulgated by the Basel
Committee on Banking Supervision, which are proposed to take
effect in 2023, are expected to increase our RWA.
The leverage ratio is a balance sheet-driven measure and
therefore limits balance sheet-intensive activities, such as lending,
more than activities that are less balance sheet intensive, and it
may constrain our business even if we satisfy other risk-based
capital requirements. Our leverage ratio denominator is driven by,
among other things, the level of client activity, including deposits
and loans, foreign exchange rates, interest rates and other market
factors. Many of these factors are wholly or partly outside of our
control.
69
The effect of taxes on our financial results is significantly
influenced by tax law changes and reassessments of our
deferred tax assets
Our effective tax rate is highly sensitive to our performance, our
expectation of future profitability and any potential increases or
decreases in statutory tax rates, such as any potential increase in
the US federal corporate tax rate. Further, based on prior years’
tax losses, we have recognized deferred tax assets (DTAs)
reflecting the probable recoverable level based on future taxable
profit as informed by our business plans. If our performance is
expected to produce diminished taxable profit in future years,
particularly in the US, we may be required to write down all or a
portion of the currently recognized DTAs through the income
statement in excess of anticipated amortization. This would have
the effect of increasing our effective tax rate in the year in which
any write-downs are taken. Conversely, if we expect the
performance of entities in which we have unrecognized tax losses
to improve, particularly in the US or the UK, we could potentially
recognize additional DTAs. The effect of doing so would be to
reduce our effective tax rate in years in which additional DTAs are
recognized and to increase our effective tax rate in future years.
Our effective tax rate is also sensitive to any future reductions in
statutory tax rates, particularly in the US, which would cause the
expected future tax benefit from items such as tax loss carry-
forwards in the affected locations to diminish in value. This, in
turn, would cause a write-down of the associated DTAs. For
example, the reduction in the US federal corporate tax rate to
21% from 35% introduced by the US Tax Cuts and Jobs Act
resulted in a USD 2.9 billion net write-down in the Group’s DTAs
in the fourth quarter of 2017. Conversely, an increase in US
corporate tax rates would result in an increase in the Group’s
DTAs.
We generally revalue our DTAs in the fourth quarter of the
financial year based on a reassessment of future profitability
taking into account our updated business plans. We consider the
performance of our businesses and the accuracy of historical
forecasts, tax rates and other factors in evaluating the
recoverability of our DTAs, including the remaining tax loss carry-
forward period and our assessment of expected future taxable
profits over the life of DTAs. Estimating future profitability is
inherently subjective and is particularly sensitive to future
economic, market and other conditions, which are difficult to
predict.
Our results in past years have demonstrated that changes in
the recognition of DTAs can have a very significant effect on our
reported results. Any future change in the manner in which UBS
remeasures DTAs could affect UBS’s effective tax rate, particularly
in the year in which the change is made.
Our full-year effective tax rate could change if aggregate tax
expenses in respect of profits from branches and subsidiaries
without loss coverage differ from what is expected, or if branches
and subsidiaries generate tax losses that we cannot benefit from
through the income statement. In particular, losses at entities or
branches that cannot offset for tax purposes taxable profits in
other group entities, and which do not result in additional DTA
recognition, may increase our effective tax rate. In addition, tax
laws or the tax authorities in countries where we have undertaken
legal structure changes may cause entities to be subject to
taxation as permanent establishments or may prevent the transfer
of tax losses incurred in one legal entity to newly organized or
reorganized subsidiaries or affiliates or may impose limitations on
the utilization of tax losses that relate to businesses formerly
conducted by the transferor. Were this to occur in situations
where there were also limited planning opportunities to utilize the
tax losses in the originating entity, the DTAs associated with such
tax losses may be required to be written down through the
income statement.
Changes in tax law may materially affect our effective tax rate,
and, in some cases, may substantially affect the profitability of
certain activities. In addition, statutory and regulatory changes, as
well as changes to the way in which courts and tax authorities
interpret tax laws, including assertions that we are required to pay
taxes in a jurisdiction as a result of activities connected to that
jurisdiction constituting a permanent establishment or similar
theory, and changes in our assessment of uncertain tax positions,
could cause the amount of taxes we ultimately pay to materially
differ from the amount accrued.
Strategy, management and operation al risks
Operational risks affect our business
Our businesses depend on our ability to process a large number
of transactions, many of which are complex, across multiple and
diverse markets in different currencies, to comply with
requirements of many different legal and regulatory regimes to
which we are subject and to prevent, or promptly detect and stop,
unauthorized, fictitious or fraudulent transactions. We also rely
on access to, and on the functioning of, systems maintained by
third parties, including clearing systems, exchanges, information
processors and central counterparties. Any failure of our or third-
party systems could have an adverse effect on us. These risks may
be greater as we deploy newer technologies, such as blockchain,
or products that rely on these technologies. Our operational risk
management and control systems and processes are designed to
help ensure that the risks associated with our activities – including
those arising from process error, failed execution, misconduct,
unauthorized
trading, fraud, system failures, financial crime,
cyberattacks, breaches of information security, inadequate or
ineffective access controls and failure of security and physical
protection – are appropriately controlled. If our internal controls
fail or prove ineffective in identifying and remedying these risks,
we could suffer operational failures that might result in material
losses, such as the substantial loss we incurred from the
unauthorized trading incident announced in September 2011.
As a significant proportion of our staff have been and will
continue working from outside the offices as a consequence of
the COVID-19 pandemic, we have faced, and will continue to
face, new challenges and operational risks, including
maintenance of supervisory and surveillance controls, as well as
increased fraud and data security risks. While we have taken
measures to manage these risks, such measures have never been
tested on the scale or duration that we are currently experiencing,
and there is risk that these measures will prove not to have been
effective in the current unprecedented operating environment.
Our strategy, business model and environment | Risk factors
70
We use automation as part of our efforts to improve efficiency,
reduce the risk of error and improve our client experience. We
intend to expand the use of robotic processing, machine learning
and artificial intelligence to further these goals. Use of these tools
presents their own risks, including the need for effective design
and testing; the quality of the data used for development and
operation of machine learning and artificial intelligence tools may
adversely affect their functioning and result in errors and other
operational risks.
For financial institutions, cybersecurity risks have increased due
to the widespread use of digital technologies, cloud computing
and mobile devices to conduct financial business and transactions.
In addition, cyberattacks by hackers, terrorists, criminal
organizations, nation states and extremists have also increased in
frequency and sophistication. Current geopolitical tensions also
may lead to increased risk of cyberattack from foreign state actors.
In particular, the Russian invasion of Ukraine and the imposition
of significant sanctions on Russia by Switzerland, the US, the EU,
the UK and others may result in an increase in the risk of
cyberattacks.
We and other financial services firms have been subject to
breaches of security and to cyber- and other forms of attack, some
of which are sophisticated and targeted attacks intended to gain
access to confidential information or systems, disrupt service or
destroy data. These attacks may be attempted through the
introduction of viruses or malware, phishing and other forms of
social engineering, distributed denial of service attacks and other
means. These attempts may occur directly, or using equipment or
security passwords of our employees, third-party service providers
or other users. In addition to external attacks, we have
experienced loss of client data from failure by employees and
others to follow internal policies and procedures and from
misappropriation of our data by employees and others. We may
not be able to anticipate, detect or recognize threats to our
systems or data and our preventative measures may not be
effective to prevent an attack or a security breach. In the event of
a security breach, notwithstanding our preventative measures, we
may not immediately detect a particular breach or attack. Once a
particular attack is detected, time may be required to investigate
and assess the nature and extent of the attack. A successful
breach or circumvention of security of our systems or data could
have significant negative consequences for us, including
disruption of our operations, misappropriation of confidential
information concerning us or our customers, damage to our
systems, financial losses for us or our customers, violations of data
privacy and similar laws, litigation exposure and damage to our
reputation. We may be subject to enforcement actions as
regulatory focus on cybersecurity increases and regulators have
announced new rules, guidance and initiatives on ransomware
and other cybersecurity-related issues.
We are subject to complex and frequently changing laws and
regulations governing the protection of client and personal data,
such as the EU General Data Protection Regulation. Ensuring that
we comply with applicable laws and regulations when we collect,
use and transfer personal information requires substantial
resources and may affect the ways in which we conduct our
business. In the event that we fail to comply with applicable laws,
we may be exposed to regulatory fines and penalties and other
sanctions. We may also incur such penalties if our vendors or
other service providers or clients or counterparties fail to comply
with these laws or to maintain appropriate controls over protected
data. In addition, any loss or exposure of client or other data may
adversely
damage our reputation and adversely affect our
business.
A major focus of US and other countries’ governmental policies
relating
to financial institutions in recent years has been on
fighting money laundering and terrorist financing. We are
required to maintain effective policies, procedures and controls to
detect, prevent and report money laundering and terrorist
financing, and to verify the identity of our clients under the laws
of many of the countries in which we operate. We are also subject
to laws and regulations related to corrupt and illegal payments to
government officials by others, such as the US Foreign Corrupt
Practices Act and the UK Bribery Act. We have implemented
policies, procedures and internal controls that are designed to
comply with such laws and regulations. Notwithstanding this, US
regulators have found deficiencies in the design and operation of
anti-money laundering programs in our US operations. We have
undertaken a significant program to address these regulatory
findings with the objective of fully meeting regulatory
expectations for our programs. Failure to maintain and implement
adequate programs to combat money laundering, terrorist
financing or corruption, or any failure of our programs in these
areas, could have serious consequences both from legal
enforcement action and from damage to our reputation. Frequent
changes in sanctions imposed and increasingly complex sanctions
imposed on countries, entities and individuals, as exemplified by
the breadth and scope of the sanctions imposed in relation the
Russian invasion of Ukraine, increase our cost of monitoring and
complying with sanctions requirements and increase the risk that
we will not identify in a timely manner client activity that is subject
to a sanction.
As a result of new and changed regulatory requirements and
the changes we have made in our legal structure, the volume,
frequency and complexity of our regulatory and other reporting
has remained elevated. Regulators have also significantly
increased expectations regarding our internal reporting and data
aggregation, as well as management reporting. We have incurred
and continue to incur significant costs to implement infrastructure
to meet these requirements. Failure to meet external reporting
requirements accurately and in a timely manner or failure to meet
regulatory expectations of internal reporting, data aggregation
and management reporting could result in enforcement action or
other adverse consequences for us.
In addition, despite the contingency plans that we have in
place, our ability to conduct business may be adversely affected
by a disruption in the infrastructure that supports our businesses
and the communities in which we operate. This may include a
disruption due to natural disasters, pandemics, civil unrest, war or
terrorism and involve electrical, communications, transportation
or other services that we use or that are used by third parties with
whom we conduct business.
71
We may not be successful in the ongoing execution of our
strategic plans
We have transformed
UBS to focus on our Global Wealth
Management business and our universal bank in Switzerland,
complemented by Asset Management and a significantly smaller
and more capital-efficient Investment Bank; we have substantially
reduced the risk-weighted assets and leverage ratio denominator
usage in Group Functions; and made significant cost reductions.
Risk remains that going forward we may not succeed in executing
our strategy or achieving our performance targets, or may be
delayed in doing so. Macroeconomic conditions, geopolitical
uncertainty, changes to regulatory requirements and the
continuing costs of meeting these requirements have prompted
us to adapt our targets and ambitions in the past and we may
need to do so again in the future.
To achieve our strategic plans, we expect to continue to make
significant expenditures on technology and infrastructure to
improve client experience, improve and further enable digital
offerings and increase efficiency. We also may seek to implement
our strategy through acquisitions or strategic partnerships to
expand or improve our product offerings or target additional
client segments. Our investments in new technology and our
acquisitions and strategic partnerships may not fully achieve our
objectives or improve our ability to attract and retain customers.
In addition, we face competition in providing digitally enabled
offerings from both existing competitors and new financial service
providers in various portions of the value chain. For example,
technological advances and the growth of e-commerce have
made it possible for e-commerce firms and other companies to
offer products and services that were traditionally offered only by
banks. These advances have also allowed financial institutions and
other companies to provide digitally based financial solutions,
including electronic securities trading, payments processing and
online automated algorithmic-based investment advice at a low
cost to their customers. We may have to lower our prices, or risk
losing customers as a result. Our ability to develop and implement
competitive digitally enabled offerings and processes will be an
important factor in our ability to compete.
As part of our strategy, we seek to improve our operating
efficiency, in part by controlling our costs. We may not be able to
identify feasible cost reduction opportunities that are consistent
with our business goals and cost reductions may be realized later
or may be smaller than we anticipate. Higher temporary and
permanent regulatory costs and higher business demand than
anticipated have partly offset cost reductions and delayed the
achievement of our past cost reduction targets, and we could
continue to be challenged in the execution of our ongoing efforts
to improve operating efficiency.
Changes in our workforce as a result of outsourcing,
nearshoring, offshoring, insourcing or staff reductions or, changes
which arise from the introduction of work from home or other
flexible ways of working or agile work methodologies may
introduce new operational risks that, if not effectively addressed,
could affect our ability to achieve cost and other benefits from
such changes, or could result in operational losses.
As we implement effectiveness and efficiency programs, we
may also experience unintended consequences, such as the
unintended loss or degradation of capabilities that we need in
order to maintain our competitive position, achieve our targeted
returns or meet existing or new regulatory requirements and
expectations.
We depend on our risk management and control processes to
avoid or limit potential losses in our businesses
Controlled risk-taking is a major part of the business of a financial
services firm. Some losses from risk-taking activities are inevitable,
but to be successful over time, we must balance the risks we take
against the returns generated. Therefore, we must diligently
identify, assess, manage and control our risks, not only in normal
market conditions but also as they might develop under more
extreme, stressed conditions, when concentrations of exposures
can lead to severe losses.
We have not always been able to prevent serious losses arising
from risk management failures and extreme or sudden market
events. We recorded substantial losses on fixed-income trading
positions in the 2008 financial crisis, in the unauthorized trading
incident in 2011 and, more recently, positions resulting from the
default of a US prime brokerage client. We revise and strengthen
our risk management and control frameworks to seek to address
identified shortcomings. Nonetheless, we could suffer further
losses in the future if, for example:
–
we do not fully identify the risks in our portfolio, in particular
risk concentrations and correlated risks;
–
our assessment of the risks identified, or our response to
negative trends, proves to be untimely, inadequate, insufficient
or incorrect;
–
our risk models prove insufficient to predict the scale of
financial risks the bank faces;
–
markets move in ways that we do not expect – in terms of their
speed, direction, severity or correlation – and our ability to
manage risks in the resulting environment is, therefore,
affected;
–
third parties to whom we have credit exposure or whose
securities we hold are severely affected by events and we suffer
defaults and impairments beyond the level implied by our risk
assessment; or
–
collateral or other security provided by our counterparties and
clients proves inadequate to cover their obligations at the time
of default.
We also hold legacy risk positions, primarily in Group
Functions, that, in many cases, are illiquid and may again
deteriorate in value.
We also manage risk on behalf of our clients. The performance
of assets we hold for our clients may be adversely affected by the
same factors mentioned above. If clients suffer losses or the
performance of their assets held with us is not in line with relevant
benchmarks against which clients assess investment performance,
we may suffer reduced fee income and a decline in assets under
management, or withdrawal of mandates.
Investment positions, such as equity investments made as part
of strategic initiatives and seed investments made at the inception
of funds that we manage, may also be affected by market risk
factors. These investments are often not liquid and generally are
intended or required to be held beyond a normal trading horizon.
Deteriorations in the fair value of these positions would have a
negative effect on our earnings.
Our strategy, business model and environment | Risk factors
72
We may not be successful in implementing changes in our
wealth management businesses to meet changing market,
regulatory and other conditions
In recent years, inflows from lower-margin segments and markets
have been replacing outflows from higher-margin segments and
markets, in particular for cross-border clients. This dynamic,
combined with changes in client product preferences as a result
of which low-margin products account for a larger share of our
revenues than in the past, has put downward pressure on Global
Wealth Management’s margins.
We are exposed to possible outflows of client assets in our
asset-gathering businesses and to changes affecting the
profitability of Global Wealth Management, in particular.
Initiatives that we may implement to overcome the effects of
changes in the business environment on our profitability, balance
sheet and capital positions may not succeed in counteracting
those effects and may cause net new money outflows and
reductions in client deposits, as happened with our balance sheet
and capital optimization program in 2015. There is no assurance
that we will be successful in our efforts to offset the adverse effect
of these or similar trends and developments.
We may be unable to identify or capture revenue or competitive
opportunities, or retain and attract qualified employees
The financial services industry is characterized by intense
competition, continuous innovation, restrictive, detailed, and
sometimes fragmented regulation and ongoing consolidation. We
face competition at the level of local markets and individual
business lines, and from global financial institutions that are
comparable to us in their size and breadth, as well as competition
from new technology-based market entrants, which may not be
subject to the same level of regulation. Barriers to entry in
individual markets and pricing levels are being eroded by new
technology. We expect these trends to continue and competition
to increase. Our competitive strength and market position could
be eroded if we are unable to identify market trends and
developments, do not respond to such trends and developments
by devising and implementing adequate business strategies, do
not adequately develop or update our technology including our
digital channels and tools, or are unable to attract or retain the
qualified people needed.
The amount and structure of our employee compensation is
affected not only by our business results, but also by competitive
factors and regulatory considerations.
In response to the demands of various stakeholders, including
regulatory authorities and shareholders, and in order to better
align the interests of our staff with other stakeholders, we have
increased average deferral periods for stock awards, expanded
forfeiture provisions and, to a more limited extent, introduced
clawback provisions for certain awards linked to business
performance. We have also introduced individual caps on the
proportion of fixed to variable pay for the Group Executive Board
(GEB) members, as well as certain other employees.
Constraints on the amount or structure of employee
compensation, higher levels of deferral, performance conditions
and other circumstances triggering the forfeiture of unvested
awards may adversely affect our ability to retain and attract key
employees, particularly where we compete with companies that
are not subject to these constraints. The loss of key staff and the
inability to attract qualified replacements could seriously
compromise our ability to execute our strategy and to successfully
improve our operating and control environment, and could affect
our business performance. Swiss law requires that shareholders
approve the compensation of the Board of Directors (the BoD) and
the GEB each year. If our shareholders fail to approve the
compensation for the GEB or the BoD, this could have an adverse
effect on our ability to retain experienced directors and our senior
management.
Our reputation is critical to our success
Our reputation is critical to the success of our strategic plans,
business and prospects. Reputational damage is difficult to
reverse, and improvements tend to be slow and difficult to
measure. In the past, our reputation has been adversely affected
by our losses during the financial crisis, investigations into our
cross-border private banking services, criminal resolutions of
LIBOR-related and foreign exchange matters, as well as other
matters. We believe that reputational damage as a result of these
events was an important factor in our loss of clients and client
assets across our asset-gathering businesses. New events that
cause reputational damage could have a material adverse effect
on our results of operation and financial condition, as well as our
ability to achieve our strategic goals and financial targets.
As UBS Group AG is a holding company, its operating results,
financial condition and ability to pay dividends and other
distributions and / or to pay its obligations in the future depend
on funding, dividends and other distributions received directly or
indirectly from its subsidiaries, which may be subject to
restrictions
UBS Group AG’s ability to pay dividends and other distributions
and to pay its obligations in the future will depend on the level of
funding, dividends and other distributions, if any, received from
UBS AG and other subsidiaries. The ability of such subsidiaries to
make loans or distributions, directly or indirectly, to UBS Group
AG may be restricted as a result of several factors, including
restrictions in financing agreements and the requirements of
applicable law and regulatory, fiscal or other restrictions. In
particular, UBS Group AG’s direct and indirect subsidiaries,
including UBS AG, UBS Switzerland AG, UBS Americas Holding
LLC and UBS Europe SE, are subject to laws and regulations that
restrict dividend payments, authorize regulatory bodies to block
or reduce the flow of funds from those subsidiaries to UBS Group
AG, or could affect their ability to repay any loans made to, or
other investments in, such subsidiary by UBS Group AG or another
member of the Group. For example, in the early stages of the
COVID-19 pandemic, the European Central Bank ordered all
banks under its supervision to cease dividend distributions and the
Federal Reserve Board has limited capital distributions by bank
holding companies and intermediate holding companies.
Restrictions and regulatory actions of this kind could impede
access to funds that UBS Group AG may need to meet its
obligations or to pay dividends to shareholders. In addition, UBS
Group AG’s right to participate in a distribution of assets upon a
subsidiary’s liquidation or reorganization is subject to all prior
claims of the subsidiary’s creditors.
Our capital instruments may contractually prevent UBS Group
AG from proposing the distribution of dividends to shareholders,
other than in the form of shares and from engaging in
repurchases of shares, if we do not pay interest on these
instruments.
73
Furthermore, UBS Group AG may guarantee some of the
payment obligations of certain of the Group’s subsidiaries from
time to time. These guarantees may require UBS Group AG to
provide substantial funds or assets to subsidiaries or their creditors
or counterparties at a time when UBS Group AG is in need of
liquidity to fund its own obligations.
The credit ratings of UBS Group AG or its subsidiaries used for
funding purposes could be lower than the ratings of the Group’s
operating subsidiaries, which may adversely affect the market
value of the securities and other obligations of UBS Group AG or
those subsidiaries on a standalone basis.
Liquidity and funding risk
Liquidity and funding management are critical to UBS’s ongoing
performance
The viability of our business depends on the availability of funding
sources, and our success depends on our ability to obtain funding
at times, in amounts, for tenors and at rates that enable us to
efficiently support our asset base in all market conditions. Our
funding sources have generally been stable, but could change in
the future because of,
among other things, gener
al market
disruptions or widening credit spreads, which could also influence
the cost of funding. A substantial part of our liquidity and funding
requirements are met using short-term unsecured funding
sources, including retail and wholesale deposits and the regular
issuance of money market securities. A change in the availability
of short-term funding could occur quickly.
The addition of loss-absorbing debt as a component of capital
requirements, the regulatory requirements to maintain minimum
TLAC at UBS’s holding company and at subsidiaries, as well as the
power of resolution authorities to bail in TLAC and other debt
obligations, and uncertainty as to how such powers will be
exercised, will increase our cost of funding and could potentially
increase the total amount of funding required, in the absence of
other changes in our business.
Reductions in our credit ratings may adversely affect the
market value of the securities and other obligations and increase
our funding costs, in particular with regard to funding from
wholesale unsecured sources, and could affect the availability of
certain kinds of funding. In addition, as experienced in connection
with Moody’s downgrade of UBS AG’s long-term debt rating in
June 2012, rating downgrades can require us to post additional
collateral or make additional cash payments under trading
agreements. Our credit ratings, together with our capital strength
and reputation, also contribute to maintaining client and
counterparty confidence, and it is possible that rating changes
could influence the performance of some of our businesses.
The requirement to maintain a liquidity coverage ratio of high-
quality liquid assets to estimated stressed short-term net cash
outflows, and other similar liquidity and funding requirements,
oblige us to maintain high levels of overall liquidity, limit our ability
to optimize interest income and expense, make certain lines of
business less attractive and reduce our overall ability to generate
profits. In particular, UBS AG is subjected to increased liquidity
coverage requirements under the direction of FINMA. Regulators
may consider it necessary to increase these requirements in light
of the anticipated economic stresses resulting from the COVID-19
pandemic. The liquidity coverage ratio and net stable funding
ratio requirements are intended to ensure that we are not overly
reliant on short-term funding and that we have sufficient long-
term funding for illiquid assets. The relevant calculations make
assumptions about the relative likelihood and amount of outflows
of funding and available sources of additional funding in market-
wide and firm-specific stress situations. There can be no assurance
that in an actual stress situation our funding outflows would not
exceed the assumed amounts.
Financial and
operating
performance
Management report
2
Financial and operating performance | Accounting and financial reporting
76
Accounting and financial reporting
Critical accounting estimates and judgments
In preparing our financial statements in accordance with
International Financial Reporting Standards (IFRS), as issued by the
International Accounting Standards Board (the IASB), we apply
judgment and make estimates and assumptions that may involve
significant uncertainty at the time they are made. We regularly
reassess those estimates and assumptions, which encompass
historical experience, expectations of the future and other
pertinent factors, to determine their continuing relevance based
on current conditions, and update them as necessary. Changes in
estimates and assumptions may have significant effects on the
financial statements. Furthermore, actual results may differ
significantly from our estimates, which could result in significant
losses to the Group, beyond what we expected or provided for.
Key areas involving a high degree of judgment and areas where
estimates and assumptions are significant to the consolidated
financial statements include:
–
expected credit loss measurement;
–
fair value measurement;
–
income taxes;
–
provisions and contingent liabilities;
–
post-employment benefit plans;
–
goodwill; and
–
consolidation of structured entities.
›
Refer to “Note 1a Material accounting policies” in the
“Consolidated financial statements” section of this report for
more information
›
Refer to the “Risk factors” section of this report for more
information
Significant accounting and financial reporting changes in
2021
Amendments to IFRS as a consequence of
Interest Rate
Benchmark Reform
Effective from 1 January 2021, we have adopted
Interest
Rate
Benchmark Reform – Phase 2, Amendments to IFRS 9, IAS 39,
IFRS 7, IFRS 4 and IFRS 16
, addressing a number of issues in
financial reporting areas that arise when interbank offered rates
(IBORs) are reformed or replaced, in particular in the area of hedge
accounting. The amendments also introduced additional
disclosure requirements covering how
we are
managing the
transition to alternative benchmark rates, our progress as of the
reporting date and the risks to which we are exposed because of
the transition.
›
Refer to “Note 1b Changes in accounting policies, comparability
and other adjustments” and “Note 25 Interest rate benchmark
reform” in the “Consolidated financial statements” section of
this report for more information
77
Group performance
Income statement
For the year ended
% change from
USD million
31.12.21
31.12.20
31.12.19
31.12.20
Net interest income
Other net income from financial instruments measured at fair value through profit or loss
Credit loss (expense) / release
Fee and commission income
Fee and commission expense
Net fee and commission income
Other income
Total operating income
Personnel expenses
General and administrative expenses
Depreciation, amortization and impairment of non-financial assets
2,118
2,126
1,940
Total operating expenses
Operating profit / (loss) before tax
Tax expense / (benefit)
Net profit / (loss)
Net profit / (loss) attributable to non-controlling interests
Net profit / (loss) attributable to shareholders
Comprehensive income
Total comprehensive income
Total comprehensive income attributable to non-controlling interests
Total comprehensive income attributable to shareholders
Financial and operating performance | Group performance
78
2021 compared with 2020
Results
In 202
1
,
net profit attributable to shareholders
increased by
USD 900 million, or 14%, to USD 7,457 million, which included a
net tax expense of USD 1,998 million.
Profit before tax increased by USD 1, 329 million, or 16%, to
USD 9,484 million, reflecting higher operating income, partly
offset by an increase in operating expenses. Operating income
increased by USD 3,152 million, or 10%, to USD 3 5,542 million,
mainly reflecting a USD 3,201 million increase in net fee and
commission income. Net credit loss releases were USD 148
million, compared with net credit loss expenses of USD 694
million in 2020. This was partly offset by USD 624 million lower
other income and a USD 267 million decrease in total combined
net interest income and other net income from financial
instruments measured at fair value through profit or loss.
Operating expenses increased by USD 1,823 million, or 8%, to
USD
2
6
,
058
million. This
increase
was mai
nly driven by
USD
1,
1
63
million
high
er
personnel
expenses
and
USD
668
million higher general and administrative expenses.
Operating income
Operating income increased by USD 3,152 million, or 10%, to
USD 35,542 million.
Net interest income and other net income from financial
instruments measured at fair value through profit or loss
Total combined net interest income and other net income from
financial instruments measured at fair value through profit or loss
decreased by USD 267 million to USD 12,555 million.
The Investment Bank
de
creased by
USD
57
6
million to
USD 5,067 million, largely driven by a USD 713 million decrease
in our Financing business in Global Markets, primarily reflecting a
loss of USD 861 million incurred in the first half of 2021 on the
default of a US-based client of our prime brokerage business,
partly offset by
higher capital markets financing revenues
.
Derivatives & Solutions increased by USD 169 million, mainly due
to higher revenues from equity derivatives, partly offset by lower
income from foreign exchange, rates and credit products.
Group Functions recognized negative income of USD 397
million, compared with negative income of USD 302 million. This
was largely due to USD 113 million lower net income in Group
Treasury, mainly
reflecting
net effects related to accounting
asymmetries, including hedge accounting ineffectiveness, partly
offset by lower negative revenues related to centralized Group
Treasury risk management services. In addition, 2021 included
valuation gains of USD 58 million on auction rate securities in
Non-core and Legacy Portfolio, compared with valuation losses of
USD 9 million in the prior year.
Global Wealth Management increased by USD 302 million to
USD 5,341 million, mainly driven by higher net interest income,
largely reflecting growth in lending revenues from higher volumes
and margins, partly offset by lower deposit revenues, mainly due
to lower US dollar interest rates and despite higher deposit
volumes.
Personal & Corporate Banking increased by USD 98 million to
USD 2,557 million, mainly due to higher net interest income,
driven by proactive deposit management.
›
Refer to “Note 3 Net interest income and other net income from
financial instruments measured at fair value through profit or
loss” in the “Consolidated financial statements” section of this
report for more information
Net interest income and other net income from financial instruments measured at fair value through profit or loss
For the year ended
% change from
USD million
31.12.21
31.12.20
31.12.19
31.12.20
Net interest income from financial instruments measured at amortized cost and fair value through other
comprehensive income
Net interest income from financial instruments measured at fair value through profit or loss
Other net income from financial instruments measured at fair value through profit or loss
Total
Global Wealth Management
of which: net interest income
of which: transaction-based income from foreign exchange and other intermediary activity
Personal & Corporate Banking
of which: net interest income
of which: transaction-based income from foreign exchange and other intermediary activity
Asset Management
Investment Bank
Global Banking
Global Markets
Group Functions
1 Mainly includes spread-related income in connection with client-driven transactions, foreign currency translation effects and income and expenses from precious metals, which are included in the income statement
line Other net income from financial instruments measured at fair value through profit or loss. The amounts reported on this line are one component of Transaction -based income in the management discussion and
analysis of Global Wealth Management and Personal & Corporate Banking in the “Global Wealth Management” and “Personal & Corporate Banking” sections of this report, respectively. 2 Investment Bank
information is provided at the business line level rather than by financial statement reporting line in order to reflect the underlying business activities, which is consistent with the structure of the management discussion
and analysis in the “Investment Bank” section of this report.
79
Net fee and commission income
Net fee and commission income increased by USD 3,201 million
to USD 22,387 million.
Fees for portfolio management and related services increased
by USD 1,753 million to USD 9,762 million, driven by Global
Wealth Management, reflecting higher average fee-generating
assets, due to positive market performance and net new fee-
generating assets.
Investment fund fees increased by
USD
501 million to
USD 5,790 million, mainly driven by Global Wealth Management,
reflecting higher average fee-generating assets. Management
fees in Asset Management increased on a higher average invested
asset base, partly offset by lower performance-based fee income,
compared with the particularly high levels in 2020.
Underwriting fees increased by USD 378 million to USD 1,463
million, largely driven by higher equity underwriting revenues
from public offerings in the Investment Bank.
M&A and corporate finance fees increased by USD 366 million
to USD 1,102 million, primarily reflecting higher revenues from
M&A
transactions in our Global Banking business in the
Investment Bank, due to an increase in the number of transactions
that closed in 2021.
Net brokerage fees increased by USD 265 million to USD 4,123
million
,
reflecting
higher levels of client activity in the Cash
Equities business of the Investment Bank, as well as in Global
Wealth Management.
›
Refer to “Note 4 Net fee and commission income” in the
“Consolidated financial statements” section of this report for
more information
Other income
Other income decreased by USD 624 million to USD 452 million,
mainly driven by lower gains from disposals of subsidiaries and
associates, largely reflecting a USD 37 million gain from the sale
of our remaining minority investment in Clearstream Fund Centre
AG (previously Fondcenter AG) in 2021, compared with a gain of
USD 631 million from the partial sale of Fondcenter AG (now
Clearstream Fund Centre AG) in
2020
.
In 2021
,
we also
recognized a gain of USD 100 million from the sale of our
domestic wealth management business in Austria and income of
USD 51 million related to a legacy bankruptcy claim. In the prior
year, we recognized a USD 215 million gain from the sale of
intellectual property rights associated with the Bloomberg
Commodity Index family.
›
Refer to “Note 5 Other income” in the “Consolidated financial
statements” section of this report for more information
›
Refer to “Note 30 Changes in organization and acquisitions and
disposals of subsidiaries and businesses” in the “Consolidated
financial statements” section of this report for more information
about the sale of our remaining investment in Clearstream Fund
Centre AG and the sale of our domestic wealth management
business in Austria
Credit loss expense / release
Total net credit loss releases were USD 148 million, compared with
net credit loss expenses of USD 694 million in the prior year,
reflecting net releases of USD 123 million related to stage 1 and
2 positions and net releases of USD 25 million related to credit-
impaired (stage 3) positions.
›
Refer to “Note 9 Financial assets at amortized cost and other
positions in scope of expected credit loss measurement” and
“Note 20 Expected credit loss measurement” in the
“Consolidated financial statements” section of this report for
more information about credit loss expenses / releases
›
Refer to the “Risk factors” section of this report for more
information
Credit loss (expense) / release
USD million
Global
Wealth
Management
Personal &
Corporate
Banking
Asset
Management
Investment
Bank
Group
Functions
Total
For the year ended 31.12.21
Stages 1 and 2
Stage 3
Total credit loss (expense) / release
For the year ended 31.12.20
Stages 1 and 2
(88)
(266)
Stage 3
(217)
(429)
Total credit loss (expense) / release
For the year ended 31.12.19
Stages 1 and 2
Stage 3
Total credit loss (expense) / release
Financial and operating performance | Group performance
80
Operating expenses
Operating expenses increased by USD 1,823 million, or 8%, to
USD 26,058 million.
Personnel expenses
Personnel expenses increased by
USD
1,1
63
million to
USD
1
8
,
387
million,
including
net
r
estructuring expenses of
USD 200 million, compared with USD 106 million in the prior
year. Total restructuring expenses in 2021 are net of curtailment
gains
of
USD
80
million, which represent a reduction in the
defined benefit obligation (DBO) related to the Swiss pension plan
resulting from a decrease in headcount following restructuring
activities.
Financial advisor compensation increased by USD 769 million
to
USD
4,860 million
,
due to an increase in compensable
revenues.
Salary costs increased by
USD
316
million to
USD
7,
339
million, mainly driven by foreign currency translation effects and
higher restructuring expenses.
Social security expenses increased by
USD
79
million to
USD 978 million, broadly in line with higher salary expenses.
›
Refer to the “Compensation” section of this report for more
information
›
Refer to “Note 6 Personnel expenses,” “Note 27 Post-
employment benefit plans” and “Note 28 Employee benefits:
variable compensation” in the “Consolidated financial
statements” section of this report for more information
General and administrative expenses
General and administrative expenses increased by USD 668
million to USD 5,553 million, mainly driven by a USD 740 million
(EUR 650 million) increase in litigation provisions for the French
cross-border matter and USD 106 million higher IT expenses.
These effects were partly offset by lower consulting fees and
outsourcing costs.
Net expenses for the UK and German bank levies were USD 58
million in 2021 and included a USD 16 million credit related to
prior years. In 2020, net expenses for the UK and German bank
levies were USD 55 million and included a USD 27 million credit
related to prior years.
We believe that the industry continues to operate in an
environment in which expenses associated with litigation,
regulatory and similar matters will remain elevated for the
foreseeable future, and we continue to be exposed to a number
of significant claims and regulatory matters. The outcome of many
of these matters, the timing of a resolution, and the potential
effects of resolutions on our future business, financial results or
financial condition are extremely difficult to predict.
›
Refer to “Note 7 General and administrative expenses” and
“Note 18 Provisions and contingent liabilities” in the
“Consolidated financial statements” section of this report for
more information
Depreciation, amortization and impairment
Depreciation, amortization and impairment of non-financial
assets decreased by USD 8 million to USD 2,118 million, mainly
driven by lower impairment expenses on internally generated
software, a decrease in depreciation expenses related to leased
properties and lower amortization of intangible assets, partly
offset by higher depreciation expenses on internally generated
software.
›
Refer to “Note 12 Property, equipment and software” and
“Note 13 Goodwill and intangible assets” in the “Consolidated
financial statements” section of this report for more information
Operating expenses
For the year ended
% change from
USD million
31.12.21
31.12.20
31.12.19
31.12.20
Personnel expenses
of which: salaries
of which: variable compensation
of which: relating to current year
of which: relating to prior years
5
650
of which: financial advisor compensation
of which: other personnel expenses
General and administrative expenses
of which: net expenses for litigation, regulatory and similar matters
197
165
of which: other general and administrative expenses
4,688
5,122
Depreciation, amortization and impairment of non-financial assets
2,118
2,126
1,940
Total operating expenses
1 Includes expenses relating to performance awards and other variable compensation for the respective performance year. 2 Consists of amortization of prior years’ awards relating to performance awards and other
variable compensation. 3 Financial advisor compensation consists of formulaic compensation based directly on compensable revenues generated by financial advisors and supplemental compensation calculated on
the basis of financial advisor productivity, firm tenure, assets and other variables. It also includes expenses related to compensation commitments with financial advisors entered into at the time of recruitment that
are subject to vesting requirements. 4 Consists of expenses related to contractors, social security, post-employment benefit plans, and other personnel expenses. Refer to “Note 6 Personnel expenses” in the
“Consolidated financial statements” section of this report for more information. 5 During 2020, UBS modified the conditions for continued vesting of certain outstanding deferred compensation awards for qualifying
employees, resulting in an expense of approximately USD 280 million, of which USD 240 million is disclosed within Variable compensation and USD 40 million within Other personnel expenses in this table.
81
Tax
Income tax expenses of USD 1,998 million were recognized for
the Group in 2021, representing an effective tax rate of 21.1%,
compared with USD 1,583 million for 2020, which represented
an effective tax rate of 19.4%. The income tax expenses for 2021
included Swiss tax expenses of USD 714 million and non-Swiss tax
expenses of USD 1,284 million.
The Swiss tax expenses included current tax expenses of
USD 680 million related to taxable profits of UBS Switzerland AG
and other Swiss entities. They also included deferred tax expenses
of
USD
34 million, which reflect movements in temporary
differences.
The non-Swiss tax expenses included current tax expenses of
USD 884 million related to taxable profits earned by non-Swiss
subsidiaries and branches and net deferred tax expenses of
USD 400 million. Expenses of USD 734 million, which primarily
relate
d
to the amortization of deferred tax assets (DTAs)
previously recognized in relation to tax losses carried forward and
deductible temporary differences of UBS Americas Inc., were
partly offset by a benefit of USD 334 million in respect of the
remeasurement of DTAs. This benefit included upward
revaluations of DTAs of USD 152 million for certain entities,
primarily in connection with our business planning process. It also
included USD 113 million in respect of additional DTA recognition
that primarily related to the contribution of real estate assets by
UBS AG to UBS Americas Inc. and UBS Financial Services Inc.,
which allowed the full recognition of DTAs in respect of the
associated historic real estate costs that were previously
capitalized for US tax purposes under elections that were made in
the fourth quarter of 2018. In addition, it included USD 69 million
in respect of an increase in the expected value of future tax
deductions for deferred compensation awards, due to an increase
in the Group’s share price during the year.
The pre-tax expense that was recognized in the year in respect
of the increase in litigation provisions for the French cross-border
matter did not result in any tax benefit.
Excluding any potential effects from the remeasurement of
DTAs in connection with next year’s business planning process
and any potential US corporate tax rate changes or other material
jurisdictional statutory tax rate changes that could be enacted
during the year, we expect a tax rate for 2022 of around 24%.
›
Refer to “Note 8 Income taxes” in the “Consolidated financial
statements” section of this report for more information
›
Refer to the “Risk factors” section of this report for more
information
Total comprehensive income attributable to shareholders
In 2021, total comprehensive income attributable to shareholders
was USD 5,106 million, reflecting net profit of USD 7,457 million
and negative other comprehensive income (OCI), net of tax, of
USD 2,351 million.
OCI related to cash flow hedges was negative USD 1,675
million, mainly reflecting net gains on hedging instruments that
were reclassified from OCI to the income statement as the hedged
forecast cash flows affected profit or loss.
Foreign currency translation OCI was
negative
USD
535
million, mainly due to the weakening of the euro (7%), the Swiss
franc (3%) and the Japanese yen (10%) against the US dollar.
OCI associated with financial assets measured at fair value
through OCI was negative USD 157 million, primarily reflecting
net unrealized losses of USD 203 million following increases in the
relevant US dollar long-term interest rates.
OCI related to cost of hedging was negative USD 26 million,
mainly driven by a tightening of the US dollar / euro cross-currency
basis that decreased the fair value of the cross-currency swaps.
Defined benefit plan OCI, net of tax, was negative USD 5
million. Total net pre-tax OCI related to the Swiss pension plan
was negative USD 336 million. This was mainly driven by an
extraordinary employer contribution of
USD
2
54
million that
increased the gross plan assets and a pension plan curtailment of
USD 80 million that reduced the DBO against profit or loss. These
effects led to an offsetting OCI loss, as no net pension asset could
be recognized on the balance sheet as of 31 December 2021 due
to the asset ceiling. As announced in 2018, UBS agreed to
mitigate the effects from changes to the Swiss pension plan
implemented in 2019 by contributing up to CHF 720 million
(USD 790 million at the closing exchange rate as of 31 December
2021)
in three installments in 2020, 2021 and 2022. The
extraordinary contribution of USD 254 million in the first quarter
of 2021 reflected the second installment paid (first installment in
the first quarter of 2020: USD 235 million).
Total pre-tax OCI related to our non-Swiss pension plans was
positive USD 339 million, mainly driven by the UK pension plan,
which recorded positive net pre-tax OCI of USD 207 million. The
positive OCI in the UK plan reflected gains of USD 277 million due
to a positive return on plan assets, partly offset by losses of
USD
71
million from remeasurement of the
DBO
.
The DBO
remeasurement effect was mainly driven by a loss of USD 316
million due to an increase in the applicable inflation rate and a
USD
59 million
experience loss
repres
enting the effects of
differences between the previous actuarial assumptions and what
actually occurred, partly offset by a USD 319 million gain due to
an increase in the applicable discount rate.
OCI related to own credit on financial liabilities designated at
fair value was positive USD 46 million, primarily reflecting effects
from time decay.
›
Refer to “Statement of comprehensive income” in the
“Consolidated financial statements” section of this report for
more information
›
Refer to “Note 21 Fair value measurement” in the “Consolidated
financial statements” section of this report for more information
about own credit on financial liabilities designated at fair value
›
Refer to “Note 26 Hedge accounting” in the “Consolidated
financial statements” section of this report for more information
about cash flow hedges of forecast transactions
›
Refer to “Note 27 Post-employment benefit plans” in the
“Consolidated financial statements” section of this report for
more information about OCI related to defined benefit plans
Financial and operating performance | Group performance
82
Sensitivity to interest rate movements
As of 31 December 2021, we estimate that a parallel shift in yield
curves by +100 basis points could lead to a combined increase in
annual net interest income of approximately USD 1.8 billion in
Global Wealth Management and Personal & Corporate Banking
in the first year after such a shift. Of this increase, approximately
USD 1.2 billion and USD 0.2 billion would result from changes in
US dollar and Swiss franc interest rates, respectively. A parallel
shift in yield curves by –100 basis points could lead to a combined
decrease in annual net interest income of approximately USD 0.8
billion in Global Wealth Management and Personal & Corporate
Banking in the first year after such a shift, predominantly driven
by positions denominated in US dollars.
These estimates are based on a hypothetical scenario of an
immediate change in interest rates, equal across all currencies and
relative to implied forward rates as of 31 December 2021 applied
to our banking book. These estimates further assume no change
to balance sheet size and structure, constant foreign exchange
rates and no specific management action.
Seasonal characteristics
Our revenues may show seasonal patterns, notably in the
Investment Bank and transaction-based revenues for Global
Wealth Management, and typically reflect the highest client
activity levels in the first quarter, with lower levels throughout the
rest of the year, especially during the summer months and the
end-of-year holiday season.
Key figures
Below we provide an overview of selected key figures of the
Group. For further information about key figures related to capital
management, refer to the “Capital, liquidity and funding, and
balance sheet” section of this report.
Cost / income ratio
The cost / income ratio was 73.6%, compared with 73.3%,
reflecting
higher operating expenses
,
with a
partly offset
ting
effect driven by an increase in operating income. The cost /
income ratio is measured based on income before credit loss
expenses or releases.
Common equity tier 1 capital
Common equity tier 1 (CET1) capital increased by USD 5.4 billion
to USD 45.3 billion, mainly as a result of operating profit before
tax of
USD
9.5 billion,
a
USD
0.
5
billion
increase in
eligible
deferred tax assets on temporary differences, a USD 0.4 billion
decrease in deduction of goodwill resulting from the sale of our
remaining minority investment in Clearstream Fund Centre AG
(previously Fondcenter AG) and an increase of USD 0.2 billion
related to the launch of our new operational partnership entity
with Sumitomo Mitsui Trust Holdings, Inc. These effects were
partly offset by dividend accruals of USD 1.7 billion, current tax
expenses of USD 1.6 billion, share repurchases under our share
repurchase program of USD 0.6 billion, negative foreign currency
effects of USD 0.6 billion, compensation- and own share -related
capital components of USD 0.4 billion, and negative effects from
defined benefit plans of USD 0.2 billion.
Our share repurchases in 2021 decreased CET1 capital by
USD 0.6 billion, reflecting shares repurchased under our share
repurchase programs of USD 2.6 billion, partly offset by the use
of the capital reserve for potential share repurchases of USD 2.0
billion. The capital reserve for potential share repurchases was
fully utilized during 2021.
Return on CET1 capital
Our return on CET1 capital (RoCET1) was 17.5%, compared with
1
7
.
4
%,
reflecting
a
USD
900
m
illion
in
crease in net profit
attributable to shareholders, with a partly offsetting effect driven
by USD 5.0 billion higher average CET1 capital.
Risk-weighted assets
R
isk
-
weighted assets (RWA)
increased by
USD
13.1
billion to
USD
302
.
2
billion,
primarily driven by increases of
USD
12.0
billion in credit and counterparty credit risk RWA, USD 1.0 billion
in operational risk RWA and USD 0.9 billion in non-counterparty-
related risk. These increases were partly offset by a decrease of
USD 0.8 billion in market risk RWA.
Common equity tier 1 capital ratio
Our CET1 capital ratio increased 1.2 percentage points to 15.0%,
reflecting a USD 5.4 billion increase in CET1 capital that was partly
offset by the aforementioned increase in RWA.
Leverage ratio denominator
The leverage ratio denominator (the LRD) increased by USD 32
billion (excluding the temporary exemption that applied from
25 March 2020 until 1 January 2021 and was granted by the
Swiss Financial Market Supervisory Authority (
FINMA)
)
to
USD 1,069 billion, driven by asset size and other movements of
USD 54 billion, partly offset by a decrease due to currency effects
of USD 23 billion.
Common equity tier 1 leverage ratio
Our CET1 leverage ratio increased to 4.24% from
3.85
%
(excluding the temporary exemption that applied from 25 March
2020 until 1 January 2021 and was granted by FINMA), as the
aforementioned USD 5.4 billion increase in CET1 capital was
partly offset by the aforementioned increase in the LRD.
Going concern leverage ratio
Our going concern leverage ratio increased to 5.7% from 5.4%
(excluding the temporary exemption that applied from 25 March
2020 until 1 January 2021 and was granted by FINMA), as the
USD 4.3 billion increase in our going concern capital was partly
offset by the aforementioned increase in the LRD.
Personnel
The number of personnel employed as of 31 December 2021 was
broadly stable at 71,385 (full-time equivalents), a net decrease of
166 compared with 31 December 2020.
83
Return on equity and CET1 capital
As of or for the year ended
USD million, except where indicated
31.12.21
31.12.20
31.12.19
Net profit
Net profit attributable to shareholders
Equity
Equity attributable to shareholders
Less: goodwill and intangible assets
6,378
6,480
6,469
Tangible equity attributable to shareholders
54,283
52,965
48,032
Less: other CET1 deductions
9,003
13,075
12,497
CET1 capital
45,281
39,890
35,535
Return on equity
Return on equity (%)
12.6
11.3
7.9
Return on tangible equity (%)
14.1
12.8
9.0
Return on common equity tier 1 capital (%)
17.5
17.4
12.4
Financial and operating performance | Global Wealth Management
84
Global Wealth Management
Global Wealth Management
1
As of or for the year ended
% change from
USD million, except where indicated
31.12.21
31.12.20
31.12.20
Results
Net interest income
4,244
4,027
5
Recurring net fee income
2
11,170
9,372
19
Transaction-based income
2
3,836
3,576
7
Other income
168
159
5
Income
19,419
17,134
13
Credit loss (expense) / release
29
(88)
Total operating income
19,449
17,045
14
Total operating expenses
14,665
13,026
13
Business division operating profit / (loss) before tax
4,783
4,019
19
Performance measures and other information
Financial advisor variable compensation
3,4
4,382
3,589
22
Compensation commitments with recruited financial advisors
3,5
479
502
(5)
Pre-tax profit growth (year-on-year, %)
2
19.0
18.3
Cost / income ratio (%)
2
75.5
76.0
Average attributed equity (USD billion)
6
18.8
17.1
10
Return on attributed equity (%)
2,6
25.4
23.6
Risk-weighted assets (USD billion)
6
99.8
87.2
15
Leverage ratio denominator (USD billion)
6,7
399.6
371.2
8
Goodwill and intangible assets (USD billion)
5.0
5.1
(1)
Net new fee-generating assets (USD billion)
2
106.9
40.8
Fee-generating assets (USD billion)
2
1,482
1,277
16
Fee-generating asset margin (bps)
2
82.6
86.2
Net new money (USD billion)
2
111.1
43.3
Invested assets (USD billion)
2
3,303
3,016
10
Loans, gross (USD billion)
8
234.1
213.1
10
Customer deposits (USD billion)
8
369.8
348.0
6
Recruitment loans to financial advisors
3
1,830
1,872
(2)
Other loans to financial advisors
3
623
697
(11)
Impaired loan portfolio as a percentage of total loan portfolio, gross (%)
2,9
0.2
0.4
Advisors (full-time equivalents)
9,329
9,575
(3)
1 Comparatives may differ as a result of adjustments following organizational changes, restatements due to the retrospective adoption of new accounting standards or changes in accounting policies, and events after
the reporting period. 2 Refer to “Alternative performance measures” in the appendix to this report for the definition and calculation method. 3 Relates to licensed professionals with the ability to provide investment
advice to clients in the Americas. 4 Financial advisor variable compensation consists of formulaic compensation based directly on compensable revenues generated by financial advisors and supplemental
compensation calculated on the basis of financial advisor productivity, firm tenure, new assets and other variables. 5 Compensation commitments with recruited financial advisors represent expenses related to
compensation commitments granted to financial advisors at the time of recruitment that are subject to vesting requirements. 6 Refer to the “Capital, liquidity and funding, and balance sheet” section of this report
for more information. 7 The leverage ratio denominator calculated as of the respective date in 2020 does not reflect the effects of the temporary exemption that applied from 25 March 2020 until 1 January 2021
and was granted by FINMA in connection with COVID-19. Refer to the “Regulatory and legal developments” section of our Annual Report 2020 for more information. 8 Loans and Customer deposits in this table
include customer brokerage receivables and payables, respectively, which are presented in a separate reporting line on the balance sheet. 9 Refer to the “Risk management and control” section of this report for
more information about (credit-)impaired exposures. Excludes loans to financial advisors.
85
2021 compared with 2020
Results
Profit before tax increased by USD 764 million, or 19%, to
USD 4,783 million, driven by higher operating income, partly
offset by higher operating expenses, which included a USD 657
million increase in litigation provisions for the French cross-border
matter.
Operating income
Total operating income increased by USD 2,404 million, or 14%,
to USD 19,449 million, driven by increases across all operating
income lines.
Net interest income increased by USD 217 million to
USD 4,244 million, mostly reflecting growth in loan revenues from
higher volumes and margins, partly offset by lower deposit
revenues, mainly due to lower US dollar interest rates and despite
higher deposit volumes.
Recurring net fee income increased by USD 1,798 million to
USD 11,170 million, primarily driven by higher average fee-
generating assets, reflecting positive market performance and net
new fee-generating assets.
Transaction -based income increased by USD 260 million to
USD 3,836 million, reflecting higher levels of client activity in the
Americas, EMEA and Switzerland.
Other income increased by USD 9 million to USD 168 million,
primarily driven by a gain of USD 100 million related to the sale
of our domestic wealth management business in Austria to LGT.
2020 included a gain of USD 60 million from the sale of a majority
stake in Fondcenter AG (now Clearstream Fund Centre AG).
Net credit loss releases were USD 29 million, compared with
net expenses of USD 88 million. Stage 1 and 2 credit loss releases
were USD 28 million, largely resulting from a partial release of a
post-model adjustment of USD 12 million during the year, as well
as model updates. Stage 3 net credit loss releases were USD 1
million.
Operating expenses
Total operating expenses increased by USD 1,639 million to
USD 14,665 million. This was mainly driven by an increase in
financial advisor variable compensation, reflecting higher
compensable revenues, and by the aforementioned USD 657
million increase in litigation provisions for the French cross-border
matter.
Pre-tax profit growth
Pre-tax profit growth in 2021 was 19.0%, compared with 18.3%
in 2020. Our target range is 10–15% over the cycle.
Cost / income ratio
The cost / income ratio decreased to 75.5% from 76.0%,
reflecting positive operating leverage.
Fee-generating assets
Fee-generating assets increased by USD 205 billion, or 16%, to
USD 1,482 billion, predominantly driven by net new fee-
generating assets of USD 106.9 billion, with inflows across all
regions, and net positive market performance and foreign
currency effects of USD 98.0 billion.
Loans
Loans increased by USD 21.0 billion, or 10%, to USD 234.1
billion, primarily driven by net new loans of USD 25.1 billion,
partly offset by USD 3.0 billion from negative foreign exchange
effects and USD 1.1 billion from the reclassification of loans to
disposal groups held for sale in connection with the upcoming
sales of our domestic wealth management business in Spain and
UBS Swiss Financial Advisers AG. Net new loans were largely
driven by an increase in Lombard loans and mortgages. Loan
penetration was stable at 7.1% in 2021.
›
Refer to the “Risk management and control” section of this
report for more information
Financial and operating performance | Global Wealth Management
86
Regional breakdown of performance measures
As of or for the year ended 31.12.21
USD billion, except where indicated
Americas
1
Switzerland
EMEA
2
Asia Pacific
Global Wealth
Management
3
Total operating income (USD million)
Total operating expenses (USD million)
Operating profit / (loss) before tax (USD million)
Cost / income ratio (%)
4
Loans, gross
5
Net new loans
Loan penetration (%)
4,6
Fee-generating assets
4
Net new fee-generating assets
4
Invested assets
4
Net new money
4
Advisors (full-time equivalents)
1 Including the following business units: United States and Canada; and Latin America. 2 Including the following business units: Europe; Central & Eastern Europe, Greece and Israel; and Middle East and Africa.
3 Including minor functions, which are not included in the four regions individually presented in this table, with USD 16 million of total operating income, USD 34 million of total operating expenses, USD 17 million
of operating loss before tax, USD 0.6 billion of loans, USD 0.0 billion of net new loan outflows, USD 1 billion of fee-generating assets, USD 0.5 billion of net new fee-generating asset outflows, USD 3 billion of invested
assets, USD 0.8 billion of net new money outflows and 80 advisors in 2021. 4 Refer to “Alternative performance measures” in the appendix to this report for the definition and calculation method. 5 Loans include
customer brokerage receivables, which are presented in a separate reporting line on the balance sheet. 6 Loans, gross as a percentage of invested assets.
Regional comments: 2021 compared with 2020
Americas
Profit before tax increased by USD 641 million to USD 2,001
million. Operating income increased by USD 1,645 million to
USD 10,672 million, driven by higher recurring net fee, net
interest and transaction-based income. The cost / income ratio
decreased to 81.4% from 84.4%. Loans increased 27% to
USD 92 billion, reflecting USD 19.6 billion of net new loans. Fee-
generating assets increased 19% to USD 900 billion, mainly
driven by positive market performance and net new fee-
generating assets of USD 64.3 billion.
Switzerland
Profit before tax increased by USD 108 million to USD 750 million.
This included an USD 85 million increase in litigation provisions
for the French cross-border matter. Operating income increased
by USD 206 million to USD 1,906 million, mainly driven by higher
recurring net fee, net interest and transaction-based income. The
cost / income ratio decreased to 60.8% from 61.7%. Loans
increased 3% to USD 43 billion, driven by net new loans of
USD 2.3 billion, partly offset by negative foreign currency effects.
Fee-generating assets increased 17% to USD 130 billion, mainly
driven by net new fee-generating assets of USD 10.6 billion and
net positive market performance and foreign currency effects.
EMEA
Profit before tax decreased by USD
145 million
to USD
812
million, driven by a USD 572 million increase in litigation
provisions for the French cross -border matter. Operating income
increased by USD 397 million to USD 3,953 million, due to higher
recurring net fee income and other income, which was driven by
the aforementioned gain from the sale of our domestic wealth
management business in Austria, as well as higher transaction-
based income. The cost / income ratio increased to 79.6% from
72.7%. Loans increased 3% to USD 50 billion, mainly reflecting
USD 3.8 billion of net new loans, partly offset by negative foreign
currency effects and the aforementioned reclassification of
USD 0.7 billion of loans to disposal groups held for sale. Fee-
generating assets increased 9% to USD 334 billion, mainly driven
by net new fee-generating assets of USD 18.8 billion and net
positive market performance and foreign currency effects.
Asia Pacific
Profit before tax increased by USD 176 million to USD 1,237
million. Operating income increased by USD 166 million to
USD 2,901 million, mostly driven by recurring net fee and net
interest income. The cost / income ratio decreased to 57.4% from
61.2%. Loans decreased 2% to USD 49 billion, driven by negative
foreign currency effects and net new loan outflows of USD 0.5
billion, as clients reduced their debts in light of market uncertainty.
Fee-generating assets increased 13% to USD 116 billion, mainly
driven by net new fee-generating assets of USD 13.7 billion.
87
Personal & Corporate Banking
Personal & Corporate Banking – in Swiss francs
1
As of or for the year ended
% change from
CHF million, except where indicated
31.12.21
31.12.20
31.12.20
Results
Net interest income
1,941
1,916
1
Recurring net fee income
2
774
676
15
Transaction-based income
2
1,079
985
10
Other income
110
74
49
Income
3,904
3,650
7
Credit loss (expense) / release
79
(243)
Total operating income
3,984
3,407
17
Total operating expenses
2,397
2,233
7
Business division operating profit / (loss) before tax
1,587
1,175
35
Performance measures and other information
Average attributed equity (CHF billion)
3
8.4
8.3
1
Return on attributed equity (%)
2,3
19.0
14.1
Pre-tax profit growth (%) (year-on-year, %)
2
35.1
(18.0)
Cost / income ratio (%)
2
61.4
61.2
Net interest margin (bps)
2
140
142
Risk-weighted assets (CHF billion)
3
66.7
63.8
4
Leverage ratio denominator (CHF billion)
3,4
221.7
219.9
1
Business volume for Personal Banking (CHF billion)
2
184
179
3
Net new business volume for Personal Banking (CHF billion)
2
5.3
11.6
Net new business volume growth for Personal Banking (%)
2
3.0
6.9
Active Digital Banking clients in Personal Banking (%)
2,5
70.3
66.1
Active Digital Banking clients in Corporate & Institutional Clients (%)
2
79.3
77.9
Mobile Banking log-in share in Personal Banking (%)
2
73.5
68.0
Client assets (CHF billion)
2
751
702
7
Loans, gross (CHF billion)
139.3
136.4
2
Customer deposits (CHF billion)
162.1
161.1
1
Secured loan portfolio as a percentage of total loan portfolio, gross (%)
2
92.7
92.9
Impaired loan portfolio as a percentage of total loan portfolio, gross (%)
2,6
0.9
1.1
1 Comparatives may differ as a result of adjustments following organizational changes, restatements due to the retrospective adoption of new accounting standards or changes in accounting policies, and events after
the reporting period. 2 Refer to “Alternative performance measures” in the appendix to this report for the definition and calculation method. 3 Refer to the “Capital, liquidity and funding, and balance sheet”
section of this report for more information. 4 The leverage ratio denominator calculated as of the respective date in 2020 does not reflect the effects of the temporary exemption that applied from 25 March 2020
until 1 January 2021 and was granted by FINMA in connection with COVID-19. Refer to the “Regulatory and legal developments” section of our Annual Report 2020 for more information. 5 In 2021, 86.4% of
clients of Personal Banking were “activated users” of Digital Banking (i.e., clients who had logged into Digital Banking at least once in the course of their relationship with UBS). 6 Refer to the “Risk management
and control” section of this report for more information about (credit-)impaired exposures.
Financial and operating performance | Personal & Corporate Banking
88
2021 compared with 2020
Results
Profit before tax increased by CHF
41
2
million, or 35%, to
CHF 1,587 million, reflecting higher operating income, partly
offset by higher operating expenses.
Operating income
Total operating income increased by CHF 577 million, or 17%, to
CHF 3,984 million, reflecting net credit loss releases, compared
with net credit loss expenses in the prior year, as well as increases
across all income lines.
Net interest income increased by CHF 25 million to CHF 1,941
million, mainly driven by proactive deposit management.
Recurring net fee income increased by CHF 98 million to
CHF 774 million, primarily driven by higher custody, mandate and
investment fund fees, resulting from an increase in average
custody assets, reflecting net new investment product inflows and
positive market performance.
Transaction-based income increased by CHF 94 million to
CHF 1,079 million, largely driven by higher revenues from credit
card and foreign exchange transactions, reflecting a continued
increase in spending on travel and leisure by clients following the
easing of COVID-19-related restrictions in certain countries
relative to 2020. The third quarter of 2020 included a CHF 17
million gain related to the sale of an equity investment.
Other income increased by CHF 36 million to CHF 110 million,
mostly driven by a gain of CHF 26 million from the sale of several
small properties in the second quarter of 2021.
Net credit loss releases were CHF 79 million, compared with
net expenses of CHF 243 million. Stage 1 and 2 credit loss releases
were CHF 57 million, largely resulting from a partial release of a
post-model adjustment during the year, as well as model updates.
Prior-year stage 1 and 2 net credit loss expenses were CHF 123
million, which mainly reflected expenses for selected exposures to
large Swiss corporate clients, small and medium-sized entities,
financial intermediaries, and, to a lesser extent, real estate. These
modeled expected losses were predominantly driven by the
update to the forward-looking scenarios and their associated
weightings, factoring in updated macroeconomic assumptions to
reflect the effects of the COVID
-
19 pandemic.
Stage
3 net
releases were CHF 23 million, compared with net expenses of
CHF
120 million
,
which
includ
ed
expenses of CHF
54 million
related to a case of fraud at a commodity trade finance
counterparty.
Operating expenses
Total operating expenses increased by CHF 164 million, or 7%, to
CHF 2,397 million, mostly driven by a CHF 76 million (USD 83
million) increase in litigation provisions for the French cross-border
matter, as well as higher investments in technology and higher
variable compensation.
Cost / income ratio
The cost / income ratio slightly increased to 61.4% from 61.2%,
reflecting higher operating expenses, partly offset by higher
income.
89
Personal & Corporate Banking – in US dollars
1
As of or for the year ended
% change from
USD million, except where indicated
31.12.21
31.12.20
31.12.20
Results
Net interest income
2,120
2,049
3
Recurring net fee income
2
846
725
17
Transaction-based income
2
1,178
1,054
12
Other income
119
79
50
Income
4,263
3,908
9
Credit loss (expense) / release
86
(257)
Total operating income
4,349
3,651
19
Total operating expenses
2,618
2,392
9
Business division operating profit / (loss) before tax
1,731
1,259
37
Performance measures and other information
Average attributed equity (USD billion)
3
9.2
8.9
3
Return on attributed equity (%)
2,3
18.9
14.2
Pre-tax profit growth (%) (year-on-year, %)
2
37.5
(12.6)
Cost / income ratio (%)
2
61.4
61.2
Net interest margin (bps)
2
142
143
Risk-weighted assets (USD billion)
3
73.2
72.1
1
Leverage ratio denominator (USD billion)
3,4
243.2
248.3
(2)
Business volume for Personal Banking (USD billion)
2
202
202
0
Net new business volume for Personal Banking (USD billion)
2
5.8
12.3
Net new business volume growth for Personal Banking (%)
2
2.9
7.1
Active Digital Banking clients in Personal Banking (%)
2,5
70.3
66.1
Active Digital Banking clients in Corporate & Institutional Clients (%)
2
79.3
77.9
Mobile Banking log-in share in Personal Banking (%)
2
73.5
68.0
Client assets (USD billion)
2
824
793
4
Loans, gross (USD billion)
152.8
154.0
(1)
Customer deposits (USD billion)
177.8
181.9
(2)
Secured loan portfolio as a percentage of total loan portfolio, gross (%)
2
92.7
92.9
Impaired loan portfolio as a percentage of total loan portfolio, gross (%)
2,6
0.9
1.1
1 Comparatives may differ as a result of adjustments following organizational changes, restatements due to the retrospective adoption of new accounting standards or changes in accounting policies, and events after
the reporting period. 2 Refer to “Alternative performance measures” in the appendix to this report for the definition and calculation method. 3 Refer to the “Capital, liquidity and funding, and balance sheet”
section of this report for more information. 4 The leverage ratio denominator calculated as of the respective date in 2020 does not reflect the effects of the temporary exemption that applied from 25 March 2020
until 1 January 2021 and was granted by FINMA in connection with COVID -19. Refer to the “Regulatory and legal developments” section of our Annual Report 2020 for more information. 5 In 2021, 86.4% of
clients of Personal Banking were “activated users” of Digital Banking (i.e., clients who had logged into Digital Banking at least once in the course of their relationship with UBS). 6 Refer to the “Risk management
and control” section of this report for more information about (credit-)impaired exposures.
Financial and operating performance | Asset Management
90
Asset Management
Asset Management
1
As of or for the year ended
% change from
USD million, except where indicated
31.12.21
31.12.20
31.12.20
Results
Net management fees
2
2,320
1,950
19
Performance fees
260
455
(43)
Net gain from disposal of an associate / a subsidiary
37
571
(93)
Credit loss (expense) / release
(1)
(2)
Total operating income
2,616
2,974
(12)
Total operating expenses
1,586
1,519
4
Business division operating profit / (loss) before tax
1,030
1,455
(29)
Performance measures and other information
Average attributed equity (USD billion)
3
2.0
2.0
1
Return on attributed equity (%)
3,4
51.8
74.2
Pre-tax profit growth (year-on-year, %)
4
(29.2)
173.6
Cost / income ratio (%)
4
60.6
51.0
Risk-weighted assets (USD billion)
3
6.9
6.9
(1)
Leverage ratio denominator (USD billion)
3,5
2.9
5.8
(51)
Goodwill and intangible assets (USD billion)
1.2
1.2
(2)
Net margin on invested assets (bps)
4
9
16
(42)
Gross margin on invested assets (bps)
4
23
32
(29)
Information by business line / asset class
Net new money (USD billion)
4
Equities
10.3
65.1
Fixed Income
22.7
7.3
of which: money market
(3.1)
(7.4)
Multi-asset & Solutions
6.8
6.6
Hedge Fund Businesses
5.7
(1.1)
Real Estate & Private Markets
(0.6)
2.3
Total net new money
44.9
80.1
of which: net new money excluding money market
48.0
87.5
Invested assets (USD billion)
4
Equities
580
506
15
Fixed Income
285
274
4
of which: money market
92
97
(5)
Multi-asset & Solutions
193
172
12
Hedge Fund Businesses
55
48
15
Real Estate & Private Markets
98
93
5
Total invested assets
1,211
1,092
11
of which: passive strategies
540
457
18
Information by region
Invested assets (USD billion)
4
Americas
287
254
13
Asia Pacific
190
181
5
Europe, Middle East and Africa (excluding Switzerland)
334
294
14
Switzerland
399
363
10
Total invested assets
1,211
1,092
11
Information by channel
Invested assets (USD billion)
4
Third-party institutional
707
648
9
Third-party wholesale
145
128
13
UBS’s wealth management businesses
359
316
13
Total invested assets
1,211
1,092
11
1 Comparatives may differ as a result of adjustments following organizational changes, restatements due to the retrospective adoption of new accounting standards or changes in accounting policies, and events after
the reporting period. 2 Net management fees include transaction fees, fund administration revenues (including net interest and trading income from lending activities and foreign exchange hedging as part of the
fund services offering), distribution fees, incremental fund-related expenses, gains or losses from seed money and co-investments, funding costs, the negative pass-through impact of third-party performance fees, and
other items that are not Asset Management’s performance fees. 3 Refer to the “Capital, liquidity and funding, and balance sheet” section of this report for more information. 4 Refer to “Alternative performance
measures” in the appendix to this report for the definition and calculation method. 5 The leverage ratio denominator calculated as of the respective date in 2020 does not reflect the effects of the temporary
exemption that applied from 25 March 2020 until 1 January 2021 and was granted by FINMA in connection with COVID-19. Refer to the “Regulatory and legal developments” section of our Annual Report 2020 for
more information.
91
2021 compared with 2020
Results
Profit before tax decreased by USD 425 million, or 29%, to
USD 1,030 million. This reflected a gain of USD 571 million from
the sale of a majority stake in Fondcenter AG (now Clearstream
Fund Centre AG) in the third quarter of 2020 and a gain of
USD 37 million related to the sale of our remaining minority
investment in Clearstream Fund Centre AG (previously Fondcenter
AG) to Deutsche Börse AG in the second quarter of 2021.
Excluding these gains, profit before tax increased by USD 109
million, or 12%, to USD 993 million, reflecting positive operating
leverage.
›
Refer to “Note 30 Changes in organization and acquisitions and
disposals of subsidiaries and businesses” in the “Consolidated
financial statements” section of this report for more information
about the aforementioned sales
Operating income
Total operating income decreased by USD 358 million, or 12%, to
USD 2,616 million. Excluding the aforementioned gains from
sales, total operating income increased by USD 176 million, or
7%.
Net management fees increased by USD 370 million, or 19%,
to USD 2,320 million on a higher average invested asset base,
reflecting a combination of a constructive market backdrop and
strong net new money generation.
Performance fees decreased by USD 195 million to USD 260
million, mainly in our Hedge Fund Businesses and our Equities
business, compared with the particularly
high levels of
performance fees in 2020.
Operating expenses
Total operating expenses increased by USD 67 million, or 4%, to
USD 1,586 million, mainly driven by higher personnel expenses
and foreign currency effects, partly offset by lower general and
administrative expenses.
Cost / income ratio
The cost / income ratio was 60.6%, compared with 51.0% in
2020. Excluding the aforementioned gains from sales, the cost /
income ratio was 61.5%, compared with 63.2% in 2020.
Invested assets
Invested assets increased to USD 1,211 billion from USD 1,092
billion, reflecting positive market performance of USD 102 billion
and net new money inflows of USD 45 billion, partly offset by
negative foreign currency effects of USD 28 billion. Excluding
money market flows, net new money was USD 48 billion.
Investment performance
2021 saw risk assets perform strongly and subdued market
volatility. Expansive monetary policy supported a continued,
broad economic recovery across the globe. Shortages in supplies
to meet heightened global demand led to higher energy prices
and strong inflation over the year, and central banks, led by the
US Federal Reserve, started to reconsider their future monetary
policy.
As of year-end 2021, Morningstar assigned a four- or five-star
rating to 64% of our retail and institutional funds (both actively
managed and passive), on an assets under management (AuM)-
weighted basis. Furthermore, 55% of our actively managed open-
ended retail funds and actively managed institutional AuM (which
account in total for 44% of our relevant AuM) are ranked, on an
AuM-weighted basis over a three-year investment period, above
their respective peer median.
Investment performance as of 31 December 2021
In %
Total traditional
investments
Equities
Fixed income
Multi-asset
% of UBS Asset Management fund assets rated as 4- or 5-star
1,2
64
66
65
49
% of UBS Asset Management above peer median over a 3-year investment period
2,3
55
48
61
65
1 Percentage of AuM to which Morningstar has assigned a four- or five-star rating. AuM reflect the AuM of Asset Management’s retail and institutional funds (both actively managed and passive) across all domiciles
for which Asset Management owns the investment performance, i.e., Asset Management is either the sole portfolio manager or co-portfolio manager. Source: Morningstar (Morningstar® Essentials Quantitative Star
Rating & Rankings; © 2022 Morningstar). Universe is approximately 31% of all active and passive traditional assets of Asset Management (Equities, Fixed Income excluding money market, and Multi-asset) as of
31
December 2021. 2 Morningstar® Essentials Quantitative Star Rating & Rankings; © 2022 Morningstar. All Rights Reserved. The information contained herein: (i) is proprietary to Morningstar and / or its content
providers; (ii) may not be copied or distributed; and (iii) is not warranted to be accurate, complete or timely. Neither Morningstar nor its content providers are responsible for any damages or losses arising from any
use of this information. Past
performance is no guarantee of future results. For more detailed information about the Morningstar Rating, including its meth
odology, refer to:
https://s21.q4cdn.com/198919461/files/doc_downloads/othe_disclosure_materials/MorningstarRatingforFunds.pdf. 3 Percentage of AuM above peer median over a three-year investment period. AuM reflect the
AuM of Asset Management’s actively managed open-ended retail funds across all domiciles and actively managed institutional AuM for which Asset Management owns the investment performance, i.e., Asset
Management is either the sole portfolio manager or co-portfolio manager. Source: Morningstar (Morningstar® Essentials Quantitative Star Rating & Rankings; © 2022 Morningstar) extract date 11 January 2022,
eVestment extract date 4 February 2022, KGAST extract date 4 February 2022. Universe is approximately 44% of all active traditional assets of Asset Management (Equities, Fixed Income excluding money market,
and Multi-asset) as of 31 December 2021.
Financial and operating performance | Investment Bank
92
Investment Bank
Investment Bank
1
As of or for the year ended
% change from
USD million, except where indicated
31.12.21
31.12.20
31.12.20
Results
Advisory
988
634
56
Capital Markets
2,170
1,744
24
Global Banking
3,158
2,378
33
Execution Services
2
1,894
1,857
2
Derivatives & Solutions
3,422
3,609
(5)
Financing
979
1,674
(42)
Global Markets
6,296
7,141
(12)
of which: Equities
4,581
4,502
2
of which: Foreign Exchange, Rates and Credit
1,715
2,638
(35)
Income
9,454
9,519
(1)
Credit loss (expense) / release
34
(305)
Total operating income
9,488
9,214
3
Total operating expenses
6,858
6,732
2
Business division operating profit / (loss) before tax
2,630
2,482
6
Performance measures and other information
Pre-tax profit growth (year-on-year, %)
3
5.9
216.6
Average attributed equity (USD billion)
4
13.0
12.6
3
Return on attributed equity (%)
3,4
20.3
19.7
Cost / income ratio (%)
3
72.5
70.7
Risk-weighted assets (USD billion)
4
92.2
94.3
(2)
Return on risk-weighted assets, gross (%)
3
10.0
10.0
Leverage ratio denominator (USD billion)
4,5
319.2
315.5
1
Return on leverage ratio denominator, gross (%)
3,5
2.9
3.1
Goodwill and intangible assets (USD billion)
0.1
0.2
(14)
Average VaR (1-day, 95% confidence, 5 years of historical data)
11
12
(9)
1 Comparative figures in this table may differ as a result of adjustments following organizational changes, restatements due to the retrospective adoption of new accounting standards or changes in accounting
policies, and events after the reporting period. 2 Execution & Platform, which was disclosed in previous periods, has been renamed Execution Services. 3 Refer to “Alternative performance measures” in the
appendix to this report for the definition and calculation method. 4 Refer to the “Capital, liquidity and funding, and balance sheet” section of this report for more information. 5 The leverage ratio denominators
calculated as of the respective dates in 2020 do not reflect the effects of the temporary exemption that applied from 25 March 2020 until 1 January 2021 and was granted by FINMA in connection with COVID-19.
Refer to the “Regulatory and legal developments” section of our Annual Report 2020 for more information.
93
2021 compared with 2020
Results
Profit before tax
increased by USD
14
8
million, or 6%, to
USD 2,630 million, driven by higher operating income, partly
offset by higher operating expenses.
Operating income
Total operating income increased by USD 274 million, or 3%, to
USD 9,488 million, reflecting higher revenues in Global Banking
and net credit loss releases compared with net credit loss expenses
in 2020, partly offset by lower revenues in Global Markets.
Global Banking
Global Banking revenues increased by USD 780 million, or 33%,
to USD 3,158 million, driven by Capital Markets and Advisory
revenues, and compared with an overall global fee pool increase
of 39%.
Advisory revenues increased by USD 354 million, or 56%, to
USD 988 million, largely due to higher revenues from an increased
number of merger and acquisition transactions that closed in
2021, and compared with a 64% increase in the global fee pool.
Capital Markets revenues increased by USD 426 million, or
24%, to USD 2,170 million, mainly reflecting a USD 358 million,
or 52%, increase in Equity Capit
al Markets
(ECM)
revenues,
compared with an increase in the global ECM fee pool of 34%.
Global Markets
Global Markets revenues decreased by USD 845 million, or 12%,
to USD 6,296 million, driven by lower revenues in our Financing
and Derivatives & Solutions businesses, partly offset by higher
revenues in Execution Services.
Execution Services revenues increased by USD 37 million, or
2%, to USD 1,894 million. Revenue increases in cash equities
were partly offset by decreases from other products.
Derivatives & Solutions revenues decreased by USD 187
million, or 5%, to USD 3,422 million, mainly due to the third
quarter of 2020 including a USD 215 million gain from the sale of
intellectual property rights associated with the Bloomberg
Commodity Index family. Excluding that gain, revenues increased
by USD 28 million, or 1%.
Financing revenues decreased by USD 695 million, or 42%, to
USD 979 million, predominantly due to an USD 861 million loss
incurred in the first half of 2021 on the default of a US-based
client of our prime brokerage business. Excluding that loss,
revenues increased by USD 166 million, or 10%.
›
Refer to “Note 21 Fair value measurement” in the “Consolidated
financial statements” section of this report for more information
about the loss in the prime brokerage business
Global Markets Equities revenues increased by USD 79 million,
or 2%, to USD 4,581 million. Equity derivatives and cash equities
products revenues increased, while Financing revenues included
the aforementioned loss in our prime brokerage business.
Global Markets Foreign Exchange, Rates and Credit revenues
decreased by USD 923 million, or 35%, to USD 1,715 million,
compared with strong revenues in 2020.
Credit loss expense / release
Net credit loss releases were USD 34 million, primarily related to
stage 1 and 2 positions, resulting from model updates, as well as
a partial net release of a post-model adjustment during the year.
Prior-year net credit loss expenses were USD 305 million, driven
by the effects of the COVID-19 pandemic.
Operating expenses
Total operating expenses increased by USD 126 million, or 2%, to
USD 6,858 million, largely driven by foreign currency effects.
Cost / income ratio
The cost / income ratio increased to 72.5% from 70.7%, as
income decreased by 1% compared with a strong prior year, and
operating expenses increased by 2%.
Risk-weighted assets
Risk-weighted assets (RWA) decreased by USD 2 billion, or 2%, to
USD 92 billion, primarily due to a USD 3 billion decrease in
operational risk RWA and a USD 1 billion decrease in market risk
RWA, partly offset by a USD 2 billion increase in credit risk RWA
due to higher loans and loan commitments.
›
Refer to the “Capital, liquidity and funding, and balance sheet”
section of this report for more information
Leverage ratio denominator
The leverage ratio denominator increased by USD 4 billion, or 1%,
to USD 319 billion, mainly reflecting a USD 9 billion increase in
on
-
balance sheet exposures
,
partly offset by a USD
4
billion
decrease in derivative and securities financing transaction
exposures.
›
Refer to the “Capital, liquidity and funding, and balance sheet”
section of this report for more information
Financial and operating performance | Group Functions
94
Group Functions
Group Functions
1
As of or for the year ended
% change from
USD million, except where indicated
31.12.21
31.12.20
31.12.20
Results
Total operating income
(360)
(494)
(27)
Total operating expenses
330
567
(42)
Operating profit / (loss) before tax
(689)
(1,060)
(35)
of which: Group Treasury
(446)
(341)
31
of which: Non-core and Legacy Portfolio
(79)
(269)
(71)
of which: Group Services
(165)
(450)
(63)
Additional information
Risk-weighted assets (USD billion)
2
30.1
28.7
5
Leverage ratio denominator (USD billion)
2,3
104.0
96.2
8
1 Comparatives may differ as a result of adjustments following organizational changes, restatements due to the retrospective adoption of new accounting standards or changes in accounting policies, and events after
the reporting period. 2 Refer to the “Capital, liquidity and funding, and balance sheet” section of this report for more information. 3 The leverage ratio denominator calculated as of the respective date in 2020
does not reflect the effects of the temporary exemption that applied from 25 March 2020 until 1 January 2021 and was granted by FINMA in connection with COVID -19. Refer to the “Regulatory and legal
developments” section of our Annual Report 2020 for more information.
2021 compared with 2020
Results
Group Functions recorded a loss before tax of USD 689 million,
compared with a loss of USD 1,060 million.
Group Treasury
The Group Treasury result was negative USD 446 million,
compared with negative USD 341 million.
Income from accounting asymmetries, including hedge
accounting ineffectiveness, was net negative USD 341 million,
compared with net positive of USD 6 million.
Revenues related to centralized Group Treasury risk
management services were negative USD 63 million, compared
with negative USD 279 million. The increased expense in 2020
was driven by additional liquidity costs related to COVID-19
market stress in the first half of that year.
Operating expenses decreased by USD 30 million to USD 42
million.
Non-core and Legacy Portfolio
The Non-core and Legacy Portfolio result was negative USD 79
million, compared with negative USD 269 million. This result was
partly due to valuation gains of USD 58 million on our USD 1.6
billion portfolio of auction rate securities (ARS), compared with
valuation losses of USD 9 million in 2020. Our remaining
exposures to ARS were all rated investment grade as of
31 December 2021. In addition, 2021 included income of USD 51
million related to a legacy bankruptcy claim, while 2020 included
a credit loss expense of USD 42 million on an energy-related
exposure.
Group Services
The Group Services result was negative USD 165 million,
compared with negative USD 450 million. There were lower
expenses relating to our legal entity transformation program and
decreased funding costs on deferred tax assets. Also, 2020
included real estate costs of USD 72 million related to early lease
terminations and associated provisions, an impairment of
internally generated software of USD 67 million, and expenses of
USD 54 million related to the modification of certain outstanding
deferred compensation awards.
›
Refer to the “Group performance” section and “Note 1b Changes
in accounting policies, comparability and other adjustments” in
the “Consolidated financial statements” section of this report for
more information about the modification of deferred
compensation awards
95
Selected financial information of our business
divisions and Group Functions
Performance of our business divisions and Group Functions
1
For the year ended 31.12.21
USD million
Global Wealth
Management
Personal &
Corporate
Banking
Asset
Manage-
ment
Investment
Bank
Group
Functions
Total
Operating income
of which: gain from the sale of UBS’s domestic wealth management business in Austria
100
100
Operating expenses
of which: net restructuring expenses
Operating profit / (loss) before tax
For the year ended 31.12.20
USD million
Global Wealth
Management
Personal &
Corporate
Banking
Asset
Manage-
ment
Investment
Bank
Group
Functions
Total
Operating income
of which: net gain from the sale of a majority stake in Fondcenter AG
60
571
631
of which: gain on the sale of intellectual property rights
215
215
of which: net gains from properties sold or held for sale
64
64
of which: valuation gain on auction rate securities in the fourth quarter of 2020
134
134
of which: gain related to investment in associates
6
19
26
of which: gain on the sale of equity investment measured at fair value through profit or loss
4
18
22
Operating expenses
of which: acceleration of expenses in relation to outstanding deferred compensation awards in
the third quarter of 2020
46
3
22
229
58
359
of which: expenses associated with terminated real estate leases
72
72
of which: impairment of internally generated software
67
67
of which: net restructuring expenses
Operating profit / (loss) before tax
For the year ended 31.12.19
USD million
Global Wealth
Management
Personal &
Corporate
Banking
Asset
Manage-
ment
Investment
Bank
Group
Functions
Total
Operating income
of which: net foreign currency translation losses
(35)
(35)
of which: net losses from properties held for sale
(29)
(29)
Operating expenses
of which: impairment of goodwill
110
110
of which: net restructuring expenses
Operating profit / (loss) before tax
1 The components of operating income and operating expenses disclosed in this table are items that are not recurring or necessarily representative of the underlying business performance for the reporting period
specified. 2 Includes curtailment gains of USD 80 million, which represent a reduction in the defined benefit obligation related to the Swiss pension plan resulting from a decrease in headcount following restructuring
activities. 3 Reflects a valuation gain recognized in the fourth quarter of 2020 as a result of a recovery in underlying market conditions, following a change in valuation methodology. This gain was more than offset
by valuation losses recognized earlier in the year. 4 Reflects the accelerated expense recognized in the third quarter of 2020 when the conditions for continued vesting of certain outstanding deferred compensation
awards were modified. This amount includes approximately USD 80 million of accelerated expense that would otherwise have been recognized in the fourth quarter of 2020. The full year effect was an expense of
approximately USD 280 million (Global Wealth Management: USD 30 million, Asset Management: USD 10 million, Investment Bank: USD 180 million, Group Functions: USD 60 million). 5 Relates to impairment of
internally generated software resulting from a decision in the fourth quarter of 2020 to not proceed with an internal busines s transfer from UBS Switzerland AG to UBS AG. 6 Relates to the disposal or closure of
foreign operations.
Risk, capital,
liquidity and
funding, and
balance sheet
Management report
3
Audited information according to IFRS 7 and IAS 1
Risk and capital disclosures provided in line with the requirements of
International Financial Reporting Standard 7 (IFRS 7),
Financial
Instruments: Disclosures,
and International Accounting Standard 1 (IAS 1),
Presentation of
Financial Statements,
form part of the
financial statements included in the “Consolidated financial statements” section of this report and audited by the independent
registered public accounting firm Ernst & Young Ltd, Basel. This information is marked as “Audited” within this section of the report.
The risk profile of UBS AG consolidated does not differ materially from that of UBS Group AG consolidated. Audited information
provided in the “Risk management and control” and “Capital, liquidity and funding, and balance sheet” sections applies to both UBS
Group AG consolidated and UBS AG consolidated.
Signposts
The
Audited |
signpost that is displayed at the beginning of a section, table or chart indicates that those items have been audited. A triangle symbol –
p
indicates the end of the audited section, table or chart.
Risk management
and control
Table of contents
99
100
102
103
105
108
109
110
113
131
140
143
147
99
Risk management and control
Overview of risks arising from our business activities
The scale of our activities depends on the capital available to cover
risks, the size of our on- and off-balance sheet assets via their
contribution to our capital, leverage and liquidity ratios, and our
risk appetite.
Despite our credit book growing over the course of 2021, our
overall credit risk profile was broadly unchanged
,
and we
continued to manage market risks at generally low levels.
Operational resilience, conduct and the prevention of financial
crime remain key focus topics.
Key risks by business division and Group Functions
Business divisions and Group Functions
Key risks arising from business activities
Global Wealth Management
Credit risk
against residential and commercial real estate collateral, as well as corporate and other lending
Market risk
Personal & Corporate Banking
Credit risk
finance, lending to banks and other regulated clients, as well as a small amount of derivatives trading
activity
Minimal contribution to
market risk
Asset Management
Small amounts of credit and market risk for on-balance sheet items
Investment Bank
Credit risk
trading and securities financing
Market risk
Group Functions
Credit
market risk
and liquidity portfolios
Non-financial risks,
in business and can arise as a result of our past and current business activities across all business divisions and Group Functions.
Risk, capital, liquidity and funding, and balance sheet | Risk management and control
100
Risk categories
We categorize the risk exposures of our business divisions and Group Functions as outlined in the table below. Our risk appetite
framework is designed to capture all risk categories.
›
Refer to “Risk appetite framework” in this section for more information
Risk managed by
Independent
oversight by
Financial risks
Audited |
Credit risk:
contractual obligations toward UBS. This includes settlement risk, loan underwriting risk and step-in risk.
Settlement risk:
security versus cash) where we must deliver without first being able to determine with certainty that
we will receive the countervalue.
Loan underwriting risk:
that are intended for further distribution.
Step-in risk:
that is facing stress in the absence of, or in excess of, any contractual obligations to provide such
support.
p
Business management
Risk Control
Audited |
Market risk
market variables. Market variables include observable variables, such as interest rates, foreign exchange
rates, equity prices, credit spreads and commodity (including precious metal) prices, as well as variables
that may be unobservable or only indirectly observable, such as volatilities and correlations. Market risk
includes issuer risk and investment risk.
Issuer risk:
an issuer to which we are exposed through tradable securities or derivatives referencing the issuer.
Investment risk:
p
Business management
and Group Treasury
Risk Control
Country risk:
involves a country’s authorities preventing or restricting the payment of an obligation, as well as
systemic risk events arising from country-specific political or macroeconomic developments.
Business management
Risk Control
Sustainability and climate risk
(previously known at UBS as environmental and social risk): the risk
that UBS is negatively impacted by or negatively impacts climate change, loss of biodiversity, human
rights infringements, or other environmental, social or governance (ESG) matters. Climate risks can arise
from either changing climate conditions (physical risks) or from efforts to mitigate climate change
(transition risks). Sustainability and climate risks may manifest as credit, market, liquidity and operational
risks for UBS, resulting in potential adverse financial, liability and reputation impacts. They may also
negatively impact the value of investments.
Business management
Risk Control
Treasury risk:
of insufficient funding or liquidity.
Group Treasury
Risk Control
Audited |
Liquidity risk:
unexpected current and forecast cash flows and collateral needs without affecting either daily
operations or the financial condition of the firm.
p
Audited |
Funding risk:
the market on an unsecured (or even secured) basis at an acceptable price to fund actual or
proposed commitments; i.e., the risk that UBS’s funding capacity is not sufficient to support the
firm’s current business and desired strategy.
p
Structural foreign exchange risk:
exchange rates with an adverse translation effect on capital held in currencies other than the US
dollar.
Pension risk:
from decreases in the fair value of assets held in defined benefit pension funds and / or changes in
the value of defined benefit pension obligations due to changes in actuarial assumptions (e.g.,
discount rate, life expectancy, rate of pension increase, etc.) and / or changes to plan designs.
Group Treasury and
Human Resources
Risk Control
and Finance
Business risk:
and / or margins, to the extent they are not offset by a decrease in expenses.
Business management
Finance and Risk Control
101
Risk managed by
Independent
oversight by
Non-financial risks
Operational risk:
from external causes (deliberate, accidental or natural), that have an impact (either financial or non-
financial) on UBS, its clients or the markets in which it operates. Events may be direct financial losses or
indirect, in the form of revenue forgone as a result of business suspension. They may also result in
damage to our reputation and to our franchise that has longer-term financial consequences.
Business management
Group Compliance,
Regulatory &
Governance (GCRG)
Legal risk:
a breach of applicable laws, rules or regulations; (ii) being held liable for a breach of contractual or
other legal obligations; (iii) an inability or failure to enforce or protect contractual rights or non-
contractual rights sufficiently to protect UBS’s interests, including the risk of being party to a claim in
respect of any of the above (and the risk of loss of attorney–client privilege in the context of any such
claim); (iv) a failure to adequately develop, supervise and resource legal teams or adequately supervise
external legal counsel advising on business legal risk and other matters; and (v) a failure to adequately
manage any potential, threatened and commenced litigation and legal proceedings, including civil,
criminal, arbitration and regulatory proceedings, and / or litigation risk or any dispute or investigation
that may lead to litigation or threat of any litigation.
Legal
Employment risk:
regulatory requirements and human resources practices, as well as our own internal standards. Such
risk is managed by business management, with independent overview by Human Resources.
Human Resources
Cybersecurity and information security risk:
to a material impact on confidentiality, integrity or availability of UBS data or information systems.
Cyberattacks are manifestations of a cyber threat into an act of aggression or criminal activity causing
financial, regulatory or reputational harm or loss.
Business management
and Chief Digital and
Information Office
(CDIO)
GCRG
Conduct risk:
counterparties, undermines the integrity of the financial system or impairs effective competition to the
detriment of consumers.
Business management
GCRG
Compliance risk:
regulations, and our own internal standards.
Business management
GCRG
Financial crime risk:
theft and fraud, money laundering, bribery and corruption, and fails to comply with sanctions and
embargoes, or fails to report or respond to requests from relevant authorities related to these matters.
Business management,
Financial Crime
Prevention (FCP), and
GCRG COO
GCRG
Model risk:
business and / or strategic decision making, or damage to the firm’s reputation) resulting from decisions
based on incorrect or misused model outputs and reports. Model risk may result from a number of
sources: inputs, methodology, implementation or use.
Model owner
Risk Control
Reputational risk:
such as clients, shareholders and staff, and the general public.
All businesses and
functions
All control functions
Risk, capital, liquidity and funding, and balance sheet | Risk management and control
102
Top and emerging risks
The top and emerging risks disclosed below reflect those that we
currently think have the potential to materialize within one year
and which could significantly affect the Group. Investors should
also carefully review all information set out in the “Risk factors”
section of this report, where we discuss these and other material
risks that we consider could have an effect on our ability to
execute our strategy and may affect our business activities,
financial condition, results of operations and business prospects.
–
The COVID-19 pandemic, and its impact on growth,
employment, debt dynamics and supply chains, remains an
important driver of risk, and we expect this to be the case for
at least the near future. The Omicron variant continues to
spread, and there is
uncertainty about when restrictions
introduced in many countries will be eased.
–
There continue to be concerns regarding a resurgence in global
inflation, and the timing and extent of central bank policy
responses (i.e., interest rate hikes and the tapering of
quantitative easing) will be an area of focus in the coming
months. There are related concerns about increasing energy
and other commodity prices in a number of countries, while
mounting global supply chain stresses and tight labor markets
are creating negative pressure on growth. China is facing
several challenges, including a slowing economy following the
post-pandemic boom.
–
We remain watchful of a range of geopolitical developments
in Europe and Asia and political changes in a number of
countries. Our current focus is on the Russian invasion of
Ukraine. Our current direct exposure to Russia, Ukraine and
Belarus is limited, as is our exposure to peripheral European
countries
.
However,
market closures, the imposition of
exchange controls, sanctions or other measures may limit our
ability to settle existing transactions or to realize on collateral,
which may result in unexpected increases in exposures. In
addition, we have significant country risk exposure to major
economies, which could also be affected, including the US,
China, Switzerland, Germany, the UK and France.
–
We are exposed to a number of macroeconomic issues, as well
as general market conditions. As noted in “Market, credit and
macroeconomic risks” in the “Risk factors” section of this
report, these external pressures may have a significant adverse
effect on our business activities and related financial results,
primarily through reduced margins and revenues, asset
impairments and other valuation adjustments. Accordingly,
these macroeconomic factors are considered in the
development of stress testing scenarios for our ongoing risk
management activities.
–
We are exposed to substantial changes in the regulation of our
businesses that could have a material adverse effect on our
business, as discussed in the “Regulatory and legal
developments” section of this report and in “Regulatory and
legal risks” in the “Risk factors” section of this report.
–
As a global financial services firm, we are subject to many
different legal, tax and regulatory regimes and extensive
regulatory oversight. We are exposed to significant liability risk,
and we are subject to various claims, disputes, legal
proceedings and government investigations, as noted in
“Regulatory and legal risks” in the “Risk factors” section of
this report. Information about litigation, regulatory and similar
matters we consider significant is disclosed in “Note 18
Provisions and contingent liabilities” in the “Consolidated
financial statements” section of this report.
–
Cyber threats continue to evolve at pace, not least due to the
Russian invasion of Ukraine, and can impact the industry, as
well as critical infrastructure which it relies on. More recently,
ransomware attacks with a possible widespread impact have
increased significantly. Additionally, as a result of the
operational complexity of all our businesses, we are continually
exposed to operational resilience scenarios such as process
error, failed execution, system failures and fraud.
–
Conduct risks are inherent in our businesses. Achieving fair
outcomes for our clients, upholding market integrity and
cultivating the highest standards of employee conduct are of
critical importance to UBS. Management of conduct risks is an
integral part of our risk management framework.
–
Financial crime
–
including money laundering, terrorist
financing, sanctions violations, fraud, bribery and corruption –
presents significant risk. Heightened regulatory expectations
and attention require investment in people and systems, while
emerging technologies and changing geopolitical risks further
increase the complexity of identifying and preventing financial
crime
.
Refer to “Non
-
financial risk” in this
section and
“Strategy, management and operational risks” in the “Risk
factors” section of this report for more information.
–
Environmental, social and governance (ESG) risks are a growing
area of focus for regulators
and other stakeholders
, in
particular climate risks and concerns about greenwashing,
where UBS may be subject to reputational risk if not fully
aligned with the stated purpose of the firm. New standards
and rules are developing in several jurisdictions with the risk of
divergent rules increasing and leading to an increased risk that
UBS may not comply with all relevant regulations. Refer to
“Non-financial risk” in this section.
103
Risk governance
Our risk governance framework operates along three lines of
defense.
Our first line of defense, business management, owns its risk
exposures and is accountable for maintaining effective processes
and systems to manage its risks in compliance with applicable
laws, external regulations and internal requirements, including
identifying control weaknesses and inadequate processes.
Our second line of defense, control functions, is separate from
the business and reports directly to the Group CEO. Control
functions provide independent oversight, challenge financial and
non-financial risks arising from the firm’s business activities, and
establish independent frameworks for risk assessment,
measurement, aggregation and reporting, protecting against
non-compliance with applicable laws and regulations.
Our third line of defense, Group Internal Audit, reports to the
Chairman and to the Audit Committee. This function assesses the
design and operating effectiveness and sustainability of processes
to define risk appetite, governance, risk management, internal
controls, remediation activities and processes to comply with legal
and regulatory requirements and internal governance
requirements.
The key roles and responsibilities for risk management and
control are shown in the chart below and described on the
following pages.
Risk, capital, liquidity and funding, and balance sheet | Risk management and control
104
Audited |
The
Board of Directors
management and control framework of the Group, including the
Group and business division overall risk appetite. The BoD is
supported by its Risk Committee, which monitors and oversees
the Group’s risk profile and the implementation of the risk
framework approved by the BoD, and approves the Group’s risk
appetite methodology. The Corporate Culture and Responsibility
Committee (the CCRC) helps the BoD meet its duty to safeguard
and advance UBS’s reputation for responsible and sustainable
conduct, reviewing stakeholder concerns and expectations
pertaining to UBS’s societal contribution and corporate culture.
The Audit Committee assists the BoD with its oversight duty
relating to financial reporting and internal controls over financial
reporting, and the effectiveness of whistleblowing procedures
and the external and internal audit functions.
The
Group
Executive Board
for establishing and implementing a risk management and control
framework in the Group, managing the risk profile of the Group
as a whole.
The
Group Chief Executive Officer
has responsibility and
accountability for the management and performance of the Group,
has risk authority over transactions, positions and exposures, and
allocates business divisions and Group Functions risk limits
approved by the BoD.
The
business division Presidents
and
are
responsible for the operation and management of their business
divisions, including controlling the dedicated financial resources
and risk appetite of the business division.
The
regional Presidents
are responsible for cross
-
divisional
collaboration in their regions and are mandated to inform the GEB
about any activities / issues that may give rise to actual or
potentially material regulatory or reputational concerns.
The
Group Chief Risk Officer
for developing the Group’s risk management and control
framework (including risk principles and risk appetite) for credit,
market, country, treasury, model and sustainability and climate
risks. This includes risk measurement and aggregation, portfolio
controls and risk reporting. The Group CRO sets risk limits and
approves credit and market risk transactions and exposures. Risk
Control is also the central function for model risk management
and control for all models used in UBS. A framework of policies
and authorities support the risk control process.
The
Group Chief Compliance and Governance Officer
is
responsible for developing the Group’s operational risk
framework, which sets the general requirements for
identification, management, assessment and mitigation of
operational risk, and for ensuring that all non-financial risks are
identified, owned and managed according to the operational risk
appetite objectives, supported by an effective control framework.
The
Group Chief Financial Officer
is responsible for
transparency in assessing the financial performance of the Group
and the business divisions, and for managing the Group’s financial
accounting, controlling, forecasting, planning and reporting.
Additional responsibilities include managing UBS’s tax affairs, as
well as treasury and capital management, including funding and
liquidity risk and UBS’s regulatory capital ratios.
The
Group General Counsel
Group’s legal affairs (including litigation involving UBS), ensuring
effective and timely assessment of legal matters impacting the Group
or its businesses, and managing and reporting all litigation matters.
The
Head of Human Resources
oversight and challenge of employment-related risks.
Group Internal Audit
(GIA) independently assesses the
effectiveness of processes to define strategy and risk appetite and
overall adherence to the approved strategy. It also assesses the
effectiveness of governance processes and risk management,
including compliance with legal and regulatory requirements and
internal governance documents. The Head GIA reports to the
Chairman of the BoD. GIA also has a functional reporting line to
the BoD Audit Committee.
Some of these roles and responsibilities are replicated for
certain significant legal entities of the Group. The
legal entity risk
officers
financial and non-financial risks for certain significant legal
entities of the Group as part of the legal entity control framework,
which complements the Group’s risk management and control
framework.
p
105
Risk appetite framework
We have a defined Group-level risk appetite, covering all financial and non-financial risk types, via a complementary set of qualitative and
quantitative risk appetite statements. This is reviewed and recalibrated annually and presented to the BoD for approval.
Our risk appetite is defined at the aggregate Group level and
reflects the types of risk that we are willing to accept or avoid. It
is set via complementary qualitative and quantitative risk appetite
statements defined at a firm-wide level and is embedded
throughout our business divisions and legal entities by Group,
business division and legal entity policies, limits and authorities.
We are subject to consolidated supervision by the Swiss Financial
Market Supervisory Authority (FINMA) and related ordinances,
which impose, among other requirements, minimum standards
for capital, liquidity, risk concentration and internal organization.
Our risk appetite is reviewed and recalibrated annually, with the
aim of ensuring that risk-taking at every level of the organization
is in line with our strategic priorities, our capital and liquidity
plans, our
Pillars, Principles and
Behaviors
, and minimum
regulatory requirements. The “Risk appetite framework” chart
below shows the key elements of the framework, described in
detail in this section.
Qualitative risk appetite statements aim to ensure we maintain
the desired risk culture. Quantitative risk appetite objectives are
designed to enhance UBS’s resilience against the effect
s
of
potential severe adverse economic or geopolitical events. These
risk appetite objectives cover UBS’s minimum capital and leverage
ratios, solvency, earnings, liquidity, and funding, and are subject
to periodic review, including the yearly business planning process.
These objectives are complemented by operational risk
appetite objectives, which are set for each of our non-financial
risk categories, including market conduct, theft, fraud, data
confidentiality and technology risks. A standardized financial firm-
wide operational risk appetite has been established at Group level
and is embedded throughout our business divisions. Operational
risk events exceeding predetermined risk tolerances, expressed as
percentages of UBS’s operating income, must be escalated as per
the firm-wide escalation framework to the respective business
division President or higher, as appropriate.
The quantitative risk appetite objectives are supported by a
comprehensive suite of risk limits set at a portfolio level to monitor
specific portfolios and to control potential risk concentrations.
The status of risk appetite objectives is evaluated each month
and reported to the BoD and the GEB. As our risk appetite may
change over time, portfolio limits and associated approval
authorities are subject to periodic reviews and changes, particularly
in the context of our annual business planning process.
Our risk appetite framework is governed by a single overarching
policy and conforms to the Financial Stability Board’s Principles for
an Effective Risk Appetite Framework.
›
Refer to “Risk principles and risk culture” and “Quantitative risk
appetite objectives” on the following pages for more
information
Risk, capital, liquidity and funding, and balance sheet | Risk management and control
106
Risk principles and risk culture
Maintaining a strong risk culture is a prerequisite for success in
today’s highly complex operating environment and a source of
sustainable competitive advantage. Placing prudent and
disciplined risk-taking at the center of every decision has three
principal goals: delivering unrivaled client satisfaction; creating
long-term value for stakeholders; and making UBS one of the
world’s most attractive companies to work for.
Our risk appetite framework combines all the important
elements of our risk culture, expressed in our
Pillars, Principles and
Behaviors
, our risk management and control principles, our Code
of Conduct and Ethics, and our Total Reward Principles. Together,
these aim to align our decisions with the Group’s strategy,
principles and risk appetite. They help create a solid foundation
for promoting risk awareness, leading to appropriate risk-taking
and the establishing of robust risk management and control
processes. These principles are supported by a range of initiatives
covering employees at all levels, for example the
UBS House View
on Leadership
, which is a set of explicit expectations for leaders
that establishes consistent leadership standards across UBS.
Another example is our Principles of Good Supervision, which
establish clear expectations of managers and employees regarding
supervisory responsibilities, specifically: to take responsibility; to
know and organize their business; to know their employees and
what they do; to create a good risk culture; and to respond to and
resolve issues.
›
Refer to the foldout pages of this report for more information
about our Pillars, Principles and Behaviors
›
Refer to the Code of Conduct and Ethics of UBS at
ubs.com/code
for more information
Risk management and control principles
Protection of financial strength
Protecting UBS’s financial strength by controlling our risk exposure and avoiding potential risk
concentrations at individual exposure levels, at specific portfolio levels and at an aggregate firm-wide
level across all risk types
Protection of reputation
Protecting our reputation through a sound risk culture characterized by a holistic and integrated view of
risk, performance and reward, and through full compliance with our standards and principles, particularly
our Code of Conduct and Ethics
Business management accountability
Maintaining management accountability, whereby business management owns all risks assumed
throughout the Group and is responsible for the continuous and active management of all risk exposures
to provide for balanced risk and return
Independent controls
Independent control functions that monitor the effectiveness of the businesses’ risk management and
oversee risk-taking activities
Risk disclosure
Disclosure of risks to senior management, the BoD, investors, regulators, credit rating agencies and other
stakeholders with an appropriate level of comprehensiveness and transparency
Whistleblowing policies and procedures exist to support an
environment where staff are comfortable raising concerns. There
are multiple channels via which individuals may, either openly or
anonymously, escalate suspected breaches of laws, regulations,
rules and other legal requirements, our Code of Conduct and
Ethics, policies, or relevant professional standards. Our program is
designed to ensure that whistleblowing concerns are investigated
and that appropriate and consistent action is taken. We are
committed to ensuring appropriate training for and
communication to staff and legal entity representatives are
available on an ongoing basis, including with regard to new
regulatory requirements.
Mandatory training programs cover various compliance and
risk-related topics, including operational risk and anti-money
laundering. Additional specialized training is provided depending
on employees’ specific roles and responsibilities, e.g., credit risk
and market risk training for those working in trading areas. Failure
to complete mandatory training sessions within an appropriate
timeframe can lead to consequences, including disciplinary action.
Our operational risk and conduct risk frameworks aim to identify
and manage financial, regulatory and reputational risks, as well as
risks to clients and markets.
Quantitative risk appetite objectives
Our quantitative risk appetite objectives aim to ensure that our
aggregate risk exposure remains within desired risk capacity,
based on capital and business plans. The specific definition of risk
capacity for each objective is aimed at ensuring we have sufficient
capital, earnings, funding and liquidity to protect our businesses
and exceed minimum regulatory requirements under a severe
stress event. The risk appetite objectives are evaluated during the
annual business planning process and approved by the BoD. The
comparison of risk exposure with risk capacity is a key
consideration in decisions on potential adjustments to the
business strategy and risk profile of UBS and capital returns to
shareholders.
The annual business planning process reviews UBS’s business
strategy, assesses the risk profile our operations and activities
result in, and stress tests that risk profile. We use both scenario-
based stress tests and statistical risk measurement techniques to
assess effects of severe stress events at a firm-wide level. These
complementary frameworks capture exposures to all material risks
across our business divisions and Group Functions.
›
Refer to “Risk measurement” in this section for more
information about our stress testing and statistical stress
frameworks
107
Our risk capacity is underpinned by performance targets and
capital guidance as per our business plan. When determining our
risk capacity in case of a severe stress event, we estimate projected
earnings under stress, factoring in lower expected income and
also lower expenses. We also consider capital impacts under stress
from deferred tax assets, pension plan assets and liabilities, and
accruals for capital returns to shareholders.
Risk appetite objectives define the aggregate risk exposure
acceptable at the firm-wide level, given our risk capacity. The
maximum acceptable risk exposure is supported by a full set of
risk limits, triggers and targets, which are cascaded to businesses
and portfolios. These limits, triggers and targets aim to ensure
that our total risks remain in line with risk appetite.
Risk appetite statements at the business division level are
derived from the firm-wide risk appetite. They may also include
division-specific strategic goals related to that division’s activities
and risks. Risk appetite statements are also set for certain legal
entities, which must be consistent with the firm-wide risk appetite
framework and approved in accordance with Group and legal
entity regulations. Differences may exist that reflect the specific
nature, size, complexity and regulations applicable to the relevant
legal entity.
Risk, capital, liquidity and funding, and balance sheet | Risk management and control
108
Internal risk reporting
Comprehensive and transparent reporting of risks is central to our
risk governance framework’s control and oversight responsibilities
and required by our risk management and control principles.
Accordingly, risks are reported at a frequency and level of detail
commensurate with the extent and variability of the risk and the
needs of the various governance bodies, regulators and risk
authority holders.
The Group Risk Report provides a detailed qualitative and
quantitative monthly overview of developments in financial and
non-financial risks at the firm-wide level, along with breakdowns
of risks at the divisional level, including the status of our risk
appetite objectives and the results of firm-wide stress testing. The
Group Risk Report is distributed internally to the BoD and the GEB,
and senior members of Risk Control, GIA, Finance and Legal. Risk
reports are also produced for significant Group entities (entities
subject to enhanced standards of corporate governance) and
significant branches.
Granular divisional risk reports are provided to the respective
business division CROs and business division Presidents. This
monthly reporting is supplemented with daily or weekly reports,
at various levels of granularity, covering market and credit risks for
the business divisions to enable risk officers and senior
management to monitor and control the Group’s risk profile.
Our internal risk reporting covers financial and non-financial risks
and is supported by risk data and measurement systems that are
also used for external disclosure and regulatory reporting.
Dedicated units within Risk Control assume responsibility for
measurement, analysis and reporting of risk and for overseeing the
quality and integrity of risk-related data. Our risk data and
measurement systems are subject to periodic review by GIA,
following a risk-based audit approach.
109
Model risk management
Introduction
We rely on models to derive risk management and control
decisions, to measure risks or exposures, value instruments or
positions, conduct stress testing, assess adequacy of capital, and
manage clients’ assets and our own assets. Models may also be
used to measure and monitor compliance with rules and
regulations, for surveillance activities, or to meet financial or
regulatory reporting requirements.
Model risk is defined as the risk of adverse consequences (e.g.,
financial losses or reputational damage) resulting from incorrect
models.
Model governance framework
Our model governance framework establishes requirements for
identifying, measuring, monitoring, reporting, controlling and
mitigating model risks. All the models that we use are subject to
governance and controls throughout their life cycles. This is
designed to ensure that risks arising from model use are
identified, understood, managed, monitored, controlled and
reported on both a model-specific and an aggregated level.
Before they can be granted approval for use from the model
sponsor, all our models are independently validated across four
model risk dimensions: (i) model input; (ii) model methodology;
(iii) model implementation; and (iv) model use.
Once validated and approved for use, a model is subject to
ongoing model performance monitoring and annual model
confirmation, ensuring that the model is only used if it continues
to be found fit for purpose. All models are subject to periodic
model re-validation, with rigor, depth and frequency determined
by the model’s materiality and complexity.
Our model risk governance framework follows our overarching
risk governance framework, with the three lines of defense (LoD)
assigned as follows.
–
First LoD: model sponsors, model owners, model developers,
and model users
–
Second LoD: Chief Model Risk Officer, Model Risk
Management & Control
–
Third LoD: Group Internal Audit
An important difference as compared with how LoD are usually
defined in financial and non-financial risk is that some models are
owned by traditionally second LoD functions, such as risk control,
finance or compliance.
Model risk appetite framework and statement
The model risk appetite framework sets out the model risk
appetite statement, defines the relevant metrics and lays out how
appropriate adherence is assessed.
Model oversight
Model oversight committees and forums ensure that model risk is
overseen at different levels of the organization, appropriate
model risk management and control actions are taken and, where
necessary, escalated to the next level.
The Group Model Governance Committee is our most senior
oversight and escalation body for all models in scope of our model
governance framework. It is co-chaired by the Group CRO and
the Group CFO and is responsible for: (i) reviewing and approving
changes to the framework; (ii) approving the model risk appetite
statement; (iii) overseeing adherence to the UBS model risk
governance framework; and (iv) monitoring model risk at a firm-
wide level.
Risk, capital, liquidity and funding, and balance sheet | Risk management and control
110
Risk measurement
Audited |
to quantify the risks of our portfolios and potential risk
concentrations. Risks that are not fully reflected within standard
measures are subject to additional controls, which may include
preapproval of specific transactions and the application of specific
restrictions. Models to quantify risk are generally developed by
dedicated units within control functions and are subject to
independent validation.
p
›
Refer to “Credit risk,” “Market risk” and “Non-financial risk” in
this section for more information about model confirmation
procedures
Stress testing
We perform stress testing to estimate losses that could result from
extreme yet plausible macroeconomic and geopolitical stress
events to identify, better understand and manage our potential
vulnerabilities and risk concentrations. Stress testing has a key role
in our limits framework at the firm-wide, business division, legal
entity and portfolio levels. Stress test results are regularly reported
to the BoD and the GEB. As described in “Risk appetite
framework,” stress testing, along with statistical loss measures,
has a central role in our risk appetite and business planning
processes.
Our stress testing framework has three pillars: (i) combined
stress tests; (ii) an extensive set of portfolio- and risk type-specific
stress tests; and (iii) reverse stress testing.
Our
combined stress testing
and aims to quantify overall firm-wide losses that could result
from various potential global systemic events. The framework
captures all material risks, as covered in “Risk categories.”
Scenarios are forward-looking and encompass macroeconomic
and geopolitical stress events calibrated to different levels of
severity. We implement each scenario through the expected
evolution of market indicators and economic variables under that
scenario and then estimate the overall loss and capital
implications were the scenario to occur. At least once a year, the
Risk Committee approves the most relevant scenario, known as
the binding scenario, for use as the main scenario for regular CST
reporting and for monitoring risk exposure against our minimum
capital, earnings and leverage ratio objectives in our risk appetite
framework.
We provide detailed stress loss analyses to FINMA and
regulators of our legal entities in accordance with their
requirements.
Our Enterprise-wide Stress Forum (the ESF) aims to ensure the
consistency and adequacy of the assumptions and scenarios used
for firm-wide stress measures. As part of its responsibilities, the
ESF with input from the Think Tank, a panel of senior
representatives from the business divisions, Risk Control and
economic research, seeks to ensure that the set of stress scenarios
adequately reflects current and potential developments in the
macroeconomic and geopolitical environment, current and
planned business activities, and actual or potential risk
concentrations and vulnerabilities in our portfolios.
Each scenario captures a wide range of macroeconomic
variables, including GDP, equity prices, interest rates, foreign
exchange rates, commodity prices, property prices and
unemployment. We use assumed changes in these
macroeconomic and market variables in each scenario to stress
the key risk drivers of our portfolios. For example, lower GDP
growth and rising interest rates may reduce the income of clients
we have lent money to, which changes the credit risk parameters
for probability of default, loss given default and exposure at
default, and results in higher predicted credit losses within the
stress scenario. We also capture the business risk resulting from
lower fee, interest and trading income net of lower expenses.
These effects are measured for all businesses and material risk
types to calculate the aggregate estimated effect of the scenario
on profit or loss, other comprehensive income, RWA, LRD and,
ultimately, capital and leverage ratios. The assumed changes in
macroeconomic variables are updated periodically to account for
changes in the current and possible future market environment.
In 2021, the binding scenario for CST was the internal
Global
Crisis scenario
, which is characterized by a deterioration of global
economic conditions leading to sovereign defaults in Europe and
a global recession.
The scenario was updated over the course of
2021 to incorporate
current
risks related to
COVID
-
19
,
in
particular macroeconomic assumptions, such as deteriorating
GDP and rising unemployment
.
data and tensions between European countries about debt
mutualization undermines market confidence in the sustainability
of peripheral debt, leading to a sharp spike in bond yields. Italy,
Spain, Portugal and Cyprus receive bailout packages, on the
condition of substantial debt restructuring, while Greece leaves
the Eurozone. In addition to the effects of COVID-19, the
macroeconomic impact is severe, as is the immediate market
impact. Weak consumer and business confidence and a fall in
global trade as a result of protectionism lead to a global recession.
China is hit severely by trade protectionism and a confidence
shock, which lead to a hard landing
.
111
As part of the CST framework, we routinely monitored three
additional stress scenarios throughout 2021:
–
The
in the US, which leads to a sell-off of US dollar-denominated
assets, sparking an abrupt and substantial depreciation of the
US dollar. The US economy is hit hard, financial markets enter
a period of high volatility and other industrialized countries
replicate the cyclical pattern of the US. Regional inflation
trends diverge as the US experiences significant inflationary
pressures while other developed markets experience deflation.
–
The
scenario explores a
sharp and persistent rise in inflation leading to a significant rise
in long-term interest rates and a period of market turbulence.
Economic activity slows across the globe as both business and
household sentiment collapse, while credit conditions
deteriorate. Despite weakness in activity, inflation remains
stubbornly high, forcing central banks to begin hiking their
policy rates and thereby prolonging the weakness in economic
activity and asset prices.
–
The
scenario explores a resurgence of
COVID-19 and subsequent containment policies, which lead to
a severe global downturn with long-term scarring impacts. The
lack of adherence to containment measures leads to rapid
resurgences in the number of cases and fatalities, which force
countries to enforce increasingly stringent lockdown policies.
Vaccines prove to be ineffective in the near term, due to either
logistical constraints of vaccine distribution, vaccine hesitancy
or virus variants undermining the efficacy of current vaccines.
We have updated the binding stress scenario in our CST
framework for 2022. The updated Global Crisis scenario reflects
the weaker fiscal conditions resulting from the COVID-19
pandemic, which leads to sovereign defaults in several emerging
markets. The scenario continues to assume a Eurozone crisis and
a hard landing in China.
Portfolio-specific stress tests
of specific portfolios. Our portfolio stress loss measures are
derived from data on past events, but also include forward-
looking elements
(
e.g., we derive the expected market
movements in our liquidity-adjusted stress metric using a
combination of historical market behavior, based on an analysis
of historical events, and forward-looking analysis, including
consideration of defined scenarios not modeled on any historical
events). Results of portfolio-specific stress tests may be subject to
limits to explicitly control risk-taking or may be monitored without
limits to identify vulnerabilities.
Reverse stress testing
(e.g., a specified loss amount, reputational damage, a liquidity
shortfall or a breach of regulatory capital ratios) and works
backward to identify economic or financial scenarios that could
result in such an outcome. As such, reverse stress testing is
intended to complement scenario-based stress tests by assuming
“what if” outcomes that could extend beyond the range normally
considered, and thereby potentially challenge assumptions
regarding severity and plausibility.
We also routinely analyze the effect of increases or decreases
in interest rates and changes in the structure of yield curves.
Within Group Treasury, we also perform stress testing to
determine the optimum asset and liability structure, enabling us
to maintain an appropriately balanced liquidity and funding
position under various scenarios. These scenarios differ from those
outlined above, because they focus on specific situations that
could generate liquidity and funding stress, as opposed to the
scenarios used in the CST framework, which focus on the effect
on profit or loss and capital.
›
Refer to “Credit risk” and “Market risk” in this section for more
information about stress loss measures
›
Refer to the “Capital, liquidity and funding, and balance sheet”
section of this report for more information about stress testing
Statistical measures
We complement the scenario-based CST measures with our
statistical stress framework to calculate and aggregate risks using
statistical techniques to derive stress events at chosen confidence
levels.
This framework is used to derive a loss distribution, considering
effects on both income and expenses, based on the simulation of
historically observed financial and economic risk factors in
combination with the firm’s actual earnings and relevant risk
exposures. From that, we determine earnings-at-risk (EaR),
measuring the potential shortfall in earnings (i.e., the deviation
from forecast earnings) at a 95% confidence level and evaluated
over a one-year horizon. EaR is used for the assessment of the
earnings objectives in our risk appetite framework.
We extend the EaR measure, incorporating the effects of gains
and losses recognized through other comprehensive income, to
derive a distribution of potential effects of stress events on
common equity tier 1 capital. From this distribution, we derive our
capital-at-risk (CaR) buffer measure at a 95% confidence level to
assess our capital and leverage ratio risk appetite objectives, and
derive our CaR solvency measure at a 99.9% confidence level to
assess our solvency risk appetite objective.
We use the CaR solvency measure as a basis for deriving the
contributions of the business divisions to risk-based capital (RBC),
which is a component of our equity attribution framework. RBC
measures the potential capital impairment from an extreme stress
event at a 99.9% confidence level.
›
Refer to the “Capital, liquidity and funding, and balance sheet”
section of this report for more information about the equity
attribution framework
Risk, capital, liquidity and funding, and balance sheet | Risk management and control
112
Portfolio and position limits
UBS maintains a comprehensive set of risk limits across its major
risk portfolios. These portfolio limits are set based on our risk
appetite and periodically reviewed and adjusted as part of the
business planning process.
Firm-wide stress and statistical metrics are complemented by
more granular portfolio and position limits, triggers and targets.
Combining these measures provides a comprehensive control
framework to apply to our business divisions, as well as the
significant legal entities, as relevant to the key risks arising from
their businesses.
We apply limits to a variety of exposures at portfolio level, using
statistical and stress-based measures, such as value-at-risk,
liquidity-adjusted stress, loan underwriting limits, economic value
sensitivity and portfolio default simulations for loan books. These
are complemented with a set of controls for net interest income
sensitivity, mark-to-market losses on available-for-sale portfolios,
and the effect of foreign exchange movements on capital and
capital ratios.
Portfolio measures are supplemented with position-level
controls. Risk measures for position controls are based on market
risk sensitivities and counterparty-level credit risk exposures.
Market risk sensitivities include sensitivities to changes in general
market risk factors (e.g., equity indices, foreign exchange rates
and interest rates) and sensitivities to issuer-specific factors (e.g.,
changes in an issuer’s credit spread or default risk). We monitor
numerous market and treasury risk controls on a daily basis.
Counterparty measures capture the current and potential future
exposure to an individual counterparty, considering collateral and
legally enforceable netting agreements.
›
Refer to “Credit risk” in this section for more information about
counterparty limits
›
Refer to “Risk appetite framework” in this section for more
information about the risk appetite framework
Risk concentrations
Audited |
Risk concentrations may exist where one or several
positions within or across different risk categories could result in
significant losses relative to UBS’s financial strength. Identifying
such risk concentrations and assessing their potential impact is a
critical component of our risk management and control process.
For financial risks, we consider a number of elements, such as
shared characteristics of positions, the size of the portfolio and
the sensitivity of positions to changes in the underlying risk
factors. Also important in our assessment is the liquidity of the
markets where the positions are traded, as well as the availability
and effectiveness of hedges or other potential risk-mitigating
factors. This includes an assessment of the provider of the hedge
and market liquidity where the hedge might be traded. Particular
attention is given to identification of wrong-way risk and risk on
risk. Wrong-way risk is defined as a positive correlation between
the size of the exposure and the likelihood of a loss. Risk on risk
is when a position and its risk mitigation can be impacted by the
same event.
For non-financial risks, risk concentrations may result from, for
example, a single operational risk issue that is large on its own
(i.e., has the potential to produce a single high-impact loss or a
number of losses that together are high impact) or related risk
issues that may link together to create a high impact.
Risk concentrations are subject to increased oversight by Group
Risk Control and Group Compliance, Regulatory & Governance,
and assessed to determine whether they should be reduced or
mitigated, depending on the available means to do so. It is
possible that material losses could occur on financial or non-
financial risks, particularly if the correlations that emerge in a
stressed environment differ markedly from those envisaged by risk
models.
p
›
Refer to “Credit risk” and “Market risk” in this section for more
information about the composition of our portfolios
›
Refer to the “Risk factors” section of this report for more
information
113
Credit risk
Key developments
In Global Wealth Management
,
the Lombard and mortgage
books showed significant growth primarily in the Americas over
the course of 2021, while keeping a stable risk profile with regard
to concentrations and with no material losses.
Across the firm, our lending portfolios performed well, with
c
redit loss expenses below expectations
. Nevertheless,
we
continue to be exposed to the development of the global economy
and the effects of the ongoing and highly uncertain COVID-19
pandemic.
We incurred a loss of USD 861 million in the first half of 2021
on the default of a US-based client of our prime brokerage
business. We have conducted a thorough review and put in place
appropriate measures to strengthen our relevant client
onboarding and risk management and control processes. Across
the items identified for remediation and beyond, we have made
changes to our organization to drive wider improvements in both
first and second lines of defense. Our prime brokerage business
remains a strategic element of UBS’s offering.
Credit loss expense / release
Total net credit loss releases were USD 148 million in 2021,
compared with net credit loss expenses of USD 694 million in the
prior year, reflecting net releases of USD 123 million related to
stage 1 and 2 positions and net releases of USD 25 million related
to credit-impaired (stage 3) positions.
Stage 1 and 2 net credit loss releases of USD 123 million in
2021 included a partial net release of a post-model adjustment of
USD 68 million, due to the continued positive trend in
macroeconomic scenario input data during the year, a USD 45
million net release from a number of model and methodology
changes, a residual USD 10 million net release from
remeasurements within the loan book, and derecognized
transactions, partially offset by expenses from new transactions.
Stage 3 net releases of USD 25 million were recognized across a
number of defaulted positions, primarily corporate
lending
positions in Personal & Corporate Banking.
›
Refer to “Note 1 Summary of material accounting policies,”
“Note 9 Financial assets at amortized cost and other positions in
scope of expected credit loss measurement” and “Note 20
Expected credit loss measurement” in the “Consolidated financial
statements” section of this report for more information about
IFRS 9 and expected credit losses
Audited |
–
Global Wealth Management
predominant
ly
conduct
s
securities-based (Lombard) lending and mortgage lending.
–
A substantial portion of lending exposure arises from Personal
& Corporate Banking, which offers mortgage loans, secured
mainly by residential properties and income-producing real
estate, as well as corporate loans, and therefore depends on
the performance of the Swiss economy.
–
The Investment Bank’s credit exposure arises mainly from
lending, derivatives trading and securities financing.
Derivatives tra
ding and securities financing are
mainly
investment grade. Loan underwriting activity can be lower
rated and give rise to temporary concentrated exposure.
–
Credit risk within Non-core and Legacy Portfolio relates to
derivative transactions and securitized positions.
p
Credit loss (expense) / release
USD million
Global
Wealth
Management
Personal &
Corporate
Banking
Asset
Management
Investment
Bank
Group
Functions
Total
For the year ended 31.12.21
Stages 1 and 2
Stage 3
Total credit loss (expense) / release
For the year ended 31.12.20
Stages 1 and 2
(88)
(266)
Stage 3
(217)
(429)
Total credit loss (expense) / release
For the year ended 31.12.19
Stages 1 and 2
Stage 3
Total credit loss (expense) / release
Risk, capital, liquidity and funding, and balance sheet | Risk management and control
114
Audited |
management techniques
–
Credit risk from transactions with individual counterparties is
based on our estimates of probability of default (PD), exposure
at default (EAD) and loss given default (LGD). Limits are
established for individual counterparties and groups of related
counterparties covering banking and traded products, and for
settlement amounts. Risk authorities are approved by the BoD
and are delegated to the Group CEO, the Group CRO and
divisional CROs, based on risk exposure amounts, internal
credit rating and potential for losses.
–
Limits apply not only to the current outstanding amount but
also to contingent commitments and the potential future
exposure of traded products.
–
The Investment Bank monitoring, measurement and limit
framework distinguishes between exposures intended to be
held to maturity (take-and-hold exposures) and those intended
for distribution or risk transfer (temporary exposures).
–
We use models to derive portfolio credit risk measures of
expected loss, statistical loss and stress loss at Group-wide and
business division levels, and to establish portfolio limits.
–
Credit risk concentrations can arise if clients are engaged in
similar activities, located in the same geographical region or
have comparable economic characteristics, e.g., if their ability
to meet contractual obligations would be similarly affected by
changes in economic, political or other conditions. To avoid
credit risk concentrations, we establish limits / operational
controls that constrain risk concentrations at portfolio and sub-
portfolio levels for sector exposure, country risk and specific
product exposures.
p
Credit risk profile of the Group
The exposures detailed in this section are based on management’s
view of credit risk, which differs in certain respects from the
expected credit loss (ECL) measurement requirements of IFRS.
Internally, we
put
credit risk exposures into two broad
categories: banking products and traded products. Banking
products
include
drawn loans, guarantees and loan
commitments, amounts
due from banks
,
balances
at
central
banks
,
and
other financial assets at amortized cost
. Traded
products include over-the-counter (OTC) derivatives, exchange-
traded derivatives (ETDs) and securities financing transactions
(
SFTs
)
,
consisting
of
securities borrowing and lending
,
and
repurchase and reverse repurchase agreements.
Banking products
Breakdowns of banking products exposures in the “Banking and
traded products exposure in our business divisions and Group
Functions” table on the next page reflect the total exposures
within the scope of ECL requirements and are gross before
allowances and provisions for ECL and credit hedges. Guarantees
and loan commitments are shown on a notional basis, without
applying credit conversion factors.
›
Refer to “Note 1 Summary of material accounting policies” in the
“Consolidated financial statements” section of this report for
more information about our accounting policy for allowances
and provisions for ECL
›
Refer to “Note 9 Financial assets at amortized cost and other
positions in scope of expected credit loss measurement” and
“Note 20 Expected credit loss measurement” in the
“Consolidated financial statements” section of this report for
more information about ECL measurement requirements
under IFRS
›
Refer to “Note 14a Other financial assets measured at amortized
cost” in the “Consolidated financial statements” section of this
report for more details
115
Banking and traded products exposure in our business divisions and Group Functions
31.12.21
USD million
Global Wealth
Management
Personal &
Corporate
Banking
Asset
Management
Investment
Bank
Group
Functions
Total
Banking products
1,2
Gross exposure
337,266
229,334
1,520
59,352
65,514
692,985
of which: loans and advances to customers (on-balance sheet)
228,598
152,847
0
13,720
3,445
398,611
of which: guarantees and loan commitments (off-balance sheet)
10,772
29,737
0
14,994
4,947
60,450
Traded products
2,3
Gross exposure
9,582
783
0
35,950
46,314
of which: over-the-counter derivatives
7,186
766
0
9,767
17,719
of which: securities financing transactions
0
0
0
18,566
18,566
of which: exchange-traded derivatives
2,396
17
0
7,617
10,030
Other credit lines, gross
4
12,947
24,174
0
3,629
28
40,778
Total credit-impaired exposure, gross (stage 3)
1
729
1,617
0
264
0
2,610
Total allowances and provisions for expected credit losses (stages 1 to 3)
264
709
0
188
4
1,165
of which: stage 1
89
126
0
64
4
282
of which: stage 2
41
146
0
34
0
220
of which: stage 3 (allowances and provisions for credit-impaired exposures)
135
438
0
90
0
662
31.12.20
USD million
Global Wealth
Management
Personal &
Corporate
Banking
Asset
Management
Investment
Bank
Group
Functions
Total
Banking products
1,2
Gross exposure
300,368
227,139
3,374
56,237
52,199
639,317
of which: loans and advances to customers (on-balance sheet)
208,324
153,975
1
13,964
4,324
380,589
of which: guarantees and loan commitments (off-balance sheet)
10,153
28,814
0
15,936
3,550
58,453
Traded products
2,3
Gross exposure
9,919
1,201
0
40,215
51,335
of which: over-the-counter derivatives
6,946
1,182
0
11,236
19,364
of which: securities financing transactions
0
0
0
21,753
21,753
of which: exchange-traded derivatives
2,973
19
0
7,227
10,218
Other credit lines, gross
4
12,201
24,950
0
2,952
31
40,134
Total credit-impaired exposure, gross (stage 3)
1
1,324
1,997
0
450
7
3,778
Total allowances and provisions for expected credit losses (stages 1 to 3)
318
842
1
298
10
1,468
of which: stage 1
103
130
0
70
3
306
of which: stage 2
54
216
0
63
0
333
of which: stage 3 (allowances and provisions for credit-impaired exposures)
160
497
1
165
6
829
1 ECL gross exposure including other financial assets at amortized cost, but excluding cash, receivables from securities financing transactions, cash collateral receivables on derivative instruments, financial assets at
FVOCI, irrevocable committed prolongation of existing loans and unconditionally revocable committed credit lines and forward starting reverse repurchase and securities borrowing agreements. 2 Internal management
view of credit risk, which differs in certain respects from IFRS. 3 As counterparty risk for traded products is managed at counterparty level, no further split between exposures in the Investment Bank and Group
Functions is provided. 4 Unconditionally revocable committed credit lines.
Global Wealth Management
Gross banking products exposure within Global Wealth
Management increased to USD 337 billion from USD 300 billion.
Our Global Wealth Management loan portfolio is mainly
secured by securities (Lombard loans) and by residential real
estate. Most Lombard loans were of high quality, with 93% rated
as investment grade based on our internal ratings, and are
typically short term in nature, with an average loan-to-value (LTV)
of 46%. Moreover, Lombard loans can be canceled immediately
if the collateral quality deteriorates and margin calls are not met.
In 2021, the Lombard book, including traded products, increased
approximately 10%, while keeping a stable risk profile with regard
to collateral concentrations with no material losses. The increase
was mainly driven by higher loan volumes in the US that are
collateralized by highly liquid and diversified securities. The share
of non-standard Lombard loans, for example with less liquid or
concentrated collateral, was stable at approximately 4% of the
total Lombard book.
The mortgage book increased by approximately 8%, driven by
higher volumes of mortgage loans in the US residential real estate
portfolios (average LTV 51%).
Other financings and non-standard loans represent
approximately 3% of the total banking products exposures and
are consolidated in a corporate and other portfolio that increased
approximately 57% in 2021, mainly driven by private equity
subscription facilities in the US, which are mostly investment
grade rated.
Risk, capital, liquidity and funding, and balance sheet | Risk management and control
116
Global Wealth Management and Personal & Corporate Banking loans and advances to customers, gross
1
Global Wealth Management
Personal & Corporate Banking
USD million
31.12.21
31.12.20
31.12.21
31.12.20
Secured by residential real estate
58,655
60,021
110,041
111,554
Secured by commercial / industrial real estate
3,338
3,273
18,878
19,623
Secured by cash
34,175
22,722
3,114
2,860
Secured by securities
115,901
104,652
2,214
2,003
Secured by guarantees and other collateral
14,138
15,605
7,435
6,942
Unsecured loans and advances to customers
2,391
2,051
11,166
10,994
Total loans and advances to customers, gross
228,598
208,324
152,847
153,975
Allowances
(168)
(190)
(574)
(676)
Total loans and advances to customers, net of allowances
228,431
208,134
152,273
153,299
1 Collateral arrangements generally incorporate a range of collateral, including cash, securities, real estate and other collateral. UBS applies a risk-based approach that generally prioritizes collateral according to its
liquidity profile. In 2021, the collateral allocation was refined to reflect additional cash collateral and custody accounts that are also available as security for certain on-balance sheet lending. This resulted in an increase
in loans secured by cash, with an offsetting reduction in loans secured by residential real estate and loans secured by securities.
Personal & Corporate Banking
Gross banking products exposure (excluding exposure re-
allocated from Group Treasury) within Personal & Corporate
Banking was largely unchanged in our reporting currency at
USD
18
6
billion
(CHF
170
billion)
,
compared
with
USD
187
billion (CHF 165 billion). Net banking products exposure was
USD
186
billion
(CHF
16
9
billion)
,
compared with USD
1
86
billion
(CHF
16
5
billion)
, of which approximately
65
% was
classified as investment grade, unchanged from 2020. Around
50% of the exposure is categorized in the lowest LGD bucket ,
i.e., 0–25%, similar to 2020. Personal & Corporate Banking’s
gross loan portfolio was USD
15
3
billion
(CHF
13
9
billion)
compared with USD 154 billion (CHF 136 billion) in 2020. This
portfolio is predominantly denominated in Swiss francs and the
increase in Swiss franc term s was more than offset by the effect
of the US dollar appreciating . As of 31 December 2021, 93% of
this portfolio was secured by collateral, mainly residential and
commercial property. Of the total unsecured amount, 83%
related to cash flow-based lending to corporate counterparties
and 4% related to lending to public authorities. Based on our
internal ratings, 50% of the unsecured loan portfolio was rated
as investment grade, compared with 45% in 2020.
The improved macroeconomic environment for most industries
along with the supporting measures of the Swiss Government and
Cantons, such as COVID-19 loans, short-time work compensation
and subsidies, as well as our careful risk management, led to
numerous credit loss releases during 2021.
Our Swiss corporate banking products portfolio, which was
USD 36 billion (CHF 33 billion) compared with USD 35 billion
(CHF 31 billion) in 2020, consists of loans, guarantees and loan
commitments to multi-national and domestic counterparties. The
small and medium-sized entity (SME) portfolio, in particular, is well
diversified across industries. However, such companies are reliant
on the domestic economy and the economies to which they
export, in particular the EU and the US. In addition, the change in
the EUR / CHF exchange rate is an important risk factor for Swiss
corporate clients.
Our commodity trade finance portfolio focuses on energy and
base-metal trading companies, where the related commodity price
risk is hedged to a large extent by the commodity trader. The
majority of limits in this business are uncommitted, transactional
and short-term in nature. Our portfolio size was USD 8 billion
(CHF 7 billion) as of 31 December 2021, compared with USD 6
billion (CHF 5 billion) in 2020, with the increase in exposure mainly
driven by the strong appreciation of commodity prices in 2021.
Our exposure to banks consists primarily of contingent claims
and was USD 6 billion (CHF 5 billion), unchanged compared with
2020.
The delinquency ratio was 0.3% for the corporate portfolio,
compared with 0.4% at the end of 2020.
›
Refer to “Credit risk models” in this section for more information
about loss given default, rating grades and rating agency
mappings
Swiss mortgage loan portfolio
Our Swiss mortgage loan portfolio secured by residential and
commercial real estate in Switzerland continues to be our largest
loan portfolio. These mortgage loans, totaling USD 167 billion
(CHF 152 billion), mainly originate from Personal & Corporate
Banking, but also from Global Wealth Management Region
Switzerland. Of these mortgage loans, USD 152 billion (CHF 138
billion) related to residential properties that the borrower was
either occupying or renting out, with full recourse to the
borrower. Of this USD 152 billion (CHF 138 billion), USD 110
billion (CHF 100 billion) is related to properties occupied by the
borrower, with an average LTV ratio of 52%, compared with 54%
as of 31 December 2020. The average LTV for newly originated
loans for this portfolio was 64%, compared with 67% in 2020.
The remaining USD
4
2
bi
llion (CHF
38 billion) of the Swiss
residential mortgage loan portfolio related to properties rented
out by the borrower and the average LTV of that portfolio was
52%, compared with 53% as of 31 December 2020. The average
LTV for newly originated Swiss residential mortgage loans for
properties rented out by the borrower was 55%, compared with
56% in 2020.
As illustrated in the “Swiss mortgages: distribution of net
exposure at default (EAD) across exposure segments and loan-to-
value (LTV) buckets” table on the following page, more than 99%
of the aggregate amount of Swiss residential mortgage loans
would continue to be covered by the real estate collateral even if
the value assigned to that collateral were to decrease 20%, and
more than 98% would remain covered by the real estate collateral
even if the value assigned to that collateral were to decrease 30%.
In this table, the amount of each mortgage loan is allocated across
the LTV buckets to indicate the portion at risk at the various value
levels shown; for example, a loan of 75 with an LTV ratio of 75%
(i.e., a collateral value of 100) would result in allocations of 30 in
the less-than-30% LTV bucket, 20 in the 31–50% bucket, 10 in
the 51–60% bucket, 10 in the 61–70% bucket and 5 in the 71–
80% bucket.
117
Personal & Corporate Banking: distribution of banking products exposure across internal UBS ratings and loss given
default (LGD) buckets
1
USD million, except where indicated
31.12.21
31.12.20
LGD buckets
Weighted
average
LGD (%)
Weighted
average
LGD (%)
Internal UBS rating
2
Exposure
0–25%
26–50%
51–75%
76–100%
Exposure
Investment grade
121,520
68,547
41,738
9,347
1,889
27
121,386
26
Sub-investment grade
63,141
24,301
25,306
11,646
1,888
34
63,266
33
of which: 6−9
57,955
22,540
23,195
10,513
1,706
34
58,141
33
of which: 10−13
5,185
1,760
2,110
1,133
181
36
5,125
35
Defaulted / Credit-impaired
1,617
32
1,332
252
0
42
1,997
41
Total exposure before deduction of allowances and provisions
186,278
92,880
68,376
21,245
3,777
29
186,648
29
Less: allowances and provisions
(674)
(795)
Net banking products exposure
1
185,604
185,853
1 Excluding balances at central banks and Group Treasury reallocations. 2 The ratings of the major credit rating agencies, and their mapping to our internal rating scale, are shown in the “Internal UBS rating scale
and mapping of external ratings” table in this section.
Personal & Corporate Banking: unsecured loans by industry sector
31.12.21
31.12.20
USD million
%
USD million
%
Construction
166
1.5
157
1.4
Financial institutions
2,786
25.0
2,553
23.2
Hotels and restaurants
119
1.1
133
1.2
Manufacturing
1,555
13.9
1,572
14.3
Private households
1,488
13.3
1,648
15.0
Public authorities
419
3.8
472
4.3
Real estate and rentals
574
5.1
498
4.5
Retail and wholesale
1,971
17.7
1,756
16.0
Services
1,908
17.1
1,896
17.3
Other
180
1.6
309
2.8
Exposure, gross
11,166
100.0
10,994
100.0
Swiss mortgages: distribution of net exposure at default (EAD) across exposure segments and loan-to-value (LTV)
buckets
USD billion, except where indicated
31.12.21
31.12.20
LTV buckets
Exposure segment
≤30%
31–50%
51–60%
61–70%
71–80%
81–100%
>100%
Total
Total
Residential mortgages
Net EAD
89.0
38.6
10.2
4.6
1.2
0.2
0.1
143.9
143.9
as a % of row total
62
27
7
3
1
0
0
Income-producing real estate
Net EAD
14.5
5.7
1.3
0.5
0.2
0.0
0.0
22.2
22.8
as a % of row total
65
25
6
2
1
0
0
Corporates
Net EAD
7.1
2.6
0.7
0.4
0.2
0.1
0.0
10.9
10.8
as a % of row total
65
23
6
3
1
1
0
Other segments
Net EAD
0.6
0.2
0.0
0.0
0.0
0.0
0.0
0.9
0.8
as a % of row total
68
20
5
3
2
2
0
Mortgage-covered exposure
Net EAD
111.2
47.0
12.2
5.5
1.5
0.3
0.1
177.9
178.3
as a % of total
63
26
7
3
1
0
0
Mortgage-covered exposure 31.12.20
Net EAD
108.8
47.3
13.0
6.4
2.0
0.5
0.2
178.3
as a % of total
61
27
7
4
1
0
0
100
Asset Management
Gross banking products exposure within Asset Management was
USD 1.5 billion as of 31 December 2021, compared with USD 3.4
billion as of 31 December 2020. The reduction was driven by
lower allocated balances at central banks.
Investment Bank
The Investment Bank’s lending activities are largely associated
with corporate and non-bank financial institutions. The business
is broadly diversified across industry sectors, but concentrated in
North America.
Risk, capital, liquidity and funding, and balance sheet | Risk management and control
118
The gross banking products exposure including balances at
central banks and Group Treasury reallocations was USD 59 billion
as of 31 December 2021, compared with USD 56 billion as of
31 December 2020. Gross banking products exposure excluding
balances at central banks and Group Treasury reallocations
decreased to USD 35 billion from USD 37 billion, mostly driven by
decreases in irrevocable loan commitments. Based on our internal
ratings, 53% of
this
gro
ss banking
products
exposure was
classified as investment grade. The vast majority of the gross
banking products exposure had an estimated LGD below 50%.
Our loan underwriting business’s overall ability to distribute
risk remained sound.
Total
mandated
t
emporary loan
underwriting exposure ended 2021 at USD 6.6 billion, compared
with
USD
4.
9
billion at the end of
the
prior
year
.
Loan
underwriting exposures are classified as held for trading, with fair
values reflecting market conditions at the end of 2021.
›
Refer to “Credit risk models” in this section for more information
about LGD, rating grades and rating agency mappings
Investment Bank: distribution of banking products exposure across internal UBS ratings and loss given default (LGD)
buckets
1
USD million, except where indicated
31.12.21
31.12.20
LGD buckets
Weighted
average
LGD (%)
Weighted
average
LGD (%)
Internal UBS rating
2
Exposure
0–25%
26–50%
51–75%
76–100%
Exposure
Investment grade
18,302
6,486
7,673
3,069
1,073
36
19,303
36
Sub-investment grade
16,250
5,022
6,111
5,020
97
20
16,785
17
of which: 6−9
10,467
3,269
2,163
4,938
97
14
12,030
11
of which: 10−13
5,783
1,753
3,948
82
0
31
4,756
30
Defaulted / Credit-impaired
264
58
196
9
0
33
450
53
Banking products exposure
1
34,815
11,566
13,981
8,098
1,170
28
36,538
27
1 Excluding balances at central banks and Group Treasury reallocations. 2 The ratings of the major credit rating agencies, and their mapping to our internal rating scale, are shown in the “Internal UBS rating scale
and mapping of external ratings” table in this section.
Investment Bank: banking products exposure by geographical region
1
31.12.21
31.12.20
USD million
%
USD million
%
Asia Pacific
5,154
14.8
7,216
19.7
Latin America
1,327
3.8
1,584
4.3
Middle East and Africa
212
0.6
428
1.2
North America
16,282
46.8
15,462
42.3
Switzerland
453
1.3
720
2.0
Rest of Europe
11,387
32.7
11,129
30.5
Exposure
1
34,815
100.0
36,538
100.0
1 Excluding balances at central banks and Group Treasury reallocations.
Investment Bank: banking products exposure by industry sector
1
31.12.21
31.12.20
USD million
%
USD million
%
Banks
4,908
14.1
5,846
16.0
Chemicals
645
1.9
876
2.4
Electricity, gas, water supply
359
1.0
448
1.2
Financial institutions, excluding banks
13,353
38.4
14,570
39.9
Manufacturing
1,692
4.9
1,681
4.6
Mining
1,024
2.9
1,558
4.3
Public authorities
619
1.8
1,273
3.5
Real estate and construction
1,581
4.5
1,421
3.9
Retail and wholesale
2,793
8.0
2,041
5.6
Technology and communications
3,736
10.7
3,443
9.4
Transport and storage
414
1.2
445
1.2
Other
3,691
10.6
2,937
8.0
Exposure
1
34,815
100.0
36,538
100.0
1 Excluding balances at central banks and Group Treasury reallocations. Clearing houses are now classified under Financial institutions, excluding banks (31 December 2021: USD 1,196 million; 31 December 2020:
USD 1,440 million).
119
Group Functions
Gross banking products exposure within Group Functions, which
arises primarily in connection with treasury activities, increased by
USD 13 billion to USD 66 billion from balances at central banks.
The cash inflow was generated mainly from lower funding
consumption by the Investment Bank, shifts within the high-
quality liquid asset (HQLA) portfolio from securities into cash, and
net new issuances of long-term debt issued measured at
amortized cost.
›
Refer to “Balance sheet assets” in the “Capital, liquidity and
funding, and balance sheet” section of this report for more
information
›
Refer to the “Group Functions” section of this report for
more information
Traded products
Audited |
Counterparty credit risk
(CCR)
arising from traded
products, which include OTC derivatives, ETD exposures and SFTs,
originating
in the Investm
ent Bank
,
Non
-
core
and Legacy
Portfolio, and Group Treasury , is generally managed on a close-
out basis. This takes into account possible effects of market
movements on the exposure and any associated collateral over
the time it would take to close out our positions. In the Investment
Bank, limits are applied to the potential future exposure per
counterparty, with the
size of the
limit
dependent on
the
counterparty’s creditworthiness (as determined by Risk Control).
Limit frameworks are also used to control overall exposure to
specific classes or categories of collateral on a portfolio level. Such
portfolio
limits are monitored and reported to senior
management.
Trading in OTC derivatives is conducted through central
counterparties (CCPs) where practicable. Where CCPs are not
used, we have clearly defined policies and processes for trading
on a bilateral basis. Trading is typically conducted under bilateral
International Swaps and Derivatives Association (ISDA) or similar
master netting agreements, which generally allow for close-out
and netting of transactions in case of default, subject to applicable
law. For most major market participant counterparties, we use
two-way collateral agreements under which either party can be
required to provide collateral in the form of cash or marketable
securities when the exposure exceeds specified levels. This
collateral typically consists of well-rated government debt or other
collateral permitted by applicable regulations. For certain
counterparties, an initial margin is taken to cover some or all of
the calculated close-out exposure. This is in addition to the
variation margin taken to settle changes in market value of
transactions. Regulations on margining uncleared OTC derivatives
continue to evolve. These generally expand the scope of bilateral
derivatives activity subject to margining. They will also result in
greater amounts of initial margin received from, and posted to,
certain bilateral trading counterparties than had been required in
the past. These changes should result in lower close-out risk over
time.
p
In the tables on the following page, OTC derivatives exposures
are generally presented as net positive replacement values after
the application of legally enforceable netting agreements and the
deduction of cash and marketable securities held as collateral. SFT
exposures are reported taking into account collateral received,
and ETD exposures take into account collateral margin calls.
The “Banking and traded products exposure in our business
divisions and Group Functions” table in this section provides
information on the split by divisions and products, and the tables
on the next page provide information about the OTC derivatives,
SFT and ETD exposures of the Investment Bank, Non-core and
Legacy Portfolio, and Group Treasury.
›
Refer to “Note 10 Derivative instruments” in the “Consolidated
financial statements” section of this report for more information
about OTC derivatives settled through central counterparties
›
Refer to “Note 22 Offsetting financial assets and financial liabilities”
in the “Consolidated financial statements” section of this report
for more information about the effect of netting and collateral
arrangements on derivative exposures
Risk, capital, liquidity and funding, and balance sheet | Risk management and control
120
Investment Bank, Non-core and Legacy Portfolio and Group Treasury: traded products exposure
USD million
OTC derivatives
SFTs
ETDs
Total
Total
31.12.21
31.12.20
Total exposure, before deduction of credit valuation adjustments and hedges
9,767
18,566
7,617
35,950
40,215
Less: credit valuation adjustments and allowances
(34)
0
0
(34)
(54)
Less: credit protection bought (credit default swaps, notional)
(119)
0
0
(119)
(126)
Net exposure after credit valuation adjustments, allowances and hedges
9,615
18,566
7,617
35,797
40,035
Investment Bank, Non-core and Legacy Portfolio and Group Treasury: distribution of net OTC derivatives and SFT
exposure across internal UBS ratings and loss given default (LGD) buckets
USD million, except where indicated
31.12.21
31.12.20
LGD buckets
Weighted
average
LGD (%)
Weighted
average
LGD (%)
Internal UBS rating
1
Exposure
0–25%
26–50%
51–75%
76–100%
Exposure
Net OTC derivatives exposure
Investment grade
9,297
272
7,770
704
552
47
10,436
49
Sub-investment grade
317
44
54
131
88
59
620
55
of which: 6−9
249
25
53
90
81
62
487
55
of which: 10−12
46
0
1
39
7
64
114
62
of which: 13 and defaulted
22
19
0
3
0
14
19
12
Total net OTC derivatives exposure, after credit valuation adjustments
and hedges
9,615
317
7,824
835
639
48
11,056
49
Net SFT exposure
Investment grade
17,937
159
15,655
1,812
310
40
21,155
40
Sub-investment grade
629
0
296
50
283
69
598
59
Total net SFT exposure
18,566
159
15,951
1,862
593
41
21,753
40
1 The ratings of the major credit rating agencies, and their mapping to our internal rating scale, are shown in the “Internal UBS rating scale and mapping of external ratings” table in this section.
Investment Bank, Non-core and Legacy Portfolio and Group Treasury: net OTC derivatives and SFT exposure
by geographical region
Net OTC derivatives exposure
Net SFT exposure
31.12.21
31.12.20
31.12.21
31.12.20
USD million
%
USD million
%
USD million
%
USD million
%
Asia Pacific
1,586
16.5
2,139
19.3
5,380
29.0
5,123
23.6
Latin America
111
1.2
162
1.5
20
0.1
18
0.1
Middle East and Africa
112
1.2
263
2.4
360
1.9
939
4.3
North America
1,830
19.0
2,539
23.0
4,473
24.1
4,778
22.0
Switzerland
688
7.2
667
6.0
559
3.0
1,329
6.1
Rest of Europe
5,288
55.0
5,286
47.8
7,774
41.9
9,566
44.0
Exposure
9,615
100.0
11,056
100.0
18,566
100.0
21,753
100.0
Investment Bank, Non-core and Legacy Portfolio and Group Treasury: net OTC derivatives and SFT exposure
by industry sector
Net OTC derivatives exposure
Net SFT exposure
31.12.21
31.12.20
31.12.21
31.12.20
USD million
%
USD million
%
USD million
%
USD million
%
Banks
1
986
10.3
1,877
17.0
1,654
8.9
1,653
7.6
Chemicals
14
0.1
10
0.1
0
0.0
0
0.0
Electricity, gas, water supply
103
1.1
127
1.2
0
0.0
0
0.0
Financial institutions, excluding banks
1
7,174
74.6
6,742
61.0
15,866
85.5
18,049
83.0
Manufacturing
50
0.5
68
0.6
0
0.0
0
0.0
Mining
51
0.5
12
0.1
0
0.0
0
0.0
Public authorities
810
8.4
1,339
12.1
926
5.0
2,050
9.4
Retail and wholesale
22
0.2
44
0.4
0
0.0
0
0.0
Transport, storage and communication
255
2.6
481
4.3
0
0.0
0
0.0
Other
150
1.6
356
3.2
120
0.6
1
0.0
Exposure
9,615
100.0
11,056
100.0
18,566
100.0
21,753
100.0
1 Clearing houses have been reclassified from Banks to Financial institutions, excluding banks. Prior-period numbers have been restated accordingly
121
Credit risk mitigation
Audited |
collateral against exposures and by utilizing credit hedging.
p
Lending secured by real estate
Audited |
to-back process for credit decisions on originating or modifying
Swiss mortgage loans. The model’s two key factors are the LTV
ratio and an affordability calculation relative to gross income.
p
The calculation of affordability takes into account interest
payments, minimum amortization requirements, potential
property maintenance costs and, for rental properties, the level of
rental income. Interest payments are estimated using a predefined
framework, which considers the potential for significant interest
rates increases over the lifetime of the loan. The interest rate is set
at 5% per annum in the context of the current environment.
For residential properties occupied by the borrower, the
maximum LTV for the standard approval process is 80% and 60%
for holiday homes and luxury real estate. For other properties, the
maximum LTV allowed within the standard approval process
ranges from 30% to 80%, depending on the type and age of the
property, and the amount of renovation work needed.
Audited |
lowest value determined from
model
-
derived
valuations, the
purchase price, an asset value for income-producing real estate
(IPRE), and, in some cases, an additional external valuation for
owner-occupied residential properties (ORPs).
p
Two separate models provided by a market-leading external
vendor are used to derive property valuations for ORPs and IPRE.
We estimate the current value of an ORP using a regression model
(a hedonic model) based on statistical comparison against current
transaction data. We derive the value of a property from the
characteristics of the real estate itself, as well as those of its
location. In addition to the initial valuation, values for ORPs are
updated quarterly over the lifetime of the loan using region-
specific real estate price indices. The price indices are sourced from
an external vendor and subject to internal validation and
benchmarking. We use these valuations quarterly to compute
indexed LTV for all ORPs. A portfolio-specific monitoring system
considers these along with other risk measures (e.g., rating and
behavioral information) to identify higher-risk loans and triggers
an assessment and reappraisal by client advisors and credit officers
as needed.
For IPRE, the capitalization rate model is used to determine the
property valuation by discounting estimated sustainable future
income using a capitalization rate based on various attributes.
These attribu
tes consider regional
and
specific property
characteristics, such as market and location data (e.g., vacancy
rates), benchmarks (e.g., for running costs) and certain other
standardized input parameters (e.g., property condition). Updated
information regarding rental income from IPRE is requested from
the client at least once every three years. Our portfolio-specific
monitoring system alerts us to changes in rental income and other
risk measures (e.g., LTV, rating, behavioral information), and
triggers an assessment and reappraisal by client advisors and
credit officers as needed.
To take market developments into account for these models,
the external vendor regularly updates the parameters and / or
refines the architecture for each model. Model changes and
parameter updates are subject to the same validation procedures
as our internally developed models.
Audited |
Global Wealth Management Region Americas mortgage loan
portfolio, taking into account loan affordability and collateral
sufficiency. LTV standards are defined for the various mortgage
types, such as residential mortgages or investment properties,
based on associated risk factors, such as property type, loan size,
and purpose. The maximum LTV allowed within the standard
approval process ranges from
45
% to
80
%. In addition to LTV,
other credit risk metrics, such as debt-to-income ratios, credit
scores and required client reserves,
are
also
part of our
underwriting guidelines.
A risk limit framework is
applied to the Global Wealth
Management Region Americas mortgage loan portfolio. Limits
are set to govern exposures within LTV categories, geographic
concentrations, portfolio growth and high-risk mortgage
segments, such as interest-only loans. These limits are monitored
by a specialized credit risk monitoring team and reported to senior
management. Supplementing this limit framework is a real estate
lending policy and procedures framework, set up to govern real
estate lending activities. Quality assurance and quality control
programs monitor compliance with mortgage underwriting and
documentation requirements.
For our mortgage loan portfolio in the Global Wealth
Management regions of EMEA and Asia Pacific, we apply global
underwriting guidelines with regional variations to allow for
regulatory and market differentials. As in other regions, the
underwriting guidelines take into account affordability and
collateral sufficiency. Affordability is assessed at a stressed interest
rate using, for residential real estate, the borrowers’ sustainable
income and declared liabilities, and for commercial real estate the
quality and sustainability of rental income. For interest-only loans,
a declared and evidenced repayment strategy must be in place.
The applicable LTV for each mortgage is based on the quality and
liquidity of the property and assessed against valuations from
bank-appointed third-party valuers. Maximum LTV varies from
30
% to
70
%, depending on the type and location of the property,
as well as other factors. Collateral sufficiency is often further
supported by personal guarantees from the borrower. The overall
portfolio is centrally assessed against a number of stress scenarios
to ensure that exposures remain within predefined stress limits.
p
›
Refer to “Swiss mortgage loan portfolio” in this section for more
information about LTV in our Swiss mortgage portfolio
Risk, capital, liquidity and funding, and balance sheet | Risk management and control
122
Lombard lending
Audited |
securities, guarantees and other forms of collateral. Eligible
financial securities
are
primarily
liquid and actively traded
transferable securities (such as bonds and equities), and other
transferable securities, such as approved structured products for
which regular prices are available and the issuer of the security
provides a market. To a lesser degree, less liquid collateral is also
used.
We derive lending values by applying discounts (haircuts) to the
pledged collateral
’
s market value.
H
aircuts for ma
rketable
securities are calculated to cover possible change in value over a
given close-out period and confidence level. Less liquid or more
volatile collateral will typically have larger haircuts.
We assess concentration and correlation risks across collateral
posted at a counterparty level, and at a divisional level across
counterparties. We also perform targeted Group-wide reviews of
concentration. Concentration of collateral in single securities,
issuers or issuer groups, industry sectors, countries, regions or
currencies may result in higher risk and reduced liquidity. In such
cases, the lending value of the collateral, margin call and close-
out levels are adjusted accordingly.
p
Exposures and collateral values are monitored daily, with the
aim of ensuring that the credit exposure is always within the
established risk tolerance. A shortfall occurs when the lending
value drops below the exposure; if it exceeds a defined trigger
level, a margin call is initiated, requiring the client to provide
additional collateral, reduce the exposure or take other action to
bring exposure in line with the agreed lending value of the
collateral. If a shortfall increases and exceeds a further trigger
level, or the shortfall is not corrected within the required period,
a close-out is initiated, through which collateral is liquidated, open
derivative positions are closed and guarantees are called.
We conduct stress testing of collateralized exposures to
simulate market events that reduce collateral value, increase
exposure of traded products, or do both. For certain classes of
counterparties, limits on such calculated stress exposures are
applied and controlled at a counterparty level. Also, portfolio
limits are applied across certain businesses or collateral types.
›
Refer to “Stress loss” in this section for more information about
our stress testing
Credit hedging
Audited |
index CDSs, bespoke protection and other instruments to actively
manage credit risk in the Investment Bank and Non-core and
Legacy Portfolio. The aim is to reduce concentrations of risk from
specific counterparties, sectors or portfolios and, for CCR, the
profit or loss
effect
arising from changes in credit valuation
adjustments (CVAs).
We have strict guidelines with regard to taking credit hedges
into account for credit risk mitigation purposes. For example,
when monitoring exposures against counterparty limits, we do
not usually
apply certain
credit risk
mitigants
,
such as proxy
hedges (credit protection on a correlated but different name) or
credit
-
index
CDSs
,
to reduce counterparty exposures
. Buying
credit protection also creates credit exposure with regard to the
protection provider. We monitor and limit exposures to credit
protection providers, and also monitor the effectiveness of credit
hedges as part of our overall credit exposures to the relevant
counterparties. Trading with such counterparties is typically
collateralized. For credit protection purchased to hedge the
lending portfolio, this includes monitoring mismatches between
the maturity of credit protection purchased and the maturity of
the associated loan. Such mismatches result in basis risk and may
reduce the effectiveness of the credit protection. Mismatches are
routinely reported to credit officers and mitigating actions are
taken when necessary.
p
›
Refer to “Note 10 Derivative instruments” in the “Consolidated
financial statements” section of this report for more information
Mitigation of settlement risk
To mitigate settlement risk, we reduce actual settlement volumes
by
us
ing
multi
-
lateral
and bilateral agreements with
counterparties, including payment netting.
Foreign exchange transactions are our most significant source
of settlement risk. We are a member of Continuous Linked
Settlement (CLS), an industry utility that provides a multi-lateral
framework to settle transactions on a delivery-versus-payment
basis, th
us
reducing foreign exchange
-
related settlement risk
relative to the volume of business. However, mitigation of
settlement risk through CLS and other means does not fully
eliminate credit risk in foreign exchange transactions resulting
from changes in exchange rates prior to settlement, which is
managed as part of our overall credit risk management of OTC
derivatives.
Credit risk models
Basel III – A-IRB credit risk models
Audited |
credit losses that may be implicit in our current portfolio.
Exposures to individual counterparties are measured using
three generally accepted parameters: PD, EAD and LGD. For a
given credit facility, the product of these three parameters results
in the expected loss. These parameters are the basis for the
majority of our internal measures of credit risk, and key inputs for
regulatory capital calculation under the advanced internal ratings-
based (A-IRB) approach of the Basel III framework. We also use
models to derive the portfolio credit risk measures of expected
loss, statistical loss and stress loss.
p
The “Key features of our main credit risk models” table on the
next page shows the number and key features of the models we
use to derive PD, LGD and EAD for our main portfolios and asset
classes, and is followed by more detailed explanations of these
models and parameters.
›
Refer to the 31 December 2021 Pillar 3 Report, available under
“Pillar 3 disclosures” at
ubs.com/investors
,
for more information
about the regulatory capital calculation under the advanced
internal ratings-based approach
123
Key features of our main credit risk models
Portfolio in scope
Asset class
Model
approach
Number of
main models
Main drivers
Number of
years of loss
data
1
Probability of
default
Sovereigns and central banks
Central governments and
central banks
Scorecard
1
Political, institutional and economic indicators
>10
Owner-occupied mortgages in
Switzerland and the US
Retail: residential
mortgages
Scorecard
2
Behavioral data, affordability relative to income,
property type, loan-to-value. Separate models for
mortgages in Switzerland and the US
27
Income-producing real estate
mortgages
Retail: residential
mortgages,
Corporates: specialized
lending
Scorecard
1
Loan-to-value, debt service coverage, financial data
(for large corporates only), behavioral data. Weights
of risk drivers differ between corporate and private
clients
27
Lombard lending
Retail: other
Merton type
1
Loan-to-value, historical asset returns, behavioral
data
15
Small and medium-sized
enterprises
Corporates: other lending
Scorecard
1
Financial data including balance sheet ratios and
profit and loss, behavioral data. Weights of risk
drivers differ depending on the corporate client sub-
segment
27
Credit cards in Switzerland
Retail: qualifying
revolving retail and other
retail,
Corporates: other lending
Scorecard
1
Client type and characteristics (revolver, transactor,
new client, dormant client), and behavioral data
14
Banks
Banks and securities
dealers
Scorecard
4
Financial data including balance sheet ratios and
profit and loss. Separate models for banks –
developed markets, banks – emerging markets,
broker-dealers and investment banks, and private
banks
14
Commodity traders
Corporates: specialized
lending
Scorecard
1
Financial data including balance sheet ratios and
profit and loss, as well as non-financial criteria
23
Aircraft financing
Corporates: other lending
Scorecard
1
Loan-to-value, AuM, strength of legal framework of
source of wealth, and behavioral factors
15
Large corporates
Corporates: other lending
Scorecard /
market data
3
Financial data including balance sheet ratios and
profit and loss, and market data. Separate rating
tools for corporates with publicly traded and highly
liquid stocks (market intelligence tool), private
corporates, and leveraged corporates
14
Other portfolios
Corporates: other
lending,
Public-sector entities and
multi-lateral development
banks
Scorecard /
pooled rating
approach /
rating
template
9
Financial data and/or historical portfolio performance
for pooled ratings. Separate models for hedge funds,
managed funds, insurance companies, commercial
real estate loans, debt REITs, mortgage originators,
public-sector entities and multi-lateral development
banks / supranationals
14
Loss given default
Owner-occupied mortgages in
Switzerland and the US
Retail: residential
mortgages
Statistical
model
2
Loan-to-value, time since last valuation. Separate
models for mortgages in Switzerland and the US
11
Income-producing real estate
mortgages
Retail: residential
mortgages, Corporates:
specialized lending
Statistical
model
1
Loan-to-value, time since last valuation, property
type, location indicator
11
Lombard lending
Retail: other
Statistical
model,
simulation
1
Historical observed loss rates
13
Small and medium-sized
enterprises
Corporates: other lending
Statistical
model
2
Separate models for mortgage and non-mortgage
LGDs. Mortgage models: loan-to-value, time since
last valuation, property type, location indicator. Non-
mortgage models: historical observed loss rates
11–17
Investment Bank – all
counterparties
Across the asset classes
Statistical
model
2
Counterparty and facility specific, including industry
segment, collateral, seniority, legal environment and
bankruptcy procedures. Specific model for sovereign
LGDs based on econometric modeling of past default
events using GDP per capita, government debt, and
other quantitative and qualitative factors such as the
share of multi-lateral debt service, the size of the
banking sector and institutional quality
5–10
Exposure at default
Banking products
Across the asset classes
Statistical
model
3
Separate models based on exposure type (committed
credit lines, revocable credit lines, contingent
products)
>10
Traded products
Across the asset classes
Statistical
model
2
Product-specific market drivers, e.g., interest rates.
Separate models for OTC derivatives, ETDs and SFTs
that generate the simulation of risk factors used for
the credit exposure measure
n/a
1 For sovereign and Investment Bank PD models, the length of internal portfolio history is shown in “Number of years of loss data.”
Risk, capital, liquidity and funding, and balance sheet | Risk management and control
124
Audited |
Internal UBS rating scale and mapping of external ratings
Internal UBS rating
1-year PD range in %
Description
Moody’s Investors
Service mapping
S&P mapping
Fitch mapping
0 and 1
0.00–0.02
Investment grade
Aaa
AAA
AAA
2
0.02–0.05
Aa1 to Aa3
AA+ to AA–
AA+ to AA–
3
0.05–0.12
A1 to A3
A+ to A–
A+ to A–
4
0.12–0.25
Baa1 to Baa2
BBB+ to BBB
BBB+ to BBB
5
0.25–0.50
Baa3
BBB–
BBB–
6
0.50–0.80
Sub-investment grade
Ba1
BB+
BB+
7
0.80–1.30
Ba2
BB
BB
8
1.30–2.10
Ba3
BB–
BB–
9
2.10–3.50
B1
B+
B+
10
3.50–6.00
B2
B
B
11
6.00–10.00
B3
B–
B–
12
10.00–17.00
Caa1 to Caa3
13
>17
Ca to C
CCC to C
CCC to C
Counterparty is in default
Default
Defaulted
D
D
p
Probability of default
PD estimates the likelihood of a counterparty defaulting on its
contractual obligations over the next 12 months. PD ratings are
used for credit risk measurement and are an important input for
determining credit risk approval authorities. For calculating RWA, a
three-basis-point PD floor is applied to banks, corporates and retail
exposures, as required under the Basel III framework. We apply an
eight-basis-point PD floor for Swiss owner-occupied mortgages and
a four-basis-point PD floor for Lombard loans.
PD is assessed using rating tools tailored to the various
categories of counterparties. Statistically developed scorecards,
based on key attributes of the obligor, are used to determine PD
for many corporate clients and loans secured by real estate. Where
available, market data may also be used to derive the PD for large
corporate counterparties. For low-default portfolios, we take into
account available relevant external default data when developing
rating tools. For Lombard loans, our rating approach uses Merton-
type historical return-based model simulations taking into account
potential changes in securities collateral value. These categories
are also calibrated to our internal credit rating scale (masterscale),
designed to ensure a consistent assessment of default
probabilities across counterparties. Our masterscale expresses
one-year default probabilities determined using our various rating
tools by means of distinct classes, with each class incorporating a
range of default probabilities. Counterparties move between
rating classes as our assessment of their PD changes.
The ratings of major credit rating agencies, and their mapping
to our masterscale and internal PD bands, are shown in the
“Internal UBS rating scale and mapping of external ratings” table
above. For Moody’s and S&P, the mapping is based on the long-
term average of one-year default rates available from these rating
agencies, with Fitch ratings being mapped to the equivalent S&P
ratings. For each external rating category, the average default rate
is compared with our internal PD bands to derive a mapping to
our internal rating scale. Our internal rating of a counterparty may
thus diverge from one or more of the correlated external ratings
shown in the table. Observed defaults by rating agencies may vary
through economic cycles, and we do not necessarily expect the
actual number of defaults in our equivalent rating band to equal
the rating agencies’ average in any given period. We periodically
assess the long-term average default rates of credit rating
agencies’ ratings and adjust their mapping to our masterscale as
needed to reflect any material changes.
Exposure at default
EAD is the amount we expect to be owed by a counterparty at
the time of possible default. We derive EAD from current exposure
to the counterparty and possible future exposure development.
The EAD of an on-balance sheet loan is its notional amount. For
off
-
balance sheet
co
mmitments
that are not drawn, credit
conversion factors (CCFs) are used in order to obtain an expected
on
-
balance sheet
amount. Such CCFs are based on historical
observations
.
To comply with regulatory guidance, we floor
individual observed CCF values at zero in the CCF model; i.e., we
assume that the drawn EAD will be no less than the drawn amount
one year prior to default.
For traded products, we derive EAD by modeling the range of
possible exposure outcomes at various points in time using scenario
and statistical techniques. We assess the net amount that may be
owed to us or that we may owe to others, taking into account the
effect of market movements over the potential time it would take
to close out positions. For ETDs, calculation of EAD takes into
account collateral margin calls. When measuring individual
counterparty exposure against credit limits, we consider the
maximum likely exposure measured to a high level of confidence.
However, when aggregating exposures to different counterparties
for portfolio risk measurement purposes, we use the expected
exposure to each counterparty at a given time period (usually one
year) generated by the same model.
125
We assess exposures where there is a material correlation
between the factors driving the credit quality of the counterparty
and those driving the potential future value of our traded
products exposure (wrong-way risk), and we have established
specific controls to mitigate such risks.
Loss given default
LGD is the magnitude of the likely loss if there is a default. Our
LGD estimates, which consider downturn conditions, include loss
of principal, interest and other amounts (such as workout costs,
including the cost of carrying an impaired position during the
workout process) less recovered amounts. We determine LGD
based on the likely recovery rate of claims against defaulted
counterparties, which depends on the type of counterparty and
any credit mitigation
due to
collateral or guarantees. Our
estimates are supported by internal loss data and external
information,
where available.
If
we hold collateral, such as
marketable securities or a mortgage on a property, LTV ratios are
typically a key parameter in determining LGD. For low-default
portfolios, where available, we take into account relevant external
default data in the rating tool development. In RWA calculation,
a regulatory LGD floor of 10% is applied for exposures secured
by residential properties. Additionally, we apply a 25% LGD floor
for Lombard loans in Global Wealth Management outside Region
Americas and a 20% LGD floor for Lombard loans in Global
Wealth Management Region Americas. All other LGDs are subject
to a 5% floor.
Expected loss
Credit losses are an inherent cost of doing business and the
occurrence and amount of credit losses can be erratic. We use the
concept of expected loss to quantify future credit losses that may
be implicit in our current portfolio. The expected loss for a given
credit facility is a product of the three components described
above, i.e., PD, EAD and LGD. We aggregate the expected loss for
individual counterparties to derive expected portfolio credit losses.
Expected loss (EL) for regulatory and internal risk control
purposes is a statistical measure used to estimate the average
annual costs we expect to experience from positions that become
impaired. EL is the basis for quantifying credit risk in all our
portfolios. We use a statistical modeling approach to estimate the
loss profile of each of our credit portfolios over a one-year period
to a specified level of confidence. The mean value of this loss
distribution is the expected loss. EL provides an indication of the
level of risk in our portfolio and it may change over time. Some
parameters have to be estimated on a conservative basis in order
to meet the regulatory requirements for banks applying the
internal ratings-based approach to determine RWA.
IFRS 9 – ECL credit risk models
Comparison of Basel III EL and IFRS 9 ECL credit risk models
The IFRS 9 expected credit loss (ECL) concept has a number of key
differences from our standard credit risk models, both in the loss
estimation process and the r
esult thereof.
Most notably,
regulatory Basel
III
EL parameters are through
-
the
-
cycle /
downturn estimates, which might include a margin of
conservatism, while IFRS 9 ECL parameters are typically point-in-
time, reflecting current economic conditions and future outlook.
The table on the next page summarizes the main differences.
Stage 1 and 2 ECL releases in 2021 were USD 123 million and
respective allowances and provisions as of 31 December 2021
were USD
50
3
mi
llion
.
This includes
ECL allowances and
provisions of USD
436
million related to positions under the
Basel III advanced internal ratings-based approach. Basel III EL for
non-defaulted positions increased by USD 34 million to USD 919
million.
›
Refer to “Note 1 Summary of material accounting policies” in the
“Consolidated financial statements” section of this report for
more information about our accounting policy for allowances
and provisions for ECL including key definitions relevant for the
ECL calculation under IFRS 9
Expected credit loss
ECL are defined as the difference between contractual cash flows
and those UBS expects to receive, discounted at the effective
interest rate (EIR). For loan commitments and other credit facilities
in scope of ECL requirements, expected cash shortfalls are
determined by considering expected future drawdowns. Rather
than focusing on an average through-the-cycle expected annual
loss, the purpose of ECL is to estimate the amount of losses
inherent in a portfolio based on current conditions and future
outlook (a point-in-time measure), whereby such a forecast has to
include all information available without undue cost and effort,
and address multiple scenarios where there is perceived non-
linearity between changes in economic conditions and their effect
on credit losses. From a credit risk modeling perspective, ECL
parameters are generally derivations of the factors assessed for
regulatory Basel III EL.
Risk, capital, liquidity and funding, and balance sheet | Risk management and control
126
The table below shows the main differences between the two expected loss measures.
Basel III EL (advanced internal ratings-based approach)
IFRS 9 ECL
Scope
The Basel III advanced internal ratings-based (A-IRB)
approach applies to most credit risk exposures. It includes
transactions measured at amortized cost, at fair value
through profit or loss and at fair value through OCI,
including loan commitments and financial guarantees.
The IFRS 9 ECL calculation mainly applies to financial assets
measured at amortized cost and debt instruments measured at fair
value through OCI, as well as loan commitments and financial
guarantees not at fair value through profit or loss.
12-month versus
lifetime expected
loss
The Basel III A-IRB approach takes into account expected
losses resulting from expected default events occurring
within the next 12 months.
In the absence of a significant increase in credit risk (SICR), a
maximum 12-month ECL is recognized to reflect lifetime cash
shortfalls that will result if a default event occurs in the 12 months
after the reporting date (or a shorter period if the expected lifetime
is less). Once an SICR event has occurred, a lifetime ECL is
recognized considering expected default events over the life of the
transaction.
Exposure at default
(EAD)
EAD is the amount we expect a counterparty to owe us at
the time of a possible default. For banking products, EAD
equals book value as of the reporting date; for traded
products, such as securities financing transactions, EAD is
modeled. EAD is expected to remain constant over a 12-
month period. For loan commitments, a credit conversion
factor is applied to model expected future drawdowns over
the 12-month period, irrespective of the actual maturity of a
particular transaction. The credit conversion factor includes
downturn adjustments.
EAD is generally calculated on the basis of the cash flows that are
expected to be outstanding at the individual points in time during
the life of the transaction, discounted to the reporting date using
the effective interest rate. For loan commitments, a credit
conversion factor is applied to model expected future drawdowns
over the life of the transaction without including downturn
assumptions. In both cases, the time period is capped at 12
months, unless an SICR has occurred.
Probability of
default
(PD)
PD estimates are determined on a through-the-cycle (TTC)
basis. They represent historical average PDs, taking into
account observed losses over a prolonged historical period,
and therefore are less sensitive to movements in the
underlying economy.
PD estimates will be determined on a point-in-time (PIT) basis,
based on current conditions and incorporating forecasts for future
economic conditions at the reporting date.
Loss given default
(LGD)
LGD includes prudential adjustments, such as downturn LGD
assumptions and floors. Similar to PD, LGD is determined on
a TTC basis.
LGD should reflect the losses that are reasonably expected and
prudential adjustments should therefore not be applied. Similar to
PD, LGD is determined on the basis of a PIT approach.
Use of scenarios
n / a
Multiple forward-looking scenarios have to be taken into account
to determine a probability-weighted ECL.
Further key aspects of credit risk models
Stress loss
We complement our statistical modeling approach with scenario-
based stress loss measures. Stress tests are run regularly to
monitor potential effects of extreme, but nevertheless plausible,
events on our portfolios, under which key credit risk parameters
are assumed to deteriorate substantially. Where we consider it
appropriate, we apply limits on this basis.
Stress scenarios and methodologies are tailored to portfolios’
natures, ranging from regionally focused to global systemic
events, and varying in time horizon. For example, for our loan
underwriting portfolio, we apply a global market event under
which, simultaneously, the market for loan syndication freezes,
market conditions significantly worsen, and credit quality
deteriorates. Similarly, for Lombard lending we use a range of
scenarios representing instantaneous market shocks to all
collateral and exposure positions, taking into consideration
liquidity and potential concentration. The portfolio-specific stress
test for our mortgage lending business in Switzerland reflects a
multi-year event, and the overarching stress test for global
wholesale and CCR exposure to corporations uses a one-year
global stress event and takes into account exposure concentration
to single counterparties.
›
Refer to “Stress testing” in this section for more information
about our stress testing framework
127
Credit risk model confirmation
Our approach to model confirmation involves both quantitative
methods, e.g., monitoring compositional changes in portfolios
and results of backtesting, and qualitative assessments, such as
feedback from users on model output as a practical indicator of a
model’s performance and reliability.
Material changes in portfolio composition may invalidate the
conceptual soundness of a model. We therefore perform regular
analyses of the evolution of portfolios to identify such changes in
the structure and credit quality of portfolios. This includes analyses
of changes in key attributes, changes in portfolio concentration
measures and changes in RWA.
›
Refer to “Risk measurement” in this section for more
information about our approach to model confirmation
procedures
Backtesting
We monitor the performance of models by backtesting and
benchmarking them, with model outcomes compared with actual
results, based on our internal experience and externally observed
results. To assess the predictive power of credit exposure models
for traded products, such as OTC derivatives and ETD products,
we statistically compare predicted future exposure distributions at
different forecast horizons with realized values.
For PD, we use statistical modeling to derive a predicted
distribution of the number of defaults. The observed number of
defaults is compared with this distribution, letting us derive a
statistical level of confidence in the model conservatism. We also
derive a lower and upper limit for the average default rate. If the
portfolio average PD lies outside the derived interval, the rating
tool is, as a general rule, recalibrated.
For LGD, backtesting statistically tests whether the mean
difference between the observed and predicted LGD is zero. If the
test fails, there is evidence that our predicted LGD is too low. In
such cases, and where these differences are outside expectations,
models are recalibrated.
Main credit risk models backtesting by regulatory asset class
Length of time series
used for the calibration
(in years)
Actual rates in %
Estimated average rates
at the start of
2021 in %
Average of last
5 years
1
Min. of last
5 years
2
Max. of last
5 years
2
Probability of default
3
Central governments and central banks
>10
4
0.00
0.00
0.00
0.22
Banks and securities dealers
>10
0.13
0.00
0.53
0.69
Public-sector entities, multi-lateral development banks
>10
0.04
0.00
0.21
0.21
Corporates: specialized lending
>10
0.36
0.14
0.60
1.24
Corporates: other lending
>10
0.27
0.20
0.33
0.46
Retail: residential mortgages
>20
0.22
0.16
0.28
0.54
Retail: other
>10
0.02
0.00
0.10
0.25
Loss given default
Central governments and central banks
>10
42.49
Banks and securities dealers
>10
48.69
Public-sector entities, multi-lateral development banks
>10
24.55
Corporates: specialized lending
>10
0.19
0.00
0.92
22.77
Corporates: other lending
>10
18.12
0.46
27.00
38.28
Retail: residential mortgages
>20
0.58
0.00
0.92
21.34
Retail: other
>10
1.77
0.00
26.64
Credit conversion factors
Corporates
>10
21.06
6.93
37.91
38.72
1 Average of all observations over the last five years. 2 Minimum / maximum annual average of observations in any single year from the last five years. Yearly averages are only calculated where five or more
observations occurred during that year. 3 Average PD estimation is based on all rated clients in the portfolio. 4 Sovereign PD model is calibrated to UBS masterscale, length of time series shows span of internal
history for this portfolio.
Risk, capital, liquidity and funding, and balance sheet | Risk management and control
128
CCFs, used for the calculation of EAD for undrawn facilities
with corporate counterparties, are dependent on several credit
facility contractual dimensions. We compare the predicted
amount drawn with observed historical use of such facilities by
defaulted counterparties. If any statistically significant deviation is
observed, the relevant CCFs are redefined.
The “Main credit risk models backtesting by regulatory asset
class” table on the previous page compares the current model
calibration for PD, LGD and CCFs with historical observed values
over the last five years.
Changes to models and model parameters during the period
As part of our continuous efforts to enhance models to reflect
market developm
ents and newly available data
,
w
e
updat
ed
several models in 2021.
In Personal & Corporate Banking, we introduced a new model
for credit card exposures, new rating models for the public-sector
entities portfolio and a new LGD and CCF model for the industrial
goods leasing portfolio.
In Global Wealth Management, a new model was introduced
for the aircraft financing portfolio.
F
or the income
-
producing real estate mortgages
,
w
e
recalibrated the risk parameters and for mortgages in Switzerland,
we updated the LGD model.
In the Investment Bank, a new LGD model for leveraged
finance was introduced and the multi-nationals and financials
LGD was recalibrated.
In Group Functions, we extended the use of internal Group
models to the sovereign portfolio of the Group Liquidity Reserve
(GLR). Additionally, further exposures in GLR (e.g., covered bonds)
have been moved to the standardized approach.
For CCR models, we recalibrated the market parameters in the
SFT model. The transition from LIBOR required a number of model
changes for CCR models, for traded products to be able to
consume the new alternative reference rate curves.
Where required, changes to models and model parameters
were approved by FINMA before being made.
›
Refer to “Risk-weighted assets” in the “Capital, liquidity and
funding, and balance sheet” section of this report for more
information about the effect of the changes to models and
model parameters on credit risk RWA
Future credit risk-related regulatory capital developments
In December 2017, the Basel Committee on Banking Supervision
(the BCBS) announced the finalization of the Basel III framework,
with an implementation date of 1 January 2023. We expect the
Swiss regulations to come into force in 2024. The updated
framework makes a number of revisions to the internal ratings-
based (IRB) approaches, namely: (i) removing the option of using
the A-IRB approach for certain asset classes (including large and
medium-sized corporate clients, and banks and other financial
institutions); (ii) placing floors on certain model inputs under the
IRB approach, e.g., PD and LGD; and (iii) introducing various
requirements to reduce RWA variability (e.g., for LGD).
The published framework has a number of requirements that
are subject to national discretion. Also, revisions to the credit
valuation adjustment (CVA) framework were published, including
the removal of the advanced CVA approach. UBS has a close
dialogue with FINMA to discuss in detail the implementation
objectives and prepare for a smooth transition of the capital
regime for credit risk.
›
Refer to “Capital management objectives, planning and
activities” in the “Capital, liquidity and funding, and balance
sheet” section of this report for more information about the
development of RWA
›
Refer to “Risk measurement” in this section for more
information about our approach to model confirmation
procedures
›
Refer to the “Regulatory and legal developments” and “Risk
factors” sections of this report for more information
Credit policies for distressed assets
The “Exposure categorization” chart on the next page shows how
we categorize banking products and
securities financing
transactions as non-performing, defaulted / credit -impaired and
purchased or originated credit-impaired.
Non-performing
Audited |
non-performing when: (i) it is more than 90 days past due; (ii) it is
subject to restructuring proceedings, where preferential
conditions concerning interest rates, subordination, tenor, etc.
have been granted in order to avoid default of the counterparty
(forbearance); (iii) the counterparty is subject to bankruptcy /
enforced liquidation proceedings in any form, even if there is
sufficient collateral to cover the due payment; or (iv) there is other
evidence that payment obligations will not be fully met without
recourse to collateral.
129
Default and credit-impaired
UBS uses a single definition of default for classifying assets and
determining the PD of its obligors for risk modeling purposes. The
definition of default is based on quantitative and qualitative
criteria. A counterparty is classified as defaulted when material
payments of interest, principal or fees are overdue for more than
90 days, or more than 180 days for certain exposures in relation
to loans to private and commercial clients in Personal & Corporate
Banking and to private clients of Global Wealth Management
Region Switzerland. UBS does not consider the general 90-day
presumption for default recognition appropriate for
those
portfolios, given the cure rates, which show that strict application
of the 90-day criterion would not accurately reflect the inherent
credit risk. Counterparties are also classified as defaulted when:
bankruptcy, insolvency proceedings or enforced liquidation have
commenced; obligations have been restructured on preferential
terms (forbearance); or there is other evidence that payment
obligations will not be fully met without recourse to collateral. The
latter may be the case even if, to date, all contractual payments
have been made when due. If one claim against a counterparty is
defaulted on, generally all claims against the counterparty are
treated as defaulted.
An
instrument is classified as credit
-
impaired if the
counterparty is classified as defaulted and / or the instrument is
identified as purchased or originated credit-impaired (POCI). An
instrument is POCI if it has been purchased at a deep discount to
its carrying amount following a risk event of the issuer or
originated with a defaulted counterparty. Once a financial asset is
classified as defaulted / credit-impaired (except POCI), it is
reported as a stage 3 instrument and remains as such unless all
past due amounts have been rectified, additional payments have
been made on time, the position is not classified as credit-
restructured, and there is general evidence of credit recovery. A
three-month probation period is applied before a transfer back to
stages 1 or 2 can be triggered. However, most instruments remain
in stage 3 for a longer period. As of 31 December 2021, we had
no instruments classified as POCI on our books.
p
Risk, capital, liquidity and funding, and balance sheet | Risk management and control
130
Forbearance (credit restructuring)
Audited |
occurred, we may grant concessions to borrowers in financial
difficulties that we would otherwise not consider in the normal
course of business, such as offering preferential interest rates,
extending maturity, modifying the schedule of repayments, debt /
equity swap, subordination, etc. When a forbearance measure
takes place, each case is considered individually and the exposure
is generally classified as defaulted. Forbearance classification
remains until the loan is repaid or written off, non-preferential
conditions are granted that supersede the preferential conditions,
or the counterparty has recovered and the preferential conditions
no longer exceed our risk tolerance.
Contractual adjustments when there is no evidence of
imminent payment default, or where changes to terms and
conditions are within our usual risk tolerance, are not considered
to be forborne.
p
Loss history statistics
An instrument is classified as credit-impaired if the counterparty
has defaulted. This also includes credit-impaired exposures for
which no loss has occurred or for which no allowance has been
recognized (for example because we expect to fully recover the
exposures via collateral held).
The “Loss history statistics” table below provides a five-year
history of credit loss experience for loans and advances to banks
and customers, and ratios of those credit losses relative to credit-
impaired and non-performing loans and advances to banks and
customers. For 2017, the amounts are based on IAS 37 and
IAS 39; for 2018 and onward, the amounts are based on IFRS 9.
›
The majority of the credit-impaired exposure relates to loans
and advances in our Swiss domestic business. Refer to “Note 9
Financial assets at amortized cost and other positions in scope of
expected credit loss measurement” and “Note 20 Expected credit
loss measurement” in the “Consolidated financial statements”
section of this report for more information about ECL
measurement
›
Refer to “Note 14a Other financial assets measured at amortized
cost” in the “Consolidated financial statements” section of this
report for more details
Loss history statistics
USD million, except where indicated
31.12.21
IFRS 9
31.12.20
IFRS 9
31.12.19
IFRS 9
31.12.18
IFRS 9
31.12.17
IAS 37, IAS 39
Loans and advances to banks and customers (gross)
414,099
396,049
340,003
338,000
342,604
Credit-impaired loans and advances to banks and customers
2,150
2,945
2,309
2,300
1,104
Non-performing loans and advances to banks and customers
2,387
3,176
2,466
2,419
2,149
ECL allowances and provisions for credit losses
1,2
1,165
1,468
1,029
1,054
712
of which: allowances for loans and advances to banks and customers
1
857
1,076
770
780
678
Write-offs
137
356
142
210
101
of which: write-offs for loans and advances to banks and customers
118
348
122
192
101
Credit loss (expense) / release
3
148
(694)
(78)
(118)
(131)
Ratios
Credit-impaired loans and advances to banks and customers as a percentage of loans and advances to banks
and customers (gross)
0.5
0.7
0.7
0.7
0.3
Non-performing loans and advances to banks and customers as a percentage of loans and advances to banks
and customers (gross)
0.6
0.8
0.7
0.7
0.6
ECL allowances for loans and advances to banks and customers as a percentage of loans and advances to
banks and customers (gross)
0.2
0.3
0.2
0.2
0.2
Write-offs as a percentage of average loans and advances to banks and customers (gross) outstanding during
the period
0.0
0.1
0.0
0.1
0.0
1 Includes collective loan loss allowances for 31 December 2017. Until 31 December 2017 did not include allowances for other receivables (USD 19 million). 2 Includes provisions for ECL of guarantees and loan
commitments and allowances for securities financing transactions. 3 Includes credit loss (expense) / release for other financial assets at amortized cost, guarantees, loan commitments, and securities financing
transactions.
131
Market risk
Key developments
Market risk remained at low levels as a result of our continued
focus on managing tail risks. Average management value-at-risk
(VaR) (1-day, 95% confidence level) decreased to USD 11 million
from USD 13 million in 2020, mainly as a result of the Investment
Bank’s equities trading business. The number of negative
backtesting exceptions within a 250-business-day window
increased to 4 from 3 by the end of 2021. As these backtesting
exceptions remained below 5, the FINMA VaR multiplier for
market risk RWA remained unchanged at 3.0 as of 31 December
2021.
Audited |
Market risks arise from both trading and non-trading business
activities.
–
Trading market risks are mainly connected with primary debt and
equity underwriting and securities and derivatives trading for
market-making and client facilitation in our Investment Bank, as
well as the remaining positions in Non-core and Legacy Portfolio
in Group Functions and our municipal securities trading business
in Global Wealth Management.
–
Non-trading market risks arise predominantly in the form of
interest rate and foreign exchange risks connect
ed
with
personal banking and lending in our wealth management
business, our Swiss personal and corporate banking business,
the Investment Bank’s lending business, and treasury activities.
–
Group Treasury
assumes market risks in the process of
managing interest rate risk, structural foreign exchange risk
and the Group’s liquidity and funding profile, including HQLA.
–
Equity and debt investments can also give rise to market risks,
as can some aspects of employee benefits, such as defined
benefit pension schemes.
p
Audited |
management techniques
–
Market risk limits are set for the Group, the business divisions,
Group Treasury and Non-core and Legacy Portfolio at granular
levels in the various business lines, reflecting the nature and
magnitude of the market risks.
–
Management VaR measures exposures under the market risk
framework, including trading market risks and some non-
trading market risks. Non-trading market risks not included in
VaR are also covered in the risks controlled by Market &
Treasury Risk Control, as set out below.
–
Our primary portfolio measures of market risk are liquidity-
adjusted stress (LAS) loss and VaR. Both are common to all
business divisions and subject to limits that are approved by the
Board of Directors (the BoD).
–
These measures are complemented by concentration and
granular limits for general and specific market risk factors. Our
trading businesses are subject to multiple market risk limits,
which take into account the extent of market liquidity and
volatility, available operational capacity, valuation uncertainty
and, for our single-name exposures, issuer credit quality.
–
Trading market risks are managed on an integrated basis at
portfolio level. As risk factor sensitivities change due to new
transactions, transaction expiries or changes in market levels,
risk factors are dynamically rehedged to remain within limits.
Thus we do not generally seek to distinguish in the trading
portfolio between specific positions and associated hedges.
–
Issuer risk is controlled by limits applied at business division
level based on jump-to-zero measures, which estimate
maximum default exposure (the default event loss assuming
zero recovery).
–
Non-trading foreign exchange risks are managed under market
risk limits, with the exception of Group Treasury management
of consolidated capital activity.
Our Market & Treasury Risk Control function applies a holistic
risk framework, set
ting
the appetite for treasury
-
related risk
-
taking activities across the Group. A key element of the
framework is an overarching economic value sensitivity limit, set
by the BoD. Th is limit is linked to the level of Basel III common
equity tier 1 (CET1) capital, and takes into account risks arising
from interest rates, foreign exchange and credit spreads. Also, the
sensitivity of net interest income to changes in interest rates is
monitored against targets set by the Group CEO, so as to analyze
the outlook and volatility of net interest income based on market-
expected interest rates. Limits are also set by the BoD to balance
the effect of foreign exchange movements on our CET1 capital
and CET1 capital ratio. Non-trading interest rate and foreign
exchange risks are included in Group-wide statistical and stress
testing metrics, which flow into our risk appetite framework.
Equity and debt investments are subject to a range of risk
controls, including preapproval of new investments by business
management and Risk Control and regular monitoring and
reporting. They are also included in Group-wide statistical and
stress testing metrics.
p
›
Refer to “Currency management” in the “Capital, liquidity and
funding, and balance sheet” section of this report for more
information about Group Treasury’s management of foreign
exchange risks
›
Refer to the “Capital, liquidity and funding, and balance sheet”
section of this report for more information about the sensitivity
of our CET1 capital and CET1 capital ratio to currency
movements
Risk, capital, liquidity and funding, and balance sheet | Risk management and control
132
Market risk stress loss
We measure and manage market risks through a comprehensive
framework of non -statistical measures and related limits, as well
as VaR. This includes an extensive set of stress tests and scenario
analyses, continuously evaluated to ensure that losses resulting
from an extreme yet plausible event do not exceed our risk
appetite.
Liquidity-adjusted stress
LAS is our primary stress loss measure for Group-wide market risk.
The LAS framework captures the economic losses that could arise
under specified stress scenarios. This is partially done by replacing
the standard 1-day and 10-day holding period assumptions used
for management and regulatory VaR with liquidity-adjusted
holding periods, as explained below. Shocks are applied to
positions based on expected market movements in the liquidity-
adjusted holding periods resulting from the specified scenario.
The holding periods used for LAS are calibrated to reflect the
time needed to reduce or hedge the risk of positions in each major
risk factor in a stressed environment, assuming maximum
utilization of the relevant position limits. We apply minimum
holding periods, regardless of observed liquidity levels,
as
identification of and reaction to a crisis may not always be
immediate.
The expected market movements are derived using historical
market behavior
(
based on analysis of historical events
)
and
forward
-
looking analysis includ
ing
consideration of defined
scenarios that have not occurred in the past.
LAS
-
based limits appl
y
at
several
levels: Group, business
division, Group Treasury and Non-core and Legacy Portfolio;
business area; and sub-portfolio. LAS is also the core market risk
component of our combined stress test framework and therefore
integral to our overall risk appetite framework.
›
Refer to “Risk appetite framework” in this section for more
information
›
Refer to “Stress testing” in this section for more information
about our stress testing framework
Value-at-risk
VaR definition
Audited |
potential market risk losses over a set time horizon (holding
period) at an established level of confidence. VaR assumes no
change in the Group’s trading positions over the set time horizon.
We calculate VaR daily. The profit or loss distribution VaR is
derived from our internally developed VaR model, which simulates
returns over the holding period for those risk factors our trading
positions are sensitive to, and subsequently quantifies the profit /
loss effect of these risk factor returns on trading positions. Risk
factor returns associated with general interest rate, foreign
exchange and commodities risk factor classes are based on a pure
historical simulation approach,
us
ing
a five
-
year look
-
back
window. Risk factor returns for selected issuer-based risk factors,
e.g., equity price and credit spreads, are split into systematic and
residual issuer-specific components using a factor model
approach. Systematic returns are based on historical simulation,
and residual returns on a Monte Carlo simulation. VaR model
profit or loss distribution is derived from the sum of systematic
and residual returns in such a way that we consistently capture
systematic and residual risk. Correlations among risk factors are
implicitly captured via a historical simulation approach. When
modeling risk factor returns we consider the stationarity
properties of the historical time series of risk factor changes.
Depending on the stationarity properties of the risk factors within
a given factor class, we model the factor returns using absolute
returns or logarithmic returns. Risk factor return distributions are
updated fortnightly.
Our VaR model does not have full revaluation capability, but
we source full revaluation grids and sensitivities from front-office
systems, enabling us to capture material non-linear profit or loss
effects.
We use a single VaR model for both internal management
purposes and determining market
risk
R
WA, although we
consider different confidence levels and time horizons. For
internal management purposes, we establish risk limits and
measure exposures using VaR at a
95
% confidence level with a
1-day holding period, aligned to the way we consider the risks
associated with our trading activities. The regulatory measure of
market risk used to underpin the market risk capital requirement
under Basel III requires a measure equivalent to a
99
% confidence
level using a 10-day holding period. To calculate a 10-day holding
period VaR, we
use
10
-
day risk factor returns,
with
all
observations equally weighted.
Additionally, the portfolio population for management and
regulatory VaR is slightly different. The one for regulatory VaR
meets regulatory requirements for inclusion in regulatory VaR.
Management VaR includes a broader range of positions. For
example, regulatory VaR excludes credit spread risks from the
securitization portfolio, which are treated instead under the
securitization approach for regulatory purposes.
133
We also use stressed VaR (SVaR) for the calculation of market
risk RWA. SVaR uses broadly the same methodology as regulatory
VaR and is calculated using the same population, holding period
(10-day) and confidence level (
99
%). Unlike regulatory VaR, the
historical data set for SVaR is not limited to five years, instead
covering from 1 January 2007 to the present. In deriving SVaR, we
seek the largest 10-day holding period VaR for the current Group
portfolio across all one-year look-back windows from 1 January
2007 to the present. SVaR is computed weekly.
p
›
Refer to the 31 December 2021 Pillar 3 Report, available under
“Pillar 3 disclosures” at
ubs.com/investors
, for more information
about the regulatory capital calculation under the advanced
internal ratings-based approach
Management VaR for the period
The tables below show minimum, maximum, average and period-
end management VaR by business division and Group Functions,
and by general market risk type. We continued to maintain
management VaR at low levels, with average VaR decreasing to
USD 11 million from USD 13 million in 2020.
Audited |
Management value-at-risk (1-day, 95% confidence, 5 years of historical data) of our business divisions and Group
Functions by general market risk type
1
For the year ended 31.12.21
USD million
Equity
Interest
rates
Credit
spreads
Foreign
exchange
Commodities
Min.
1
7
5
1
2
Max.
35
13
11
9
5
Average
7
9
7
3
3
31.12.21
8
11
7
6
3
Total management VaR, Group
4
36
11
12
Average (per business division and risk type)
Global Wealth Management
1
3
1
2
0
1
2
0
0
Personal & Corporate Banking
0
0
0
0
0
0
0
0
0
Asset Management
0
0
0
0
0
0
0
0
0
Investment Bank
3
36
11
11
7
9
7
3
3
Group Functions
4
8
5
4
0
4
4
1
0
Diversification effect
2,3
(6)
(5)
0
(5)
(5)
(1)
0
For the year ended 31.12.20
USD million
Equity
Interest
rates
Credit
spreads
Foreign
exchange
Commodities
Min.
3
6
5
2
2
Max.
29
11
11
7
6
Average
10
8
7
4
4
31.12.20
6
8
8
3
3
Total management VaR, Group
8
31
13
11
Average (per business division and risk type)
Global Wealth Management
0
2
1
1
0
1
1
0
0
Personal & Corporate Banking
0
0
0
0
0
0
0
0
0
Asset Management
0
0
0
0
0
0
0
0
0
Investment Bank
7
32
12
10
10
7
6
4
4
Group Functions
4
7
5
6
0
4
3
1
0
Diversification effect
2,3
(5)
(8)
0
(4)
(4)
(1)
0
1 Statistics at individual levels may not be summed to deduce the corresponding aggregate figures. The minima and maxima for each level may well occur on different days, and likewise, the VaR for each business
line or risk type, being driven by the extreme loss tail of the corresponding distribution of simulated profits and losses for that business line or risk type, may well be driven by different days in the historical time series,
rendering invalid the simple summation of figures to arrive at the aggregate total. 2 Difference between the sum of the standalone VaR for the business divisions and Group Functions and the VaR for the Group as
a whole. 3 As the minima and maxima for different business divisions and Group Functions occur on different days, it is not meaningful to calculate a portfolio diversification effect.
p
Risk, capital, liquidity and funding, and balance sheet | Risk management and control
134
VaR limitations
Audited |
implied by VaR for a variety of reasons.
–
VaR is calibrated to a specified level of confidence and may not
indicate potential losses beyond this confidence level.
–
The 1-day time horizon used for VaR for internal management
purposes (10-day for regulatory VaR) may not fully capture
market risk of positions that cannot be closed out or hedged
within the specified period.
–
In some cases, VaR calculations approximate the effect of
changes in risk factors on the values of positions and portfolios.
This may happen due to the number of risk factors included in
the VaR model needing to be limited.
–
Effects of extreme market movements are subject to estimation
errors, which may result from non-linear risk sensitivities, and
the potential for actual volatility and correlation levels to differ
from assumptions implicit in VaR calculations.
–
Using a five-year window means sudden increases in market
volatility will tend not to increase VaR as quickly as the use of
shorter historical observation periods, but such increases will
affect VaR for a longer period of time. Similarly, after periods
of increased volatility, as markets stabilize, VaR predictions will
remain more conservative for a period of time influenced by
the length of the historical observation period.
SVaR is subject to the limitations noted for VaR above, but the
use of one-year data sets avoids the smoothing effect of the five-
year data set used for VaR and the absence of the five-year
window gives a longer history of potential loss events. Therefore,
although the significant period of stress during the 2007–2009
financial crisis is no longer contained in the historical five-year
period used for management and regulatory VaR, SVaR continues
to use that data. This approach aims to reduce the procyclicality
of the regulatory capital requirements for market risks.
We recognize that no single measure can encompass all risks
associated with a position or portfolio. Thus we use a set of
metrics with both overlapping and complementary characteristics
to create a holistic framework that aims to ensure material
completeness of risk identification and measurement. As a
statistical aggregate risk measure, VaR supplements our liquidity-
adjusted stress and comprehensive stress testing frameworks.
We also have a framework to identify and quantify potential
risks not fully captured by our VaR model and refer to such risks
as risks not in VaR. The framework underpins these potential risks
with regulatory capital, calculated as a multiple of regulatory VaR
and stressed VaR.
p
Backtesting of VaR
VaR backtesting is a performance measurement process in which
a 1-day VaR prediction is compared with the realized 1-day profit
or
loss (P&L)
. We compute backtesting VaR using a 99%
confidence level and 1-day holding period for the regulatory VaR
population. Since 99% VaR at UBS is defined as a risk measure
that operates on the lower tail of the P&L distribution, 99%
backtesting VaR is a negative number. Backtesting revenues
exclude non-trading revenues, such as valuation reserves, fees
and commissions, and revenues from intraday trading, to provide
for a like-for-like comparison. A backtesting exception occurs
when backtesting revenues are lower than the previous day’s
backtesting VaR.
135
Statistically, given the 99% confidence level, 2 or 3 backtesting
exceptions a year can be expected. More than 4 exceptions could
indicate that the VaR model is not performing appropriately, as
could too few exceptions over a long period. However, as noted
for VaR limitations above, a sudden increase (or decrease) in
market volatility relative to the five-year window could lead to a
higher (or lower) number of exceptions. Therefore, Group-level
backtesting exceptions are investigated, as are exceptional
positive backtesting revenues, with the results reported to senior
business management, the Group CRO and the Group Chief
Market & Treasury Risk Officer. Internal and external auditors and
relevant regulators are also informed of backtesting exceptions.
The “Group: development of regulatory backtesting revenues
and actual trading revenues against backtesting VaR” chart on the
previous page shows the 12-month development of backtesting
VaR against the Group’s backtesting revenues and actual trading
revenues for 2021. The chart shows both the 99% and the 1%
backtesting VaR. The asymmetry between the negative and
positive tails is due to the long gamma risk profile historically run
in the Investment Bank.
The actual trading revenues include backtesting and intraday
revenues.
The number of negative backtesting exceptions within a 250-
business-day window increased to 4 from 3 by the end of the year.
As these backtesting exceptions remained below 5, the FINMA
VaR multiplier for market risk RWA remained unchanged at 3.0 as
of 31 December 2021.
VaR model confirmation
As well as for regulatory-purposes backtesting described above,
we conduct extended backtesting for internal model confirmation
purposes. This includes observing model performance across the
entire P&L distribution (not just the tails), and at multiple levels
within the business division hierarchies.
›
Refer to “Risk measurement” in this section for more
information about our approach to model confirmation
procedures
VaR model developments in 2021
Audited |
There were no
material changes to the VaR model
in 2021.
p
Future market risk-related regulatory capital developments
In January 2019, the Basel Committee on Banking Supervision
(the BCBS) published the final standards on the minimum capital
requirements for market risk (the Fundamental Review of the
Trading Book). We do not expect these standards to become
mandatory in Switzerland until after the BCBS target effective
date of 1 July 2024.
Key elements of the revised market risk framework include:
(i) changes to the internal model-based approach, including
changes to the model approval and performance measurement
process; (ii) changes to the standardized approach with the aim of
it being a credible fallback method for an internal model-based
approach; and (iii) a revised boundary between trading book and
banking book. UBS maintains a close dialogue with FINMA to
discuss the implementation objectives in more detail and to
provide a smooth transition of the capital regime for market risk.
In September 2021 FINMA mandated UBS to hold an RWA
add-on for the omission of time decay in regulatory VaR and SVaR.
The add-on reflects the outcome of discussions with FINMA
regarding our regulatory VaR model, which started in late 2019.
The integration of time decay into the regulatory VaR model,
which would replace the add-on, is subject to further discussions
between FINMA and UBS.
›
Refer to “Risk-weighted assets” in the “Capital, liquidity and
funding, and balance sheet” section of this report for more
information about the development of RWA including the
regulatory add-on
›
Refer to “Risk measurement” in this section for more
information about our approach to model confirmation
procedures
›
Refer to the “Regulatory and legal developments” and “Risk
factors” sections of this report for more information
Interest rate risk in the banking book
Interest rate risk in the banking book disclosure
Our financial reports’ interest rate risk in the banking book (IRRBB)
disclosure is aligned to the Pillar 3 requirements set by FINMA
Circular “2019/2 Interest Rate Risk – Banks,” which sets minimum
standards for measuring, managing, monitoring and controlling
IRRBB. In particular, the economic value of equity (EVE) sensitivity
is assessed under the six regulatory rate-shock scenarios set in the
FINMA circular, which are currency-specific and not subject to
flooring.
Sources of interest rate risk in the banking book
Audited |
Loans
and advances to banks
,
Loans and advances to customers
,
Financial assets at fair value not held for trading
,
Financial assets
measured at amortized cost
,
Customer deposits
,
Debt issued
measured at amortized cost
, and derivatives, including those
subject to hedge accounting. Fair value changes to these positions
may affect other comprehensive income (OCI) or the income
statement, depending on their accounting treatment.
Risk, capital, liquidity and funding, and balance sheet | Risk management and control
136
Our largest banking book interest rate exposures arise from
customer deposits and lending products in Global Wealth
Management and Personal & Corporate Banking. The inherent
interest rate risks are generally transferred from Global Wealth
Management and Personal & Corporate Banking to Group
Treasury, to manage them centrally. This enables the netting of
interest rate risks across different sources, while leaving the
originating businesses with commercial margin and volume
management. The residual interest rate risk is mainly hedged with
interest rate swaps, to the vast majority of which we apply hedge
accounting. Short-term exposures and high-quality liquid assets
classified as
Financial assets at fair value not held for trading
hedged with derivatives accounted for on a mark-to-market basis.
Long-term fixed-rate debt issued is hedged with interest rate
swaps designated in fair value hedge accounting relationships.
Risk management and governance
IRRBB is measured using several metrics, the most relevant of
which are the following.
–
Interest
rate sensitivities to
changes
in yield curves
are
calculated as changes in the present value of future cash flows
irrespective of accounting treatment. These are also the key risk
factors for statistical and stress-based measures, e.g., value-at-
risk and stress scenarios (including EVE sensitivity), and are
measured and reported daily. EVE sensitivity is the exposure
arising from the most adverse regulatory interest rate scenario
after netting across currencies.
As well as
the regulatory
measure,
we
appl
y
an internal EVE sensitivity me
tric
that
includes additional tier 1 (AT1) capital instruments and
modeled interest rate duration assigned to equity, goodwill
and real estate.
–
Net interest income (NII) sensitivity assesses NII change over a
set time horizon compared with baseline NII, wh
ich
we
internally calculate by assuming interest rates in all currencies
develop according to their market-implied forward rates and
assum
ing
constant business volumes and no specific
management actions. This internally calculated NII sensitivity,
which, unlike the FINMA Pillar 3 disclosure requirements,
includes the contribution from cash held at central banks, is
measured and reported monthly.
We actively manage IRRBB, aiming to reduce the volatility of
NII, while keeping the EVE sensitivity within set internal risk limits.
EVE and NII sensitivity are monitored against limits and triggers,
at consolidated and significant legal entity levels. We also assess
the sensitivity of EVE and NII under stressed market conditions by
applying a suite of parallel and non-parallel interest rate scenarios,
as well as specific economic scenarios.
The Group Asset and Liability Committee (ALCO) and, where
relevant, ALCOs at a legal entity level perform independent
oversight over the management of IRRBB, which is also subject to
Group Internal Audit and model governance.
›
Refer to “Group Internal Audit” in the “Corporate governance”
section of this report and to “Risk measurement” in this section
for more information
Key modeling assumptions
The cash flows from customer deposits and lending products used
in calculation of EVE sensitivity exclude commercial margins and
other spread components, are aggregated by daily time buckets
and are discounted using risk-free rates. Our external issuances
are discounted using UBS’s senior debt curve, and capital
instruments are modeled to the first call date. NII sensitivity, which
includes commercial margins, is calculated over a one-year time
horizon, assuming constant balance sheet structure and volumes,
and considers the flooring effect of embedded interest rate
options.
The average repricing maturity of non-maturing deposits and
loans is determined via replication portfolio strategies designed to
protect product margin. Optimal replicating portfolios are
determined at granular currency- and product-specific levels by
simulating and applying a real-world market rate model to
historically calibrated client rate and volume models.
We use an econometric prepayment model to forecast
prepayment rates on US mortgage loans in UBS Bank USA and
agency mortgage-backed securities (MBSs) held in various
liquidity portfolios of UBS Americas Holding LLC consolidated.
These prepayment rates are used to forecast both mortgage loan
and MBS balances under various macroeconomic scenarios. The
prepayment model is used for a variety of purposes, including risk
management and regulatory stress testing. Swiss mortgages and
fixed-term deposits generally do not carry similar optionality, due
to prepayment and early redemption penalties.
p
137
Effect of interest rate changes on shareholders’ equity and
CET1 capital
The “Accounting and capital effect of changes in interest rates”
table below shows the effects on shareholders’ equity and CET1
capital of gains and losses from changes in interest rates in the
main banking book positions. For instruments held at fair value,
changes in interest rates result in an immediate fair value gain or
loss, recognized either in the income statement or through OCI.
Typically, increases in interest rates would lead to immediate
reductions in the value of our long-term assets held at fair value,
but we would expect such reductions to be offset over time
through higher NII on core banking products.
For assets and liabilities measured at amortized cost, changes
in interest rates do not result in changes in the carrying amount
of the instruments, but could affect the amount of interest
income or expense recognized over time in the income statement.
In addition to the differing accounting treatments, banking
book positions have different sensitivities to different points on
yield curves. For example, portfolios of debt securities, whether
measured at amortized cost or at fair value, and interest rate
swaps, whether designated as cash flow hedges or transacted as
economic hedges, are generally more sensitive to changes in
longer-duration interest rates, whereas deposits and a significant
portion of loans contributing to NII are more sensitive to short-
term rates. These factors are important, as yield curves may not
shift on a parallel basis and could, for example, exhibit an initial
steepening followed by a flattening over time.
Due to the accounting treatment and yield curve sensitivities
outlined above, in a rising rate scenario we would expect to have
an initial decrease in shareholders’ equity, as a result of fair value
losses recognized in OCI. This would be compensated over time
by increased NII, as increases in interest rates affect the shorter
end of the yield curve in particular. The effect on CET1 capital
would be less pronounced, as gains and losses on interest rate
swaps designated as cash flow hedges are not recognized for
regulatory capital purposes. Fair value losses on instruments
designated at fair value should be offset by economic hedges.
Accounting and capital effect of changes in interest rates
1
Recognition
Shareholders’ equity
CET1 capital
Timing
Income statement / OCI
Gains
Losses
Gains
Losses
Loans and deposits at amortized cost
2,3
Gradual
Income statement
l
l
l
l
Other financial assets and liabilities measured at amortized cost
2
Gradual
Income statement
l
l
l
l
Debt issued measured at amortized cost
2,3
Gradual
Income statement
l
l
l
l
Receivables and payables from securities financing transactions
2
Gradual
Income statement
l
l
l
l
Financial assets at fair value not held for trading
Immediate
Income statement
l
l
l
l
Financial assets at fair value through other comprehensive income
Immediate
OCI
l
l
l
Derivatives designated as cash flow hedges
Immediate
OCI
4
l
l
Derivatives designated as fair value hedges
5
Immediate
Income statement
l
l
l
l
Derivatives transacted as economic hedges
Immediate
Income statement
l
l
l
l
1 Refer to the “Reconciliation of IFRS equity to Swiss SRB common equity tier 1 capital” table in the “Capital, liquidity and funding, and balance sheet” section of this report for more information about the differences
between shareholders’ equity and CET1 capital. 2 For fixed-rate financial instruments, changes in interest rates affect the income statement when these instruments roll over and reprice. 3 For hedge accounted
items, a fair value adjustment is applied in line with the treatment of the hedging derivatives. 4 Excluding hedge ineffectiveness that is recognized in the income statement in accordance with IFRS. 5 The fair value
of the derivatives is offset by the fair value adjustment of the hedged items. Under the fair value hedge program applied to cross-currency swaps and foreign currency debt, the foreign currency basis spread is excluded
from the hedge designation and accounted for through OCI, which is included in CET1.
Net interest income sensitivity
The NII sensitivity of Global Wealth Management and Personal &
Corporate Banking is assessed using a number of scenarios
assuming parallel and non-parallel shifts in yield curves, with
various degrees of severity. The results are compared with a
baseline NII, calculated assuming that interest rates in all
currencies develop according to their market-implied forward
rates and under the assumption of constant business volumes and
no specific management actions.
In addition to the above scenario analysis, we monitor NII
sensitivity to immediate parallel shocks of –200 and +200 basis
points against the defined thresholds, under the assumption of
constant balance sheet volume and structure.
As of 31 December 2021, the projected NII was approximately
14% lower than the baseline NII under a parallel shock of –200
basis points, whereas under a parallel +200-basis-point shock it
was approximately 57% higher than the baseline NII.
To shelter our NII level from the persistently low and negative
interest rate environment, in particular in Swiss francs, we rely on
self-funding our lending businesses through our deposit base in
Global Wealth Management and Personal & Corporate Banking,
along with appropriate additional adjustments to our interest
rate-linked product pricing. The loss of such equilibrium on the
balance sheet, for example due to unattractive pricing relative to
peers for either mortgages or deposits, could lead to our NII
decreasing in a persistently low and negative interest rate
environment. As we assume constant business volumes, these
risks do not appear in the aforementioned interest rate scenarios.
Moreover, should the low and negative interest rate
environment worsen,
our NII
could
come under
additional
pressure and we could face additional costs for holding our Swiss
franc HQLA portfolio. A reduction of the Swiss National Bank’s
deposit exemption threshold for banks would also reduce our NII,
as we might not be able to offset higher costs for our cash
holdings, for example by passing on some of the costs to our
depositors. Should euro interest rates also decline further, that
could likewise increase liquidity costs and put NII generated from
euro-denominated loans and deposits under pressure. Depending
on the overall economic and market environment, sustained and
significant negative rates could also lead to Global Wealth
Management and Personal & Corporate Banking clients paying
down their loans, along with reducing any excess cash they hold
with us as deposits. That would reduce the underlying business
volume and lower our NII accordingly.
Risk, capital, liquidity and funding, and balance sheet | Risk management and control
138
The NII impact of a net decrease in deposits would depend on
various factors, including the currency, its interest rate level and
the balance sheet situation, as the impact could be offset by a
reduction in negative-yielding liquidity portfolios or require
alternative funding. If funding were required, the cost would also
significantly depend on term and nature of replacement funding,
whether such funding is raised in wholesale markets or from
swapping with available other currency-denominated funding.
Furthermore, imbalances leading to an excess deposit position
could require additional investments at negative yields, which our
excess deposit balance charging mechanisms might not be able
to sufficiently compensate for.
Economic value sensitivity
Audited |
regulatory EVE sensitivity threshold of
15
% of tier 1 capital. The
exposure is calculated as the theoretical change in the present
value of the banking book under the most adverse of the six
FINMA interest rate scenarios.
As of 31 December 2021, the interest rate sensitivity of our
banking book to a +1-basis-point parallel shift in yield curves was
negative USD
29.9
27.2
million as of 31 December 2020. The change in the interest rate
sensitivity was driven by the execution of transactions in the first
quarter of 2021 that were aimed at protecting our net interest
income should interest rates decrease. The reported interest rate
sensitivity excludes the AT1 capital instruments, as per FINMA
Pillar 3 disclosure requirements, with a sensitivity of USD
4.5
million per basis point, and our equity, goodwill and real estate,
with a modeled sensitivity of USD
22.1
which USD
15.6
5.5
the US dollar and the Swiss franc portfolios, respectively.
The most adverse of the six FINMA interest rate scenarios
would be the “Parallel up” scenario, which would result in a
change in the economic value of equity of negative USD
6.0
billion, representing a pro forma reduction of
10.0
% of tier 1
capital, which would be well below the regulatory outlier test of
15
% of tier 1 capital. The immediate effect of the “Parallel up”
scenario on tier 1 capital as of 31 December 2021 would be a
reduction of
1.8
%, or USD
1.1
banking book that is measured at fair value through profit or loss
and from
Financial assets measured at fair value through other
comprehensive income
. Over time this scenario would have a
positive effect on net interest income.
p
›
Refer to “Note 11 Financial assets measured at fair value
through other comprehensive income” in the “Consolidated
financial statements” section of this report for more information
›
Refer to the “Group performance” section of this report for more
information about sensitivity to interest rate
movements
Audited |
Interest rate risk – banking book
USD million
+1 bp
Parallel up
1
Parallel down
1
Steepener
2
Flattener
3
Short-term up
4
Short-term down
5
CHF
(5.1)
(724.1)
806.3
(254.3)
117.1
(158.7)
162.5
EUR
(1.1)
(196.6)
231.9
(69.0)
37.4
(24.1)
27.4
GBP
0.1
33.3
(32.8)
(31.1)
35.3
45.4
(43.7)
USD
(23.5)
(5,068.3)
4,124.2
(821.4)
(362.3)
(2,165.9)
2,315.6
Other
(0.4)
(85.8)
19.9
(3.7)
(34.5)
(59.6)
3.8
Total effect on economic value of equity as per Pillar 3 requirement as of
31.12.21
(29.9)
(6,041.4)
5,149.5
(1,179.6)
(207.0)
(2,362.9)
2,465.6
Additional tier 1 (AT1) capital instruments
4.5
853.4
(928.4)
(9.6)
197.1
531.5
(553.3)
Total including AT1 capital instruments as of 31.12.21
(25.4)
(5,188.0)
4,221.1
(1,189.2)
(10.0)
(1,831.4)
1,912.3
1 Rates across all tenors move by ±150 bps for Swiss franc, ±200 bps for euro and US dollar and ±250 bps for pound sterling. 2 Short-term rates decrease and long-term rates increase. 3 Short-term rates increase
and long-term rates decrease. 4 Short-term rates increase more than long-term rates. 5 Short-term rates decrease more than long-term rates.
p
Other market risk exposures
Own credit
We are exposed to changes in UBS’s own credit reflected in the
valuation of financial liabilities designated at fair value when
UBS’s own credit risk would be considered by market participants,
except for fully collateralized liabilities or other obligations for
which it is established market practice to not include an own-
credit component.
›
Refer to “Note 21 Fair value measurement” in the “Consolidated
financial statements” section of this report for more information
about own credit
Structural foreign exchange risk
Upon consolidation, assets and liabilities held in foreign
operations are translated into US dollars at the closing foreign
exchange rate on the balance sheet date. Value changes (in US
dollars) of non-US dollar assets or liabilities due to foreign
exchange movements are recognized in OCI and therefore affect
shareholders’ equity and CET1 capital.
Group Treasury uses strategies to manage this foreign currency
exposure, including matched funding of assets and liabilities and
net investment hedging.
›
Refer to the “Capital, liquidity and funding, and balance sheet”
section of this report for more information about our exposure
to and management of structural foreign exchange risk
›
Refer to “Note 10 Derivative instruments” in the “Consolidated
financial statements” section of this report for more information
about our hedges of net investments in foreign operations
Equity investments
Audited |
equity holdings in both listed and unlisted companies, for a variety
of purposes, including investments such as exchange and clearing
house memberships held to support our business activities. We
may also make investments in funds that we manage in order to
fund or seed them at inception or to demonstrate that our
interests align with those of investors. We also buy, and are
sometimes required by agreement to buy, securities and units
from funds that we have sold to clients.
139
The fair value of equity investments tends to be influenced by
factors specific to the individual investments. Equity investments
are generally intended to be held for the medium or long term
and may be subject to lock-up agreements. For these reasons, we
generally do not control these exposures by using market risk
measures applied to trading activities. However, such equity
investments are subject to a different range of controls, including
preapproval of new investments by business management and
Risk Control, portfolio and concentration limits, and regular
monitoring and reporting to senior management. They are also
included in our Group-wide statistical and stress testing metrics,
which flow into our risk appetite framework.
As of 31 December 2021, we held equity investments and
investment fund units totaling USD
3.0
1.8
billion was classified as
Financial assets at fair value not held for
trading
1.2
Investments in associates
.
p
›
Refer to “Note 21 Fair value measurement” and “Note 29
Interests in subsidiaries and other entities” in the “Consolidated
financial statements” section of this report for more information
›
Refer to “Note 1 Summary of material accounting policies” in the
“Consolidated financial statements” section of this report for
more information about the classification of financial
instruments
Debt investments
Audited |
Financial assets measured at
fair value through OCI
at fair value with changes in fair value recorded through
Equity
,
and can broadly be categorized as money market instruments and
debt securities primarily held for statutory, regulatory or liquidity
reasons.
The risk control framework applied to debt instruments
classified as
Financial assets measured at fair value through OCI
depends on the nature of the instruments and the purpose for
which we hold them. Our exposures may be included in market
risk limits or be subject to specific monitoring and interest rate
sensitivity analysis. They are also included in our Group-wide
statistical and stress testing metrics, which flow into our risk
appetite framework.
Debt instruments classified as
Financial assets measured at fair
value through OCI
8.8
31
December 2021 compared with
USD
8.3
of
31 December 2020.
p
›
Refer to “Note 21 Fair value measurement” in the “Consolidated
financial statements” section of this report for more information
›
Refer to “Economic value sensitivity” in this section for more
information
›
Refer to “Note 1 Summary of material accounting policies” in the
“Consolidated financial statements” section of this report for
more information about the classification of financial
instruments
Pension risk
We provide a number of pension plans for past and current
employees, some classified as defined benefit pension plans under
IFRS that can have a material effect on our IFRS equity and CET1
capital.
Pension risk is the risk that defined benefit plans’ funded status
might decrease, negatively affecting our capital. This can result
from falls in the value of a plan’s assets or in the investment
returns, increases in defined benefit obligations, or combinations
of the above.
Important risk factors affecting the fair value of pension plans’
assets include equity market returns, interest rates, bond yields,
and real estate prices. Important risk factors affecting the present
value of expected future benefit payments include high-grade
bond yields, interest rates, inflation rates, and life expectancy.
Pension risk is included in our Group-wide statistical and stress
testing metrics, which flow into our risk appetite framework. The
potential effects are thus captured in the post-stress capital ratio
calculations.
›
Refer to “Note 1 Summary of material accounting policies” and
“Note 27 Post-employment benefit plans” in the “Consolidated
financial statements” section of this report for more information
about defined benefit plans
UBS own share exposure
Group Treasury holds UBS Group AG shares to hedge future share
delivery obligations related to employee share-based
compensation awards, and also holds shares purchased under the
share repurchase program. In addition, the Investment Bank holds
a limited number of UBS Group AG shares, primarily in its capacity
as a market-maker with regard to UBS Group AG shares and
related derivatives, and to hedge certain issued structured debt
instruments.
›
Refer to “UBS shares” in the “Capital, liquidity and funding, and
balance sheet” section of this report for more information
Risk, capital, liquidity and funding, and balance sheet | Risk management and control
140
Country risk
Country risk framework
Country risk includes all country-specific events occurring in a
sovereign jurisdiction that may lead to impairment of UBS’s
exposures. It may take the form of: sovereign risk, which is the
ability and willingness of a government to honor its financial
commitments; transfer risk, which arises if a counterparty or issuer
cannot acquire foreign currencies following a moratorium by a
central bank on foreign exchange transfers; or “other” country
risk. “Other” country risk may manifest itself through, on the one
hand, increased and multiple counterparty and issuer default risk
(systemic risk) and, on the other hand, events that may affect a
country’s
standing, such as
adverse shocks affecting political
stability or institutional and / or legal frameworks. We have a well-
established risk control framework to assess the risk profiles of all
countries where we have exposure.
We assign a country rating to each country, which reflects our
view of the country’s creditworthiness and of the probability of a
country risk event occurring. Country ratings are mapped to
statistically derived default probabilities
,
described under
“Probability of default” in this section. We use this internal
analysis to set the credit ratings of governments and central
banks, estimate the probability of a transfer event occurring, and
establish rules
on
how aspects of country risk should be
incorporated in counterparty ratings of non-sovereign entities
domiciled in the respective country.
Country ratings are also used to define our risk appetite and
risk exposure to foreign countries. A country risk limit (i.e.,
maximum aggregate exposure) applies to exposures to
counterparties or issuers of securities and financial investments in
the given foreign country. We may limit the extension of credit,
transactions in traded products or positions in securities based on
a country risk ceiling even if our exposure to a counterparty is
otherwise acceptable.
For internal measurement and control of country risk, we also
consider the financial effect of market disruptions arising prior to,
during and after a country crisis. These may take the form of a
severe deterioration in a country’s debt, equity or other asset
markets or a sharp depreciation of its currency. We use stress
testing to assess potential financial effects of severe country or
sovereign crises. This involves the developing of plausible stress
scenarios for combined stress testing and the identification of
countries that may potentially be subject to a crisis event,
determining potential losses and making assumptions about
recovery rates depending on the types of credit transactions
involved and their economic importance to the affected countries.
Our exposures to market risks are subject to regular stress tests
covering major global scenarios, which are also used for combined
stress testing, where we apply market shock factors to equity
indices, interest rates and currency rates in all relevant countries
and consider the potential liquidity of the instruments.
Country risk exposure
Country risk exposure measure
The presentation of country risk follows our internal risk view,
where the basis for measuring exposures depends on the product
category in which we classified the exposures. In addition to the
classification of exposures into banking products and traded
products, covered in “Credit risk profile of the Group” in this
section, in the trading inventory we classify issuer risk on securities
such as bonds and equities, as well as risk relating to underlying
reference assets for derivative positions.
As we manage the trading inventory on a net basis, we net the
value of long positions against short positions with the same
underlying issuer. Net exposures are, however, floored at zero per
issuer in the figures presented in the following tables. As a result,
we do not recognize potentially offsetting benefits of certain
hedges and short positions across issuers.
We do not recognize any expected recovery values when
reporting country exposures as exposure before hedges,
except
for risk-reducing effects of master netting agreements and
collateral held in either cash or portfolios of diversified marketable
securities, which we deduct from the positive exposure values.
Within banking products and traded products, risk-reducing
effects of credit protection are taken into account on a notional
basis when determining the net of hedge exposures.
Country risk exposure allocation
In general, exposures are shown against the country of domicile
of the contractual counterparty or the issuer of the security. For
some counterparties whose economic substance in terms of
assets or source of revenues is primarily located in a different
country, the exposure is allocated to the risk domicile of those
assets or revenues.
We apply a specific approach for banking products exposures
to branches of banks that are located in a country other than the
legal entity’s domicile. In such cases, exposures are recorded in full
against the country of domicile of the counterparty and
additionally in full against the country wh
ere
the branch is
located.
In the case of derivatives, we show counterparty risk
associated with positive replacement value (PRV) against the
counterparty’s country of domicile (presented within traded
products). In addition, risk associated with an instantaneous fall
in value of underlying reference assets to zero (assuming no
recovery) is shown against the country of domicile of the issuer
of the reference asset (presented within trading inventory). This
approach allows us to capture both counterparty and, where
applicable, issuer elements of risk arising from derivatives and
applies comprehensively for all derivatives, including single-name
credit default swaps (CDSs) and other credit derivatives.
141
CDSs are primarily bought and sold in relation to our trading
businesses, and, to a much lesser degree, used to hedge credit
valuation adjustments (CVAs). Holding CDSs for credit default
protection does not necessarily protect the buyer of protection
against losses, as contracts only pay out under certain scenarios.
The effectiveness of our CDS protection as a hedge of default risk
is influenced by a number of factors, including the contractual
terms under which a given CDS was written. Generally, only the
occurrence of credit events as defined by the CDS contract’s terms
(which may include, among other events, failure to pay,
restructuring or bankruptcy) result
s
in payments under the
purchased credit protection contracts. For CDS contracts on
sovereign obligations, repudiation can also be deemed as a
default event. The determination as to whether a credit event has
occurred is made by the relevant International Swaps and
Derivatives Association (ISDA) determination committees
(composed of various ISDA member firms) based on the terms of
the CDS and the facts and circumstances surrounding the event.
Top 20 country risk exposures
The table below shows our 20 largest country exposures by
product type, excluding our home country, as of 31 December
2021 compared with 31 December 2020.
Compared with the prior year, our net exposure to the UK
increased by USD 8.8 billion, driven by central bank exposures due
to treasury activities. Net exposure to the US increased by USD 6.3
billion, solely driven by banking products, largely related to nostro
balances at the
Federal Reserve
due to
t
reasury
a
ctivities,
mortgages and Investment Bank loans. Those increases in the US
were partly offset by tradable assets related to treasury activities.
Net exposure to Australia
increased by USD
2.9 billion,
predominantly driven by trading inventory due to loan
underwriting projects and central bank exposures. Net exposure
to Germany decreased by USD 2.8 billion, driven by trading
inventory due to loan underwriting projects and sovereign issuer
risk. Net exposure to China decreased by USD 2.0 billion,
predominantly driven by trading inventory across issuer risk and
margin loans, as well as banking products. Net exposure to France
decreased by USD 1.0 billion, driven by trading inventory due to
treasury activities.
Based on the sovereign rating categories, as of 31 December
2021, 84% of our emerging market country exposure was rated
investment grade, compared with 83% as of 31 December 2020.
Russia
Our direct country risk exposure to Russia contributed USD 634
million to our total emerging market exposure of USD 20.9 billion
as of 31 December 2021. This includes trade finance exposures in
Personal & Corporate Banking, a single loan in the Investment
Bank with a non-Russian entity with key facilities spread globally
including Russia and the Commonwealth of Independent States,
Nostro and cash accounts balances, issuer risk on trading
inventory within the Investment Bank, and derivatives within the
Investment Bank. These exposures have been reduced since year-
end 2021. Not included in this figure are net assets held in our
Russian subsidiary, with a net asset value of USD 51 million. UBS
is also currently monitoring settlement risk on certain open
transactions with Russian banks and non -bank counterparties or
Russian
underlyings
,
as
market closures, the imposition of
exchange controls, sanctions or other measures may limit our
ability to settle existing transactions or to realize on collateral,
which may result in unexpected increases in exposures.
As of 3 March 2022, UBS also had approximately USD 0.2
billion exposure arising from reliance
on Russian assets as
collateral on Lombard lending and other secured financing in
Global Wealth Management.
As of 3 March 2022, we identified a small number of Global
Wealth Management clients subject to the recently introduced
sanctions, with total loans outstanding of under USD 10 million.
Our market risk exposure to Russia as of 3 March 2022 was
limited.
We had no material direct country risk exposures to Ukraine or
to Belarus as of 31 December 2021 and no material reliance on
Ukrainian or to Belarusian collateral within our Lombard portfolio.
Risk, capital, liquidity and funding, and balance sheet | Risk management and control
142
Top 20 country risk net exposures by product type
USD million
Total
Banking products
(loans, guarantees, loan
commitments)
Traded products
(counterparty risk from derivatives
and securities financing)
after master netting agreements
and net of collateral
Trading inventory
(securities and potential
benefits / remaining
exposure from derivatives)
Net of hedges
1
Net of hedges
1
Net of hedges
Net long per issuer
31.12.21
31.12.20
31.12.21
31.12.20
31.12.21
31.12.20
31.12.21
31.12.20
United States
116,388
110,041
79,647
62,950
8,371
9,786
28,371
37,305
United Kingdom
34,837
26,083
24,788
16,154
7,465
8,541
2,585
1,388
Japan
14,764
14,974
10,572
5,625
3,508
2,972
684
6,378
Germany
10,564
13,336
3,397
2,447
1,232
1,217
5,934
9,672
Singapore
8,993
8,950
3,110
3,875
2,557
2,431
3,326
2,644
Australia
6,397
3,465
2,674
1,475
1,786
1,329
1,937
661
France
6,301
7,344
1,356
1,306
1,711
1,409
3,235
4,628
China
5,344
7,392
1,823
2,553
830
1,010
2,691
3,828
Canada
3,933
3,792
1,199
1,483
1,044
832
1,689
1,477
Luxembourg
3,453
3,292
2,438
2,128
58
145
958
1,019
Hong Kong SAR
3,388
2,840
1,914
1,498
367
395
1,107
946
Netherlands
3,020
3,048
1,183
656
830
782
1,007
1,610
South Korea
2,479
2,259
462
426
418
526
1,599
1,307
Sweden
1,617
2,326
647
657
194
260
776
1,410
Thailand
1,469
1,494
208
146
26
41
1,235
1,306
Austria
1,220
1,664
265
197
97
616
858
851
Norway
1,215
1,669
25
22
206
337
983
1,310
India
1,119
903
991
727
87
86
41
90
Monaco
1,022
1,016
984
994
28
17
10
5
Brazil
915
1,119
488
474
40
88
387
557
Total
2
228,438
217,006
138,171
105,793
30,853
32,819
59,414
78,394
1 Before deduction of IFRS 9 ECL allowances and provisions. 2 Excluding Switzerland, supranationals and global funds.
Emerging markets¹ net exposure² by internal UBS country rating category
USD million
31.12.21
31.12.20
Investment grade
17,608
19,580
Sub-investment grade
3,261
4,005
Total
20,869
23,585
1 We classify countries as emerging markets based on per capita GDP, historical real GDP growth, alignment with international institutions (such as BIS, World Bank, IMF, MSCI) and other factors. 2 Net of credit
hedges (for banking products and for traded products); net long per issuer (for trading inventory). Before deduction of IFRS 9 ECL allowances and provisions.
143
Sustainability and climate risk
Sustainability risk
Sustainability and climate risk (SCR, previously known at UBS as
environmental and social risk, or ESR) is defined as the risk that
UBS is negatively impacted by or
negatively
impacts
climate
change, loss of biodiversity, human rights infringements, or other
environmental, social or governance (ESG) matters. Sustainability
and climate risks may manifest as credit, market, liquidity or
operational risks for UBS and can result in financial or reputational
impacts for the firm. They may also negatively impact the value of
investments. The management of sustainability and climate risks
is gaining importance amid a global drive to meet the Sustainable
Development Goals (the SDGs) and transition to net zero, as
defined by the Paris Agreement. In addition, regulators across
jurisdictions increasingly
seek to understand the potential
financial impacts of climate change. Our broad and wide-ranging
SCR policy framework governs client and supplier relationships,
applies firm-wide to all activities, and is integrated in
management practices and control principles. The SCR framework
is embedded in our standard risk, compliance and operations
processes and applied through:
–
risk identification and measurement;
–
risk monitoring and appetite setting;
–
risk management and control; and
–
risk reporting.
The aforementioned processes
include client onboarding,
transaction due diligence, product development and investment
decision processes, own operations, supply chain management,
and portfolio reviews. This framework is geared toward
identifying clients, transactions or suppliers potentially in breach
of our standards or otherwise subject to significant controversies
related to sustainability, human rights or climate change.
›
Refer to “Sustainability and climate risk policy framework” in
appendix 6 to the Sustainability Report 2021, available from
11 March 2022 under “Annual reporting” at
ubs.com/investors
,
for more information
Climate risk
Climate risk can arise either from changing climate conditions
(physical risks) or from efforts to mitigate climate change
(transition risks). The physical and transition risks from a changing
climate contribute to a structural change across economies and
consequently can affect banks and the financial sector as a whole
through financial and non-financial impacts.
In order to protect our clients’ assets and our own assets from
climate-related risks, we have established a climate risk program
to further integrate climate risk into the firm’s risk management
framework and standard processes. The program follows a multi-
year roadmap to address regulatory expectations and is engaging
with stakeholders and experts across the firm and externally to
further develop climate risk methodologies, deliver on climate
stress test exercises, and build capacity to respond to climate risk
management expectations.
We currently identify and manage climate risk in our own
operations, our balance sheet, client assets and the supply chain.
We have continually reduced our exposure to carbon-related
assets and
advanced
our multi
-
year efforts to develop
methodologies that enable robust and transparent disclosure of
climate metrics. This work supports our efforts to ensure that we
are prepared to respond to
increased climate
risk
-
related
regulatory requirements, align our disclosure with the Financial
Stability Board’s
Task Force on Climate
-
related Financial
Disclosures (the TCFD) recommendations and collaborate within
the financial sector to close gaps.
We approach climate risk identification through climate risk
heatmaps, developed in collaboration with the United Nations
Environment
Programme Finance
Initiative
(UNEP FI)
TCFD
working group.
As part of this effort, we have defined an inventory of climate-
sensitive sectors based on elevated climate risk ratings defined by
the TCFD, regulators and rating agencies. We initially disclosed
our exposure to climate sensitive sectors (transition risks) in our
Annual Report 2020. Over the course of 2021, we have refined
the disclosure of transition risks and introduced an initial
disclosure of physical risks. We summarize our current exposure
to climate-sensitive sectors for both risk types in the table on the
next page.
Exposures may appear either under one or under both of the
risk types, as the physical and transition risk methodologies are
distinct in their approach and application and should not be
added up as one total exposure figure. Climate risk analysis is a
novel area of research, and, as the methodologies, tools and data
availability improve, we will further develop our risk identification
and measurement approaches.
›
Refer to “Taking action on a net-zero future – our climate
report” in the Sustainability Report 2021, available from
11 March 2022 under “Annual reporting” at
ubs.com/investors
,
for more information
Risk, capital, liquidity and funding, and balance sheet | Risk management and control
144
UBS lending to climate-sensitive sectors
1
Climate-sensitive exposure:
elevated transition risks,
as of 31.12.21
2
Climate-sensitive exposure:
elevated physical risks,
as of 31.12.21
2
USD million, except where indicated
Trend (%) 2019–2021
Gross exposure
3
Share of total in %
Trend (%) 2019–2021
Gross exposure
3
Share of total in %
Climate-sensitive sector
4
Aerospace and defense
¯
831
0.18
¯
338
0.07
Automotive
¯
703
0.15
¯
1,042
0.23
Business services
¯
853
0.19
Chemicals
¯
1,112
0.24
¯
991
0.22
Constructions and materials
¯
3,637
0.79
¯
302
0.07
Consumer products and retail
®
355
0.08
650
0.14
Entertainment, leisure and services
¯
1,308
0.28
Food and beverage
®
2
0.00
1,334
0.29
Industrial materials
¯
121
0.03
¯
243
0.05
Information technology
¯
274
0.06
Machinery and equipment
1,040
0.23
2,732
0.60
Medical equipment and services
408
0.09
Mining
¯
2,920
0.64
1,153
0.25
Oil and gas
¯
5,823
1.27
¯
5,538
1.21
Pharmaceuticals/biotechnology
1,400
0.30
®
814
0.18
Plastic and rubber
¯
299
0.07
¯
280
0.06
Primary materials
®
13
0.00
®
320
0.07
Real estate management
¯
18,029
3.93
528
0.12
Sovereigns and financials
¯
4,371
0.95
Transportation and equipment
¯
849
0.18
¯
419
0.09
Utilities
¯
375
0.08
1,579
0.34
Total, climate-sensitive sectors
2
¯
37,510
8.17
¯
25,476
5.55
Total, all sectors
459,061
100.00
459,061
100.00
1 Not additive across transition risks and physical risks. 2 Global Wealth Management corporate lending to customers represents 1.1% of all on- and off-balance sheet loans and advances to customers, and is not
rated. 3 Reported as IFRS9 expected credit loss (ECL) calculation, and represents both on-balance sheet: total loans and advances to customers and off-balance sheet: guarantees and irrevocable loan commitments
(within the scope of ECL). Physical risk exposures include USD ~4 billion in loans backed by real estate. 4 The table includes only those sector exposures that are defined as climate-sensitive. Climate-sensitive sectors
defined as business activities rated as having high, moderately high or moderate vulnerability to transition and physical risks. Transition risk methodology was initially developed in collaboration with UNEP FI TCFD
working group and disclosed in Phase II “From disclosure to action – a guide to implementing the TCFD framework within financial institutions” report. Physical risk methodology is based on country, sectoral and
value chain risk factors derived from a range of academic and expert sources. Both methodologies have been adapted internally and enhanced.
Climate risk heatmaps enable us to use a materiality-driven
approach when defining our climate risk management strategy
by:
–
helping us to identify concentrations of exposure with high
climate risk vulnerability, which, in turn, enables resource
prioritization for detailed risk analysis and management action;
–
supporting a client-centric strategy in order to best assist clients
that may benefit from UBS products and services to support
their climate strategies; and
–
providing information to senior management to support
decision making and the provision of external disclosure to
stakeholders.
Our
climate risk
heatmap
s
rate cross
-
sectoral credit risk
exposure to climate sensitivity, from high to low, through a risk
segmentation process. The transition risk methodology, reflected
in the climate risk heatmap on the next page, divides economic
sectors into segments with similar risk characteristics and rates
those
segments
according to their vulnerability to
mitigative
climate policies, low-carbon technology risks and revenue or
demand shifts under an aggressive approach to meeting the well-
below
-
2˚C Paris goal.
The physica
l risk methodology groups
corporate counterparties based on exposure to key physical risk
factors, through rating sectoral, geographic, and value chain
vulnerabilities in a climate trajectory in which no
��
changeadditional policy action is taken. Counterparties are assigned a
climate vulnerability rating based on the primary industry code
(Global Industry Classification Standard, GICS) and risk domicile
in UBS data systems.
›
For our physical risk heatmap, refer to “Taking action on a net-
zero future – our climate report” in the Sustainability Report
2021, available from 11 March 2022 under “Annual reporting” at
ubs.com/investors
145
Risk, capital, liquidity and funding, and balance sheet | Risk management and control
146
Scenario analysis and stress tests
exercises
We have been using scenario-based approaches since 2014 to
assess our exposure and the potential impacts of physical and
transition risks stemming from climate change. Novel in-house
scenario analyses have been followed by a series of assessments
performed through industry collaborations in order to harmonize
approaches in addressing methodological and data gaps. We
have performed both top-down balance sheet stress testing
(across the firm) and targeted bottom-up analyses of specific
sector exposures covering short
-
, mid
-
and long
-
term time
horizons. Starting in 2021, UBS participates in regulatory scenario
analysis and stress test exercises, including the Bank of England’s
“2021 Climate Biennial Exploratory Scenario: Financial risks from
climate change” and the European Central Bank’s climate stress
test. In addition, in 2021 UBS participated in a top-down climate
risk assessment performed jointly by FINMA and the Swiss
National Bank in Switzerland.
›
For more information about our climate risk approach and
physical risk heatmap, refer to “Taking action on a net-zero
future – our climate report” in the Sustainability Report 2021,
available from 11 March 2022 under “Annual reporting” at
ubs.com/investors
147
Non-financial risk
Key developments
We have identified seven non-financial risk themes as key to the
firm for 2022. These are:
–
digital transformation and cyber and operational resilience;
–
use of data;
–
new ways of working and change delivery;
–
investor protection and market interaction;
–
strategic growth initiatives and partnerships;
–
the evolving nature of anti-money-laundering (AML) / know-
your-client (KYC) programs and sanctions; and
–
environmental, social and governance (ESG) risks.
We are continuing our efforts regarding innovation and
digitalization to create value for our clients. As part of the
resulting transformation, we are focusing on timely changes to
frameworks, including consideration of new or revised controls,
working practices and oversight, with the aim of mitigating any
new risks introduced, including those related to data ethics.
Increases in the sophistication of cyberattacks and frauds are
noted worldwide, especially with ransomware attacks. To date,
our security controls, regular communications to help employees
stay alert to cyber threats while working remotely and enhanced
monitoring of cyber threats have resulted in no cyber security
incidents having a material effect on our operations during 2021.
UBS continues to be vigilant, particularly in view of the potential
for intensifying cyber threats, both in terms of volume and
sophistication, driven by current geopolitical events.
Operational resilience continues to be a focus area for us, as
well as for regulators globally. We have a global program to
enhance our operational-resilience capabilities, including
addressing developing regulatory requirements.
The existing resilience built into our operations and the
effectiveness of our business continuity management and
operational risk processes (including those for third-party service
providers) have been critical in handling the ongoing COVID-19
pandemic. They have enabled us to maintain stable operations
while complying with governmental measures to contain
COVID-19; continuing to serve our clients without material
impact; and to support the safety and well-being of our staff.
Hybrid working arrangements can lead to increased conduct
risk, inherent risk of fraudulent activities, potential increases in the
number of
suspicious transactions and increased information
security risks. We have implemented additional monitoring and
supervision intended to mitigate these risks. In addition, as we
move to a post-pandemic new normal, changes to the work
environment, including permanent hybrid and the introduction of
agile ways of working, may introduce new challenges for
supervision and monitoring.
Achieving fair outcomes for our clients, upholding market
integrity and cultivating the highest standards of employee
conduct are of critical importance to the firm. We maintain a
conduct risk framework across our activities, which is designed to
align our standards and conduct with these objectives and
maintain momentum on fostering a strong culture.
Competition to find new business opportunities across the
financial services industry, both for firms and customers, is
increasing. Thus suitability risk, product selection, cross-divisional
service offerings, quality of advice and price transparency also
remain areas of heightened focus for UBS and for the industry as
a whole, as low interest rates, market volatility and major
legislative change programs (such as the Swiss Financial Services
Act (FIDLEG) in Switzerland, Regulation Best Interest (Reg BI) in
the US
,
and the Markets in Fin
ancial Instruments Directive
II
(MiFID II) in the EU) all significantly affect the industry and require
adjustments to control processes on a geographically aligned
basis. We regularly monitor our suitability, product and conflicts
of interest control frameworks to assess whether they are
reasonably designed to facilitate adherence to applicable laws and
regulatory expectations.
Cross-border risk remains an area of regulatory attention for
global financial institutions, with
a strong focus on fiscal
transparency, as well as market access, particularly third-country
market access into the European Economic Area. There is also an
ongoing high level of attention regarding the risk that tax
authorities may, on the basis of new interpretations of existing
law, seek to impose taxation based on the existence of a
permanent establishment. We maintain a series of controls
designed to address these risks.
Financial crime, including money laundering, terrorist
financing, sanctions violations, fraud, bribery and corruption,
continues to present a major risk, as technological innovation and
geopolitical developments increase the complexity of doing
business and heightened regulatory attention continues. An
effective financial crime prevention program therefore remains
essential for UBS. Money laundering
and financial fraud
techniques are becoming increasingly sophisticated, and
geopolitical volatility makes the sanctions landscape more
challenging, as new or novel sanctions may be imposed that
require complex
implementation in a short timeframe, as
evidenced by the existing, and potential escalation of new
sanctions arising from the Russian invasion of Ukraine. New risks
continue to emerge, such
as virtual currencies and related
activities or investments.
In the US, the Office of the Comptroller of the Currency issued
a Cease and Desist Order against the firm in May 2018 relating to
our US branch KYC and AML programs. In response, we initiated
an extensive program for the purpose of ensuring sustainable
remediation of US-relevant Bank Secrecy Act / AML issues across
all our US legal entities. We introduced significant improvements
to the framework between 2019 and 2021 and are continuing to
implement these. We believe they will yield the planned
enhancements to our AML controls.
We continued to focus on strategic enhancements to our
global AML / KYC and sanctions programs to address evolving risk
profiles and regulatory expectations, including the exploration of
new technologies and more sophisticated monitoring.
In line with our firm-wide purpose, ESG topics and the risks
related to them are high on our agenda, particularly considering
the increasing regulatory focus on ESG disclosure, climate-related
stress testing and greenwashing, as well as the potential for new
and diverse regulations being deployed across jurisdictions.
›
Refer to “Sustainability and climate risk” in this section for more
information about risks related to sustainability and climate risk
Risk, capital, liquidity and funding, and balance sheet | Risk management and control
148
Operational risk framework
Operational risk is an inherent part of the firm’s business. Losses
can result from inadequate or failed internal processes, people
and systems, or from external causes. UBS follows a Group-wide
operational risk framework (an ORF) that establishes requirements
for identifying, managing, assessing and mitigating operational,
compliance and conduct risks to achieve an agreed balance
between risk and return. It is built on the following pillars:
–
classifying inherent risks through the operational risk
taxonomy, which defines the universe of material operational
risks that can arise as a consequence of the firm’s business
activities and external factors;
–
assessing the design and operating effectiveness of controls
through the control assessment process;
–
proactively and sustainably remediating identified control
deficiencies;
–
defining operational risk appetite (including a financial
operational risk appetite statement at Group, UBS AG and
business division levels for operational risk events) through
quantitative metrics and thresholds and qualitative measures,
and assessing risk exposure against appetite; and
–
assessing inherent and residual risk through risk assessment
processes, and determining whether additional remediation
plans are required to address identified deficiencies.
Divisional Presidents are accountable for the effectiveness of
operational risk management and for the robustness of the front-
to-back control environment within their business divisions, and
legal entity responsible executives are responsible for operational
risk management within their legal entities. Group function heads
are accountable for supporting the divisional Presidents and legal
entity responsible executives of our legal entities in the discharge
of this responsibility, by confirming completeness and
effectiveness of the control environment and operational risk
management within their Group functions. Collectively, divisional
Presidents, central Group function heads and legal entity
responsible executives are in charge of implementing the
operational risk framework.
Compliance & Operational Risk Control (C&ORC) is responsible
for providing an independent and objective view of the adequacy
of operational risk management across the Group, and ensuring
that operational, compliance and conduct risks are understood,
owned and managed in accordance with the firm’s risk appetite.
C&ORC-aligned teams sit within the Group Compliance,
Regulatory & Governance (GCRG) function, reporting to the
Group Chief Compliance and Governance Officer, who is a
member of the Group Executive Board. The ORF forms the
common basis for managing and assessing operational,
compliance and conduct risk, and there are additional C&ORC
activities intended to ensure UBS is able to demonstrate
compliance with applicable laws, rules and regulations.
In 2021, UBS continued to review and enhance the ORF
through the established ORF design authority, considering
feedback and input from both internal and external stakeholders,
including implementing Group-wide control portfolio analytics,
supporting consistency across the control portfolio.
All functions within UBS are required to assess the design and
operating effectiveness of their internal controls periodically. The
output of these assessments forms the basis for the assessment
and testing of internal controls over financial reporting as required
by the Sarbanes–Oxley Act, Section 404 (SOX 404).
Key control deficiencies identified during the internal control
and risk assessment processes must be reported in the operational
risk inventory, and sustainable remediation must be defined and
executed. These control deficiencies are assigned to owners at
senior management level and the remediation progress is
reflected in the respective managers’ annual performance
measurement and management objectives. To assist with
prioritizing the most material control deficiencies and measuring
aggregated risk exposure, irrespective of origin, a common rating
methodology is applied across all three lines of defense, as well as
by external audit.
149
Advanced measurement approach model
The operational risk framework outlined above underpins the
calculation of regulatory capital for operational risk, which
enables us to quantify operational risk and define effective risk
mitigating management incentives
as part of the related
operational risk capital allocation approach to the business
divisions.
We measure Group operational risk exposure and calculate
operational risk regulatory capital using the advanced
measurement approach (AMA) in accordance with FINMA
requirements.
An entity-specific AMA model has been applied for UBS
Switzerland AG, while for other regulated entities the basic
indicators or standardized approaches are adopted for regulatory
capital in agreement with local regulators. Also, the methodology
of the Group AMA is leveraged for entity-specific Internal Capital
Adequacy Assessment Processes.
Currently, the model includes 16 AMA units of measure (UoM),
which are aligned with our operational as closely
��
risk taxonomyas possible. Frequency and severity distributions are calibrated for
each of the model’s UoM. The modeled distribution functions for
both frequency and severity are used to generate the annual loss
distribution. The resulting 99.9% quantile of the overall annual
operational risk loss distribution across all UoM determines the
required regulatory capital. Currently, we do not reflect mitigation
through insurance or any other risk transfer mechanism in our
AMA model.
AMA model calibration and review
A key assumption when calibrating data-driven frequency and
severity distributions is that historical losses form a reasonable
proxy for future events. In line with regulatory expectations, the
AMA methodology utilizes both historical internal losses and
external losses suffered by the broader industry for model
calibration.
Initial model outputs driven by loss history are reviewed and
adjusted to reflect fast-changing external developments, such as
new regulations, geopolitical change, volatile market and
economic conditions,
and
int
ernal factors
(e.g.
,
changes in
business strategy and control framework enhancements). The
resulting baseline data-driven frequency and severity distributions
are reviewed by subject matter experts and where necessary
adjusted based on a review of qualitative information about the
business environment and internal control factors, as well as
expert judgment, with the aim of forecasting losses.
Our model is reviewed regularly to maintain risk sensitivity and
recalibrated at least annually. Any changes to regulatory capital
as a result of a recalibration or methodology changes are
presented to FINMA for approval prior to use for disclosure
purposes.
AMA model governance
The Group and entity-specific AMA models are subject to an
independent validation performed by Model Risk Management &
Control in line with the Group’s model risk management
framework.
Expected transition of capital regime under Basel III capital
regulations
The AMA is expected to be replaced by the standardized
measurement approach for regulatory capital determination
purposes in line with the relevant Basel Committee for Banking
Supervision Basel III capital regulations. UBS is interacting closely
with the relevant Swiss authorities to discuss the implementation
details and related implementation timeline.
›
Refer to “Capital planning and activities” in the “Capital,
liquidity and funding, and balance sheet” section of this report
for more information about the development of risk-weighted
assets
›
Refer to “Risk measurement” in this section for more
information about our approach to model confirmation
procedures
›
Refer to the “Risk factors” section of this report for more
information
Capital, liquidity
and funding,
and balance sheet
Table of contents
151
151
152
154
158
161
163
168
169
169
169
171
171
172
173
173
179
181
182
183
151
Capital management
Capital management objectives, planning and activities
Capital management objectives
Audited |
meeting both internal assessment and regulatory requirements is
a prerequisite for conducting our business activities.
p
We are therefore committed to maintaining a strong TLAC
position and sound TLAC ratios at all times, in order to meet
regulatory capital requirements and our target capital ratios, and
to support the growth of our businesses.
As of 31 December 2021, our common equity tier 1 (CET1)
capital ratio was 15.0% and our CET1 leverage ratio 4.24%, each
above our capital guidance, and also above the requirements for
Swiss systemically relevant banks (SRBs) and the Basel Committee
on Banking Supervision (the BCBS) requirements. We believe that
our capital strength is a source of confidence for our stakeholders,
contributes to our sound credit ratings and is one the
��
offoundations of our success.
The BCBS announced the finalization of the Basel III framework
in December 2017, and published the final rules on the minimum
capital requirements for market risk from the Fundamental Review
of the Trading Book (the FRTB) in January 2019. In response to
COVID-19, the Group of Central Bank Governors and Heads of
Supervision, which acts as the BCBS’s oversight body, endorsed
the deferral of the implementation date by one year, to 1 January
2023. The accompanying transitional arrangements for the
output floor were also extended by one year, to 1 January 2028.
We expect the Swiss regulations to come into force in 2024 and
we continue to make progress on our infrastructure design and
operational governance ahead of the upcoming adoption of these
rules. We currently estimate that the revised Basel III framework
may lead to a further net increase in risk-weighted assets (RWA)
of around USD 20 billion in 2024, before taking into account
mitigating acti
ons.
The
e
stimate includes
credit risk and
operational risk
RWA
from the finalization of
the
Basel
III
framework, as well as market risk and credit valuation adjustment
(CVA) RWA from the FRTB, based on our current understanding
of the relevant standards. It may change as a result of new or
changed regulatory interpretations, particularly those regarding
the treatment of historical operational losses
, as well as
the
appropriate conservatism in model calibration
,
the
implementation of Basel III standards into national law, changes
in business growth, market conditions and other factors.
›
Refer to the “Our strategy” and “Targets, aspirations and capital
guidance” sections of this report for more information about our
capital and resource guidelines
›
Refer to “We may be unable to maintain our capital strength” in
the “Risk factors” section of this report for more information
about capital ratio-related risks
Capital planning and activities
Audited |
We manage our balance sheet, RWA,
leverage ratio
denominator (LRD) and TLAC ratio levels based on our regulatory
requirements and within our internal limits and targets. Our
strategic focus is on achieving an optimal attribution and use of
financial resources between our business divisions and Group
Functions, as well as between our legal entities, while remaining
within the limits defined for the Group and allocated to the
business divisions by the Board of Directors (the BoD). These
resource allocations, in turn, affect business plans and earnings
projections, which are reflected in our capital plans.
The annual strategic planning process includes
a capital
-
planning component that is key in defining our capital targets. It
is based on an attribution of Group RWA and LRD internal limits
to the business divisions.
Limits and targets are established at the Group and business
division levels, and are approved by the BoD at least annually. In
the target-setting process, we take into account the current and
potential future TLAC requirements, our aggregate risk exposure
in terms of capital-at-risk, the assessment by rating agencies,
comparisons with peers and the effect of expected accounting
policy changes.
p
Monitoring is based on these internal limits and targets and
provides indications if any changes are required. Any breach of
limits in place triggers a series of required remediating actions.
Group Treasury plans for and monitors consolidated TLAC
information on an ongoing basis, reflecting business and legal
entity requirements, as well as regulatory developments in capital
regulations. In addition, capital planning and monitoring are
performed at the legal entity level for our significant subsidiaries
and sub-groups that are subject to prudential supervision and
must meet capital and other supervisory requirements.
›
Refer to “Capital and capital ratios of our significant regulated
subsidiaries” in this section for more information
Risk, capital, liquidity and funding, and balance sheet | Capital management
152
Swiss SRB total loss-absorbing capacity framework
The disclosures in this section are provided for UBS Group AG on
a consolidated basis and focus on key developments during the
reporting period and information in accordance with the Basel III
framework, as applicable to Swiss SRBs.
Additional regulatory disclosures for UBS Group AG on a
consolidated basis are provided in our 31 December 2021 Pillar 3
Report. The Pillar 3 Report further includes information relating to
our significant regulated subsidiaries and sub-groups (UBS AG
standalone, UBS Switzerland AG standalone, UBS Europe SE
consolidated and UBS Americas Holding LLC consolidated) as of
31 December 2021 and is available under “Pillar 3 disclosures” at
ubs.com/investors
.
Capital and other regulatory information for UBS AG
consolidated in accordance with the Basel III framework, as
applicable to Swiss SRBs, is provided in the combined UBS Group
AG and UBS AG Annual Report 2021, available under “Annual
reporting” at
ubs.com/investors
.
Regulatory framework
The Basel III framework came into effect in Switzerland on
1 January 2013 and is embedded in the Swiss Capital Adequacy
Ordinance (the CAO). The CAO also includes the too-big-to-fail
provisions applicable to Swiss SRBs, which have been fully phased-
in since 1 January 2020.
Under the Swiss SRB framework, going and gone concern
requirements represent the Group’s TLAC requirement. TLAC
encompasses regulatory capital, such as CET1, loss-absorbing
additional tier 1 (AT1) and tier 2 capital instruments, and liabilities
that can be written down or converted into equity in case of
resolution or for the purpose of restructuring measures.
Capital and other instruments contributing to our total
loss-absorbing capacity
In addition to CET1 capital, the following instruments contribute
to our loss-absorbing capacity:
–
loss-absorbing AT1 capital instruments (high- and low-trigger);
–
loss-absorbing tier 2 capital instruments (high- and low-trigger);
–
non-Basel III-compliant tier 2 capital instruments; and
–
TLAC-eligible senior unsecured debt instruments.
Under the Swiss SRB rules, going concern capital includes CET1
and high-trigger loss-absorbing AT1 capital instruments. Our
existing outstanding low-trigger loss-absorbing AT1 capital
instruments are available to meet the going concern capital
requirements until their first call date. As of their first call date,
these instruments are eligible to meet the gone concern
requirements.
Outstanding high- and low-trigger loss-absorbing tier 2 capital
instruments, non-Basel III-compliant tier 2 capital instruments and
TLAC-eligible senior unsecured debt instruments are eligible to
meet gone concern requirements until one year before maturity.
A maximum of 25% of the gone concern requirements can be
met with instruments that have a remaining maturity of between
one and two years (i.e., are in the last year of eligibility). However,
once at least 75% of the gone concern requirement has been met
with instruments that have a remaining maturity of greater than
two years, all instruments that have a remaining maturity of
between one and two years remain eligible to be included in the
total gone concern capital.
›
Refer to “Bondholder information,” available at
ubs.com/investors
, for more information about the eligibility of
capital and senior unsecured debt instruments and key features
and terms and conditions of capital instruments
Total loss-absorbing capacity and leverage ratio requirements
Going concern capital requirements
Under the Swiss SRB requirements, total going concern minimum
requirements for all Swiss SRBs are a capital ratio requirement of
12.86% of RWA and a leverage ratio requirement of 4.5%. In
addition to these minimum requirements, an add-on reflecting
the degree of systemic importance is applied, based on market
share and LRD. The applicable market share add-on requirements
for UBS increased 0.36% to 0.72% of RWA and 0.125% to
0.25% of LRD, reflecting an increase in UBS’s market share in the
Swiss credit business to more than 17%. The applicable LRD add-
on requirements remained unchanged at 0.72% of RWA and
0.25% of LRD, as our Group LRD remained within the same add-
on bucket.
Effective from 27 March 2020, the Swiss Federal Council
deactivated the countercyclical buffer requirement of 2% on risk-
weighted positions that are directly or indirectly backed by
residential properties in Switzerland
to support the lending
capacity of banks. Even though the Swiss countercyclical buffer
requirement was not active in 2021
,
we
continued to
apply
additional countercyclical buffer requirements introduced in other
BCBS member jurisdictions, which result in an additional buffer
requirement of 0.02%. In January 2022, the Swiss Federal Council
decided, at the request of the Swiss National Bank, to reactivate
the countercyclical capital buffer, at a maximum level of 2.5%.
The reactivated countercyclical capital buffer will become effective
on 30 September 2022 and is expected to increase our CET1
capital requirement by approximately 30 basis points.
The total going concern capital requirements applicable are
14.32% of RWA (including countercyclical buffer requirements)
and 5.00% of LRD. Furthermore, of the total going concern
capital requirement of 14.32% of RWA, at least 10.02% must be
met with CET1 capital, while a maximum of 4.3% can be met
with high-trigger loss-absorbing AT1 capital instruments
(including our existing
outstanding low
-
trigger AT1 capital
instruments, which qualify until their first call date as mentioned
above).
Similarly, of the total going concern leverage ratio requirement
of 5.00%, at least 3.5% must be met with CET1 capital, while a
maximum of 1.5% can be met with high-trigger loss-absorbing
AT1 capital instruments (including our existing outstanding low-
trigger AT1 capital instruments, which qualify until their first call
date as mentioned above).
153
Gone concern loss-absorbing capacity requirements
As an internationally active Swiss SRB, UBS is also subject to gone
concern loss-absorbing capacity requirements. The gone concern
requirements also include add-ons for market share and LRD.
Under the Swiss SRB framework, banks are eligible for a rebate
on the gone concern requirement if they take actions that
facilitate recovery and resolvability beyond the minimum
requirements. The amount of the rebate for improved resolvability
is assessed annually by FINMA. Based on actions we had
completed by December 2020 to improve resolvability, FINMA
granted a rebate on the gone concern requirement of 55% of the
aforementioned maximum rebate in the third quarter of 2021,
which resulted in a reduction of 3.14 percentage points for the
RWA-based requirement and 1.10 percentage points for the
LRD-based requirement.
Our gone concern requirements are further reduced when
higher quality capital instruments
(
CET1 capital,
low
-
trigger
loss
-
absorbing
AT1 or certain low
-
trigger
tier
2 capital
instruments) are used to meet gone concern requirements. As of
31
December 202
1
,
UBS
used
low
-
trigger tier
2 capital
instruments to fulfill gone concern requirements, resulting in a
reduction
o
f
0.4
3
percentage points for the RWA
-
based
requirement and 0.
1
2
percentage
points for the LRD
-
based
requirement.
Until 31 December 2021, the gone concern requirement after
the application of the rebate for resolvability measures and the
reduction for the use of higher quality capital instruments was
floored at 8.6% and 3% for the RWA
-
and LRD
-
based
requirements
,
respectively.
From 1
January 2022 onward, this
floor increased to 10% and 3.75% for the RWA- and LRD-based
requirements, respectively.
In this
report
,
we refer to the RWA
-
based gone concern
requirements as gone concern loss-absorbing capacity
requirements and the RWA-based gone concern ratio is referred
to as the gone concern loss-absorbing capacity ratio.
The table
below
provides the RWA
-
and
LRD
-
based
requirements and information as of 31 December 2021.
Swiss SRB going and gone concern requirements and information
As of 31.12.21
RWA
LRD
USD million, except where indicated
in %
in %
Required going concern capital
Total going concern capital
1
1
Common equity tier 1 capital
2
of which: minimum capital
of which: buffer capital
of which: countercyclical buffer
Maximum additional tier 1 capital
of which: additional tier 1 capital
of which: additional tier 1 buffer capital
Eligible going concern capital
Total going concern capital
Common equity tier 1 capital
Total loss-absorbing additional tier 1 capital
3
of which: high-trigger loss-absorbing additional tier 1 capital
of which: low-trigger loss-absorbing additional tier 1 capital
Required gone concern capital
Total gone concern loss-absorbing capacity
4
of which: base requirement
5
of which: additional requirement for market share and LRD
of which: applicable reduction on requirements
of which: rebate granted (equivalent to 55% of maximum rebate)
of which: reduction for usage of low-trigger tier 2 capital instruments
Eligible gone concern capital
Total gone concern loss-absorbing capacity
Total tier 2 capital
of which: low-trigger loss-absorbing tier 2 capital
of which: non-Basel III-compliant tier 2 capital
TLAC-eligible senior unsecured debt
Total loss-absorbing capacity
Required total loss-absorbing capacity
Eligible total loss-absorbing capacity
Risk-weighted assets / leverage ratio denominator
Risk-weighted assets
Leverage ratio denominator
1 Includes applicable add-ons of 1.44% for RWA and 0.50% for LRD. 2 Our minimum CET1 leverage ratio requirement of 3.5% consists of a 1.5% base requirement, a 1.5% base buffer capital requirement, a 0.25%
LRD add-on requirement and a 0.25% market share add-on requirement based on our Swiss credit business. 3 Includes outstanding low-trigger loss-absorbing additional tier 1 (AT1) capital instruments, which are
available under the Swiss SRB framework to meet the going concern requirements until their first call date. As of their first call date, these instruments are eligible to meet the gone concern requirements. 4 A maximum
of 25% of the gone concern requirements can be met with instruments that have a remaining maturity of between one and two years. Once at least 75% of the minimum gone concern requirement has been met with
instruments that have a remaining maturity of greater than two years, all instruments that have a remaining maturity of between one and two years remain eligible to be included in the total gone concern capital.
5 The gone concern requirement after the application of the rebate for resolvability measures and the reduction for the use of higher quality capital instruments is floored at 8.6% and 3% for the RWA- and LRD-based
requirements, respectively. This means that the combined reduction may not exceed 5.7 percentage points for the RWA-based requirement of 14.3% and 2.0 percentage points for the LRD-based requirement of 5.0%.
Risk, capital, liquidity and funding, and balance sheet | Capital management
154
Total loss-absorbing capacity
Swiss SRB going and gone concern information
USD million, except where indicated
31.12.21
31.12.20
Eligible going concern capital
Total going concern capital
Total tier 1 capital
Common equity tier 1 capital
Total loss-absorbing additional tier 1 capital
of which: high-trigger loss-absorbing additional tier 1 capital
of which: low-trigger loss-absorbing additional tier 1 capital
Eligible gone concern capital
Total gone concern loss-absorbing capacity
Total tier 2 capital
of which: low-trigger loss-absorbing tier 2 capital
of which: non-Basel III-compliant tier 2 capital
TLAC-eligible senior unsecured debt
Total loss-absorbing capacity
Total loss-absorbing capacity
Risk-weighted assets / leverage ratio denominator
Risk-weighted assets
Leverage ratio denominator
1
Capital and loss-absorbing capacity ratios (%)
Going concern capital ratio
of which: common equity tier 1 capital ratio
Gone concern loss-absorbing capacity ratio
Total loss-absorbing capacity ratio
Leverage ratios (%)
1
Going concern leverage ratio
of which: common equity tier 1 leverage ratio
Gone concern leverage ratio
Total loss-absorbing capacity leverage ratio
1 The leverage ratio denominator (LRD) and leverage ratios for 31 December 2020 do not reflect the effects of the temporary exemption that applied from 25 March 2020 until 1 January 2021 and was granted by
FINMA in connection with COVID-19. Refer to the “Regulatory and legal developments” section and to “Application of the temporary COVID-19-related FINMA exemption of central bank sight deposits” in the
“Capital, liquidity and funding, and balance sheet” sections of our Annual Report 2020 for more information.
Audited |
Reconciliation of IFRS equity to Swiss SRB common equity tier 1 capital
USD million
31.12.21
31.12.20
Total IFRS equity
61,002
59,765
Equity attributable to non-controlling interests
(340)
(319)
Defined benefit plans, net of tax
(270)
(41)
Deferred tax assets recognized for tax loss carry-forwards
(4,565)
(5,617)
Deferred tax assets on temporary differences, excess over threshold
(49)
(5)
Goodwill, net of tax
1
(5,838)
(6,319)
Intangible assets, net of tax
(180)
(296)
Compensation-related components (not recognized in net profit)
(1,700)
(1,349)
Expected losses on advanced internal ratings-based portfolio less provisions
(482)
(330)
Unrealized (gains) / losses from cash flow hedges, net of tax
(628)
(2,321)
Own credit related to gains / losses on financial liabilities measured at fair value that existed at the balance sheet date
315
382
Own credit related to gains / losses on derivative financial instruments that existed at the balance sheet date
(50)
(45)
Unrealized gains related to debt instruments at fair value through OCI, net of tax
(68)
(152)
Prudential valuation adjustments
(167)
(150)
Accruals for dividends to shareholders
(1,700)
(1,314)
Capital reserve for potential share repurchases
(2,000)
Other
1
0
Total common equity tier 1 capital
45,281
39,890
1 Includes goodwill related to significant investments in financial institutions of USD
22
413
associates.
p
155
Total loss-absorbing capacity and movement
Our total loss-absorbing capacity increased by USD 3.0 billion to
USD 104.8 billion as of 31 December 2021.
Going concern capital and movement
Audited |
premium, which primarily consists of additional paid-in capital
related to shares
issued;
and retained earnings. A detailed
reconciliation of IFRS equity to CET1 capital is provided in the
“Reconciliation of IFRS equity to Swiss SRB common equity tier 1
capital” table.
Our CET1 capital increased by USD
5.4
45.3
billion as of 31 December 2021, mainly as a result of operating
profit before tax of USD
9.5
0.5
eligible deferred tax assets on temporary differences, a USD
0.4
billion decrease in deduction of goodwill resulting from the sale
of our remaining minority investment in Clearstream Fund
Centre AG (previously Fondcenter AG) and an increase of USD
0.2
billion related to the launch of our new operational partnership
entity with Sumitomo Mitsui Trust Holdings, Inc. These effects
were partly offset by dividend accruals of USD
1.7
tax expenses of USD
1.6
repurchase program of USD
0.6
effects of USD
0.6
capital components of USD
0.4
defined benefit plans of USD
0.2
Our share repurchases in 2021 decreased CET1 capital by
USD
0.6
repurchase programs of USD
2.6
of the capital reserve for potential share repurchases of USD
2.0
billion. The capital reserve for potential share repurchases was
fully utilized during 2021.
›
Refer to “UBS shares” in this section for more information about
our share repurchase programs
Our loss-absorbing additional tier 1 (AT1) capital decreased by
USD
1.1
15.2
USD
2.6
dollars and foreign currency translation and interest rate risk
hedge effects, partly offset by two issuances of USD
2.25
of AT1 capital instruments denominated in US dollars.
p
Gone concern loss-absorbing capacity and movement
Audited |
by USD 1.3 billion to USD
44.3
included USD
41.1
debt.
p
The decrease was mainly due to four TLAC-eligible senior
unsecured debt instruments denominated in US dollars, euro and
Swiss francs that ceased to be eligible as they had less than one
year to maturity, the call of a low-trigger tier 2 capital instrument
denominated in euro, a low-trigger loss-absorbing tier 2 capital
instrument denominated in US dollars that ceased to be eligible
as it had less than one year to maturity, and the call of a TLAC-
eligible senior unsecured debt instrument denominated in euro,
as well as interest rate risk hedge, foreign currency translation and
other effects. These decreases were partly offset by 16 issuances
of TLAC-eligible senior unsecured debt instruments denominated
in euro, US dollars, Swiss francs, pounds sterling and Australian
dollars.
Loss-absorbing capacity and leverage ratios
Our CET1 capital ratio increased 1.2 percentage points to 15.0%,
reflecting a USD 5.4 billion increase in CET1 capital that was partly
offset by a USD 13.1 billion increase in RWA.
Our CET1 leverage ratio increased 0.39 percentage points to
4.24% as of 31 December 2021, as the aforementioned increase
in CET1 capital was partly offset by a USD 32 billion increase in
LRD.
Our gone concern loss-absorbing capacity ratio decreased from
15.8% to 14.6% and our gone concern leverage ratio decreased
from 4.4% to 4.1%, mainly driven by an increase in RWA and
LRD, respectively, and
the aforementioned
decrease
in gone
concern loss-absorbing capacity.
Risk, capital, liquidity and funding, and balance sheet | Capital management
156
Swiss SRB total loss-absorbing capacity movement
USD million
Going concern capital
Swiss SRB
Common equity tier 1 capital as of 31.12.20
39,890
Operating profit before tax
9,484
Current tax (expense) / benefit
(1,564)
Deferred tax assets on temporary differences
544
Goodwill and intangible assets
519
Accruals for proposed dividends to shareholders
(1,700)
Share repurchase program
(2,612)
Capital reserve for potential share repurchases
2,000
Foreign currency translation effects before tax
(570)
Compensation- and own share-related capital components
(441)
Defined benefit plans
1
(234)
Other
(34)
Common equity tier 1 capital as of 31.12.21
45,281
Loss-absorbing additional tier 1 capital as of 31.12.20
16,288
Issuance of high-trigger loss-absorbing additional tier 1 capital
2,250
Call of high-trigger loss-absorbing additional tier 1 capital
(2,600)
Interest rate risk hedge, foreign currency translation and other effects
(731)
Loss-absorbing additional tier 1 capital as of 31.12.21
15,207
Total going concern capital as of 31.12.20
56,178
Total going concern capital as of 31.12.21
60,488
Gone concern loss-absorbing capacity
Tier 2 capital as of 31.12.20
7,744
Call of low-trigger loss-absorbing tier 2 capital
(2,415)
Debt no longer eligible as gone concern loss-absorbing capacity due to residual tenor falling to below one year
(2,020)
Interest rate risk hedge, foreign currency translation and other effects
(166)
Tier 2 capital as of 31.12.21
3,144
TLAC-eligible senior unsecured debt as of 31.12.20
37,801
Issuance of TLAC-eligible senior unsecured debt
11,956
Call of TLAC-eligible senior unsecured debt
(2,027)
Debt no longer eligible as gone concern loss-absorbing capacity due to residual tenor falling to below one year
(4,248)
Interest rate risk hedge, foreign currency translation and other effects
(2,362)
TLAC-eligible senior unsecured debt as of 31.12.21
41,120
Total gone concern loss-absorbing capacity as of 31.12.20
45,545
Total gone concern loss-absorbing capacity as of 31.12.21
44,264
Total loss-absorbing capacity
Total loss-absorbing capacity as of 31.12.20
101,722
Total loss-absorbing capacity as of 31.12.21
104,752
1 Includes a pension plan curtailment of USD 80 million that reduced the defined benefit obligation and a USD 254 million payment of the second installment to employees’ retirement assets in the Swiss pension
fund. As announced in 2018, a similar contribution will be made in the first quarter of 2022. Refer to “Note 29 Pension and other post-employment benefit plans” in the “Consolidated financial statements” section
of the Annual Report 2019 for more information.
Additional information
Active management of sensitivity to foreign exchange
movements
Group Treasury is mandated to minimize adverse effects from
changes in foreign currency rates on our CET1 capital and / or
CET1 capital ratio. A significant portion of our CET1 capital and
RWA is denominated in Swiss francs, euro, pounds sterling and
other currencies. In order to hedge the CET1 capital ratio, CET1
capital needs to have foreign currency exposure, leading to
foreign currency rates sensitivity of CET1 capital.
As a consequence, it is not possible to simultaneously fully
hedge CET1 capital and the CET1 capital ratio. As the proportion
of RWA denominated in currencies other than the US dollar
outweighs
CET1
capita
l in
such
currencies, a significant
appreciation of the US dollar against such currencies could benefit
our capital ratios, while a significant depreciation of the US dollar
against these currencies could adversely affect our capital ratios.
The Group Asset and Liability Committee (the Group ALCO), a
committee of the Group Executive Board, has mandated Group
Treasury to adjust the currency mix of CET1 capital, within limits
set by the BoD, to balance the effect of foreign exchange
movements on CET1 capital and the CET1 capital ratio. Limits are
in place for the sensitivity of both CET1 capital and the CET1
capital ratio to an appreciation or depreciation of 10% in the
value of the US dollar against other currencies.
Sensitivity to currency movements
Risk-weighted assets
We estimate that a 10% depreciation of the US dollar against
other currencies would have increased our RWA by USD 13
billion and our CET1 capital by
USD
1.
4
billion as of
31
December
202
1
(31
December
2020
:
USD
1
3
billion and
USD 1.3 billion, respectively ) and decreased our CET1 capital
ratio 15 basis points (31 December 2020: 15 basis points) .
Conversely, we estimate that a 10% appreciation of the US
dollar against other currencies would have decreased our RWA by
USD
1
1 billion and our CET1 capital by
USD
1.
3
billion
(31
December
20
20
:
USD
1
2
billion and
USD
1.
2
billion,
respectively) and increased our CET1 capital ratio 14 basis points
(31 December 2020: 15 basis points).
157
Leverage ratio denominator
Our leverage ratio is also sensitive to foreign exchange
movements as a result of the currency mix of our capital and LRD.
When adjusting the currency mix in capital, potential effects on
the going concern leverage ratio are taken into account and the
sensitivity of the going concern leverage ratio to an appreciation
or depreciation of 10% in the value of the US dollar against other
currencies is actively monitored.
We estimate that a 10% depreciation of the US dollar against
other currencies would have increased our LRD by USD 63 billion
as of 31 December 2021 (31 December 2020: USD 65 billion)
and
decreased
our Swiss SRB going concern leverage ratio
15 basis points (31 December 2020: 16 basis points). Conversely,
we estimate that a 10% appreciation of the US dollar against
other currencies would have decreased our LRD by USD 57 billion
(31 December 20 20: USD 58 billion) and increased our Swiss SRB
going concern leverage ratio 16 basis points (31 December 20 20:
16 basis points) .
The
aforementioned
sensitivities do not consider foreign
currency translation effects related to defined benefit plans other
than those related to the currency translation of the net equity of
foreign operations.
Estimated effect on capital from litigation, regulatory and similar
matters subject to provisions and contingent liabilities
We have estimated the loss in capital that we could incur as a
result of the risks associated with the matters described in
“
Note
18 Provisions and contingent liabilities
”
in the
“Consolidated financial statements” section of this report. We
have
employed
for this purpose the advanced measurement
approach (AMA) methodology that we use when determining the
capital requirements associated with operational risks, based on a
99.9% confidence level over a 12-month horizon. The
methodology takes into consideration UBS and industry
experience for the AMA operational risk categories to which those
matters correspond, as well as the external environment affecting
risks of these types, in isolation from other areas. On this basis,
we estimate the maximum loss in capital that we could incur over
a 12-month period as a result of our risks associated with these
operational risk categories at USD 4.0 billion as of 31 December
2021, with no change to prior year-end. This estimate is not
related to and does not take into account any provisions
recognized for any of these matters and does not constitute a
subjective assessment of our actual exposure in any of these
matters.
›
Refer to “Non-financial risk” in the “Risk management and
control” section of this report for more information
›
Refer to “Note 18 Provisions and contingent liabilities” in the
“Consolidated financial statements” section of this report for
more information
Capital and capital ratios of our significant regulated subsidiaries
UBS Group AG is a holding company conducting substantially all
operations through UBS AG and subsidiaries thereof. UBS Group
AG and UBS AG have contributed a significant portion of their
respective capital
to,
and provide
d
substantial liquidity to
,
subsidiaries. Many of these subsidiaries are subject to regulations
requiring compliance with minimum capital, liquidity and similar
requirements. Regulatory capital components and capital ratios of
our significant regulated subsidiaries determined under the
regulatory framework of each subsidiary’s home jurisdiction are
provided in the “Financial and regulatory key figures for our
significant regulated subsidiaries and sub-groups” section of this
report. Supervisory authorities generally have discretion to impose
higher requirements
,
or to otherwise limit
the activities of
subsidiaries. Supervisory authorities also may require entities to
measure capital and leverage ratios on a stressed basis, and may
limit the ability of the entity to engage in new activities or take
capital actions based on the results of those tests.
›
Refer to the 31 December 2021 Pillar 3 Report, available under
“Pillar 3 disclosures” at
ubs.com/investors
,
for more capital and
other regulatory information about our significant regulated
subsidiaries and sub-groups
Joint liability of UBS AG and UBS Switzerland AG
In June 2015, upon the transfer of the Personal & Corporate
Banking and Global Wealth Management businesses booked in
Switzerland from UBS AG to UBS Switzerland AG, UBS AG and
UBS Switzerland AG assumed joint liability for obligations
transferred to UBS Switzerland AG and existing at UBS AG,
respectively. Under certain circumstances, the Swiss Banking Act
and FINMA’s Banking Insolvency Ordinance authorize FINMA to
modify, extinguish or convert to common equity liabilities of a
bank in connection with a resolution or insolvency of such bank.
The
joint liability amounts
have declined
as obligations
matured, terminated or were novated following the transfer date.
As of 31 December 2021, the liability of UBS Switzerland AG
amounted to CHF 5.2 billion (the equivalent of USD 5.7 billion), a
decrease of CHF
3.7 billion (USD
4.4
billion)
compared with
31 December 2020. The respective liability of UBS AG has been
substantially extinguished.
Risk, capital, liquidity and funding, and balance sheet | Capital management
158
Risk-weighted assets
RWA development in 2021
During 2021, RWA increased by USD 13.1 billion to USD 302.2
billion, primarily driven by increases of USD 12.0 billion in credit
and counterparty credit risk RWA, USD 1.0 billion in operational
risk RWA and USD 0.9 billion in non-counterparty-related risk.
These increases were partly offset by a decrease of USD 0.8 billion
in market risk RWA.
›
Refer to the 31 December 2021 Pillar 3 Report, available under
“Pillar 3 disclosures” at
ubs.com/investors
, for more information
about RWA movements and definitions of RWA movement key
drivers
Movement in risk-weighted assets by key driver
USD billion
RWA as of
31.12.20
Currency
effects
Methodology
and policy
changes
Model
updates /
changes
Regulatory
add-ons
Asset size and
Other
1
RWA as of
31.12.21
Credit and counterparty credit risk
2
178.1
(4.1)
2.0
5.3
3.1
5.8
190.1
Non-counterparty-related risk
3
23.4
(0.3)
1.2
24.3
Market risk
11.8
(0.1)
3.1
4
(3.7)
11.1
Operational risk
75.8
1.0
76.7
Total
289.1
(4.4)
2.0
6.1
6.2
3.2
302.2
1 Includes the Pillar 3 categories “Asset size,” “Credit quality of counterparties,” “Acquisitions and disposals” and “Other.” Refer to the 31 December 2021 Pillar 3 Report under “Pillar 3 disclosures” at
ubs.com/investors for more information. 2 Includes settlement risk, credit valuation adjustments, equity exposures in the banking book and securitization exposures in the banking book. 3 Non-counterparty-
related risk includes deferred tax assets recognized for temporary differences, property, equipment, software and other items. 4 As of 31 December 2021, the regulatory add-on related to time decay was USD 3.5
billion.
Credit and counterparty credit risk
Credit and counterparty credit risk RWA increased by USD 12.0
billion to USD 190.1 billion as of 31 December 2021. This increase
was partly driven by asset size and other movements of USD 5.8
billion, due to an increase in asset size of USD 8.8 billion, mainly
due to loan growth in Global Wealth Management, partly offset
by asset quality movements of USD 3.1 billion, mainly reflecting
improvements in counterparty ratings and loss given default (LGD)
in Global Wealth Management and Personal & Corporate
Banking. Also, 2021 included increases from model updates of
USD 5.3 billion, regulatory add-ons of USD 3.1 billion, and
methodology and policy changes of USD 2.0 billion. These
increases were partly offset by decreases from currency effects of
USD 4.1 billion.
Movement in credit and counterparty credit risk RWA by key driver
1
USD billion
Global Wealth
Management
Personal &
Corporate
Banking
Asset
Management
Investment
Bank
Group
Functions
Group
Total credit and counterparty credit risk RWA as of 31.12.20
46.7
62.8
2.9
58.5
7.2
178.1
Asset size
5.5
1.1
0.3
1.8
0.1
8.8
Asset quality
(1.3)
(1.1)
0.0
(0.4)
(0.3)
(3.1)
Model updates
4.3
1.2
0.0
(0.2)
0.0
5.3
Methodology and policy changes
1.7
0.3
0.0
0.0
0.0
2.0
Regulatory add-ons
0.2
0.7
0.0
2.3
(0.1)
3.1
Acquisitions and disposals
0.0
0.0
0.0
0.0
0.0
0.0
Foreign exchange movements
(0.6)
(1.6)
0.0
(1.4)
(0.5)
(4.1)
Other
0.4
(0.4)
0.0
0.0
0.0
0.1
Total movement
10.2
0.2
0.3
2.1
(0.8)
12.0
Total credit and counterparty credit risk RWA as of 31.12.21
56.9
63.0
3.2
60.5
6.4
190.1
1 Refer to the 31 December 2021 Pillar 3 Report under “Pillar 3 disclosures” at ubs.com/investors for the definitions of credit and counterparty credit risk RWA movement categories.
159
Model updates
The increase in credit and counterparty credit risk RWA from
model updates of USD 5.3 billion was primarily driven by the
phase-in impacts for structured margin loans and similar products
in Global Wealth Management of USD 2.1 billion and by new
probability of default (PD) and LGD models for the mortgage
portfolio in the US of USD
2.0 billion.
In addition, we have
updated the LGD model for mortgages in Switzerland, which
resulted in an RWA increase of USD 0.9 billion and was partly
offset by an RWA reduction of USD 0.3 billion related to the
introduction of new models for the leasing of aircraft and
industrial goods.
›
Refer to “Credit risk models” in the “Risk management and
control” section of this report for more information about model
updates
Methodology changes
The increase in credit and counterparty credit risk RWA from
methodology changes of USD 2.0 billion was primarily driven by
a change related to credit valuation adjustment (CVA) risk for
derivative exposures
with Lombard clients
that
resulted in an
increase of USD 1.1 billion in RWA. Additionally, the approach
used for the covered bonds within the high-quality liquid asset
(HQLA) portfolio has been changed from the advanced internal
ratings-based (A-IRB) approach to the standardized approach, as
requested by FINMA, resulting in an RWA increase of USD 1.0
billion.
Regulatory add-ons
The increase in credit and counterparty credit risk RWA from
regulatory add-ons of USD 3.1 billion was primarily driven by add-
ons for prime brokerage clients of USD 2.4 billion, credit card
exposures in Switzerland of USD 0.5 billion, as well as clients
leasing aircraft and industrial goods of USD 0.4 billion.
›
Refer to the “Risk management and control” section of this
report and the 31 December 2021 Pillar 3 Report, available under
“Pillar 3 disclosures” at
ubs.com/investors
, for more information
about credit and counterparty credit risk developments
We expect that further methodology changes and model
updates, as well as regulatory add-ons, will increase credit and
counterparty credit risk RWA by around USD 10 billion in 2022.
The extent and timing of RWA changes may vary as methodology
changes and model updates are completed and receive regulatory
approval. In addition, changes in the composition of the relevant
portfolios and other market factors will affect RWA.
Risk, capital, liquidity and funding, and balance sheet | Capital management
160
Non-counterparty-related risk
Non-counterparty credit risk RWA increased by USD 0.9 billion to
USD 24.3 billion as of 31 December 202 1, primarily driven by an
increase in deferred tax assets on temporary differences.
Market risk
Market risk RWA decreased by USD 0.8 billion to USD 11.1 billion
as of 31
December 202
1
,
primarily
driven by a decrease of
USD 3.7 billion from portfolio and market movements , mostly in
the Investment Bank’s Global Markets business. This was partly
offset by an increase from regulatory add-ons of USD 3.1 billion,
primarily related to time decay. The integration of time decay into
the regulatory VaR model
is subject to further discussions
between FINMA and UBS.
›
Refer to the “Risk management and control” section of this
report and the 31 December 2021 Pillar 3 Report, available under
“Pillar 3 disclosures” at
ubs.com/investors,
about market risk developments
Operational risk
Operational risk RWA increased by USD 1.0 billion to USD 76.7
billion as of 31 December 2021, driven by the annual recalibration
of the AMA model used for the calculation of operational risk
capital. Allocations to the business divisions changed in the fourth
quarter of 2021, as certain historical losses dropped from the time
window that is relevant for the internal allocation approach.
We are assessing the effect of the verdict in the French cross-
border matter and the corresponding changes in provisions for
litigation, regulatory and similar matters on operational risk RWA
in consultation with FINMA. We expect to reflect additional
operational risk RWA in the first quarter of 2022, with a potential
single
-
digit billion
US dollar operational risk RWA impact
following completion of this assessment.
›
Refer to “Advanced measurement approach model” in the “Risk
management and control” section of this report for more
information about the AMA model
Risk-weighted assets by business division and Group Functions
USD billion
Global Wealth
Management
Personal &
Corporate
Banking
Asset
Manage-
ment
Investment
Bank
Group
Functions
Total
RWA
31.12.21
Credit and counterparty credit risk
1
56.9
63.0
3.2
60.5
6.4
190.1
Non-counterparty-related risk
2
6.2
2.0
0.6
3.5
12.0
24.3
Market risk
1.6
0.0
8.1
1.5
11.1
Operational risk
35.2
8.1
3.0
20.2
10.3
76.7
Total
99.8
73.2
6.9
92.2
30.1
302.2
31.12.20
Credit and counterparty credit risk
1
46.7
62.8
2.9
58.5
7.2
178.1
Non-counterparty-related risk
2
6.2
2.1
0.7
3.6
10.7
23.4
Market risk
1.4
0.0
9.0
1.4
11.8
Operational risk
32.8
7.2
3.3
23.2
9.3
75.8
Total
87.2
72.1
6.9
94.3
28.7
289.1
31.12.21 vs 31.12.20
Credit and counterparty credit risk
1
10.2
0.2
0.3
2.1
(0.8)
12.0
Non-counterparty-related risk
2
0.0
(0.1)
(0.1)
(0.2)
1.2
0.9
Market risk
0.1
0.0
(0.9)
0.1
(0.8)
Operational risk
2.4
0.9
(0.3)
(3.0)
1.0
1.0
Total
12.7
1.1
(0.1)
(2.0)
1.5
13.1
1 Includes settlement risk, credit valuation adjustments, equity exposures in the banking book and securitization exposures in the banking book. 2 Non-counterparty-related risk includes deferred tax assets recognized
for temporary differences (31 December 2021: USD 11.4 billion; 31 December 2020: USD 10.0 billion), as well as property, equipment, software and other items (31 December 2021: USD 12.9 billion; 31 December
2020: USD 13.4 billion).
161
Leverage ratio denominator
LRD increased by USD 32 billion to USD 1,069 billion as of 31 December 2021, driven by asset size and other movements of USD 54
billion, partly offset by a decrease due to currency effects of USD 23 billion.
Movement in leverage ratio denominator by key driver
USD billion
LRD as of
31.12.20
1
Currency
effects
Asset size and
other
LRD as of
31.12.21
On-balance sheet exposures (excluding derivative exposures and SFTs)
2
806.6
(17.0)
57.8
847.4
Derivative exposures
96.6
(2.7)
(3.0)
90.9
Securities financing transactions
115.3
(2.3)
(3.9)
109.2
Off-balance sheet items
31.3
(0.7)
2.2
32.8
Deduction items
(12.8)
0.1
1.2
(11.5)
Total
1,037.1
(22.6)
54.3
1,068.9
1 The respective period shown ending on 31 December 2020 does not reflect the effects of the temporary exemption that applied from 25 March 2020 until 1 January 2021 and was granted by FINMA in connection
with COVID-19. Refer to the “Regulatory and legal developments” section and to “Application of the temporary COVID -19-related FINMA exemption of central bank sight deposits” in the “Capital, liquidity and
funding, and balance sheet” section of our Annual Report 2020, available under “Annual reporting” at ubs.com/investors, for more information. 2 The exposures exclude derivative financial instruments, cash
collateral receivables on derivative instruments, receivables from SFTs, and margin loans, as well as prime brokerage receivables and financial assets at fair value not held for trading, both related to SFTs. These
exposures are presented separately under Derivative exposures and Securities financing transactions in this table.
The LRD movements described below exclude currency effects.
On-balance sheet exposures (excluding derivative exposures
and SFTs) increased by USD 58 billion, mainly driven by an increase
in central bank balances partly offset by disposal of high-quality
liquid asset (HQLA) securities in Group Treasury, as well as higher
lending balances, mainly in Global Wealth Management, and
trading assets in the Investment Bank.
Derivative exposures
de
creased by
USD
3
billion, reflecting
market-driven movements and lower client volumes mainly in the
Investment Bank.
SFTs decreased by USD 4 billion, mainly due to lower prime
brokerage receivables and margin loan repayments as a result of
client activities in the Investment Bank.
›
Refer to “Balance sheet and off-balance sheet” in this section for
more information about balance sheet movements
Risk, capital, liquidity and funding, and balance sheet | Capital management
162
Leverage ratio denominator by business division and Group Functions
USD billion
Global Wealth
Management
Personal &
Corporate
Banking
Asset
Management
Investment
Bank
Group
Functions
Total
31.12.21
Total IFRS assets
395.2
225.4
25.6
346.4
124.5
1,117.2
Difference in scope of consolidation
1
0.0
0.0
(21.5)
(0.1)
0.0
(21.6)
Less: derivative exposures and SFTs
2
(25.9)
(11.8)
(0.1)
(159.2)
(51.2)
(248.2)
On-balance sheet exposures
369.3
213.6
4.1
187.1
73.3
847.4
Derivative exposures
5.8
1.4
0.0
79.0
4.7
90.9
Securities financing transactions
22.6
10.9
0.0
45.7
29.9
109.2
Off-balance sheet items
7.2
17.5
0.0
7.6
0.5
32.8
Items deducted from Swiss SRB tier 1 capital
(5.3)
(0.2)
(1.2)
(0.3)
(4.4)
(11.5)
Total
399.6
243.2
2.9
319.2
104.0
1,068.9
31.12.20
3
Total IFRS assets
367.7
231.7
28.6
369.7
128.1
1,125.8
Difference in scope of consolidation
1
(0.1)
(21.1)
0.0
0.1
(21.2)
Less: derivative exposures and SFTs
2
(34.0)
(16.7)
(0.7)
(191.6)
(54.9)
(298.0)
On-balance sheet exposures
333.6
215.0
6.7
178.0
73.3
806.6
Derivative exposures
6.6
2.0
0.0
82.7
5.3
96.6
Securities financing transactions
30.1
15.1
0.7
46.5
22.9
115.3
Off-balance sheet items
6.1
16.3
0.0
8.5
0.4
31.3
Items deducted from Swiss SRB tier 1 capital
(5.2)
(0.1)
(1.6)
(0.3)
(5.5)
(12.8)
Total
371.2
248.3
5.8
315.5
96.2
1,037.1
31.12.21 vs 31.12.20
Total IFRS assets
27.5
(6.3)
(2.9)
(23.3)
(3.6)
(8.6)
Difference in scope of consolidation
1
0.1
0.0
(0.4)
(0.1)
(0.1)
(0.5)
Less: derivative exposures and SFTs
2
8.1
4.9
0.7
32.5
3.7
49.8
On-balance sheet exposures
35.7
(1.4)
(2.7)
9.1
0.0
40.8
Derivative exposures
(0.8)
(0.6)
0.0
(3.7)
(0.6)
(5.7)
Securities financing transactions
(7.5)
(4.2)
(0.7)
(0.8)
7.0
(6.2)
Off-balance sheet items
1.1
1.2
(0.9)
0.1
1.5
Items deducted from Swiss SRB tier 1 capital
(0.1)
0.0
0.4
0.0
1.1
1.3
Total
28.4
(5.1)
(2.9)
3.7
7.7
31.7
1 Represents the difference between the IFRS and the regulatory scope of consolidation, which is the applicable scope for the LRD calculation. 2 The exposures consist of derivative financial instruments, cash
collateral receivables on derivative instruments, receivables from SFTs, and margin loans, as well as prime brokerage receivables and financial assets at fair value not held for trading, both related to SFTs, all of which
are in accordance with the regulatory scope of consolidation. These exposures are presented separately under Derivative exposures and Securities financing transactions in this table. 3 The respective period shown
ending on 31 December 2020 does not reflect the effects of the temporary exemption that applied from 25 March 2020 until 1 January 2021 and was granted by FINMA in connection with COVID-19. Refer to the
“Regulatory and legal developments” section and to “Application of the temporary COVID-19-related FINMA exemption of central bank sight deposits” in the “Capital, liquidity and funding, and balance sheet”
section of our Annual Report 2020, available under “Annual reporting” at ubs.com/investors, for more information.
163
UBS AG consolidated total loss-absorbing capacity and leverage
ratio information
Going and gone concern requirements and information
UBS is considered an SRB under Swiss banking law and, on a
consolidated basis, both UBS Group AG and UBS AG are required
to comply with regulations based on the Basel III framework as
applicable for Swiss SRBs.
The Swiss SRB framework and requirements applicable to
UBS AG consolidated are consistent with those applicable to
UBS Group AG consolidated and are described in the “Capital,
liquidity and funding, and balance sheet” section of this report.
›
Refer to “Regulatory framework” in this section for more
information about total loss-absorbing capacity, leverage ratio
requirements and gone concern rebate
UBS AG is subject to going and gone concern requirements on
a standalone basis. Capital and other regulatory information for
UBS AG standalone is provided under “Holding company and
significant regulated subsidiaries and sub-groups” at
ubs.com/investors
available under “Pillar 3 disclosures” at
ubs.com/investors
.
The table on the next page provides the RWA- and LRD-based
requirements and information as of 31 December 2021 for
UBS AG consolidated.
Risk, capital, liquidity and funding, and balance sheet | Capital management
164
Swiss SRB going and gone concern requirements and information
As of 31.12.21
RWA
LRD
USD million, except where indicated
in %
in %
Required going concern capital
Total going concern capital
1
1
Common equity tier 1 capital
2
of which: minimum capital
of which: buffer capital
of which: countercyclical buffer
Maximum additional tier 1 capital
of which: additional tier 1 capital
of which: additional tier 1 buffer capital
Eligible going concern capital
Total going concern capital
Common equity tier 1 capital
Total loss-absorbing additional tier 1 capital
3
of which: high-trigger loss-absorbing additional tier 1 capital
of which: low-trigger loss-absorbing additional tier 1 capital
Required gone concern capital
4
Total gone concern loss-absorbing capacity
5
of which: base requirement
of which: additional requirement for market share and LRD
of which: applicable reduction on requirements
of which: rebate granted (equivalent to 55% of maximum rebate)
of which: reduction for usage of low-trigger tier 2 capital instruments
Eligible gone concern capital
Total gone concern loss-absorbing capacity
Total tier 2 capital
of which: low-trigger loss-absorbing tier 2 capital
of which: non-Basel III-compliant tier 2 capital
TLAC-eligible senior unsecured debt
Total loss-absorbing capacity
Required total loss-absorbing capacity
Eligible total loss-absorbing capacity
Risk-weighted assets / leverage ratio denominator
Risk-weighted assets
Leverage ratio denominator
1 Includes applicable add-ons of 1.44% for RWA and 0.50% for LRD. 2 Our minimum CET1 leverage ratio requirement of 3.5% consists of a 1.5% base requirement, a 1.5% base buffer capital requirement,
a 0.25% LRD add-on requirement and a 0.25% market share add-on requirement based on our Swiss credit business. 3 The relevant capital instruments were issued after the new Swiss SRB framework had been
implemented and qualify as going concern capital at the UBS AG consolidated level, as agreed with FINMA. 4 A maximum of 25% of the gone concern requirements can be met with instruments that have a
remaining maturity of between one and two years. Once at least 75% of the minimum gone concern requirement has been met with instruments that have a remaining maturity of greater than two years, all instruments
that have a remaining maturity of between one and two years remain eligible to be included in the total gone concern capital. 5 The gone concern requirement after the application of the rebate for resolvability
measures and the reduction for the use of higher quality capital instruments is floored at 8.6% and 3% for the RWA- and LRD-based requirements, respectively. This means that the combined reduction may not
exceed 5.7 percentage points for the RWA-based requirement of 14.3% and 2.0 percentage points for the LRD-based requirement of 5.0%.
165
Swiss SRB going and gone concern information
USD million, except where indicated
31.12.21
31.12.20
Eligible going concern capital
Total going concern capital
Total tier 1 capital
Common equity tier 1 capital
Total loss-absorbing additional tier 1 capital
of which: high-trigger loss-absorbing additional tier 1 capital
of which: low-trigger loss-absorbing additional tier 1 capital
1
Eligible gone concern capital
Total gone concern loss-absorbing capacity
Total tier 2 capital
of which: low-trigger loss-absorbing tier 2 capital
of which: non-Basel III-compliant tier 2 capital
TLAC-eligible senior unsecured debt
Total loss-absorbing capacity
Total loss-absorbing capacity
Risk-weighted assets / leverage ratio denominator
Risk-weighted assets
Leverage ratio denominator
2
Capital and loss-absorbing capacity ratios (%)
Going concern capital ratio
of which: common equity tier 1 capital ratio
Gone concern loss-absorbing capacity ratio
Total loss-absorbing capacity ratio
Leverage ratios (%)
2
Going concern leverage ratio
of which: common equity tier 1 leverage ratio
Gone concern leverage ratio
Total loss-absorbing capacity leverage ratio
1 The relevant capital instruments were issued after the new Swiss SRB framework had been implemented and qualify as going concern capital of UBS AG, as agreed with FINMA. 2 The leverage ratio denominator
(LRD) and leverage ratios for 31 December 2020 do not reflect the effects of the temporary exemption that applied from 25 March 2020 until 1 January 2021 and was granted by FINMA in connection with COVID-
19. Refer to “UBS AG consolidated total loss-absorbing capacity and leverage ratio information” in the “Capital, liquidity and funding, and balance sheet” section of the combined UBS Group AG and UBS AG Annual
Report 2020, available under “Annual reporting” at ubs.com/investors, for more information.
Risk, capital, liquidity and funding, and balance sheet | Capital management
166
UBS Group AG vs UBS AG consolidated loss-absorbing
capacity and leverage ratio information
The going concern capital of UBS AG consolidated was USD 5.1
billion lower than the going concern capital of UBS Group AG
consolidated as of 31 December 2021, reflecting lower CET1
capital of USD 3.7 billion and lower going concern loss-absorbing
additional tier 1 (AT1) capital of USD 1.4 billion.
The aforementioned difference in CET1 capital was primarily
due to a lower UBS AG consolidated IFRS equity of USD 2.6 billion
and higher UBS AG accruals for dividends, as well as a higher
capital deduction at the UBS AG consolidated level related to
deferred tax assets on temporary differences. The aforementioned
factors were partly offset by compensation-related regulatory
capital accruals at the UBS Group AG level.
The going concern loss-absorbing AT1 capital of UBS AG
consolidated was USD 1.4 billion lower than that of UBS Group
AG consolidated as of 31
December 202
1
,
mainly
reflecting
deferred contingent capital plan awards granted at Group level to
eligible employees for the performance years 2016 to 2020, partly
offset by two loss-absorbing AT1 capital instruments on-lent by
UBS Group AG to UBS AG.
Differences in capital between UBS Group AG consolidated
and UBS AG consolidated related to employee compensation
plans will reverse to the extent underlying services are performed
by employees of, and are consequently charged to, UBS AG and
its subsidiaries. Such reversal generally occurs over the service
period of the employee compensation plans.
The leverage ratio framework for UBS AG consolidated is
consistent with that of UBS Group AG consolidated. As of
31 December 2021, the going concern leverage ratio of UBS AG
consolidated was 0.5 percentage points lower than that of UBS
Group AG consolidated, mainly because the going concern capital
of UBS AG consolidated was USD 5.1 billion lower.
Audited |
Reconciliation of IFRS equity to Swiss SRB common equity tier 1 capital (UBS Group AG vs UBS AG consolidated)
As of 31.12.21
USD million
UBS Group AG
(consolidated)
UBS AG
(consolidated)
Difference
Total IFRS equity
61,002
58,442
2,559
Equity attributable to non-controlling interests
(340)
(340)
Defined benefit plans, net of tax
(270)
(270)
Deferred tax assets recognized for tax loss carry-forwards
(4,565)
(4,565)
Deferred tax assets on temporary differences, excess over threshold
(49)
(350)
302
Goodwill, net of tax
(5,838)
(5,838)
Intangible assets, net of tax
(180)
(180)
Compensation-related components (not recognized in net profit)
(1,700)
(1,700)
Expected losses on advanced internal ratings-based portfolio less provisions
(482)
(482)
Unrealized (gains) / losses from cash flow hedges, net of tax
(628)
(628)
Own credit related to gains / losses on financial liabilities measured at fair value that existed at the balance sheet date
315
315
Own credit related to gains / losses on derivative financial instruments that existed at the balance sheet date
(50)
(50)
Unrealized gains related to debt instruments at fair value through OCI, net of tax
(68)
(68)
Prudential valuation adjustments
(167)
(167)
Accruals for dividends to shareholders
(1,700)
(4,200)
2,500
Other
1
(24)
25
Total common equity tier 1 capital
45,281
41,594
3,687
p
167
Swiss SRB going and gone concern information (UBS Group AG vs UBS AG consolidated)
As of 31.12.21
USD million, except where indicated
UBS Group AG
(consolidated)
UBS AG
(consolidated)
Difference
Eligible going concern capital
Total going concern capital
Total tier 1 capital
Common equity tier 1 capital
Total loss-absorbing additional tier 1 capital
of which: high-trigger loss-absorbing additional tier 1 capital
of which: low-trigger loss-absorbing additional tier 1 capital
Eligible gone concern capital
Total gone concern loss-absorbing capacity
Total tier 2 capital
of which: low-trigger loss-absorbing tier 2 capital
of which: non-Basel III-compliant tier 2 capital
TLAC-eligible senior unsecured debt
Total loss-absorbing capacity
Total loss-absorbing capacity
Risk-weighted assets / leverage ratio denominator
Risk-weighted assets
Leverage ratio denominator
Capital and loss-absorbing capacity ratios (%)
Going concern capital ratio
of which: common equity tier 1 capital ratio
Gone concern loss-absorbing capacity ratio
Total loss-absorbing capacity ratio
Leverage ratios (%)
Going concern leverage ratio
of which: common equity tier 1 leverage ratio
Gone concern leverage ratio
Total loss-absorbing capacity leverage ratio
Risk, capital, liquidity and funding, and balance sheet | Capital management
168
Equity attribution and return on attributed equity
Under
our equity attribution framework, tangible equity is
attributed based on a weighting of 50% each for average risk-
weighted assets (RWA) and average leverage ratio denominator
(LRD), which both include resource allocations from Group
Functions to the business divisions (the BDs). Average RWA and
LRD are converted to common equity tier 1 (CET1) capital
equivalents using capital ratios of 12.5% and 3.75%, respectively.
If the attributed tangible equity calculated under the weighted-
driver approach is less than the CET1 capital equivalent of risk-
based capital (RBC) for any BD, the CET1 capital equivalent of RBC
is used as a floor for that BD.
In addition to tangible equity, we allocate equity to the BDs to
support goodwill and intangible assets.
Furthermore, we allocate to the BDs attributed equity related
to certain CET1 deduction items, such as compensation-related
components and expected losses on the advanced internal
ratings-based portfolio less provisions.
We attribute all remaining Basel III capital deduction items to
Group Functions. These items include deferred tax assets (DTAs)
recognized for tax loss carry
-
forwards
,
DTAs on temporary
differences in excess of the threshold, accruals for shareholder
returns, and unrealized gains from cash flow hedges.
›
Refer to “Balance sheet and off-balance sheet” in this section for
more information about movements in equity attributable to
shareholders
Average attributed equity
For the year ended
USD billion
31.12.21
31.12.20
31.12.19
Global Wealth Management
18.8
17.1
16.6
Personal & Corporate Banking
9.2
8.9
8.4
Asset Management
2.0
2.0
1.8
Investment Bank
13.0
12.6
12.3
Group Functions
16.3
17.4
15.1
of which: deferred tax assets
1
5.9
6.7
7.1
of which: related to retained RWA and LRD
2,3
3.2
3.4
2.8
of which: accruals for shareholder returns and others
4
7.2
7.2
5.1
Average equity attributed to business divisions and Group Functions
59.3
57.8
54.2
1 Includes average attributed equity related to the Basel III capital deduction items for deferred tax assets (deferred tax assets recognized for tax loss carry-forwards and deferred tax assets on temporary differences,
excess over threshold), as well as retained RWA and LRD related to deferred tax assets. 2 Excludes average attributed equity related to retained RWA and LRD related to deferred tax assets. 3 The temporary
exemption that applied from 25 March 2020 until 1 January 2021 and was granted by FINMA in connection with COVID-19 was not applied when calculating average attributed equity for 2020. Refer to the
“Regulatory and legal developments” section of our Annual Report 2020 for more information. 4 Includes attributed equity related to dividend accruals, unrealized gains from cash flow hedges, and a balancing
item for capital held in excess of the 12.5% / 3.75% capital and leverage ratio calibration thresholds for equity attribution.
Return on attributed equity
1
For the year ended
In %
31.12.21
31.12.20
31.12.19
Global Wealth Management
25.4
23.6
20.5
Personal & Corporate Banking
18.9
14.2
17.1
Asset Management
51.8
74.2
29.7
Investment Bank
20.3
19.7
6.4
1 Return on attributed equity for Group Functions is not shown, as it is not meaningful.
169
Liquidity and funding management
We manage the structural risks of our balance sheet, including
interest rate risk, structural foreign exchange risk and collateral
risk, as well as liquidity and funding risks. This section provides
information
about
regulatory requirements
and
the firm’s
governance structure, liquidity and funding management
(including sources of liquidity and funding), contingency planning,
and stress testing. The balances disclosed in this section represent
year-end positions, unless indicated otherwise. Intra-period
balances fluctuate in the ordinary course of business and may
differ from year-end positions.
Strategy, objectives and governance
Audited |
positions has the overall objective of optimizing our franchise’s
value across a broad range of market conditions while considering
current and future regulatory constraints. We employ a number
of measures to monitor these positions under normal and stressed
conditions. In particular, we use stress scenarios to apply
behavioral adjustments to our balance sheet and calibrate the
results from internal stress models while in compliance with
external measures, primarily the liquidity coverage ratio (the LCR)
and the net stable funding ratio (the NSFR). Our liquidity and
funding strategy is proposed by Group Treasury and approved by
the Group Asset and Liability Committee (the Group ALCO),
which is a committee of the Group Executive Board (the GEB) that
is overseen by the Risk Committee of the Board of Directors (the
BoD).
p
Group Treasury monitors and oversees the implementation and
execution of our liquidity and funding strategy and is responsible
for adherence to policies, limits, triggers and targets. This enables
close control of both our cash and collateral, including our high-
quality liquid assets, and centralizes the Group’s general access to
wholesale cash markets in Group Treasury. In addition, should a
crisis require contingency funding measures to be invoked, Group
Treasury is responsible for coordinating liquidity generation with
representatives of the relevant business areas. Group Treasury
reports on the Group’s overall liquidity and funding position,
including funding status and concentration risks, at least monthly,
to the Group ALCO and the Risk Committee of the BoD.
Audited |
set at Group and, where appropriate, at legal entity and
business division levels, and are reviewed and reconfirmed at
least once a year by the BoD, the Group ALCO, the Group
Chief Financial Officer, the Group Chief Risk Officer, the Group
Treasurer and the business divisions, taking into consideration
current and projected business strategy and risk tolerance. The
principles underlying our limit , trigger and target framework
are designed to maximize and sustain the value of our business
franchise and maintain an appropriate balance in the asset and
liability structure. Structural limits , triggers and targets focus
on the structure and composition of the balance sheet, with
supplementary limits , triggers and targets designed to drive
the utilization, diversification and allocation of funding
resources. To complement and support this framework, Group
Treasury monitors the markets for early warning indicators
regarding the current liquidity situation. These indicators are
used at the Group level to assess both the overall global and
regional liquidity status for potential threats. Treasury Risk
Control provides independent oversight over liquidity and
funding risks.
p
›
Refer to the “Corporate governance” and “Risk management
and control” sections of this report for more information
Liquidity management
Audited |
has sufficient liquidity or access to funding sources to meet its
liabilities when due, to meet prudential requirements and to
survive a severe three-month idiosyncratic and market-wide
liquidity stress event, allowing for discrete management actions
instructed by the Group Treasurer in addition to monetizing the
firm’s liquidity reserves.
Our liquid assets are managed using limits, triggers and targets
to maintain an appropriate level of diversification (issuer, tenor
and other risk characteristics) in response to any expected or
un
expected
volatility in funding availability or requirements
caused by adverse market, operational or other firm-specific
events. The liquid asset portfolio size is managed dynamically, so
as to operate at all times within the risk appetite of the BoD and
relevant Group and subsidiary liquidity requirements.
p
Stress testing
Audited |
and liability structure that enables us to maintain an appropriately
balanced liquidity and funding position under various scenarios.
Liquidity crisis scenario analysis and contingency funding planning
support the liquidity management process and aim to ensure that
immediate corrective measures to absorb potential sudden
liquidity shortfalls can be put into effect.
p
We model our liquidity exposures under two main potential
scenarios: a structural market-wide scenario and a combined
market and idiosyncratic scenario. We continuously refine the
assumptions used to maintain a robust, actionable and tested
contingency plan.
›
Refer to “Risk measurement” in the “Risk management and
control” section of this report for more information about stress
testing
Risk, capital, liquidity and funding, and balance sheet | Liquidity and funding management
170
Structural market-wide scenario
As a liquidity crisis could have a myriad of causes, the structural
market-wide scenario encompasses potential stress effects across
all markets, currencies and products, but it is typically not firm-
specific. In addition to the loss of the ability to replace maturing
wholesale funding, it assumes a gradual decline of otherwise
stable client deposits and liquidity outflows corresponding to a
one
-
notch downgrade in our long
-
term credit
rating
,
and a
corresponding downgrade in our short-term rating.
We use a cash capital metric that incorporates the structural
market-wide scenario and measures the amount of long-term
funding available to fund franchise and illiquid assets. Franchise
assets consist of lending exposure to clients or assets to support
franchise client activities. The illiquid assets cannot easily and
readily be sold or exchanged for cash without a substantial loss in
value within the scenario horizon. Long-term funding used as
cash capital to support franchise and illiquid assets is composed
of unsecured funding with a remaining time to maturity of at least
one year, deposits that have a behavioral maturity of at least one
year and shareholders’ equity.
Combined market and idiosyncratic scenario
The combined scenario represents an extreme stress event that
combines a firm-specific crisis with market disruption. This
scenario assumes: (i)
substantial outflows o
f
otherwise stable
client deposits, mainly due on demand; (ii) inability to renew or
replace maturing unsecured wholesale
funding;
(iii)
unusually
large drawdowns on loan commitments; (iv) reduced capacity to
g
enerate liquidity from trading
assets;
(v)
liquidity outflows
corresponding to a three-notch downgrade in our long-term
credit rating, and a corresponding downgrade in our short-term
rating; (vi) triggering contractual obligations to unwind derivative
positions or to deliver additional
collateral;
(vii)
additional
collateral requirements due to adverse movements in the market
values of derivatives; and (viii) elevated liquidity requirements in
supp
ort of continuous payment and settlement activity
.
The
combined scenario is run daily to project potential cash outflows
under it and is assessed as part of ongoing risk management
activities.
Contingency Funding Plan
Audited |
our global crisis management framework, which covers various
types of crisis events. This Contingency Funding Plan contains an
assessment of contingent funding sources and liquidity generative
actions in a stressed environment, early warning indicators and
metrics, and contingency procedures. Our funding diversification
and global scope help to protect our liquidity position in the event
of a crisis. We regularly assess and test all material known and
expected cash flows, as well as the level and availability of high-
quality collateral that could be used to raise additional funding if
required. Our contingent funding sources include our high-quality
liquid asset (HQLA) portfolios, available and unutilized liquidity
facilities at several major central banks, contingent reductions of
liquid trading portfolio assets
,
and other available
business
management actions.
p
Funding management
Audited |
including concentration risks, aiming to ensure that we maintain
a well-balanced and diversified liability structure. Our funding
management team looks to create the optimal asset and liability
structure to finance our businesses reliably and cost-efficiently.
Our funding activities are planned by analyzing the overall
liquidity and funding profile of our balance sheet, taking into
account the amount of stable funding that would be needed to
support ongoing business activities through periods of difficult
market conditions.
p
The funding strategy of UBS Group AG is set annually in the
Funding Plan and is reviewed on a quarterly basis. The Funding
Plan is developed by Group Treasury and approved by the Group
ALCO. Group Treasury proposes, sets and oversees limits, triggers
an
d targets for funding generation
,
including concentration
limits, weighted average maturity limits and volume. Funding
diversification is monitored continuously, with a focus on product
type, single-counterparty exposure (as a percentage of the total),
mat
urity profile,
and
the
overall contribution of a particular
funding source to the liability mix.
›
Refer to “Balance sheet and off-balance sheet” in this section for
more information about the development of our short-term and
long-term debt during 2021
Global Wealth Management and Personal & Corporate
Banking provide significant, cost-efficient and stable sources of
funding. These include core deposits and debt issued through the
Swiss central mortgage institutions, which use a portion of our
portfolio of Swiss residential mortgages as collateral to generate
long-term funding. In addition, we have several short-, medium-
and long-term funding programs under which we issue senior
unsecured debt and structured notes, as well as short-term debt.
These programs enable institutional and private investors who are
active in the markets of Europe, the US and Asia Pacific to
customize their investments in UBS’s debt. Collectively, these
broad product offerings and funding sources, together with the
global scope of our business activities, support our funding
stability.
Internal funding and funds transfer pricing
We use an integrated liquidity and funding framework to govern
the liquidity management of all our branches and subsidiaries,
and our major sources of liquidity are channeled through entities
that are fully consolidated. Group
Treasury
meets internal
demands for funding by channeling funds from entities
generating surplus cash to those in need of financing, except in
circumstances where transfer restrictions exist.
Funding costs and benefits are allocated to our business
divisions according to our liquidity and funding risk management
framework. Our internal funds transfer pricing system, which is
governed by Group Treasury, is designed to provide the proper
liability structure to support the assets and planned activities of
each business division.
171
Credit ratings
Credit ratings can affect the cost and availability of funding,
especially funding from wholesale unsecured sources. Our credit
ratings can also influence the performance of some of our
businesses and the levels of client and counterparty confidence.
Rating agencies take into account a range of factors when
assessing creditworthiness and setting credit ratings. These
include the company’s strategy, its business position and franchise
value, stability and quality of earnings, capital adequacy, risk
profile and management, liquidity management, diversification of
funding sources, asset quality, and corporate governance. Credit
ratings reflect the opinions of the rating agencies and can change
at any time.
In evaluating our liquidity and funding requirements, we
consider the potential effect of a reduction in our long-term credit
ratings and a corresponding reduction in short-term ratings. If our
credit ratings were to be downgraded, rating trigger clauses could
result in an immediate cash settlement or the need to deliver
additional collateral to counterparties from contractual
obligations related to over-the-counter (OTC) derivative positions
and other obligations. Based on our credit ratings as of 31
December 2021, in the event of a one-notch reduction in our
long-term credit ratings, we would have been required to provide
USD 0.0 billion in cash or other collateral. In the event of a two-
notch reduction it would have been USD 0.5 billion and for a
three-notch downgrade USD 0.7 billion. In all scenarios these
collateral requirements predominantly relate to OTC derivative
positions.
There was one main rating action with regard to UBS Group
AG’s and UBS AG’s solicited credit ratings in 2021. On 2 March
2021, Fitch Ratings revised the outlooks for the issuer ratings of
UBS Group AG, UBS AG and the rated subsidiaries from negative
back to stable, reversing the outlook change on 31 March 2020,
which was part of a series of rating actions over several weeks
across the sector to reflect the disruption caused by the
COVID-19 pandemic.
›
Refer to “Liquidity and funding management are critical to UBS’s
ongoing performance” in the “Risk factors” section of this report
for more information
Liquidity coverage ratio
The LCR measures the short-term resilience of a bank’s liquidity
profile by comparing whether sufficient HQLA are available to
survive expected net cash outflows from a significant liquidity
stress scenario, as defined by the relevant regulator.
For UBS, HQLA are low-risk unencumbered assets under the
control of Group Treasury that are easily and immediately
convertible into cash at little or no loss of value, in order to meet
liquidity needs. Our HQLA predominantly consist of assets that
qualify as Level 1 in the LCR framework, including cash, central
bank reserves and government bonds. Group HQLA are held by
UBS AG and its subsidiaries, and may include amounts that are
available to meet funding and collateral needs in certain
jurisdictions, but are not readily available for use by the Group as
a whole. These limitations are typically the result of local
regulatory requirements, including local LCR and large exposure
requirements. Funds that are effectively restricted are excluded
from the calculation of Group HQLA to the extent they exceed the
outflow assumptions for the subsidiary that holds the relevant
HQLA. On this basis, USD 44 billion of assets were excluded from
our daily average Group HQLA for the fourth quarter of 2021.
Amounts held in excess of local liquidity requirements that are not
subject to other restrictions are generally available for transfer
within the Group.
Basel Committee on Banking Supervision (BCBS) standards
require an LCR of at least 100%. In a period of financial stress,
the Swiss Financial Market Supervisory Authority (FINMA) may
allow banks to use their HQLA and let their LCR temporarily fall
below the minimum threshold. We monitor the LCR in all
significant currencies in order to manage any currency
mismatches between HQLA and the net expected cash outflows
in times of stress.
Our daily average LCR for the fourth quarter of 2021 was
155%, compared with 152% in the fourth quarter of 2020,
remaining above the prudential requirement communicated by
FINMA.
The average LCR increase was driven by a USD 14 billion
increase in average HQLA to USD 228 billion, driven by higher
average cash balances, which was partly offset by an increase in
average net cash outflows of USD 6 billion to USD 147 billion, due
to higher outflows from customer deposit balances and secured
financing transactions.
›
Refer to the 31 December 2021 Pillar 3 Report, available under
“Pillar 3 disclosures” at
ubs.com/investors
,
for more information
about the LCR
›
Refer to the “Significant regulated subsidiary and sub-group
information” section of this report
for more information about
the LCR of UBS AG and UBS Switzerland AG
Liquidity coverage ratio
USD billion, except where indicated
Average 4Q21
1
Average 4Q20
1
High-quality liquid assets
Net cash outflows
Liquidity coverage ratio (%)
2
1 Calculated based on an average of 66 data points in the fourth quarter of 2021 and 63 data points in the fourth quarter of 2020. 2 Calculated after the application of haircuts and inflow and outflow rates, as
well as, where applicable, caps on Level 2 assets and cash inflows.
Risk, capital, liquidity and funding, and balance sheet | Liquidity and funding management
172
Net stable funding ratio
The net stable funding ratio (NSFR) framework is intended to limit
overreliance on short-term wholesale funding, to encourage a
better assessment of funding risk across all on- and off-balance
sheet items and to promote funding stability. The NSFR has two
components: available stable funding (ASF) and required stable
funding (RSF). ASF is the portion of capital and liabilities expected
to be available over the period of one year. RSF is a measure of
the stable funding requirement of an asset based on its maturity,
encumbrance and other characteristics, as well as the potential
for contingent calls on funding liquidity from off-balance sheet
exposures. The BCBS NSFR regulatory framework requires a ratio
of at least 100%.
The NSFR regulation was finalized in the fourth quarter of 2020
with the release of the revised FINMA Circular 2015/2 “Liquidity
risks – banks” and became effective on 1 July 2021.
As of 31 December 2021, our NSFR was unchanged at 119%.
This reflected USD 15 billion higher available stable funding,
mainly driven by an increase in debt issued designated at fair value
and an increase in required stable funding of USD 15 billion,
mainly reflecting higher loans and advances to customers.
Net stable funding ratio
USD billion, except where indicated
31.12.21
31.12.20
1
Available stable funding
Required stable funding
Net stable funding ratio (%)
1 “Net stable funding ratio” is based on estimated pro forma reporting.
173
Balance sheet and off-balance sheet
Balance sheet
The balances disclosed in this
section represent year
-
end
positions, unless indicated otherwise. Intra-period balances
fluctuate in the ordinary course of business and may differ from
year-end positions.
Balance sheet assets
As of 31 December 2021, balance sheet assets totaled USD 1,117
billion, a decrease of USD 9 billion compared with 31 December
20
20
,
which
included a decrease from currency effects of
approximately USD 21 billion.
Derivatives and cash collateral receivables on derivative
instruments
decr
eased by USD
44 billion.
This decrease
predominantly reflected decreases in foreign exchange contracts,
mainly in our Derivatives & Solutions and Financing businesses in
the Investment Bank, driven by net roll-offs, partly offset by
market-driven movements. In addition, interest rate contracts
decreased, mainly in our Derivatives & Solutions and Financing
businesses and in Non-core and Legacy Portfolio, reflecting
market-driven movements as long-term interest rates increased in
the year.
Other financial assets measured at amortized cost and fair
value decreased by USD 21 billion, largely due to shifts within the
high-quality liquid asset (HQLA) portfolio from securities into cash
within Group Treasury. Brokerage receivables decreased by USD 3
billion, mainly in our Financing business in the Investment Bank,
with growth in lending more than offset by an associated increase
in netting effects.
These decreases were partly offset by a USD 35 billion increase
in Cash and balances at central banks, predominantly in Group
Treasury
.
The cash inflow was
generated mainly from lower
funding consumption by th
e Investment Bank,
the
aforementioned shifts within the HQLA portfolio from securities
into cash,
and
net new issuances of long
-
term debt issued
measured at amortized cost. These inflows were partly offset by
outflows from higher margin requirements and an increase in net
receivables from securities financing transactions, as well as
currency effects.
Lending assets increased by USD 18 billion, of which USD 21
billion was in Global Wealth Management and predominantly
reflect
ed
increases in Lombard loans
and mortgage loans
,
primarily in the Americas, partly offset by currency effects. In
Personal & Corporate Banking, lending assets decreased by USD 1
billion as increases in mortgage loans and corporate lending were
more than offset by currency effects. Trading portfolio assets
increased by USD 5 billion, mainly in our Financing business in the
Investment Bank, reflecting higher inventory held to hedge client
positions.
›
Refer to the “Consolidated financial statements” section of this
report for more information
Assets
As of
% change from
USD billion
31.12.21
31.12.20
31.12.20
Cash and balances at central banks
Lending
1
Securities financing transactions at amortized cost
Trading portfolio
2
Derivatives and cash collateral receivables on derivative instruments
Brokerage receivables
Other financial assets measured at amortized cost and fair value
3
Non-financial assets and financial assets for unit-linked investment contracts
Total assets
1 Consists of loans and advances to banks and customers. 2 Consists of financial assets at fair value held for trading. 3 Consists of financial assets at fair value not held for trading, financial assets measured at
fair value through other comprehensive income and other financial assets measured at amortized cost, but excludes financial assets for unit-linked investment contracts.
Risk, capital, liquidity and funding, and balance sheet | Balance sheet and off-balance sheet
174
Asset encumbrance
The table below provides a breakdown of on- and off-balance
sheet assets between encumbered assets, unencumbered assets
and assets that cannot be pledged as collateral.
Assets are presented as
Encumbered
as collateral against an existing liability or are otherwise not
available for securing additional funding. Included within the
latter category are assets protected under client asset segregation
rules, financial assets for unit-linked investment contracts, assets
held in certain jurisdictions to comply with explicit minimum local
asset maintenance requirements.
›
Refer to “Note 23 Restricted and transferred financial assets” in
the “Consolidated financial statements” section of this report for
more information
Assets that cannot be pledged as collateral
that are not encumbered but by their nature are not considered
available to secure funding or meet collateral needs.
All other assets are presented as
Unencumbered
. Assets that
are considered to be readily available to secure funding on a
Group and / or legal entity level are shown separately and consist
of cash and securities readily realizable in the normal course of
business. These include our HQLA and unencumbered positions
in our trading portfolio. Unencumbered assets that are considered
to be available to secure funding on a legal entity level may be
subject to restrictions that limit the total amount of assets
available to the Group as a whole. Other unencumbered assets,
which are not considered to be readily available to secure funding
on a Group and / or legal entity level, primarily consist of loans
and advances to banks.
Asset encumbrance as of 31 December 2021
USD billion
Encumbered
Unencumbered
Assets that
cannot be
pledged as
collateral
Total Group
Assets
pledged
as collateral
Assets
otherwise
restricted and
not available
to secure
funding
Cash and
securities
available to
secure funding
on a Group and /
or legal entity
level
Other
realizable
assets
Balance sheet
Cash and balances at central banks
Loans and advances to banks
Receivables from securities financing transactions
Cash collateral receivables on derivative instruments
Loans and advances to customers
Other financial assets measured at amortized cost
Total financial assets measured at amortized cost
Financial assets at fair value held for trading
1
Derivative financial instruments
Brokerage receivables
Financial assets at fair value not held for trading
1
Total financial assets measured at fair value through profit or loss
Financial assets measured at fair value through other comprehensive income
Non-financial assets
Total balance sheet assets as of 31 December 2021
Total balance sheet assets as of 31 December 2020
Off-balance sheet
Fair value of securities accepted as collateral as of 31 December 2021
Fair value of securities accepted as collateral as of 31 December 2020
Total balance sheet assets and off-balance sheet securities accepted as collateral as of
31 December 2021
of which: high-quality liquid assets
Total balance sheet assets and off-balance sheet securities accepted as collateral as of
31 December 2020
of which: high-quality liquid assets
1 Includes assets pledged as collateral that may be sold or repledged by counterparties. The respective amounts are disclosed in “Note 23 Restricted financial assets” in the “Consolidated financial statements” section
of this report.
Assets available to secure funding on a Group and / or legal entity level by currency
USD billion
31.12.21
31.12.20
Swiss franc
US dollar
Euro
Other
Total
175
Balance sheet liabilities
Total liabilities as of 31 December 2021 were USD 1,056 billion,
a decrease of USD 10 billion compared with 31 December 2020,
which included a decrease from currency effects of approximately
USD 20 billion.
Derivatives and cash collateral payables on derivative
instruments decreased by USD
45 billion
,
in line with the
movement on the asset side. Trading portfolio liabilities decreased
by USD 2 billion, predominantly due to lower levels of short
positions held to hedge client positions. Other financial liabilities
measured at amortized cost and fair value decreased by USD 2
billion
, mainly in Group Treasury due to
higher
netting on
securities financing transactions measured at fair value. Short-
term borrowings decreased by USD 2 billion, mainly due to lower
short-term debt issued in Global Wealth Management, partly
offset by higher amounts due to banks in our Derivatives &
Solutions business in the Investment Bank.
These decreases were partly offset by an increase in customer
deposits of USD 17 billion. An increase of USD 22 billion in Global
Wealth Management, mainly in the Americas, was partly offset by
a decrease of USD 4 billion in Personal & Corporate Banking
driven by currency effects. As of 31 December 2021, our ratio of
customer deposits to outstanding loan balances was 136%
(31 December 2020: 138%).
Debt issued designated at fair value and long-term debt issued
measured at amortized cost increased by USD 16 billion, mainly
driven by USD 13 billion higher debt issued designated at fair
value, mainly reflecting net new issuances of equity-linked and
rates-linked debt instruments, as well as market-driven
movements
in our Derivatives
& Solutions business in the
Investment Bank. In addition, long-term debt issued measured at
amortized cost increased by USD 3 billion, driven by net new
issuance
s
, partly offset by
f
oreign exchange and hedge
accounting effects. During 2021, net new issuances of TLAC-
eligible benchmark instruments
and
senior unsecured debt
USD
12 billion
w
ere
partly
offset
by USD
4 billion of
net
redemptions of
covered bon
d
s and subordinated debt
instruments.
During 2022, USD 1.4 billion equivalent of TLAC-eligible
benchmark instruments and USD 2.0 billion of loss-absorbing
tier 2 capital instruments will mature. In February 2022, loss-
absorbing additional tier 1 capital instruments equivalent to
USD 1.1 billion were called and USD 2.8 billion equivalent of
TLAC-eligible benchmark instruments matured. UBS is already
compliant with its
2022 going and gone concern capital
requirements and expects to act rationally and strategically with
respect to the refinancing of any callable capital instruments and
any potential incremental issuances.
›
Refer to the document titled “UBS Group AG consolidated
capital instruments and TLAC-eligible senior unsecured debt,”
available under “Bondholder information” at
,
for more information
Brokerage payables increased by USD 5 billion, mainly in the
Financing business of our Investment Bank, due to an increase in
client credit and short positions, partly offset by higher netting
effects from increased lending.
Non-financial liabilities and financial liabilities related to unit-
linked investment contracts increased by USD 2 billion, mainly
reflecting a reclassification of assets in Global Wealth
Management as disposal groups held for sale in connection with
the upcoming sales of our domestic wealth management business
in Spain and UBS Swiss Financial Advisers AG. The increase also
included
market
-
driven increases from unit
-
linked investment
contracts in Asset Management.
›
Refer to the “Consolidated financial statements” section of this
report for more information
Equity
Equity
attributable to shareholders increased b
y USD
1,217
million to USD 60,662 million as of 31 December 2021.
This increase was mainly driven by total comprehensive income
attributable to shareholders of positive
USD
5,106 million,
reflecting net profit of USD 7,457 million and negative other
comprehensive income (OCI) of USD 2,351 million. OCI mainly
included negative cash flow hedge OCI of USD 1,675 million,
negative OCI related to foreign currency translation of USD 535
million and negative OCI related to debt instruments measured at
fair value through OCI of USD
157 million
.
In addition,
amortization of deferred share-based compensation awards
increased share premium by USD 643 million and the launch of
our new operational partnership entity with Sumitomo Mitsui
Trust Holdings, Inc. resulted in an equity increase of USD 155
million.
These increases were partly offset by net treasury share activity
that decreased equity by USD 3,326 million. This was mainly due
to share repurchases with an acquisition cost of USD 2,500 million
under our 2021 share repurchase program
,
repurchases
of
USD 112 million under our 2018–2021 program and purchases of
USD 545 million from the market to hedge our share delivery
obligations related to employee share-based compensation
awards. In addition, distributions to shareholders reduced equity
by USD 1,301 million, reflecting a dividend payment of USD 0.37
per share.
In the second quarter of 2021, we canceled 156,632,400
shares purchased under our 2018–2021 share repurchase
program, as approved by shareholders at the 2021 Annual
General Meeting. The cancellation of shares resulted in
reclassifications within equity but had no net effect on our total
equity attributable to shareholders.
›
Refer to the “Group performance” and “Consolidated financial
statements” sections of this report for more information about
OCI
›
Refer to “UBS shares” in this section for more information about
our share repurchase programs
›
Refer to “Note 30 Changes in organization and acquisitions and
disposals of subsidiaries and businesses” in the “Consolidated
financial statements” section of this report for more information
about our partnership with Sumitomo Mitsui Trust Holdings, Inc.
Risk, capital, liquidity and funding, and balance sheet | Balance sheet and off-balance sheet
176
Liabilities and equity
As of
% change from
USD billion
31.12.21
31.12.20
31.12.20
Short-term borrowings
1
Securities financing transactions at amortized cost
Customer deposits
Debt issued designated at fair value and long-term debt issued measured at amortized cost
2
Trading portfolio
3
Derivatives and cash collateral payables on derivative instruments
Brokerage payables
Other financial liabilities measured at amortized cost and fair value
4
Non-financial liabilities and financial liabilities related to unit-linked investment contracts
Total liabilities
Share capital
Share premium
Treasury shares
Retained earnings
Other comprehensive income
5
Total equity attributable to shareholders
Equity attributable to non-controlling interests
Total equity
Total liabilities and equity
1 Consists of short-term debt issued measured at amortized cost and amounts due to banks. 2 The classification of debt issued measured at amortized cost into short-term and long-term is based on original
contractual maturity and therefore long-term debt also includes debt with a remaining time to maturity of less than one year. This classification does not consider any early redemption features. 3 Consists of financial
liabilities at fair value held for trading. 4 Consists of other financial liabilities measured at amortized cost and other financial liabilities designated at fair value, but excludes financial liabilities related to unit-linked
investment contracts. 5 Excludes other comprehensive income related to defined benefit plans and own credit, which is recorded directly in Retained earnings.
177
Liabilities by product and currency
USD billion
As a percentage of total liabilities
All currencies
All currencies
USD
CHF
EUR
Other
31.12.21
31.12.20
31.12.21
31.12.20
31.12.21
31.12.20
31.12.21
31.12.20
31.12.21
31.12.20
31.12.21
31.12.20
Short-term borrowings
56.2
57.7
5.3
5.4
3.1
3.0
0.4
0.6
0.6
1.0
1.3
0.9
of which: amounts due to banks
13.1
11.0
1.2
1.0
0.3
0.3
0.4
0.5
0.1
0.1
0.4
0.1
of which: short-term debt issued
1
43.1
46.7
4.1
4.4
2.7
2.7
0.0
0.0
0.5
0.9
0.8
0.8
Securities financing transactions at
amortized cost
5.5
6.3
0.5
0.6
0.5
0.5
0.0
0.0
0.0
0.0
0.0
0.1
Customer deposits
542.0
524.6
51.3
49.2
23.9
19.7
18.0
20.1
5.2
5.2
4.3
4.2
of which: demand deposits
246.4
236.4
23.3
22.2
8.7
7.4
6.7
7.2
4.4
4.3
3.5
3.4
of which: retail savings / deposits
247.2
220.9
23.4
20.7
11.9
8.3
11.0
11.8
0.5
0.5
0.0
0.0
of which: time deposits
48.4
67.3
4.6
6.3
3.2
4.0
0.3
1.1
0.3
0.4
0.8
0.8
Debt issued designated at fair value
and long-term debt issued
measured at amortized cost
2
169.9
153.8
16.1
14.4
9.5
7.6
1.7
1.6
3.3
3.7
1.5
1.5
Trading portfolio
3
31.7
33.6
3.0
3.2
1.3
1.3
0.1
0.1
0.6
0.5
1.0
1.2
Derivatives and cash collateral
payables on derivative instruments
153.1
198.4
14.5
18.6
12.0
15.2
0.2
0.2
1.4
2.0
0.9
1.1
Brokerage payables
44.0
38.7
4.2
3.6
3.1
2.7
0.0
0.0
0.3
0.2
0.8
0.7
Other financial liabilities measured at
amortized cost and fair value
4
17.6
19.1
1.7
1.8
0.9
1.1
0.1
0.2
0.4
0.2
0.3
0.3
Non-financial liabilities and financial
liabilities related to unit-linked
investment contracts
36.1
33.7
3.4
3.2
0.6
0.6
0.2
0.2
0.3
0.2
2.3
2.2
Total liabilities
1,056.2
1,066.0
100.0
100.0
54.7
51.6
20.8
23.0
12.1
13.1
12.4
12.3
1 Short-term debt issued consists of certificates of deposit, commercial paper, acceptances and promissory notes, and other money market paper. 2 The classification of debt issued measured at amortized cost into
short-term and long-term is based on original contractual maturity and therefore long-term debt also includes debt with a remaining time to maturity of less than one year. This classification does not consider any
early redemption features. 3 Consists of financial liabilities at fair value held for trading. 4 Consists of other financial liabilities measured at amortized cost and other financial liabilities designated at fair value, but
excludes financial liabilities related to unit-linked investment contracts.
Risk, capital, liquidity and funding, and balance sheet | Balance sheet and off-balance sheet
178
Maturity analysis of assets and liabilities
The table below provides an analysis of carrying amounts of
balance sheet assets and liabilities, as well as off-balance sheet
exposures by residual contractual maturity as of the reporting
date. The residual contractual maturity of assets includes the
effect of callable features. The residual contractual maturity of
liabilities and off-balance sheet exposures is based on the earliest
date on which we could be required to pay. The presentation of
liabilities at the carrying amount in this table differs from “Note
24 Maturity analysis of financial liabilities” in the “Consolidated
financial statements” section of this report, where such liabilities
are presented on an undiscounted basis,
as required by
International Financial Reporting Standards (IFRS).
Derivative financial instruments and
f
inancial
assets and
liabilities at fair value held for trading are assigned to the
Due
within 1 month
,
respective contractual maturities may extend over significantly
longer periods.
Assets held to hedge unit-linked investment contracts
(presented within
Financial assets at fair value not held for trading
)
are assigned to the
Due within 1 month
the maturity assigned to the related amounts due under unit-
linked investment contracts (presented within
Other financial
liabilities designated at fair value
).
Other financial assets and liabilities with no contractual
maturity, such as equity securities, are included in the
Perpetual /
Not applicable
classified based on the contractual notice period that the
counterparty of the instrument is entitled to give. Where there is
no contractual notice period, undated or perpetual contracts are
included in the
Perpetual / Not applicable
Non-financial assets and liabilities with no contractual maturity
are generally included in the
Perpetual / Not applicable
bucket.
Loan commitments are classified on the basis of the earliest
date they can be drawn down.
Maturity analysis of assets and liabilities
USD billion
Due
within
1 month
Due
between
1 and 3
months
Due
between
3 and 6
months
Due
between
6 and 9
months
Due
between
9 and 12
months
Due
between
1 and 2
years
Due
between
2 and 5
years
Due over
5 years
Perpetual /
Not
applicable
Total
Assets
Total financial assets measured at amortized cost
Loans and advances to customers
Total financial assets measured at fair value through profit or
loss
Financial assets at fair value not held for trading
29.7
Financial assets measured at fair value through other
comprehensive income
Total non-financial assets
Total assets as of 31 December 2021
Total assets as of 31 December 2020
Liabilities
Total financial liabilities measured at amortized cost
Customer deposits
Debt issued measured at amortized cost
Total financial liabilities measured at fair value through
profit or loss
Debt issued designated at fair value
Total non-financial liabilities
Total liabilities as of 31 December 2021
Total liabilities as of 31 December 2020
Guarantees, loan commitments and forward starting transactions
1
Guarantees, loan commitments and forward starting
transactions as of 31 December 2021
Guarantees, loan commitments and forward starting
transactions as of 31 December 2020
1 The notional amounts associated with derivative loan commitments, as well as forward starting repurchase and reverse repurchase agreements, measured at fair value through profit or loss are presented together
with notional amounts related to derivative instruments and have been excluded from the table above. Refer to “Note 10 Derivative instruments” in the “Consolidated financial statements” section of this report for
information about the notional amounts of these instruments.
179
Off-balance sheet
In the normal course of business, we enter into transactions
where, pursuant to IFRS, the maximum contractual exposure may
not be recognized in whole or in part on our balance sheet. These
transactions include derivative instruments, guarantees, loan
commitments and similar arrangements.
When we incur an obligation or become entitled to an asset
through these arrangements, we recognize them on the balance
sheet. It should be noted that in certain instances the amount
recognized on the balance sheet does not represent the full gain
or loss potential inherent in such arrangements.
›
Refer to “Note 1a Material accounting policies” items 1, 2a and
2c, and “Note 29 Interests in subsidiaries and other entities” in
the “Consolidated financial statements” section of this report for
more information
The following paragraphs provide more information about
certain off-balance sheet arrangements. Additional off-balance
sheet information is primarily provided in Notes 9, 10, 18, 20, 21i,
23 and 29 in the “Consolidated financial statements” section of
this report, and in the 31 December 2021 Pillar 3 Report, available
under “Pillar 3 disclosures” at
Guarantees, loan commitments and similar arrangements
In the normal course of business, we issue various forms of
guarantees, commitments to extend credit, standby and other
letters of credit to support our clients, forward starting
transactions, note issuance facilities and revolving underwriting
facilities. With the exception of related premiums, generally these
guarantees and similar obligations are kept as off-balance sheet
items, unless a provision to cover probable losses or expected
credit losses is required.
Guarantees represent irrevocable assurances that, subject to
the satisfying of certain conditions, we will make payments if our
clients fail to fulfill their obligations to third parties. As of
31 December 2021, the net exposure (i.e., gross values less sub-
participations) from guarantees and similar instruments was
USD 19 billion, compared with USD 15 billion as of 31 December
2020. The increase of USD 4 billion reflected higher guarantees in
Group Treasury and an increase in guarantees issued to corporate
clients in Personal & Corporate Banking. Fee income from issuing
guarantees was not significant to total revenues in 2021 or 2020.
We also enter into commitments to extend credit in the form
of credit lines available to secure the liquidity needs of clients. The
majority of loan commitments range in maturity from one month
to one year. Committed unconditionally revocable credit lines are
generally open-ended.
During 2021, loan commitments decreased by USD 2 billion,
mainly in Personal &
Corporate Banking
,
predominantly in
Personal Banking Switzerland.
Committed unconditionally revocable credit lines
remained
broadly stable. Forward starting reverse repurchase agreements
de
creased by USD
2
billion
and f
orward starting repurchase
agreements increased by USD 1 billion, both predominantly in
Group Treasury.
Off-balance sheet
As of
% change from
USD billion
31.12.21
31.12.20
31.12.20
Guarantees
1
Loan commitments
1,2
Committed unconditionally revocable credit lines
Forward starting reverse repurchase agreements
2
Forward starting repurchase agreements
2
1 Guarantees and Loan commitments are shown net of sub-participations. 2 The exposures related to loan commitments, forward starting repurchase and reverse repurchase agreements measured at fair value
through profit or loss are not included in this table but are reflected as notional amounts in “Note 10 Derivative instruments” in the “Consolidated financial statements” section of this report.
If customers fail to meet their obligations, our maximum
exposure to credit risk is the contractual amount of these
instruments. The risk is similar to the risk involved in extending
loan facilities and is subject to the same risk management and
control framework. In 2021, we recognized net credit loss releases
of USD 46 million related to loan commitments, guarantees and
other credit facilities in
the
scope of expected credit loss
measurement
,
compared with net credit loss expenses of
USD 138 million in 2020. Provisions recognized for guarantees,
loan commitments and other credit facilities in the scope of
expected credit loss measurement were USD 196 million as of
31
December 202
1
, compared wi
th
USD
257
million as of
31 December 2020.
›
Refer to “Note 9 Financial assets at amortized cost and other
positions in scope of expected credit loss measurement” and
“Note 20 Expected credit loss measurement” in the “Consolidated
financial statements” section of this report for more information
about provisions for expected credit losses
Risk, capital, liquidity and funding, and balance sheet | Balance sheet and off-balance sheet
180
For certain obligations we enter into partial sub-participations
to mitigate various risks from guarantees and loan commitments.
A sub-participation is an agreement by another party to take a
share of the loss in the event that the obligation is not fulfilled by
the obligor and, where applicable, to fund a part of the credit
facility. We retain the contractual relationship with the obligor,
and the sub-participant has only an indirect relationship. We only
enter into sub-participation agreements with banks to which we
ascribe a credit rating equal to or better than that of the obligor.
W
e
also
provide representa
tions, warranties and
indemnifications to third parties in the normal course of business.
Support provided to non-consolidated investment funds
In 2021, the Group did not provide material support, financial or
otherwise, to unconsolidated investment funds when the Group
was not contractually obligated to do so, nor does it have an
intention to do so.
Clearing house and exchange memberships
We are a member of numerous securities and derivative
exchanges and clearing houses. In connection with some of these
memberships, we may be required to pay a share of the financial
obligations of another member who defaults, or we may be
otherwise exposed to additional financial obligations. While the
membership rules vary, obligations generally would arise only if
the exchange or clearing house had exhausted its resources. We
consider the probability of a material loss due to such obligations
to be remote.
Deposit insurance
Swiss banking law and the deposit insurance system require Swiss
banks and securities dealers to jointly guarantee an amount of up
to CHF 6 billion for privileged client deposits in the event that a
Swiss bank or securities dealer becomes insolvent.
As of
31 December 2021, FINMA estimates our share in the deposit
insurance system to be CHF
0.9 billion.
This represents
a
contingent payment obligation and exposes us to additional risk.
As of 31 December 2021, we considered the probability of a
material loss from our obligations to be remote.
UBS is also subject
to
,
or is a member of, other deposit
protection schemes in other countries. However, no contingent
payment obligation existed as of 31 December 2021 from any
other material scheme.
Material cash requirements
The Group’s material cash requirements as of 31 December 2021
are represented by the residual contractual maturities for non-
derivative and non-trading financial liabilities included in the table
presented in “Note 24 Maturity analysis of financial liabilities” in
the “Consolidated financial statements” section of this report.
Included in the table are debt issued designated at fair value
(USD 82 billion) and long-term debt issued measured at amortized
cost (USD 106 billion). The amounts represent estimated future
interest and principal payments on an undiscounted basis.
In the normal course of business, we also issue or enter into
various forms of guarantees, loan commitments and other similar
arrangements that may result in an outflow of cash in the future.
The maturity profile of these obligations, which are presented off-
balance sheet, are included in “Note 24 Maturity analysis of
financial liabilities” in the “Consolidated financial statements”
section of this report.
›
Refer to “Guarantees, loan commitments and similar
arrangements” in this section for more information
181
Cash flows
As a global financial institution, our cash flows are complex and
often may bear little relation to our net earnings and net assets.
Consequently, we believe that a traditional cash flow analysis is
less meaningful when evaluating our liquidity position than the
liquidity, funding and capital management frameworks and
measures described elsewhere in this section.
Cash and cash equivalents
As of 31 December 2021, cash and cash equivalents totaled
USD 207.9 billion, an increase of USD 34.3 billion compared with
31 December 2020, driven by net cash inflows from operating
and financing activities. These effects were partly offset by net
cash outflows from investing activities, as well as the effects of
exchange rate differences on cash and cash equivalents, mainly
reflecting the appreciation of the US dollar against the Swiss
franc, Japanese yen and euro in 2021.
Operating activities
Net cash inflows from operating activities were USD 31.4 billion
in 20
2
1
, compared with USD 37
.0
billion in 2020
.
The n
et
operating cash flow, before changes in operating assets and
liabilities and income taxes paid, was an inflow of USD 13.5
billion. Changes in operating assets and liabilities resulted in net
cash inflows of USD 18.0 billion, mainly driven by net inflows of
USD
29.8
billion
related to customer deposit
s
and USD
1
9
.
6
billion from financial assets and liabilities at fair value not held for
trading and other financial assets and liabilities, as well as USD 8.1
billion from brokerage receivables and payables. These inflows
were partly offset by a net outflow from lending balances to
customers of USD 27.5 billion and a net outflow from financial
assets and liabilities at fair value held for trading and derivative
financial instruments of USD 10.5 billion.
Investing activities
Investing activities resulted in a net cash outflow of USD 2.1 billion
in 2021, compared with USD 6.8 billion in 2020, primarily related
to a cash outflow of USD 1.8 billion from purchase of property,
equipment and software.
Financing activities
Financing activities resulted in a net cash inflow of USD 10.3 billion
in 2021, compared with USD 12.4 billion in 2020, mainly due to
net issuance proceeds of USD 18.4 billion from debt designated at
fair value and long-term debt measured at amortized cost. This
inflow was partly offset by the net repayment of USD 3.1 billion of
short
-
term debt
,
net cash used to acquire treasury shares of
USD 3.3 billion and a dividend distribution to shareholders of
USD 1.3 billion.
›
Refer to “Primary financial statements and share information” in
the “Consolidated financial statements” section of this report for
more information about cash flows
Statement of cash flows (condensed)
For the year ended
USD billion
31.12.21
31.12.20
Net cash flow from / (used in) operating activities
31
37
Net cash flow from / (used in) investing activities
(2)
(7)
Net cash flow from / (used in) financing activities
10
12
Effects of exchange rate differences on cash and cash equivalents
(5)
11
Net increase / (decrease) in cash and cash equivalents
34
54
Cash and cash equivalents at the end of the year
208
174
Risk, capital, liquidity and funding, and balance sheet | Currency management
182
Currency management
Strategy, objectives and governance
Group Treasury focuses on three main areas of currency risk
management: (i) currency-matched funding and investment of
non-US dollar assets and liabilities; (ii) sell-down of foreign
currency IFRS profits and losses; and (iii) selective hedging of
anticipated non-US dollar profits and losses to further mitigate the
effect of structural imbalances in the balance sheet. Group
Treasury also manages structural currency composition at the
consolidated Group level.
Currency-matched funding and investment of non-US dollar
assets and liabilities
For monetary balance sheet items and other investments, as far
as is practical and efficient, we follow the principle of matching
the currencies of our assets and liabilities for funding purposes.
This avoids profits and losses arising from the translation of
non-US dollar assets and liabilities.
Net investment hedge accounting is applied to non-US dollar
core investments to balance the effect of foreign exchange
movements on both CET1 capital and the CET1 capital ratio.
›
Refer to “Note 1a Material accounting policies” and “Note 26
Hedge accounting” in the “Consolidated financial statements”
section of this report for more information
›
Refer to “Capital management” in this section for more
information about our active management of sensitivity to
currency movements and the effect thereof on our key ratios
Sell-down of non-US dollar reported profits and losses
Income statement items of foreign subsidiaries and branches of
UBS AG with a functional currency other than the US dollar are
translated into US dollars at average exchange rates. To reduce
earnings volatility on the translation of previously recognized
earnings in foreign currencies, Group Treasury centralizes the
profits and losses (under IFRS) arising in UBS AG and its branches
and sells or buys the profit or loss for US dollars on a monthly
basis. Our foreign subsidiaries follow a similar monthly sell-down
process into their own functional currencies. Retained earnings in
foreign subsidiaries with a functional currency other than the US
dollar are integrated and managed as part of our net investment
hedge accounting program.
Hedging of anticipated non-US dollar profits and losses
The Group ALCO may at any time instruct Group Treasury to
execute hedges to protect anticipated future profits and losses in
foreign currencies against possible adverse trends of foreign
exchange rates. Although intended to hedge future earnings,
these transactions are accounted for as open currency positions
and subject to internal market risk limits for value-at-risk and
stress loss limits.
Dividend distribution
UBS Group AG declares dividends in US dollars. Shareholders
holding shares through SIX (ISIN: CH0244767585) will receive
dividends in Swiss francs, based on a published exchange rate
calculated up to five decimal places, on the day prior to the ex-
dividend
date. Shareholders holding shares through DTC
(ISIN: CH0244767585; CUSIP: H42097107) will be paid dividends
in US dollars.
›
Refer to the “Standalone financial statements” section of this
report for more information about the proposed dividend
distribution of UBS Group AG
183
UBS
UBS Group AG shares
Audited |
As of
31
December 20
2
1
,
IFRS equity attributable to
shareholders amounted to USD
60,662
3,702,422,995
Shares issued decreased by
157
156,632,400
2018–2021 share repurchase program were canceled by means of
a capital reduction, as approved by shareholders at the 2021
Annual General Meeting (AGM).
Each share has a nominal value of CHF
0.10
, carries one vote
if entered into the share register as having the right to vote, and
also entitles the holder to a proportionate share of distributed
dividends.
All shares are fully paid up. As the Articles of
Association of UBS Group AG indicate, there are no other classes
of shares and no preferential rights for shareholders.
p
›
Refer to the “Corporate governance” section of this report for
more information about UBS shares
UBS Group share information
As of or for the year ended
% change from
31.12.21
31.12.20
31.12.20
Shares issued
3,702,422,995
3,859,055,395
(4)
Treasury shares
1
302,815,328
307,477,002
(2)
of which: related to share repurchase program 2018–2021
148,975,800
(100)
of which: related to share repurchase program 2021
2
152,596,273
Shares outstanding
3,399,607,667
3,551,578,393
(4)
Basic earnings per share (USD)
3
2.14
1.83
17
Basic earnings per share (CHF)
4
1.96
1.71
15
Diluted earnings per share (USD)
3
2.06
1.77
16
Diluted earnings per share (CHF)
4
1.88
1.65
14
Equity attributable to shareholders (USD million)
60,662
59,445
2
Less: goodwill and intangible assets (USD million)
6,378
6,480
(2)
Tangible equity attributable to shareholders (USD million)
54,283
52,965
2
Ordinary cash dividends per share (USD)
5,6
0.50
0.37
35
Total book value per share (USD)
17.84
16.74
7
Tangible book value per share (USD)
15.97
14.91
7
Share price (USD)
7
18.01
14.08
28
Market capitalization (USD million)
61,230
50,013
22
1 Based on a settlement date view. 2 Our active share repurchase program of up to CHF 4 billion was started in February 2021. The program was initially planned to run over a three-year period, but we currently
expect to complete it in the first half of 2022. We therefore refer to this program as “share repurchase program 2021” throughout this report. 3 Refer to “Share information and earnings per share” in the
“Consolidated financial statements” section of this report for more information. 4 Basic and diluted earnings per share in Swiss francs are calculated based on a translation of net profit / (loss) under our US dollar
presentation currency. 5 Dividends and / or distributions out of the capital contribution reserve are normally approved and paid in the year subsequent to the reporting period. 6 Refer to “Statement of proposed
appropriation of total profit and dividend distribution out of total profit and capital contribution reserve” in the “Standalone financial statements” section of this report for more information. 7 Represents the share
price as listed on the SIX Swiss Exchange, translated to US dollars using the closing exchange rate as of the respective date.
Risk, capital, liquidity and funding, and balance sheet | UBS shares
184
Holding of UBS Group AG shares
Group Treasury holds UBS Group AG shares to hedge future
share delivery obligations related to employee share-based
compensation awards, and also holds shares purchased under the
share repurchase program. As of 31 December 2021, we held a
total of
302
,
815
,
328
treasury
shares (31
December 20
20
:
307,477,002), or 8.2% (31 December 2020: 8.0%) of shares
issued.
Our 2018–2021 share repurchase program was completed on
2 February 2021 with the purchase of an additional 7.7 million
shares in 2021 for a total acquisition cost of CHF 100 million
(USD 112 million). The 156.6 million shares repurchased under
this program were canceled by means of a capital reduction, as
approved by shareholders at the 2021 AGM.
On 8 February 2021, we commenced a new 2021 share
repurchase program of up to CHF 4 billion. Shares acquired under
this program totaled 152.6 million as of 31 December 2021 for a
total acquisition cost of CHF 2,294 million (USD 2,500 million)
and are intended to be canceled by means of a capital reduction,
pending approval by shareholders at the 2022 AGM.
Looking ahead, we intend to commence a new 2022 share
repurchase program of up to USD 6 billion over two years and
expect to execute up to USD 5 billion of repurchases under both
the existing 2021 repurchase program and the new 2022 program
by the end of 2022.
Treasury shares held to hedge our share delivery obligations
related to employee share-based compensation awards totaled
1
48
.
8
milli
on shares as of
31
December 202
1
(31
December
20
20
:
157.1
million). Share delivery obligations related to
employee share-based compensation awards totaled 175 million
shares as of 31 December 2021 (31 December 2020: 172 million)
and are calculated on the basis of undistributed notional share
awards, taking into account applicable performance conditions.
Treasury shares held are delivered to employees at exercise or
vesting. As of 31 December 2021, up to 122 million UBS Group
AG shares (31 December 2020: 122 million) could have been
issued out of conditional capital to satisfy share delivery
obligations of any future employee share option programs or
similar awards.
The Investment Bank also holds a limited number of
UBS Group AG shares, primarily in its capacity as a market-maker
with regard to UBS Group AG shares and related derivatives, and
to hedge certain issued structured debt instruments.
The table below outlines the market purchases of UBS Group
AG shares by Group Treasury. It does not include the activities of
the Investment Bank.
Treasury share purchases
Share repurchase programs
1
Other treasury shares purchased
2
Month of purchase
3
Number of shares
Average price in CHF
Remaining volume of
2018–2021 share
repurchase program in
CHF million at month-end
Remaining volume of
2021 share repurchase
program in CHF million
at month-end
Number of shares
Average price in USD
January 2021
5,250,000
13.06
31
February 2021
22,861,600
13.89
0
3,714
March 2021
39,377,000
14.64
3,137
April 2021
7,400,415
14.56
3,030
May 2021
15,858,110
13.97
2,808
5,585,000
16.11
June 2021
2,808
14,415,000
16.31
July 2021
7,730,000
14.71
2,694
August 2021
17,140,000
15.36
2,431
September 2021
11,241,248
15.36
2,259
October 2021
4,500,000
16.58
2,184
November 2021
28,800,000
16.54
1,708
December 2021
94,500
16.23
1,706
4
12,770,000
17.73
1 In March 2018, UBS initiated a share repurchase program of up to CHF 2 billion over a three-year period and this program was completed on 2 February 2021. UBS has an active share repurchase program to buy
back up to CHF 4 billion of its own shares over the three-year period started in February 2021. The share repurchase information in this table is disclosed in Swiss francs as the share buybacks were transacted in Swiss
francs on a separate trading line on the SIX Swiss Exchange. 2 This table excludes purchases for the purpose of hedging derivatives linked to UBS Group AG shares and for market-making in UBS Group AG shares.
The table also excludes UBS Group AG shares purchased by post-employment benefit funds for UBS employees, which are managed by a board of UBS management and employee representatives in accordance with
Swiss law. UBS’s post-employment benefit funds purchased 906,951 UBS Group AG shares during the year and held 14,073,132 UBS Group AG shares as of 31 December 2021. 3 Based on the transaction date of
the respective treasury share purchases. 4 The remaining volume of the 2021 share repurchase program as of 31 December 2021 was USD 1,871 million. This was calculated based on the remaining volume of
CHF 1,706 million as of 31 December 2021 and the respective closing exchange rate as of this date.
Trading volumes
For the year ended
1,000 shares
31.12.21
31.12.20
31.12.19
SIX Swiss Exchange total
2,514,259
5,095,908
4,161,555
SIX Swiss Exchange daily average
9,899
20,222
16,713
New York Stock Exchange total
137,366
260,681
203,967
New York Stock Exchange daily average
545
1,030
809
Source: Reuters
185
Listing of UBS Group AG shares
UBS Group AG shares are listed on the SIX Swiss Exchange (SIX).
They are also listed on the New York Stock Exchange (the NYSE)
as global registered shares. As such, they can be traded and
transferred across applicable borders
,
without the need for
conversion, with identical shares traded on different stock
exchanges in different currencies.
During 2021, the average daily trading volume of UBS Group
AG shares was 9.9 million shares on SIX and 0.5 million shares on
the NYSE. SIX is expected to remain the main venue for
determining the movement in our share price, because of the high
volume traded on this exchange.
During the hours in which both SIX and the NYSE are
simultaneously open for trading (generally 3:30 p.m. to 5:30 p.m.
Central European Time), price differences between these
exchanges are likely to be arbitraged away by professional
market-makers. Accordingly, the share price will typically be
similar between the two exchanges when considering the
prevailing US dollar / Swiss franc exchange rate. When SIX is
closed for trading, globally traded volumes will typically be lower.
However, the specialist firm making a market in UBS Group AG
shares on the NYSE is required to facilitate sufficient liquidity and
maintain an orderly market in UBS Group AG shares throughout
normal NYSE trading hours.
Ticker symbols UBS Group AG
Trading exchange
SIX / NYSE
Bloomberg
Reuters
SIX Swiss Exchange
UBSG
UBSG SW
UBSG.S
New York Stock Exchange
UBS
UBS UN
UBS.N
Security identification codes
ISIN
CH0244767585
Valoren
24 476 758
CUSIP
CINS H42097 10 7
Corporate
governance and
compensation
Management report
4
Audited information according to the Swiss law and applicable regulatory
requirements and guidance
Disclosures provided are in line with the requirements of Art. 663c para. 1 and 3 of the Swiss Code of Obligations (supplementary
disclosures for companies whose shares are listed on a stock exchange: shareholdings) and the Ordinance against Excessive
Compensation in Listed Stock Corporations (tables containing such information are marked as “Audited” throughout this section), as
well as other applicable regulations and guidance.
188
189
Corporate governance
Corporate governance and compensation | Corporate governance
190
Corporate governance
UBS Group AG is subject to, and complies with, all relevant Swiss
legal and regulatory
requirements regarding corporate
governance, including the SIX Swiss Exchange’s Directive on
Information relating to Corporate Governance (the SIX Swiss
Exchange Corporate Governance Directive) and the standards
established in the Swiss Code of Best Practice for Corporate
Governance, including the appendix on executive compensation.
As a foreign company with shares listed on the New York Stock
Exchange (the NYSE), UBS Group AG also complies with all
relevant corporate governance standards applicable to foreign
private issuers.
The Organization Regulations of UBS Group AG, adopted by
the Board of Directors (the BoD) based on Art. 716b of the Swiss
Code of Obligations and articles 25 and 27 of the Articles of
Association of UBS Group AG, constitute our primary corporate
governance guidelines.
To the extent practicable, the governance structures of UBS
Group AG and UBS AG are aligned. UBS AG complies with all
relevant Swiss legal and regulatory corporate governance
requirements. As a foreign private issuer with debt securities listed
on the NYSE, UBS AG also complies with the relevant NYSE
corporate governance standards. The discussion in this section
refers to both UBS Group AG and UBS AG, unless specifically
noted otherwise or unless the information discussed is relevant
only to listed companies and therefore only applicable to
UBS Group AG. This approach is in line with US Securities and
Exchange Commission (SEC) regulations and NYSE standards.
›
Refer to the Articles of Association of UBS Group AG and of
UBS AG, and to the Organization Regulations of UBS Group AG,
available at
ubs.com/governance
and
ubs.com/ubs-ag-
governance,
›
The SIX Swiss Exchange Corporate Governance Directive is
available at
directives/DCG-en.pdf,
Corporate Governance at
economiesuisse.ch/en/publications/
swiss-code-best-practice-corporate-governance
rules at
nyse.wolterskluwer.cloud/listed-company-manual
Differences from corporate governance standards relevant
to US-listed companies
The NYSE standards on corporate governance require foreign
private issuers to disclose any significant ways in which their
corporate governance practices differ from those that have to be
followed by domestic companies. Such differences are discussed
below.
Responsibility of the Audit Committee regarding independent
auditors
Our Audit Committee is responsible for the compensation,
retention and oversight of independent auditors. It assesses the
performance and qualifications of external auditors and submits
proposals for appointment, reappointment or removal of
independent auditors to the BoD. As required by the Swiss Code
of Obligations, the BoD submits its proposals for a shareholder
vote
at the Annual General Meeting (the AGM). Under NYSE
standards audit committees are responsible for appointing
independent auditors.
Discussion of risk assessment and risk management policies by
the Risk Committee
As per the Organization Regulations of UBS Group AG and
UBS AG, the Risk Committee, instead of the Audit Committee, as
per NYSE standards, oversees our risk principles and risk capacity
on behalf of the BoD. The Risk Committee is responsible for
monitoring our adherence to those risk principles and monitoring
whether business divisions and control units maintain appropriate
systems of risk management and control.
Supervision of the internal audit function
Although under NYSE standards only audit committees supervise
internal audit functions, the Chairman of the BoD (the Chairman)
and the Audit Committee share the supervisory responsibility and
authority with respect to the internal audit function.
Responsibility of the Compensation Committee for performance
evaluations of senior management of UBS Group AG
In line with Swiss law, our Compensation Committee, together
with the BoD, proposes for shareholder approval at the AGM the
maximum aggregate amount of compensation for the BoD, the
maximum aggregate amount of fixed compensation for the
Group Executive Board (the GEB) and the aggregate amount of
variable compensation for the GEB. The members of the
Compensation Committee are elected by the AGM. Under NYSE
standards it is the responsibility of compensation committees to
evaluate senior management’s performance and to determine
and approve, as a committee or together with the other
independent directors, the compensation thereof.
Proxy statement reports of the Audit Committee and the
Compensation Committee
NYSE standards require the aforementioned committees to
submit their reports directly to shareholders. However, under
Swiss law all reports to shareholders, including those from the
aforementioned committees, are provided to and approved by the
BoD, which has ultimate responsibility to the shareholders.
Shareholder votes on equity compensation plans
NYSE standards require shareholder approval for the establishing
of and material revisions to all equity compensation plans.
However, as per Swiss law, the BoD approves compensation
plans. Shareholder approval is only mandatory if equity-based
compensation plans require an increase in capital. No shareholder
approval is required if shares for such plans are purchased in the
market.
›
Refer to “Board of Directors” in this section for more
information about the BoD’s committees
›
Refer to “Share capital structure” in this section for more
information about UBS Group AG’s capital
191
Group structure and shareholders
Operational Group structure
As of 31 December 2021, the operational structure of the Group
is composed of the Global Wealth Management, Personal &
Corporate Banking, Asset Management and Investment Bank
business divisions, as well as Group Functions.
›
Refer to the “Our businesses” section on page 21 of this report
for more information about our business divisions and Group
Functions
›
Refer to “Financial and operating performance” on page 75 and
to “Note
2 Segment reporting
” in the “Consolidated financial
statements” section on page 306 of this report for more
information
›
Refer to the “Our evolution” section on page 14 of this report
for more information
Listed and non-listed companies belonging to the Group
The Group includes a number of consolidated entities, of which
only UBS Group AG shares are listed.
UBS Group AG’s registered office is at Bahnhofstrasse 45,
CH-8001 Zurich, Switzerland. UBS Group AG shares are listed on
the SIX Swiss Exchange (ISIN: CH0244767585) and on the NYSE
(CUSIP: H42097107).
›
Refer to “
UBS shares
” in the “
Capital, liquidity and funding, and
balance sheet
” section on page 183 of this report for
information about UBS Group AG’s market capitalization and
shares held by Group entities
›
Refer to “Note 29 Interests in subsidiaries and other entities” in
the “
Consolidated financial statements
” section on page 391 of
this report for more information about the significant
subsidiaries of the Group
Significant shareholders
General rules
Under the Swiss Federal Act on Financial Market Infrastructures and
Market Conduct in Securities and Derivatives Trading of 19 June
2015 (the FMIA), anyone directly or indirectly, or acting in concert
with third parties, holding shares in a company listed in Switzerland
or holding derivative rights related to shares in such a company
must notify the company and the SIX Swiss Exchange (SIX) if the
holding reaches, falls below or exceeds one of the following
percentage thresholds: 3, 5, 10, 15, 20, 25, 33
1
⁄
3
, 50 or 66
2
⁄
3
% of
voting rights, regardless of whether or not such rights may be
exercised. Nominee companies that cannot autonomously decide
how voting rights are exercised are not required to notify the
company and SIX if they reach, exceed or fall below the above-
mentioned thresholds.
Pursuant to the Swiss Code of Obligations, we disclose in
“Note 2
3
Significant shareholders” to the UBS Group AG
standalone financial statements the identity of any shareholder
with a holding of more than 5% of the total share capital of UBS
Group AG.
Shareholders subject to FMIA disclosure notifications
According to the mandatory FMIA disclosure notifications filed with
UBS Group AG and SIX, as of 31 December 2021, the following
entities held more than 3% of the total share capital of
UBS Group AG: Massachusetts Financial Services Company,
Boston, which disclosed a holding of 3.01% on 22 June 2021;
Artisan Partners Limited Partnership, Milwaukee, which disclosed a
holding of 3.15% on 18 November 2020; BlackRock Inc., New
York, which disclosed a holding of 4.70% on 26 May 2020; and
Norges Bank, Oslo, which disclosed a holding of 3.01% on 24 July
2019. As registration in the UBS share register is optional,
shareholders crossing the aforementioned thresholds requiring SIX
notification under the FMIA do not necessarily appear in the table
below.
On 24 January 2022, Dodge & Cox International Stock Fund,
San Francisco, disclosed a holding of 3.02% of the total share
capital of UBS Group AG
.
No n
ew disclosures of significant
shareholdings have been made since that date.
In accordance with the FMIA, the aforementioned holdings are
calculated in relation to the total share capital of UBS Group AG
reflected in the Articles of Association at the time of the respective
disclosure notification.
Information on disclosures under the FMIA is available at
ser-ag.com/en/resources/notifications-market-
participants/significant-shareholders.html.
Shareholders registered in the UBS share register with 3% or
more of the share capital of UBS Group AG
As a supplement to the mandatory disclosure requirements
according to the SIX Swiss Exchange Corporate Governance
Directive, we disclose in the table below the
shareholders (acting
in their own name or in their capacity as nominees for other
investors or beneficial owners) that were registered in the UBS
share register with 3% or more of the total share capital of UBS
Group AG as of 31 December 2021.
›
Refer to “Shareholders’ participation rights” on page 197 of this
section for more information about voting rights, restrictions
and representation
Cross-shareholdings
UBS Group AG has no cross-shareholdings where reciprocal
ownership would be in excess of 5% of capital or voting rights
with any other company.
Audited |
Shareholders registered in the UBS share register with 3% or more of the total share capital
1
% of share capital
31.12.21
31.12.20
31.12.19
Chase Nominees Ltd., London
2
DTC (Cede & Co.), New York
2,3
Nortrust Nominees Ltd., London
2
1 As registration in the UBS share register is optional, shareholders crossing the threshold percentages requiring SIX notification under the FMIA do not necessarily appear in this table. 2 Nominee companies and
securities clearing organizations cannot autonomously decide how voting rights are exercised and are therefore not obligated to notify UBS and SIX if they reach, exceed or fall below the threshold percentages
requiring disclosure notification under the FMIA. Consequently, they do not appear in the “Shareholders subject to FMIA disclosure notifications” section above. 3 DTC (Cede & Co.), New York, “The Depository
Trust Company,” is a US securities clearing organization.
p
Corporate governance and compensation | Corporate governance
192
Share capital structure
Ordinary share capital
At year-end 2021, UBS Group AG had 3,702,422,995 issued
shares with a nominal value of CHF 0.10 each, equating to a share
capital of CHF 370,242,299.50.
Under Swiss company law, shareholders must approve, in a
general meeting of shareholders, any increase or reduction in the
ordinary share capital or the creation of conditional or authorized
share capital.
In 2021, our shareholders were asked to approve a reduction
of share capital by way of canceling 156,632,400 registered
shares repurchased under the 2018–2021 share buyback
program.
In 2021, our shareholders were not asked to approve the
creation of conditional or authorized share capital.
No shares were issued out of existing conditional capital, as
there were no employee options and stock appreciation rights
outstanding.
Distribution of UBS shares
As of 31 December 2021
Shareholders registered
Shares registered
Number of shares registered
Number
%
Number
% of shares issued
1–100
101–1,000
1,001–10,000
10,001–100,000
100,001–1,000,000
1,000,001–5,000,000
5,000,001–37,024,229 (1%)
1–2%
2–3%
3–4%
4–5%
Over 5%
1
Total registered
2
Unregistered
3
Total
1 On 31 December 2021, Chase Nominees Ltd., London, entered as a nominee, was registered with 8,89% of all UBS shares issued. However, according to the provisions of UBS Group AG, voting rights of nominees
are limited to a maximum of 5% of all UBS shares issued. The US securities clearing organization DTC (Cede & Co.), New York, was registered with 5.78% of all UBS shares issued and is not subject to this 5% voting
limit as a securities clearing organization. 2 Of the total shares registered, 295,987,073 shares did not carry voting rights. 3 Shares not entered in the UBS share register as of 31 December 2021.
193
Conditional share capital
At year-end 2021, the following conditional share capital was
available to UBS Group AG’s BoD:
–
A maximum of CHF 38,000,000 represented by up to
380,000,000 fully paid registered shares with a nominal value
of CHF 0.10 each, to be issued through the voluntary or
mandatory exercise of conversion rights and / or warrants
granted in connection with the issuance of bonds or similar
financial instruments on national or international capital
markets. This conditional capital allowance was approved at
the Extraordinary G
eneral Meeting (
the
EGM) held on
26 November 2014, having originally been approved at the
AGM of UBS AG on 14 April 2010. The BoD has not made use
of such allowance.
–
A maximum of CHF 12,170,583 represented by 121,705,830
fully paid registered shares with a nominal value of CHF 0.10
each, to be issued upon exercise of employee options and
stock appreciation rights issued to employees and members of
the management and of the BoD of UBS Group AG and its
subsidiaries. This conditional capital allowance was approved
by the shareholders at the same EGM in 2014.
›
Refer to article 4a of the Articles of Association of UBS Group AG
for more information about the terms and conditions of the
issue of shares out of existing conditional capital. The Articles of
Association are available at
›
Refer to the “Our evolution” section on page 14 of this report
for more information
Conditional capital of UBS Group AG
As of 31 December 2021
Maximum number of shares to
be issued
Year approved by Extraor-
dinary General Meeting
% of shares issued
Employee equity participation plans
2014
Conversion rights / warrants granted in connection with bonds
2014
Total
Authorized share capital
UBS Group AG had no authorized capital available to issue on
31 December
2021
.
Changes in capital
In accordance with International Financial Reporting Standards
(IFRS), Group equity attributable to shareholders was USD 60.7
billion as of 31 December 2021 (2020: USD 59.4 billion; 2019:
USD 54.5 billion). The equity of UBS Group AG shareholders was
represented by 3,702,422,995 issued shares as of 31 December
2021 (31 December 2020: 3,859,055,395 shares; 31 December
2019: 3,859,055,395 shares).
›
Refer to “Statement of changes in equity” in the “
Consolidated
financial statements
” section on page 286 of this report for more
information about changes in shareholders’ equity over the last
three years
Ownership
Ownership of UBS Group AG shares is widely spread. The tables
in this section provide information about the distribution of UBS
Group AG shareholders by category and geographic location. This
information relates only to shareholders registered in the UBS
share register and cannot be assumed to be representative of UBS
Group AG’s entire investor base or the actual beneficial
ownership. Only shareholders registered in the share register as
“shareholders with voting rights” are entitled to exercise voting
rights.
›
Refer to “Shareholders’ participation rights” in this section for
more information
As of 31
December 202
1
,
1,606,242,
231
UBS Group AG
shares were registered in the share register and carried voting
rights, 295,987,073 shares were registered in the share register
without voting rights, and
1,800,193,691
shares were
not
registered in the UBS share register. All shares were fully paid up
and eligible for dividends. There are no preferential rights for
shareholders, and no other classes of shares have been issued by
UBS Group AG.
Corporate governance and compensation | Corporate governance
194
Shareholders, legal entities and nominees: type and geographical distribution
Shareholders registered
As of 31 December 2021
Number
%
Individual shareholders
Legal entities
Nominees, fiduciaries
Total registered shares
Unregistered shares
Total
Individual shareholders
Legal entities
Nominees
Total
Number
%
Number
%
Number
%
Number
%
Americas
of which: USA
Asia Pacific
Europe, Middle East and Africa
of which: Germany
of which: UK
of which: rest of Europe
of which: Middle East and Africa
Switzerland
Total registered shares
Unregistered shares
Total
At year-end 2021, UBS owned 302,81 5,328 UBS Group AG
registered shares, which corresponded to 8.18% of the total share
capital of UBS Group AG. At the same time, UBS had acquisition
positions relating to 327,114,543 voting rights of UBS Group AG
and disposal positions
relating to
184,989,1
49
such
rights,
corresponding to 8.84% and 5.00% of the total voting rights of
UBS Group AG, respectively. Of the disposal positions,
174,354,474 related to voting rights on shares deliverable in
respect of employee awards. The calculation methodology for the
acquisition and disposal positions is based on the Ordinance of
the Swiss Financial Market Supervisory Authority on Financial
Market Infrastructures and Market Conduct in Securities and
Derivatives Trading, which states that all future potential share
delivery obligations, irrespective of the contingent nature of the
delivery, must be considered.
Employee share ownership
Employee share ownership is encouraged and made possible in a
variety of ways. Our Equity Plus Plan is a voluntary plan that
provides eligible employees with the opportunity to purchase UBS
Group AG shares at market value and receive, at no additional
cost, one notional UBS Group AG share for every three shares
purchased. The Equity Ownership Plan (the EOP) is a mandatory
deferral plan for all employees with regulatory-driven deferral
requirements or
total compensation greater than USD
/
CHF 300,000, excluding selected senior leaders. EOP recipients
receive a portion of their deferred performance award in notional
shares (and / or notional funds for Asset Management). Selected
senior leaders receive the equity-based Long-Term Incentive Plan
(the LTIP) instead of the EOP. Both the EOP and LTIP include
provisions that allow the firm to reduce or fully forfeit the
unvested deferred portion of an award if an employee commits
certain harmful acts, and in most cases trigger forfeiture where
employment has been terminated. To reinforce our emphasis on
sustainable performance and risk management, and our focus on
achieving growth ambitions, EOP and LTIP awards granted to
certain employees will only vest if predetermined performance
conditions are met.
On 31 December 2021, UBS employees held at least 7% of
UBS shares outstanding (including approximately 5% in unvested
notional shares from our compensation programs). These figures
are based on known shareholding information from employee
participation plans, personal holdings with UBS and selected
individual retirement plans. At the end of 2021, at least 30% of
all employees held UBS shares through the firm’s employee share
participation plans.
›
Refer to the “Compensation” section on page 228 of this report
for more information
Trading restrictions in UBS shares
UBS employees with regular access to unpublished price-sensitive
information about the firm are subject to specific restrictions in
respect to UBS financial instruments, including, but not limited to,
pre-clearance requirements and regular blackout periods. Such
UBS employees are not permitted to trade UBS financial
instruments in the period starting from the close of business in
New York on the seventh business day of the final month of the
financial quarter of UBS Group AG and ending on the day of the
publication of the quarterly financial results.
Shares and participation certificates
UBS Group AG has a single class of shares, which are registered
shares in the form of uncertificated securities (in the sense of the
Swiss Code of Obligations) and intermediary-held securities (in the
sense of the Swiss Federal Act on Intermediated Securities). Each
registered share has a nominal value of CHF 0.10 and carries one
vote, subject to the restrictions set out under “Transferability,
voting rights and nominee registration” below.
We have no participation certificates outstanding.
195
Shares registered
Number
%
Individual shareholders
Legal entities
Nominees
Total
Number of shares
%
Number of shares
%
Number of shares
%
Number of shares
%
Our shares are listed on the NYSE as global registered shares.
As such, they can be traded and transferred across applicable
borders, without the need for conversion, with identical shares
traded on different stock exchanges in different currencies.
›
Refer to “
UBS shares
” in the “
Capital, liquidity and funding, and
balance sheet
” section on page 183 of this report for more
information
Distributions to shareholders
The decision to pay a dividend and the amount of any dividend
depend on a variety of factors, including our profits, cash flow
generation and capital ratios.
At the 2022 AGM, the BoD intends to propose to shareholders
for approval a dividend of USD 0.50 per share for the 2021
financial year. Shareholders whose shares are held through SIX SIS
AG will receive dividends in Swiss francs, based on a public
exchange rate on the day prior to the ex-dividend date.
Shareholders holding shares through The Depository Trust
Company in New York and Computershare will be paid dividends
in US dollars.
In compliance with Swiss tax law, 50% of the dividend will be
paid out of retained earnings and the balance will be paid out of
the capital contribution reserve. Dividends paid out of capital
contribution reserves are not subject to Swiss withholding tax. The
portion of the dividend paid out of retained earnings will be
subject to a 35% Swiss withholding tax. For US federal income
tax purposes, we expect that the dividend will be paid out of
current or accumulated earnings and profits.
Provided that the proposed dividend distribution out of
retained earnings and out of the capital contribution reserve will
be approved at the AGM on 6 April 2022, the payment of
USD 0.50 per share will be made on 14 April 2022 to holders of
shares on the record date 13 April 2022. The shares will be traded
ex-dividend as of 12 April 2022 and, accordingly, the last day on
which the shares may be traded with entitlement to receive the
dividend will be 11 April 2022.
In February 2021, the BoD launched a new three-year share
buyback program. At the 2021 AGM, the shareholders authorized
the BoD to buy back shares for cancellation purposes in an
aggregate value of up to CHF 4 billion until the 2024 AGM. Any
shares bought back under the
program
are intended to be
canceled by way of capital reduction, which will be subject to
shareholder approval at one or several subsequent AGMs, and the
acquisition and holding of such shares are not subject to the 10%
threshold for UBS Group AG’s own shares within the meaning of
Art. 659 para. 1 of the Swiss Code of Obligations. Since the start
of this 2021 share repurchase program in February 2021 until
18 February 2022, we have bought back CHF 2.78 billion of
shares. These shares are expected to be canceled by means of a
capital reduction, to be proposed for shareholder approval at the
2022 AGM.
Looking ahead, we intend to commence a new 2022 share
buyback program of up to USD 6 billion over two years and
expect to execute up to USD 5 billion of share repurchases under
both the existing 2021 and the new 2022 share buyback program
by the end of 2022.
›
Refer to “
UBS shares
” in the “
Capital, liquidity and funding, and
balance sheet
” section on page 183 of this report for more
information about the share repurchase programs
Corporate governance and compensation | Corporate governance
196
Transferability, voting rights and nominee registration
We do not apply any restrictions or limitations on the
transferability of shares. Voting rights may be exercised without
any restrictions by shareholders entered into the share register if
they expressly render a declaration of beneficial ownership
according to the provisions of the Articles of Association.
We have special provisions for the registration of nominees.
Nominees are entered in the share register with voting rights up
to a total of 5% of all issued UBS Group AG shares if they agree
to disclose, upon our request, beneficial owners holding 0.3% or
more of all issued UBS Group AG shares. An exception to the 5%
voting limit rule is in place for securities clearing organizations,
such as The Depository Trust Company in New York.
›
Refer to “Shareholders’ participation rights” in this section for
more information
Convertible bonds and options
As of 31
December
2021
,
there were no contingent capital
securities or convertible bonds outstanding requiring the issuance
of new shares.
›
Refer to the “
Capital, liquidity and funding, and balance sheet
”
section on page 150 of this report for more information about
our outstanding capital instruments
As of 31 December 2021, there were no employee options and
stock appreciation rights outstanding.
Option
-
based
compensation plans are sourced by issuing new shares out of
conditional capital. As of 31
December
2021
, 121,705,830
unissued UBS Group AG shares in conditional share capital were
available for the issuance of new shares for this purpose.
›
Refer to “Conditional share capital” in this section for more
information
›
Refer to “Note 28
” in
the “
Consolidated financial statements
” section on page 387 of
this report for more information about outstanding options and
stock appreciation rights
197
Shareholders’ participation rights
We are committed to shareholder participation in decision-
making processes. Our online voting platform offers registered
shareholders a convenient log-in and online voting process.
Registered shareholders are sent personal invitations to the
general meetings. Together with the invitation materials, they
receive a personal one-time password and a QR code to easily log
in to the online voting platform, where they can enter their voting
instructions or order an admission card for the general meeting.
Shareholders who choose not to receive the comprehensive
invitation materials are informed of upcoming general meetings
by a short letter containing a personal one-time password, a QR
code for online voting and a reference to
ubs.com/agm
,
where all
information for the upcoming meeting is available.
General meetings offer shareholders the opportunity to raise
questions for the BoD, GEB and internal and external auditors.
Also, prior to our
virtual general meetings, we offer all
shareholders the opportunity to contact us with questions, which
are answered in writing or during the general meeting.
Voting rights, restrictions and representation
We place no restrictions on share ownership and voting rights.
However, pursuant to general principles formulated by the BoD,
nominee companies, which normally represent a large number of
individual shareholders and may hold an unlimited number of
shares, have voting rights limited to a maximum of 5% of all
issued UBS Group AG shares. This is to avoid large shareholders
being entered in UBS’s share register via nominee companies so
as to exercise influence without directly registering their shares
with UBS. Securities clearing organizations, such as The
Depository Trust Company in New York, are not subject to this
5% voting limit.
Shareholders can exercise voting rights conferred by shares
only if they are registered in our share register with voting rights.
To register, shareholders must confirm that they have acquired
UBS Group AG shares in their own name and for their own
account. Nominee companies are required to sign an agreement
confirming their willingness to disclose, upon our request,
individual beneficial owners holding more than 0.3% of all issued
UBS Group AG shares.
All shareholders registered with voting rights are entitled to
participate in general meetings. If they do not wish to attend in
person, they may issue instructions to support, reject or abstain
for each individual item on the meeting agenda, either by giving
instructions to an independent proxy in accordance with article
14 of the Articles of Association (the AoA) or by appointing
another registered shareholder of their choice to vote on their
behalf. Alternatively, registered shareholders may issue their
voting instructions to the independent proxy electronically
through our online voting platform. Nominee companies normally
submit the proxy material to the beneficial owners and forward
the collected votes to the independent proxy.
In 2021, physical attendance at the AGM was not possible, due
to COVID-19-related restrictions in Switzerland, and voting rights
could only be exercised through the independent proxy. Due to
the ongoing pandemic, the BoD has decided to also hold the 2022
AGM without the physical participation of shareholders.
›
Refer to article 14 of the Articles of Association of UBS Group
AG, available at
ubs.com/governance
, for more information
about the issuing of instructions to independent voting right
representatives
Statutory quorums
Motions are decided at a general meeting by an absolute majority
of the votes cast, excluding blank and invalid ballots. For the
approval of certain specific issues, the Swiss Code of Obligations
requires a positive vote from a two-thirds majority of the votes
represented at the given general meeting, and from an absolute
majority of the nominal value of shares represented thereat. Such
issues include creating shares with privileged voting rights,
introducing restrictions on the transferability of registered shares,
conditional and authorized capital increases and restricting or
excluding shareholders’ preemptive rights.
The AoA also require a two-thirds majority of votes represented
for approval of any change to their provisions regarding the
number of BoD members, any decision to remove one-quarter or
more of the BoD members and any modification to the provision
establishing this qualified quorum.
Votes and elections are generally conducted electronically to
ascertain the exact number of votes cast. Voting by a show of
hands is possible if a clear majority is predictable. Shareholders
representing at least 3% of the votes represented may request
that a vote or election be carried out electronically or by written
ballot. To allow shareholders to clearly express their views on all
individual topics, each agenda item is separately put to a vote and
BoD members are elected on a person-by-person basis.
Corporate governance and compensation | Corporate governance
198
Convocation of general meetings of shareholders
The AGM must be held within six months of the close of the
financial year (i.e., 31 December). In 2022, the AGM will take
place on 6 April.
Extraordinary General Meetings (EGMs) may be convened
whenever the BoD or the auditors consider it necessary.
Shareholders individually or jointly representing at least 10% of
the share capital may at any time, including during an AGM,
require, by way of a written statement, that an EGM be convened
to address a specific issue they put forward.
A personal invitation, including a detailed agenda, is made
available to every registered shareholder at least 20 days ahead of
each scheduled general meeting. The items on the agenda are
also published in the Swiss Official Gazette of Commerce, as well
as at
ubs.com/agm.
Placing of items on the agenda
Pursuant to our AoA, shareholders individually or jointly
representing shares with an aggregate minimum nominal value of
CHF 62,500 may submit proposals for matters to be placed on the
agenda for consideration at the next general meeting of
shareholders.
At the beginning of January, the invitation to submit such
proposals is published in the Swiss Official Gazette of Commerce
and at
ubs.com/agm.
agenda must include the actual motions to be put forward,
together with a short explanation. Such requests must be
submitted to the BoD 50 days prior to the general meeting of
shareholders, including a statement from the depository bank
confirming the number of shares held by the requesting
shareholder(s) and that these shares are blocked from sale until
the end of the general meeting of shareholders. The BoD
formulates opinions on the proposals, which are published
together with the motions.
Registrations in the share register
The share register of UBS Group AG, where around 190,000
shareholders are directly registered, is an internal, non-public
register subject to statutory confidentiality, secrecy, privacy and
data protection regulations protecting registered shareholders. In
general, third parties and shareholders have no inspection rights
with regard to data related to other shareholders. Disclosure of
such data is permitted only in specific and limited instances. In line
with the Swiss Federal Act on Data Protection, the disclosure of
personal data as defined thereunder is only allowed with the
consent of the registered shareholder and in cases where there is
an overriding private or public interest or if explicitly provided for
by Swiss law. The Swiss Federal Act on Financial Market
Infrastructures and Market Conduct in Securities and Derivatives
Trading contains specific reporting duties, such as in relation to
significant shareholders (refer to “Significant shareholders” in this
section for more information). Disclosure may also be required or
requested by a court of a competent jurisdiction, by any
regulatory body that regulates the conduct of UBS Group AG or
by other statutory provisions.
The general rules for entry into our Swiss share register with
voting rights are described in article 5 of our AoA. The same rules
apply to our US transfer agent that operates the US share register
for all UBS Group AG shares in a custodian account in the US,
where some 230,000 US shareholders are indirectly registered via
nominee companies. In order to determine the voting rights of
each shareholder, our share register generally closes two business
days prior to a general meeting. Our independent proxy agent
processes voting instructions from shareholders as long as
technically possible, generally also until two business days before
a general meeting. Such technical closure of our share register
facilitates the determination of the actual voting rights of every
shareholder that issued a voting instruction. Irrespective of this
technical closure, shares that are registered in our share register
are never immobilized and are freely tradable at any time,
irrespective of any issued voting instructions.
›
Refer to article 5 of the Articles of Association of UBS Group AG,
available at
ubs.com/governance
, for more information about
the general rules for entry into our Swiss share register
199
Board of Directors
The BoD of UBS Group AG, led by the Chairman, consists of
between 6 and 12 members, as per our AoA.
The BoD decides on the strategy of the Group, upon
recommendation by the Group Chief Executive Officer (the Group
CEO), and is responsible for the overall direction, supervision and
control of the Group and its management. It is also responsible
for supervising compliance with applicable laws, rules and
regulations. The BoD exercises oversight over UBS Group AG and
its subsidiaries, and is responsible for establishing a clear Group
governance framework to provide effective steering and
supervision of the Group, taking into account the material risks to
which UBS Group AG and its subsidiaries are exposed. The BoD
has ultimate responsibility for the success of the Group and for
delivering sustainable shareholder value within a framework of
prudent and effective controls. It approves all financial statements
and appoints and removes all GEB members.
The BoD of UBS AG, led by the decides on the
��
Chairman,strategy of UBS AG upon recommendation by the President of its
Executive Board and exercises the ultimate supervision of
management. Its ultimate responsibility for the success of UBS AG
is exercised subject to the parameters set by the Group.
Members of the Board of Directors
At the AGM on 8 April 2021, Jeremy Anderson, William C.
Dudley, Reto Francioni, Fred Hu, Mark Hughes, Nathalie Rachou,
Julie G. Richardson, Dieter Wemmer and Jeanette Wong were re-
elected as members of the BoD. Beatrice Weder di Mauro did not
stand for re-election; the biography of Ms. Weder di Mauro can
be found on page 190 of the UBS Group AG Annual Report 2020,
available under “Annual reporting” at
ubs.com/investors
. Claudia
Böckstiegel and Patrick Firmenich were elected for their first
terms. At that same AGM, Axel A. Weber was re-elected
Chairman, and Julie
G.
Richardson, Reto Francioni, Dieter
Wemmer and Jeanette Wong were elected as members of the
Compensation Committee. ADB Altorfer Duss & Beilstein AG was
elected as independent proxy agent. Following his re-election, the
BoD appointed Jeremy Anderson as Vice Chairman and Senior
Independent Director of UBS Group AG.
On 20 November 2021, the BoD announced that Colm
Kelleher would be nominated for election to the BoD of UBS
Group AG and UBS AG to succeed Axel A. Weber as Chairman at
the forthcoming AGMs. Mr. Kelleher was the President of Morgan
Stanley & Company, and responsible for Institutional Securities
and Wealth Management from 2016 to 2019. In his 30-year
career with Morgan Stanley, he held various senior management
positions, including Chief Financial Officer during the financial
crisis in 2008. In addition, the BoD announced that Lukas
Gähwiler would be nominated for election to the BoD of UBS
Group AG and UBS AG as Vice Chairman at the forthcoming
AGMs. Having joined UBS in 2010 as a member of the GEB of
UBS AG and President UBS Switzerland, Mr. Gähwiler stepped
down from those roles in 2016 and has been Chairman of the
board of directors of UBS Switzerland AG since 2017. He will step
down from the board of directors of UBS Switzerland AG as of 5
April 2022.
Article 31 of our AoA limits the number of mandates that
members of the BoD may hold outside UBS Group to four
mandates in listed companies and five additional mandates in
non-listed companies. Mandates in companies that are controlled
by us or that control us are not subject to this limitation. In
addition, members of the BoD may hold no more than 10
mandates at UBS’s request and 10 mandates in associations,
charitable organizations, foundations, trusts, and employee
welfare foundations. As of 31 December 2021, no member of the
BoD reached the thresholds described in article 31 of our AoA.
The following biographies provide information about the BoD
members who were in office in 2021 and the Group Company
Secretary. In addition to information on mandates, the
biographies include information on memberships or other
activities or functions, as required by the SIX Swiss Exchange
Corporate Governance Directive.
No member of the BoD currently carries out or has carried out
over the past three years operational management tasks within
the Group; therefore, all members of the Board are non-executive
members.
All members of UBS Group AG’s BoD are also members of UBS
AG’s BoD, and committee membership is the same for both
entities. The Senior Independent Director function relates only to
UBS Group AG.
In 2021, UBS AG’s BoD had three permanent committees: the
Audit Committee, the Compensation Committee and the Risk
Committee. In addition to those permanent committees, UBS
Group AG also had the Corporate Culture and Responsibility
Committee and the Governance and Nominating Committee.

Corporate governance and compensation | Corporate governance
200
Axel A. Weber
Chairman of the Board of Directors and non-executive member of
the Board since 2012
–
Chairperson of the Corporate Culture and Responsibility Committee
since 2013
–
Chairperson of the Governance and Nominating Committee
since 2012
Nationality:
Year of birth:
Axel A. Weber was elected Chairman of UBS in 2012. He gained
international recognition as the President of the Deutsche Bundesbank.
During his six-year tenure there, he also served as a member of the
Governing Council of the European Central Bank, a member of the Board
of Directors of the Bank for International Settlements, German governor
of the International Monetary Fund and a member of the G7 and G20
Ministers and Governors. As an expert in international and monetary
economics, Mr. Weber strove to strengthen the Bundesbank’s importance
in the group of the 17 European central banks and led the Bundesbank
through the events of the global real estate and financial crisis. Before the
Deutsche Bundesbank, he had a career as a renowned expert in monetary
and currency theories through his academic posts at several German
universities.
Professional experience
2011 – 2012
Visiting professor, University of Chicago Booth School of
Business, USA (on leave, University of Cologne, Germany)
2011
Member of the Steering Committee, the European
Systemic Risk Board
2010 – 2011
Member of the Steering Committee, the Financial
Stability Board
2004 – 2011
President, Deutsche Bundesbank
2002 – 2004
Member, German Council of Economic Experts
2001 – 2004
Professor of International Economics and Director of the
Centre for Financial Research, University of Cologne
1998 – 2001
Professor for Applied Monetary Economics and Director
of the Center for Financial Studies, Goethe University
Frankfurt am Main
1994 – 1998
Professor of Economic Theory, University of Bonn
Education
–
Master’s degree, economics, University of Constance
–
Doctorate (Dr. rer. pol.) and habilitation, economics,
University of Siegen, Germany
Other activities and functions
–
Vice Chairman of the Swiss Bankers Association
–
Member of the Board of Trustees of Avenir Suisse
–
Member of the Board of the Swiss Finance Council
–
Chairman of the Board of the Institute of International Finance
–
Member of the European Financial Services Round Table
–
Member of the European Banking Group
–
Member of the International Advisory Councils of the China Banking
and Insurance Regulatory Commission and the China Securities
Regulatory Commission
–
Member of the International Advisory Panel, Monetary Authority
of Singapore
–
Member of the Group of Thirty, Washington, DC
–
Member of the Advisory Board of the Department of Economics,
University of Zurich
–
European Chairman of the Trilateral Commission
Key competencies
–
Finance, audit, accounting
–
Risk management, compliance and legal
–
Regulatory authority, central bank
–
ESG (environmental, social and governance)
Leadership experience
–
CEO, Chairman


201
Jeremy Anderson
Vice Chairman and Senior Independent Director since 2020 and
non-executive member of the Board since 2018
–
Member of the Governance and Nominating Committee since 2019
–
Chairperson of the Audit Committee since 2018
Nationality:
Year of birth:
Jeremy Anderson is a financial services veteran, with more than 30 years’
experience working in the banking and insurance sector in an advisory
capacity, covering a broad range of topics, including strategy, audit and
risk management, technology-enabled transformation, mergers, and bank
restructuring. Before retiring from KPMG in 2017, he was its Chairman of
Global Financial Services. Mr. Anderson is also an IT expert, having started
out as a software developer in the early 1980s, before working in IT
consulting and developing a broad knowledge of systems integration and
IT outsourcing services, as well as software development. He cemented his
reputation as a tech specialist by becoming a founding sponsor of KPMG’s
Global Fintech Network in 2014.
Professional experience
2010 – 2017
Chairman of Global Financial Services,
KPMG International
2008
–
2011
Head of Clients and Markets KPMG Europe,
KPMG International
2006 – 2011
Head of Financial Services KPMG Europe,
KPMG International
2004 – 2006
Head of Financial Services KPMG UK,
KPMG International
2002 – 2004
Member of the Group Management Board and
Head of UK operations, Atos Origin SA
1985 – 2002
KPMG consulting UK, KPMG
1980 – 1985
Software developer, Triad Computing Systems
Education
–
Bachelor’s degree, economics, University College London
Listed company boards
–
Member of the Board of Prudential plc
Other activities and functions
–
Trustee of the UK’s Productivity Leadership Group
–
Trustee of Kingham Hill Trust
–
Trustee of St. Helen’s Bishopsgate
Key competencies
–
Banking (wealth management, asset management,
personal and corporate banking) and insurance
–
Finance, audit, accounting
–
Risk management, compliance and legal
–
Technology, cybersecurity
Leadership experience
–
Executive board leadership
Claudia Böckstiegel
Non-executive member of the Board since 2021
Nationality:
Year of birth:
Claudia Böckstiegel has been General Counsel and a member of the
Enlarged Executive Committee of Roche Holding AG since 2020. She
started her professional career as an attorney in private practice in
Germany, then joined the Swiss pharmaceutical company in Germany in
2001 and subsequently held various global management positions in the
legal sector in Switzerland. Ms. Böckstiegel brings a wealth of know-how
in a highly regulated sector. Her responsibilities at Roche Holding AG
include a broad range of additional topics, such as safety, health &
environment, patents, audit and risk advisory, compliance and
sustainability.
Professional experience
2020 – date
General Counsel and member of the Enlarged Executive
Committee, Roche Holding AG
2016 – 2020
Head of Legal Diagnostics, F. Hoffmann-La Roche Ltd.,
Basel, Switzerland, Roche Group
2010 – 2016
Head Legal Business, Roche Diagnostics International Ltd,
Rotkreuz, Switzerland, Roche Group
2005 – 2010
Head Legal Business, Roche Diagnostics GmbH,
Mannheim, Germany, Roche Group
2001 – 2005
Legal Counsel, Roche Diagnostics GmbH,
Mannheim, Germany, Roche Group
1995 – 2001
Attorney (Partner), Philipp & Littig, Mannheim, Germany
1992 – 1995
Attorney (Associate), Dr. Hermann Büttner,
Karlsruhe, Germany
Education
–
Master’s degree, law, Universities of Mannheim and Heidelberg
–
Master of Laws (LL.M.), Georgetown University, Washington, DC
Key competencies
–
Risk management, compliance and legal
–
Finance, audit, accounting
–
ESG (environmental, social and governance)
–
Regulatory authority, central bank
Leadership experience
–
Executive board leadership
Other activities and functions
None


Corporate governance and compensation | Corporate governance
202
William C. Dudley
Non-executive member of the Board since 2019
–
Member of the Governance and Nominating Committee since 2020
–
Member of the Corporate Culture and Responsibility Committee
since 2019
–
Member of the Risk Committee since 2019
Nationality:
Year of birth:
William C. Dudley served as the President and CEO of the Federal Reserve
Bank of New York for nine years. He demonstrated exceptional leadership
in monetary policy and as a top regulator, including during the years of
the global financial crisis. During that period, his additional area of focus
included cultural behavior and social and governance
topics in the
financial services industry. He also served as the Vice Chairman and a
permanent member of the Federal Open Market Committee. Mr. Dudley
brings a wealth of experience in banking and research thanks to his former
management positions at Goldman Sachs Group and Morgan Guaranty
Trust.
Professional experience
2009 – 2018
President and CEO, Federal Reserve Bank of New York,
USA
2007 – 2009
Executive Vice President and Head Markets Group,
Federal Reserve Bank of New York, USA
2006
Senior advisor (part-time), Goldman Sachs Group, USA
2002 – 2005
Partner and Director US Economic Research Group,
Goldman Sachs Group, USA
1996 – 2002
Managing Director and Director US Economic Research
Group, Goldman Sachs Group, USA
1983 – 1996
Economist at Goldman Sachs Group, Morgan Guaranty
Trust Company, and Board of Governors of the Federal
Reserve System
Education
–
Bachelor of Arts, New College of Florida
–
Doctorate, economics, University of California, Berkeley
Non-listed company boards
–
Member of the Board of Treliant LLC
Other activities and functions
–
Senior Advisor to the Griswold Center for Economic Policy Studies,
Princeton University
–
Member of the Group of Thirty
–
Member of the Council on Foreign Relations
–
Chair of the Bretton Woods Committee Board of Directors
–
Member of the Board of the Council for Economic Education
Key competencies
–
Investment banking, capital markets
–
Risk management, compliance and legal
–
Regulatory authority, central bank
–
ESG (environmental, social and governance)
Leadership experience
–
CEO, Chairman
Patrick Firmenich
Non-executive member of the Board since 2021
–
Member of the Audit Committee since 2021
–
Member of the Corporate Culture and Responsibility Committee
since 2021
Nationality:
Year of birth:
Patrick Firmenich has been Chairman of the Board of Firmenich
International SA, the world’s largest privately owned fragrances and
flavorings company, since 2016, after leading the company as CEO during
a 12-year tenure. He demonstrated his entrepreneurial leadership by
significantly advancing the Firmenich group’s global position through
organic and in-organic growth and successfully continuously transformed
the organization to respond to client needs and the market environment.
He developed an ambitious sustainability strategy for the group to lead
the industry in health, safety and environmental performance. Before
joining Firmenich, he held several positions in the legal and banking
sectors, including working as an international investment banking analyst.
Professional experience
2014 – 2016
Vice Chairman of the Board, Firmenich International SA
2002 – 2014
CEO, Firmenich SA, Geneva
2001 – 2002
Corporate Vice President, Special Operations,
Firmenich SA, Geneva
1997 – 2001
Vice President Fine Fragrance worldwide and Président
Directeur Général, Firmenich & Cie, Paris and
Firmenich Inc, New York
1993
–
1997
Vice President Fine Fragrance North America,
Firmenich Inc, New York
1990 – 1993
Account Manager, Firmenich & Cie, Paris
1988 – 1989
Analyst, International Investment Banking, Credit Suisse
First Boston
1988
Production administrator, Firmenich SA de CV, Mexico
1984 – 1986
Attorney, Business Law, Patry, Junet, Simon & Le Fort,
Geneva
Education
–
Master’s degree, law, University of Geneva, admitted to the bar
in Geneva
–
MBA, INSEAD Fontainebleau
Non-listed company boards
–
Member of the Board of Jacobs Holding AG
Other activities and functions
–
Member of the Board of INSEAD and INSEAD World Foundation
–
Member of the Advisory Council of the Swiss Board Institute
Key competencies
–
Risk management, compliance and legal
–
Finance, audit, accounting
–
ESG (environmental, social and governance)
–
Banking (wealth management, asset management, personal and
corporate banking) and insurance
Leadership experience
–
CEO, Chairman


203
Reto Francioni
Non-executive member of the Board since 2013
–
Member of the Compensation Committee since 2019
–
Member of the Risk Committee since 2015
Nationality:
Year of birth:
Reto Francioni, as the former CEO of Deutsche Börse, can draw on many
years of experience in the financial world. Prior to his role at Deutsche
Börse, he was Chairman of the Supervisory Board and President of the
SWX Group, Zurich, placing him at the heart of digitalization within the
financial sector. In both positions, he drove a fundamental transformation
to reshape the firms as world leaders in technology. Mr. Francioni has
been a professor of applied capital markets theory at the University of
Basel since 2006 and is the author of several highly respected books on
capital markets issues. He has also served as an independent director on
the boards of various major corporations.
Professional experience
2005 – 2015
CEO, Deutsche Börse AG
2002 – 2005
Chairman of the Supervisory Board and President,
SWX Group, Zurich
2000 – 2002
Co-CEO and Spokesman for the Board of Directors,
Consors AG, Nuremberg
1999 – 2000
Deputy CEO, Deutsche Börse AG, Frankfurt am Main
1993 – 2000
Member of the Executive Board, Deutsche Börse AG,
Frankfurt am Main
1992 – 1993
Director, Corporate Finance, Hoffmann-La Roche, Basel
1989 – 1992
Deputy Director and deputy CEO, Association Tripartite
Bourses, Zurich
1985 – 1988
Equity sales and legal, Credit Suisse, New York and Zurich
1981 – 1984
Union Bank of Switzerland
Education
–
Master’s degree and doctorate, law, University of Zurich
Listed company boards
–
Member of the Board of Coca-Cola HBC AG (Senior Independent
Non-Executive Director, chair of the nomination committee)
Non-listed company boards
–
Chairman of the Board of Swiss International Air Lines AG
–
Vice Chairman of the Board of MTIP AG
Other activities and functions
–
Member of the Board of economiesuisse
Key competencies
–
Investment banking, capital markets
–
Risk management, compliance and legal
–
Human resources management, including compensation
–
Technology, cybersecurity
Leadership experience
–
CEO, Chairman
Fred Hu
Non-executive member of the Board since 2018
–
Member of the Governance and Nominating Committee since 2020
–
Member of the Risk Committee since 2020
Nationality:
Year of birth:
Fred Hu has been the Chairman and CEO of Primavera Capital Group , an
Asia-based private investment firm focused on emerging technology and
innovative industries, since founding it in 2010. Prior to that, he was a
partner and Chairman for Greater China at Goldman Sachs, building the
firm’s Asia Pacific franchise. Mr. Hu has a profound understanding of
Chin
a’s
economy and rapidly developing financial system,
and
vast
amount of experience advising and investing in leading firms in the tech,
consumer and health care sectors in China and globally. He has worked
at the IMF and advised the Chinese government on economic policy.
Professional experience
2010
–
date
Founder, Chairman & CEO,
Primavera Capital Group, China
2008 – 2010
Partner and Chairman of Greater China, Goldman Sachs
2004 – 2008
Partner and Co-Head, Investment Banking, China,
Goldman Sachs
2003 – 2004
Managing Director and Co-Head, Investment Banking,
China, Goldman Sachs
1997 – 2003
Executive Director, then Managing Director and Chief
Economist and Strategist, Greater China, Goldman Sachs
1996 – date
Co-Director, the National Center for Economic Research
1996 – date
Adjunct Professor, Economics, Tsinghua University
Education
–
Master’s degree, engineering science, Tsinghua University
–
Master’s degree and doctorate, economics, Harvard University
Listed company boards
–
Non-executive Chairman of the Board of Yum China Holdings
(chair of the nomination and governance committee)
–
Member of the Board of ICBC
Non-listed company boards
–
Chairman of Primavera Capital Ltd
–
Member of the Board of Ant Group
–
Member of the Board of Minsheng Financial Leasing Co.
Other activities and functions
–
Trustee of the China Medical Board
–
Governor of the Chinese International School in Hong Kong SAR
–
Co-Chairman of the Nature Conservancy Asia Pacific Council
–
Member of the Board of Trustees, the Institute for Advanced Study
–
Director and member of the Executive Committee of China Venture
Capital and Private Equity Association Ltd.
Key competencies
–
Investment banking, capital markets
–
Risk management, compliance and legal
–
Technology, cybersecurity
–
Regulatory authority, central bank
Leadership experience
–
CEO, Chairman


Corporate governance and compensation | Corporate governance
204
Mark Hughes
Non-executive member of the Board since 2020
–
Chairperson of the Risk Committee since 2020
–
Member of the Corporate Culture and Responsibility Committee
since 2020
Nationality:
Year of birth:
Mark Hughes is a veteran in the financial services sector, having spent
more than 35 years working for the Royal Bank of Canada (RBC) in
Canada, in the US and the UK. In his final role as Group Chief Risk Officer
of RBC, he was responsible for the strategic management of risk on an
enterprise-wide basis and oversaw all risk functions. During his career, Mr.
Hughes has also held senior management positions in the front office and
key operational roles. Currently, he is a visiting lecturer at Leeds University
and is chair of the Global Risk Institute, bringing an enormous amount of
experience as a risk specialist to the Board of Directors of UBS.
Professional experience
2014 – 2018
Group Chief Risk Officer and member Group Executive
Committee, Royal Bank of Canada
2013
Deputy Chief Risk Officer, Royal Bank of Canada
2008 – 2013
Chief Operating Officer, RBC Capital Markets, Royal Bank
of Canada
2001 – 2008
Head of Global Credit, Royal Bank of Canada
1999 – 2001
Head of Debt Products, Royal Bank of Canada
1998 – 1999
Senior Vice President and General Manager USA,
Royal Bank of Canada
1997 – 1998
Senior Vice President Financial Services, Royal Bank
of Canada
1982 – 1996
Various positions, Royal Bank of Canada
Education
–
Bachelor of Laws (LL.B.), University of Leeds
–
MBA, finance, University of Manchester
Other activities and functions
–
Chair of the Board of Directors of the Global Risk Institute
–
Visiting lecturer at the University of Leeds
–
Senior advisor to McKinsey & Company
Key competencies
–
Banking (wealth management, asset management,
personal and corporate banking) and insurance
–
Investment banking, capital markets
–
Risk management, compliance and legal
–
Technology, cybersecurity
Leadership experience
–
Executive board leadership
Nathalie Rachou
Non-executive member of the Board since 2020
–
Member of the Risk Committee since 2020
Nationality:
Year of birth:
Nathalie Rachou is a seasoned expert in financial services, having held a
number of banking positions, such as CEO of Prime Brokerage and Head
of a business line in Capital Markets at Crédit Agricole Indosuez in the UK
and in France. In 1999, she founded a London-based asset management
company that merged with a French asset manager and continued as a
senior adviser until 2020. Alongside these roles, Ms. Rachou brings
extensive experience from serving as a board member of Société Générale
for 12 years and is currently on the boards of two other listed companies,
including the pan-European bourse, Euronext N.V.
Professional experience
2015
–
2020
Senior Advisor, Clartan Associés
(formerly Rouvier Associés), France
1999
–
2014
Founding partner and CEO,
Topiary Finance Ltd., UK
1996
–
1999
Head of Global Foreign Exchange and Currency Options,
Crédit Agricole Indosuez (formerly Banque Indosuez), UK
1991 – 1996
Corporate Secretary and Secretary to the
Board of Directors, Crédit Agricole Indosuez, France
1986 – 1991
COO, Carr Futures, France (owned by Banque Indosuez),
Crédit Agricole Indosuez, France
1983 – 1986
Head of Asset and Liability Management & Market Risks,
Crédit Agricole Indosuez, France
1978 – 1982
Position in Forex Exchange Sales, Crédit Agricole Indosuez,
France and UK
Education
–
Master’s degree, management, HEC Paris
–
MBA, INSEAD Fontainebleau
Listed company boards
–
Member of the Board of Euronext N.V.
(chair of the remuneration committee)
–
Member of the Board of Veolia Environnement SA
(chair of the audit committee)
Other activities and functions
–
Member of the Board of the African Financial Institutions Investment
Platform
Key competencies
–
Banking (wealth management, asset management,
personal and corporate banking) and insurance
–
Investment banking, capital markets
–
Risk management, compliance and legal
–
Finance, audit, accounting


205
Julie G. Richardson
Non-executive member of the Board since 2017
–
Chairperson of the Compensation Committee since 2019
–
Member of the Governance and Nominating Committee since 2019
–
Member of the Risk Committee since 2017
Nationality:
Year of birth:
Julie G. Richardson spent more than 25 years on Wall Street as a senior
investment banker with a focus on telecom, media and technology. She
began her career at Merrill Lynch, before moving to JPMorgan, where she
headed the telecommunications, media and technology investment
banking group. Later, she moved into private equity, as head of the New
York office of Providence Equity Partners. Throughout her career,
Ms. Richardson has spent significant time with both incumbent and new
technology companies, including being a board member of a digital
knowledge management company and a leading cloud monitoring firm.
Professional experience
2012 – 2014
Senior advisor, Providence Equity Partners, New York
2003
–
2012
Partner and Head of the New York office,
Providence Equity Partners, New York
1998
–
2003
Vice Chairman of the Investment Banking division of
JPMorgan Chase & Co. and Head of its Global
Telecommunications, Media and Technology group
1986 – 1998
Various position at Merrill Lynch, final position:
Managing Director Media and Communications
Investment Banking
Education
–
Bachelor’s degree, business administration, University of
Wisconsin–Madison
Listed company boards
–
Member of the Board of Yext (chair of the audit committee)
–
Member of the Board of Datadog (chair of the audit committee)
Key competencies
–
Investment banking, capital markets
–
Risk management, compliance and legal
–
Human resources management, including compensation
–
Technology, cybersecurity
Dieter Wemmer
Non-executive member of the Board since 2016
–
Member of the Governance and Nominating Committee since 2020
–
Member of the Audit Committee since 2019
–
Member of the Compensation Committee since 2018
Nationality:
Year of birth:
Dieter Wemmer began his esteemed career in the insurance sector with the
Zurich Group in 1986, retiring in 2017 as CFO of Allianz. As a long-serving
CFO of two large multi-national companies in the financial services sector, he
brings deep experience across a broad range of highly relevant topics to the
table. Mr. Wemmer brings to the BoD knowledge covering accounting,
finance and audit, including capital markets, investments, risk management,
as well as asset management. His know-how includes hands-on experience in
M&A and management of large organizations with a dedication to strategy.
Professional experience
2013 – 2017
CFO, Allianz SE
2012
–
2013
Member of the Board of Management, responsible for the
insurance business in France, Benelux, Italy, Greece and
Turkey and for the “Global Property & Casualty” Center of
Competence, Allianz SE
2007 – 2011
CFO, Zurich Insurance Group
2010 – 2011
Regional Chairman of Europe, Zurich Insurance Group
2004 – 2007
CEO of the Europe General Insurance business
and member of Zurich’s Group Executive Committee,
Zurich Insurance Group
2003 – 2004
COO of Europe General Insurance, Zurich Insurance Group
1999 – 2003
Head of Mergers and Acquisitions, Zurich Insurance Group
1997 – 1999
Head of Financial Controlling, Zurich Insurance Group
Education
–
Master’s degree and doctorate, mathematics, University of Cologne
Listed company boards
–
Member of the Board of Ørsted A/S
(chair of the audit and risk committee)
Non-listed company boards
–
Chairman of Marco Capital Holdings Limited, Malta and subsidiaries
Other activities and functions
–
Member of the Berlin Center of Corporate Governance
Key competencies
–
Banking (wealth management, asset management,
personal and corporate banking) and insurance
–
Investment banking, capital markets
–
Finance, audit, accounting
–
Risk management, compliance and legal
Leadership experience
–
Executive board leadership


Corporate governance and compensation | Corporate governance
206
Jeanette Wong
Non-executive member of the Board since 2019
–
Member Compensation Committee since 2020
–
Member of the Corporate Culture and Responsibility Committee
since 2020
–
Member of the Audit Committee since 2019
Nationality:
Year of birth:
Jeanette Wong has spent more than 30 years working in the financial
sector in Singapore. She retired from DBS Group in 2019, where she was
Group Executive responsible for the institutional banking business, a post
which encompassed corporate banking, global transaction services,
strategic advisory and mergers and acquisitions. Prior to that, she held the
position of CFO at DBS Bank. During a 16-year career with JPMorgan,
Ms. Wong helped build up its Asia and emerging markets business. She
brings extensive experience from serving as a member of the board of
directors of two highly valued listed companies.
Professional experience
2008 – 2019
Group Executive institutional banking business,
DBS Bank, Singapore
2003 – 2008
CFO, DBS Bank
2003
Chief Administration Officer, DBS Bank, Singapore
1997 – 2002
Country Manager Singapore, JPMorgan Chase, Singapore
1986 – 1997
Various roles in Global Markets and Emerging Markets
Sales and Trading business, Asia, JPMorgan Chase,
Singapore
1984 – 1986
Manager, Private Banking, Citibank, Singapore
1982 – 1984
Manager, Corporate Banking, Paribas, Singapore
Education
–
Bachelor’s degree, business administration, the National University
of Singapore
–
MBA, University of Chicago
Listed company boards
–
Member of the Board of Prudential plc
–
Member of the Board of Singapore Airlines Limited
Non-listed company boards
–
Member of the Board Risk Committee of GIC Pte Ltd
–
Member of the Board of Jurong Town Corporation
–
Member of the Board of PSA International
Other activities and functions
–
Chairman of the CareShield Life Council
–
Member of the Securities Industry Council
–
Member of the Board of Trustees of the National University
of Singapore
Key competencies
–
Banking (wealth management, asset management,
personal and corporate banking) and insurance
–
Investment banking, capital markets
–
Finance, audit, accounting
–
ESG (environmental, social and governance)
Leadership experience
–
Executive board leadership
Markus Baumann
Group Company Secretary since 2017
Nationality:
Year of birth:
1963
Markus Baumann joined UBS in 1979 as a banking apprentice
and has now been with the firm for more than 40 years. Earlier
in his career, he worked in Japan for four years, as Corporate
Planning Officer and assistant to the CEO. He then worked as
COO EMEA for UBS Asset Management and has since held a
broad range of leadership roles across the Group in Switzerland,
the US and Japan, including COO of Group Internal Audit from
2006 to 2015.
Professional experience
2017 – date
Group Company Secretary of UBS Group AG
and Company Secretary of UBS AG
2015 – 2016
Chief of Staff to the Chairman of the Board of
Directors, UBS
2006 – 2015
COO, Group Internal Audit, UBS
2005 – 2006
Head Global Reporting & Controlling,
Global Asset Management, UBS
2002 – 2004
Head Management Support CEO EMEA,
Global Asset Management, UBS
1998 – 2002
COO EMEA, Global Asset Management, UBS
1979 – 1997
Various positions, Union Bank of Switzerland
Education
–
Swiss Federal Diploma as a Business Analyst
–
MBA, INSEAD Fontainebleau
207
Elections and terms of office
Shareholders annually elect each member of the BoD individually,
as well as the Chairman and the members of the Compensation
Committee, based on proposals from the BoD.
As set out in the Organization Regulations, BoD members are
normally expected to serve for at least three years. BoD members
are limited to serving for a maximum of 10 consecutive terms of
office; in exceptional circumstances the BoD may extend that
limit.
›
Refer to “Skills, expertise and training of the Board of Directors”
in this section for more information
Organizational principles and structure
Following each AGM, the BoD meets to appoint one or more Vice
Chairmen, a Senior Independent Director, the BoD committee
members (other than the Compensation Committee members,
who are elected by the shareholders) and the respective
committee Chairpersons. At the same meeting the BoD appoints
the Group Company Secretary, who, pursuant to the
Organization Regulations, acts as secretary to the BoD and its
committees.
Pursuant to the AoA and the Organization Regulations, the
BoD meets as often as business requires, but it must meet at least
six times a year. Due to the continued COVID-19 pandemic, all
meetings were organized as video calls, with the exception of the
meeting held in October 2021. Additional video calls were
organized during the reporting period to facilitate social
engagement and interaction between the members of the BoD.
During 2021, a total of 24 BoD meetings were held, 12 of which
were attended by GEB members. Average participation in the BoD
meetings was 99%. In addition to the BoD meetings attended by
GEB members, the Group CEO attended some of the meetings of
the BoD without GEB participation. The meetings had an average
duration of 130 minutes and covered both UBS Group AG and
UBS AG. Additionally, 10 ad hoc calls were held, 6 of which were
attended by GEB members. The BoD held a number of strategy
workshops throughout the year, during which the results of the
new CEO’s in-depth strategy review were covered. These strategy
workshops included deep dives on each business division and
geographical region, and topics such as the definition of the
p
urpose, vision and strategic imperatives
,
as well as the
digitalization of the business, sustainable finance, cultural and
behavioral
aspects
,
including
agile approaches to
ways of
working. The strategy discussions were completed in October
2021, when the overarching strategy and implementation plans
were agreed upon.
At the BoD meetings, each committee Chairperson provides
the BoD with an update on current activities of his or her
committee and important committee issues.
In 2021, four UBS AG BoD meetings were held with members
of the Executive Board in attendance. Standalone meetings are
held regularly to discuss and agree on finance, risk, compliance,
operational risk, regulatory and other topics related to UBS AG.
We also continued with the coordination and exchange of
information between UBS Group AG and its significant group
entities. Joint meetings between the BoD of UBS Group AG and
the boards of directors of the significant group entities, as well as
between the respective chairs of the risk and audit committees,
have been held. As in prior years, an annual workshop, attended
by independent members of the boards of the Group and
significant group entities, was held.
Corporate governance and compensation | Corporate governance
208
Performance assessment
Every third year, an external assessment of the effectiveness of the
BoD is conducted. In 2022, this review concluded that the UBS
BoD and committees operate effectively, in line with best practice,
and set a high standard in comparison with leading international
peers. The review also confirmed that the BoD agenda covers all
important and relevant topics and that these are addressed
professionally and in great depth. It further found that the BoD
members are independent, highly committed and of the highest
integrity, and that the Chairman provides effective leadership and
direction. The review emphasized that the cooperation between
the BoD and the GEB is based on mutual trust, respect and
constructive dialogue. The mix of expertise in the BoD is broad-
based and the quality of BoD members is high. The BoD and GEB
have responded well to the economic environment, including
successfully managing the firm through the COVID-19 pandemic
and
other significant challenges, while maintaining an
appropriate focus on control and regulatory issues. The review
highlights the successful CEO transition and onboarding and the
well-planned and professionally executed Chairman succession
process. No significant weaknesses were identified in the review,
areas to be further focused on included the maintaining of a
balanced agenda that provides sufficient room for business
performance, strategic review and growth initiatives.
BoD committees
The committees listed on the following pages assist the BoD in
the performance of its responsibilities. These committees and
their charters are described in our Organization Regulations,
available at
ubs.com/governance.
as their business requires, but no less than four times a year in the
case of the Audit Committee, the Risk Committee and the
Compensation Committee, and no less than two times a year in
the case of the Corporate Culture and Responsibility Committee
and the Governance and Nominating Committee. Topics of
common interest or affecting more than one committee are
discussed at joint committee meetings.
During 2021, a total of nine joint committee meetings were
held for UBS Group AG (seven joint committee meetings were
held simultaneously for UBS AG). The Risk Committee held two
meetings with
the Compensation Committee,
two
with the
Corporate Culture and Responsibility Committee, and five with
the Audit Committee.
Board of Directors
Members in 2021
Meeting attendance
without GEB
3
Meeting attendance
with GEB
4
Key responsibilities include:
Axel A. Weber, Chairman
12/12
100%
12/12
100%
The Board has ultimate responsibility for the success of the Group and
for delivering sustainable shareholder value within a framework of
prudent and effective controls. It decides on the Group’s strategy and
the necessary financial and human resources upon recommendation of
the Group CEO and sets the Group’s values and standards to ensure
that its obligations to shareholders and other stakeholders are met.
›
Refer to the Organization Regulations of UBS Group AG,
available at
ubs.com/governance
, for more information
Jeremy Anderson
12/12
100%
12/12
100%
Claudia Böckstiegel
1
10/10
100%
8/8
100%
William C. Dudley
12/12
100%
12/12
100%
Patrick Firmenich
1
10/10
100%
8/8
100%
Reto Francioni
12/12
100%
12/12
100%
Fred Hu
11/12
92%
11/12
92%
Mark Hughes
12/12
100%
12/12
100%
Nathalie Rachou
12/12
100%
12/12
100%
Julie G. Richardson
12/12
100%
12/12
100%
Beatrice Weder di Mauro
2
2/2
100%
4/4
100%
Dieter Wemmer
12/12
100%
12/12
100%
Jeanette Wong
12/12
100%
12/12
100%
1
2
the 2021 AGM; indicated are her attended and total meetings up to the 2021 AGM.
3
4
209
Audit Committee
Throughout 2021, the Audit Committee consisted of four BoD
members, all of whom were determined by the BoD to be fully
independent. As a group, members of the Audit Committee must
have the necessary qualifications and skills to perform all their
duties and together must possess financial literacy and experience
in banking and risk management.
The Audit Committee itself does not perform audits; instead,
it oversees the work of the external auditors, Ernst & Young Ltd,
who in turn are responsible for auditing the annual financial
statements of UBS Group AG and UBS AG and for reviewing the
quarterly financial statements.
In particular, the Audit Committee monitors the integrity of the
financial statements of UBS Group AG and UBS AG and any
announcements related to financial performance, and reviews
significant financial reporting judgments contained in them,
before recommending their approval to the BoD or proposing any
adjustments the Audit Committee considers appropriate.
The Audit Committee oversees the relationship with, and
assesses the qualifications, expertise, effectiveness, independence
and performance of, the external auditors and the lead audit
partner, and supports the BoD in reaching decisions on the
appointment, reappointment or dismissal of the external auditors
and the rotation of the lead audit partner. The BoD then submits
proposals for shareholder approval at the AGM.
During 2021, the Audit Committee held 13 committee
meetings, with a participation rate of 100%. The meetings had
an average duration of approximately 145 minutes and covered
both UBS Group AG and UBS AG. Additional attendees included
the Chairman of the BoD, the Group CEO, the Group CFO, the
Group Controller and Chief Accounting Officer, the Head Group
Internal Audit (GIA) and the external auditors. The Chairperson
and the committee continued to maintain regular contact with
core supervisory authorities.
All Audit Committee members have accounting or related
financial management expertise and, in compliance with the rules
established pursuant to the 2002 US Sarbanes–Oxley Act, at least
one member qualifies as a financial expert. The NYSE standards
on corporate governance and Rule 10A-3 under the US Securities
Exchange Act set more stringent independence requirements for
members of audit committees than for the other members of the
BoD. Throughout 2021, all members of the Audit Committee, in
addition to satisfying our independence criteria, satisfied these
requirements, in that they did not receive, directly or indirectly,
any consulting, advisory or compensatory fees from any member
of the Group other than in their capacity as a BoD member, did
not hold, directly or indirectly, UBS Group AG shares in excess of
5% of the outstanding capital, and did not serve on the audit
committees of more than two other public companies.
Audit Committee
Members in 2021
Meeting attendance
3
Key responsibilities include:
Jeremy Anderson (Chairperson)
13/13
100%
The function of the Audit Committee is to support the Board in fulfilling its oversight duty relating
to financial reporting and internal controls over financial reporting, the effectiveness of the
external and internal audit functions, and the effectiveness of whistleblowing procedures.
Management is responsible for the preparation, presentation and integrity of the financial
statements, while the external auditors are responsible for auditing financial statements. The Audit
Committee’s responsibility is one of oversight and review.
›
Refer to the Organization Regulations of UBS Group AG,
available at
ubs.com/governance,
Patrick Firmenich
1
9/9
100%
Beatrice Weder di Mauro
2
4/4
100%
Dieter Wemmer
13/13
100%
Jeanette Wong
13/13
100%
1
2
are her attended and total meetings up to the 2021 AGM.
3
Additionally, the Audit Committee held one ad hoc call.
Corporate governance and compensation | Corporate governance
210
Compensation Committee
The Compensation Committee consisted of four independent
BoD members throughout 2021, as indicated in the table below.
In addition to the key responsibilities indicated in the same table,
the Compensation Committee reviews the compensation
disclosures included in this report.
During 2021, the
Co
mpensation Committee held nine
meetings, with a
n average
participation rate of 97%. The
meetings had an average duration of approximately 90 minutes
and covered both UBS Group AG and UBS AG. All meetings were
held in the presence of the Chairman and the Group CEO and
most were attended by external advisors.
In
2021
,
the
Chairperson met regularly with core supervisory authorities.
›
Refer to “Compensation for the Board of Directors” in the
“Compensation” section on page 258 of this report for more
information about the Compensation Committee’s decision-
making procedures
Corporate Culture and Responsibility Committee
In 2021, the Corporate Culture and Responsibility Committee
consisted of the Chairperson and four independent BoD
members. The Group CEO, the Group Chief Regulatory Officer,
the President Asset Management and GEB lead for Sustainability
and Impact, and the Chief Sustainability Officer are permanent
guests of the Corporate Culture and Responsibility Committee.
During 2021, six meetings were held, with a participation rate of
100
%.
The average duration of each of the meetings was
approximately 80 minutes.
Compensation Committee
Members in 2021
Meeting attendance
1
Key responsibilities include:
Julie G. Richardson (Chairperson)
9/9
100%
The Compensation Committee is responsible for:
(i)
supporting the Board in its duties to set guidelines on compensation and benefits;
(ii) approving the total compensation for the Chairman and the non-independent Board members;
(iii) proposing, upon proposal of the Chairman, financial and non-financial performance targets
and objectives for the Group CEO for approval by the Board and reviewing,
upon the proposal
of the Group CEO, the performance f
ramework for the other GEB members;
(iv) proposing, upon proposal of the Chairman, the Group CEO’s performance assessment for
approval by the Board, as well as informing the Board of the performance assessments of
all GEB members, including the Group CEO
;
(v)
proposing, upon proposal
of the Chairman, the total compensation for the Group CEO for
approval by the Board; and
(vi) proposing, upon proposal of the Group CEO, the individual total compensation for the other
GEB members for approval by the Board.
›
Refer to the Organization Regulations of UBS Group AG,
available at
ubs.com/governance,
Reto Francioni
8/9
89%
Dieter Wemmer
9/9
100%
Jeanette Wong
9/9
100%
1
Additionally, the Compensation Committee held four ad hoc calls.
Corporate Culture and Responsibility Committee
Members in 2021
Meeting attendance
Key responsibilities include:
Axel A. Weber (Chairperson)
6/6
100%
The Corporate Culture and Responsibility Committee supports the Board in its duties to safeguard
and advance the Group’s reputation for responsible and sustainable conduct. Its function is
forward-looking in that it monitors and reviews societal trends and transformational developments
and assesses their potential relevance for the Group.
In undertaking this assessment, it reviews stakeholder concerns and expectations pertaining to the
societal performance of UBS and to the development of its corporate culture. The Corporate
Culture and Responsibility Committee’s function also encompasses the monitoring of the current
state and implementation of the programs and initiatives within the Group pertaining to corporate
culture and corporate responsibility, including sustainability.
›
Refer to the Organization Regulations of UBS Group AG,
available at
ubs.com/governance
, for more information
William C. Dudley
6/6
100%
Patrick Firmenich
1
4/4
100%
Mark Hughes
6/6
100%
Beatrice Weder di Mauro
2
2/2
100%
Jeanette Wong
6/6
100%
1
2
AGM; indicated are her attended and total meetings up to the 2021 AGM.
211
Governance and Nominating Committee
In 2021, the Governance and Nominating Committee consisted
of the Chairperson and five independent members. During 2021,
nine meetings were held, with a participation rate of 100%. The
average duration of each of the meetings was approximately 75
minutes. The Group CEO attended meetings as appropriate.
Risk Committee
In 2021, the Risk Committee consisted of six independent
members. During 2021, the Risk Committee held 11 committee
meetings, with a participation rate of 100%. The average
duration of each of the meetings was approximately 205 minutes,
covering both UBS Group AG and UBS AG. The Group CEO, the
Group CFO, the Group Chief Risk Officer, Group COO and later
the Group Chief
Digital and Information
Officer, the Group
Treasurer, the Group Chief Compliance and Governance Officer,
the Group General Counsel, and the Head GIA attended the
meetings. In 2021, the Chairperson or the full committee met
with core supervisory authorities.
Ad hoc committees
The Special Committee and the Strategy Committee are two ad
hoc committees, which have a standing composition and hold
meetings as and when required.
Leading up the 2021 AGM, the Special Committee was
composed of four BoD members. Jeremy Anderson chaired the
Special Committee, with Nathalie Rachou, Julie G. Richardson,
and Axel A. Weber as its members; after the AGM, Claudia
Böckstiegel joined the Special Committee. Its primary purpose is
to oversee activities related to key litigation and investigation
matters, review management’s respective proposals and send to
the BoD recommendations for decisions. In 2021, the key focus
was the French cross-border matter. The Group CEO and the
Group General Counsel are permanent guests. During 2021, six
meetings were held, covering both UBS Group AG and UBS AG.
The Strategy Committee is composed of four BoD members.
Its primary purpose is to support management and the BoD with
regard to the assessment of strategic considerations and to assist
with the planning of the annual strategy meetings for the BoD
and the GEB. The committee sends recommendations for
decisions to the BoD. Axel A. Weber chaired the Strategy
Committee, with William C. Dudley, Fred Hu and Dieter Wemmer
as its members. During 2021, one meeting was held, covering
both UBS Group AG and UBS AG. The Group CEO, the Group
CFO and the Head Corporate Development & Performance were
present.
Governance and Nominating Committee
Members in 2021
Meeting attendance
1
Key responsibilities include:
Axel A. Weber (Chairperson)
9/9
100%
The function of the Governance and Nominating Committee is to support the Board in fulfilling its
duty to establish best practices in corporate governance across the Group, including conducting a
Board assessment, establishing and maintaining a process for appointing new Board and GEB
members, as well as for the annual performance assessment of the Board.
›
Refer to the Organization Regulations of UBS Group AG,
available at
ubs.com/governance
, for more information
Jeremy Anderson
9/9
100%
William C. Dudley
9/9
100%
Fred Hu
9/9
100%
Julie G. Richardson
9/9
100%
Dieter Wemmer
9/9
100%
1
Additionally, the Governance and Nominating Committee held five ad hoc calls.
Risk Committee
Members in 2021
Meeting attendance
1
Key responsibilities include:
Mark Hughes (Chairperson)
11/11
100%
The function of the Risk Committee is to oversee and support the Board in fulfilling its duty to set
and supervise an appropriate risk management and control framework in the areas of:
(i)
financial and non
-
financial risks
; and
(ii) balance sheet, treasury and capital management, including funding,
liquidity and
equity attribution.
›
Refer to the Organization Regulations of UBS Group AG,
available at
ubs.com/governance
, for more information
William C. Dudley
11/11
100%
Reto Francioni
11/11
100%
Fred Hu
11/11
100%
Nathalie Rachou
11/11
100%
Julie G. Richardson
11/11
100%
1
Additionally, the Risk Committee held four ad hoc calls.
Corporate governance and compensation | Corporate governance
212
Roles and responsibilities of the Chairman of the Board of
Directors
At the 2022 AGM, Axel A. Weber will step down and Colm
Kelleher will stand for election as the full-time Chairman of the
BoD. The Chairman coordinates tasks within the BoD, calls BoD
meetings and sets their agendas. He presides over all general
meetings of
shareholders and works with the committee
Chairpersons to coordinate the work of all BoD committees.
Together with the Group CEO, the Chairman undertakes
responsibility for UBS’s reputation, and is responsible for effective
communication with shareholders
and other stakeholders,
including government officials, regulators and public
organizations. This is in addition to establishing and maintaining
close working relationships with the Group CEO and other GEB
members, and providing advice and support when appropriate.
›
Refer to “Employees” in the “How we create value for our
stakeholders” section on page 44 and the fold-out pages of this
report for information about our Pillars, Principles and Behaviors
In 2021, the Chairman met regularly with core supervisory
authorities in all major locations where UBS is active. Meetings
with important supervisory authorities were scheduled on an ad
hoc or needs-driven basis.
Roles and responsibilities of the Vice Chairmen and the
Senior Independent Director
The BoD appoints one or more Vice Chairmen and a Senior
Independent Director. If the BoD appoints more than one Vice
Chairman, at least one of them must be independent. Both the
Vice Chairman and the Senior Independent Director support the
Chairman with regard to his responsibilities and authorities and
provide him with advice. In conjunction with the Chairman and
the Governance and Nominating Committee, they facilitate good
Group-wide corporate governance, as well as balanced leadership
and control within the Group, the Board and the committees.
Jeremy Anderson has been the Vice Chairman and Senior
Independent Director since 2020 and it is planned that he will
remain Senior Independent Director following the 2022 AGM.
Lukas Gähwiler will be appointed as Vice Chairman following the
2022 AGM. The Vice Chairman is required to lead and has led
meetings of the BoD in the temporary absence of the Chairman.
Together with the Governance and Nominating Committee, he is
tasked with the ongoing monitoring and the annual evaluation of
the Chairman. He also represents UBS on behalf of the Chairman
in meetings with internal or external stakeholders. The Senior
Independent Director enables and supports communication and
the flow of information among the independent BoD members.
At least twice a year, he organizes and leads a meeting of the
independent BoD members without the participation of the
Chairman. In 2021, two independent BoD meetings were held,
covering both UBS Group AG and UBS AG, with an average
participation rate of 81% and an average duration of
approximately 85 minutes. The Senior Independent Director also
relays to the Chairman any issues or concerns raised by the
independent BoD members and acts as a point of contact for
shareholders and stakeholders seeking discussions with an
independent BoD member.
Important business connections of independent members
of the Board of Directors
As a global financial services provider and a major Swiss bank, we
enter into business relationships with many large companies,
including some in which our BoD members have management or
independent board responsibilities. The Governance and
Nominating Committee determines in each instance whether the
nature of the Group’s business relationship with such a company
might compromise our BoD members’ capacity to express
independent judgment.
Our Organization Regulations require three-quarters of the
UBS Group AG BoD members and one-third of those at UBS AG
to be independent. For this purpose, independence is determined
in accordan
ce with FINMA Circular
2017/1 “Corporate
governance – banks” and the NYSE rules.
In 2021, our BoD met the standards of the Organization
Regulations for the percentage of directors who are considered
independent under the criteria described above. Since our
Chairman has a full-time contract with UBS Group AG, he is not
considered independent. No other BoD member has a significant
business connection to UBS or any of its subsidiaries. No BoD
member currently carries out, or has carried out over the past
three years, operational management tasks within the Group.
All relationships and transactions with UBS Group AG’s
independent BoD members are conducted in the ordinary course
of business and are on the same terms as those prevailing at the
time for comparable transactions with non-affiliated persons. All
relationships and transactions with BoD members’ associated
companies are conducted at arm’s length.
›
Refer to “Note 31 Related parties” in the “
Consolidated financial
statements
” section on page 397 of this report for more
information
Checks and balances: Board of Directors and Group
Executive Board
We operate under a strict dual board structure, as mandated by
Swiss banking law. The separation of responsibilities between the
BoD and the GEB is clearly
defined in the Organization
Regulations. The BoD decides on the strategy of the Group, upon
recommendations by the Group CEO, and exercises ultimate
supervision over management; whereas the GEB, headed by the
Group CEO, has executive management responsibility. The
functions of Chairman and Group CEO are assigned to two
different people, leading to a separation of power. This structure
establishes checks and balances and preserves the institutional
independence of the BoD from the executive management of the
Group, for which responsibility is delegated to the GEB, under the
leadership of the Group CEO. No member of one board may
simultaneously be a member of the other.
Supervision and control of the GEB remain with the BoD. The
authorities and responsibilities of the two bodies are governed by
the AoA and the Organization Regulations.
213
Skills, expertise and training of the Board of Directors
The BoD is composed of members with a broad spectrum of skills,
educational backgrounds, experience and expertise from a range
of sectors that reflect the nature and scope of the firm’s business.
With a view to recruiting needs, the Governance and Nominating
Committee uses a competencies and experience matrix to identify
any gaps in the competencies considered most relevant to the
BoD, taking into consideration the firm’s business exposure, risk
profile, strategy and geographic reach.
We asked our BoD membe
rs to
select
their four key
competencies from the following eight categories and to indicate
whether they have ever been a CEO or chairperson of a listed
company or a member of the executive board of such a company:
Key competencies
–
banking (wealth management, asset management, personal
and corporate banking) and insurance
–
investment banking, capital markets
–
finance, audit, accounting
–
risk management, compliance and legal
–
human resources management, including compensation
–
technology, cybersecurity
–
regulatory authority, central bank
–
environmental, social and governance (ESG)
Leadership experience
–
experience as CEO or chairperson
–
executive board leadership experience (e.g., as CFO, chief risk
officer or COO of a listed company)
The Governance and Nominating Committee reviews these
categories and ratings annually to confirm that the BoD continues
to possess the most relevant experience and competencies to
perform its duties.
With regard to the BoD composition after the 2021 AGM,
members thereof identified all of the target competencies as
being their key competencies.
Particularly strong levels of
experience and expertise existed in these areas:
–
financial services
–
risk management, compliance and legal
–
finance, audit, accounting
Furthermore, 10 of the 12 BoD members have held or currently
hold chairperson, CEO or other executive board-level leadership
positions.
Moreover, education remained an important priority for our
BoD members. In addition to a comprehensive induction program
for new BoD members, continuous training and topical deep dives
are part of the BoD agenda.
›
Refer to “Risk governance” in the “
Risk management and
control
” section on page 103 of this report for information about
our risk governance framework

Corporate governance and compensation | Corporate governance
214
Succession planning
Succession planning is one of the key responsibilities of both the
BoD and the GEB. Across all divisions and regions, an inclusive
talent development and succession planning process is in place
that aims to foster the personal development and Group-wide
mobility of our employees. Although the recruiting process for
BoD and GEB members takes into account a broad spectrum of
factors, such as skills, backgrounds, experience and expertise, our
approach with regard to diversity considerations does not
constitute a diversity policy within the meaning of the EU Directive
on Non-Financial Reporting, and Swiss law does not require UBS
to maintain such a policy.
In 2021, the Chairman and the members of the BoD and the
GEB launched several strategic initiatives with the close
involvement of the BoD and with the aim of further strengthening
UBS. The succession plans for the GEB and the management layer
below it are managed under the lead of the Group CEO. The BoD
reviews and approves the succession plans of the GEB.
For the BoD, the
Chairman leads a systematic
succession
planning process as illustrated in the chart below.
Our strategy and the business environment constitute the main
drivers in our succession planning process for new BoD members,
as they define the key competencies required on the BoD. Taking
the diversity and the tenure of the existing BoD into account, the
Governance and Nominating Committee defines the recruiting
profile for the search. Both external and internal sources
contribute to identifying suitable candidates. The Chairman and
the members of the Governance and Nominating Committee
meet with potential candidates and, with the support of the full
BoD, nominations are submitted to the AGM for approval. New
BoD members follow an in-depth onboarding process designed to
enable them to integrate efficiently and become effective in their
new role.
Due to
this succession planning process, the
composition of the BoD is in line with the demanding
requirements of a leading global financial services firm.
The succession of both the CEO and Chairman, as well as of
GEB members, was smoothly planned and is being carried out,
demonstrating the strength and success of the succession
planning at UBS.
215
Information and control instruments with regard to the
Group Executive Board
The BoD is kept informed of the GEB’s activities in various ways,
including regular meetings between the Chairman, the Group
CEO and GEB members. The Group CEO and other GEB members
also participate in BoD meetings to update its members on all
significant issues. The BoD also receives regular comprehensive
reports, covering financial, capital, funding, liquidity, regulatory,
compliance and legal developments, as well as performance
against plan and forecasts for the remainder of the year. For
important developments, BoD members are also updated by the
GEB in between meetings. In addition, the Chairman receives the
meeting material and minutes of the GEB meetings.
BoD members may request from other BoD or GEB members
any information about matters concerning the Group that they
require in order to fulfill their duties. When these requests are
raised outside BoD meetings, such requests must go through the
Group Company Secretary and be addressed to the Chairman.
The BoD is supported in discharging its governance
responsibilities by GIA, which independently assesses whether risk
management, control and governance processes are designed
and operating sustainably and effectively.
The Head GIA reports directly to the Chairman. In addition, GIA
has a functional reporting line to the Audit Committee in
accordance with its responsibilities as set forth in our Organization
Regulations. The Audit Committee assesses the independence
and performance of GIA and the effectiveness of both the Head
GIA and GIA as an organization, approves GIA’s annual audit plan
and objectives and monitors GIA’s discharge of these objectives.
The committee is also in regular contact with the Head GIA.
GIA issues quarterly reports that provide an overview of significant
audit results and key issues, as well as themes and trends, based
on results of individual audits, continuous risk assessment and
issue assurance. The reports are provided to the Chairman, the
members of the Audit and the Risk Committees, the GEB and
other stakeholders. The Head GIA regularly updates the Chairman
and the Audit Committee on GIA’s activities, processes, audit plan
execution, resourcing requirements and other important
developments. GIA issues an annual Activity Report, which is
provided to the Chairman and the Audit Committee to support
their assessment of GIA’s effectiveness.
›
Refer to “Group Internal Audit” in this section for more
information
›
Refer to “Internal risk reporting” in the “
Risk management and
control
” section on page 108 of this report for information about
reporting to the BoD
Corporate governance and compensation | Corporate governance
216
Group Executive Board
The BoD delegates the management of the business to the Group
Executive Board (the GEB).
Responsibilities, authorities and organizational principles
of the Group Executive Board
As of 31 December 2021, the GEB, under the leadership of the
Group CEO, consisted of
12 members. It has executive
management responsibility for the steering of the Group and its
business and assumes overall responsibility for developing the
strategies of the Group, business divisions and Group Functions
and implements the BoD approved strategies. The GEB is also the
risk council of the Group, with overall responsibility for
establishing and supervising the implementation of risk
management and control principles, as well as for managing the
risk profile of the Group, as determined by the BoD and the Risk
Committee.
In 2021, the GEB held a total of 66 meetings for UBS Group
AG.
At UBS AG, management of the business is also delegated, and
its Executive Board, under the leadership of its President, has
executive management responsibility for UBS AG and its business.
In 2021, all members of the GEB were members of UBS AG’s
Executive Board, with the exception of Sabine Keller-Busse, who
served as President UBS Switzerland AG. The Executive Board held
66 combined meetings with the GEB and
four
st
andalone
meetings for UBS AG in 2021.
›
Refer to the Organization Regulations of UBS Group AG,
available at
ubs.com/governance
, for more information about
the authorities of the Group Executive Board
Changes to the Group Executive Board
Effective 1 February 2021, Axel P. Lehmann ended his tenure at
UBS and Sabine Keller-Busse succeeded to the posts of President
Personal & Corporate Banking and President UBS Switzerland. In
addition to his responsibility as Co-President Global Wealth
Management, Iqbal Khan assumed the role of President UBS
EMEA from Sabine Keller-Busse as of 1 February 2021. Effective
1
April
2021, Robert Karofsky was appointed sole President
Investment Bank, following Piero Novelli’s decision to step down
as Co-President Investment Bank as of 31 March 2021. Effective
1 May 2021, Mike Dargan was appointed Group Chief Digital and
Information Officer (CDIO) and member of the GEB. The Group
CDIO organization succeeded the function of the Group Chief
Operating Officer. Effective 1 November 2021, and after 13 years
of service, Markus U. Diethelm stepped down from his role as
Group General Counsel and member of the GEB; he remains with
UBS into 2022 as a senior advisor for selected legacy litigation
matters. Barbara Levi assumed the role of Group General Counsel
and member of the GEB. Ms. Levi joined UBS from Rio Tinto
Group, where she served as Chief Legal Officer & External Affairs
and before that as Group General Counsel and a member of the
Executive Committee.
On 1 December 2021, UBS announced that Kirt Gardner will
step down from his role as Group CFO in May 2022. Sarah
Youngwood will join UBS and the GEB in March 2022 and will
take over as Group CFO in May 2022. Ms. Youngwood has been
CFO of JPMorgan Chase’s consumer and community banking line
of
business since 2016.
She also led Finance for
its
Global
Technology unit.
The biographies on the following pages provide information
about the GEB members in office as of 31 December 2021. The
biographies of Piero Novelli and Markus U. Diethelm can be found
on page 208 and 203 of the UBS Group AG Annual Report 2020,
available under “Annual reporting” at
ubs.com/investors
.
In
addition to information on mandates, the biographies include
memberships and other activities or functions, as required by the
SIX Swiss Exchange Corporate Governance Directive.
In line with Swiss law, article 36 of UBS Group AG’s Articles of
Association limits the number of mandates that GEB members
may hold outside UBS Group to one mandate in a listed company
and five additional mandates in non-listed companies. Mandates
in companies that are controlled by UBS or that control UBS are
not subject to this limitation. In addition, GEB members may not
hold more than 10 mandates at a time at the request of the
company and
eight mandates
in associations, charitable
organizations, foundations, trusts and employee welfare
foundations. On 31 December 2021, no member of the GEB
reached the aforementioned thresholds.
Responsibilities and authorities of the Asset and Liability
Committees
The Asset and Liability Committees (the ALCOs) of UBS Group AG
and UBS AG are sub-committees of the GEB and the Executive
Board that are responsible for managing assets and liabilities in
line with the strategy, risk appetite, regulatory commitments and
the interests of shareholders and other stakeholders. The ALCO
of UBS Group AG proposes the framework for capital
management, capital allocation, funding and liquidity risk, and
proposes limits and targets for the Group to the BoD for approval.
It oversees the balance sheet management of the Group, its
business divisions and Group Functions. In 2021, the ALCOs of
UBS Group AG and UBS AG held 11 meetings.
Management contracts
We
have not entered into management contracts with any
companies or natural persons that do not belong to the Group.


217
Ralph Hamers
Group Chief Executive Officer, member of the GEB since 2020
Nationality:
Year of birth:
Ralph Hamers has been Group CEO of UBS Group AG and President of
the Executive Board of UBS AG since November 2020. Before joining UBS,
he served as CEO and Chairman of the Executive Board of ING Group.
During his time as CEO of ING, he steered the bank to profitability after
the financial crisis and supported the firm’s digital transformation. He also
played a leading role in driving sustainability efforts in the financial
industry, and firmly continues to do so.
Professional experience
2020 – date
Group CEO of UBS Group AG and President of the
Executive Board of UBS AG
2013 – 2020
CEO and Chairman of the Executive Board, ING
Supervisory Board member of NN Group (2014 – 2015);
Management Board Banking and Management Board NN
Group (2013 – 2014)
2011 – 2013
CEO of ING Belgium and Luxembourg, ING
2010 – 2011
Head of Network Management for Retail Banking Direct &
International, ING
2007 – 2010
Global Head of the Commercial Banking network, ING
2005 – 2007
CEO of ING Bank Netherlands, ING
2002 – 2005
General Manager of the ING Bank branch network, ING
1999 – 2002
General Manager of ING Romania, ING
Education
–
Master’s degree, business econometrics and operations research,
Tilburg University
Other activities and functions
–
Member of the Board of the Swiss-American Chamber of Commerce
–
Member of the Institut International d’Etudes Bancaires
–
Member of the IMD Foundation Board
–
Member of the McKinsey Advisory Council
–
Member of the World Economic Forum International Business Council
–
Governor of the World Economic Forum (Financial Services)
Christian Bluhm
Group Chief Risk Officer, member of the GEB since 2016
Nationality:
German |
Year of birth:
Christian Bluhm has been Group Chief Risk Officer since 2016. He held
several positions in academia before starting his banking career in 1999
with Deutsche Bank in credit risk management, and subsequently working
for Hypovereinsbank and Credit Suisse in the same area. Before joining
UBS, he used his expertise and skills as Chief Risk & Financial Officer at
FMS Wertmanagement. Mr. Bluhm is responsible for the development of
the Group’s risk management and control framework for various risk
categories and implementation of its independent control frameworks.
Professional experience
2016 – date
Group Chief Risk Officer of UBS Group AG and Chief Risk
Officer of UBS AG
2012 – 2015
Spokesman of the Executive Board,
FMS Wertmanagement
2010 – 2015
Chief Risk & Financial Officer, FMS Wertmanagement
2004 – 2009
Managing Director, Credit Risk Management (Switzerland
and Private Banking worldwide), Credit Suisse
2008 – 2009
Head Credit Risk Management Analytics & Instruments,
Credit Suisse
2004 – 2008
Head of Credit Portfolio Management, Credit Suisse
2001 – 2004
Head Structured Finance Analytics, Group Credit Portfolio
Management, Hypovereinsbank
1999 – 2000
Credit Risk Management, Deutsche Bank
Education
–
Master’s degree, mathematics and informatics, and doctorate,
mathematics, University of Erlangen-Nuremberg
Other activities and functions
–
Member of the Board of UBS Switzerland AG
–
Member of the Foundation Board of the UBS Pension Fund
–
Member of the Foundation Board – International Financial
Risk Institute


Corporate governance and compensation | Corporate governance
218
Mike Dargan
Group Chief Digital and Information Officer,
member of the GEB since 2021
Nationality:
Year of birth:
Mike Dargan was appointed Group Chief Digital and Information Officer
(CDIO) in May 2021. The Group CDIO organization consists of the Group
Technology teams and Group Corporate Services. In October 2021, he
took up the additional role of UBS GEB sponsor to co-lead the AI, Data
and Analytics center of expertise, along with Robert Karofsky. From his
former roles at Standard Chartered Bank, Mr. Dargan brings proven
experience in technology strategy and operations.
Professional experience
May 2021 – date
Group CDIO, UBS Group AG and UBS AG
Oct. 2021 – date
President of the Executive Board,
UBS Business Solutions AG
2016 – 2021
Head Group Technology, UBS
2015 – 2016
CIO for Corporate and
Institutional Banking, Standard Chartered Bank
2014 – 2015
Global Group Technology and Operations Head for
Global Markets, Wealth Management, Private Banking
and Securities Services, Group Technology and
Operations Engineering, Standard Chartered Bank
2013 – 2014
CIO for Financial Markets, Standard Chartered Bank
2009 – 2013
Global Head of Strategy and Corporate M&A, Global
Markets, Standard Chartered Bank
2005 – 2009
Head Corporate Strategy & M&A, EMEA and Pacific
Rim, Merrill Lynch
1999 – 2005
Head of Corporate and Institutional Banking Practice,
Asia Pacific, Oliver Wyman
Education
–
Master’s degree, politics, philosophy and economics,
St. John’s College, Oxford University
Non-listed company boards
–
Member of the Board of Directors of Done Next Holdings AG
Other activities and functions
–
Member of the Board of UBS Business Solutions AG
–
Member of the Board of Trustees of the Inter-Community
School Zurich
Kirt Gardner
Group Chief Financial Officer, member of the GEB since 2016
Nationality:
Year of birth:
Kirt Gardner became Group CFO in 2016. Earlier in his career, he worked
for the management and technology consulting firms BearingPoint and
Barents Group in the US, Asia, Latin America and Europe. Before joining
UBS as CFO Wealth Management in 2013, Mr. Gardner held various
leadership positions at Citigroup, including CFO and Head of Strategy
within Global Transaction Services, Head of Strategy, Planning and Risk
Strategy for the Corporate and Institutional Division, and Head of Global
Strategy and Cost Management for the Consumer Bank.
Professional experience
2016 – date
Group CFO of UBS Group AG and CFO of UBS AG
2013 – 2015
CFO Wealth Management, UBS
2010 – 2013
CFO and Head of Strategy Global Transaction Services,
Citigroup
2006 – 2010
Head of Strategy, Planning and Risk Strategy for the
Corporate and Institutional Division, Citigroup
2004
–
2006
Head of Global Strategy and Cost Management for the
Consumer Bank, Citigroup
2000 – 2004
Global Head of Financial Services Strategy, BearingPoint
1994
–
2000
Managing Director and Head of Financial Services
Consulting, Barents Group
Education
–
Master’s degree, international studies, University of Pennsylvania
–
MBA, finance, the Wharton School
Other activities and functions
–
Member of the Board of UBS Business Solutions AG


219
Suni Harford
President Asset Management, member of the GEB since 2019
Nationality:
Year of birth:
Suni Harford was appointed President Asset Management in 2019 and is
the Chair of UBS Optimus Foundation. Ms. Harford has been the UBS GEB
lead for Sustainability and Impact since May 2021. She started her Wall
Street career at Merrill Lynch & Co., in investment banking
,
before
embarking on a 24-year career at Citigroup Inc., the last nine years of
which she was the Regional Head of Markets for North America.
Ms. Harford then joined UBS, bringing with her a broad experience from
across the industry, including in research, client coverage and risk
management, and successfully led UBS Asset Management’s integrated
investments capabilities, driving performance for its clients.
Professional experience
2019 – date
President Asset Management, UBS Group AG
and UBS AG
2017 – 2019
Head of Investments, Asset Management, UBS
2008 – 2017
Regional Head of Markets for North Americas,
Citigroup Inc.
2004 – 2008
Global Head of Fixed Income Research, Citigroup Inc.
Education
–
Bachelor’s degree, physics and mathematics, Denison University, Ohio
–
MBA, Tuck School of Business, Dartmouth College
Other activities and functions
–
Chairman of the Board of Directors of UBS Asset Management AG
–
Chair of the Board of UBS Optimus Foundation
–
Member of the Leadership Council of the Bob Woodruff Foundation
Robert Karofsky
President Investment Bank, member of the GEB since 2018
Nationality:
Year of birth:
1967
Robert Karofsky was appointed Co-President of the Investment Bank in
2018. He became sole President in April 2021. Before joining UBS, he
acquired know-how in investment banking as an analyst and trader,
working for various financial institutions such as Morgan Stanley,
Deutsche Bank, and AllianceBernstein. He then became Global Head of
Equities at UBS, responsible for driving UBS’s growth strategy for equities
globally. In October 2021, Mr. Karofsky was appointed to the additional
role of UBS GEB sponsor to co-lead the AI, Data and Analytics center of
expertise, along with Mike Dargan.
Professional experience
Apr. 2021 – date
President Investment Bank, UBS Group AG and UBS AG
2018 – Mar. 2021
Co-President Investment Bank, UBS
2015 – 2021
President UBS Securities LLC, UBS
2014 – 2018
Global Head Equities, UBS
2011 – 2014
Global Head of Equity Trading, AllianceBernstein
2008 – 2010
Co-Head of Global Equities, Deutsche Bank
2005 – 2008
Head of North American Equities, Deutsche Bank
1994 – 2005
Head of North American Trading, Morgan Stanley
Education
–
Bachelor’s degree, economics, Hobart and William Smith Colleges
–
MBA, finance and statistics, University of Chicago’s Booth School
of Business
Other activities and functions
–
Member of the Board of UBS Americas Holding LLC
–
Member of the Board of UBS Optimus Foundation
–
Trustee of the UBS Americas Inc. Political Action Committee


Corporate governance and compensation | Corporate governance
220
Sabine Keller-Busse
President Personal & Corporate Banking and
President UBS Switzerland, member of the GEB since 2016
Nationality:
Year of birth:
Sabine Keller-Busse was appointed President Personal & Corporate
Banking and President UBS Switzerland in 2021, heading the leading
Universal Bank in Switzerland. In her previous role, Group COO, she
overs
aw
global functions such as technology, oper
ations, human
resources and corporate services. She has been pivotal in driving business
alignment, and digital and cultural transformation, while also facilitating
business growth as President UBS Europe, Middle East and Africa. Ms.
Keller-Busse also brings in-depth experience regarding financial market
infrastructure, having served on the Board of SIX Group for nine years.
Professional experience
Feb. 2021 – date
President Personal & Corporate Banking and
President UBS Switzerland, UBS Group AG
Feb. 2021 – date
President of the Executive Board, UBS Switzerland AG
2018 – 2021
Group COO of UBS and President of the Executive
Board, UBS Business Solutions AG
2019 – 2021
President UBS Europe, Middle East and Africa, UBS
2016 – 2021
Member of the Executive Board of UBS AG
2014 – 2017
Group Head Human Resources, UBS
2010
–
2014
COO UBS Switzerland, UBS
2008 – 2010
Head Private Clients Region Zurich, Credit Suisse
1995 – 2008
Partner (2002), McKinsey & Company
Education
–
Master’s degree and doctorate, economics, University of St. Gallen
Listed company boards
–
Member of the Board of Zurich Insurance Group
Other activities and functions
–
Member of the Foundation Council of the UBS International Center
of Economics in Society
–
Member of the Board and Board Committee of Zurich Chamber
of Commerce
–
Member of the Board of the University Hospital Zurich Foundation
Iqbal Khan
Co-President Global Wealth Management and
President UBS EMEA, member of the GEB since 2019
Nationality:
Year of birth:
Iqbal Khan has been Co-President Global Wealth Management, which he
leads with Tom Naratil, since 2019. He was appointed President UBS
EMEA in February 2021. Mr. Khan joined Ernst & Young (EY) in 2001,
holding many
leadership positions and becoming the youngest ever
partner of the firm’s Swiss arm; when leaving EY, he was lead auditor of
UBS. In 2013, he moved to Credit Suisse, holding senior leadership
positions as CFO Private Banking & Wealth Management and later CEO
International Wealth Management.
Professional experience
2019 – date
Co-President Global Wealth Management,
UBS Group AG and UBS AG
Feb. 2021 – date
President UBS Europe, Middle East and Africa,
UBS Group AG and UBS AG
2015 – 2019
CEO International Wealth Management, Credit Suisse
2013 – 2015
CFO Private Banking & Wealth Management,
Credit Suisse
2011 – 2013
Managing Partner Assurance and Advisory Services –
Financial Services, Ernst & Young
2009 – 2011
Industry Lead Partner Banking and Capital Markets,
Switzerland and EMEA Private Banking, Ernst & Young
2001 – 2009
Various positions in Ernst & Young
Education
–
Swiss Certified Public Accountant
–
Advanced Master of International Business Law degree (LLM),
University of Zurich
Other activities and functions
–
Member of the Supervisory Board of UBS Europe SE
–
Member of the Board of UBS Optimus Foundation
–
Member of the Board of Room to Read Switzerland


221
Edmund Koh
President UBS Asia Pacific, member of the GEB since 2019
Nationality:
Year of birth:
Edmund Koh has been President UBS Asia Pacific since 2019. He is a
financial sector veteran, with more than 30 years in senior roles in financial
services, including as Head Wealth Management Asia Pacific, Country
Head Singapore and Head Wealth Management South East Asia and Asia
Pacific Hub for UBS. Before working for DBS Bank in Singapore, Mr. Koh
was CEO for Prudential Assurance and Alverdine Pte Ltd, both companies
based in Singapore. He joined UBS from Taiwan -based Ta Chong Bank,
where he served as President and Director.
Professional experience
2019 – date
President UBS Asia Pacific at UBS Group AG and UBS AG
2016 – 2018
Head Wealth Management Asia Pacific, UBS
2012 – 2018
Country Head Singapore, UBS
2012 – 2015
Head Wealth Management South East Asia and
Asia Pacific Hub, UBS
2008 – 2012
President and Director, Ta Chong Bank, Taiwan
2001 – 2008
Managing Director and Regional Head, Consumer Banking
Group, DBS Bank, Singapore
Education
–
Bachelor’s degree, psychology, University of Toronto
Non-listed company boards
–
Member of the Board of Trustees of the Wealth Management
Institute, Singapore
–
Member of the Board of Next50 Limited, Singapore
–
Member of the Board of Medico Suites (S) Pte Ltd
Other activities and functions
–
Member of a sub-committee of the Singapore Ministry
of Finance’s Committee on the Future Economy
–
Member of the Financial Centre Advisory Panel of the Monetary
Authority of Singapore
–
Council member of the Asian Bureau of Finance and
Economic Research
–
Council member of the KidSTART program of the Early Childhood
Development Agency, Singapore (until 31 January 2022)
–
Trustee of the Cultural Matching Fund, Singapore
–
Member of University of Toronto’s International Leadership
Council for Asia
Barbara Levi
Group General Counsel, member of the GEB since 2021
Nationality:
Year of birth:
Barbara Levi has been Group General Counsel since November 2021. A
qualified attorney-at-law, she has been admitted to the Supreme Court of
the United States, the New York State bar and the bar of Milan, Italy, and
has worked in several law firms in New York and Milan. Ms. Levi began
her corporate career with Novartis Group in 2004 and worked there for
16 years, holding a number of senior legal roles across Europe. Before
joining UBS, she served as Chief Legal Officer & External Affairs at Rio
Tinto Group and, before that, as General Counsel. In both roles, she was
a member of that company’s executive committee.
Professional experience
Nov. 2021 – date
Group General Counsel for UBS Group AG and UBS AG
2021
Chief Legal Officer & External Affairs, Rio Tinto Group
2020 – 2021
Group General Counsel, Rio Tinto Group
2019
Group Legal Head, M&A and Strategic Transactions,
Novartis
2016
–
2019
Global General Counsel, Sandoz International GmbH,
Novartis
2014 – 2016
Global Legal Head, Product Strategy &
Commercialization, Novartis
2013 – 2014
Global Legal Head, TechOps, Primary Care and
Established Medicines, Novartis
2009 – 2013
Head of Legal & Compliance, Region Asia-Pacific,
Middle East, and African Countries, Region Group
Emerging Markets, Novartis
Education
–
Master’s degree, law, University of Milan
–
LL.M., banking, corporate and finance law, Fordham University
School of Law, New York
Other activities and functions
–
Member of the Employers’ Board of the Global Institute for
Women’s Leadership, King’s College London
–
Member of the Board of Directors of the European General
Counsel Association


Corporate governance and compensation | Corporate governance
222
Tom Naratil
Co-President Global Wealth Management and
President UBS Americas, member of the GEB since 2011
(UBS Group AG: 2014, UBS AG: 2011)
Nationality:
Year of birth:
Tom Naratil has been Co-President Global Wealth Management since
2018, which he leads with Iqbal Khan. He also is CEO of UBS Americas
Holding LLC. He started his career in finance in 1983, when he joined the
brokerage firm Paine Webber Jackson & Curtis, and is an experienced
veteran in the banking sector. UBS acquired Paine Webber in 2000; since
then, Mr. Naratil has held various senior management positions at UBS
Group, including CFO and COO. He served as President Wealth
Management Americas from 2016 and was also appointed President UBS
Americas at UBS Group AG and UBS AG in 2016.
Professional experience
2018 – date
Co-President Global Wealth Management,
UBS Group AG and UBS AG
2016 – date
President UBS Americas, UBS Group AG and UBS AG
2016 – date
CEO of UBS Americas Holding LLC
2016 – 2018
President Wealth Management Americas, UBS
2015 – 2016
President of the Executive Board,
UBS Business Solutions AG
2014 – 2015
Group COO, UBS
2011 – 2015
Group CFO, UBS
2009 – 2011
CFO and Chief Risk Officer,
Wealth Management Americas, UBS
1983 – 2009
Various positions at PaineWebber and UBS
Education
–
Bachelor’s degree, history, Yale University
–
MBA, economics, New York University
Other activities and functions
–
Member of the Board of UBS Americas Holding LLC
–
Member of the Board of the American Swiss Foundation
Markus Ronner
Group Chief Compliance and Governance Officer,
member of the GEB since 2018
Nationality:
Year of birth:
Markus Ronner has been Group Chief Compliance and Governance
Officer since 2018. He has been with UBS for 40 years and held various
positions across the firm, including manager of the Group-wide too-big-
to-fail program, COO Wealth Management & Swiss Bank, Head Products
and Services of Wealth Management & Swiss Bank, COO Asset
Management, and Head Group Internal Audit. In his current position, he
is responsible at the Group level for compliance and operational risk
control, governmental and regulatory affairs, as well as investigations and
governance matters.
Professional experience
2018 – date
Group Chief Compliance and Governance Officer,
UBS Group AG and UBS AG
2012 – 2018
Head Group Regulatory and Governance, UBS
2011
–
2013
Manager Group-wide too-big-to-fail program, UBS
2010 – 2011
COO Wealth Management & Swiss Bank, UBS
2009 – 2010
Head Products and Services of Wealth Management &
Swiss Bank, UBS
2007 – 2009
COO Asset Management, UBS
2001 – 2007
Head Group Internal Audit, UBS
Education
–
Swiss Banking Diploma
Other activities and functions
None
223
Change of control and defense measures
Our Articles of Association do not provide any measures for
delaying, deferring or preventing a change of control.
Duty to make an offer
Pursuant to the
Swiss Federal Act on Financial Market
Infrastructures and Market Conduct in Securities and Derivatives
Trading of 19 June 2015, an investor who has acquired
(whether directly, indirectly or in concert with third parties)
more than 33
1
⁄
3
% of all voting rights of a company listed in
Switzerland, whether such rights are exercisable or not, is
required to submit a takeover offer for all listed shares
outstanding. We have not elected to change or opt out of this
rule.
Clauses on change of control
Neither the full-time contract with the Chairman of the BoD nor
any employment contracts with GEB members or employees
holding key functions within the company contain change of
control clauses.
All employment contracts with GEB members stipulate a notice
period of six months. During the notice period, GEB members are
entitled to their salaries
and the continuation of existing
employment benefits and may be eligible to be considered for a
discretionary performance award based on their contribution
during their tenure.
In case of a change of control, we may, at our discretion,
accelerate the vesting of and / or relax applicable forfeiture
provisions of employees’ awards.
›
Refer to the “Compensation” section of this report on page 228
for more information
Corporate governance and compensation | Corporate governance
224
Auditors
Audit is an integral part of corporate governance. While
safeguarding their independence, the external auditors closely
coordinate their work with Group Internal Audit (GIA). The Audit
Committee and, ultimately, the BoD supervise the effectiveness of
audit work.
›
Refer to “Board of Directors” in this section for more
information about the Audit Committee
External independent auditors
The AGM in 2021 re-elected Ernst & Young Ltd (EY) as auditors
for the Group for a one-year term of office. EY assumes virtually
all auditing functions according to laws, regulatory requests and
the AoA. Bob Jacob is the EY lead partner in charge of the overall
coordination of the UBS Group financial and regulatory audits and
the co-signing partner of the financial audit. In 2020, Maurice
McCormick became the lead audit partner for the financial
statement audit and has an incumbency limit of five years. In
2021, Hannes Smit became the Lead Auditor to the Swiss
Financial Market Supervisory Authority (FINMA) with an
incumbency limit of seven years. Daniel Martin has been the co-
signing partner for the FINMA audit since 2019, with an
incumbency limit of seven years.
During 2021, the Audit Committee held 13 meetings with the
external auditors.
Review of UBS Group AG and UBS AG audit engagement
EU rules require UBS Europe SE to rotate its external auditor in the
financial year 2024. In connection with this required change, and
in consideration of governance best practices, the Board of
Directors considered whether it would propose to shareholders a
rotation of the Group auditor concurrent with the change at UBS
Europe SE. Under the direction of the Audit Committee, UBS
conducted a formal review of the Group audit engagement
including soliciting proposals from potential auditors. Based on
the results of this assessment, the Board of Directors has decided
to retain Ernst & Young as the Group’s external auditor.
Audit effectiveness assessment
The Audit Committee assesses the performance, effectiveness
and independence of the external auditors on an annual basis.
The assessment is generally based on interviews with senior
management and survey feedback from stakeholders across the
Group. Assessment criteria include quality of service delivery,
quality and competence of the audit team, value added as part of
the audit, insightfulness, and the overall relationship with EY.
Based on its own analysis and the assessment results, including
feedback received as part of the review of the Group audit
engagement described above, the Audit Committee concluded
that EY’s audit has been effective.
Fees paid to external independent auditors
UBS Group AG and its subsidiaries (including UBS AG) paid the following fees (including expenses) to their external independent
auditors.
For the year ended
USD million
31.12.21
31.12.20
Audit
Global audit fees
Additional services classified as audit (services required by law or statute, including work of a non-recurring nature mandated by regulators)
Total audit
1
Non-audit
Audit-related fees
of which: assurance and attestation services
of which: control and performance reports
of which: consultation concerning financial accounting and reporting standards
Tax fees
All other fees
Total non-audit
1
1 Total audit and non-audit fees amounted to USD 72 million for UBS Group AG consolidated as of 31 December 2021 (31 December 2020: USD 73 million), of which USD 43 million related to UBS AG consolidated
(31 December 2020: USD 46 million).
225
Special auditors for potential capital increases
At the AGM on 8 April 2021, BDO AG was reappointed as special
auditors for a three-year term of office. Special auditors provide
audit opinions in connection with potential capital increases
independently from other auditors.
Services performed and fees
The Audit Committee oversees all services provided to UBS by
the external auditors. For services requiring the approval from the
Audit Committee, a preapproval may be granted either for a
specific mandate or in the form of a blanket preapproval
authorizing a limited and well-defined type and scope of services.
The fees (including expenses) paid to EY are set forth in the
table on the previous page. In addition, EY received USD 34.1
million in 2021 (USD 32.7 million in 2020) for services performed
on behalf of our investment funds, many of which have
independent fund boards or trustees.
Audit work includes all services necessary to perform the audit
for the Group in accordance with applicable laws and generally
accepted auditing standards, as well as other assurance services
that conventionally only the auditor can provide. These include
statutory and regulatory audits, attestation services and the
review of documents to be filed with regulatory bodies. The
additional services classified as audit in 2021 included several
engagements for which EY was mandated at the request of
FINMA.
Audit-related work consists of assurance and related services
traditionally performed by auditors, such as attestation services
related to financial reporting, internal control reviews and
performance standard reviews, as well as consultation concerning
financial accounting and reporting standards.
Tax work involves services performed by professional staff in
EY’s tax division and includes tax compliance and tax consultation
with respect to our own affairs.
“Other” services are permitted services, which include
technical IT security control reviews and assessments.
Group Internal Audit
GIA performs the internal auditing role for the Group. It is an
independent function that provides expertise and insights to
confirm controls are functioning correctly and highlight where
UBS needs to better manage current and emerging risks. In 2021,
it operated with an average headcount of 586 full-time equivalent
employees.
GIA supports the BoD in discharging its governance
responsibilities by taking a dynamic approach to audit, issue
assurance and risk assessment, calling attention to key risks in
order to drive action to prevent unexpected loss or damage to the
firm’s reputation. To support the achievement of UBS’s objectives,
GIA independently, objectively and systematically assesses the:
(i)
soundness of the Group’s risk and control culture;
(ii)
reliability
and integrity of financial and operational
information, including whether activities are properly,
accurately and completely recorded, and the quality of
underlying data and models; and
(iii)
design, operating effectiveness and sustainability of:
–
processes to define strategy and risk appetite, as well as
the overall adherence to the approved strategy;
–
governance processes;
–
risk management, including whether risks are
appropriately identified and managed;
–
internal controls, specifically whether they are
commensurate with the risks taken;
–
remediation activities; and
–
processes to comply with legal and regulatory
requirements, internal policies, and the Group’s
constitutional documents and contracts.
Audit reports that include significant issues are provided to the
Group CEO, relevant GEB members and other responsible
management. The Chairman, the Audit Committee and the Risk
Committee of the BoD are regularly informed of such issues.
In addition, GIA provides independent assurance on the
effective and sustainable remediation of control deficiencies
within its mandate, taking a prudent and conservative risk-based
approach and assessing at the issue level whether the root cause
and the potential exposure for the firm have been holistically and
sustainably addressed. GIA also cooperates closely with risk
control functions and internal and external legal advisors on
investigations into major control issues.
To ensure GIA’s independence from management, the Head
GIA reports to the Chairman of the BoD and to the Audit
Committee, which assesses annually whether GIA has sufficient
resources to perform its function, as well as its independence and
performance. In the Audit Committee’s assessment, GIA is
sufficiently resourced to fulfill its mandate and complete
its
auditing objectives. GIA’s role, position, responsibilities and
accountability are set out in our Organization Regulations and the
Charter for GIA, available at
ubs.com/governance.
also applies
to UBS AG’s internal audit function. GIA has
unrestricted access to all accounts, books, records, systems,
property and personnel, and must be provided with all
information and data that it needs to fulfill its auditing
responsibilities. GIA also conducts special audits at the request of
the Audit Committee, or other BoD members, committees or the
Group CEO in consultation with the Audit Committee.
GIA enhances the efficiency of its work through coordination
and close cooperation with the external auditors.
Corporate governance and compensation | Corporate governance
226
Information policy
We provide regular information to our shareholders and to the
wider financial community.
Financial reports for UBS Group AG are expected to be
published on the following dates:
First quarter 2022
26 April 2022
Second quarter 2022
26 July 2022
Third quarter 2022
25 October 2022
The annual general meetings of the shareholders of UBS
Group AG will take place on the following dates:
2022
6 April 2022
2023
5 April 2023
›
Refer to the corporate calendar at
ubs.com/investors
financial report publication and other key dates, including UBS
AG’s financial report publication dates
We meet with institutional investors worldwide throughout the
year and regularly hold results presentations, attend and present
at investor conferences, and, from time to time, host investor
days. When appropriate, investor meetings are hosted by senior
management and are attended by members of our Investor
Relations team. We use various technologies, such as webcasting,
audio links and cross-location videoconferencing, to widen our
audience and maintain contact with shareholders globally.
We make our publications available to all shareholders
simultaneously to provide them with equal access to our financial
information.
All our financial publications are available at
ubs.com/investors
.
Shareholders may opt to receive a printed copy of our annual
report. Additionally, they may also access our digital annual review
at
ubs.com/annualreview
, which reflects on specific initiatives and
achievements of the Group and provides an overview of the
Group’s activities during the year, as well as key financial
information.
›
Refer to
ubs.com/investors
reporting documents and a selection of senior management
industry conference presentations
›
Refer to the “Information sources” section on page 585 of this
report for more information
›
Refer to “Corporate information” and “Contacts” on page 6 of
this report for more information
Financial disclosure principles
We fully support transparency, and consistent and informative
disclosure. We aim to communicate our strategy and results in a
manner that enables stakeholders to gain a good understanding
of how our Group operates, what our growth prospects are, and
the risks that our businesses and our strategy entail. We assess
feedback from analysts and investors on a regular basis and,
where appropriate, reflect this in our disclosures. To continue
achieving these goals, we apply the following principles in our
financial reporting and disclosure:
–
transparency that enhances the understanding of economic
drivers and builds trust and credibility;
–
consistency
within each reporting period and between
reporting periods;
–
simplicity that allows readers to gain a good understanding of
the performance of our businesses;
–
relevance,
by focusing not only on what is required by
regulation or statute but also on what is relevant to our
stakeholders; and
–
best practice that leads to improved standards.
We regard the continuous improvement of our disclosures as
an ongoing commitment.
Financial reporting policies
We report our Group’s results for each financial quarter, including a
breakdown of results by business division and disclosures or key
developments relating to risk management and control, capital,
liquidity and funding management. Each quarter, we publish
quarterly financial reports for UBS Group AG, on the same day as the
earnings releases.
The consolidated financial statements of UBS Group AG and UBS
AG are prepared in accordance with International Financial Reporting
Standards as issued by the International Accounting Standards Board.
›
Refer to “Note
1
Summary of material accounting policies” in the
“Consolidated financial statements” section on page 292 of this
report for more information about the basis of accounting
We are committed to maintaining the transparency of our
reported results and to allowing analysts and investors to make
meaningful comparisons with prior periods. If there is a major
reorganization of our business divisions or if changes to
accounting standards or interpretations lead to a material change
in the Group’s reported results, our results are restated for
previous periods as required by applicable accounting standards.
These restatements show how our results would have been
reported on the new basis and provide clear explanations of all
relevant changes.
US disclosure requirements
As a foreign private issuer, we must file reports and other
information, including
certain financial reports, with the US
Securities and Exchange Commission (the SEC) under the US federal
securities laws. We file an annual report on Form 20-F and furnish
our quarterly financial reports and other material information under
cover of Form 6-K to the SEC. These reports are available at
ubs.com/investors
sec.gov.
An evaluation of the effectiveness of our disclosure controls and
procedures (as defined in Rule 13a–15e) under the US Securities
Exchange Act of 1934 has been carried out, under the supervision
of management, including the Group CEO, the Group CFO and the
Group Controller and Chief Accounting Officer. Based on that
evaluation, the Group CEO and the Group CFO concluded that our
disclosure controls and procedures were effective as of
31 December 2021. No significant changes have been made to our
internal controls or to other factors that could significantly affect
these controls subsequent to the date of their evaluation.
›
Refer to the “Consolidated financial statements” section on page
274 of this report for more information
Compensation

228
Compensation
Julie G. Richardson
Chairperson of the
Compensation Committee
of the Board of Directors
Dear Shareholders,
The Board of Directors (the BoD) and I wish to thank you for your
support once again at last year’s Annual General Meeting (the
AGM) and for sharing your views on our compensation practices
over the past year. As the Chairperson of the Compensation
Committee, I am pleased to present our Compensation Report for
2021.
The arrival of our new CEO in late 2020 and the launch of our
purpose in early 2021 resulted in a review of our Total Reward
Principles and compensation framework to ensure that they are
fully aligned with our purpose and strategic imperatives.
Throughout 2021, the BoD Compensation Committee also
continued to oversee that reward reflects performance, that risk-
taking is appropriate and that employee interests are aligned with
those of our stakeholders. Following these reviews, we applied
selected enhancements to our principles while keeping our overall
compensation framework broadly unchanged, as we concluded
that it still remains well suited to support us in achieving our
ambitions for the Group and that it provides strong alignment
with shareholders’ interests. Nevertheless, we have updated our
G
roup
-
wide performance management approach
,
including
evolving our Group Executive Board (GEB) performance review to
reflect our strategic refresh, digital initiatives and elevated focus
on sustainability.
The restructured approach fosters an even
greater focus on GEB priorities and the success of the overall
Group by assessing all GEB members against Group financial
targets.
Strategy execution
We made significant progress in delivering on our strategic vision
and putting clients at the center of all we do. The benefits of
delivering our ecosystem to clients in a seamless way as One UBS
are visible in our financial performance for 2021.
Our clients continued to put their trust in us, as was evident
from the
ongoing
momentum in flows and volume growth
throughout the year. Together with favorable market conditions
and investor sentiment, this led to growth across the firm. Our
business momentum, our focus on fueling growth and disciplined
execution led to strong financial results.
Sustainability is core to our purpose and ecosystem; to help us
maximize our impact and direct capital to where it is needed most,
we are focusing on three key areas to drive the sustainability
transit
ion:
P
lanet
, People
and
P
artnerships. As a result, our
sustainability focus and impact investing assets grew 78% in 2021
and amounted to USD 251 billion. Furthermore, UBS was again
named as a member of the Dow Jones Sustainability Index and
we are proud to be recognized once again for our industry
leadership in the Environmental dimension.
›
Refer to “Financial and operating performance” in our Annual
Report 2021 for further details about our Group and business
division performance
Alignment to purpose
–
Our purpose articulates why we do what we do, and why it matters. Our culture impacts how we do things, and it is firmly
grounded in our three keys to success: our Pillars, Principles and Behaviors. We refreshed our three keys to success in 2021 to
reflect our purpose, client promise and strategic imperatives, and to help ensure that our culture advances our strategic goals.
–
For the past decade, those keys have defined how we work together and what we stand for, as a firm and as individuals. They
continue to drive daily business decisions and are integrated into our people management processes, including hiring,
performance management, compensation, promotion, talent development, training, and succession planning.
–
Following the launch of the purpose, we reviewed our
Total Reward Principles, performance management approach,
and compensation framework
modest adjustments, no fundamental changes were made to our compensation framework for 2021 as a result of our review.
–
Fair and effective people management processes are key for our long-term success. Our
global performance management
approach
to our year-end review, objective-setting and employee feedback processes that aim to support our strategic priorities, to
reinforce our high performance culture and to be simpler and more transparent. Additionally, our GEB performance review
process includes more tangible measurement on quantitative outcomes and a greater focus on strategy, digitalization and
sustainability matters.
Find out more:
ubs.com/global/en/our-firm/our-purpose
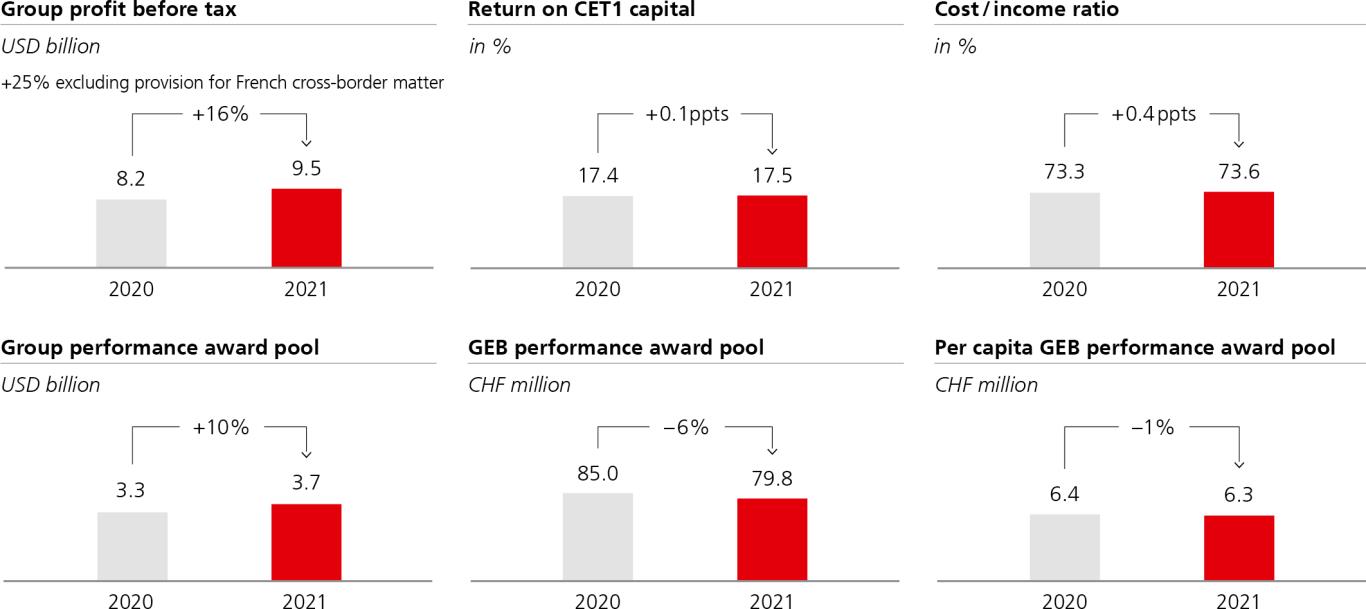

229
Financial performance
In 2021, the ongoing momentum in flows and volume growth
together with favorable market conditions and investor sentiment
led to growth across the firm. Our financial results outperformed
our financial targets and we saw the highest profit before tax
since 2006. This growth outpaces our performance award pool
development. We also maintained our high level of return on
CET1 capital.
Commitment to return capital to shareholders
We remain committed to returning excess capital to our
shareholders. We repurchased USD 2.6 billion of shares in 2021
and we intend to repurchase up to USD 5 billion during 2022. For
2021, the BoD intends to propose a dividend of USD 0.50 per
share for approval at the Annual General Meeting of shareholders
in 2022.
2021 performance award pool
The performance award pool continues to reflect our strict pay-
for
-
performance philosophy
,
our disciplined approach in
managing compensation over business cycles and alignment to
shareholder interests.
The 2021 performance award pool was USD 3.7 billion, an
increase of 10% compared with 2020. It factors in the strong
financial performance, as well as the financial and reputational
impact resulting from the loss related to the default of a US-based
client of our prime brokerage business. The seriousness of this
event led to
a significant downward revision of the Group
performance award pool. As a reminder regarding the French
cross-border matter, in 2019 we reflected this matter in our
compensation decisions, including linking a meaningful portion of
GEB compensation (as well as the Chairman’s compensation) to
the final outcome of this matter which is still not resolved.
Furthermore, our performance award pool decision also
reflected our achievements relative to non-financial objectives,
such as our good progress toward delivering on our sustainability
strategy, as well as the positive total shareholder return (TSR) of
UBS shares. It also reflected other factors, such as the growing
competition to attract and retain a talented and diverse workforce
that continues to deliver on our purpose and strategy.
For 2021, the GEB performance award pool was CHF 79.8
million, a reduction of 1% on a per capita basis and a reduction
of 6% overall. This decrease in an otherwise exceptionally good
financial year contrasts with the Group pool increase of 10%. The
decision for the GEB pool considers the excellent financial result
offset by a proportionally larger downward adjustment than the
Group pool to reflect the accountability of the GEB for the loss
resulting from the default of a US-based client of our prime
brokerage business.
›
Refer to the “2021 key compensation themes” section of this
report for more information about the compensation impact
resulting from the significant loss event, the French cross-border
matter, environmental, social and governance (ESG)
achievements, and other key compensation themes
›
Refer to the “Group compensation” section of this report for
more information
2022 Annual General Meeting
At the 2022 AGM on 6 April, we will seek your support on the
following compensation-related items:
–
the maximum aggregate amount of compensation for the BoD
for the period from the 2022 AGM to the 2023 AGM;
–
the maximum aggregate amount of fixed compensation for
the GEB for 2023;
–
the aggregate amount of variable compensation for the GEB
for 2021; and
–
shareholder endorsement in an advisory vote for this
Compensation Report.
On behalf of the Compensation Committee and the BoD, I
thank you again for your feedback and we respectfully ask for
your continued support at the upcoming AGM.
Julie G. Richardson
Chairperson of the Compensation Committee of the
Board of Directors
Advisory vote
Corporate governance and compensation | Compensation
230
2021 key compensation themes
The feedback we seek from our shareholders on compensation-
related topics is very important to us, as we are committed to
maintaining a strong link between the interests of our employees
and those of our shareholders. We continued engaging with
shareholders during 2021 and received overall positive feedback
about our compensation framework.
The text below summarizes key compensation themes for 2021
and provides answers to the questions we most frequently receive
from shareholders.
Summary of 2021 key compensation themes / responses to frequently asked questions
How was the loss resulting from the default of a US-based
client of our prime brokerage business reflected in the
compensation process?
Despite our excellent financial performance in 2021, our
reputation and financial results were negatively impacted by a
significant USD 861 million pre-tax loss that we incurred in the
first half of 2021 related to the default of a US-based client of our
prime brokerage business.
We conducted a thorough review of the event and its root
causes, and took decisive actions reflecting the significance of the
event and its impact on our shareholders and reputation. The
outcomes of the review and the actions taken by management
were reviewed by the Joint Risk and Compensation Committees,
as well as other internal governance bodies, as appropriate.
The 2021 Group performance award pool was reduced
significantly as a consequence of this event. Our funding
approach for the performance award pool resulted in a direct and
substantial reduction, which was supplemented by an additional
and significant negative adjustment to the pool. Overall,
compensation was reduced by an amount equivalent to over half
of the post-tax loss. This reduction had a direct impact on
compensation for business and control functions, as well as for
the Group Executive Board (the GEB).
The GEB performance award pool had a proportionally larger
downward adjustment than the Group pool
,
to reflect the
accountability of the GEB for the event. The GEB per-capita
performance pool decreased in an otherwise exceptionally good
financial year.
On an individual level, we conducted a detailed accountability
review of employees involved in the event. The fact-finding for
the review was supported by external legal counsel, as well as our
internal investigation functions. The accountability review covered
30 employees, including relevant individuals in the GEB. The
outcomes of the review impacted performance reviews and
compensation decisions substantially, where appropriate.
How do the refreshed financial targets announced in
February 2022 impact compensation?
The compensation decisions for 2021 reflect the achievements
relative to the 2021 objectives that were set in early 2021 and
consider the previous externally communicated targets. Similarly,
we have set objectives for 2022 that consider the refreshed
targets as communicated in February 2022.
In addition, for our Long-Term Incentive Plan (LTIP) awards for
2021 performance, we have reviewed the three-year average
return on common equity tier 1 (RoCET1) performance metric to
reflect our strategic return ambitions, our revised financial targets
and cost of capital.
Specifically, for our awards granted in early 2022 for 2021
performance, the required performance threshold for the
minimum payout has been raised to 8%, from 6% in prior-year
awards, to reflect our new financial targets. The required RoCET1
performance for a maximum payout is set at 18%, which
represents the upper end of our target range. The raised threshold
also increases the mid-point of the payout thresholds to better
reflect our cost of capital. The linear payout design between
threshold and maximum level supports our growth ambitions and
our focus on delivering sustainable performance without
encouraging excessive risk-taking.
231
How does UBS support diversity and pay fairness?
Ensuring fair treatment and strengthening our commitment to
diversity, equity and inclusion (DE&I) are vital to our sustainable
business success. We find diverse teams better understand and
relate to the needs of our equally diverse clients. Through the
diversity of our employees’ backgrounds and experiences, we
drive innovation and better decision making.
Gender diversity is a key priority for the firm. We are
particularly focused on increasing the representation of women at
senior management levels. We take a multi-pronged approach in
this respect, analyzing and adapting various factors that support
the hiring, development and retention of women at all levels.
Increasing the ethnic minority diversity of our workforce, and
a related commitment to support underrepresented talent and
communities, is also a top priority across all business divisions and
regions. We focus on four areas: accountability and transparency;
investing in our talent; improving our culture; and leveraging our
business strengths in underrepresented communities.
Compensating employees fairly and consistently is key to
ensuring equal opportunities. We pay for performance, and we
take pay equity seriously. A strong commitment to both is
embedded
in our compensation policies, and we
regularly
conduct both internal reviews and independent external audits as
quality checks.
Additionally, these reviews also allow us to
maintain our certification status from
the EQUAL
-
SALARY
Foundation for our equal pay practices in Switzerland, the US, the
UK, Hong Kong SAR and Singapore.
How is litigation considered in the compensation process?
Litigation and regulatory matters, and their resolution and
remediation, are taken into consideration throughout the
compensation decision-making process. The Compensation
Committee distinguishes between current matters, where the
underlying issues are within the responsibility of management,
and legacy matters, where management is accountable for
resolving them but not responsible for the underlying issue.
Current matters have a direct impact on the performance
award pool, individual performance assessments and resulting
compensation decisions, as well as the payout of deferred awards.
For legacy matters, the Compensation Committee seeks to
incentivize management to resolve these matters in the best
interest of shareholders and we hold management accountable
for the effective and efficient resolution of these matters.
Therefore, the performance and compensation assessment
reflects management’s responsibility for achieving a resolution
without creating an incentive to settle inappropriately or take
excessive risks on such matters. In addition, the use of RoCET1,
which includes both current and legacy matters, in our
performance assessment for GEB performance, as well as the LTIP
design, supports the focus on ensuring the cost of litigation
matters has in our compensation plans a direct impact on the
compensation awarded to and realized by our most senior
leaders, including the GEB.
What progress has been made on resolving the French
cross-border matter and how is this reflected in GEB
compensation?
In December 2021, UBS filed an appeal with the French Supreme
Court regarding the decision of the Court of Appeal relating to
the French cross-border matter. This matter remains ongoing and
was considered in the decision-making process for our 2021
performance award pool.
The use of the RoCET1 metric aims to ensure the cost of
litigation matters, including the French cross-border matter, has
an ongoing and direct impact on the compensation awarded and
realized
by our most senior leaders, including the GEB.
Additionally, when determining the 2019 performance award
pool, the impact of the French
cross
-
border
matter
was
considered in our decision making.
Furthermore, as outlined in our 2019 Compensation Report,
up to CHF 7.9 million, or 30%, of the 2019 LTIP awards at grant
for GEB members active in March 2017, as well as the Chairman
of the BoD’s unvested share award, continues to be at risk and
directly linked to the final resolution of the French cross-border
matter. In addition, a malus clause allows the Compensation
Committee to assess any new information that becomes available
in the future and to retrospectively reduce the 2019 LTIP award by
up to the full amount if such new information would have
impacted our compensation decision in 2
019.
This matter
continues to be ongoing and, once resolved, the final outcome
will be reflected in the final amounts delivered to relevant current
and former employees.
Impact of litigation matters on the LTIP
Advisory vote
Corporate governance and compensation | Compensation
232
How is ESG considered in the compensation process?
ESG objectives are considered in the compensation determination
process in objective setting, performance award pool funding,
performance evaluation and compensation decisions.
ESG-related objectives have been embedded in our Pillars and
Principles since they were established in 2011. In 2021, we revised
the Group CEO and GEB scorecards and further enhanced the link
between ESG and compensation by introducing explicit
sustainability objectives under “Strategic & Growth” in the non-
financial goal category. These sustainability objectives are linked
to our priorities, and their progress is measured via robust
quantitative
metrics
and qualitative
criteria
. Sustainability
objectives are individually assessed for each GEB member, and
consequently directly impact their performance assessments and
compensation decisions.
In addition, in the performance award pool funding across the
Group, ESG is also reflected through an assessment of progress
made toward targets linked to our focus areas of Planet, People
(including progress made toward our diversity ambitions) and
Partnerships, alongside other key dimensions.
Therefore ESG is taken into consideration when the
Compensation Committee assesses not only what results were
achieved but also how they were achieved.
For 2021, we established robust and concrete targets, and
made good progress toward achieving them. We continue to
increase our focus on this topic.
›
Refer to “Environmental, Social and Governance considerations”
in the “Compensation philosophy and governance” section of
this report for more information
How does UBS promote and support the health and well-
being of employees?
Supporting employee health and well-being remained a priority in
2021. We are committed to helping employees thrive in their
current roles and deliver sustainable performance over time.
Regular “pulse” surveys gauged employees’ views on remote
work, stress, communication and other aspects. Resources to
support holistic well-being featured a bespoke eLearning
curriculum, physical and mental health initiatives, volunteering
opportunities, increased certain local benefits offerings, and
financial education events.
›
Refer to the Sustainability Report 2021, available from 11 March
2022 under “Annual reporting” at
ubs.com/investors
, for more
information
How does UBS respond to the increasing competition for
talent?
We continue to see increasing competition for talent. These
pressures come from our direct competit
ors
but also other
organizations including technology, consulting and new entrants
or disruptors, such as fintech firms. As a recognized employer of
choice, we continue to broaden and deepen our talent pools
through ongoing talent development and continued investment
in our employees. We take careful consideration to reflect pay for
performance and competitive pay in our decision making.
Furthermore, as our compensation approach includes substantial
deferral, we balance incentivizing performance with retention in
order to promote a sustainable workforce.
233
Say-on-pay
Say-on-pay votes at the AGM
In line with the Swiss Ordinance against Excessive Compensation
in Listed Stock Corporations, we seek binding shareholder
approval for the aggregate compensation awarded to the GEB
and the BoD. Prospective approval of the fixed compensation of
the BoD and GEB provides the firm and its governing bodies with
the certainty
needed
to operate
effectively.
R
etrospective
approval of the GEB’s variable compensation aligns their
compensation with performance and contribution.
These binding votes on compensation and the advisory vote on
our compensation report reflect our commitment to shareholders
having their say on pay.
›
Refer to “Provisions of the Articles of Association related to
compensation” in the “Supplemental information” section of
this report for more information
Audited |
Approved fixed compensation
At the 2020 AGM, shareholders approved a maximum aggregate
fixed compensation amount of CHF 33.0 million for GEB
members for the 2021 performance year. This budget reflects
base salaries, role-based allowances in response to EU Capital
Requirements Directive IV, and estimated standard contributions
to retirement benefit plans, as well as other benefits.
Our expenses related to fixed compensation for our continuing
GEB members were within the budget; however, the amount of
fixed compensation related to the hiring of Barbara Levi as new
Group General Counsel resulted in exceeding this budget.
Therefore, as authorized by article 46 para. 5 of our Articles of
Association, an amount of CHF 2.2 million was used to pay the
portion of her fixed compensation (including replacement awards)
that exceeded the approved amount.
p
›
Refer to “2021 total compensation for the GEB members” in the
“Compensation for GEB members” section of this report
Say on pay – compensation-related votes at the 2021 AGM
2021 AGM say-on-pay voting schemes
2021 AGM actual shareholder votes
Vote “for”
Binding vote on GEB variable compensation
Shareholders approved CHF 85,000,000 for the 2020 financial year
1,2,3
84.8%
Binding vote on GEB fixed compensation
Shareholders approved CHF 33,000,000 for the 2022 financial year
1,2,3
91.8%
Binding vote on BoD compensation
Shareholders approved CHF 13,000,000 for the period from the 2021 AGM
to the 2022 AGM
1,2,4
91.1%
Advisory vote on the Compensation Report
Shareholders approved the UBS Group AG Compensation Report 2020 in an advisory vote
85.7%
1
2
portion related to the legally required employer’s social security contributions.
3
in office on 31 December 2021 and thirteen GEB members on 31 December 2020.
4
Advisory vote
Corporate governance and compensation | Compensation
234
Compensation-related proposals for 2022
At the 2022 AGM, we will ask our shareholders to vote on the
variable compensation for the GEB for 2021, the fixed
compensation for the GEB for 2023 and the compensation for the
BoD from the 2022 AGM to the 2023 AGM.
In
addition, we will also ask shareholders for an advisory vote
on our Compensation Report, which describes our compensation
policy, including framework and governance.
The table
below
outlines our compensation proposals,
including supporting rationales, that we plan to submit to the
2022 AGM for binding votes (in line with the Swiss Ordinance
against Excessive Compensation in Listed Stock Corporations and
our Articles of Association (AoA)).
Compensation-related proposals for binding votes at the 2022 AGM
Item
Proposal
Rationale
GEB variable
compensation
The Board of Directors proposes an
aggregate amount of variable
compensation of CHF 79,750,000
for the members of the GEB for the
2021 financial year.
The proposed amount reflects a reduction of 1% on a per capita basis and a reduction of 6%
overall compared with the previous year. This decrease in an otherwise exceptionally good financial
year contrasts with the Group pool increase of 10%. The decision for the GEB pool considers the
excellent financial result offset by a proportionally larger downward adjustment than the Group
pool to reflect the accountability of the GEB for the loss resulting from the default of a US-based
client of our prime brokerage business.
GEB fixed
compensation
The Board of Directors proposes a
maximum aggregate amount of
fixed compensation of
CHF 33,000,000 for the members
of the GEB for the 2023 financial
year.
The proposed amount is unchanged from the previous year, reflecting consistency in planning over
time and unchanged base salaries for the Group CEO and other GEB members. In addition to the
base salaries, it also includes role-based allowances in response to EU Capital Requirements
Directive IV, estimated standard contributions to retirement benefit plans, and other benefits. The
proposed amount provides flexibility in light of potential changes of GEB composition or roles,
competitive considerations where potential additional role-based allowances may be required, and
other factors (e.g., changes in FX rates or benefits).
BoD
compensation
The Board of Directors proposes a
maximum aggregate amount of
compensation of CHF 13,000,000
for the members of the Board of
Directors for the period from the
2022 AGM to the 2023 AGM.
The proposed amount is unchanged compared with the previous period and includes the total
compensation of the nominated Chairman and Vice Chairman. For the new Chairman we expect
his total compensation would be approximately CHF 0.4 million lower compared with the current
Chairman (a reduction of approximately 8%). The fees for BoD members other than the nominated
Chairman and Vice Chairman are unchanged.
235
Compensation philosophy and governance
Our compensation philosophy
Total Reward Principles
Our Total Reward Principles provide a strong link to our strategic
imperatives and encourage employees to live our strong and
inclusive culture that is grounded in our three keys to success: our
Pillars, Principles and Behaviors.
These guiding principles underpin our approach to
compensation and define our compensation framework. In 2021,
following the launch of our purpose, we reviewed our Total
Reward Principles and compensation framework to confirm they
are fully aligned with our purpose and support our strategic
imperatives.
This ensures that the interests of our employees are aligned
with those of our clients and other stakeholders.
Therefore, our compensation approach supports our capital
strength and risk management, and provides for simplification
and efficiency. It
encourages employees to focus on client
centricity, connectivity and sustainable impact in everything we
do. Moreover, we reward behaviors that help build and protect
the firm’s reputation, specifically accountability with integrity,
collaboration and innovation. Compensation for each employee
is based on individual, team, business division and Group
performance, within the context of the markets in which we
operate.
Total Reward Principles
Our Total Reward Principles apply to all employees globally, but vary in certain locations according to local legal requirements and
regulations and practices. The table below provides a summary of our Total Reward Principles.
Support our purpose and strategy
Our compensation approach supports the firm’s purpose and strategy, fosters engagement among
employees and aligns their long-term interests with those of clients and stakeholders.
Attract, retain and connect a diverse, talented
workforce
We embrace a culture of diversity, equity, and inclusiveness. Pay at UBS is fair, reflects equal
treatment and is competitive. In this way, our investment in a connected workforce supports the
sustainability of the organization.
Apply a pay-for-performance approach to
support development and our ways of working
The setting of clear objectives and a thorough evaluation of what was achieved and how it was
achieved, combined with effective communication, promote clarity, accountability and establish a
strong link between pay and performance. This approach emphasizes our Behaviors, which are
accountability with integrity, collaboration and innovation.
Reinforce sustainable growth and support long-
term value creation
Compensation is appropriately balanced between fixed and variable elements and delivered over an
appropriate period to support our growth ambitions and sustainable performance.
Support risk awareness and appropriate risk-
taking
Our compensation structure encourages employees to have a focus on risk management and behave
consistently with the firm’s risk framework and appetite, thereby anticipating and managing risks
effectively to protect our capital and reputation.
Our Total Reward approach
At UBS, we apply a holistic Total Reward approach, generally
consist
ing
of fixed compensation (base salary and role
-
b
a
sed
allowances, if applicable), performance awards
,
pension
contributions and benefits.
Our Total Reward approach is
structured to support sustainable results and growth ambitions.
For employees whose total compensation exceeds certain
levels, performance awards are delivered in a combination of
cash, deferred contingent capital awards and deferred share-
based awards.
A substantial portion of performance award s is deferred and
vests over a five-year period (or longer for certain regulated
employees). This deferral approach supports alignment of
employee and investor interests, our capital base and the creation
of sustainable shareholder value.
›
Refer to “Compensation elements for all employees” in the
“Group compensation” section of this report for more
information
Advisory vote
Corporate governance and compensation | Compensation
236
Compensation governance
Board of Directors and Compensation Committee
The BoD is ultimately responsible for approving the compensation
strategy
and principles
proposed by the Compensation
Committee, which determines compensation-related matters in
line with the principles set forth in the AoA.
As determined in the AoA and the firm’s Organization
Regulations, the Compensation Committee supports the BoD
with its duties to set guidelines on compensation and benefits, to
oversee implementation thereof,
to approve certain
compensation and to scrutinize executive compensation. The
Compensation Committee consist
s
of independent BoD
members, who are elected annually by shareholders at the AGM,
and is responsible for governance and oversight of our
compensation process and practices. This includes the alignment
between pay and performance, and ensuring
that the
compensation framework supports appropriate risk awareness
and management, as well as appropriate risk-taking. In 2021, to
additionally support the connection between the Compensation
Committee and the Risk Committee, the Compensation
Committee Chair
person
was also a member of the Risk
Committee.
A
nnual
ly,
and on behalf of the BoD, the Compensation
Committee:
–
reviews our Total Reward Principles;
–
approves key features of the compensation framework and
plans for the non-independent Board members and GEB
members;
–
reviews performance award funding throughout the year and
proposes, upon proposal of the Group CEO, the final annual
Group performance award pool for BoD approval;
–
upon proposal of the Group CEO, reviews the performance
framework of the other GEB members;
–
upon proposal of the Group CEO, proposes the performance
assessments and the individual total compensation for the
other GEB members for approval by the BoD;
–
upon proposal of the Chairman, proposes financial and non-
financial performance targets and objectives for the Group
CEO and the Group CEO’s performance assessment for
approval by the Board;
–
approves the total compensation for the Chairman and the
non-independent Board members;
–
proposes, upon proposal of the Chairman, the total
compensation for the Group CEO for approval by the Board;
–
proposes to the BoD the maximum aggregate amounts of BoD
compensation and GEB fixed compensation and the aggregate
amount of variable compensation for the GEB for approval by
the general meeting of the shareholders;
–
upon proposal of the Chairman, proposes the remuneration /
fee framework for independent Board members for approval
by the Board;
–
upon proposal of the Chairman and Group CEO, approves the
remuneration / fee frameworks for external supervisory board
members of Significant Group Entities and be informed of
remuneration / fee frameworks for external supervisory board
members of Significant Regional Entities; and
–
proposes to the BoD for approval the annual compensation
report and approves other material public disclosures on UBS
compensation matters.
The Compensation Committee is required to meet at least four
times each year. All meetings in 2021 were held in the presence
of the Chairman and the Group CEO and most were attended by
external advisors. Individuals, including the Chairman and the
Group CEO, are not permitted to attend a meeting or participate
in a discussion on their own performance and compensation.
After the meetings, the Chairperson of the Compensation
Committee reports to the BoD on the Compensation Committee’s
activities and discussions and, if necessary, submits proposals for
approval by the full BoD. Compensation Committee meeting
minutes are also sent to all members of the BoD.
On 31 December 2021, the members of the Compensation
Committee were
Julie G. Richardson (Chair
person
), Reto
Francioni, Dieter Wemmer and Jeanette Wong.
›
Refer to “Board of Directors” in the “Corporate governance”
section of our Annual Report 2021 for more information
External advisors
The Compensation Committee may retain external advisors to
support it in fulfilling its duties. In 2021, HCM International Ltd.
(HCM) provided independent advice on compensation matters.
HCM holds no other mandates with UBS. Additionally, Willis
Towers Watson provided the Compensation Committee with data
on market trends and pay levels. Various subsidiaries of Willis
Towers Watson provide similar information to Human Resources
in relation to compensation for employees. Willis Towers Watson
holds no other compensation-related mandates with UBS.
The Risk Committee’s role in compensation
The Risk Committee, a committee of the BoD, works closely with
the Compensation Committee to ensure that our compensation
framework appropriately
reflects risk
awareness
and
management, and ensures appropriate risk-taking. It supervises
and sets appropriate risk management and risk control principles
and
is
regular
ly
brief
ed
on how risk is factored into the
compensation process. It also monitors the involvement of Group
Risk Con
trol and Compliance and Operational Risk
in
compensation and reviews risk-related aspects of the
compensation process.
›
Refer to
ubs.com/governance
237
Compensation Committee 2021 / 2022 key activities and timeline
May
June
July
Sept
Oct
Nov¹
Dec¹
Jan
Feb
Strategy, policy and governance
Total Reward Principles
l
Sustainability / ESG in the compensation process
l
l
l
Compensation disclosure and stakeholder communication matters
l
l
l
l
l
AGM reward-related items
l
l
Compensation Committee governance
l
Annual compensation review
Accruals and full-year forecast of the performance award pool funding
l
l
l
l
l
l
Performance targets and performance assessment of the Group CEO and GEB members
l
l
l
Group CEO and GEB members’ salaries and individual performance awards
l
l
l
Update on market practice, trends and peer group matters
l
l
l
Pay for performance, including governance on certain higher-paid employees, and
non-standard compensation arrangements
l
l
l
l
l
l
l
Board of Directors remuneration
l
l
Compensation framework
Compensation framework and deferred compensation matters
l
l
l
l
l
Risk and regulatory
Risk management in the compensation approach and joint meeting with
BoD Risk Committee
l
l
l
l
l
Regulatory activities impacting employees and engagement with regulators
l
l
l
l
l
l
l
l
1
The Compensation Committee held two meetings in November 2021 and three meetings in December 2021.
Compensation governance
The table below provides an overview of compensation governance by specific role.
Recipients
Compensation recommendations proposed by
Approved by
Chairman of the BoD
Chairperson of the Compensation Committee
Compensation Committee
1
Independent BoD members
(remuneration / fee framework)
Compensation Committee and Chairman of the BoD
BoD
1
Group CEO
Compensation Committee and Chairman of the BoD
BoD
1
Other GEB members
Compensation Committee and Group CEO
BoD
1
Key Risk Takers (KRTs) /
senior employees
Respective GEB member and functional management
team
Individual compensation for KRTs and senior employees:
Group CEO
1
Advisory vote
Corporate governance and compensation | Compensation
238
Environmental, Social and Governance considerations
ESG in the compensation determination process
ESG objectives are considered in the compensation determination
process in objective setting, performance award pool funding,
performance evaluation and compensation decisions.
ESG-related objectives have been embedded in our Pillars and
Principles since they were established in 2011. In 2021, we revised
the Group CEO and GEB scorecards and further enhanced the link
between ESG and compensation by introducing explicit
sustainability objectives under “Strategic & Growth” in the non-
financial goal category. These sustainability objectives are linked
to our
priorities
, and their progress
is measured via robust
quantitative metrics and qualitative criteria. The table below
provides an overview of our metrics and progress achieved in
2021. Sustainability objectives are individually assessed for each
GEB member, and consequently directly impact their performance
assessments and compensation decisions.
In addition, in the performance award pool funding across the
Group, ESG is also reflected through an assessment of progress
made against targets linked to our focus areas of Planet, People
(including progress made against our diversity ambitions) and
Partnerships, alongside other key dimensions. Therefore ESG is
taken into consideration when the Compensation Committee
assesses not only what results were achieved but also how they
were achieved.
For 2021, we established robust and concrete targets, and
made good progress toward achieving them. We continue to
increase our focus on this topic.
›
Refer to “GEB performance assessments“ in the “Compensation
for GEB members” section of this report for more information
about the GEB performance measurement process
›
Refer to “Our focus on sustainability and climate,” “Employees”
and “Society” in the “How we create value for our stakeholders”
section of our Annual Report 2021 for more information
›
Refer to
ubs.com/gri
topics
Fair pay and pay for performance
Compensating employees fairly and consistently is key to ensuring
equal opportunities. We pay for performance, and we take pay
equity seriously. A strong commitment to both is embedded in our
compensation policies, and we conduct both internal reviews and
independent external audits as quality checks. If we uncover gaps
that c
annot be explained by business factors
or
appropriate
personal factors
–
such as experience, role, responsibility,
performance or location – we explore the root causes of those gaps
and address them.
Additionally, our regular monitoring and review processes also
allow us to maintain our certification status with the EQUAL-
SALARY Foundation for our equal pay practices in Switzerland, the
US, the UK, Hong Kong SAR and Singapore.
The firm also
successfully completed an equal pay analysis in Switzerland in 2020,
as required by the Swiss Federal Act on Gender Equality. The results
of the analysis confirmed that we are fully compliant with Swiss
equal pay standards. These holistic certifications are a testament to
our well
-
established equal opportunity environment
and the
strength of our human resources practices, including performance
and reward. In 2021, we continued to monitor pay fairness and
addressed any unexplained gaps to ensure that all employees are
paid fairly.


239
Our targets and progress
Our priorities
Our targets
Our progress in 2021
Planet,
people,
partnerships
USD 400 billion invested assets in sustainable investments
by 2025.
Increased invested assets in sustainable investments to
USD 251 billion (compared with USD 141 billion in 2020).
Planet
Set decarbonization targets for 2030 for financing of the
fossil fuels, power generation and real estate sectors (from
2020 levels):
–
reduce absolute financed emissions associated with UBS
loans to fossil fuel companies by 71%;
–
reduce emissions intensity associated with UBS loans to
power generation companies by 49%;
–
reduce emissions intensity of UBS’s commercial real
estate lending portfolio by 44%; and
–
reduce emissions intensity of UBS’s residential real estate
lending portfolio by 42%.
Estimated baselines and development of net-zero-aligned
pathways for the fossil fuel, power generation and real
estate (commercial and residential) sectors.
Align USD 235 billion of invested assets to net zero by
2030 (Asset Management).
Established Asset Management baseline covering the
weighted average carbon intensity of the respective
benchmark for each strategy and fund included in our
target.
Achieve net-zero emissions across discretionary client
portfolios by 2050.
Expanded discretionary offering with climate transition-
focused solutions and built more detailed carbon footprint
data into our research and reporting toolkits.
Achieve net-zero energy emissions resulting from our own
operations (scope 1 and 2) by 2025; cut energy
consumption by 15% by 2025 (compared with 2020).
Reduced net greenhouse gas footprint for scope 1 and 2
emissions by 75% and energy consumption by 5%
(compared with 2020); continued implementation of the
replacement of fossil fuel heating systems and investing in
credible carbon removal projects; maintained 100%
renewable electricity coverage.
Offset historical emissions back to the year 2000 by
sourcing carbon offsets (by end 2021) and by offsetting
credit delivery and full retirement in registry (by end 2025).
Completed the sourcing process for a portfolio of
transparent carbon offsets from the voluntary carbon
market across a range of project types and geographies.
Engage with key vendors on targeting net zero by 2035.
Commenced working on understanding and quantifying
the scope 3 emissions in our supply chain.
People
30% global female representation at Director level and
above by 2025.
Increased to 26.7% (2020: 26.0%) female representation
at Director level and above.
26% US ethnic minority representation at Director level
and above by 2025.
Increased to 20.1% (2020: 19.5%) ethnic minority
representation at Director level and above in the US.
26% UK ethnic minority representation at Director level
and above by 2025.
Increased to 21.3% (2020: 20.7%) ethnic minority
representation at Director level and above in the UK.
Raise USD 1 billion in donations to our client philanthropy
foundations and funds and reach 25 million beneficiaries
by 2025 (cumulative for years 2021-2025).
Achieved UBS Optimus Foundation donations volume of
USD 161 million (including UBS matching contributions)
and reached 4.6 million beneficiaries.
Support one million beneficiaries through our community
impact activities by 2025 (cumulative for years 2020-
2024).
Reached 1.199 million beneficiaries through strategic
community impact activities cumulatively during 2020 and
2021, surpassing our 2025 target in two years.
Partnerships
Establish UBS as a leading facilitator of discussion, debate
and idea generation.
Launched the UBS Sustainability and Impact Institute, with
the objective of delivering original, best-in-class
sustainability and impact thought leadership.
Drive standards, research and development, and product
development through partnerships across the financial
ecosystem.
Continued implementation of the Principles for
Responsible Banking by expanding the scope of our
impact analyses and improving upon our existing
methodologies in partnership with the UN Environment
Program and peers.
›
Refer to the Sustainability Report 2021, available from 11 March 2022 under “Annual reporting“ at
ubs.com/investor
s, for more
information
Advisory vote
Corporate governance and compensation | Compensation
240
Our commitment to diversity, equity and inclusion
Ensuring fair treatment and strengthening our commitment to
DE&I are vital to our sustainable business success. We find diverse
teams better understand and relate to the needs of our equally
diverse clients. Through the diversity of our employees’
backgrounds and experiences, we drive innovation and better
decision making. Our aim, therefore, is to shape a diverse and
inclusive organization that is innovative, provides outstanding
service to our clients and offers equitable opportunities so that
every employee can thrive.
UBS is a strong supporter of the UN Standards of Conduct for
Business anti-discrimination guidelines. Additionally, we are
signatories to the UN-backed Women’s Empowerment Principles,
the UK’s Women in Finance Charter and Race at Work Charter,
and the Corporate Call to Action in the US. Philosophically, we
take a broad approach to DE&I, focusing on a range of aspects,
including inclusive leadership, age, gender, race and ethnicity,
LGBTQ+, disability, and veterans. Building inclusive leadership
skills, increasing gender and ethnic diversity, and equitable policies
and practices were our leading priorities in 2021.
Gender diversity is a key priority for the firm. We are particularly
focused on increasing the representation of women at senior
management levels. We take a multi-pronged approach in this
respect, analyzing and adapting various factors that support the
hiring, development and retention of women at all levels. For
example, our interviews for open roles are expected to include
qualified diverse candidates, and our interview questions seek to
gauge inclusive leadership competencies for executive roles.
To ensure we are making progress, we hold ourselves and our
leaders accountable. For example, in early 2020 we publicly stated
our aspiration to have 30% of all Director and above roles held by
women by 2025. At the end of 2021, that figure stood at 26.7%,
up from 26.0% in 2020. As of 31 December 2021, 25% of GEB
members were female and we expect to increase this ratio to 33%
in early 2022 after the designated Group Chief Financial Officer
joins the firm. In addition, 27% of senior managers who reported
directly to the Group Executive Board (the GEB) in 2021 were
female. These aspirations are considered in the determination of
the annual performance award pool and are included in the
explicit sustainability objectives under “Strategic & Growth” for
the GEB, as outlined in the table on the previous page.
Increasing the ethnic minority diversity of our workforce, and
a related commitment to support underrepresented talent and
communities, is also a top priority across all business divisions and
regions. We focus on four areas: accountability and transparency;
investing in our talent; improving our culture; and leveraging our
business strengths in underrepresented communities.
We take a country-by-country approach, in close collaboration
with relevant business and jurisdictional entities. This is because
legislation, legal requirements and progress toward racial and
ethnic equality vary significantly across the locations in which we
do business. In the short term, the largest share of our efforts is
focused on Switzerland, the US and the UK. In Switzerland, we
began collecting ethnicity data on a voluntary basis in 2021,
aimed at understanding the current representation within our
local workforce. Our 2025 aspiration is to achieve a 26%
representation of ethnic minorities at Director level and above in
the UK and the US. As of the end of 2021, our representation was
20.1% in the US and 21.3% in the UK.
Our employee networks are strong partners in our ethnic
diversity strategy. Throughout 2021, our ethnicity-focused
MOSAIC networks globally facilitated numerous events for staff
in every region to increase awareness and personal accountability
along with specialized educational sessions for network members.
In addition, a community of more than 480 Diversity and Inclusion
Ambassadors acts as a resource for employee advice and coaching
on conversations about various diversity and inclusion-related
topics.
We are committed to ensuring a workplace where employees
are fairly treated, with equitable employment and advancement
opportunities for all. We do not tolerate harassment of any kind,
including sexual harassment, and we take measures to prevent all
forms of harassment, bullying, victimization and retaliation. Our
policies, procedures, employee and line manager education, and
awareness materials all encourage employees to raise concerns,
which they may do openly or anonymously. An internal anti-
harassment officer appointed by the Group Head Human
Resources provides an independent view of the firm’s various
processes and procedures to prevent harassment and sexual
misconduct.
›
Refer to
ubs.com/diversity
priorities, commitments and progress, and the Sustainability
Report 2021, available from 11 March 2022 under “Annual
reporting” at
ubs.com/investors
, for our management practices
and detailed employee data, including gender- and region-
specific data
›
Refer to ”Employees” in the ”How we create value for our
stakeholders” section of our Annual Report 2021 for more
information.
241
Performance award pool funding
Our compensation philosophy focuses on balancing performance
with appropriate risk-taking, retaining talented employees and
shareholder returns. Our overall performance award pool funding
percentage reduces as financial performance increases. In years of
strong
financial
performance
,
this prevents excessive
compensation and results in an increased proportion of profit
before performance awards being available for distribution to
shareholders or growing the Group’s capital. In years where
performance declines, the performance award pool will generally
decrease; however, the funding percentage may increase.
Our performance award pool funding framework is based on
Group and business division performance, including achievements
against defined performance measures. In assessing performance,
we also consider industry peers, market competitiveness of our
results and pay position, as well as progress against our strategic
objectives, including
returns, risk
-
weighted assets and cost
efficiency. The Risk and Compliance functions support our holistic
reflection and consideration of the financial and non-financial
impact (including reputation) of risk matters. We further consider
the firm’s risk profile and culture, the extent to which operational
risks and audit issues have been identified and resolved, and the
success of risk reduction initiatives including significant events.
The funding for Group Functions is linked to overall Group
performance and reflects headcount, workforce location and
demographics. For each functional area quantitative and
qualitative assessments evaluate service quality, risk management
and financial achievements.
O
ur decision
s also
balance
consideration of financial performance with a range of factors,
including DE&I and other ESG metrics, the impact of litigation,
regulatory costs, the effect of changes in financial accounting
standards, capital returns, and relative total shareholder return.
Before making its final proposal to the BoD, the Compensation
Committee considers the CEO’s proposals and can apply a positive
or negative adjustment to the performance award pool.
For
example, despite our excellent financial results in 2021, our
reputation and financial results were negatively impacted by a loss
related to the default of a US-based client of our prime brokerage
business. As a consequence, the 2021 Group performance award
pool was reduced significantly. Our funding approach for the
performance award pool resulted in a direct and substantial
reduction, which was supplemented by a significant negative
adjustment to the pool.
Taking into consideration the above proposals and factors, over
the past nine years the Compensation Committee has approved
adjustments to the performance award pool, resulting in
downward adjustments in all but one year.
›
Refer to “2021 Group performance outcomes” in the “Group
compensation” section of this report
›
Refer to the “Group performance” section of our Annual Report
2021 for more information about our results
Advisory vote
Corporate governance and compensation | Compensation
242
Performance award pool funding process – illustrative overview
243
Compensation for GEB members
GEB compensation framework
In 2021, we made no changes to our GEB compensation
framework.
The
chart below illustrat
es the compensation
elements, pay mix and key features for GEB members. Of the
annual performance award, 20% is paid in the form of cash and
80% is deferred over a period of five years
1
, with 50% of the
annual performance awards granted under the Long-Term
Incentive Plan (the LTIP) and 30% under the Deferred Contingent
Capital Plan (the DCCP).
›
Refer to “Our deferred compensation plans” in the “Group
compensation” section of this report for more information
2021 compensation framework for GEB members (illustrative example)
›
Refer to the “Group Compensation” section of this report for more information
›
Refer to “Regulated staff” in the “Supplemental information” section of this report for more information
Pay-for-performance safeguards for GEB members
Performance
award caps
–
Cap on the total GEB performance award pool (2.5% of profit before tax)
1
–
Caps on individual performance awards (for the Group CEO capped at five times the fixed compensation and at seven times for the other
GEB members)
–
Cap of 20% of performance award in cash
Delivery and
deferral
–
80% of performance awards are at risk of forfeiture
–
Long-term deferral over five years (or longer for certain regulated GEB members)
–
Alignment with shareholders (through the LTIP) and bondholders (through the DCCP)
–
Final payout of equity-based LTIP award (50% of performance award) subject to absolute and relative performance conditions (three-year
performance period)
Contract
terms
–
No severance terms
–
Six-month notice period
Other
safeguards
–
Share ownership requirements
–
No hedging allowed
1
Advisory vote
Corporate governance and compensation | Compensation
244
GEB share ownership requirements
To align the interests of GEB members with those of our
shareholders and to demonstrate personal commitment to the
firm, we require the Group CEO and the other GEB members to
hold a substantial number of UBS shares. GEB members must
reach their minimum shareholding requirements within five years
from their appointment and retain it throughout their tenure. The
total number of UBS shares held by a GEB member consists of any
vested or unvested shares and any privately held shares. GEB
members may not sell any UBS shares before they reach the
minimum ownership thresholds mentioned below. At the end of
2021, all GEB members met their share ownership requirements,
except for those appointed within the last four years, who still
have time to build up and meet the required share ownership.
As of 31 December 2021, our GEB members held shares with
an aggregate value of
approximately
USD
191
million
,
demonstrating their commitment to our strategy and alignment
with shareholders.
Share ownership requirements
Group CEO
min. 1,000,000 shares
Must be built up within five years from their appointment and retained throughout
their tenure.
Other GEB members
min. 500,000 shares
GEB base salary and role-based allowance
Each GEB member receives a fixed base salary, which is reviewed
annually by the Compensation Committee. The 2021 annual base
salary for the Group CEO role was CHF 2.5 million and has
remained unchanged since 2011. The other GEB members each
received a base salary of CHF 1.5 million (or local currency
equivalent), also unchanged since 2011.
Over the course of 2021, two GEB members held a UK Senior
Management Function (SMF) role for one of our UK entities. In
addition to base salary, role-based allowances were part of their
fixed compensation.
At the AGM, shareholders are asked to approve the maximum
aggregate amount of fixed compensation for GEB members for
the following financial year.
›
Refer to the “Supplemental information” section of this report
for more information about MRTs and SMFs
›
Refer to the “Say-on-pay” section of this report for more
information about the AGM vote on fixed compensation for the
GEB
Caps on the GEB performance award pool
The size of the GEB performance award pool may not exceed
2.5% of the Group profit before tax. This limits the overall GEB
compensation based on the firm’s profitability.
For 2021, the Group’s profit before tax was USD 9.5 billion and
the total GEB performance award pool was CHF 79.8 million. The
GEB performance award pool as a percentage of Group profit
before tax was 0.9%, well below the 2.5% cap.
In line with the individual compensation caps on the proportion
of fixed pay to variable pay for all GEB members (introduced in
2013), the Group CEO’s granted performance award is capped at
five times his fixed compensation. Granted performance awards
of other GEB members are capped at seven times their fixed
compensation (or two times for GEB members who are also
Material Risk Takers (
MRTs
)
)
. For 202
1
,
performance awards
granted to GEB members and the Group CEO were, on average,
3.2
times their fixed compensation (excluding one
-
time
replacement awards, benefits and contributions to retirement
plans).
›
Refer to “Performance award pool funding” in the
“Compensation philosophy and governance” section of this
report for more information
GEB employment contracts and severance terms
GEB members’ employment contracts do not include severance
terms or supplementary pension plan contributions and are
subject to a notice period of at least six months. A GEB member
leaving
UBS
before the end of a performance year may be
considered for a performance award. Such awards are subject to
approval by the BoD, and ultimately by the shareholders at the
AGM.
Benchmarking for GEB members
When recommending performance awards for the Group CEO
and the other GEB members, the Compensation Committee
reviews the respective total compensation for each role against a
financial industry peer group. The peer group is selected based on
comparability of their size, business mix, geographic presence and
the extent to which they compete with us for talent. The
Compensation Committee considers our peers’ strategies,
practices and pay levels, as well as their regulatory environment;
it also periodically reviews other firms’ pay levels or practices,
including both financial and non-financial sector peers as
applicable. The total compensation for a GEB member’s specific
role
considers the compensation paid by our peers for a
comparable role and performance within the context of our
organizational profile. The Compensation Committee periodically
reviews and approves the peer group composition.
The table below presents the composition of our peer group as
approved by the Compensation Committee
for the
202
1
performance year.
Bank of America
Goldman Sachs
Barclays
HSBC
BlackRock
JPMorgan Chase
BNP Paribas
Julius Baer
Citigroup
Morgan Stanley
Credit Suisse
Standard Chartered
Deutsche Bank
State Street
245
GEB performance assessments
For 2021, we have further enhanced the performance assessment
for GEB members to ensure it is fully aligned with the firm’s new
purpose and strategic objectives. We assess GEB members against
a set of Group financial targets, non-financial objectives and
Behaviors. Under the non-financial objectives we introduced the
new categories of Core Job, which covers job-specific, risk and
people objectives, as well as Strategic & Growth, which covers
strategy, digital and ESG objectives. The restructured approach
fosters an even greater focus on GEB priorities and the success of
the Group overall among all GEB members, and strengthens the
understanding and importance of interdependence within and
across the GEB. At the same time, it creates stronger individual
accountability, and further increases the focus on core activities.
The Compensation Committee exercises its judgment with
respect to the performance achieved relative to the prior year, the
strategic plan and competitors, and considers the Group CEO’s
proposals. The Compensation Committee’s proposals are subject
to approval by the BoD.
The Compensation Committee, and then the full BoD, follows
a similar process for the Group CEO, except that the proposal
comes from the Chairman of the BoD.
Overview of the GEB compensation determination process
The compensation for the Group CEO and the other GEB members is governed by a rigorous process under Compensation Committee
and BoD oversight. The chart below shows how compensation for all GEB members is determined.
Advisory vote
Corporate governance and compensation | Compensation
246
Overview of performance assessment measures
We apply a range of quantitative measures to assess GEB member performance against financial and non-financial objectives while
Behaviors are assessed qualitatively. The table below provides a summary of the main metrics and measures used for 2021.
Financial measures
(60%)
–
Reported Group profit before tax
–
Reported Group cost / income ratio
–
Reported Return on CET1 capital
Non-
financial
measures
(30%)
Core Job
Job-specific
–
Business-specific criteria such as net new investable asset targets and client engagement-level objectives
–
Operating income growth targets for specific client segments and total cost goals
–
Post-stress CET1 objectives and Capital ratio guidance
–
Execution progress on key client and internal initiatives; e.g., cross-divisional collaboration initiatives,
efficiency and cost saving initiates
Risk
–
Operating within risk appetite constraints
–
Progress to deliver on risk reduction initiatives
People
–
Employee listening / sentiment results and feedback
–
Progress to meet 2025 ambitions for female representation and for ethnic minority representation in the
US and UK at Director and above levels (as per ESG disclosure)
–
People development, mobility, turnover and succession plan metrics
Strategic &
Growth
Strategy
–
Progress on group-wide transformation initiatives
–
Delivery on division / function-specific strategic programs and initiatives
Digital
–
Progress on digital transformation initiatives
–
Delivery of digital offering and user experience for clients
ESG
–
Refer to the ”Our targets and progress” table in the ”Environmental, Social and Governance
considerations” section of this report
Behaviors
(10%)
Accountability with integrity
Qualitative assessment
against expected
Behaviors:
–
Responsible for what they say and do
–
Takes ownership and makes things happen
–
Steps up and acts when something is not right
Collaboration
–
Trusts others and helps them to be successful
–
Delivers One UBS, together with their colleagues
–
Fosters a diverse, inclusive and equitable work environment
Innovation
–
Challenges perspectives and looks at every opportunity to improve
–
Actively seeks and provides feedback
–
Learns from every success and failure
Performance assessment categories
The table below presents the three performance categories for the assessment of the performance against non-financial objectives
related to Core Job, Strategic & Growth and Behaviors. The achievement score represents the maximum percentage, and the
Compensation Committee may apply downward adjustments.
Non-financial measures
Needs focus
Good contribution
Excellent contribution
Achievement score: up to 33%
Achievement score: up to 66%
Achievement score: up to 100%
Behaviors
Needs focus
Expected behavior
Exemplary behavior
Achievement score: up to 33%
Achievement score: up to 66%
Achievement score: up to 100%
247
2021 performance for the Group CEO
The performance award for the Group CEO is based on the
achievement of financial performance targets and non-financial
objectives related to his Core Job, Strategic & Growth initiatives
and Behaviors, as described earlier in this section.
These objectives were set to reflect the strategic priorities
determined by the Chairman and the BoD.
›
Refer to “GEB compensation framework” in this section of this
report for more information
Performance assessment for the Group CEO
The BoD recognized that Ralph Hamers successfully focused on
building on UBS’s strong business momentum, which resulted in
very strong financial results for 2021. He led the Group toward
stronger client centricity and improved the delivery of the bank’s
ecosystem to clients. He also delivered a successful strategic
refresh in 2021 and re-positioned the bank’s sustainability efforts.
Mr. Hamers successfully led the development of the purpose
statement, established the client promise, and strategic
imperatives, including development of concrete transformation
initiatives to position the firm for future growth. He was the most
important ambassador for the firm’s refreshed culture and
behavior program.
Furthermore, Ralph Hamers continuously displayed high risk
awareness and set a strong and consistent tone from the top to
promote an effective risk culture. He also demonstrated strong
leadership and accountability in dealing with the loss event
resulting from the default of a US-based client of our prime
brokerage business.
Additionally, the BoD recognized that Mr. Hamers personally
championed the drive towards becoming more digital across the
organization, along with his continuous push for technology as a
differentiator for both clients and employees.
The BoD acknowledged that Mr. Hamers also championed key
changes across the organization to further promote agile ways of
working, simplification and empowerment. He continued to
increase the Group’s focus on delivering against diversity and
ethnicity ambitions.
Mr. Hamers demonstrated strong leadership on ESG topics,
including establishing a group-wide sustainability and impact
organization. He drove the definition of a net-zero framework
and focused the organization on delivering against select UN
Sustainable Development goals, as well as establishing ambitions
and making progress on key focus areas, including Planet, People
and Partnerships.
The table below illustrates the assessment criteria used to
evaluate the achievements of Mr. Hamers in 2021.
Financial performance
Weight
Performance measures
2021
targets
2021
results
Achieve-
ment
2
Weighted
assess-
ment
2021 commentary
20%
Reported Group Profit
before Tax
USD 6.9bn
USD 9.5bn
100%
2
20%
–
Profit before tax increased 16% to USD 9.5 billion,
reflecting strong business momentum with income up
in all regions and good cost control. This result
significantly exceeds the 2021 performance
target and also represents the highest result
since 2006.
20%
Reported Cost / Income
Ratio
75%
1
73.6%
100%
2,3
20%
–
The cost / income ratio was 73.6%,
better than the
2021 performance target
, despite the increase in
litigation provisions of USD 740 million taken for the
French cross-border matter.
20%
Reported Return on CET1
Capital
16%
1
17.5%
100%
2
20%
–
The return on CET1 capital (RoCET1) was 17.5%,
compared with 17.4% in 2020,
exceeding the 2021
performance target
.
1
capital target range of 12–15% and the cost / income ratio target range of 75–78% in the spirit of setting ambitious goals to reach a 100% performance achievement.
2
100%.
3
Advisory vote
Corporate governance and compensation | Compensation
248
Performance assessment for the Group CEO (continued)
Non-financial performance and Behaviors
Weight
Performance
measures
Achieve-
ment
Weighted
assess-
ment
2021 commentary
30%
Good
contribution
(66%)
20%
–
The evaluation of each non-financial objective considers
quantitative metrics
assessed against internal targets / plan:
Core Job
(Job specific,
Risk, People)
Core Job
–
Progressed on execution of
digital transformation
–
Delivered improved
digital offering
user experience for clients
–
Operated within
risk appetite
–
Progressed on
risk reduction initiatives
control framework
–
Improved
employee listening / sentiment results
–
Increased the
ratio of female leaders
, stayed on track to meet the 2025 target
–
Stayed on track toward the 2025 ambition for ratios of US and UK
employees from ethnic
minorities
–
Improved statistics on
employee mobility and turnover
Strategic &
Growth
(Strategy, Digital,
ESG)
Strategic & Growth
–
Developed and launched UBS’s
purpose
–
Delivered the refreshed
strategy
–
Launched new client promise and strategic imperatives
–
Refreshed the
Sustainability
–
Progressed on the execution of key
growth initiatives
–
Refreshed culture and behavior program
–
See
ESG
10%
Behaviors
(Accountability
with integrity,
Collaboration,
Innovation)
Expected
behavior
(66%)
7%
The assessment of the Behavior objectives is
qualitative
summary assessment:
–
Mr. Hamers acted as a
role model
ownership and accountability
. He further
strengthened
collaboration
individual
accountability
–
He drove
innovation
new ways of working
. He continuously promoted simplification, more radical challenge
and innovative thinking and action
Total weighted assessment
(maximum 100%)
87%
In addition to the overall 2021 performance of the Group and Mr.
Hamers’ achievements outlined in the performance evaluation
table above, the BoD also considered other factors, such as the
impact of the significant risk event related to a loss from a US-
based client of our prime brokerage business.
The BoD approved the proposal by the Compensation
Committee to grant Mr. Hamers a performance award of CHF 8.5
million, resulting in a total compensation for 2021 of CHF 11.0
million (excluding benefits and contributions to his retirement
benefit plan).
Aligned with the GEB compensation framework, the Group
CEO’s performance award will be delivered 20% (CHF 1.7 million)
in cash and the remaining 80% (CHF 6.8 million) subject to
deferral and forfeiture provisions, as well as meeting performance
conditions over the next five years.
249
2021 total compensation for the GEB members
The aggregate performance award pool for the GEB for 2021 was
CHF 79.8 million (USD 87.1 million); on a per capita basis this
reflects a decrease of 1% compared with 2020. This contrasts
with the change in the overall performance award pool of the
firm, which increased
10% compared with 2020.
The GEB
performance award pool had a proportionally larger downward
adjustment than the Group pool, to reflect the accountability of
the GEB for the significant risk event in the first half of 2021. The
Group’s profit before tax was USD 9.5 billion, up 16% compared
with 2020.
The Compensation Committee has confirmed that
performance conditions for all GEB members’ awards due to vest
in March 2022 have been satisfied and the awards will therefore
vest in full.
At the 2022 AGM, shareholders will vote on the aggregate
2021 total variable compensation for the GEB in Swiss francs. The
tables below provide the awarded compensation for the Group
CEO and the GEB members in Swiss francs and, for reference, the
total amounts in US dollars for comparability with financial
performance. The individual variable performance awards for
each GEB member will only be confirmed upon shareholder
approval at the AGM
›
Refer to “Provisions of the Articles of Association related to
compensation” in the “Supplemental Information” section of
this report for more information
Audited |
Total compensation for GEB members
CHF, except where indicated
USD (for reference)
1
For the
year
Base salary
Contribution
to retirement
benefit plans
Benefits
2
Total fixed
compensa-
tion
Cash
3
Performance
award
under LTIP
4
Performance
award
under
DCCP
5
Total
variable
compensa-
tion
Total fixed
and vari-
able com-
pensation
6
Total fixed
compensa-
tion
Total
variable
compensa-
tion
Total fixed
and vari-
able com-
pensation
6
Highest Paid Executive (for 2021 Ralph A.J.G Hamers and for 2020 Sergio P. Ermotti)
2021
2,500,000
246,415
251,856
2,998,271
1,700,000
4,250,000
2,550,000
8,500,000
11,498,271
3,275,763
9,286,681
12,562,444
2020
7
2,500,000
244,353
78,891
2,823,244
2,100,000
5,250,000
3,150,000
10,500,000
13,323,244
Group CEO Ralph A.J.G. Hamers (reflects compensation since joining UBS per 1 September 2020)
2020
833,333
62,124
314,260
1,209,717
600,000
1,500,000
900,000
3,000,000
4,209,717
Aggregate of all GEB members
8,9,10,11,12
2021
24,853,521
2,064,009
1,179,512
28,097,041
15,950,000
39,875,000
23,925,000
79,750,000
107,847,041
30,697,441
87,130,916
117,828,357
2020
27,469,369
2,249,276
1,145,489
30,864,135
16,625,062
42,874,938
25,500,000
85,000,000
115,864,135
1 Swiss franc amounts have been translated into US dollars for reference at the 2021 performance award currency exchange rate of CHF / USD 1.092551. 2 All benefits are valued at market price. 3 For GEB
members who are also MRTs or SMFs, the cash portion includes blocked shares. 4 LTIP awards for performance year 2021 were awarded at a value of 67.7% of maximum which reflects our best estimate of the fair
value of the award. The maximum number of shares is determined by dividing the awarded amount by the estimated fair value of the award at grant, divided by CHF 19.194 or USD 20.700, the average closing price
of UBS shares over the last ten trading days leading up to and including the grant date. 5 The amounts reflect the amount of the notional additional tier 1 (AT1) capital instrument excluding future notional interest.
6 Excludes the portion related to the legally required employer’s social security contributions for 2021 and 2020, which are estimated at grant at CHF 4,997,243 and CHF 5,497,811, respectively, of which CHF 763,059
and CHF 880,496, respectively, are for the highest-paid GEB member. The legally required employees’ social security contributions are included in the amounts shown in the table above, as appropriate. 7 Reflects
compensation for 12 months until the end of his GEB employment on 31 December 2020. 8 As stated in “Group Executive Board” in the “Corporate governance” section of our Annual Report 2021, twelve GEB
members were in office on 31 December 2021 and thirteen GEB members on 31 December 2020. 9 Includes compensation paid under employment contracts during notice periods for GEB members who stepped
down during the respective years. 10 Includes compensation for newly appointed GEB members for their time in office as GEB members during the respective years. 11 For 2021, Barbara Levi received a one-time
replacement award of CHF 7,081,474. This replacement award is not included in the above table; including this, the 2021 total aggregate compensation of all GEB members is CHF 114,928,515. For 2020, Ralph
A.J.G. Hamers received a one-time replacement award of CHF 163,399. This replacement award is not included in the above table; including this, the 2020 total aggregate compensation of all GEB members is CHF
116,027,534. 12 Base salary may include role-based allowances in line with market practice in response to regulatory requirements.
p
Advisory vote
Corporate governance and compensation | Compensation
250
Total realized compensation for the Group CEO
The realized compensation reflects the total amount paid out in
the year. It includes the base salary, cash performance award
payments, and all deferred performance awards vested in the
year. As such, realized pay is the natural culmination of awards
granted and approved by shareholders in previous years.
To illustrate the effect of our long-term deferral approach,
which has been in place since 2012, we disclose the annual
realized compensation of Mr. Hamers, including a comparison
with his total awarded compensation.
Total realized compensation vs awarded compensation for Ralph A.J.G Hamers¹
CHF
Realized
Awarded
For the year
Base salary
Cash award
2
Deferred cash
award
2
Performance
award under
equity plans
2
Performance
award under
DCCP
2
Total realized
fixed and variable
compensation
Total awarded
fixed and variable
compensation
3,4
2021
2020
1
1 Includes compensation for 4 months as Ralph A.J.G. Hamers joined UBS on 1 September 2020. 2 Excludes dividend / interest payments. 3 Excludes contributions to retirement benefit plans and benefits. Includes
social security contributions paid by Ralph A.J.G. Hamers but excludes the portion related to the legally required social security contributions paid by UBS. 4 Excludes the one-time replacement award.
251
Group compensation
Compensation elements for all employees
A
ll elements of pay
are considered
when making our
compensation decisions. We regularly review our principles and
compensation framework in order to remain competitive and
aligned with stakeholders. In 2021, we made no material changes
to our overall framew
ork.
We will continue to review our
approach to salaries and performance awards, considering market
developments, our performance and our commitment to deliver
sustainable returns to shareholders.
Base salary and role-based allowance
Employees’ fixed compensation (e.g., base salary) reflects their
level of skill, role and experience, as well as local market practice.
Base salaries are usually paid monthly or fortnightly, in line with
local market practice. We offer competitive base salaries that
reflect location, function and role. Salary increases generally
consider promotions, skill set, performance and overall
responsibility.
In addition to base salary, and as part of fixed compensation,
some employees may receive a role-based allowance. This
allowance is a shift in the compensation mix between fixed and
variable compensation, not an increase in total compensation. It
reflects the market value of a specific role and is fixed, non-
forfeitable compensation. Unlike salary, a role-based allowance is
paid only if the employee is in a specific role. Similar to previous
years, 2021 role-based allowances consisted of a cash portion
and, where applicable, a blocked UBS share award.
Pensions and benefits
We offer certain benefits for all employees, such as health
insurance and retirement benefits. These vary depending on the
employee’s location and are
reviewed periodically for
competitiveness. Pension contributions and pension plans also
vary in accordance with local requirements and market practice.
However, pension plan rules in any one location are generally the
same for all employees, including management.
GEB members’ pension contributions and benefits are in line
with local practices for other employees. There are no enhanced
or supplementary pension contributions for the GEB.
Performance award
Most of our employees are eligible for an annual performance
award
.
The level of
this
award, where applicable, generally
depends on the firm’s overall performance, the employee’s
business division, team and individual performance, and behavior,
reflecting their overall contribution to the firm’s results. These
awards are in line with applicable local employment conditions
and at the discretion of the firm.
In addition to the firm’s Pillars and Principles, Behaviors related
to accountability with integrity, collaboration and innovation are
part of the performance management approach. Therefore, when
assessing performance, we consider not only what was achieved
but also how it was achieved.
Advisory vote
Corporate governance and compensation | Compensation
252
Our deferred compensation plans
To reinforce our emphasis on sustainable performance and risk
management, and our focus on achieving growth ambitions, we
deliver part of
our employees’
annual variable compensation
through
deferred compensation plans
.
We believe that our
approach, with a single incentive decision and a mandatory
deferral
,
is
transparent and
well
suited to implementing our
compensation philosophy and delivering sustainable
performance. This aligns the interests of our employees and
shareholders and appropriately links compensation to longer-term
sustainable performance.
Our mandatory deferral approach applies to all employees with
regulatory
-
driven deferral
requirements or total compensation
greater than USD / CHF 300,000. Certain regulated employees,
such as Senior Management Functions (SMFs) and Material Risk
Takers (MRTs), are subject to additional requirements (e.g., an
additional non-financial conduct-related performance metric
under the LTIP, more stringent deferral requirements, additional
blocking periods). In addition, SMFs and MRTs receive 50% of
their cash portion in the form of immediately vested shares, which
are blocked for 12 months after grant.
The deferred amount increases at higher marginal rates in line
with the value of the performance award. The effective deferral
rate therefore depends on the amount of the performance award
and the amount of total compensation.
We believe our deferral regime has one of the longest vesting
periods in the industry. The weighted average deferral period (for
non-regulated employees) is 4.4 years for GEB members and
ranges from 3.5 to
4 years for employees below GEB level
.
Additionally, from time to time, we may utilize alternative deferred
compensation arrangements to remain competitive in specific
business areas.
To further promote sustainable performance,
all of
our
deferred compensation plans include employment conditions and
malus conditions. These enable the firm to reduce or fully forfeit
unvested deferred awards under certain circumstances, pursuant
to performance and harmful acts provisions. In addition, forfeiture
is triggered in cases where employment has been terminated for
cause.
Our share delivery obligations related to notional share awards
are satisfied by delivering treasury shares, which are purchased in
the market, to employees at vesting.
›
Refer to “Note 28 Employee benefits: variable compensation” in
the “Consolidated financial statements” section of our Annual
Report 2021 for more information
›
Refer to the “Supplemental information” section of this report
for more information about MRTs and SMFs
Variable compensation elements by employee category
253
Long-Term Incentive Plan
The LTIP is a mandatory deferral plan for senior leaders of the
Group (i.e., GEB members and selected senior management). For
the 2021 performance year, we granted LTIP awards to 117
employees at a fair value of 67.7% of maximum. The value was
calculated by an independent third party using a well-established
valuation methodology.
The performance metrics of the share-based LTIP awards are
average return on CET1 capital (RoCET1) and relative total
shareholder return (rTSR) over a three-year performance period
starting on 1 January in the year of grant. Performance outcomes
and actual payout levels will be disclosed at the end of the
performance period.
The three-year average RoCET1 performance metric reflects
our strategic return ambitions and considers our revised financial
targets, as well as our cost of capital as outlined below:
–
the required RoCET1 performance for a maximum payout is set
at 18%, which represents the upper end of our target range;
–
the required performance threshold for the minimum payout
has been raised to 8% from 6% in prior-year awards to reflect
our new financial targets communicated in February 2022,
increasing the mid-point of the payout thresholds to better
reflect our cost of capital; and
–
the linear payout design between threshold and maximum
level
supports
our growth ambitions
and
our focus on
delivering sustainable performance without
encour
ag
ing
excessive risk-taking.
The rTSR performance metric over the three-year period further
aligns the interests of employees with those of shareholders:
–
the metric compares the total shareholder return (the TSR) of
UBS with the TSR of an index consisting of listed Global
Systemically Important Banks (G-SIBs) as determined by the
Financial Stability Board (excluding UBS Group);
–
the G-SIBs are independently defined and reflect companies
with a comparable risk profile and impact on the global
economy;
–
the index, which includes publicly traded G-SIBs, is equal
weighted, calculated in Swiss francs and maintained by an
independent index provider, so as to ensure independence of
the TSR calculation; and
–
the payout interval of ±25 percentage points versus the index
performance demonstrates our ambition of delivering
attractive relative returns to shareholders. The linear payout
and the threshold level set below index performance further
support sustainability of results and prudent risk-taking.
Global Systemically Important Banks (G-SIBs) that are listed companies
1
Agricultural Bank of China
Goldman Sachs
Santander
Bank of America
Groupe Crédit Agricole
Société Générale
Bank of China
HSBC
Standard Chartered
Bank of New York Mellon
ING Bank
State Street
Barclays
ICBC
Sumitomo Mitsui FG
BNP Paribas
JPMorgan Chase
Toronto-Dominion
China Construction Bank
Mitsubishi UFJ FG
UniCredit
Citigroup
Mizuho FG
Wells Fargo
Credit Suisse
Morgan Stanley
Deutsche Bank
Royal Bank of Canada
1
Dividend equivalents (granted where applicable regulation
permits) are subject to the same terms as the underlying LTIP
award.
LTIP award s reflect the long-term focus of our compensation
framework. The final number of shares as determined at the end
of the three-year performance period will vest in three equal
installments in each of the three years following the performance
period for GEB members, and cliff vest in the first year following
the performance period for selected senior management (longer
deferral periods may apply for regulated employees).
LTIP payout illustration
–
The final number of notional
shares vesting will vary based on
the achievement versus the
performance metrics.
–
Linear payout between threshold
and maximum performance.
–
Vesting levels are a percentage of
the maximum opportunity of the
LTIP and cannot exceed 100%.
–
Full forfeiture for performance
below the predefined threshold
levels.
–
SMFs and UK MRTs are subject to
an additional non-financial metric
based on a conduct assessment
with a potential downward
adjustment of up to 100% of the
entire award.
Performance metric:
Below threshold (<8%)
Threshold (8%) up to
maximum (<18%)
Maximum and above (>18%)
Full forfeiture
(payout 0%)
Partial vest
(payout between 33% and <100%)
Full vest
(payout 100%)
Performance metric:
Below threshold (<–25 pps)
Threshold (–25 pps) up to
maximum (+25 pps)
Maximum and above (>+25 pps)
Full forfeiture
(payout 0%)
Partial vest
(payout between 33% and <100%)
Full vest
(payout 100%)
Advisory vote
Corporate governance and compensation | Compensation
254
Equity Ownership Plan
The EOP is the deferred compensation plan for employees who
are subject to deferral requirements but do not receive LTIP
awards. For the 2021 performance year, we granted EOP awards
to 4,228 employees.
Delivering sustainable performance is a key objective for UBS,
and we therefore link EOP award vesting with minimum
performance thresholds over a multi-year time horizon. Our EOP
creates a direct link with shareholder returns as a notional equity
award and have no upward leverage. This approach promotes
growth and sustainable performance.
EOP awards
generally
vest
over three
years.
For certain
employee populations, EOP awards can be adjusted downwards,
including to zero, based on the average RoCET1 over the
applicable performance period. The Compensation Committee
sets the minimum future performance threshold and may adjust
the award if the performance metric does not reflect a fair
measure of performance.
Asset Management employees receive some or all of their EOP
in the form of notional funds to align their compensation more
closely with industry standards. This plan is generally delivered in
cash and vests over five years.
›
Refer to “Vesting of outstanding awards granted in prior years
subject to performance conditions” in the “Supplemental
information” section of this report for more information
Deferred Contingent Capital Plan
The DCCP is a key component of our compensation framework
and supports alignment of the interests of our senior employees
with those of our stakeholders.
All employees subject to deferral requirements receive DCCP
awards. For the 2021 performance year, we granted DCCP awards
to 4,303 employees.
DCCP replicates many of the features of the loss-absorbing
bonds that we issue to investors and may be paid at vesting in
cash or, at the discretion of the firm, a perpetual, marketable
additional tier 1 (AT1) capital instrument. Employees can elect to
have their DCCP awards denominated in Swiss francs or US
dollars.
DCCP awards vest in full after five years (longer deferral
periods may apply for regulated employees). DCCP awards bear
notional interest paid annually (except as limited by regulation for
MRTs), subject to review and confirmation by the Compensation
Committee. The notional interest rate for grants in 2022 was
3.7% for awards denominated in Swiss francs and 5.7% for
awards denominated in US dollars. These interest rates are based
on the current market rates for similar AT1 capital instruments
issued by UBS Group.
Awards are forfeited if a viability event occurs, i.e., if FINMA
notifies the firm that the DCCP awards must be written down to
mitigate the risk of an insolvency, bankruptcy or failure of UBS or
if the firm receives a commitment of extraordinary support from
the public sector that is necessary to prevent such an event. DCCP
awards are also written down for GEB members if the Group’s
CET1 capital ratio falls below 10% and for all other employees if
it falls below 7%.
In addition, GEB members forfeit 20% of DCCP awards for
each loss-making year during the vesting period. This means
100% of the award is subject to risk of forfeiture. The forfeiture
features of DCCP create a strong alignment with our debt holders
and support the sustainability of the firm.
Over the last five years, USD 1.7 billion of DCCP awards have
been issued, contributing to the Group’s total loss-absorbing
capacity (TLAC).
Therefore
,
DCCP awards not only support
competitive pay but also provide a loss absorption buffer that
protects the firm’s capital position. The following table illustrates
the contribution of the DCCP to our AT1 capital and the effect on
our TLAC ratio.
›
Refer to the “Supplemental information” section of this report
for more information about performance award and personnel-
related expenses
›
Refer to the “Supplemental information” section of this report
for more information about longer vesting and clawback periods
for MRTs and SMFs
Contribution of the Deferred Contingent Capital Plan to our loss-absorbing capacity
1
USD million, except where indicated
31.12.21
31.12.20
Deferred Contingent Capital Plan (DCCP), eligible as high-trigger loss-absorbing additional tier 1 capital
1,730
1,875
DCCP contribution to the total loss-absorbing capacity ratio (%)
0.6
0.6
1 Refer to “Bondholder information” at ubs.com/investors for more information about the capital instruments of UBS Group AG and UBS AG both on a consolidated and a standalone basis.
255
Replacement awards and forfeitures
In line with industry practice, our compensation framework and
plans include provisions generally requiring reduction / forfeiture
of a terminated employee’s unvested or deferred awards. In
particular, these provisions apply if the terminated employee joins
another financial services organization and / or violates restrictive
covenants, such as solicitation of clients or employees.
Conversely, to support talent acquisition, and consistent with
industry practice, we may offer replacement awards to attract
senior candidates
by
offse
t
t
ing
deferred
compensation being
forfeited at their previous employer as a result of joining UBS.
When
making such awards
,
we aim to match the pre
vious
employer’s terms and conditions for the awards to be forfeited
upon joining UBS. The total 2021 forfeitures of USD 258 million
of previously awarded deferred compensation offset the 2021
total sign-on payments, replacement payments and guarantees of
USD 137 million.
Barbara Levi succeeded Markus Diethelm as Group General
Counsel effective 1 November 2021. Consistent with the terms of
the original awards and included in the above figures, she received
replacement awards for compensation forfeited at her previous
employer as a result of joining UBS. Ms. Levi’s replacement
payment had a total value of CHF 7,081,474 and consisted of an
EOP share award representing 430,732 UBS shares (denominated
in Swiss francs), a deferred cash award as well as replacement of
cash items. The deferred portion of the award will vest in various
installments between 2022 and 2027. These replacement awards
are subject to UBS’s harmful acts provisions.
Other variable compensation components
To support hiring and retention, particularly at senior levels, we
may offer other compensation components, such as:
–
retention payments to key employees to induce them to stay,
particularly during critical periods for the firm, such as a sale or
wind-down of a business;
–
on a limited basis, guarantees may be required to attract
individuals with certain skills and experience – these awards are
fixed incentives subject to our standard deferral rules and
limited to the first full year of employment;
–
award grants to employees hired late in the year to replace
performance awards that they would have earned at their
previous employers, but have foregone by joining UBS – these
awards are generally structured with the same level of deferral
as for employees at a similar level at UBS; and
–
in exceptional cases, candidates may be offered a sign-on
award to increase the chances of them accepting our offer.
These other variable compensation components are subject to
a comprehensive governance process, which may involve the
Compensation Committee, depending on the amount or type of
such payments.
Below-GEB level employees who are made redundant may
receive severance payments. Our severance terms comply with the
applicable local laws (legally obligated severance). In certain
locations, we may provide severance packages that are negotiated
with our local social partners and may go beyond the applicable
minimum legal requirements (standard severance). Such
payments are governed by location -specific severance policies. In
addition, we may make severance payments that exceed legally
obligated or standard severance payments where we believe these
are aligned with market practice and appropriate under the
circumstances (supplemental severance). GEB members do not
receive severance payments.
Sign-on payments, replacement payments, guarantees and severance payments
Total 2021
of which: non-deferred
cash
of which: deferred
compensation
awards
Total 2020
Number of beneficiaries
USD million, except where indicated
2021
2020
Total sign-on payments
1
of which: Key Risk Takers
2
Total replacement payments
3
of which: Key Risk Takers
2
Total guarantees
3
of which: Key Risk Takers
2
Total severance payments
1,4
5
of which: Key Risk Takers
2
1 GEB members are not eligible for sign-on or severance payments. 2 Expenses for Key Risk Takers are full-year amounts for individuals in office on 31 December 2021. Key Risk Takers as defined by UBS, including
all employees with a total compensation exceeding USD / CHF 2.5 million (Highly Paid Employees). 3 Includes replacement payments for one GEB member in 2021 and for another GEB member in 2020. No GEB
member received a guarantee in 2021 or 2020. 4 Includes legally obligated and standard severance payments as well as payments in lieu of notice. 5 Represents expense recognized in 2021 associated with
payments made in 2021 as well as provisions for expected payments in 2022.
Forfeitures
1
Total 2021
Total 2020
USD million, except where indicated
Total forfeitures
of which: former GEB members
of which: Key Risk Takers
2
1 For notional share awards, forfeitures are calculated as units forfeited during the year, valued at the share price on 31 December 2021 (USD 17.87) for 2021. The 2020 data is valued using the share price on 31
December 2020 (USD 14.13). For LTIP the forfeited units reflect the fair value awarded at grant. For the notional funds awarded to Asset Management employees under the EOP, this represents the forfeiture credits
recognized in 2021 and 2020. For the DCCP, the fair value at grant of the forfeited awards during the year is reflected. Numbers presented may differ from the effect on the income statement in accordance with IFRS.
2 Key Risk Takers as defined by UBS, including all employees with a total compensation exceeding USD / CHF 2.5 million (Highly Paid Employees) and excluding former GEB members who forfeited awards in 2021 or
2020.
Advisory vote
Corporate governance and compensation | Compensation
256
Benchmarking for employees other than GEB members
We generally consider market practice in our pay decisions and
framework. Our market review reflects several factors, including
the comparability of the business division, location, scope and the
diversity of our businesses. For certain businesses or roles, we may
consider practices at other major international banks, other large
Swiss private banks, private equity firms, hedge funds and non-
financial firms.
W
e also
internally
benchmark employee
compensation for comparable roles within and across business
divisions and locations.
Employee share ownership
According to available records on employee shareholdings,
including unvested deferred compensation, as of 31 December
2021, employees held at least USD 4.5 billion of UBS shares (of
which approximately USD 2.9 billion were unvested), representing
approximately 7% of our total shares issued.
The Equity Plus Plan is our employee share purchase program.
It allows employees at Executive Director level and below to
voluntarily invest up to 30% of their base salary and / or regular
commission payments to purchase UBS shares. In addition (where
offered), eligible employee
s
can
invest
up to 35% of their
performance award under the program. Participation in the
program is capped at USD / CHF 20,000 annually. Eligible
employees may purchase UBS shares at market price and receive
one additional share for every three shares purchased through the
program. Additional shares vest after a maximum of three years,
provided the employee remains employed by UBS and has
retained the purchased shares throughout the holding period.
›
Refer to “Note 28 Employee benefits: variable compensation” in
the “Consolidated financial statements” section of our Annual
Report 2021 for more information
Compensation for US financial advisors in Global Wealth
Management
In line with market practice for US wealth management
businesses, the compensation for US financial advisors in Global
Wealth Management predominantly includes production payout
and deferred compensation awards. Production payout, paid
monthly, is primarily based on compensable revenue. Financial
advisors may also qualify for deferred compensation awards,
which generally vest over a six-year period. These awards are
based on strategic performance measures, including production
and length of service with UBS. Production payout rates and
deferred compensation awards may be reduced for, among other
things, errors, negligence or carelessness, or failure to comply
with the firm’s rules, standards, practices and / or policies, and /
or applicable laws and regulations.
257
2021 Group performance outcomes
Performance awards granted for the 2021 performance year
The “Variable compensation” table below shows the amount of
variable compensation awarded to employees for the 2021
performance year, together with the number of beneficiaries for
each type of award granted. In the case of deferred awards, the
final amount paid to an employee depends on performance
conditions and consideration of relevant forfeiture provisions. The
deferred share award amount is based on the market value of
these awards on the date of grant.
Variable compensation
1
Expenses recognized
in the IFRS income
statement
Expenses deferred to
future periods
4
Accounting
adjustments
4
Total
Number of beneficiaries
USD million, except where indicated
2021
2020
2021
2020
2021
2020
2021
2020
2021
2020
Non-deferred cash
Deferred compensation awards
of which: Equity Ownership Plan
5
5
of which: Deferred Contingent Capital Plan
of which: Long-Term Incentive Plan
5
5
of which: Asset Management EOP
Variable compensation – performance award pool
Variable compensation – other
2
6
6
Total variable compensation excluding financial advisor
variable compensation
Financial advisor (FA) variable compensation
3
Total variable compensation including FA variable
compensation
1 Expenses under “Variable compensation – other” and “Financial advisor variable compensation” are not part of UBS’s performance award pool. 2 Consists of replacement payments, forfeiture credits, severance
payments, retention plan payments and interest expense related to the Deferred Contingent Capital Plan. 3 Financial advisor compensation consists of formulaic compensation based directly on compensable revenues
generated by financial advisors and supplemental compensation calculated based on financial advisor productivity, firm tenure, new assets and other variables. It also includes expenses related to compensation
commitments with financial advisors entered into at the time of recruitment that are subject to vesting requirements. 4 Estimates as of 31 December 2021 and 2020. Actual amounts to be expensed in future periods
may vary, e.g., due to forfeiture of awards. 5 Represents estimated post-vesting transfer restriction and permanent forfeiture discounts. 6 Included in expenses deferred to future periods is an amount of USD 121
million (2020: USD 74 million) in interest expense related to the Deferred Contingent Capital Plan. As the amount recognized as performance award represents the present value of the award at the date it is granted
to the employee, this amount is excluded.
2021
performance award pool and expenses
The performance award pool, which includes performance-based
variable awards for 2021, was USD 3.7 billion, reflecting an
increase of 10% compared with 2020. Performance award
expenses for 2021 decreased 1% to USD 3.2 billion, reflecting
increased performance award expenses accrued in the
performance year, offset by lower expenses related to prior
performance years, as 2020 included additional expenses that
resulted from modifying the terms of certain outstanding deferred
compensation awards. The “Performance award pool and
expenses” table below compares the performance award pool
with performance award expenses.
Performance award pool and expenses
USD million, except where indicated
2021
2020
% change
Performance award pool
1
of which: expenses deferred to future periods and accounting adjustments
2,3
Performance award expenses accrued in the performance year
Performance award expenses related to prior performance years
Total performance award expenses recognized for the year
4
1 Excluding employer-paid taxes and social security. 2 Estimate as of the end of the performance year. Actual amounts expensed in future periods may vary, e.g., due to forfeiture of awards. 3 Accounting
adjustments represent estimated post-vesting transfer restriction and permanent forfeiture discounts. 4 Refer to “Note 28 Employee benefits: variable compensation” in the “Consolidated financial statements”
section of our Annual Report 2021 for more information
Advisory vote
Corporate governance and compensation | Compensation
258
Compensation for the Board of Directors
Chairman of the BoD
Under the leadership of the Chairman, Axel A. Weber, the BoD
determines, among other things, the strategy for the Group,
based on recommendations by the Group CEO, exercises ultimate
supervision over management and appoints all GEB members.
The Chairman leads all general meetings and BoD meetings
and works with the committee chairpersons to coordinate their
work. Together with the Group CEO, the Chairman is responsible
for effective communication with shareholders and stakeholders,
including clients, government officials, regulators and public
organizations. The Chairman works closely with the Group CEO
and other GEB members, providing advice and support when
appropriate
,
and
continues to strengthen and promote our
culture through the three keys to success: our Pillars, Principles
and Behaviors.
The Chairman’s total compensation for the period from AGM
to AGM is contractually fixed without any variable component.
For the current period from the 2021 AGM to the 2022 AGM, his
total compensation was CHF 4.9 million, excluding benefits and
pension fund contributions. The Chairman’s total compensation
for the current period consisted of a cash payment of CHF 3.5
million and a share component of CHF 1.4 million consisting of
72,939
UBS shares at CHF
19.19
4
per share. The share
component aligns the Chairman’s pay with the Group’s long-term
performance.
Thus, Mr. Weber’s total reward, including benefits and pension
fund contributions, for his service as Chairman for the current
period, was CHF 5,224,913.
The Chairman’s employment agreement does not provide for
severance terms or supplementary contributions to pension plans.
The benefits for the Chairman are in line with local practices for
UBS employees. The Chair
person
of the Compensation
Committee proposes and the Compensation Committee approves
the Chairman’s compensation annually for the upcoming AGM-
to-AGM period, taking into consideration fee or compensation
levels for comparable roles based on our core financial industry
peers and other relevant leading Swiss companies included in the
Swiss Market Index.
›
Refer to “Board of Directors” in the “Corporate governance”
section of our Annual Report 2021 for more information about
the responsibilities of the Chairman
Audited |
Compensation details and additional information for non-independent BoD members
CHF, except where indicated
USD
(for reference)
Name, function
1
For the period
AGM to AGM
Base salary
Annual share
award
2
Contributions
to retirement
plans and
benefits
3
Total
4
Total
4,5
Axel A. Weber, Chairman
2021/2022
2020/2021
1 Axel A. Weber was the only non-independent member in office on 31 December 2021 and 31 December 2020. 2 These shares are blocked for four years. 3 Includes the estimated portion related to UBS’s
contribution to the statutory pension scheme and estimated benefits valued at market price, as applicable. For the period from the 2020 AGM to the 2021 AGM, the actual amount was CHF 336,050. 4 Excludes
the portion related to the legally required social security contributions paid by UBS, which for the period from the 2021 AGM to the 2022 AGM is estimated at CHF 336,428 and for the period from the 2020 AGM to
the 2021 AGM at CHF 332,243. The legally required social security contributions paid by the non-independent BoD members are included in the amounts shown in this table, as appropriate. 5 Swiss franc amounts
have been translated into US dollars for reference at the 2021 performance award currency exchange rate of CHF / USD 1.092551.
p
259
Independent BoD members
As outlined in the table below, all BoD members, except the
Chairman, are deemed independent and receive fixed fees for
their services on the BoD and its committees. Independent BoD
members do not receive performance awards, severance
payments, benefits or pension contributions.
In the current period, the roles of Senior Independent Director
and Vice Chairman are both held by one BoD member, but the
additional fee is only paid once. Independent BoD members must
use a minimum of 50% of their fees to purchase UBS shares,
which are blocked for four years, and they may elect to use up to
100% of their fees to purchase blocked UBS shares. In all cases,
the number of shares is calculated based on the average closing
price of the 10 trading days leading up to and including the grant
date.
At each AGM, shareholders are invited to approve the
aggregate amount of BoD remuneration, including compensation
for the Chairman, which applies until the next AGM. The tables
below and on the following page provide details on the fee
structure for the independent BoD members.
The fee structure for independent BoD members is reviewed
annually based on the Chairman’s proposal to the Compensation
Committee, which in turn submits a proposal to the BoD for
approval. In our regular review of the BoD fee structure, we
concluded that our overall approach for independent BoD
member compensation remains appropriate and thus unchanged.
Remuneration framework for independent BoD members
Advisory vote
Corporate governance and compensation | Compensation
260
Audited |
Total payments to BoD members
CHF, except where indicated
USD (for reference)
For the period AGM to AGM
Total
1
Total
1,2
Aggregate of all BoD members
2021/2022
2020/2021
1 Includes social security contributions paid by the BoD members but excludes the portion related to the legally required social security contributions paid by UBS, which for the period from the 2021 AGM to the 2022
AGM is estimated at grant at CHF 739,615 and for the period from the 2020 AGM to the 2021 AGM at CHF 719,763. 2 Swiss franc amounts have been translated into US dollars for reference at the 2021
performance award currency exchange rate of CHF / USD 1.092551
p
Audited |
Remuneration details and additional information for independent BoD members
CHF, except where indicated
Name, function
1
Audit Committee
Compensation
Committee
Corporate Culture and
Responsibility
Committee
Governance and
Nominating Committee
Risk Committee
For the period
AGM to AGM
Base fee
Committee
fee(s)
Additional
payments
2
Total
3
Share
percentage
4
Number of
shares
5,6
Jeremy Anderson,
Vice Chairman and Senior
Independent Director
C
M
2021/2022
C
M
2020/2021
Claudia Böckstiegel, member
2021/2022
2020/2021
-
-
-
-
William C. Dudley, member
M
M
M
2021/2022
M
M
M
2020/2021
Patrick Firmenich, member
M
M
2021/2022
2020/2021
-
-
-
-
Reto Francioni, member
M
M
2021/2022
M
M
2020/2021
Fred Hu, member
M
M
2021/2022
M
M
2020/2021
Mark Hughes, member
M
C
2021/2022
M
C
2020/2021
Nathalie Rachou, member
M
2021/2022
M
2020/2021
Julie G. Richardson, member
C
M
M
2021/2022
C
M
M
2020/2021
Beatrice Weder di Mauro,
former member
2021/2022
-
-
-
-
M
M
2020/2021
Dieter Wemmer, member
M
M
M
2021/2022
M
M
M
2020/2021
Jeanette Wong, member
M
M
M
2021/2022
M
M
M
2020/2021
Total 2021/2022
Total 2021/2022 in USD
(for reference)
7
Total 2020/2021
Legend: C = Chairperson of the respective Committee, M = Member of the respective Committee
1 Eleven independent BoD members were in office on 31 December 2021. At the 2021 AGM, Claudia Böckstiegel and Patrick Firmenich were newly elected and Beatrice Weder di Mauro did not stand for re-election.
Ten independent BoD members were in office on 31 December 2020. 2 These payments are associated with the Vice Chairman and the Senior Independent Director function. 3 Excludes UBS’s portion related to
the legally required social security contributions, which for the period from the 2021 AGM to the 2022 AGM is estimated at grant at CHF 403,187 and which for the period from the 2020 AGM to the 2021 AGM was
estimated at grant at CHF 387,520. The legally required social security contributions paid by the independent BoD members are included in the amounts shown in this table, as appropriate. 4 Fees are paid 50% in
cash and 50% in blocked UBS shares. However, independent BoD members may elect to have 100% of their remuneration paid in blocked UBS shares. 5 For 2021, UBS shares were valued at CHF 19.194 (average
closing price of UBS shares over the last 10 trading days leading up to and including the grant date). For 2020, UBS shares, valued at CHF 13.810 (average closing price of UBS shares over the last 10 trading days
leading up to and including the grant date). These shares are blocked for four years. 6 Number of shares is reduced in case of the 100% election to deduct legally required contributions. All remuneration payments
are, where applicable, subject to social security contributions and / or withholding tax. 7 Swiss franc amounts have been translated into US dollars for reference at the 2021 performance award currency exchange
rate of CHF / USD 1.092551.
p
261
Supplemental information
Fixed and variable compensation for GEB members
Fixed and variable compensation for GEB members
1,2,3
Total for 2021
Not deferred
Deferred
4
Total for 2020
CHF million, except where indicated
Amount
%
Amount
%
Amount
%
Amount
Total compensation
Amount
5
Number of beneficiaries
Fixed compensation
5,6
Cash-based
Equity-based
Variable compensation
Cash
7
Long-Term Incentive Plan (LTIP)
8
Deferred Contingent Capital Plan (DCCP)
8
1 The figures include all GEB members in office during the respective years. 2 Includes compensation paid under the employment contract during the notice period for GEB members who stepped down during the
respective years. 3 Includes compensation for newly appointed GEB members for their time in office as a GEB member during the respective years. 4 Based on the specific plan vesting and reflecting the total
award value at grant, which may differ from the expense recognized in the income statement in accordance with IFRS. 5 Excludes benefits and employer’s contributions to retirement benefit plans. Includes social
security contributions paid by GEB members but excludes the portion related to the legally required social security contributions paid by UBS. For 2021, Barbara Levi received a one-time replacement award of CHF 7
million. This replacement award is not included in the above table; including this, the 2021 total aggregate compensation of all GEB members is CHF 112 million. For 2020, Ralph A.J.G. Hamers received a one-time
replacement award of CHF 0.2 million. This replacement award is not included in the above table; including this, the 2020 total aggregate compensation of all GEB members is CHF 113 million. 6 Includes base
salary and role-based allowances, rounded to the nearest million. 7 Includes allocation of vested but blocked shares, in line with the remuneration section of the UK Prudential Regulation Authority Rulebook. 8
For the GEB members who are also MRTs (or SMFs), the awards do not include dividend and interest payments. Accordingly, the amounts reflect for the LTIP the fair value of the non-dividend-bearing awards and for
the DCCP the fair value of the granted non-interest-bearing awards.
Advisory vote
Corporate governance and compensation | Compensation
262
Regulated staff
Key Risk Takers
KRTs are defined as those employees who, by the nature of their
roles, have been determined to materially set, commit or control
significant amounts of the firm’s resources and / or exert
significant influence over its risk profile. This includes employees
that work in front-office roles, logistics and control functions.
Identifying KRTs globally is part of our risk control framework and
an important element in ensuring we incentivize only appropriate
risk-taking. For 2021, in addition to GEB members, 699
employees were classified as KRTs throughout UBS Group
globally, including
all
employees with a total compensation
exceeding USD / CHF 2.5 million (Highly Paid Employees), who
may not have been identified as KRTs during the performance
year.
In line with regulatory requirements, the performance of
employees identified as KRTs during the performance year is
evaluated by the control functions. In addition, KRTs’ performance
awards are subject to a mandatory deferral rate of at least 50%,
regardless of whether the deferral threshold has been met
(excluding KRTs with de minimis performance awards below a pre-
determined threshold where standard deferral rates apply). A
KRT’s deferred compensation award will only vest if the Group
performance conditions are met. Consistent with all other
employees, the deferred portion of a KRT’s compensation is also
subject to forfeiture or reduction if the KRT commits harmful acts.
Fixed and variable compensation for Key Risk Takers
1
Total for 2021
Not deferred
Deferred
2
Total for 2020
USD million, except where indicated
Amount
%
Amount
%
Amount
%
Amount
Total compensation
Amount
Number of beneficiaries
Fixed compensation
3,4
Cash-based
Equity-based
Variable compensation
Cash
5
Long-Term Incentive Plan (LTIP) / Equity Ownership
Plan (EOP)
6
Deferred Contingent Capital Plan (DCCP)
6
1 Includes employees with a total compensation exceeding USD / CHF 2.5 million (Highly Paid Employees), excluding GEB members who were in office during the performance year, except the new GEB member
appointed during 2021, who is included for compensation received in their role as a KRT prior to being appointed to the GEB. 2 Based on the specific plan vesting and reflecting the total value at grant, which may
differ from the expense recognized in the income statement in accordance with IFRS. 3 Excludes benefits and employer's contributions to retirement benefits plan. Includes social security contributions paid by KRTs
but excludes the legally required social security contributions paid by UBS. 4 Includes base salary and role-based allowances. 5 Includes allocation of vested but blocked shares, in line with regulatory requirements
where applicable. 6 KRTs who are also MRTs do not receive dividend and interest payments. Accordingly, the amounts for the EOP / LTIP reflect the fair value of the non-dividend-bearing awards and for the DCCP
the fair value of the granted non-interest-bearing awards.
263
GEB and KRTs deferred compensation
The table below shows the current economic value of unvested
outstanding deferred variable compensation awards subject to
ex-post adjustments. For share-based plans, the economic value
is determined based on the closing share price on 31 December
202
1
. For notional funds
,
it is determined using the latest
available market price for the underlying funds at year-end 2021,
and for deferred cash plans
,
it is determined based on the
outstanding amount of cash owed to award recipients.
GEB and KRTs deferred compensation
1,2,3
USD million, except where indicated
Relating to awards
for 2021
4
Relating to
awards for prior
years
5
Total
of which: exposed to
ex-post explicit and /
or implicit adjustments
Total deferred
compensation
year-end 2020
Total amount of
deferred compensation
paid out in 2021
6
GEB
Deferred Contingent Capital Plan
Equity Ownership Plan (including notional funds)
Long-Term Incentive Plan
KRTs
Deferred Contingent Capital Plan
Equity Ownership Plan (including notional funds)
Long-Term Incentive Plan
Total GEB and KRTs
1 Based on the specific plan vesting and reflecting the economic value of the outstanding awards, which may differ from the expense recognized in the income statement in accordance with IFRS. Year -to-year
reconciliations would also need to consider the imp acts of additional items including off-cycle awards, FX movements, population changes, and dividend equivalent reinvestments. 2 Refer to “Note 28 Employee
benefits: variable compensation” in the “Consolidated financial statements” section of the Annual Report 2021 for more information. 3 GEB members and KRTs who are also MRTs do not receive dividend and
interest payments. Accordingly, the amounts for the EOP / LTIP reflect the fair value of the non-dividend-bearing awards and for the DCCP the fair value of the granted non-interest-bearing awards. 4 Where
applicable, amounts are translated into US dollars at the performance award currency exchange rate. LTIP values reflect the fair value awarded at grant. 5 Takes into account the ex-post implicit adjustments, given
the share price movements since grant. Where applicable, amounts are translated from award currency into US dollars using FX rates as of 31 December 2021. LTIP values reflect the fair value awarded at grant. 6
Valued at distribution price and FX rate for all awards distributed in 2021.
The table below shows the value of actual ex-post explicit and
implicit adjustments to outstanding deferred compensation in the
2021 financial year for GEB members and KRTs.
Ex-post adjustments occur after an award has been granted.
Explicit adjustments occur when we adjust compensation by
forfeiting deferred awards. Implicit adjustments are unrelated to
any action taken by the firm and occur as a result of price
movements that affect the value of an award.
The total value of ex-post explicit adjustments made to UBS
share awards in 2021, based on the approximately 8.1 million
shares forfeited during 2021, is a reduction of USD 142 million.
GEB and KRTs ex-post explicit and implicit adjustments to deferred compensation
Ex-post explicit adjustments
to unvested awards
1
Ex-post implicit adjustments
to unvested awards
2
USD million
31.12.21
31.12.20
31.12.21
31.12.20
GEB
Deferred Contingent Capital Plan
Equity Ownership Plan (including notional funds, if applicable)
Long-Term Incentive Plan
KRTs
Deferred Contingent Capital Plan
Equity Ownership Plan (including notional funds)
Long-Term Incentive Plan
Total GEB and KRTs
1 For notional share awards, ex-post explicit adjustments are calculated as units forfeited during the year, valued at the share price on 31 December 2021 (USD 17.87) for 2021 (which may differ from the expense
recognized in the income statement in accordance with IFRS). The 2020 data is valued using the share price on 31 December 2020 (USD 14.13). For LTIP the forfeited units reflect the fair value awarded at grant. For
the notional funds awarded to Asset Management employees under the EOP, this represents the forfeiture credits recognized in 2021 and 2020. For the DCCP, the fair value at grant of the forfeited awards during the
year is reflected. 2 Ex-post implicit adjustments for UBS shares are calculated based on the difference between the weighted average grant date fair value and the share price at year-end. The amount for notional
funds is calculated using the mark-to-market change during 2021 and 2020. For the GEB member who was appointed to the GEB during 2021, awards have been fully reflected in the GEB entries.
Advisory vote
Corporate governance and compensation | Compensation
264
Material Risk Takers
For relevant EU- or UK-regulated entities, we identify individuals
who are deemed to be Material Risks Takers (MRTs) based on local
regulatory requirements, including the respective EU Commission
Delegated Regulation, the fifth iteration of the EU Capital
Requirements Directive (CRD V) and equivalent UK requirements,
as applicable. This group consists of senior management, risk
takers, selected staff in control or support functions and certain
highly-compensated employees. For 2021, UBS identified 683
MRTs in relation to its relevant EU or UK entities.
Variable compensation awarded to MRTs is subject to
additional deferral and other requirements. These include a
maximum variable to fixed compensation ratio of 200% based on
approval through relevant shareholder votes, a minimum deferral
rate of 40% or 60% (depending on role / variable compensation
level) on performance awards and delivery of at least 50% of any
upfront performance award in UBS shares that are vested but
blocked for 12 months after grant.
Deferred awards granted to MRTs under UBS’s deferred
compensation plans for their performance in 2021 are subject to
6- or 12-month blocking periods post vesting and do not pay out
dividends or interest during the deferral period.
For up to seven years after grant, performance awards granted
to MRTs are subject to clawback provisions, which allow the firm
to claim repayment of both the upfront and the vested deferred
element of any performance award if an individual is found to
have contributed substantially to significant financial losses for the
Group or corporate structure in scope, a material downward
restatement of disclosed results, or engaged in misconduct and /
or failed to take expected actions that contributed to significant
reputational harm.
LTIP awards granted to UK MRTs and SMFs are subject to an
additional non-financial conduct-related metric as required by UK
regulation.
UK Senior Managers and Certification Regime
The Senior Managers and Certification Regime (the SMCR) of the
UK Prudential Regulation Authority and Financial Conduct
Authority requires that individuals with specified responsibilities,
performing certain significant functions and / or those in certain
other identified categories be designated as SMFs.
Subject to de minimis and other compensation-related
considerations, variable compensation awards made to SMFs
must comply with specific requirements, including longer deferral,
blocking and clawback periods. The deferral period for SMFs is
seven years, with the deferred performance awards vesting no
faster than pro rata from years 3 to 7, except those who have total
compensation below GBP 500,000 and variable incentive
accounting for less than 33% of total compensation, for whom a
five-year deferral period (instead of a seven-year period) applies.
Such awards are also subject to a 12-month blocking period post
vesting. The clawback policy for SMFs permits clawback for up to
10 years from the date of performance award grants (applicable
if an individual is subject to an investigation at the end of the
initial seven-year clawback period). All SMFs are also MRTs and, as
such, subject to the same prohibitions on dividend and interest
payments.
Control functions and Group Internal Audit
Our control functions must be independent in order to monitor
risk effectively. Therefore
,
their compensation is determined
separately from the revenue areas that they oversee, supervise or
monitor. Their performance award pool is based not on the
performance of these businesses, but on the performance of the
Group as a whole. We also consider other factors, such as how
effectively the function has performed and our market position.
Decisions on individual compensation for the senior managers of
the control
functions are made by the function heads and
approved by the Group CEO. Decisions on individual
compensation for the members of Group Internal Audit (GIA) are
made by the Head GIA and approved by the Chairman. Following
a proposal by the Chairman, total compensation for the Head GIA
is approved by the Compensation Committee.
265
2021 Group personnel expenses
The number of personnel employed as of 31 December 2021 was
broadly stable, at 71,385 (full-time equivalents), a net decrease of
166 compared with 31 December 2020.
The table below shows our total personnel expenses for 2021,
including salaries, pension expenses, social security contributions,
variable compensation and other personnel costs. Variable
compensation includes cash performance awards paid in 2022 for
the 2021 performance year, amortization of unvested deferred
awards granted in previous years and the cost of deferred awards
granted to employees
that
are eligible for retirement in the
context of the compensation framework at the date of grant.
The performance award pool reflects the value of performance
awards granted relating to the 2021 performance year, including
awards that are paid out immediately and those that are deferred.
To determine our variable compensation expenses, the following
adjustments are required in order to reconcile the performance
award pool to the expenses recognized in the Group’s financial
statements prepared in accordance with IFRS:
–
reduction for expenses deferred to future periods (amortization
of unvested awards granted in 2022 for the 2021 performance
year) and accounting adjustments; and
–
addition for 2021 amortization of unvested deferred awards
granted in prior years.
As a large part of compensation consists of deferred awards,
the amortization of unvested deferred awards granted in prior
years forms a significant part of the IFRS expenses in both 2021
and 2022.
›
Refer to “Note 6 Personnel expenses” and “Note 28 Employee
benefits: variable compensation” in the “Consolidated financial
statements” section of our Annual Report 2021 for more
information
Personnel expenses
Expenses recognized in the IFRS income statement
USD million
Related to the
performance year 2021
Related to prior
performance years
Total expenses
recognized in
2021
Total expenses
recognized in
2020
Total expenses
recognized in
2019
Salaries
1
Non-deferred cash
Deferred compensation awards
of which: Equity Ownership Plan
of which: Deferred Contingent Capital Plan
of which: Long-Term Incentive Plan
of which: Asset Management EOP
Variable compensation – performance awards
2
Variable compensation – other
2,3
Total variable compensation excluding financial advisor variable compensation
Contractors
Social security
Pension and other post-employment benefit plans
4
Financial advisor variable compensation
2,5
Other personnel expenses
Total personnel expenses
1 Includes role-based allowances. 2 Refer to “Note 28 Employee benefits: variable compensation” in the “Consolidated financial statements” section of our Annual Report 2021 for more information. 3 Consists
of replacement payments, forfeiture credits, severance payments, retention plan payments and interest expense related to the Deferred Contingent Capital Plan. 4 Refer to “Note 27 Pension and other post-
employment benefit plans” in the “Consolidated financial statements” section of our Annual Report 2021 for more information. 5 Consists of formulaic compensation based directly on compensable revenues
generated by financial advisors and supplemental compensation calculated based on financial advisor productivity, firm tenure, new assets and other variables. It also includes expenses related to compensation
commitments with financial advisors entered into at the time of recruitment that are subject to vesting requirements.
Advisory vote
Corporate governance and compensation | Compensation
266
Deferred compensation
Vesting of outstanding awards granted in prior years subject to performance conditions
The tables below show the extent to which the performance conditions for awards granted in prior years have been met and the
percentage of the installment that will vest in 2022.
Equity Ownership Plan (EOP) 2016 / 2017, EOP 2017 / 2018, EOP 2018 / 2019 and EOP 2019 / 2020
Performance conditions
Performance achieved
1
% of installment vesting
Return on common equity tier 1 capital
(RoCET1) and divisional return on
attributed equity
The Group and divisional performance conditions have been satisfied. For EOP
2016 / 2017, the third and final installment for the Group Executive Board (the
GEB) members vests in full. For EOP 2017 / 2018, the second installment for the
GEB members vests in full. For EOP 2018 / 2019, the first installment for the GEB
members and the second installment for all other employees covered under the
plan vest in full. For EOP 2019 / 2020, the first installment for all other employees
covered under the plan vests in full.
100%
Deferred Contingent Capital Plan (DCCP) 2016 / 2017
Performance conditions
Performance achieved
1
% of installment vesting
Common equity tier 1 (CET1) capital
ratio, viability event and, additionally for
GEB, Group profit before tax
The performance conditions have been satisfied. DCCP 2016 / 2017 vests in full.
100%
1
.
267
List of tables
Page
268
268
269
269
270
270
270
Advisory vote
Corporate governance and compensation | Compensation
268
Audited |
Share ownership / entitlements of GEB members
1
Name, function
on
31 December
Number of
unvested
shares / at
risk
2
Number of
vested shares
Total number
of shares
Potentially
conferred
voting
rights in %
Ralph A.J.G. Hamers, Group Chief Executive Officer
2021
2020
Christian Bluhm, Group Chief Risk Officer
2021
2020
Mike Dargan, Group Chief Digital and Information Officer
2021
2020
-
-
-
-
Markus U. Diethelm, former Group General Counsel
2021
-
-
-
-
2020
Kirt Gardner, Group Chief Financial Officer
2021
2020
Suni Harford, President Asset Management
2021
2020
Robert Karofsky, President Investment Bank
2021
2020
Sabine Keller-Busse, President Personal & Corporate Banking and President UBS Switzerland
2021
2020
Iqbal Khan, Co-President Global Wealth Management and President EMEA
2021
2020
Edmund Koh, President Asia Pacific
2021
2020
Axel P. Lehmann, former President Personal & Corporate Banking and President UBS Switzerland
2021
-
-
-
-
2020
Barbara Levi, Group General Counsel
2021
2020
-
-
-
-
Tom Naratil, Co-President Global Wealth Management and President UBS Americas
2021
2020
Piero Novelli, former Co-President Investment Bank
2021
-
-
-
-
2020
Markus Ronner, Group Chief Compliance and Governance Officer
2021
2020
Total
2021
2020
1 Includes all vested and unvested shares of GEB members, including those held by related parties. No options were held in 2021 and 2020 by any GEB member or any of its related parties. Refer to “Note 28 Employee
benefits: variable compensation” in the “Consolidated financial statements” section of our Annual Report 2021 for more information. 2 Includes shares granted under variable compensation plans with forfeiture
provisions. LTIP values reflect the fair value awarded at grant. The actual number of shares vesting in the future will be calculated under the terms of the plans. Refer to the “Group compensation” section of this
report for more information about the plans.
p
Audited |
Total of all vested and unvested shares of GEB members
1,2
Total
of which: vested
of which: vesting
2022
2023
2024
2025
2026
2027
Shares on 31 December 2021
2021
2022
2023
2024
2025
2026
Shares on 31 December 2020
1 Includes shares held by related parties. 2 Includes shares granted under variable compensation plans with forfeiture provisions. The actual number of shares vesting in the future will be calculated under the terms
of the plans. Refer to the “Group compensation” section of this report for more information.
p
269
Audited |
Number of shares of BoD members
1
Name, function
on 31 December
Number of shares held
Voting rights in %
Axel A. Weber, Chairman
2021
2020
Jeremy Anderson, Vice Chairman and Senior Independent Director
2021
2020
Claudia Böckstiegel, member
2
2021
2020
-
-
William C. Dudley, member
2021
2020
Patrick Firmenich, member
2
2021
2020
-
-
Reto Francioni, member
2021
2020
Fred Hu, member
2021
2020
Mark Hughes, member
2021
2020
Nathalie Rachou, member
2021
2020
Julie G. Richardson, member
2021
2020
Beatrice Weder di Mauro, former member
2
2021
-
-
2020
Dieter Wemmer, member
2021
2020
Jeanette Wong, member
2021
2020
Total
2021
2020
1 Includes blocked and unblocked shares held by BoD members, including those held by related parties. No options were granted in 2021 and 2020. 2 At the 2021 AGM, Claudia Böckstiegel and Patrick Firmenich
were newly elected and Beatrice Weder di Mauro did not stand for re-election.
p
Audited |
Total of all blocked and unblocked shares of BoD members
1
Total
of which:
unblocked
of which: blocked until
2022
2023
2024
2025
Shares on 31 December 2021
2021
2022
2023
2024
Shares on 31 December 2020
1 Includes shares held by related parties.
p
Advisory vote
Corporate governance and compensation | Compensation
270
Audited |
Loans granted to GEB members
1
In line with article 38 of the Articles of Association of UBS Group
AG, GEB members may be granted loans. Such loans are made in
the ordinary course of business on substantially the same terms as
those granted to other employees, including interest rates
and collateral, and neither involve more than the normal risk of
collectability nor contain any other unfavorable features for the
firm. The total amount of such loans must not exceed CHF 20
million per GEB member.
CHF, except where indicated
2
USD
(for reference)
Name, function
on 31 December
Loans
3
Loans
3
Christian Bluhm, Group Chief Risk Officer (highest loan in 2021)
2021
Markus U. Diethelm, Group General Counsel (highest loan in 2020)
2020
Aggregate of all GEB members
4
2021
2020
1 No loans have been granted to related parties of the GEB members at conditions not customary in the market. 2 Swiss franc and US dollar amounts disclosed represent local currency amounts translated at the
relevant year-end closing exchange rate. 3 All loans granted are secured loans. 4 No unused uncommitted credit facilities in 2021 and 2020.
p
Audited |
Loans granted to BoD members
1
In line with article 33 of the Articles of Association of UBS Group
AG, loans to independent BoD members are made in the ordinary
course of business at general market conditions. The Chairman,
as a non-independent member, may be granted loans in the
ordinary course of business on substantially the same terms as
those granted to employees, including interest rates and
collateral, and neither involve more than the normal risk of
collectability nor contain any other unfavorable features for the
firm. The total amount of such loans must not exceed CHF 20
million per BoD member.
CHF, except where indicated
2
USD
(for reference)
on 31 December
Loans
3,4
Loans
3,4
Aggregate of all BoD members
2021
2020
1 No loans have been granted to related parties of the BoD members at conditions not customary in the market. 2 Swiss franc and US dollar amounts disclosed represent local currency amounts translated at the
relevant year-end closing exchange rate. 3 All loans granted are secured loans. 4 CHF 1,500,00 for Reto Francioni in 2021 and CHF 600,000 for Reto Francioni and CHF 1,500,000 for Beatrice Weder di Mauro
in 2020.
p
Audited |
Compensation paid to former BoD and GEB members
1
CHF, except where indicated
2
USD
(for reference)
For the year
Compensation
Benefits
Total
Total
Former BoD members
2021
2020
Aggregate of all former GEB members
3
2021
2020
Aggregate of all former BoD and GEB members
2021
2020
1 Compensation or remuneration that is related to the former members’ activity on the BoD or GEB or that is not at market conditions. 2 Swiss franc and US dollar amounts disclosed represent local currency amounts
translated at the relevant year-end closing exchange rate. 3 Includes benefit payments in 2021 and 2020 to two former GEB members.
271
Provisions of the Articles of Association related to compensation
Swiss say-on-pay provisions give
shareholders of companies listed in
Switzerland significant influence over
board and management compensation.
At UBS, this is achieved by means of an
annual binding say-on-pay vote in
accordance with the following provisions
of the Articles of Association (the AoA).
Say on pay
In line with article 43 of the AoA of UBS
Group AG, the General Meeting approves
proposals from the BoD in relation to:
a) the maximum aggregate amount of
compensation of the BoD for the period
until the next AGM;
b) the maximum aggregate amount of
fixed compensation of the GEB for the
following financial year; and
c) the aggregate amount of variable
compensation of the GEB for the
preceding financial year.
The BoD may submit for approval by the
General Meeting deviating or additional
proposals relating to the same or different
periods. If the General Meeting does not
approve a proposal from the BoD, the
BoD will determine, taking into account
all relevant factors, the respective
(maximum) aggregate amount or
(maximum) partial amounts and submit
the amount(s) so determined for approval
by the General Meeting. UBS Group AG
or companies controlled by it may pay or
grant compensation prior to approval by
the General Meeting, subject to
subsequent approval.
Principles of compensation
In line with articles 45 and 46 of the AoA
of UBS Group AG, compensation of the
members of the BoD includes base
remuneration and may include other
compensation elements and benefits.
Compensation of the members of the
BoD is intended to recognize the
responsibility and governance nature of
their role, to attract and retain qualified
individuals, and to ensure alignment with
shareholders’ interests.
Compensation of the members of the
GEB includes fixed and variable
compensation elements. Fixed
compensation includes the base salary
and may include other compensation
elements and benefits. Variable
compensation elements are governed by
financial and non-financial performance
measures that take into account the
performance of UBS Group AG and / or
parts thereof, targets in relation to the
market, other companies or comparable
benchmarks, short- and long-term
strategic objectives, and / or individual
targets. The BoD or, where delegated to
it, the Compensation Committee
determines the respective performance
measures, the overall and individual
performance targets, and their
achievement. The BoD or, where
delegated to it, the Compensation
Committee aims to ensure alignment with
sustainable performance and appropriate
risk-taking through adequate deferrals,
forfeiture conditions, caps on
compensation, harmful acts provisions
and similar means with regard to parts of
or all of the compensation. Parts of
variable compensation are subject to a
multi-year vesting period.
Additional amount for GEB members
appointed after the vote on the
aggregate amount of compensation by
the AGM
In line with article 46 of the AoA of UBS
Group AG, if the maximum aggregate
amount of compensation already
approved by the General Meeting is not
sufficient to also cover the compensation
of a person who becomes a member of or
is being promoted within the GEB after
the General Meeting has approved the
compensation, UBS Group AG, or
companies controlled by it, is authorized
to pay or grant each such GEB member a
supplementary amount during the
compensation period(s) already approved.
The aggregate pool for such
supplementary amounts per
compensation period cannot exceed 40%
of the average of total annual
compensation paid or granted to the GEB
during the previous three years.
›
Refer to
ubs.com/governance
for more
information
Advisory vote
Corporate governance and compensation | Compensation
272
Financial
statements
5
274
Consolidated
financial statements
Table of contents
276
277
278
283
283
283
284
285
286
288
289
291
291
1
308
2
311
311
3
312
4
312
5
313
6
313
7
314
8
317
317
9
322
10
324
11
324
12
325
13
327
14
327
15
328
16
329
17
330
18
336
19
337
337
20
348
21
364
22
366
23
369
24
370
25
373
26
377
27
387
28
391
29
396
30
397
31
399
32
400
33
400
34
401
35
275
403
404
405
406
407
409
413
413
413
414
415
416
418
419
422
422
1
439
2
442
442
3
443
4
443
5
444
6
444
7
445
8
448
448
9
453
10
455
11
455
12
456
13
458
14
458
15
459
16
460
17
461
18
467
19
468
468
20
479
21
496
22
498
23
501
24
502
25
505
26
509
27
519
28
523
29
528
30
529
31
532
32
533
33
533
34
534
35
536
36
276
reporting
Management’s responsibility for internal control over financial
reporting
The Board of Directors and management of UBS Group AG (UBS)
are responsible for establishing and maintaining adequate internal
control over financial reporting. UBS’s internal control over
financial reporting is designed to provide reasonable assurance
regarding the preparation and fair presentation of published
financial statements in accordance with International Financial
Reporting Standards (IFRS), as issued by the International
Accounting Standards Board (IASB).
UBS’s internal control over financial reporting includes those
policies and procedures that:
–
pertain to the maintenance of records that, in reasonable
detail, accurately and fairly reflect transactions and dispositions
of assets;
–
provide reasonable assurance that transactions are recorded as
necessary to permit preparation and fair presentation of
financial statements, and that receipts and expenditures of the
company are being made only in accordance with
authorizations of UBS management; and
–
provide reasonable assurance regarding prevention or timely
detection of unauthorized acquisition, use or disposition of the
company’s assets that could have a material effect on the
financial statements.
Because of its inherent limitations, internal control over
financial reporting may not prevent or detect misstatements. Also,
projections of any evaluation of effectiveness to future periods are
subject to the risk that controls may become inadequate because
of changes in conditions, or that the degree of compliance with
the policies or procedures may deteriorate.
Management’s assessment of internal control over financial
reporting as of 31 December
2021
UBS management has assessed the effectiveness of UBS’s internal
control over financial reporting as of 31 December 2021 based on
the criteria set forth by the Committee of Sponsoring
Organizations of the Treadway Commission (COSO) in Internal
Control – Integrated Framework (2013 Framework). Based on this
assessment, management believes that, as of 31 December 2021,
UBS’s internal control over financial reporting was effective.
The effectiveness of UBS’s internal control over financial
reporting as of 31 December 2021 has been audited by Ernst &
Young Ltd, UBS’s independent registered public accounting firm, as
stated in their report appearing on page 277, which expresses an
unqualified opinion on the effectiveness of UBS’s internal control
over financial reporting as of 31 December 2021.
277
278
279
280
281
282
283
UBS Group AG consolidated financial
statements
Primary financial statements and share information
Audited |
Income statement
For the year ended
USD million
Note
31.12.21
31.12.20
31.12.19
Interest income from financial instruments measured at amortized cost and fair value through
other comprehensive income
8,533
8,810
10,684
Interest expense from financial instruments measured at amortized cost
(3,259)
(4,247)
(7,194)
Net interest income from financial instruments measured at fair value through profit or loss
1,431
1,299
1,011
Net interest income
6,705
5,862
4,501
Other net income from financial instruments measured at fair value through profit or loss
5,850
6,960
6,842
Credit loss (expense) / release
148
(694)
(78)
Fee and commission income
24,372
20,961
19,110
Fee and commission expense
(1,985)
(1,775)
(1,696)
Net fee and commission income
22,387
19,186
17,413
Other income
452
1,076
212
Total operating income
35,542
32,390
28,889
Personnel expenses
18,387
17,224
16,084
General and administrative expenses
5,553
4,885
5,288
Depreciation, amortization and impairment of non-financial assets
12, 13
2,118
2,126
1,940
Total operating expenses
26,058
24,235
23,312
Operating profit / (loss) before tax
9,484
8,155
5,577
Tax expense / (benefit)
1,998
1,583
1,267
Net profit / (loss)
7,486
6,572
4,310
Net profit / (loss) attributable to non-controlling interests
29
15
6
Net profit / (loss) attributable to shareholders
7,457
6,557
4,304
Earnings per share (USD)
Basic
2.14
1.83
1.17
Diluted
2.06
1.77
1.14
Consolidated financial statements | UBS Group AG consolidated financial statements
284
Statement of comprehensive income
For the year ended
USD million
Note
31.12.21
31.12.20
31.12.19
Comprehensive income attributable to shareholders
Net profit / (loss)
7,457
6,557
4,304
Other comprehensive income that may be reclassified to the income statement
Foreign currency translation
Foreign currency translation movements related to net assets of foreign operations, before tax
(1,076)
2,103
200
Effective portion of changes in fair value of hedging instruments designated as net investment hedges, before tax
498
(936)
(134)
Foreign currency translation differences on foreign operations reclassified to the income statement
(2)
(7)
52
Effective portion of changes in fair value of hedging instruments designated as net investment hedges reclassified to
the income statement
10
2
(14)
Income tax relating to foreign currency translations, including the effect of net investment hedges
35
(67)
0
Subtotal foreign currency translation, net of tax
(535)
1,095
104
Financial assets measured at fair value through other comprehensive income
11
Net unrealized gains / (losses), before tax
(203)
223
189
Net realized gains / (losses) reclassified to the income statement from equity
(9)
(40)
(31)
Income tax relating to net unrealized gains / (losses)
55
(48)
(41)
Subtotal financial assets measured at fair value through other comprehensive income, net of tax
(157)
136
117
Cash flow hedges of interest rate risk
26
Effective portion of changes in fair value of derivative instruments designated as cash flow hedges, before tax
(992)
2,012
1,571
Net (gains) / losses reclassified to the income statement from equity
(1,073)
(770)
(175)
Income tax relating to cash flow hedges
390
(231)
(253)
Subtotal cash flow hedges, net of tax
(1,675)
1
1,011
1,143
Cost of hedging
26
Cost of hedging, before tax
(32)
(13)
Income tax relating to cost of hedging
6
0
Subtotal cost of hedging, net of tax
(26)
(13)
Total other comprehensive income that may be reclassified to the income statement, net of tax
(2,393)
2,230
1,363
Other comprehensive income that will not be reclassified to the income statement
Defined benefit plans
27
Gains / (losses) on defined benefit plans, before tax
2
(327)
(146)
Income tax relating to defined benefit plans
(7)
109
(41)
Subtotal defined benefit plans, net of tax
(5)
(218)
(186)
Own credit on financial liabilities designated at fair value
21
Gains / (losses) from own credit on financial liabilities designated at fair value, before tax
46
(293)
(400)
Income tax relating to own credit on financial liabilities designated at fair value
0
0
8
Subtotal own credit on financial liabilities designated at fair value, net of tax
46
(293)
(392)
Total other comprehensive income that will not be reclassified to the income statement, net of tax
42
(511)
(578)
Total other comprehensive income
(2,351)
1,719
785
Total comprehensive income attributable to shareholders
5,106
8,276
5,089
Comprehensive income attributable to non-controlling interests
Net profit / (loss)
29
15
6
Total other comprehensive income that will not be reclassified to the income statement, net of tax
(16)
21
(4)
Total comprehensive income attributable to non-controlling interests
13
36
2
Total comprehensive income
Net profit / (loss)
7,486
6,572
4,310
Other comprehensive income
(2,367)
1,740
781
of which: other comprehensive income that may be reclassified to the income statement
(2,393)
2,230
1,363
of which: other comprehensive income that will not be reclassified to the income statement
26
(490)
(582)
Total comprehensive income
5,119
8,312
5,091
1 Mainly reflects the reclassification of net gains on hedging instruments from OCI to the income statement as the hedged forecast cash flows affected profit or loss and a decrease in net unrealized gains on US dollar
hedging derivatives resulting from increases in the relevant long-term US dollar interest rates.
285
Balance sheet
USD million
Note
31.12.21
31.12.20
Assets
Cash and balances at central banks
192,817
158,231
Loans and advances to banks
15,480
15,444
Receivables from securities financing transactions
9, 22
75,012
74,210
Cash collateral receivables on derivative instruments
9, 22
30,514
32,737
Loans and advances to customers
397,761
379,528
Other financial assets measured at amortized cost
9, 14a
26,209
27,194
Total financial assets measured at amortized cost
737,794
687,345
Financial assets at fair value held for trading
130,821
125,397
of which: assets pledged as collateral that may be sold or repledged by counterparties
43,397
47,098
Derivative financial instruments
10, 21, 22
118,142
159,617
Brokerage receivables
21,839
24,659
Financial assets at fair value not held for trading
60,080
80,364
Total financial assets measured at fair value through profit or loss
330,882
390,037
Financial assets measured at fair value through other comprehensive income
11, 21
8,844
8,258
Investments in associates
29b
1,243
1,557
Property, equipment and software
12,888
13,109
Goodwill and intangible assets
6,378
6,480
Deferred tax assets
8,876
9,212
Other non-financial assets
14b
10,277
9,768
Total assets
1,117,182
1,125,765
Liabilities
Amounts due to banks
13,101
11,050
Payables from securities financing transactions
5,533
6,321
Cash collateral payables on derivative instruments
31,798
37,312
Customer deposits
542,007
524,605
Debt issued measured at amortized cost
139,155
139,232
Other financial liabilities measured at amortized cost
19a
9,001
9,729
Total financial liabilities measured at amortized cost
740,595
728,250
Financial liabilities at fair value held for trading
31,688
33,595
Derivative financial instruments
10, 21, 22
121,309
161,102
Brokerage payables designated at fair value
44,045
38,742
Debt issued designated at fair value
16, 21
73,799
61,243
Other financial liabilities designated at fair value
19b, 21
30,074
30,387
Total financial liabilities measured at fair value through profit or loss
300,916
325,069
Provisions
18a
3,518
2,828
Other non-financial liabilities
19c
11,151
9,854
Total liabilities
1,056,180
1,066,000
Equity
Share capital
322
338
Share premium
15,928
16,753
Treasury shares
(4,675)
(4,068)
Retained earnings
43,851
38,776
Other comprehensive income recognized directly in equity, net of tax
5,236
7,647
Equity attributable to shareholders
60,662
59,445
Equity attributable to non-controlling interests
340
319
Total equity
61,002
59,765
Total liabilities and equity
1,117,182
1,125,765
Consolidated financial statements | UBS Group AG consolidated financial statements
286
Statement of changes in equity
USD million
Share
capital
Share
premium
Treasury shares
Retained
earnings
Balance as of 31 December 2018
338
20,843
(2,631)
30,416
Effect of adoption of IFRIC 23
(11)
Balance as of 1 January 2019 after the adoption of IFRIC 23
338
20,843
(2,631)
30,405
Acquisition of treasury shares
(1,771)
2
Delivery of treasury shares under share-based compensation plans
(886)
983
Other disposal of treasury shares
(2)
94
2
Premium on shares issued and warrants exercised
29
Share-based compensation expensed in the income statement
619
Tax (expense) / benefit
11
Dividends
(2,544)
3
Translation effects recognized directly in retained earnings
(9)
New consolidations / (deconsolidations) and other increases / (decreases)
(6)
Total comprehensive income for the year
3,726
of which: net profit / (loss)
4,304
of which: OCI, net of tax
(578)
Balance as of 31 December 2019
338
18,064
(3,326)
34,122
Acquisition of treasury shares
(1,584)
2
Delivery of treasury shares under share-based compensation plans
(628)
719
Other disposal of treasury shares
(11)
123
2
Share-based compensation expensed in the income statement
691
Tax (expense) / benefit
18
Dividends
(1,304)
3
(1,304)
3
Translation effects recognized directly in retained earnings
(49)
Share of changes in retained earnings of associates and joint ventures
(40)
New consolidations / (deconsolidations) and other increases / (decreases)
4
(76)
Total comprehensive income for the year
6,046
of which: net profit / (loss)
6,557
of which: OCI, net of tax
(511)
Balance as of 31 December 2020
338
16,753
(4,068)
38,776
Acquisition of treasury shares
(3,521)
2
Delivery of treasury shares under share-based compensation plans
(675)
789
Other disposal of treasury shares
7
81
2
Cancellation of treasury shares related to the 2018–2021 share repurchase program
5
(16)
(236)
2,044
(1,792)
Share-based compensation expensed in the income statement
643
Tax (expense) / benefit
(88)
Dividends
(651)
3
(651)
3
Equity classified as obligation to purchase own shares
(7)
Translation effects recognized directly in retained earnings
18
Share of changes in retained earnings of associates and joint ventures
1
New consolidations / (deconsolidations) and other increases / (decreases)
6
182
Total comprehensive income for the year
7,499
of which: net profit / (loss)
7,457
of which: OCI, net of tax
42
Balance as of 31 December 2021
322
15,928
(4,675)
43,851
1 Excludes other comprehensive income related to defined benefit plans and own credit, which is recorded directly in Retained earnings. 2 Includes treasury shares acquired and disposed of by the Investment Bank
in its capacity as a market-maker with regard to UBS shares and related derivatives, and to hedge certain issued structured debt instruments. These acquisitions and disposals are reported based on the sum of the net
monthly movements. 3 Reflects the payment of an ordinary cash dividend of USD
0.37
0.73
, 2019: CHF
0.70
) per dividend-bearing share. From 2020 onward, Swiss tax law effective 1 January 2020
requires that Switzerland-domiciled companies with shares listed on a stock exchange pay no more than
50
% of dividends from capital contribution reserves, with the remainder required to be paid from retained
earnings. 4 Mainly relates to the establishment of a banking partnership with Banco do Brasil. In 2020, UBS issued a
49.99
% stake in UBS Brasil Serviços in exchange for exclusive access to Banco do Brasil’s
corporate clients. Upon completion of the transaction in 2020, equity attributable to non-controlling interests increased by USD
115
the cancellation of
156,632,400
Swiss tax law effective 1 January 2020 requires Switzerland-domiciled companies with shares listed on a Swiss stock exchange to reduce capital contribution reserves by at least
50
% of the total capital reduction
amount exceeding the nominal value upon cancellation of the shares. 6 Includes the effects related to the launch of UBS’s new operational partnership entity with Sumitomo Mitsui Trust Holdings, Inc. Refer to
Note 30 for more information.
287
Other comprehensive
income recognized
directly in equity,
net of tax
1
of which:
foreign currency
translation
of which:
financial assets at
fair value through OCI
of which:
cash flow
hedges
of which:
cost of hedging
Total equity
attributable to
shareholders
Non-controlling
interests
Total equity
3,930
3,924
(103)
109
52,896
176
53,071
(11)
(11)
3,930
3,924
(103)
109
52,885
176
53,060
(1,771)
(1,771)
97
97
92
92
29
29
619
619
11
11
(2,544)
(8)
(2,552)
9
0
9
0
0
(6)
5
(1)
1,363
104
117
1,143
5,089
2
5,091
4,304
6
4,310
1,363
104
117
1,143
785
(4)
781
5,303
4,028
14
1,260
54,501
174
54,675
(1,584)
(1,584)
90
90
112
112
691
691
18
18
(2,607)
(6)
(2,613)
49
0
49
0
0
(40)
(40)
65
65
(12)
115
103
2,230
1,095
136
1,011
(13)
8,276
36
8,312
6,557
15
6,572
2,230
1,095
136
1,011
(13)
1,719
21
1,740
7,647
5,188
151
2,321
(13)
59,445
319
59,765
(3,521)
(3,521)
114
114
88
88
0
0
643
643
(88)
(88)
(1,301)
(4)
(1,305)
(7)
(7)
(18)
0
(18)
0
0
0
1
1
182
12
193
(2,393)
(535)
(157)
(1,675)
(26)
5,106
13
5,119
7,457
29
7,486
(2,393)
(535)
(157)
(1,675)
(26)
(2,351)
(16)
(2,367)
5,236
4,653
(7)
628
(39)
60,662
340
61,002
Consolidated financial statements | UBS Group AG consolidated financial statements
288
Share information and earnings per share
Ordinary share capital
As of 31 December 2021, UBS Group AG had
3,702,422,995
issued shares with a nominal value of CHF
0.10
a share capital of CHF
370,242,299.50
. Shares issued decreased
by
157
16
2021, as the
156,632,400
share repurchase program were canceled by means of a capital
reduction, as approved by shareholders at the 2021 Annual
General Meeting.
Conditional share capital
As of 31 December 2021, the following conditional share capital
was available to UBS Group AG’s Board of Directors (BoD):
–
A maximum of CHF
38,000,000
380,000,000
of CHF
0.10
mandatory exercise of conversion rights and / or warrants
granted in connection with the issuance of bonds or similar
financial instruments on national or international capital
markets. This conditional capital allowance was approved at
the
Extraordinary General Meeting (the EGM) held on
26 November 2014, having originally been approved at the
Annual General Meeting (AGM) of UBS AG on 14 April 2010.
The BoD has not made use of such allowance.
–
A maximum of CHF
12,170,583
121,705,830
fully paid registered shares with a nominal value of CHF
0.10
each, to be issued upon exercise of employee options and
stock appreciation rights issued to employees and members of
the management and of the BoD of UBS Group AG and its
subsidiaries. This conditional capital allowance was approved
by the shareholders at the same EGM in 2014.
Authorized share capital
UBS Group AG had no authorized capital available to issue on
31 December
2021
.
Share repurchase programs
In March 2018, UBS initiated a share repurchase program of up
to CHF
2
repurchas
ed
8
million sha
res
for a total acquisition cost of
USD
112
31
acquisition cost of USD
364
The 2018–2021 program was completed on 2 February 2021
and the
156,632,400
repurchase program were canceled by means of a capital
reduction, as approved by shareholders at the 2021 Annual
General Meeting.
In February 2021, UBS commenced a new three-year share
repurchase program of up to CHF
4
UBS repurchased
153
cost of USD
2,500
2,294
.
As of or for the year ended
31.12.21
31.12.20
31.12.19
Shares outstanding
Shares issued
Balance at the beginning of the year
3,859,055,395
3,859,055,395
3,855,634,749
Shares issued
3,420,646
Shares canceled
(156,632,400)
1
Balance at the end of the year
3,702,422,995
3,859,055,395
3,859,055,395
Treasury shares
Balance at the beginning of the year
307,477,002
243,021,296
166,467,802
Acquisitions
214,270,175
128,372,257
146,876,692
Disposals
(62,299,449)
(63,916,551)
(70,323,198)
Cancellation of second trading line treasury shares
(156,632,400)
1
Balance at the end of the year
302,815,328
307,477,002
243,021,296
Shares outstanding
3,399,607,667
3,551,578,393
3,616,034,099
Basic and diluted earnings (USD million)
Net profit / (loss) attributable to shareholders for basic EPS
7,457
6,557
4,304
Less: (profit) / loss on own equity derivative contracts
0
(1)
0
Net profit / (loss) attributable to shareholders for diluted EPS
7,457
6,556
4,304
Weighted average shares outstanding
Weighted average shares outstanding for basic EPS
2
3,482,963,682
3,583,176,189
3,663,278,238
Effect of dilutive potential shares resulting from notional employee shares, in-the-money options and warrants
outstanding
3
144,277,693
123,852,137
103,881,600
Weighted average shares outstanding for diluted EPS
3,627,241,375
3,707,028,326
3,767,159,838
Earnings per share (USD)
Basic
2.14
1.83
1.17
Diluted
2.06
1.77
1.14
Potentially dilutive instruments
4
Employee share-based compensation awards
5,886,945
2,536,789
Other equity derivative contracts
6,553,051
11,414,728
21,632,879
Total
12,439,996
13,951,517
21,632,879
1 Reflects the cancellation of shares purchased under UBS’s 2018–2021 share repurchase program as approved by shareholders at the 2021 Annual General Meeting. 2 The weighted average shares outstanding
for basic EPS are calculated by taking the number of shares at the beginning of the period, adjusted by the number of shares acquired or issued during the period, multiplied by a time-weighted factor for the period
outstanding. As a result, balances are affected by the timing of acquisitions and issuances during the period. 3 The weighted average number of shares for notional employee awards with performance conditions
reflects all potentially dilutive shares that are expected to vest under the terms of the awards. 4 Reflects potential shares that could dilute basic earnings per share in the future, but were not dilutive for the periods
presented.
289
Statement of cash flows
For the year ended
USD million
31.12.21
31.12.20
31.12.19
Cash flow from / (used in) operating activities
Net profit / (loss)
7,486
6,572
4,310
Non-cash items included in net profit and other adjustments:
Depreciation, amortization and impairment of non-financial assets
2,118
2,126
1,940
Credit loss expense / (release)
(148)
694
78
Share of net profits of associates and joint ventures and impairment related to associates
(105)
(84)
(45)
Deferred tax expense / (benefit)
434
352
477
Net loss / (gain) from investing activities
(230)
(698)
220
Net loss / (gain) from financing activities
100
3,246
6,493
Other net adjustments
3,802
(8,076)
854
Net change in operating assets and liabilities:
Loans and advances to banks and amounts due to banks
2,148
3,586
(4,336)
Securities financing transactions
(2,316)
9,588
8,678
Cash collateral on derivative instruments
(3,312)
(3,487)
2,839
Loans and advances to customers
(27,460)
(33,656)
(3,128)
Customer deposits
29,825
51,805
23,217
Financial assets and liabilities at fair value held for trading and derivative financial instruments
(10,516)
11,259
(18,829)
Brokerage receivables and payables
8,115
(5,199)
(2,347)
Financial assets at fair value not held for trading and other financial assets and liabilities
19,609
320
33
Provisions and other non-financial assets and liabilities
3,010
(387)
55
Income taxes paid, net of refunds
(1,134)
(1,002)
(804)
Net cash flow from / (used in) operating activities
31,425
36,958
19,705
Cash flow from / (used in) investing activities
Purchase of subsidiaries, associates and intangible assets
(1)
(46)
(26)
Disposal of subsidiaries, associates and intangible assets
1
593
674
114
Purchase of property, equipment and software
(1,841)
(1,854)
(1,584)
Disposal of property, equipment and software
295
366
11
Purchase of financial assets measured at fair value through other comprehensive income
(5,802)
(6,290)
(3,424)
Disposal and redemption of financial assets measured at fair value through other comprehensive income
5,052
4,530
3,913
Net (purchase) / redemption of debt securities measured at amortized cost
(415)
(4,166)
(562)
Net cash flow from / (used in) investing activities
(2,119)
(6,785)
(1,558)
Table continues on the next page.
Consolidated financial statements | UBS Group AG consolidated financial statements
290
Statement of cash flows (continued)
Table continued from previous page.
For the year ended
USD million
31.12.21
31.12.20
31.12.19
Cash flow from / (used in) financing activities
Net short-term debt issued / (repaid)
(3,093)
23,845
(17,149)
Net movements in treasury shares and own equity derivative activity
(3,341)
(1,387)
(1,559)
Distributions paid on UBS shares
(1,301)
(2,607)
(2,544)
Issuance of debt designated at fair value and long-term debt measured at amortized cost
98,272
80,255
65,047
Repayment of debt designated at fair value and long-term debt measured at amortized cost
(79,909)
(87,098)
(68,883)
Net cash flows from other financing activities
(282)
(575)
(526)
Net cash flow from / (used in) financing activities
10,345
12,432
(25,614)
Total cash flow
Cash and cash equivalents at the beginning of the year
173,531
119,873
126,079
Net cash flow from / (used in) operating, investing and financing activities
39,651
42,605
(7,467)
Effects of exchange rate differences on cash and cash equivalents
(5,307)
11,052
1,261
Cash and cash equivalents at the end of the year
2
207,875
173,531
119,873
of which: cash and balances at central banks
3
192,706
158,088
106,957
of which: loans and advances to banks
13,942
14,028
11,386
of which: money market paper
4
1,227
1,415
1,530
Additional information
Net cash flow from / (used in) operating activities includes:
Interest received in cash
11,163
11,915
15,315
Interest paid in cash
4,707
6,320
10,769
Dividends on equity investments, investment funds and associates received in cash
5
2,531
1,901
3,145
1 Includes cash proceeds from the sale of UBS’s investment in Clearstream Fund Centre AG (previously Fondcenter AG). UBS’s majority stake was sold in 2020 and the remaining minority investment was sold in the
second quarter of 2021. Refer to Note 30 for more information. Also includes dividends received from associates. 2 USD
3,408
3,828
3,192
reflected in Loans and advances to banks) were restricted as of 31 December 2021, 31 December 2020 and 31 December 2019, respectively. Refer to Note 23 for more information. 3 Includes only balances with
an original maturity of three months or less. 4 Money market paper is included in the balance sheet under Financial assets at fair value held for trading, Financial assets measured at fair value through other
comprehensive income, Financial assets at fair value not held for trading and Other financial assets measured at amortized cost. 5 Includes dividends received from associates reported within Net cash flow from /
(used in) investing activities.
Changes in liabilities arising from financing activities
USD million
Debt issued
measured at
amortized cost
of which:
short-term
1
of which:
long-term
2
Debt issued
designated at fair
value
Over-the-
counter debt
instruments
3
Total
Balance as of 1 January 2020
110,497
21,837
88,660
66,809
2,022
179,327
Cash flows
22,428
23,845
(1,417)
(5,420)
(6)
17,002
Non-cash changes
6,308
984
5,324
(146)
44
6,207
of which: foreign currency translation
4,980
984
3,995
1,764
81
6,824
of which: fair value changes
(1,909)
(37)
(1,946)
of which: hedge accounting and other effects
1,328
1,328
1,328
Balance as of 31 December 2020
139,232
46,666
92,566
61,243
2,060
202,535
Cash flows
5,070
(3,093)
8,163
10,076
124
15,270
Non-cash changes
(5,148)
(475)
(4,673)
2,480
(56)
(2,724)
of which: foreign currency translation
(3,175)
(475)
(2,700)
(1,617)
(65)
(4,857)
of which: fair value changes
4,097
9
4,106
of which: hedge accounting and other effects
(1,972)
(1,972)
(1,972)
Balance as of 31 December 2021
139,155
43,098
96,057
73,799
2,128
215,082
1 Debt with an original contractual maturity of less than one year. 2 Debt with an original maturity greater than or equal to one year. The classification of debt issued into short-term and long-term does not consider
any early redemption features. 3 Included in balance sheet line Other financial liabilities designated at fair value.
291
Notes to the UBS Group AG consolidated financial statements
Note 1 Summary of material accounting policies
The following table provides an overview of information included in this Note.
292
a)
292
292
1)
293
2)
293
a.
293
b.
Classification, measurement and presentation
297
c.
297
d.
297
e.
297
f.
298
g.
301
h.
301
i.
302
j.
302
3)
303
4)
304
5)
304
6)
305
7)
305
8)
305
9)
306
10)
306
11)
307
b)
307
c)
Consolidated financial statements | UBS Group AG consolidated financial statements
292
Note 1 Summary of material accounting policies
a)
Material accounting policies
This Note describes the material accounting policies applied in the
preparation of the consolidated financial statements (the Financial
Statements) of UBS Group AG and its subsidiaries (UBS or the
Group). On 24 February 2022, the Financial Statements were
authorized for issue by the Board of Directors.
Basis of accounting
The Financial Statements have been prepared in accordance with
International Financial Reporting Standards (IFRS), as issued by the
International Accounting Standards Board (the IASB), and are
presented in US dollars (USD).
Disclosures marked as audited in the “Risk, capital, liquidity
and funding, and balance sheet” section of this report form an
integral part of the Financial Statements. These disclosures relate
to requirements under IFRS 7,
Financial Instruments: Disclosures
,
and IAS 1,
Presentation of Financial Statements
,
and are not
repeated in this section.
The accounting policies described in this Note have been
applied consistently in all years presented unless otherwise stated
in Note 1b.
Critical accounting estimates and judgments
Preparation of these Financial Statements under IFRS requires management
to apply judgment and make estimates and assumptions that affect reported
amounts of assets, liabilities, income and expenses and disclosure of
contingent assets and liabilities, and may involve significant uncertainty at the
time they are made. Such estimates and assumptions are based on the best
available information. UBS regularly reassesses
such
estimates and
assumptions, which encompass historical experience, expectations of the
future and other pertinent factors, to determine their continuing relevance
based on current conditions, updating them as necessary. Changes in those
estimates and assumptions may have a significant effect on the Financial
Statements. Furthermore, actual results may differ significantly from UBS’s
estimates, which could result in significant losses to the Group, beyond what
was anticipated or provided for.
The following areas contain estimation uncertainty or require critical
judgment and have a significant effect on amounts recognized in the
Financial Statements:
–
expected credit loss measurement (refer to item 2g in this Note and to
Note 20);
–
fair value measurement (refer to item 2f in this Note and to Note 21);
–
income taxes (refer to item 6 in this Note and to Note 8);
–
provisions and contingent liabilities (refer to item 9 in this Note and to
Note 18);
–
post-employment benefit plans (refer to item 5 in this Note and to Note
27);
–
goodwill (refer to item 8 in this Note and to Note 13); and
–
consolidation of structured entities (refer to item 1 in this Note and to
Note 29).
1) Consolidation
The Financial Statements comprise the financial statements of the
parent company (UBS Group AG) and its subsidiaries, presented
as a single economic entity
;
intercompany transactions and
balances have been eliminated. UBS consolidates all entities that
it controls, including structured entities (SEs), which is the case
when it has: (i) power over the relevant activities of the entity;
(ii) exposure to an entity‘s variable returns; and (iii) the ability to
use its power to affect its own returns.
Consideration is given to all facts and circumstances to
determine whether the Group has power over another entity, i.e.,
the current ability to direct the relevant activities of an entity when
decisions about those activities need to be made.
Subsidiaries, including SEs, are consolidated from the date
when control is gained and deconsolidated from the date when
control ceases. Control, or the lack thereof, is reassessed if facts
and circumstances indicate that there is a change to one or more
elements required to establish that control is present.
Business combinations are accounted for using the acquisition
method. The amount of any non-controlling interest is measured
at the non-controlling interest’s proportionate share of the
acquiree’s identifiable net assets.
›
Refer to Note
29
for more information
Critical accounting estimates and judgments
Each individual entity is assessed for consolidation in line with the
aforementioned consolidation principles. The assessment of control can be
complex and requires the use of significant judgment, in particular in
determining whether UBS has power over the entity. As the nature and
extent of UBS’s involvement is unique for each entity, there is no uniform
consolidation outcome by entity. Certain entities within a class may be
consolidated while others may not. When carrying out the consolidation
assessment, judgment is exercised considering all the relevant facts and
circumstances, including the nature and activities of the investee, as well as
the substance of voting and similar rights.
›
Refer to Note
29
for more information
293
Note 1 Summary of material accounting policies
(continued)
2) Financial instruments
a. Recognition
UBS recognizes financial instruments when it becomes a party to
contractual provisions of an instrument. UBS applies settlement
date accounting to all standard purchases and sales of non-
derivative financial instruments.
In transactions where UBS acts as a transferee, to the extent
the financial asset transfer does not qualify for derecognition by
the transferor, UBS does not recognize the transferred instrument
as its asset.
UBS also acts in a fiduciary capacity, which results in it holding
or placing assets on behalf of individuals, trusts, retirement
benefit plans and other institutions. Unless these items meet the
definition of an asset and the recognition criteria are satisfied,
they are not recognized on UBS’s balance sheet and the related
income is excluded from the Financial Statements.
Client cash balances associated with derivatives clearing and
execution services are not recognized on the balance sheet if,
through contractual agreement, regulation or practice, UBS
neither obtains benefits from nor controls such cash balances.
b. Classification, measurement and presentation
Financial assets
All financial instruments are on initial recognition measured at fair
value and classified as measured at amortized cost, fair value
through other comprehensive income (FVOCI) or fair value
through profit or loss (FVTPL)
.
For
financial instruments
subsequently measured at amortized cost or FVOCI, the initial fair
value is adjusted for directly attributable transaction costs.
Where the contractual terms of a debt instrument result in cash
flows that are solely payments of principal and interest (SPPI) on
the principal amount outstanding,
the debt instrument
is
classified as measured at amortized cost if it is held within a
business model that has an objective of holding financial assets to
collect contractual cash flows, or at FVOCI if it is held within a
business model
with
the
objective
being
achieved by both
collecting contractual cash flows and selling financial assets.
All other financial assets are measured at FVTPL, including
those held for trading or those managed on a fair value basis,
except for derivatives designated in a hedge relationship, in which
case hedge accounting requirements apply (refer to item 2j in this
Note for more information).
Business model assessment and contractual cash flow
characteristics
UBS determines the nature of a business model by considering the
way financial assets are managed to achieve a particular business
objective.
In assessing whether contractual cash flows are SPPI, the
Group considers whether the contractual terms of the financial
asset contain a term that could change the timing or amount of
contractual cash flows arising over the life of the instrument.
Financial liabilities
Financial liabilities measured at amortized cost
Debt issued measured at amortized cost includes contingent
capital instruments containing contractual provisions under which
the principal amounts would be written down or converted into
equity upon either a specified common equity tier 1 (CET1) ratio
breach or a determination by
the
Swiss Financial Market
Supervisory Authority (FINMA) that a viability event has occurred.
Such contractual provisions are not derivatives, as the underlying
is deemed to be a non-financial variable specific to a party to the
contract.
If a debt were to be written down or converted into equity in
a future period, it would be partially or fully derecognized, with
the difference between its carrying amount and the fair value of
any equity issued recognized in the income statement.
A gain or loss is recognized in
Other income
is subsequently repurchased for market-making or other activities.
A subsequent sale of own bonds in the market is treated as a
reissuance of debt.
Financial liabilities measured at fair value through profit or loss
UBS designates certain issued debt instruments as financial
liabilities at fair value through profit or loss, on the basis that such
financial instruments include embedded derivatives and / or are
managed on a fair value basis (refer to the table below for more
information), in which case bifurcation of the embedded
derivative component is not required. Financial instruments
including embedded derivatives arise predominantly from the
issuance of certain structured debt instruments.
Measurement and presentation
After initial recognition, UBS classifies, measures and presents its
financial assets and liabilities in accordance with IFRS 9, as
described in the table on the following pages.
Consolidated financial statements | UBS Group AG consolidated financial statements
294
Note 1 Summary of material accounting policies (continued)
Classification, measurement and presentation of financial assets
Financial assets classification
Significant items included
Measurement and presentation
Measured at
amortized cost
This classification includes:
–
cash and balances at central banks;
–
loans and advances to banks;
–
receivables from securities financing transactions;
–
cash collateral receivables on derivative instruments;
–
residential and commercial mortgages;
–
corporate loans;
–
secured loans, including Lombard loans, and
unsecured loans;
–
loans to financial advisors; and
–
debt securities held as high-quality liquid assets
(HQLA).
Measured at amortized cost using the effective interest
method less allowances for expected credit losses (ECL)
(refer to items 2d and 2g in this Note for more information).
The following items are recognized in the income
statement:
–
interest income, which is accounted for in accordance
with item 2d in this Note;
–
ECL and reversals; and
–
foreign exchange (FX) translation gains and losses.
When a financial asset at amortized cost is derecognized,
the gain or loss is recognized in the income statement.
For amounts arising from settlement of certain derivatives,
refer to the next page.
Measured
at FVOCI
Debt instruments
measured at
FVOCI
This classification primarily includes debt securities and
certain asset-backed securities held as HQLA.
Measured at fair value, with unrealized gains and losses
reported in
Other comprehensive income,
net of applicable
income taxes, until such investments are derecognized.
Upon derecognition, any accumulated balances in
Other
comprehensive income
are reclassified to the income
statement and reported within
Other income.
The following items, which are determined on the same
basis as for financial assets measured at amortized cost, are
recognized in the income statement:
–
interest income, which is accounted for in accordance
with item 2d in this Note;
–
ECL and reversals; and
–
FX translation gains and losses.
295
Note 1 Summary of material accounting policies (continued)
Classification, measurement and presentation of financial assets
Financial assets classification
Significant items included
Measurement and presentation
Measured at
FVTPL
Held for
trading
Financial assets held for trading include:
–
all derivatives with a positive replacement value, except
those that are designated and effective hedging
instruments; and
–
other financial assets acquired principally for the
purpose of selling or repurchasing in the near term, or
that are part of a portfolio of identified financial
instruments that are managed together and for which
there is evidence of a recent actual pattern of short-term
profit taking. Included in this category are debt
instruments (including those in the form of securities,
money market paper, and traded corporate and bank
loans) and equity instruments.
Measured at fair value, with changes recognized in the
income statement.
Derivative assets (including derivatives that are designated
and effective hedging instruments) are generally
presented as
Derivative financial instruments
, except those
exchange-traded (ETD) and over-the-counter (OTC)-
cleared derivatives that are legally settled on a daily basis
or in substance net settled on a daily basis, which are
presented within
Cash collateral receivables on derivative
instruments.
Changes in fair value, initial transaction costs, dividends
and gains and losses arising on disposal or redemption are
recognized in
Other net income from financial
instruments measured at fair value through profit or loss
,
except interest income on instruments other than
derivatives (refer to item 2d in this Note), interest on
derivatives designated as hedging instruments in hedges
of interest rate risk and forward points on certain short-
and long-duration FX contracts acting as economic
hedges, which are reported in
Net interest income.
Changes in the fair value of derivatives that are
designated and effective hedging instruments are
presented either in the income statement or
Other
comprehensive income
, depending on the type of hedge
relationship (refer to item 2j in this Note for more
information).
Mandatorily
measured at
FVTPL – Other
This classification includes financial assets mandatorily
measured at FVTPL that are not held for trading, as
follows:
–
certain structured loans, certain commercial loans, and
receivables from securities financing transactions are
managed on a fair value basis;
–
loans managed on a fair value basis, including those
hedged with credit derivatives;
–
certain debt securities held as HQLA and managed on a
fair value basis;
–
certain investment fund holdings and assets held to
hedge delivery obligations related to cash-settled
employee compensation plans;
–
brokerage receivables, for which contractual cash flows
do not meet the SPPI criterion because the aggregate
balance is accounted for as a single unit of account,
with interest being calculated on the individual
components;
–
auction rate securities, for which contractual cash flows
do not meet the SPPI criterion because interest may be
reset at rates that contain leverage;
–
equity instruments; and
–
assets held under unit-linked investment contracts.
Consolidated financial statements | UBS Group AG consolidated financial statements
296
Note 1 Summary of material accounting policies (continued)
Classification, measurement and presentation of financial liabilities
Financial liabilities classification
Significant items included
Measurement and presentation
Measured at amortized cost
This classification includes:
–
demand and time deposits;
–
retail savings / deposits;
–
payables from securities financing transactions;
–
non-structured fixed-rate bonds;
–
subordinated debt;
–
certificates of deposit and covered bonds; and
–
cash collateral payables on derivative instruments.
Measured at amortized cost using the effective interest
method.
When a financial liability at amortized cost is
derecognized, the gain or loss is recognized in the income
statement.
Measured at
fair value
through
profit or loss
Held for trading
Financial liabilities held for trading include:
–
all derivatives with a negative replacement value
(including certain loan commitments), except those
that are designated and effective hedging
instruments; and
–
obligations to deliver financial instruments, such as
debt and equity instruments, that UBS has sold to
third parties but does not own (short positions).
Measurement and presentation of financial liabilities
classified at FVTPL follow the same principles as for
financial assets classified at FVTPL, except that the amount
of change in the fair value of a financial liability
designated at FVTPL that is attributable to changes in
UBS’s own credit risk is presented in
Other comprehensive
income
Retained earnings
and is never
reclassified to the income statement.
Derivative liabilities (including derivatives that are
designated and effective hedging instruments) are
generally presented as
Derivative financial instruments
,
except those exchange-traded and OTC-cleared
derivatives that are legally settled on a daily basis or in
substance net settled on a daily basis, which are
presented within
Cash collateral payables on derivative
instruments.
Designated at
FVTPL
UBS designates at FVTPL the following financial
liabilities:
–
issued hybrid debt instruments that primarily include
equity-linked, credit-linked and rates-linked bonds or
notes;
–
issued debt instruments managed on a fair value
basis;
–
certain payables from securities financing transactions;
–
amounts due under unit-linked investment contracts
the cash flows of which are linked to financial assets
measured at FVTPL and eliminate an accounting
mismatch; and
–
brokerage payables, which arise in conjunction with
brokerage receivables and are measured at FVTPL to
achieve measurement consistency.
297
Note 1 Summary of material accounting policies (continued)
c. Loan commitments and financial guarantees
Loan commitments are arrangements to provide credit under
defined terms and conditions. Irrevocable loan commitments are
classified as: (i) derivative loan commitments measured at fair
value through profit or loss; (ii) loan commitments designated at
fair value through profit or loss; or (iii) loan commitments not
measured at fair value.
Financial guarantee contracts are contracts
that require UBS to make specified payments to reimburse the
holder for an incurred loss because a specified debtor fails to
make payments when due in accordance with the terms of a
specified debt instrument.
d. Interest income and expense
Interest income and expense are recognized in the income
statement
based on
the
effective interest
method
. When
calculating the effective interest rate (the EIR) for financial
instruments (other than credit-impaired financial instruments),
UBS estimates future cash flows considering all contractual terms
of the instrument, but not expected credit losses, with the EIR
applied to the gross carrying amount of the financial asset or the
amortized cost of a financial liability. However, when a financial
asset becomes credit-impaired after initial recognition, interest
income is determined by applying the EIR to the amortized cost of
the instrument, which represents the gross carrying amount
adjusted for any credit loss allowance.
Upfront fees, including fees on loan commitments not
measured at fair value where a loan is expected to be issued, and
direct costs are included within the initial measurement of a
financial instrument measured at amortized cost or FVOCI and
recognized over the expected life of the instrument as part of its
EIR.
Fees related to loan commitments where no loan is expected
to be issued, as well as loan syndication fees where UBS does not
retain a portion of the syndicated loan or where UBS does retain
a portion of the syndicated loan at the same effective yield for
comparable risk as other participants, are included in
Net fee and
commission income
and either recognized over the life of the
commitment or when syndication occurs.
›
Refer to item 3 in this Note for more information
Interest income on financial assets, excluding derivatives, is
included in interest income when positive and in interest expense
when negative. Similarly, interest expense on financial liabilities,
excluding derivatives, is included in interest expense, except when
interest rates are negative, in which case it is included in interest
income.
›
Refer to item 2b in this Note and Note
3
e. Derecognition
Financial assets
UBS derecognizes a transferred financial asset, or a portion of a
financial asset, if the purchaser has received substantially all the
risks and rewards of the asset or a significant part of the risks and
rewards combined with a practical ability to sell or pledge the
asset.
Where financial assets have been pledged as collateral or in
similar arrangements, they are considered to have been
transferred if the counterparty has received the contractual rights
to the cash flows of the pledged assets, as may be evidenced by,
for example, the counterparty’s right to sell or repledge the assets.
In transfers where control over the financial asset is retained, UBS
continues to recognize the asset to the extent of its continuing
involvement, determined by the extent to which it is exposed to
changes in the value of the transferred asset following the
transfer.
Certain OTC derivative contracts and most exchange-traded
futures and option contracts cleared through central clearing
counterparties and exchanges are considered to be settled on a
daily basis, as the payment or receipt of variation margin on a daily
basis represents legal or economic settlement, which results in
derecognition of the associated derivatives.
›
Refer to Note 22 and Note
23
Financial liabilities
UBS derecognizes a financial liability when it is extinguished, i.e.,
when the obligation specified in the contract is discharged,
canceled or expires. When an existing financial liability is
exchanged for a new one from the same lender on substantially
different terms, or the terms of an existing liability are
substantially modified, the original liability is derecognized and a
new liability recognized with any difference in the respective
carrying amounts recognized in the income statement.
f. Fair value of financial instruments
UBS accounts for a significant portion of its assets and liabilities
at fair value. Fair value is the price on the measurement date that
would be received for the sale of an asset or paid to transfer a
liability in an orderly transaction between market participants in
the principal market, or in the most advantageous market in the
absence of a principal market.
›
Refer to Note 21 for more information
Consolidated financial statements | UBS Group AG consolidated financial statements
298
Note 1 Summary of material accounting policies (continued)
Critical accounting estimates and judgments
The use of valuation techniques, modeling assumptions and estimates of
unobservable market inputs in the fair valuation of financial instruments
requires significant judgment and could affect the amount of gain or loss
recorded for a particular position. Valuation techniques that rely more
heavily on unobservable inputs and sophisticated models inherently require
a higher level of judgment and may require adjustment to reflect factors
that market participants would consider in estimating fair value, such as
close-out costs, which are presented in Note 21d.
UBS‘s governance framework over fair value measurement is described
in Note 21b, and UBS provides a sensitivity analysis of the estimated effects
arising from changing significant unobservable inputs in Level 3 financial
instruments to reasonably possible alternative assumptions in Note 21g.
›
Refer to Note 21 for more information
g. Allowances and provisions for expected credit losses
ECL are recognized for financial assets measured at amortized
cost, financial assets measured at FVOCI, fee and lease
receivables, financial guarantees
,
and loan commitments
not
measured at fair value. ECL are also recognized on the undrawn
portion of committed unconditionally revocable credit lines,
which include UBS’s credit card limits and master credit facilities,
as UBS is exposed to credit risk because the borrower has the
ability to draw down funds
before UBS can take credit risk
mitigation actions.
Recognition of expected credit losses
ECL are recognized on the following basis:
–
Stage 1 instruments: Maximum 12-month ECL are recognized
from initial recognition, reflecting the portion of lifetime cash
shortfalls that would result if a default occurs in the 12 months
after the reporting date, weighted by the risk of a default
occurring.
–
Stage 2 instruments: Lifetime ECL are recognized if a
significant increase in credit risk (
an
SICR) is observed
subsequent to the instrument’s initial recognition, reflecting
lifetime cash shortfalls that would result from all possible
default events over the expected life of a financial instrument,
weighted by the risk of a default occurring. When an SICR is
no longer observed, the instrument will move back to stage 1.
–
Stage 3 instruments: Lifetime ECL are always recognized for
credit-impaired financial instruments, as determined by the
occurrence of one or more loss events, by estimating expected
cash flows based on a chosen
recovery
strategy. Credit
-
impaired exposures may include positions for which no
allowance has been recognized, for example because they are
expected to be fully recoverable through collateral held.
–
Changes in lifetime ECL since initial recognition are also
recognized for assets that are purchased or originated credit-
impaired (POCI). POCI financial instruments include those that
are purchased at a deep discount or newly originated with a
defaulted counterparty; they remain a separate category until
derecognition.
All or part of a financial asset is written off if it is deemed
uncollectible or forgiven. Write-offs reduce the principal amount
of a claim and are charged against related allowances for credit
losses. Recoveries, in part or in full, of amounts previously written
off are generally credited to
Credit loss (expense) / release
.
ECL are recognized in the income statement in
Credit loss
(expense) / release
. A corresponding ECL allowance is reported as
a decrease in the carrying amount of financial assets measured at
amortized cost on the balance sheet. For financial assets that are
measured at FVOCI, the carrying amount is not reduced, but an
accumulated amount is recognized in
Other comprehensive
income
. For off-balance sheet financial instruments and other
credit lines, provisions for ECL are presented in
Provisions.
Default and credit impairment
UBS applies a single definition of default for credit risk
management purposes, regulatory reporting and ECL, with a
counterparty classified as defaulted based on quantitative and
qualitative criteria.
›
Refer to “Credit policies for distressed assets” in the “Risk
management and control” section of this report for more
information
Measurement of expected credit losses
IFRS 9 ECL reflect an unbiased, probability-weighted estimate
based on loss expectations resulting from default events. The
method used to calculate ECL applies the following principal
factors: probability of default (PD), loss given default (LGD) and
exposure at default (EAD). Parameters are generally determined
on an individual financial asset level. Based on the materiality of
the portfolio, for credit card exposures and personal account
overdrafts in Switzerland, a portfolio approach is applied that
derives an average PD and LGD for the entire portfolio. PDs and
LGDs used in the ECL calculation are point-in-time (PIT)-based for
key portfolios and consider both current conditions and expected
cyclical changes. For material portfolios,
PDs and LGDs are
determined for different scenarios, whereas EAD projections are
treated as scenario independent.
For the purpose of determining the ECL-relevant parameters,
UBS leverages its Pillar 1 internal ratings-based (IRB) models that
are also used in determining expected loss (EL) and risk-weighted
assets under the Basel III framework and Pillar 2 stress loss models.
Adjustments have been made to these models and IFRS 9-related
models have been developed that consider the complexity,
structure and risk profile of relevant portfolios and take account
of the fact that PDs and LGDs used in the ECL calculation are PIT-
based, as opposed to the corresponding Basel III through-the-
cycle (TTC) parameters. All models that are relevant for measuring
expected credit losses are subject to UBS’s model validation and
oversight processes.
299
Note 1 Summary of material accounting policies (continued)
Probability of default:
PD represents the probability of a default
over a specified time period. A 12-month PD represents the
probability of default determined for the next 12 months and a
lifetime PD represents the probability of default over the
remaining lifetime of the instrument. PIT PDs are derived from TTC
PDs and scenario forecasts. The modeling is region-, industry- and
client segment-specific and considers both macroeconomic
scenario dependencies and client-idiosyncratic information.
Exposure at default:
EAD represents an estimate of the
exposure to credit risk at the time of a potential default occurring,
considering expected repayments, interest payments and
accruals, discounted at the EIR. Future drawdowns on facilities are
considered through a credit conversion factor (a CCF) that is
reflective of historical drawdown and default patterns and the
characteristics of the respective portfolios.
Loss given default:
LGD represents an estimate of the loss at the
time of a potential default occurring, taking into account expected
future cash flows from collateral and other credit enhancements, or
expected payouts from bankruptcy proceedings for unsecured
claims and, where applicable, time to realization of collateral and
the seniority of claims. LGD is commonly expressed as a percentage
of EAD.
Estimation of expected credit losses
Number of scenarios and estimation of scenario weights
Determination of probability -weighted ECL requires evaluating a
range of diverse and relevant future economic conditions,
especially with a view to modeling the non-linear effect of
assumptions about macroeconomic factors on the estimate.
To accommodate this requirement, UBS uses different
economic scenarios in the ECL calculation
.
Each scenario is
represented by a specific scenario narrative, which is relevant
considering the exposure of key portfolios to economic risks, and
for which a set of consistent macroeconomic variables is
determined. The estimation of the appropriate weights for these
scenarios is predominantly judgement-based. The assessment is
based on a holistic review of the prevailing economic or political
conditions, which may exhibit different levels of uncertainty. It
takes into account the impact of changes in the nature and
severity of the underlying scenario narratives and the projected
economic variables.
The determined weights constitute the probabilities that the
respective set of macroeconomic conditions will occur and not
that the chosen particular narratives with the related
macroeconomic variables will materialize.
Macroeconomic and other factors
The range of macroeconomic, market and other factors that is
modeled as part of the scenario determination is wide, and
historical information is used to support the identification of the
key factors. As the forecast horizon increases, the availability of
information decreases, requiring an increase in judgment. For
cycle-sensitive PD and LGD determination purposes, UBS projects
the relevant economic factors for a period of three years before
reverting, over a specified period, to cycle-neutral PD and LGD for
longer-term projections.
Factors relevant for ECL calculation vary by type of exposure.
Regional and client-segment characteristics are generally taken
into account, with specific focus on Switzerland and the US,
considering UBS’s key ECL-relevant portfolios.
For UBS, the following forward-looking macroeconomic
variables represent the most relevant factors for ECL calculation:
–
GDP growth rates, given their significant effect on borrowers’
performance;
–
unemployment rates, given their significant effect on private
clients’ ability to meet contractual obligations;
–
house price indices, given their significant effect on mortgage
collateral valuations;
–
interest rates, given their significant effect on counterparties’
abilities to service debt;
–
consumer price indices, given their overall relevance for
companies’ performance, private clients’ purchasing power
and economic stability; and
–
equity indices, given that they are an important factor in our
corporate rating tools.
Scenario generation, review process and governance
A team of economists, who are part of Group Risk Control,
develop the forward-looking macroeconomic assumptions with
involvement from a broad range of experts.
The scenarios, their weight and the key macroeconomic and
other factors are subject to a critical assessment by the IFRS 9
Scenario Sounding Sessions and ECL Management Forum, which
include senior management from Group Risk and Group Finance.
Important aspects for the review include whether there may be
particular credit risk concerns that may not be capable of being
addressed systematically and require post-model adjustments for
stage allocation and ECL allowance.
The Group Model Governance
Committee
,
as the highest
authority under UBS’s model governance framework, ratifies the
decisions taken by the ECL Management Forum.
›
Refer to Note 20 for more information
ECL measurement period
The period for which lifetime ECL are determined is based on the
maximum contractual period that UBS is exposed to credit risk,
taking into account contractual extension, termination and
prepayment options. For irrevocable loan commitments and
financial guarantee contracts, the measurement period represents
the maximum contractual period for which UBS has an obligation
to extend credit.
Consolidated financial statements | UBS Group AG consolidated financial statements
300
Note 1 Summary of material accounting policies (continued)
Additionally, some financial instruments include both an on-
demand loan and a revocable undrawn commitment, where the
contractual cancellation right does not limit UBS’s exposure to
credit risk to the contractual notice period, as the client has the
ability to draw down funds before UBS can take risk-mitigating
actions. In such cases UBS is required to estimate the period over
which it is exposed to credit risk. This applies to UBS’s credit card
limits, which do not have a defined contractual maturity date, are
callable on demand and where the drawn and undrawn
components are managed as one exposure. The exposure arising
from UBS’s credit card limits is not significant and is managed at
a portfolio level, with credit actions triggered when balances are
past due. An ECL measurement period of seven years is applied
for credit card limits, capped at 12 months for stage 1 balances,
as a proxy for the period that UBS is exposed to credit risk.
Customary master credit agreements in the Swiss corporate
market also include on-demand loans and revocable undrawn
commitments. For smaller commercial facilities, a risk-based
monitoring (RbM) approach is in place that highlights negative
trends as risk events, at an individual facility level, based on a
combination of continuously updated risk indicators. The risk
events trigger additional credit reviews by a risk officer, enabling
informed credit decisions to be taken. Larger corporate facilities
are not subject to RbM, but are reviewed at least annually through
a formal credit review. UBS has assessed these credit risk
management practices and considers both the RbM approach and
formal credit reviews as substantive credit reviews resulting in a
re-origination of the given facility. Following this, a 12-month
measurement period from the reporting date is used for both
types of facilities as an appropriate proxy of the period over which
UBS is exposed to credit risk, with 12 months also used as a look-
back period for assessing
SICR,
always from the respective
reporting date.
Significant increase in credit risk
Financial instruments subject to ECL are monitored on an
ongoing basis. To determine whether the recognition of a
maximum 12-month ECL continues to be appropriate, an
assessment is made as to whether an SICR has occurred since
initial recognition of the financial instrument , applying both
quantitative and qualitative factors.
Primarily, UBS assesses changes in an instrument’s risk of
default on a quantitative basis by comparing the annualized
forward-looking and scenario-weighted lifetime PD of an
instrument determined at two different dates:
–
at the reporting date; and
–
at inception of the instrument.
If, based on UBS’s quantitative modeling, an increase exceeds
a set threshold, an SICR is deemed to have occurred and the
instrument is transferred to stage 2 with lifetime ECL recognized
.
The threshold applied varies depending on the original credit
quality of the borrower, with a higher SICR threshold set for those
instruments with a low PD at inception. The SICR assessment
based on PD changes is made at an individual financial asset level.
A high-level overview of the SICR trigger, which is a multiple of
the annualized remaining lifetime PIT PD expressed in rating
downgrades, is provided in the “SICR thresholds” table below.
The actual SICR thresholds applied are defined on a more granular
level by interpolating between the values shown in the table.
SICR thresholds
Internal rating at origination
of the instrument
Rating downgrades /
SICR trigger
0–3
3
4–8
2
9–13
1
›
Refer to the “
Risk management and control
” section of this
report for more details about UBS’s internal grading system
Irrespective of the SICR assessment based on default
probabilities, credit risk is generally deemed to have significantly
increased for an instrument if the contractual payments are more
than 30 days past due. For certain less material portfolios,
specifically the Swiss credit card portfolio, the 30-day past due
criterion is used as the primary indicator of an SICR. Where
instruments are transferred to stage 2 due to the 30-day past due
criterion, a minimum period of six months is applied before a
transfer back to stage 1 can be triggered. For instruments in
Personal & Corporate Banking and Global Wealth Management
Region Switzerland that are between 90 and 180 days past due
but have not been reclassified to stage 3, a one-year period is
applied before a transfer back to stage 1 can be triggered.
Additionally, based on individual counterparty-specific
indicators, external market indicators of credit risk or general
economic conditions, counterparties may be moved to a watch
list, which is used as a secondary qualitative indicator for an SICR.
Exception management is further applied, allowing for individual
and collective adjustments on exposures sharing the same credit
risk characteristics to take account of specific situations that are
not otherwise fully reflected.
In general, the overall SICR determination process does not
apply to Lombard loans, securities financing transactions and
certain other asset-based lending transactions, because of the risk
management practices adopted, including daily monitoring
processes with strict margining. If margin calls are not satisfied, a
position is closed out and classified as a stage 3 position. In
exceptional cases, an individual adjustment and a transfer into
stage 2 may be made to take account of specific facts.
301
Note 1 Summary of material accounting policies (continued)
Credit risk officers are responsible for the identification of an
SICR, which for accounting purposes is in some respects different
from internal credit risk management processes. This difference
mainly
arises
because ECL accounting requirements are
instrument-specific, such that a borrower can have multiple
exposures allocated to different stages, and maturing loans in
stage 2 will migrate to stage 1 upon renewal irrespective of the
actual credit risk at that time. Under a risk-based approach, a
holistic counterparty credit assessment and the absolute level of
risk at any given date will determine what risk-mitigating actions
may be warranted.
›
Refer to the “
Risk management and control
” section of this
report for more information
Critical accounting estimates and judgments
The calculation of ECL requires management to apply significant judgment
and make estimates and assumptions that can result in significant changes
to the timing and amount of ECL recognized.
Determination of a significant increase in credit risk
IFRS 9 does not include a definition of what constitutes an SICR, with UBS’s
assessment considering qualitative and quantitative criteria. An IFRS 9 ECL
Management Forum has been established to review and challenge the SICR
results.
Scenarios, scenario weights and macroeconomic variables
ECL reflect an unbiased and probability-weighted amount, which UBS
determines by evaluating a range of possible outcomes. Management
selects forward-looking scenarios that include relevant macroeconomic
variables and management’s assumptions around future economic
conditions. IFRS 9 Scenario Sounding Sessions, in addition to the IFRS 9 ECL
Management Forum, are in place to derive, review and challenge the
scenario selection and weights, and to determine whether any additional
post-model adjustments are required that may significantly affect ECL.
ECL measurement period
Lifetime ECL are generally determined based upon the contractual maturity
of the transaction, which significantly affects ECL. For credit card limits and
Swiss callable master credit facilities, judgment is required, as UBS must
determine the period over which it is exposed to credit risk. A seven-year
period is applied for credit card limits, capped at 12 months for stage 1
positions, and a 12-month period applied for master credit facilities.
Modeling and post-model adjustments
A number of complex models have been developed or modified to calculate
ECL, with additional post-model adjustments required which may
significantly affect ECL. The models are governed by UBS’s model validation
controls and approved by the Group Model Governance Committee (the
GMGC)
. The post
-
model adjustments
are approved by the
ECL
Management Forum and endorsed by the GMGC.
A
sensitivity analysis
covering key macroeconomic variables
, scenario
weights and SICR trigger points on ECL measurement is provided in Note
20f.
›
Refer to Note 20 for more information
h. Restructured and modified financial assets
When payment default is expected, or where default has already
occurred, UBS may grant concessions to borrowers in financial
difficulties that it would not consider in the normal course of its
business, such as preferential interest rates, extension of maturity,
modifying the schedule of repayments, debt / equity swap,
subordination, etc. When a concession or forbearance measure is
granted, each case is considered individually and the exposure is
generally classified as being in default. Forbearance classification
will remain until the loan is collected or written off, non-
preferential conditions superseding preferential conditions are
granted or until the counterparty has recovered and the
preferential conditions no longer exceed UBS’s risk tolerance.
Modifications result in an alteration of future contractual cash
flows and can occur within UBS’s normal risk tolerance or as part
of a credit restructuring where a counterparty is in financial
difficulties. The restructuring or modification of a financial asset
could lead to a substantial change in the terms and conditions,
resulting in the original financial asset being derecognized and a
new financial asset being recognized. Where the modification
does not result in a derecognition, any difference between the
modified contractual cash flows discounted at the original EIR and
the existing gross carrying amount of the given financial asset is
recognized in the income statement as a modification gain or loss.
i. Offsetting
UBS presents financial assets and liabilities on its balance sheet
net if (i) it has a legally enforceable right to set off the recognized
amounts and (ii) it intends either to settle on a net basis or to
realize the asset and settle the liability simultaneously. Netted
positions include, for example, certain derivatives and repurchase
and reverse repurchase transactions with various counterparties,
exchanges and clearing houses.
In assessing whether UBS intends to either settle on a net basis,
or to realize the asset and settle the liability simultaneously,
emphasis is placed on the effectiveness of operational settlement
mechanics in eliminating substantially all credit and liquidity
exposure between the counterparties. This condition precludes
offsetting on the balance sheet for substantial amounts of UBS’s
financial assets and liabilities, even though they may be subject to
enforceable netting arrangements. Repurchase arrangements and
securities financing transactions are presented net only to the
extent that the settlement mechanism eliminates, or results in
insignificant, credit and liquidity risk, and processes the
receivables and payables in a single settlement process or cycle.
›
Refer to Note
22
for more information
Consolidated financial statements | UBS Group AG consolidated financial statements
302
Note 1 Summary of material accounting policies
(continued)
j
. Hedge accounting
The Group applies hedge accounting requirements of IFRS 9, unless
stated otherwise below, where the criteria for documentation and
hedge effectiveness are met. If a hedge relationship no longer
meets the criteria for hedge accounting, hedge accounting is
discontinued. Voluntary discontinuation of hedge accounting is
permitted under IAS 39 but not under IFRS 9.
Fair value hedges of interest rate risk related to debt instruments
and loan assets
The fair value change of the hedged item attributable to a hedged
risk is reflected as an adjustment to the carrying amount of the
hedged item, and recognized in the income statement along with
the change in the fair value of the hedging instrument.
Fair value hedges of portfolio interest rate risk related to loans
designated under IAS 39
Prior to discontinuation in December 2021, the fair value change
of the hedged item attributable to a hedged risk is reflected within
Other financial assets measured at amortized cost
or
Other
financial liabilities measured at amortized cost
and recognized in
the income statement along with the change in the fair value of
the hedging instrument.
Fair value hedges of FX risk related to debt instruments
The fair value change of the hedged item attributable to the
hedged risk is reflected in the measurement of the hedged item
and recognized in the income statement along with the change
in the fair value of the hedging instrument. The foreign currency
basis spread of cross-currency swaps designated as hedging
derivatives is excluded from the designation and accounted for as
a cost of hedging with amounts deferred in
Other comprehensive
income
Equity
. These amounts are released to the income
statement over the term of the hedged item.
Discontinuation of fair value hedges
Discontinuations for reasons other than derecognition of the hedged
item result in an adjustment to the carrying amount, which is
amortized to the income statement over the remaining life of the
hedged item using the effective interest method. If the hedged item
is derecognized, the unamortized fair value adjustment or deferred
cost of hedging amount is recognized immediately in the income
statement as part of any derecognition gain or loss.
Cash flow hedges of forecast transactions
Fair value gains or losses associated with the effective portion of
derivatives designated as cash flow hedges for cash flow repricing
risk are recognized initially in
Other comprehensive income
within
Equity
when the hedged forecast cash flows affect profit or loss,
including discontinued hedges for which forecast cash flows are
expected to occur. If the forecast transactions are no longer
expected to occur, the deferred gains or losses are immediately
reclassified to the income statement.
Hedges of net investments in foreign operations
Gains or losses on the hedging instrument relating to the effective
portion of a hedge are recognized directly in
Other comprehensive
income
Equity,
while any gains or losses relating to the
ineffective and / or undesignated portion (for example, the interest
element of a forward contract) are recognized in the income
statement. Upon disposal or partial disposal of the foreign operation,
the cumulative value of any such gains or losses recognized in
Equity
associated with the entity
is reclassified to
Other income
.
Interest Rate Benchmark Reform
UBS can continue hedge accounting during the period of
uncertainty before existing interest rate benchmarks are replaced
with alternative risk-free interest rates. During this period, UBS
can assume that the current benchmark rates will continue to
exist, such that forecast transactions are considered highly
probable and hedge relationships remain,
with
little or
no
consequential
impact on the financial statements. Upon
replacement of existing interest rate benchmarks by alternative
risk-free interest rates expected in 2021 and beyond, UBS will
apply the requirements of
Amendments to IFRS 9, IAS 39, IFRS 7,
IFRS 4 and IFRS 16 (Interest Rate Benchmark Reform – Phase 2).
›
Refer to Note 1b for more information
3) Fee and commission income and expenses
UBS earns fee income from the diverse range of services it
provides to its clients. Fee income can be divided into two broad
categories: fees earned from services that are provided over a
certain period of time, such as management of clients’ assets,
custody services and certain advisory services; and fees earned
from point-in-time services, such as underwriting fees, deal-
contingent merger and acquisitions fees, and brokerage fees
(e.g., securities and derivative
s
execution and clearing). UBS
recognizes fees earned from point-in-time services when it has
fully provided the service to the customer. Where the contract
requires services to be provided over time, income is recognized
on a systematic basis over the life of the agreement.
Consideration received is allocated to the separately
identifiable performance obligations in a contract. Owing to the
nature of UBS’s business, contracts that include multiple
performance obligations are typically those that are considered to
include a series of similar performance obligations fulfilled over
time with the same pattern of transfer to the client, e.g.,
management of client assets and custodial services. As a
consequence, UBS is not required to apply significant judgment in
allocating the consideration received across the various
performance obligations.
303
Note 1 Summary of material accounting policies
(continued)
Point-in-time services are generally for a fixed price or
dependent on deal size, e.g., a fixed number of basis points of
trade size, where the amount of revenue is known when the
performance obligation is met. Fixed over-time fees are
recognized on a straight-line basis over the performance period.
Custodial and asset management fees can be variable through
reference to the size of the customer portfolio. However, they are
generally billed on a monthly or quarterly basis once the
customer’s portfolio size is known or known with near certainty
and therefore also recognized ratably over the performance
period. UBS does not recognize performance fees related to
management of clients’ assets or fees related to contingencies
beyond UBS’s control until such uncertainties are resolved.
UBS’s fees are generally earned from short-term contracts. As
a result, UBS’s contracts do not include a financing component or
result in the recognition of significant receivables or prepayment
assets. Furthermore, due to the short-term nature of such
contracts, UBS has not capitalized any material costs to obtain or
fulfill a contract or generated any significant contract assets or
liabilities.
UBS presents expenses primarily in line with their nature in the
income statement, differentiating between expenses that are
directly attributable to the satisfaction of specific performance
obligations associated with the generation of revenues, which are
generally presented within
Total operating income
Fee and
commission expense
, and those that are related to personnel,
general and administrative expenses, which are presented within
Total operating expenses
. For derivatives execution and clearing
services (where UBS acts as an agent), UBS only records its specific
fees in the income statement, with fees payable to other parties
not recognized as an expense but instead directly offset against
the associated income collected from the given client.
›
Refer to Note 4 for more information, including the
disaggregation of revenues
4) Share-based and other deferred compensation plans
UBS recognizes expenses for deferred compensation awards over
the period that the employee is required to provide service to
become entitled to the award. Where the service period is
shortened, for example in the case of employees affected by
restructuring programs or mutually agreed termination provisions,
recognition of such expense is accelerated to the termination
date. Where no future service is required, such as for employees
who are eligible for retirement or who have met certain age and
length-of-service criteria, the services are presumed to have been
received and compensation expense is recognized over the
performance year or, in the case of off-cycle awards, immediately
on the grant date.
Share-based compensation plans
Share-based compensation expense is measured by reference to
the fair value of the equity instruments on the date of grant,
taking into account the terms and conditions inherent in the
award, including, where relevant, dividend rights, transfer
restrictions in effect beyond the vesting date, market conditions,
and non-vesting conditions.
For equity-settled awards, fair value is not remeasured unless
the terms of the award are modified such that there is an
incremental increase in value. Expenses are recognized, on a per-
tranche basis, over the service period based on an estimate of the
number of instruments expected to vest and are adjusted to
reflect the actual outcomes of service or performance conditions.
For equity-settled awards, forfeiture events resulting from a
breach of a non-vesting condition (i.e., one that does not relate
to a service or performance condition) do not result in any
adjustment to the share-based compensation expense.
For cash-settled share-based awards, fair value is remeasured
at each reporting date, so that the cumulative expense recognized
equals the cash distributed.
Other deferred compensation plans
Compensation expense for other deferred compensation plans is
recognized on a per-tranche or straight-line basis, depending on
the nature of the plan. The amount recognized is measured based
on the present value of the amount expected to be paid under
the plan and is remeasured at each reporting date, so that the
cumulative expense recognized equals the cash or the fair value
of respective financial instruments distributed.
›
Refer to Note
28
Consolidated financial statements | UBS Group AG consolidated financial statements
304
Note 1 Summary of material accounting policies (continued)
5) Post-employment benefit plans
Defined benefit plans
Defined benefit
plans specify an amount of benefit that an
employee will receive, which usually depends on one or more
factors, such as age, years of service and compensation. The
defined benefit liability recognized in the balance sheet is the
present value of the defined benefit obligation, measured using
the projected unit credit method, less the fair value of the plan’s
assets at the balance sheet date, with changes resulting from
remeasurements recorded immediately in
Other comprehensive
income
. If the fair value of the plan ’s assets is higher than the
present value of the defined benefit obligation, the recognition of
the resulting net asset is limited to the present value of economic
benefits available in the form of refunds from the plan or
reductions in future contributions to the plan. Calculation of the
net defined benefit obligation or asset takes into account the
specific features of each plan, including risk sharing between
employee and employer,
and
is
calculated periodically by
independent qualified actuaries.
Critical accounting estimates and judgment
s
The net defined benefit liability or asset at the balance sheet date and the
related personnel expense depend on the expected future benefits to be
provided, determined using a number of economic and demographic
assumptions. A range of assumptions could be applied, and different
assumptions could significantly alter the defined benefit liability or asset
and pension expense recognized. The most significant assumptions include
life expectancy, discount rate, expected salary increases, pension increases
and interest credits on retirement savings account balances. Sensitivity
analysis for reasonable possible movements in each significant assumption
for UBS‘s post-employment obligations is provided in Note 27.
›
Refer to Note 27
for more information
Defined contribution plans
A defined contribution plan pays fixed contributions into a
separate entity from which post-employment and other benefits
are paid. UBS has no legal or constructive obligation to pay further
amounts
if the plan does not hold sufficient assets to pay
employees the benefits relating to employee service in the current
and prior periods. Compensation expense is recognized when the
employees have rendered services in exchange for contributions.
This is generally in the year of contribution. Prepaid contributions
are recognized as an asset to the extent that a cash refund or a
reduction in future payments is available.
6) Income taxes
UBS is subject to the income tax laws of Switzerland and those of
the non-Swiss jurisdictions in which UBS has business operations.
The Group’s provision for income taxes is composed of current
and deferred taxes. Current income taxes represent taxes to be
paid or refunded for the current period or previous periods.
Deferred taxes are recognized for temporary differences
between the carrying amounts and tax bases of assets and
liabilities that will result in taxable or deductible amounts in future
periods and are measured using the applicable tax rates and laws
that have been enacted or substantively enacted by the end of the
reporting period and that will be in effect when such differences
are expected to reverse.
Deferred tax assets arise from a variety of sources, the most
significant being: (i) tax losses that can be carried forward to be
used against profits in future years; and (ii) temporary differences
that will result in deductions against profits in future years.
Deferred tax assets are recognized only to the extent it is probable
that sufficient taxable profits will be available against which these
differences can be used. When an entity or tax group has a history
of recent losses, deferred tax assets are only recognized to the
extent there are sufficient taxable temporary differences or there
is convincing other evidence that sufficient taxable profit will be
available against which the unused tax losses can be utilized.
Deferred tax liabilities are recognized for temporary differences
between the carrying amounts of assets and liabilities in the
balance sheet that reflect the expectation that certain items will
give rise to taxable income in future periods.
Deferred and current tax assets and liabilities are offset when:
(i) they arise in the same tax reporting group; (ii) they relate to the
same tax authority; (iii) the legal right to offset exists; and (iv) they
are intended to be settled net or realized simultaneously.
Current and deferred taxes are recognized as income tax
benefit or expense in the income statement, except for current
and deferred taxes recognized in relation to: (i) the acquisition of
a subsidiary (for which such amounts would affect the amount of
goodwill arising from the acquisition); (ii) gains and losses on the
sale of treasury shares (for which the tax effects are recognized
directly in
Equity
); (iii) unrealized gains or losses on financial
instruments that are classified at FVOCI; (iv) changes in fair value
of derivative instruments designated as cash flow hedges; (v)
remeasurements of defined benefit plans; or (vi) certain foreign
currency translations of foreign operations. Amounts relating to
points (iii) through (vi)
above
are recognized in
Other
comprehensive income
Equity
.
UBS reflects the potential effect of uncertain tax positions for
which acceptance by the relevant tax authority is not considered
probable by adjusting current or deferred taxes, as applicable,
using either the most likely amount or expected value methods,
depending on which method is deemed a better predictor of the
basis on which, and extent to which, the uncertainty will be
resolved.
305
Note 1 Summary of material accounting policies (continued)
Critical accounting estimates and judgments
Tax laws are complex, and judgment and interpretations about the
application of such laws are required when accounting for income taxes.
UBS considers the performance of its businesses and the accuracy of
historical forecasts and other factors when evaluating the recoverability of
its deferred tax assets, including the remaining tax loss carry-forward
period, and its assessment of expected future taxable profits in the forecast
period used for recognizing deferred tax assets. Estimating future
profitability and business plan forecasts is inherently subjective and is
particularly sensitive to future economic, market and other conditions.
Forecasts are reviewed annually, but adjustments may be made at other
times, if required. If recent losses have been incurred, convincing evidence
is required to prove there is sufficient future profitability given the value of
UBS’s deferred tax assets may be affected, with effects primarily recognized
through the income statement.
In addition, judgment is required to assess the expected value of
uncertain tax positions and the related probabilities, including
interpretation of tax laws, the resolution of any income tax-related appeals
and litigation.
›
Refer to Note 8 for more information
7) Property, equipment and software
Property, equipment and software
is
measured
at cost less
accumulated dep
reciation and impairment losses
.
Software
development costs are capitalized only when the costs can be
measured reliably and it is probable that future economic benefits
will arise. Depreciation of property, equipment and software
begins when they are available for use and is calculated on a
straight line basis over an asset’s estimated useful life.
Property, equipment and software are generally tested for
impairment at the appropriate
cash
-
generating unit level,
alongside goodwill and intangible assets as described in item 8 in
this Note. An impairment charge is recognized for such assets if
the recoverable amount is
below its carrying amount
.
The
recoverable amounts of such assets, other than property that has
a market price, are generally determined using a replacement cost
approach that reflects the amount that would be currently
required by a market participant to replace the service capacity of
the asset. If such assets are no longer used, they are tested
individually for impairment.
›
Refer to Note
12
for more information
8) Goodwill
Goodwill represents the excess of the consideration over the fair
value of identifiable assets, liabilities and contingent liabilities
acquired that arises in a business combination. Goodwill is not
amortized, but is assessed for impairment at the end of each
reporting period, or when indicators exist. UBS tests
��
of impairmentgoodwill for impairment annually, irrespective of whether there is
any indication of impairment.
An impairment charge is recognized in the income statement if
the carrying amount exceeds the recoverable amount.
Critical accounting estimates and judgments
UBS‘s methodology for goodwill impairment testing is based on a model
that is most sensitive to the following key assumptions: (i) forecasts of
earnings available to shareholders in years one to three; (ii) changes in the
discount rates; and (iii) changes in the long-term growth rate.
Earnings available to shareholders are estimated on the basis of forecast
results, which are part of the business plan approved by the Board of
Directors. The discount rates and growth rates are determined using
external information, and also considering inputs from both internal and
external analysts and the view of management.
The key assumptions used to determine the recoverable amounts of
each cash-generating unit are tested for sensitivity by applying reasonably
possible changes to those assumptions.
›
Refer to Notes
2
and
9) Provisions and contingent liabilities
Provisions are liabilities of uncertain timing or amount, and are
generally
recognized
in accordance with IAS
37,
Provisions,
Contingent Liabilities and Contingent Assets
, when: (i) UBS has a
present obligation as a result of a past event; (ii) it is probable that
an outflow of resources will be required to settle the obligation;
and (iii) a reliable estimate of the amount of the obligation can be
made.
The majority of UBS’s provisions relate to litigation, regulatory
and similar matters, restructuring, and employee benefits.
Restructuring provisions are generally recognized as a
consequence of management agreeing to materially change the
scope of the business or the manner in which it is conducted,
including changes in management structures. Provisions for
employee benefits relate mainly to service anniversaries and
sabbatical leave, and are recognized in accordance with
measurement principles set out in item 4 in this Note. In addition,
UBS presents expected credit loss allowances within
Provisions
they relate to a loan commitment, financial guarantee contract or
a revolving revocable credit line.
IAS 37 provisions are measured considering the best estimate
of the consideration required to settle the present obligation at
the balance sheet date.
When conditions required to recognize a provision are not met,
a contingent liability is disclosed, unless the likelihood of an
outflow of resources is remote. Contingent liabilities are also
disclosed for possible obligations that arise from past events the
existence of which will be confirmed only by uncertain future
events not wholly within the control of UBS.
Consolidated financial statements | UBS Group AG consolidated financial statements
306
Note 1 Summary of material accounting policies
(continued)
Critical accounting estimates and judgments
Recognition of provisions often involves significant judgment in assessing
the existence of an obligation that results from
past events and in
estimating the probability, timing and amount of any outflows of resources.
This is particularly the case for litigation, regulatory and similar matters,
which, due to their nature, are subject to many uncertainties, making their
outcome difficult to predict.
The amount of any provision recognized is sensitive to the assumptions
used and there could be a wide range of possible outcomes for any
particular matter.
Management regularly reviews all the available information regarding
such matters, including legal advice, to assess whether the recognition
criteria for provisions have been satisfied and to determine the timing and
amount of any potential outflows
.
›
Refer to Note
18
10) Foreign currency translation
Transactions denominated in a foreign currency are translated
into the functional currency of the reporting entity at the spot
exchange rate on the date of the transaction. At the balance sheet
date, all monetary assets, including those at FVOCI, and monetary
liabilities denominated in foreign currency are translated into the
functional currency using the closing exchange rate. Translation
differences are reported in
Other net income from financial
instruments measured at fair value through profit or loss
.
Non-monetary items measured at historical cost are translated
at the exchange rate on the date of the transaction.
Upon consolidation, assets and liabilities of foreign operations
are translated into US dollars, UBS’s presentation currency, at the
closing exchange rate on the balance sheet date, and income and
expense items and other comprehensive income are translated at
the average rate for the period. The resulting foreign currency
translation differences are recognized in
Equity
the income statement when UBS disposes of, partially or in its
entirety, the foreign operation and UBS no longer controls the
foreign operation.
Share capital issued, share premium and treasury shares held are
translated at the historic average rate, with the difference between
the historic average rate and the spot rate realized upon repayment
of share capital or disposal of treasury shares reported as
Share
premium.
Other comprehensive
income
in respect of cash flow hedg
es and financial assets
measured at FVOCI are translated at the closing exchange rate as
of the balance sheet dates, with any translation effects adjusted
through
Retained earnings
.
›
Refer to Note 33 for more information
11) Equity, treasury shares and contracts on UBS Group AG
shares
UBS Group AG shares held (treasury shares)
UBS Group AG shares held by the Group, including those
purchased as part of market-making activities, are presented in
Equity
as
Treasury shares
at their acquisition cost and are
deducted from
Equity
difference between the proceeds from sales of treasury shares
and their weighted average cost (net of tax, if any) is reported as
Share premium
.
Net cash settlement contracts
Contracts involving UBS Group AG shares that require net cash
settlement, or provide the counterparty or UBS with a settlement
option that includes a choice of settling net in cash, are classified
as derivatives held for trading.
307
Note 1 Summary of material accounting policies (continued)
b)
Changes in accounting policies, comparability and other adjustments
Amendments to IAS 1,
Presentation of Financial Statements
, and
IFRS Practice Statement 2,
Making Materiality Judgements
Effective from 1 January 2021, UBS early adopted amendments to
IAS 1,
Presentation of Financial Statements
, and IFRS Practice
Statement 2,
Making Materiality Judgements
, issued by IASB in
February 2021. The disclosure of material accounting policies in
Note 1a has been refined through adopting these amendments.
Amendments to IAS 39, IFRS 9 and IFRS 7 (
Interest Rate
Benchmark Reform – Phase 2
)
On 1 January 2021, UBS adopted
Interest Rate Benchmark
Reform – Phase 2 (Amendments to IFRS 9, IAS 39, IFRS 7, IFRS 4
and IFRS 16)
, addressing a number of issues in financial reporting
areas that arise when interbank offered rates (IBORs) are reformed
or replaced. The amendments provide a practical expedient that
permits certain changes in the contractual cash flows of debt
instruments attributable to the replacement of IBORs with
alternative reference rates (ARRs) to be accounted for
prospectively by updating a given instrument’s effective interest
rate (EIR), provided (i) the change is necessary as a direct
consequence of IBOR reform and (ii) the new basis for
determining the contractual cash flows is economically equivalent
to the previous basis. UBS has adopted the amendments, which
had no material effect on the Group’s financial statements.
T
he amendments
also
provide various hedge accounting
reliefs, with the following adopted by UBS:
–
D
esignate
an
ARR as a non
-
contractually specified risk
component, even if it is not separately identifiable at the date
when it was designated, provided UBS can reasonably expect
that it will meet the requirements within 24 months of the first
designation and the risk component is reliably measurable. As
of 31 December 2021, the principal ARRs that UBS has
designated as the hedged risk in fair value hedges of interest
rate risk related to debt instruments, mortgages and cash flow
hedges of forecast transactions were the Secured Overnight
Financing Rate (SOFR), the Swiss Average Rate Overnight
(SARON) and the Sterling Overnight Index Average (SONIA).
–
Amend hedge documentation for the fair value hedges of
interest rate risk related to debt instruments for which the
hedged risk changed due to IBOR reform, which allowed UBS
to continue the hedge relationship in accordance with the
requirements of the phase 2 amendment.
–
The cash flow hedges of IBOR forecast transactions in Swiss
francs and pounds sterling were discontinued and replaced
with new ARR designations in December 2021. The amount
accumulated in the cash flow hedge reserve is deemed to be
based on the ARR on which the hedged future cash flows will
be based. Amounts will be released to the income statement
when the forecast ARR cash flows affect the income statement
or are no longer expected to occur.
›
Refer to Note 26 for more information
The amendments also introduced additional disclosure
requirements regarding the Group’s management of the
transition to alternative benchmark rates, its progress as at the
reporting date and the risks to which it is exposed arising from
financial instruments because of the transition.
›
Refer to Note 25 for more information
c)
International Financial Reporting Standards and Interpretations to be adopted in 2022 and later and other changes
IFRS 17,
In May 2017, the IASB issued IFRS 17,
Insurance Contracts
, which
sets out the accounting requirements for contractual rights and
obligations that arise from insurance contracts issued and
reinsurance contracts held. IFRS 17 is effective from 1 January
2023. UBS is assessing the standard, but does not expect it to
have a material effect on the Group’s financial statements.
Consolidated financial statements | UBS Group AG consolidated financial statements
308
Note 2a Segment reporting
UBS’s businesses are organized globally into four business
divisions: Global Wealth Management, Personal & Corporate
Banking, Asset Management and the Investment Bank. All four
business divisions are supported by Group Functions and qualify
as reportable segments for the purpose of segment reporting.
Together with Group Functions, the four business divisions reflect
the management structure of the Group.
–
Global Wealth Management
provides financial services,
advice and solutions to private clients, in particular in the ultra
high net worth and high net worth segments. Its offering
ranges from investment management to estate planning and
corporate finance advice, in addition to specific wealth
management products and services. The business division is
managed globally across the regions.
–
Personal & Corporate Banking
and institutional client
s
’ needs
,
from
basic banking to
retirement, financing, investments and strategic transactions,
in Switzerland
,
through its branch network and digital
channels.
–
Asset Management
asset manager. It offers investment capabilities and styles
across all major traditional and alternative asset classes, as well
as advisory support to institutions, wholesale intermediaries
and wealth management clients globally.
–
The
Investment Bank
provides a range of services to
institutional, corporate and wealth management clients
globally, to help them raise capital, grow their businesses,
invest and manage risks. Its offering includes advisory services,
facilitating clients raising debt and equity from the public and
private markets
and
capital markets, cash and derivatives
trading across equities and fixed income, and financing.
–
Group Functions
Group Se
rvices
(
which consists of
Technology,
Corporate
Services,
Human Resources
,
Finance,
Legal, Risk Control,
Compliance, Regulatory & Governance, Communications &
Branding and Group Sustainability and Impact), Group Treasury
and Non-core and Legacy Portfolio.
Financial information about the four business divisions and
Group Functions is presented separately in internal management
reports to the Group Executive Board (the GEB), which is
considered the “chief operating decision maker” pursuant to
IFRS 8,
Operating Segments
.
UBS’s internal accounting policies, which include management
accounting policies and service level agreements, determine the
revenues and expenses directly attributable to each reportable
segment. Transactions between the reportable segments are
carried out at internally agreed rates and are reflected in the
operating results of the reportable segments. Revenue-sharing
agreements are used to allocate external client revenues to
reportable segments where several reportable segments are
involved in the value creation chain. Total intersegment revenues
for the Group are immaterial, as the majority of the revenues are
allocated across the segments by means of revenue-sharing
agreements. Interest income earned from managing UBS’s
consolidated equity is allocated to the reportable segments based
on average attributed equity and currency composition. Assets
and liabilities of the reportable segments are funded through and
invested with Group Functions, and the net interest margin is
reflected in the results of each reportable segment.
Segment assets are based on a third-party view and do not
include intercompany balances. This view is in line with internal
reporting to the GEB. If one operating segment is involved in an
external transaction together with another operating segment or
Group Functions, additional criteria are considered to determine
the segment that will report the associated assets. This will include
a consideration of which segment’s business needs are being
addressed by the transaction and which segment is providing the
funding and / or resources. Allocation of liabilities follows the
same principles.
Non-current assets disclosed for segment reporting purposes
represent assets that are expected to be recovered more than 12
months after the reporting date, excluding financial instruments,
deferred tax assets and post-employment benefits.
309
Note 2a Segment reporting (continued)
USD million
Global Wealth
Management
Personal &
Corporate
Banking
Asset
Management
Investment
Bank
Group
Functions
UBS
For the year ended 31 December 2021
Net interest income
4,244
2,120
(15)
481
(127)
6,705
Non-interest income
15,175
2,143
2,632
8,972
(233)
28,689
Income
19,419
4,263
2,617
9,454
(359)
35,393
Credit loss (expense) / release
29
86
(1)
34
0
148
Total operating income
19,449
4,349
2,616
9,488
(360)
35,542
Total operating expenses
14,665
2,618
1,586
6,858
330
26,058
Operating profit / (loss) before tax
4,783
1,731
1,030
2,630
(689)
9,484
Tax expense / (benefit)
1,998
Net profit / (loss)
7,486
Additional information
Total assets
395,235
225,370
25,639
346,431
124,507
1,117,182
Additions to non-current assets
56
16
1
30
1,989
2,091
USD million
Global Wealth
Management
Personal &
Corporate
Banking
Asset
Management
Investment
Bank
Group
Functions
UBS
For the year ended 31 December 2020
Net interest income
4,027
2,049
(17)
284
(481)
5,862
Non-interest income
1
13,107
1,858
2,993
9,235
30
27,222
Income
17,134
3,908
2,975
9,519
(452)
33,084
Credit loss (expense) / release
(88)
(257)
(2)
(305)
(42)
(694)
Total operating income
17,045
3,651
2,974
9,214
(494)
32,390
Total operating expenses
13,026
2,392
1,519
6,732
567
24,235
Operating profit / (loss) before tax
4,019
1,259
1,455
2,482
(1,060)
8,155
Tax expense / (benefit)
1,583
Net profit / (loss)
6,572
Additional information
Total assets
367,714
231,657
28,589
369,683
128,122
1,125,765
Additions to non-current assets
5
12
385
150
2,294
2,847
USD million
Global Wealth
Management
Personal &
Corporate
Banking
Asset
Management
Investment
Bank
Group
Functions
UBS
For the year ended 31 December 2019
Net interest income
3,947
1,992
(25)
(669)
(744)
4,501
Non-interest income
12,426
1,744
1,962
7,968
367
24,467
Income
16,373
3,736
1,938
7,299
(378)
28,967
Credit loss (expense) / release
(20)
(21)
0
(30)
(7)
(78)
Total operating income
16,353
3,715
1,938
7,269
(385)
28,889
Total operating expenses
12,955
2,274
1,406
6,485
192
23,312
Operating profit / (loss) before tax
3,397
1,441
532
784
(577)
5,577
Tax expense / (benefit)
1,267
Net profit / (loss)
4,310
Additional information
Total assets
309,766
209,405
34,565
315,855
102,603
972,194
Additions to non-current assets
68
10
0
1
5,217
5,297
1 Includes a USD
631
571
60
recognized in Global Wealth Management.
Consolidated financial statements | UBS Group AG consolidated financial statements
310
Note 2b Segment reporting by geographic location
The operating regions shown in the table below correspond to
the regional management structure of the Group. The allocation
of operating income to these regions reflects, and is consistent
with, the basis on which the business is managed and its
performance is evaluated. These allocations involve assumptions
and judgments that management considers to be reasonable, and
may be refined to reflect changes in estimates or management
structure. The main principles of the allocation methodology are
that client revenues are attributed to the domicile of the given
client and trading and portfolio management revenues are
attributed to the country where the risk is managed. This revenue
attribution is consistent with the mandate of the regional
Presidents. Certain revenues, such as those related to Non-core
and Legacy Portfolio in Group Functions, are managed at a Group
level. These revenues are included in the
Global
The geographic analysis of non-current assets is based on the
location of the entity in which the given assets are recorded.
For the year ended 31 December 2021
Total operating income
Total non-current assets
USD billion
Share %
USD billion
Share %
Americas
14.5
41
9.0
44
of which: USA
13.5
38
8.5
41
Asia Pacific
6.5
18
1.5
7
Europe, Middle East and Africa (excluding Switzerland)
7.0
20
2.9
14
Switzerland
7.9
22
7.1
35
Global
(0.3)
(1)
0.0
0
Total
35.5
100
20.5
100
For the year ended 31 December 2020
Total operating income
Total non-current assets
USD billion
Share %
USD billion
Share %
Americas
13.0
40
9.0
42
of which: USA
11.7
36
8.4
40
Asia Pacific
6.0
18
1.5
7
Europe, Middle East and Africa (excluding Switzerland)
6.5
20
3.0
14
Switzerland
6.9
21
7.6
36
Global
0.1
0
0.0
0
Total
32.4
100
21.1
100
For the year ended 31 December 2019
Total operating income
Total non-current assets
USD billion
Share %
USD billion
Share %
Americas
12.0
42
8.9
44
of which: USA
10.9
38
8.5
42
Asia Pacific
4.7
16
1.4
7
Europe, Middle East and Africa (excluding Switzerland)
5.8
20
3.0
15
Switzerland
6.7
23
7.1
35
Global
(0.3)
(1)
0.0
0
Total
28.9
100
20.3
100
311
Income statement notes
Note 3 Net interest income and other net income from financial instruments measured at fair value through profit or loss
For the year ended
USD million
31.12.21
31.12.20
31.12.19
Net interest income from financial instruments measured at fair value through profit or loss
1,431
1,299
1,011
Other net income from financial instruments measured at fair value through profit or loss
5,850
6,960
6,842
of which: net gains / (losses) from financial liabilities designated at fair value
1
(6,582)
1,509
(8,748)
Total net income from financial instruments measured at fair value through profit or loss
7,281
8,259
7,853
Net interest income
Interest income from loans and deposits
2
6,488
6,690
8,008
Interest income from securities financing transactions
3
513
862
2,005
Interest income from other financial instruments measured at amortized cost
284
335
364
Interest income from debt instruments measured at fair value through other comprehensive income
115
101
120
Interest income from derivative instruments designated as cash flow hedges
1,133
822
188
Total interest income from financial instruments measured at amortized cost and fair value through other comprehensive income
8,533
8,810
10,684
Interest expense on loans and deposits
4
523
1,031
2,634
Interest expense on securities financing transactions
5
1,102
870
1,152
Interest expense on debt issued
1,533
2,237
3,285
Interest expense on lease liabilities
102
110
122
Total interest expense from financial instruments measured at amortized cost
3,259
4,247
7,194
Total net interest income from financial instruments measured at amortized cost and fair value through other comprehensive income
5,274
4,563
3,490
Total net interest income from financial instruments measured at fair value through profit or loss
1,431
1,299
1,011
Total net interest income
6,705
5,862
4,501
1 Excludes fair value changes of hedges related to financial liabilities designated at fair value and foreign currency translation effects arising from translating foreign currency transactions into the respective functional
currency, both of which are reported within Other net income from financial instruments measured at fair value through profit or loss. 2021 included net losses of USD
2,068
72
USD
1,830
USD
2,068
72
1,830
through profit or loss not held for trading. 2 Consists of interest income from cash and balances at central banks, loans and advances to banks and customers, and cash collateral receivables on derivative instruments,
as well as negative interest on amounts due to banks, customer deposits, and cash collateral payables on derivative instruments. 3 Includes interest income on receivables from securities financing transactions and
negative interest, including fees, on payables from securities financing transactions. 4 Consists of interest expense on amounts due to banks, cash collateral payables on derivative instruments, and customer
deposits, as well as negative interest on cash and balances at central banks, loans and advances to banks, and cash collateral receivables on derivative instruments. 5 Includes interest expense on payables from
securities financing transactions and negative interest, including fees, on receivables from securities financing transactions.
Consolidated financial statements | UBS Group AG consolidated financial statements
312
Note 4 Net fee and commission income
For the year ended
USD million
31.12.21
31.12.20
31.12.19
Fee and commission income
Underwriting fees
1,463
1,085
741
M&A and corporate finance fees
1,102
736
774
Brokerage fees
4,382
4,132
3,248
Investment fund fees
5,790
5,289
4,858
Portfolio management and related services
9,762
8,009
7,656
Other
1,874
1,710
1,832
Total fee and commission income
1
24,372
20,961
19,110
of which: recurring
15,410
13,009
12,544
of which: transaction-based
8,692
7,491
6,402
of which: performance-based
269
461
163
Fee and commission expense
Brokerage fees paid
259
274
310
Distribution fees paid
611
589
590
Other
1,115
912
797
Total fee and commission expense
1,985
1,775
1,696
Net fee and commission income
22,387
19,186
17,413
of which: net brokerage fees
4,123
3,858
2,938
1 For the year ended 31 December 2021, reflects third-party fee and commission income of USD
14,545
1,644
3,337
million for Asset Management, USD
4,814
33
12,475
USD
1,426
3,129
3,882
49
2019: USD
11,694
1,307
2,659
3,355
94
million for Group Functions).
Note 5 Other income
For the year ended
USD million
31.12.21
31.12.20
31.12.19
Associates, joint ventures and subsidiaries
Net gains / (losses) from acquisitions and disposals of subsidiaries
1
(11)
635
2
(36)
Net gains / (losses) from disposals of investments in associates
41
0
4
Share of net profits of associates and joint ventures
105
84
46
Impairments related to associates
0
0
(1)
Total
135
719
13
Net gains / (losses) from disposals of financial assets measured at fair value through other comprehensive income
9
40
31
Income from properties
3
23
26
27
Net gains / (losses) from properties held for sale
100
4
76
5
(19)
Other
185
6
216
7
160
Total other income
452
1,076
212
1 Includes foreign exchange gains / (losses) reclassified from other comprehensive income related to the disposal or closure of foreign operations. 2 Includes a USD
631
stake in Fondcenter AG (now Clearstream Fund Centre AG). 3 Includes rent received from third parties. 4 Mainly relates to the sale of a property in Basel. 5 Includes net gains of USD
140
sale-and-leaseback transactions, primarily related to a property in Geneva, partly offset by remeasurement losses relating to properties that were reclassified as held for sale. 6 Includes a gain of USD
100
from the sale of UBS's domestic wealth management business in Austria. Refer to Note 30 for more information. 7 Includes a USD
215
Bloomberg Commodity Index family.
313
Note 6 Personnel expenses
For the year ended
USD million
31.12.21
31.12.20
31.12.19
Salaries
1
7,339
7,023
6,518
Variable compensation – performance awards
2
3,190
3,209
3
2,755
Variable compensation – other
2
229
220
246
Financial advisor compensation
2,4
4,860
4,091
4,043
Contractors
381
375
381
Social security
978
899
3
799
Post-employment benefit plans
5
833
6
845
787
of which: defined benefit plans
470
502
461
of which: defined contribution plans
363
343
326
Other personnel expenses
576
561
3
555
Total personnel expenses
18,387
17,224
16,084
1 Includes role-based allowances. 2 Refer to Note 28 for more information. 3 During 2020, UBS modified the conditions for continued vesting of certain outstanding deferred compensation awards for qualifying
employees, resulting in an expense of approximately USD
280
240
20
20
million within Other personnel expenses. 4 Financial advisor compensation consists of grid-based compensation based directly on compensable revenues generated by financial advisors and supplemental
compensation calculated on the basis of financial advisor productivity, firm tenure, assets and other variables. It also includes expenses related to compensation commitments with financial advisors entered into at
the time of recruitment that are subject to vesting requirements. 5 Refer to Note 27 for more information. 6 Includes curtailment gains of USD
80
obligation related to the Swiss pension plan resulting from a decrease in headcount following restructuring activities.
Note 7 General and administrative expenses
1
For the year ended
USD million
31.12.21
31.12.20
31.12.19
Outsourcing costs
893
951
1,072
IT expenses
1,055
949
860
Consulting, legal and audit fees
540
646
850
Real estate and logistics costs
634
671
662
Market data services
417
413
414
Marketing and communication
242
217
270
Travel and entertainment
72
84
298
Litigation, regulatory and similar matters
2
911
197
165
Other
788
757
696
of which: UK and German bank levies
3
58
55
41
Total general and administrative expenses
5,553
4,885
5,288
1 In 2021, UBS changed the presentation of the line items within general and administrative expenses. Prior-period information reflects the new presentation structure, with no effect on Total general and administrative
expenses. 2 Reflects the net increase in provisions for litigation, regulatory and similar matters recognized in the income statement. Refer to Note 18 for more information. Also, includes recoveries from third parties
of USD
1
3
11
22
38
30
USD
16
27
31
Consolidated financial statements | UBS Group AG consolidated financial statements
314
Note 8 Income taxes
For the year ended
USD million
31.12.21
31.12.20
31.12.19
Tax expense / (benefit)
Swiss
Current
680
482
365
Deferred
34
116
265
Total Swiss
714
598
630
Non-Swiss
Current
884
749
426
Deferred
400
236
211
Total non-Swiss
1,284
985
637
Total income tax expense / (benefit) recognized in the income statement
1,998
1,583
1,267
Income tax recognized in the income statement
Income tax expenses of USD
1,998
the Group in 2021, representing an effective tax rate of
21.1
%.
These included Swiss tax expenses of USD
714
Swiss tax expenses of USD
1,284
The Swiss tax expenses included current tax expenses of
USD
680
and other Swiss entities. They also included deferred tax expenses
of USD
34
million, which reflect
movements in temporary
differences.
The non-Swiss tax expenses included current tax expenses of
USD
884
subsidiaries and branches
,
and
net
deferred t
ax expenses of
USD
400
734
related to the amortization of deferred tax assets (DTAs) previously
recognized in relation to tax losses carried forward and deductible
temporary differences of UBS Americas Inc., were partly offset by
a benefit of USD
334
DTAs. This benefit included upward
revaluations
of DTAs of
USD
152
our business planning process. It also included USD
113
respect of additional DTA recognition that primarily related to the
contribution of real estate assets by UBS AG to UBS Americas Inc.
and UBS Financial Services Inc., which allowed the full recognition
of DTAs in respect of the associated historic real estate costs that
were previously capitalized for US tax purposes under elections
that were made in the fourth quarter of 2018. In addition, it
included USD
69
value of future tax deductions for deferred compensation awards,
due to an increase in the Group’s share price during the year.
The pre-tax expense that was recognized in the year in respect
of the increase in litigation provisions for the French cross-border
matter did not result in any tax benefit.
For the year ended
USD million
31.12.21
31.12.20
31.12.19
Operating profit / (loss) before tax
9,484
8,155
5,577
of which: Swiss
3,334
3,403
2,571
of which: non-Swiss
6,150
4,752
3,006
Income taxes at Swiss tax rate of
18.5
% for 2021,
19.5
% for 2020 and
20.5
% for 2019
1,755
1,590
1,143
Increase / (decrease) resulting from:
Non-Swiss tax rates differing from Swiss tax rate
234
110
82
Tax effects of losses not recognized
124
144
131
Previously unrecognized tax losses now utilized
(179)
(212)
(265)
Non-taxable and lower-taxed income
(278)
(394)
(351)
Non-deductible expenses and additional taxable income
510
385
732
Adjustments related to prior years – current tax
(40)
(67)
(5)
Adjustments related to prior years – deferred tax
(10)
12
(6)
Change in deferred tax recognition
(342)
(381)
(294)
Adjustments to deferred tax balances arising from changes in tax rates
(5)
234
(9)
Other items
231
161
107
Income tax expense / (benefit)
1,998
1,583
1,267
315
Note 8 Income taxes (continued)
The components of operating profit before tax, and the differences between income tax expense reflected in the financial statements
and the amounts calculated at the Swiss tax rate, are provided in the table on the previous page and explained below.
Component
Description
Non-Swiss tax rates
differing from Swiss tax
rate
To the extent that Group profits or losses arise outside Switzerland, the applicable local tax rate may differ from the Swiss tax
rate. This item reflects, for such profits, an adjustment from the tax expense that would arise at the Swiss tax rate to the tax
expense that would arise at the applicable local tax rate. Similarly, it reflects, for such losses, an adjustment from the tax
benefit that would arise at the Swiss tax rate to the tax benefit that would arise at the applicable local tax rate.
Tax effects of losses not
recognized
This item relates to tax losses of entities arising in the year that are not recognized as DTAs and where no tax benefit arises in
relation to those losses. Therefore, the tax benefit calculated by applying the local tax rate to those losses as described above
is reversed.
Previously unrecognized
tax losses now utilized
This item relates to taxable profits of the year that are offset by tax losses of previous years for which no DTAs were previously
recorded. Consequently, no current tax or deferred tax expense arises in relation to those taxable profits and the tax expense
calculated by applying the local tax rate on those profits is reversed.
Non-taxable and lower-
taxed income
This item relates to tax deductions for the year in respect of permanent differences. These include deductions in respect of
profits that are either not taxable or are taxable at a lower rate of tax than the local tax rate. They also include deductions
made for tax purposes, which are not reflected in the accounts.
Non-deductible expenses
and additional taxable
income
This item relates to additional taxable income for the year in respect of permanent differences. These include income that is
recognized for tax purposes by an entity but is not included in its profit that is reported in the financial statements, as well as
expenses for the year that are non-deductible (e.g., client entertainment costs are not deductible in certain locations).
Adjustments related to
prior years – current tax
This item relates to adjustments to current tax expense for prior years (e.g., if the tax payable for a year is agreed with the tax
authorities in an amount that differs from the amount previously reflected in the financial statements).
Adjustments related to
prior years – deferred tax
This item relates to adjustments to deferred tax positions recognized in prior years (e.g., if a tax loss for a year is fully
recognized and the amount of the tax loss agreed with the tax authorities is expected to differ from the amount previously
recognized as DTAs in the accounts).
Change in deferred tax
recognition
This item relates to changes in DTAs, including changes in DTAs previously recognized resulting from reassessments of
expected future taxable profits. It also includes changes in temporary differences in the year, for which deferred tax is not
recognized.
Adjustments to deferred
tax balances arising from
changes in tax rates
This item relates to remeasurements of DTAs and liabilities recognized due to changes in tax rates. These have the effect of
changing the future tax saving that is expected from tax losses or deductible tax differences and therefore the amount of
DTAs recognized or, alternatively, changing the tax cost of additional taxable income from taxable temporary differences and
therefore the deferred tax liability.
Other items
Other items include other differences between profits or losses at the local tax rate and the actual local tax expense or
benefit, including movements in provisions for uncertain positions in relation to the current year and other items.
Income tax recognized directly in equity
A net tax benefit of USD
479
Other comprehensive income
237
net tax expense of USD
88
Share premium
(2020: benefit of USD
18
Consolidated financial statements | UBS Group AG consolidated financial statements
316
Note 8 Income taxes (continued)
Deferred tax assets and liabilities
The Group has gross DTAs, valuation allowances and recognized
DTAs related to tax loss carry-forwards and deductible temporary
differences, and also deferred tax liabilities in respect of taxable
temporary differences, as shown in the table below. The valuation
allowances reflect DTAs that were not recognized because, as of
the last remeasurement period, management did not consider it
probable that there would be sufficient future taxable profits
available
to utilize the related tax loss carry
-
forwards and
deductible temporary differences.
The recognition of DTAs is supported by forecasts of taxable
profits for the entities concerned. In addition, tax planning
opportunities are available that would result in additional future
taxable income and these would be utilized, if necessary.
Deferred tax liabilities are recognized in respect of investments
in subsidiaries, branches and associates, and interests in joint
arrangements, except to the extent that the Group can control
the timing of the reversal of the associated taxable temporary
difference and it is probable that such will not reverse in the
foreseeable future. However, as of 31
December 202
1
,
this
exception was not considered to apply to any taxable temporary
differences.
USD million
31.12.21
31.12.20
Deferred tax assets
1
Gross
Valuation
allowance
Recognized
Gross
Valuation
allowance
Recognized
Tax loss carry-forwards
13,636
(9,193)
4,443
14,108
(8,715)
5,393
Temporary differences
5,133
(700)
4,433
4,384
(565)
3,819
of which: related to real estate costs capitalized for US tax
purposes
2,272
0
2,272
2,268
0
2,268
of which: related to compensation and benefits
1,222
(209)
1,013
1,128
(173)
955
of which: other
1,639
(491)
1,148
989
(392)
564
Total deferred tax assets
18,769
(9,893)
8,876
2
18,492
(9,280)
9,212
2
of which: related to the US
8,521
8,780
of which: related to other locations
355
431
Deferred tax liabilities
Cash flow hedges
118
425
Other
183
139
Total deferred tax liabilities
300
564
1 After offset of DTLs, as applicable. 2 As of 31 December 2021, the Group recognized DTAs of USD
77
138
or preceding year.
In general, US federal tax losses incurred prior to 31 December
2017 can be carried forward for 20 years. However, US federal tax
losses incurred after 31 December 2017 and UK tax losses can be
carried forward indefinitely, although the utilization of such losses
is limited to 80% of the entity’s future year taxable profits for the
US and generally to 25% thereof for the UK. The amounts of US
tax loss carry-forwards that are included in the table below are
based on their amount for federal tax purposes rather than for
state and local tax purposes.
Unrecognized tax loss carry-forwards
USD million
31.12.21
31.12.20
Within 1 year
141
146
From 2 to 5 years
1,026
638
From 6 to 10 years
13,283
13,257
From 11 to 20 years
2,093
3,858
No expiry
18,147
17,227
Total
34,690
35,127
of which: related to the US
1
14,870
16,256
of which: related to the UK
14,909
13,848
of which: related to other locations
4,911
5,023
1 Related to UBS AG's US branch.
317
Balance sheet notes
Note 9 Financial assets at amortized cost and other positions in scope of expected credit loss measurement
The tables on the following pages provide information about
financial instruments and certain credit lines that are subject to
expected credit loss (ECL) requirements. UBS’s ECL disclosure
segments or “ECL segments” are aggregated portfolios based on
shared risk characteristics and on the same or similar rating
methods applied. The key segments are presented in the table
below.
›
Refer to Note 20 for more information about expected credit
loss measuremen
t
Segment
Segment description
Description of credit risk sensitivity
Business division / Group Functions
Private clients with
mortgages
Lending to private clients secured by
owner-occupied real estate and
personal account overdrafts of those
clients
Sensitive to the interest rate environment,
unemployment levels, real estate collateral
values and other regional aspects
–
Personal & Corporate Banking
–
Global Wealth Management
Real estate financing
Rental or income-producing real estate
financing to private and corporate
clients secured by real estate
Sensitive to unemployment levels, the
interest rate environment, real estate
collateral values and other regional
aspects
–
Personal & Corporate Banking
–
Global Wealth Management
–
Investment Bank
Large corporate clients
Lending to large corporate and multi-
national clients
Sensitive to GDP developments,
unemployment levels, seasonality,
business cycles and collateral values
(diverse collateral, including real estate
and other collateral types)
–
Personal & Corporate Banking
–
Investment Bank
SME clients
Lending to small and medium-sized
corporate clients
Sensitive to GDP developments,
unemployment levels, the interest rate
environment and, to some extent,
seasonality, business cycles and collateral
values (diverse collateral, including real
estate and other collateral types)
–
Personal & Corporate Banking
Lombard
Loans secured by pledges of marketable
securities, guarantees and other forms
of collateral
Sensitive to equity and debt markets (e.g.,
changes in collateral values)
–
Global Wealth Management
Credit cards
Credit card solutions in Switzerland and
the US
Sensitive to unemployment levels
–
Personal & Corporate Banking
–
Global Wealth Management
Commodity trade
finance
Working capital financing of commodity
traders, generally extended on a self-
liquidating transactional basis
Sensitive primarily to the strength of
individual transaction structures and
collateral values (price volatility of
commodities), as the primary source for
debt service is directly linked to the
shipments financed
–
Personal & Corporate Banking
Financial intermediaries
and hedge funds
Lending to financial institutions and
pension funds, including exposures to
broker-dealers and clearing houses
Sensitive to GDP development, the
interest rate environment, price and
volatility risks in financial markets, and
regulatory and political risk
–
Personal & Corporate Banking
–
Investment Bank
›
Refer to Note 20f for more details regarding sensitivity
Consolidated financial statements | UBS Group AG consolidated financial statements
318
Note 9 Financial assets at amortized cost and other positions in scope of expected credit loss measurement (continued)
The tables below and on the following pages provide ECL exposure and ECL allowance and provision information about financial
instruments and certain non-financial instruments that are subject to ECL.
USD million
31.12.21
Carrying amount
1
ECL allowances
Financial instruments measured at amortized cost
Total
Stage 1
Stage 2
Stage 3
Total
Stage 1
Stage 2
Stage 3
Cash and balances at central banks
192,817
192,817
0
0
0
0
0
0
Loans and advances to banks
15,480
15,453
26
1
(8)
(7)
(1)
0
Receivables from securities financing transactions
75,012
75,012
0
0
(2)
(2)
0
0
Cash collateral receivables on derivative instruments
30,514
30,514
0
0
0
0
0
0
Loans and advances to customers
397,761
380,564
15,620
1,577
(850)
(126)
(152)
(572)
of which: Private clients with mortgages
152,479
143,505
8,262
711
(132)
(28)
(71)
(33)
of which: Real estate financing
43,945
40,463
3,472
9
(60)
(19)
(40)
0
of which: Large corporate clients
13,990
12,643
1,037
310
(170)
(22)
(16)
(133)
of which: SME clients
14,004
12,076
1,492
436
(259)
(19)
(15)
(225)
of which: Lombard
149,283
149,255
0
27
(33)
(6)
0
(28)
of which: Credit cards
1,716
1,345
342
29
(36)
(10)
(9)
(17)
of which: Commodity trade finance
3,813
3,799
7
7
(114)
(6)
0
(108)
Other financial assets measured at amortized cost
26,209
25,718
302
189
(109)
(27)
(7)
(76)
of which: Loans to financial advisors
2,453
2,184
106
163
(86)
(19)
(3)
(63)
Total financial assets measured at amortized cost
737,794
720,079
15,948
1,767
(969)
(161)
(160)
(647)
Financial assets measured at fair value through other comprehensive income
8,844
8,844
0
0
0
0
0
0
Total on-balance sheet financial assets in scope of ECL requirements
746,638
728,923
15,948
1,767
(969)
(161)
(160)
(647)
Total exposure
ECL provisions
Off-balance sheet (in scope of ECL)
Total
Stage 1
Stage 2
Stage 3
Total
Stage 1
Stage 2
Stage 3
Guarantees
20,972
19,695
1,127
150
(41)
(18)
(8)
(15)
of which: Large corporate clients
3,464
2,567
793
104
(6)
(3)
(3)
0
of which: SME clients
1,353
1,143
164
46
(8)
(1)
(1)
(7)
of which: Financial intermediaries and hedge funds
9,575
9,491
84
0
(17)
(13)
(4)
0
of which: Lombard
2,454
2,454
0
0
(1)
0
0
(1)
of which: Commodity trade finance
3,137
3,137
0
0
(1)
(1)
0
0
Irrevocable loan commitments
39,478
37,097
2,335
46
(114)
(72)
(42)
0
of which: Large corporate clients
23,922
21,811
2,102
9
(100)
(66)
(34)
0
Forward starting reverse repurchase and securities borrowing agreements
1,444
1,444
0
0
0
0
0
0
Committed unconditionally revocable credit lines
40,778
38,207
2,508
63
(38)
(28)
(10)
0
of which: Real estate financing
7,328
7,046
281
0
(5)
(4)
(1)
0
of which: Large corporate clients
5,358
4,599
736
23
(7)
(4)
(3)
0
of which: SME clients
5,160
4,736
389
35
(15)
(11)
(3)
0
of which: Lombard
8,670
8,670
0
0
0
0
0
0
of which: Credit cards
9,466
9,000
462
4
(6)
(5)
(2)
0
of which: Commodity trade finance
117
117
0
0
0
0
0
0
Irrevocable committed prolongation of existing loans
5,611
5,527
36
48
(3)
(3)
0
0
Total off-balance sheet financial instruments and credit lines
108,284
101,971
6,006
307
(196)
(121)
(60)
(15)
Total allowances and provisions
(1,165)
(282)
(220)
(662)
1 The carrying amount of financial assets measured at amortized cost represents the total gross exposure net of the respective ECL allowances.
319
Note 9 Financial assets at amortized cost and other positions in scope of expected credit loss measurement (continued)
USD million
31.12.20
Carrying amount
1
ECL allowances
Financial instruments measured at amortized cost
Total
Stage 1
Stage 2
Stage 3
Total
Stage 1
Stage 2
Stage 3
Cash and balances at central banks
158,231
158,231
0
0
0
0
0
0
Loans and advances to banks
15,444
15,260
184
0
(16)
(9)
(5)
(1)
Receivables from securities financing transactions
74,210
74,210
0
0
(2)
(2)
0
0
Cash collateral receivables on derivative instruments
32,737
32,737
0
0
0
0
0
0
Loans and advances to customers
379,528
356,948
20,341
2,240
(1,060)
(142)
(215)
(703)
of which: Private clients with mortgages
148,175
138,769
8,448
959
(166)
(35)
(93)
(39)
of which: Real estate financing
43,429
37,568
5,838
23
(63)
(15)
(44)
(4)
of which: Large corporate clients
15,161
12,658
2,029
474
(279)
(27)
(40)
(212)
of which: SME clients
14,872
11,990
2,254
628
(310)
(19)
(23)
(268)
of which: Lombard
133,850
133,795
0
55
(36)
(5)
0
(31)
of which: Credit cards
1,558
1,198
330
30
(38)
(11)
(11)
(16)
of which: Commodity trade finance
3,269
3,214
43
12
(106)
(5)
0
(101)
Other financial assets measured at amortized cost
27,194
26,377
348
469
(133)
(34)
(9)
(90)
of which: Loans to financial advisors
2,569
1,982
137
450
(108)
(27)
(5)
(76)
Total financial assets measured at amortized cost
687,345
663,763
20,873
2,709
(1,211)
(187)
(229)
(795)
Financial assets measured at fair value through other comprehensive income
8,258
8,258
0
0
0
0
0
0
Total on-balance sheet financial assets in scope of ECL requirements
695,603
672,021
20,873
2,709
(1,211)
(187)
(229)
(795)
Total exposure
ECL provisions
Off-balance sheet (in scope of ECL)
Total
Stage 1
Stage 2
Stage 3
Total
Stage 1
Stage 2
Stage 3
Guarantees
17,081
14,687
2,225
170
(63)
(14)
(15)
(34)
of which: Large corporate clients
3,710
2,048
1,549
113
(20)
(4)
(5)
(12)
of which: SME clients
1,310
936
326
48
(13)
(1)
(1)
(11)
of which: Financial intermediaries and hedge funds
7,637
7,413
224
0
(17)
(7)
(9)
0
of which: Lombard
641
633
0
8
(2)
0
0
(2)
of which: Commodity trade finance
1,441
1,416
25
0
(2)
(1)
0
0
Irrevocable loan commitments
41,372
36,894
4,374
104
(142)
(74)
(68)
0
of which: Large corporate clients
24,209
20,195
3,950
64
(121)
(63)
(58)
0
Forward starting reverse repurchase and securities borrowing agreements
3,247
3,247
0
0
0
0
0
0
Committed unconditionally revocable credit lines
40,134
35,233
4,792
108
(50)
(29)
(21)
0
of which: Real estate financing
6,328
5,811
517
0
(12)
(5)
(7)
0
of which: Large corporate clients
4,909
2,783
2,099
27
(9)
(2)
(7)
0
of which: SME clients
5,827
4,596
1,169
63
(16)
(12)
(4)
0
of which: Lombard
9,671
9,671
0
0
0
(1)
0
0
of which: Credit cards
8,661
8,220
430
11
(8)
(6)
(2)
0
of which: Commodity trade finance
242
242
0
0
0
0
0
0
Irrevocable committed prolongation of existing loans
3,282
3,277
5
0
(2)
(2)
0
0
Total off-balance sheet financial instruments and credit lines
105,116
93,337
11,396
382
(257)
(119)
(104)
(34)
Total allowances and provisions
(1,468)
(306)
(333)
(829)
1 The carrying amount of financial assets measured at amortized cost represents the total gross exposure net of the respective ECL allowances.
Consolidated financial statements | UBS Group AG consolidated financial statements
320
Note 9 Financial assets at amortized cost and other positions in scope of expected credit loss measurement (continued)
Coverage ratios are calculated for the core loan portfolio by
taking ECL allowances and provisions divided by the gross carrying
amount of the exposures. Core loan exposure is defined as the
sum of
Loans and advances to customers
Loans to financial
advisors
.
These ratios are influenced by the following key factors:
–
Lombard loans are generally secured with marketable securities
in portfolios that are, as a rule, highly diversified, with strict
lending policies that are intended to ensure that credit risk is
minimal under most circumstances;
–
mortgage loans to private clients and real estate financing are
controlled by conservative eligibility criteria, including low loan-
to-value ratios and strong debt service capabilities;
–
the amount of unsecured retail lending (including credit cards)
is insignificant;
–
lending in Switzerland includes government-backed COVID-19
loans;
–
contractual maturities in the loan portfolio, which are a factor
in the calculation of ECLs, are generally short, with Lombard
lending typically having average contractual maturities of 12
months or less, real estate lending generally between 2 years
and 3 years in Switzerland with longer dated maturities in the
US and corporate lending between 1 to 2 years with related
loan commitments up to 4 years; and
–
write-offs of ECL allowances against the gross loan balances
when all or part of a financial asset is deemed uncollectible or
forgiven, reduces the coverage ratios
.
Coverage ratios for core loan portfolio
31.12.21
Gross carrying amount (USD million)
ECL coverage (bps)
On-balance sheet
Total
Stage 1
Stage 2
Stage 3
Total
Stage 1
Stage 2
Stage 3
Private clients with mortgages
152,610
143,533
8,333
744
9
2
85
446
Real estate financing
44,004
40,483
3,512
10
14
5
114
231
Large corporate clients
14,161
12,665
1,053
443
120
18
148
2,997
SME clients
14,263
12,095
1,507
661
182
16
103
3,402
Lombard
149,316
149,261
0
55
2
0
0
5,026
Credit cards
1,752
1,355
351
46
204
72
255
3,735
Commodity trade finance
3,927
3,805
7
115
290
15
3
9,388
Other loans and advances to customers
18,578
17,493
1,010
75
25
9
15
3,730
Loans to financial advisors
2,539
2,203
109
226
338
88
303
2,791
Total
1
401,150
382,893
15,882
2,374
23
4
98
2,673
Gross exposure (USD million)
ECL coverage (bps)
Off-balance sheet
Total
Stage 1
Stage 2
Stage 3
Total
Stage 1
Stage 2
Stage 3
Private clients with mortgages
9,123
8,798
276
49
3
3
9
15
Real estate financing
8,766
8,481
285
0
9
7
88
0
Large corporate clients
32,748
28,981
3,630
136
34
25
110
1
SME clients
8,077
7,276
688
114
38
19
151
585
Lombard
14,438
14,438
0
0
1
0
0
0
Credit cards
9,466
9,000
462
4
7
5
34
0
Commodity trade finance
3,262
3,262
0
0
4
4
0
0
Financial intermediaries and hedge funds
12,153
11,784
369
0
15
12
120
0
Other off-balance sheet commitments
8,806
8,507
296
4
15
6
30
0
Total
2
106,840
100,527
6,006
307
18
12
100
486
1 Includes Loans and advances to customers of USD
398,611
2,539
2 Excludes Forward starting reverse repurchase and securities borrowing agreements.
321
Note 9 Financial assets at amortized cost and other positions in scope of expected credit loss measurement (continued)
Coverage ratios for core loan portfolio
31.12.20
Gross carrying amount (USD million)
ECL coverage (bps)
On-balance sheet
Total
Stage 1
Stage 2
Stage 3
Total
Stage 1
Stage 2
Stage 3
Private clients with mortgages
148,341
138,803
8,540
998
11
2
108
390
Real estate financing
43,492
37,583
5,883
27
15
4
75
1,414
Large corporate clients
15,440
12,684
2,069
686
181
21
192
3,089
SME clients
15,183
12,010
2,277
896
204
16
101
2,991
Lombard
133,886
133,800
0
86
3
0
0
3,592
Credit cards
1,596
1,209
342
46
240
91
333
3,488
Commodity trade finance
3,375
3,219
43
113
315
16
2
8,939
Other loans and advances to customers
19,274
17,781
1,402
91
31
14
25
3,563
Loans to financial advisors
2,677
2,009
142
526
404
135
351
1,446
Total
1
383,266
359,099
20,697
3,470
30
5
106
2,247
Gross exposure (USD million)
ECL coverage (bps)
Off-balance sheet
Total
Stage 1
Stage 2
Stage 3
Total
Stage 1
Stage 2
Stage 3
Private clients with mortgages
6,285
6,083
198
3
7
6
16
197
Real estate financing
7,056
6,576
481
0
21
9
185
0
Large corporate clients
32,828
25,026
7,598
205
46
27
92
565
SME clients
9,121
7,239
1,734
148
40
19
63
779
Lombard
14,178
14,170
0
8
2
1
0
1,941
Credit cards
8,661
8,220
430
11
9
8
44
0
Commodity trade finance
1,683
1,658
25
0
10
8
15
8,279
Financial intermediaries and hedge funds
7,690
7,242
448
0
26
13
248
166
Other off-balance sheet commitments
14,366
13,876
482
8
13
7
11
12,414
Total
2
101,869
90,090
11,396
382
25
13
91
894
1 Includes Loans and advances to customers of USD
380,589
2,677
2 Excludes Forward starting reverse repurchase and securities borrowing agreements.
Consolidated financial statements | UBS Group AG consolidated financial statements
322
Note 10 Derivative instruments
Overview
Over-the-counter (OTC) derivative contracts are usually traded
under a standardized International Swaps and Derivatives
Association (ISDA) master agreement between UBS and its
counterparties. Terms are negotiated directly with counterparties
and the contracts have industry-standard settlement mechanisms
prescribed by ISDA. Other OTC derivatives are cleared through
clearing houses, in particular interest rate swaps with LCH, where
a settled-to-market method has been generally adopted , under
which cash collateral exchanged on a daily basis is considered to
legally settle the market value of the derivatives. Regulators in
various jurisdictions have begun a phased introduction of rules
requiring the payment and collection of initial and
variation
margins on certain OTC derivative contracts, which may have a
bearing on price and other relevant terms. Due to challenges
brought on by COVID
-
19
,
the International Organization of
Securities Commissions (IOSCO) has extended the deadline for
completion of the final phase-in of margin requirements for non-
centrally cleared derivatives, to 1 September 2022.
Other derivative contracts are standardized in terms of their
amounts and settlement dates, and are bought and sold on
regulated exchanges. These are commonly referred to as
exchange-traded derivatives (ETD) contracts. Exchanges offer the
benefits of pricing transparency, standardized daily settlement of
changes in value and, consequently, reduced credit risk.
Most of the Group’s derivative transactions relate to sales and
market-making activity. Sales activities include the structuring and
marketing of derivative products to customers to enable them to
take, transfer, modify or reduce current or expected risks. Market-
making aims to directly support the facilitation and execution of
client activity, and involves quoting bid and offer prices to other
market participants with the aim of generating revenues based on
spread and volume.
The
Group
also uses various derivative
instruments for hedging purposes.
›
Refer to Notes 16 and 21 for more information about derivative
instruments
›
Refer to Note 26 for more information about derivatives
designated in hedge accounting relationships
Risks of derivative instruments
The derivative financial assets shown on the balance sheet can be
an important component of the Group’s credit exposure;
however, the positive replacement values related to a respective
counterparty are rarely an adequate reflection of the Group’s
credit exposure in its derivatives business with that counterparty.
This is generally the case because, on the one hand, replacement
values can increase over time (potential future exposure), while,
on the other hand, exposure may be mitigated by entering into
master netting agreements and bilateral collateral arrangements.
Both the exposure measures used internally by the Group to
control credit risk and the capital requirements imposed by
regulators reflect these additional factors.
›
Refer to Note 22 for more information about derivative financial
assets and liabilities after consideration of netting potential
allowed under enforceable netting arrangements
›
Refer to the “Risk management and control” section of this
report for more information about the risks arising from
derivative instruments
323
Note 10 Derivative instruments (continued)
Derivative instruments
31.12.21
31.12.20
USD billion
Derivative
financial
assets
Notional
amounts
related to
derivative
financial
assets
2,3
Derivative
financial
liabilities
Notional
amounts
related to
derivative
financial
liabilities
2,3
Other
notional
amounts
2,4
Derivative
financial
assets
Notional
amounts
related to
derivative
financial
assets
2,3
Derivative
financial
liabilities
Notional
amounts
related to
derivative
financial
liabilities
2,3
Other
notional
amounts
2,4
Interest rate contracts
33.2
991.2
28.7
943.1
8,675.1
50.9
928.0
43.9
880.4
11,291.5
of which: forward contracts (OTC)
1
0.1
29.4
0.2
28.6
443.6
0.0
19.8
0.4
21.9
2,602.5
of which: swaps (OTC)
26.4
394.3
19.2
344.1
7,549.4
40.8
407.0
30.9
364.8
8,105.2
of which: options (OTC)
6.6
545.2
9.2
553.6
10.1
447.5
12.5
460.5
of which: futures (ETD)
525.0
480.6
of which: options (ETD)
0.0
22.4
0.0
16.8
157.1
0.0
53.6
0.0
33.1
103.3
Credit derivative contracts
1.4
44.7
1.8
46.3
2.4
57.6
2.9
64.8
of which: credit default swaps (OTC)
1.3
39.4
1.6
44.1
2.2
53.6
2.6
62.3
of which: total return swaps (OTC)
0.1
1.3
0.2
1.7
0.1
1.9
0.3
2.5
Foreign exchange contracts
53.3
3,030.8
54.1
2,938.8
1.2
68.7
2,951.1
70.5
2,820.4
1.4
of which: forward contracts (OTC)
23.8
1,008.9
23.8
1,043.2
27.3
779.1
29.0
853.3
of which: swaps (OTC)
24.3
1,606.3
24.9
1,480.3
34.3
1,727.3
34.4
1,567.3
of which: options (OTC)
5.2
412.6
5.3
408.6
7.1
440.9
7.1
394.7
Equity contracts
28.2
456.9
34.9
603.9
80.1
34.8
449.6
41.2
581.3
91.3
of which: swaps (OTC)
4.7
105.7
9.3
154.8
6.4
89.4
9.8
108.4
of which: options (OTC)
4.6
61.4
6.5
102.3
7.0
87.1
10.9
146.2
of which: futures (ETD)
71.2
67.9
of which: options (ETD)
10.2
289.6
9.8
346.3
8.8
10.7
273.1
11.3
326.8
23.5
of which: client-cleared transactions (ETD)
8.6
9.4
10.7
9.1
Commodity contracts
1.6
57.8
1.6
56.4
14.7
2.2
57.8
2.0
49.7
10.1
of which: swaps (OTC)
0.5
19.9
0.8
25.4
0.5
17.7
0.8
18.0
of which: options (OTC)
0.4
14.0
0.2
10.4
1.0
23.5
0.7
17.8
of which: futures (ETD)
13.9
9.3
of which: forward contracts (ETD)
18.1
15.2
8.0
6.3
of which: client-cleared transactions (ETD)
0.6
0.4
0.5
0.3
Loan commitments
measured at FVTPL (OTC)
0.8
0.0
8.2
0.0
10.2
Unsettled purchases of non-derivative
financial instruments
5
0.1
13.3
0.2
10.6
0.3
18.3
0.2
10.0
Unsettled sales of non-derivative financial
instruments
5
0.2
18.2
0.1
9.4
0.2
17.2
0.3
12.9
Total derivative instruments,
based on IFRS netting
6
118.1
4,613.8
121.3
4,616.6
8,771.1
159.6
4,479.5
161.1
4,429.7
11,394.4
1 Includes certain forward starting repurchase and reverse repurchase agreements that are classified as measured at fair value through profit or loss and are recognized within derivative instruments. 2 In cases where
derivative financial instruments are presented on a net basis on the balance sheet, the respective notional amounts of the netted derivative financial instruments are still presented on a gross basis. 3 Notional
amounts of client-cleared ETD and OTC transactions through central clearing counterparties are not disclosed, as they have significantly different risk profile. 4 Other notional amounts relate to derivatives that are
cleared through either a central counterparty or an exchange. The fair value of these derivatives is presented on the balance sheet net of the corresponding cash margin under Cash collateral receivables on derivative
instruments and Cash collateral payables on derivative instruments and was not material for all periods presented. 5 Changes in the fair value of purchased and sold non-derivative financial instruments between
trade date and settlement date are recognized as derivative financial instruments. 6 Derivative financial assets and liabilities are presented net on the balance sheet if UBS has the unconditional and legally enforceable
right to offset the recognized amounts, both in the normal course of business and in the event of default, bankruptcy or insolvency of the entity and all of the counterparties, and intends either to settle on a net basis
or to realize the asset and settle the liability simultaneously. Refer to Note 22 for more information on netting arrangements.
On a notional amount basis, approximately
40
% of OTC interest
rate contracts held as of
50
%) mature within one year,
36
% (31 December 2020:
30
%)
within one to five years and
25
% (31 December 2020:
20
%) after
five years.
Notional amounts of interest rate contracts cleared through
either a central counterparty or an exchange that are legally
settled on a daily basis are presented under
Other notional
amounts
buckets on the basis of
contractual maturities of the cleared
underlying derivative contracts. Other notional amounts related
to interest rate contracts decreased by USD
2.6
with 31 December 2020, mainly reflecting trade compressions,
which included activity as part of the ongoing transition to
alternative reference rates, and maturities.
Consolidated financial statements | UBS Group AG consolidated financial statements
324
Note 11 Financial assets measured at fair value through other comprehensive income
USD million
31.12.21
31.12.20
Financial assets measured at fair value through other comprehensive income
1
Debt instruments
Governments and government agencies
8,522
8,155
of which: USA
7,507
7,727
Banks
322
103
Total financial assets measured at fair value through other comprehensive income
8,844
8,258
Unrealized gains / (losses) recognized in Other comprehensive income
Unrealized gains, before tax
67
204
Unrealized (losses), before tax
(80)
(4)
Net unrealized gains / (losses), before tax
(13)
200
Net unrealized gains / (losses), after tax
(7)
151
1 Refer to Note 21c for more information about product type and fair value hierarchy categorization. Refer also to Note 9 and Note 20 for more information about expected credit loss measurement.
Note 12 Property, equipment and software
At historical cost less accumulated depreciation
USD million
Owned
properties and
equipment
1
Leased
properties and
equipment
2
Software
Projects in
progress
2021
2020
Historical cost
Balance at the beginning of the year
13,185
4,249
7,768
1,036
26,238
24,431
Additions
273
213
228
1,376
2,090
2,312
Disposals / write-offs
3
(430)
(223)
(98)
0
(751)
(990)
Reclassifications
4
323
0
808
(1,149)
(18)
(590)
Foreign currency translation
(303)
(66)
(64)
(12)
(445)
1,074
Balance at the end of the year
13,048
4,174
8,642
1,250
27,113
26,238
Accumulated depreciation
Balance at the beginning of the year
8,060
1,082
3,987
0
13,129
11,628
Depreciation
635
498
945
0
2,078
1,997
Impairment
5
9
1
0
0
10
72
Disposals / write-offs
3
(424)
(215)
(98)
0
(737)
(855)
Reclassifications
4
(12)
0
0
0
(12)
(328)
Foreign currency translation
(196)
(20)
(28)
0
(243)
616
Balance at the end of the year
8,072
1,346
4,807
0
14,225
13,129
Net book value
Net book value at the beginning of the year
5,126
3,167
3,780
1,036
13,109
12,804
Net book value at the end of the year
4,976
2,828
3,835
1,250
6
12,888
13,109
1 Includes leasehold improvements and IT hardware. 2 Represents right-of-use assets recognized by UBS as lessee. UBS predominantly enters into lease contracts, or contracts that include lease components, in
relation to real estate, including offices, retail branches and sales offices. The total cash outflow for leases during 2021 was USD
657
679
within Interest expense from financial instruments measured at amortized cost and Lease liabilities are included within Other financial liabilities measured at amortized cost. Refer to Notes 3 and 19a, respectively.
There were no material gains or losses arising from sale-and-leaseback transactions in 2021 (2020: USD
140
respective periods represents net reclassifications to Properties and other non-current assets held for sale. 5 Impairment charges recorded in 2021 generally relate to assets that are no longer used, for which the
recoverable amount based on a value in use approach was determined to be zero. 6 Consists of USD
1,087
163
325
Note 13 Goodwill and intangible assets
Introduction
UBS performs an impairment test on its goodwill assets on an
annual basis or when indicators of impairment exist.
UBS considers Asset Management, as it is reported in Note 2a,
as a separate cash-generating unit (a CGU), as that is the level at
which the performance of investment (and the related goodwill)
is reviewed and assessed by management. Given that a significant
amount of goodwill in Global Wealth Management relates to the
PaineWebber acquisition in 2000, which mainly affected the
Americas portion of the business, this goodwill remains separately
monitored by the Americas, despite the formation of Global
Wealth Management in 2018. Therefore, goodwill for Global
Wealth Management is separately considered for impairment at
the level of two CGUs: Americas; and Switzerland and
International (consisting of EMEA, Asia Pacific and Global).
The impairment test is performed for each CGU to which
goodwill is allocated by comparing the recoverable amount, based
on its value in use, with the carrying amount of the respective
CGU. An impairment charge is recognized if the carrying amount
exceeds the recoverable amount.
As of 31 December 2021, total goodwill recognized on the
balance sheet was USD
6.1
3.7
carried by the Global Wealth Management Americas CGU,
USD
1.2
Switzerland and International
CGU
,
and USD
1.2
billion was
carried by Asset Management. Based on the impairment testing
methodology described below, UBS concluded that the goodwill
balances as of 31 December 2021 allocated to these CGUs are
not impaired.
Methodology for goodwill impairment testing
The recoverable amounts are determined using a discounted cash
flow model, which has been adapted to use inputs that consider
features of the banking business and its regulatory environment.
The recoverable amount of a CGU is the sum of the discounted
earnings attributable to shareholders from the first three forecast
years and the terminal value, adjusted for the effect of the capital
assumed to be needed over the next three years and to support
growth beyond that period. The terminal value, which covers all
periods beyond the third year, is calculated on the basis of the
forecast of third -year profit, the discount rate and the long-term
growth rate, as well as the implied perpetual capital growth.
The carrying amount for each CGU is determined by reference
to the Group’s equity attribution framework. Within this
framework, which is described in the “Capital, liquidity and
funding, and balance sheet” section of this report, UBS attributes
equity to the businesses on the basis of their risk-weighted assets
and leverage ratio denominator (both metrics include resource
allocations from Group Functions to the business divisions), their
goodwill and their intangible assets, as well as attributed equity
related to certain
CET1
deduction items. The framework is
primarily used for the purpose of measuring the performance of
the businesses and includes certain management assumptions.
Attributed equity is equal to the capital a CGU requires to conduct
its business and is currently considered a reasonable
approximation of the carrying amount of the CGUs. The
attributed equity methodology is also applied in the business
planning process, the inputs from which are used in calculating
the recoverable amounts of the respective CGU.
›
Refer to the “Capital, liquidity and funding, and balance sheet”
section of this report for more information about the equity
attribution framework
Assumptions
Valuation parameters used within the Group’s impairment test
model are linked to external market
information, where
applicable. The model used to determine the recoverable amount
is most sensitive to changes in the forecast earnings available to
shareholders in years one to three, to changes in the discount
rates and to changes in the long-term growth rate. The applied
long-term growth rate is based on long-term economic growth
rates for different regions worldwide. Earnings available to
shareholders are estimated on the basis of forecast results, which
are part of the business plan approved by the Board of Directors.
The discount rates are determined by applying a capital asset
pricing model-based approach, as well as considering quantitative
and qualitative inputs from both internal and external analysts
and the view of management.
T
hey
also
take int
o account
regional differences in risk-free rates at the level of the individual
CGUs. In line with discount rates, long-term growth rates are
determined at the regional level based on nominal or real GDP
growth rate forecasts.
Consolidated financial statements | UBS Group AG consolidated financial statements
326
Note 13 Goodwill and intangible assets (continued)
Key assumptions used to determine the recoverable amounts
of eac h CGU are tested for sensitivity by applying a reasonably
possible change to those assumptions. Forecast earnings
available to shareholders were changed by
20
%, the discount
rates were changed by
1.5
growth rates were changed by
0.75
scenarios, reasonably possible changes in key assumptions did
not result in an impairment of goodwill or intangible assets
reported by Global Wealth Management Americas, Global
Wealth Management Switzerland and International, and Asset
Management.
If the estimated earnings and other assumptions in future
periods deviate from the current outlook, the value of goodwill
attributable to Global Wealth Management Americas, Global
Wealth Management Switzerland and International, and Asset
Management may become impaired in the future, giving rise to
losses in the income statement. Recognition of any impairment of
goodwill would reduce IFRS equity and net profit. It would not
affect cash flows and, as goodwill is required to be deducted from
capital under the Basel III capital framework, no effect would be
expected on the Group’s capital ratios.
Discount and growth rates
Discount rates
Growth rates
In %
31.12.21
31.12.20
31.12.21
31.12.20
Global Wealth Management Americas
9.5
9.5
4.0
5.1
Global Wealth Management Switzerland and International
8.5
8.5
3.1
3.7
Asset Management
8.5
8.5
2.9
3.5
USD million
Goodwill
Intangible
assets
1
2021
2020
Historical cost
Balance at the beginning of the year
6,182
1,683
7,865
7,820
Additions
1
1
147
Disposals
(3)
(3)
(158)
Write-offs
(41)
(41)
(35)
Foreign currency translation
(53)
(30)
(83)
91
Balance at the end of the year
6,126
1,612
7,739
7,865
Accumulated amortization and impairment
Balance at the beginning of the year
1,385
1,385
1,351
Amortization
31
31
55
Impairment / (reversal of impairment)
2
(1)
(1)
2
Disposals
0
0
Write-offs
(41)
(41)
(35)
Foreign currency translation
(13)
(13)
11
Balance at the end of the year
1,360
1,360
1,385
Net book value at the end of the year
6,126
252
6,378
6,480
of which: Global Wealth Management Americas
3,720
41
3,760
3,770
of which: Global Wealth Management Switzerland and International
1,204
72
1,276
1,320
of which: Asset Management
1,202
1,202
1,226
of which: Investment Bank
139
139
161
of which: Group Functions
0
4
1 Intangible assets mainly include customer relationships, contractual rights and the fully amortized branch network intangible asset recognized in connection with the acquisition of PaineWebber Group, Inc.
2 Impairment charges recorded in 2020 relate to assets for which the recoverable amount was determined considering their value in use (recoverable amount of the impaired intangible assets: USD
5
2020).
The table below presents estimated aggregated amortization expenses for intangible assets.
USD million
Intangible assets
Estimated aggregated amortization expenses for:
2022
29
2023
27
2024
23
2025
23
2026
23
Thereafter
126
Not amortized due to indefinite useful life
2
Total
252
327
Note 14 Other assets
a) Other financial assets measured at amortized cost
USD million
31.12.21
31.12.20
Debt securities
18,858
18,801
of which: government bills / bonds
9,833
9,789
Loans to financial advisors
2,453
2,569
Fee- and commission-related receivables
1,972
2,014
Finance lease receivables
1,356
1,447
Settlement and clearing accounts
455
614
Accrued interest income
520
591
Other
594
1,158
Total other financial assets measured at amortized cost
26,209
27,194
b) Other non-financial assets
USD million
31.12.21
31.12.20
Precious metals and other physical commodities
5,258
6,264
Deposits and collateral provided in connection with litigation, regulatory and similar matters
1
1,526
1,418
Prepaid expenses
1,108
1,081
VAT and other tax receivables
638
433
Properties and other non-current assets held for sale
32
246
Assets of disposal groups held for sale
2
1,093
Other
621
326
Total other non-financial assets
10,277
9,768
1 Refer to Note 18 for more information. 2 Refer to Note 30 for more information.
Note 15 Amounts due to banks and customer deposits
USD million
31.12.21
31.12.20
Amounts due to banks
Customer deposits
542,007
524,605
of which: demand deposits
246,417
236,447
of which: retail savings / deposits
247,224
220,898
of which: time deposits
1
48,365
67,260
Total amounts due to banks and customer deposits
555,108
535,655
1 Includes customer deposits in UBS AG Jersey Branch placed by UBS Switzerland AG on behalf of its clients.
Consolidated financial statements | UBS Group AG consolidated financial statements
328
Note 16 Debt issued designated at fair value
USD million
31.12.21
31.12.20
Issued debt instruments
Equity-linked
1
47,059
41,069
Rates-linked
16,369
11,038
Credit-linked
1,723
1,933
Fixed-rate
2,868
3,604
Commodity-linked
2,911
1,497
Other
2,868
2,101
of which: debt that contributes to total loss-absorbing capacity
2,136
1,190
Total debt issued designated at fair value
73,799
61,243
of which: issued by UBS AG with original maturity greater than one year
2
57,967
46,427
of which: life-to-date own credit (gain) / loss
347
418
1 Includes investment fund unit-linked instruments issued. 2 Based on original contractual maturity without considering any early redemption features. As of 31 December 2021,
100
% of the balance was unsecured
(31 December 2020:
100
%).
As of 31 December 2021 and 31 December 2020, the contractual
redemption amount at maturity of debt issued designated at fair
value through profit or loss was not materially different from the
carrying amount.
The table below shows the residual contractual maturity of the
carrying amount of debt issued designated at fair value, split
between fixed-rate and floating-rate instruments based on the
contractual terms, and does not consider any early redemption
features. Interest rate ranges for future interest payments related
to debt issued designated at fair value have not been included in
the table below, as the majority of the debt instruments issued are
structured products and therefore the future interest payments
are highly dependent upon the embedded derivative and
prevailing market conditions at the point in time that each interest
payment is made.
›
Refer to Note 24 for maturity information on an undiscounted
cash flow basis
Contractual maturity of carrying amount
USD million
2022
2023
2024
2025
2026
2027–2031
Thereafter
Total
31.12.21
Total
31.12.20
UBS Group AG
1
Non-subordinated debt
Fixed-rate
0
0
0
0
0
0
2,340
2,340
1,375
UBS AG
2
Non-subordinated debt
Fixed-rate
4,296
1,658
716
495
226
273
1,732
9,397
9,409
Floating-rate
19,338
15,621
5,067
5,816
3,840
8,364
3,238
61,284
49,528
Subtotal
23,635
17,279
5,783
6,311
4,066
8,637
4,971
70,682
58,937
Other subsidiaries
3
Non-subordinated debt
Fixed-rate
6
0
0
0
0
423
0
429
539
Floating-rate
150
47
145
0
0
0
7
349
392
Subtotal
156
47
145
0
0
423
7
778
931
Total
23,791
17,325
5,929
6,311
4,066
9,060
7,317
73,799
61,243
1 Consists of instruments issued by the legal entity UBS Group AG. 2 Consists of instruments issued by the legal entity UBS AG. 3 Consists of instruments issued by subsidiaries of UBS AG.
329
Note 17 Debt issued measured at amortized cost
USD million
31.12.21
31.12.20
Certificates of deposit and commercial paper
40,640
41,151
Other short-term debt
2,458
5,515
Short-term debt
1
43,098
46,666
Senior unsecured debt that contributes to total loss-absorbing capacity (TLAC)
38,984
36,611
Senior unsecured debt other than TLAC
27,590
21,340
of which: issued by UBS AG with original maturity greater than one year
2
23,307
18,464
Covered bonds
1,389
2,796
Subordinated debt
18,640
22,157
of which: high-trigger loss-absorbing additional tier 1 capital instruments
11,052
11,837
of which: low-trigger loss-absorbing additional tier 1 capital instruments
2,425
2,577
of which: low-trigger loss-absorbing tier 2 capital instruments
2,596
7,201
of which: non-Basel III-compliant tier 2 capital instruments
547
543
Debt issued through the Swiss central mortgage institutions
9,454
9,660
Other long-term debt
0
3
Long-term debt
3
96,057
92,566
Total debt issued measured at amortized cost
4
139,155
139,232
1 Debt with an original contractual maturity of less than one year. 2 Based on original contractual maturity without considering any early redemption features. As of 31 December 2021,
100
% of the balance was
unsecured (31 December 2020:
100
%). 3 Debt with an original contractual maturity greater than or equal to one year. The classification of debt issued into short-term and long-term does not consider any early
redemption features. 4 Net of bifurcated embedded derivatives, the fair value of which was not material for the periods presented.
The Group uses interest rate and foreign exchange derivatives to
manage the risks inherent in certain debt instruments held at
amortized cost. In
some
cases, the Group applies hedge
accounting for interest rate risk as discussed in item 2j in Note 1a
and Note 26. As a result of applying hedge accounting, the life-
to-date adjustment to the carrying amount of debt issued was an
increase of USD
478
increase of USD
2,401
changes in fair value due to interest rate movements.
Subordinated debt consists of unsecured debt obligations that
are contractually subordinated in right of payment to all other
present and future non-subordinated obligations of the respective
issuing entity.
All of the subordinated debt instruments
outstanding as of 31 December 2021 pay a fixed rate of interest.
The table below shows the residual contractual maturity of the
carrying amount of debt issued, split between fixed-rate and
floating-rate based on the contractual terms, and does not
consider any early redemption features. The effects from interest
rate swaps, which are used to hedge various fixed-rate debt
issuances by changing the repricing characteristics into those
similar to floating-rate debt, are also not considered in the table
below.
›
Refer to Note 24 for maturity information on an undiscounted
cash flow basis
Contractual maturity of carrying amount
USD million
2022
2023
2024
2025
2026
2027–2031
Thereafter
Total
31.12.21
Total
31.12.20
UBS Group AG
1
Non-subordinated debt
Fixed-rate
3,769
4,027
5,145
5,052
6,748
12,534
3,294
40,569
33,578
Floating-rate
492
2,183
0
0
0
0
0
2,676
5,890
Subordinated debt
Fixed-rate
0
0
0
0
0
0
13,477
13,477
14,413
Subtotal
4,261
6,211
5,145
5,052
6,748
12,534
16,771
56,722
53,881
UBS AG
2
Non-subordinated debt
Fixed-rate
38,647
5,578
1,964
349
3,439
1,381
1,213
52,571
52,618
Floating-rate
9,807
2,093
1,922
907
508
0
0
15,238
15,299
Subordinated debt
Fixed-rate
2,020
0
2,596
337
210
0
0
5,163
7,744
Subtotal
50,474
7,671
6,482
1,594
4,158
1,381
1,213
72,972
75,661
Other subsidiaries
3
Non-subordinated debt
Fixed-rate
907
1,007
1,072
1,173
1,045
3,674
582
9,460
9,690
Subtotal
907
1,007
1,072
1,173
1,045
3,674
582
9,460
9,690
Total
55,642
14,889
12,698
7,818
11,951
17,590
18,566
139,155
139,232
1 Consists of debt issued by the legal entity UBS Group AG. 2 Consists of debt issued by the legal entity UBS AG. 3 Consists of debt issued by subsidiaries of UBS AG.
Consolidated financial statements | UBS Group AG consolidated financial statements
330
Note 18 Provisions and contingent liabilities
a) Provisions
The table below presents an overview of total provisions.
USD million
31.12.21
31.12.20
Provisions other than provisions for expected credit losses
3,322
2,571
Provisions for expected credit losses
196
257
Total provisions
3,518
2,828
The following table presents additional information for provisions other than provisions for expected credit losses.
USD million
Litigation,
regulatory and
similar matters
1
Restructuring
Other
3
Total 2021
Balance at the beginning of the year
2,135
72
363
2,571
Increase in provisions recognized in the income statement
986
297
78
1,361
Release of provisions recognized in the income statement
(74)
(30)
(32)
(136)
Provisions used in conformity with designated purpose
(189)
(165)
(80)
(434)
Capitalized reinstatement costs
0
0
32
32
Foreign currency translation / unwind of discount
(59)
(3)
(10)
(72)
Balance at the end of the year
2,798
172
2
352
3,322
1 Consists of provisions for losses resulting from legal, liability and compliance risks. 2 Primarily consists of personnel-related restructuring provisions of USD
125
USD
18
47
49
operational risks.
Restructuring
provisions primarily relate to
personnel
-
related
provisions and onerous contracts. Personnel-related restructuring
provisions are used within a short period of time but potential
changes in amount may be triggered when natural staff attrition
reduces the number of people affected by a restructuring event
and therefore the estimated costs. Onerous contracts for property
are recognized when UBS is committed to pay for non-lease
components, such as utilities, service charges, taxes and
maintenance, when a property is vacated or not fully recovered
from sub-tenants.
Information about provisions and contingent liabilities in
respect of litigation, regulatory and similar matters, as a class, is
included in Note 18b. There are no material contingent liabilities
associated with the other classes of provisions.
b) Litigation, regulatory and similar matters
The Group operates in a legal and regulatory environment that
exposes it to significant litigation and similar risks arising from
disputes and regulatory proceedings. As a result, UBS (which for
purposes of this Note may refer to UBS Group AG and/or one or
more of its subsidiaries, as applicable) is involved in various
disputes and legal proceedings, including litigation, arbitration,
and regulatory and criminal investigations.
Such matters are subject to many uncertainties, and the
outcome and the timing of resolution are often difficult to predict,
particularly in the earlier stages of a case. There are also situations
where the Group may enter into a settlement agreement. This
may occur in order to avoid the expense, management distraction
or reputational implications of continuing to contest liability, even
for those matters for which the Group believes it should be
exonerated. The uncertainties inherent in all such matters affect
the amount and timing of any potential outflows for both matters
with respect to which provisions have been established and other
contingent liabilities. The Group makes provisions for such
matters brought against it when, in the opinion of management
after seeking legal advice, it is more likely than not that the Group
has a present legal or constructive obligation as a result of past
events, it is probable that an outflow of resources will be required,
and the amount can be reliably estimated. Where these factors
are otherwise satisfied, a provision may be established for claims
that have not yet been asserted against the Group, but are
nevertheless expected to be, based on the Group’s experience
with similar asserted claims. If any of those conditions is not met,
such matters result in contingent liabilities. If the amount of an
obligation cannot be reliably estimated, a liability exists that is not
recognized even if an outflow of resources is probable.
Accordingly, no provision is established even if the potential
outflow of resources with respect to such matters could be
significant. Developments relating to a matter that occur after the
relevant reporting period, but prior to the issuance of financial
statements, which affect management’s assessment of the
provision for such matter (because, for example, the
developments provide evidence of conditions that existed at the
end of the reporting period), are adjusting events after the
reporting period under IAS 10 and must be recognized in the
financial statements for the reporting period.
331
Note 18 Provisions and contingent liabilities (continued)
Specific litigation, regulatory and other matters are described
below, including all such matters that management considers to
be material and others that management believes to be of
significance due to potential financial, reputational and other
effects. The amount of damages claimed, the size of a transaction
or other information is provided where available and appropriate
in order to assist users in considering the magnitude of potential
exposures.
In the case of certain matters below, we state that we have
established a provision, and for the other matters, we make no
such statement. When we make this statement and we expect
disclosure of the amount of a provision to prejudice seriously our
position with other parties in the matter because it would reveal
what UBS believes to be the probable and reliably estimable
outflow, we do not disclose that amount. In some cases we are
subject to confidentiality obligations that preclude such
disclosure. With respect to the matters for which we do not state
whether we have established a provision, either: (a) we have not
established a provision, in which case the matter is treated as a
contingent liability under the applicable accounting standard; or
(b) we have established a provision but expect disclosure of that
fact to prejudice seriously our position with other parties in the
matter because it would reveal the fact that UBS believes an
outflow of resources to be probable and reliably estimable.
With respect to certain litigation, regulatory and similar matters
for which we have established provisions, we are able to estimate
the expected timing of outflows. However, the aggregate amount
of the expected outflows for those matters for which we are able
to estimate expected timing is immaterial relative to our current
and expected levels of liquidity over the relevant time periods.
The aggregate amount provisioned for litigation, regulatory
and similar matters as a class is disclosed in the “Provisions” table
in Note 18a above. It is not practicable to provide an aggregate
estimate of liability for our litigation, regulatory and similar
matters as a class of contingent liabilities. Doing so would require
UBS to provide speculative legal assessments as to claims and
proceedings that involve unique fact patterns or novel legal
theories, that have not yet been initiated or are at early stages of
adjudication, or as to which alleged damages have not been
quantified by the claimants. Although UBS therefore cannot
provide a numerical estimate of the future losses that could arise
from litigation, regulatory and similar matters, UBS believes that
the aggregate amount of possible future losses from this class that
are more than remote substantially exceeds the level of current
provisions.
Litigation, regulatory and similar matters may also result in
non-monetary penalties and consequences. A guilty plea to, or
conviction of, a crime could have material consequences for UBS.
Resolution of regulatory proceedings may require UBS to obtain
waivers of regulatory disqualifications to maintain certain
operations, may entitle regulatory authorities to limit, suspend or
terminate licenses and regulatory authorizations, and may permit
financial market utilities to limit, suspend or terminate UBS’s
participation in such utilities. Failure to obtain such waivers, or any
limitation, suspension or termination of licenses, authorizations or
participations, could have material consequences for UBS.
The risk of loss associated with litigation, regulatory and similar
matters is a component of operational risk for purposes of
determining capital requirements. Information concerning our
capital requirements and the calculation of operational risk for this
purpose is included in the “Capital, liquidity and funding, and
balance sheet” section of this report.
Provisions for litigation, regulatory and similar matters by business division and in Group Functions
1
USD million
Global
Wealth
Manage-
ment
Personal &
Corporate
Banking
Manage-
ment
Investment
Bank
Group
Functions
Total 2021
Balance at the beginning of the year
861
115
0
227
932
2,135
Increase in provisions recognized in the income statement
754
84
9
107
32
986
Release of provisions recognized in the income statement
(60)
(11)
0
(4)
0
(74)
Provisions used in conformity with designated purpose
(175)
(1)
(1)
(10)
(2)
(189)
Foreign currency translation / unwind of discount
(42)
(6)
0
(11)
0
(59)
Balance at the end of the year
1,338
181
8
310
962
2,798
1 Provisions, if any, for the matters described in items 3 and 4 of this Note are recorded in Global Wealth Management, and provisions, if any, for the matters described in item 2 are recorded in Group Functions.
Provisions, if any, for the matters described in items 1 and 6 of this Note are allocated between Global Wealth Management and Personal & Corporate Banking, and provisions, if any, for the matters described in item
5 are allocated between the Investment Bank and Group Functions.
Consolidated financial statements | UBS Group AG consolidated financial statements
332
Note 18 Provisions and contingent liabilities (continued)
1. Inquiries regarding cross-border wealth management
businesses
Tax and regulatory authorities in a number of countries have
made inquiries, served requests for information or examined
employees located in their respective jurisdictions relating to the
cross-border wealth management services provided by UBS and
other financial institutions. It is possible that the implementation
of automatic tax information exchange and other measures
relating to cross-border provision of financial services could give
rise to further inquiries in the future. UBS has received disclosure
orders from the Swiss Federal Tax Administration (FTA) to transfer
information based on requests for international administrative
assistance in tax matters. The requests concern a number of UBS
account numbers pertaining to current and former clients and are
based on data from 2006 and 2008. UBS has taken steps to
inform affected clients about the administrative assistance
proceedings and their procedural rights, including the right to
appeal. The requests are based on data received from the German
authorities, who seized certain data related to UBS clients booked
in Switzerland during their investigations and have apparently
shared this data with other European countries. UBS expects
additional countries to file similar requests.
Since 2013, UBS (France) S.A., UBS AG and certain former
employees have been under investigation in France for alleged
complicity in unlawful solicitation of clients on French territory,
regarding the laundering of proceeds of tax fraud, and banking
and financial solicitation by unauthorized persons. In connection
with this investigation, the investigating judges ordered UBS AG
to provide bail (“
caution
”) of EUR
1.1
to post bail of EUR
40
EUR
10
On 20 February 2019, the court of first instance returned a
verdict finding UBS AG guilty of unlawful solicitation of clients on
French territory and aggravated laundering of the proceeds of tax
fraud, and UBS (France) S.A. guilty of aiding and abetting
unlawful solicitation and of laundering the proceeds of tax fraud.
The court imposed fines aggregating EUR
3.7
and UBS (France) S.A. and awarded EUR
800
damages to the French state. A trial in the French Court of Appeal
took place in March 2021. On 13 December 2021, the Court of
Appeal found UBS AG guilty of unlawful solicitation and
aggravated laundering of the proceeds of tax fraud. The court
ordered a fine of EUR
3.75
EUR
1
EUR
800
the aiding and abetting of unlawful solicitation and ordered it to
pay a fine of EUR
1.875
the French Supreme Court to preserve its rights. The appeal
enables UBS AG to thoroughly assess the verdict of the Court of
Appeal and to determine next steps in the best interest of its
stakeholders. The fine and confiscation imposed by the Court of
Appeal are suspended during the appeal. The civil damages award
has been paid to the French state (EUR
99
deducted from the bail), subject to the result of UBS’s appeal.
Our balance sheet at 31 December 2021 reflected provisions
with respect to this matter in an amount of EUR
1.1
(USD
1.252
possible outcomes in this case contributes to a high degree of
estimation uncertainty and the provision reflects our best estimate
of possible financial implications, although actual penalties and
civil damages could exceed (or may be less than) the provision
amount.
In 2016, UBS was notified by the Belgian investigating judge
that it was under formal investigation (“
inculpé
”) regarding the
allegations of laundering of proceeds of tax fraud, banking and
financial solicitation by unauthorized persons, and serious tax
fraud. In November 2021, the Council Chamber approved a
settlement with the Brussels Prosecution Office for EUR
49
without recognition of guilt with regard to the allegations of
banking and financial solicitation by unauthorized persons and
serious tax fraud. The allegation of laundering of proceeds of tax
fraud was dismissed.
Our balance sheet at 31 December 2021 reflected provisions
with respect to matters described in this item 1 in an amount that
UBS believes to be appropriate under the applicable accounting
standard. As in the case of other matters for which we have
established provisions, the future outflow of resources in respect
of such matters cannot be determined with certainty based on
currently available information and accordingly may ultimately
prove to be substantially greater (or may be less) than the
provision that we have recognized.
2. Claims related to sales of residential mortgage-backed
securities and mortgages
From 2002 through 2007, prior to the crisis in the US residential
loan market, UBS was a substantial issuer and underwriter of US
residential mortgage-backed securities (RMBS) and was a
purchaser and seller of US residential mortgages.
In November 2018, the DOJ filed a civil complaint in the District
Court for the Eastern District of New York. The complaint seeks
unspecified civil monetary penalties under the Financial
Institutions Reform, Recovery and Enforcement Act of 1989
related to UBS’s issuance, underwriting and sale of 40 RMBS
transactions in 2006 and 2007. UBS moved to dismiss the civil
complaint on 6 February 2019. On 10 December 2019, the
district court denied UBS’s motion to dismiss.
Our balance sheet at 31 December 2021 reflected a provision
with respect to matters described in this item 2 in an amount that
UBS believes to be appropriate under the applicable accounting
standard. As in the case of other matters for which we have
established provisions, the future outflow of resources in respect
of this matter cannot be determined with certainty based on
currently available information and accordingly may ultimately
prove to be substantially greater (or may be less) than the
provision that we have recognized.
333
Note 18 Provisions and contingent liabilities (continued)
3. Madoff
In relation to the Bernard L. Madoff Investment Securities LLC
(BMIS) investment fraud, UBS AG, UBS (Luxembourg) S.A. (now
UBS Europe SE, Luxembourg branch) and certain other UBS
subsidiaries have been subject to inquiries by a number of
regulators, including the Swiss Financial Market Supervisory
Authority (FINMA) and the Luxembourg Commission de
Surveillance du Secteur Financier. Those inquiries concerned two
third-party funds established under Luxembourg law, substantially
all assets of which were with BMIS, as well as certain funds
established in offshore jurisdictions with either direct or indirect
exposure to BMIS. These funds faced severe losses, and the
Luxembourg funds are
in liquidation. The documentation
establishing both funds identifies UBS entities in various roles,
including custodian, administrator, manager, distributor and
promoter, and indicates that UBS employees serve as board
members.
In 2009 and 2010, the liquidators of the two Luxembourg
funds filed claims against UBS entities, non-UBS entities and
certain individuals, including current and former UBS employees,
seeking amounts totaling approximately EUR
2.1
includes amounts that the funds may be held liable to pay the
trustee for the liquidation of BMIS (BMIS Trustee).
A large number of alleged beneficiaries have filed claims
against UBS entities (and non-UBS entities) for purported losses
relating to the Madoff fraud. The majority of these cases have
been filed in Luxembourg, where decisions that the claims in eight
test cases were inadmissible have been affirmed by the
Luxembourg Court of Appeal, and the Luxembourg Supreme
Court has dismissed a further appeal in one of the test cases.
In the US, the BMIS Trustee filed claims against UBS entities,
among others, in relation to the two Luxembourg funds and one
of the offshore funds. The total amount claimed against all
defendants in these actions was not less than USD
2
2014, the US Supreme Court rejected the BMIS Trustee’s motion
for leave to appeal decisions dismissing all claims except those for
the recovery of approximately USD
125
alleged to be fraudulent conveyances and preference payments.
In 2016, the bankruptcy court dismissed these claims against the
UBS entities. In February 2019, the Court of Appeals reversed the
dismissal of the BMIS Trustee’s remaining claims, and the US
Supreme Court subsequently denied a petition seeking review of
the Court of Appeals’ decision. The case has been remanded to
the Bankruptcy Court for further proceedings.
4. Puerto Rico
Declines since 2013 in the market prices of Puerto Rico municipal
bonds and of closed-end funds (funds) that are sole-managed and
co-managed by UBS Trust Company of Puerto Rico and
distributed by UBS Financial Services Incorporated of Puerto Rico
(UBS PR) led to multiple regulatory inquiries, which in 2014 and
2015, led to settlements with the Office of the Commissioner of
Financial Institutions for the Commonwealth of Puerto Rico, the
US Securities and Exchange Commission (SEC) and the Financial
Industry Regulatory Authority.
Since then, UBS clients in Puerto Rico who own the funds or
Puerto Rico municipal bonds and/or who used their UBS account
assets as collateral for UBS non-purpose loans filed customer
complaints and arbitration demands seeking aggregate damages
of USD
3.4
3.1
through settlements, arbitration or withdrawal of claims.
Allegations include fraud, misrepresentation and unsuitability of
the funds and of the loans.
A shareholder derivative action was filed in 2014 against
various UBS entities and current and certain former directors of
the funds, alleging hundreds of millions of US dollars in losses in
the funds. In 2021, the parties reached an agreement to settle this
matter for USD
15
In 2011, a purported derivative action was filed on behalf of
the Employee Retirement System of the Commonwealth of Puerto
Rico (System) against over 40 defendants, including UBS PR,
which was named in connection with its underwriting and
consulting services. Plaintiffs alleged that defendants violated
their purported fiduciary duties and contractual obligations in
connection with the issuance and underwriting of USD
3
of bonds by the System in 2008 and sought damages of over
USD
800
to join the action as a plaintiff. In 2017, the court denied
defendants’ motion to dismiss the complaint. In 2020, the court
denied plaintiffs’ motion for summary judgment.
Beginning in 2015, certain agencies and public corporations of
the Commonwealth of Puerto Rico (Commonwealth) defaulted
on certain interest payments on Puerto Rico bonds. In 2016, US
federal legislation created an oversight board with power to
oversee Puerto Rico’s finances and to restructure its debt. The
oversight board has imposed a stay on the exercise of certain
creditors’ rights. In 2017, the oversight board placed certain of
the bonds into a bankruptcy-like proceeding under the
supervision of a Federal District Judge.
In May 2019, the oversight board filed complaints in Puerto
Rico federal district court bringing claims against financial, legal
and accounting firms that had participated in Puerto Rico
municipal bond offerings, including UBS, seeking a return of
underwriting and swap fees paid in connection with those
offerings. UBS estimates that it received approximately USD
125
million in fees in the relevant offerings.
In August 2019, and February and November 2020, four US
insurance companies that insured issues of Puerto Rico municipal
bonds sued UBS and several other underwriters of Puerto Rico
municipal bonds in three separate cases. The actions collectively
seek recovery of an aggregate of USD
955
from the defendants. The plaintiffs in these cases claim that
defendants failed to reasonably investigate financial statements in
the offering materials for the insured Puerto Rico bonds issued
between 2002 and 2007, which plaintiffs argue they relied upon
in agreeing to insure the bonds notwithstanding that they had no
contractual relationship with the underwriters. Defendants’
motions to dismiss were granted in two of the cases; those
decisions are being appealed by the plaintiffs. In the third case,
defendants’ motion to dismiss was denied, but on appeal that
ruling was reversed and the motion to dismiss was granted.
Consolidated financial statements | UBS Group AG consolidated financial statements
334
Note 18 Provisions and contingent liabilities (continued)
Our balance sheet at 31 December 2021 reflected provisions
with respect to matters described in this item 4 in amounts that
UBS believes to be appropriate under the applicable accounting
standard. As in the case of other matters for which we have
established provisions, the future outflow of resources in respect
of such matters cannot be determined with certainty based on
currently available information and accordingly may ultimately
prove to be substantially greater (or may be less) than the
provisions that we have recognized.
5. Foreign exchange, LIBOR and benchmark rates, and other
trading practices
Foreign exchange-related regulatory matters:
numerous authorities commenced investigations concerning
possible manipulation of foreign exchange markets and precious
metals prices. As a result of these investigations, UBS entered into
resolutions with Swiss, US and United Kingdom regulators and
the European Commission. UBS was granted
conditional
immunity by the Antitrust Division of the DOJ and by authorities
in other jurisdictions in connection with potential competition law
violations relating to foreign exchange and precious metals
businesses.
Foreign exchange-related civil litigation:
have been filed since 2013 in US federal courts and in other
jurisdictions against UBS and other banks on behalf of putative
classes of persons who engaged in foreign currency transactions
with any of the defendant banks. UBS has resolved US federal
court class actions relating to foreign currency transactions with
the defendant banks and persons who transacted in foreign
exchange futures contracts and options on such futures under a
settlement agreement that provides for UBS to pay an aggregate
of USD
141
classes. Certain class members have excluded themselves from
that settlement and have filed individual actions in US and English
courts against UBS and other banks, alleging violations of US and
European competition laws and unjust enrichment.
In 2015, a putative class action was filed in federal court
against UBS and numerous other banks on behalf of persons and
businesses in the US who directly purchased foreign currency from
the defendants and alleged co-conspirators for their own end use.
In March 2017, the court granted UBS’s (and the other banks’)
motions to dismiss the complaint. The plaintiffs filed an amended
complaint in August 2017. In March 2018, the court denied the
defendants’ motions to dismiss the amended complaint.
LIBOR and other benchmark-related regulatory matters:
Numerous government agencies conducted investigations
regarding potential improper attempts by UBS, among others, to
manipulate LIBOR and other benchmark rates at certain times.
UBS reached settlements or otherwise concluded investigations
relating to benchmark interest rates with the investigating
authorities. UBS was granted conditional leniency or conditional
immunity from authorities in certain jurisdictions, including the
Antitrust Division of the DOJ and the Swiss Competition
Commission (WEKO), in connection with potential antitrust or
competition law violations related to certain rates. However, UBS
has not reached a final settlement with WEKO, as the Secretariat
of WEKO has asserted that UBS does not qualify for full immunity.
LIBOR and other benchmark-related civil litigation:
of putative class actions and other actions are pending in the
federal courts in New York against UBS and numerous other banks
on behalf of parties who transacted in certain interest rate
benchmark-based derivatives. Also pending in the US and in other
jurisdictions are a number of other actions asserting losses related
to various products whose interest rates were linked to LIBOR and
other benchmarks, including adjustable rate mortgages, preferred
and debt securities, bonds pledged as collateral, loans, depository
accounts, investments and other interest-bearing instruments.
The complaints allege manipulation, through various means, of
certain benchmark interest rates, including USD LIBOR, Euroyen
TIBOR, Yen LIBOR, EURIBOR, CHF LIBOR, GBP LIBOR, SGD SIBOR
and SOR and Australian BBSW, and seek unspecified
compensatory and other damages under varying legal theories.
USD LIBOR class and individual actions in the US:
In 2013 and
2015, the district court in the USD LIBOR actions dismissed, in
whole or in part, certain plaintiffs’ antitrust claims, federal
racketeering claims, CEA claims, and state common law claims,
and again dismissed the antitrust claims in 2016 following an
appeal. In December 2021, the Second Circuit affirmed the district
court’s dismissal in part and reversed in part and remanded to the
district court for further proceedings. The Second Circuit, among
other things, held that there was personal jurisdiction over UBS
and other foreign defendants based on allegations that at least
one alleged co-conspirator undertook an overt act in the United
States. Separately, in 2018, the Second Circuit reversed in part the
district court’s 2015 decision dismissing certain individual
plaintiffs’ claims and certain of these actions are now proceeding.
In 2018, the district court denied plaintiffs’ motions for class
certification in the USD class actions for claims pending against
UBS, and plaintiffs sought permission to appeal that ruling to the
Second Circuit. In July 2018, the Second Circuit denied the
petition to appeal of the class of USD lenders and in November
2018 denied the petition of the USD exchange class. In January
2019, a putative class action was filed in the District Court for the
Southern District of New York against UBS and numerous other
banks on behalf of US residents who, since 1 February 2014,
directly transacted with a defendant bank in USD LIBOR
instruments. The complaint asserts antitrust claims. The
defendants moved to dismiss the complaint in August 2019. On
26 March 2020 the court granted defendants’ motion to dismiss
the complaint in its entirety. Plaintiffs have appealed the dismissal.
In August 2020, an individual action was filed in the Northern
District of California against UBS and numerous other banks
alleging that the defendants conspired to fix the interest rate used
as the basis for loans to consumers by jointly setting the
USD LIBOR rate and monopolized the market for LIBOR-based
consumer loans and credit cards. Defendants moved to dismiss
the complaint in September 2021.
335
Note 18 Provisions and contingent liabilities (continued)
Other benchmark class actions in the US:
Yen LIBOR / Euroyen TIBOR –
In 2014, 2015 and 2017, the court
in one of the Yen LIBOR / Euroyen TIBOR lawsuits dismissed
certain of the plaintiffs’ claims, including the plaintiffs’ federal
antitrust and racketeering claims. In August 2020, the court
granted defendants’ motion for judgment on the pleadings and
dismissed the lone remaining claim in the action as impermissibly
extraterritorial. Plaintiffs have appealed. In 2017, the court
dismissed the other Yen LIBOR / Euroyen TIBOR action in its
entirety on standing grounds. In April 2020, the appeals court
reversed the dismissal and in August 2020 plaintiffs in that action
filed an amended complaint focused on Yen LIBOR. The court
granted in part and denied in part defendants’ motion to dismiss
the amended complaint in September 2021 and plaintiffs and the
remaining defendants have moved for reconsideration.
CHF LIBOR
on standing grounds and failure to state a claim. Plaintiffs filed an
amended complaint, and the court granted a renewed motion to
dismiss in September 2019. Plaintiffs appealed. In September
2021, the Second Circuit granted the parties’ joint motion to
vacate the dismissal and remand the case for further proceedings.
EURIBOR
the case as to UBS and certain other foreign defendants for lack
of personal jurisdiction. Plaintiffs have appealed.
SIBOR / SOR
action dismissed all but one of plaintiffs’ claims against UBS.
Plaintiffs filed an amended complaint, and the court granted a
renewed motion to dismiss in July 2019. Plaintiffs appealed. In
March 2021, the Second Circuit reversed the dismissal. Plaintiffs
filed an amended complaint in October 2021, which defendants
have moved to dismiss.
BBSW
lawsuit as to UBS and certain other foreign defendants for lack of
personal jurisdiction. Plaintiffs filed an amended complaint in April
2019, which UBS and other defendants moved to dismiss. In
February 2020, the court granted in part and denied in part
defendants’ motions to dismiss the amended complaint. In
August 2020, UBS and other BBSW defendants joined a motion
for judgment on the pleadings, which the court denied in May
2021.
GBP LIBOR
August 2019. Plaintiffs have appealed.
Government bonds:
2015 in US federal courts against UBS and other banks on behalf
of persons who participated in markets for US Treasury securities
since 2007. A consolidated complaint was filed in 2017 in the US
District Court for the Southern District of New York alleging that
the banks colluded with respect to, and manipulated prices of, US
Treasury securities sold at auction and in the secondary market and
asserting claims under the antitrust laws and for unjust enrichment.
Defendants’ motions to dismiss the consolidated complaint was
granted in March 2021. Plaintiffs filed an amended complaint,
which defendants moved to dismiss in June 2021. Similar class
actions have been filed concerning European government bonds
and other government bonds.
In May 2021, the European Commission issued a decision
finding that UBS and six other banks breached European Union
antitrust rules in 2007–2011 relating to European government
bonds. The European Commission fined UBS EUR
172
is appealing the amount of the fine.
With respect to additional matters and jurisdictions not
encompassed by the settlements and orders referred to above,
our balance sheet at 31 December 2021 reflected a provision in
an amount that UBS believes to be appropriate under the
applicable accounting standard. As in the case of other matters
for which we have established provisions, the future outflow of
resources in respect of such matters cannot be determined with
certainty based on currently available information and accordingly
may ultimately prove to be substantially greater (or may be less)
than the provision that we have recognized.
6. Swiss retrocessions
The Federal Supreme Court of Switzerland ruled in 2012, in a test
case
against UBS, that distribution fees paid to a firm for
distributing third-party and intra-group investment funds and
structured products must be disclosed and surrendered to clients
who have entered into a discretionary mandate agreement with
the firm, absent a valid waiver. FINMA issued a supervisory note
to all Swiss banks in response to the Supreme Court decision. UBS
has met the FINMA requirements and has notified all potentially
affected clients.
The Supreme Court decision has resulted, and continues to
result, in a number of client requests for UBS to disclose and
potentially surrender retrocessions. Client requests are assessed
on a case-by-case basis. Considerations taken into account when
assessing these cases include, among other things, the existence
of a discretionary mandate and whether or not the client
documentation contained a valid waiver with respect to
distribution fees.
Our balance sheet at 31 December 2021 reflected a provision
with respect to matters described in this item 6 in an amount that
UBS believes to be appropriate under the applicable accounting
standard. The ultimate exposure will depend on client requests
and the resolution thereof, factors that are difficult to predict and
assess. Hence, as in the case of other matters for which we have
established provisions, the future outflow of resources in respect
of such matters cannot be determined with certainty based on
currently available information and accordingly may ultimately
prove to be substantially greater (or may be less) than the
provision that we have recognized.
Consolidated financial statements | UBS Group AG consolidated financial statements
336
Note 19 Other liabilities
a) Other financial liabilities measured at amortized cost
USD million
31.12.21
31.12.20
Other accrued expenses
1,876
1,696
Accrued interest expenses
1,094
1,355
Settlement and clearing accounts
1,304
1,199
Lease liabilities
3,558
3,927
Other
1,167
1,553
Total other financial liabilities measured at amortized cost
9,001
9,729
b) Other financial liabilities designated at fair value
USD million
31.12.21
31.12.20
Financial liabilities related to unit-linked investment contracts
21,466
20,975
Securities financing transactions
6,377
7,317
Over-the-counter debt instruments
2,128
2,060
Other
103
35
Total other financial liabilities designated at fair value
30,074
30,387
of which: life-to-date own credit (gain) / loss
(32)
(36)
c) Other non-financial liabilities
USD million
31.12.21
31.12.20
Compensation-related liabilities
7,257
7,468
of which: Deferred Contingent Capital Plan
1,628
1,858
of which: financial advisor compensation plans
1,512
1,500
of which: other compensation plans
2,846
2,740
of which: net defined benefit liability
633
722
of which: other compensation-related liabilities
1
638
648
Deferred tax liabilities
300
564
Current tax liabilities
1,398
1,009
VAT and other tax payables
590
523
Deferred income
240
228
Liabilities of disposal groups held for sale
2
1,298
Other
68
61
Total other non-financial liabilities
11,151
9,854
1 Includes liabilities for payroll taxes and untaken vacation. 2 Refer to Note 30 for more information.
337
Additional information
Note 20 Expected credit loss measurement
a) Expected credit losses in the period
Total net credit loss releases were USD
148
reflecting net credit loss releases of USD
123
stage 1 and 2 positions and USD
25
related to credit-impaired (stage 3) positions.
Stage 1 and 2 net credit loss releases of USD
123
included a USD
68
adjustment, due to the continued positive trend in
macroeconomic scenario input data during the year, a USD
45
million net release from a number of model and methodology
changes
and
a
residual
USD
10
from
remeasurements within the loan book, derecognized
transactions, partially offset by expenses from new transactions
.
›
Refer to Note 20b for more information regarding changes to
ECL model, scenarios, scenario weights and the post-model
adjustment and to Note 20c for more information regarding
the development of ECL allowances and provisions
Stage 3 net releases of USD
25
a number of defaulted positions with a USD
24
in Personal & Corporate Banking.
Credit loss (expense) / release
USD million
Global
Wealth
Management
Personal &
Corporate
Banking
Asset
Management
Investment
Bank
Group
Functions
Total
For the year ended 31.12.21
Stages 1 and 2
28
62
0
34
0
123
Stage 3
1
24
(1)
0
0
25
Total credit loss (expense) / release
29
86
(1)
34
0
148
For the year ended 31.12.20
Stages 1 and 2
(48)
(129)
0
(88)
0
(266)
Stage 3
(40)
(128)
(2)
(217)
(42)
(429)
Total credit loss (expense) / release
(88)
(257)
(2)
(305)
(42)
(694)
For the year ended 31.12.19
Stages 1 and 2
3
23
0
(4)
0
22
Stage 3
(23)
(44)
0
(26)
(7)
(100)
Total credit loss (expense) / release
(20)
(21)
0
(30)
(7)
(78)
Consolidated financial statements | UBS Group AG consolidated financial statements
338
Note 20 Expected credit loss measurement (continued)
b) Changes to ECL models, scenarios, scenario weights and key inputs
Refer to Note 1a for information about the principles governing
expected credit loss (ECL) models, scenarios, scenario weights and
key inputs applied.
Governance
Comprehensive cross-functional and cross-divisional governance
processes are in place and are used to discuss and approve
scenario updates and weights, to assess whether significant
increases in credit risk resulted in stage transfers, to review model
outputs and to reach conclusions regarding post-model
adjustments.
Model changes
During 2021, the model review and enhancement process led to
adjustments of the probability of default (PD), loss given default
(LGD) and credit conversion factor (CCF) models, resulting in a
USD
45
25
Large corporate clients
Investment Bank. The remainder related to various segments in
Personal & Corporate Banking and Global Wealth Management.
Scenario and key input updates
During 2021, the scenarios and related macroeconomic factors
were updated from those that were applied at the end of 2020
by taking into account the prevailing economic and political
conditions and uncertainty. As the economic development was
more positive than anticipated following the COVID-19-related
downturn, the forward-looking scenarios benefited from an
improved forecast starting level.
The projections of the baseline scenario, which are aligned to
the economic and market assumptions used for UBS’s business
planning purposes, are broadly in line with external data, such as
from Bloomberg Consensus, Oxford Economics and the
International Monetary Fund World Economic Outlook. The
economic performance during 2021 in relevant markets,
especially in the US and in Switzerland, highlighted an accelerated
improvement after the COVID-19-related shocks. The scenario
assumes continued growth in 2022 in all key markets, albeit at a
slower rate than seen in 2021, and unemployment rates are not
expected to fall noticeably below the current levels. Interest rates
are expected to remain low in line with the central bank policies
pursued in the Eurozone and Switzerland, and any potential rises
in the US would be limited in the foreseeable future. House prices
are expected to reflect the momentum and continue to rise,
especially in Switzerland and, to a lesser degree, in the US.
The narrative of the hypothetical severe downside scenario,
which is the Group’s binding stress scenario, has been adapted
and assumes that, while the immediate risks from COVID-19 have
decreased, the associated disruptions and the consequences of
the unprecedented monetary and fiscal stimulus measures will
remain critical. Concerns regarding the sustainability of public
debt, following the marked deterioration of fiscal positions, lead
to a loss of confidence and market turbulence, while
protectionism results in a fall in global trade. Governments and
central banks have limited scope to support the economies. As a
consequence, the Eurozone and China suffer a hard landing,
under this scenario which severely affects the Swiss export-
oriented economy, and the US economy contracts as global
demand is significantly affected. Given the severity of the
macroeconomic impact, unemployment rates rise to historical
highs and real estate sectors contract sharply.
With effect from the second quarter, the hypothetical upside
and mild downside scenarios, which were viewed as less plausible
as of 31 December 2020 and had a probability weight of zero
attached, were redesigned and reintroduced in the ECL
calculation. These two scenarios have become more relevant
following this update, as they better reflect a more positive
outlook with regard to COVID-19 and market expectations
regarding a potential change in central bank policies, respectively.
The upside scenario is based on positive developments
following COVID-19 and strong economic activity supported by
pent-up demand in certain sectors, as well as the expectation that
interest rates will remain relatively low in the near future. Asset
prices rise significantly, but a view that currently observed higher
inflation rates are temporary and spare economic capacity would
mean that consumer prices remain moderate in the first year of
the scenario.
The mild downside scenario focuses on the implications of
rising concerns regarding inflationary trends following a recovery
from COVID-19. Higher-than-expected inflation data triggers a
steepening of yield curves across the globe and leads to market
volatility. Higher interest rates lead to a sell-off in assets and a
period of deleveraging
under this scenario
. With inflation
remaining high, central banks start hiking their policy rates after
a few quarters, leading to further increases in interest rates and
impacting corporate and private debt sustainability. A recessionary
period is the consequence.
The table on the following page details the key assumptions
for the four scenarios applied as of 31 December 2021.
339
Note 20 Expected credit loss measurement (continued)
Scenario weights and post-model adjustments
With the weighting of four scenarios above 0% and considering
the generally more positive outlook regarding an abating effect
on the world economy from the COVID-19 pandemic, the
distribution of weights shifted during 2021. As of 31 December
2021, 5 percentage points of the weight of the baseline scenario
and 10 percentage points of the severe downside scenario were
redistributed to the upside scenario (5%) and the mild downside
scenario (10%), as shown in the table below.
Although the scenarios and weight allocation were established
in line with the general market sentiment that COVID-19 has
passed its peak and a gradual return to normal is the most likely
path, significant uncertainties still remain. Models, which are
based on supportable statistical information from past
experiences regarding interdependencies of macroeconomic
factors and their implications for credit risk portfolios, cannot
comprehensively reflect extraordinary events, such as a pandemic
or a fundamental change in the world political order. Especially in
these uncertain times, it is in the realm of possibilities that the
generally accepted view that the effects of COVID-19 are abating
may prove to be disappointed by the emergence of new variants
of the virus, which may be more harmful and may undermine
current vaccination efforts. Political events involving tensions
between major global forces may introduce unforeseen
challenges, such as disruptions in the global supply chain and a
distortion of energy markets. Such events could affect economies
severely and change the baseline assumptions significantly. Rather
than creating multiple additional scenarios to gauge these risks
and applying model parameters that lack supportable information
and cannot be robustly validated, management continued to
apply significant post
-
model adjustments.
These
adjustments
were benchmarked against coverage ratio levels as of 30 June
2021
,
when a partial
n
et release
of USD
91
recognized, corresponding to one third of the accumulated effect
of scenario improvements, following comprehensive expert
assessment and judgment, and were also deemed appropriate for
year-end 2021 reporting. The post-model adjustments relating to
COVID-19 amounted to USD
224
(2020: USD
117
16
for other aspects, where model results were deemed to be
uncertain).
ECL scenario
Assigned weights in %
31.12.21
31.12.20
Upside
5.0
0.0
Baseline
55.0
60.0
Mild downside
10.0
0.0
Severe downside
30.0
40.0
Scenario assumptions
One year
Three years cumulative
31.12.21
Upside
Baseline
Mild
downside
Severe
downside
Upside
Baseline
Mild
downside
Severe
downside
Real GDP growth (% change)
United States
9.1
4.4
(0.1)
(5.9)
17.8
10.1
1.8
(3.8)
Eurozone
9.4
3.9
(0.1)
(8.7)
17.3
7.5
0.9
(10.3)
Switzerland
5.5
2.4
(0.9)
(6.6)
13.1
5.8
(0.1)
(5.7)
Consumer price index (% change)
United States
3.1
2.2
5.7
(1.2)
9.5
6.3
13.0
0.4
Eurozone
2.3
1.4
4.2
(1.3)
8.0
4.8
10.4
(1.7)
Switzerland
1.8
0.3
3.5
(1.8)
6.1
1.7
9.0
(1.6)
Unemployment rate (end-of-period level, %)
United States
3.0
3.9
6.1
10.9
3.0
3.5
7.2
10.8
Eurozone
6.2
7.4
8.7
12.9
6.0
7.2
9.1
15.1
Switzerland
2.3
2.5
3.4
5.2
1.6
2.3
4.2
5.9
Fixed income: 10-year government bonds (change in yields, basis points)
USD
50.0
16.5
259.2
(50.0)
170.0
41.2
329.2
(15.0)
EUR
40.0
11.1
283.8
(35.0)
140.0
34.9
349.3
(25.0)
CHF
50.0
12.1
245.5
(70.0)
150.0
34.4
307.3
(35.0)
Equity indices (% change)
S&P 500
12.0
14.1
(27.0)
(50.2)
35.5
24.7
(21.8)
(40.1)
EuroStoxx 50
16.0
12.3
(23.4)
(57.6)
41.6
20.7
(19.9)
(50.4)
SPI
14.0
12.1
(22.9)
(53.6)
37.9
19.1
(19.6)
(44.2)
Swiss real estate (% change)
Single-Family Homes
5.1
4.4
(4.3)
(17.0)
15.5
7.4
(8.8)
(30.0)
Other real estate (% change)
United States (S&P / Case-Shiller)
10.0
3.5
(2.3)
(9.5)
21.7
7.1
(8.7)
(26.3)
Eurozone (House Price Index)
8.4
5.1
(4.0)
(5.4)
17.8
9.6
(7.6)
(10.8)
Consolidated financial statements | UBS Group AG consolidated financial statements
340
Note 20 Expected credit loss measurement (continued)
Scenario assumptions
One year
Three years cumulative
31.12.20
Baseline
Severe downside
Baseline
Severe downside
Real GDP growth (% change)
United States
2.7
(5.9)
9.1
(3.8)
Eurozone
2.5
(8.7)
9.9
(10.3)
Switzerland
3.3
(6.6)
9.0
(5.7)
Consumer price index (% change)
United States
1.7
(1.2)
5.5
0.4
Eurozone
1.4
(1.3)
3.9
(1.7)
Switzerland
0.3
(1.8)
0.9
(1.6)
Unemployment rate (end-of-period level, %)
United States
5.5
12.1
4.5
9.9
Eurozone
9.5
14.1
8.0
16.4
Switzerland
3.8
6.1
3.2
6.8
Fixed income: 10-year government bonds (change in yields, basis points)
USD
22.0
(50.0)
46.0
(15.0)
EUR
4.0
(35.0)
21.0
(25.0)
CHF
13.0
(70.0)
31.0
(35.0)
Equity indices (% change)
S&P 500
(2.9)
(50.2)
(1.7)
(40.1)
EuroStoxx 50
3.8
(57.6)
13.5
(50.4)
SPI
(0.8)
(53.6)
5.8
(44.2)
Swiss real estate (% change)
Single-Family Homes
3.4
(17.0)
7.1
(30.0)
Other real estate (% change)
United States (S&P / Case-Shiller)
2.5
(15.3)
9.2
(28.7)
Eurozone (House Price Index)
1.1
(22.9)
7.2
(35.4)
c) Development of ECL allowances and provisions
The ECL allowances and provisions recognized in the period are
impacted by a variety of factors, such as:
–
origination of new instruments during the period;
–
effect of passage of time as the ECLs on an instrument for the
remaining lifetime decrease (all other factors remaining the
same);
–
discount unwind within ECLs as it is measured on a present
value basis;
–
derecognition of instruments in the period;
–
change in individual asset quality of instruments;
–
effect of updating forward-looking scenarios and the
respective weights;
–
movements from a maximum 12-month ECL to the recognition
of lifetime ECLs (and vice versa) following transfers between
stages 1 and 2;
–
movements from stages 1 and 2 to stage 3 (credit-impaired
status) when default has become certain and PD increases to
100% (or vice versa);
–
changes in models or updates to model parameters;
–
write-off; and
–
foreign exchange translations for assets denominated in
foreign currencies and other movements.
341
Note 20 Expected credit loss measurement (continued)
The following table explains the changes in the ECL allowances and provisions for on- and off-balance sheet financial instruments and
credit lines in scope of ECL requirements between the beginning and the end of the period due to the factors listed on the previous
page.
Development of ECL allowances and provisions
USD million
Total
Stage 1
Stage 2
Stage 3
Balance as of 31 December 2020
(1,468)
(306)
(333)
(829)
Net movement from new and derecognized transactions
1
(59)
(72)
13
0
of which: Private clients with mortgages
(7)
(10)
3
0
of which: Real estate financing
(7)
(11)
4
0
of which: Large corporate clients
(13)
(21)
7
0
of which: SME clients
(8)
(8)
0
0
of which: Other
(24)
(23)
(2)
0
(21)
(18)
(4)
0
0
(1)
1
0
Remeasurements with stage transfers
2
(40)
8
0
(49)
of which: Private clients with mortgages
(9)
4
(13)
0
of which: Real estate financing
(3)
1
(4)
0
of which: Large corporate clients
2
(2)
12
(8)
of which: SME clients
(27)
5
4
(36)
of which: Other
(3)
0
2
(4)
2
(1)
3
0
0
1
(1)
0
Remeasurements without stage transfers
3
203
55
74
74
of which: Private clients with mortgages
33
8
26
(1)
of which: Real estate financing
30
13
13
3
of which: Large corporate clients
44
5
21
17
of which: SME clients
53
(1)
1
53
of which: Other
44
29
14
2
27
15
12
0
6
8
1
(3)
Model changes
4
45
29
16
0
Movements with profit or loss impact
5
148
19
104
25
Movements without profit or loss impact (write-off, FX and other)
6
154
5
9
141
Balance as of 31 December 2021
(1,165)
(282)
(220)
(662)
1 Represents the increase and decrease in allowances and provisions resulting from financial instruments (including guarantees and facilities) that were newly originated, purchased or renewed and from the final
derecognition of loans or facilities on their maturity date or earlier. 2 Represents the remeasurement between 12-month and lifetime ECL due to stage transfers. 3 Represents the change in allowances and provisions
related to changes in model inputs or assumptions, including changes in forward -looking macroeconomic conditions, changes in the exposure profile, PD and LGD changes, and unwinding of the time value.
4 Represents the change in the allowances and provisions related to changes in models and methodologies. 5 Includes ECL movements from new and derecognized transactions, remeasurement changes, model and
methodology changes. 6 Represents the decrease in allowances and provisions resulting from write-offs of the ECL allowance against the gross carrying amount when all or part of a financial asset is deemed
uncollectible or forgiven and movements in foreign exchange rates.
In 2021, ECL allowances and provisions decreased by USD
148
million from net credit loss releases impacting profit or loss:
–
a USD
59
transactions that resulted from a USD
72
increase primarily in the corporate lending and real estate
lending portfolio, offset by a USD
13
stage 2 positions, driven by positions that were terminated
before their contractual maturity;
–
a USD
163
that
resulted from a USD
203
remeasurements without stage transfers, with approximately
half of that related to corporate lending – another significant
portion related to real estate-related lending, primarily due to
the partial release of a post-model adjustment, partially offset
by USD
40
2 into stages 2 and 3, respectively, primarily related to SME
clients; and
–
a USD
45
model changes. An amount of USD
25
Large corporate clients
remainder related to various segments in Personal & Corporate
Banking and Global Wealth Management.
In addition
to the movements impacting profit or loss,
allowances decreased by USD
154
137
million of write-offs and USD
18
million from foreign exchange
and other movements, both of which did not impact the income
statement.
Consolidated financial statements | UBS Group AG consolidated financial statements
342
Note 20 Expected credit loss measurement (continued)
Development of ECL allowances and provisions
USD million
Total
Stage 1
Stage 2
Stage 3
Balance as of 31 December 2019
(1,029)
(181)
(160)
(688)
Net movement from new and derecognized transactions
1
(28)
(90)
17
46
of which: Private clients with mortgages
(2)
(3)
2
0
of which: Real estate financing
(3)
(5)
2
0
of which: Large corporate clients
(32)
(29)
(4)
0
of which: SME clients
(16)
(14)
(3)
0
of which: Other
26
(39)
20
46
32
(1)
15
17
9
(1)
9
0
23
(6)
0
29
(20)
(15)
(5)
0
Remeasurements with stage transfers
2
(427)
45
(134)
(338)
of which: Private clients with mortgages
(19)
(2)
(17)
0
of which: Real estate financing
(6)
3
(9)
0
of which: Large corporate clients
(224)
34
(83)
(175)
of which: SME clients
(43)
(1)
(11)
(31)
of which: Other
(134)
11
(14)
(131)
(36)
0
(18)
(19)
(12)
7
(7)
(11)
(36)
0
0
(36)
(59)
0
0
(59)
Remeasurements without stage transfers
3
(271)
(88)
(47)
(136)
of which: Private clients with mortgages
(34)
(19)
(8)
(7)
of which: Real estate financing
(14)
(4)
(11)
1
of which: Large corporate clients
(149)
(53)
(17)
(79)
of which: SME clients
(13)
0
(7)
(6)
of which: Other
(60)
(11)
(4)
(44)
(18)
(12)
(3)
(3)
(3)
6
0
(9)
(12)
0
0
(12)
Model changes
4
32
21
11
0
Movements with profit or loss impact
5
(694)
(112)
(154)
(429)
Movements without profit or loss impact (write-off, FX and other)
6
254
(14)
(19)
287
Balance as of 31 December 2020
(1,468)
(306)
(333)
(829)
1 Represents the increase and decrease in allowances and provisions resulting from financial instruments (including guarantees and facilities) that were newly originated, purchased or renewed and from the final
derecognition of loans or facilities on their maturity date or earlier. 2 Represents the remeasurement between 12-month and lifetime ECL due to stage transfers. 3 Represents the change in allowances and provisions
related to changes in model inputs or assumptions, including changes in forward -looking macroeconomic conditions, changes in the exposure profile, PD and LGD changes, and unwinding of the time value.
4 Represents the change in the allowances and provisions related to changes in models and methodologies. 5 Includes ECL movements from new and derecognized transactions, remeasurement changes, model and
methodology changes. 6 Represents the decrease in allowances and provisions resulting from write-offs of the ECL allowance against the gross carrying amount when all or part of a financial asset is deemed
uncollectible or forgiven and movements in foreign exchange rates.
As explained in Note 1a, the assessment of a significant increase
in credit risk (
SICR
)
considers a number of qualitative and
quantitative factors to determine whether a stage transfer
between stage 1 and stage 2 is required, although the primary
assessment considers changes in PD based on rating analyses and
economic outlook. Additionally, UBS takes into consideration
counterparties that have moved to a credit watch list and those
with payments that are at least 30 days past due.
ECL stage 2 (“significant deterioration in credit risk”) allowances / provisions as of 31 December 2021 – classification by trigger
USD million
Stage 2
of which:
PD layer
of which:
watch list
of which:
≥30 days
past due
On-and off-balance sheet
(220)
(158)
(22)
(39)
of which: Private clients with mortgages
(71)
(54)
0
(17)
of which: Real estate financing
(43)
(38)
0
(4)
of which: Large corporate clients
(55)
(40)
(15)
0
of which: SME clients
(30)
(19)
(7)
(4)
of which: Financial intermediaries and hedge funds
(6)
(6)
0
0
of which: Loans to financial advisors
(3)
0
0
(3)
of which: Credit cards
(11)
0
0
(11)
of which: Other
(1)
(1)
0
0
343
Note 20 Expected credit loss measurement (continued)
d) Maximum exposure to credit risk
The tables below provide the Group’s maximum exposure to
credit risk for financial instruments subject to ECL requirements
and the respective collateral and other credit enhancements
mitigating credit risk for these classes of financial instruments.
The maximum exposure to credit risk includes the carrying
amounts of financial instruments recognized on the balance sheet
subject to credit risk and the notional amounts for off-balance
sheet arrangements. Where information is available, collateral is
presented at fair value. For other collateral, such as real estate, a
reasonable alternative value is used. Credit enhancements, such
as credit derivative contracts and guarantees, are included at their
notional amounts. Both are capped at the maximum exposure to
credit risk for which they serve as security. The “Risk management
and control” section of this report describes management’s view
of credit risk and the related exposures, which can differ in certain
respects from the requirements of IFRS.
Maximum exposure to credit risk
31.12.21
Collateral
1,2
Credit enhancements
1
Exposure to
credit risk
after collateral
and credit
enhancements
USD billion
Maximum
exposure to
credit risk
Cash
collateral
received
Collateralized
by securities
Secured by
real estate
Other
collateral
3
Netting
Credit
derivative
contracts
Guarantees
Financial assets measured at
amortized cost on the balance sheet
Cash and balances at central banks
192.8
192.8
Loans and advances to banks
4
15.5
0.1
0.1
15.3
Receivables from securities financing transactions
75.0
0.0
68.0
6.9
0.0
Cash collateral receivables on derivative instruments
5,6
30.5
18.4
12.1
Loans and advances to customers
7
397.8
37.5
128.7
191.3
20.2
4.0
16.2
Other financial assets measured at amortized cost
26.2
0.2
0.1
1.3
24.6
Total financial assets measured at amortized cost
737.8
37.7
196.9
191.3
28.4
18.4
0.0
4.0
261.0
Financial assets measured at fair value
through other comprehensive income – debt
8.8
8.8
Total maximum exposure to credit risk
reflected on the balance sheet in scope of ECL
746.6
37.7
196.9
191.3
28.4
18.4
0.0
4.0
269.8
Guarantees
8
20.9
1.3
6.5
0.2
2.5
2.3
8.1
Loan commitments
8
39.4
0.5
4.0
2.4
7.3
0.3
1.7
23.1
Forward starting transactions, reverse repurchase
and securities borrowing agreements
1.4
1.4
0.0
Committed unconditionally revocable credit lines
40.7
0.3
9.0
6.2
3.9
0.5
20.9
Total maximum exposure to credit risk not
reflected on the balance sheet, in scope of ECL
102.5
2.2
20.9
8.7
13.7
0.0
0.3
4.5
52.1
31.12.20
Collateral
1,2
Credit enhancements
1
Exposure to
credit risk
after collateral
and credit
enhancements
USD billion
Maximum
exposure to
credit risk
Cash
collateral
received
Collateralized
by securities
Secured by
real estate
Other
collateral
3
Netting
Credit
derivative
contracts
Guarantees
Financial assets measured at
amortized cost on the balance sheet
Cash and balances at central banks
158.2
158.2
Loans and advances to banks
4
15.4
0.1
15.3
Receivables from securities financing transactions
74.2
0.0
67.1
7.0
0.0
Cash collateral receivables on derivative instruments
5,6
32.7
21.1
11.6
Loans and advances to customers
7
379.5
25.8
118.2
194.6
21.7
4.4
14.8
Other financial assets measured at amortized cost
27.2
0.1
0.2
1.3
25.5
Total financial assets measured at amortized cost
687.3
26.0
185.7
194.6
30.1
21.1
0.0
4.4
225.5
Financial assets measured at fair value
through other comprehensive income – debt
8.3
8.3
Total maximum exposure to credit risk
reflected on the balance sheet in scope of ECL
695.6
26.0
185.7
194.6
30.1
21.1
0.0
4.4
233.7
Guarantees
8
17.0
0.7
5.0
0.2
1.7
2.5
7.0
Loan commitments
8
41.2
0.0
4.2
2.1
6.8
0.4
2.4
25.3
Forward starting transactions, reverse repurchase
and securities borrowing agreements
3.2
3.2
0.0
Committed unconditionally revocable credit lines
40.1
0.1
10.3
6.2
2.7
0.0
20.7
Total maximum exposure to credit risk not
reflected on the balance sheet, in scope of ECL
101.6
0.8
22.7
8.5
11.2
0.0
0.4
4.9
53.0
1 Of which: USD
1,443
1,983
130
(31 December 2020: USD
154
cash, securities, real estate and other collateral. UBS applies a risk-based approach that generally prioritizes collateral according to its liquidity profile. 3 Includes but is not limited to life insurance contracts, inventory,
mortgage loans, gold and other commodities. 4 Loans and advances to banks include amounts held with third-party banks on behalf of clients. The credit risk associated with these balances may be borne by those
clients. 5 Included within Cash collateral receivables on derivative instruments are margin balances due from exchanges or clearing houses. Some of these margin balances reflect amounts transferred on behalf of
clients who retain the associated credit risk. 6 The amount shown in the “Netting” column represents the netting potential not recognized on the balance sheet. Refer to Note 22 for more information. 7 In 2021,
the collateral allocation was updated to reflect additional cash collateral and custody accounts that are also available as security for certain on-balance sheet lending. This resulted in an increase in loans secured by
cash, with an offsetting reduction in loans secured by real estate and loans secured by securities. 8 The amount shown in the “Guarantees” column includes sub-participations.
Consolidated financial statements | UBS Group AG consolidated financial statements
344
Note 20 Expected credit loss measurement (continued)
e) Financial assets subject to credit risk by rating category
The table below shows the credit quality and the maximum
exposure to credit risk based on the Group’s internal credit rating
system and year-end stage classification. Under IFRS 9, the credit
risk rating reflects the Group’s assessment of the probability of
default of individual counterparties, prior to substitutions. The
amounts presented are gross of impairment allowances.
›
Refer to the “Risk management and control” section of this
report for more details regarding the Group’s internal grading
system
Financial assets subject to credit risk by rating category
USD million
31.12.21
Rating category
1
0–1
2–3
4–5
6–8
9–13
Credit-
impaired
(defaulted)
Total gross
carrying
amount
ECL
allowances
Net carrying
amount
(maximum
exposure to
credit risk)
Financial assets measured at amortized cost
Cash and balances at central banks
191,015
1,802
0
0
0
0
192,817
0
192,817
of which: stage 1
191,015
1,802
0
0
0
0
192,817
0
192,817
Loans and advances to banks
407
12,623
1,171
795
490
1
15,488
(8)
15,480
of which: stage 1
407
12,623
1,146
795
488
0
15,460
(7)
15,453
of which: stage 2
0
0
24
0
2
0
27
(1)
26
of which: stage 3
0
0
0
0
0
1
1
0
1
Receivables from securities financing transactions
34,386
11,267
10,483
17,440
1,439
0
75,014
(2)
75,012
of which: stage 1
34,386
11,267
10,483
17,440
1,439
0
75,014
(2)
75,012
Cash collateral receivables on derivative instruments
7,466
13,476
5,878
3,647
47
0
30,514
0
30,514
of which: stage 1
7,466
13,476
5,878
3,647
47
0
30,514
0
30,514
Loans and advances to customers
5,295
232,233
67,620
69,892
21,423
2,148
398,611
(850)
397,761
of which: stage 1
5,295
231,153
65,084
62,796
16,362
0
380,690
(126)
380,564
of which: stage 2
0
1,080
2,536
7,096
5,061
0
15,773
(152)
15,620
of which: stage 3
0
0
0
0
0
2,148
2,148
(572)
1,577
Other financial assets measured at amortized cost
12,564
6,702
321
6,072
394
264
26,318
(109)
26,209
of which: stage 1
12,564
6,693
307
5,863
317
0
25,745
(27)
25,718
of which: stage 2
0
10
13
209
77
0
309
(7)
302
of which: stage 3
0
0
0
0
0
264
264
(76)
189
Total financial assets measured at amortized cost
251,133
278,103
85,472
97,846
23,793
2,414
738,762
(969)
737,794
On-balance sheet financial instruments
Financial assets measured at FVOCI – debt instruments
3,996
4,771
0
77
0
0
8,844
0
8,844
Total on-balance sheet financial instruments
255,130
282,874
85,472
97,923
23,793
2,414
747,606
(969)
746,638
Off-balance sheet positions subject to expected credit loss by rating category
USD million
31.12.21
Rating category
1
0–1
2–3
4–5
6–8
9–13
Credit-
impaired
(defaulted)
Total off -
balance sheet
exposure
(maximum
exposure to
credit risk)
ECL provisions
Off-balance sheet financial instruments
Guarantees
4,457
7,064
4,535
3,757
1,009
150
20,972
(41)
of which: stage 1
4,457
7,037
4,375
3,075
752
0
19,695
(18)
of which: stage 2
0
27
160
682
258
0
1,127
(8)
of which: stage 3
0
0
0
0
0
150
150
(15)
Irrevocable loan commitments
2,797
14,183
7,651
8,298
6,502
46
39,478
(114)
of which: stage 1
2,797
13,917
7,416
7,127
5,840
0
37,097
(72)
of which: stage 2
0
266
235
1,171
663
0
2,335
(42)
of which: stage 3
0
0
0
0
0
46
46
0
Forward starting reverse repurchase and securities borrowing agreements
0
0
55
1,389
0
0
1,444
0
Total off-balance sheet financial instruments
7,254
21,247
12,241
13,444
7,512
196
61,894
(155)
Credit lines
Committed unconditionally revocable credit lines
2,636
15,594
8,627
9,752
4,107
63
40,778
(38)
of which: stage 1
2,636
15,250
8,304
8,346
3,671
0
38,207
(28)
of which: stage 2
0
344
323
1,406
436
0
2,508
(10)
of which: stage 3
0
0
0
0
0
63
63
0
Irrevocable committed prolongation of existing loans
17
2,438
1,422
1,084
602
48
5,611
(3)
of which: stage 1
17
2,438
1,422
1,082
568
0
5,527
(3)
of which: stage 2
0
0
0
1
34
0
36
0
of which: stage 3
0
0
0
0
0
48
48
0
Total credit lines
2,653
18,032
10,049
10,836
4,709
111
46,390
(41)
1 Refer to the “Internal UBS rating scale and mapping of external ratings” table in the “Risk management and control” section of this report for more information on rating categories.
345
Note 20 Expected credit loss measurement (continued)
Financial assets subject to credit risk by rating category
USD million
31.12.20
Rating category
1
0–1
2–3
4–5
6–8
9–13
Credit-
impaired
(defaulted)
Total gross
carrying
amount
ECL
allowances
Net carrying
amount
(maximum
exposure to
credit risk)
Financial assets measured at amortized cost
Cash and balances at central banks
156,250
1,981
0
0
0
0
158,231
0
158,231
of which: stage 1
156,250
1,981
0
0
0
0
158,231
0
158,231
Loans and advances to banks
543
12,129
1,344
1,182
260
1
15,460
(16)
15,444
of which: stage 1
543
12,074
1,277
1,145
231
0
15,269
(9)
15,260
of which: stage 2
0
55
67
37
29
0
189
(5)
184
of which: stage 3
0
0
0
0
0
1
1
(1)
0
Receivables from securities financing transactions
22,998
16,009
15,367
17,995
1,842
0
74,212
(2)
74,210
of which: stage 1
22,998
16,009
15,367
17,995
1,842
0
74,212
(2)
74,210
Cash collateral receivables on derivative instruments
8,196
13,477
7,733
3,243
88
0
32,737
0
32,737
of which: stage 1
8,196
13,477
7,733
3,243
88
0
32,737
0
32,737
Loans and advances to customers
5,813
214,307
67,270
69,217
21,038
2,943
380,589
(1,060)
379,528
of which: stage 1
5,813
212,970
63,000
59,447
15,860
0
357,090
(142)
356,948
of which: stage 2
0
1,338
4,269
9,770
5,178
0
20,556
(215)
20,341
of which: stage 3
0
0
0
0
0
2,943
2,943
(703)
2,240
Other financial assets measured at amortized cost
15,404
4,018
280
6,585
481
560
27,327
(133)
27,194
of which: stage 1
15,404
4,015
269
6,334
389
0
26,410
(34)
26,377
of which: stage 2
0
3
11
251
91
0
357
(9)
348
of which: stage 3
0
0
0
0
0
560
560
(90)
469
Total financial assets measured at amortized cost
209,204
261,922
91,993
98,223
23,709
3,505
688,556
(1,211)
687,345
On-balance sheet financial instruments
Financial assets measured at FVOCI – debt instruments
3,212
5,014
0
32
0
0
8,258
0
8,258
Total on-balance sheet financial instruments
212,417
266,936
91,993
98,255
23,709
3,505
696,815
(1,211)
695,603
Off-balance sheet positions subject to expected credit loss by rating category
USD million
31.12.20
Rating category
1
0–1
2–3
4–5
6–8
9–13
Credit-
impaired
(defaulted)
Total off -
balance sheet
exposure
(maximum
exposure to
credit risk)
ECL provisions
Off-balance sheet financial instruments
Guarantees
3,482
4,623
3,522
4,293
991
170
17,081
(63)
of which: stage 1
3,482
4,219
2,688
3,558
739
0
14,687
(14)
of which: stage 2
0
404
834
736
252
0
2,225
(15)
of which: stage 3
0
0
0
0
0
170
170
(34)
Irrevocable loan commitments
3,018
14,516
8,583
9,302
5,850
104
41,372
(142)
of which: stage 1
3,018
13,589
6,873
8,739
4,676
0
36,894
(74)
of which: stage 2
0
927
1,711
563
1,174
0
4,374
(68)
of which: stage 3
0
0
0
0
0
104
104
0
Forward starting reverse repurchase and securities borrowing agreements
82
150
0
3,015
0
0
3,247
0
Total off-balance sheet financial instruments
6,583
19,289
12,105
16,610
6,840
273
61,700
(205)
Credit lines
Committed unconditionally revocable credit lines
574
13,505
5,958
8,488
11,501
108
40,134
(50)
of which: stage 1
574
12,940
4,517
6,609
10,593
0
35,233
(29)
of which: stage 2
0
565
1,441
1,879
908
0
4,792
(21)
of which: stage 3
0
0
0
0
0
108
108
0
Irrevocable committed prolongation of existing loans
14
1,349
931
632
357
0
3,282
(2)
of which: stage 1
14
1,349
930
630
355
0
3,277
(2)
of which: stage 2
0
1
1
2
1
0
5
0
of which: stage 3
0
0
0
0
0
0
0
0
Total credit lines
588
14,854
6,889
9,119
11,858
109
43,416
(52)
1 Refer to the “Internal UBS rating scale and mapping of external ratings” table in the “Risk management and control” section of this report for more information on rating categories.
Consolidated financial statements | UBS Group AG consolidated financial statements
346
Note 20 Expected credit loss measurement (continued)
f) Sensitivity information
As outlined in Note 1a, ECL estimates involve significant
uncertainties at the time they are made.
ECL model
The models applied to determine point-in-time PD and LGD rely
on market and statistical data, which has been found to
correlate well with historically observed defaults in sufficiently
homogeneous segments. The risk sensitivities for each of the
ECL reporting segments to such factors are summarized in Note
9.
Forward-looking scenarios
Depending on the scenario selection and related macro-economic
assumptions for the risk factors, the components of the relevant
weighted average ECL change. This is particularly relevant for
interest rates, which can move in both directions under a given
growth assumption (for example, low growth with high interest
rates in a stagflation scenario, versus low growth and falling interest
rates in a recession). Management generally looks for scenario
narratives that reflect the key risk drivers of a given credit portfolio.
As forecasting models are complex, due to the combination of
multiple factors, simple what-if analyses involving a change of
individual parameters do not necessarily provide realistic
information on the exposure of segments to changes in the
macroeconomy. Portfolio -specific analyses based on their key risk
factors would also not be meaningful, as potential compensatory
effects in other segments would be ignored. The table below
indicate
s
some sensitivities to ECL
s
if a key macroeconomic
variable for the forecasting period is amended across all scenarios
with all other factors remaining unchanged.
Potential effect on stage 1 and stage 2 positions from changing key parameters as of 31 December 2021
USD million
Baseline
Upside
Mild downside
Severe downside
Weighted average
Change in key parameters
Fixed income: Government bonds (absolute change)
–0.50%
(1)
0
(29)
(9)
(4)
+0.50%
1
1
39
11
5
+1.00%
4
2
88
23
14
Unemployment rate (absolute change)
–1.00%
(2)
(2)
(30)
(48)
(13)
–0.50%
(1)
(1)
(17)
(27)
(7)
+0.50%
1
1
21
31
8
+1.00%
3
2
47
68
18
Real GDP growth (relative change)
–2.00%
4
2
8
17
10
–1.00%
2
1
4
8
5
+1.00%
(1)
0
(10)
(8)
(4)
+2.00%
(2)
0
(14)
(16)
(7)
House Price Index (relative change)
–5.00%
6
4
50
73
24
–2.50%
3
2
24
34
12
+2.50%
(2)
(1)
(26)
(31)
(11)
+5.00%
(4)
(3)
(46)
(31)
(13)
Equity (S&P500, EuroStoxx, SMI) (relative change)
–10.00%
2
2
5
6
5
–5.00%
1
0
2
3
2
+5.00%
(1)
0
(2)
(3)
(2)
+10.00%
(2)
0
(4)
(6)
(3)
347
Note 20 Expected credit loss measurement (continued)
Sensitivities can be more meaningfully assessed in the context
of coherent scenarios with consistently developed
macroeconomic factors. The table on the previous page outlines
favorable and unfavorable effects, based on reasonably possible
alternative changes to the economic conditions for stage 1 and
stage 2 positions. The ECL impact is calculated for material
portfolios and disclosed for each scenario.
The forecasting horizon is limited to three years, with a
model-based mean reversion of PD and LGD assumed
thereafter. Changes to these timelines may have an effect on
ECLs: depending on the cycle, a longer or shorter forecasting
horizon will lead to different annualized lifetime PD and average
LGD estimations. This is currently not deemed to be material for
UBS, as a large proportion of loans, including mortgages in
Switzerland, have
maturities
that
are
within the forecasting
horizon.
Scenario weights
ECL is sensitive to changing scenario weights, in particular if
narratives and parameters are selected that are not close to the
baseline scenario, highlighting the non-linearity of credit losses.
As shown in the table on the bottom of this page, the ECL
for stage 1 and stage 2 positions would have been USD
387
million (31
December 2020:
USD
442
f
USD
503
639
had been determined solely on the baseline scenario. The
weighted average ECL therefore amounts to
130
%
(31 December 2020:
145
%) of the baseline value. The effects of
weighting each of the four scenarios 100% are shown in the
table below.
Stage allocation and SICR
The determination of what constitutes a
n
SICR is based on
management judgment, as explained in Note 1a. Changing the
SICR trigger will have a direct effect on ECLs, as more or fewer
positions would be subject to lifetime ECLs under any scenario.
The relevance of the SICR trigger on overall ECL is
demonstrated in the table below with the indication that the
ECL allowances and provisions for stage 1 and stage 2 positions
would have been USD
1,060
across the portfolio had been measured for lifetime ECLs
irrespective of their actual SICR status. This amount compares to
actual stage 1 and 2 allowances and provisions of USD
503
million as of 31 December 2021.
Potential effect on stage 1 and stage 2 positions from changing scenario weights or moving to an ECL lifetime calculation as of 31 December 2021
Actual ECL
allowances and
provisions,
including staging
(as per Note 9)
Pro forma ECL
allowances and
provisions,
assuming all
positions being
subject to lifetime
ECL
Scenarios
Weighted average
100% Baseline
100% Upside
100% Mild
downside
100% Severe
downside
Weighted average
USD million, except where indicated
Segmentation
Private clients with mortgages
(95)
(53)
(52)
(119)
(207)
(277)
Real estate financing
(62)
(50)
(48)
(101)
(97)
(118)
Large corporate clients
(150)
(116)
(107)
(148)
(244)
(257)
SME clients
(65)
(56)
(55)
(71)
(91)
(117)
Other segments
(130)
(112)
(108)
(135)
(166)
(291)
Total
(503)
(387)
(370)
(574)
(806)
(1,060)
Maturity profile
The maturity profile is an important driver for changes in ECL due
to transfers to stage 2 and from stage 2 to stage 1. The current
maturity profile of most lending books is relatively short; hence a
movement to stage 2 may have a moderate effect on ECLs. A
significant portion of our lending to SMEs is documented under
multi-purpose credit agreements, which allow for various forms
of utilization but are unconditionally cancelable by UBS at any
time. For drawings under such agreements with a fixed maturity,
the respective term is applied for ECL calculations, or a maximum
of 12 months in stage 1. For unused credit lines and all drawings
that have no fixed maturity (e.g., current accounts), UBS generally
applies a 12-month maturity from the reporting date, given the
credit review policies, which require either continuous monitoring
of key indicators and behavioral patterns for smaller positions or
an annual formal review for any other limit. The ECLs for these
products are sensitive to shortening or extending the maturity
assumption.
Consolidated financial statements | UBS Group AG consolidated financial statements
348
Note 21 Fair value measurement
a) Valuation principles
All financial and non-financial assets and liabilities measured or
disclosed at fair value are categorized into one of three fair value
hierarchy levels in accordance with IFRS. The fair value hierarchy
is based on the transparency of inputs to the valuation of an asset
or liability as of the measurement date. In certain cases, the inputs
used to measure fair value may fall within different levels of the
fair value hierarchy. For disclosure purposes, the level in the
hierarchy within which an instrument is classified in its entirety is
based on the lowest level input that is significant to the position’s
fair value measurement:
–
Level 1 – quoted prices (unadjusted) in active markets for
identical assets and liabilities;
–
Level 2 – valuation techniques for which all significant inputs
are, or are based on, observable market data; or
–
Level 3 – valuation techniques for which significant inputs are
not based on observable market data.
Fair values are determined using quoted prices in active
markets for identical assets or liabilities, where available. Where
the market for a financial instrument or non-financial asset or
liability is not active, fair value is established using a valuation
technique, including pricing models. Valuation adjustments may
be made to allow for additional factors, including model, liquidity,
credit and funding risks, which are not explicitly captured within
the valuation technique, but which would nevertheless be
considered by market participants when establishing a price. The
limitations inherent in a particular valuation technique are
considered in the determination of the classification of an asset or
liability within the fair value hierarchy. Generally, the unit of
account for a financial instrument is the individual instrument,
and UBS applies valuation adjustments at an individual instrument
level, consistent with that unit of account. However, if certain
conditions are met, UBS may estimate the fair value of a portfolio
of financial assets and liabilities with substantially similar and
offsetting risk exposures on the basis of the net open risks.
›
Refer to Note 21d for more information
b) Valuation governance
UBS’s fair value measurement and model governance framework
includes numerous controls and other procedural safeguards that
are intended to maximize the quality of fair value measurements
reported in the financial statements. New products and valuation
techniques must be reviewed and approved by key stakeholders
from the risk and finance control functions. Responsibility for the
ongoing measurement of financial and non-financial instruments
at fair value is with the business divisions.
Fair value estimates are validated by the risk and finance
control functions, which are independent of the business
divisions. Independent price verification is performed by Finance
through benchmarking the business divisions’ fair value estimates
with observable market prices and other independent sources. A
governance framework and associated controls are in place in
order to monitor the quality of third -party pricing sources where
used. For instruments where valuation models are used to
determine fair value, independent valuation and model control
groups within Finance and Risk Control evaluate UBS’s models on
a regular basis, including valuation and model input parameters,
as well as pricing. As a result of the valuation controls employed,
valuation adjustments may be made to the business divisions’
estimates of fair value to align with independent market data and
the relevant accounting standard.
›
Refer to Note 21d for more information
349
Note 21 Fair value measurement (continued)
c) Fair value hierarchy
The table below provides the fair value hierarchy classification of
financial and non-financial assets and liabilities measured at fair
value. The narrative that follows describes valuation techniques
used in measuring their fair value of different product types
(including significant valuation inputs and assumptions used), and
the factors considered in determining their classification within
the fair value hierarchy.
Determination of fair values from quoted market prices or valuation techniques
1
31.12.21
31.12.20
USD million
Level 1
Level 2
Level 3
Total
Level 1
Level 2
Level 3
Total
Financial assets measured at fair value on a recurring basis
Financial assets at fair value held for trading
113,697
14,825
2,299
130,821
107,507
15,553
2,337
125,397
of which:
Equity instruments
97,958
1,090
149
99,197
90,307
1,101
171
91,579
Government bills / bonds
7,135
1,351
10
8,496
9,028
2,207
10
11,245
Investment fund units
7,843
1,364
21
9,229
7,374
1,794
23
9,192
Corporate and municipal bonds
708
7,604
556
8,868
789
8,356
817
9,961
Loans
0
3,099
1,443
4,542
0
1,860
1,134
2,995
Asset-backed securities
53
317
120
489
8
236
181
425
Derivative financial instruments
522
116,479
1,140
118,142
795
157,068
1,754
159,617
of which:
Foreign exchange contracts
255
53,043
7
53,305
319
68,424
5
68,749
Interest rate contracts
0
32,747
494
33,241
0
50,353
537
50,890
Equity / index contracts
0
27,861
384
28,245
0
33,990
853
34,842
Credit derivative contracts
0
1,179
236
1,414
0
2,008
350
2,358
Commodity contracts
0
1,590
16
1,606
0
2,211
6
2,217
Brokerage receivables
0
21,839
0
21,839
0
24,659
0
24,659
Financial assets at fair value not held for trading
2
27,278
28,622
4,180
60,080
40,986
35,435
3,942
80,364
of which:
Financial assets for unit-linked investment contracts
21,110
187
6
21,303
20,628
101
2
20,731
Corporate and municipal bonds
123
13,937
306
14,366
290
16,957
372
17,619
Government bills / bonds
5,624
3,236
0
8,860
19,704
3,593
0
23,297
Loans
0
4,982
892
5,874
0
7,699
862
8,561
Securities financing transactions
0
5,704
100
5,804
0
6,629
122
6,751
Auction rate securities
0
0
1,585
1,585
0
0
1,527
1,527
Investment fund units
338
574
117
1,028
278
447
105
831
Equity instruments
83
2
681
765
86
0
544
631
Other
0
0
495
495
0
10
408
418
Financial assets measured at fair value through other comprehensive income on a recurring basis
Financial assets measured at fair value through other comprehensive income
2
2,704
6,140
0
8,844
1,144
7,114
0
8,258
of which:
Asset-backed securities
0
4,849
0
4,849
0
6,624
0
6,624
Government bills / bonds
2,658
27
0
2,686
1,103
47
0
1,150
Corporate and municipal bonds
45
1,265
0
1,310
40
444
0
485
Non-financial assets measured at fair value on a recurring basis
Precious metals and other physical commodities
5,258
0
0
5,258
6,264
0
0
6,264
Non-financial assets measured at fair value on a non-recurring basis
Other non-financial assets
3
0
0
26
26
0
1
245
246
Total assets measured at fair value
149,459
187,905
7,645
345,010
156,696
239,831
8,278
404,805
Consolidated financial statements | UBS Group AG consolidated financial statements
350
Note 21 Fair value measurement (continued)
Determination of fair values from quoted market prices or valuation techniques (continued)
1
31.12.21
31.12.20
USD million
Level 1
Level 2
Level 3
Total
Level 1
Level 2
Level 3
Total
Financial liabilities measured at fair value on a recurring basis
Financial liabilities at fair value held for trading
25,413
6,170
105
31,688
26,888
6,652
55
33,595
of which:
Equity instruments
18,328
513
83
18,924
22,519
425
40
22,985
Corporate and municipal bonds
30
4,219
17
4,266
31
4,048
9
4,089
Government bills / bonds
5,883
826
0
6,709
3,642
1,036
0
4,678
Investment fund units
1,172
555
6
1,733
696
1,127
5
1,828
Derivative financial instruments
509
118,558
2,242
121,309
746
156,884
3,471
161,102
of which:
Foreign exchange contracts
258
53,800
21
54,078
316
70,149
61
70,527
Interest rate contracts
0
28,398
278
28,675
0
43,389
527
43,916
Equity / index contracts
0
33,438
1,511
34,949
0
38,870
2,306
41,176
Credit derivative contracts
0
1,412
341
1,753
0
2,403
528
2,931
Commodity contracts
0
1,503
63
1,566
0
2,003
24
2,027
Financial liabilities designated at fair value on a recurring basis
Brokerage payables designated at fair value
0
44,045
0
44,045
0
38,742
0
38,742
Debt issued designated at fair value
2
0
59,606
14,194
73,799
0
50,273
10,970
61,243
Other financial liabilities designated at fair value
2
0
29,258
816
30,074
0
29,671
716
30,387
of which:
Financial liabilities related to unit-linked investment contracts
0
21,466
0
21,466
0
20,975
0
20,975
Securities financing transactions
0
6,375
2
6,377
0
7,317
0
7,317
Over-the-counter debt instruments
0
1,334
794
2,128
0
1,363
697
2,060
Total liabilities measured at fair value
25,922
257,637
17,357
300,916
27,635
282,222
15,212
325,069
1 Bifurcated embedded derivatives are presented on the same balance sheet lines as their host contracts and are not included in this table. The fair value of these derivatives was not material for the periods presented.
2 As of 31 December 2021, USD
17
21
8
8
fair value through other comprehensive income, USD
36
16
1
1
liabilities designated at fair value are expected to be recovered or settled after 12 months. 3 Other non-financial assets primarily consist of properties and other non-current assets held for sale, which are measured
at the lower of their net carrying amount or fair value less costs to sell.
351
Note 21 Fair value measurement (continued)
Valuation techniques
UBS uses widely recognized valuation techniques for determining
the fair value of financial and non-financial instruments that are
not actively traded and quoted. The most frequently applied
valuation techniques include discounted value of expected cash
flows, relative value and option pricing methodologies.
Discounted value of expected cash flows is a valuation
technique that measures fair value using estimated expected
future cash flows from assets or liabilities and then discounts
these cash flows using a discount rate or discount margin that
reflects the credit and / or funding spreads required by the market
for instruments with similar risk and liquidity profiles to produce a
present value. When using such valuation techniques, expected
future cash flows are estimated using an observed or implied
market price for the future cash flows or by using industry-
standard cash flow projection models. The discount factors within
the calculation are generated using industry-standard yield curve
modeling techniques and models.
Relative value models measure fair value based on the market
prices of equivalent or comparable assets or liabilities, making
adjustments for differences between the characteristics of the
observed instrument and the instrument being valued.
Option pricing models incorporate assumptions regarding the
behavior of future price movements of an underlying referenced
asset or assets to generate a probability-weighted future expected
payoff for the option. The resulting probability-weighted expected
payoff is then discounted using discount factors generated from
industry-standard yield curve modeling techniques and models.
The option pricing model may be implemented using a closed-
form analytical formula or other mathematical techniques (e.g.,
binomial tree or Monte Carlo simulation).
Where available, valuation techniques use market-observable
assumptions and inputs. If such data is not available, inputs may
be derived by reference to similar assets in active markets, from
recent prices for comparable transactions or from other
observable market data. In such cases, the inputs selected are
based on historical experience and practice for similar or
analogous instruments, derivation of input levels based on similar
products with observable price levels, and knowledge of current
market conditions and valuation approaches.
For more complex instruments, fair values may be estimated
using a combination of observed transaction prices, consensus
pricing services and relevant quotes. Consideration is given to the
nature of the quotes (e.g., indicative or firm) and the relationship of
recently evidenced market activity to the prices provided by
consensus pricing services. UBS also uses internally developed
models, which are typically based on valuation methods and
techniques recognized as standard within the industry. Assumptions
and inputs used in valuation techniques include benchmark interest
rate curves, credit and funding spreads used in estimating discount
rates, bond and equity prices, equity index prices, foreign exchange
rates, levels of market volatility and correlation. Refer to Note 21f
for more information. The discount curves used by the Group
incorporate the funding and credit characteristics of the
instruments to which they are applied.
Financial instruments excluding derivatives: valuation and classification in the fair value hierarchy
Product
Valuation and classification in the fair value hierarchy
Government bills
and bonds
Valuation
–
Generally valued using prices obtained directly from the market.
–
Instruments not priced directly using active-market data are valued using discounted cash flow valuation
techniques that incorporate market data for similar government instruments.
Fair value hierarchy
–
Generally traded in active markets with prices that can be obtained directly from these markets, resulting
in classification as Level 1, while the remaining positions are classified as Level 2 and Level 3.
Corporate and
municipal bonds
Valuation
–
Generally valued using prices obtained directly from the market for the security, or similar securities,
adjusted for seniority, maturity and liquidity.
–
When prices are not available, instruments are valued using discounted cash flow valuation techniques
incorporating the credit spread of the issuer or similar issuers.
–
For convertible bonds without directly comparable prices, issuances may be priced using a convertible bond
model.
Fair value hierarchy
–
Generally classified as Level 1 or Level 2, depending on the depth of trading activity behind price sources.
–
Level 3 instruments have no suitable pricing information available.
Traded loans and
loans measured at
fair value
Valuation
–
Valued directly using market prices that reflect recent transactions or quoted dealer prices, where available.
–
Where no market price data is available, loans are valued by relative value benchmarking using pricing
derived from debt instruments in comparable entities or different products in the same entity, or by using
a credit default swap valuation technique, which requires inputs for credit spreads, credit recovery rates
and interest rates. Recently originated commercial real estate loans are measured using a securitization
approach based on rating agency guidelines.
Fair value hierarchy
–
Instruments with suitably deep and liquid pricing information are classified as Level 2.
–
Positions requiring the use of valuation techniques, or for which the price sources have insufficient trading
depth, are classified as Level 3.
Consolidated financial statements | UBS Group AG consolidated financial statements
352
Note 21 Fair value measurement (continued)
Product
Valuation and classification in the fair value hierarchy
Investment fund
units
Valuation
–
Predominantly exchange-traded, with readily available quoted prices in liquid markets.
–
Where market prices are not available, fair value may be measured using net asset values (NAVs).
Fair value hierarchy
–
Listed units are classified as Level 1, provided there is sufficient trading activity to justify active-market
classification, while other positions are classified as Level 2.
–
Positions for which NAVs are not available are classified as Level 3.
Asset-backed
securities (ABS)
Valuation
–
For liquid securities, the valuation process will use trade and price data, updated for movements in market
levels between the time of trading and the time of valuation. Less liquid instruments are measured using
discounted expected cash flows incorporating price data for instruments or indices with similar risk profiles.
Fair value hierarchy
–
Residential mortgage
-
backed securities
,
c
ommercial mortgage
-
backed securities
and other ABS are
generally classified as Level 2. However, if significant inputs are unobservable, or if market or fundamental
data is not available, they are classified as Level 3.
Auction rate
securities (ARS)
Valuation
–
ARS are valued utilizing a discounted cash flow methodology. The model captures interest rate risk
emanating from the note coupon, credit risk attributable to the underlying closed-end fund investments,
liquidity risk as a function of the level of trading volume in these positions, and extension risk, as ARS are
perpetual instruments that require an assumption regarding their maturity or issuer redemption date.
Fair value hierarchy
–
Granular and liquid pricing information is generally not available for ARS. As a result, these securities are
classified as Level 3.
Equity instruments
Valuation
–
Listed equity instruments are generally valued using prices obtained directly from the market.
–
Unlisted equity holdings, including private equity positions, are initially marked at their transaction price
and are revalued when reliable evidence of price movement becomes available or when the position is
deemed to be impaired.
Fair value hierarchy
–
The majority of equity securities are actively traded on public stock exchanges where quoted prices are
readily and regularly available, resulting in Level 1 classification.
Financial assets for
unit-linked
investment
contracts
Valuation
–
The majority of assets are listed on exchanges and fair values are determined using quoted prices.
Fair value hierarchy
–
Most assets are classified as Level 1 if actively traded, or Level 2 if trading is not active.
–
Instruments for which prices are not readily available are classified as Level 3.
Securities financing
transactions
Valuation
–
These instruments are valued using discounted expected cash flow techniques. The discount rate applied
is based on funding curves that are relevant to the collateral eligibility terms.
Fair value hierarchy
–
Collateral funding curves for these instruments are generally observable and, as a result, these positions
are classified as Level 2.
–
Where the collateral terms are non-standard, the funding curve may be considered unobservable and these
positions are classified as Level 3.
Brokerage
receivables and
payables
Valuation
–
Fair value is determined based on the value of the underlying balances.
Fair value hierarchy
–
Due to their on-demand nature, these receivables and payables are deemed as Level 2.
Amounts due under
unit-linked
investment
contracts
Valuation
–
The fair values of investment contract liabilities are determined by reference to the fair value of the
corresponding assets.
Fair value hierarchy
–
The liabilities themselves are not actively traded, but are mainly referenced to instruments that are actively
traded and are therefore classified as Level 2.
353
Note 21 Fair value measurement (continued)
Derivative instruments: valuation and classification in the
fair value hierarchy
The curves used for discounting expected cash flows in the
valuation of collateralized derivatives reflect the funding terms
associated with the relevant collateral arrangement for the
instrument being valued. These collateral arrangements differ
across counterparties with respect to the eligible currency and
interest terms of the collateral. The majority of collateralized
derivatives are measured using a discount curve based on funding
rates derived from overnight interest in the cheapest eligible
currency for the respective counterparty collateral agreement.
Uncollateralized and partially collateralized derivatives are
discounted using the alternative reference rate (the ARR) (or
equivalent) curve for the currency of the instrument. As described
in Note
2
1
d
,
the fair value of uncollateralized and partially
collateralized derivatives is then adjusted by credit valuation
adjustments (
CVA
s)
,
debit valuation adjustments (
DVA
s)
and
funding valuation adjustments (FVAs), as applicable, to reflect an
estimation of the effect of counterparty credit risk, UBS’s own
credit risk, and funding costs and benefits.
›
Refer to Note 10 for more information about derivative
instruments
Derivative product
Valuation and classification in the fair value hierarchy
Interest rate
contracts
Valuation
–
Interest rate swap contracts are valued by estimating future interest cash flows and discounting those cash
flows using a rate that reflects the appropriate funding rate for the position being measured. The yield
curves used to estimate future index levels and discount rates are generated using market-standard yield
curve models using interest rates associated with current market activity. The key inputs to the models are
interest rate swap rates, forward rate agreement rates, short-term interest rate futures prices, basis swap
spreads and inflation swap rates.
–
Interest rate option contracts are valued using various market-standard option models, using inputs that
include interest rate yield curves, inflation curves, volatilities and correlations.
–
When the maturity of an interest rate swap or option contract exceeds the term for which standard market
quotes are observable for a significant input parameter, the contracts are valued by extrapolation from the
last observable point using standard assumptions or by reference to another observable comparable input
parameter to represent a suitable proxy for that portion of the term.
Fair value hierarchy
–
The majority of interest rate swaps are classified as Level 2, as the standard market contracts that form the
inputs for yield curve models are generally traded in active and observable markets.
–
Options are generally treated as Level 2, as the calibration process enables the model output to be validated
to active-market levels. Models calibrated in this way are then used to revalue the portfolio of both standard
options and more exotic products.
–
Interest rate swap or option contracts are classified as Level 3 when the terms exceed standard market-
observable quotes.
–
Exotic options for which appropriate volatility or correlation input levels cannot be implied from observable
market data are classified as Level 3.
Credit derivative
contracts
Valuation
–
Credit derivative contracts are valued using industry-standard models based primarily on market credit
spreads, upfront pricing points and implied recovery rates. Where a derivative credit spread is not directly
available, it may be derived from the price of the reference cash bond.
–
Asset-backed credit derivatives are valued using a valuation technique similar to that of the underlying
security with an adjustment to reflect the funding differences between cash and synthetic form.
Fair value hierarchy
–
Single-entity and portfolio credit derivative contracts are classified as Level 2 when credit spreads and
recovery rates are determined from actively traded observable market data. Where the underlying reference
name(s) are not actively traded and the correlation cannot be directly mapped to actively traded tranche
instruments, these contracts are classified as Level 3.
–
Asset-backed credit derivatives follow the characteristics of the underlying security and are therefore
distributed across Level 2 and Level 3.
Consolidated financial statements | UBS Group AG consolidated financial statements
354
Note 21 Fair value measurement (continued)
Derivative product
Valuation and classification in the fair value hierarchy
Foreign exchange
contracts
Valuation
–
Open spot foreign exchange (FX) contracts are valued using the FX spot rate observed in the market.
–
Forward FX contracts are valued using the FX spot rate adjusted for forward pricing points observed from
standard market-based sources.
–
Over-the-counter (OTC) FX option contracts are valued using market-standard option valuation models.
The models used for shorter-dated options (i.e., maturities of five years or less) tend to be different than
those used for longer-dated options because the models needed for longer-dated OTC FX contracts require
additional consideration of interest rate and FX rate interdependency.
–
The valuation for multi-dimensional FX options uses a multi-local volatility model, which is calibrated to the
observed FX volatilities for all relevant FX pairs.
Fair value hierarchy
–
The markets for FX spot and FX forward pricing points are both actively traded and observable and
therefore such FX contracts are generally classified as Level 2.
–
A significant proportion of OTC FX option contracts are classified as Level 2 as inputs are derived mostly
from standard market contracts traded in active and observable markets.
–
OTC FX option contracts classified as Level 3 include multi-dimensional FX options and long-dated FX exotic
option contracts where there is no active market from which to derive volatility or correlation inputs.
Equity / index
contracts
Valuation
–
Equity forward contracts have a single stock or index underlying and are valued using market-standard
models. The key inputs to the models are stock prices, estimated dividend rates and equity funding rates
(which are implied from prices of forward contracts observed in the market). Estimated cash flows are then
discounted using market-standard discounted cash flow models using a rate that reflects the appropriate
funding rate for that portion of the portfolio. When no market data is available for the instrument maturity,
they are valued by extrapolation of available data, use of historical dividend data, or use of data for a
related equity.
–
Equity option contracts are valued using market-standard models that estimate the equity forward level as
described for equity forward contracts and incorporate inputs for stock volatility and for correlation
between stocks within a basket. The probability-weighted expected option payoff generated is then
discounted using market-standard discounted cash flow models applying a rate that reflects the
appropriate funding rate for that portion of the portfolio. When volatility, forward or correlation inputs are
not available, they are valued using extrapolation of available data, historical dividend, correlation or
volatility data, or the equivalent data for a related equity.
Fair value hierarchy
–
As inputs are derived mostly from standard market contracts traded in active and observable markets, a
significant proportion of equity forward contracts are classified as Level 2.
–
Equity option positions for which inputs are derived from standard market contracts traded in active and
observable markets are also classified as Level 2. Level 3 positions are those for which volatility, forward or
correlation inputs are not observable.
Commodity
contracts
Valuation
–
Commodity forward and swap contracts are measured using market-standard models that use market
forward levels on standard instruments.
–
Commodity option contracts are measured using market-standard option models that estimate the
commodity forward level as described for commodity forward and swap contracts, incorporating inputs
for the volatility of the underlying index or commodity. For commodity options on baskets of commodities
or bespoke commodity indices, the valuation technique also incorporates inputs for the correlation
between different commodities or commodity indices.
Fair value hierarchy
–
Individual commodity contracts are typically classified as Level 2, because active forward and volatility
market data is available.
355
Note 21 Fair value measurement (continued)
d) Valuation adjustments and other items
The output of a valuation technique is always an estimate of a fair
value that cannot be measured with complete certainty. As a
result, valuations are adjusted, where appropriate and when such
factors would be considered by market participants in estimating
fair value, to reflect close-out costs, credit exposure, model-driven
valuation uncertainty, funding costs and benefits, trading
restrictions and other factors.
The table below summarizes the valuation adjustment reserves
recognized on the balance sheet. Details about each category are
provided further below.
Valuation adjustment reserves on the balance sheet
As of
Life-to-date gain / (loss), USD million
31.12.21
31.12.20
31.12.19
Deferred day-1 profit or loss reserves
418
269
146
Own credit adjustments on financial liabilities designated at fair value
(315)
(381)
(88)
CVAs, FVAs, DVAs and other valuation adjustments
(1,004)
(959)
(706)
Deferred day-1 profit or loss reserves
For new transactions where the valuation technique used to
measure fair value requires significant inputs that are not based
on observable market data, the financial instrument is initially
recognized at the transaction price. The transaction price may
differ from the fair value obtained using a valuation technique,
where any such difference is deferred and not initially recognized
in the income statement.
Deferred day-1 profit or loss is generally released into
Other
net income from financial instruments measured at fair value
through profit or loss
underlying parameters become
s
observable or when the
transaction is closed out.
The table below summarizes the changes in deferred day-1
profit or loss reserves during the respective period.
Deferred day-1 profit or loss reserves
USD million
2021
2020
2019
Reserve balance at the beginning of the year
269
146
255
Profit / (loss) deferred on new transactions
459
362
171
(Profit) / loss recognized in the income statement
(308)
(238)
(278)
Foreign currency translation
(2)
0
(2)
Reserve balance at the end of the year
418
269
146
Own credit
Own credit risk is reflected in the valuation of UBS’s fair value
option liabilities where this component is considered relevant for
valuation purposes by UBS’s counterparties and other market
participants.
Changes in the fair value of financial liabilities designated at
fair value through profit or loss related to own credit are
recognized in
Other comprehensive income
directly within
Retained earnings,
with no reclassification to the income
statement in future periods. This presentation does not create or
increase an accounting mismatch in the income statement, as the
Group does not hedge changes in own credit.
Own credit is estimated using own credit adjustment (OCA)
curves, which incorporate observable market data, including
market-observed secondary prices for UBS’s debt, UBS’s credit
default swap spreads and debt curves of peers. In the table below,
the change in unrealized own credit consists of changes in fair
value that are attributable to the change in UBS’s credit spreads,
as well as the effect of changes in fair values attributable to factors
other than credit spreads, such as redemptions, effects from time
decay and changes in interest and other market rates. Realized
own credit is recognized when an instrument with an associated
unrealized OCA is repurchased prior to the contractual maturity
date. Life-to-date amounts reflect the cumulative unrealized
change since initial recognition.
›
Refer to Note 16 for more information about debt issued
designated at fair value
Consolidated financial statements | UBS Group AG consolidated financial statements
356
Note 21 Fair value measurement (continued)
Own credit adjustments on financial liabilities designated at fair value
Included in Other comprehensive income
For the year ended
USD million
31.12.21
31.12.20
31.12.19
Recognized during the period:
Realized gain / (loss)
(14)
2
8
Unrealized gain / (loss)
60
(295)
(408)
Total gain / (loss), before tax
46
(293)
(400)
As of
USD million
31.12.21
31.12.20
31.12.19
Recognized on the balance sheet as of the end of the period:
Unrealized life-to-date gain / (loss)
(315)
(381)
(88)
Credit valuation adjustments
In order to measure the fair value of OTC derivative instruments,
including funded derivative instruments that are classified as
Financial assets at fair value not held for trading,
to reflect the credit risk of the counterparty inherent in these
instruments. This amount represents the estimated fair value of
protection required to hedge the counterparty credit risk of such
instruments. A CVA is determined for each counterparty,
considering all exposures with that counterparty, and is
dependent on the expected future value of exposures, default
probabilities and recovery rates, applicable collateral or netting
arrangements, break clauses, funding spreads
,
and other
contractual factors.
Funding valuation adjustments
FVAs reflect the costs and benefits of funding associated with
uncollateralized and partially collateralized derivative receivables
and payables and are calculated as the valuation effect from
moving the discounting of the uncollateralized derivative cash
flows from the ARR to OCA using the CVA framework, including
the probability of counterparty default. An FVA is also applied to
collateralized derivative assets in cases where the collateral cannot
be sold or repledged.
Debit valuation adjustments
A DVA is estimated to incorporate own credit in the valuation of
derivatives where an FVA is not already recognized. The DVA
calculation is effectively consistent with the CVA framework,
being determined for each counterparty, considering all
exposures with that counterparty and taking into account
collateral netting agreements, expected future mark-to-market
movements and UBS’s credit default spreads.
Other valuation adjustments
Instruments that are measured as part of a portfolio of combined
long and short positions are valued at mid-market levels to ensure
consistent valuation of the long- and short-component risks. A
liquidity valuation adjustment is then made to the overall net long
or short exposure to move the fair value to bid or offer as
appropriate, reflecting current levels of market liquidity. The bid–
offer spreads used in the calculation of this valuation adjustment
are obtained from market transactions and other relevant sources
and are updated periodically.
Uncertainties associated with the use
of model
-
based
valuations are incorporated into the measurement of fair value
through the use of model reserves. These reserves reflect the
amounts that the Group estimates should be deducted from
valuations produced directly by models to incorporate
uncertainties in the relevant modeling assumptions, in the model
and market inputs used, or in the calibration of the model output
to adjust for known model deficiencies. In arriving at these
estimates, the Group considers a range of market practices,
including how it believes market participants would assess these
uncertainties. Model reserves are reassessed periodically in light of
data from market transactions, consensus pricing services and
other relevant sources.
Other items
In the first half of 2021, UBS incurred a loss of USD
861
a result of closing out a significant portfolio of swaps with a
US-based client of its prime brokerage business and the
unwinding of related hedges, following the client’s default. This
loss is presented within
Other net income from financial
instruments measured at fair value through profit or loss
.
Valuation adjustments on financial instruments
As of
Life-to-date gain / (loss), USD million
31.12.21
31.12.20
Credit valuation adjustments
1
(44)
(66)
Funding valuation adjustments
(49)
(73)
Debit valuation adjustments
2
0
Other valuation adjustments
(913)
(820)
of which: liquidity
(341)
(340)
of which: model uncertainty
(571)
(479)
1 Amounts do not include reserves against defaulted counterparties.
357
Note 21 Fair value measurement (continued)
e) Transfers between Level 1 and Level 2
Assets and liabilities transferred from Level 2 to Level 1 during 2021 were not material. Assets and liabilities transferred from Level 1
to Level 2 during 2021 were also not material.
f) Level 3 instruments: valuation techniques and inputs
The table below presents material Level 3 assets and liabilities,
together with the valuation techniques used to measure fair
value, the inputs used in a given valuation technique that are
considered significant as of 31 December 2021 and unobservable,
and a range of values for those unobservable inputs.
The range of values represents the highest- and lowest-level
inputs used in the valuation techniques. Therefore, the range does
not reflect the level of uncertainty regarding a particular input or
an assessment of the reasonableness of the Group’s estimates and
assumptions, but rather the different underlying characteristics of
the relevant assets and liabilities held by the Group. The ranges
will therefore vary from period to period and parameter to
parameter based on characteristics of the instruments held at
each balance sheet date. Furthermore, the ranges of unobservable
inputs may differ across other financial institutions, reflecting the
diversity of the products in each firm’s inventory.
Valuation techniques and inputs used in the fair value measurement of Level 3 assets and liabilities
Fair value
Significant
unobservable
input(s)
1
Range of inputs
Assets
Liabilities
Valuation
technique(s)
31.12.21
31.12.20
USD billion
31.12.21
31.12.20
31.12.21
31.12.20
low
high
weighted
average
2
low
high
weighted
average
2
unit
1
Financial assets and liabilities at fair value held for trading and Financial assets at fair value not held for trading
Corporate and municipal
bonds
0.9
1.2
0.0
0.0
Relative value to
market comparable
Bond price equivalent
16
143
98
1
143
100
points
Discounted expected
cash flows
Discount margin
434
434
268
268
basis
points
Traded loans, loans
measured at fair value,
loan commitments and
guarantees
2.8
2.4
0.0
0.0
Relative value to
market comparable
Loan price equivalent
0
101
99
0
101
99
points
Discounted expected
cash flows
Credit spread
175
800
436
190
800
398
basis
points
Market comparable
and securitization
model
Credit spread
28
1,544
241
40
1,858
333
basis
points
Auction rate securities
1.6
1.5
Discounted expected
cash flows
Credit spread
115
197
153
100
188
140
basis
points
Investment fund units
3
0.1
0.1
0.0
0.0
Relative value to
market comparable
Net asset value
Equity instruments
3
0.8
0.7
0.1
0.0
Relative value to
market comparable
Price
Debt issued designated at
fair value
4
14.2
11.0
Other financial liabilities
designated at fair value
0.8
0.7
Discounted expected
cash flows
Funding spread
24
175
42
175
basis
points
Derivative financial instruments
Interest rate contracts
0.5
0.5
0.3
0.5
Option model
Volatility of interest
rates
65
81
29
69
basis
points
Credit derivative contracts
0.2
0.3
0.3
0.5
Discounted expected
cash flows
Credit spreads
1
583
1
489
basis
points
Bond price equivalent
2
136
0
100
points
Equity / index contracts
0.4
0.9
1.5
2.3
Option model
Equity dividend yields
0
11
0
13
%
Volatility of equity
stocks, equity and
other indices
4
98
4
100
%
Equity-to-FX
correlation
(29)
76
(34)
65
%
Equity-to-equity
correlation
(25)
100
(16)
100
%
1 The ranges of significant unobservable inputs are represented in points, percentages and basis points. Points are a percentage of par (e.g., 100 points would be 100% of par). 2 Weighted averages are provided
for most non-derivative financial instruments and were calculated by weighting inputs based on the fair values of the respective instruments. Weighted averages are not provided for inputs related to Other financial
liabilities designated at fair value and Derivative financial instruments, as this would not be meaningful. 3 The range of inputs is not disclosed, as there is a dispersion of values given the diverse nature of the
investments. 4 Debt issued designated at fair value primarily consists of UBS structured notes, which include variable maturity notes with various equity and foreign exchange underlying risks, rates-linked and credit-
linked notes, all of which have embedded derivative parameters that are considered to be unobservable. The equivalent derivative instrument parameters are presented in the respective derivative financial instruments
lines in this table.
Consolidated financial statements | UBS Group AG consolidated financial statements
358
Note 21 Fair value measurement (continued)
Significant unobservable inputs in Level 3 positions
This section discusses the significant unobservable inputs used in the valuation of Level 3 instruments and assesses the potential effect
that a change in each unobservable input in isolation may have on a fair value measurement. Relationships between observable and
unobservable inputs have not been included in the summary below.
Input
Description
Bond price equivalent
–
Where market prices are not available for a bond, fair value is measured by comparison with observable pricing data from
similar instruments. Factors considered when selecting comparable instruments include credit quality, maturity and industry of
the issuer. Fair value may be measured either by a direct price comparison or by conversion of an instrument price into a yield
(either as an outright yield or as a spread to the relevant benchmark rate).
–
For corporate and municipal bonds, the range represents the range of prices from reference issuances used in determining fair
value. Bonds priced at 0 are distressed to the point that no recovery is expected, while prices significantly in excess of 100 or
par relate to inflation-linked or structured issuances that pay a coupon in excess of the market benchmark as of the
measurement date.
–
For credit derivatives, the bond price range represents the range of prices used for reference instruments, which are typically
converted to an equivalent yield or credit spread as part of the valuation process.
Loan price equivalent
–
Where market prices are not available for a traded loan, fair value is measured by comparison with observable pricing data for
similar instruments. Factors considered when selecting comparable instruments include industry segment, collateral quality,
maturity and issuer-specific covenants. Fair value may be measured either by a direct price comparison or by conversion of an
instrument price into a yield. The range represents the range of prices derived from reference issuances of a similar credit quality
used to measure fair value for loans classified as Level 3. Loans priced at 0 are distressed to the point that no recovery is
expected, while a current price of 100 represents a loan that is expected to be repaid in full.
Credit spread
–
Valuation models for many credit derivatives require an input for the credit spread, which is a reflection of the credit quality of
the associated referenced underlying. The credit spread of a particular security is quoted in relation to the yield on a benchmark
security or reference rate, typically either US Treasury or ARR, and is generally expressed in terms of basis points. An increase /
(decrease) in credit spread will increase / (decrease) the value of credit protection offered by credit default swaps and other
credit derivative products. The income statement effect from such changes depends on the nature and direction of the positions
held. Credit spreads may be negative where the asset is more creditworthy than the benchmark against which the spread is
calculated. A wider credit spread represents decreasing creditworthiness. The range represents a diverse set of underlyings,
with the lower end of the range representing credits of the highest quality and the upper end of the range representing greater
levels of credit risk.
Discount margin
–
The discount margin (DM) spread represents the discount rates applied to present value cash flows of an asset to reflect the
market return required for uncertainty in the estimated cash flows. DM spreads are a rate or rates applied on top of a floating
index (e.g., Secured Overnight Financing Rate (SOFR)) to discount expected cash flows. Generally, a decrease / (increase) in the
DM in isolation would result in a higher / (lower) fair value.
–
The high end of the range relates to securities that are priced low within the market relative to the expected cash flow schedule.
This indicates that the market is pricing an increased risk of credit loss into the security that is greater than what is being
captured by the expected cash flow generation process. The low e nds of the ranges are typical of funding rates on better-
quality instruments.
Funding spread
–
Structured financing transactions are valued using synthetic funding curves that best represent the assets that are pledged as
collateral for the transactions. They are not representative of where UBS can fund itself on an unsecured basis, but provide an
estimate of where UBS can source and deploy secured funding with counterparties for a given type of collateral. The funding
spreads are expressed in terms of basis points, and if funding spreads widen, this increases the effect of discounting.
–
A small proportion of structured debt instruments and non-structured fixed-rate bonds within financial liabilities designated at
fair value had an exposure to funding spreads that was longer in duration than the actively traded market.
Volatility
–
Volatility measures the variability of future prices for a particular instrument and is generally expressed as a percentage, where
a higher number reflects a more volatile instrument, for which future price movements are more likely to occur. Volatility is a
key input into option models, where it is used to derive a probability-based distribution of future prices for the underlying
instrument. The effect of volatility on individual positions within the portfolio is driven primarily by whether the option contract
is a long or short position. In most cases, the fair value of an option increases as a result of an increase in volatility and is
reduced by a decrease in volatility. Generally, volatility used in the measurement of fair value is derived from active-market
option prices (referred to as implied volatility). A key feature of implied volatility is the volatility “smile” or “skew,” which
represents the effect of pricing options of different option strikes at different implied volatility levels.
–
Volatilities of low interest rates tend to be much higher than volatilities of high interest rates. In addition, different currencies
may have significantly different implied volatilities.
359
Note 21 Fair value measurement (continued)
Input
Description
Correlation
–
Correlation measures the interrelationship between the movements of two variables. It is expressed as a percentage between
–100% and +100%, where +100% represents perfectly correlated variables (meaning a movement of one variable is associated
with a movement of the other variable in the same direction) and –100% implies that the variables are inversely correlated
(meaning a movement of one variable is associated with a movement of the other variable in the opposite direction). The effect
of correlation on the measurement of fair value depends on the specific terms of the instruments being valued, reflecting the
range of different payoff features within such instruments.
–
Equity-to-FX correlation is important for equity options based on a currency other than the currency of the underlying stock.
Equity-to-equity correlation is particularly important for complex options that incorporate, in some manner, different equities
in the projected payoff.
Equity dividend yields
–
The derivation of a forward price for an individual stock or index is important for measuring fair value for forward or swap
contracts and for measuring fair value using option pricing models. The relationship between the current stock price and the
forward price is based on a combination of expected future dividend levels and payment timings, and, to a lesser extent, the
relevant funding rates applicable to the stock in question. Dividend yields are generally expressed as an annualized percentage
of the share price, with the lowest limit of 0% representing a stock that is not expected to pay any dividend. The dividend yield
and timing represent the most significant parameter in determining fair value for instruments that are sensitive to an equity
forward price.
g) Level 3 instruments: sensitivity to changes in unobservable input assumptions
The table below summarizes those financial assets and liabilities
classified as Level 3 for which a change in one or more of the
unobservable inputs to reflect reasonably possible favorable and
unfavorable alternative assumptions would change fair value
significantly, and the estimated effect thereof. The table below
does not represent the
estimated effect of stress scenarios.
Interdependencies between Level 1, 2 and 3 parameters have not
been incorporated in the table. Furthermore, direct inter-
relationships between the Level 3 parameters discussed below are
not a significant element of the valuation uncertainty.
Sensitivity data is estimated using a number of techniques,
including the estimation of price dispersion among different
market participants, variation in modeling approaches and
reasonably possible changes to assumptions used within the fair
value measurement process. The sensitivity ranges are not always
symmetrical around the fair values, as the inputs used in
valuations are not always precisely in the middle of the favorable
and unfavorable range.
Sensitivity data is determined at a product or parameter level
and then aggregated assuming no diversification benefit.
Diversification would incorporate estimated correlations across
different sensitivity results and, as such, would result in an overall
sensitivity that would be less than the sum of the individual
component sensitivities. However, the Group believes that the
diversification benefit is not significant to this analysis.
Sensitivity of fair value measurements to changes in unobservable input assumptions
1
31.12.21
31.12.20
USD million
Favorable
changes
Unfavorable
changes
Favorable
changes
Unfavorable
changes
Traded loans, loans designated at fair value, loan commitments and guarantees
19
(13)
29
(28)
Securities financing transactions
41
(53)
40
(52)
Auction rate securities
66
2
(66)
2
105
(105)
Asset-backed securities
20
(20)
41
(41)
Equity instruments
173
(146)
129
(96)
Interest rate derivative contracts, net
29
(19)
11
(16)
Credit derivative contracts, net
5
(8)
10
(14)
Foreign exchange derivative contracts, net
19
(11)
20
(15)
Equity / index derivative contracts, net
368
(335)
318
(294)
Other
50
(73)
91
(107)
Total
790
(744)
794
(768)
1 Sensitivity of issued and over-the-counter debt instruments is reported with the equivalent derivative or securities financing instrument. 2 Includes refinements applied in estimating valuation uncertainty across
various parameters and a change in assumptions regarding the underlying statistical distribution.
Consolidated financial statements | UBS Group AG consolidated financial statements
360
Note 21 Fair value measurement (continued)
h) Level 3 instruments: movements during the period
The table below presents additional information about material
movements in Level 3 assets and liabilities measured at fair value
on a recurring basis, excluding any related hedging activity.
Assets and liabilities transferred into or out of Level 3 are
presented as if those assets or liabilities had been transferred at
the beginning of the year.
Movements of Level 3 instruments
Total gains / losses
included in
comprehensive income
USD billion
Balance
as of
31 December
2019
Net gains /
losses
included in
income
1
of which:
related to
Level 3
instruments
held at the
end of the
reporting
period
Purchases
Sales
Issuances
Settlements
Transfers
into
Level 3
Transfers
out of
Level 3
Foreign
currency
translation
Balance
as of
31 December
2020
Financial assets at fair value held for
trading
1.8
(0.1)
(0.1)
0.8
(1.4)
1.0
0.0
0.3
0.0
0.0
2.3
of which:
Investment fund units
0.0
0.0
0.0
0.0
0.0
0.0
0.0
0.0
0.0
0.0
0.0
Corporate and municipal bonds
0.5
0.0
0.0
0.7
(0.5)
0.0
0.0
0.1
0.0
0.0
0.8
Loans
0.8
0.0
(0.1)
0.0
(0.7)
1.0
0.0
0.1
0.0
0.0
1.1
Other
0.4
0.0
0.0
0.1
(0.3)
0.0
0.0
0.2
0.0
0.0
0.4
Derivative financial instruments –
assets
1.3
0.3
0.4
0.0
0.0
0.7
(0.5)
0.1
(0.2)
0.1
1.8
of which:
Interest rate contracts
0.3
0.2
0.2
0.0
0.0
0.0
0.0
0.0
0.0
0.0
0.5
Equity / index contracts
0.6
0.1
0.1
0.0
0.0
0.6
(0.3)
0.0
(0.1)
0.0
0.9
Credit derivative contracts
0.4
0.0
0.0
0.0
0.0
0.1
(0.2)
0.1
0.0
0.0
0.3
Other
0.0
0.0
0.0
0.0
0.0
0.0
0.0
0.0
0.0
0.0
0.0
Financial assets at fair value not held
for trading
4.0
0.0
0.1
0.8
(0.9)
0.0
0.0
0.1
0.0
0.0
3.9
of which:
Loans
1.2
0.0
0.0
0.3
(0.7)
0.0
0.0
0.0
0.0
0.0
0.9
Auction rate securities
1.5
0.0
0.0
0.0
0.0
0.0
0.0
0.0
0.0
0.0
1.5
Equity instruments
0.5
0.0
0.0
0.1
(0.1)
0.0
0.0
0.0
0.0
0.0
0.5
Other
0.7
0.0
0.0
0.4
(0.2)
0.0
0.0
0.0
0.0
0.0
1.0
Derivative financial instruments –
liabilities
2.0
1.3
1.2
0.0
0.0
1.2
(0.9)
0.4
(0.6)
0.1
3.5
of which:
Interest rate contracts
0.1
0.3
0.3
0.0
0.0
0.3
(0.2)
0.2
(0.2)
0.0
0.5
Equity / index contracts
1.3
1.0
0.8
0.0
0.0
0.8
(0.6)
0.1
(0.2)
0.0
2.3
Credit derivative contracts
0.5
0.0
0.0
0.0
0.0
0.1
(0.1)
0.1
(0.2)
0.0
0.5
Other
0.1
0.0
0.0
0.0
0.0
0.0
0.0
0.0
0.0
0.0
0.1
Debt issued designated at fair value
9.9
0.2
0.0
0.0
0.0
7.6
(5.7)
0.5
(1.7)
0.2
11.0
Other financial liabilities designated
at fair value
0.8
0.1
0.1
0.0
0.0
0.3
(0.5)
0.0
0.0
0.0
0.7
1 Net gains / losses included in comprehensive income are composed of Net interest income, Other net income from financial instruments measured at fair value through profit or loss and Other income. 2 Total
Level 3 assets as of 31 December 2021 were USD
7.6
8.3
17.4
15.2
361
Note 21 Fair value measurement (continued)
Total gains / losses
included in
comprehensive income
Balance
as of
31 December
2020
2
Net gains /
losses
included in
income
1
of which:
related to
Level 3
instruments
held at the
end of the
reporting
period
Purchases
Sales
Issuances
Settlements
Transfers
into
Level 3
Transfers
out of
Level 3
Foreign
currency
translation
Balance
as of
31 December
2021
2
2.3
0.0
(0.1)
0.3
(1.6)
1.2
0.0
0.3
(0.3)
0.0
2.3
0.0
0.0
0.0
0.0
0.0
0.0
0.0
0.0
0.0
0.0
0.0
0.8
0.0
0.0
0.2
(0.4)
0.0
0.0
0.0
(0.1)
0.0
0.6
1.1
0.0
0.0
0.0
(0.8)
1.2
0.0
0.0
(0.2)
0.0
1.4
0.4
0.0
0.0
0.1
(0.4)
0.0
0.0
0.3
0.0
0.0
0.3
1.8
(0.2)
(0.1)
0.0
0.0
0.5
(0.7)
0.1
(0.3)
0.0
1.1
0.5
0.1
0.1
0.0
0.0
0.1
(0.2)
0.0
(0.1)
0.0
0.5
0.9
(0.1)
(0.1)
0.0
0.0
0.3
(0.4)
0.0
(0.2)
0.0
0.4
0.3
(0.1)
(0.1)
0.0
0.0
0.0
(0.1)
0.0
0.0
0.0
0.2
0.0
0.0
0.0
0.0
0.0
0.0
0.0
0.0
0.0
0.0
0.0
3.9
0.1
0.1
1.0
(0.6)
0.0
0.0
0.1
(0.3)
0.0
4.2
0.9
0.0
0.0
0.6
(0.3)
0.0
0.0
0.0
(0.3)
0.0
0.9
1.5
0.1
0.1
0.0
0.0
0.0
0.0
0.0
0.0
0.0
1.6
0.5
0.1
0.1
0.1
(0.1)
0.0
0.0
0.0
0.0
0.0
0.7
1.0
0.0
(0.1)
0.3
(0.2)
0.0
0.0
0.0
0.0
0.0
1.0
3.5
0.2
0.0
0.0
0.0
0.9
(1.8)
0.0
(0.5)
0.0
2.2
0.5
(0.1)
(0.1)
0.0
0.0
0.0
(0.1)
0.0
0.0
0.0
0.3
2.3
0.3
0.1
0.0
0.0
0.8
(1.5)
0.0
(0.4)
0.0
1.5
0.5
(0.1)
(0.1)
0.0
0.0
0.0
0.0
0.0
(0.1)
0.0
0.3
0.1
0.1
0.0
0.0
0.0
0.0
(0.1)
0.0
0.0
0.0
0.1
11.0
0.7
0.6
0.0
0.0
8.0
(4.2)
0.2
(1.2)
(0.2)
14.2
0.7
0.0
0.0
0.0
0.0
0.4
(0.2)
0.0
0.0
0.0
0.8
Consolidated financial statements | UBS Group AG consolidated financial statements
362
Note 21 Fair value measurement (continued)
i) Maximum exposure to credit risk for financial instruments measured at fair value
The tables below provide the Group’s maximum exposure to
credit risk for financial instruments measured at fair value and the
respective collateral and other credit enhancements mitigating
credit risk for these classes of financial instruments.
The maximum exposure to credit risk includes the carrying
amounts of financial instruments recognized on the balance sheet
subject to credit risk and the notional amounts for off-balance
sheet arrangements. Where information is available, collateral is
presented at fair value. For other collateral, such as real estate, a
reasonable alternative value is used. Credit enhancements, such
as credit derivative contracts and guarantees, are included at their
notional amounts. Both are capped at the maximum exposure to
credit risk for which they serve as security. The “Risk management
and control” section of this report describes management’s view
of credit risk and the related exposures, which can differ in certain
respects from the requirements of IFRS.
Maximum exposure to credit risk
31.12.21
Maximum
exposure to
credit risk
Collateral
Credit enhancements
Exposure to
credit risk
after collateral
and credit
enhancements
USD billion
Cash
collateral
received
Collateral-
ized by
securities
Secured by
real estate
Other
collateral
Netting
Credit
derivative
contracts
Guarantees
Financial assets measured at
fair value on the balance sheet
1
Financial assets at fair value
held for trading – debt instruments
2,3
22.4
22.4
Derivative financial instruments
4,5
118.1
4.2
103.2
10.7
Brokerage receivables
21.8
21.6
0.2
Financial assets at fair value not
held for trading – debt instruments
6
37.0
11.2
25.7
Total financial assets measured at fair value
199.4
0.0
37.1
0.0
0.0
103.2
0.0
0.0
59.1
Guarantees
7
0.2
0.2
0.0
31.12.20
Maximum
exposure to
credit risk
Collateral
Credit enhancements
Exposure to
credit risk
after collateral
and credit
enhancements
USD billion
Cash
collateral
received
Collateral-
ized by
securities
Secured by
real estate
Other
collateral
Netting
Credit
derivative
contracts
Guarantees
Financial assets measured at
fair value on the balance sheet
1
Financial assets at fair value
held for trading – debt instruments
2,3
24.6
24.6
Derivative financial instruments
4,5
159.6
6.0
138.4
15.2
Brokerage receivables
24.7
24.4
0.3
Financial assets at fair value not
held for trading – debt instruments
6
58.2
13.2
45.0
Total financial assets measured at fair value
267.1
0.0
43.6
0.0
0.0
138.4
0.0
0.0
85.1
Guarantees
7
0.5
0.1
0.3
0.0
1 The maximum exposure to loss is generally equal to the carrying amount and subject to change over time with market movements. 2 These positions are generally managed under the market risk framework. For
the purpose of this disclosure, collateral and credit enhancements were not considered. 3 Does not include investment fund units. 4 Includes USD
0
0
commitments and forward starting reverse repurchase agreements classified as derivatives. The full contractual committed amount of forward starting reverse repurchase agreements (generally highly collateralized) of
USD
27.8
21.9
8.2
0.8
9.4
billion, of which USD
0.8
balance sheet. Refer to Note 22 for more information. 6 Financial assets at fair value not held for trading collateralized by securities consisted of structured loans and reverse repurchase and securities borrowing
agreements. 7 The amount shown in the “Guarantees” column largely relates to sub-participations.
363
Note 21 Fair value measurement (continued)
j) Financial instruments not measured at fair value
The table below provides the estimated fair values of financial instruments not measured at fair value.
Financial instruments not measured at fair value
31.12.21
31.12.20
Carrying
amount
Fair value
Carrying
amount
Fair value
USD billion
Total
Carrying
amount
approximates
fair value
1
Level 1
Level 2
Level 3
Total
Total
Carrying
amount
approximates
fair value
1
Level 1
Level 2
Level 3
Total
Assets
2
Cash and balances at central banks
192.8
192.7
0.1
0.0
0.0
192.8
158.2
158.1
0.1
0.0
0.0
158.2
Loans and advances to banks
15.5
14.8
0.0
0.7
0.0
15.5
15.4
14.7
0.0
0.6
0.1
15.4
Receivables from securities financing
transactions
75.0
71.6
0.0
1.3
2.1
75.0
74.2
64.9
0.0
7.6
1.7
74.2
Cash collateral receivables on derivative
instruments
30.5
30.5
0.0
0.0
0.0
30.5
32.7
32.7
0.0
0.0
0.0
32.7
Loans and advances to customers
397.8
163.1
0.0
43.8
190.1
396.9
379.5
172.0
0.0
34.2
174.6
380.8
Other financial assets measured at amortized
cost
26.2
4.1
9.3
10.7
2.4
26.5
27.2
5.3
9.4
10.9
2.3
28.0
Liabilities
2
Amounts due to banks
13.1
9.1
0.0
4.0
0.0
13.1
11.0
8.5
0.0
2.6
0.0
11.0
Payables from securities financing
transactions
5.5
4.1
0.0
1.5
0.0
5.5
6.3
6.0
0.0
0.3
0.0
6.3
Cash collateral payables on derivative
instruments
31.8
31.8
0.0
0.0
0.0
31.8
37.3
37.3
0.0
0.0
0.0
37.3
Customer deposits
542.0
535.4
0.0
6.6
0.0
542.0
524.6
519.4
0.0
5.3
0.0
524.7
Debt issued measured at amortized cost
139.2
15.8
0.0
125.3
0.0
141.1
139.2
16.4
0.0
125.5
0.0
141.9
Other financial liabilities measured at
amortized cost
3
5.4
5.4
0.0
0.0
0.0
5.4
5.8
5.7
0.0
0.0
0.1
5.8
1 Includes certain financial instruments where the carrying amount is a reasonable approximation of the fair value due to the instruments’ short-term nature (instruments that are receivable or payable on demand, or
with a remaining maturity (excluding the effects of callable features) of three months or less). 2 As of 31 December 2021, USD
0
0
USD
0
0
1
1
175
2020: USD
163
19
20
1
0
of Amounts due to banks, USD
3
2
84
82
3
(31 December 2020: USD
3
The fair values included in the table above have been calculated
for
disclosure purposes only. The valuation techniques and
assumptions described below relate only to the fair value of UBS’s
financial instruments not measured at fair value. Other institutions
may use different methods and assumptions for their fair value
estimations, and therefore such fair value disclosures cannot
necessarily be compared from one financial institution to another.
The following principles were applied when determining fair value
estimates for financial instruments not measured at fair value:
–
For financial instruments with remaining maturities greater
than three months, the fair value was determined from quoted
market prices, if available.
–
Where quoted market prices were not available, the fair values
were estimated by discounting contractual cash flows using
current market interest rates or appropriate yield curves for
instruments with similar credit risk and maturity. These
estimates generally include adjustments for counterparty credit
risk or UBS’s own credit.
–
For short-term financial instruments with remaining maturities
of three months or less, the carrying amount, which is net of
credit loss allowances, is generally considered a reasonable
estimate of fair value.
Consolidated financial statements | UBS Group AG consolidated financial statements
364
Note 22 Offsetting financial assets and financial liabilities
UBS enters into netting agreements with counterparties to
manage the credit risks associated primarily with repurchase and
reverse repurchase transactions, securities borrowing and lending,
over-the-counter derivatives, and exchange-traded derivatives.
These netting agreements and similar arrangements generally
enable the counterparties to set off liabilities against available
assets received in the ordinary course of business and / or in the
event that the counterparties to the transaction are unable to
fulfill their contractual obligations.
The tables on this page and the next page provide a summary
of financial assets and financial liabilities subject to offsetting,
enforceable master netting arrangements and similar agreements,
as well as financial collateral received or pledged to mitigate credit
exposures for these financial instruments.
The Group engages in a variety of counterparty credit risk
mitigation strategies in addition to netting and collateral
arrangements. Therefore the net amounts presented in the tables
on this page and the next page do not purport to represent their
actual credit risk exposure.
Financial assets subject to offsetting, enforceable master netting arrangements and similar agreements
Assets subject to netting arrangements
Netting recognized on the balance sheet
Netting potential not recognized on
the balance sheet
3
Assets not
subject to netting
arrangements
4
Total assets
As of 31.12.21, USD billion
Gross assets
before netting
Netting with
gross liabilities
2
Net assets
recognized
on the
balance
sheet
Financial
liabilities
Collateral
received
Assets after
consideration
of
netting
potential
Assets
recognized
on the
balance
sheet
Total assets
after
consideration
of netting
potential
Total assets
recognized
on the
balance
sheet
Receivables from securities
financing transactions
67.7
(13.8)
53.9
(2.9)
(51.0)
0.0
21.1
21.1
75.0
Derivative financial instruments
116.0
(3.6)
112.4
(88.9)
(18.5)
5.0
5.7
10.7
118.1
Cash collateral receivables on
derivative instruments
1
29.4
0.0
29.4
(15.2)
(3.3)
11.0
1.1
12.1
30.5
Financial assets at fair value
not held for trading
93.1
(87.6)
5.5
(1.1)
(4.4)
0.0
54.6
54.6
60.1
of which: reverse
repurchase agreements
93.1
(87.6)
5.5
(1.1)
(4.4)
0.0
0.3
0.3
5.8
Total assets
306.2
(105.0)
201.2
(108.1)
(77.2)
15.9
82.6
98.5
283.7
As of 31.12.20, USD billion
Receivables from securities
financing transactions
70.3
(13.4)
57.0
(1.7)
(55.3)
0.0
17.3
17.3
74.2
Derivative financial instruments
156.9
(5.0)
151.9
(117.2)
(27.2)
7.5
7.7
15.2
159.6
Cash collateral receivables on
derivative instruments
1
31.9
0.0
31.9
(19.6)
(1.5)
10.8
0.8
11.6
32.7
Financial assets at fair value
not held for trading
85.6
(79.1)
6.5
(0.8)
(5.8)
0.0
73.9
73.9
80.4
of which: reverse
repurchase agreements
85.6
(79.1)
6.5
(0.8)
(5.8)
0.0
0.2
0.2
6.7
Total assets
344.8
(97.5)
247.3
(139.3)
(89.8)
18.3
99.7
117.9
346.9
1 The net amount of Cash collateral receivables on derivative instruments recognized on the balance sheet includes certain OTC derivatives that are net settled on a daily basis either legally or in substance under
directly to the amounts presented in the “Netting with gross assets” column in the liabilities table presented on the following page. Netting in this column for reverse repurchase agreements presented within the lines
“Receivables from securities financing transactions” and “Financial assets at fair value not held for trading” taken together corresponds to the amounts presented for repurchase agreements in the “Payables from
securities financing transactions” and “Other financial liabilities designated at fair value” lines in the liabilities table presented on the following page. 3 For the purpose of this disclosure, the amounts of financial
instruments and cash collateral presented have been capped so as not to exceed the net amount of financial assets presented on the balance sheet; i.e., over-collateralization, where it exists, is not reflected in the
table. 4 Includes assets not subject to enforceable netting arrangements and other out-of-scope items.
365
Note 22 Offsetting financial assets and financial liabilities (continued)
Financial liabilities subject to offsetting, enforceable master netting arrangements and similar agreements
Liabilities subject to netting arrangements
Netting recognized on the balance sheet
Netting potential not recognized
on the balance sheet
3
Liabilities not
subject
to netting
arrangements
4
Total liabilities
As of 31.12.21, USD billion
Gross
liabilities
before
netting
Netting with
gross assets
2
Net
liabilities
recognized
on the
balance
sheet
Financial
assets
Collateral
pledged
Liabilities
after
consideration of
netting
potential
Liabilities
recognized
on the
balance
sheet
Total
liabilities
after
consideration
of netting
potential
Total
liabilities
recognized
on the
balance
sheet
Payables from securities
financing transactions
16.9
(12.8)
4.1
(1.8)
(2.3)
0.0
1.4
1.4
5.5
Derivative financial instruments
118.4
(3.6)
114.9
(88.9)
(18.1)
7.9
6.4
14.3
121.3
Cash collateral payables on
derivative instruments
1
30.4
0.0
30.4
(13.1)
(3.3)
14.0
1.4
15.4
31.8
Other financial liabilities
designated at fair value
94.8
(88.6)
6.2
(2.2)
(3.8)
0.2
23.9
24.1
30.1
of which: repurchase agreements
94.6
(88.6)
6.0
(2.2)
(3.8)
0.0
0.4
0.4
6.4
Total liabilities
260.6
(105.0)
155.6
(106.0)
(27.5)
22.1
33.1
55.2
188.7
As of 31.12.20, USD billion
Payables from securities
financing transactions
18.2
(13.3)
4.9
(1.6)
(3.3)
0.0
1.4
1.4
6.3
Derivative financial instruments
157.1
(5.0)
152.1
(117.2)
(23.9)
10.9
9.0
19.9
161.1
Cash collateral payables on
derivative instruments
1
35.6
0.0
35.6
(19.6)
(2.1)
13.9
1.7
15.7
37.3
Other financial liabilities
designated at fair value
87.0
(79.2)
7.8
(0.8)
(6.3)
0.7
22.6
23.3
30.4
of which: repurchase agreements
86.2
(79.2)
7.0
(0.8)
(6.3)
0.0
0.3
0.3
7.3
Total liabilities
297.8
(97.5)
200.3
(139.2)
(35.5)
25.6
34.8
60.4
235.1
1 The net amount of Cash collateral payables on derivative instruments recognized on the balance sheet includes certain OTC derivatives that are net settled on a daily basis either legally or in substance under IAS 32
principles and exchange-traded derivatives that are economically settled on a daily basis. 2 The logic of the table results in amounts presented in the “Netting with gross assets” column corresponding to the amounts
presented in the “Netting with gross liabilities” column in the assets table presented on the previous page. Netting in this column for repurchase agreements presented within the lines “Payables from securities
financing transactions” and “Other financial liabilities designated at fair value” taken together corresponds to the amounts presented for reverse repurchase agreements in the “Receivables from securities financing
transactions” and “Financial assets at fair value not held for trading” lines in the assets table presented on the previous page. 3 For the purpose of this disclosure, the amounts of financial instruments and cash
collateral presented have been capped so as not to exceed the net amount of financial liabilities presented on the balance sheet; i.e., over-collateralization, where it exists, is not reflected in the table. 4 Includes
liabilities not subject to enforceable netting arrangements and other out-of-scope items.
Consolidated financial statements | UBS Group AG consolidated financial statements
366
Note 23 Restricted and transferred financial assets
This Note provides information about restricted financial assets (Note 23a), transfers of financial assets (Note 23b and 23c) and financial
assets that are received as collateral with the right to resell or repledge these assets (Note 23d).
a) Restricted financial assets
Restricted financial assets consist of assets pledged as collateral
against an existing liability or contingent liability and other assets
that are otherwise explicitly restricted such that they cannot be
used to secure funding.
Financial assets are mainly pledged as collateral in securities
lending transactions, in repurchase transactions, against loans
from Swiss mortgage institutions and in connection with the
issuance of covered bonds. The Group generally enters into
repurchase and securities lending arrangements under standard
market agreements. For securities lending, the cash received as
collateral may be more or less than the fair value of the securities
loaned, depending on the nature of the transaction. For
repurchase agreements, the fair value of the collateral sold under
an agreement to repurchase is generally in excess of the cash
borrowed. Pledged mortgage loans serve as collateral for existing
liabilities against Swiss central mortgage institutions and for
existing covered bond issuances of USD
10,843
31 December 2021 (31 December 2020: USD
12,456
Other restricted financial assets include assets protected under
client asset segregation rules, assets held by the Group’s insurance
entities to back related liabilities to the policy holders, assets held
in certain jurisdictions to comply with explicit minimum local asset
maintenance requirements. The carrying amount of the liabilities
associated with these other restricted financial assets is generally
equal to the carrying amount of the assets, with the exception of
assets held to comply with local asset maintenance requirements,
for which the associated liabilities are greater.
Restricted financial assets
USD million
31.12.21
31.12.20
Restricted
financial assets
of which: assets
pledged as
collateral that
may be sold or
repledged by
counterparties
of which:
mortgage loans
1
Restricted
financial assets
of which: assets
pledged as
collateral that
may be sold or
repledged by
counterparties
of which:
mortgage loans
1
Financial assets pledged as collateral
Financial assets at fair value held for trading
63,725
43,397
64,367
47,098
Loans and advances to customers
18,160
16,330
20,361
18,191
Financial assets at fair value not held for trading
961
961
2,140
2,140
Debt securities classified as Other financial assets measured at amortized
cost
2,234
1,870
2,506
2,506
Financial assets measured at fair value through other comprehensive
income
0
0
149
149
Total financial assets pledged as collateral
2
85,079
89,523
Other restricted financial assets
Loans and advances to banks
3,408
3,730
Financial assets at fair value held for trading
392
741
Cash collateral receivables on derivative instruments
4,747
3,765
Loans and advances to customers
1,237
756
Financial assets at fair value not held for trading
22,765
23,243
Financial assets measured at fair value through other comprehensive
income
894
0
Other
97
110
Total other restricted financial assets
33,540
32,345
Total financial assets pledged and other restricted financial assets
118,619
121,868
1 All related to mortgage loans that serve as collateral for existing liabilities toward Swiss central mortgage institutions and for existing covered bond issuances. Of these pledged mortgage loans, approximately
USD
2.7
2.7
requirements. 2 Does not include assets placed with central banks related to undrawn credit lines and for payment, clearing and settlement purposes (31 December 2021: USD
4.4
USD
1.3
367
Note 23 Restricted and transferred financial assets (continued)
In addition to restrictions on financial assets, UBS Group AG
and its subsidiaries are, in certain cases, subject to regulatory
requirements that affect the transfer of dividends and capital
within the Group, as well as intercompany lending. Supervisory
authorities also may require entities to measure capital and
leverage ratios on a stressed basis, such as the Federal Reserve
Board
’s Comprehensive Capital Analysis and Review
process,
which may limit
the relevant subsidiaries’
ability to make
distributions of capital based on the results of those tests.
Supervisory authorities generally have discretion to impose
higher requirements or to otherwise limit the activities of
subsidiaries.
Non-regulated subsidiaries are generally not subject to such
requirements and transfer restrictions. However, restrictions can
also be the result of different legal, regulatory, contractual, entity-
or country-specific arrangements and / or requirements.
›
Refer to the “Financial and regulatory key figures for our
significant regulated subsidiaries and sub-groups” section of this
report for financial information about significant regulated
subsidiaries of the Group
b) Transferred financial assets that are not derecognized in their entirety
The table below presents information for financial assets that have been transferred but are subject to continued recognition in full,
as well as recognized liabilities associated with those transferred assets.
Transferred financial assets subject to continued recognition in full
USD million
31.12.21
31.12.20
Carrying amount
of transferred
assets
Carrying amount of
associated liabilities
recognized
on balance sheet
Carrying amount
of transferred
assets
Carrying amount of
associated liabilities
recognized
on balance sheet
Financial assets at fair value held for trading that may be sold or repledged by counterparties
43,397
17,687
47,098
18,874
relating to securities lending and repurchase agreements in exchange for cash received
17,970
17,687
19,177
18,874
relating to securities lending agreements in exchange for securities received
24,146
27,595
relating to other financial asset transfers
1,281
326
Financial assets at fair value not held for trading that may be sold or repledged by
counterparties
961
898
2,140
1,378
Debt securities classified as Other financial assets measured at amortized cost that may be
sold or repledged by counterparties
1,870
1,725
2,506
1,963
Financial assets measured at fair value through other comprehensive income that may be sold
or repledged by counterparties
0
0
149
148
Total financial assets transferred
46,227
20,311
51,893
22,363
Transactions in which financial assets are transferred, but
continue to be recognized in their entirety on UBS’s balance sheet
include securities lending and repurchase agreements , as well as
other financial asset transfers. Repurchase and securities lending
arrangements are, for the most part, conducted under standard
market agreements and are undertaken with counterparties
subject to UBS’s normal credit risk control processes.
›
Refer to Note 1a item 2e for more information about repurchase
and securities lending agreements
As of
31 December 2021
,
approximately
41
%
of the
transferred financial assets were assets
held for trading
transferred in exchange for cash, in which case the associated
recognized liability represents the amount to be repaid to
counterparties. For securities lending and repurchase agreements,
a haircut of between
0
% and
15
% is generally applied to the
transferred assets, which results in associated liabilities having a
carrying amount below the carrying amount of the transferred
assets. The counterparties to the associated liabilities presented in
the table above have full recourse to UBS.
In securities lending arrangements entered into in exchange for
the receipt of other securities as collateral, neither the securities
received nor the obligation to return them are recognized on
UBS’s balance sheet, as the risks and rewards of ownership are
not transferred to UBS. In cases where such financial assets
received are subsequently sold or repledged in another
transaction, this is not considered to be a transfer of financial
assets.
Other financial asset transfers primarily include securities
transferred to collateralize derivative transactions, for which the
carrying amount of associated liabilities is not provided in the
table above, because those replacement values are managed on
a portfolio basis across counterparties and product types, and
therefore there is no direct relationship between the specific
collateral pledged and the associated liability.
Transferred financial assets that are not subject to
derecognition in full but remain on the balance sheet to the extent
of the Group’s continuing involvement were not material as of
31 December 2021 and as of 31 December 2020.
Consolidated financial statements | UBS Group AG consolidated financial statements
368
Note 23 Restricted and transferred financial assets (continued)
c) Transferred financial assets that are derecognized in their entirety with continuing involvement
Continuing involvement in a transferred and fully derecognized
financial asset may result from contractual provisions in the
particular transfer agreement or from a separate agreement, with
the counterparty or a third party, entered into in connection with
the transfer.
The fair value and carrying amount of UBS’s continuing
involvement from transferred positions as of 31 December 2021
and 31 December 2020 was not material. Life-to-date losses
reported in prior periods primarily relate to legacy positions in
securitization vehicles which have been fully marked down, with no
remaining exposure to loss
.
d) Off-balance sheet assets received
The table below presents assets received from third parties that can be sold or repledged and that are not recognized on the balance
sheet, but that are held as collateral, including amounts that have been sold or repledged.
Off-balance sheet assets received
USD million
31.12.21
31.12.20
Fair value of assets received that can be sold or repledged
497,828
500,689
received as collateral under reverse repurchase, securities borrowing
and lending arrangements, derivative and other transactions
1
483,426
487,904
received in unsecured borrowings
14,402
12,785
Thereof sold or repledged
2
367,440
367,258
in connection with financing activities
319,176
315,603
to satisfy commitments under short sale transactions
31,688
33,595
in connection with derivative and other transactions
1
16,575
18,059
1 Includes securities received as initial margin from its clients that UBS is required to remit to central counterparties, brokers and deposit banks through its exchange-traded derivative clearing and execution services.
2 Does not include off-balance sheet securities (31 December 2021: USD
12.7
18.9
settlement purposes for which there are no associated liabilities or contingent liabilities.
��
369
Note 24 Maturity analysis of financial liabilities
The residual contractual maturities for non-derivative and non-
trading financial liabilities as of 31 December 2021 are based on
the earliest date on which UBS could be contractually required to
pay. The total amounts that contractually mature in each time
band are also shown for 31 December 2020. Derivative positions
and trading liabilities, predominantly made up of short sale
transactions, are assigned to the
Due within 1 month
,
this provides a conservative reflection of the nature of these
trading activities. The residual contractual maturities may extend
over significantly longer periods.
Maturity analysis of financial liabilities
31.12.21
USD billion
Due within
1 month
Due between
1 and 3 months
Due between
3 and 12 months
Due between
1 and 5 years
Due after
5 years
Total
Financial liabilities recognized on balance sheet
1
Amounts due to banks
6.7
2.4
3.5
0.6
13.1
Payables from securities financing transactions
3.8
0.3
1.6
0.0
5.7
Cash collateral payables on derivative instruments
31.8
31.8
Customer deposits
530.1
5.2
3.3
3.2
0.4
542.3
Debt issued measured at amortized cost
2
4.0
12.7
41.1
53.5
37.6
148.9
Other financial liabilities measured at amortized cost
4.5
0.1
0.5
1.8
1.6
8.4
0.1
0.1
0.5
1.8
1.6
4.0
Total financial liabilities measured at amortized cost
580.9
20.8
49.9
59.2
39.5
750.2
Financial liabilities at fair value held for trading
3,4
31.7
31.7
Derivative financial instruments
3,5
121.3
121.3
Brokerage payables designated at fair value
44.0
44.0
Debt issued designated at fair value
6
13.8
11.5
13.5
24.5
18.5
81.9
Other financial liabilities designated at fair value
28.1
0.4
0.5
0.4
1.1
30.5
Total financial liabilities measured at fair value through profit or loss
239.0
11.9
14.0
24.9
19.6
309.4
Total
819.8
32.7
63.9
84.1
59.1
1,059.6
Guarantees, commitments and forward starting transactions
Loan commitments
7
38.3
0.5
0.7
0.0
39.5
Guarantees
21.2
0.0
21.2
Forward starting transactions, reverse repurchase
and securities borrowing agreements
7
1.4
1.4
Total
60.9
0.5
0.7
0.0
0.0
62.1
31.12.20
USD billion
Due within
1 month
Due between
1 and 3 months
Due between
3 and 12 months
Due between
1 and 5 years
Due after
5 years
Total
Financial liabilities recognized on balance sheet
1
Amounts due to banks
6.1
2.4
2.1
0.5
0.0
11.1
Payables from securities financing transactions
5.6
0.4
0.3
0.0
0.0
6.3
Cash collateral payables on derivative instruments
37.3
37.3
Customer deposits
512.8
6.6
3.5
1.8
0.2
524.9
Debt issued measured at amortized cost
2
9.0
8.3
41.9
53.7
35.6
148.5
Other financial liabilities measured at amortized cost
4.5
0.1
0.5
2.0
1.8
8.9
0.1
0.1
0.5
2.0
1.8
4.5
Total financial liabilities measured at amortized cost
575.3
17.9
48.2
58.0
37.7
737.1
Financial liabilities at fair value held for trading
3,4
33.6
33.6
Derivative financial instruments
3,5
161.1
161.1
Brokerage payables designated at fair value
38.7
38.7
Debt issued designated at fair value
6
21.9
16.8
7.1
9.2
9.5
64.5
Other financial liabilities designated at fair value
27.9
0.6
0.6
0.7
1.1
30.9
Total financial liabilities measured at fair value through profit or loss
283.2
17.4
7.7
9.9
10.6
328.8
Total
858.5
35.3
56.0
67.9
48.3
1,065.9
Guarantees, commitments and forward starting transactions
Loan commitments
7
40.5
0.5
0.4
0.0
41.4
Guarantees
17.5
17.5
Forward starting transactions, reverse repurchase
and securities borrowing agreements
7
3.2
3.2
Total
61.3
0.5
0.4
0.0
0.0
62.2
1 Except for financial liabilities at fair value held for trading and derivative financial instruments (see footnote 3), the amounts presented generally represent undiscounted cash flows of future interest and principal
payments. 2 The time-bucket Due after 5 years includes perpetual loss-absorbing additional tier 1 capital instruments. 3 Carrying amount is fair value. Management believes that this best represents the cash flows
that would have to be paid if these positions had to be settled or closed out. 4 Contractual maturities of financial liabilities at fair value held for trading are: USD
30.8
USD
32.6
0.9
1.0
0
0
34
(31 December 2020: USD
32
full contractual committed amount of USD
36.0
31.3
by reference to the applicable interest rate prevailing as of the reporting date. Future principal payments that are variable are determined by reference to the conditions existing at the relevant reporting date. 7
Excludes derivative loan commitments and forward starting reverse repurchase agreements measured at fair value (see footnote 5).
Consolidated financial statements | UBS Group AG consolidated financial statements
370
Note 25 Interest rate benchmark reform
Background
A market-wide reform of major interest rate benchmarks is being
undertaken globally, with the Financial Conduct Authority (the
FCA) announcing in March 2021 that the publication of London
Interbank Offered Rates (LIBORs) would cease after 31 December
2021 for all non-US dollar LIBORs, as well as for one-week and
two-month USD LIBOR. Publication of the remaining USD LIBOR
tenors will cease immediately after 30 June 2023.
The majority of UBS’s IBOR exposure was linked to CHF LIBOR
and USD LIBOR. The alternative reference rate (the ARR) for CHF
LIBOR is the Swiss Average Rate Overnight (SARON). The ARR for
USD LIBOR is the Secured Overnight Financing Rate (SOFR); in
addition, there are recommended ARRs for GBP LIBOR, JPY LIBOR
and EUR LIBOR.
The Euro Interbank Offered Rate (EURIBOR) was reformed in
2019, with the reform consisting of a change in the underlying
calculation method. Consequently, contracts linked to EURIBOR
are not considered throughout the rest of this Note.
On 25 January 2021, the IBOR Fallbacks Supplement and IBOR
Fallbacks Protocol, which amend the International Swaps and
Derivatives Association (ISDA) standard definitions for interest rate
derivatives to incorporate fallbacks for derivatives linked to certain
IBORs, came into effect. From that date, all newly cleared and
non-cleared derivatives between adhering parties that reference
ISDA standard
definitions now include these fallbacks. UBS
adhered to the protocol in November 2020.
UBS’s focus throughout 2021 was on transitioning existing
contracts via bi-lateral and multi-lateral agreements, by leveraging
industry solutions
(e.
g.,
the use of fallback provisions)
and
through third-party actions (those by clearing houses, agents,
etc.). UBS has established a framework to address the transition
of contracts that do not contain adequate fallback provisions.
Furthermore, in line with regulatory guidance
,
UBS has
implemented a framework to limit new contracts referencing
IBORs.
Governance over the transition to alternative benchmark rates
UBS established a global cross-divisional, cross-functional
governance structure and change program to address the scale
and complexity of the transition. This global program is sponsored
by the Group CFO and led by senior representatives from the
business divisions and UBS’s control and support functions. The
program includes governance and execution structures within
each business division, together with cross-divisional teams from
each control and support function. During 2021, progress was
overseen centrally via a monthly operating committee and a
monthly steering committee, as well as quarterly updates to the
joint Audit and Risk Committees. A dedicated Group-wide forum,
with an increased US regional focus, will oversee progress of the
remaining USD LIBOR transition.
Risks
A
core part of UBS’s change program is the identification,
management and monitoring of the risks associated with IBOR
reform and transition. These risks include, but are not limited to,
the following:
–
economic risks to UBS and its clients, through the repricing of
existing contracts, reduced transparency and / or liquidity of
pricing information, market uncertainty or disruption;
–
accounting risks, where the transition affects the accounting
treatment, including hedge accounting and consequential
income statement volatility;
–
valuation risks arising from the variation between benchmarks
that will cease and ARRs, affecting the risk profile of financial
instruments;
–
operational risks arising from changes to UBS’s front-to-back
processes and systems to accommodate the transition, e.g.,
data sourcing and processing and bulk migration of contracts;
and
–
legal and conduct risks relating to UBS’s engagement with
clients and market counterparties around new benchmark
products and amendments required for existing contracts
referencing benchmarks that will cease.
Overall, the effort required to transition is affected by multiple
factors, including whether negotiations need to take place with
multiple stakeholders (as is the case for syndicated loans or certain
listed securities), market readiness
–
such as liquidity in ARR
-
equivalent products – and a client’s technical readiness to handle
ARR market conventions. UBS remains confident that it has the
transparency, oversight and operational preparedness to progress
with the IBOR transition consistent with market timelines, given the
significant progress made as of 31 December 2021. UBS did not
have and does not expect changes to its risk management approach
and strategy as a result of interest rate benchmark reform.
371
Note 25 Interest rate benchmark reform (continued)
Transition progress
Non-derivative instruments
UBS’s significant non-derivative exposures subject to IBOR reform
primarily related to brokerage receivable and payable balances,
corporate and private loans, and mortgages, linked to CHF and
USD LIBORs. During 2020, UBS transitioned most of its CHF
LIBOR-linked deposits to SARON. In that same year, UBS launched
SARON-based mortgages and corporate loans based on all major
ARRs in the Swiss market, as well as SOFR-based mortgages in the
US market.
Throughout 2021, UBS transitioned substantially all of its
private and corporate loans linked to non-USD IBORs, with the
remaining CHF LIBOR-linked contracts planned to transition on
their first roll date in 2022.
In addition, as of 31 December 2021 UBS had completed the
transition
of IBOR
-
linked
non
-
derivative financial assets and
liabilities related to brokerage accounts, except for balances
originated in the US, which transitioned to SOFR in January 2022.
In March 2021, following the FCA announcement regarding
the cessation timelines for IBORs,
UBS initiated a centralized
communication initiative for private mortgages linked to CHF
LIBOR, with the objective of transitioning these exposures, either
through the activation of existing fallbacks or the amendment of
contractual terms where such fallbacks do not exist. During 2021,
mortgages that were linked to CHF LIBOR
were
reduced
to
USD
21
mortgages automatically transitioning to SARON from their next
coupon roll date.
The transition of
US sec
urities
-
based lending
to SOFR
,
amounting to USD
37
the most part completed in January 2022, with US mortgages
linked to USD LIBOR planned to transition to SOFR in 2022–2023.
As of 31 December 2021, UBS had approximately USD
3
equivalent of Japanese yen- and US dollar-denominated publicly
issued benchmark bonds that, per current contractual terms, if
not called on their respective call dates, would reset based directly
on JPY LIBOR and USD LIBOR. These bonds have robust IBOR
fallback language and the confirmation of interest rate calculation
mechanics will be communicated as market standards formalize
and in advance of any rate resets. In addition, several US dollar-
and Swiss franc-denominated benchmark bonds publicly issued
by UBS reference rates indirectly derived from IBORs, if they are
not called on their respective call dates. UBS aims to transition
those bonds in advance of their reset dates, with the transition of
Swiss franc-denominated benchmark bonds completed in January
2022. These debt instruments have not been included in the table
on the following page, given their current fixed-rate coupon.
As of 31 December 2021, UBS had approximately USD
5
of irrevocable commitments that may be drawn down in different
currencies with IBOR-linked interest rates and that expire after the
relevant benchmark cessation dates; approximately USD
3
of these contracts had transitioned for all IBORs, except USD
LIBOR
,
and
USD
2
of these
commitments
retained
a
non
-
USD IBOR interest rate
as
of
31
December 2021
with
transition dependent upon the actions of other parties. To the
extent non-USD IBOR-linked amounts are requested under these
contracts, UBS will seek to renegotiate current terms or rely on
legislative solutions.
Derivative instruments
UBS holds derivatives for trading and hedging purposes, including
those designated in hedge accounting relationships. A significant
number of interest rate and cross -currency swaps have floating
legs that reference various benchmarks that are subject to IBOR
reform.
The majority of derivatives are transacted with clearing houses,
in particular LCH, with the transition of these non-USD IBOR-
linked derivatives substantially completed in December 2021. UBS
had also completed the transition of all non-USD IBOR-linked
exchange
-
traded derivatives (ETDs)
through participation in
activities organized by respective exchanges
by 31
December
2021.
For derivatives not
transacted with clearing houses or
exchanges, UBS and a significant proportion of UBS’s
counterparties have adhered to the ISDA IBOR Fallbacks Protocol,
which builds in agreed fallbacks. The majority of these contracts
had transitioned as of 31 December 2021, with a small number
of contracts transitioned in January 2022, to ensure an orderly
transition when converting high volumes of transactions at the
time of cessation.
Consolidated financial statements | UBS Group AG consolidated financial statements
372
Note 25 Interest rate benchmark reform (continued)
Financial instruments yet to transition to alternative benchmarks
The amounts included in the table below relate to financial
instrument contracts across UBS’s business divisions where UBS
has material exposures subject to IBOR reform that have not yet
transitioned to ARRs, and that:
–
contractually reference an interest rate benchmark that will
transition to an alternative benchmark; and
–
have a contractual maturity date (including open-ended
contracts) after the agreed cessation dates.
Contracts
where
penalty terms reference IBORs, or where
exposure to an IBOR is not the primary purpose of the contract,
have not been included, as these contracts do not have a material
impact on the transition process.
In line with information provided to management and external
parties monitoring UBS’s transition progress, the table below
includes the following financial metrics for instruments external
to the Group that are subject to interest rate benchmark reform:
–
gross carrying value / exposure for non-derivative financial
instruments; and
–
total trade count for derivative financial instruments.
The exposure
s
included
in the table below represent the
maximum IBOR exposure, without regard for early termination
rights, with the actual exposure being dependent upon client
preferences and investment decisions.
As of 31 December 2021, UBS had made significant progress
in transitioning LIBOR exposures to ARRs. The remaining non-USD
LIBOR-linked exposures included in the table below primarily
relate to derivatives that successfully transitioned in January 2022
and CHF LIBOR mortgages that will automatically transition to
SARON on their first roll date in 2022.
31.12.21
LIBOR benchmark rates
Measure
CHF
USD
GBP
EUR
1
JPY
Carrying value of non-derivative financial instruments
Total non-derivative financial assets
USD million
21,616
2
65,234
3
45
4
1
0
Total non-derivative financial liabilities
USD million
27
4
1,985
4
3
4
5
0
Trade count of derivative financial instruments
Total derivative financial instruments
Trade count
829
6
40,500
7
183
6
3,744
6
184
6
Off-balance sheet exposures
Total irrevocable loan commitments
USD million
0
11,863
8
0
0
0
1 Relates primarily to EUR LIBOR positions. 2 Relates primarily to CHF LIBOR mortgages, which will automatically transition to SARON on their first roll date in 2022. 3 Includes USD LIBOR securities-based lending
and brokerage accounts, amounting to USD
37
5
1
credit lines, where IBOR transition efforts are complete, except for USD LIBOR. The remainder primarily relates to US mortgages and corporate lending. 4 Relates to floating-rate notes that per their contractual terms
can reset to rates linked to LIBOR, with transition dependent upon the actions of respective issuers. 5 Relates to contracts that transitioned in January 2022. 6 Includes predominantly bilateral derivatives, which
transitioned in January 2022, and an insignificant amount of cleared derivatives, where the respective clearing houses’ organized transition happened in January 2022. 7 Includes approximately
5,000
derivatives, of which approximately
500
swaps with an ARR leg and a USD IBOR leg. 8 Includes loan commitments that can be drawn in different currencies at the client‘s discretion, of which approximately USD
3
remaining and approximately USD
2
that can be drawn in US dollars only and will transition in 2022–2023.
373
Note 26 Hedge accounting
Derivatives designated in hedge accounting relationships
The Group applies hedge accounting to interest rate risk and
foreign exchange risk, including structural foreign exchange risk
related to net investments in foreign operations.
›
Refer to “Market risk” in the “Risk management and control”
section of this report for more information about how risks arise
and how they are managed by the Group
Hedging instruments and hedged risk
Interest rate swaps are designated in fair value hedges or cash
flow hedges of interest rate risk arising solely from changes in
benchmark interest rates. Fair value changes arising from such risk
are usually the largest component of the overall change in the fair
value of the hedged position in transaction currency.
Cross-currency swaps are designated as fair value hedges of
foreign exchange risk. Foreign exchange forwards and foreign
exchange swaps are mainly designated as hedges of structural
foreign exchange risk related to net investments in foreign
operations. In both cases the hedged risk arises solely from
changes in spot foreign exchange rate.
The notional of the designated hedging instruments matches
the notional of the hedged items, except when the interest rate
swaps are re-designated in cash flow hedges, in which case the
hedge ratio designated is determined based on the swap
sensitivity.
Hedged items and hedge designation
Fair value hedges of interest rate risk related to debt instruments
and loan assets
Fair value hedges of interest rate risk related to debt instruments
and loan assets involve swapping fixed cash flows associated with
the debt issued, debt securities held and, from 2021 onward, loan
assets (principally long-term fixed-rate mortgage loans in Swiss
francs formerly designated within “Fair value hedges of portfolio
interest rate risk related to loans designated under IAS 39”) to
floating cash flows by entering into interest rate swaps that either
receive fixed and pay floating cash flows or that pay fixed and
receive floating cash flows.
Designations have been made in US dollars, euros, Swiss
francs, Australian dollars, Japanese yen and Singapore dollars. For
new hedging instruments and hedged risk designations entered
into in 2021 in these currencies (with the exception of euro), the
benchmark rate was the relevant alternative reference rate (ARR).
Following the interbank offered rate (IBOR) transition for swaps
with LCH (formerly the London Clearing House) in December
2021, the benchmark hedge rate for Swiss franc and Japanese
yen designations was changed from an IBOR rate to the relevant
ARR with the hedge relationship continuing in accordance with
Interest Rate Benchmark Reform – Phase 2 (Amendments to
IFRS 9, IAS 39, IFRS 7, IFRS 4 and IFRS 16)
.
Fair value hedges of portfolio interest rate risk related to loans
designated under IAS 39
Prior to December 2021, the Group hedged an open portfolio of
long-term fixed-rate mortgage loans in Swiss francs using interest
rate swaps that paid a fixed rate of interest and received a floating
rate of interest. Both the hedged portfolio and the hedging
instruments were adjusted on a monthly basis to reflect changes
in size and the maturity profile of the hedged portfolio. Each
month the hedge relationship was discontinued and a new one
designated. Changes in the portfolio were driven by new loans
being originated or loans being repaid.
Cash flow hedges of forecast transactions
The Group hedges forecas t cash flows on non-trading financial
assets and liabilities that bear interest at variable rates or are
expected to be refinanced or reinvested in the future, due to
movements in future market rates. The amounts and timing of
future cash flows, representing both principal and interest flows,
are projected on the basis of contractual terms and other relevant
factors, including estimates of prepayments and defaults. The
aggregate principal balances and interest cash flows across all
portfolios over time form the basis for identifying the non-trading
interest rate risk of the Group, which is hedged with interest rate
swaps, the maximum maturity of which is 10 years. Cash flow
forecasts and risk exposures are monitored and adjusted on an
ongoing basis, and consequently additional hedging instruments
are traded and designated, or are terminated resulting in a hedge
discontinuance. Hedge designations have been made in the
following currencies: US dollars, euros, Swiss francs, pounds
sterling and Hong Kong dollars. The cash flow hedges in US
dollars, Swiss francs and pounds sterling were discontinued and
replaced with new ARR designations in December 2021.
›
Refer to Note
1b
Fair value hedges of foreign exchange risk related to issued debt
instruments
Debt instruments denominated in currencies other than the US
dollar are designated in fair value hedges of spot foreign
exchange risk, in addition to and separate from the fair value
hedges of interest rate risk. Cross-currency swaps economically
convert debt denominated in currencies other than the US dollar
to US dollars. This hedge accounting program started on
1 January 2020, with the adoption of the hedge accounting
requirements of IFRS 9,
Financial Instruments,
›
Refer to Note
1b
Hedges of net investments in foreign operations
The Group applies hedge accounting for certain net investments
in foreign operations, which include subsidiaries, branches and
associates. Upon maturity of hedging instruments, typically two
months, the hedge relationship is terminated and new
designations are made to reflect any changes in the net
investments in foreign operations.
Consolidated financial statements | UBS Group AG consolidated financial statements
374
Note 26 Hedge accounting (continued)
Economic relationship between hedged item and hedging
instrument
For hedges designated under IFRS 9, the economic relationship
between the hedged item and the hedging instrument is
determined based on a qualitative analysis of their critical terms.
In cases where hedge designation takes place after origination of
the hedging instrument, a quantitative analysis of the possible
behavior of the hedging derivative and the hedged item during
their respective terms is also performed.
Prior to December 2021, for the fair value hedge of portfolio
interest rate risk related to loans designated under IAS 39, hedge
effectiveness was assessed by comparing changes in the fair value
of the hedged portfolio of loans attributable to changes in the
designated benchmark interest rate with the changes in the fair
value of the interest rate swaps.
Sources of hedge ineffectiveness
In hedges of interest rate risk, hedge ineffectiveness can arise
from mismatches of critical terms and / or the use of different
curves to discount the hedged item and instrument, or from
entering into a hedge relationship after the trade date of the
hedging derivative
.
In hedges of foreign exchange risk related to debt issued,
hedge ineffectiveness can arise due to the discounting of the
hedging instruments and undesignated risk components and lack
of such discounting and risk components in the hedged items.
In hedges of net investments in foreign operations,
ineffectiveness is unlikely unless the hedged net assets fall below
the designated hedged amount. The exceptions are hedges where
the hedging currency is not the same as the currency of the
foreign operation, where the currency basis may cause
ineffectiveness.
Hedge ineffectiveness from financial instruments measured at
fair value through profit or loss is recognized in
Other net income.
Derivatives not designated in hedge accounting relationships
Non-hedge accounted derivatives are mandatorily held for trading
with all fair value movements taken to
Other net income from
financial instruments measured at fair value through profit or loss
,
even when held as an economic hedge or to facilitate client
clearing. The one exception relates to forward points on certain
short- and long-duration foreign exchange contracts acting as
economic hedges, which are reported in
Net interest income.
All hedges: designated hedging instruments and hedge ineffectiveness
As of or for the year ended
31.12.21
Carrying amount
USD million
Notional
amount
Derivative
financial
assets
Derivative
financial
liabilities
Changes in
fair value of
hedging
instruments
1
Changes in
fair value of
hedged
items
1
Hedge
ineffectiveness
recognized in the
income statement
Interest rate risk
Fair value hedges
89,525
0
7
(1,604)
1,602
(2)
Cash flow hedges
79,573
12
1
(1,185)
990
(196)
Foreign exchange risk
Fair value hedges
27,875
87
261
(2,139)
2,181
42
Hedges of net investments in foreign operations
13,939
23
105
497
(497)
0
As of or for the year ended
31.12.20
Carrying amount
USD million
Notional
amount
Derivative
financial
assets
Derivative
financial
liabilities
Changes in
fair value of
hedging
instruments
1
Changes in
fair value of
hedged
items
1
Hedge
ineffectiveness
recognized in the
income statement
Interest rate risk
Fair value hedges
80,759
12
1,231
(1,247)
(16)
Cash flow hedges
72,732
18
2,213
(2,012)
201
Foreign exchange risk
Fair value hedges
2
21,555
449
7
(1,735)
1,715
(20)
Hedges of net investments in foreign operations
13,775
3
194
(937)
936
(2)
1 Amounts used as the basis for recognizing hedge ineffectiveness for the period. 2 The foreign currency basis spread of cross-currency swaps designated as hedging derivatives is excluded from the hedge
accounting designation and accounted for as a cost of hedging with amounts deferred in Other comprehensive income within Equity.
375
Note 26 Hedge accounting (continued)
Fair value hedges: designated hedged items
USD million
31.12.21
31.12.20
Interest rate
risk
FX risk
Interest rate
risk
FX risk
Debt issued measured at amortized cost
Carrying amount of designated debt issued
74,700
27,875
70,429
21,555
478
2,401
Other financial assets measured at amortized cost – debt securities
Carrying amount of designated debt securities
2,677
3,242
(7)
(38)
Loans and advances to customers
1
Carrying amount of designated loans
13,835
10,374
of which: accumulated amount of fair value hedge adjustment
2
(109)
100
of which: accumulated amount of fair value hedge adjustment subject to amortization attributable to the portion of the
portfolio that ceased to be part of hedge accounting
2
3
111
1 Prior to 31 December 2021, these amounts were designated in fair value hedges of portfolio interest rate risk under IAS 39. 2 As of 31 December 2021, the amount was presented within Loans and advances to
customers, whereas prior to 1 January 2021 amounts were presented within either Other financial assets measured at amortized cost or Other financial liabilities measured at amortized cost.
Fair value hedges: profile of the timing of the nominal amount of the hedging instrument
31.12.21
USD billion
Due within
1 month
Due between
1 and 3 months
Due between
3 and 12 months
Due between
1 and 5 years
Due after
5 years
Total
Interest rate swaps
0
8
10
49
22
90
Cross-currency swaps
1
1
6
13
6
28
31.12.20
USD billion
Due within
1 month
Due between
1 and 3 months
Due between
3 and 12 months
Due between
1 and 5 years
Due after
5 years
Total
Interest rate swaps
1
0
4
9
46
12
70
Cross-currency swaps
0
0
4
16
2
22
1 In accordance with IFRS 7 requirements, the fair value hedges of portfolio interest rate risk related to loans and advances to customers designated under IAS 39 are not included.
Cash flow hedge reserve on a pre-tax basis
USD million
31.12.21
31.12.20
Amounts related to hedge relationships for which hedge accounting continues to be applied
26
2,560
Amounts related to hedge relationships for which hedge accounting is no longer applied
743
296
Total other comprehensive income recognized directly in equity related to cash flow hedges, on a pre-tax basis
769
2,856
Foreign currency translation reserve on a pre-tax basis
USD million
31.12.21
31.12.20
Amounts related to hedge relationships for which hedge accounting continues to be applied
(45)
(559)
Amounts related to hedge relationships for which hedge accounting is no longer applied
262
268
Total other comprehensive income recognized directly in equity related to hedging instruments designated as net investment hedges, on a pre-tax
basis
217
(291)
Consolidated financial statements | UBS Group AG consolidated financial statements
376
Note 26 Hedge accounting (continued)
Interest rate benchmark reform
The Group continues to apply the relief provided by
Interest Rate
Benchmark Reform
published by the IASB in September 2019.
The interest rate benchmarks subject to interest rate
benchmark reforms to which the Group’s hedge relationships
were exposed were USD LIBOR, CHF LIBOR, GBP LIBOR, AUD
LIBOR, JPY LIBOR, HKD LIBOR, SGD LIBOR and EONIA. Interest rate
swaps designated in hedge relationships referencing GBP, CHF
and JPY LIBOR transitioned to ARRs in December 2021 when LCH
transitioned its contracts. For other currencies, IBOR quotations
remain available, but all new designations will reference ARR. As
such, ARR designations in these currencies will replace IBOR
designations as IBOR contracts mature.
The Group’s hedge relationships are also exposed to the Euro
Inter-bank Offered Rate (EURIBOR), which is expected to continue
to exist as a benchmark rate for the foreseeable future. Thus, the
Group does not consider its hedges involving the EURIBOR
benchmark interest rate to be directly affected by interest rate
benchmark reform.
Apart from EURIBOR hedges, UBS applied the relief to all its
fair value hedges of interest rate risk and to those cash flow hedge
relationships where the hedged risk is LIBOR or EONIA. The
following table provides details on the notional amount and
carrying amount of the hedging instruments in those hedge
relationships maturing after 31 December 2021, or 30 June 2023
for USD LIBOR hedges, which are the cessation dates of the
applicable interest rate benchmarks.
Hedges of net investments in foreign operations are not
affected by the amendments.
›
Refer to Note
1a item 2j
for more information about the relief
provided by the amendments to IFRS 9, IAS 39 and IFRS 7 related
to interest rate benchmark reform
›
Refer to Note 25 Interest rate benchmark reform for more
information about the transition progress
Hedging instruments referencing LIBOR
31.12.21
31.12.20
Carrying amount
Carrying amount
USD million
Notional
amount
Derivative
financial
assets
Derivative
financial
liabilities
Notional
amount
Derivative
financial
assets
Derivative
financial
liabilities
Interest rate risk
Fair value hedges
23,367
0
0
37,146
1
(12)
Cash flow hedges
10,803
0
0
11,179
0
0
377
Note 27 Post-employment benefit plans
a) Defined benefit plans
UBS has established defined benefit plans for its employees in
various jurisdiction
s
in accordance with local regulations and
practices. The major plans are located in Switzerland, the UK, the
US and Germany. The level of benefits depends on the specific
plan rules.
Swiss pension plan
The
Swiss pension plan covers
employees of UBS AG
in
Switzerland and employees of companies in Switzerland having
close economic or financial ties with UBS AG, and exceeds the
minimum benefit requirements under Swiss pension law. The
Swiss plan offers retirement, disability and survivor benefits and is
governed by a Pension Foundation Board. The responsibilities of
this board are defined by Swiss pension law and the plan rules.
Savings contributions to the Swiss plan are paid by both
employer and employee. Depending on the age of the employee,
UBS pays a savings contribution that ranges between
6.5
% and
27.5
% of contributory base salary and between
2.8
% and
9
% of
contributory variable compensation. UBS also pays risk
contributions that are used to fund disability and survivor benefits.
Employees can choose the level of savings contributions paid by
them, which vary between
2.5
% and
13.5
% of contributory base
salary and between
0
% and
9
% of contributory
variable
compensation, depending on age and choice of savings
contribution category.
The plan offers to members at the normal retirement age of
65
a choice between a lifetime pension and a partial or full lump sum
payment.
Participants can choose to
draw early retirement
benefits starting from the age of
58
, but can also continue
employment and remain active members of the plan until the age
of
70
. Employees have the opportunity to make additional
purchases of benefits to fund early retirement benefits.
The pension amount payable to a participant is calculated by
applying a conversion rate to the accumulated balance of the
participant’s retirement savings account at the retirement date.
The balance is based on credited vested benefits transferred from
previous employers, purchases of benefits, and the employee and
employer contributions that have been made to the participant’s
retirement savings account, as well as the interest accrued. The
annual interest rate credited to participants is determined by the
Pension Foundation Board at the end of each year.
Although the Swiss plan is based on a defined contribution
promise under Swiss pension law, it is accounted for as a defined
benefit plan under IFRS, primarily because of the obligation to
accrue interest on the participants’ retirement savings accounts
and the payment of lifetime pension benefits.
An actuarial valuation in accordance with Swiss pension law is
performed regularly. Should an underfunded situation on this
basis occur, the Pension Foundation Board is required to take the
necessary measures to ensure that full funding can be expected
to be restored within a maximum period of
10
plan were to become significantly underfunded on a Swiss
pension law basis, additional employer and employee
contributions could be required. In this situation, the risk is shared
between employer and employees, and the employer is not legally
obliged to cover more than
50
% of the additional contributions
required. As of 31 December 2021, the Swiss plan had a technical
funding ratio in accordance with Swiss pension law of
134.8
%
(31 December 2020:
132.6
%).
The investment strategy of the Swiss plan complies with Swiss
pension law, including the rules and regulations relating to
diversification of plan assets, and is derived from the risk budget
defined by the Pension Foundation Board on the basis of regularly
performed asset and liability management analyses. The Pension
Foundation Board strives for a medium - and long -term balance
between assets and liabilities.
As of 31 December 2021, the Swiss plan was in a surplus
situation on an IFRS measurement basis, as the fair value of the
plan’s assets exceeded the defined benefit obligation (DBO) by
USD
6,577
4,862
million). However, a surplus is only recognized on the balance
sheet to the extent that it does not exceed the estimated future
economic benefit, which equals the difference between the
present value of the estimated future net service cost and the
present value of the estimated future employer contributions. As
of both 31 December 2021 and 31 December 2020, the
estimated future economic benefit was zero and hence no net
defined benefit asset was recognized on the balance sheet.
Changes to the Swiss pension plan in 2019
The Pension Foundation Board and UBS agreed to implement
measures that took effect from the start of 2019 to support the
long-term financial stability of the Swiss pension fund. The
measures, among other things, lowered the conversion rate and
increased the normal retirement age from 64 to 65. Pensions
already in payment on 1 January 2019 were not affected.
To mitigate the effects for active participants, UBS committed
to pay an extraordinary contribution of up to CHF
720
(USD
790
2021) in three installments in 2020, 2021 and 2022. Two
installments of USD
235
254
and 2021 reduced OCI with no effect on the income statement.
The third installment, CHF
193
212
closing exchange rate on 31 December 2021), will be paid in the
first quarter of 2022. The regular employer contributions to be
made to the Swiss plan in 2022 are estimated at USD
491
Consolidated financial statements | UBS Group AG consolidated financial statements
378
Note 27 Post-employment benefit plans (continued)
UK pension plan
The UK plan is a career -average revalued earnings scheme, and
benefits increase automatically based on UK price inflation. The
normal retirement age for participants in the UK plan is
60
. The
plan provides guaranteed lifetime pension benefits to participants
upon retirement. The UK plan has been closed to new entrants
for more than 20 years and, since 2013, participants are no longer
accruing benefits for current or future service. Instead, employees
participate in the UK defined contribution plan.
The governance responsibility for the UK plan lies jointly with
the Pension Trustee Board and UBS. The employer contributions
to the pension fund reflect agreed-upon deficit funding
contributions, which are determined on the basis of the most
recent actuarial valuation using assumptions agreed by the
Pension Trustee Board and UBS. In the event of underfunding, UBS
and the Pension Trustee Board must agree on a deficit recovery
plan within statutory deadlines. In 2021, UBS made no deficit
funding contributions to the UK plan. In 2020, UBS made deficit
funding contributions of USD
46
The plan assets are invested in a diversified portfolio of
financial assets, which include a longevity swap with an external
insurance company. This swap enables the UK pension plan to
hedge the risk between expected and actual longevity, which
should mitigate volatility in the net defined benefit asset / liability.
As of 31 December 2021, the longevity swap had a negative value
of USD
3
In 2019, UBS and the Pension Trustee Board entered into an
arrangement whereby a collateral pool was established to provide
security for the pension fund. The value of the collateral pool as
of 31 December 2021 was USD
337
USD
347
related debt instruments
and other financial assets
. The
arrangement provides the Pension Trustee Board dedicated access
to a pool of assets in the event of UBS’s insolvency or not paying
a required deficit funding contribution.
The employer contributions to be made to the UK defined
benefit plan in 2022 are estimated at USD
5
regular funding reviews during the year.
US pension plans
There are two distinct major defined benefit plans in the US, with
a normal retirement age of
65
. Both plans were closed to new
entrants more than 20 years ago. Since they closed, new
employees have participated in a defined contribution plan.
One of the defined benefit plans is a contribution-based plan
in which each participant accrues a percentage of salary in a
retirement savings account. The retirement savings account is
credited annually with interest based on a rate that is linked to
the average yield on one-year US government bonds. For the
other defined benefit plan, retirement benefits accrue based on
the career-average earnings of each individual plan participant.
Former employees with vested benefits have the option to take a
lump sum payment or a lifetime annuity.
As required under applicable pension laws, both plans have
fiduciaries who, together with UBS, are responsible for the
governance of the plans.
The plan assets of both plans are invested in diversified
portfolio
s
of financial assets. Ea
ch plan’s fiduciaries are
responsible for the investment decisions with respect to the plan
assets.
The employer contributions to be made to the US defined
benefit plans in 2022 are estimated at USD
10
German pension plans
There are two defined benefit plans in Germany, which are both
unfunded. The normal retirement age is
65
directly by UBS. In the larger of the two plans each participant
accrues a percentage of salary in a retirement savings account.
The accumulated account balance of the participant is credited on
an annual basis with guaranteed interest at a rate of
5
%. The plan
has been closed to new entrants and all participants younger than
the age of 55 no longer accrue benefits. In the other plan,
amounts are accrued annually based on employee elections
related to variable compensation. For this plan, the accumulated
account balance is credited on an annual basis with a guaranteed
interest rate of
6
% for amounts accrued before 2010, of
4
% for
amounts accrued from 2010 to 2017 and of
0.9
% for amounts
accrued after 2017. Both plans are subject to German pension
law, whereby the responsibility to pay pension benefits when they
are due resides entirely with UBS. A portion of the pension
payments is directly increased in line with price inflation.
In June 2021, UBS implemented a new funded pension plan
with interest credited to participants equal to actual investment
returns with a guaranteed minimum of
0
%. The plan was
implemented retrospectively for new hires since June 2018 and
for all eligible active participants younger than 55 from July 2021.
Each participant accrues a percentage of salary in a retirement
savings account.
The employer contributions to be made to the German defined
benefit plans in 2022 are estimated at USD
12
Financial information by plan
The tables on the following pages provide an analysis of the
movement in the net asset / liability recognized on the balance
sheet for defined benefit plans, as well as an analysis of amounts
recognized in net profit and in
Other comprehensive incom
e.
379
Note 27 Post-employment benefit plans (continued)
Defined benefit plans
USD million
Swiss pension plan
UK pension plan
US and German
pension plans
Total
2021
2020
2021
2020
2021
2020
2021
2020
Defined benefit obligation at the beginning of the year
27,728
24,496
4,162
3,654
1,905
1,820
33,795
29,970
Current service cost
494
447
0
0
6
6
500
453
Interest expense
58
72
58
73
30
45
147
190
Plan participant contributions
266
259
0
0
0
0
266
259
Remeasurements
837
1,279
71
449
(62)
105
846
1,832
of which: actuarial (gains) / losses due to changes in demographic assumptions
51
(164)
14
(14)
4
(34)
69
(212)
of which: actuarial (gains) / losses due to changes in financial assumptions
(678)
983
(3)
505
(78)
134
(759)
1,621
of which: experience (gains) / losses
1
1,464
460
59
(42)
12
5
1,535
423
Past service cost related to plan amendments
0
0
0
3
4
0
4
3
Curtailments
(80)
0
0
0
0
0
(80)
0
Benefit payments
(1,097)
(1,153)
(148)
(148)
(112)
(108)
(1,357)
(1,409)
Other movements
0
(4)
0
0
1
0
1
(4)
Foreign currency translation
(809)
2,333
(38)
132
(33)
37
(880)
2,501
Defined benefit obligation at the end of the year
27,398
27,728
4,105
4,162
1,740
1,905
33,242
33,795
of which: amounts owed to active members
14,333
13,765
150
159
222
245
14,705
14,169
of which: amounts owed to deferred members
0
0
1,593
1,879
669
743
2,262
2,622
of which: amounts owed to retirees
13,065
13,963
2,362
2,124
849
917
16,276
17,004
of which: funded plans
27,398
27,728
4,105
4,162
1,222
1,319
32,724
33,209
of which: unfunded plans
0
0
0
0
518
586
518
586
Fair value of plan assets at the beginning of the year
32,590
28,219
4,149
3,658
1,360
1,299
38,100
33,176
Return on plan assets excluding interest income
2,322
1,818
277
388
40
118
2,639
2,324
Interest income
74
84
58
73
26
38
159
196
Employer contributions
763
729
0
46
16
17
779
792
Plan participant contributions
266
259
0
0
0
0
266
259
Benefit payments
(1,097)
(1,153)
(148)
(148)
(112)
(108)
(1,357)
(1,409)
Administration expenses, taxes and premiums paid
(13)
(13)
0
0
(4)
(4)
(17)
(17)
Other movements
0
0
0
0
1
0
1
0
Foreign currency translation
(930)
2,647
(39)
132
0
0
(969)
2,779
Fair value of plan assets at the end of the year
33,975
32,590
4,297
4,149
1,329
1,360
39,601
38,100
Surplus / (deficit)
6,577
4,862
192
(13)
(411)
(545)
6,358
4,304
Asset ceiling effect at the beginning of the year
4,862
3,724
0
0
0
0
4,862
3,724
Interest expense on asset ceiling effect
15
12
0
0
0
0
15
12
Asset ceiling effect excluding interest expense and foreign currency translation on
asset ceiling effect
1,821
814
0
0
0
0
1,821
814
Foreign currency translation
(121)
313
0
0
0
0
(121)
313
Asset ceiling effect at the end of the year
6,577
4,862
0
0
0
0
6,577
4,862
Net defined benefit asset / (liability) of major plans
0
0
192
(13)
(411)
(545)
(219)
(558)
Net defined benefit asset / (liability) of remaining plans
(112)
(123)
Total net defined benefit asset / (liability)
(331)
(680)
of which: Net defined benefit asset
302
42
of which: Net defined benefit liability
2
(633)
(722)
1 Experience (gains) / losses are a component of actuarial remeasurements of the defined benefit obligation and reflect the effects of differences between the previous actuarial assumptions and what has actually
occurred. 2 Refer to Note 19c.
Consolidated financial statements | UBS Group AG consolidated financial statements
380
Note 27 Post-employment benefit plans (continued)
Income statement – expenses related to defined benefit plans
1
USD million
Swiss pension plan
UK pension plan
US and German
pension plans
Total
For the year ended
31.12.21
31.12.20
31.12.21
31.12.20
31.12.21
31.12.20
31.12.21
31.12.20
Current service cost
494
447
0
0
6
6
500
453
Interest expense related to defined benefit obligation
58
72
58
73
30
45
147
190
Interest income related to plan assets
(74)
(84)
(58)
(73)
(26)
(38)
(159)
(196)
Interest expense on asset ceiling effect
15
12
0
0
0
0
15
12
Administration expenses, taxes and premiums paid
13
13
0
0
4
4
17
17
Past service cost related to plan amendments
0
0
0
3
4
0
4
3
Curtailments
(80)
0
0
0
0
0
(80)
0
Net periodic expenses recognized in net profit for major plans
426
459
0
3
18
18
444
479
Net periodic expenses recognized in net profit for remaining plans
2
25
23
Total net periodic expenses recognized in net profit
470
502
1 Refer to Note 6. 2 Includes differences between actual and estimated performance award accruals.
Other comprehensive income – gains / (losses) on defined benefit plans
USD million
Swiss pension plan
UK pension plan
US and German
pension plans
Total
For the year ended
31.12.21
31.12.20
31.12.21
31.12.20
31.12.21
31.12.20
31.12.21
31.12.20
Remeasurement of defined benefit obligation
(837)
(1,279)
(71)
(449)
62
(105)
(846)
(1,832)
of which: change in discount rate assumption
870
(777)
319
(504)
77
(141)
1,267
(1,421)
of which: change in rate of salary increase assumption
(3)
(230)
0
0
0
0
(3)
(230)
of which: change in rate of pension increase assumption
0
0
(316)
(1)
(1)
1
(318)
0
of which: change in rate of interest credit on retirement savings assumption
(193)
26
0
0
(1)
24
(194)
50
of which: change in life expectancy
0
261
9
22
(3)
50
5
333
of which: change in other actuarial assumptions
(47)
(99)
(23)
(8)
2
(34)
(68)
(142)
of which: experience gains / (losses)
1
(1,464)
(460)
(59)
42
(12)
(5)
(1,535)
(423)
Return on plan assets excluding interest income
2,322
1,818
277
388
40
118
2,639
2,324
Asset ceiling effect excluding interest expense and foreign currency translation
(1,821)
(814)
0
0
0
0
(1,821)
(814)
Total gains / (losses) recognized in other comprehensive income for major plans
(336)
(276)
207
(61)
103
14
(27)
(323)
Total gains / (losses) recognized in other comprehensive income for remaining plans
30
(4)
Total gains / (losses) recognized in other comprehensive income
2
2
(327)
1 Experience (gains) / losses are a component of actuarial remeasurements of the defined benefit obligation and reflect the effects of differences between the previous actuarial assumptions and what has actually
occurred. 2 Refer to the “Statement of comprehensive income.”
The table below provides information about the duration of the DBO and the timing for expected benefit payments.
Swiss pension plan
UK pension plan
US and German pension
plans
1
31.12.21
31.12.20
31.12.21
31.12.20
31.12.21
31.12.20
Duration of the defined benefit obligation (in years)
15.1
15.7
18.8
19.0
9.5
10.2
Maturity analysis of benefits expected to be paid
USD million
Benefits expected to be paid within 12 months
1,312
1,293
110
114
123
122
Benefits expected to be paid between 1 and 3 years
2,636
2,630
248
232
237
235
Benefits expected to be paid between 3 and 6 years
3,824
3,839
418
406
338
346
Benefits expected to be paid between 6 and 11 years
6,220
6,166
743
744
495
532
Benefits expected to be paid between 11 and 16 years
5,572
5,646
751
758
392
413
Benefits expected to be paid in more than 16 years
18,092
18,884
3,028
3,206
519
541
1 The duration of the defined benefit obligation represents a weighted average across US and German plans.
381
Note 27 Post-employment benefit plans (continued)
Actuarial assumptions
The actuarial assumptions used for the defined benefit plans are
based on the economic conditions prevailing in the jurisdiction in
which they are offered. Changes in the defined benefit obligation
are most sensitive to changes in the discount rate. The discount
rate is based on the yield of high-quality corporate bonds quoted
in an active market in the currency of the respective plan. A
decrease in the discount curve increases the DBO. UBS regularly
reviews the actuarial assumptions used in calculating the DBO to
determine their continuing relevance.
›
Refer to Note 1a item 5 for a description of the accounting policy
for defined benefit plans
The tables below show the significant actuarial assumptions used in calculating the DBO at the end of the year
.
Significant actuarial assumptions
Swiss pension plan
UK pension plan
US and German pension
plans
1
In %
31.12.21
31.12.20
31.12.21
31.12.20
31.12.21
31.12.20
Discount rate
0.34
0.10
1.82
1.42
2.10
1.62
Rate of salary increase
2.01
2.00
0.00
0.00
2.35
2.25
Rate of pension increase
0.00
0.00
3.32
2.89
1.80
1.70
Rate of interest credit on retirement savings
1.04
0.60
0.00
0.00
1.18
1.12
1 Represents weighted average assumptions across US and German plans.
Mortality tables and life expectancies for major plans
Life expectancy at age 65 for a male member currently
aged 65
aged 45
Country
Mortality table
31.12.21
31.12.20
31.12.21
31.12.20
Switzerland
BVG 2020 G with CMI 2019 projections
21.7
21.7
23.3
23.2
UK
S3PA with CMI 2020 projections
1
23.4
23.4
24.5
24.6
USA
Pri-2012 with MP-2021 projection scale
2
21.9
21.8
23.3
23.2
Germany
Dr. K. Heubeck 2018 G
20.5
20.8
23.2
23.6
Life expectancy at age 65 for a female member currently
aged 65
aged 45
Country
Mortality table
31.12.21
31.12.20
31.12.21
31.12.20
Switzerland
BVG 2020 G with CMI 2019 projections
23.4
23.4
25.0
24.9
UK
S3PA with CMI 2020 projections
1
24.9
24.9
26.3
26.3
USA
Pri-2012 with MP-2021 projection scale
2
23.3
23.2
24.7
24.5
Germany
Dr. K. Heubeck 2018 G
23.9
24.3
26.1
26.5
1 In 2020, S3PA with CMI 2019 projections was used. 2 In 2020, Pri-2012 with MP-2020 projection scale was used.
Consolidated financial statements | UBS Group AG consolidated financial statements
382
Note 27 Post-employment benefit plans (continued)
Sensitivity analysis of significant actuarial assumptions
The table below presents a sensitivity analysis for each significant
actuarial assumption, showing how the DBO would have been
affected by changes in the relevant actuarial assumption that
were reasonably possible at the balance sheet date. Unforeseen
circumstances may arise, which could result in variations that are
outside the range of alternatives deemed reasonably possible.
Caution should be used in extrapolating the sensitivities below on
the DBO, as the sensitivities may not be linear.
Sensitivity analysis of significant actuarial assumptions
1
Increase / (decrease) in defined benefit obligation
Swiss pension plan
UK pension plan
US and German pension plans
USD million
31.12.21
31.12.20
31.12.21
31.12.20
31.12.21
31.12.20
Discount rate
Increase by 50 basis points
(1,695)
(1,793)
(361)
(370)
(78)
(91)
Decrease by 50 basis points
1,933
2,048
411
423
84
99
Rate of salary increase
Increase by 50 basis points
109
117
–
2
–
2
0
1
Decrease by 50 basis points
(104)
(111)
–
2
–
2
0
(1)
Rate of pension increase
Increase by 50 basis points
1,333
1,413
334
358
6
8
Decrease by 50 basis points
–
3
–
3
(306)
(316)
(6)
(7)
Rate of interest credit on retirement savings
Increase by 50 basis points
224
236
–
4
–
4
8
9
Decrease by 50 basis points
(224)
5
(188)
–
4
–
4
(7)
(8)
Life expectancy
Increase in longevity by one additional year
915
1,061
184
182
56
60
1 The sensitivity analyses are based on a change in one assumption while holding all other assumptions constant, so that interdependencies between the assumptions are excluded. 2 As the plan is closed for future
service, a change in assumption is not applicable. 3 As the assumed rate of pension increase was
0
% as of 31 December 2021 and as of 31 December 2020, a downward change in assumption is not applicable.
4 As the UK plan does not provide interest credits on retirement savings, a change in assumption is not applicable. 5 As of 31 December 2021,
19
% of retirement savings were subject to a legal minimum rate of
1.00
%.
383
Note 27 Post-employment benefit plans (continued)
Fair value of plan assets
The tables below provide information about the composition and fair value of plan assets of the Swiss, UK, US and German pension plans
.
Composition and fair value of plan assets
Swiss pension plan
31.12.21
31.12.20
Fair value
Plan asset
allocation %
Fair value
Plan asset
allocation %
USD million
Quoted
in an active
market
Other
Total
Quoted
in an active
market
Other
Total
Cash and cash equivalents
187
0
187
1
219
0
219
1
Real estate / property
Domestic
0
3,530
3,530
10
0
3,582
3,582
11
Foreign
0
580
580
2
0
331
331
1
Investment funds
Equity
Domestic
843
0
843
2
826
0
826
3
Foreign
6,213
2,652
8,865
26
6,284
1,958
8,242
25
Bonds
1
Domestic, AAA to BBB–
4,446
0
4,446
13
3,721
0
3,721
11
Foreign, AAA to BBB–
5,093
0
5,093
15
6,146
0
6,146
19
Foreign, below BBB–
1,314
0
1,314
4
1,303
0
1,303
4
Other
4,211
3,558
7,769
23
3,363
3,722
7,085
22
Other investments
668
682
1,349
4
663
473
1,136
3
Total fair value of plan assets
22,973
11,002
33,975
100
22,525
10,065
32,590
100
31.12.21
31.12.20
Total fair value of plan assets
33,975
32,590
of which:
2
Bank accounts at UBS
194
231
UBS debt instruments
28
34
UBS shares
25
24
Securities lent to UBS
3
1,079
1,416
Property occupied by UBS
93
96
Derivative financial instruments, counterparty UBS
3
128
149
1 The bond credit ratings are primarily based on S&P’s credit ratings. Ratings AAA to BBB– and below BBB– represent investment grade and non-investment grade ratings, respectively. In cases where credit ratings
from other rating agencies were used, these were converted to the equivalent rating in S&P’s rating classification. 2 Bank accounts at UBS encompass accounts in the name of the Swiss pension fund. The other
positions disclosed in the table encompass both direct investments in UBS instruments and indirect investments, i.e., those made through funds that the pension fund invests in. 3 Securities lent to UBS and derivative
financial instruments are presented gross of any collateral. Securities lent to UBS were fully covered by collateral as of 31 December 2021 and 31 December 2020. Net of collateral, derivative financial instruments
amounted to USD
43
17
Consolidated financial statements | UBS Group AG consolidated financial statements
384
Note 27 Post-employment benefit plans (continued)
Composition and fair value of plan assets (continued)
UK pension plan
31.12.21
31.12.20
Fair value
Plan asset
allocation %
Fair value
Plan asset
allocation %
USD million
Quoted
in an active
market
Other
Total
Quoted
in an active
market
Other
Total
Cash and cash equivalents
147
0
147
3
195
0
195
5
Bonds
1
Domestic, AAA to BBB–
2,605
0
2,605
61
2,150
0
2,150
52
Foreign, AAA to BBB–
372
0
372
9
53
0
53
1
Foreign, below BBB–
4
0
4
0
0
0
0
0
Investment funds
Equity
Domestic
44
4
47
1
34
3
37
1
Foreign
921
0
921
21
1,077
0
1,077
26
Bonds
1
Domestic, AAA to BBB–
532
147
679
16
919
131
1,050
25
Domestic, below BBB–
12
0
12
0
47
0
47
1
Foreign, AAA to BBB–
179
0
179
4
149
0
149
4
Foreign, below BBB–
115
0
115
3
110
0
110
3
Real estate
Domestic
110
12
122
3
98
16
114
3
Foreign
6
34
40
1
0
37
37
1
Other
(313)
0
(313)
(7)
(86)
0
(86)
(2)
Insurance contracts
0
8
8
0
0
8
8
0
Derivatives
57
(3)
54
1
(3)
0
(3)
0
Asset-backed securities
0
11
11
0
0
6
6
0
Other investments
2
(717)
10
(707)
(16)
(803)
9
(794)
(19)
Total fair value of plan assets
4,074
223
4,297
100
3,940
209
4,149
100
1 The bond credit ratings are primarily based on S&P’s credit ratings. Ratings AAA to BBB– and below BBB– represent investment grade and non-investment grade ratings, respectively. In cases where credit ratings
from other rating agencies were used, these were converted to the equivalent rating in S&P’s rating classification. 2 Mainly relates to repurchase arrangements on UK treasury bonds.
385
Note 27 Post-employment benefit plans (continued)
US and German pension plans
31.12.21
31.12.20
Fair value
Plan asset
allocation %
Fair value
Plan asset
allocation %
USD million
Quoted
in an active
market
Other
Total
Quoted
in an active
market
Other
Total
Cash and cash equivalents
11
0
11
1
38
0
38
3
Equity
Domestic
79
0
79
6
0
0
0
0
Foreign
31
0
31
2
0
0
0
0
Bonds
1
Domestic, AAA to BBB–
486
0
486
37
490
0
490
36
Domestic, below BBB–
17
0
17
1
7
0
7
0
Foreign, AAA to BBB–
97
0
97
7
99
0
99
7
Foreign, below BBB–
6
0
6
0
1
0
1
0
Investment funds
Equity
Domestic
3
0
3
0
210
0
210
15
Foreign
56
0
56
4
169
0
169
12
Bonds
1
Domestic, AAA to BBB–
269
0
269
20
195
0
195
14
Domestic, below BBB–
147
0
147
11
34
0
34
2
Foreign, AAA to BBB–
11
0
11
1
19
0
19
1
Foreign, below BBB–
2
0
2
0
3
0
3
0
Real estate
Domestic
0
9
9
1
0
14
14
1
Other
99
0
99
7
79
0
79
6
Insurance contracts
0
1
1
0
0
1
1
0
Other investments
5
0
5
0
0
0
0
0
Total fair value of plan assets
1,319
10
1,329
100
1,345
15
1,360
100
1 The bond credit ratings are primarily based on S&P’s credit ratings. Ratings AAA to BBB– and below BBB– represent investment grade and non-investment grade ratings, respectively. In cases where credit ratings
from other rating agencies were used, these were converted to the equivalent rating in S&P’s rating classification.
Consolidated financial statements | UBS Group AG consolidated financial statements
386
Note 27 Post-employment benefit plans (continued)
b) Defined contribution plans
UBS sponsors a number of defined contribution plans, with the
most significant plans in the US and the UK. UBS’s obligation is
limited to its contributions made in accordance with each plan,
which may include direct contributions
and
matching
contributions. Employer contributions to defined contribution
plans are recognized as an expense.
Expenses related to defined contribution plans
For the year ended
USD million
31.12.21
31.12.20
31.12.19
US plan
198
190
173
UK plan
101
88
82
Remaining plans
64
65
71
Total
1
363
343
326
1 Refer to Note 6.
c) Related-party disclosure
UBS is the principal provider of banking services for the pension
fund of UBS in Switzerland. In this capacity, UBS is engaged to
execute most of the pension fund’s banking activities. These
activities can include, but are not limited to, trading, securities
lending and borrowing and derivative transactions. The non-Swiss
UBS pension funds do not have a similar banking relationship with
UBS.
Also, UBS leases certain properties that are owned by the Swiss
pension fund
. As of 31
December
202
1
, the minimum
commitment toward the Swiss pension fund under the related
leases was approximately
USD
9
million
(31
December 20
20
:
USD
11
›
Refer to the “Composition and fair value of plan assets” table in
Note 27a for more information about fair value of investments
in UBS instruments held by the Swiss pension fund
The following amounts have been received or paid by UBS from
and to the post-employment benefit plans located in Switzerland,
the UK, the US and Germany in respect of these banking activities
and arrangements.
Related-party disclosure
For the year ended
USD million
31.12.21
31.12.20
31.12.19
Received by UBS
Fees
39
34
34
Paid by UBS
Rent
4
5
4
Dividends, capital repayments and interest
5
10
11
The transaction volumes in UBS shares and UBS debt instruments and the balances of UBS shares held were:
Transaction volumes – UBS shares and UBS debt instruments
For the year ended
31.12.21
31.12.20
Financial instruments bought by pension funds
UBS shares (in thousands of shares)
907
1,758
UBS debt instruments (par values, USD million)
37
28
Financial instruments sold by pension funds or matured
UBS shares (in thousands of shares)
1,688
2,605
UBS debt instruments (par values, USD million)
40
6
UBS shares held by post-employment benefit plans
31.12.21
31.12.20
Number of shares (in thousands of shares)
14,073
14,854
Fair value (USD million)
252
210
387
Note 28 Employee benefits: variable compensation
a) Plans offered
The Group has several share-based and other deferred
compensation plans that align the interests of Group Executive
Board (GEB) members and other employees with the interests of
investors.
Share-based awards are granted in the form of notional shares
and, where permitted, carry a dividend equivalent that may be paid
in notional shares or cash. Awards are settled by delivering UBS shares
at vesting, except in jurisdictions where this is not permitted for legal
or tax reasons.
Deferred compensation awards are generally forfeitable upon,
among other circumstances, voluntary termination of employment
with UBS. These compensation plans are also designed to meet
regulatory requirements and include special provisions for
regulated employees.
The most significant deferred compensation plans are described
below.
›
Refer to Note 1a item 5 for a description of the accounting policy
related to share-based and other deferred compensation plans
Mandatory deferred compensation plans
The Long-Term Incentive Plan
The Long-Term Incentive Plan (LTIP) is a mandatory deferred
share-based compensation plan for senior leaders of the Group
(i.e., GEB members and selected senior management).
The number of notional shares delivered at vesting depends on
two equally
weighted performance metrics over a three
-
year
performance period: reported return on common equity tier 1
capital and relative total shareholder return, which measures the
performance of UBS against an index of Global Systemically
Important Banks as determined by the Financial Stability Board.
The final number of shares will vest in three equal installments
in each of the three years following the performance period for
GEB members, and cliff vest in the first year following the
performance period for selected senior management.
The Equity Ownership Plan
The Equity Ownership Plan (EOP) is a deferred share-based
compensation plan for employees who are subject to deferral
requirements but do not receive LTIP awards. Vesting under the
EOP generally occurs in equal installments two and three years
after grant, subject to continued employment and, in certain
cases, achievement of defined performance conditions.
Asset Management employees receive some or all of their EOP
in the form of cash-settled notional investment funds. The
amount delivered depends on the value of the underlying
investment funds at the time of vesting.
The Deferred Contingent Capital Plan
The Deferred Contingent Capital Plan (DCCP) is a deferred
compensation plan for all employees who are subject to deferral
requirements. Such employees are awarded notional additional tier
1 (AT1) capital instruments, which, at the discretion of UBS, can be
settled as a cash payment or a perpetual, marketable AT1 capital
instrument. DCCP awards generally vest in full after five years,
unless the award is written down following the occurrence of a
viability event (as defined under the terms of an AT1 instrument) or
if the Group’s CET1 capital ratio falls below a defined threshold.
Additional performance conditions apply to GEB members.
Interest payments on DCCP awards are paid at the discretion of
UBS. Where interest payments are not permitted, such as for certain
regulated employees, the DCCP award reflects the fair value of the
granted non-interest-bearing award.
Financial advisor variable compensation
In
line with market practice for US wealth management
businesses, the compensation for US financial advisors in Global
Wealth Management predominantly includes production payout
and deferred compensation awards. Production payout is
primarily based on compensable revenue. Financial advisors may
also qualify for deferred compensation awards, which generally
vest over a six-year period. These awards are based on strategic
performance measures, including production and length of
service with UBS. Production payout rates and deferred
compensation awards may be reduced for, among other things,
errors, negligence or carelessness, or failure to comply with the
firm’s rules, standards, practices and / or policies, and / or
applicable laws and regulations.
Financial advisor compensation also includes expenses related
to compensation commitments with financial advisors entered
into at the time of recruitment that are subject to vesting
requirements.
Share delivery obligations
Share delivery obligations related to employee share-based
compensation awards were
175
2021 (31 December 2020:
172
obligations are calculated on the basis of undistributed notional
share awards, taking applicable performance conditions into
account.
As of 31 December 2021, UBS held
149
(31 December 2020:
157
share delivery obligations.
Consolidated financial statements | UBS Group AG consolidated financial statements
388
Note 28 Employee benefits: variable compensation (continued)
b) Effect on the income statement
Effect on the income statement for the financial year and future
periods
The table below provides information about compensation expenses
related to total variable compensation, including financial advisor
variable compensation, that were recognized in the financial year
ended 31 December 2021, as well as expenses that were deferred
and will be recognized in the income statement for 2022 and later.
The majority of expenses deferred to 2022 and later that are related
to the 2021 performance year pertain to awards granted in February
2022. The total unamortized compensation expense for unvested
share
-
based awards granted up to 31
December
2021
will be
recognized in future periods over a weighted average period of
2.5
years.
Variable compensation including financial advisor variable compensation
Expenses recognized in 2021
Expenses deferred to 2022 and later
1
USD million
Related to the
2021
performance
year
Related to prior
performance
years
Total
Related to the
2021
performance
year
Related to prior
performance
years
Total
Non-deferred cash
2,383
(10)
2,373
0
0
0
Deferred compensation awards
405
412
817
797
624
1,421
of which: Equity Ownership Plan
183
180
363
393
184
577
of which: Deferred Contingent Capital Plan
140
158
297
299
329
628
of which: Long-Term Incentive Plan
54
19
73
50
33
83
of which: Asset Management EOP
29
56
84
56
78
133
Variable compensation – performance awards
2,788
402
3,190
797
624
1,421
Variable compensation – other
2
191
38
229
215
182
397
Total variable compensation excluding financial advisor variable compensation
2,979
440
3,419
1,012
806
1,818
Financial advisor variable compensation
4,134
248
4,382
434
641
1,075
of which: non-deferred cash
3,858
(6)
3,853
0
0
0
of which: deferred share-based awards
106
51
157
123
146
269
of which: deferred cash-based awards
170
202
372
311
495
806
Compensation commitments with recruited financial advisors
3
41
438
479
662
1,682
2,344
Total FA variable compensation
4,175
685
4,860
1,097
2,323
3,419
Total variable compensation including FA variable compensation
7,155
1,125
8,280
4
2,109
3,129
5,238
1 Estimate as of 31 December 2021. Actual amounts to be expensed in future periods may vary, e.g., due to forfeiture of awards. 2 Consists of replacement payments, forfeiture credits, severance payments,
retention plan payments and interest expense related to the Deferred Contingent Capital Plan. 3 Reflects expenses related to compensation commitments with financial advisors entered into at the time of recruitment
that are subject to vesting requirements. Amounts reflected as deferred expenses represent the maximum deferred exposure as of the balance sheet date. Amounts in the “Related to the 2021 performance year”
columns represent commitments entered into in 2021. 4 Includes USD
651
435
59
million; financial advisor compensation: USD
157
85
USD
5
64
16
compensation excluding social security was USD
641
389
Note 28 Employee benefits: variable compensation (continued)
Variable compensation including financial advisor variable compensation (continued)
Expenses recognized in 2020
Expenses deferred to 2021 and later
1
USD million
Related to the
2020
performance
year
Related to prior
performance
years
Total
Related to the
2020
performance
year
Related to prior
performance
years
Total
Non-deferred cash
2,167
(26)
2,141
0
0
0
Deferred compensation awards
341
727
1,068
756
288
1,044
of which: Equity Ownership Plan
137
327
463
306
69
376
of which: Deferred Contingent Capital Plan
112
351
463
280
196
476
of which: Long-Term Incentive Plan
42
11
54
50
10
61
of which: Asset Management EOP
49
39
88
120
12
132
Variable compensation – performance awards
2,508
701
3,209
756
288
1,044
Variable compensation – other
2
126
94
220
181
192
374
Total variable compensation excluding financial advisor variable compensation
2,634
795
3,429
938
480
1,418
Financial advisor variable compensation
3,356
233
3,589
350
602
952
of which: non-deferred cash
3,154
0
3,154
0
0
0
of which: deferred share-based awards
69
50
119
79
135
214
of which: deferred cash-based awards
133
183
316
271
467
738
Compensation commitments with recruited financial advisors
3
22
480
502
473
1,682
2,155
Total FA variable compensation
3,378
713
4,091
822
2,284
3,106
Total variable compensation including FA variable compensation
6,012
1,508
7,520
4
1,760
2,764
4,524
1 Estimate as of 31 December 2020. Actual amounts to be expensed in future periods may vary, e.g., due to forfeiture of awards. 2 Consists of replacement payments, forfeiture credits, severance payments, retention
plan payments and interest expense related to the Deferred Contingent Capital Plan. 3 Reflects expenses related to compensation commitments with financial advisors entered into at the time of recruitment that
are subject to vesting requirements. Amounts reflected as deferred expenses represent the maximum deferred exposure as of the balance sheet date. Amounts in the “Related to the 2020 performance year” columns
represent commitments entered into in 2020. 4 Includes USD
686
517
50
financial advisor compensation: USD
119
100
4
million related to role-based allowances; social security: USD
54
42
compensation excluding social security was USD
691
Variable compensation including financial advisor variable compensation (continued)
Expenses recognized in 2019
Expenses deferred to 2020 and later
1
USD million
Related to the
2019
performance
year
Related to prior
performance
years
Total
Related to the
2019
performance
year
Related to prior
performance
years
Total
Non-deferred cash
1,894
(26)
1,868
0
0
0
Deferred compensation awards
299
588
887
429
608
1,036
of which: Equity Ownership Plan
122
300
422
205
219
424
of which: Deferred Contingent Capital Plan
113
262
375
173
365
538
of which: Long-Term Incentive Plan
39
0
39
25
0
25
of which: Asset Management EOP
25
26
51
26
23
49
Variable compensation – performance awards
2,193
562
2,755
429
608
1,036
Variable compensation – other
2
159
88
246
117
232
349
Total variable compensation excluding financial advisor variable compensation
2,352
650
3,001
545
840
1,385
Financial advisor variable compensation
3,233
268
3,501
197
710
907
of which: non-deferred cash
3,064
0
3,064
0
0
0
of which: deferred share-based awards
57
48
106
54
130
183
of which: deferred cash-based awards
112
219
331
144
580
724
Compensation commitments with recruited financial advisors
3
32
510
542
350
1,617
1,967
Total FA variable compensation
3,265
778
4,043
548
2,327
2,874
Total variable compensation including FA variable compensation
5,617
1,428
7,045
4
1,093
3,166
4,259
1 Estimate as of 31 December 2019. Actual amounts expensed may vary, e.g., due to forfeiture of awards. 2 Consists of replacement payments, forfeiture credits, severance payments, retention plan payments and
interest expense related to the Deferred Contingent Capital Plan. 3 Reflects expenses related to compensation commitments with financial advisors entered into at the time of recruitment that are subject to vesting
requirements. Amounts reflected as deferred expenses represent the maximum deferred exposure as of the balance sheet date. Amounts in the “Related to the 2019 performance year” columns represent commitments
entered into in 2019. 4 Includes USD
610
461
43
USD
106
61
10
allowances; social security: USD
25
27
security was USD
619
Consolidated financial statements | UBS Group AG consolidated financial statements
390
Note 28 Employee benefits: variable compensation (continued)
c) Outstanding share-based compensation awards
Share and performance share awards
Movements in outstanding share-based awards during 2021 and 2020 are provided in the table below.
Movements in outstanding share-based compensation awards
Number of shares
2021
Weighted average
grant date fair value
(USD)
Number of shares
2020
Weighted average
grant date fair value
(USD)
Outstanding, at the beginning of the year
174,900,395
12
156,064,763
14
Awarded during the year
68,721,549
15
72,250,157
11
Distributed during the year
(52,137,287)
13
(46,899,362)
15
Forfeited during the year
(10,906,096)
13
(6,515,164)
13
Outstanding, at the end of the year
180,578,561
13
174,900,395
12
of which: shares vested for accounting purposes
107,828,979
118,260,527
The total carrying amount of the liability related to cash-settled share-based awards as of 31 December 2021 and 31 December 2020
was USD
37
36
d) Valuation
UBS share awards
UBS measures compensation expense based on the average
market price of UBS shares on the grant date as quoted on the
SIX Swiss Exchange, taking into consideration post-vesting sale
and hedge restrictions, non-vesting conditions and market
conditions, where applicable. The fair value of the share awards
subject to post-vesting sale and hedge restrictions is discounted
on the basis of the duration of the post-vesting restriction and is
referenced to the cost of purchasing an at-the-money European
put option for the term of the transfer restriction. The grant date
fair value of notional shares without dividend entitlements also
includes a deduction for the present value of future expected
dividends to be paid between the grant date and distribution.
391
Note 29 Interests in subsidiaries and other entities
a) Interests in subsidiaries
UBS defines its significant subsidiaries as those entities that, either
individually or in aggregate, contribute significantly to the
Group’s financial position or results of operations, based on a
number of criteria, including the subsidiaries’ equity and
contribution to the Group’s total assets and profit or loss before
tax, in accordance with the requirements set by IFRS 12, Swiss
regulations and the rules of the US Securities and Exchange
Commission (the SEC).
Individually significant subsidiaries
The two tables below list the Group’s individually significant
subsidiaries as of 31 December 2021. Unless otherwise stated, the
subsidiaries listed below have share capital consisting solely of
ordinary shares held entirely by the Group, and the proportion of
ownership interest held is equal to the voting rights held by the
Group.
The country where the respective registered office is located is
also the principal place of business. UBS AG operates through a
global branch network and a significant proportion of its business
activity is conducted outside Switzerland, including in the UK, the
US, Singapore, Hong Kong SAR and other countries. UBS Europe
SE has branches and offices in a number of EU Member States,
including Germany, Italy, Luxembourg and Spain. Share capital is
provided in the currency of the legally registered office.
Individually significant subsidiaries of UBS Group AG as of 31 December 2021
Company
Registered office
Share capital in million
Equity interest accumulated in %
UBS AG
Zurich and Basel, Switzerland
CHF
385.8
100.0
UBS Business Solutions AG
1
Zurich, Switzerland
CHF
1.0
100.0
1 UBS Business Solutions AG holds subsidiaries in China, India, Israel and Poland.
Individually significant subsidiaries of UBS AG as of 31 December 2021
1
Company
Registered office
Primary business
Share capital in million
Equity interest accumulated in %
UBS Americas Holding LLC
Wilmington, Delaware, USA
Group Functions
USD
4,150.0
2
100.0
UBS Americas Inc.
Wilmington, Delaware, USA
Group Functions
USD
0.0
100.0
UBS Asset Management AG
Zurich, Switzerland
Asset Management
CHF
43.2
100.0
UBS Bank USA
Salt Lake City, Utah, USA
Global Wealth Management
USD
0.0
100.0
UBS Europe SE
Frankfurt, Germany
Global Wealth Management
EUR
446.0
100.0
UBS Financial Services Inc.
Wilmington, Delaware, USA
Global Wealth Management
USD
0.0
100.0
UBS Securities LLC
Wilmington, Delaware, USA
Investment Bank
USD
1,283.1
3
100.0
UBS Switzerland AG
Zurich, Switzerland
Personal & Corporate Banking
CHF
10.0
100.0
1 Includes direct and indirect subsidiaries of UBS AG. 2 Consists of common share capital of USD
1,000
4,150,000,000
. 3 Consists of common share capital of USD
100,000
1,283,000,000
.
Consolidated financial statements | UBS Group AG consolidated financial statements
392
Note 29 Interests in subsidiaries and other entities (continued)
Other subsidiaries
The table below lists other direct and indirect subsidiaries of UBS AG that are not individually significant but contribute to the Group’s
total assets and aggregated profit before tax thresholds and are thus disclosed in accordance with requirements set by the SEC.
Other subsidiaries of UBS AG as of 31 December 2021
Company
Registered office
Primary business
Share capital in million
Equity interest
accumulated in %
UBS Asset Management (Americas) Inc.
Wilmington, Delaware, USA
Asset Management
USD
0.0
100.0
UBS Asset Management (Hong Kong) Limited
Hong Kong SAR, China
Asset Management
HKD
254.0
100.0
UBS Asset Management Life Ltd
London, United Kingdom
Asset Management
GBP
15.0
100.0
UBS Asset Management Switzerland AG
Zurich, Switzerland
Asset Management
CHF
0.5
100.0
UBS Business Solutions US LLC
Wilmington, Delaware, USA
Group Functions
USD
0.0
100.0
UBS Credit Corp.
Wilmington, Delaware, USA
Global Wealth Management
USD
0.0
100.0
UBS (France) S.A.
Paris, France
Global Wealth Management
EUR
133.0
100.0
UBS Fund Management (Luxembourg) S.A.
Luxembourg, Luxembourg
Asset Management
EUR
13.0
100.0
UBS Fund Management (Switzerland) AG
Basel, Switzerland
Asset Management
CHF
1.0
100.0
UBS (Monaco) S.A.
Monte Carlo, Monaco
Global Wealth Management
EUR
49.2
100.0
UBS O‘Connor LLC
Wilmington, Delaware, USA
Asset Management
USD
1.0
100.0
UBS Realty Investors LLC
Boston, Massachusetts, USA
Asset Management
USD
9.0
100.0
UBS Securities Australia Ltd
Sydney, Australia
Investment Bank
AUD
0.3
1
100.0
UBS Securities Hong Kong Limited
Hong Kong SAR, China
Investment Bank
HKD
4,154.2
100.0
UBS Securities Japan Co., Ltd.
Tokyo, Japan
Investment Bank
JPY
34,708.7
100.0
UBS SuMi TRUST Wealth Management Co., Ltd.
Tokyo, Japan
Global Wealth Management
JPY
5,165.0
51.0
1 Includes a nominal amount relating to redeemable preference shares.
Consolidated structured entities
Consolidated structured entities (SEs) include certain investment
funds, securitization vehicles and client investment vehicles. UBS
has no individually significant subsidiaries that are SEs.
In
2021 and 2020,
the Group did not enter into any
contractual obligation that could require the Group to provide
financial support to consolidated SEs. In addition, the Group did
not provide support, financial or otherwise, to a consolidated SE
when the Group was not contractually obligated to do so, nor
does
the Grou
p
have
an
y
intention to do so in the future.
Furthermore, the Group did not provide support, financial or
otherwise, to a previously unconsolidated SE that resulted in the
Group controlling the SE during the reporting period.
393
Note 29 Interests in subsidiaries and other entities (continued)
b) Interests in associates and joint ventures
As of 31 December 2021 and 2020, no associate or joint venture
was individually material to the Group. Also, there were no
significant restrictions on the ability of associates or joint ventures
to transfer funds to UBS Group AG or its subsidiaries as cash
dividends or to repay loans or advances made. There were no
quoted market prices for any associates or joint ventures of the
Group.
Investments in associates and joint ventures
USD million
2021
2020
Carrying amount at the beginning of the year
1,557
1,051
Additions
1
388
Reclassifications
1
(386)
0
Share of comprehensive income
150
83
of which: share of net profit
2
105
84
of which: share of other comprehensive income
3
45
(1)
Share of changes in retained earnings
1
(40)
Dividends received
(39)
(33)
Foreign currency translation
(39)
108
Carrying amount at the end of the year
1,243
1,557
of which: associates
1,200
1,513
of which: SIX Group AG, Zurich
4
1,043
965
of which: Clearstream Fund Centre AG, Zurich
1
399
of which: other associates
157
150
of which: joint ventures
43
44
1 In the second quarter of 2021, UBS reclassified its minority investment (
48.8
%) in Clearstream Fund Centre AG (previously Fondcenter AG) of USD
386
sale and sold the investment in the same quarter. Refer to Note 30 for more information. 2 For 2021, consists of USD
79
26
64
million from associates and USD
19
44
1
1
associates. 4 In 2021, UBS AG’s equity interest amounted to
17.31
%. UBS AG is represented on the Board of Directors.
Consolidated financial statements | UBS Group AG consolidated financial statements
394
Note 29 Interests in subsidiaries and other entities (continued)
c) Unconsolidated structured entities
UBS is considered to sponsor another entity if, in addition to
ongoing involvement with
the
entity, it had a key role in
establishing that entity or in bringing together relevant
counterparties for a transaction facilitated by the entity. During
2021
,
the
Group sponsored the creation of various SEs and
interacted with a number of non-sponsored SEs, including
securitization vehicles, client vehicles and certain investment
funds, that UBS did not consolidate as of 31 December 2021
because it did not control them.
Interests in unconsolidated structured entities
The table below presents the Group’s interests in and maximum
exposure to loss from unconsolidated SEs, as well as the total
assets held by the SEs in which UBS had an interest as of year-
end, except for investment funds sponsored by third parties, for
which the carrying amount of UBS’s interest as of year-end has
been disclosed.
Sponsored unconsolidated structured entities in which UBS did
not have an interest at year-end
During 2021 and 2020, the Group did not earn material income
from sponsored unconsolidated SEs in which UBS did not have an
interest at year-end.
During 2021 and 2020, UBS and third parties did not transfer
any assets into sponsored securitization vehicles created in the
year. UBS and third parties transferred assets, alongside deposits
and debt issuances (which are assets from the perspective of the
vehicle), of USD
1
2
sponsored client vehicles created in 2021 (2020: USD
0
USD
9
transfers arose during the period as investors invested and
redeemed positions, thereby changing the overall size of the
funds, which, when combined with market movements, resulted
in a total closing net asset value of USD
46
2020: USD
37
Interests in unconsolidated structured entities
31.12.21
USD million, except where indicated
Securitization
vehicles
Client
vehicles
Investment
funds
Total
Maximum
exposure to loss
1
Financial assets at fair value held for trading
246
162
6,743
7,151
7,151
Derivative financial instruments
5
45
155
205
205
Loans and advances to customers
125
125
125
Financial assets at fair value not held for trading
35
222
257
257
Financial assets measured at fair value through other comprehensive income
324
4,525
4,849
4,849
Other financial assets measured at amortized cost
0
2
0
1
250
Total assets
610
3
4,732
7,247
12,588
Derivative financial instruments
2
11
281
294
Total liabilities
2
11
281
294
Assets held by the unconsolidated structured entities in which UBS had an interest
(USD billion)
30
4
81
5
158
6
31.12.20
USD million, except where indicated
Securitization
vehicles
Client
vehicles
Investment
funds
Total
Maximum
exposure to loss
1
Financial assets at fair value held for trading
375
131
7,595
8,101
8,101
Derivative financial instruments
6
49
158
213
211
Loans and advances to customers
179
179
179
Financial assets at fair value not held for trading
35
1
2
172
208
208
Financial assets measured at fair value through other comprehensive income
6,624
6,624
6,624
Other financial assets measured at amortized cost
0
2
0
250
Total assets
416
3
6,805
8,104
15,326
Derivative financial instruments
3
11
376
390
0
Total liabilities
3
11
376
390
Assets held by the unconsolidated structured entities in which UBS had an interest
(USD billion)
39
4
136
5
124
6
1 For the purpose of this disclosure, maximum exposure to loss amounts do not consider the risk-reducing effects of collateral or other credit enhancements. 2 Represents the carrying amount of loan commitments.
The maximum exposure to loss for these instruments is equal to the notional amount. 3 As of 31 December 2021, USD
0.1
0.6
0.2
0.4
was held in Group Functions – Non-core and Legacy Portfolio. 4 Represents the principal amount outstanding. 5 Represents the market value of total assets. 6 Represents the net asset value of the investment
funds sponsored by UBS and the carrying amount of UBS’s interests in the investment funds not sponsored by UBS. In 2021, UBS updated the presentation of this table to remove its interests in unconsolidated
structured investment funds and the corresponding total asset information, where UBS’s interest is driven solely from UBS’s role as the fund’s investment manager and the fees it receives. This information is now
separately disclosed in the accompanying text on the following page. Prior-period information has been aligned with this new presentation.
395
Note 29 Interests in subsidiaries and other entities (continued)
The Group retains or purchases interests in unconsolidated SEs
in the form of direct investments, financing, guarantees, letters of
credit, derivatives, as well as through management contracts. The
Group’s maximum exposure to loss is generally equal to the
carrying amount of the Group’s interest in the SE, with this subject
to change over time with market movements. Guarantees, letters
of credit and credit derivatives are an exception, with the
contract’s notional amount, adjusted for losses already incurred,
representing the maximum loss that the Group is exposed to.
The maximum exposure to loss disclosed in the table on the
previous page does not reflect the Group’s risk management
activities, including effects from financial instruments that may be
used to economically hedge risks inherent in the unconsolidated
SE or
risk
-
reducing effects of collateral or other credit
enhancements.
In 2021 and 2020, the Group did not provide support, financial
or otherwise, to an unconsolidated SE when not contractually
obligated to do so, nor does the Group have any intention to do
so in the future.
In 2021 and 2020, income and expenses from interests in
unconsolidated SEs primarily resulted from mark-to-market
movements recognized in
Other net income from financial
instruments measured at fair value through profit of loss
, which
have generally been hedged with other financial instruments, as
well as fee and commission income received from UBS-
sponsored funds.
Interests in securitization vehicles
As of 31 December 2021 and 31 December 2020, the Group held
interests, both retained and acquired, in various securitization
vehicles that relate to financing, underwriting, secondary market
and derivative trading activities.
The numbers outlined in the table on the previous page may
differ from the securitization positions presented in the
31
December
2021
Pillar
3
R
eport
, available
under “Pillar
3
disclosures” at
ubs.com/investors
, for the following reasons:
(i) exclusion of synthetic securitizations transacted with entities
that are not SEs and transactions in which the Group did not
have an interest because it did not absorb any risk ; (ii) a different
measurement basis in certain cases (e.g., IFRS carrying amount
within the previous table compared with net exposure amount
at default for Pillar 3 disclosures) ; and (iii) different classification
of vehicles viewed as sponsored by the Group versus sponsored
by third parties.
›
Refer to the 31 December 2021 Pillar 3 Report, available under
“Pillar 3 disclosures” at
ubs.com/investors
,
for more information
Interests in client vehicles
Client vehicles are established predominantly for clients to gain
exposure to specific assets or risk exposures. Such vehicles may
enter into derivative agreements, with UBS or a third party, to
align the cash flows of the entity with the investor’s intended
investment objective, or to introduce other desired risk exposures.
As of 31 December 2021 and 31 December 2020, the Group
retained interests in client vehicles sponsored by UBS and third
parties that relate to financing, secondary market and derivative
trading activities, and to hedge structured product offerings.
Interests in investment funds
Investment funds have a collective investment objective, and are
either passively managed, so that any decision making does not
have a substantive effect on variability, or are actively managed
and investors or their governing bodies do not have substantive
voting or similar rights.
The Group holds interests in a number of investment funds,
primarily resulting from seed investments or in order to hedge
structured product offerings. In addition to the interests disclosed
in the table on the previous page, the Group manages the assets
of various pooled investment funds and receives fees based, in
whole or part, on the net asset value of the fund and / or the
performance of the fund. The specific fee structure is determined
based on various market factors and considers the fund’s nature
and the jurisdiction of incorporation, as well as fee schedules
negotiated with clients. These fee contracts represent an interest
in the fund, as they align the Group’s exposure with investors,
providing a variable return based on the performance of the
entity. Depending on the structure of the fund, these fees may be
collected directly from the fund
’s
assets and
/
or from the
investors. Any amounts due are collected on a regular basis and
are generally backed by the fund’s assets. Therefore interest in
such funds is not represented by the on-balance sheet fee
receivable but rather by the future exposure to variable fees. The
total assets of such funds were USD
370
359
billion
as
of
31
December
2021
and 31
December
2020,
respectively, and have been excluded from the table on the
previous page. The Group did not have any material exposure to
loss from these interests as of 31 December 2021 or as of
31 December 2020.
Consolidated financial statements | UBS Group AG consolidated financial statements
396
Note 30 Changes in organization and acquisitions and disposals of subsidiaries and businesses
Strategic partnership with Sumitomo Mitsui Trust Holdings
In 2019, UBS entered into a strategic wealth management
partnership in Japan with Sumitomo Mitsui Trust Holdings, Inc.
(SuMi Trust Holdings). In January 2020, the first phase was
launched, with operations commencing in the joint venture that
was established to promote the respective services. At the time,
UBS and SuMi Trust Holdings also started offering each other’s
products and services to their respective clients.
In the third quarter of 2021, the second phase of the
partnership was completed, with the launch of a new operational
partnership entity, UBS SuMi TRUST Wealth Management Co.,
Ltd., which is
51
%-owned and controlled by UBS, requiring UBS
to consolidate this entity. The new entity offers global securities
and wealth management capabilities, together with the custody,
real estate, inheritance and wealth transfer expertise of a
Japanese trust banking group. Upon completion of this
transaction in the third quarter of 2021, shareholders’ equity of
the Group increased by USD
155
or loss.
Disposals of subsidiaries and businesses
Sale of remaining investment in Clearstream Fund Centre AG
In the second quarter of 2021, UBS sold its remaining minority
investment in Clearstream Fund Centre AG to Deutsche Börse AG
for CHF
390
majority investment and successful transfer of control of
Fondcenter AG to Deutsche Börse AG in 2020, when UBS
recognized a post-tax gain on sale of USD
631
Other
income
. The sale of the remaining
48.8
% investment resulted in
a post-tax gain of USD
37
in
Other income
, with no associated net tax expense. Long-term
commercial cooperation arrangements remain in place for the
provision of services by Clearstream to UBS, including jointly
servicing banks and insurance companies.
Sale of wealth management business in Austria
In the third quarter of 2021, UBS completed the sale of its
domestic wealth management business in Austria to LGT. The sale
resulted in a pre-tax gain of USD
100
recognized in
Other income
, and an associated tax expense of
USD
25
Sale of wealth management business in Spain in 2022
In October 2021, UBS signed an agreement to sell its domestic
wealth management business in Spain to Singular Bank. The
agreement includes the transition of employees, client
relationships, products and services of the wealth management
business of UBS in Spain. The transaction is subject to customary
closing conditions and is expected to close in the third quarter of
2022.
As of 31 December 2021, the assets and liabilities of the
business were presented in Global Wealth Management as a
disposal group held for sale within
Other non-financial assets
Other non-financial liabilities
647
and USD
823
million, respectively. Upon the closing of the
transaction, UBS expects to record a pre-tax gain of approximately
USD
0.2
Sale of UBS Swiss Financial Advisers AG in 2022
In December 2021, UBS signed an agreement to sell its wholly
owned subsidiary UBS Swiss Financial Advisers AG (SFA) to
Vontobel. SFA is an SEC-registered investment advisor and
FINMA-licensed securities firm that offers US clients tailored
investment solutions in a Switzerland-based environment. The
transaction is subject to customary closing conditions and
regulatory approvals and is expected to close in the third quarter
of 2022.
As of 31 December 2021, the assets and liabilities that are
subject to the transaction
were
presented in Global Wealth
Management as a disposal group held for sale within
Other non-
financial assets
Other non-financial liabilities
to USD
446
475
closing of the transaction, UBS does not expect a material effect
on profit or loss or shareholders’ equity of the Group.
Acquisitions of subsidiaries and businesses in 2022
Acquisition of Wealthfront in 2022
In January 2022, UBS entered into an agreement to acquire
Wealthfront, an industry-leading digital wealth management
provider, for a cash consideration of USD
1.4
acquisition is aligned with UBS’s growth strategy in the Americas,
will broaden our reach among affluent investors and will add a
new digital-first offering increasing our distribution capabilities.
The transaction is subject to customary closing conditions,
including regulatory approvals, and is expected to close in the
second half of 2022. Upon the closing of the transaction,
Wealthfront will become a wholly owned subsidiary of UBS and
UBS expects to recognize additional goodwill and other intangible
assets of approximately USD
1.2
397
Note
31 Related parties
UBS defines related parties as associates (entities
that
are
significantly influenced by UBS), joint ventures (entities in which
UBS shares control with another party), post-employment benefit
plans for UBS employees, key management personnel, close
family members of key management personnel and entities that
are, directly or indirectly, controlled or jointly controlled by key
management personnel or their close family members. Key
management personnel is defined as members of the Board of
Directors (BoD) and Group Executive Board (GEB).
a) Remuneration of key management personnel
The Chairman of the BoD has a specific management employment contract and receives pension benefits upon retirement. Total
remuneration of the Chairman of the BoD and all GEB members is included in the table below.
Remuneration of key management personnel
USD million, except where indicated
31.12.21
31.12.20
31.12.19
Base salaries and other cash payments
1
31
33
32
Incentive awards – cash
2
17
18
14
Annual incentive award under DCCP
26
27
21
Employer’s contributions to retirement benefit plans
3
3
3
Benefits in kind, fringe benefits (at market value)
1
1
1
Share-based compensation
3
45
47
37
Total
124
129
108
Total (CHF million)
4
113
121
107
1 May include role-based allowances in line with market practice and regulatory requirements. 2 The cash portion may also include blocked shares in line with regulatory requirements. 3 Compensation expense
is based on the share price on grant date taking into account performance conditions. Refer to Note 27 for more information. For GEB members, share-based compensation for 2021, 2020 and 2019 was entirely
composed of LTIP awards.For the Chairman of the BoD the share-based compensation for 2021, 2020 and 2019 was entirely composed of UBS shares. 4 Swiss franc amounts disclosed represent the respective US
dollar amounts translated at the applicable performance award currency exchange rates (2021: USD / CHF
0.92
; 2020: USD / CHF
0.94
; 2019: USD / CHF
0.99
).
The independent members of the BoD do not have employment
or service contracts with UBS, and thus are not entitled to benefits
upon termination of their service on the BoD. Payments to these
individuals for their services as external board members amounted
to USD
7.5
6.9
7.0
(CHF
6.6
7.3
7.3
2019.
b) Equity holdings of key management personnel
Equity holdings of key management personnel
1
31.12.21
31.12.20
Number of shares held by members of the BoD, GEB and parties closely linked to them
2
4,597,006
5,288,317
1 No options were held in 2021 and 2020 by non-independent members of the BoD and any GEB member or any of its related parties. 2 Excludes shares granted under variable compensation plans with forfeiture
provisions.
Of the share totals above, no shares were held by close family
members of key management personnel on 31 December 2021
and 31 December 2020. No shares were held by entities that are
directly or indirectly controlled or jointly controlled by key
management personnel or their close family members on
31 December 2021 and 31 December 2020. As of 31 December
2021, no member of the BoD or GEB was the beneficial owner of
more than 1% of UBS Group AG’s shares.
Consolidated financial statements | UBS Group AG consolidated financial statements
398
Note 31 Related parties (continued)
c) Loans, advances and mortgages to key management personnel
The non-independent members of the BoD and GEB members are
granted loans, fixed advances and mortgages in the ordinary
course of business on substantially the same terms and conditions
that are available to other employees, including interest rates and
collateral, and neither involve more than
the normal risk of
collectability nor contain any other unfavorable features for the
firm. Independent BoD members are granted loans and
mortgages in the ordinary course of business at general market
conditions.
Movements in the loan, advances and mortgage balances are
as follows
.
Loans, advances and mortgages to key management personnel
1
USD million, except where indicated
2021
2020
Balance at the beginning of the year
38
33
Additions
11
14
Reductions
(15)
(8)
Balance at the end of the year
2
34
38
Balance at the end of the year (CHF million)
2, 3
31
34
1 All loans are secured loans. 2 There were no unused uncommitted credit facilities as of 31 December 2021 and 31 December 2020. 3 Swiss franc amounts disclosed represent the respective US dollar amounts
translated at the relevant year-end closing exchange rate.
d) Other related-party transactions with entities controlled by key management personnel
In 2021 and 2020, UBS did not enter into transactions with
entities that are directly or indirectly controlled or jointly
controlled by UBS’s key management personnel or their close
family members and as of 31 December 2021, 31 December
20
20
and 31
December 201
9
, there were no outstanding
balances related to such transactions. Furthermore, in 2021 and
2020, entities controlled by key management personnel did not
sell any goods or provide any services to UBS, and therefore did
not receive any fees from UBS. UBS also did not provide services
to such entities in 2021 and 2020, and therefore also received no
fees.
e) Transactions with associates and joint ventures
Loans to and outstanding receivables from associates and joint ventures
USD million
2021
2020
Carrying amount at the beginning of the year
630
982
Additions
133
527
Reductions
(497)
(1,001)
Foreign currency translation
(14)
123
Carrying amount at the end of the year
251
630
of which: unsecured loans and receivables
243
621
Other transactions with associates and joint ventures
As of or for the year ended
USD million
31.12.21
31.12.20
Payments to associates and joint ventures for goods and services received
157
139
Fees received for services provided to associates and joint ventures
104
128
Liabilities to associates and joint ventures
127
91
Commitments and contingent liabilities to associates and joint ventures
7
9
›
Refer to Note 29 for an overview of investments in associates and joint ventures
399
Note 32 Invested assets and net new money
The following disclosures provide a bre akdown of UBS’s invested
assets and a presentation of their development, including net new
money, as required by the Swiss Financial Market Supervisory
Authority.
Invested assets
Invested assets consist of all client assets managed by or deposited
with UBS
for investment purposes. Invested assets include
managed fund assets, managed institutional assets, discretionary
and advisory wealth management portfolios, fiduciary deposits,
time deposits, savings accounts, and wealth management
securities or brokerage
accounts. All assets held for purely
transactional purposes and custody-only assets, including
corporate client assets held for cash management and
transactional purposes, are excluded from invested assets, as the
Group only administers the assets and does not offer advice on
how they should be invested. Also excluded are non-bankable
assets (e.g., art collections) and deposits from third-party banks
for funding or trading purposes.
Discretionary assets are defined as client assets that UBS
decides how to invest. Other invested assets are those where the
client ultimately decides how the assets are invested. When a
single product is created in one business division and sold in
another, it is counted in both the business division managing the
investment and the one distributing it. This results in double
counting within UBS total invested assets, as both business
divisions are independently providing a service to their respective
clients, and both add value and generate revenue.
Net new money
Net new money in a reporting period is the amount of invested
assets entrusted to UBS by new and existing clients, less those
withdrawn by existing clients and clients who terminated
relationships with UBS.
Net new money is calculated using the direct method, under
which inflows and outflows to
/
from invested assets are
determined at the client level, based on transactions. Interest and
dividend income from invested assets are not counted as net new
money inflows. Market and currency movements, as well as fees,
commissions and interest on loans charged, are excluded from net
new money, as are effects resulting from any acquisition or
divestment of a UBS subsidiary or business. Reclassifications
between invested assets and custody-only assets as a result of a
change in service level delivered are generally treated as net new
money flows. However, where the change in service level directly
results from an externally imposed regulation or a strategic decision
by UBS to exit a market or specific service offering, the one-time net
effect is reported as
Other effects
.
The Investment Bank does not track invested assets and net
new money. However, when a client is transferred from the
Investment Bank to another business division, this may produce
net new money even though the client assets were already with
UBS.
Invested assets and net new money
As of or for the year ended
USD billion
31.12.21
31.12.20
Fund assets managed by UBS
419
397
Discretionary assets
1,705
1,459
Other invested assets
2,472
2,331
Total invested assets
1
4,596
4,187
of which: double counts
356
311
Net new money
1
159
127
1 Includes double counts.
Development of invested assets
USD billion
2021
2020
Total invested assets at the beginning of the year
1
4,187
3,607
Net new money
159
127
Market movements
2
339
359
Foreign currency translation
(65)
96
Other effects
(24)
(1)
of which: acquisitions / (divestments)
(5)
0
Total invested assets at the end of the year
1
4,596
4,187
1 Includes double counts. 2 Includes interest and dividend income.
Consolidated financial statements | UBS Group AG consolidated financial statements
400
Note 33 Currency translation rates
The following table shows the rates of the main currencies used to translate the financial information of UBS’s operations with a
functional currency other than the US dollar into US dollars.
Closing exchange rate
Average rate
1
As of
For the year ended
31.12.21
31.12.20
31.12.21
31.12.20
31.12.19
1 CHF
1.10
1.13
1.09
1.07
1.01
1 EUR
1.14
1.22
1.18
1.15
1.12
1 GBP
1.35
1.37
1.37
1.29
1.28
100 JPY
0.87
0.97
0.91
0.94
0.92
1 Monthly income statement items of operations with a functional currency other than the US dollar are translated into US dollars using month-end rates. Disclosed average rates for a year represent an average of 12
month-end rates, weighted according to the income and expense volumes of all operations of the Group with the same functional currency for each month. Weighted average rates for individual business divisions
may deviate from the weighted average rates for the Group.
Note 34 Events after the reporting period
Russia’s invasion of Ukraine
Russia’s invasion of Ukraine on 24 February 2022 has triggered
disruptions and uncertainties in the markets and the global
economy, as well as coordinated implementation of sanctions by
Switzerland, the United States, the European Union, the United
Kingdom and others against Russia and, certain Russian entities
and nationals. These events, together with potential counter-
sanctions and other measures taken by Russia, impact UBS’s
businesses.
UBS’s country risk exposure to Russia was approximately
USD
0.6
2021. This exposure has been reduced since year-end 2021. In
addition, UBS is currently monitoring settlement risk on certain
open transactions with Russian bank- or non-bank counterparties
or Russian underlyings, as market closures, the imposition of
exchange controls, sanctions or other measures may limit our
ability to settle existing transactions or to realize on collateral,
which may result in unexpected increases in exposures. UBS’s
balance sheet as of 31 December 2021 also included net assets of
USD
51
As of 3 March 2022, UBS also had approximately USD
0.2
of exposure arising from reliance on Russian assets as collateral on
Lombard lending and other secured financing in Global Wealth
Management.
As of 3 March 2022, UBS identified a small number of Global
Wealth Management clients subject to the recently introduced
sanctions with total loans outstanding of under USD
10
UBS continues to closely monitor related effects on its financial
statements, including estimated direct and indirect impacts on
expected credit loss calculations and on fair value measurement
of assets, liabilities and off-balance sheet exposures. The situation
continues to evolve and broader implications for other
counterparties of UBS, including financial institutions, are not
possible to assess at this time; however, there were no material
adverse effects on UBS’s financial statements as of 4 March 2022.
›
Refer to “Top and emerging risks” and “Country risk” in the
“Risk management and control” section and to “Performance in
the financial services industry is affected by market conditions
and the macroeconomic climate” in the “Risk factors” section of
this report for more information
401
Note 35 Main differences between IFRS and Swiss GAAP
The consolidated financial statements of UBS Group AG are
prepared in accordance with International Financial Reporting
Standards (IFRS). The Swiss Financial Market Supervisory Authority
(FINMA) requires financial groups presenting financial statements
under IFRS to provide a narrative explanation of the main
differences between IFRS and Swiss
g
enerally accepted
accounting principles (GAAP) (the FINMA Accounting Ordinance,
FINMA Circular 2020/1 “Accounting – banks” and the Banking
Ordinance (the BO)). Included in this Note are the significant
differences in the recognition and measurement between IFRS
and the provisions of the
BO
and the guidelines of FINMA
governing true and fair view financial statement reporting
pursuant to Art. 25 to Art. 42 of the BO.
1. Consolidation
Under IFRS, all entities that are controlled by the holding entity
are consolidated. Under Swiss GAAP, controlled entities deemed
immaterial to the Group or held only temporarily are exempt from
consolidation, but instead are recorded as participations
accounted for under the equity method of accounting or as
financial investments measured at the lower of cost or market
value.
2. Classification and measurement of financial assets
Under IFRS, debt instruments are measured at amortized cost, fair
value through other comprehensive income (FVOCI) or fair value
through profit or loss (FVTPL), depending on the nature of the
business model within which the asset is held and the
characteristics of the contractual cash flows of the asset. Equity
instruments are accounted for at FVTPL by UBS. Under Swiss
GAAP, trading assets and derivatives are measured at FVTPL in line
with IFRS. However, non-trading debt instruments are generally
measured at amortized cost, even when the assets are managed
on a fair value basis. In addition, the measurement of financial
assets in the form of securities depends on the nature of the asset:
debt instruments not held to maturity, i.e., instruments available
for sale,
and
equity instruments
with no permanent holding
intent, are classified as
Financial investments
lower of (amortized) cost or market value. Market value
adjustments up to the original cost amount and realized gains or
losses upon disposal of the investment are recorded in the income
statement as
Other income
from
ordinary activities.
Equity
instruments with a permanent holding intent are classified as
participations in
Non-consolidated investments in subsidiaries and
other participations
Impairment losses are recorded in the income statement as
Impairment of investments in non-consolidated subsidiaries and
other participations.
cost amount and realized gains or losses upon disposal of the
investment are recorded as
Extraordinary income
Extraordinary
expenses
.
3. Fair value option applied to financial liabilities
Under IFRS, UBS applies the fair value option to certain financial
liabilities not held for trading. Instruments for which the fair value
option is applied are accounted for at FVTPL. The amount of
change in the fair value attributable to changes in UBS’s own
credit is presented in
Other comprehensive income
Retained earnings
. The fair value option is applied primarily to
issued structured debt instruments, certain non-structured debt
instruments, certain payables under repurchase agreements and
cash collateral on securities lending agreements, amounts due
under unit-linked investment contracts, and brokerage payables.
Under Swiss GAAP, the fair value option can only be applied to
structured debt instruments consisting of a debt host contract and
one or more embedded derivatives that do not relate to own
equity. Furthermore, unrealized changes in fair value attributable
to changes in UBS’s own credit are not recognized, whereas
realized own credit is recognized in
.
4. Allowances and provisions for credit losses
Swiss GAAP permit use of IFRS for accounting for allowances and
provisions for credit losses based on an expected credit loss (ECL)
model. UBS has chosen to apply the IFRS 9 ECL approach to the
substantial majority of exposures in scope of Swiss GAAP ECL
requirements, including all exposures in scope of ECL under both
Swiss GAAP and IFRS.
In addition, for a small population of exposures within the
scope of Swiss GAAP ECL requirements, which are not subject to
ECL under
IFRS due to classification and measurements
differences, UBS applies an alternative approach. Where Pillar 1
internal ratings-based (IRB) models are applied to measure credit
risk, ECL for such exposures is determined by the regulatory
expected loss (EL), with an add-on for scaling up to the residual
maturity of exposures maturing beyond the next 12 months. For
detailed information on regulatory EL, refer to the
“
Risk
management and control” section of this report. For exposures
where the Pillar 1 standardized approach (SA) is used to measure
credit risk, ECL is determined using a portfolio approach that
derives a conservative probability of default (PD) and loss given
default (LGD) for the entire portfolio.
5. Hedge accounting
Under IFRS, when cash flow hedge accounting is applied, the fair
value gain or loss on the effective portion of
a
derivative
designated as a cash flow hedge is recognized initially in equity
and reclassified to the income statement when certain conditions
are met. When fair value hedge accounting is applied, the fair
value change of the hedged item attributable to the hedged risk
is reflected in the measurement of the hedged item and is
recognized in the income statement along with the change in the
fair value of the hedging derivative. Under Swiss GAAP, the
effective portion of the fair value change of
a
derivative
instrument designated as a cash flow or as a fair value hedge is
deferred on the balance sheet as
Other assets
Other liabilities
.
The carrying amount of the hedged item designated in fair value
hedges is not adjusted for fair value changes attributable to the
hedged risk.
Consolidated financial statements | UBS Group AG consolidated financial statements
402
Note 35 Main differences between IFRS and Swiss GAAP (continued)
6. Goodwill and intangible assets
Under IFRS, goodwill acquired in a business combination is not
amortized but tested annually for impairment. Intangible assets
with an indefinite useful life are also not amortized but tested
annually for impairment.
Under Swiss GAAP, goodwill and
intangible assets with indefinite useful lives are amortized over a
period not exceeding five years, unless a longer useful life, which
may not exceed
10
are tested annually for impairment.
7. Post-employment benefit plans
Swiss GAAP permit the use of IFRS or Swiss accounting standards
for post-employment benefit plans, with the election made on a
plan-by-plan basis.
UBS has elected to apply IFRS (IAS 19) for the non-Swiss
defined benefit plans in
the
UBS AG standalone financial
statements and Swiss GAAP (FER 16) for the Swiss pension plan
in the UBS AG and the UBS Switzerland AG standalone financial
statements. The requirements of Swiss GAAP are better aligned
with the specific nature of Swiss pension plans, which are hybrid
in that they combine elements of defined contribution and
defined benefit plans, but are treated as defined benefit plans
under IFRS. Key differences between Swiss GAAP and IFRS include
the treatment of dynamic elements, such as future salary increases
and future interest credits on retirement savings, which are not
considered under the static method used in accordance with Swiss
GAAP. Also, the discount rate used to determine the defined
benefit obligation in accordance with IFRS is based on the yield of
high-quality corporate bonds of the market in the respective
pension plan country. The discount rate used in accordance with
Swiss GAAP (i.e., the technical interest rate) is determined by the
Pension Foundation Board based on the expected returns of the
Board’s investment strategy.
For defined benefit plans, IFRS require the full defined benefit
obligation net of the plan assets to be recorded on the balance
sheet subject to the asset ceiling rules, with changes resulting
from remeasurements recognized directly in equity. However, for
non-Swiss defined benefit plans for which IFRS accounting is
elected, changes due to remeasurements are recognized in the
income statement of UBS AG standalone under Swiss GAAP.
Swiss GAAP require employer contributions to the pension
fund to be recognized as personnel expenses in the income
statement. Swiss GAAP also require an assessment of whether,
based on the pension fund’s financial statements prepared in
accordance with Swiss accounting standards
(FER 26), an
economic benefit to, or obligation of, the employer arises from
the pension fund that is recognized in the balance sheet when
conditions are met. Conditions for recording a pension asset or
liability would be met if, for example, an employer contribution
reserve is available or the employer is required to contribute to the
reduction of a pension deficit (on an FER 26 basis).
8. Leasing
Under IFRS, a single lease accounting model applies that requires
UBS to record a right-of-use (RoU) asset and a corresponding lease
liability on the balance sheet when UBS is a lessee in a lease
arrangement. The RoU asset and the lease liability are recognized
when UBS acquires control of the physical use of the asset. The
lease liability is measured based on the present value of the lease
payments over the lease term, discounted using UBS’s unsecured
borrowing rate. The RoU asset is recorded at an amount equal to
the lease liability but is adjusted for rent prepayments, initial direct
costs, any costs to refurbish the leased asset and / or lease
incentives received. The RoU asset is depreciated over the shorter
of the lease term or the useful life of the underlying asset.
Under Swiss GAAP, leases that transfer substantially all the risks
and rewards, but not necessarily legal title in the underlying
assets, are classified as finance leases. All other leases are
classified as operating leases. Whereas finance leases are
recognized on the balance sheet and measured in line with IFRS,
operating leases are not recognized on the balance sheet, with
payments recognized as
General and administrative expenses
a straight-line basis over the lease term, which commences with
control of the physical use of the asset. Lease incentives are
treated as a reduction of rental expense and recognized on a
consistent basis over the lease term.
9. Netting of derivative assets and liabilities
Under IFRS, derivative assets, derivative liabilities and related cash
collateral not settled to market are reported on a gross basis
unless the restrictive IFRS netting requirements are met: (i)
existence of master netting agreements and related collateral
arrangements that are unconditional and legally enforceable, in
both the normal course of business and the event of default,
bankruptcy or insolvency of UBS and its counterparties; and (ii)
UBS’s intention to either settle on a net basis or to realize the asset
and settle the liability simultaneously.
Under Swiss GAAP,
derivative assets, derivative liabilities and related cash collateral
not settled to market are generally reported on a net basis,
provided the master netting and the related collateral agreements
are legally enforceable in the event of default, bankruptcy or
insolvency of UBS’s counterparties.
10. Negative interest
Under IFRS, negative interest income arising on a financial asset
does not meet the definition of interest income and, therefore,
negative interest on financial assets and negative interest on
financial liabilities are presented within interest expense and
interest income, respectively. Under Swiss GAAP, negative interest
on financial assets is presented within interest income and
negative interest on financial liabilities is presented within interest
expense.
11. Extraordinary income and expense
Certain non-recurring and non-operating income and expense
items, such as realized gains or losses from the disposal of
participations, fixed and intangible assets, a
nd
reversals of
impairments of participations and fixed assets, are classified as
extraordinary items under Swiss GAAP. This distinction is not
available under IFRS
.
p
403
UBS AG consolidated financial information
This section contains a comparison of selected financial and
capital information between UBS Group AG consolidated and
UBS AG consolidated. Information for UBS AG consolidated does
not differ materially from UBS Group AG on a consolidated basis.
Comparison between UBS Group AG consolidated and
UBS AG consolidated
The accounting policies applied under International Financial
Reporting Standards (IFRS) to both UBS Group AG and UBS AG
consolidated financial statements are identical. However, there
are certain scope and presentation differences as noted below:
–
Assets, liabilities, operating income, operating expenses and
tax expenses / (benefits) relating to UBS Group AG and its
directly held subsidiaries, including UBS Business Solutions AG,
are reflected in the consolidated financial statements of UBS
Group AG but not of UBS AG. UBS AG’s assets, liabilities,
operating income and operating expenses related to
transactions with UBS Group AG and its directly held
subsidiaries, including UBS Business Solutions AG and other
shared services subsidiaries, are not subject to elimination in
the UBS AG consolidated financial statements, but are
eliminated
in the UBS Group AG consolidated financial
statements.
–
Differences in net profit between UBS Group AG consolidated
and UBS AG consolidated mainly arise as
UBS Business
Solutions AG and other shared services subsidiaries of UBS
Group AG charge other legal entities within the UBS AG
consolidation scope for services provided, including a markup
on costs incurred. In addition, and to a lesser extent,
differences arise as a result of certain compensation-related
matters, including pensions.
–
The equity of UBS Group AG consolidated was USD 2.6 billion
higher
than
the equity of UBS AG consolidated as of
31
December 202
1
. This difference was
mainly driven by
higher dividends paid by UBS AG to UBS Group AG compared
with the dividend distributions of UBS Group AG, as well as
higher retained earnings in the UBS Group AG consolidated
financial statements, largely related to the aforementioned
markup charged by shared services subsidiaries of UBS Group
AG to other legal entities in the UBS AG scope of
consolidation. In addition, UBS Group is the grantor of the
majority of the compensation plans of the Group and
recognizes share premium for equity-settled awards granted.
These effects were partly offset by treasury shares acquired as
part of our share repurchase programs and those held to hedge
share delivery obligations associated with Group compensation
plans, as well as additional share premium recognized at the
UBS AG consolidated level related to the establishment of
UBS Group AG and UBS Business Solutions AG, a wholly
owned subsidiary of UBS Group AG.
–
The going concern capital of UBS Group AG consolidated was
USD
5
.
1
billion higher than the going concern capital of
UBS AG consolidated as of 31 December 2021, reflecting
higher common equity tier 1 (CET1) capital of USD 3.7 billion
and higher going concern loss-absorbing additional tier 1 (AT1)
capital of USD 1.4 billion
–
The CET1 capital of UBS Group AG consolidated was USD 3.7
billion higher than that of UBS AG consolidated as of
31 December 2021. The higher CET1 capital of UBS Group AG
consolidated was primarily due to a higher UBS Group AG
consolidated IFRS equity of USD 2.6 billion, as described
above, and lower UBS Group AG accruals for future dividends
to shareholders, as well as a higher capital deduction at the
UBS AG consolidated level related to deferred tax assets on
temporary differences. The aforementioned factors were partly
offset by compensation-related regulatory capital accruals at
the UBS Group AG level.
–
The going concern loss-absorbing AT1 capital of UBS Group
AG consolidated was USD 1.4 billion higher than that of UBS
AG consolidated as of 31 December 2021, mainly reflecting
deferred contingent capital plan awards granted at the Group
level to eligible employees for the performance years 2016 to
2020, partly offset by two loss-absorbing AT1 capital
instruments on-lent by UBS Group AG to UBS AG.
Consolidated financial statements | UBS AG consolidated financial statements
404
UBS AG consolidated key figures
As of or for the year ended
USD million, except where indicated
31.12.21
31.12.20
31.12.19
1
Results
Operating income
Operating expenses
Operating profit / (loss) before tax
Net profit / (loss) attributable to shareholders
Profitability and growth
2
Return on equity (%)
Return on tangible equity (%)
Return on common equity tier 1 capital (%)
Return on risk-weighted assets, gross (%)
Return on leverage ratio denominator, gross (%)
3
Cost / income ratio (%)
Net profit growth (%)
Resources
Total assets
Equity attributable to shareholders
Common equity tier 1 capital
4
Risk-weighted assets
4
Common equity tier 1 capital ratio (%)
4
Going concern capital ratio (%)
4
Total loss-absorbing capacity ratio (%)
4
Leverage ratio denominator
3,4
Common equity tier 1 leverage ratio (%)
3,4
Going concern leverage ratio (%)
3,4
Total loss-absorbing capacity leverage ratio (%)
4
Other
Invested assets (USD billion)
5
Personnel (full-time equivalents)
1 Refer to the “Accounting and financial reporting” and “Consolidated financial statements” sections of this report for information about the restatement of comparative information, where applicable. 2 Refer to
the “Targets, aspirations and capital guidance” section of this report for more information about our performance measurement. 3 Leverage ratio denominators and leverage ratios for year 2020 do not reflect the
effects of the temporary exemption that applied from 25 March 2020 until 1 January 2021 and was granted by FINMA in connection with COVID-19. Refer to the “Regulatory and legal developments” section of our
Annual Report 2020 for more information. 4 Based on the Swiss systemically relevant bank framework as of 1 January 2020. Refer to the “Capital, liquidity and funding, and balance sheet” section of this report
for more information. 5 Consists of invested assets for Global Wealth Management, Asset Management and Personal & Corporate Banking. Refer to “Note 32 Invested assets and net new money” in the
“Consolidated financial statements” section of this report for more information.
405
Comparison between UBS Group AG consolidated and UBS AG consolidated
As of or for the year ended 31.12.21
As of or for the year ended 31.12.20
USD million, except where indicated
UBS Group AG
consolidated
UBS AG
consolidated
Difference
(absolute)
UBS Group AG
consolidated
UBS AG
consolidated
Difference
(absolute)
Income statement
Operating income
35,542
35,976
(434)
32,390
32,780
(390)
Operating expenses
26,058
27,012
(955)
24,235
25,081
(846)
Operating profit / (loss) before tax
9,484
8,964
520
8,155
7,699
456
of which: Global Wealth Management
4,783
4,706
77
4,019
3,965
54
of which: Personal & Corporate Banking
1,731
1,726
4
1,259
1,261
(2)
of which: Asset Management
1,030
1,023
7
1,455
1,454
1
of which: Investment Bank
2,630
2,592
38
2,482
2,441
41
of which: Group Functions
(689)
(1,083)
394
(1,060)
(1,423)
362
Net profit / (loss)
7,486
7,061
425
6,572
6,211
361
of which: net profit / (loss) attributable to shareholders
7,457
7,032
425
6,557
6,196
361
of which: net profit / (loss) attributable to non-controlling interests
29
29
0
15
15
0
Statement of comprehensive income
Other comprehensive income
(2,367)
(2,235)
(131)
1,740
1,759
(19)
of which: attributable to shareholders
(2,351)
(2,220)
(131)
1,719
1,738
(19)
of which: attributable to non-controlling interests
(16)
(16)
0
21
21
0
Total comprehensive income
5,119
4,826
293
8,312
7,970
342
of which: attributable to shareholders
5,106
4,813
293
8,276
7,934
342
of which: attributable to non-controlling interests
13
13
0
36
36
0
Balance sheet
Total assets
1,117,182
1,116,145
1,037
1,125,765
1,125,327
438
Total liabilities
1,056,180
1,057,702
(1,522)
1,066,000
1,067,254
(1,254)
Total equity
61,002
58,442
2,559
59,765
58,073
1,691
of which: equity attributable to shareholders
60,662
58,102
2,559
59,445
57,754
1,691
of which: equity attributable to non-controlling interests
340
340
0
319
319
0
Capital information
Common equity tier 1 capital
45,281
41,594
3,687
1,709
Going concern capital
60,488
55,434
5,054
Risk-weighted assets
302,209
299,005
3,204
Common equity tier 1 capital ratio (%)
15.0
13.9
1.1
0.5
Going concern capital ratio (%)
20.0
18.5
1.5
1.1
Total loss-absorbing capacity ratio (%)
34.7
33.3
1.3
1.0
Leverage ratio denominator
1,068,862
1,067,679
1,183
379
Common equity tier 1 leverage ratio (%)
4.24
3.90
0.34
0.16
Going concern leverage ratio (%)
5.7
5.2
0.5
0.3
Total loss-absorbing capacity leverage ratio (%)
9.8
9.3
0.5
0.3
Consolidated financial statements | UBS AG consolidated financial statements
406
Management’s report on internal control over financial
reporting
Management’s responsibility for internal control over financial
reporting
The Board of Directors and management of UBS AG are
responsible for establishing and maintaining adequate internal
control over financial reporting. UBS AG’s internal control over
financial reporting is designed to provide reasonable assurance
regarding the preparation and fair presentation of published
financial statements in accordance with International Financial
Reporting Standards (IFRS) as issued by the International
Accounting Standards Board (IASB).
UBS AG’s internal control over financial reporting includes
those policies and procedures that:
–
pertain to the maintenance of records that, in reasonable
detail, accurately and fairly reflect transactions and dispositions
of assets;
–
provide reasonable assurance that transactions are recorded as
necessary to permit preparation and fair presentation of
financial statements, and that receipts and expenditures of the
company are being made only in accordance with
authorizations of UBS AG management; and
–
provide reasonable assurance regarding prevention or timely
detection of unauthorized acquisition, use or disposition of the
company’s assets that could have a material effect on the
financial statements.
Because of its inherent limitations, internal control over
financial reporting may not prevent or detect misstatements. Also,
projections of any evaluation of effectiveness to future periods are
subject to the risk that controls may become inadequate because
of changes in conditions, or that the degree of compliance with
the policies or procedures may deteriorate.
Management’s assessment of internal control over financial
reporting as of 31 December
2021
UBS AG management has assessed the effectiveness of UBS AG’s
internal control over financial reporting as of 31 December 2021
based on the criteria set forth by the Committee of Sponsoring
Organizations of the Treadway Commission (COSO) in Internal
Control – Integrated Framework (2013 Framework). Based on this
assessment, management believes that, as of 31 December 2021,
UBS AG’s internal control over financial reporting was effective.
The effectiveness of UBS AG’s internal control over financial
reporting as of 31 December 2021 has been audited by Ernst &
Young Ltd, UBS AG’s independent registered public accounting
firm, as stated in their report appearing on page 407 which
expresses an unqualified opinion on the effectiveness of UBS AG’s
internal control over financial reporting as of 31 December 2021.
407
408
409
410

411
412
413
UBS AG consolidated financial statements
Primary financial statements and share information
Audited |
Income statement
For the year ended
USD million
Note
31.12.21
31.12.20
31.12.19
Interest income from financial instruments measured at amortized cost and fair value through
other comprehensive income
3
8,534
8,816
10,703
Interest expense from financial instruments measured at amortized cost
3
(3,366)
(4,333)
(7,303)
Net interest income from financial instruments measured at fair value through profit or loss
3
1,437
1,305
1,015
Net interest income
3
6,605
5,788
4,415
Other net income from financial instruments measured at fair value through profit or loss
3
5,844
6,930
6,833
Credit loss (expense) / release
20
148
(695)
(78)
Fee and commission income
4
24,422
20,982
19,156
Fee and commission expense
4
(1,985)
(1,775)
(1,696)
Net fee and commission income
4
22,438
19,207
17,460
Other income
5
941
1,549
677
Total operating income
35,976
32,780
29,307
Personnel expenses
6
15,661
14,686
13,801
General and administrative expenses
7
9,476
8,486
8,586
Depreciation, amortization and impairment of non-financial assets
12,13
1,875
1,909
1,751
Total operating expenses
27,012
25,081
24,138
Operating profit / (loss) before tax
8,964
7,699
5,169
Tax expense / (benefit)
8
1,903
1,488
1,198
Net profit / (loss)
7,061
6,211
3,971
Net profit / (loss) attributable to non-controlling interests
29
15
6
Net profit / (loss) attributable to shareholders
7,032
6,196
3,965
Consolidated financial statements | UBS AG consolidated financial statements
414
Statement of comprehensive income
For the year ended
USD million
Note
31.12.21
31.12.20
31.12.19
Comprehensive income attributable to shareholders
Net profit / (loss)
7,032
6,196
3,965
Other comprehensive income that may be reclassified to the income statement
Foreign currency translation
Foreign currency translation movements related to net assets of foreign operations, before tax
(1,046)
2,040
199
Effective portion of changes in fair value of hedging instruments designated as net investment hedges, before tax
492
(938)
(144)
Foreign currency translation differences on foreign operations reclassified to the income statement
(1)
(7)
52
Effective portion of changes in fair value of hedging instruments designated as net investment hedges reclassified to
the income statement
10
2
(14)
Income tax relating to foreign currency translations, including the effect of net investment hedges
35
(67)
(1)
Subtotal foreign currency translation, net of tax
(510)
1,030
92
Financial assets measured at fair value through other comprehensive income
11
Net unrealized gains / (losses), before tax
(203)
223
189
Net realized gains / (losses) reclassified to the income statement from equity
(9)
(40)
(31)
Income tax relating to net unrealized gains / (losses)
55
(48)
(41)
Subtotal financial assets measured at fair value through other comprehensive income, net of tax
(157)
136
117
Cash flow hedges of interest rate risk
26
Effective portion of changes in fair value of derivative instruments designated as cash flow hedges, before tax
(992)
2,012
1,571
Net (gains) / losses reclassified to the income statement from equity
(1,073)
(770)
(175)
Income tax relating to cash flow hedges
390
(231)
(253)
Subtotal cash flow hedges, net of tax
(1,675)
1
1,011
1,143
Cost of hedging
26
Cost of hedging, before tax
(32)
(13)
Income tax relating to cost of hedging
6
0
Subtotal cost of hedging, net of tax
(26)
(13)
Total other comprehensive income that may be reclassified to the income statement, net of tax
(2,368)
2,165
1,351
Other comprehensive income that will not be reclassified to the income statement
Defined benefit plans
27
Gains / (losses) on defined benefit plans, before tax
133
(222)
(129)
Income tax relating to defined benefit plans
(31)
88
(41)
Subtotal defined benefit plans, net of tax
102
(134)
(170)
Own credit on financial liabilities designated at fair value
21
Gains / (losses) from own credit on financial liabilities designated at fair value, before tax
46
(293)
(400)
Income tax relating to own credit on financial liabilities designated at fair value
0
0
8
Subtotal own credit on financial liabilities designated at fair value, net of tax
46
(293)
(392)
Total other comprehensive income that will not be reclassified to the income statement, net of tax
148
(427)
(562)
Total other comprehensive income
(2,220)
1,738
789
Total comprehensive income attributable to shareholders
4,813
7,934
4,754
Comprehensive income attributable to non-controlling interests
Net profit / (loss)
29
15
6
Total other comprehensive income that will not be reclassified to the income statement, net of tax
(16)
21
(4)
Total comprehensive income attributable to non-controlling interests
13
36
2
Total comprehensive income
Net profit / (loss)
7,061
6,211
3,971
Other comprehensive income
(2,235)
1,759
785
of which: other comprehensive income that may be reclassified to the income statement
(2,368)
2,165
1,351
of which: other comprehensive income that will not be reclassified to the income statement
132
(406)
(566)
Total comprehensive income
4,826
7,970
4,756
1 Mainly reflects the reclassification of net gains on hedging instruments from OCI to the income statement as the hedged forecast cash flows affected profit or loss and a decrease in net unrealized gains on US dollar
hedging derivatives resulting from increases in the relevant long-term US dollar interest rates.
415
Balance sheet
USD million
Note
31.12.21
31.12.20
Assets
Cash and balances at central banks
192,817
158,231
Loans and advances to banks
15,360
15,344
Receivables from securities financing transactions
9, 22
75,012
74,210
Cash collateral receivables on derivative instruments
9, 22
30,514
32,737
Loans and advances to customers
398,693
380,977
Other financial assets measured at amortized cost
9, 14a
26,236
27,219
Total financial assets measured at amortized cost
738,632
688,717
Financial assets at fair value held for trading
131,033
125,492
of which: assets pledged as collateral that may be sold or repledged by counterparties
43,397
47,098
Derivative financial instruments
10, 21, 22
118,145
159,618
Brokerage receivables
21,839
24,659
Financial assets at fair value not held for trading
59,642
80,038
Total financial assets measured at fair value through profit or loss
330,659
389,808
Financial assets measured at fair value through other comprehensive income
11, 21
8,844
8,258
Investments in associates
29b
1,243
1,557
Property, equipment and software
11,712
11,958
Goodwill and intangible assets
6,378
6,480
Deferred tax assets
8,839
9,174
Other non-financial assets
14b
9,836
9,374
Total assets
1,116,145
1,125,327
Liabilities
Amounts due to banks
15a
13,101
11,050
Payables from securities financing transactions
5,533
6,321
Cash collateral payables on derivative instruments
31,801
37,313
Customer deposits
15a
544,834
527,929
Funding from UBS Group AG
15b
57,295
53,979
Debt issued measured at amortized cost
82,432
85,351
Other financial liabilities measured at amortized cost
19a
9,765
10,421
Total financial liabilities measured at amortized cost
744,762
732,364
Financial liabilities at fair value held for trading
31,688
33,595
Derivative financial instruments
10, 21, 22
121,309
161,102
Brokerage payables designated at fair value
44,045
38,742
Debt issued designated at fair value
16, 21
71,460
59,868
Other financial liabilities designated at fair value
19b, 21
32,414
31,773
Total financial liabilities measured at fair value through profit or loss
300,916
325,080
Provisions
18a
3,452
2,791
Other non-financial liabilities
19c
8,572
7,018
Total liabilities
1,057,702
1,067,254
Equity
Share capital
338
338
Share premium
24,653
24,580
Retained earnings
27,912
25,251
Other comprehensive income recognized directly in equity, net of tax
5,200
7,585
Equity attributable to shareholders
58,102
57,754
Equity attributable to non-controlling interests
340
319
Total equity
58,442
58,073
Total liabilities and equity
1,116,145
1,125,327
Consolidated financial statements | UBS AG consolidated financial statements
416
Statement of changes in equity
USD million
Share
capital
Share
premium
Retained
earnings
Balance as of 31 December 2018
338
24,655
23,285
Effect of adoption of IFRIC 23
(11)
Balance as of 1 January 2019 after the adoption of IFRIC 23
338
24,655
23,274
Premium on shares issued and warrants exercised
0
Tax (expense) / benefit
11
Dividends
(3,250)
Translation effects recognized directly in retained earnings
(9)
New consolidations / (deconsolidations) and other increases / (decreases)
(7)
Total comprehensive income for the year
3,403
of which: net profit / (loss)
3,965
of which: OCI, net of tax
(562)
Balance as of 31 December 2019
338
24,659
23,419
Premium on shares issued and warrants exercised
(4)
2
Tax (expense) / benefit
1
Dividends
(3,848)
Translation effects recognized directly in retained earnings
(49)
Share of changes in retained earnings of associates and joint ventures
(40)
New consolidations / (deconsolidations) and other increases / (decreases)
3
(76)
Total comprehensive income for the year
5,769
of which: net profit / (loss)
6,196
of which: OCI, net of tax
(427)
Balance as of 31 December 2020
338
24,580
25,251
Premium on shares issued and warrants exercised
(7)
2
Tax (expense) / benefit
(102)
Dividends
(4,539)
Translation effects recognized directly in retained earnings
18
Share of changes in retained earnings of associates and joint ventures
1
New consolidations / (deconsolidations) and other increases / (decreases)
4
182
Total comprehensive income for the year
7,180
of which: net profit / (loss)
7,032
of which: OCI, net of tax
148
Balance as of 31 December 2021
338
24,653
27,912
1 Excludes other comprehensive income related to defined benefit plans and own credit, which is recorded directly in Retained earnings. 2 Includes decreases related to recharges by UBS Group AG for share-based
compensation awards granted to employees of UBS AG or its subsidiaries. 3 Mainly relates to the establishment of a banking partnership with Banco do Brasil. In 2020, UBS AG issued a
49.99
% stake in UBS Brasil
Serviços in exchange for exclusive access to Banco do Brasil’s corporate clients. Upon completion of the transaction in 2020, equity attributable to non-controlling interests increased by USD
115
material effect on equity attributable to shareholders. 4 Includes the effects related to the launch of UBS AG’s new operational partnership entity with Sumitomo Mitsui Trust Holdings, Inc. Refer to Note 30 for more
information.
417
Other comprehensive
income recognized
directly in equity,
net of tax
1
of which:
foreign currency
translation
of which:
financial assets
at fair value through
OCI
of which:
cash flow
hedges
of which:
cost of hedging
Total equity
attributable to
shareholders
Non-controlling
interests
Total equity
3,946
3,940
(103)
109
52,224
176
52,400
(11)
(11)
3,946
3,940
(103)
109
52,213
176
52,389
0
0
11
11
(3,250)
(8)
(3,258)
9
0
9
0
0
(7)
5
(3)
1,351
92
117
1,143
4,754
2
4,756
3,965
6
3,971
1,351
92
117
1,143
789
(4)
785
5,306
4,032
14
1,260
53,722
174
53,896
(4)
(4)
1
1
(3,848)
(6)
(3,854)
49
0
49
0
0
(40)
(40)
65
65
(12)
115
103
2,165
1,030
136
1,011
(13)
7,934
36
7,970
6,196
15
6,211
2,165
1,030
136
1,011
(13)
1,738
21
1,759
7,585
5,126
151
2,321
(13)
57,754
319
58,073
(7)
(7)
(102)
(102)
(4,539)
(4)
(4,542)
(18)
0
(18)
0
0
0
1
1
182
12
193
(2,368)
(510)
(157)
(1,675)
(26)
4,813
13
4,826
7,032
29
7,061
(2,368)
(510)
(157)
(1,675)
(26)
(2,220)
(16)
(2,235)
5,200
4,617
(7)
628
(39)
58,102
340
58,442
Consolidated financial statements | UBS AG consolidated financial statements
418
Share information and earnings per share
Ordinary share capital
As of 31 December 2021, UBS AG had
3,858,408,466
shares (31 December 2020:
3,858,408,466
nominal value of CHF
0.10
CHF
385,840,846.60
. The shares were entirely held by
UBS Group AG.
Conditional share capital
As of 31 December 2021, the following conditional share capital
was available to UBS AG’s Board of Directors (BoD):
–
A maximum
of CHF
38,000,000
380,000,000
of CHF
0.10
mandatory exercise of conversion rights and / or warrants
granted in connection with the issuance of bonds or similar
financial instruments on national or international capital
markets. This conditional capital allowance was approved at
the Annual General Meeting of UBS AG on 14 April 2010. The
BoD has not made use of such allowance.
Authorized share capital
UBS AG had no authorized capital available to issue on
31 December 2021.
Earnings per share
In 2015, UBS AG shares were delisted from the SIX Swiss
Exchange and the New York Stock Exchange. As of 31 December
2021, 100% of UBS AG’s issued shares were held by UBS Group
AG and therefore were not publicly traded. Accordingly, earnings
per share information is not provided for UBS AG.
419
Statement of cash flows
For the year ended
USD million
31.12.21
31.12.20
31.12.19
Cash flow from / (used in) operating activities
Net profit / (loss)
7,061
6,211
3,971
Non-cash items included in net profit and other adjustments:
Depreciation, amortization and impairment of non-financial assets
1,875
1,909
1,751
Credit loss expense / (release)
(148)
695
78
Share of net profits of associates and joint ventures and impairment related to associates
(105)
(84)
(45)
Deferred tax expense / (benefit)
432
355
460
Net loss / (gain) from investing activities
(230)
(698)
220
Net loss / (gain) from financing activities
100
3,246
6,506
Other net adjustments
3,790
(8,061)
862
Net change in operating assets and liabilities:
Loans and advances to banks and amounts due to banks
2,148
3,586
(4,336)
Securities financing transactions
(2,316)
9,588
8,678
Cash collateral on derivative instruments
(3,311)
(3,486)
2,842
Loans and advances to customers
(26,943)
(33,897)
(3,205)
Customer deposits
29,349
52,831
23,399
Financial assets and liabilities at fair value held for trading and derivative financial instruments
(10,635)
11,326
(18,873)
Brokerage receivables and payables
8,115
(5,199)
(2,347)
Financial assets at fair value not held for trading and other financial assets and liabilities
19,793
392
126
Provisions and other non-financial assets and liabilities
2,617
(1,213)
(537)
Income taxes paid, net of refunds
(1,026)
(919)
(741)
Net cash flow from / (used in) operating activities
30,563
36,581
18,805
Cash flow from / (used in) investing activities
Purchase of subsidiaries, associates and intangible assets
(1)
(46)
(26)
Disposal of subsidiaries, associates and intangible assets
1
593
674
114
Purchase of property, equipment and software
(1,581)
(1,573)
(1,401)
Disposal of property, equipment and software
295
364
11
Purchase of financial assets measured at fair value through other comprehensive income
(5,802)
(6,290)
(3,424)
Disposal and redemption of financial assets measured at fair value through other comprehensive income
5,052
4,530
3,913
Net (purchase) / redemption of debt securities measured at amortized cost
(415)
(4,166)
(562)
Net cash flow from / (used in) investing activities
(1,860)
(6,506)
(1,374)
Table continues on the next page.
Consolidated financial statements | UBS AG consolidated financial statements
420
Statement of cash flows (continued)
Table continued from previous page.
For the year ended
USD million
31.12.21
31.12.20
31.12.19
Cash flow from / (used in) financing activities
Net short-term debt issued / (repaid)
(3,093)
23,845
(17,149)
Distributions paid on UBS AG shares
(4,539)
(3,848)
(3,250)
Issuance of debt designated at fair value and long-term debt measured at amortized cost
2
98,619
80,153
65,047
Repayment of debt designated at fair value and long-term debt measured at amortized cost
2
(79,799)
(87,099)
(68,883)
Net cash flows from other financing activities
(261)
(553)
(504)
Net cash flow from / (used in) financing activities
10,927
12,498
(24,738)
Total cash flow
Cash and cash equivalents at the beginning of the year
173,430
119,804
125,853
Net cash flow from / (used in) operating, investing and financing activities
39,630
42,573
(7,307)
Effects of exchange rate differences on cash and cash equivalents
(5,306)
11,053
1,258
Cash and cash equivalents at the end of the year
3
207,755
173,430
119,804
of which: cash and balances at central banks
4
192,706
158,088
106,957
of which: loans and advances to banks
13,822
13,928
11,317
of which: money market paper
5
1,227
1,415
1,530
Additional information
Net cash flow from / (used in) operating activities includes:
Interest received in cash
11,170
11,929
15,344
Interest paid in cash
4,802
6,414
10,800
Dividends on equity investments, investment funds and associates received in cash
6
2,531
1,901
3,145
1 Includes cash proceeds from the sale of UBS AG’s investment in Clearstream Fund Centre AG (previously Fondcenter AG). UBS AG’s majority stake was sold in 2020 and the remaining minority investment was sold
in the second quarter of 2021. Refer to Note 30 for more information. Also includes dividends received from associates. 2 Includes funding from UBS Group AG measured at amortized cost (recognized in Funding
from UBS Group AG in the balance sheet) and measured at fair value (recognized in Other financial liabilities designated at fair value in the balance sheet). 3 USD
3,408
3,828
3,192
million of cash and cash equivalents (mainly reflected in Loans and advances to banks) were restricted as of 31 December 2021, 31 December 2020 and 31 December 2019, respectively. Refer to Note 23 for more
information. 4 Includes only balances with an original maturity of three months or less. 5 Money market paper is included in the balance sheet under Financial assets at fair value held for trading, Financial assets
measured at fair value through other comprehensive income, Financial assets at fair value not held for trading and Other financial assets measured at amortized cost. 6 Includes dividends received from associates
reported within Net cash flow from / (used in) investing activities.
421
Changes in liabilities arising from financing activities
USD million
Debt issued
measured at
amortized cost
of which:
short-term
1
of which:
long-term
2
Debt issued
designated at fair
value
Over-the-
counter (OTC)
debt
instruments
3
Funding from
UBS Group
AG
4
Total
Balance as of 1 January 2020
62,835
21,837
40,998
66,592
2,022
48,083
179,531
Cash flows
18,722
23,845
(5,123)
(6,423)
(6)
4,606
16,899
Non-cash changes
3,794
984
2,810
(301)
44
2,666
6,203
of which: foreign currency translation
3,589
984
2,605
1,760
82
1,395
6,825
of which: fair value changes
(2,061)
(38)
152
(1,946)
of which: hedge accounting and other effects
205
205
1,119
1,324
Balance as of 31 December 2020
85,351
46,666
38,685
59,868
2,060
55,354
202,633
Cash flows
(550)
(3,093)
2,543
9,075
126
7,076
15,727
Non-cash changes
(2,369)
(475)
(1,894)
2,516
(58)
(2,795)
(2,705)
of which: foreign currency translation
(1,841)
(475)
(1,366)
(1,611)
(65)
(1,340)
(4,857)
of which: fair value changes
4,127
7
(30)
4,104
of which: hedge accounting and other effects
(528)
(528)
(1,425)
(1,953)
Balance as of 31 December 2021
82,432
43,098
39,334
71,460
2,128
59,635
215,655
1 Debt with an original contractual maturity of less than one year. 2 Debt with an original maturity greater than or equal to one year. The classification of debt issued into short-term and long-term does not consider
any early redemption features. 3 Included in balance sheet line Other financial liabilities designated at fair value. 4 Includes funding from UBS Group AG measured at amortized cost (refer to Note 15b) and
measured at fair value (refer to Note 19b).
Consolidated financial statements | UBS AG consolidated financial statements
422
Notes to the UBS AG consolidated financial statements
Note 1 Summary of material accounting policies
The following table provides an overview of information included in this Note.
423
a)
423
423
1)
424
2)
424
a.
424
b.
428
c.
428
d.
428
e.
428
f.
429
g.
432
h.
432
i.
433
j.
433
3)
434
4)
435
5)
435
6)
436
7)
436
8)
436
9)
437
10)
437
11)
438
b)
438
c)
423
Note 1 Summary of material accounting policies
(continued)
a)
Material accounting policies
This Note describes the material accounting policies applied in the
preparation of the consolidated financial statements (the Financial
Statements) of UBS AG and its subsidiaries (UBS
AG
).
On
24 February 2022, the Financial Statements were authorized for
issue by the Board of Directors.
Basis of accounting
The Financial Statements have been prepared in accordance with
International Financial Reporting Standards (IFRS), as issued by the
International Accounting Standards Board (the IASB), and are
presented in US dollars (USD).
Disclosures marked as audited in the “Risk, capital, liquidity
and funding, and balance sheet” section of this report form an
integral part of the Financial Statements. These disclosures relate
to requirements under IFRS 7,
Financial Instruments: Disclosures
,
and IAS 1,
Presentation of Financial Statements
,
and are not
repeated in this section.
The accounting policies described in this Note have been
applied consistently in all years presented unless otherwise stated
in Note 1b.
Critical accounting estimates and judgments
Preparation of these Financial Statements under IFRS requires management
to apply judgment and make estimates and assumptions that affect reported
amounts of assets, liabilities, income and expenses and disclosure of
contingent assets and liabilities, and may involve significant uncertainty at the
time they are made. Such estimates and assumptions are based on the best
available information. UBS
AG
regularly reassesses
such
estimates and
assumptions, which encompass historical experience, expectations of the
future and other pertinent factors, to determine their continuing relevance
based on current conditions, updating them as necessary. Changes in those
estimates and assumptions may have a significant effect on the Financial
Statements. Furthermore, actual results may differ significantly from UBS AG’s
estimates, which could result in significant losses to UBS AG, beyond what
was anticipated or provided for.
The following areas contain estimation uncertainty or require critical
judgment and have a significant effect on amounts recognized in the
Financial Statements:
–
expected credit loss measurement (refer to item 2g in this Note and to
Note 20);
–
fair value measurement (refer to item 2f in this Note and to Note 21);
–
income taxes (refer to item 6 in this Note and to Note 8);
–
provisions and contingent liabilities (refer to item 9 in this Note and to
Note 18);
–
post-employment benefit plans (refer to item 5 in this Note and to Note
27);
–
goodwill (refer to item 8 in this Note and to Note 13); and
–
consolidation of structured entities (refer to item 1 in this Note and to
Note 29).
1) Consolidation
The Financial Statements comprise the financial statements of
UBS AG and its subsidiaries, presented as a single economic entity;
intercompany transactions and balances have been eliminated.
UBS AG consolidates all entities that it controls, including
structured entities (SEs), which is the case when it has: (i) power
over the relevant activities of the entity; (ii) exposure to an entity‘s
variable returns; and (iii) the ability to use its power to affect its
own returns.
Consideration is given to all facts and circumstances to
determine whether UBS AG has power over another entity, i.e.,
the current ability to direct the relevant activities of an entity when
decisions about those activities need to be made.
Subsidiaries, including SEs, are consolidated from the date
when control is gained and deconsolidated from the date when
control ceases. Control, or the lack thereof, is reassessed if facts
and circumstances indicate that there is a change to one or more
elements required to establish that control is present.
Business combinations are accounted for using the acquisition
method. The amount of any non-controlling interest is measured
at the non-controlling interest’s proportionate share of the
acquiree’s identifiable net assets.
›
Refer to Note
29
for more information
Critical accounting estimates and judgments
Each individual entity is assessed for consolidation in line with the
aforementioned consolidation principles. The assessment of control can be
complex and requires the use of significant judgment, in particular in
determining whether UBS AG has power over the entity. As the nature and
extent of UBS AG’s involvement is unique for each entity, there is no
uniform consolidation outcome by entity. Certain entities within a class may
be consolidated while others may not. When carrying out the consolidation
assessment, judgment is exercised considering all the relevant facts and
circumstances, including the nature and activities of the investee, as well as
the substance of voting and similar rights.
›
Refer to Note
29
for more information
Consolidated financial statements | UBS AG consolidated financial statements
424
Note 1 Summary of material accounting policies (continued)
2)
Financial instruments
a. Recognition
UBS AG recognizes financial instruments when it becomes a party
to contractual provisions of
an
instrument. UBS
AG
applies
settlement date accounting to all standard purchases and sales of
non-derivative financial instruments.
In transactions where UBS AG acts as a transferee, to the
extent
the
financial asset transfer does not qualify for
derecognition by the transferor, UBS AG does not recognize the
transferred instrument as its asset.
UBS AG also acts in a fiduciary capacity, which results in it
holding or placing assets on behalf of individuals, trusts,
retirement benefit plans and other institutions. Unless these items
meet the definition of an asset and the recognition criteria are
satisfied, they are not recognized on UBS AG’s balance sheet and
the related income is excluded from the Financial Statements.
Client cash balances associated with derivatives clearing and
execution services are not recognized on the balance sheet if,
through contractual agreement, regulation or practice, UBS AG
neither obtains benefits from nor controls such cash balances.
b. Classification, measurement and presentation
Financial assets
All financial instruments are on initial recognition measured at fair
value and classified as measured at amortized cost, fair value
through other comprehensive income (FVOCI) or fair value
through profit or loss (FVTPL)
.
For
financial instruments
subsequently measured at amortized cost or FVOCI, the initial fair
value is adjusted for directly attributable transaction costs.
Where the contractual terms of a debt instrument result in cash
flows that are solely payments of principal and interest (SPPI) on
the principal amount outstanding,
the debt instrument
is
classified as measured at amortized cost if it is held within a
business model that has an objective of holding financial assets to
collect contractual cash flows, or at FVOCI if it is held within a
business model
with
the
objective
being
achieved by both
collecting contractual cash flows and selling financial assets.
All other financial assets are measured at FVTPL, including
those held for trading or those managed on a fair value basis,
except for derivatives designated in a hedge relationship, in which
case hedge accounting requirements apply (refer to item 2j in this
Note for more information).
Business model assessment and contractual cash flow
characteristics
UBS AG determines the nature of a business model by considering
the way financial assets are managed to achieve a particular
business objective.
In assessing whether contractual cash flows are SPPI, UBS AG
considers whether the contractual terms of the financial asset
contain a term that could change the timing or amount of
contractual cash flows arising over the life of the instrument.
Financial liabilities
Financial liabilities measured at amortized cost
Financial liabilities measured at amortized cost include
Debt issued
measured at amortized cost
Funding from UBS Group AG
,
which constitute obligations of UBS AG arising from funding it
has received from UBS Group AG, which are not within the UBS
AG scope of consolidation. The latter includes contingent capital
instruments
issued to UBS Group AG
cont
ain
ing
contractual
provisions under which the principal amounts would be written
down or converted into equity upon either a specified common
equity tier 1 (CET1) ratio breach or a determination by the Swiss
Financial Market Supervisory Authority (FINMA) that a viability
event has occurred.
Such contractual provisions are not
derivatives, as the underlying is deemed to be a non-financial
variable specific to a party to the contract.
If a debt were to be written down or converted into equity in
a future period, it would be partially or fully derecognized, with
the difference between its carrying amount and the fair value of
any equity issued recognized in the income statement.
A gain or loss is recognized in
Other income
is subsequently repurchased for market-making or other activities.
A subsequent sale of own bonds in the market is treated as a
reissuance of debt.
Financial liabilities measured at fair value through profit or loss
UBS AG designates certain issued debt instruments as financial
liabilities at fair value through profit or loss, on the basis that such
financial instruments include embedded derivatives and / or are
managed on a fair value basis (refer to the table below for more
information), in which case bifurcation of the embedded
derivative component is not required. Financial instruments
including embedded derivatives arise predominantly from the
issuance of certain structured debt instruments.
Measurement and presentation
After initial recognition, UBS AG classifies, measures and presents
its financial assets and liabilities in accordance with IFRS 9, as
described in the table on the following pages.
425
Note 1 Summary of material accounting policies (continued)
Classification, measurement and presentation of financial assets
Financial assets classification
Significant items included
Measurement and presentation
Measured at
amortized cost
This classification includes:
–
cash and balances at central banks;
–
loans and advances to banks;
–
receivables from securities financing transactions;
–
cash collateral receivables on derivative instruments;
–
residential and commercial mortgages;
–
corporate loans;
–
secured loans, including Lombard loans, and
unsecured loans;
–
loans to financial advisors; and
–
debt securities held as high-quality liquid assets
(HQLA).
Measured at amortized cost using the effective interest
method less allowances for expected credit losses (ECL)
(refer to items 2d and 2g in this Note for more information).
The following items are recognized in the income
statement:
–
interest income, which is accounted for in accordance
with item 2d in this Note;
–
ECL and reversals; and
–
foreign exchange (FX) translation gains and losses.
When a financial asset at amortized cost is derecognized,
the gain or loss is recognized in the income statement.
For amounts arising from settlement of certain derivatives,
refer to the next page.
Measured
at FVOCI
Debt instruments
measured at
FVOCI
This classification primarily includes debt securities and
certain asset-backed securities held as HQLA.
Measured at fair value, with unrealized gains and losses
reported in
Other comprehensive income,
net of applicable
income taxes, until such investments are derecognized.
Upon derecognition, any accumulated balances in
Other
comprehensive income
are reclassified to the income
statement and reported within
Other income.
The following items, which are determined on the same
basis as for financial assets measured at amortized cost, are
recognized in the income statement:
–
interest income, which is accounted for in accordance
with item 2d in this Note;
–
ECL and reversals; and
–
FX translation gains and losses.
Consolidated financial statements | UBS AG consolidated financial statements
426
Note 1 Summary of material accounting policies (continued)
Classification, measurement and presentation of financial assets
Financial assets classification
Significant items included
Measurement and presentation
Measured at
FVTPL
Held for
trading
Financial assets held for trading include:
–
all derivatives with a positive replacement value, except
those that are designated and effective hedging
instruments; and
–
other financial assets acquired principally for the
purpose of selling or repurchasing in the near term, or
that are part of a portfolio of identified financial
instruments that are managed together and for which
there is evidence of a recent actual pattern of short-term
profit taking. Included in this category are debt
instruments (including those in the form of securities,
money market paper, and traded corporate and bank
loans) and equity instruments.
Measured at fair value, with changes recognized in the
income statement.
Derivative assets (including derivatives that are designated
and effective hedging instruments) are generally
presented as
Derivative financial instruments
, except those
exchange-traded (ETD) and over-the-counter (OTC)-
cleared derivatives that are legally settled on a daily basis
or in substance net settled on a daily basis, which are
presented within
Cash collateral receivables on derivative
instruments.
Changes in fair value, initial transaction costs, dividends
and gains and losses arising on disposal or redemption are
recognized in
Other net income from financial
instruments measured at fair value through profit or loss
,
except interest income on instruments other than
derivatives (refer to item 2d in this Note), interest on
derivatives designated as hedging instruments in hedges
of interest rate risk and forward points on certain short-
and long-duration FX contracts acting as economic
hedges, which are reported in
Net interest income.
Changes in the fair value of derivatives that are
designated and effective hedging instruments are
presented either in the income statement or
Other
comprehensive income
, depending on the type of hedge
relationship (refer to item 2j in this Note for more
information).
Mandatorily
measured at
FVTPL – Other
This classification includes financial assets mandatorily
measured at FVTPL that are not held for trading, as
follows:
–
certain structured loans, certain commercial loans, and
receivables from securities financing transactions are
managed on a fair value basis;
–
loans managed on a fair value basis, including those
hedged with credit derivatives;
–
certain debt securities held as HQLA and managed on a
fair value basis;
–
certain investment fund holdings and assets held to
hedge delivery obligations related to cash-settled
employee compensation plans;
–
brokerage receivables, for which contractual cash flows
do not meet the SPPI criterion because the aggregate
balance is accounted for as a single unit of account,
with interest being calculated on the individual
components;
–
auction rate securities, for which contractual cash flows
do not meet the SPPI criterion because interest may be
reset at rates that contain leverage;
–
equity instruments; and
–
assets held under unit-linked investment contracts.
427
Note 1 Summary of material accounting policies
(continued)
Classification, measurement and presentation of financial liabilities
Financial liabilities classification
Significant items included
Measurement and presentation
Measured at amortized cost
This classification includes:
–
demand and time deposits;
–
retail savings / deposits;
–
payables from securities financing transactions;
–
non-structured fixed-rate bonds;
–
subordinated debt;
–
certificates of deposit and covered bonds;
–
obligations against funding from UBS Group AG; and
–
cash collateral payables on derivative instruments.
Measured at amortized cost using the effective interest
method.
When a financial liability at amortized cost is
derecognized, the gain or loss is recognized in the income
statement.
Measured at
fair value
through
profit or loss
Held for trading
Financial liabilities held for trading include:
–
all derivatives with a negative replacement value
(including certain loan commitments), except those
that are designated and effective hedging
instruments; and
–
obligations to deliver financial instruments, such as
debt and equity instruments, that UBS AG has sold to
third parties but does not own (short positions).
Measurement and presentation of financial liabilities
classified at FVTPL follow the same principles as for
financial assets classified at FVTPL, except that the amount
of change in the fair value of a financial liability
designated at FVTPL that is attributable to changes in UBS
AG’s own credit risk is presented in
Other comprehensive
income
Retained earnings
and is never
reclassified to the income statement.
Derivative liabilities (including derivatives that are
designated and effective hedging instruments) are
generally presented as
Derivative financial instruments
,
except those exchange-traded and OTC-cleared
derivatives that are legally settled on a daily basis or in
substance net settled on a daily basis, which are
presented within
Cash collateral payables on derivative
instruments.
Designated at
FVTPL
UBS AG designates at FVTPL the following financial
liabilities:
–
issued hybrid debt instruments that primarily include
equity-linked, credit-linked and rates-linked bonds or
notes;
–
issued debt instruments managed on a fair value
basis;
–
certain payables from securities financing transactions;
–
amounts due under unit-linked investment contracts
the cash flows of which are linked to financial assets
measured at FVTPL and eliminate an accounting
mismatch; and
–
brokerage payables, which arise in conjunction with
brokerage receivables and are measured at FVTPL to
achieve measurement consistency.
Consolidated financial statements | UBS AG consolidated financial statements
428
Note 1 Summary of material accounting policies
(continued)
c.
Loan commitments and financial guarantees
Loan commitments are arrangements to provide credit under
defined terms and conditions. Irrevocable loan commitments are
classified as: (i) derivative loan commitments measured at fair
value through profit or loss; (ii) loan commitments designated at
fair value through profit or loss; or (iii) loan commitments not
measured at fair value.
Financial guarantee contracts are contracts
that require UBS AG to make specified payments to reimburse the
holder for an incurred loss because a specified debtor fails to
make payments when due in accordance with the terms of a
specified debt instrument.
d. Interest income and expense
Interest income and expense are recognized in the income
statement
based on
the effective interest
method
. When
calculating the effective interest rate (the EIR) for financial
instruments (other than credit-impaired financial instruments),
UBS AG estimates future cash flows considering all contractual
terms of the instrument, but not expected credit losses, with the
EIR applied to the gross carrying amount of the financial asset or
the amortized cost of a financial liability. However, when a
financial asset becomes credit-impaired after initial recognition,
interest income is determined by applying the EIR to the amortized
cost of the instrument, which represents the gross carrying
amount adjusted for any credit loss allowance.
Upfront fees, including fees on loan commitments not
measured at fair value where a loan is expected to be issued, and
direct costs are included within the initial measurement of a
financial instrument measured at amortized cost or FVOCI and
recognized over the expected life of the instrument as part of its
EIR.
Fees related to loan commitments where no loan is expected
to be issued, as well as loan syndication fees where UBS AG does
not retain a portion of the syndicated loan or where UBS AG does
retain a portion of the syndicated loan at the same effective yield
for comparable risk as other participants, are included in
Net fee
and commission income
and either recognized over the life of the
commitment or when syndication occurs.
›
Refer to item 3 in this Note for more information
Interest income on financial assets, excluding derivatives, is
included in interest income when positive and in interest expense
when negative. Similarly, interest expense on financial liabilities,
excluding derivatives, is included in interest expense, except when
interest rates are negative, in which case it is included in interest
income.
›
Refer to item 2b in this Note and Note
3
e.
Derecognition
Financial assets
UBS AG derecognizes a transferred financial asset, or a portion of
a financial asset, if the purchaser has received substantially all the
risks and rewards of the asset or a significant part of the risks and
rewards combined with a practical ability to sell or pledge the
asset.
Where financial assets have been pledged as collateral or in
similar arrangements, they are considered to have been
transferred if the counterparty has received the contractual rights
to the cash flows of the pledged assets, as may be evidenced by,
for example, the counterparty’s right to sell or repledge the assets.
In transfers where control over the financial asset is retained, UBS
AG continues to recognize the asset to the extent of its continuing
involvement, determined by the extent to which it is exposed to
changes in the value of the transferred asset following the
transfer.
Certain OTC derivative contracts and most exchange-traded
futures and option contracts cleared through central clearing
counterparties and exchanges are considered to be settled on a
daily basis, as the payment or receipt of variation margin on a daily
basis represents legal or economic settlement, which results in
derecognition of the associated derivatives.
›
Refer to Note 22 and Note 23 for more information
Financial liabilities
UBS AG derecognizes a financial liability when it is extinguished,
i.e., when the obligation specified in the contract is discharged,
canceled or expires. When an existing financial liability is
exchanged for a new one from the same lender on substantially
different terms, or the terms of an existing liability are
substantially modified, the original liability is derecognized and a
new liability recognized with any difference in the respective
carrying amounts recognized in the income statement.
f. Fair value of financial instruments
UBS
AG
accounts for a significant portion of its assets and
liabilities at fair value. Fair value is the price on the measurement
date that would be received for the sale of an asset or paid to
transfer a liability in an orderly transaction between market
participants in the principal market, or in the most advantageous
market in the absence of a principal market.
›
Refer to Note 21 for more information
429
Note 1 Summary of material accounting policies
(continued)
Critical accounting estimates and judgments
The use of valuation techniques, modeling assumptions and estimates of
unobservable market inputs in the fair valuation of financial instruments
requires significant judgment and could affect the amount of gain or loss
recorded for a particular position. Valuation techniques that rely more
heavily on unobservable inputs and sophisticated models inherently require
a higher level of judgment and may require adjustment to reflect factors
that market participants would consider in estimating fair value, such as
close-out costs, which are presented in Note 21d.
UBS
AG
‘
s governance framework over fair value measurement is
described in Note 21b, and UBS AG provides a sensitivity analysis of the
estimated effects arising from changing significant unobservable inputs in
Level 3 financial instruments to reasonably possible alternative assumptions
in Note 21g.
›
Refer to Note 21 for more information
g. Allowances and provisions for expected credit losses
ECL are recognized for financial assets measured at amortized
cost, financial assets measured at FVOCI, fee and lease
receivables, financial guarantees
,
and loan commitments
not
measured at fair value. ECL are also recognized on the undrawn
portion of committed unconditionally revocable credit lines,
which include UBS
AG
’s credit card limits and master credit
facilities, as UBS AG is exposed to credit risk because the borrower
has the ability to draw down funds before UBS AG can take credit
risk mitigation actions.
Recognition of expected credit losses
ECL are recognized on the following basis:
–
Stage 1 instruments: Maximum 12-month ECL are recognized
from initial recognition, reflecting the portion of lifetime cash
shortfalls that would result if a default occurs in the 12 months
after the reporting date, weighted by the risk of a default
occurring.
–
Stage 2 instruments: Lifetime ECL are recognized if a
significant increase in credit risk (
an
SICR) is observed
subsequent to the instrument’s initial recognition, reflecting
lifetime cash shortfalls that would result from all possible
default events over the expected life of a financial instrument,
weighted by the risk of a default occurring. When an SICR is
no longer observed, the instrument will move back to stage 1.
–
Stage 3 instruments: Lifetime ECL are always recognized for
credit-impaired financial instruments, as determined by the
occurrence of one or more loss events, by estimating expected
cash flows based on a chosen
recovery
strategy. Credit
-
impaired exposures may include positions for which no
allowance has been recognized, for example because they are
expected to be fully recoverable through collateral held.
–
Changes in lifetime ECL since initial recognition are also
recognized for assets that are purchased or originated credit-
impaired (POCI). POCI financial instruments include those that
are purchased at a deep discount or newly originated with a
defaulted counterparty; they remain a separate category until
derecognition.
All or part of a financial asset is written off if it is deemed
uncollectible or forgiven. Write-offs reduce the principal amount
of a claim and are charged against related allowances for credit
losses. Recoveries, in part or in full, of amounts previously written
off are generally credited to
Credit loss (expense) / release
.
ECL are recognized in the income statement in
Credit loss
(expense) / release
. A corresponding ECL allowance is reported as
a decrease in the carrying amount of financial assets measured at
amortized cost on the balance sheet. For financial assets that are
measured at FVOCI, the carrying amount is not reduced, but an
accumulated amount is recognized in
Other comprehensive
income
. For off-balance sheet financial instruments and other
credit lines, provisions for ECL are presented in
Provisions.
Default and credit impairment
UBS
AG
applies a single definition of default for credit risk
management purposes, regulatory reporting and ECL, with a
counterparty classified as defaulted based on quantitative and
qualitative criteria.
›
Refer to “Credit policies for distressed assets’’ in the ‘’Risk
management and control” section of this report for more
information
Measurement of expected credit losses
IFRS 9 ECL reflect an unbiased, probability-weighted estimate
based on loss expectations resulting from default events. The
method used to calculate ECL applies the following principal
factors: probability of default (PD), loss given default (LGD) and
exposure at default (EAD). Parameters are generally determined
on an individual financial asset level. Based on the materiality of
the portfolio, for credit card exposures and personal account
overdrafts in Switzerland, a portfolio approach is applied that
derives an average PD and LGD for the entire portfolio. PDs and
LGDs used in the ECL calculation are point-in-time (PIT)-based for
key portfolios and consider both current conditions and expected
cyclical changes. For material portfolios, PDs and LGDs are
determined for different scenarios, whereas EAD projections are
treated as scenario independent.
For the purpose of determining the ECL-relevant parameters,
UBS AG leverages its Pillar 1 internal ratings-based (IRB) models
that are also used in determining expected loss (EL) and risk-
weighted assets under the Basel III framework and Pillar 2 stress
loss models. Adjustments have been made to these models and
IFRS 9-related models have been developed that consider the
complexity, structure and risk profile of relevant portfolios and
take account of the fact that PDs and LGDs used in the ECL
calculation are PIT-based, as opposed to the corresponding
Basel III through-the-cycle (TTC) parameters. All models that are
relevant for measuring expected credit losses are subject to UBS
AG’s model validation and oversight processes.
Consolidated financial statements | UBS AG consolidated financial statements
430
Note 1 Summary of material accounting policies (continued)
Probability of default:
PD represents the probability of a default
over a specified time period. A 12-month PD represents the
probability of default determined for the next 12 months and a
lifetime PD represents the probability of default over the
remaining lifetime of the instrument. PIT PDs are derived from TTC
PDs and scenario forecasts. The modeling is region-, industry- and
client segment-specific and considers both macroeconomic
scenario dependencies and client-idiosyncratic information.
Exposure at default:
EAD represents an estimate of the
exposure to credit risk at the time of a potential default occurring,
considering expected repayments, interest payments and
accruals, discounted at the EIR. Future drawdowns on facilities are
considered through a credit conversion factor (a CCF) that is
reflective of historical drawdown and default patterns and the
characteristics of the respective portfolios.
Loss given default:
LGD represents an estimate of the loss at the
time of a potential default occurring, taking into account expected
future cash flows from collateral and other credit enhancements, or
expected payouts from bankruptcy proceedings for unsecured
claims and, where applicable, time to realization of collateral and
the seniority of claims. LGD is commonly expressed as a percentage
of EAD.
Estimation of expected credit losses
Number of scenarios and estimation of scenario weights
Determination of probability -weighted ECL requires evaluating a
range of diverse and relevant future economic conditions,
especially with a view to modeling the non-linear effect of
assumptions about macroeconomic factors on the estimate.
To accommodate this
requirement, UBS
AG
uses different
economic scenarios in the ECL calculation
.
Each scenario is
represented by a specific scenario narrative, which is relevant
considering the exposure of key portfolios to economic risks, and
for which a set of consistent macroeconomic variables is
determined. The estimation of the appropriate weights for these
scenarios is predominantly judgement-based. The assessment is
based on a holistic review of the prevailing economic or political
conditions, which may exhibit different levels of uncertainty. It
takes into account the impact of changes in the nature and
severity of the underlying scenario narratives and the projected
economic variables.
The determined weights constitute the probabilities that the
respective set of macroeconomic conditions will occur and not
that the chosen particular narratives with the related
macroeconomic variables will materialize.
Macroeconomic and other factors
The range of macroeconomic, market and other factors that is
modeled as part of the scenario determination is wide, and
historical information is used to support the identification of the
key factors. As the forecast horizon increases, the availability of
information decreases, requiring an increase in judgment. For
cycle
-
sensitive PD a
nd LGD determination purposes, UBS
AG
projects the relevant economic factors for a period of three years
before reverting, over a specified period, to cycle-neutral PD and
LGD for longer-term projections.
Factors relevant for ECL calculation vary by type of exposure.
Regional and client-segment characteristics are generally taken
into account, with specific focus on Switzerland and the US,
considering UBS AG’s key ECL-relevant portfolios.
For UBS AG, the following forward-looking macroeconomic
variables represent the most relevant factors for ECL calculation:
–
GDP growth rates, given their significant effect on borrowers’
performance;
–
unemployment rates, given their significant effect on private
clients’ ability to meet contractual obligations;
–
house price indices, given their significant effect on mortgage
collateral valuations;
–
interest rates, given their significant effect on counterparties’
abilities to service debt;
–
consumer price indices, given their overall relevance for
companies’ performance, private clients’ purchasing power
and economic stability; and
–
equity indices, given that they are an important factor in our
corporate rating tools.
Scenario generation, review process and governance
A team of economists, who are part of Group Risk Control,
develop the forward-looking macroeconomic assumptions with
involvement from a broad range of experts.
The scenarios, their weight and the key macroeconomic and
other factors are subject to a critical assessment by the IFRS 9
Scenario Sounding Sessions and ECL Management Forum, which
include senior management from Group Risk and Group Finance.
Important aspects for the review include whether there may be
particular credit risk concerns that may not be capable of being
addressed systematically and require post-model adjustments for
stage allocation and ECL allowance.
The Group Model Governance
Committee
,
as the highest
authority under UBS AG’s model governance framework, ratifies
the decisions taken by the ECL Management Forum.
›
Refer to Note 20 for more information
ECL measurement period
The period for which lifetime ECL are determined is based on the
maximum contractual period that UBS AG is exposed to credit
risk, taking into account contractual extension, termination and
prepayment options. For irrevocable loan commitments and
financial guarantee contracts, the measurement period represents
the maximum contractual period for which UBS
AG
has an
obligation to extend credit.
431
Note 1 Summary of material accounting policies (continued)
Additionally, some financial instruments include both an on-
demand loan and a revocable undrawn commitment, where the
contractual cancellation right does not limit UBS AG’s exposure to
credit risk to the contractual notice period, as the client has the
abi
lity to draw down funds before UBS
AG
can take risk
-
mitigating actions. In such cases UBS AG is required to estimate
the period over which it is exposed to credit risk. This applies to
UBS
AG
’s credit card limits, which do not have a defined
contractual maturity date, are callable on demand and where the
drawn and undrawn components are managed as one exposure.
The exposure arising from UBS AG’s credit card limits is not
significant and is managed at a portfolio level, with credit actions
triggered when balances are past due. An ECL measurement
period of seven years is applied for credit card limits, capped at 12
months for stage 1 balances, as a proxy for the period that UBS
AG is exposed to credit risk.
Customary master credit agreements in the Swiss corporate
market also include on-demand loans and revocable undrawn
commitments. For smaller commercial facilities, a risk-based
monitoring (RbM) approach is in place that highlights negative
trends as risk events, at an individual facility level, based on a
combination of continuously updated risk indicators. The risk
events trigger additional credit reviews by a risk officer, enabling
informed credit decisions to be taken. Larger corporate facilities
are not subject to RbM, but are reviewed at least annually through
a formal credit review. UBS AG has assessed these credit risk
management practices and considers both the RbM approach and
formal credit reviews as substantive credit reviews resulting in a
re-origination of the given facility. Following this, a 12-month
measurement period from the reporting date is used for both
types of facilities as an appropriate proxy of the period over which
UBS AG is exposed to credit risk, with 12 months also used as a
look-back period for assessing SICR, always from the respective
reporting date.
Significant increase in credit risk
Financial instruments subject to ECL are monitored on an
ongoing basis. To determine whether the recognition of a
maximum 12-month ECL continues to be appropriate, an
assessment is made as to whether an SICR has occurred since
initial recognition of the financial instrument , applying both
quantitative and qualitative factors.
Primarily, UBS AG assesses changes in an instrument’s risk of
default on a quantitative basis by comparing the annualized
forward-looking and scenario-weighted lifetime PD of an
instrument determined at two different dates:
–
at the reporting date; and
–
at inception of the instrument.
If, based on UBS AG’s quantitative modeling, an increase
exceeds a set threshold, an SICR is deemed to have occurred and
the instrument is transferred to stage 2 with lifetime ECL
recognized.
The threshold applied varies depending on the original credit
quality of the borrower, with a higher SICR threshold set for those
instruments with a low PD at inception. The SICR assessment
based on PD changes is made at an individual financial asset level.
A high-level overview of the SICR trigger, which is a multiple of
the annualized remaining lifetime PIT PD expressed in rating
downgrades, is provided in the “SICR thresholds” table below.
The actual SICR thresholds applied are defined on a more granular
level by interpolating between the values shown in the table.
SICR thresholds
Internal rating at origination
of the instrument
Rating downgrades /
SICR trigger
0–3
3
4–8
2
9–13
1
›
Refer to the “
Risk management and control
” section of this
report for more details about UBS AG’s internal grading system
Irrespective of the SICR assessment based on default
probabilities, credit risk is generally deemed to have significantly
increased for an instrument if the contractual payments are more
than 30 days past due. For certain less material portfolios,
specifically the Swiss credit card portfolio, the 30-day past due
criterion is used as the primary indicator of an SICR. Where
instruments are transferred to stage 2 due to the 30-day past due
criterion, a minimum period of six months is applied before a
transfer back to stage 1 can be triggered. For instruments in
Personal & Corporate Banking and Global Wealth Management
Region Switzerland that are between 90 and 180 days past due
but have not been reclassified to stage 3, a one-year period is
applied before a transfer back to stage 1 can be triggered.
Additionally, based on individual counterparty-specific
indicators, external market indicators of credit risk or general
economic conditions, counterparties may be moved to a watch
list, which is used as a secondary qualitative indicator for an SICR.
Exception management is further applied, allowing for individual
and collective adjustments on exposures sharing the same credit
risk characteristics to take account of specific situations that are
not otherwise fully reflected.
In general, the overall SICR determination process does not
apply to Lombard loans, securities financing transactions and
certain other asset-based lending transactions, because of the risk
management practices adopted, including daily monitoring
processes with strict margining. If margin calls are not satisfied, a
position is closed out and classified as a stage 3 position. In
exceptional cases, an individual adjustment and a transfer into
stage 2 may be made to take account of specific facts.
Consolidated financial statements | UBS AG consolidated financial statements
432
Note 1 Summary of material accounting policies
(continued)
Credit risk officers are responsible for the identification of an
SICR, which for accounting purposes is in some respects different
from internal credit risk management processes. This difference
mainly
arises
because ECL accounting requirements are
instrument-specific, such that a borrower can have multiple
exposures allocated to different stages, and maturing loans in
stage 2 will migrate to stage 1 upon renewal irrespective of the
actual credit risk at that time. Under a risk-based approach, a
holistic counterparty credit assessment and the absolute level of
risk at any given date will determine what risk-mitigating actions
may be warranted.
›
Refer to the “
Risk management and control
” section of this
report for more information
Critical accounting estimates and judgments
The calculation of ECL requires management to apply significant judgment
and make estimates and assumptions that can result in significant changes
to the timing and amount of ECL recognized.
Determination of a significant increase in credit risk
IFRS 9 does not include a definition of what constitutes an SICR, with UBS
AG’s assessment considering qualitative and quantitative criteria. An IFRS 9
ECL Management Forum has been established to review and challenge the
SICR results.
Scenarios, scenario weights and macroeconomic variables
ECL reflect an unbiased and probability-weighted amount, which UBS AG
determines by evaluating a range of possible outcomes. Management
selects forward-looking scenarios that include relevant macroeconomic
variables and management’s assumptions around future economic
conditions. IFRS 9 Scenario Sounding Sessions, in addition to the IFRS 9 ECL
Management Forum, are in place to derive, review and challenge the
scenario selection and weights, and to determine whether any additional
post-model adjustments are required that may significantly affect ECL.
ECL measurement period
Lifetime ECL are generally determined based upon the contractual maturity
of the transaction, which significantly affects ECL. For credit card limits and
Swiss callable master credit facilities, judgment is required, as UBS AG must
determine the period over which it is exposed to credit risk. A seven-year
period is applied for credit card limits, capped at 12 months for stage 1
positions, and a 12-month period applied for master credit facilities.
Modeling and post-model adjustments
A number of complex models have been developed or modified to calculate
ECL, with additional post-model adjustments required which may
significantly affect ECL. The models are governed by UBS AG’s model
validation controls and approved by the Group Model Governance
Committee (the GMGC). The post-model adjustments are approved by the
ECL Management Forum and endorsed by the GMGC.
A
sensitivity analysis
covering key macroeconomic variables
, scenario
weights and SICR trigger points on ECL measurement is provided in Note
20f.
›
Refer to Note 20 for more information
h.
Restructured and modified financial assets
When payment default is expected, or where default has already
occurred, UBS AG may grant concessions to borrowers in financial
difficulties that it would not consider in the normal course of its
business, such as preferential interest rates, extension of maturity,
modifying the schedule of repayments, debt / equity swap,
subordination, etc. When a concession or forbearance measure is
granted, each case is considered individually and the exposure is
generally classified as being in default. Forbearance classification
will remain until the loan is collected or written off, non-
preferential conditions superseding preferential conditions are
granted or until the counterparty has recovered and the
preferential conditions no longer exceed UBS AG’s risk tolerance.
Modifications result in an alteration of future contractual cash
flows and can occur within UBS AG’s normal risk tolerance or as
part of a credit restructuring where a counterparty is in financial
difficulties. The restructuring or modification of a financial asset
could lead to a substantial change in the terms and conditions,
resulting in the original financial asset being derecognized and a
new financial asset being recognized. Where the modification
does not result in a derecognition, any difference between the
modified contractual cash flows discounted at the original EIR and
the existing gross carrying amount of the given financial asset is
recognized in the income statement as a modification gain or loss.
i. Offsetting
UBS AG presents financial assets and liabilities on its balance sheet
net if (i) it has a legally enforceable right to set off the recognized
amounts and (ii) it intends either to settle on a net basis or to
realize the asset and settle the liability simultaneously. Netted
positions include, for example, certain derivatives and repurchase
and reverse repurchase transactions with various counterparties,
exchanges and clearing houses.
In assessing whether UBS AG intends to either settle on a net
basis, or to realize the asset and settle the liability simultaneously,
emphasis is placed on the effectiveness of operational settlement
mechanics in eliminating substantially all credit and liquidity
exposure between the counterparties. This condition precludes
offsetting on the balance sheet for substantial amounts of UBS
AG’s financial assets and liabilities, even though they may be
subject to enforceable netting arrangements.
R
epurchase
arrangements and securities financing transactions are presented
net only to the extent that the settlement mechanism eliminates,
or results in insignificant, credit and liquidity risk, and processes
the receivables and payables in a single settlement process or
cycle.
›
Refer to Note
22
for more information
433
Note 1 Summary of material accounting policies (continued)
j.
Hedge accounting
UBS AG applies hedge accounting requirements of IFRS 9, unless
stated otherwise below, where the criteria for documentation and
hedge effectiveness are met. If a hedge relationship no longer
meets the criteria for hedge accounting, hedge accounting is
discontinued. Voluntary discontinuation of hedge accounting is
permitted under IAS 39 but not under IFRS 9.
Fair value hedges of interest rate risk related to debt instruments
and loan assets
The fair value change of the hedged item attributable to a hedged
risk is reflected as an adjustment to the carrying amount of the
hedged item, and recognized in the income statement along with
the change in the fair value of the hedging instrument.
Fair value hedges of portfolio interest rate risk related to loans
designated under IAS 39
Prior to discontinuation in December 2021, the fair value change
of the hedged item attributable to a hedged risk is reflected within
Other financial assets measured at amortized cost
or
Other
financial liabilities measured at amortized cost
and recognized in
the income statement along with the change in the fair value of
the hedging instrument.
Fair value hedges of FX risk related to debt instruments
The fair value change of the hedged item attributable to the
hedged risk is reflected in the measurement of the hedged item
and recognized in the income statement along with the change
in the fair value of the hedging instrument. The foreign currency
basis spread of cross-currency swaps designated as hedging
derivatives is excluded from the designation and accounted for as
a cost of hedging with amounts deferred in
Other comprehensive
income
Equity
. These amounts are released to the income
statement over the term of the hedged item.
Discontinuation of fair value hedges
Discontinuations for reasons other than derecognition of the hedged
item result in an adjustment to the carrying amount, which is
amortized to the income statement over the remaining life of the
hedged item using the effective interest method. If the hedged item
is derecognized, the unamortized fair value adjustment or deferred
cost of hedging amount is recognized immediately in the income
statement as part of any derecognition gain or loss.
Cash flow hedges of forecast transactions
Fair value gains or losses associated with the effective portion of
derivatives designated as cash flow hedges for cash flow repricing
risk are recognized initially in
Other comprehensive income
within
Equity
when the hedged forecast cash flows affect profit or loss,
including discontinued hedges for which forecast cash flows are
expected to occur. If the forecast transactions are no longer
expected to occur, the deferred gains or losses are immediately
reclassified to the income statement.
Hedges of net investments in foreign operations
Gains or losses on the hedging instrument relating to the effective
portion of a hedge are recognized directly in
Other comprehensive
income
Equity,
while any gains or losses relating to the
ineffective and / or undesignated portion (for example, the interest
element of a forward contract) are recognized in the income
statement. Upon disposal or partial disposal of the foreign operation,
the cumulative value of any such gains or losses recognized in
Equity
associated with the entity
is reclassified to
Other income
.
Interest Rate Benchmark Reform
UBS AG can continue hedge accounting during the period of
uncertainty before existing interest rate benchmarks are replaced
with alternative risk-free interest rates. During this period, UBS AG
can assume that the current benchmark rates will continue to
exist, such that forecast transactions are considered highly
probable an
d hedge relationships remain,
with
little or
no
consequential impact on the financial statements. Upon
replacement of existing interest rate benchmarks by alternative
risk-free interest rates expected in 2021 and beyond, UBS AG will
apply the requirements of
Amendments to IFRS 9, IAS 39, IFRS 7,
IFRS 4 and IFRS 16 (Interest Rate Benchmark Reform – Phase 2).
›
Refer to Note 1b for more information
3) Fee and commission income and expenses
UBS AG earns fee income from the diverse range of services it
provides to its clients. Fee income can be divided into two broad
categories: fees earned from services that are provided over a
certain period of time, such as management of clients’ assets,
custody services and certain advisory services; and fees earned
from point-in-time services, such as underwriting fees, deal-
contingent merger and acquisitions fees, and brokerage fees
(e.g., securities and derivatives execution and clearing). UBS AG
recognizes fees earned from point-in-time-services when it has
fully provided the service to the customer. Where the contract
requires services to be provided over time, income is recognized
on a systematic basis over the life of the agreement.
Consideration received is allocated to the separately
identifiable performance obligations in a contract. Owing to the
nature of UBS AG’s business, contracts that include multiple
performance obligations are typically those that are considered to
include a series of similar performance obligations fulfilled over
time with the same pattern of transfer to the client, e.g.,
management of client assets and custodial services. As a
consequence, UBS
AG
is not required to apply significant
judgment in allocating the consideration received across the
various performance obligations.
Consolidated financial statements | UBS AG consolidated financial statements
434
Note 1 Summary of material accounting policies (continued)
Point-in-time services are generally for a fixed price or
dependent on deal size, e.g., a fixed number of basis points of
trade size, where the amount of revenue is known when the
performance obligation is met. Fixed over-time fees are
recognized on a straight-line basis over the performance period.
Custodial and asset management fees can be variable through
reference to the size of the customer portfolio. However, they are
generally billed on a monthly or quarterly basis once the
customer’s portfolio size is known or known with near certainty
and therefore also recognized ratably over the performance
period. UBS AG does not recognize performance fees related to
management of clients’ assets or fees related to contingencies
beyond UBS AG’s control until such uncertainties are resolved.
UBS AG’s fees are generally earned from short-term contracts.
As a result, UBS
AG
’s contracts do not include a financing
component or result in the recognition of significant receivables
or prepayment assets. Furthermore, due to the short-term nature
of such contracts, UBS AG has not capitalized any material costs
to obtain or fulfill a contract or generated any significant contract
assets or liabilities.
UBS AG presents expenses primarily in line with their nature in
the income statement, differentiating between expenses that are
directly attributable to the satisfaction of specific performance
obligations associated with the generation of revenues, which are
generally presented within
Total operating income
Fee and
commission expense
, and those that are related to personnel,
general and administrative expenses, which are presented within
Total operating expenses
. For derivatives execution and clearing
services (where UBS AG acts as an agent), UBS AG only records its
specific fees in the income statement, with fees payable to other
parties not recognized as an expense but instead directly offset
against the associated income collected from the given client.
›
Refer to Note 4 for more information, including the
disaggregation of revenues
4)
Share-based and other deferred compensation plans
UBS AG recognizes expenses for deferred compensation awards
over the period that the employee is required to provide service
to become entitled to the award. Where the service period is
shortened, for example in the case of employees affected by
restructuring programs or mutually agreed termination provisions,
recognition of such expense is accelerated to the termination
date. Where no future service is required, such as for employees
who are eligible for retirement or who have met certain age and
length-of-service criteria, the services are presumed to have been
received and compensation expense is recognized over the
performance year or, in the case of off-cycle awards, immediately
on the grant date.
Share-based compensation plans
UBS Group AG is the grantor of and maintains the obligation to
settle share-based compensation plans that are awarded to
employees of UBS AG. As a consequence, UBS AG classifies the
awards of UBS Group AG shares as equity-settled share-based
payment transactions. UBS AG recognizes the fair value of awards
granted to its employees by reference to the fair value of UBS
Group AG’s equity instruments on the date of grant, taking into
account the terms and conditions inherent in the award,
including, where relevant, dividend rights, transfer restrictions in
effect beyond the vesting date, market conditions, and non-
vesting conditions.
For equity-settled awards, fair value is not remeasured unless
the terms of the award are modified such that there is an
incremental increase in value. Expenses are recognized, on a per-
tranche basis, over the service period based on an estimate of the
number of instruments expected to vest and are adjusted to
reflect the actual outcomes of service or performance conditions.
For equity-settled awards, forfeiture events resulting from a
breach of a non-vesting condition (i.e., one that does not relate
to a service or performance condition) do not result in any
adjustment to the share-based compensation expense.
For cash-settled share-based awards, fair value is remeasured
at each reporting date, so that the cumulative expense recognized
equals the cash distributed.
Other deferred compensation plans
Compensation expense for other deferred compensation plans is
recognized on a per-tranche or straight-line basis, depending on
the nature of the plan. The amount recognized is measured based
on the present value of the amount expected to be paid under
the plan and is remeasured at each reporting date, so that the
cumulative expense recognized equals the cash or the fair value
of respective financial instruments distributed.
›
Refer to Note
28
435
Note 1 Summary of material accounting policies (continued)
5)
Post-employment benefit plans
Defined benefit plans
Defined benefit
plans specify an amount of benefit that an
employee will receive, which usually depends on one or more
factors, such as age, years of service and compensation. The
defined benefit liability recognized in the balance sheet is the
present value of the defined benefit obligation, measured using
the projected unit credit method, less the fair value of the plan’s
assets at the balance sheet date, with changes resulting from
remeasurements recorded immediately in
Other comprehensive
income
. If the fair value of the plan ’s assets is higher than the
present value of the defined benefit obligation, the recognition of
the resulting net asset is limited to the present value of economic
benefits available in the form of refunds from the plan or
reductions in future contributions to the plan. Calculation of the
net defined benefit obligation or asset takes into account the
specific features of each plan, including risk sharing between
employee and employer,
and
is
calculated periodically by
independent qualified actuaries.
Critical accounting estimates and judgments
The net defined benefit liability or asset at the balance sheet date and the
related personnel expense depend on the expected future benefits to be
provided, determined using a number of economic and demographic
assumptions. A range of assumptions could be applied, and different
assumptions could significantly alter the defined benefit liability or asset
and pension expense recognized. The most significant assumptions include
life expectancy, discount rate, expected salary increases, pension increases
and interest credits on retirement savings account balances. Sensitivity
analysis for reasonable possible movements in each significant assumption
for UBS AG‘s post-employment obligations is provided in Note 27
.
›
Refer to Note 27
for more information
Defined contribution plans
A defined contribution plan pays fixed contributions into a
separate entity from which post-employment and other benefits
are paid. UBS AG has no legal or constructive obligation to pay
further amounts if the plan does not hold sufficient assets to pay
employees the benefits relating to employee service in the current
and prior periods. Compensation expense is recognized when the
employees have rendered services in exchange for contributions.
This is generally in the year of contribution. Prepaid contributions
are recognized as an asset to the extent that a cash refund or a
reduction in future payments is available.
6)
Income taxes
UBS AG is subject to the income tax laws of Switzerland and those
of the non-Swiss jurisdictions in which UBS AG has business
operations.
UBS AG’s provision for income taxes is composed of current
and deferred taxes. Current income taxes represent taxes to be
paid or refunded for the current period or previous periods.
Deferred taxes are recognized for temporary differences
between the carrying amounts and tax bases of assets and
liabilities that will result in taxable or deductible amounts in future
periods and are measured using the applicable tax rates and laws
that have been enacted or substantively enacted by the end of the
reporting period and that will be in effect when such differences
are expected to reverse.
Deferred tax assets arise from a variety of sources, the most
significant being: (i) tax losses that can be carried forward to be
used against profits in future years; and (ii) temporary differences
that will result in deductions against profits in future years.
Deferred tax assets are recognized only to the extent it is probable
that sufficient taxable profits will be available against which these
differences can be used. When an entity or tax group has a history
of recent losses, deferred tax assets are only recognized to the
extent there are sufficient taxable temporary differences or there
is convincing other evidence that sufficient taxable profit will be
available against which the unused tax losses can be utilized.
Deferred tax liabilities are recognized for temporary differences
between the carrying amounts of assets and liabilities in the
balance sheet that reflect the expectation that certain items will
give rise to taxable income in future periods.
Deferred and current tax assets and liabilities are offset when:
(i) they arise in the same tax reporting group; (ii) they relate to the
same tax authority; (iii) the legal right to offset exists; and (iv) they
are intended to be settled net or realized simultaneously.
Current and deferred taxes are recognized as income tax
benefit or expense in the income statement, except for current
and deferred taxes recognized in relation to: (i) the acquisition of
a subsidiary (for which such amounts would affect the amount of
goodwill arising from the acquisition); (ii) gains and losses on the
sale of treasury shares (for which the tax effects are recognized
directly in
Equity
); (iii) unrealized gains or losses on financial
instruments that are classified at FVOCI; (iv) changes in fair value
of derivative instruments designated as cash flow hedges; (v)
remeasurements of defined benefit plans; or (vi) certain foreign
currency translations of foreign operations. Amounts relating to
points (iii) through (vi)
above
are recognized in
Other
comprehensive income
Equity
.
UBS AG reflects the potential effect of uncertain tax positions
for which acceptance by the relevant tax authority is not
considered probable by adjusting current or deferred taxes, as
applicable, using either the most likely amount or expected value
methods,
depending on which method is
deemed
a better
predictor of the basis on which
,
and extent to which
,
the
uncertainty will be resolved.
Consolidated financial statements | UBS AG consolidated financial statements
436
Note 1 Summary of material accounting policies (continued)
Critical accounting estimates and judgments
Tax laws are complex, and judgment and interpretations about the
application of such laws are required when accounting for income taxes.
UBS AG considers the performance of its businesses and the accuracy of
historical forecasts and other factors when evaluating the recoverability of
its deferred tax assets, including the remaining tax loss carry-forward
period, and its assessment of expected future taxable profits in the forecast
period used for recognizing deferred tax assets. Estimating future
profitability and business plan forecasts is inherently subjective and is
particularly sensitive to future economic, market and other conditions.
Forecasts are reviewed annually, but adjustments may be made at other
times, if required. If recent losses have been incurred, convincing evidence
is required to prove there is sufficient future profitability given the value of
UBS
AG
’s deferred tax assets may b
e affected
, with effects
primarily
recognized through the income statement.
In addition, judgment is required to assess the expected value of
uncertain tax positions and the related probabilities, including
interpretation of tax laws, the resolution of any income tax-related appeals
and litigation.
›
Refer to Note
8
7) Property, equipment and software
Property, equipment and software
is
measured
at cost less
accumulated dep
reciation and impairment losses
.
Software
development costs are capitalized only when the costs can be
measured reliably and it is probable that future economic benefits
will arise. Depreciation of property, equipment and software
begins when they are available for use and is calculated on a
straight line basis over an asset’s estimated useful life.
Property, equipment and software are generally tested for
impairment at the appropriate
cash
-
generating unit level,
alongside goodwill and intangible assets as described in item 8 in
this Note. An impairment charge is recognized for such assets if
the recoverable amount is
below its carrying amount
.
The
recoverable amounts of such assets, other than property that has
a market price, are generally determined using a replacement cost
approach that reflects the amount that would be currently
required by a market participant to replace the service capacity of
the asset. If such assets are no longer used, they are tested
individually for impairment.
›
Refer to Note
12
for more information
8) Goodwill
Goodwill represents the excess of the consideration over the fair
value of identifiable assets, liabilities and contingent liabilities
acquired that arises in a business combination. Goodwill is not
amortized, but is assessed for impairment at the end of each
reporting period, or when indicators of impairment exist. UBS AG
tests goodwill for impairment annually, irrespective of whether
there is any indication of impairment.
An impairment charge is recognized in the income statement if
the carrying amount exceeds the recoverable amount.
Critical accounting estimates and judgments
UBS AG‘s methodology for goodwill impairment testing is based on a
model that is most sensitive to the following key assumptions: (i) forecasts
of earnings available to shareholders in years one to three; (ii) changes in
the discount rates; and (iii) changes in the long-term growth rate.
Earnings available to shareholders are estimated on the basis of forecast
results, which are part of the business plan approved by the Board of
Directors. The discount rates and growth rates are determined using
external information, and also considering inputs from both internal and
external analysts and the view of management.
The key assumptions used to determine the recoverable amounts of
each cash-generating unit are tested for sensitivity by applying reasonably
possible changes to those assumptions.
›
Refer to Notes
2
and
9) Provisions and contingent liabilities
Provisions are liabilities of uncertain timing or amount, and are
generally
recognized
in accordance with IAS
37,
Provisions,
Contingent Liabilities and Contingent Assets
, when: (i) UBS AG
has a present obligation as a result of a past event; (ii) it is probable
that an outflow of resources will be required to settle the
obligation; and (iii) a reliable estimate of the amount of the
obligation can be made.
The majority of UBS
AG
’s provisio
ns relate to litigation,
regulatory and similar matters, restructuring, and employee
benefits. Restructuring provisions are generally recognized as a
consequence of management agreeing to materially change the
scope of the business or the manner in which it is conducted,
including changes in management structures. Provisions for
employee benefits relate mainly to service anniversaries and
sabbatical leave, and are recognized in accordance with
measurement principles set out in item 4 in this Note. In addition,
UBS AG presents expected credit loss allowances within
Provisions
if they relate to a loan commitment, financial guarantee contract
or a revolving revocable credit line.
IAS 37 provisions are measured considering the best estimate
of the consideration required to settle the present obligation at
the balance sheet date.
When conditions required to recognize a provision are not met,
a contingent liability is disclosed, unless the likelihood of an
outflow of resources is remote. Contingent liabilities are also
disclosed for possible obligations that arise from past events the
existence of which will be confirmed only by uncertain future
events not wholly within the control of UBS AG.
437
Note 1 Summary of material accounting policies (continued)
Critical accounting estimates and judgments
Recognition of provisions often involves significant judgment in assessing
the existence of an obligation that results from
past events and in
estimating the probability, timing and amount of any outflows of resources.
This is particularly the case for litigation, regulatory and similar matters,
which, due to their nature, are subject to many uncertainties, making their
outcome difficult to predict.
The amount of any provision recognized is sensitive to the assumptions
used and there could be a wide range of possible outcomes for any
particular matter.
Management regularly reviews all the available information regarding
such matters, including legal advice, to assess whether the recognition
criteria for provisions have been satisfied and to determine the timing and
amount of any potential outflows.
›
Refer to Note
18
10) Foreign currency translation
Transactions denominated in a foreign currency are translated
into the functional currency of the reporting entity at the spot
exchange rate on the date of the transaction. At the balance sheet
date, all monetary assets, including those at FVOCI, and monetary
liabilities denominated in foreign currency are translated into the
functional currency using the closing exchange rate. Translation
differences are reported in
Other net income from financial
instruments measured at fair value through profit or loss
.
Non-monetary items measured at historical cost are translated
at the exchange rate on the date of the transaction.
Upon consolidation, assets and liabilities of foreign operations
are translated into US dollars, UBS AG’s presentation currency, at
the closing exchange rate on the balance sheet date, and income
and expense items and other comprehensive income are translated
at the average rate for the period. The resulting foreign currency
translation differences are recognized in
Equity
the income statement when UBS AG disposes of, partially or in its
entirety, the foreign operation and UBS AG no longer controls the
foreign operation.
Share capital issued, share premium and treasury shares held are
translated at the historic average rate, with the difference between
the historic average rate and the spot rate realized upon repayment
of share capital or disposal of treasury shares reported as
Share
premium.
Other comprehensive
income
in respect of cash flow hedges and financial assets
measured at FVOCI are translated at the closing exchange rate as
of the balance sheet dates, with any translation effects adjusted
through
Retained earnings
.
›
Refer to Note 33 for more information
11) Net cash settlement contracts
Contracts involving UBS Group AG shares that require net cash
settlement, or provide the counterparty or UBS
AG
with a
settlement option that includes a choice of settling net in cash,
are classified as derivatives held for trading.
Consolidated financial statements | UBS AG consolidated financial statements
438
Note 1 Summary of material accounting policies (continued)
b)
Changes in accounting policies, comparability and other adjustments
Amendments to IAS 1,
Presentation of Financial Statements
, and
IFRS Practice Statement 2,
Making Materiality Judgements
Effective from 1 January 2021, UBS AG early adopted
amendments to IAS 1,
Presentation of Financial Statements
, and
IFRS Practice Statement 2,
Making Materiality Judgements
, issued
by IASB in February 2021. The disclosure of material accounting
policies in Note 1a has been refined through adopting these
amendments.
Amendments to IAS 39, IFRS 9 and IFRS 7 (
Interest Rate
Benchmark Reform – Phase 2
)
On 1 January 2021, UBS adopted
Interest Rate Benchmark
Reform – Phase 2 (Amendments to IFRS 9, IAS 39, IFRS 7, IFRS 4
and IFRS 16)
, addressing a number of issues in financial reporting
areas that arise when interbank offered rates (IBORs) are reformed
or replaced. The amendments provide a practical expedient that
permits certain changes in the contractual cash flows of debt
instruments attributable to the replacement of IBORs with
alternative reference rates (ARRs) to be accounted for
prospectively by updating a given instrument’s effective interest
rate (EIR), provided (i) the change is necessary as a direct
consequence of IBOR reform and (ii) the new basis for
determining the contractual cash flows is economically equivalent
to the previous basis. UBS AG has adopted the amendments,
which had no material effect on UBS AG’s financial statements.
T
he amendments
also
provide various hedge accounting
reliefs, with the following adopted by UBS AG:
–
D
esignate
an
ARR as a non
-
contractually specified risk
component, even if it is not separately identifiable at the date
when it was designated, provided UBS AG can reasonably
expect that it will meet the requirements within 24 months of
the first designation and the risk component is reliably
measurable. As of 31 December 2021, the principal ARRs that
UBS AG has designated as the hedged risk in fair value hedges
of interest rate risk related to debt instruments, mortgages and
cash flow hedges of forecast transactions were the Secured
Overnight Financing Rate (SOFR),
the
Swiss
Average Rate
Overnight (SARON) and the Sterling Overnight Index Average
(SONIA).
–
Amend hedge documentation for the fair value hedges of
interest rate risk related to debt instruments for which the
hedged risk changed due to IBOR reform, which allowed UBS
AG to continue the hedge relationship in accordance with the
requirements of the phase 2 amendment.
–
The cash flow hedges of IBOR forecast transactions in Swiss
francs and pounds sterling were discontinued and replaced
with new ARR designations in December 2021. The amount
accumulated in the cash flow hedge reserve is deemed to be
based on the ARR on which the hedged future cash flows will
be based. Amounts will be released to the income statement
when the forecast ARR cash flows affect the income statement
or are no longer expected to occur.
›
Refer to Note 26 for more information
The amendments also introduced additional disclosure
requirements regarding UBS AG’s management of the transition
to alternative benchmark rates, its progress as at the reporting
date and the risks to which it is exposed arising from financial
instruments because of the transition.
›
Refer to Note 25 for more information
c)
International Financial Reporting Standards and Interpretations to be adopted in 2022 and later and other changes
IFRS 17,
In May 2017, the IASB issued IFRS 17,
Insurance Contracts
, which
sets out the accounting requirements for contractual rights and
obligations that arise from insurance contracts issued and
reinsurance contracts held. IFRS 17 is effective from 1 January
2023. UBS AG is assessing the standard, but does not expect it to
have a material effect on UBS AG’s financial statements.
439
Note 2a Segment reporting
UBS AG’s businesses are organized globally into four business
divisions: Global Wealth Management, Personal & Corporate
Banking, Asset Management and the Investment Bank. All four
business divisions are supported by Group Functions and qualify
as reportable segments for the purpose of segment reporting.
Together with Group Functions, the four business divisions reflect
the management structure of UBS AG.
–
Global Wealth Management
pr
ovides financial services,
advice and solutions to private clients, in particular in the ultra
high net worth and high net worth segments. Its offering
ranges from investment management to estate planning and
corporate finance advice, in addition to specific wealth
management products and services. The business division is
managed globally across the regions.
–
Personal & Corporate Banking
and institutional client
s
’ needs
,
from
basic banking to
retirement, financing, investments and strategic transactions,
in Switzerland
,
through its branch network and digital
channels.
–
Asset Management
asset manager. It offers investment capabilities and styles
across all major traditional and alternative asset classes, as well
as advisory support to institutions, wholesale intermediaries
and wealth management clients globally.
–
The
Investment Bank
provides a range of services to
institutional, corporate and wealth management clients
globally, to help them raise capital, grow their businesses,
invest and manage risks. Its offering includes advisory services,
facilitating clients raising debt and equity from the public and
private markets
and
capital markets, cash and derivatives
trading across equities and fixed income, and financing.
–
Group Functions
Group Services
(
which consists of
Technology,
Corporate
Services,
Human Resources
,
Finance,
Legal, Ris
k Control,
Compliance, Regulatory & Governance, Communications &
Branding and Group Sustainability and Impact), Group Treasury
and Non-core and Legacy Portfolio.
Financial information about the four business divisions and
Group Functions is presented separately in internal management
reports to the Executive Board, which is considered the “chief
operating decision maker” pursuant to IFRS 8,
Operating
Segments
.
UBS AG’s internal accounting policies, which include
management accounting policies and service level agreements,
determine the revenues and expenses directly attributable to each
reportable segment. Transactions between the reportable
segments are carried out at internally agreed rates and are
reflected in the operating results of the reportable segments.
Revenue-sharing agreements are used to allocate external client
revenues to reportable segments where several reportable
segments are involved in the value creation chain. Total
intersegment revenues for UBS AG are immaterial, as the majority
of the revenues are allocated across the segments by means of
revenue-sharing agreements. Interest income earned from
managing UBS AG’s consolidated equity is allocated to the
reportable segments based on average attributed equity and
currency composition. Assets and liabilities of the reportable
segments are funded through and invested with Group Functions,
and the net interest margin is reflected in the results of each
reportable segment.
Segment assets are based on a third-party view and do not
include intercompany balances. This view is in line with internal
reporting to management. If one operating segment is involved
in an external transaction together with another operating
segment or Group Functions, additional criteria are considered to
determine the segment that will report the associated assets. This
will include a consideration of which segment’s business needs
are being addressed by the transaction and which segment is
providing the funding and / or resources. Allocation of liabilities
follows the same principles.
Non-current assets disclosed for segment reporting purposes
represent assets that are expected to be recovered more than 12
months after the reporting date, excluding financial instruments,
deferred tax assets and post-employment benefits.
Consolidated financial statements | UBS AG consolidated financial statements
440
Note 2a Segment reporting (continued)
USD million
Global Wealth
Management
Personal &
Corporate
Banking
Asset
Management
Investment
Bank
Group
Functions
UBS AG
For the year ended 31 December 2021
Net interest income
4,244
2,120
(15)
481
(226)
6,605
Non-interest income
15,175
2,144
2,632
8,978
294
29,222
Income
19,419
4,264
2,617
9,459
68
35,828
Credit loss (expense) / release
29
86
(1)
34
0
148
Total operating income
19,449
4,350
2,616
9,493
68
35,976
Total operating expenses
14,743
2,623
1,593
6,902
1,151
27,012
Operating profit / (loss) before tax
4,706
1,726
1,023
2,592
(1,083)
8,964
Tax expense / (benefit)
1,903
Net profit / (loss)
7,061
Additional information
Total assets
395,235
225,425
25,202
346,641
123,641
1,116,145
Additions to non-current assets
56
16
1
30
1,689
1,791
USD million
Global Wealth
Management
Personal &
Corporate
Banking
Asset
Management
Investment
Bank
Group
Functions
UBS AG
For the year ended 31 December 2020
Net interest income
4,027
2,049
(17)
284
(555)
5,788
Non-interest income
1
13,107
1,859
2,993
9,224
504
27,686
Income
17,134
3,908
2,975
9,508
(52)
33,474
Credit loss (expense) / release
(88)
(257)
(2)
(305)
(42)
(695)
Total operating income
17,046
3,651
2,974
9,203
(94)
32,780
Total operating expenses
13,080
2,390
1,520
6,762
1,329
25,081
Operating profit / (loss) before tax
3,965
1,261
1,454
2,441
(1,423)
7,699
Tax expense / (benefit)
1,488
Net profit / (loss)
6,211
Additional information
Total assets
367,714
231,710
28,266
369,778
127,858
1,125,327
Additions to non-current assets
5
12
385
150
1,971
2,524
USD million
Global Wealth
Management
Personal &
Corporate
Banking
Asset
Management
Investment
Bank
Group
Functions
UBS AG
For the year ended 31 December 2019
Net interest income
3,947
1,993
(25)
(669)
(831)
4,415
Non-interest income
12,426
1,745
1,962
7,967
869
24,970
Income
16,373
3,737
1,938
7,298
38
29,385
Credit loss (expense) / release
(20)
(21)
0
(30)
(7)
(78)
Total operating income
16,353
3,717
1,938
7,268
31
29,307
Total operating expenses
13,018
2,274
1,407
6,515
925
24,138
Operating profit / (loss) before tax
3,335
1,443
531
753
(893)
5,169
Tax expense / (benefit)
1,198
Net profit / (loss)
3,971
Additional information
Total assets
309,766
209,512
34,565
316,058
102,028
971,927
Additions to non-current assets
68
10
0
1
4,935
5,014
1 Includes a USD
631
571
60
recognized in Global Wealth Management.
441
Note 2b Segment reporting by geographic location
The operating regions shown in the table below correspond to
the regional management structure of UBS AG. The allocation of
operating income to these regions reflects, and is consistent with,
the basis on which the business is managed and its performance
is evaluated. These allocations involve assumptions and
judgments that management considers to be reasonable, and
may be refined to reflect changes in estimates or management
structure. The main principles of the allocation methodology are
that client revenues are attributed to the domicile of the given
client and trading and portfolio management revenues are
attributed to the country where the risk is managed. This revenue
attribution is consistent with the mandate of the regional
Presidents. Certain revenues, such as those related to Non-core
and Legacy Portfolio in Group Functions, are managed at a Group
level. These revenues are included in the
Global
The geographic analysis of non-current assets is based on the
location of the entity in which the given assets are recorded.
For the year ended 31 December 2021
Total operating income
Total non-current assets
USD billion
Share %
USD billion
Share %
Americas
14.5
40
9.0
47
of which: USA
13.5
38
8.5
44
Asia Pacific
6.5
18
1.4
7
Europe, Middle East and Africa (excluding Switzerland)
7.0
19
2.6
13
Switzerland
7.9
22
6.3
33
Global
0.1
0
0.0
0
Total
36.0
100
19.3
100
For the year ended 31 December 2020
Total operating income
Total non-current assets
USD billion
Share %
USD billion
Share %
Americas
13.0
40
9.0
45
of which: USA
11.7
36
8.4
42
Asia Pacific
6.0
18
1.4
7
Europe, Middle East and Africa (excluding Switzerland)
6.5
20
2.7
14
Switzerland
6.9
21
6.9
34
Global
0.5
2
0.0
0
Total
32.8
100
20.0
100
For the year ended 31 December 2019
Total operating income
Total non-current assets
USD billion
Share %
USD billion
Share %
Americas
12.0
41
8.9
46
of which: USA
10.9
37
8.5
44
Asia Pacific
4.7
16
1.3
7
Europe, Middle East and Africa (excluding Switzerland)
5.8
20
2.6
13
Switzerland
6.7
23
6.5
34
Global
0.1
0
0.0
0
Total
29.3
100
19.3
100
Consolidated financial statements | UBS AG consolidated financial statements
442
Income statement notes
Note 3 Net interest income and other net income from financial instruments measured at fair value through profit or loss
For the year ended
USD million
31.12.21
31.12.20
31.12.19
Net interest income from financial instruments measured at fair value through profit or loss
1,437
1,305
1,015
Other net income from financial instruments measured at fair value through profit or loss
5,844
6,930
6,833
of which: net gains / (losses) from financial liabilities designated at fair value
1
(6,457)
1,625
(8,748)
Total net income from financial instruments measured at fair value through profit or loss
7,281
8,235
7,848
Net interest income
Interest income from loans and deposits
2
6,489
6,696
8,026
Interest income from securities financing transactions
3
513
862
2,005
Interest income from other financial instruments measured at amortized cost
284
335
364
Interest income from debt instruments measured at fair value through other comprehensive income
115
101
120
Interest income from derivative instruments designated as cash flow hedges
1,133
822
188
Total interest income from financial instruments measured at amortized cost and fair value through other comprehensive income
8,534
8,816
10,703
Interest expense on loans and deposits
4
1,655
2,440
4,541
Interest expense on securities financing transactions
5
1,102
870
1,152
Interest expense on debt issued
512
918
1,491
Interest expense on lease liabilities
98
105
118
Total interest expense from financial instruments measured at amortized cost
3,366
4,333
7,303
Total net interest income from financial instruments measured at amortized cost and fair value through other comprehensive income
5,168
4,483
3,400
Total net interest income from financial instruments measured at fair value through profit or loss
1,437
1,305
1,015
Total net interest income
6,605
5,788
4,415
1 Excludes fair value changes of hedges related to financial liabilities designated at fair value and foreign currency translation effects arising from translating foreign currency transactions into the respective functional
currency, both of which are reported within Other net income from financial instruments measured at fair value through profit or loss. 2021 included net losses of USD
2,068
72
and USD
1,830
of USD
2,068
72
1,830
through profit or loss not held for trading. 2 Consists of interest income from cash and balances at central banks, loans and advances to banks and customers, and cash collateral receivables on derivative
instruments, as well as negative interest on amounts due to banks, customer deposits, and cash collateral payables on derivative instruments. 3 Includes interest income on receivables from securities financing
transactions and negative interest, including fees, on payables from securities financing transactions. 4 Consists of interest expense on amounts due to banks, cash collateral payables on derivative instruments,
customer deposits, and funding from UBS Group AG, as well as negative interest on cash and balances at central banks, loans and advances to banks, and cash collateral receivables on derivative instruments. 5
Includes interest expense on payables from securities financing transactions and negative interest, including fees, on receivables from securities financing transactions.
443
Note 4 Net fee and commission income
For the year ended
USD million
31.12.21
31.12.20
31.12.19
Fee and commission income
Underwriting fees
1,512
1,104
784
M&A and corporate finance fees
1,102
736
774
Brokerage fees
4,383
4,132
3,248
Investment fund fees
5,790
5,289
4,859
Portfolio management and related services
9,762
8,009
7,656
Other
1,874
1,712
1,836
Total fee and commission income
1
24,422
20,982
19,156
of which: recurring
15,410
13,010
12,545
of which: transaction-based
8,743
7,512
6,449
of which: performance-based
269
461
163
Fee and commission expense
Brokerage fees paid
259
274
310
Distribution fees paid
611
589
590
Other
1,115
911
796
Total fee and commission expense
1,985
1,775
1,696
Net fee and commission income
22,438
19,207
17,460
of which: net brokerage fees
4,124
3,858
2,938
1 For the year ended 31 December 2021, reflects third-party fee and commission income of USD
14,545
1,645
3,337
million for Asset Management, USD
4,863
33
12,475
1,427
3,129
3,901
50
USD
11,694
1,307
2,659
3,397
98
for Group Functions).
Note 5 Other income
For the year ended
USD million
31.12.21
31.12.20
31.12.19
Associates, joint ventures and subsidiaries
Net gains / (losses) from acquisitions and disposals of subsidiaries
1
(11)
635
2
(36)
Net gains / (losses) from disposals of investments in associates
41
0
4
Share of net profits of associates and joint ventures
105
84
46
Impairments related to associates
0
0
(1)
Total
134
719
13
Net gains / (losses) from disposals of financial assets measured at fair value through other comprehensive income
9
40
31
Income from properties
3
22
25
27
Net gains / (losses) from properties held for sale
100
4
76
5
(19)
Income from shared services provided to UBS Group AG or its subsidiaries
451
422
464
Other
224
6
267
7
161
Total other income
941
1,549
677
1 Includes foreign exchange gains / (losses) reclassified from other comprehensive income related to the disposal or closure of foreign operations. 2 Includes a USD
631
stake in Fondcenter AG (now Clearstream Fund Centre AG). 3 Includes rent received from third parties. 4 Mainly relates to the sale of a property in Basel. 5 Includes net gains of USD
140
sale-and-leaseback transactions, primarily related to a property in Geneva, partly offset by remeasurement losses relating to properties that were reclassified as held for sale. 6 Includes a gain of USD
100
from the sale of UBS AG's domestic wealth management business in Austria. Refer to Note 30 for more information. 7 Includes a USD
215
Bloomberg Commodity Index family.
Consolidated financial statements | UBS AG consolidated financial statements
444
Note 6 Personnel expenses
For the year ended
USD million
31.12.21
31.12.20
31.12.19
Salaries
1
5,723
5,535
5,183
Variable compensation – performance awards
2
2,916
2,953
3
2,545
Variable compensation – other
2
196
201
225
Financial advisor compensation
2,4
4,860
4,091
4,043
Contractors
142
138
147
Social security
762
704
3
627
Post-employment benefit plans
5
582
6
597
569
of which: defined benefit plans
280
306
of which: defined contribution plans
303
291
278
Other personnel expenses
479
466
3
461
Total personnel expenses
15,661
14,686
13,801
1 Includes role-based allowances. 2 Refer to Note 28 for more information. 3 During 2020, UBS AG modified the conditions for continued vesting of certain outstanding deferred compensation awards for qualifying
employees, resulting in an expense of approximately USD
270
240
20
10
million within Other personnel expenses. 4 Financial advisor compensation consists of grid-based compensation based directly on compensable revenues generated by financial advisors and supplemental
compensation calculated on the basis of financial advisor productivity, firm tenure, assets and other variables. It also includes expenses related to compensation commitments with financial advisors entered into at
the time of recruitment that are subject to vesting requirements. 5 Refer to Note 27 for more information. 6 Includes curtailment gains of USD
49
obligation related to the Swiss pension plan resulting from a decrease in headcount following restructuring activities.
Note 7 General and administrative expenses
1
For the year ended
USD million
31.12.21
31.12.20
31.12.19
Outsourcing costs
426
466
551
IT expenses
490
449
448
Consulting, legal and audit fees
465
566
753
Real estate and logistics costs
530
563
559
Market data services
367
361
364
Marketing and communication
171
162
191
Travel and entertainment
66
77
272
Litigation, regulatory and similar matters
2
910
197
165
Other
6,051
5,646
5,283
of which: shared services costs charged by UBS Group AG or its subsidiaries
5,321
4,939
4,621
of which: UK and German bank levies
3
58
55
41
Total general and administrative expenses
9,476
8,486
8,586
1 In 2021, UBS AG changed the presentation of the line items within general and administrative expenses. Prior-period information reflects the new presentation structure, with no effect on Total general and
administrative expenses. 2 Reflects the net increase in provisions for litigation, regulatory and similar matters recognized in the income statement. Refer to Note 18 for more information. Also, includes recoveries
from third parties of USD
1
3
11
22
38
30
included a credit of USD
16
27
31
445
Note 8 Income taxes
For the year ended
USD million
31.12.21
31.12.20
31.12.19
Tax expense / (benefit)
Swiss
Current
614
417
336
Deferred
26
107
246
Total Swiss
640
524
582
Non-Swiss
Current
857
715
402
Deferred
406
248
214
Total non-Swiss
1,263
963
616
Total income tax expense / (benefit) recognized in the income statement
1,903
1,488
1,198
Income tax recognized in the income statement
Income tax expenses of USD
1,903
UBS AG in 2021, representing an effective tax rate of
21.2
%.
These included Swiss tax expenses of USD
640
Swiss tax expenses of USD
1,263
The Swiss tax expenses included current tax expenses of
USD
614
and other Swiss entities. They also included deferred tax expenses
of USD
26
million, which reflect
movements in temporary
differences.
The non-Swiss tax expenses included current tax expenses of
USD
857
subsidiaries and branches
,
and
net
deferred t
ax expenses of
USD
406
740
related to the amortization of deferred tax assets (DTAs) previously
recognized in relation to tax losses carried forward and deductible
temporary differences of UBS Americas Inc., were partly offset by
a benefit of USD
334
DTAs. This benefit included upward
revaluation
s
of DTAs of
USD
152
our business planning process. It also included USD
113
respect of additional DTA recognition that primarily related to the
contribution of real estate assets by UBS AG to UBS Americas Inc.
and UBS Financial Services Inc., which allowed the full recognition
of DTAs in respect of the associated historic real estate costs that
were previously capitalized for US tax purposes under elections
that were made in the fourth quarter of 2018. In addition, it
included USD
69
value of future tax deductions for deferred compensation awards,
due to an increase in the Group’s share price during the year.
The pre-tax expense that was recognized in the year in respect
of the increase in litigation provisions for the French cross-border
matter did not result in any tax benefit.
For the year ended
USD million
31.12.21
31.12.20
31.12.19
Operating profit / (loss) before tax
of which: Swiss
2,983
3,042
2,297
of which: non-Swiss
5,981
4,657
2,872
Income taxes at Swiss tax rate of
18.5
% for 2021,
19.5
% for 2020 and
20.5
% for 2019
1,658
1,501
1,060
Increase / (decrease) resulting from:
Non-Swiss tax rates differing from Swiss tax rate
217
96
72
Tax effects of losses not recognized
124
144
131
Previously unrecognized tax losses now utilized
(179)
(212)
(265)
Non-taxable and lower-taxed income
(252)
(381)
(305)
Non-deductible expenses and additional taxable income
487
373
713
Adjustments related to prior years – current tax
(38)
(66)
1
Adjustments related to prior years – deferred tax
(3)
18
(6)
Change in deferred tax recognition
(341)
(383)
(293)
Adjustments to deferred tax balances arising from changes in tax rates
(1)
235
(9)
Other items
230
163
99
Income tax expense / (benefit)
1,903
1,488
1,198
Consolidated financial statements | UBS AG consolidated financial statements
446
Note 8 Income taxes (continued)
The components of operating profit before tax, and the differences between income tax expense reflected in the financial statements
and the amounts calculated at the Swiss tax rate, are provided in the table on the previous page and explained below.
Component
Description
Non-Swiss tax rates
differing from Swiss tax
rate
To the extent that UBS AG profits or losses arise outside Switzerland, the applicable local tax rate may differ from the Swiss
tax rate. This item reflects, for such profits, an adjustment from the tax expense that would arise at the Swiss tax rate to the
tax expense that would arise at the applicable local tax rate. Similarly, it reflects, for such losses, an adjustment from the tax
benefit that would arise at the Swiss tax rate to the tax benefit that would arise at the applicable local tax rate.
Tax effects of losses not
recognized
This item relates to tax losses of entities arising in the year that are not recognized as DTAs and where no tax benefit arises in
relation to those losses. Therefore, the tax benefit calculated by applying the local tax rate to those losses as described above
is reversed.
Previously unrecognized
tax losses now utilized
This item relates to taxable profits of the year that are offset by tax losses of previous years for which no DTAs were previously
recorded. Consequently, no current tax or deferred tax expense arises in relation to those taxable profits and the tax expense
calculated by applying the local tax rate on those profits is reversed.
Non-taxable and lower-
taxed income
This item relates to tax deductions for the year in respect of permanent differences. These include deductions in respect of
profits that are either not taxable or are taxable at a lower rate of tax than the local tax rate. They also include deductions
made for tax purposes, which are not reflected in the accounts.
Non-deductible expenses
and additional taxable
income
This item relates to additional taxable income for the year in respect of permanent differences. These include income that is
recognized for tax purposes by an entity but is not included in its profit that is reported in the financial statements, as well as
expenses for the year that are non-deductible (e.g., client entertainment costs are not deductible in certain locations).
Adjustments related to
prior years – current tax
This item relates to adjustments to current tax expense for prior years (e.g., if the tax payable for a year is agreed with the tax
authorities in an amount that differs from the amount previously reflected in the financial statements).
Adjustments related to
prior years – deferred tax
This item relates to adjustments to deferred tax positions recognized in prior years (e.g., if a tax loss for a year is fully
recognized and the amount of the tax loss agreed with the tax authorities is expected to differ from the amount previously
recognized as DTAs in the accounts).
Change in deferred tax
recognition
This item relates to changes in DTAs, including changes in DTAs previously recognized resulting from reassessments of
expected future taxable profits. It also includes changes in temporary differences in the year, for which deferred tax is not
recognized.
Adjustments to deferred
tax balances arising from
changes in tax rates
This item relates to remeasurements of DTAs and liabilities recognized due to changes in tax rates. These have the effect of
changing the future tax saving that is expected from tax losses or deductible tax differences and therefore the amount of
DTAs recognized or, alternatively, changing the tax cost of additional taxable income from taxable temporary differences and
therefore the deferred tax liability.
Other items
Other items include other differences between profits or losses at the local tax rate and the actual local tax expense or
benefit, including movements in provisions for uncertain positions in relation to the current year and other items.
Income tax recognized directly in equity
A net tax benefit of USD
455
Other comprehensive income
258
net tax expense of USD
102
Share premium
(2020: net benefit of USD
1
447
Note 8 Income taxes (continued)
Deferred tax assets and liabilities
UBS AG has gross DTAs, valuation allowances and recognized
DTAs related to tax loss carry-forwards and deductible temporary
differences, and also deferred tax liabilities in respect of taxable
temporary differences, as shown in the table below. The valuation
allowances reflect DTAs that were not recognized because, as of
the last remeasurement period, management did not consider it
probable that there would be sufficient future taxable profits
available
to utilize the related tax loss carry
-
forwards and
deductible temporary differences.
The recognition of DTAs is supported by forecasts of taxable
profits for the entities concerned. In addition, tax planning
opportunities are available that would result in additional future
taxable income and these would be utilized, if necessary.
Deferred tax liabilities are recognized in respect of investments
in subsidiaries, branches and associates, and interests in joint
arrangements, except to the extent that UBS AG can control the
timing of the reversal of the associated taxable temporary
difference and it is probable that such will not reverse in the
foreseeable future. However, as of 31
December 202
1
,
this
exception was not considered to apply to any taxable temporary
differences.
USD million
31.12.21
31.12.20
Deferred tax assets
1
Gross
Valuation
allowance
Recognized
Gross
Valuation
allowance
Recognized
Tax loss carry-forwards
13,636
(9,193)
4,443
14,108
(8,715)
5,393
Temporary differences
5,092
(696)
4,396
4,343
(561)
3,782
of which: related to real estate costs capitalized for US tax
purposes
2,272
0
2,272
2,268
0
2,268
of which: related to compensation and benefits
1,200
(209)
991
1,112
(173)
939
of which: other
1,620
(487)
1,133
963
(388)
574
Total deferred tax assets
18,728
(9,889)
8,839
2
18,450
(9,276)
9,174
2
of which: related to the US
8,521
8,780
of which: related to other locations
318
394
Deferred tax liabilities
Cash flow hedges
118
425
Other
179
133
Total deferred tax liabilities
297
558
1 After offset of DTLs, as applicable. 2 As of 31 December 2021, UBS AG recognized DTAs of USD
77
138
preceding year.
In general, US federal tax losses incurred prior to 31 December
2017 can be carried forward for 20 years. However, US federal tax
losses incurred after 31 December 2017 and UK tax losses can be
carried forward indefinitely, although the utilization of such losses
is limited to 80% of the entity’s future year taxable profits for the
US and generally to 25% thereof for the UK. The amounts of US
tax loss carry-forwards that are included in the table below are
based on their amount for federal tax purposes rather than for
state and local tax purposes.
Unrecognized tax loss carry-forwards
USD million
31.12.21
31.12.20
Within 1 year
141
146
From 2 to 5 years
1,026
638
From 6 to 10 years
13,283
13,257
From 11 to 20 years
2,093
3,858
No expiry
18,147
17,227
Total
34,690
35,127
of which: related to the US
1
14,870
16,256
of which: related to the UK
14,909
13,848
of which: related to other locations
4,911
5,023
1 Related to UBS AG's US branch.
Consolidated financial statements | UBS AG consolidated financial statements
448
Balance sheet notes
Note 9 Financial assets at amortized cost and other positions in scope of expected credit loss measurement
The tables on the following pages provide information about
financial instruments and certain credit lines that are subject to
expected credit loss (ECL) requirements . UBS AG’s ECL disclosure
segments or “ECL segments” are aggregated portfolios based on
shared risk characteristics and on the same or similar rating
methods applied. The key segments are presented in the table
below.
›
Refer to Note 20 for more information about expected credit
loss measurement
Segment
Segment description
Description of credit risk sensitivity
Business division / Group Functions
Private clients with
mortgages
Lending to private clients secured by
owner-occupied real estate and
personal account overdrafts of those
clients
Sensitive to the interest rate environment,
unemployment levels, real estate collateral
values and other regional aspects
–
Personal & Corporate Banking
–
Global Wealth Management
Real estate financing
Rental or income-producing real estate
financing to private and corporate
clients secured by real estate
Sensitive to unemployment levels, the
interest rate environment, real estate
collateral values and other regional
aspects
–
Personal & Corporate Banking
–
Global Wealth Management
–
Investment Bank
Large corporate clients
Lending to large corporate and multi-
national clients
Sensitive to GDP developments,
unemployment levels, seasonality,
business cycles and collateral values
(diverse collateral, including real estate
and other collateral types)
–
Personal & Corporate Banking
–
Investment Bank
SME clients
Lending to small and medium-sized
corporate clients
Sensitive to GDP developments,
unemployment levels, the interest rate
environment and, to some extent,
seasonality, business cycles and collateral
values (diverse collateral, including real
estate and other collateral types)
–
Personal & Corporate Banking
Lombard
Loans secured by pledges of marketable
securities, guarantees and other forms
of collateral
Sensitive to equity and debt markets (e.g.,
changes in collateral values)
–
Global Wealth Management
Credit cards
Credit card solutions in Switzerland and
the US
Sensitive to unemployment levels
–
Personal & Corporate Banking
–
Global Wealth Management
Commodity trade
finance
Working capital financing of commodity
traders, generally extended on a self-
liquidating transactional basis
Sensitive primarily to the strength of
individual transaction structures and
collateral values (price volatility of
commodities), as the primary source for
debt service is directly linked to the
shipments financed
–
Personal & Corporate Banking
Financial intermediaries
and hedge funds
Lending to financial institutions and
pension funds, including exposures to
broker-dealers and clearing houses
Sensitive to GDP development, the
interest rate environment, price and
volatility risks in financial markets, and
regulatory and political risk
–
Personal & Corporate Banking
–
Investment Bank
›
Refer to Note 20f for more details regarding sensitivity
449
Note 9 Financial assets at amortized cost and other positions in scope of expected credit loss measurement (continued)
The tables below and on the following pages provide ECL exposure and ECL allowance and provision information about financial
instruments and certain non-financial instruments that are subject to ECL.
USD million
31.12.21
Carrying amount
1
ECL allowances
Financial instruments measured at amortized cost
Total
Stage 1
Stage 2
Stage 3
Total
Stage 1
Stage 2
Stage 3
Cash and balances at central banks
192,817
192,817
0
0
0
0
0
0
Loans and advances to banks
15,360
15,333
26
1
(8)
(7)
(1)
0
Receivables from securities financing transactions
75,012
75,012
0
0
(2)
(2)
0
0
Cash collateral receivables on derivative instruments
30,514
30,514
0
0
0
0
0
0
Loans and advances to customers
398,693
381,496
15,620
1,577
(850)
(126)
(152)
(572)
of which: Private clients with mortgages
152,479
143,505
8,262
711
(132)
(28)
(71)
(33)
of which: Real estate financing
43,945
40,463
3,472
9
(60)
(19)
(40)
0
of which: Large corporate clients
13,990
12,643
1,037
310
(170)
(22)
(16)
(133)
of which: SME clients
14,004
12,076
1,492
436
(259)
(19)
(15)
(225)
of which: Lombard
149,283
149,255
0
27
(33)
(6)
0
(28)
of which: Credit cards
1,716
1,345
342
29
(36)
(10)
(9)
(17)
of which: Commodity trade finance
3,813
3,799
7
7
(114)
(6)
0
(108)
Other financial assets measured at amortized cost
26,236
25,746
302
189
(109)
(27)
(7)
(76)
of which: Loans to financial advisors
2,453
2,184
106
163
(86)
(19)
(3)
(63)
Total financial assets measured at amortized cost
738,632
720,917
15,948
1,767
(969)
(161)
(160)
(647)
Financial assets measured at fair value through other comprehensive income
8,844
8,844
0
0
0
0
0
0
Total on-balance sheet financial assets in scope of ECL requirements
747,477
729,762
15,948
1,767
(969)
(161)
(160)
(647)
Total exposure
ECL provisions
Off-balance sheet (in scope of ECL)
Total
Stage 1
Stage 2
Stage 3
Total
Stage 1
Stage 2
Stage 3
Guarantees
20,972
19,695
1,127
150
(41)
(18)
(8)
(15)
of which: Large corporate clients
3,464
2,567
793
104
(6)
(3)
(3)
0
of which: SME clients
1,353
1,143
164
46
(8)
(1)
(1)
(7)
of which: Financial intermediaries and hedge funds
9,575
9,491
84
0
(17)
(13)
(4)
0
of which: Lombard
2,454
2,454
0
0
(1)
0
0
(1)
of which: Commodity trade finance
3,137
3,137
0
0
(1)
(1)
0
0
Irrevocable loan commitments
39,478
37,097
2,335
46
(114)
(72)
(42)
0
of which: Large corporate clients
23,922
21,811
2,102
9
(100)
(66)
(34)
0
Forward starting reverse repurchase and securities borrowing agreements
1,444
1,444
0
0
0
0
0
0
Committed unconditionally revocable credit lines
42,373
39,802
2,508
63
(38)
(28)
(10)
0
of which: Real estate financing
7,328
7,046
281
0
(5)
(4)
(1)
0
of which: Large corporate clients
5,358
4,599
736
23
(7)
(4)
(3)
0
of which: SME clients
5,160
4,736
389
35
(15)
(11)
(3)
0
of which: Lombard
8,670
8,670
0
0
0
0
0
0
of which: Credit cards
9,466
9,000
462
4
(6)
(5)
(2)
0
of which: Commodity trade finance
117
117
0
0
0
0
0
0
Irrevocable committed prolongation of existing loans
5,611
5,527
36
48
(3)
(3)
0
0
Total off-balance sheet financial instruments and credit lines
109,878
103,565
6,006
307
(196)
(121)
(60)
(15)
Total allowances and provisions
(1,165)
(282)
(220)
(662)
1 The carrying amount of financial assets measured at amortized cost represents the total gross exposure net of the respective ECL allowances.
Consolidated financial statements | UBS AG consolidated financial statements
450
Note 9 Financial assets at amortized cost and other positions in scope of expected credit loss measurement (continued)
USD million
31.12.20
Carrying amount
1
ECL allowances
Financial instruments measured at amortized cost
Total
Stage 1
Stage 2
Stage 3
Total
Stage 1
Stage 2
Stage 3
Cash and balances at central banks
158,231
158,231
0
0
0
0
0
0
Loans and advances to banks
15,344
15,160
184
0
(16)
(9)
(5)
(1)
Receivables from securities financing transactions
74,210
74,210
0
0
(2)
(2)
0
0
Cash collateral receivables on derivative instruments
32,737
32,737
0
0
0
0
0
0
Loans and advances to customers
380,977
358,396
20,341
2,240
(1,060)
(142)
(215)
(703)
of which: Private clients with mortgages
148,175
138,769
8,448
959
(166)
(35)
(93)
(39)
of which: Real estate financing
43,429
37,568
5,838
23
(63)
(15)
(44)
(4)
of which: Large corporate clients
15,161
12,658
2,029
474
(279)
(27)
(40)
(212)
of which: SME clients
14,872
11,990
2,254
628
(310)
(19)
(23)
(268)
of which: Lombard
133,850
133,795
0
55
(36)
(5)
0
(31)
of which: Credit cards
1,558
1,198
330
30
(38)
(11)
(11)
(16)
of which: Commodity trade finance
3,269
3,214
43
12
(106)
(5)
0
(101)
Other financial assets measured at amortized cost
27,219
26,401
348
469
(133)
(34)
(9)
(90)
of which: Loans to financial advisors
2,569
1,982
137
450
(108)
(27)
(5)
(76)
Total financial assets measured at amortized cost
688,717
665,135
20,873
2,709
(1,211)
(187)
(229)
(795)
Financial assets measured at fair value through other comprehensive income
8,258
8,258
0
0
0
0
0
0
Total on-balance sheet financial assets in scope of ECL requirements
696,976
673,394
20,873
2,709
(1,211)
(187)
(229)
(795)
Total exposure
ECL provisions
Off-balance sheet (in scope of ECL)
Total
Stage 1
Stage 2
Stage 3
Total
Stage 1
Stage 2
Stage 3
Guarantees
17,081
14,687
2,225
170
(63)
(14)
(15)
(34)
of which: Large corporate clients
3,710
2,048
1,549
113
(20)
(4)
(5)
(12)
of which: SME clients
1,310
936
326
48
(13)
(1)
(1)
(11)
of which: Financial intermediaries and hedge funds
7,637
7,413
224
0
(17)
(7)
(9)
0
of which: Lombard
641
633
0
8
(2)
0
0
(2)
of which: Commodity trade finance
1,441
1,416
25
0
(2)
(1)
0
0
Irrevocable loan commitments
41,372
36,894
4,374
104
(142)
(74)
(68)
0
of which: Large corporate clients
24,209
20,195
3,950
64
(121)
(63)
(58)
0
Forward starting reverse repurchase and securities borrowing agreements
3,247
3,247
0
0
0
0
0
0
Committed unconditionally revocable credit lines
42,077
37,176
4,792
108
(50)
(29)
(21)
0
of which: Real estate financing
6,328
5,811
517
0
(12)
(5)
(7)
0
of which: Large corporate clients
4,909
2,783
2,099
27
(9)
(2)
(7)
0
of which: SME clients
5,827
4,596
1,169
63
(16)
(12)
(4)
0
of which: Lombard
9,671
9,671
0
0
0
(1)
0
0
of which: Credit cards
8,661
8,220
430
11
(8)
(6)
(2)
0
of which: Commodity trade finance
242
242
0
0
0
0
0
0
Irrevocable committed prolongation of existing loans
3,282
3,277
5
0
(2)
(2)
0
0
Total off-balance sheet financial instruments and credit lines
107,059
95,281
11,396
382
(257)
(119)
(104)
(34)
Total allowances and provisions
(1,468)
(306)
(333)
(829)
1 The carrying amount of financial assets measured at amortized cost represents the total gross exposure net of the respective ECL allowances.
451
Note 9 Financial assets at amortized cost and other positions in scope of expected credit loss measurement (continued)
Coverage ratios are calculated for the core loan portfolio by
taking ECL allowances and provisions divided by the gross carrying
amount of the exposures. Core loan exposure is defined as the
sum of
Loans and advances to customers
Loans to financial
advisors
.
These ratios are influenced by the following key factors:
–
Lombard loans are generally secured with marketable securities
in portfolios that are, as a rule, highly diversified, with strict
lending policies that are intended to ensure that credit risk is
minimal under most circumstances;
–
mortgage loans to private clients and real estate financing are
controlled by conservative eligibility criteria, including low loan-
to-value ratios and strong debt service capabilities;
–
the amount of unsecured retail lending (including credit cards)
is insignificant;
–
lending in Switzerland includes government backed COVID-19
loans;
–
contractual maturities in the loan portfolio, which are a factor
in the calculation of ECLs, are generally short, with Lombard
lending typically having average contractual maturities of 12
months or less, real estate lending generally between 2 years
and 3 years in Switzerland with longer dated maturities in the
US and corporate lending between 1 to 2 years with related
loan commitments up to 4 years; and
–
write-offs of ECL allowances against the gross loan balances
when all or part of a financial asset is deemed uncollectible or
forgiven, reduces the coverage ratios
.
Coverage ratios for core loan portfolio
31.12.21
Gross carrying amount (USD million)
ECL coverage (bps)
On-balance sheet
Total
Stage 1
Stage 2
Stage 3
Total
Stage 1
Stage 2
Stage 3
Private clients with mortgages
152,610
143,533
8,333
744
9
2
85
446
Real estate financing
44,004
40,483
3,512
10
14
5
114
231
Large corporate clients
14,161
12,665
1,053
443
120
18
148
2,997
SME clients
14,263
12,095
1,507
661
182
16
103
3,402
Lombard
149,316
149,261
0
55
2
0
0
5,026
Credit cards
1,752
1,355
351
46
204
72
255
3,735
Commodity trade finance
3,927
3,805
7
115
290
15
3
9,388
Other loans and advances to customers
19,510
18,425
1,010
75
23
9
15
3,730
Loans to financial advisors
2,539
2,203
109
226
338
88
303
2,791
Total
1
402,081
383,825
15,882
2,374
23
4
98
2,673
Gross exposure (USD million)
ECL coverage (bps)
Off-balance sheet
Total
Stage 1
Stage 2
Stage 3
Total
Stage 1
Stage 2
Stage 3
Private clients with mortgages
9,123
8,798
276
49
3
3
9
15
Real estate financing
8,766
8,481
285
0
9
7
88
0
Large corporate clients
32,748
28,981
3,630
136
34
25
110
1
SME clients
8,077
7,276
688
114
38
19
151
585
Lombard
14,438
14,438
0
0
1
0
0
0
Credit cards
9,466
9,000
462
4
7
5
34
0
Commodity trade finance
3,262
3,262
0
0
4
4
0
0
Financial intermediaries and hedge funds
13,747
13,379
369
0
13
10
120
0
8,806
8,507
296
4
15
6
30
0
Total
2
108,434
102,121
6,006
307
18
12
100
486
1 Includes Loans and advances to customers of USD
399,543
2,539
2 Excludes Forward starting reverse repurchase and securities borrowing agreements.
Consolidated financial statements | UBS AG consolidated financial statements
452
Note 9 Financial assets at amortized cost and other positions in scope of expected credit loss measurement (continued)
Coverage ratios for core loan portfolio
31.12.20
Gross carrying amount (USD million)
ECL coverage (bps)
On-balance sheet
Total
Stage 1
Stage 2
Stage 3
Total
Stage 1
Stage 2
Stage 3
Private clients with mortgages
148,341
138,803
8,540
998
11
2
108
390
Real estate financing
43,492
37,583
5,883
27
15
4
75
1,414
Large corporate clients
15,440
12,684
2,069
686
181
21
192
3,089
SME clients
15,183
12,010
2,277
896
204
16
101
2,991
Lombard
133,886
133,800
0
86
3
0
0
3,592
Credit cards
1,596
1,209
342
46
240
91
333
3,488
Commodity trade finance
3,375
3,219
43
113
315
16
2
8,939
Other loans and advances to customers
20,722
19,229
1,402
91
29
13
25
3,563
Loans to financial advisors
2,677
2,009
142
526
404
135
351
1,446
Total
1
384,714
360,547
20,697
3,470
30
5
106
2,247
Gross exposure (USD million)
ECL coverage (bps)
Off-balance sheet
Total
Stage 1
Stage 2
Stage 3
Total
Stage 1
Stage 2
Stage 3
Private clients with mortgages
6,285
6,083
198
3
7
6
16
197
Real estate financing
7,056
6,576
481
0
21
9
185
0
Large corporate clients
32,828
25,026
7,598
205
46
27
92
565
SME clients
9,121
7,239
1,734
148
40
19
63
779
Lombard
14,178
14,170
0
8
2
1
0
1,941
Credit cards
8,661
8,220
430
11
9
8
44
0
Commodity trade finance
1,683
1,658
25
0
10
8
15
8,279
Financial intermediaries and hedge funds
7,690
7,270
448
0
26
13
248
166
16,309
15,792
482
8
12
6
11
12,414
Total
2
103,812
92,034
11,396
382
25
13
91
894
1 Includes Loans and advances to customers of USD
382,036
2,677
2 Excludes Forward starting reverse repurchase and securities borrowing agreements.
453
Note 10 Derivative instruments
Overview
Over-the-counter (OTC) derivative contracts are usually traded
under
a standardized International Swaps and Derivatives
Association (ISDA) master agreement between UBS AG and its
counterparties. Terms are negotiated directly with counterparties
and the contracts have industry-standard settlement mechanisms
prescribed by ISDA. Other OTC derivatives are cleared through
clearing houses, in particular interest rate swaps with LCH, where
a settled-to-market method has been generally adopted, under
which cash collateral exchanged on a daily basis is considered to
legally settle the market value of the derivatives. Regulators in
various jurisdictions have begun a phased introduction of rules
requiring the payment and collection of initial and variation
margins on certain OTC derivative contracts, which may have a
bearing on price and other relevant terms. Due to challenges
brought on by COVID
-
19
,
the International Organization of
Securities Commissions (IOSCO) has extended the deadline for
completion of the final phase-in of margin requirements for non-
centrally cleared derivatives, to 1 September 2022.
Other derivative contracts are standardized in terms of their
amounts and settlement dates, and are bought and sold on
regulated exchanges. These are commonly referred to as
exchange-traded derivatives (ETD) contracts. Exchanges offer the
benefits of pricing transparency, standardized daily settlement of
changes in value and, consequently, reduced credit risk.
Most of UBS AG’s derivative transactions relate to sales and
market-making activity. Sales activities include the structuring and
marketing of derivative products to customers to enable them to
take, transfer, modify or reduce current or expected risks. Market-
making aims to directly support the facilitation and execution of
client activity, and involves quoting bid and offer prices to other
market participants with the aim of generating revenues based on
spread and volume.
UBS AG
also uses various derivative
instruments for hedging purposes.
›
Refer to Notes 16 and 21 for more information about derivative
instruments
›
Refer to Note 26 for more information about derivatives
designated in hedge accounting relationships
Risks of derivative instruments
The derivative financial assets shown on the balance sheet can be
an important component of UBS AG ’s credit exposure; however,
the positive replacement values related to a respective
counterparty are rarely an adequate reflection of UBS AG’s credit
exposure in its derivatives business with that counterparty. This is
generally the case because, on the one hand, replacement values
can increase over time (potential future exposure), while, on the
other hand, exposure may be mitigated by entering into master
netting agreements and bilateral collateral arrangements. Both
the exposure measures used internally by UBS AG to control credit
risk and the capital requirements imposed by regulators reflect
these additional factors.
›
Refer to Note 22 for more information about derivative financial
assets and liabilities after consideration of netting potential
allowed under enforceable netting arrangements
›
Refer to the “Risk management and control” section of this
report for more information about the risks arising from
derivative instruments
Consolidated financial statements | UBS AG consolidated financial statements
454
Note 10 Derivative instruments (continued)
Derivative instruments
31.12.21
31.12.20
USD billion
Derivative
financial
assets
Notional
amounts
related to
derivative
financial
assets
2,3
Derivative
financial
liabilities
Notional
amounts
related to
derivative
financial
liabilities
2,3
Other
notional
amounts
2,4
Derivative
financial
assets
Notional
amounts
related to
derivative
financial
assets
2,3
Derivative
financial
liabilities
Notional
amounts
related to
derivative
financial
liabilities
2,3
Other
notional
amounts
2,4
Interest rate contracts
33.2
991.2
28.7
943.1
8,675.1
50.9
928.0
43.9
880.4
11,291.5
of which: forward contracts (OTC)
1
0.1
29.4
0.2
28.6
443.6
0.0
19.8
0.4
21.9
2,602.5
of which: swaps (OTC)
26.4
394.3
19.2
344.1
7,549.4
40.8
407.0
30.9
364.8
8,105.2
of which: options (OTC)
6.6
545.2
9.2
553.6
10.1
447.5
12.5
460.5
of which: futures (ETD)
525.0
480.6
of which: options (ETD)
0.0
22.4
0.0
16.8
157.1
0.0
53.6
0.0
33.1
103.3
Credit derivative contracts
1.4
44.7
1.8
46.3
2.4
57.6
2.9
64.8
of which: credit default swaps (OTC)
1.3
39.4
1.6
44.1
2.2
53.6
2.6
62.3
of which: total return swaps (OTC)
0.1
1.3
0.2
1.7
0.1
1.9
0.3
2.5
Foreign exchange contracts
53.3
3,031.0
54.1
2,938.8
1.2
68.7
2,951.2
70.5
2,820.4
1.4
of which: forward contracts (OTC)
23.8
1,009.1
23.8
1,043.2
27.3
779.2
29.0
853.3
of which: swaps (OTC)
24.3
1,606.4
24.9
1,480.3
34.3
1,727.3
34.4
1,567.3
of which: options (OTC)
5.2
412.6
5.3
408.6
7.1
440.9
7.1
394.7
Equity contracts
28.2
456.9
34.9
603.9
80.1
34.8
449.6
41.2
581.3
91.3
of which: swaps (OTC)
4.7
105.7
9.3
154.8
6.4
89.4
9.8
108.4
of which: options (OTC)
4.6
61.4
6.5
102.3
7.0
87.1
10.9
146.2
of which: futures (ETD)
71.2
67.9
of which: options (ETD)
10.2
289.6
9.8
346.3
8.8
10.7
273.1
11.3
326.8
23.5
of which: client-cleared transactions (ETD)
8.6
9.4
10.7
9.1
Commodity contracts
1.6
57.8
1.6
56.4
14.7
2.2
57.8
2.0
49.7
10.1
of which: swaps (OTC)
0.5
19.9
0.8
25.4
0.5
17.7
0.8
18.0
of which: options (OTC)
0.4
14.0
0.2
10.4
1.0
23.5
0.7
17.8
of which: futures (ETD)
13.9
9.3
of which: forward contracts (ETD)
0.0
18.1
0.0
15.2
0.0
8.0
0.0
6.3
of which: client-cleared transactions (ETD)
0.6
0.4
0.5
0.3
Loan commitments
measured at FVTPL (OTC)
0.8
0.0
8.2
0.0
10.2
Unsettled purchases of non-derivative
financial instruments
5
0.1
13.3
0.2
10.6
0.3
18.3
0.2
10.0
Unsettled sales of non-derivative financial
instruments
5
0.2
18.2
0.1
9.4
0.2
17.2
0.3
12.9
Total derivative instruments,
based on IFRS netting
6
118.1
4,614.0
121.3
4,616.6
8,771.1
159.6
4,479.6
161.1
4,429.7
11,394.4
1 Includes certain forward starting repurchase and reverse repurchase agreements that are classified as measured at fair value through profit or loss and are recognized within derivative instruments. 2 In cases where
derivative financial instruments are presented on a net basis on the bal ance sheet, the respective notional amounts of the netted derivative financial instruments are still presented on a gross basis. 3 Notional
amounts of client-cleared ETD and OTC transactions through central clearing counterparties are not disclosed, as they have significantly different risk profile. 4 Other notional amounts relate to derivatives that are
cleared through either a central counterparty or an exchange. The fair value of these derivatives is presented on the balance sheet net of the corresponding cash margin under Cash collateral receivables on derivative
instruments and Cash collateral payables on derivative instruments and was not material for all periods presented. 5 Changes in the fair value of purchased and sold non-derivative financial instruments between
trade date and settlement date are recognized as derivative financial instruments. 6 Derivative financial assets and liabilities are presented net on the balance sheet if UBS AG has the unconditional and legally
enforceable right to offset the recognized amounts, both in the normal course of business and in the event of default, bankruptcy or insolvency of the entity and all of the counterparties, and intends either to settle on
a net basis or to realize the asset and settle the liability simultaneously. Refer to Note 22 for more information on netting arrangements.
On a notional amount basis, approximately
40
% of OTC interest
rate contracts held as of 31 December 2021 (31 December 2020:
50
%) mature within one year,
36
% (31 December 2020:
30
%)
within one to five years and
25
% (31 December 2020:
20
%) after
five years.
Notional amounts of interest rate contracts cleared through
either a central counterparty or an exchange that are legally
settled on a daily basis are presented under
Other notional
amounts
above and are categorized into maturity
buckets on the basis of contractual maturities of the cleared
underlying derivative contracts. Other notional amounts related
to interest rate contracts decreased by USD
2.6
with 31 December 2020, mainly reflecting trade compressions,
which included activity as part of the ongoing transition to
alternative reference rates, and maturities.
455
Note 11 Financial assets measured at fair value through other comprehensive income
USD million
31.12.21
31.12.20
Financial assets measured at fair value through other comprehensive income
1
Debt instruments
Governments and government agencies
8,522
8,155
of which: USA
7,507
7,727
Banks
322
103
Total financial assets measured at fair value through other comprehensive income
8,844
8,258
Unrealized gains / (losses) recognized in Other comprehensive income
Unrealized gains, before tax
67
204
Unrealized (losses), before tax
(80)
(4)
Net unrealized gains / (losses), before tax
(13)
200
Net unrealized gains / (losses), after tax
(7)
151
1 Refer to Note 21c for more information about product type and fair value hierarchy categorization. Refer also to Note 9 and Note 20 for more information about expected credit loss measurement.
Note 12 Property, equipment and software
At historical cost less accumulated depreciation
USD million
Owned
properties and
equipment
1
Leased
properties and
equipment
2
Software
Projects in
progress
2021
2020
Historical cost
Balance at the beginning of the year
11,676
4,091
7,111
907
23,785
22,329
Additions
162
1
174
233
1,220
1,789
1,989
Disposals / write-offs
3
(345)
(212)
(75)
0
(632)
(867)
Reclassifications
4
267
0
703
(988)
(18)
(590)
Foreign currency translation
(266)
(59)
(48)
(9)
(381)
924
Balance at the end of the year
11,494
3,994
7,924
1,130
24,542
23,785
Accumulated depreciation
Balance at the beginning of the year
7,188
1,019
3,621
0
11,827
10,503
Depreciation
507
474
854
0
1,835
1,779
Impairment
5
8
1
0
0
9
72
Disposals / write-offs
3
(341)
(204)
(75)
0
(619)
(735)
Reclassifications
4
(12)
0
0
0
(12)
(328)
Foreign currency translation
(172)
(18)
(19)
0
(210)
535
Balance at the end of the year
7,178
1,272
4,380
0
12,830
11,827
Net book value
Net book value at the beginning of the year
4,488
3,072
3,490
907
11,958
11,826
Net book value at the end of the year
4,316
2,722
3,544
1,130
6
11,712
11,958
1 Includes leasehold improvements and IT hardware. 2 Represents right-of-use assets recognized by UBS AG as lessee. UBS AG predominantly enters into lease contracts, or contracts that include lease components,
in relation to real estate, including offices, retail branches and sales offices. The total cash outflow for leases during 2021 was USD
632
652
within Interest expense from financial instruments measured at amortized cost and Lease liabilities are included within Other financial liabilities measured at amortized cost. Refer to Notes 3 and 19a, respectively.
There were no material gains or losses arising from sale-and-leaseback transactions in 2021 (2020: USD
140
respective periods represents net reclassifications to Properties and other non-current assets held for sale. 5 Impairment charges recorded in 2021 generally relate to assets that are no longer used, for which the
recoverable amount based on a value in use approach was determined to be zero. 6 Consists of USD
1,009
121
Consolidated financial statements | UBS AG consolidated financial statements
456
Note 13 Goodwill and intangible assets
Introduction
UBS AG performs an impairment test on its goodwill assets on an
annual basis or when indicators of impairment exist.
UBS AG considers Asset Management, as it is reported in Note
2a, as a separate cash-generating unit (a CGU), as that is the level
at which the performance of investment (and the related
goodwill) is reviewed and assessed by management. Given that a
significant amount of goodwill in Global Wealth Management
relates to the PaineWebber acquisition in 2000, which mainly
affected the Americas portion of the business, this goodwill
remains separately monitored by the Americas
,
despite the
formation of Global Wealth Management in 2018. Therefore,
goodwill for Global Wealth Management is separately considered
for impairment at the level of two CGUs: Americas; and
Switzerland and International (consisting of EMEA, Asia Pacific
and Global).
The impairment test is performed for each CGU to which
goodwill is allocated by comparing the recoverable amount, based
on its value in use, with the carrying amount of the respective
CGU. An impairment charge is recognized if the carrying amount
exceeds the recoverable amount.
As of 31 December 2021, total goodwill recognized on the
balance sheet was USD
6.1
3.7
carried by the Global Wealth Management Americas CGU,
USD
1.2
Switzerland and International
CGU
,
and USD
1.2
billion was
carried by Asset Management. Based on the impairment testing
methodology described below, UBS AG concluded that the
goodwill balances as of 31 December 2021 allocated to these
CGUs are not impaired.
Methodology for goodwill impairment testing
The recoverable amounts are determined using a discounted cash
flow model, which has been adapted to use inputs that consider
features of the banking business and its regulatory environment.
The recoverable amount of a CGU is the sum of the discounted
earnings attributable to shareholders from the first three forecast
years and the terminal value, adjusted for the effect of the capital
assumed to be needed over the next three years and to support
growth beyond that period. The terminal value, which covers all
periods beyond the third year, is calculated on the basis of the
forecast of third -year profit, the discount rate and the long-term
growth rate, as well as the implied perpetual capital growth.
The carrying amount for each CGU is determined by reference
to UBS’s equity attribution framework. Within this framework,
which is described in the “Capital, liquidity and funding, and
balance sheet” section of this report, UBS attributes equity to the
businesses on the basis of their risk-weighted assets and leverage
ratio denominator (both metrics include resource allocations from
Group Functions to the business divisions), their goodwill and
their intangible assets, as well as attributed equity related to
certain CET1 deduction items. The framework is primarily used for
the purpose of measuring the performance of the businesses and
includes certain management assumptions. Attributed equity is
equal to the capital a CGU requires to conduct its business and is
currently considered a reasonable approximation of the carrying
amount of the CGUs. The attributed equity methodology is also
applied in the business planning process, the inputs from which
are used in calculating the recoverable amounts of the respective
CGU.
›
Refer to the “Capital, liquidity and funding, and balance sheet”
section of this report for more information about the equity
attribution framework
Assumptions
Valuation parameters used within UBS AG’s impairment test
model are linked to external market information, where
applicable. The model used to determine the recoverable amount
is most sensitive to changes in the forecast earnings available to
shareholders in years one to three, to changes in the discount
rates and to changes in the long-term growth rate. The applied
long-term growth rate is based on long-term economic growth
rates for different regions worldwide. Earnings available to
shareholders are estimated on the basis of forecast results, which
are part of the business plan approved by the Board of Directors.
The discount rates are determined by applying a capital asset
pricing model-based approach, as well as considering quantitative
and qualitative inputs from both internal and external analysts
and the view of management.
T
hey
also
take into account
regional differences in risk-free rates at the level of the individual
CGUs. In line with discount rates, long-term growth rates are
determined at the regional level based on nominal or real GDP
growth rate forecasts.
457
Note 13 Goodwill and intangible assets (continued)
Key assumptions used to determine the recoverable amounts
of eac h CGU are tested for sensitivity by applying a reasonably
possible change to those assumptions. Forecast earnings
available to shareholders were changed by
20
%, the discount
rates were changed by
1.5
growth rates were changed by
0.75
scenarios, reasonably possible changes in key assumptions did
not result in an impairment of goodwill or intangible assets
reported by Global Wealth Management Americas, Global
Wealth Management Switzerland and International, and Asset
Management.
If the estimated earnings and other assumptions in future
periods deviate from the current outlook, the value of goodwill
attributable to Global Wealth Management Americas, Global
Wealth Management Switzerland and International, and Asset
Management may become impaired in the future, giving rise to
losses in the income statement. Recognition of any impairment of
goodwill would reduce IFRS equity and net profit. It would not
affect cash flows and, as goodwill is required to be deducted from
capital under the Basel III capital framework, no effect would be
expected on UBS AG’s capital ratios.
Discount and growth rates
Discount rates
Growth rates
In %
31.12.21
31.12.20
31.12.21
31.12.20
Global Wealth Management Americas
9.5
9.5
4.0
5.1
Global Wealth Management Switzerland and International
8.5
8.5
3.1
3.7
Asset Management
8.5
8.5
2.9
3.5
USD million
Goodwill
Intangible
assets
1
2021
2020
Historical cost
Balance at the beginning of the year
6,182
1,683
7,865
7,820
Additions
1
1
147
Disposals
(3)
(3)
(158)
Write-offs
(41)
(41)
(35)
Foreign currency translation
(53)
(30)
(83)
91
Balance at the end of the year
6,126
1,612
7,739
7,865
Accumulated amortization and impairment
Balance at the beginning of the year
1,385
1,385
1,351
Amortization
31
31
55
Impairment / (reversal of impairment)
2
(1)
(1)
2
Disposals
0
0
Write-offs
(41)
(41)
(35)
Foreign currency translation
(13)
(13)
11
Balance at the end of the year
1,360
1,360
1,385
Net book value at the end of the year
6,126
252
6,378
6,480
of which: Global Wealth Management Americas
3,720
41
3,760
3,770
of which: Global Wealth Management Switzerland and International
1,204
72
1,276
1,320
of which: Asset Management
1,202
1,202
1,226
of which: Investment Bank
139
139
161
of which: Group Functions
0
4
1 Intangible assets mainly include customer relationships, contractual rights and the fully amortized branch network intangible asset recognized in connection with the acquisition of PaineWebber Group, Inc.
2 Impairment charges recorded in 2020 relate to assets for which the recoverable amount was determined considering their value in use (recoverable amount of the impaired intangible assets: USD
5
2020).
The table below presents estimated aggregated amortization expenses for intangible assets.
USD million
Intangible assets
Estimated aggregated amortization expenses for:
2022
29
2023
27
2024
23
2025
23
2026
23
Thereafter
126
Not amortized due to indefinite useful life
2
Total
252
Consolidated financial statements | UBS AG consolidated financial statements
458
Note 14 Other assets
a) Other financial assets measured at amortized cost
USD million
31.12.21
31.12.20
Debt securities
18,858
18,801
of which: government bills / bonds
9,833
9,789
Loans to financial advisors
2,453
2,569
Fee- and commission-related receivables
1,966
2,014
Finance lease receivables
1,356
1,447
Settlement and clearing accounts
455
614
Accrued interest income
521
592
Other
627
1,182
Total other financial assets measured at amortized cost
26,236
27,219
b) Other non-financial assets
USD million
31.12.21
31.12.20
Precious metals and other physical commodities
5,258
6,264
Deposits and collateral provided in connection with litigation, regulatory and similar matters
1
1,526
1,418
Prepaid expenses
717
731
VAT and other tax receivables
591
392
Properties and other non-current assets held for sale
32
246
Assets of disposal groups held for sale
2
1,093
Other
618
323
Total other non-financial assets
9,836
9,374
1 Refer to Note 18 for more information. 2 Refer to Note 30 for more information.
Note 15 Amounts due to banks, customer deposits, and funding from UBS Group AG
a) Amounts due to banks and customer deposits
USD million
31.12.21
31.12.20
Amounts due to banks
13,101
11,050
Customer deposits
544,834
527,929
of which: demand deposits
247,299
237,604
of which: retail savings / deposits
247,224
220,898
of which: time deposits
1
50,312
69,427
Total amounts due to banks and customer deposits
557,935
538,979
1 Includes customer deposits in UBS AG Jersey Branch placed by UBS Switzerland AG on behalf of its clients.
b) Funding from UBS Group AG
USD million
31.12.21
31.12.20
Senior unsecured debt that contributes to total loss-absorbing capacity (TLAC)
38,984
36,611
Senior unsecured debt other than TLAC
4,471
2,939
High-trigger loss-absorbing additional tier 1 capital instruments
11,414
11,854
Low-trigger loss-absorbing additional tier 1 capital instruments
2,426
2,575
Total
1
57,295
53,979
1 UBS AG has also recognized funding from UBS Group AG that is designated at fair value. Refer to Note 19b for more information.
459
Note 16 Debt issued designated at fair value
USD million
31.12.21
31.12.20
Issued debt instruments
Equity-linked
1
47,059
41,069
Rates-linked
16,369
11,038
Credit-linked
1,723
1,933
Fixed-rate
2,868
3,604
Commodity-linked
2,911
1,497
Other
529
726
Total debt issued designated at fair value
71,460
59,868
of which: issued by UBS AG with original maturity greater than one year
2
57,967
46,427
of which: life-to-date own credit (gain) / loss
144
233
1 Includes investment fund unit-linked instruments issued. 2 Based on original contractual maturity without considering any early redemption features. As of 31 December 2021,
100
% of the balance was unsecured
(31 December 2020:
100
%).
As of 31 December 2021 and 31
��
December 2020, the contractualredemption amount at maturity of debt issued designated at fair
value through profit or loss was not materially different from the
carrying amount.
The table below shows the residual contractual maturity of the
carrying amount of debt issued designated at fair value, split
between fixed-rate and floating-rate instruments based on the
contractual terms, and does not consider any early redemption
features. Interest rate ranges for future interest payments related
to debt issued designated at fair value have not been included in
the table below, as the majority of the debt instruments issued are
structured products and therefore the future interest payments
are highly dependent upon the embedded derivative and
prevailing market conditions at the point in time that each interest
payment is made.
›
Refer to Note 24 for maturity information on an undiscounted
cash flow basis
Contractual maturity of carrying amount
USD million
2022
2023
2024
2025
2026
2027–2031
Thereafter
Total
31.12.21
Total
31.12.20
UBS AG
1
Non-subordinated debt
Fixed-rate
4,296
1,658
716
495
226
273
1,732
9,397
9,409
Floating-rate
19,338
15,621
5,067
5,816
3,840
8,364
3,238
61,284
49,528
Subtotal
23,635
17,279
5,783
6,311
4,066
8,637
4,971
70,682
58,937
Other subsidiaries
2
Non-subordinated debt
Fixed-rate
6
0
0
0
0
423
0
429
539
Floating-rate
150
47
145
0
0
0
7
349
392
Subtotal
156
47
145
0
0
423
7
778
931
Total
23,791
17,325
5,929
6,311
4,066
9,060
4,977
71,460
59,868
1 Consists of instruments issued by the legal entity UBS AG. 2 Consists of instruments issued by subsidiaries of UBS AG.
Consolidated financial statements | UBS AG consolidated financial statements
460
Note 17 Debt issued measured at amortized cost
USD million
31.12.21
31.12.20
Certificates of deposit and commercial paper
40,640
41,151
Other short-term debt
2,458
5,515
Short-term debt
1
43,098
46,666
Senior unsecured debt
23,328
18,483
of which: issued by UBS AG with original maturity greater than one year
2
23,307
18,464
Covered bonds
1,389
2,796
Subordinated debt
5,163
7,744
of which: low-trigger loss-absorbing tier 2 capital instruments
2,596
7,201
of which: non-Basel III-compliant tier 2 capital instruments
547
543
Debt issued through the Swiss central mortgage institutions
9,454
9,660
Other long-term debt
0
3
Long-term debt
3
39,334
38,685
Total debt issued measured at amortized cost
4
82,432
85,351
1 Debt with an original contractual maturity of less than one year. 2 Based on original contractual maturity without considering any early redemption features. As of 31 December 2021,
100
% of the balance was
unsecured (31 December 2020:
100
%). 3 Debt with an original contractual maturity greater than or equal to one year. The classification of debt issued into short-term and long-term does not consider any early
redemption features. 4 Net of bifurcated embedded derivatives, the fair value of which was not material for the periods presented.
UBS AG uses interest rate and foreign exchange derivatives to
manage the risks inherent in certain debt instruments held at
amortized cost. In some cases, UBS AG applies hedge accounting
for interest rate risk as discussed in item 2j in Note 1a and Note
26. As a result of applying hedge accounting, the life-to-date
adjustment to the carrying amount of debt issued was an increase
of USD
261
USD
761
fair value due to interest rate movements.
Subordinated debt consists of unsecured debt obligations that
are contractually subordinated in right of payment to all other
present and future non-subordinated obligations of the respective
issuing entity.
All of the subo
rdinated debt instruments
outstanding as of 31 December 2021 pay a fixed rate of interest.
The table below shows the residual contractual maturity of the
carrying amount of debt issued, split between fixed-rate and
floating-rate based on the contractual terms, and does not
consider any early redemption features. The effects from interest
rate swaps, which are used to hedge various fixed-rate debt
issuances by changing the repricing characteristics into those
similar to floating-rate debt, are also not considered in the table
below.
›
Refer to Note 24 for maturity information on an undiscounted
cash flow basis
Contractual maturity of carrying amount
USD million
2022
2023
2024
2025
2026
2027–2031
Thereafter
Total
31.12.21
Total
31.12.20
UBS AG
1
Non-subordinated debt
Fixed-rate
38,647
5,578
1,964
349
3,439
1,381
1,213
52,571
52,618
Floating-rate
9,807
2,093
1,922
907
508
0
0
15,238
15,299
Subordinated debt
Fixed-rate
2,020
0
2,596
337
210
0
0
5,163
7,744
Subtotal
50,474
7,671
6,482
1,594
4,158
1,381
1,213
72,972
75,661
Other subsidiaries
2
Non-subordinated debt
Fixed-rate
907
1,007
1,072
1,173
1,045
3,674
582
9,460
9,690
Subtotal
907
1,007
1,072
1,173
1,045
3,674
582
9,460
9,690
Total
51,381
8,679
7,554
2,766
5,203
5,055
1,795
82,432
85,351
1 Consists of debt issued by the legal entity UBS AG. 2 Consists of debt issued by subsidiaries of UBS AG.
461
Note 18 Provisions and contingent liabilities
a) Provisions
The table below presents an overview of total provisions.
USD million
31.12.21
31.12.20
Provisions other than provisions for expected credit losses
3,256
2,534
Provisions for expected credit losses
196
257
Total provisions
3,452
2,791
The following table presents additional information for provisions other than provisions for expected credit losses.
USD million
Litigation,
regulatory and
similar matters
1
Restructuring
Other
3
Total 2021
Balance at the beginning of the year
2,135
67
332
2,534
Increase in provisions recognized in the income statement
986
228
73
1,286
Release of provisions recognized in the income statement
(74)
(25)
(29)
(128)
Provisions used in conformity with designated purpose
(189)
(130)
(76)
(396)
Capitalized reinstatement costs
0
0
30
30
Foreign currency translation / unwind of discount
(59)
(3)
(9)
(70)
Balance at the end of the year
2,798
137
2
321
3,256
1 Consists of provisions for losses resulting from legal, liability and compliance risks. 2 Primarily consists of personnel-related restructuring provisions of USD
90
USD
13
47
49
operational risks.
Restructuring
provisions primarily relate to
personnel
-
related
provisions and onerous contracts. Personnel-related restructuring
provisions are used within a short period of time but potential
changes in amount may be triggered when natural staff attrition
reduces the number of people affected by a restructuring event
and therefore the estimated costs. Onerous contracts for property
are recognized when UBS AG is committed to pay for non-lease
components, such as utilities, service charges, taxes and
maintenance, when a property is vacated or not fully recovered
from sub-tenants.
Information about provisions and contingent liabilities in
respect of litigation, regulatory and similar matters, as a class, is
included in Note 18b. There are no material contingent liabilities
associated with the other classes of provisions.
b) Litigation, regulatory and similar matters
UBS operates in a legal and regulatory environment that exposes
it to significant litigation and similar risks arising from disputes
and regulatory proceedings. As a result, UBS (which for purposes
of this Note may refer to UBS AG and/or one or more of its
subsidiaries, as applicable) is involved in various disputes and legal
proceedings, including litigation, arbitration, and regulatory and
criminal investigations.
Such matters are subject to many uncertainties, and the
outcome and the timing of resolution are often difficult to predict,
particularly in the earlier stages of a case. There are also situations
where UBS may enter into a settlement agreement. This may
occur in order to avoid the expense, management distraction or
reputational implications of continuing to contest liability, even for
those matters for which UBS believes it should be exonerated. The
uncertainties inherent in all such matters affect the amount and
timing of any potential outflows for both matters with respect to
which provisions have been established and other contingent
liabilities. UBS makes provisions for such matters brought against
it when, in the opinion of management after seeking legal advice,
it is more likely than not that UBS has a present legal or
constructive obligation as a result of past events, it is probable
that an outflow of resources will be required, and the amount can
be reliably estimated. Where these factors are otherwise satisfied,
a provision may be established for claims that have not yet been
asserted against UBS, but are nevertheless expected to be, based
on UBS’s experience with similar asserted claims. If any of those
conditions is not met, such matters result in contingent liabilities.
If the amount of an obligation cannot be reliably estimated, a
liability exists that is not recognized even if an outflow of
resources is probable. Accordingly, no provision is established
even if the potential outflow of resources with respect to such
matters could be significant. Developments relating to a matter
that occur after the relevant reporting period, but prior to the
issuance of financial statements, which affect management’s
assessment of the provision for such matter (because, for
example, the developments provide evidence of conditions that
existed at the end of the reporting period), are adjusting events
after the reporting period under IAS 10 and must be recognized
in the financial statements for the reporting period.
Consolidated financial statements | UBS AG consolidated financial statements
462
Note 18 Provisions and contingent liabilities (continued)
Specific litigation, regulatory and other matters are described
below, including all such matters that management considers to
be material and others that management believes to be of
significance due to potential financial, reputational and other
effects. The amount of damages claimed, the size of a transaction
or other information is provided where available and appropriate
in order to assist users in considering the magnitude of potential
exposures.
In the case of certain matters below, we state that we have
established a provision, and for the other matters, we make no
such statement. When we make this statement and we expect
disclosure of the amount of a provision to prejudice seriously our
position with other parties in the matter because it would reveal
what UBS believes to be the probable and reliably estimable
outflow, we do not disclose that amount. In some cases we are
subject to confidentiality obligations that preclude such
disclosure. With respect to the matters for which we do not state
whether we have established a provision, either: (a) we have not
established a provision, in which case the matter is treated as a
contingent liability under the applicable accounting standard; or
(b) we have established a provision but expect disclosure of that
fact to prejudice seriously our position with other parties in the
matter because it would reveal the fact that UBS believes an
outflow of resources to be probable and reliably estimable.
With respect to certain litigation, regulatory and similar matters
for which we have established provisions, we are able to estimate
the expected timing of outflows. However, the aggregate amount
of the expected outflows for those matters for which we are able
to estimate expected timing is immaterial relative to our current
and expected levels of liquidity over the relevant time periods.
The aggregate amount provisioned for litigation, regulatory
and similar matters as a class is disclosed in the “Provisions” table
in Note 18a above. It is not practicable to provide an aggregate
estimate of liability for our litigation, regulatory and similar
matters as a class of contingent liabilities. Doing so would require
UBS to provide speculative legal assessments as to claims and
proceedings that involve unique fact patterns or novel legal
theories, that have not yet been initiated or are at early stages of
adjudication, or as to which alleged damages have not been
quantified by the claimants. Although UBS therefore cannot
provide a numerical estimate of the future losses that could arise
from litigation, regulatory and similar matters, UBS believes that
the aggregate amount of possible future losses from this class that
are more than remote substantially exceeds the level of current
provisions.
Litigation, regulatory and similar matters may also result in
non-monetary penalties and consequences. A guilty plea to, or
conviction of, a crime could have material consequences for UBS.
Resolution of regulatory proceedings may require UBS to obtain
waivers of regulatory disqualifications to maintain certain
operations, may entitle regulatory authorities to limit, suspend or
terminate licenses and regulatory authorizations, and may permit
financial market utilities to limit, suspend or terminate UBS’s
participation in such utilities. Failure to obtain such waivers, or any
limitation, suspension or termination of licenses, authorizations or
participations, could have material consequences for UBS.
The risk of loss associated with litigation, regulatory and similar
matters is a component of operational risk for purposes of
determining capital requirements. Information concerning our
capital requirements and the calculation of operational risk for this
purpose is included in the “Capital, liquidity and funding, and
balance sheet” section of this report.
Provisions for litigation, regulatory and similar matters by business division and in Group Functions
1
USD million
Global
Wealth
Manage-
ment
Personal &
Corporate
Banking
Manage-
ment
Investment
Bank
Group
Functions
Total 2021
Balance at the beginning of the year
861
115
0
227
932
2,135
Increase in provisions recognized in the income statement
754
84
9
107
32
986
Release of provisions recognized in the income statement
(60)
(11)
0
(4)
0
(74)
Provisions used in conformity with designated purpose
(175)
(1)
(1)
(10)
(2)
(189)
Foreign currency translation / unwind of discount
(42)
(6)
0
(11)
0
(59)
Balance at the end of the year
1,338
181
8
310
962
2,798
1 Provisions, if any, for the matters described in items 3 and 4 of this Note are recorded in Global Wealth Management, and provisions, if any, for the matters described in item 2 are recorded in Group Functions.
Provisions, if any, for the matters described in items 1 and 6 of this Note are allocated between Global Wealth Management and Personal & Corporate Banking, and provisions, if any, for the matters described in item
5 are allocated between the Investment Bank and Group Functions.
463
Note 18 Provisions and contingent liabilities (continued)
1. Inquiries regarding cross-border wealth management
businesses
Tax and regulatory authorities in a number of countries have
made inquiries, served requests for information or examined
employees located in their respective jurisdictions relating to the
cross-border wealth management services provided by UBS and
other financial institutions. It is possible that the implementation
of automatic tax information exchange and other measures
relating to cross-border provision of financial services could give
rise to further inquiries in the future. UBS has received disclosure
orders from the Swiss Federal Tax Administration (FTA) to transfer
information based on requests for international administrative
assistance in tax matters. The requests concern a number of UBS
account numbers pertaining to current and former clients and are
based on data from 2006 and 2008. UBS has taken steps to
inform affected clients about the administrative assistance
proceedings and their procedural rights, including the right to
appeal. The requests are based on data received from the German
authorities, who seized certain data related to UBS clients booked
in Switzerland during their investigations and have apparently
shared this data with other European countries. UBS expects
additional countries to file similar requests.
Since 2013, UBS (France) S.A., UBS AG and certain former
employees have been under investigation in France for alleged
complicity in unlawful solicitation of clients on French territory,
regarding the laundering of proceeds of tax fraud, and banking
and financial solicitation by unauthorized persons. In connection
with this investigation, the investigating judges ordered UBS AG
to provide bail (“
caution
”) of EUR
1.1
to post bail of EUR
40
EUR
10
On 20 February 2019, the court of first instance returned a
verdict finding UBS AG guilty of unlawful solicitation of clients on
French territory and aggravated laundering of the proceeds of tax
fraud, and UBS (France) S.A. guilty of aiding and abetting
unlawful solicitation and of laundering the proceeds of tax fraud.
The court imposed fines aggregating EUR
3.7
and UBS (France) S.A. and awarded EUR
800
damages to the French state. A trial in the French Court of Appeal
took place in March 2021. On 13 December 2021, the Court of
Appeal found UBS AG guilty of unlawful solicitation and
aggravated laundering of the proceeds of tax fraud. The court
ordered a fine of EUR
3.75
EUR
1
EUR
800
the aiding and abetting of unlawful solicitation and ordered it to
pay a fine of EUR
1.875
the French Supreme Court to preserve its rights. The appeal
enables UBS AG to thoroughly assess the verdict of the Court of
Appeal and to determine next steps in the best interest of its
stakeholders. The fine and confiscation imposed by the Court of
Appeal are suspended during the appeal. The civil damages award
has been paid to the French state (EUR
99
deducted from the bail), subject to the result of UBS’s appeal.
Our balance sheet at 31 December 2021 reflected provisions
with respect to this matter in an amount of EUR
1.1
(USD
1.252
possible outcomes in this case contributes to a high degree of
estimation uncertainty and the provision reflects our best estimate
of possible financial implications, although actual penalties and
civil damages could exceed (or may be less than) the provision
amount.
In 2016, UBS was notified by the Belgian investigating judge
that it was under formal investigation (“
inculpé
”) regarding the
allegations of laundering of proceeds of tax fraud, banking and
financial solicitation by unauthorized persons, and serious tax
fraud. In November 2021, the Council Chamber approved a
settlement with the Brussels Prosecution Office for EUR
49
without recognition of guilt with regard to the allegations of
banking and financial solicitation by unauthorized persons and
serious tax fraud. The allegation of laundering of proceeds of tax
fraud was dismissed.
Our balance sheet at 31 December 2021 reflected provisions
with respect to matters described in this item 1 in an amount that
UBS believes to be appropriate under the applicable accounting
standard. As in the case of other matters for which we have
established provisions, the future outflow of resources in respect
of such matters cannot be determined with certainty based on
currently available information and accordingly may ultimately
prove to be substantially greater (or may be less) than the
provision that we have recognized.
2. Claims related to sales of residential mortgage-backed
securities and mortgages
From 2002 through 2007, prior to the crisis in the US residential
loan market, UBS was a substantial issuer and underwriter of US
residential mortgage-backed securities (RMBS) and was a
purchaser and seller of US residential mortgages.
In November 2018, the DOJ filed a civil complaint in the District
Court for the Eastern District of New York. The complaint seeks
unspecified civil monetary penalties under the Financial
Institutions Reform, Recovery and Enforcement Act of 1989
related to UBS’s issuance, underwriting and sale of 40 RMBS
transactions in 2006 and 2007. UBS moved to dismiss the civil
complaint on 6 February 2019. On 10 December 2019, the
district court denied UBS’s motion to dismiss.
Our balance sheet at 31 December 2021 reflected a provision
with respect to matters described in this item 2 in an amount that
UBS believes to be appropriate under the applicable accounting
standard. As in the case of other matters for which we have
established provisions, the future outflow of resources in respect
of this matter cannot be determined with certainty based on
currently available information and accordingly may ultimately
prove to be substantially greater (or may be less) than the
provision that we have recognized.
Consolidated financial statements | UBS AG consolidated financial statements
464
Note 18 Provisions and contingent liabilities (continued)
3. Madoff
In relation to the Bernard L. Madoff Investment Securities LLC
(BMIS) investment fraud, UBS AG, UBS (Luxembourg) S.A. (now
UBS Europe SE, Luxembourg
branch) and certain other UBS
subsidiaries have been subject to inquiries by a number of
regulators, including the Swiss Financial Market Supervisory
Authority (FINMA) and the Luxembourg Commission de
Surveillance du Secteur Financier. Those inquiries concerned two
third-party funds established under Luxembourg law, substantially
all assets of which were with BMIS, as well as certain funds
established in offshore jurisdictions with either direct or indirect
exposure to BMIS. These funds faced severe losses, and the
Luxembourg funds are in liquidation. The documentation
establishing both funds identifies UBS entities in various roles,
including custodian, administrator, manager, distributor and
promoter, and indicates that UBS employees serve as board
members.
In 2009 and 2010, the liquidators of the two Luxembourg
funds filed claims against UBS entities, non-UBS entities and
certain individuals, including current and former UBS employees,
seeking amounts totaling approximately EUR
2.1
includes amounts that the funds may be held liable to pay the
trustee for the liquidation of BMIS (BMIS Trustee).
A large number of alleged beneficiaries have filed claims
against UBS entities (and non-UBS entities) for purported losses
relating to the Madoff fraud. The majority of these cases have
been filed in Luxembourg, where decisions that the claims in eight
test cases were inadmissible have been affirmed by the
Luxembourg Court of Appeal, and the Luxembourg Supreme
Court has dismissed a further appeal in one of the test cases.
In the US, the BMIS Trustee filed claims against UBS entities,
among others, in relation to the two Luxembourg funds and one
of the offshore funds. The total amount claimed against all
defendants in these actions was not less than USD
2
2014, the US Supreme Court rejected the BMIS Trustee’s motion
for leave to appeal decisions dismissing all claims except those for
the recovery of approximately USD
125
alleged to be fraudulent conveyances and preference payments.
In 2016, the bankruptcy court dismissed these claims against the
UBS entities. In February 2019, the Court of Appeals reversed the
dismissal of the BMIS Trustee’s remaining claims, and the US
Supreme Court subsequently denied a petition seeking review of
the Court of Appeals’ decision. The case has been remanded to
the Bankruptcy Court for further proceedings.
4. Puerto Rico
Declines since 2013 in the market prices of Puerto Rico municipal
bonds and of closed-end funds (funds) that are sole-managed and
co-managed by UBS Trust Company of Puerto Rico and
distributed by UBS Financial Services Incorporated of Puerto Rico
(UBS PR) led to multiple regulatory inquiries, which in 2014 and
2015, led to settlements with the Office of the Commissioner of
Financial Institutions for the Commonwealth of Puerto Rico, the
US Securities and Exchange Commission (SEC) and the Financial
Industry Regulatory Authority.
Since then, UBS clients in Puerto Rico who own the funds or
Puerto Rico municipal bonds and/or who used their UBS account
assets as collateral for UBS non-purpose loans filed customer
complaints and arbitration demands seeking aggregate damages
of USD
3.4
3.1
through settlements, arbitration or withdrawal of
claims
.
Allegations include fraud, misrepresentation and unsuitability of
the funds and of the loans.
A shareholder derivative action was filed in 2014 against
various UBS entities and current and certain former directors of
the funds, alleging hundreds of millions of US dollars in losses in
the funds. In 2021, the parties reached an agreement to settle this
matter for USD
15
In 2011, a purported derivative action was filed on behalf of
the Employee Retirement System of the Commonwealth of Puerto
Rico (System) against over 40 defendants, including UBS PR,
which was named in connection with its underwriting and
consulting services. Plaintiffs alleged that defendants violated
their purported fiduciary duties and contractual obligations in
connection with the issuance and underwriting of USD
3
of bonds by the System in 2008 and sought damages of over
USD
800
to join the action as a plaintiff. In 2017,
the court denied
defendants’ motion to dismiss the complaint. In 2020, the court
denied plaintiffs’ motion for summary judgment.
Beginning in 2015, certain agencies and public corporations of
the Commonwealth of Puerto Rico (Commonwealth) defaulted
on certain interest payments on Puerto Rico bonds. In 2016, US
federal legislation created an oversight board with power to
oversee Puerto Rico’s finances and to restructure its debt. The
oversight board has imposed a stay on the exercise of certain
creditors’ rights. In 2017, the oversight board placed certain of
the bonds into a bankruptcy-like proceeding under the
supervision of a Federal District Judge.
In May 2019, the oversight board filed complaints in Puerto
Rico federal district court bringing claims against financial, legal
and accounting firms that had participated in Puerto Rico
municipal bond offerings, including UBS, seeking a return of
underwriting and swap fees paid in connection with those
offerings. UBS estimates that it received approximately USD
125
million in fees in the relevant offerings.
In August 2019, and February and November 2020, four US
insurance companies that insured issues of Puerto Rico municipal
bonds sued UBS and several other underwriters of Puerto Rico
municipal bonds in three separate cases. The actions collectively
seek recovery of an aggregate of USD
955
from the defendants. The plaintiffs in these cases claim that
defendants failed to reasonably investigate financial statements in
the offering materials for the insured Puerto Rico bonds issued
between 2002 and 2007, which plaintiffs argue they relied upon
in agreeing to insure the bonds notwithstanding that they had no
contractual relationship with the underwriters. Defendants’
motions to dismiss were granted in two of the cases; those
decisions are being appealed by the plaintiffs. In the third case,
defendants’ motion to dismiss was denied, but on appeal that
ruling was reversed and the motion to dismiss was granted.
465
Note 18 Provisions and contingent liabilities (continued)
Our balance sheet at 31 December 2021 reflected provisions
with respect to matters described in this item 4 in amounts that
UBS believes to be appropriate under the applicable accounting
standard. As in the case of other matters for which we have
established provisions, the future outflow of resources in respect
of such matters cannot be determined with certainty based on
currently available information and accordingly may ultimately
prove to be substantially greater (or may be less) than the
provisions that we have recognized.
5. Foreign exchange, LIBOR and benchmark rates, and other
trading practices
Foreign exchange-related regulatory matters:
numerous authorities commenced investigations concerning
possible manipulation of foreign exchange markets and precious
metals prices. As a result of these investigations, UBS entered into
resolutions with Swiss, US and United Kingdom regulators and
the European Commission. UBS was granted conditional
immunity by the Antitrust Division of the DOJ and by authorities
in other jurisdictions in connection with potential competition law
violations relating to foreign exchange and precious metals
businesses.
Foreign exchange-related civil litigation:
have been filed since 2013 in US federal courts and in other
jurisdictions against UBS and other banks on behalf of putative
classes of persons who engaged in foreign currency transactions
with any of the defendant banks. UBS has resolved US federal
court class actions relating to foreign currency transactions with
the defendant banks and persons who transacted in foreign
exchange futures contracts and options on such futures under a
settlement agreement that provides for UBS to pay an aggregate
of USD
141
classes. Certain class members have excluded themselves from
that settlement and have filed individual actions in US and English
courts against UBS and other banks, alleging violations of US and
European competition laws and unjust enrichment.
In 2015, a putative class action was filed in federal court
against UBS and numerous other banks on behalf of persons and
businesses in the US who directly purchased foreign currency from
the defendants and alleged co-conspirators for their own end use.
In March 2017, the court granted UBS’s (and the other banks’)
motions to dismiss the complaint. The plaintiffs filed an amended
complaint in August 2017. In March 2018, the court denied the
defendants’ motions to dismiss the amended complaint.
LIBOR and other benchmark
-
related regulatory
matters:
Numerous government agencies conducted investigations
regarding potential improper attempts by UBS, among others, to
manipulate LIBOR and other benchmark rates at certain times.
UBS reached settlements or otherwise concluded investigations
relating to benchmark interest rates with the investigating
authorities. UBS was granted conditional leniency or conditional
immunity from authorities in certain jurisdictions, including the
Antitrust Division of the DOJ and the Swiss Competition
Commission (WEKO), in connection with potential antitrust or
competition law violations related to certain rates. However, UBS
has not reached a final settlement with WEKO, as the Secretariat
of WEKO has asserted that UBS does not qualify for full immunity.
LIBOR and other benchmark-related civil litigation:
of putative class actions and other actions are pending in the
federal courts in New York against UBS and numerous other banks
on behalf of parties who transacted in certain interest rate
benchmark-based derivatives. Also pending in the US and in other
jurisdictions are a number of other actions asserting losses related
to various products whose interest rates were linked to LIBOR and
other benchmarks, including adjustable rate mortgages, preferred
and debt securities, bonds pledged as collateral, loans, depository
accounts, investments and other interest-bearing instruments.
The complaints allege manipulation, through various means, of
certain benchmark interest rates, including USD LIBOR, Euroyen
TIBOR, Yen LIBOR, EURIBOR, CHF LIBOR, GBP LIBOR, SGD SIBOR
and SOR and Australian BBSW, and seek unspecified
compensatory and other damages under varying legal theories.
USD LIBOR class and individual actions in the US:
In 2013 and
2015, the district court in the USD LIBOR actions dismissed, in
whole or in part, certain plaintiffs’ antitrust claims, federal
racketeering claims, CEA claims, and state common law claims,
and again dismissed the antitrust claims in 2016 following an
appeal. In December 2021, the Second Circuit affirmed the district
court’s dismissal in part and reversed in part and remanded to the
district court for further proceedings. The Second Circuit, among
other things, held that there was personal jurisdiction over UBS
and other foreign defendants based on allegations that at least
one alleged co-conspirator undertook an overt act in the United
States. Separately, in 2018, the Second Circuit reversed in part the
district court’s 2015 decision dismissing certain individual
plaintiffs’ claims and certain of these actions are now proceeding.
In 2018, the district court denied plaintiffs’ motions for class
certification in the USD class actions for claims pending against
UBS, and plaintiffs sought permission to appeal that ruling to the
Second Circuit. In July 2018, the Second Circuit denied the
petition to appeal of the class of USD lenders and in November
2018 denied the petition of the USD exchange class. In January
2019, a putative class action was filed in the District Court for the
Southern District of New York against UBS and numerous other
banks on behalf of US residents who, since 1 February 2014,
directly transacted with a defendant bank in USD LIBOR
instruments. The complaint asserts antitrust claims. The
defendants moved to dismiss the complaint in August 2019. On
26 March 2020 the court granted defendants’ motion to dismiss
the complaint in its entirety. Plaintiffs have appealed the dismissal.
In August 2020, an individual action was filed in the Northern
District of California against UBS and numerous other banks
alleging that the defendants conspired to fix the interest rate used
as the basis for loans to consumers by jointly setting the
USD LIBOR rate and monopolized the market for LIBOR-based
consumer loans and credit cards. Defendants moved to dismiss
the complaint in September 2021.
Consolidated financial statements | UBS AG consolidated financial statements
466
Note 18 Provisions and contingent liabilities (continued)
Other benchmark class actions in the US:
Yen LIBOR / Euroyen TIBOR –
In 2014, 2015 and 2017, the court
in one of the Yen LIBOR / Euroyen TIBOR lawsuits dismissed
certain of the plaintiffs’ claims, including the plaintiffs’ federal
antitrust and racketeering claims. In August 2020, the court
granted defendants’ motion for judgment on the pleadings and
dismissed the lone remaining claim in the action as impermissibly
extraterritorial. Plaintiffs have appealed. In 2017, the court
dismissed the other Yen LIBOR / Euroyen TIBOR action in its
entirety on standing grounds. In April 2020, the appeals court
reversed the dismissal and in August 2020 plaintiffs in that action
filed an amended complaint focused on Yen LIBOR. The court
granted in part and denied in part defendants’ motion to dismiss
the amended complaint in September 2021 and plaintiffs and the
remaining defendants have moved for reconsideration.
CHF LIBOR
on standing grounds and failure to state a claim. Plaintiffs filed an
amended complaint, and the court granted a renewed motion to
dismiss in September 2019. Plaintiffs appealed. In September
2021, the Second Circuit granted the parties’ joint motion to
vacate the dismissal and remand the case for further proceedings.
EURIBOR
the case as to UBS and certain other foreign defendants for lack
of personal jurisdiction. Plaintiffs have appealed.
SIBOR / SOR
action dismissed all but one of plaintiffs’ claims against UBS.
Plaintiffs filed an amended complaint, and the court granted a
renewed motion to dismiss in July 2019. Plaintiffs appealed. In
March 2021, the Second Circuit reversed the dismissal. Plaintiffs
filed an amended complaint in October 2021, which defendants
have moved to dismiss.
BBSW
lawsuit as to UBS and certain other foreign defendants for lack of
personal jurisdiction. Plaintiffs filed an amended complaint in April
2019, which UBS and other defendants moved to dismiss. In
February 2020, the court granted in part and denied in part
defendants’ motions to dismiss the amended complaint. In
August 2020, UBS and other BBSW defendants joined a motion
for judgment on the pleadings, which the court denied in May
2021.
GBP LIBOR
August 2019. Plaintiffs have appealed.
Government bonds:
2015 in US federal courts against UBS and other banks on behalf
of persons who participated in markets for US Treasury securities
since 2007. A consolidated complaint was filed in 2017 in the US
District Court for the Southern District of New York alleging that
the banks colluded with respect to, and manipulated prices of, US
Treasury securities sold at auction and in the secondary market and
asserting claims under the antitrust laws and for unjust enrichment
.
Defendants’ motions to dismiss the consolidated complaint was
granted in March 2021. Plaintiffs filed an amended complaint,
which defendants moved to dismiss in June 2021. Similar class
actions have been filed concerning European government bonds
and other government bonds.
In May 2021, the European Commission issued a decision
finding that UBS and six other banks breached European Union
antitrust rules in 2007–2011 relating to European government
bonds. The European Commission fined UBS EUR
172
is appealing the amount of the fine.
With respect to additional matters and jurisdictions not
encompassed by the settlements and orders referred to above,
our balance sheet at 31 December 2021 reflected a provision in
an amount that UBS believes to be appropriate under the
applicable accounting standard. As in the case of other matters
for which we have established provisions, the future outflow of
resources in respect of such matters cannot be determined with
certainty based on currently available information and accordingly
may ultimately prove to be substantially greater (or may be less)
than the provision that we have recognized.
6. Swiss retrocessions
The Federal Supreme Court of Switzerland ruled in 2012, in a test
case against UBS, that distribution fees paid to a firm for
distributing third-party and intra-group investment funds and
structured products must be disclosed and surrendered to clients
who have entered into a discretionary mandate agreement with
the firm, absent a valid waiver. FINMA issued a supervisory note
to all Swiss banks in response to the Supreme Court decision. UBS
has met the FINMA requirements and has notified all potentially
affected clients.
The Supreme Court decision has resulted, and continues to
result, in a number of client requests for UBS to disclose and
potentially surrender retrocessions. Client requests are assessed
on a case-by-case basis. Considerations taken into account when
assessing these cases include, among other things, the existence
of a discretionary mandate and whether or not the client
documentation contained
a valid waiver with respect to
distribution fees.
Our balance sheet at 31 December 2021 reflected a provision
with respect to matters described in this item 6 in an amount that
UBS believes to be appropriate under the applicable accounting
standard. The ultimate exposure will depend on client requests
and the resolution thereof, factors that are difficult to predict and
assess. Hence, as in the case of other matters for which we have
established provisions, the future outflow of resources in respect
of such matters cannot be determined with certainty based on
currently available information and accordingly may ultimately
prove to be substantially greater (or may be less) than the
provision that we have recognized.
467
Note 19 Other liabilities
a) Other financial liabilities measured at amortized cost
USD million
31.12.21
31.12.20
Other accrued expenses
1,642
1,508
Accrued interest expenses
1,134
1,382
Settlement and clearing accounts
1,282
1,181
Lease liabilities
3,438
3,821
Other
2,269
2,530
Total other financial liabilities measured at amortized cost
9,765
10,421
b) Other financial liabilities designated at fair value
USD million
31.12.21
31.12.20
Financial liabilities related to unit-linked investment contracts
21,466
20,975
Securities financing transactions
6,377
7,317
Over-the-counter debt instruments
2,128
2,060
Funding from UBS Group AG
2,340
1,375
Other
103
46
Total other financial liabilities designated at fair value
32,414
31,773
of which: life-to-date own credit (gain) / loss
172
148
c) Other non-financial liabilities
USD million
31.12.21
31.12.20
Compensation-related liabilities
4,795
4,776
of which: financial advisor compensation plans
1,512
1,497
of which: other compensation plans
2,140
2,034
of which: net defined benefit liability
617
711
of which: other compensation-related liabilities
1
526
534
Deferred tax liabilities
297
558
Current tax liabilities
1,365
943
VAT and other tax payables
524
470
Deferred income
225
212
Liabilities of disposal groups held for sale
2
1,298
Other
68
61
Total other non-financial liabilities
8,572
7,018
1 Includes liabilities for payroll taxes and untaken vacation. 2 Refer to Note 30 for more information.
Consolidated financial statements | UBS AG consolidated financial statements
468
Additional information
Note 20 Expected credit loss measurement
a) Expected credit losses in the period
Total net credit loss releases were USD
148
reflecting net credit loss releases of USD
123
stage 1 and 2 positions and USD
25
related to credit-impaired (stage 3) positions.
Stage 1 and 2 net credit loss releases of USD
123
included a USD
68
adjustment, due to the continued positive trend in
macroeconomic scenario input data during the year, a USD
45
million net release from a number of model and methodology
changes and
a
residual
USD
10
from
remeasurements within the loan book, derecognized
transactions, partially offset by expenses from new transactions
.
›
Refer to Note 20b for more information regarding changes to
ECL model, scenarios, scenario weights and the post-model
adjustment and to Note 20c for more information regarding the
development of ECL allowances and provisions
Stage 3 net releases of USD
25
a number of defaulted positions with a USD
24
in Personal & Corporate Banking.
Credit loss (expense) / release
USD million
Global
Wealth
Management
Personal &
Corporate
Banking
Asset
Management
Investment
Bank
Group
Functions
Total
For the year ended 31.12.21
Stages 1 and 2
28
62
0
34
0
123
Stage 3
1
24
(1)
0
0
25
Total credit loss (expense) / release
29
86
(1)
34
0
148
For the year ended 31.12.20
Stages 1 and 2
(48)
(129)
0
(88)
0
(266)
Stage 3
(40)
(128)
(2)
(217)
(42)
(429)
Total credit loss (expense) / release
(88)
(257)
(2)
(305)
(42)
(695)
For the year ended 31.12.19
Stages 1 and 2
3
23
0
(4)
0
22
Stage 3
(23)
(44)
0
(26)
(7)
(100)
Total credit loss (expense) / release
(20)
(21)
0
(30)
(7)
(78)
469
Note 20 Expected credit loss measurement (continued)
b) Changes to ECL models, scenarios, scenario weights and key inputs
Refer to Note 1a for information about the principles governing
expected credit loss (ECL) models, scenarios, scenario weights and
key inputs applied.
Governance
Comprehensive cross-functional and cross-divisional governance
processes are in place and are used to discuss and approve
scenario updates and weights, to assess whether significant
increases in credit risk resulted in stage transfers, to review model
outputs and to reach conclusions regarding post-model
adjustments.
Model changes
During 2021, the model review and enhancement process led to
adjustments of the probability of default (PD), loss given default
(LGD) and credit conversion factor (CCF) models, resulting in a
USD
45
25
Large corporate clients
Investment Bank. The remainder related to various segments in
Personal & Corporate Banking and Global Wealth Management.
Scenario and key input updates
During 2021, the scenarios and related macroeconomic factors
were updated from those that were applied at the end of 2020
by taking into account the prevailing economic and political
conditions and uncertainty. As the economic development was
more positive than anticipated following the COVID-19-related
downturn,
the forward
-
looking scenarios benefited from an
improved forecast starting level.
The projections of the baseline scenario, which are aligned to
the economic and market assumptions used for UBS
AG
’s
business planning purposes, are broadly in line with external data,
such as from Bloomberg Consensus, Oxford Economics and the
International Monetary Fund World Economic Outlook. The
economic performance during 2021 in relevant markets,
especially in the US and in Switzerland, highlighted an accelerated
improvement after the COVID-19-related shocks. The scenario
assumes continued growth in 2022 in all key markets, albeit at a
slower rate than seen in 2021, and unemployment rates are not
expected to fall noticeably below the current levels. Interest rates
are expected to remain low in line with the central bank policies
pursued in the Eurozone and Switzerland, and any potential rises
in the US would be limited in the foreseeable future. House prices
are expected to reflect the momentum and continue to rise,
especially in Switzerland and, to a lesser degree, in the US.
The narrative of the hypothetical severe downside scenario,
which is the Group’s binding stress scenario, has been adapted
and assumes that, while the immediate risks from COVID-19 have
decreased, the associated disruptions and the consequences of
the unprecedented monetary and fiscal stimulus measures will
remain critical. Concerns regarding the sustainability of public
debt, following the marked deterioration of fiscal positions, lead
to a loss of confidence and market turbulence, while
protectionism results in a fall in global trade. Governments and
central banks have limited scope to support the economies. As a
consequence, the Eurozone and China suffer a hard landing,
under this scenario which severely affects the Swiss export-
oriented economy, and the US economy contracts as global
demand is significantly affected. Given the severity of the
macroeconomic impact, unemployment rates rise to historical
highs and real estate sectors contract sharply.
With effect from the second quarter, the hypothetical upside
and mild downside scenarios, which were viewed as less plausible
as of 31 December 2020 and had a probability weight of zero
attached, were redesigned and reintroduced in the ECL
calculation. These two scenarios have become more relevant
following this update, as they better reflect a more positive
outlook with regard to COVID-19 and market expectations
regarding a potential change in central bank policies, respectively.
The upside scenario is based on positive developments
following COVID-19 and strong economic activity supported by
pent-up demand in certain sectors, as well as the expectation that
interest rates will remain relatively low in the near future. Asset
prices rise significantly, but a view that currently observed higher
inflation rates are temporary and spare economic capacity would
mean that consumer prices remain moderate in the first year of
the scenario.
The mild downside scenario focuses on the implications of
rising concerns regarding inflationary trends following a recovery
from COVID-19. Higher-than-expected inflation data triggers a
steepening of yield curves across the globe and leads to market
volatility. Higher interest rates lead to a sell-off in assets and a
period of deleveraging under this scenario. With inflation
remaining high, central banks start hiking their policy rates after
a few quarters, leading to further increases in interest rates and
impacting corporate and private debt sustainability. A recessionary
period is the consequence.
The table on the following page details the key assumptions
for the four scenarios applied as of 31 December 2021.
Consolidated financial statements | UBS AG consolidated financial statements
470
Note 20 Expected credit loss measurement (continued)
Scenario weights and post-model adjustments
With the weighting of four scenarios above 0% and considering
the generally more positive outlook regarding an abating effect
on the world economy from the COVID-19 pandemic, the
distribution of weights shifted during 2021. As of 31 December
2021, 5 percentage points of the weight of the baseline scenario
and 10 percentage points of the severe downside scenario were
redistributed to the upside scenario (5%) and the mild downside
scenario (10%), as shown in the table below.
Although the scenarios and weight allocation were established
in line with the general market sentiment that COVID-19 has
passed its peak and a gradual return to normal is the most likely
path, significant uncertainties still remain. Models, which are
based on supportable statistical information from past
experiences regarding interdependencies of macroeconomic
factors and their implications for credit risk portfolios, cannot
comprehensively reflect extraordinary events, such as a pandemic
or a fundamental change in the world political order. Especially in
these uncertain times, it is in the realm of possibilities that the
generally accepted view that the effects of COVID-19 are abating
may prove to be disappointed by the emergence of new variants
of the virus, which may be more harmful and may undermine
current vaccination efforts. Political events involving tensions
between major global forces may introduce unforeseen
challenges, such as disruptions in the global supply chain and a
distortion of energy markets. Such events could affect economies
severely and change the baseline assumptions significantly. Rather
than creating multiple additional scenarios to gauge these risks
and applying model parameters that lack supportable information
and cannot be robustly validated, management continued to
apply significant post
-
model adjustments.
These
adjustments
were benchmarked against coverage ratio levels as of 30 June
2021
,
when a partial
net release
of USD
91
recognized, corresponding to one third of the accumulated effect
of scenario improvements, following comprehensive expert
assessment and judgment, and were also deemed appropriate for
year-end 2021 reporting. The post-model adjustments relating to
COVID-19 amounted to USD
224
(2020: USD
117
16
for other aspects, where model results were deemed to be
uncertain).
ECL scenario
Assigned weights in %
31.12.21
31.12.20
Upside
5.0
0.0
Baseline
55.0
60.0
Mild downside
10.0
0.0
Severe downside
30.0
40.0
Scenario assumptions
One year
Three years cumulative
31.12.21
Upside
Baseline
Mild
downside
Severe
downside
Upside
Baseline
Mild
downside
Severe
downside
Real GDP growth (% change)
United States
9.1
4.4
(0.1)
(5.9)
17.8
10.1
1.8
(3.8)
Eurozone
9.4
3.9
(0.1)
(8.7)
17.3
7.5
0.9
(10.3)
Switzerland
5.5
2.4
(0.9)
(6.6)
13.1
5.8
(0.1)
(5.7)
Consumer price index (% change)
United States
3.1
2.2
5.7
(1.2)
9.5
6.3
13.0
0.4
Eurozone
2.3
1.4
4.2
(1.3)
8.0
4.8
10.4
(1.7)
Switzerland
1.8
0.3
3.5
(1.8)
6.1
1.7
9.0
(1.6)
Unemployment rate (end-of-period level, %)
United States
3.0
3.9
6.1
10.9
3.0
3.5
7.2
10.8
Eurozone
6.2
7.4
8.7
12.9
6.0
7.2
9.1
15.1
Switzerland
2.3
2.5
3.4
5.2
1.6
2.3
4.2
5.9
Fixed income: 10-year government bonds (change in yields, basis points)
USD
50.0
16.5
259.2
(50.0)
170.0
41.2
329.2
(15.0)
EUR
40.0
11.1
283.8
(35.0)
140.0
34.9
349.3
(25.0)
CHF
50.0
12.1
245.5
(70.0)
150.0
34.4
307.3
(35.0)
Equity indices (% change)
S&P 500
12.0
14.1
(27.0)
(50.2)
35.5
24.7
(21.8)
(40.1)
EuroStoxx 50
16.0
12.3
(23.4)
(57.6)
41.6
20.7
(19.9)
(50.4)
SPI
14.0
12.1
(22.9)
(53.6)
37.9
19.1
(19.6)
(44.2)
Swiss real estate (% change)
Single-Family Homes
5.1
4.4
(4.3)
(17.0)
15.5
7.4
(8.8)
(30.0)
Other real estate (% change)
United States (S&P / Case-Shiller)
10.0
3.5
(2.3)
(9.5)
21.7
7.1
(8.7)
(26.3)
Eurozone (House Price Index)
8.4
5.1
(4.0)
(5.4)
17.8
9.6
(7.6)
(10.8)
471
Note 20 Expected credit loss measurement (continued)
Scenario assumptions
One year
Three years cumulative
31.12.20
Baseline
Severe downside
Baseline
Severe downside
Real GDP growth (% change)
United States
2.7
(5.9)
9.1
(3.8)
Eurozone
2.5
(8.7)
9.9
(10.3)
Switzerland
3.3
(6.6)
9.0
(5.7)
Consumer price index (% change)
United States
1.7
(1.2)
5.5
0.4
Eurozone
1.4
(1.3)
3.9
(1.7)
Switzerland
0.3
(1.8)
0.9
(1.6)
Unemployment rate (end-of-period level, %)
United States
5.5
12.1
4.5
9.9
Eurozone
9.5
14.1
8.0
16.4
Switzerland
3.8
6.1
3.2
6.8
Fixed income: 10-year government bonds (change in yields, basis points)
USD
22.0
(50.0)
46.0
(15.0)
EUR
4.0
(35.0)
21.0
(25.0)
CHF
13.0
(70.0)
31.0
(35.0)
Equity indices (% change)
S&P 500
(2.9)
(50.2)
(1.7)
(40.1)
EuroStoxx 50
3.8
(57.6)
13.5
(50.4)
SPI
(0.8)
(53.6)
5.8
(44.2)
Swiss real estate (% change)
Single-Family Homes
3.4
(17.0)
7.1
(30.0)
Other real estate (% change)
United States (S&P / Case-Shiller)
2.5
(15.3)
9.2
(28.7)
Eurozone (House Price Index)
1.1
(22.9)
7.2
(35.4)
c) Development of ECL allowances and provisions
The ECL allowances and provisions recognized in the period are
impacted by a variety of factors, such as:
–
origination of new instruments during the period;
–
effect of passage of time as the ECLs on an instrument for the
remaining lifetime decrease (all other factors remaining the
same);
–
discount unwind within ECLs as it is measured on a present
value basis;
–
derecognition of instruments in the period;
–
change in individual asset quality of instruments;
–
effect of updating forward-looking scenarios and the
respective weights;
–
movements from a maximum 12-month ECL to the recognition
of lifetime ECLs (and vice versa) following transfers between
stages 1 and 2;
–
movements from stages 1 and 2 to stage 3 (credit-impaired
status) when default has become certain and PD increases to
100% (or vice versa);
–
changes in models or updates to model parameters;
–
write-off; and
–
foreign exchange translations for assets denominated in
foreign currencies and other movements.
Consolidated financial statements | UBS AG consolidated financial statements
472
Note 20 Expected credit loss measurement (continued)
The following table explains the changes in the ECL allowances and provisions for on- and off-balance sheet financial instruments and
credit lines in scope of ECL requirements between the beginning and the end of the period due to the factors listed on the previous
page.
Development of ECL allowances and provisions
USD million
Total
Stage 1
Stage 2
Stage 3
Balance as of 31 December 2020
(1,468)
(306)
(333)
(829)
Net movement from new and derecognized transactions
1
(59)
(72)
13
0
of which: Private clients with mortgages
(7)
(10)
3
0
of which: Real estate financing
(7)
(11)
4
0
of which: Large corporate clients
(13)
(21)
7
0
of which: SME clients
(8)
(8)
0
0
of which: Other
(24)
(23)
(2)
0
(21)
(18)
(4)
0
0
(1)
1
0
Remeasurements with stage transfers
2
(40)
8
0
(49)
of which: Private clients with mortgages
(9)
4
(13)
0
of which: Real estate financing
(3)
1
(4)
0
of which: Large corporate clients
2
(2)
12
(8)
of which: SME clients
(27)
5
4
(36)
of which: Other
(3)
0
2
(4)
2
(1)
3
0
0
1
(1)
0
Remeasurements without stage transfers
3
203
55
74
74
of which: Private clients with mortgages
33
8
26
(1)
of which: Real estate financing
30
13
13
3
of which: Large corporate clients
44
5
21
17
of which: SME clients
53
(1)
1
53
of which: Other
44
29
14
2
27
15
12
0
6
8
1
(3)
Model changes
4
45
29
16
0
Movements with profit or loss impact
5
148
19
104
25
Movements without profit or loss impact (write-off, FX and other)
6
154
5
9
141
Balance as of 31 December 2021
(1,165)
(282)
(220)
(662)
1 Represents the increase and decrease in allowances and provisions resulting from financial instruments (including guarantees and facilities) that were newly originated, purchased or renewed and from the final
derecognition of loans or facilities on their maturity date or earlier. 2 Represents the remeasurement between 12-month and lifetime ECL due to stage transfers. 3 Represents the change in allowances and provisions
related to changes in model inputs or assumptions, including changes in forward -looking macroeconomic conditions, changes in the exposure profile, PD and LGD changes, and unwinding of the time value.
4 Represents the change in the allowances and provisions related to changes in models and methodologies. 5 Includes ECL movements from new and derecognized transactions, remeasurement changes, model and
methodology changes. 6 Represents the decrease in allowances and provisions resulting from write-offs of the ECL allowance against the gross carrying amount when all or part of a financial asset is deemed
uncollectible or forgiven and movements in foreign exchange rates.
In 2021, ECL allowances and provisions decreased by USD
148
million from net credit loss releases impacting profit or loss:
–
a USD
59
transactions that resulted from a USD
72
increase primarily in the corporate lending and real estate
lending portfolio, offset by a USD
13
stage 2 positions, driven by positions that were terminated
before their contractual maturity;
–
a USD
163
that resulted from a USD
203
remeasurements without stage transfers, with approximately
half of that related to corporate lending – another significant
portion related to real estate related lending, primarily due to
the partial release of a post-model adjustment, partially offset
by USD
40
2 into stages 2 and 3, respectively, primarily related to SME
clients; and
–
a USD
45
model changes. An amount of USD
25
Large corporate clients
remainder related to various segments in Personal & Corporate
Banking and Global Wealth Management.
In addition
to the movements im
pacting profit or loss,
allowances decreased by USD
154
137
million of write offs and USD
18
million from foreign exchange
and other movements, both of which did not impact the income
statement.
473
Note 20 Expected credit loss measurement (continued)
Development of ECL allowances and provisions
USD million
Total
Stage 1
Stage 2
Stage 3
Balance as of 31 December 2019
(1,029)
(181)
(160)
(688)
Net movement from new and derecognized transactions
1
(28)
(90)
17
46
of which: Private clients with mortgages
(2)
(3)
2
0
of which: Real estate financing
(3)
(5)
2
0
of which: Large corporate clients
(32)
(29)
(4)
0
of which: SME clients
(16)
(14)
(3)
0
of which: Other
26
(39)
20
46
32
(1)
15
17
9
(1)
9
0
23
(6)
0
29
(20)
(15)
(5)
0
Remeasurements with stage transfers
2
(427)
45
(134)
(338)
of which: Private clients with mortgages
(19)
(2)
(17)
0
of which: Real estate financing
(6)
3
(9)
0
of which: Large corporate clients
(224)
34
(83)
(175)
of which: SME clients
(43)
(1)
(11)
(31)
of which: Other
(134)
11
(14)
(131)
(36)
0
(18)
(19)
(12)
7
(7)
(11)
(36)
0
0
(36)
(59)
0
0
(59)
Remeasurements without stage transfers
3
(271)
(88)
(47)
(136)
of which: Private clients with mortgages
(34)
(19)
(8)
(7)
of which: Real estate financing
(14)
(4)
(11)
1
of which: Large corporate clients
(149)
(53)
(17)
(79)
of which: SME clients
(13)
0
(7)
(6)
of which: Other
(60)
(11)
(4)
(44)
(18)
(12)
(3)
(3)
(3)
6
0
(9)
(12)
0
0
(12)
Model changes
4
32
21
11
0
Movements with profit or loss impact
5
(694)
(112)
(154)
(429)
Movements without profit or loss impact (write-off, FX and other)
6
254
(14)
(19)
287
Balance as of 31 December 2020
(1,468)
(306)
(333)
(829)
1 Represents the increase and decrease in allowances and provisions resulting from financial instruments (including guarantees and facilities) that were newly originated, purchased or renewed and from the final
derecognition of loans or facilities on their maturity date or earlier. 2 Represents the remeasurement between 12-month and lifetime ECL due to stage transfers. 3 Represents the change in allowances and provisions
related to changes in model inputs or assumptions, including changes in forward -looking macroeconomic conditions, changes in the exposure profile, PD and LGD changes, and unwinding of the time value.
4 Represents the change in the allowances and provisions related to changes in models and methodologies. 5 Includes ECL movements from new and derecognized transactions, remeasurement changes, model and
methodology changes. 6 Represents the decrease in allowances and provisions resulting from write-offs of the ECL allowance against the gross carrying amount when all or part of a financial asset is deemed
uncollectible or forgiven and movements in foreign exchange rates.
As explained in Note 1a, the assessment of a significant increase
in credit risk (
SICR
)
considers a number of qualitative and
quantitative factors to determine whether a stage transfer
between stage 1 and stage 2 is required, although the primary
assessment considers changes in PD based on rating analyses and
economic outlook. Additionally, UBS AG takes into consideration
counterparties that have moved to a credit watch list and those
with payments that are at least 30 days past due.
ECL stage 2 ("significant deterioration in credit risk”) allowances / provisions as of 31 December 2021 – classification by trigger
USD million
Stage 2
of which:
PD layer
of which:
watch list
of which:
≥30 days
past due
On-and off-balance sheet
(220)
(158)
(22)
(39)
of which: Private clients with mortgages
(71)
(54)
0
(17)
of which: Real estate financing
(43)
(38)
0
(4)
of which: Large corporate clients
(55)
(40)
(15)
0
of which: SME clients
(30)
(19)
(7)
(4)
of which: Financial intermediaries and hedge funds
(6)
(6)
0
0
of which: Loans to financial advisors
(3)
0
0
(3)
of which: Credit cards
(11)
0
0
(11)
of which: Other
(1)
(1)
0
0
Consolidated financial statements | UBS AG consolidated financial statements
474
Note 20 Expected credit loss measurement (continued)
d) Maximum exposure to credit risk
The tables below provide UBS AG’s maximum exposure to credit
risk for financial instruments subject to ECL requirements and the
respective collateral and other credit enhancements mitigating
credit risk for these classes of financial instruments.
The maximum exposure to credit risk includes the carrying
amounts of financial instruments recognized on the balance sheet
subject to credit risk and the notional amounts for off-balance
sheet arrangements. Where information is available, collateral is
presented at fair value. For other collateral, such as real estate, a
reasonable alternative value is used. Credit enhancements, such
as credit derivative contracts and guarantees, are included at their
notional amounts. Both are capped at the maximum exposure to
credit risk for which they serve as security. The “Risk management
and control” section of this report describes management’s view
of credit risk and the related exposures, which can differ in certain
respects from the requirements of IFRS
.
Maximum exposure to credit risk
31.12.21
Collateral
1,2
Credit enhancements
1
Exposure to
credit risk
after collateral
and credit
enhancements
USD billion
Maximum
exposure to
credit risk
Cash
collateral
received
Collateralized
by securities
Secured by
real estate
Other
collateral
3
Netting
Credit
derivative
contracts
Guarantees
Financial assets measured at
amortized cost on the balance sheet
Cash and balances at central banks
192.8
192.8
Loans and advances to banks
4
15.4
0.1
0.1
15.1
Receivables from securities financing transactions
75.0
0.0
68.0
6.9
0.0
Cash collateral receivables on derivative instruments
5,6
30.5
18.4
12.1
Loans and advances to customers
7
398.7
38.2
128.7
191.3
20.2
4.0
16.4
Other financial assets measured at amortized cost
26.2
0.2
0.1
0.0
1.3
24.7
Total financial assets measured at amortized cost
738.6
38.4
196.9
191.3
28.4
18.4
0.0
4.0
261.1
Financial assets measured at fair value
through other comprehensive income – debt
8.8
8.8
Total maximum exposure to credit risk
reflected on the balance sheet in scope of ECL
747.5
38.4
196.9
191.3
28.4
18.4
0.0
4.0
270.0
Guarantees
8
20.9
1.3
6.5
0.2
2.5
2.3
8.1
Loan commitments
8
39.4
0.5
4.0
2.4
7.3
0.3
1.7
23.1
Forward starting transactions, reverse repurchase
and securities borrowing agreements
1.4
1.4
0.0
Committed unconditionally revocable credit lines
42.3
0.3
9.0
6.2
3.9
0.5
22.5
Total maximum exposure to credit risk not
reflected on the balance sheet, in scope of ECL
104.1
2.2
20.9
8.7
13.7
0.0
0.3
4.5
53.7
31.12.20
Collateral
1,2
Credit enhancements
1
Exposure to
credit risk
after collateral
and credit
enhancements
USD billion
Maximum
exposure to
credit risk
Cash
collateral
received
Collateralized
by securities
Secured by
real estate
Other
collateral
3
Netting
Credit
derivative
contracts
Guarantees
Financial assets measured at
amortized cost on the balance sheet
Cash and balances at central banks
158.2
158.2
Loans and advances to banks
4
15.3
0.1
15.2
Receivables from securities financing transactions
74.2
0.0
67.1
7.0
0.0
Cash collateral receivables on derivative instruments
5,6
32.7
21.1
11.6
Loans and advances to customers
7
381.0
27.0
118.2
194.6
21.7
0.0
4.4
15.1
Other financial assets measured at amortized cost
27.2
0.1
0.2
0.0
1.3
25.5
Total financial assets measured at amortized cost
688.7
27.2
185.7
194.6
30.1
21.1
0.0
4.4
225.6
Financial assets measured at fair value
through other comprehensive income – debt
8.3
8.3
Total maximum exposure to credit risk
reflected on the balance sheet in scope of ECL
697.0
27.2
185.7
194.6
30.1
21.1
0.0
4.4
233.9
Guarantees
8
17.0
0.7
5.0
0.2
1.7
2.5
7.0
Loan commitments
8
41.2
0.0
4.2
2.1
6.8
0.4
2.4
25.3
Forward starting transactions, reverse repurchase
and securities borrowing agreements
3.2
3.2
0.0
Committed unconditionally revocable credit lines
42.0
0.1
10.3
6.2
2.7
0.0
22.7
Total maximum exposure to credit risk not
reflected on the balance sheet, in scope of ECL
103.5
0.8
22.7
8.5
11.2
0.0
0.4
4.9
54.9
1 Of which: USD
1,443
1,983
130
(31 December 2020: USD
154
cash, securities, real estate and other collateral. UBS AG applies a risk-based approach that generally prioritizes collateral according to its liquidity profile. 3 Includes but is not limited to life insurance contracts,
inventory, mortgage loans, gold and other commodities. 4 Loans and advances to banks include amounts held with third-party banks on behalf of clients. The credit risk associated with these balances may be borne
by those clients. 5 Included within Cash collateral receivables on derivative instruments are margin balances due from exchanges or clearing houses. Some of these margin balances reflect amounts transferred on
behalf of clients who retain the associated credit risk. 6 The amount shown in the “Netting” column represents the netting potential not recognized on the balance sheet. Refer to Note 22 for more
information. 7 In 2021, the collateral allocation was updated to reflect additional cash collateral and custody accounts that are also available as security for certain on-balance sheet lending. This resulted in an
increase in loans secured by cash, with an offsetting reduction in loans secured by real estate and loans secured by securities. 8 The amount shown in the “Guarantees” column includes sub-participations.
475
Note 20 Expected credit loss measurement (continued)
e) Financial assets subject to credit risk by rating category
The table below shows the credit quality and the maximum
exposure to credit risk based on the Group’s internal credit rating
system and year-end stage classification. Under IFRS 9, the credit
risk rating reflects the Group’s assessment of the probability of
default of individual counterparties, prior to substitutions. The
amounts presented are gross of impairment allowances.
›
Refer to the “Risk management and control” section of this
report for more details regarding the Group’s internal grading
system
Financial assets subject to credit risk by rating category
USD million
31.12.21
Rating category
1
0–1
2–3
4–5
6–8
9–13
Credit-
impaired
(defaulted)
Total gross
carrying
amount
ECL
allowances
Net carrying
amount
(maximum
exposure to
credit risk)
Financial assets measured at amortized cost
Cash and balances at central banks
191,015
1,802
0
0
0
0
192,817
0
192,817
of which: stage 1
191,015
1,802
0
0
0
0
192,817
0
192,817
Loans and advances to banks
407
12,552
1,123
795
490
1
15,368
(8)
15,360
of which: stage 1
407
12,552
1,098
795
488
0
15,340
(7)
15,333
of which: stage 2
0
0
24
0
2
0
27
(1)
26
of which: stage 3
0
0
0
0
0
1
1
0
1
Receivables from securities financing transactions
34,386
11,267
10,483
17,440
1,439
0
75,014
(2)
75,012
of which: stage 1
34,386
11,267
10,483
17,440
1,439
0
75,014
(2)
75,012
Cash collateral receivables on derivative instruments
7,466
13,476
5,878
3,647
47
0
30,514
0
30,514
of which: stage 1
7,466
13,476
5,878
3,647
47
0
30,514
0
30,514
Loans and advances to customers
5,295
232,663
67,620
70,394
21,423
2,148
399,543
(850)
398,693
of which: stage 1
5,295
231,583
65,083
63,298
16,362
0
381,622
(126)
381,496
of which: stage 2
0
1,080
2,536
7,096
5,061
0
15,773
(152)
15,620
of which: stage 3
0
0
0
0
0
2,148
2,148
(572)
1,577
Other financial assets measured at amortized cost
12,564
6,705
321
6,097
394
264
26,346
(109)
26,236
of which: stage 1
12,564
6,696
307
5,887
317
0
25,772
(27)
25,746
of which: stage 2
0
10
13
209
77
0
309
(7)
302
of which: stage 3
0
0
0
0
0
264
264
(76)
189
Total financial assets measured at amortized cost
251,133
278,465
85,424
98,372
23,793
2,414
739,601
(969)
738,632
On-balance sheet financial instruments
Financial assets measured at FVOCI – debt instruments
3,996
4,771
0
77
0
0
8,844
0
8,844
Total on-balance sheet financial instruments
255,130
283,236
85,424
98,449
23,793
2,414
748,445
(969)
747,477
Off-balance sheet positions subject to expected credit loss by rating category
USD million
31.12.21
Rating category
1
0–1
2–3
4–5
6–8
9–13
Credit-
impaired
(defaulted)
Total off -
balance sheet
exposure
(maximum
exposure to
credit risk)
ECL provisions
Off-balance sheet financial instruments
Guarantees
4,457
7,064
4,535
3,757
1,009
150
20,972
(41)
of which: stage 1
4,457
7,037
4,375
3,075
752
0
19,695
(18)
of which: stage 2
0
27
160
682
258
0
1,127
(8)
of which: stage 3
0
0
0
0
0
150
150
(15)
Irrevocable loan commitments
2,797
14,183
7,651
8,298
6,502
46
39,478
(114)
of which: stage 1
2,797
13,917
7,416
7,127
5,840
0
37,097
(72)
of which: stage 2
0
266
235
1,171
663
0
2,335
(42)
of which: stage 3
0
0
0
0
0
46
46
0
Forward starting reverse repurchase and securities borrowing agreements
0
0
55
1,389
0
0
1,444
0
Total off balance sheet financial instruments
7,254
21,247
12,241
13,444
7,512
196
61,894
(155)
Credit lines
Committed unconditionally revocable credit lines
2,636
16,811
8,627
10,130
4,107
63
42,373
(38)
of which: stage 1
2,636
16,467
8,304
8,724
3,671
0
39,802
(28)
of which: stage 2
0
344
323
1,406
436
0
2,508
(10)
of which: stage 3
0
0
0
0
0
63
63
0
Irrevocable committed prolongation of existing loans
17
2,438
1,422
1,084
602
48
5,611
(3)
of which: stage 1
17
2,438
1,422
1,082
568
0
5,527
(3)
of which: stage 2
0
0
0
1
34
0
36
0
of which: stage 3
0
0
0
0
0
48
48
0
Total credit lines
2,653
19,249
10,049
11,214
4,709
111
47,984
(41)
1 Refer to the “Internal UBS rating scale and mapping of external ratings” table in the “Risk management and control” section of this report for more information on rating categories.
Consolidated financial statements | UBS AG consolidated financial statements
476
Note 20 Expected credit loss measurement (continued)
Financial assets subject to credit risk by rating category
USD million
31.12.20
Rating category
1
0–1
2–3
4–5
6–8
9–13
Credit-
impaired
(defaulted)
Total gross
carrying
amount
ECL
allowances
Net carrying
amount
(maximum
exposure to
credit risk)
Financial assets measured at amortized cost
Cash and balances at central banks
156,250
1,981
0
0
0
0
158,231
0
158,231
of which: stage 1
156,250
1,981
0
0
0
0
158,231
0
158,231
Loans and advances to banks
543
12,029
1,344
1,182
260
1
15,360
(16)
15,344
of which: stage 1
543
11,974
1,277
1,145
231
0
15,170
(9)
15,160
of which: stage 2
0
55
67
37
29
0
189
(5)
184
of which: stage 3
0
0
0
0
0
1
1
(1)
0
Receivables from securities financing transactions
22,998
16,009
15,367
17,995
1,842
0
74,212
(2)
74,210
of which: stage 1
22,998
16,009
15,367
17,995
1,842
0
74,212
(2)
74,210
Cash collateral receivables on derivative instruments
8,196
13,477
7,733
3,243
88
0
32,737
0
32,737
of which: stage 1
8,196
13,477
7,733
3,243
88
0
32,737
0
32,737
Loans and advances to customers
5,813
215,755
67,270
69,217
21,038
2,943
382,036
(1,060)
380,977
of which: stage 1
5,813
214,418
63,000
59,447
15,860
0
358,538
(142)
358,396
of which: stage 2
0
1,338
4,269
9,770
5,178
0
20,556
(215)
20,341
of which: stage 3
0
0
0
0
0
2,943
2,943
(703)
2,240
Other financial assets measured at amortized cost
15,404
4,043
280
6,585
481
560
27,352
(133)
27,219
of which: stage 1
15,404
4,040
269
6,334
389
0
26,435
(34)
26,401
of which: stage 2
0
3
11
251
91
0
357
(9)
348
of which: stage 3
0
0
0
0
0
560
560
(90)
469
Total financial assets measured at amortized cost
209,204
263,295
91,993
98,223
23,709
3,505
689,929
(1,211)
688,717
On-balance sheet financial instruments
Financial assets measured at FVOCI – debt instruments
3,212
5,014
0
32
0
0
8,258
0
8,258
Total on-balance sheet financial instruments
212,417
268,309
91,993
98,255
23,709
3,505
698,187
(1,211)
696,976
Off-balance sheet positions subject to expected credit loss by rating category
USD million
31.12.20
Rating category
1
0–1
2–3
4–5
6–8
9–13
Credit-
impaired
(defaulted)
Total off -
balance sheet
exposure
(maximum
exposure to
credit risk)
ECL provisions
Off-balance sheet financial instruments
Guarantees
3,482
4,623
3,522
4,293
991
170
17,081
(63)
of which: stage 1
3,482
4,219
2,688
3,558
739
0
14,687
(14)
of which: stage 2
0
404
834
736
252
0
2,225
(15)
of which: stage 3
0
0
0
0
0
170
170
(34)
Irrevocable loan commitments
3,018
14,516
8,583
9,302
5,850
104
41,372
(142)
of which: stage 1
3,018
13,589
6,873
8,739
4,676
0
36,894
(74)
of which: stage 2
0
927
1,711
563
1,174
0
4,374
(68)
of which: stage 3
0
0
0
0
0
104
104
0
Forward starting reverse repurchase and securities borrowing agreements
82
150
0
3,015
0
0
3,247
0
Total off balance sheet financial instruments
6,583
19,289
12,105
16,610
6,840
273
61,700
(205)
Credit lines
Committed unconditionally revocable credit lines
574
15,448
5,958
8,488
11,501
108
42,077
(50)
of which: stage 1
574
14,883
4,517
6,609
10,593
0
37,176
(29)
of which: stage 2
0
565
1,441
1,879
908
0
4,792
(21)
of which: stage 3
0
0
0
0
0
108
108
0
Irrevocable committed prolongation of existing loans
14
1,349
931
632
357
0
3,282
(2)
of which: stage 1
14
1,349
930
630
355
0
3,277
(2)
of which: stage 2
0
1
1
2
1
0
5
0
of which: stage 3
0
0
0
0
0
0
0
0
Total credit lines
588
16,797
6,889
9,119
11,858
109
45,359
(52)
1 Refer to the “Internal UBS rating scale and mapping of external ratings” table in the “Risk management and control” section of this report for more information on rating categories.
477
Note 20 Expected credit loss measurement (continued)
f) Sensitivity information
As outlined in Note 1a, ECL estimates involve significant
uncertainties at the time they are made.
ECL model
The models applied to determine point-in-time PD and LGD rely
on market and statistical data, which has been found to
correlate well with historically observed defaults in sufficiently
homogeneous segments. The risk sensitivities for each of the
ECL reporting segments to such factors are summarized in Note
9.
Forward-looking scenarios
Depending on the scenario selection and related macro-economic
assumptions for the risk factors, the components of the relevant
weighted average ECL change. This is particularly relevant for
interest rates, which can move in both directions under a given
growth assumption (for example, low growth with high interest
rates in a stagflation scenario, versus low growth and falling interest
rates in a recession). Management generally looks for scenario
narratives that reflect the key risk drivers of a given credit portfolio.
As forecasting models are complex, due to the combination of
multiple factors, simple what-if analyses involving a change of
individual parameters do not necessarily provide realistic
information on the exposure of segments to changes in the
macroeconomy. Portfolio -specific analyses based on their key risk
factors would also not be meaningful, as potential compensatory
effects in other segments would be ignored. The table below
indicate
s
some sensitivities to ECL
s
if a key macroeconomic
variable for the forecasting period is amended across all scenarios
with all other factors remaining unchanged
.
Potential effect on stage 1 and stage 2 positions from changing key parameters as of 31 December 2021
USD million
Baseline
Upside
Mild downside
Severe downside
Weighted average
Change in key parameters
Fixed income: Government bonds (absolute change)
–0.50%
(1)
0
(29)
(9)
(4)
+0.50%
1
1
39
11
5
+1.00%
4
2
88
23
14
Unemployment rate (absolute change)
–1.00%
(2)
(2)
(30)
(48)
(13)
–0.50%
(1)
(1)
(17)
(27)
(7)
+0.50%
1
1
21
31
8
+1.00%
3
2
47
68
18
Real GDP growth (relative change)
–2.00%
4
2
8
17
10
–1.00%
2
1
4
8
5
+1.00%
(1)
0
(10)
(8)
(4)
+2.00%
(2)
0
(14)
(16)
(7)
House Price Index (relative change)
–5.00%
6
4
50
73
24
–2.50%
3
2
24
34
12
+2.50%
(2)
(1)
(26)
(31)
(11)
+5.00%
(4)
(3)
(46)
(31)
(13)
Equity (S&P500, EuroStoxx, SMI) (relative change)
–10.00%
2
2
5
6
5
–5.00%
1
0
2
3
2
+5.00%
(1)
0
(2)
(3)
(2)
+10.00%
(2)
0
(4)
(6)
(3)
Consolidated financial statements | UBS AG consolidated financial statements
478
Note 20 Expected credit loss measurement (continued)
Sensitivities can be more meaningfully assessed in the context
of coherent scenarios with consistently developed
macroeconomic factors. The table on the previous page outlines
favorable and unfavorable effects, based on reasonably possible
alternative changes to the economic conditions for stage 1 and
stage 2 positions. The ECL impact is calculated for material
portfolios and disclosed for each scenario.
The forecasting horizon is limited to three years, with a
model-based mean reversion of PD and LGD assumed
thereafter. Changes to these timelines may have an effect on
ECLs: depending on the cycle, a longer or shorter forecasting
horizon will lead to different annualized lifetime PD and average
LGD estimations. This is currently not deemed to be material for
UBS AG, as a large proportion of loans, including mortgages in
Switzerland, have
maturities
that
are
within the forecasting
horizon.
Scenario weights
ECL is sensitive to changing scenario weights, in particular if
narratives and parameters are selected that are not close to the
baseline scenario, highlighting the non-linearity of credit losses.
As shown in the table on the bottom of this page, the ECL for
stage 1 and stage 2 positions would have been USD
387
(31 December 2020: USD
442
503
(31
December 2020:
USD
639
determined solely on the baseline scenario. The weighted average
ECL therefore amounts to
130
% (31 December 2020:
145
%) of
the baseline value. The effects of weighting each of the four
scenarios 100% are shown in the table below.
Stage allocation and SICR
The determination of what constitutes a
n
SICR is based on
management judgment, as explained in Note 1a. Changing the
SICR trigger will have a direct effect on ECLs, as more or fewer
positions would be subject to lifetime ECLs under any scenario.
The relevance of the SICR trigger on overall ECL is
demonstrated in the table below with the indication that the ECL
allowances and provisions for stage 1 and stage 2 positions would
have been USD
1,060
the portfolio had been measured for lifetime ECLs irrespective of
their actual SICR status. This amount compares to actual stage 1
and 2 allowances and provisions of USD
503
31 December 2021.
Potential effect on stage 1 and stage 2 positions from changing scenario weights or moving to an ECL lifetime calculation as of 31 December 2021
Actual ECL
allowances and
provisions,
including staging
(as per Note 9)
Pro forma ECL
allowances and
provisions,
assuming all
positions being
subject to lifetime
ECL
Scenarios
Weighted average
100% Baseline
100% Upside
100% Mild
downside
100% Severe
downside
Weighted average
USD million, except where indicated
Segmentation
Private clients with mortgages
(95)
(53)
(52)
(119)
(207)
(277)
Real estate financing
(62)
(50)
(48)
(101)
(97)
(118)
Large corporate clients
(150)
(116)
(107)
(148)
(244)
(257)
SME clients
(65)
(56)
(55)
(71)
(91)
(117)
Other segments
(130)
(112)
(108)
(135)
(166)
(291)
Total
(503)
(387)
(370)
(574)
(806)
(1,060)
Maturity profile
The maturity profile is an important driver for changes in ECL due
to transfers to stage 2 and from stage 2 to stage 1. The current
maturity profile of most lending books is relatively short; hence a
movement to stage 2 may have a moderate effect on ECLs. A
significant portion of our lending to SMEs is documented under
multi-purpose credit agreements, which allow for various forms
of utilization but are unconditionally cancelable by UBS AG at any
time. For drawings under such agreements with a fixed maturity
the respective term is applied for ECL calculations, or a maximum
of 12 months in stage 1. For unused credit lines and all drawings
that have no fixed maturity (e.g., current accounts), UBS AG
generally applies a 12-month maturity from the reporting date,
given the credit review policies, which require either continuous
monitoring of key indicators and behavioral patterns for smaller
positions or an annual formal review for any other limit. The ECLs
for these products are sensitive to shortening or extending the
maturity assumption.
479
Note 21 Fair value measurement
a) Valuation principles
All financial and non-financial assets and liabilities measured or
disclosed at fair value are categorized into one of three fair value
hierarchy levels in accordance with IFRS. The fair value hierarchy
is based on the transparency of inputs to the valuation of an asset
or liability as of the measurement date. In certain cases, the inputs
used to measure fair value may fall within different levels of the
fair value hierarchy. For disclosure purposes, the level in the
hierarchy within which an instrument is classified in its entirety is
based on the lowest level input that is significant to the position’s
fair value measurement:
–
Level 1 – quoted prices (unadjusted) in active markets for
identical assets and liabilities;
–
Level 2 – valuation techniques for which all significant inputs
are, or are based on, observable market data; or
–
Level 3 – valuation techniques for which significant inputs are
not based on observable market data.
Fair values are determined using quoted prices in active
markets for identical assets or liabilities, where available. Where
the market for a financial instrument or non-financial asset or
liability is not active, fair value is established using a valuation
technique, including pricing models. Valuation adjustments may
be made to allow for additional factors, including model, liquidity,
credit and funding risks, which are not explicitly captured within
the valuation technique, but which would nevertheless be
considered by market participants when establishing a price. The
limitations inherent in a particular valuation technique are
considered in the determination of the classification of an asset or
liability within the fair value hierarchy. Generally, the unit of
account for a financial instrument is the individual instrument,
and UBS applies valuation adjustments at an individual instrument
level, consistent with that unit of account. However, if certain
conditions are met, UBS may estimate the fair value of a portfolio
of financial assets and liabilities with substantially similar and
offsetting risk exposures on the basis of the net open risks.
›
Refer to Note 21d for more information
b) Valuation governance
UBS’s fair value measurement and model governance framework
includes numerous controls and other procedural safeguards that
are intended to maximize the quality of fair value measurements
reported in the financial statements. New products and valuation
techniques must be reviewed and approved by key stakeholders
from the risk and finance control functions. Responsibility for the
ongoing measurement of financial and non-financial instruments
at fair value is with the business divisions.
Fair value estimates are validated by the risk and finance
control functions, which are independent of the business
divisions. Independent price verification is performed by Finance
through benchmarking the business divisions’ fair value estimates
with observable market prices and other independent sources. A
governance framework and associated controls are in place in
order to monitor the quality of third -party pricing sources where
used. For instruments where valuation models are used to
determine fair value, independent valuation and model control
groups within Finance and Risk Control evaluate UBS’s models on
a regular basis, including valuation and model input parameters,
as well as pricing. As a result of the valuation controls employed,
valuation adjustments may be made to the business divisions’
estimates of fair value to align with independent market data and
the relevant accounting standard.
›
Refer to Note 21d for more information
Consolidated financial statements | UBS AG consolidated financial statements
480
Note 21 Fair value measurement (continued)
c) Fair value hierarchy
The table below provides the fair value hierarchy classification of
financial and non-financial assets and liabilities measured at fair
value. The narrative that follows describes valuation techniques
used in measuring their fair value of different product types
(including significant valuation inputs and assumptions used), and
the factors considered in determining their classification within
the fair value hierarchy.
Determination of fair values from quoted market prices or valuation techniques
1
31.12.21
31.12.20
USD million
Level 1
Level 2
Level 3
Total
Level 1
Level 2
Level 3
Total
Financial assets measured at fair value on a recurring basis
Financial assets at fair value held for trading
113,722
15,012
2,299
131,033
107,526
15,630
2,337
125,492
of which:
Equity instruments
97,983
1,090
149
99,222
90,327
1,101
171
91,599
Government bills / bonds
7,135
1,351
10
8,496
9,028
2,207
10
11,245
Investment fund units
7,843
1,364
21
9,229
7,374
1,794
23
9,192
Corporate and municipal bonds
708
7,791
556
9,055
789
8,432
817
10,038
Loans
0
3,099
1,443
4,542
0
1,860
1,134
2,995
Asset-backed securities
53
317
120
489
8
236
181
425
Derivative financial instruments
522
116,482
1,140
118,145
795
157,069
1,754
159,618
of which:
Foreign exchange contracts
255
53,046
7
53,307
319
68,425
5
68,750
Interest rate contracts
0
32,747
494
33,241
0
50,353
537
50,890
Equity / index contracts
0
27,861
384
28,245
0
33,990
853
34,842
Credit derivative contracts
0
1,179
236
1,414
0
2,008
350
2,358
Commodity contracts
0
1,590
16
1,606
0
2,211
6
2,217
Brokerage receivables
0
21,839
0
21,839
0
24,659
0
24,659
Financial assets at fair value not held for trading
2
27,278
28,185
4,180
59,642
40,986
35,110
3,942
80,038
of which:
Financial assets for unit-linked investment contracts
21,110
187
6
21,303
20,628
101
2
20,731
Corporate and municipal bonds
123
13,937
306
14,366
290
16,957
372
17,619
Government bills / bonds
5,624
3,236
0
8,860
19,704
3,593
0
23,297
Loans
0
4,982
892
5,874
0
7,699
862
8,561
Securities financing transactions
0
5,704
100
5,804
0
6,629
122
6,751
Auction rate securities
0
0
1,585
1,585
0
0
1,527
1,527
Investment fund units
338
137
117
591
278
121
105
505
Equity instruments
83
2
681
765
86
0
544
631
Other
0
0
495
495
0
10
408
418
Financial assets measured at fair value through other comprehensive income on a recurring basis
Financial assets measured at fair value through other comprehensive income
2
2,704
6,140
0
8,844
1,144
7,114
0
8,258
of which:
Asset-backed securities
0
4,849
0
4,849
0
6,624
0
6,624
Government bills / bonds
2,658
27
0
2,686
1,103
47
0
1,150
Corporate and municipal bonds
45
1,265
0
1,310
40
444
0
485
Non-financial assets measured at fair value on a recurring basis
Precious metals and other physical commodities
5,258
0
0
5,258
6,264
0
0
6,264
Non-financial assets measured at fair value on a non-recurring basis
Other non-financial assets
3
0
0
26
26
0
1
245
246
Total assets measured at fair value
149,484
187,658
7,645
344,787
156,716
239,583
8,278
404,576
481
Note 21 Fair value measurement (continued)
Determination of fair values from quoted market prices or valuation techniques (continued)
1
31.12.21
31.12.20
USD million
Level 1
Level 2
Level 3
Total
Level 1
Level 2
Level 3
Total
Financial liabilities measured at fair value on a recurring basis
Financial liabilities at fair value held for trading
25,413
6,170
105
31,688
26,889
6,652
55
33,595
of which:
Equity instruments
18,328
513
83
18,924
22,519
425
40
22,985
Corporate and municipal bonds
30
4,219
17
4,266
31
4,048
9
4,089
Government bills / bonds
5,883
826
0
6,709
3,642
1,036
0
4,678
Investment fund units
1,172
555
6
1,733
696
1,127
5
1,828
Derivative financial instruments
509
118,558
2,242
121,309
746
156,884
3,471
161,102
of which:
Foreign exchange contracts
258
53,800
21
54,078
316
70,149
61
70,527
Interest rate contracts
0
28,398
278
28,675
0
43,389
527
43,916
Equity / index contracts
0
33,438
1,511
34,949
0
38,870
2,306
41,176
Credit derivative contracts
0
1,412
341
1,753
0
2,403
528
2,931
Commodity contracts
0
1,503
63
1,566
0
2,003
24
2,027
Financial liabilities designated at fair value on a recurring basis
Brokerage payables designated at fair value
0
44,045
0
44,045
0
38,742
0
38,742
Debt issued designated at fair value
2
0
59,606
11,854
71,460
0
50,273
9,595
59,868
Other financial liabilities designated at fair value
2
0
29,258
3,156
32,414
0
29,682
2,091
31,773
of which:
Financial liabilities related to unit-linked investment contracts
0
21,466
0
21,466
0
20,975
0
20,975
Securities financing transactions
0
6,375
2
6,377
0
7,317
0
7,317
Over-the-counter debt instruments
0
1,334
794
2,128
0
1,363
697
2,060
Total liabilities measured at fair value
25,922
257,637
17,357
300,916
27,635
282,233
15,212
325,080
1 Bifurcated embedded derivatives are presented on the same balance sheet lines as their host contracts and are not included in this table. The fair value of these derivatives was not material for the periods presented.
2 As of 31 December 2021, USD
16
20
8
8
fair value through other comprehensive income, USD
33
15
3
3
liabilities designated at fair value are expected to be recovered or settled after 12 months. 3 Other non-financial assets primarily consist of properties and other non-current assets held for sale, which are measured
at the lower of their net carrying amount or fair value less costs to sell.
Consolidated financial statements | UBS AG consolidated financial statements
482
Note 21 Fair value measurement (continued)
Valuation techniques
UBS uses widely recognized valuation techniques for determining
the fair value of financial and non-financial instruments that are
not actively traded and quoted. The most frequently applied
valuation techniques include discounted value of expected cash
flows, relative value and option pricing methodologies.
Discounted value of expected cash flows is a valuation
technique that measures fair value using estimated expected
future cash flows from assets or liabilities and then discounts
these cash flows using a discount rate or discount margin that
reflects the credit and / or funding spreads required by the market
for instruments with similar risk and liquidity profiles to produce a
present value. When using such valuation techniques, expected
future cash flows are estimated using an observed or implied
market price for the future cash flows or by using industry-
standard cash flow projection models. The discount factors within
the calculation are generated using industry-standard yield curve
modeling techniques and models.
Relative value models measure fair value based on the market
prices of equivalent or comparable assets or liabilities, making
adjustments for differences between the characteristics of the
observed instrument and the instrument being valued.
Option pricing models incorporate assumptions regarding the
behavior of future price movements of an underlying referenced
asset or assets to generate a probability-weighted future expected
payoff for the option. The resulting probability-weighted expected
payoff is then discounted using discount factors generated from
industry-standard yield curve modeling techniques and models.
The option pricing model may be implemented using a closed-
form analytical formula or other mathematical techniques (e.g.,
binomial tree or Monte Carlo simulation).
Where available, valuation techniques use market-observable
assumptions and inputs. If such data is not available, inputs may
be derived by reference to similar assets in active markets, from
recent prices for comparable transactions or from other
observable market data. In such cases, the inputs selected are
based on historical experience and practice for similar or
analogous instruments, derivation of input levels based on similar
products with observable price levels, and knowledge of current
market conditions and valuation approaches.
For more complex instruments, fair values may be estimated
using a combination of observed transaction prices, consensus
pricing services and relevant quotes. Consideration is given to the
nature of the quotes (e.g., indicative or firm) and the relationship of
recently evidenced market activity to the prices provided by
consensus pricing services. UBS also uses internally developed
models, which are typically based on valuation methods and
techniques recognized as standard within the industry. Assumptions
and inputs used in valuation techniques include benchmark interest
rate curves, credit and funding spreads used in estimating discount
rates, bond and equity prices, equity index prices, foreign exchange
rates, levels of market volatility and correlation. Refer to Note 21f
for more information. The discount curves used by UBS incorporate
the funding and credit characteristics of the instruments to which
they are applied.
Financial instruments excluding derivatives: valuation and classification in the fair value hierarchy
Product
Valuation and classification in the fair value hierarchy
Government bills
and bonds
Valuation
–
Generally valued using prices obtained directly from the market.
–
Instruments not priced directly using active-market data are valued using discounted cash flow valuation
techniques that incorporate market data for similar government instruments.
Fair value hierarchy
–
Generally traded in active markets with prices that can be obtained directly from these markets, resulting
in classification as Level 1, while the remaining positions are classified as Level 2 and Level 3.
Corporate and
municipal bonds
Valuation
–
Generally valued using prices obtained directly from the market for the security, or similar securities,
adjusted for seniority, maturity and liquidity.
–
When prices are not available, instruments are valued using discounted cash flow valuation techniques
incorporating the credit spread of the issuer or similar issuers.
–
For convertible bonds without directly comparable prices, issuances may be priced using a convertible bond
model.
Fair value hierarchy
–
Generally classified as Level 1 or Level 2, depending on the depth of trading activity behind price sources.
–
Level 3 instruments have no suitable pricing information available.
Traded loans and
loans measured at
fair value
Valuation
–
Valued directly using market prices that reflect recent transactions or quoted dealer prices, where available.
–
Where no market price data is available, loans are valued by relative value benchmarking using pricing
derived from debt instruments in comparable entities or different products in the same entity, or by using
a credit default swap valuation technique, which requires inputs for credit spreads, credit recovery rates
and interest rates. Recently originated commercial real estate loans are measured using a securitization
approach based on rating agency guidelines.
Fair value hierarchy
–
Instruments with suitably deep and liquid pricing information are classified as Level 2.
–
Positions requiring the use of valuation techniques, or for which the price sources have insufficient trading
depth, are classified as Level 3.
483
Note 21 Fair value measurement (continued)
Product
Valuation and classification in the fair value hierarchy
Investment fund
units
Valuation
–
Predominantly exchange-traded, with readily available quoted prices in liquid markets.
–
Where market prices are not available, fair value may be measured using net asset values (NAVs).
Fair value hierarchy
–
Listed units are classified as Level 1, provided there is sufficient trading activity to justify active-market
classification, while other positions are classified as Level 2.
–
Positions for which NAVs are not available are classified as Level 3.
Asset-backed
securities (ABS)
Valuation
–
For liquid securities, the valuation process will use trade and price data, updated for movements in market
levels between the time of trading and the time of valuation. Less liquid instruments are measured using
discounted expected cash flows incorporating price data for instruments or indices with similar risk profiles.
Fair value hierarchy
–
Residential mortgage
-
backed securities
,
commercial
mortgage
-
backed securities
and other ABS are
generally classified as Level 2. However, if significant inputs are unobservable, or if market or fundamental
data is not available, they are classified as Level 3.
Auction rate
securities (ARS)
Valuation
–
ARS are valued utilizing a discounted cash flow methodology. The model captures interest rate risk
emanating from the note coupon, credit risk attributable to the underlying closed-end fund investments,
liquidity risk as a function of the level of trading volume in these positions, and extension risk, as ARS are
perpetual instruments that require an assumption regarding their maturity or issuer redemption date.
Fair value hierarchy
–
Granular and liquid pricing information is generally not available for ARS. As a result, these securities are
classified as Level 3.
Equity instruments
Valuation
–
Listed equity instruments are generally valued using prices obtained directly from the market.
–
Unlisted equity holdings, including private equity positions, are initially marked at their transaction price
and are revalued when reliable evidence of price movement becomes available or when the position is
deemed to be impaired.
Fair value hierarchy
–
The majority of equity securities are actively traded on public stock exchanges where quoted prices are
readily and regularly available, resulting in Level 1 classification.
Financial assets for
unit-linked
investment
contracts
Valuation
–
The majority of assets are listed on exchanges and fair values are determined using quoted prices.
Fair value hierarchy
–
Most assets are classified as Level 1 if actively traded, or Level 2 if trading is not active.
–
Instruments for which prices are not readily available are classified as Level 3.
Securities financing
transactions
Valuation
–
These instruments are valued using discounted expected cash flow techniques. The discount rate applied
is based on funding curves that are relevant to the collateral eligibility terms.
Fair value hierarchy
–
Collateral funding curves for these instruments are generally observable and, as a result, these positions
are classified as Level 2.
–
Where the collateral terms are non-standard, the funding curve may be considered unobservable and these
positions are classified as Level 3.
Brokerage
receivables and
payables
Valuation
–
Fair value is determined based on the value of the underlying balances.
Fair value hierarchy
–
Due to their on-demand nature, these receivables and payables are deemed as Level 2.
Amounts due under
unit-linked
investment
contracts
Valuation
–
The fair values of investment contract liabilities are determined by reference to the fair value of the
corresponding assets.
Fair value hierarchy
–
The liabilities themselves are not actively traded, but are mainly referenced to instruments that are actively
traded and are therefore classified as Level 2.
Consolidated financial statements | UBS AG consolidated financial statements
484
Note 21 Fair value measurement (continued)
Derivative instruments: valuation and classification in the
fair value hierarchy
The curves used for discounting expected cash flows in the
valuation of collateralized derivatives reflect the funding terms
associated with the relevant collateral arrangement for the
instrument being valued. These collateral arrangements differ
across counterparties with respect to the eligible currency and
interest terms of the collateral. The majority of collateralized
derivatives are measured using a discount curve based on funding
rates derived from overnight interest in the cheapest eligible
currency for the respective counterparty collateral agreement.
Uncollateralized and partially collateralized derivatives are
discounted using the alternative reference rate (the ARR) (or
equivalent) curve for the currency of the instrument. As described
in Note
2
1
d
,
the fair value of uncollateralized and partially
collateralized derivatives is then adjusted by credit valuation
adjustments (
CVA
s)
,
debit valuation adjustments (
DVA
s)
and
funding valuation adjustments (FVAs), as applicable, to reflect an
estimation of the effect of counterparty credit risk, UBS’s own
credit risk, and funding costs and benefits.
›
Refer to Note 10 for more information about derivative
instruments
Derivative product
Valuation and classification in the fair value hierarchy
Interest rate
contracts
Valuation
–
Interest rate swap contracts are valued by estimating future interest cash flows and discounting those cash
flows using a rate that reflects the appropriate funding rate for the position being measured. The yield
curves used to estimate future index levels and discount rates are generated using market-standard yield
curve models using interest rates associated with current market activity. The key inputs to the models are
interest rate swap rates, forward rate agreement rates, short-term interest rate futures prices, basis swap
spreads and inflation swap rates.
–
Interest rate option contracts are valued using various market-standard option models, using inputs that
include interest rate yield curves, inflation curves, volatilities and correlations.
–
When the maturity of an interest rate swap or option contract exceeds the term for which standard market
quotes are observable for a significant input parameter, the contracts are valued by extrapolation from the
last observable point using standard assumptions or by reference to another observable comparable input
parameter to represent a suitable proxy for that portion of the term.
Fair value hierarchy
–
The majority of interest rate swaps are classified as Level 2 as the standard market contracts that form the
inputs for yield curve models are generally traded in active and observable markets.
–
Options are generally treated as Level 2 as the calibration process enables the model output to be validated
to active-market levels. Models calibrated in this way are then used to revalue the portfolio of both standard
options and more exotic products.
–
Interest rate swap or option contracts are classified as Level 3 when the terms exceed standard market-
observable quotes.
–
Exotic options for which appropriate volatility or correlation input levels cannot be implied from observable
market data are classified as Level 3.
Credit derivative
contracts
Valuation
–
Credit derivative contracts are valued using industry-standard models based primarily on market credit
spreads, upfront pricing points and implied recovery rates. Where a derivative credit spread is not directly
available, it may be derived from the price of the reference cash bond.
–
Asset-backed credit derivatives are valued using a valuation technique similar to that of the underlying
security with an adjustment to reflect the funding differences between cash and synthetic form.
Fair value hierarchy
–
Single-entity and portfolio credit derivative contracts are classified as Level 2 when credit spreads and
recovery rates are determined from actively traded observable market data. Where the underlying reference
name(s) are not actively traded and the correlation cannot be directly mapped to actively traded tranche
instruments, these contracts are classified as Level 3.
–
Asset-backed credit derivatives follow the characteristics of the underlying security and are therefore
distributed across Level 2 and Level 3.
485
Note 21 Fair value measurement (continued)
Derivative product
Valuation and classification in the fair value hierarchy
Foreign exchange
contracts
Valuation
–
Open spot foreign exchange (FX) contracts are valued using the FX spot rate observed in the market.
–
Forward FX contracts are valued using the FX spot rate adjusted for forward pricing points observed from
standard market-based sources.
–
Over-the-counter (OTC) FX option contracts are valued using market-standard option valuation models.
The models used for shorter-dated options (i.e., maturities of five years or less) tend to be different than
those used for longer-dated options because the models needed for longer-dated OTC FX contracts require
additional consideration of interest rate and FX rate interdependency.
–
The valuation for multi-dimensional FX options uses a multi-local volatility model, which is calibrated to the
observed FX volatilities for all relevant FX pairs.
Fair value hierarchy
–
The markets for FX spot and FX forward pricing points are both actively traded and observable and
therefore such FX contracts are generally classified as Level 2.
–
A significant proportion of OTC FX option contracts are classified as Level 2 as inputs are derived mostly
from standard market contracts traded in active and observable markets.
–
OTC FX option contracts classified as Level 3 include multi-dimensional FX options and long-dated FX exotic
option contracts where there is no active market from which to derive volatility or correlation inputs.
Equity / index
contracts
Valuation
–
Equity forward contracts have a single stock or index underlying and are valued using market-standard
models. The key inputs to the models are stock prices, estimated dividend rates and equity funding rates
(which are implied from prices of forward contracts observed in the market). Estimated cash flows are then
discounted using market-standard discounted cash flow models using a rate that reflects the appropriate
funding rate for that portion of the portfolio. When no market data is available for the instrument maturity,
they are valued by extrapolation of available data, use of historical dividend data, or use of data for a
related equity.
–
Equity option contracts are valued using market-standard models that estimate the equity forward level as
described for equity forward contracts and incorporate inputs for stock volatility and for correlation
between stocks within a basket. The probability-weighted expected option payoff generated is then
discounted using market-standard discounted cash flow models applying a rate that reflects the
appropriate funding rate for that portion of the portfolio. When volatility, forward or correlation inputs are
not available, they are valued using extrapolation of available data, historical dividend, correlation or
volatility data, or the equivalent data for a related equity.
Fair value hierarchy
–
As inputs are derived mostly from standard market contracts traded in active and observable markets, a
significant proportion of equity forward contracts are classified as Level 2.
–
Equity option positions for which inputs are derived from standard market contracts traded in active and
observable markets are also classified as Level 2. Level 3 positions are those for which volatility, forward or
correlation inputs are not observable.
Commodity
contracts
Valuation
–
Commodity forward and swap contracts are measured using market-standard models that use market
forward levels on standard instruments.
–
Commodity option contracts are measured using market-standard option models that estimate the
commodity forward level as described for commodity forward and swap contracts, incorporating inputs
for the volatility of the underlying index or commodity. For commodity options on baskets of commodities
or bespoke commodity indices, the valuation technique also incorporates inputs for the correlation
between different commodities or commodity indices.
Fair value hierarchy
–
Individual commodity contracts are typically classified as Level 2, because active forward and volatility
market data is available.
Consolidated financial statements | UBS AG consolidated financial statements
486
Note 21 Fair value measurement (continued)
d) Valuation adjustments and other items
The output of a valuation technique is always an estimate of a
fair value that cannot be measured with complete certainty. As a
result, valuations are adjusted, where appropriate and when such
factors would be considered by market participants in estimating
fair value, to reflect close-out costs, credit exposure, model-driven
valuation uncertainty, funding costs and benefits, trading
restrictions and other factors.
The table below summarizes the valuation adjustment reserves
recognized on the balance sheet. Details about each category are
provided further below.
Valuation adjustment reserves on the balance sheet
As of
Life-to-date gain / (loss), USD million
31.12.21
31.12.20
31.12.19
Deferred day-1 profit or loss reserves
418
269
146
Own credit adjustments on financial liabilities designated at fair value
(315)
(381)
(88)
CVAs, FVAs, DVAs and other valuation adjustments
(1,004)
(959)
(706)
Deferred day-1 profit or loss reserves
For new transactions where the valuation technique used to
measure fair value requires significant inputs that are not based
on observable market data, the financial instrument is initially
recognized at the transaction price. The transaction price may
differ from the fair value obtained using a valuation technique,
where any such difference is deferred and not initially recognized
in the income statement.
Deferred day-1 profit or loss is generally released into
Other
net income from financial instruments measured at fair value
through profit or loss
underlying parameters become
s
observable or when the
transaction is closed out.
The table below summarizes the changes in deferred day-1
profit or loss reserves during the respective period.
Deferred day-1 profit or loss reserves
USD million
2021
2020
2019
Reserve balance at the beginning of the year
269
146
255
Profit / (loss) deferred on new transactions
459
362
171
(Profit) / loss recognized in the income statement
(308)
(238)
(278)
Foreign currency translation
(2)
0
(2)
Reserve balance at the end of the year
418
269
146
Own credit
Own credit risk is reflected in the valuation of UBS’s fair value
option liabilities where this component is considered relevant for
valuation purposes by UBS’s counterparties and other market
participants.
Changes in the fair value of financial liabilities designated at
fair value through profit or loss related to own credit are
recognized in
Other comprehensive income
directly within
Retained earnings,
with no reclassification to the income
statement in future periods. This presentation does not create or
increase an accounting mismatch in the income statement, as UBS
does not hedge changes in own credit
.
Own credit is estimated using own credit adjustment (OCA)
curves, which incorporate observable market data, including
market-observed secondary prices for UBS’s debt, UBS’s credit
default swap spreads and debt curves of peers. In the table below,
the change in unrealized own credit consists of changes in fair
value that are attributable to the change in UBS’s credit spreads,
as well as the effect of changes in fair values attributable to factors
other than credit spreads, such as redemptions, effects from time
decay and changes in interest and other market rates. Realized
own credit is recognized when an instrument with an associated
unrealized OCA is repurchased prior to the contractual maturity
date. Life-to-date amounts reflect the cumulative unrealized
change since initial recognition.
›
Refer to Note 16 for more information about debt issued
designated at fair value
487
Note 21 Fair value measurement (continued)
Own credit adjustments on financial liabilities designated at fair value
Included in Other comprehensive income
For the year ended
USD million
31.12.21
31.12.20
31.12.19
Recognized during the period:
Realized gain / (loss)
(14)
2
8
Unrealized gain / (loss)
60
(295)
(408)
Total gain / (loss), before tax
46
(293)
(400)
As of
USD million
31.12.21
31.12.20
31.12.19
Recognized on the balance sheet as of the end of the period:
Unrealized life-to-date gain / (loss)
(315)
(381)
(88)
Credit valuation adjustments
In order to measure the fair value of OTC derivative instruments,
including funded derivative instruments that are classified as
Financial assets at fair value not held for trading,
to reflect the credit risk of the counterparty inherent in these
instruments. This amount represents the estimated fair value of
protection required to hedge the counterparty credit risk of such
instruments. A CVA is determined for each counterparty,
considering all exposures with that counterparty, and is
dependent on the expected future value of exposures, default
probabilities and recovery rates, applicable collateral or netting
arrangements, break clauses, funding spreads and other
contractual factors.
Funding valuation adjustments
FVAs reflect the costs and benefits of funding associated with
uncollateralized and partially collateralized derivative receivables
and payables and are calculated as the valuation effect from
moving the discounting of the uncollateralized derivative cash
flows from the ARR to OCA using the CVA framework, including
the probability of counterparty default. An FVA is also applied to
collateralized derivative assets in cases where the collateral cannot
be sold or repledged.
Debit valuation adjustments
A DVA is estimated to incorporate own credit in the valuation of
derivatives where an FVA is not already recognized. The DVA
calculation is effectively consistent with the CVA framework,
being determined for each counterparty, considering all
exposures with that counterparty and taking into account
collateral netting agreements, expected future mark-to-market
movements and UBS’s credit default spreads.
Other valuation adjustments
Instruments that are measured as part of a portfolio of combined
long and short positions are valued at mid-market levels to ensure
consistent valuation of the long- and short-component risks. A
liquidity valuation adjustment is then made to the overall net long
or short exposure to move the fair value to bid or offer as
appropriate, reflecting current levels of market liquidity. The bid–
offer spreads used in the calculation of this valuation adjustment
are obtained from market transactions and other relevant sources
and are updated periodically.
Uncertainties associated with the use of model-based
valuations are incorporated into the measurement of fair value
through the use of model reserves. These reserves reflect the
amounts that UBS estimates should be deducted from valuations
produced directly by models to incorporate uncertainties in the
relevant modeling assumptions, in the model and market inputs
used, or in the calibration of the model output to adjust for
known model deficiencies. In arriving at these estimates, UBS
considers a range of market practices, including how it believes
market participants would assess these uncertainties. Model
reserves are reassessed periodically in light of data from market
transactions, consensus pricing services and other relevant
sources.
Other items
In the first half of 2021, UBS AG incurred a loss of USD
861
as a result of closing out a significant portfolio of swaps with a
US-based client of its prime brokerage business and the
unwinding of related hedges, following the client’s default. This
loss is presented within
Other net income from financial
instruments measured at fair value through profit or loss
.
Valuation adjustments on financial instruments
As of
Life-to-date gain / (loss), USD million
31.12.21
31.12.20
Credit valuation adjustments
1
(44)
(66)
Funding valuation adjustments
(49)
(73)
Debit valuation adjustments
2
0
Other valuation adjustments
(913)
(820)
of which: liquidity
(341)
(340)
of which: model uncertainty
(571)
(479)
1 Amounts do not include reserves against defaulted counterparties.
Consolidated financial statements | UBS AG consolidated financial statements
488
Note 21 Fair value measurement (continued)
e) Transfers between Level 1 and Level 2
Assets and liabilities transferred from Level 2 to Level 1 during 2021 were not material. Assets and liabilities transferred from Level 1
to Level 2 during 2021 were also not material.
f) Level 3 instruments: valuation techniques and inputs
The table below presents material Level 3 assets and liabilities,
together with the valuation techniques used to measure fair
value, the inputs used in a given valuation technique that are
considered significant as of 31 December 2021 and unobservable,
and a range of values for those unobservable inputs.
The range of values represents the highest- and lowest-level
inputs used in the valuation techniques. Therefore, the range does
not reflect the level of uncertainty regarding a particular input or
an assessment of the reasonableness of UBS’s estimates and
assumptions, but rather the different underlying characteristics of
the relevant assets and liabilities held by UBS. The ranges will
therefore vary from period to period and parameter to parameter
based on characteristics of the instruments held at each balance
sheet date. Furthermore, the ranges of unobservable inputs may
differ across other financial institutions, reflecting the diversity of
the products in each firm’s inventory.
Valuation techniques and inputs used in the fair value measurement of Level 3 assets and liabilities
Fair value
Significant
unobservable
input(s)
1
Range of inputs
Assets
Liabilities
Valuation
technique(s)
31.12.21
31.12.20
USD billion
31.12.21
31.12.20
31.12.21
31.12.20
low
high
weighted
average
2
low
high
weighted
average
2
unit
1
Financial assets and liabilities at fair value held for trading and Financial assets at fair value not held for trading
Corporate and municipal
bonds
0.9
1.2
0.0
0.0
Relative value to
market comparable
Bond price equivalent
16
143
98
1
143
100
points
Discounted expected
cash flows
Discount margin
434
434
268
268
basis
points
Traded loans, loans
measured at fair value,
loan commitments and
guarantees
2.8
2.4
0.0
0.0
Relative value to
market comparable
Loan price equivalent
0
101
99
0
101
99
points
Discounted expected
cash flows
Credit spread
175
800
436
190
800
398
basis
points
Market comparable
and securitization
model
Credit spread
28
1,544
241
40
1,858
333
basis
points
Auction rate securities
1.6
1.5
Discounted expected
cash flows
Credit spread
115
197
153
100
188
140
basis
points
Investment fund units
3
0.1
0.1
0.0
0.0
Relative value to
market comparable
Net asset value
Equity instruments
3
0.8
0.7
0.1
0.0
Relative value to
market comparable
Price
Debt issued designated at
fair value
4
11.9
9.6
Other financial liabilities
designated at fair value
3.2
2.1
Discounted expected
cash flows
Funding spread
24
175
42
175
basis
points
Derivative financial instruments
Interest rate contracts
0.5
0.5
0.3
0.5
Option model
Volatility of interest
rates
65
81
29
69
basis
points
Credit derivative contracts
0.2
0.3
0.3
0.5
Discounted expected
cash flows
Credit spreads
1
583
1
489
basis
points
Bond price equivalent
2
136
0
100
points
Equity / index contracts
0.4
0.9
1.5
2.3
Option model
Equity dividend yields
0
11
0
13
%
Volatility of equity
stocks, equity and
other indices
4
98
4
100
%
Equity-to-FX
correlation
(29)
76
(34)
65
%
Equity-to-equity
correlation
(25)
100
(16)
100
%
1 The ranges of significant unobservable inputs are represented in points, percentages and basis points. Points are a percentage of par (e.g., 100 points would be 100% of par). 2 Weighted averages are provided
for most non-derivative financial instruments and were calculated by weighting inputs based on the fair values of the respective instruments. Weighted averages are not provided for inputs related to Other financial
liabilities designated at fair value and Derivative financial instruments, as this would not be meaningful. 3 The range of inputs is not disclosed, as there is a dispersion of values given the diverse nature of the
investments. 4 Debt issued designated at fair value primarily consists of UBS structured notes, which include variable maturity notes with various equity and foreign exchange underlying risks, rates-linked and credit-
linked notes, all of which have embedded derivative parameters that are considered to be unobservable. The equivalent derivative instrument parameters are presented in the respective derivative financial instruments
lines in this table.
489
Note 21 Fair value measurement (continued)
Significant unobservable inputs in Level 3 positions
This section discusses the significant unobservable inputs used in the valuation of Level 3 instruments and assesses the potential effect
that a change in each unobservable input in isolation may have on a fair value measurement. Relationships between observable and
unobservable inputs have not been included in the summary below.
Input
Description
Bond price equivalent
–
Where market prices are not available for a bond, fair value is measured by comparison with observable pricing data from
similar instruments. Factors considered when selecting comparable instruments include credit quality, maturity and industry of
the issuer. Fair value may be measured either by a direct price comparison or by conversion of an instrument price into a yield
(either as an outright yield or as a spread to the relevant benchmark rate).
–
For corporate and municipal bonds, the range represents the range of prices from reference issuances used in determining fair
value. Bonds priced at 0 are distressed to the point that no recovery is expected, while prices significantly in excess of 100 or
par relate to inflation-linked or structured issuances that pay a coupon in excess of the market benchmark as of the
measurement date.
–
For credit derivatives, the bond price range represents the range of prices used for reference instruments, which are typically
converted to an equivalent yield or credit spread as part of the valuation process.
Loan price equivalent
–
Where market prices are not available for a traded loan, fair value is measured by comparison with observable pricing data for
similar instruments. Factors considered when selecting comparable instruments include industry segment, collateral quality,
maturity and issuer-specific covenants. Fair value may be measured either by a direct price comparison or by conversion of an
instrument price into a yield. The range represents the range of prices derived from reference issuances of a similar credit quality
used to measure fair value for loans classified as Level 3. Loans priced at 0 are distressed to the point that no recovery is
expected, while a current price of 100 represents a loan that is expected to be repaid in full.
Credit spread
–
Valuation models for many credit derivatives require an input for the credit spread, which is a reflection of the credit quality of
the associated referenced underlying. The credit spread of a particular security is quoted in relation to the yield on a benchmark
security or reference rate, typically either US Treasury or ARR, and is generally expressed in terms of basis points. An increase /
(decrease) in credit spread will increase / (decrease) the value of credit protection offered by credit default swaps and other
credit derivative products. The income statement effect from such changes depends on the nature and direction of the positions
held. Credit spreads may be negative where the asset is more creditworthy than the benchmark against which the spread is
calculated. A wider credit spread represents decreasing creditworthiness. The range represents a diverse set of underlyings,
with the lower end of the range representing credits of the highest quality and the upper end of the range representing greater
levels of credit risk.
Discount margin
–
The discount margin (DM) spread represents the discount rates applied to present value cash flows of an asset to reflect the
market return required for uncertainty in the estimated cash flows. DM spreads are a rate or rates applied on top of a floating
index (e.g., Secured Overnight Financing Rate (SOFR)) to discount expected cash flows. Generally, a decrease / (increase) in the
DM in isolation would result in a higher / (lower) fair value.
–
The high end of the range relates to securities that are priced low within the market relative to the expected cash flow schedule.
This indicates that the market is pricing an increased risk of credit loss into the security that is greater than what is being
captured by the expected cash flow generation process. The low e nds of the ranges are typical of funding rates on better-
quality instruments.
Funding spread
–
Structured financing transactions are valued using synthetic funding curves that best represent the assets that are pledged as
collateral for the transactions. They are not representative of where UBS can fund itself on an unsecured basis, but provide an
estimate of where UBS can source and deploy secured funding with counterparties for a given type of collateral. The funding
spreads are expressed in terms of basis points, and if funding spreads widen, this increases the effect of discounting.
–
A small proportion of structured debt instruments and non-structured fixed-rate bonds within financial liabilities designated at
fair value had an exposure to funding spreads that was longer in duration than the actively traded market.
Volatility
–
Volatility measures the variability of future prices for a particular instrument and is generally expressed as a percentage, where
a higher number reflects a more volatile instrument, for which future price movements are more likely to occur. Volatility is a
key input into option models, where it is used to derive a probability-based distribution of future prices for the underlying
instrument. The effect of volatility on individual positions within the portfolio is driven primarily by whether the option contract
is a long or short position. In most cases, the fair value of an option increases as a result of an increase in volatility and is
reduced by a decrease in volatility. Generally, volatility used in the measurement of fair value is derived from active-market
option prices (referred to as implied volatility). A key feature of implied volatility is the volatility “smile” or “skew,” which
represents the effect of pricing options of different option strikes at different implied volatility levels.
–
Volatilities of low interest rates tend to be much higher than volatilities of high interest rates. In addition, different currencies
may have significantly different implied volatilities.
Consolidated financial statements | UBS AG consolidated financial statements
490
Note 21 Fair value measurement (continued)
Input
Description
Correlation
–
Correlation measures the interrelationship between the movements of two variables. It is expressed as a percentage between
–100% and +100%, where +100% represents perfectly correlated variables (meaning a movement of one variable is associated
with a movement of the other variable in the same direction) and –100% implies that the variables are inversely correlated
(meaning a movement of one variable is associated with a movement of the other variable in the opposite direction). The effect
of correlation on the measurement of fair value depends on the specific terms of the instruments being valued, reflecting the
range of different payoff features within such instruments.
–
Equity-to-FX correlation is important for equity options based on a currency other than the currency of the underlying stock.
Equity-to-equity correlation is particularly important for complex options that incorporate, in some manner, different equities
in the projected payoff.
Equity dividend yields
–
The derivation of a forward price for an individual stock or index is important for measuring fair value for forward or swap
contracts and for measuring fair value using option pricing models. The relationship between the current stock price and the
forward price is based on a combination of expected future dividend levels and payment timings, and, to a lesser extent, the
relevant funding rates applicable to the stock in question. Dividend yields are generally expressed as an annualized percentage
of the share price, with the lowest limit of 0% representing a stock that is not expected to pay any dividend. The dividend yield
and timing represent the most significant parameter in determining fair value for instruments that are sensitive to an equity
forward price.
491
Note 21 Fair value measurement (continued)
g) Level 3 instruments: sensitivity to changes in unobservable input assumptions
The table below summarizes those financial assets and liabilities
classified as Level 3 for which a change in one or more of the
unobservable inputs to reflect reasonably possible favorable and
unfavorable alternative assumptions would change fair value
significantly, and the estimated effect thereof. The table below
does not represent the estimated effect of stress scenarios.
Interdependencies between Level 1, 2 and 3 parameters have not
been incorporated in the table. Furthermore, direct inter-
relationships between the Level 3 parameters discussed below are
not a significant element of the valuation uncertainty.
Sensitivity data is estimated using a number of techniques,
including the estimation of price dispersion among different
market participants, variation in modeling approaches and
reasonably possible changes to assumptions used within the fair
value measurement process. The sensitivity ranges are not always
symmetrical around the fair values, as the inputs used in
valuations are not always precisely in the middle of the favorable
and unfavorable range.
Sensitivity data is determined at a product or parameter level
and then aggregated assuming no diversification benefit.
Diversification would incorporate estimated correlations across
different sensitivity results and, as such, would result in an overall
sensitivity that would be less than the sum of the individual
component sensitivities. However, UBS believes that the
diversification benefit is not significant to this analysis.
Sensitivity of fair value measurements to changes in unobservable input assumptions
1
31.12.21
31.12.20
USD million
Favorable
changes
Unfavorable
changes
Favorable
changes
Unfavorable
changes
Traded loans, loans designated at fair value, loan commitments and guarantees
19
(13)
29
(28)
Securities financing transactions
41
(53)
40
(52)
Auction rate securities
66
2
(66)
2
105
(105)
Asset-backed securities
20
(20)
41
(41)
Equity instruments
173
(146)
129
(96)
Interest rate derivative contracts, net
29
(19)
11
(16)
Credit derivative contracts, net
5
(8)
10
(14)
Foreign exchange derivative contracts, net
19
(11)
20
(15)
Equity / index derivative contracts, net
368
(335)
318
(294)
Other
50
(73)
91
(107)
Total
790
(744)
794
(768)
1 Sensitivity of issued and over-the-counter debt instruments is reported with the equivalent derivative or securities financing instrument. 2 Includes refinements applied in estimating valuation uncertainty across
various parameters and a change in assumptions regarding the underlying statistical distribution.
Consolidated financial statements | UBS AG consolidated financial statements
492
Note 21 Fair value measurement (continued)
h) Level 3 instruments: movements during the period
The table below presents additional information about material
movements in Level 3 assets and liabilities measured at fair value
on a recurring basis, excluding any related hedging activity.
Assets and liabilities transferred into or out of Level 3 are
presented as if those assets or liabilities had been transferred at
the beginning of the year.
Movements of Level 3 instruments
Total gains / losses
included in
comprehensive income
USD billion
Balance
as of
31 December
2019
Net gains /
losses
included in
income
1
of which:
related to
Level 3
instruments
held at the
end of the
reporting
period
Purchases
Sales
Issuances
Settlements
Transfers
into
Level 3
Transfers
out of
Level 3
Foreign
currency
translation
Balance
as of
31 December
2020
Financial assets at fair value held for
trading
1.8
(0.1)
(0.1)
0.8
(1.4)
1.0
0.0
0.3
0.0
0.0
2.3
of which:
Investment fund units
0.0
0.0
0.0
0.0
0.0
0.0
0.0
0.0
0.0
0.0
0.0
Corporate and municipal bonds
0.5
0.0
0.0
0.7
(0.5)
0.0
0.0
0.1
0.0
0.0
0.8
Loans
0.8
0.0
(0.1)
0.0
(0.7)
1.0
0.0
0.1
0.0
0.0
1.1
Other
0.4
0.0
0.0
0.1
(0.3)
0.0
0.0
0.2
0.0
0.0
0.4
Derivative financial instruments –
assets
1.3
0.3
0.4
0.0
0.0
0.7
(0.5)
0.1
(0.2)
0.1
1.8
of which:
Interest rate contracts
0.3
0.2
0.2
0.0
0.0
0.0
0.0
0.0
0.0
0.0
0.5
Equity / index contracts
0.6
0.1
0.1
0.0
0.0
0.6
(0.3)
0.0
(0.1)
0.0
0.9
Credit derivative contracts
0.4
0.0
0.0
0.0
0.0
0.1
(0.2)
0.1
0.0
0.0
0.3
Other
0.0
0.0
0.0
0.0
0.0
0.0
0.0
0.0
0.0
0.0
0.0
Financial assets at fair value not held
for trading
4.0
0.0
0.1
0.8
(0.9)
0.0
0.0
0.1
0.0
0.0
3.9
of which:
Loans
1.2
0.0
0.0
0.3
(0.7)
0.0
0.0
0.0
0.0
0.0
0.9
Auction rate securities
1.5
0.0
0.0
0.0
0.0
0.0
0.0
0.0
0.0
0.0
1.5
Equity instruments
0.5
0.0
0.0
0.1
(0.1)
0.0
0.0
0.0
0.0
0.0
0.5
Other
0.7
0.0
0.0
0.4
(0.2)
0.0
0.0
0.0
0.0
0.0
1.0
Derivative financial instruments –
liabilities
2.0
1.3
1.2
0.0
0.0
1.2
(0.9)
0.4
(0.6)
0.1
3.5
of which:
Interest rate contracts
0.1
0.3
0.3
0.0
0.0
0.3
(0.2)
0.2
(0.2)
0.0
0.5
Equity / index contracts
1.3
1.0
0.8
0.0
0.0
0.8
(0.6)
0.1
(0.2)
0.0
2.3
Credit derivative contracts
0.5
0.0
0.0
0.0
0.0
0.1
(0.1)
0.1
(0.2)
0.0
0.5
Other
0.1
0.0
0.0
0.0
0.0
0.0
0.0
0.0
0.0
0.0
0.1
Debt issued designated at fair value
9.6
0.0
(0.2)
0.0
0.0
6.6
(5.6)
0.5
(1.7)
0.2
9.6
Other financial liabilities designated
at fair value
1.0
0.2
0.2
0.0
0.0
1.4
(0.6)
0.0
0.0
0.0
2.1
1 Net gains / losses included in comprehensive income are composed of Net interest income, Other net income from financial instruments measured at fair value through profit or loss and Other income. 2 Total
Level 3 assets as of 31 December 2021 were USD
7.6
8.3
17.4
15.2
493
Note 21 Fair value measurement (continued)
Total gains / losses
included in
comprehensive income
Balance
as of
31 December
2020
2
Net gains /
losses
included in
income
1
of which:
related to
Level 3
instruments
held at the
end of the
reporting
period
Purchases
Sales
Issuances
Settlements
Transfers
into
Level 3
Transfers
out of
Level 3
Foreign
currency
translation
Balance
as of
31 December
2021
2
2.3
0.0
(0.1)
0.3
(1.6)
1.2
0.0
0.3
(0.3)
0.0
2.3
0.0
0.0
0.0
0.0
0.0
0.0
0.0
0.0
0.0
0.0
0.0
0.8
0.0
0.0
0.2
(0.4)
0.0
0.0
0.0
(0.1)
0.0
0.6
1.1
0.0
0.0
0.0
(0.8)
1.2
0.0
0.0
(0.2)
0.0
1.4
0.4
0.0
0.0
0.1
(0.4)
0.0
0.0
0.3
0.0
0.0
0.3
1.8
(0.2)
(0.1)
0.0
0.0
0.5
(0.7)
0.1
(0.3)
0.0
1.1
0.5
0.1
0.1
0.0
0.0
0.1
(0.2)
0.0
(0.1)
0.0
0.5
0.9
(0.1)
(0.1)
0.0
0.0
0.3
(0.4)
0.0
(0.2)
0.0
0.4
0.3
(0.1)
(0.1)
0.0
0.0
0.0
(0.1)
0.0
0.0
0.0
0.2
0.0
0.0
0.0
0.0
0.0
0.0
0.0
0.0
0.0
0.0
0.0
3.9
0.1
0.1
1.0
(0.6)
0.0
0.0
0.1
(0.3)
0.0
4.2
0.9
0.0
0.0
0.6
(0.3)
0.0
0.0
0.0
(0.3)
0.0
0.9
1.5
0.1
0.1
0.0
0.0
0.0
0.0
0.0
0.0
0.0
1.6
0.5
0.1
0.1
0.1
(0.1)
0.0
0.0
0.0
0.0
0.0
0.7
1.0
0.0
(0.1)
0.3
(0.2)
0.0
0.0
0.0
0.0
0.0
1.0
3.5
0.2
0.0
0.0
0.0
0.9
(1.8)
0.0
(0.5)
0.0
2.2
0.5
(0.1)
(0.1)
0.0
0.0
0.0
(0.1)
0.0
0.0
0.0
0.3
2.3
0.3
0.1
0.0
0.0
0.8
(1.5)
0.0
(0.4)
0.0
1.5
0.5
(0.1)
(0.1)
0.0
0.0
0.0
0.0
0.0
(0.1)
0.0
0.3
0.1
0.1
0.0
0.0
0.0
0.0
(0.1)
0.0
0.0
0.0
0.1
9.6
0.7
0.6
0.0
0.0
7.1
(4.2)
0.1
(1.2)
(0.2)
11.9
2.1
0.0
0.0
0.0
0.0
1.3
(0.2)
0.0
0.0
0.0
3.2
Consolidated financial statements | UBS AG consolidated financial statements
494
Note 21 Fair value measurement (continued)
i) Maximum exposure to credit risk for financial instruments measured at fair value
The tables below provide UBS AG’s maximum exposure to credit
risk for financial instruments measured at fair value and the
respective collateral and other credit enhancements mitigating
credit risk for these classes of financial instruments.
The maximum exposure to credit risk includes the carrying
amounts of financial instruments recognized on the balance sheet
subject to credit risk and the notional amounts for off-balance
sheet arrangements. Where information is available, collateral is
presented at fair value. For other collateral, such as real estate, a
reasonable alternative value is used. Credit enhancements, such
as credit derivative contracts and guarantees, are included at their
notional amounts. Both are capped at the maximum exposure to
credit risk for which they serve as security. The “Risk management
and control” section of this report describes management’s view
of credit risk and the related exposures, which can differ in certain
respects from the requirements of IFRS.
Maximum exposure to credit risk
31.12.21
Maximum
exposure to
credit risk
Collateral
Credit enhancements
Exposure to
credit risk
after collateral
and credit
enhancements
USD billion
Cash
collateral
received
Collateral-
ized by
securities
Secured by
real estate
Other
collateral
Netting
Credit
derivative
contracts
Guarantees
Financial assets measured at
fair value on the balance sheet
1
Financial assets at fair value
held for trading – debt instruments
2,3
22.6
22.6
Derivative financial instruments
4,5
118.1
4.2
103.2
10.7
Brokerage receivables
21.8
0.0
21.6
0.2
Financial assets at fair value not
held for trading – debt instruments
6
37.0
0.0
11.2
25.7
Total financial assets measured at fair value
199.5
0.0
37.1
0.0
0.0
103.2
0.0
0.0
59.2
Guarantees
7
0.2
0.0
0.2
0.0
31.12.20
Maximum
exposure to
credit risk
Collateral
Credit enhancements
Exposure to
credit risk
after collateral
and credit
enhancements
USD billion
Cash
collateral
received
Collateral-
ized by
securities
Secured by
real estate
Other
collateral
Netting
Credit
derivative
contracts
Guarantees
Financial assets measured at
fair value on the balance sheet
1
Financial assets at fair value
held for trading – debt instruments
2,3
24.7
24.7
Derivative financial instruments
4,5
159.6
6.0
138.4
15.2
Brokerage receivables
24.7
24.4
0.3
Financial assets at fair value not
held for trading – debt instruments
6
58.2
0.0
13.2
45.0
Total financial assets measured at fair value
267.2
0.0
43.6
0.0
0.0
138.4
0.0
0.0
85.2
Guarantees
7
0.5
0.1
0.3
0.0
1 The maximum exposure to loss is generally equal to the carrying amount and subject to change over time with market movements. 2 These positions are generally managed under the market risk framework. For
the purpose of this disclosure, collateral and credit enhancements were not considered. 3 Does not include investment fund units. 4 Includes USD
0
0
commitments and forward starting reverse repurchase agreements classified as derivatives. The full contractual committed amount of forward starting reverse repurchase agreements (generally highly collateralized)
of USD
27.8
21.9
8.2
0.8
9.4
billion, of which USD
0.8
balance sheet. Refer to Note 22 for more information. 6 Financial assets at fair value not held for trading collateralized by securities consisted of structured loans and reverse repurchase and securities borrowing
agreements. 7 The amount shown in the “Guarantees” column largely relates to sub-participations.
495
Note 21 Fair value measurement (continued)
j) Financial instruments not measured at fair value
The table below provides the estimated fair values of financial instruments not measured at fair value.
Financial instruments not measured at fair value
31.12.21
31.12.20
Carrying
amount
Fair value
Carrying
amount
Fair value
USD billion
Total
Carrying
amount
approximates
fair value
1
Level 1
Level 2
Level 3
Total
Total
Carrying
amount
approximates
fair value
1
Level 1
Level 2
Level 3
Total
Assets
2
Cash and balances at central banks
192.8
192.7
0.1
0.0
0.0
192.8
158.2
158.1
0.1
0.0
0.0
158.2
Loans and advances to banks
15.4
14.6
0.0
0.7
0.0
15.3
15.3
14.6
0.0
0.6
0.1
15.3
Receivables from securities financing
transactions
75.0
71.6
0.0
1.3
2.1
75.0
74.2
64.9
0.0
7.6
1.7
74.2
Cash collateral receivables on derivative
instruments
30.5
30.5
0.0
0.0
0.0
30.5
32.7
32.7
0.0
0.0
0.0
32.7
Loans and advances to customers
398.7
163.7
0.0
43.8
190.4
397.9
381.0
173.1
0.0
34.2
174.9
382.3
Other financial assets measured at amortized
cost
26.2
4.1
9.3
10.7
2.4
26.5
27.2
5.4
9.4
10.9
2.3
28.0
Liabilities
2
Amounts due to banks
13.1
9.1
0.0
4.0
0.0
13.1
11.0
8.5
0.0
2.6
0.0
11.1
Payables from securities financing
transactions
5.5
4.1
0.0
1.5
0.0
5.5
6.3
6.0
0.0
0.2
0.0
6.3
Cash collateral payables on derivative
instruments
31.8
31.8
0.0
0.0
0.0
31.8
37.3
37.3
0.0
0.0
0.0
37.3
Customer deposits
544.8
537.6
0.0
7.3
0.0
544.8
527.9
521.8
0.0
6.2
0.0
528.0
Funding from UBS Group AG
57.3
2.8
0.0
56.0
0.0
58.8
54.0
0.0
0.0
55.6
0.0
55.6
Debt issued measured at amortized cost
82.4
13.0
0.0
69.8
0.0
82.8
85.4
16.4
0.0
70.0
0.0
86.3
Other financial liabilities measured at
amortized cost
3
6.3
6.3
0.0
0.0
0.0
6.3
6.6
6.6
0.0
0.0
0.1
6.7
1 Includes certain financial instruments where the carrying amount is a reasonable approximation of the fair value due to the instruments’ short-term nature (instruments that are receivable or payable on demand, or
with a remaining maturity (excluding the effects of callable features) of three months or less). 2 As of 31 December 2021, USD
0
0
USD
0
0
1
1
175
2020: USD
163
19
20
1
0
of Amounts due to banks, USD
4
3
53
49
31
31
3
3
after 12 months. 3 Excludes lease liabilities.
The fair values included in the table above have been calculated
for disclosure purposes only. The valuation techniques and
assumptions described below relate only to the fair value of UBS’s
financial instruments not measured at fair value. Other institutions
may use different methods and assumptions for their fair value
estimations, and therefore such fair value disclosures cannot
necessarily be compared from one financial institution to another.
The following principles were applied when determining fair value
estimates for financial instruments not measured at fair value:
–
For financial instruments with remaining maturities greater
than three months, the fair value was determined from quoted
market prices, if available.
–
Where quoted market prices were not available, the fair values
were estimated by discounting contractual cash flows using
current market interest rates or appropriate yield curves for
instruments with similar credit risk
and maturity. These
estimates generally include adjustments for counterparty credit
risk or UBS’s own credit.
–
For short-term financial instruments with remaining maturities
of three months or less, the carrying amount, which is net of
credit loss allowances, is generally considered a reasonable
estimate of fair value.
Consolidated financial statements | UBS AG consolidated financial statements
496
Note 22 Offsetting financial assets and financial liabilities
UBS AG enters into netting agreements with counterparties to
manage the credit risks associated primarily with repurchase and
reverse repurchase transactions, securities borrowing and lending,
over-the-counter derivatives and exchange-traded derivatives.
These netting agreements and similar arrangements generally
enable the counterparties to set off liabilities against available
assets received in the ordinary course of business and / or in the
event that the counterparties to the transaction are unable to
fulfill their contractual obligations.
The tables on this page and the next page provide a summary
of financial assets and financial liabilities subject to offsetting,
enforceable master netting arrangements and similar agreements,
as well as financial collateral received or pledged to mitigate credit
exposures for these financial instruments.
UBS AG engages in a variety of counterparty credit risk
mitigation strategies in addition to netting and collateral
arrangements. Therefore, the net amounts presented in the tables
on this page and the next page do not purport to represent their
actual credit risk exposure.
Financial assets subject to offsetting, enforceable master netting arrangements and similar agreements
Assets subject to netting arrangements
Netting recognized on the balance sheet
Netting potential not recognized on
the balance sheet
3
Assets not
subject to netting
arrangements
4
Total assets
As of 31.12.21, USD billion
Gross assets
before netting
Netting with
gross liabilities
2
Net assets
recognized
on the
balance
sheet
Financial
liabilities
Collateral
received
Assets after
consideration
of
netting
potential
Assets
recognized
on the
balance
sheet
Total assets
after
consideration
of netting
potential
Total assets
recognized
on the
balance
sheet
Receivables from securities
financing transactions
67.7
(13.8)
53.9
(2.9)
(51.0)
0.0
21.1
21.1
75.0
Derivative financial instruments
116.0
(3.6)
112.4
(88.9)
(18.5)
5.0
5.8
10.7
118.1
Cash collateral receivables on
derivative instruments
1
29.4
0.0
29.4
(15.2)
(3.3)
11.0
1.1
12.1
30.5
Financial assets at fair value
not held for trading
93.1
(87.6)
5.5
(1.1)
(4.4)
0.0
54.1
54.1
59.6
of which: reverse
repurchase agreements
93.1
(87.6)
5.5
(1.1)
(4.4)
0.0
0.3
0.3
5.8
Total assets
306.2
(105.0)
201.2
(108.1)
(77.2)
15.9
82.1
98.1
283.3
As of 31.12.20, USD billion
Receivables from securities
financing transactions
70.3
(13.4)
57.0
(1.7)
(55.3)
0.0
17.3
17.3
74.2
Derivative financial instruments
156.9
(5.0)
151.9
(117.2)
(27.2)
7.5
7.7
15.2
159.6
Cash collateral receivables on
derivative instruments
1
31.9
0.0
31.9
(19.6)
(1.5)
10.8
0.8
11.6
32.7
Financial assets at fair value
not held for trading
85.6
(79.1)
6.5
(0.8)
(5.8)
0.0
73.5
73.5
80.0
of which: reverse
repurchase agreements
85.6
(79.1)
6.5
(0.8)
(5.8)
0.0
0.2
0.2
6.7
Total assets
344.8
(97.5)
247.3
(139.3)
(89.8)
18.3
99.3
117.6
346.6
1 The net amount of Cash collateral receivables on derivative instruments recognized on the balance sheet includes certain OTC derivatives that are net settled on a daily basis either legally or in substance under
IAS 32 principles and exchange-traded derivatives that are economically settled on a daily basis. 2 The logic of the table results in amounts presented in the “Netting with gross liabilities” column corresponding
directly to the amounts presented in the “Netting with gross assets” column in the liabilities table presented on the following page. Netting in this column for reverse repurchase agreements presented within the lines
“Receivables from securities financing transactions” and “Financial assets at fair value not held for trading” taken together corresponds to the amounts presented for repurchase agreements in the “Payables from
securities financing transactions” and “Other financial liabilities designated at fair value” lines in the liabilities table presented on the following page. 3 For the purpose of this disclosure, the amounts of financial
instruments and cash collateral presented have been capped so as not to exceed the net amount of financial assets presented on the balance sheet; i.e., over-collateralization, where it exists, is not reflected in the
table. 4 Includes assets not subject to enforceable netting arrangements and other out-of-scope items.
497
Note 22 Offsetting financial assets and financial liabilities (continued)
Financial liabilities subject to offsetting, enforceable master netting arrangements and similar agreements
Liabilities subject to netting arrangements
Netting recognized on the balance sheet
Netting potential not recognized
on the balance sheet
3
Liabilities not
subject
to netting
arrangements
4
Total liabilities
As of 31.12.21, USD billion
Gross
liabilities
before
netting
Netting with
gross assets
2
Net
liabilities
recognized
on the
balance
sheet
Financial
assets
Collateral
pledged
Liabilities
after
consideration of
netting
potential
Liabilities
recognized
on the
balance
sheet
Total
liabilities
after
consideration
of netting
potential
Total
liabilities
recognized
on the
balance
sheet
Payables from securities
financing transactions
16.9
(12.8)
4.1
(1.8)
(2.3)
0.0
1.4
1.4
5.5
Derivative financial instruments
118.4
(3.6)
114.9
(88.9)
(18.1)
7.9
6.4
14.3
121.3
Cash collateral payables on
derivative instruments
1
30.4
0.0
30.4
(13.1)
(3.3)
14.0
1.4
15.4
31.8
Other financial liabilities
designated at fair value
94.8
(88.6)
6.2
(2.2)
(3.8)
0.2
26.3
26.5
32.4
of which: repurchase agreements
94.6
(88.6)
6.0
(2.2)
(3.8)
0.0
0.4
0.4
6.4
Total liabilities
260.6
(105.0)
155.6
(106.0)
(27.5)
22.1
35.5
57.6
191.1
As of 31.12.20, USD billion
Payables from securities
financing transactions
18.2
(13.3)
4.9
(1.6)
(3.3)
0.0
1.4
1.4
6.3
Derivative financial instruments
157.1
(5.0)
152.1
(117.2)
(23.9)
10.9
9.0
19.9
161.1
Cash collateral payables on
derivative instruments
1
35.6
0.0
35.6
(19.6)
(2.1)
13.9
1.7
15.7
37.3
Other financial liabilities
designated at fair value
87.0
(79.2)
7.8
(0.8)
(6.3)
0.7
24.0
24.7
31.8
of which: repurchase agreements
86.2
(79.2)
7.0
(0.8)
(6.3)
0.0
0.3
0.3
7.3
Total liabilities
297.8
(97.5)
200.3
(139.2)
(35.5)
25.6
36.2
61.7
236.5
1 The net amount of Cash collateral payables on derivative instruments recognized on the balance sheet includes certain OTC derivatives that are net settled on a daily basis either legally or in substance under IAS 32
principles and exchange-traded derivatives that are economically settled on a daily basis. 2 The logic of the table results in amounts presented in the “Netting with gross assets” column corresponding to the amounts
presented in the “Netting with gross liabilities” column in the assets table presented on the previous page. Netting in this column for repurchase agreements presented within the lines “Payables from securities
financing transactions” and “Other financial liabilities designated at fair value” taken together corresponds to the amounts presented for reverse repurchase agreements in the “Receivables from securities financing
transactions” and “Financial assets at fair value not held for trading” lines in the assets table presented on the previous page. 3 For the purpose of this disclosure, the amounts of financial instruments and cash
collateral presented have been capped so as not to exceed the net amount of financial liabilities presented on the balance sheet; i.e., over-collateralization, where it exists, is not reflected in the table. 4 Includes
liabilities not subject to enforceable netting arrangements and other out-of-scope items.
Consolidated financial statements | UBS AG consolidated financial statements
498
Note 23 Restricted and transferred financial assets
This Note provides information about restricted financial assets (Note 23a), transfers of financial assets (Note 23b and 23c) and financial
assets that are received as collateral with the right to resell or repledge these assets (Note 23d).
a) Restricted financial assets
Restricted financial assets consist of assets pledged as collateral
against an existing liability or contingent liability and other assets
that are otherwise explicitly restricted such that they cannot be
used to secure funding.
Financial assets are mainly pledged as collateral in securities
lending transactions, in repurchase transactions, against loans
from Swiss mortgage institutions and in connection with the
issuance of covered bonds. UBS AG
generally enters into
repurchase and securities lending arrangements under standard
market agreements. For securities lending, the cash received as
collateral may be more or less than the fair value of the securities
loaned, depending on the nature of the transaction. For
repurchase agreements, the fair value of the collateral sold under
an agreement to repurchase is generally in excess of the cash
borrowed. Pledged mortgage loans serve as collateral for existing
liabilities against Swiss central mortgage institutions and for
existing covered bond issuances of USD
10,843
31 December 2021 (31 December 2020: USD
12,456
Other restricted financial assets include assets protected under
client asset segregation rules, assets held by UBS AG’s insurance
entities to back related liabilities to the policy holders, assets held
in certain jurisdictions to comply with explicit minimum local asset
maintenance requirements. The carrying amount of the liabilities
associated with these other restricted financial assets is generally
equal to the carrying amount of the assets, with the exception of
assets held to comply with local asset maintenance requirements,
for which the associated liabilities are greater.
Restricted financial assets
USD million
31.12.21
31.12.20
Restricted
financial assets
of which: assets
pledged as
collateral that
may be sold or
repledged by
counterparties
of which:
mortgage loans
1
Restricted
financial assets
of which: assets
pledged as
collateral that
may be sold or
repledged by
counterparties
of which:
mortgage loans
1
Financial assets pledged as collateral
Financial assets at fair value held for trading
63,834
43,397
64,418
47,098
Loans and advances to customers
18,160
16,330
20,361
18,191
Financial assets at fair value not held for trading
961
961
2,140
2,140
Debt securities classified as Other financial assets measured at amortized
cost
2,234
1,870
2,506
2,506
Financial assets measured at fair value through other comprehensive
income
0
0
149
149
Total financial assets pledged as collateral
2
85,188
89,574
Other restricted financial assets
Loans and advances to banks
3,408
3,730
Financial assets at fair value held for trading
392
741
Cash collateral receivables on derivative instruments
4,747
3,765
Loans and advances to customers
1,237
756
Financial assets at fair value not held for trading
22,328
22,917
Financial assets measured at fair value through other comprehensive
income
894
0
Other
97
110
Total other restricted financial assets
33,104
32,019
Total financial assets pledged and other restricted financial assets
118,292
121,593
1 All related to mortgage loans that serve as collateral for existing liabilities toward Swiss central mortgage institutions and for existing covered bond issuances. Of these pledged mortgage loans, approximately
USD
2.7
2.7
requirements. 2 Does not include assets placed with central banks related to undrawn credit lines and for payment, clearing and settlement purposes (31 December 2021: USD
4.4
USD
1.3
499
Note 23 Restricted and transferred financial assets (continued)
In addition to restrictions on financial assets, UBS AG and its
subsidiaries are, in certain cases, subject to regulatory
requirements that affect the transfer of dividends and capital
within UBS AG, as well as intercompany lending. Supervisory
authorities also may require entities to measure capital and
leverage ratios on a stressed basis, such as the Federal Reserve
Board’s Comprehensive Capital Analysis and Review process,
which may limit
the relevant subsidiaries’
ability to make
distributions of capital based on the results of those tests.
Supervisory authorities generally have discretion to impose
higher requirements or to otherwise limit the activities of
subsidiaries.
Non-regulated subsidiaries are generally not subject to such
requirements and transfer restrictions. However, restrictions can
also be the result of different legal, regulatory, contractual, entity-
or country-specific arrangements and / or requirements.
›
Refer to the “Financial and regulatory key figures for our
significant regulated subsidiaries and sub-groups” section of this
report for financial information about significant regulated
subsidiaries of UBS AG
b) Transferred financial assets that are not derecognized in their entirety
The table below presents information for financial assets that have been transferred but are subject to continued recognition in full,
as well as recognized liabilities associated with those transferred assets.
Transferred financial assets subject to continued recognition in full
USD million
31.12.21
31.12.20
Carrying amount
of transferred
assets
Carrying amount of
associated liabilities
recognized
on balance sheet
Carrying amount
of transferred
assets
Carrying amount of
associated liabilities
recognized
on balance sheet
Financial assets at fair value held for trading that may be sold or repledged by counterparties
43,397
17,687
47,098
18,874
relating to securities lending and repurchase agreements in exchange for cash received
17,970
17,687
19,177
18,874
relating to securities lending agreements in exchange for securities received
24,146
27,595
relating to other financial asset transfers
1,281
326
Financial assets at fair value not held for trading that may be sold or repledged by
counterparties
961
898
2,140
1,378
Debt securities classified as Other financial assets measured at amortized cost that may be
sold or repledged by counterparties
1,870
1,725
2,506
1,963
Financial assets measured at fair value through other comprehensive income that may be sold
or repledged by counterparties
0
0
149
148
Total financial assets transferred
46,227
20,311
51,893
22,363
Transactions in which financial assets are transferred, but
continue to be recognized in their entirety on UBS AG’s balance
sheet include securities lending and repurchase agreements, as
well as other financial asset transfers. Repurchase and securities
lending arrangements are, for the most part, conducted under
standard market
agreements
and are undertaken with
counterparties subject to UBS AG’s normal credit risk control
processes.
›
Refer to Note 1a item 2e for more information about repurchase
and securities lending agreements
As of
31 December 2021
,
approximately
41
%
of the
transferred financial assets were assets held for trading
transferred in exchange for cash, in which case the associated
recognized liability represents the amount to be repaid to
counterparties. For securities lending and repurchase agreements,
a haircut of between
0
% and
15
% is generally applied to the
transferred assets, which results in associated liabilities having a
carrying amount below the carrying amount of the transferred
assets. The counterparties to the associated liabilities presented in
the table above have full recourse to UBS AG.
In securities lending arrangements entered into in exchange for
the receipt of other securities as collateral, neither the securities
received nor the obligation to return them are recognized on UBS
AG’s balance sheet, as the risks and rewards of ownership are not
transferred to UBS AG. In cases where such financial assets
received are subsequently sold or repledged in another
transaction, this is not considered to be a transfer of financial
assets.
Other financial asset transfers primarily include securities
transferred to collateralize derivative transactions, for which the
carrying amount of associated liabilities is not provided in the
table above, because those replacement values are managed on
a portfolio basis across counterparties and product types, and
therefore there is no direct relationship between the specific
collateral pledged and the associated liability.
Transferred financial assets that are not subject to
derecognition in full but remain on the balance sheet to the extent
of UBS AG’s continuing involvement were not material as of
31 December 2021 and as of 31 December 2020.
Consolidated financial statements | UBS AG consolidated financial statements
500
Note 23 Restricted and transferred financial assets (continued)
c) Transferred financial assets that are derecognized in their entirety with continuing involvement
Continuing involvement in a transferred and fully derecognized
financial asset may result from contractual provisions in the
particular transfer agreement or from a separate agreement, with
the counterparty or a third party, entered into in connection with
the transfer.
The fair value and carrying amount of UBS AG’s continuing
involvement from transferred positions as of 31 December 2021
and 31 December 2020 was not material. Life-to-date losses
reported in prior periods primarily relate to legacy positions in
securitization vehicles which have been fully marked down, with no
remaining exposure to loss.
d) Off-balance sheet assets received
The table below presents assets received from third parties that can be sold or repledged and that are not recognized on the balance
sheet, but that are held as collateral, including amounts that have been sold or repledged.
Off-balance sheet assets received
USD million
31.12.21
31.12.20
Fair value of assets received that can be sold or repledged
497,828
500,689
received as collateral under reverse repurchase, securities borrowing
and lending arrangements, derivative and other transactions
1
483,426
487,904
received in unsecured borrowings
14,402
12,785
Thereof sold or repledged
2
367,440
367,258
in connection with financing activities
319,176
315,603
to satisfy commitments under short sale transactions
31,688
33,595
in connection with derivative and other transactions
1
16,575
18,059
1 Includes securities received as initial margin from its clients that UBS AG is required to remit to central counterparties, brokers and deposit banks through its exchange-traded derivative clearing and execution
services. 2 Does not include off-balance sheet securities (31 December 2021: USD
12.7
18.9
clearing and settlement purposes for which there are no associated liabilities or contingent liabilities.
501
Note 24 Maturity analysis of financial liabilities
The residual contractual maturities for non-derivative and non-
trading financial liabilities as of 31 December 2021 are based on
the earliest date on which UBS AG could be contractually required
to pay. The total amounts that contractually mature in each time
band are also shown for 31 December 2020. Derivative positions
and trading liabilities, predominantly made up of short sale
transactions, are assigned to the
Due within 1 month
,
this provides a conservative reflection of the nature of these
trading activities. The residual contractual maturities may extend
over significantly longer periods.
Maturity analysis of financial liabilities
31.12.21
USD billion
Due within
1 month
Due between
1 and 3 months
Due between
3 and 12 months
Due between
1 and 5 years
Due after
5 years
Total
Financial liabilities recognized on balance sheet
1
Amounts due to banks
6.7
2.4
3.5
0.6
0.0
13.1
Payables from securities financing transactions
3.8
0.3
1.6
0.0
5.7
Cash collateral payables on derivative instruments
31.8
31.8
Customer deposits
531.0
6.6
3.3
3.9
0.4
545.1
Funding from UBS Group AG
2
0.2
3.3
2.3
28.8
30.6
65.3
Debt issued measured at amortized cost
2
3.8
9.4
38.8
25.1
7.6
84.7
Other financial liabilities measured at amortized cost
5.3
0.1
0.4
1.8
1.5
9.1
of which: lease liabilities
0.1
0.1
0.4
1.8
1.5
3.9
Total financial liabilities measured at amortized cost
582.6
22.1
49.9
60.2
40.1
754.8
Financial liabilities at fair value held for trading
3,4
31.7
31.7
Derivative financial instruments
3,5
121.3
121.3
Brokerage payables designated at fair value
44.0
44.0
Debt issued designated at fair value
6
13.8
11.5
13.5
24.5
12.5
75.9
Other financial liabilities designated at fair value
28.1
0.4
0.5
0.4
7.1
36.5
Total financial liabilities measured at fair value through profit or loss
239.0
11.9
14.0
24.9
19.6
309.4
Total
821.6
34.0
63.9
85.0
59.6
1,064.2
Guarantees, commitments and forward starting transactions
Loan commitments
7
38.3
0.5
0.7
0.0
39.5
Guarantees
21.2
0.0
21.2
Forward starting transactions, reverse repurchase
and securities borrowing agreements
7
1.4
1.4
Total
60.9
0.5
0.7
0.0
0.0
62.1
31.12.20
USD billion
Due within
1 month
Due between
1 and 3 months
Due between
3 and 12 months
Due between
1 and 5 years
Due after
5 years
Total
Financial liabilities recognized on balance sheet
1
Amounts due to banks
6.1
2.4
2.1
0.5
0.0
11.1
Payables from securities financing transactions
5.6
0.4
0.3
0.0
0.0
6.3
Cash collateral payables on derivative instruments
37.3
37.3
Customer deposits
514.0
7.8
3.5
2.8
0.2
528.2
Funding from UBS Group AG
2
0.1
0.3
6.2
29.1
24.8
60.5
Debt issued measured at amortized cost
2
8.8
7.8
38.2
24.5
8.9
88.2
Other financial liabilities measured at amortized cost
5.3
0.1
0.5
2.0
1.8
9.6
of which: lease liabilities
0.1
0.1
0.5
2.0
1.8
4.4
Total financial liabilities measured at amortized cost
577.2
18.9
50.7
58.8
35.8
741.3
Financial liabilities at fair value held for trading
3,4
33.6
33.6
Derivative financial instruments
3,5
161.1
161.1
Brokerage payables designated at fair value
38.7
��
38.7
Debt issued designated at fair value
6
21.9
16.8
7.1
9.2
6.0
61.0
Other financial liabilities designated at fair value
27.9
0.6
0.6
0.7
4.6
34.3
Total financial liabilities measured at fair value through profit or loss
283.2
17.4
7.7
9.8
10.6
328.8
Total
860.3
36.3
58.4
68.6
46.4
1,070.0
Guarantees, commitments and forward starting transactions
Loan commitments
7
40.5
0.5
0.4
0.0
41.4
Guarantees
17.5
17.5
Forward starting transactions, reverse repurchase
and securities borrowing agreements
7
3.2
3.2
Total
61.3
0.5
0.4
0.0
0.0
62.2
1 Except for financial liabilities at fair value held for trading and derivative financial instruments (see footnote 3), the amounts presented generally represent undiscounted cash flows of future interest and principal
payments. 2 The time-bucket Due after 5 years includes perpetual loss-absorbing additional tier 1 capital instruments. 3 Carrying amount is fair value. Management believes that this best represents the cash flows
that would have to be paid if these positions had to be settled or closed out. 4 Contractual maturities of financial liabilities at fair value held for trading are: USD
30.8
USD
32.6
0.9
1.0
0
0
34
(31 December 2020: USD
32
full contractual committed amount of USD
36.0
31.3
by reference to the applicable interest rate prevailing as of the reporting date. Future principal payments that are variable are determined by reference to the conditions existing at the relevant reporting date.
7 Excludes derivative loan commitments and forward starting reverse repurchase agreements measured at fair value (see footnote 5).
Consolidated financial statements | UBS AG consolidated financial statements
502
Note 25 Interest rate benchmark reform
Background
A market-wide reform of major interest rate benchmarks is being
undertaken globally, with the Financial Conduct Authority (the
FCA) announcing in March 2021 that the publication of London
Interbank Offered Rates (LIBORs) would cease after 31 December
2021 for all non-US dollar LIBORs, as well as for one-week and
two-month USD LIBOR. Publication of the remaining USD LIBOR
tenors will cease immediately after 30 June 2023.
The majority of UBS AG’s IBOR exposure was linked to CHF
LIBOR and USD LIBOR. The alternative reference rate (the ARR) for
CHF LIBOR is the Swiss Average Rate Overnight (SARON). The ARR
for USD LIBOR is the Secured Overnight Financing Rate (SOFR); in
addition, there are recommended ARRs for GBP LIBOR, JPY LIBOR
and EUR LIBOR.
The Euro Interbank Offered Rate (EURIBOR) was reformed in
2019, with the reform consisting of a change in the underlying
calculation method. Consequently, contracts linked to EURIBOR
are not considered throughout the rest of this Note.
On 25 January 2021, the IBOR Fallbacks Supplement and IBOR
Fallbacks Protocol, which amend the International Swaps and
Derivatives Association (ISDA) standard definitions for interest rate
derivatives to incorporate fallbacks for derivatives linked to certain
IBORs, came into effect. From that date, all newly cleared and
non-cleared derivatives between adhering parties that reference
ISDA standard definitions now include these fallbacks. UBS AG
adhered to the protocol in November 2020.
UBS AG’s focus throughout 2021 was on transitioning existing
contracts via bi-lateral and multi-lateral agreements, by leveraging
industry solutions
(e.
g.,
the use of fallback provisions)
and
through third-party actions (those by clearing houses, agents,
etc
.
).
UBS
AG
h
as established a framework to address the
transition of contracts that do not contain adequate fallback
provisions. Furthermore, in line with regulatory guidance, UBS AG
has implemented a framework to limit new contracts referencing
IBORs.
Governance over the transition to alternative benchmark rates
UBS
AG
established a global cross
-
divisional, cross
-
functional
governance structure and change program to address the scale
and complexity of the transition. This global program is sponsored
by the Group CFO and led by senior representatives from the
business divisions and UBS AG’s control and support functions.
The program includes governance and execution structures within
each business division, together with cross-divisional teams from
each control and support function. During 2021, progress was
overseen centrally via a monthly operating committee and a
monthly steering committee, as well as quarterly updates to the
joint Audit and Risk Committees. A dedicated Group-wide forum,
with an increased US regional focus, will oversee progress of the
remaining USD LIBOR transition.
Risks
A core part of UBS AG’s change program is the identification,
management and monitoring of the risks associated with IBOR
reform and transition. These risks include, but are not limited to,
the following:
–
economic risks to UBS AG and its clients, through the repricing
of existing contracts, reduced transparency and / or liquidity of
pricing information, market uncertainty or disruption;
–
accounting risks, where the transition affects the accounting
treatment, including hedge accounting and consequential
income statement volatility;
–
valuation risks arising from the variation between benchmarks
that will cease and ARRs, affecting the risk profile of financial
instruments;
–
operational risks arising from changes to UBS AG’s front-to-
back processes and systems to accommodate the transition,
e.g.
,
data sourcing and processing and bulk migration of
contracts; and
–
legal and conduct risks relating to UBS AG’s engagement with
clients and market counterparties around new benchmark
products and amendments required for existing contracts
referencing benchmarks that will cease.
Overall, the effort required to transition is affected by multiple
factors, including whether negotiations need to take place with
multiple stakeholders (as is the case for syndicated loans or certain
listed securities), market readiness
–
such as liquidity in ARR
-
equivalent products – and a client’s technical readiness to handle
ARR market conventions. UBS AG remains confident that it has the
transparency, oversight and operational preparedness to progress
with the IBOR transition consistent with market timelines, given the
significant progress made as of 31 December 2021. UBS AG did not
have and does not expect changes to its risk management approach
and strategy as a result of interest rate benchmark reform.
503
Note 25 Interest rate benchmark reform (continued)
Transition progress
Non-derivative instruments
UBS AG’s significant non-derivative exposures subject to IBOR
reform
primarily relate
d
to brokerage receivable and payable
balances, corporate and private loans, and mortgages, linked to
CHF and USD LIBORs. During 2020, UBS AG transitioned most of
its CHF LIBOR-linked deposits to SARON. In that same year, UBS
AG launched SARON-based mortgages and corporate loans based
on all major ARRs in the Swiss market, as well as SOFR-based
mortgages in the US market.
Throughout 2021, UBS AG transitioned substantially all of its
private and corporate loans linked to non-USD IBORs, with the
remaining CHF LIBOR-linked contracts planned to transition on
their first roll date in 2022.
In addition, as of 31 December 2021 UBS AG had completed
the transition of IBOR-linked non-derivative financial assets and
liabilities related to brokerage accounts, except for balances
originated in the US, which transitioned to SOFR in January 2022.
In March 2021, following the FCA announcement regarding
the cessation timelines for IBORs, UBS AG initiated a centralized
communication initiative for private mortgages linked to CHF
LIBOR, with the objective of transitioning these exposures, either
through the activation of existing fallbacks or the amendment of
contractual terms where such fallbacks do not exist. During 2021,
mortgages that were linked to CHF LIBOR
were
reduced
to
USD
21
mortgages automatically transitioning to SARON from their next
coupon roll date.
The transition of
US securities
-
based lending
to SOFR
,
amounting to USD
37
the most part completed in January 2022, with US mortgages
linked to USD LIBOR planned to transition to SOFR in 2022–2023.
As of 31 December 2021, UBS AG had approximately USD
3
billion equivalent of Japanese yen- and US dollar-denominated
funding from UBS Group AG that, per current contractual terms,
if not called on their respective call dates, would reset based
directly on JPY LIBOR and USD LIBOR. These bonds have robust
IBOR fallback language and the confirmation of interest rate
calculation mechanics will be communicated as market standards
formalize and in advance of any rate resets. In addition, several
US
dollar
-
and
Swiss franc
-
denominated
contracts providing
funding from UBS Group AG reference rates indirectly derived
from IBORs, if they are not called on their respective call dates.
UBS AG aims to transition these contracts in advance of their reset
dates, with the transition of Swiss franc-denominated funding
completed in January 2022. These debt instruments have not
been included in the table on the following page, given their
current fixed-rate coupon.
As of 31 December 2021, UBS AG had approximately USD
5
billion of irrevocable commitments that may be drawn down in
different currencies with IBOR-linked interest rates and that expire
after the relevant benchmark cessation dates
;
approximately
USD
3
except
USD LIBOR
,
and
USD
2
commitments
retained a non-USD IBOR interest rate as of 31 December 2021
with transition dependent upon the actions of other parties. To
the extent non-USD IBOR-linked amounts are requested under
these contracts, UBS AG will seek to renegotiate current terms or
rely on legislative solutions.
Derivative instruments
UBS AG holds derivatives for trading and hedging purposes,
including those designated in hedge accounting relationships. A
significant number of interest rate and cross-currency swaps have
floating legs that reference various benchmarks that are subject
to IBOR reform.
The majority of derivatives are transacted with clearing houses,
in particular LCH, with the transition of these non-USD IBOR-
linked derivatives substantially completed in December 2021. UBS
AG had also completed the transition of all non-USD IBOR-linked
exchange
-
traded derivatives (ETDs)
through participation in
activities
organized by respective exchanges
by 31
December
2021.
For derivatives not transacted with clearing houses or
exchanges, UBS AG and a significant proportion of UBS AG’s
counterparties have adhered to the ISDA IBOR Fallbacks Protocol,
which builds in agreed fallbacks. The majority of these contracts
had transitioned as of 31 December 2021, with a small number
of contracts transitioned in January 2022, to ensure an orderly
transition when converting high volumes of transactions at the
time of cessation.
Consolidated financial statements | UBS AG consolidated financial statements
504
Note 25 Interest rate benchmark reform (continued)
Financial instruments yet to transition to alternative benchmarks
The amounts included in the table below relate to financial
instrument contracts across UBS AG’s business divisions where
UBS AG has material exposures subject to IBOR reform that have
not yet transitioned to ARRs, and that:
–
contractually reference an interest rate benchmark that will
transition to an alternative benchmark; and
–
have a contractual maturity date (including open-ended
contracts) after the agreed cessation dates.
Contracts
where
penalty terms reference IBOR
s, or where
exposure to an IBOR is not the primary purpose of the contract,
have not been included, as these contracts do not have a material
impact on the transition process.
In line with information provided to management and external
parties monitoring UBS AG’s transition progress, the table below
includes the following financial metrics for instruments external
to UBS AG that are subject to interest rate benchmark reform:
–
gross carrying value / exposure for non-derivative financial
instruments; and
–
total trade count for derivative financial instruments.
The exposure
s
included
in the table below represent the
maximum IBOR exposure, without regard for early termination
rights, with the actual exposure being dependent upon client
preferences and investment decisions.
As of 31 December 2021, UBS
AG
ha
d
made significant
progress in transitioning LIBOR exposures to ARRs. The remaining
non-USD LIBOR-linked exposures included in the table below
primarily relate t
o derivatives
that
successfully transitioned in
January 2022 and CHF LIBOR mortgages that will automatically
transition to SARON on their first roll date in 2022.
31.12.21
LIBOR benchmark rates
Measure
CHF
USD
GBP
EUR
1
JPY
Carrying value of non-derivative financial instruments
Total non-derivative financial assets
USD million
21,616
2
65,234
3
45
4
1
0
Total non-derivative financial liabilities
USD million
27
4
1,985
4
3
4
5
0
Trade count of derivative financial instruments
Total derivative financial instruments
Trade count
829
6
40,500
7
183
6
3,744
6
184
6
Off-balance sheet exposures
Total irrevocable loan commitments
USD million
0
11,863
8
0
0
0
1 Relates primarily to EUR LIBOR positions. 2 Relates primarily to CHF LIBOR mortgages, which will automatically transition to SARON on their first roll date in 2022. 3 Includes USD LIBOR securities-based lending
and brokerage accounts, amounting to USD
37
5
1
credit lines, where IBOR transition efforts are complete, except for USD LIBOR. The remainder primarily relates to US mortgages and corporate lending. 4 Relates to floating-rate notes that per their contractual terms
can reset to rates linked to LIBOR, with transition dependent upon the actions of respective issuers. 5 Relates to contracts that transitioned in January 2022. 6 Includes predominantly bilateral derivatives, which
transitioned in January 2022, and an insignificant amount of cleared derivatives, where the respective clearing houses’ organized transition happened in January 2022. 7 Includes approximately
5,000
derivatives, of which approximately
500
swaps with an ARR leg and a USD IBOR leg. 8 Includes loan commitments that can be drawn in different currencies at the client‘s discretion, of which approximately USD
3
remaining and approximately USD
2
that can be drawn in US dollars only and will transition in 2022–2023.
505
Note 26 Hedge accounting
Derivatives designated in hedge accounting relationships
UBS AG applies hedge accounting to interest rate risk and foreign
exchange risk including structural foreign exchange risk related to
net investments in foreign operations.
›
Refer to “Market risk” in the “Risk management and control”
section of this report for more information about how risks arise
and how they are managed by UBS AG
Hedging instruments and hedged risk
Interest rate swaps are designated in fair value hedges or cash
flow hedges of interest rate risk arising solely from changes in
benchmark interest rates. Fair value changes arising from such risk
are usually the largest component of the overall change in the fair
value of the hedged position in transaction currency.
Cross-currency swaps are designated as fair value hedges of
foreign exchange risk. Foreign exchange forwards and foreign
exchange swaps are mainly designated as hedges of structural
foreign exchange risk related to net investments in foreign
operations. In both cases the hedged risk arises solely from
changes in spot foreign exchange rate.
The notional of the designated hedging instruments matches
the notional of the hedged items, except when the interest rate
swaps are re-designated in cash flow hedges, in which case the
hedge ratio designated is determined based on the swap
sensitivity.
Hedged items and hedge designation
Fair value hedges of interest rate risk related to debt instruments
and loan assets
Fair value hedges of interest rate risk related to debt instruments
and loan assets involve swapping fixed cash flows associated with
the debt issued, debt securities held and, from 2021 onward, loan
assets (principally long-term fixed-rate mortgage loans in Swiss
francs formerly designated within “Fair value hedges of portfolio
interest rate risk related to loans designated under IAS 39”) to
floating cash flows by entering into interest rate swaps that either
receive fixed and pay floating cash flows or that pay fixed and
receive floating cash flows.
Designations have been made in US dollars, euros, Swiss
francs, Australian dollars, Japanese yen and Singapore dollars. For
new hedging instruments and hedged risk designations entered
into in 2021 in these currencies (with the exception of euro), the
benchmark rate was the relevant alternative reference rate (ARR).
Following the interbank offered rate (IBOR) transition for swaps
with LCH (formerly the London Clearing House) in December
2021, the benchmark hedge rate for Swiss franc and Japanese
yen designations was changed from an IBOR rate to the relevant
ARR with the hedge relationship continuing in accordance with
Interest Rate Benchmark Reform – Phase 2 (Amendments to IFRS
9, IAS 39, IFRS 7, IFRS 4 and IFRS 16)
.
Fair value hedges of portfolio interest rate risk related to loans
designated under IAS 39
Prior to December 2021, UBS AG hedged an open portfolio of
long-term fixed-rate mortgage loans in Swiss francs using interest
rate swaps that paid a fixed rate of interest and received a floating
rate of interest. Both the hedged portfolio and the hedging
instruments were adjusted on a monthly basis to reflect changes
in size and the maturity profile of the hedged portfolio. Each
month the hedge relationship was discontinued and a new one
designated. Changes in the portfolio were driven by new loans
being originated or loans being repaid.
Cash flow hedges of forecast transactions
UBS AG hedges forecast cash flows on non-trading financial
assets and liabilities that bear interest at variable rates or are
expected to be refinanced or reinvested in the future, due to
movements in future market rates. The amounts and timing of
future cash flows, representing both principal and interest flows,
are projected on the basis of contractual terms and other relevant
factors, including estimates of prepayments and defaults. The
aggregate principal balances and interest cash flows across all
portfolios over time form the basis for identifying the non-trading
interest rate risk of UBS AG, which is hedged with interest rate
swaps, the maximum maturity of which is 10 years. Cash flow
forecasts and risk exposures are monitored and adjusted on an
ongoing basis, and consequently additional hedging instruments
are traded and designated, or are terminated resulting in a hedge
discontinuance. Hedge designations have been made in the
following currencies
:
US dollars
, euros, Swiss francs, pounds
sterling and Hong Kong dollars. The cash flow hedges in US
dollars, Swiss francs and pounds sterling were discontinued and
replaced with new ARR designations in December 2021.
Fair value hedges of foreign exchange risk related to issued debt
instruments
Debt instruments denominated in currencies other than the US
dollar
are designated in fair value hedges of spot foreign
exchange risk, in addition to and separate from the fair value
hedges of interest rate risk. Cross currency swaps economically
convert debt denominated in currencies other than the US dollar
to US
dollars
. This hedge accounting program started on
1 January 2020, with the adoption of the hedge accounting
requirements of IFRS 9,
Financial Instruments,
›
Refer to Note
1b
Hedges of net investments in foreign operations
UBS AG applies hedge accounting for certain net investments in
foreign operations
,
which include subsidiaries, branches and
associates. Upon maturity of hedging instruments, typically two
months, the
hedge
relationship is terminated and new
designations are made to reflect any changes in the net
investments in foreign operations.
Consolidated financial statements | UBS AG consolidated financial statements
506
Note 26 Hedge accounting (continued)
Economic relationship between hedged item and hedging
instrument
For hedges designated under IFRS 9, the economic relationship
between the hedged item and the hedging instrument is
determined based on a qualitative analysis of their critical terms.
In cases where hedge designation takes place after origination of
the hedging instrument, a quantitative analysis of the possible
behavior of the hedging derivative and the hedged item during
their respective terms is also performed.
Prior to December 2021, for the fair value hedge of portfolio
interest rate risk related to loans designated under IAS 39, hedge
effectiveness was assessed by comparing changes in the fair value
of the hedged portfolio of loans attributable to changes in the
designated benchmark interest rate with the changes in the fair
value of the interest rate swaps.
Sources of hedge ineffectiveness
In hedges of interest rate risk, hedge ineffectiveness can arise
from mismatches of critical terms and / or the use of different
curves to discount the hedged item and instrument, or from
entering into a hedge relationship after the trade date of the
hedging derivative
.
In hedges of foreign exchange risk related to debt issued,
hedge ineffectiveness can arise due to the discounting of the
hedging instruments and undesignated risk components and lack
of such discounting and risk components in the hedged items.
In hedges of net investments in foreign operations,
ineffectiveness is unlikely unless the hedged net assets fall below
the designated hedged amount. The exceptions are hedges where
the hedging currency is not the same as the currency of the
foreign operation, where the currency basis may cause
ineffectiveness.
Hedge ineffectiveness from financial instruments measured at
fair value through profit or loss is recognized in
Other net income.
Derivatives not designated in hedge accounting relationships
Non-hedge accounted derivatives are mandatorily held for trading
with all fair value movements taken to
Other net income from
financial instruments measured at fair value through profit or loss
,
even when held as an economic hedge or to facilitate client
clearing. The one exception relates to forward points on certain
short- and long-duration foreign exchange contracts acting as
economic hedges, which are reported in
Net interest income
.
All hedges: designated hedging instruments and hedge ineffectiveness
As of or for the year ended
31.12.21
USD million
Notional
amount
Carrying amount
Changes in
fair value of
hedging
instruments
1
Changes in
fair value of
hedged
items
1
Hedge
ineffectiveness
recognized in the
income statement
Derivative
financial
assets
Derivative
financial
liabilities
Interest rate risk
Fair value hedges
89,525
0
7
(1,604)
1,602
(2)
Cash flow hedges
79,573
12
1
(1,185)
990
(196)
Foreign exchange risk
Fair value hedges
2
27,875
87
261
(2,139)
2,181
42
Hedges of net investments in foreign operations
13,761
23
103
492
(491)
0
As of or for the year ended
31.12.20
USD million
Notional
amount
Carrying amount
Changes in
fair value of
hedging
instruments
1
Changes in
fair value of
hedged
items
1
Hedge
ineffectiveness
recognized in the
income statement
Derivative
financial
assets
Derivative
financial
liabilities
Interest rate risk
Fair value hedges
80,759
12
1,231
(1,247)
(16)
Cash flow hedges
72,732
18
2,213
(2,012)
201
Foreign exchange risk
Fair value hedges
2
21,555
449
7
(1,735)
1,715
(20)
Hedges of net investments in foreign operations
13,634
3
193
(939)
938
(2)
1 Amounts used as the basis for recognizing hedge ineffectiveness for the period. 2 The foreign currency basis spread of cross -currency swaps designated as hedging derivatives is excluded from the hedge
accounting designation and accounted for as a cost of hedging with amounts deferred in Other comprehensive income within Equity.
507
Note 26 Hedge accounting (continued)
Fair value hedges: designated hedged items
USD million
31.12.21
31.12.20
Interest rate
risk
FX risk
Interest rate
risk
FX risk
Debt issued measured at amortized cost
Carrying amount of designated debt issued
21,653
11,392
24,247
10,889
261
761
Funding from UBS Group AG
Carrying amount of designated debt instruments
53,047
16,483
46,182
10,666
218
1,640
Other financial assets measured at amortized cost – debt securities
Carrying amount of designated debt securities
2,677
3,242
(7)
(38)
Loans and advances to customers
1
Carrying amount of designated loans
13,835
10,374
of which: accumulated amount of fair value hedge adjustment
2
(109)
100
of which: accumulated amount of fair value hedge adjustment subject to amortization attributable to the
portion of the portfolio that ceased to be part of hedge accounting
2
3
111
1 Prior to 31 December 2021, these amounts were designated in fair value hedges of portfolio interest rate risk under IAS 39. 2 As of 31 December 2021, the amount was presented within Loans and advances to
customers, whereas prior to 1 January 2021 amounts were presented within either Other financial assets measured at amortized cost or Other financial liabilities measured at amortized cost.
Fair value hedges: profile of the timing of the nominal amount of the hedging instrument
31.12.21
USD billion
Due within
1 month
Due between
1 and 3 months
Due between
3 and 12 months
Due between
1 and 5 years
Due after
5 years
Total
Interest rate swaps
0
8
10
49
22
90
Cross-currency swaps
1
1
6
13
6
28
31.12.20
USD billion
Due within
1 month
Due between
1 and 3 months
Due between
3 and 12 months
Due between
1 and 5 years
Due after
5 years
Total
Interest rate swaps
1
0
4
9
46
12
70
Cross-currency swaps
0
0
4
16
2
22
1 In accordance with IFRS 7 requirements, the fair value hedges of portfolio interest rate risk related to loans and advances to customers designated under IAS 39 are not included.
Cash flow hedge reserve on a pre-tax basis
USD million
31.12.21
31.12.20
Amounts related to hedge relationships for which hedge accounting continues to be applied
26
2,560
Amounts related to hedge relationships for which hedge accounting is no longer applied
743
296
Total other comprehensive income recognized directly in equity related to cash flow hedges, on a pre-tax basis
769
2,856
Foreign currency translation reserve on a pre-tax basis
USD million
31.12.21
31.12.20
Amounts related to hedge relationships for which hedge accounting continues to be applied
(569)
Amounts related to hedge relationships for which hedge accounting is no longer applied
268
Total other comprehensive income recognized directly in equity related to hedging instruments designated as net investment hedges, on a pre-tax
basis
201
(302)
Consolidated financial statements | UBS AG consolidated financial statements
508
Note 26 Hedge accounting (continued)
Interest rate benchmark reform
UBS AG continues to apply the relief provided by
Interest Rate
Benchmark Reform
published by the IASB in September 2019.
The interest rate benchmarks subject to interest rate
benchmark reforms to which the Group’s hedge relationships
were exposed were USD LIBOR, CHF LIBOR, GBP LIBOR, AUD
LIBOR, JPY LIBOR, HKD LIBOR, SGD LIBOR and EONIA. Interest rate
swaps designated in hedge relationships referencing GBP, CHF
and JPY LIBOR transitioned to ARRs in December 2021 when LCH
transitioned its contracts. For other currencies, IBOR quotations
remain available, but all new designations will reference ARR. As
such, ARR designations in these currencies will replace IBOR
designations as IBOR contracts mature.
UBS AG’s hedge relationships are also exposed to the Euro
Inter-bank Offered Rate (EURIBOR), which is expected to continue
to exist as a benchmark rate for the foreseeable future. Thus, the
Group does not consider its hedges involving the EURIBOR
benchmark interest rate to be directly affected by interest rate
benchmark reform.
Apart from EURIBOR hedges, UBS AG applied the relief to all
its fair value hedges of interest rate risk and to those cash flow
hedge relationships where the hedged risk is LIBOR or EONIA. The
following table provides details on the notional amount and
carrying amount of the hedging instruments in those hedge
relationships maturing after 31 December 2021, or 30 June 2023
for USD LIBOR hedges, which are the cessation dates of the
applicable interest rate benchmarks.
Hedges of net investments in foreign operations are not
affected by the amendments.
›
Refer to Note
1a item 2j
for more information about the relief
provided by the amendments to IFRS 9, IAS 39 and IFRS 7 related
to interest rate benchmark reform
›
Refer to Note 25 Interest rate benchmark reform for more
information about the transition progress
Hedging instruments referencing LIBOR
31.12.21
31.12.20
Carrying amount
Carrying amount
USD million
Notional
amount
Derivative
financial
assets
Derivative
financial
liabilities
Notional
amount
Derivative
financial
assets
Derivative
financial
liabilities
Interest rate risk
Fair value hedges
23,367
0
0
37,146
1
(12)
Cash flow hedges
10,803
0
0
11,179
0
0
509
Note 27 Post-employment benefit plans
a) Defined benefit plans
UBS AG has established defined benefit plans for its employees in
various jurisdictions
in accordance with local r
egulations and
practices. The major plans are located in Switzerland, the UK, the
US and Germany. The level of benefits depends on the specific
plan rules.
Swiss pension plan
The
Swiss pension plan covers
employees of UBS AG
in
Switzerland and employees of companies in Switzerland having
close economic or financial ties with UBS AG, and exceeds the
minimum benefit requirements under Swiss pension law.
In 2017, a significant number of employees were transferred
from UBS AG to UBS Business Solutions AG, which is a directly
held subsidiary of UBS Group AG. There continues to be one
pooled pension plan in Switzerland covering the employees of
UBS AG and those transferred to UBS Business Solutions AG. UBS
AG and UBS Business Solutions AG both are legal sponsors of
UBS’s Swiss pension plan. Since the date of the employee transfer,
UBS AG and UBS Business Solutions AG apply proportionate
defined benefit accounting, i.e., the net pension cost and the net
pension asset / liability of the Swiss pension plan are allocated
proportionally between UBS AG and UBS Business Solutions AG
based on the aggregated net pension cost and defined benefit
obligations related to their employees.
The Swiss plan offers retirement, disability and survivor benefits
and is governed by a Pension Foundation Board. The
responsibilities of this board are defined by Swiss pension law and
the plan rules.
Savings contributions to the Swiss plan are paid by both
employer and employee. Depending on the age of the employee,
UBS AG pays a savings contribution that ranges between
6.5
%
and
27.5
% of contributory base salary and between
2.8
% and
9
% of contributory variable compensation. UBS AG also pays risk
contributions that are used to fund disability and survivor benefits.
Employees can choose the level of savings contributions paid by
them, which vary between
2.5
% and
13.5
% of contributory base
salary and between
0
% and
9
% of contributory
variable
compensation, depending on age
and choice of savings
contribution category.
The plan offers to members at the normal retirement age of
65
a choice between a lifetime pension and a partial or full lump sum
payment.
Participants can choose to
draw early retirement
benefits starting from the age of
58
, but can also continue
employment and remain active members of the plan until the age
of
70
. Employees have the opportunity to make additional
purchases of benefits to fund early retirement benefits.
The pension amount payable to a participant is calculated by
applying a conversion rate to the accumulated balance of the
participant’s retirement savings account at the retirement date.
The balance is based on credited vested benefits transferred from
previous employers, purchases of benefits, and the employee and
employer contributions that have been made to the participant’s
retirement savings account, as well as the interest accrued. The
annual interest rate credited to participants is determined by the
Pension Foundation Board at the end of each year
.
Although the Swiss plan is based on a defined contribution
promise under Swiss pension law, it is accounted for as a defined
benefit plan under IFRS, primarily because of the obligation to
accrue interest on the participants’ retirement savings accounts
and the payment of lifetime pension benefits.
An actuarial valuation in accordance with Swiss pension law is
performed regularly. Should an underfunded situation on this
basis occur, the Pension Foundation Board is required to take the
necessary measures to ensure that full funding can be expected
to be restored within a maximum period of
10
plan were to become significantly underfunded on a Swiss
pension law basis, additional employer and employee
contributions could be required. In this situation, the risk is shared
between employer and employees, and the employer is not legally
obliged to cover more than
50
% of the additional contributions
required. As of 31 December 2021, the Swiss plan had a technical
funding ratio in accordance with Swiss pension law of
134.8
%
(31 December 2020:
132.6
%).
The investment strategy of the Swiss plan complies with Swiss
pension law, including the rules and regulations relating to
diversification of plan assets, and is derived from the risk budget
defined by the Pension Foundation Board on the basis of regularly
performed asset and liability management analyses. The Pension
Foundation Board strives for a medium - and long -term balance
between assets and liabilities.
As of 31 December 2021, the Swiss plan was in a surplus
situation on an IFRS measurement basis, as the fair value of the
plan’s assets exceeded the defined benefit obligation (DBO) by
USD
3,716
2,739
million). However, a surplus is only recognized on the balance
sheet to the extent that it does not exceed the estimated future
economic benefit, which equals the difference between the
present value of the estimated future net service cost and the
present value of the estimated future employer contributions. As
of both 31 December 2021 and 31 December 2020, the
estimated future economic benefit was zero and hence no net
defined benefit asset was recognized on the balance sheet.
Changes to the Swiss pension plan in 2019
The Pension Foundation Board and UBS AG agreed to implement
measures that took effect from the start of 2019 to support the
long-term financial stability of the Swiss pension fund. The
measures, among other things, lowered the conversion rate and
increased the normal retirement age from 64 to 65. Pensions
already in payment on 1 January 2019 were not affected.
To mitigate the effects
for active participants
, UBS
AG
committed to pay an extraordinary contribution of up to CHF
450
million (USD
494
million
at
the closing exchange rate
on
31 December 2021) in three installments in 2020, 2021 and
2022. Two installments of USD
143
152
paid in 2020 and 2021 reduced OCI with no effect on the income
statement.
The third installment, CHF
116
127
closing exchange rate on 31 December 2021), will be paid in the
first quarter of 2022. The regular employer contributions to be
made to the Swiss plan in 2022 are estimated at USD
277
Consolidated financial statements | UBS AG consolidated financial statements
510
Note 27 Post-employment benefit plans (continued)
UK pension plan
The UK plan is a career -average revalued earnings scheme, and
benefits increase automatically based on UK price inflation. The
normal retirement age for participants in the UK plan is
60
. The
plan provides guaranteed lifetime pension benefits to participants
upon retirement. The UK plan has been closed to new entrants
for more than 20 years and, since 2013, participants are no longer
accruing benefits for current or future service. Instead, employees
participate in the UK defined contribution plan.
The governance responsibility for the UK plan lies jointly with
the Pension Trustee Board and UBS
AG
. The employer
contributions to the pension fund reflect agreed-upon deficit
funding contributions, which are determined on the basis of the
most recent actuarial valuation using assumptions agreed by the
Pension Trustee Board and UBS AG. In the event of underfunding,
UBS AG and the Pension Trustee Board must agree on a deficit
recovery plan within statutory deadlines. In 2021, UBS AG made
no deficit funding contributions to the UK plan. In 2020, UBS AG
made deficit funding contributions of USD
46
The plan assets are invested in a diversified portfolio of
financial assets, which include a longevity swap with an external
insurance company. This swap enables the UK pension plan to
hedge the risk between expected and actual longevity, which
should mitigate volatility in the net defined benefit asset / liability.
As of 31 December 2021, the longevity swap had a negative value
of USD
3
In 2019, UBS AG and the Pension Trustee Board entered into
an arrangement whereby a collateral pool was established to
provide security for the pension fund. The value of the collateral
pool as of 31 December 2021 was USD
337
20
20
: USD
347
million
)
and includes corporate bonds
,
government-related debt instruments and other financial assets.
The arrangement provides the Pension Trustee Board dedicated
access to a pool of assets in the event of UBS AG’s insolvency or
not paying a required deficit funding contribution.
The employer contributions to be made to the UK defined
benefit plan in 2022 are estimated at USD
5
regular funding reviews during the year.
US pension plans
There are two distinct major defined benefit plans in the US, with
a normal retirement age of
65
. Both plans were closed to new
entrants more than 20 years ago. Since they closed, new
employees have participated in a defined contribution plan.
One of the defined benefit plans is a contribution-based plan
in which each participant accrues a percentage of salary in a
retirement savings account. The retirement savings account is
credited annually with interest based on a rate that is linked to
the average yield on one-year US government bonds. For the
other defined benefit plan, retirement benefits accrue based on
the career-average earnings of each individual plan participant.
Former employees with vested benefits have the option to take a
lump sum payment or a lifetime annuity.
As required under applicable pension laws, both plans have
fiduciaries who, together with UBS AG, are responsible for the
governance of the plans.
The plan assets of both plans are invested in diversified
portfolio
s
of finan
cial assets. Each plan’s fiduciaries are
responsible for the investment decisions with respect to the plan
assets.
The employer contributions to be made to the US defined
benefit plans in 2022 are estimated at USD
10
German pension plans
There are two defined benefit plans in Germany, which are both
unfunded. The normal retirement age is
65
directly by UBS AG. In the larger of the two plans each participant
accrues a percentage of salary in a retirement savings account.
The accumulated account balance of the participant is credited on
an annual basis with guaranteed interest at a rate of
5
%. The plan
has been closed to new entrants and all participants younger than
the age of 55 no longer accrue benefits. In the other plan,
amounts are accrued annually based on employee elections
related to variable compensation. For this plan, the accumulated
account balance is credited on an annual basis with a guaranteed
interest rate of
6
% for amounts accrued before 2010, of
4
% for
amounts accrued from 2010 to 2017 and of
0.9
% for amounts
accrued after 2017. Both plans are subject to German pension
law, whereby the responsibility to pay pension benefits when they
are due resides entirely with UBS AG. A portion of the pension
payments is directly increased in line with price inflation.
In June 2021, UBS AG implemented a new funded pension
plan with interest credited to participants equal to actual
investment returns with a guaranteed minimum of
0
%. The plan
was implemented retrospectively for new hires since June 2018
and for all eligible active participants younger than 55 from July
2021. Each participant accrues a percentage of salary in a
retirement savings account.
The employer contributions to be made to the German defined
benefit plans in 2022 are estimated at USD
12
Financial information by plan
The tables on the following pages provide an analysis of the
movement in the net asset / liability recognized on the balance
sheet for defined benefit plans, as well as an analysis of amounts
recognized in net profit and in
Other comprehensive incom
e.
511
Note 27 Post-employment benefit plans (continued)
Defined benefit plans
USD million
Swiss pension plan
UK pension plan
US and German
pension plans
Total
2021
2020
2021
2020
2021
2020
2021
2020
Defined benefit obligation at the beginning of the year
15,619
13,809
4,162
3,654
1,905
1,820
21,686
19,283
Current service cost
285
262
0
0
6
6
291
268
Interest expense
33
40
58
73
30
45
122
159
Plan participant contributions
161
159
0
0
0
0
161
159
Remeasurements
490
677
71
449
(62)
105
498
1,231
of which: actuarial (gains) / losses due to changes in demographic assumptions
26
(53)
14
(14)
4
(34)
45
(101)
of which: actuarial (gains) / losses due to changes in financial assumptions
(385)
565
(3)
505
(78)
134
(466)
1,204
of which: experience (gains) / losses
1,2
848
165
59
(42)
12
5
919
127
Past service cost related to plan amendments
0
0
0
3
4
0
4
3
Curtailments
(49)
0
0
0
0
0
(49)
0
Benefit payments
(602)
(641)
(148)
(148)
(112)
(108)
(862)
(898)
Other movements
0
(4)
0
0
1
0
1
(4)
Foreign currency translation
(456)
1,317
(38)
132
(33)
37
(527)
1,486
Defined benefit obligation at the end of the year
15,480
15,619
4,105
4,162
1,740
1,905
21,324
21,686
of which: amounts owed to active members
8,604
8,290
150
159
222
245
8,976
8,694
of which: amounts owed to deferred members
0
0
1,593
1,879
669
743
2,262
2,622
of which: amounts owed to retirees
6,876
7,329
2,362
2,124
849
917
10,086
10,370
of which: funded plans
15,480
15,619
4,105
4,162
1,222
1,319
20,806
21,100
of which: unfunded plans
0
0
0
0
518
586
518
586
Fair value of plan assets at the beginning of the year
18,358
15,908
4,149
3,658
1,360
1,299
23,867
20,864
Return on plan assets excluding interest income
2
1,319
962
277
388
40
118
1,637
1,469
Interest income
42
48
58
73
26
38
127
159
Employer contributions
450
436
0
46
16
17
466
499
Plan participant contributions
161
159
0
0
0
0
161
159
Benefit payments
(602)
(641)
(148)
(148)
(112)
(108)
(862)
(898)
Administration expenses, taxes and premiums paid
(8)
(8)
0
0
(4)
(4)
(11)
(11)
Other movements
0
0
0
0
1
0
1
0
Foreign currency translation
(524)
1,495
(39)
132
0
0
(563)
1,626
Fair value of plan assets at the end of the year
19,196
18,358
4,297
4,149
1,329
1,360
24,821
23,867
Surplus / (deficit)
3,716
2,739
192
(13)
(411)
(545)
3,497
2,181
Asset ceiling effect at the beginning of the year
2,739
2,099
0
0
0
0
2,739
2,099
Interest expense on asset ceiling effect
8
7
0
0
0
0
8
7
Asset ceiling effect excluding interest expense and foreign currency translation on
asset ceiling effect
1,037
457
0
0
0
0
1,037
457
Foreign currency translation
(68)
176
0
0
0
0
(68)
176
Asset ceiling effect at the end of the year
3,716
2,739
0
0
0
0
3,716
2,739
Net defined benefit asset / (liability) of major plans
0
0
192
(13)
(411)
(545)
(219)
(558)
Net defined benefit asset / (liability) of remaining plans
(96)
(112)
Total net defined benefit asset / (liability)
(315)
(670)
of which: Net defined benefit asset
302
42
of which: Net defined benefit liability
3
(617)
(711)
1 Experience (gains) / losses are a component of actuarial remeasurements of the defined benefit obligation and reflect the effects of differences between the previous actuarial assumptions and what has actually
occurred. 2 Includes the effect from employees being transferred between UBS AG and UBS Business Solutions during the period. 3 Refer to Note 19c.
Consolidated financial statements | UBS AG consolidated financial statements
512
Note 27 Post-employment benefit plans (continued)
Income statement – expenses related to defined benefit plans
1
USD million
Swiss pension plan
UK pension plan
US and German
pension plans
Total
For the year ended
31.12.21
31.12.20
31.12.21
31.12.20
31.12.21
31.12.20
31.12.21
31.12.20
Current service cost
285
262
0
0
6
6
291
268
Interest expense related to defined benefit obligation
33
40
58
73
30
45
122
159
Interest income related to plan assets
(42)
(48)
(58)
(73)
(26)
(38)
(127)
(159)
Interest expense on asset ceiling effect
8
7
0
0
0
0
8
7
Administration expenses, taxes and premiums paid
8
8
0
0
4
4
11
11
Past service cost related to plan amendments
0
0
0
3
4
0
4
3
Curtailments
(49)
0
0
0
0
0
(49)
0
Net periodic expenses recognized in net profit for major plans
243
269
0
3
18
18
261
289
Net periodic expenses recognized in net profit for remaining plans
2
19
17
Total net periodic expenses recognized in net profit
280
306
1 Refer to Note 6. 2 Includes differences between actual and estimated performance award accruals.
Other comprehensive income – gains / (losses) on defined benefit plans
USD million
Swiss pension plan
UK pension plan
US and German
pension plans
Total
For the year ended
31.12.21
31.12.20
31.12.21
31.12.20
31.12.21
31.12.20
31.12.21
31.12.20
Remeasurement of defined benefit obligation
(490)
(677)
(71)
(449)
62
(105)
(498)
(1,231)
of which: change in discount rate assumption
494
(447)
319
(504)
77
(141)
890
(1,092)
of which: change in rate of salary increase assumption
(2)
(132)
0
0
0
0
(2)
(132)
of which: change in rate of pension increase assumption
0
0
(316)
(1)
(1)
1
(317)
0
of which: change in rate of interest credit on retirement savings assumption
(110)
15
0
0
(1)
24
(110)
39
of which: change in life expectancy
0
84
9
22
(3)
50
5
156
of which: change in other actuarial assumptions
(24)
(33)
(23)
(8)
2
(34)
(45)
(75)
of which: experience gains / (losses)
1,2
(848)
(165)
(59)
42
(12)
(5)
(919)
(127)
Return on plan assets excluding interest income
1,319
962
277
388
40
118
1,637
1,469
Asset ceiling effect excluding interest expense and foreign currency translation
(1,037)
(457)
0
0
0
0
(1,037)
(457)
Total gains / (losses) recognized in other comprehensive income for major plans
(207)
(172)
207
(61)
103
14
102
(219)
Total gains / (losses) recognized in other comprehensive income for remaining plans
31
(3)
Total gains / (losses) recognized in other comprehensive income
3
133
(222)
1 Experience (gains) / losses are a component of actuarial remeasurements of the defined benefit obligation and reflect the effects of differences between the previous actuarial assumptions and what has actually
occurred. 2 Includes the effect from employees being transferred between UBS AG and UBS Business Solutions during the period. 3 Refer to the “Statement of comprehensive income.”
The table below provides information about the duration of the DBO and the timing for expected benefit payments.
Swiss pension plan
UK pension plan
US and German pension
plans
1
31.12.21
31.12.20
31.12.21
31.12.20
31.12.21
31.12.20
Duration of the defined benefit obligation (in years)
15.5
16.2
18.8
19.0
9.5
10.2
Maturity analysis of benefits expected to be paid
USD million
Benefits expected to be paid within 12 months
719
710
110
114
123
122
Benefits expected to be paid between 1 and 3 years
1,440
1,442
248
232
237
235
Benefits expected to be paid between 3 and 6 years
2,097
2,100
418
406
338
346
Benefits expected to be paid between 6 and 11 years
3,467
3,408
743
744
495
532
Benefits expected to be paid between 11 and 16 years
3,156
3,184
751
758
392
413
Benefits expected to be paid in more than 16 years
10,733
11,186
3,028
3,206
519
541
1 The duration of the defined benefit obligation represents a weighted average across US and German plans.
513
Note 27 Post-employment benefit plans (continued)
Actuarial assumptions
The actuarial assumptions used for the defined benefit plans are
based on the economic conditions prevailing in the jurisdiction in
which they are offered. Changes in the defined benefit obligation
are most sensitive to changes in the discount rate. The discount
rate is based on the yield of high-quality corporate bonds quoted
in an active market in the currency of the respective plan. A
decrease in the discount curve increases the DBO. UBS
AG
regularly reviews the actuarial assumptions used in calculating the
DBO to determine their continuing relevance.
›
Refer to Note 1a item 5 for a description of the accounting policy
for defined benefit plans
The tables below show the significant actuarial assumptions used in calculating the DBO at the end of the year.
Significant actuarial assumptions
Swiss pension plan
UK pension plan
US and German pension
plans
1
In %
31.12.21
31.12.20
31.12.21
31.12.20
31.12.21
31.12.20
Discount rate
0.34
0.10
1.82
1.42
2.10
1.62
Rate of salary increase
2.01
2.00
0.00
0.00
2.35
2.25
Rate of pension increase
0.00
0.00
3.32
2.89
1.80
1.70
Rate of interest credit on retirement savings
1.04
0.60
0.00
0.00
1.18
1.12
1 Represents weighted average assumptions across US and German plans.
Mortality tables and life expectancies for major plans
Life expectancy at age 65 for a male member currently
aged 65
aged 45
Country
Mortality table
31.12.21
31.12.20
31.12.21
31.12.20
Switzerland
BVG 2020 G with CMI 2019 projections
21.7
21.7
23.3
23.2
UK
S3PA with CMI 2020 projections
1
23.4
23.4
24.5
24.6
USA
Pri-2012 with MP-2021 projection scale
2
21.9
21.8
23.3
23.2
Germany
Dr. K. Heubeck 2018 G
20.5
20.8
23.2
23.6
Life expectancy at age 65 for a female member currently
aged 65
aged 45
Country
Mortality table
31.12.21
31.12.20
31.12.21
31.12.20
Switzerland
BVG 2020 G with CMI 2019 projections
23.4
23.4
25.0
24.9
UK
S3PA with CMI 2020 projections
1
24.9
24.9
26.3
26.3
USA
Pri-2012 with MP-2021 projection scale
2
23.3
23.2
24.7
24.5
Germany
Dr. K. Heubeck 2018 G
23.9
24.3
26.1
26.5
1 In 2020, S3PA with CMI 2019 projections was used. 2 In 2020, Pri-2012 with MP-2020 projection scale was used.
Consolidated financial statements | UBS AG consolidated financial statements
514
Note 27 Post-employment benefit plans (continued)
Sensitivity analysis of significant actuarial assumptions
The table below presents a sensitivity analysis for each significant
actuarial assumption, showing how the DBO would have been
affected by changes in the relevant actuarial assumption that
were reasonably possible at the balance sheet date. Unforeseen
circumstances may arise, which could result in variations that are
outside the range of alternatives deemed reasonably possible.
Caution should be used in extrapolating the sensitivities below on
the DBO, as the sensitivities may not be linear.
Sensitivity analysis of significant actuarial assumptions
1
Increase / (decrease) in defined benefit obligation
Swiss pension plan
UK pension plan
US and German pension plans
USD million
31.12.21
31.12.20
31.12.21
31.12.20
31.12.21
31.12.20
Discount rate
Increase by 50 basis points
(975)
(1,030)
(361)
(370)
(78)
(91)
Decrease by 50 basis points
1,116
1,181
411
423
84
99
Rate of salary increase
Increase by 50 basis points
69
74
–
2
–
2
0
1
Decrease by 50 basis points
(66)
(71)
–
2
–
2
0
(1)
Rate of pension increase
Increase by 50 basis points
749
793
334
358
6
8
Decrease by 50 basis points
–
3
–
3
(306)
(316)
(6)
(7)
Rate of interest credit on retirement savings
Increase by 50 basis points
134
142
–
4
–
4
8
9
Decrease by 50 basis points
(134)
5
(113)
–
4
–
4
(7)
(8)
Life expectancy
Increase in longevity by one additional year
475
566
184
182
56
60
1 The sensitivity analyses are based on a change in one assumption while holding all other assumptions constant, so that interdependencies between the assumptions are excluded. 2 As the plan is closed for future
service, a change in assumption is not applicable. 3 As the assumed rate of pension increase was
0
% as of 31 December 2021 and as of 31 December 2020, a downward change in assumption is not applicable.
4 As the UK plan does not provide interest credits on retirement savings, a change in assumption is not applicable. 5 As of 31 December 2021,
17
% of retirement savings were subject to a legal minimum rate of
1.00
%.
515
Note 27 Post-employment benefit plans (continued)
Fair value of plan assets
The tables below provide information about the composition and fair value of plan assets of the Swiss, UK, US and German pension plans.
Composition and fair value of plan assets
Swiss pension plan
31.12.21
31.12.20
Fair value
Plan asset
allocation %
Fair value
Plan asset
allocation %
USD million
Quoted
in an active
market
Other
Total
Quoted
in an active
market
Other
Total
Cash and cash equivalents
106
0
106
1
123
0
123
1
Real estate / property
Domestic
0
1,994
1,994
10
0
2,018
2,018
11
Foreign
0
328
328
2
0
186
186
1
Investment funds
Equity
Domestic
476
0
476
2
465
0
465
3
Foreign
3,510
1,498
5,009
26
3,540
1,103
4,642
25
Bonds
1
Domestic, AAA to BBB–
2,512
0
2,512
13
2,096
0
2,096
11
Foreign, AAA to BBB–
2,877
0
2,877
15
3,462
0
3,462
19
Foreign, below BBB–
742
0
742
4
734
0
734
4
Other
2,379
2,010
4,389
23
1,894
2,097
3,991
22
Other investments
377
385
762
4
373
266
640
3
Total fair value of plan assets
12,980
6,216
19,196
100
12,688
5,670
18,358
100
31.12.21
31.12.20
Total fair value of plan assets
19,196
18,358
of which:
2
Bank accounts at UBS AG
109
130
UBS AG debt instruments
16
19
UBS Group AG shares
14
13
Securities lent to UBS AG
3
608
796
Property occupied by UBS AG
52
54
Derivative financial instruments, counterparty UBS AG
3
72
84
1 The bond credit ratings are primarily based on S&P’s credit ratings. Ratings AAA to BBB– and below BBB– represent investment grade and non-investment grade ratings, respectively. In cases where credit ratings
from other rating agencies were used, these were converted to the equivalent rating in S&P’s rating classification. 2 Bank accounts at UBS AG encompass accounts in the name of the Swiss pension fund. The other
positions disclosed in the table encompass both direct investments in UBS AG instruments and UBS Group AG shares and indirect investments, i.e., those made through funds that the pension fund invests in.
3 Securities lent to UBS AG and derivative financial instruments are presented gross of any collateral. Securities lent to UBS AG were fully covered by collateral as of 31 December 2021 and 31 December 2020. Net
of collateral, derivative financial instruments amounted to USD
24
9
Consolidated financial statements | UBS AG consolidated financial statements
516
Note 27 Post-employment benefit plans (continued)
Composition and fair value of plan assets (continued)
UK pension plan
31.12.21
31.12.20
Fair value
Plan asset
allocation %
Fair value
Plan asset
allocation %
USD million
Quoted
in an active
market
Other
Total
Quoted
in an active
market
Other
Total
Cash and cash equivalents
147
0
147
3
195
0
195
5
Bonds
1
Domestic, AAA to BBB–
2,605
0
2,605
61
2,150
0
2,150
52
Foreign, AAA to BBB–
372
0
372
9
53
0
53
1
Foreign, below BBB–
4
0
4
0
0
0
0
Investment funds
Equity
Domestic
44
4
47
1
34
3
37
1
Foreign
921
0
921
21
1,077
0
1,077
26
Bonds
1
Domestic, AAA to BBB–
532
147
679
16
919
131
1,050
25
Domestic, below BBB–
12
0
12
0
47
0
47
1
Foreign, AAA to BBB–
179
0
179
4
149
0
149
4
Foreign, below BBB–
115
0
115
3
110
0
110
3
Real estate
Domestic
110
12
122
3
98
16
114
3
Foreign
6
34
40
1
0
37
37
1
Other
(313)
0
(313)
(7)
(86)
0
(86)
(2)
Insurance contracts
0
8
8
0
0
8
8
0
Derivatives
57
(3)
54
1
(3)
0
(3)
0
Asset-backed securities
0
11
11
0
0
6
6
0
Other investments
2
(717)
10
(707)
(16)
(803)
9
(794)
(19)
Total fair value of plan assets
4,074
223
4,297
100
3,940
209
4,149
100
1 The bond credit ratings are primarily based on S&P’s credit ratings. Ratings AAA to BBB– and below BBB– represent investment grade and non-investment grade ratings, respectively. In cases where credit ratings
from other rating agencies were used, these were converted to the equivalent rating in S&P’s rating classification. 2 Mainly relates to repurchase arrangements on UK treasury bonds.
517
Note 27 Post-employment benefit plans (continued)
Composition and fair value of plan assets (continued)
US and German pension plans
31.12.21
31.12.20
Fair value
Plan asset
allocation %
Fair value
Plan asset
allocation %
USD million
Quoted
in an active
market
Other
Total
Quoted
in an active
market
Other
Total
Cash and cash equivalents
11
0
11
1
38
0
38
3
Equity
Domestic
79
0
79
6
0
0
0
0
Foreign
31
0
31
2
0
0
0
0
Bonds
1
Domestic, AAA to BBB–
486
0
486
37
490
0
490
36
Domestic, below BBB–
17
0
17
1
7
0
7
0
Foreign, AAA to BBB–
97
0
97
7
99
0
99
7
Foreign, below BBB–
6
0
6
0
1
0
1
0
Investment funds
Equity
Domestic
3
0
3
0
210
0
210
15
Foreign
56
0
56
4
169
0
169
12
Bonds
1
Domestic, AAA to BBB–
269
0
269
20
195
0
195
14
Domestic, below BBB–
147
0
147
11
34
0
34
2
Foreign, AAA to BBB–
11
0
11
1
19
0
19
1
Foreign, below BBB–
2
0
2
0
3
0
3
0
Real estate
Domestic
0
9
9
1
0
14
14
1
Other
99
0
99
7
79
0
79
6
Insurance contracts
0
1
1
0
0
1
1
0
Other investments
Total fair value of plan assets
1,319
10
1,329
100
1,345
15
1,360
100
1 The bond credit ratings are primarily based on S&P’s credit ratings. Ratings AAA to BBB– and below BBB– represent investment grade and non-investment grade ratings, respectively. In cases where credit ratings
from other rating agencies were used, these were converted to the equivalent rating in S&P’s rating classification.
Consolidated financial statements | UBS AG consolidated financial statements
518
Note 27 Post-employment benefit plans (continued)
b) Defined contribution plans
UBS AG sponsors a number of defined contribution plans, with
the most significant plans in the US and the UK. UBS AG’s
obligation is limited to its contributions made in accordance with
each plan, which may include direct contributions and matching
contributions. Employer contributions to defined contribution
plans are recognized as an expense.
Expenses related to defined contribution plans
For the year ended
USD million
31.12.21
31.12.20
31.12.19
US plan
198
190
173
UK plan
41
36
34
Remaining plans
64
65
71
Total
1
303
291
278
1 Refer to Note 6.
c) Related-party disclosure
UBS AG is the principal provider of banking services for the
pension fund of UBS AG in Switzerland. In this capacity, UBS AG
is engaged to execute most of the pension fund’s banking
activities. These activities can include, but are not limited to,
trading, securities lending and borrowing and derivative
transactions. The non-Swiss UBS AG pension funds do not have a
similar banking relationship with UBS AG.
Also, UBS AG leases certain properties that are owned by the
Swiss pension fund. As of 31 December 2021, the minimum
commitment toward the Swiss pension fund under the related
leases was approximately
USD
5
million
(31
December 20
20
:
USD
6
›
Refer to the “Composition and fair value of plan assets” table in
Note 27a for more information about fair value of investments
in UBS AG and UBS Group AG instruments held by the Swiss
pension fund
The following amounts have been received or paid by UBS AG
from and to the post-employment benefit plans located in
Switzerland, the UK, the US and Germany in respect of these
banking activities and arrangements.
Related-party disclosure
For the year ended
USD million
31.12.21
31.12.20
31.12.19
Received by UBS AG
Fees
22
19
19
Paid by UBS AG
Rent
2
3
2
Dividends, capital repayments and interest
5
10
10
The transaction volumes in UBS Group AG shares and UBS AG debt instruments and the balances of UBS Group AG shares held were:
Transaction volumes – UBS Group AG shares and UBS AG debt instruments
For the year ended
31.12.21
31.12.20
Financial instruments bought by pension funds
UBS Group AG shares (in thousands of shares)
847
1,677
UBS AG debt instruments (par values, USD million)
22
16
Financial instruments sold by pension funds or matured
UBS Group AG shares (in thousands of shares)
1,505
2,556
UBS AG debt instruments (par values, USD million)
22
4
UBS Group AG shares held by post-employment benefit plans
31.12.21
31.12.20
Number of shares (in thousands of shares)
13,456
14,112
Fair value (USD million)
241
199
519
Note 28 Employee benefits: variable compensation
a) Plans offered
UBS has several share-based and other deferred compensation
plans that align the interests of Group Executive Board (GEB)
members and other employees with the interests of investors.
Share-based awards are granted in the form of notional shares
and, where permitted, carry a dividend equivalent that may be paid
in notional shares or cash. Awards are settled by delivering UBS shares
at vesting, except in jurisdictions where this is not permitted for legal
or tax reasons.
Deferred compensation awards are generally forfeitable upon,
among other circumstances, voluntary termination of employment
with UBS. These compensation plans are also designed to meet
regulatory requirements and include special provisions for
regulated employees.
The most significant deferred compensation plans are described
below.
For the majority of variable compensation awards granted
under such plans to employees of UBS AG, the grantor entity is
UBS Group AG. Expenses associated with these awards are
charged by UBS Group AG to UBS AG. For the purpose of this
Note, references to shares refer to UBS Group AG shares.
›
Refer to Note 1a item 5 for a description of the accounting policy
related to share-based and other deferred compensation plans
Mandatory deferred compensation plans
The Long-Term Incentive Plan
The Long-Term Incentive Plan (LTIP) is a mandatory deferred
share-based compensation plan for senior leaders of the Group
(i.e., GEB members and selected senior management).
The number of notional shares delivered at vesting depends on
two equally
weighted performan
ce metrics over a three
-
year
performance period: reported return on common equity tier 1
capital and relative total shareholder return, which measures the
performance of UBS against an index of Global Systemically
Important Banks as determined by the Financial Stability Board.
The final number of shares will vest in three equal installments in
each of the three years following the performance period for GEB
members, and cliff vest in the first year following the performance
period for selected senior management.
The Equity Ownership Plan
The Equity Ownership Plan (EOP) is a deferred share-based
compensation plan for employees who are subject to deferral
requirements but do not receive LTIP awards. Vesting under the
EOP generally occurs in equal installments two and three years
after grant, subject to continued employment and, in certain
cases, achievement of defined performance conditions.
Asset Management employees receive some or all of their EOP
in the form of cash-settled notional investment funds. The
amount delivered depends on the value of the underlying
investment funds at the time of vesting.
The Deferred Contingent Capital Plan
The Deferred Contingent Capital Plan (DCCP) is a deferred
compensation plan for all employees who are subject to deferral
requirements. Such employees are awarded notional additional tier
1 (AT1) capital instruments, which, at the discretion of UBS, can be
settled as a cash payment or a perpetual, marketable AT1 capital
instrument. DCCP awards generally vest in full after five years,
unless the award is written down following the occurrence of a
viability event (as defined under the terms of an AT1 instrument) or
if the Group’s CET1 capital ratio falls below a defined threshold.
Additional performance conditions apply to GEB members.
Interest payments on DCCP awards are paid at the discretion of
UBS. Where interest payments are not permitted, such as for certain
regulated employees, the DCCP award reflects the fair value of the
granted non-interest-bearing award.
Financial advisor variable compensation
In
line with market prac
tice for US wealth management
businesses, the compensation for US financial advisors in Global
Wealth Management predominantly includes production payout
and deferred compensation awards. Production payout is
primarily based on compensable revenue. Financial advisors may
also qualify for deferred compensation awards, which generally
vest over a six-year period. These awards are based on strategic
performance measures, including production and length of
service with UBS. Production payout rates and deferred
compensation awards may be reduced for, among other things,
errors, negligence or carelessness, or failure to comply with the
firm’s rules, standards, practices and / or policies, and / or
applicable laws and regulations.
Financial advisor compensation also includes expenses related
to compensation commitments with financial advisors entered
into at the time of recruitment that are subject to vesting
requirements.
Consolidated financial statements | UBS AG consolidated financial statements
520
Note 28 Employee benefits: variable compensation (continued)
b) Effect on the income statement
Effect on the income statement for the financial year and future
periods
The table below provides information about compensation expenses
related to total variable compensation, including financial advisor
variable compensation, that were recognized in the financial year
ended 31 December 2021, as well as expenses that were deferred
and will be recognized in the income statement for 2022 and later.
The majority of expenses deferred to 2022 and later that are related
to the 2021 performance year pertain to awards granted in February
2022. The total unamortized compensation expense for unvested
share
-
based awards granted up to 31
December
2021
will be
recognized in future periods over a weighted average period of
2.5
years.
Variable compensation including financial advisor variable compensation
Expenses recognized in 2021
Expenses deferred to 2022 and later
1
USD million
Related to the
2021
performance
year
Related to prior
performance
years
Total
Related to the
2021
performance
year
Related to prior
performance
years
Total
Non-deferred cash
2,136
(8)
2,128
0
0
0
Deferred compensation awards
389
399
788
767
606
1,373
of which: Equity Ownership Plan
175
174
350
374
180
553
of which: Deferred Contingent Capital Plan
134
151
285
290
318
608
of which: Long-Term Incentive Plan
51
17
69
48
32
79
of which: Asset Management EOP
29
55
84
56
77
133
Variable compensation – performance awards
2,525
391
2,916
767
606
1,373
Variable compensation – other
2
163
33
196
210
178
388
Total variable compensation excluding financial advisor variable compensation
2,688
424
3,112
978
784
1,762
Financial advisor variable compensation
4,134
248
4,382
434
641
1,075
of which: non-deferred cash
3,858
(6)
3,853
0
0
0
of which: deferred share-based awards
106
51
157
123
146
269
of which: deferred cash-based awards
170
202
372
311
495
806
Compensation commitments with recruited financial advisors
3
41
438
479
662
1,682
2,344
Total FA variable compensation
4,175
685
4,860
1,097
2,323
3,419
Total variable compensation including FA variable compensation
6,863
1,109
7,973
4
2,074
3,107
5,181
1 Estimate as of 31 December 2021. Actual amounts to be expensed in future periods may vary, e.g., due to forfeiture of awards. 2 Consists of replacement payments, forfeiture credits, severance payments,
retention plan payments and interest expense related to the Deferred Contingent Capital Plan. 3 Reflects expenses related to compensation commitments with financial advisors entered into at the time of recruitment
that are subject to vesting requirements. Amounts reflected as deferred expenses represent the maximum deferred exposure as of the balance sheet date. Amounts in the “Related to the 2021 performance year”
columns represent commitments entered into in 2021. 4 Includes USD
631
419
56
million; financial advisor compensation: USD
157
77
5
59
13
521
Note 28 Employee benefits: variable compensation (continued)
Variable compensation including financial advisor variable compensation (continued)
Expenses recognized in 2020
Expenses deferred to 2021 and later
1
USD million
Related to the
2020
performance
year
Related to prior
performance
years
Total
Related to the
2020
performance
year
Related to prior
performance
years
Total
Non-deferred cash
1,948
(29)
1,920
0
0
0
Deferred compensation awards
329
704
1,034
734
277
1,011
of which: Equity Ownership Plan
131
315
446
298
67
365
of which: Deferred Contingent Capital Plan
108
339
448
271
189
459
of which: Long-Term Incentive Plan
41
11
52
46
9
55
of which: Asset Management EOP
49
39
88
120
12
132
Variable compensation – performance awards
2,278
675
2,953
734
277
1,011
Variable compensation – other
2
109
92
201
176
189
364
Total variable compensation excluding financial advisor variable compensation
2,387
768
3,155
909
465
1,375
Financial advisor variable compensation
3,356
233
3,589
350
602
952
of which: non-deferred cash
3,154
0
3,154
0
0
0
of which: deferred share-based awards
69
50
119
79
135
214
of which: deferred cash-based awards
133
183
316
271
467
738
Compensation commitments with recruited financial advisors
3
22
480
502
473
1,682
2,155
Total FA variable compensation
3,378
713
4,091
822
2,284
3,106
Total variable compensation including FA variable compensation
5,765
1,481
7,246
4
1,732
2,749
4,481
1 Estimate as of 31 December 2020. Actual amounts to be expensed in future periods may vary, e.g., due to forfeiture of awards. 2 Consists of replacement payments, forfeiture credits, severance payments, retention
plan payments and interest expense related to the Deferred Contingent Capital Plan. 3 Reflects expenses related to compensation commitments with financial advisors entered into at the time of recruitment that
are subject to vesting requirements. Amounts reflected as deferred expenses represent the maximum deferred exposure as of the balance sheet date. Amounts in the “Related to the 2020 performance year” columns
represent commitments entered into in 2020. 4 Includes USD
666
498
49
financial advisor compensation: USD
119
88
4
related to role-based allowances; social security: USD
51
34
Variable compensation including financial advisor variable compensation (continued)
Expenses recognized in 2019
Expenses deferred to 2020 and later
1
USD million
Related to the
2019
performance
year
Related to prior
performance
years
Total
Related to the
2019
performance
year
Related to prior
performance
years
Total
Non-deferred cash
1,706
(24)
1,682
0
0
0
Deferred compensation awards
287
576
863
413
592
1,005
of which: Equity Ownership Plan
115
294
410
198
213
412
of which: Deferred Contingent Capital Plan
109
256
365
166
356
521
of which: Long-Term Incentive Plan
38
0
38
23
0
23
of which: Asset Management EOP
25
26
51
26
23
49
Variable compensation – performance awards
1,993
553
2,545
413
592
1,005
Variable compensation – other
2
140
85
225
115
228
343
Total variable compensation excluding financial advisor variable compensation
2,133
638
2,770
528
820
1,348
Financial advisor variable compensation
3,233
268
3,501
197
710
907
of which: non-deferred cash
3,064
0
3,064
0
0
0
of which: deferred share-based awards
57
48
106
54
130
183
of which: deferred cash-based awards
112
219
331
144
580
724
Compensation commitments with recruited financial advisors
3
32
510
542
350
1,617
1,967
Total FA variable compensation
3,265
778
4,043
548
2,327
2,874
Total variable compensation including FA variable compensation
5,398
1,416
6,814
4
1,076
3,146
4,222
1 Estimate as of 31 December 2019. Actual amounts expensed may vary, e.g., due to forfeiture of awards. 2 Consists of replacement payments, forfeiture credits, severance payments, retention plan payments and
interest expense related to the Deferred Contingent Capital Plan. 3 Reflects expenses related to compensation commitments with financial advisors entered into at the time of recruitment that are subject to vesting
requirements. Amounts reflected as deferred expenses represent the maximum deferred exposure as of the balance sheet date. Amounts in the “Related to the 2019 performance year” columns represent commitments
entered into in 2019. 4 Includes USD
595
448
42
USD
106
54
10
allowances; social security: USD
23
22
Consolidated financial statements | UBS AG consolidated financial statements
522
Note 28 Employee benefits: variable compensation (continued)
c) Outstanding share-based compensation awards
Share and performance share awards
Movements in outstanding share-based awards under the EOP during 2021 and 2020 are provided in the table below.
The awards presented are granted by UBS AG, but are based on UBS Group AG shares.
Movements in outstanding share-based compensation awards
Number of shares
2021
Weighted
average grant
date fair
value (USD)
Number of shares
2020
Weighted
average grant
date fair
value (USD)
Outstanding, at the beginning of the year
54,557
13
90,443
14
Awarded during the year
278,756
15
19,229
11
Distributed during the year
(24,176)
13
(55,114)
14
Forfeited during the year
(13,215)
15
0
0
Outstanding, at the end of the year
295,921
15
54,557
13
of which: shares vested for accounting purposes
116,775
53,216
The total carrying amount of the liability related to cash-settled share-based awards as of 31 December 2021 and 31 December 2020
was USD
3
1
d) Valuation
UBS share awards
UBS measures compensation expense based on the average
market price of UBS shares on the grant date as quoted on the
SIX Swiss Exchange, taking into consideration post-vesting sale
and hedge restrictions, non-vesting conditions and market
conditions, where applicable. The fair value of the share awards
subject to post-vesting sale and hedge restrictions is discounted
on the basis of the duration of the post-vesting restriction and is
referenced to the cost of purchasing an at-the-money European
put option for the term of the transfer restriction. The grant date
fair value of notional shares without dividend entitlements also
includes a deduction for the present value of future expected
dividends to be paid between the grant date and distribution.
523
Note 29 Interests in subsidiaries and other entities
a) Interests in subsidiaries
UBS AG defines its significant subsidiaries as those entities that,
either individually or in aggregate, contribute significantly to UBS
AG’s financial position or results of operations, based on a
number of criteria, including the subsidiaries’ equity and
contribution to UBS AG’s total assets and profit or loss before tax,
in accordance with the requirements set by IFRS 12, Swiss
regulations and the rules of the US Securities and Exchange
Commission (the SEC).
Individually significant subsidiaries
The table below lists UBS AG’s individually significant subsidiaries
as of 31 December 2021. Unless otherwise stated, the subsidiaries
listed below have share capital consisting solely of ordinary shares
held entirely by UBS AG, and the proportion of ownership interest
held is equal to the voting rights held by UBS AG.
The country where the respective registered office is located is
also the principal place of business. UBS AG operates through a
global branch network and a significant proportion of its business
activity is conducted outside Switzerland, including in the UK, the
US, Singapore, Hong Kong SAR and other countries. UBS Europe
SE has branches and offices in a number of EU Member States,
including Germany, Italy, Luxembourg and Spain. Share capital is
provided in the currency of the legally registered office.
Individually significant subsidiaries of UBS AG as of 31 December 2021
1
Company
Registered office
Primary business
Share capital in million
Equity interest accumulated in %
UBS Americas Holding LLC
Wilmington, Delaware, USA
Group Functions
USD
4,150.0
2
100.0
UBS Americas Inc.
Wilmington, Delaware, USA
Group Functions
USD
0.0
100.0
UBS Asset Management AG
Zurich, Switzerland
Asset Management
CHF
43.2
100.0
UBS Bank USA
Salt Lake City, Utah, USA
Global Wealth Management
USD
0.0
100.0
UBS Europe SE
Frankfurt, Germany
Global Wealth Management
EUR
446.0
100.0
UBS Financial Services Inc.
Wilmington, Delaware, USA
Global Wealth Management
USD
0.0
100.0
UBS Securities LLC
Wilmington, Delaware, USA
Investment Bank
USD
1,283.1
3
100.0
UBS Switzerland AG
Zurich, Switzerland
Personal & Corporate Banking
CHF
10.0
100.0
1 Includes direct and indirect subsidiaries of UBS AG. 2 Consists of common share capital of USD
1,000
4,150,000,000
. 3 Consists of common share capital of USD
100,000
1,283,000,000
.
Consolidated financial statements | UBS AG consolidated financial statements
524
Note 29 Interests in subsidiaries and other entities (continued)
Other subsidiaries
The table below lists other direct and indirect subsidiaries of UBS AG that are not individually significant but contribute to UBS AG’s
total assets and aggregated profit before tax thresholds and are thus disclosed in accordance with requirements set by the SEC.
Other subsidiaries of UBS AG as of 31 December 2021
Company
Registered office
Primary business
Share capital in million
Equity interest
accumulated in %
UBS Asset Management (Americas) Inc.
Wilmington, Delaware, USA
Asset Management
USD
0.0
100.0
UBS Asset Management (Hong Kong) Limited
Hong Kong SAR, China
Asset Management
HKD
254.0
100.0
UBS Asset Management Life Ltd
London, United Kingdom
Asset Management
GBP
15.0
100.0
UBS Asset Management Switzerland AG
Zurich, Switzerland
Asset Management
CHF
0.5
100.0
UBS Business Solutions US LLC
Wilmington, Delaware, USA
Group Functions
USD
0.0
100.0
UBS Credit Corp.
Wilmington, Delaware, USA
Global Wealth Management
USD
0.0
100.0
UBS (France) S.A.
Paris, France
Global Wealth Management
EUR
133.0
100.0
UBS Fund Management (Luxembourg) S.A.
Luxembourg, Luxembourg
Asset Management
EUR
13.0
100.0
UBS Fund Management (Switzerland) AG
Basel, Switzerland
Asset Management
CHF
1.0
100.0
UBS (Monaco) S.A.
Monte Carlo, Monaco
Global Wealth Management
EUR
49.2
100.0
UBS O‘Connor LLC
Wilmington, Delaware, USA
Asset Management
USD
1.0
100.0
UBS Realty Investors LLC
Boston, Massachusetts, USA
Asset Management
USD
9.0
100.0
UBS Securities Australia Ltd
Sydney, Australia
Investment Bank
AUD
0.3
1
100.0
UBS Securities Hong Kong Limited
Hong Kong SAR, China
Investment Bank
HKD
4,154.2
100.0
UBS Securities Japan Co., Ltd.
Tokyo, Japan
Investment Bank
JPY
34,708.7
100.0
UBS SuMi TRUST Wealth Management Co., Ltd.
Tokyo, Japan
Global Wealth Management
JPY
5,165.0
51.0
1 Includes a nominal amount relating to redeemable preference shares.
Consolidated structured entities
Consolidated structured entities (SEs) include certain investment
funds, securitization vehicles and client investment vehicles. UBS
AG has no individually significant subsidiaries that are SEs.
In 2021 and 2020, UBS AG did not enter into any contractual
obligation that could require UBS AG to provide financial support
to consolidated SEs. In addition, UBS AG did not provide support,
financial or otherwise, to a consolidated SE when UBS AG was
not contractually obligated to do so, nor does UBS AG have any
intention to do so in the future. Furthermore, UBS AG did not
provide support, financial or otherwise, to a previously
unconsolidated SE that resulted in UBS AG controlling the SE
during the reporting period.
525
Note 29 Interests in subsidiaries and other entities (continued)
b) Interests in associates and joint ventures
As of 31 December 2021 and 2020, no associate or joint venture
was individually material to
UBS AG
.
Also
, there were no
significant restrictions on the ability of associates or joint ventures
to transfer funds to UBS AG or its subsidiaries as cash dividends
or to repay loans or advances made. There were no quoted
market prices for any associates or joint ventures of UBS AG.
Investments in associates and joint ventures
USD million
2021
2020
Carrying amount at the beginning of the year
1,557
1,051
Additions
1
388
Reclassifications
1
(386)
0
Share of comprehensive income
150
83
of which: share of net profit
2
105
84
of which: share of other comprehensive income
3
45
(1)
Share of changes in retained earnings
1
(40)
Dividends received
(39)
(33)
Foreign currency translation
(39)
108
Carrying amount at the end of the year
1,243
1,557
of which: associates
1,200
1,513
of which: SIX Group AG, Zurich
4
1,043
965
of which: Clearstream Fund Centre AG, Zurich
1
399
of which: other associates
157
150
of which: joint ventures
43
44
1 In the second quarter of 2021, UBS reclassified its minority investment (
48.8
%) in Clearstream Fund Centre AG (previously Fondcenter AG) of USD
386
sale and sold the investment in the same quarter. Refer to Note 30 for more information. 2 For 2021, consists of USD
79
26
64
million from associates and USD
19
44
1
1
associates. 4 In 2021, UBS AG’s equity interest amounted to
17.31
%. UBS AG is represented on the Board of Directors.
Consolidated financial statements | UBS AG consolidated financial statements
526
Note 29 Interests in subsidiaries and other entities (continued)
c) Unconsolidated structured entities
UBS AG is considered to sponsor another entity if, in addition to
ongoing involvement with
the
entity, it had a key role in
establishing that entity or in bringing together relevant
counterparties for a transaction facilitated by the entity. During
2021
,
U
BS AG
sponsored the creation of various SEs and
interacted with a number of non-sponsored SEs, including
securitization vehicles, client vehicles and certain investment
funds, that UBS AG did not consolidate as of 31 December 2021
because it did not control them.
Interests in unconsolidated structured entities
The table below presents UBS AG’s interests in and maximum
exposure to loss from unconsolidated SEs, as well as the total
assets held by the SEs in which UBS had an interest as of year-
end, except for investment funds sponsored by third parties, for
which the carrying amount of UBS AG’s interest as of year-end
has been disclosed.
Sponsored unconsolidated structured entities in which UBS did
not have an interest at year-end
During 2021 and 2020, UBS AG did not earn material income
from sponsored unconsolidated SEs in which UBS AG did not have
an interest at year-end.
During 2021 and 2020, UBS AG and third parties did not
transfer any assets into sponsored securitization vehicles created
in the year. UBS AG and third parties transferred assets, alongside
deposits and debt issuances (which are assets from the
perspective of the vehicle), of USD
1
2
respectively, into sponsored client vehicles created in 2021 (2020:
USD
0
9
investment funds, transfers arose during the period as investors
invested and redeemed positions, thereby changing the overall
size of the funds, which, when combined with market
movements, resulted in a total closing net asset value of USD
46
billion (31 December 2020: USD
37
Interests in unconsolidated structured entities
31.12.21
USD million, except where indicated
Securitization
vehicles
Client
vehicles
Investment
funds
Total
Maximum
exposure to loss
1
Financial assets at fair value held for trading
246
162
6,743
7,151
7,151
Derivative financial instruments
5
45
155
205
205
Loans and advances to customers
125
125
125
Financial assets at fair value not held for trading
35
100
135
135
Financial assets measured at fair value through other comprehensive income
324
4,525
4,849
4,849
Other financial assets measured at amortized cost
0
2
0
1
250
Total assets
610
3
4,732
7,124
12,466
Derivative financial instruments
2
11
281
294
Total liabilities
2
11
281
294
Assets held by the unconsolidated structured entities in which UBS AG had an
interest (USD billion)
30
4
81
5
103
6
31.12.20
USD million, except where indicated
Securitization
vehicles
Client
vehicles
Investment
funds
Total
Maximum
exposure to loss
1
Financial assets at fair value held for trading
375
131
7,595
8,101
8,101
Derivative financial instruments
6
49
158
213
211
Loans and advances to customers
179
179
179
Financial assets at fair value not held for trading
35
1
2
73
109
109
Financial assets measured at fair value through other comprehensive income
6,624
6,624
6,624
Other financial assets measured at amortized cost
0
2
0
250
Total assets
416
3
6,805
8,005
15,227
Derivative financial instruments
3
11
376
390
0
Total liabilities
3
11
376
390
Assets held by the unconsolidated structured entities in which UBS AG had an
interest (USD billion)
39
4
136
5
89
6
1 For the purpose of this disclosure, maximum exposure to loss amounts do not consider the risk-reducing effects of collateral or other credit enhancements. 2 Represents the carrying amount of loan commitments.
The maximum exposure to loss for these instruments is equal to the notional amount. 3 As of 31 December 2021, USD
0.1
0.6
0.2
0.4
was held in Group Functions – Non-core and Legacy Portfolio. 4 Represents the principal amount outstanding. 5 Represents the market value of total assets. 6 Represents the net asset value of the investment
funds sponsored by UBS AG and the carrying amount of UBS AG’s interests in the investment funds not sponsored by UBS AG. In 2021, UBS AG updated the presentation of this table to remove its interests in
unconsolidated structured investment funds and the corresponding total asset information, where UBS AG’s interest is driven solely from UBS AG’s role as the fund’s investment manager and the fees it receives. This
information is now separately disclosed in the accompanying text on the following page. Prior-period information has been aligned with this new presentation.
527
Note 29 Interests in subsidiaries and other entities (continued)
UBS AG retains or purchases interests in unconsolidated SEs in
the form of direct investments, financing, guarantees, letters of
credit, derivatives, as well as through management contracts.
UBS AG’s maximum exposure to loss is generally equal to the
carrying amount of UBS AG’s interest in the SE, with this subject
to change over time with market movements. Guarantees, letters
of credit and credit derivatives are an exception, with the
contract’s notional amount, adjusted for losses already incurred,
representing the maximum loss that UBS AG is exposed to.
The maximum exposure to loss disclosed in the table on the
previous page does not reflect
UBS AG’s
risk management
activities, including effects from financial instruments that may be
used to economically hedge risks inherent in the unconsolidated
SE or risk-reducing effects of collateral or other credit
enhancements.
In 2021 and 2020, UBS AG did not provide support, financial
or otherwise, to an unconsolidated SE when not contractually
obligated to do so, nor does UBS AG have any intention to do so
in the future.
In 2021 and 2020, income and expenses from interests in
unconsolidated SEs primarily resulted from mark-to-market
movements recognized in
Other net income from financial
instruments measured at fair value through profit of loss
, which
have generally been hedged with other financial instruments, as
well as fee and commission income received from UBS-
sponsored funds.
Interests in securitization vehicles
As of 31 December 2021 and 31 December 2020, UBS AG held
interests, both retained and acquired, in various securitization
vehicles that relate to financing, underwriting, secondary market
and derivative trading activities.
The numbers outlined in the table on the previous page may
differ from the securitization positions presented in the
31
December
2021
Pillar
3
R
eport
, available
under “Pillar
3
disclosures” at
ubs.com/investors
, for the following reasons:
(i) exclusion of synthetic securitizations transacted with entities
that are not SEs and transactions in which UBS AG did not have
an interest because it did not absorb any risk; (ii) a different
measurement basis in certain cases (e.g., IFRS carrying amount
within the previous table compared with net exposure amount
at default for Pillar 3 disclosures) ; and (iii) different classification
of vehicles viewed as sponsored by UBS AG versus sponsored by
third parties.
›
Refer to the 31 December 2021 Pillar 3 Report, available under
“Pillar 3 disclosures” at
ubs.com/investors
,
for more information
Interests in client vehicles
Client vehicles are established predominantly for clients to gain
exposure to specific assets or risk exposures. Such vehicles may
enter into derivative agreements, with UBS or a third party, to
align the cash flows of the entity with the investor’s intended
investment objective, or to introduce other desired risk exposures.
As of 31 December 2021 and 31 December 2020, UBS AG
retained interests in client vehicles sponsored by UBS and third
parties that relate to financing, secondary market and derivative
trading activities, and to hedge structured product offerings.
Interests in investment funds
Investment funds have a collective investment objective, and are
either passively managed, so that any decision making does not
have a substantive effect on variability, or are actively managed
and investors or their governing bodies do not have substantive
voting or similar rights.
UBS AG holds interests in a number of investment funds,
primarily resulting from seed investments or in order to hedge
structured product offerings. In addition to the interests disclosed
in the table on the previous page, UBS AG manages the assets of
various pooled investment funds and receives fees based, in whole
or part, on the net asset value of the fund and
/
or the
performance of the fund. The specific fee structure is determined
based on various market factors and considers the fund’s nature
and the jurisdiction of incorporation, as well as fee schedules
negotiated with clients. These fee contracts represent an interest
in the fund, as they align UBS AG’s exposure with investors,
providing a variable return based on the performance of the
entity. Depending on the structure of the fund, these fees may be
collected directly from the fund
’s
assets and
/
or from the
investors. Any amounts due are collected on a regular basis and
are generally backed by the fund’s assets. Therefore interest in
such funds is not represented by the on-balance sheet fee
receivable but rather by the future exposure to variable fees. The
total assets of such funds were USD
425
395
billion
as
of
31
December
2021
and 31
De
cember
2020,
respectively, and have been excluded from the table on the
previous page. UBS AG did not have any material exposure to loss
from these interests as of 31
December
2021
or as of
31 December 2020.
Consolidated financial statements | UBS AG consolidated financial statements
528
Note 30 Changes in organization and acquisitions and disposals of subsidiaries and businesses
Strategic partnership with Sumitomo Mitsui Trust Holdings
In 2019, UBS AG entered into a strategic wealth management
partnership in Japan with Sumitomo Mitsui Trust Holdings, Inc.
(SuMi Trust Holdings). In January 2020, the first phase was
launched, with operations commencing in the joint venture that
was established to promote the respective services. At the time,
UBS AG and SuMi Trust Holdings also started offering each
other’s products and services to their respective clients.
In the third quarter of 2021, the second phase of the
partnership was completed, with the launch of a new operational
partnership entity, UBS SuMi TRUST Wealth Management Co.,
Ltd., which is
51
%-owned and controlled by UBS AG, requiring
UBS AG to consolidate this entity. The new entity offers global
securities and wealth management capabilities, together with the
custody, real estate, inheritance and wealth transfer expertise of
a Japanese trust banking group. Upon completion of this
transaction in the third quarter of 2021, shareholders’ equity of
UBS AG increased by USD
155
loss.
Disposals of subsidiaries and businesses
Sale of remaining investment in Clearstream Fund Centre AG
In the second quarter of 2021, UBS AG sold its remaining minority
investment in Clearstream Fund Centre AG to Deutsche Börse AG
for CHF
390
majority investment and successful transfer of control of
Fondcenter AG to Deutsche Börse AG in 2020, when UBS AG
recognized a post-tax gain on sale of USD
631
Other
income
. The sale of the remaining
48.8
% investment resulted in
a post-tax gain of USD
37
in
Other income
, with no associated net tax expense. Long-term
commercial cooperation arrangements remain in place for the
provision of services by Clearstream to UBS, including jointly
servicing banks and insurance companies.
Sale of wealth management business in Austria
In the third quarter of 2021, UBS AG completed the sale of its
domestic wealth management business in Austria to LGT. The sale
resulted in a pre-tax gain of USD
100
recognized in
Other income
, and an associated tax expense of
USD
25
Sale of wealth management business in Spain in 2022
In October 2021, UBS AG signed an agreement to sell its domestic
wealth management business in Spain to Singular Bank. The
agreement includes the transition of employees, client
relationships, products and services of the wealth management
business of UBS AG in Spain. The transaction is subject to
customary closing conditions and is expected to close in the third
quarter of 2022.
As of 31 December 2021, the assets and liabilities of the
business were presented in Global Wealth Management as a
disposal group held for sale within
Other non-financial assets
Other non-financial liabilities
647
and USD
823
million, respectively. Upon the closing of the
transaction, UBS
AG
expects to record a pre
-
tax gain of
approximately USD
0.2
Sale of UBS Swiss Financial Advisers AG in 2022
In December 2021, UBS AG signed an agreement to sell its wholly
owned subsidiary UBS Swiss Financial Advisers AG (SFA) to
Vontobel. SFA is an SEC-registered investment advisor and
FINMA-licensed securities firm that offers US clients tailored
investment solutions in a Switzerland-based environment. The
transaction is subject to customary closing conditions and
regulatory approvals and is expected to close in the third quarter
of 2022.
As of 31 December 2021, the assets and liabilities that are
subject to the transaction
were
presented in Global Wealth
Management as a disposal group held for sale within
Other non-
financial assets
Other non-financial liabilities
to USD
446
475
closing of the transaction, UBS AG does not expect a material
effect on profit or loss or shareholders’ equity.
Acquisitions of subsidiaries and businesses in 2022
Acquisition of Wealthfront in 2022
In January 2022, UBS AG entered into an agreement to acquire
Wealthfront, an industry-leading digital wealth management
provider, for a cash consideration of USD
1.4
acquisition is aligned with UBS’s growth strategy in the Americas,
will broaden our reach among affluent investors and will add a
new digital-first offering increasing our distribution capabilities.
The transaction is subject to customary closing conditions,
including regulatory approvals, and is expected to close in the
second half of 2022. Upon the closing of the transaction,
Wealthfront will become a wholly owned subsidiary of UBS AG
and UBS AG expects to recognize additional goodwill and other
intangible assets of approximately USD
1.2
529
Note 31 Related parties
UBS AG defines related parties as associates (entities that are
significantly influenced by UBS), joint ventures (entities in which
UBS shares control with another party), post-employment benefit
plans for UBS AG employees, key management personnel, close
family members of key management personnel and entities that
are, directly or indirectly, controlled or jointly controlled by key
management personnel or their close family members. Key
management personnel is defined as members of the Board of
Directors (BoD) and Executive Board (EB).
a) Remuneration of key management personnel
The Chairman of the BoD has a specific management employment contract and receives pension benefits upon retirement. Total
remuneration of the Chairman of the BoD and all EB members is included in the table below.
Remuneration of key management personnel
USD million, except where indicated
31.12.21
31.12.20
31.12.19
Base salaries and other cash payments
1
30
31
30
Incentive awards – cash
2
17
17
13
Annual incentive award under DCCP
26
26
20
Employer’s contributions to retirement benefit plans
2
2
2
Benefits in kind, fringe benefits (at market value)
1
1
1
Share-based compensation
3
45
45
34
Total
122
122
101
Total (CHF million)
4
112
115
101
1 May include role-based allowances in line with market practice and regulatory requirements. 2 The cash portion may also include blocked shares in line with regulatory requirements. 3 Compensation expense
is based on the share price on grant date taking into account performance conditions. Refer to Note 27 for more information. For EB members, share -based compensation for 2021, 2020 and 2019 was entirely
composed of LTIP awards. For the Chairman of the BoD, the share-based compensation for 2021, 2020 and 2019 was entirely composed of UBS shares. 4 Swiss franc amounts disclosed represent the respective
US dollar amounts translated at the applicable performance award currency exchange rates (2021: USD / CHF
0.92
; 2020: USD / CHF
0.94
; 2019: USD / CHF
0.99
).
The independent members of the BoD do not have employment
or service contracts with UBS AG, and thus are not entitled to
benefits upon termination of their service on the BoD. Payments
to these individuals for their services as external board members
amounted to USD
7.5
6.9
7.0
million (CHF
6.6
7.3
7.3
million) in 2019.
b) Equity holdings of key management personnel
Equity holdings of key management personnel
1
31.12.21
31.12.20
Number of shares held by members of the BoD, EB and parties closely linked to them
2
4,175,515
4,956,640
1 No options were held in 2021 and 2020 by non-independent members of the BoD and any GEB member or any of its related parties. 2 Excludes shares granted under variable compensation plans with forfeiture
provisions.
Of the share totals above, no shares were held by close family
members of key management personnel on 31 December 2021
and 31 December 2020. No shares were held by entities that are
directly or indirectly controlled or jointly controlled by key
management personnel or their close family members on
31 December 2021 and 31 December 2020. As of 31 December
2021, no member of the BoD or EB was the beneficial owner of
more than 1% of UBS Group AG’s shares.
Consolidated financial statements | UBS AG consolidated financial statements
530
Note 31 Related parties (continued)
c) Loans, advances and mortgages to key management personnel
The non-independent members of the BoD and EB members are
granted loans, fixed advances and mortgages in the ordinary
course of business on substantially the same terms and conditions
that are available to other employees, including interest rates and
collateral, neither involve more than the normal risk of
��
andcollectability nor contain any other unfavorable features for the
firm. Independent BoD members are granted loans and
mortgages in the ordinary course of business at general market
conditions.
Movements in the loan, advances and mortgage balances are
as follows.
Loans, advances and mortgages to key management personnel
1
USD million, except where indicated
2021
2020
Balance at the beginning of the year
31
23
Additions
11
13
Reductions
(15)
(5)
Balance at the end of the year
2
28
31
Balance at the end of the year (CHF million)
2, 3
25
28
1 All loans are secured loans. 2 There were no unused uncommitted credit facilities as of 31 December 2021 and 31 December 2020. 3 Swiss franc amounts disclosed represent the respective US dollar amounts
translated at the relevant year-end closing exchange rate.
d) Other related-party transactions with entities controlled by key management personnel
In 2021 and 2020, UBS AG did not enter into transactions with
entities that are
directly or indirectly controlled or jointly
controlled by UBS AG’s key management personnel or their close
family members
and as of 31
December
2021
, 31
December
20
20
and 31
December 201
9
, th
ere were no outstanding
balances related to such transactions. Furthermore, in 2021 and
2020, entities controlled by key management personnel did not
sell any goods or provide any services to UBS AG, and therefore
did not receive any fees from UBS AG. UBS AG also did not
provide services to such entities in 2021 and 2020, and therefore
also received no fees.
531
Note 31 Related parties (continued)
e) Transactions with associates and joint ventures
Loans to and outstanding receivables from associates and joint ventures
USD million
2021
2020
Carrying amount at the beginning of the year
630
982
Additions
133
527
Reductions
(497)
(1,001)
Foreign currency translation
(14)
123
Carrying amount at the end of the year
251
630
of which: unsecured loans and receivables
243
621
Other transactions with associates and joint ventures
As of or for the year ended
USD million
31.12.21
31.12.20
Payments to associates and joint ventures for goods and services received
157
139
Fees received for services provided to associates and joint ventures
104
128
Liabilities to associates and joint ventures
127
91
Commitments and contingent liabilities to associates and joint ventures
7
9
›
Refer to Note 29 for an overview of investments in associates and joint ventures
f) Receivables and payables from / to UBS Group AG and other subsidiaries of UBS Group AG
USD million
31.12.21
31.12.20
Receivables
Loans and advances to customers
1,049
1,470
Financial assets at fair value held for trading
187
76
Other financial assets measured at amortized cost
45
38
Payables
Customer deposits
2,828
3,324
Funding from UBS Group AG
57,295
53,979
Other financial liabilities measured at amortized cost
1,887
1,820
Other financial liabilities designated at fair value
1
2,340
1,375
1 Represents funding recognized from UBS Group AG that is designated at fair value. Refer to Note 19b for more information.
Consolidated financial statements | UBS AG consolidated financial statements
532
Note 32 Invested assets and net new money
The following disclosures provide
a
breakdown of UBS
AG
’s
invested assets and a presentation of their development, including
net new money, as required by the Swiss Financial Market
Supervisory Authority.
Invested assets
Invested assets consist of all client assets managed by or deposited
with UBS AG for investment purposes. Invested assets include
managed fund assets, managed institutional assets, discretionary
and advisory wealth management portfolios, fiduciary deposits,
time deposits, savings accounts, and wealth management
securities or brokerage accounts. All assets held for purely
transactional purposes and custody-only assets, including
corporate client assets held for cash management and
transactional purposes, are excluded from invested assets, as the
Group only administers the assets and does not offer advice on
how they should be invested. Also excluded are non-bankable
assets (e.g., art collections) and deposits from third-party banks
for funding or trading purposes.
Discretionary assets are defined as client assets that UBS AG
decides how to invest. Other invested assets are those where the
client ultimately decides how the assets are invested. When a
single product is created in one business division and sold in
another, it is counted in both the business division managing the
investment and the one distributing it. This results in double
counting within UBS AG total invested assets, as both business
divisions are independently providing a service to their respective
clients, and both add value and generate revenue.
Net new money
Net new money in a reporting period is the amount of invested
assets entrusted to UBS AG by new and existing clients, less those
withdrawn by existing clients and clients who terminated
relationships with UBS AG.
Net new money is calculated using the direct method, under
which inflows and outflows to
/
from invested assets are
determined at the client level, based on transactions. Interest and
dividend income from invested assets are not counted as net new
money inflows. Market and currency movements, as well as fees,
commissions and interest on loans charged, are excluded from net
new money, as are effects resulting from any acquisition or
divestment of a UBS AG subsidiary or business. Reclassifications
between invested assets and custody-only assets as a result of a
change in service level delivered are generally treated as net new
money flows. However, where the change in service level directly
results from an externally imposed regulation or a strategic decision
by UBS AG to exit a market or specific service offering, the one-time
net effect is reported as
Other effects
.
The Investment Bank does not track invested assets and net
new money. However, when a client is transferred from the
Investment Bank to another business division, this may produce
net new money even though the client assets were already with
UBS AG.
Invested assets and net new money
As of or for the year ended
USD billion
31.12.21
31.12.20
Fund assets managed by UBS
419
397
Discretionary assets
1,705
1,459
Other invested assets
2,472
2,331
Total invested assets
1
4,596
4,187
of which: double counts
356
311
Net new money
1
159
127
1 Includes double counts.
Development of invested assets
USD billion
2021
2020
Total invested assets at the beginning of the year
1
4,187
3,607
Net new money
159
127
Market movements
2
339
359
Foreign currency translation
(65)
96
Other effects
(24)
(1)
of which: acquisitions / (divestments)
(5)
0
Total invested assets at the end of the year
1
4,596
4,187
1 Includes double counts. 2 Includes interest and dividend income.
533
Note 33 Currency translation rates
The following table shows the rates of the main currencies used to translate the financial information of UBS AG’s operations with a
functional currency other than the US dollar into US dollars.
Closing exchange rate
Average rate
1
As of
For the year ended
31.12.21
31.12.20
31.12.21
31.12.20
31.12.19
1 CHF
1.10
1.13
1.09
1.07
1.01
1 EUR
1.14
1.22
1.18
1.15
1.12
1 GBP
1.35
1.37
1.37
1.29
1.28
100 JPY
0.87
0.97
0.91
0.94
0.92
1 Monthly income statement items of operations with a functional currency other than the US dollar are translated into US dollars using month-end rates. Disclosed average rates for a year represent an average of 12
month-end rates, weighted according to the income and expense volumes of all operations of UBS AG with the same functional currency for each month. Weighted average rates for individual business divisions may
deviate from the weighted average rates for UBS AG.
Note 34 Events after the reporting period
Russia’s invasion of Ukraine
Russia’s invasion of Ukraine on 24 February 2022 has triggered
disruptions and uncertainties in
the
markets and the global
economy, as well as coordinated implementation of sanctions by
Switzerland, the United States, the European Union, the United
Kingdom and others against Russia and, certain Russian entities
and nationals. These events, together with potential counter-
sanctions and other measures taken by Russia, impact UBS AG’s
businesses.
UBS AG’s country risk exposure to Russia was approximately
USD
0.6
2021. This exposure has been reduced since year-end 2021. In
addition, UBS AG is currently monitoring settlement risk on
certain open transactions with Russian bank
-
or
non
-
bank
counterparties or Russian underlyings, as market closures, the
imposition of exchange controls, sanctions or other measures may
limit our ability to settle existing transactions or to realize on
collateral, which may result in unexpected increases in exposures.
UBS AG’s balance sheet as of 31 December 2021 also included
net assets of USD
51
OOO UBS Bank. As of 3 March 2022, UBS AG also had
approximately USD
0.2
Russian assets as collateral on Lombard lending and other secured
financing in Global Wealth Management.
As of 3 March 2022, UBS identified a small number of Global
Wealth Management clients subject to the recently introduced
sanctions with total loans outstanding of under USD
10
UBS AG continues to closely monitor related effects on its
financial statements, including estimated direct and indirect
impacts on expected credit loss calculations and on fair value
measurement of assets, liabilities and off-balance sheet
exposures. The situation continues to evolve and broader
implications for other counterparties of UBS AG, including
financial institutions, are not possible to assess at this time;
however, there were no material adverse effects on UBS AG’s
financial statements as of 4 March 2022.
›
Refer to “Top and emerging risks” and “Country risk” in the
“Risk management and control” section and to “Performance in
the financial services industry is affected by market conditions
and the macroeconomic climate” in the “Risk factors” section of
this report for more information
Consolidated financial statements | UBS AG consolidated financial statements
534
Note 35 Main differences between IFRS and Swiss GAAP
The consolidated financial statements of UBS AG are prepared in
accordance with International Financial Reporting Standards
(IFRS). The Swiss Financial Market Supervisory Authority (FINMA)
requires financial groups presenting financial statements under
IFRS to provide a narrative explanation of the main differences
between IFRS and Swiss generally accepted accounting principles
(
GAAP
)
(
the FINMA Accounting Ordinance, FINMA Circular
2020/1 “Accounting – banks” and the Banking Ordinance (the
BO)). Included in this Note are the significant differences in the
recognition and measurement between IFRS and the provisions of
the BO and the guidelines of FINMA governing true and fair view
financial statement reporting pursuant to Art. 25 to Art. 42 of the
BO.
1. Consolidation
Under IFRS, all entities that are controlled by the holding entity
are consolidated. Under Swiss GAAP, controlled entities deemed
immaterial to the Group or held only temporarily are exempt from
consolidation, but instead are recorded as participations
accounted for under the equity method of accounting or as
financial investments measured at the lower of cost or market
value.
2. Classification and measurement of financial assets
Under IFRS, debt instruments are measured at amortized cost, fair
value through other comprehensive income (FVOCI) or fair value
through profit or loss (FVTPL), depending on the nature of the
business model within which the asset is held and the
characteristics of the contractual cash flows of the asset. Equity
instruments are accounted for at FVTPL by UBS AG. Under Swiss
GAAP, trading assets and derivatives are measured at FVTPL in line
with IFRS. However, non-trading debt instruments are generally
measured at amortized cost, even when the assets are managed
on a fair value basis. In addition, the measurement of financial
assets in the form of securities depends on the nature of the asset:
debt instruments not held to maturity, i.e., instruments available
for sale, and equity instruments with no permanent holding
intent, are classified as
Financial investments
lower of (amortized) cost or market value. Market value
adjustments up to the original cost amount and realized gains or
losses upon disposal of the investment are recorded in the income
statement as
Other income
from
ordinary activities.
Equity
instruments with a permanent holding intent are classified as
participations in
Non-consolidated investments in subsidiaries and
other participations
Impairment losses are recorded in the income statement as
Impairment of investments in non-consolidated subsidiaries and
other participations.
cost amount and realized gains or losses upon disposal of the
investment are recorded as
Extraordinary income
Extraordinary
expenses
.
3. Fair value option applied to financial liabilities
Under IFRS, UBS AG applies the fair value option to certain
financial liabilities not held for trading. Instruments for which the
fair value option is applied are accounted for at FVTPL. The
amount of change in the fair value attributable to changes in
UBS AG’s own credit is presented in
Other comprehensive income
directly within
Retained earnings
. The fair value option is applied
primarily to issued structured debt instruments
,
certain non
-
structured debt instruments, certain payables under repurchase
agreements and cash collateral on securities lending agreements,
amounts due under u
nit
-
linked investment contracts,
and
brokerage payables.
Under Swiss GAAP, the fair value option can only be applied to
structured debt instruments consisting of a debt host contract and
one or more embedded derivatives that do not relate to own
equity. Furthermore, unrealized changes in fair value attributable
to changes in UBS AG’s own credit are not recognized, whereas
realized own credit is recognized in
.
4. Allowances and provisions for credit losses
Swiss GAAP permit use of IFRS for accounting for allowances and
provisions for credit losses based on an expected credit loss (ECL)
model. UBS AG has chosen to apply the IFRS 9 ECL approach to
the substantial majority of exposures in scope of Swiss GAAP ECL
requirements, including all exposures in scope of ECL under both
Swiss GAAP and IFRS.
In addition, for a small population of exposures within the
scope of Swiss GAAP ECL requirements, which are not subject to
ECL under
IFRS due to classification and measurements
differences,
UBS AG applies an alternative approach
. Where
Pillar 1 internal ratings-based (IRB) models are applied to measure
credit risk, ECL for such exposures is determined by the regulatory
expected loss (EL), with an add-on for scaling up to the residual
maturity of exposures maturing beyond the next 12 months. For
detailed information on r
egulatory EL, refer to the
“
Risk
management and control” section of this report. For exposures
where the Pillar 1 standardized approach (SA) is used to measure
credit risk, ECL is determined using a portfolio approach that
derives a conservative probability of default (PD) and loss given
default (LGD) for the entire portfolio.
5. Hedge accounting
Under IFRS, when cash flow hedge accounting is applied, the fair
value gain or loss on the effective portion of
a
derivative
designated as a cash flow hedge is recognized initially in equity
and reclassified to the income statement when certain conditions
are met. When fair value hedge accounting is applied, the fair
value change of the hedged item attributable to the hedged risk
is reflected in the measurement of the hedged item and is
recognized in the income statement along with the change in the
fair value of the hedging derivative. Under Swiss GAAP, the
effective portion of the fair value change of
a
derivative
instrument designated as a cash flow or as a fair value hedge is
deferred on the balance sheet as
Other assets
Other liabilities
.
The carrying amount of the hedged item designated in fair value
hedges is not adjusted for fair value changes attributable to the
hedged risk.
535
Note 35 Main differences between IFRS and Swiss GAAP (continued)
6. Goodwill and intangible assets
Under IFRS, goodwill acquired in a business combination is not
amortized but tested annually for impairment. Intangible assets
with an indefinite useful life are also not amortized but tested
annually for impairment.
Under Swiss GAAP, goodwill and
intangible assets with indefinite useful lives are amortized over a
period not exceeding five years, unless a longer useful life, which
may not exceed
10
are tested annually for impairment.
7. Post-employment benefit plans
Swiss GAAP permit the use of IFRS or Swiss accounting standards
for post-employment benefit plans, with the election made on a
plan-by-plan basis.
UBS AG has elected to apply IFRS (IAS 19) for the non-Swiss
defined benefit plans in
the
UBS AG standalone financial
statements and Swiss GAAP (FER 16) for the Swiss pension plan
in the UBS AG and the UBS Switzerland AG standalone financial
statements. The requirements of Swiss GAAP are better aligned
with the specific nature of Swiss pension plans, which are hybrid
in that they combine elements of defined contribution and
defined benefit plans, but are treated as defined benefit plans
under IFRS. Key differences between Swiss GAAP and IFRS include
the treatment of dynamic elements, such as future salary increases
and future interest credits on retirement savings, which are not
considered under the static method used in accordance with Swiss
GAAP. Also, the discount rate used to determine the defined
benefit obligation in accordance with IFRS is based on the yield of
high-quality corporate bonds of the market in the respective
pension plan country. The discount rate used in accordance with
Swiss GAAP (i.e., the technical interest rate) is determined by the
Pension Foundation Board based on the expected returns of the
Board’s investment strategy.
For defined benefit plans, IFRS require the full defined benefit
obligation net of the plan assets to be recorded on the balance
sheet subject to the asset ceiling rules, with changes resulting
from remeasurements recognized directly in equity. However, for
non-Swiss defined benefit plans for which IFRS accounting is
elected, changes due to remeasurements are recognized in the
income statement of UBS AG standalone under Swiss GAAP.
Swiss GAAP require employer contributions to the pension
fund to be recognized as personnel expenses in the income
statement. Swiss GAAP also require an assessment of whether,
based on the pension fund’s financial statements prepared in
accordance with Swiss accounting standards (FER 26), an
economic benefit to, or obligation of, the employer arises from
the pension fund that is recognized in the balance sheet when
conditions are met. Conditions for recording a pension asset or
liability would be met if, for example, an employer contribution
reserve is available or the employer is required to contribute to the
reduction of a pension deficit (on an FER 26 basis).
8. Leasing
Under IFRS, a single lease accounting model applies that requires
UBS AG to record a right-of-use (RoU) asset and a corresponding
lease liability on the balance sheet when UBS AG is a lessee in a
lease arrangement. The RoU asset and the lease liability are
recognized when UBS AG acquires control of the physical use of
the asset. The lease liability is measured based on the present
value of the lease payments over the lease term, discounted using
UBS AG’s unsecured borrowing rate. The RoU asset is recorded at
an amount equal to the lease liability but is adjusted for rent
prepayments, initial direct costs, any costs to refurbish the leased
asset and
/
or lease incentives received. The RoU asset is
depreciated over the shorter of the lease term or the useful life of
the underlying asset.
Under Swiss GAAP, leases that transfer substantially all the risks
and rewards, but not necessarily legal title in the underlying
assets, are classified as finance leases. All other leases are
classified as operating leases. Whereas finance leases are
recognized on the balance sheet and measured in line with IFRS,
operating leases are not recognized on the balance sheet, with
payments recognized as
General and administrative expenses
a straight-line basis over the lease term, which commences with
control of the physical use of the asset. Lease incentives are
treated as a reduction of rental expense and recognized on a
consistent basis over the lease term.
9. Netting of derivative assets and liabilities
Under IFRS, derivative assets, derivative liabilities and related cash
collateral not settled to market are reported on a gross basis
unless the restrictive IFRS netting requirements are met: (i)
existence of master netting agreements and related collateral
arrangements that are unconditional and legally enforceable, in
both the normal course of business and the event of default,
bankruptcy or insolvency of UBS AG and its counterparties; and
(ii) UBS AG’s intention to either settle on a net basis or to realize
the asset and settle the liability simultaneously.
Under Swiss
GAAP,
derivative assets
, derivative
liabilities
and related cash
collateral not settled to market are generally reported on a net
agreements are legally enforceable in the event of default,
bankruptcy or insolvency of UBS AG’s counterparties.
10. Negative interest
Under IFRS, negative interest income arising on a financial asset
does not meet the definition of interest income and, therefore,
negative interest on financial assets and negative interest on
financial liabilities are presented within interest expense and
interest income, respectively. Under Swiss GAAP, negative interest
on financial assets is presented within interest income and
negative interest on financial liabilities is presented within interest
expense.
11. Extraordinary income and expense
Certain non-recurring and non-operating income and expense
items, such as realized gains or losses from the disposal of
participations, fixed and intangible assets, a
nd
reversals of
impairments of participations and fixed assets, are classified as
extraordinary items under Swiss GAAP. This distinction is not
available under IFRS
.
p
Consolidated financial statements | UBS AG consolidated financial statements
536
537
Note 36 Supplemental guarantor information required under SEC regulations
Joint liability of UBS Switzerland AG
In 2015, the Personal & Corporate Banking and Wealth
Management businesses booked in Switzerland were transferred
from UBS AG to UBS Switzerland AG through an asset transfer in
accordance with the Swiss Merger Act. Under the terms of the
asset transfer agreement, UBS Switzerland AG assumed joint
liability for contractual obligations of UBS AG existing on the asset
transfer date, including the full and unconditional guarantee of
certain registered debt securities issued by UBS AG. To reflect this
joint liability, UBS Switzerland AG is presented in a separate
column as a subsidiary co-guarantor.
The joint liability of UBS Switzerland AG for contractual
obligations of UBS AG decreased in 2021 by USD
4.4
USD
5.7
billion as of 31
December 2021,
mainly driven by
contractual maturities and, to a lesser extent, early
extinguishments of UBS AG liabilities.
Supplemental guarantor consolidated income statement
USD million
UBS AG
(standalone)
1
UBS
Switzerland AG
(standalone)
1
Other
subsidiaries
2
Elimination
entries
UBS AG
(consolidated)
For the year ended 31 December 2021
Operating income
Interest income from financial instruments measured at amortized cost and
fair value through other comprehensive income
3,130
3,652
2,456
(703)
8,534
Interest expense from financial instruments measured at amortized cost
(2,847)
(520)
(1,024)
1,025
(3,366)
Net interest income from financial instruments measured at fair value through
profit or loss
1,229
254
228
(274)
1,437
Net interest income
1,512
3,386
1,660
48
6,605
Other net income from financial instruments measured at fair value through
profit or loss
3,751
807
1,369
(83)
5,844
Credit loss (expense) / release
65
98
10
(24)
148
Fee and commission income
3,837
5,204
16,151
(770)
24,422
Fee and commission expense
(810)
(481)
(1,450)
755
(1,985)
Net fee and commission income
3,027
4,723
14,702
(14)
22,438
Other income
7,555
221
1,560
(8,396)
941
Total operating income
15,910
9,235
19,300
(8,469)
35,976
Operating expenses
Personnel expenses
3,401
2,098
10,161
1
15,661
General and administrative expenses
4,255
3,442
4,474
(2,696)
9,476
Depreciation, amortization and impairment of non-financial assets
949
285
755
(114)
1,875
Total operating expenses
8,605
5,825
15,390
(2,809)
27,012
Operating profit / (loss) before tax
7,305
3,409
3,910
(5,660)
8,964
Tax expense / (benefit)
203
622
1,090
(11)
1,903
Net profit / (loss)
7,102
2,788
2,820
(5,649)
7,061
Net profit / (loss) attributable to non-controlling interests
0
0
29
0
29
Net profit / (loss) attributable to shareholders
7,102
2,788
2,792
(5,649)
7,032
1 Amounts presented for UBS AG standalone and UBS Switzerland AG standalone represent IFRS standalone information. Refer to the UBS AG standalone and UBS Switzerland AG standalone financial statements
under “Complementary financial information” at ubs.com/investors for information prepared in accordance with Swiss GAAP. 2 The ”Other subsidiaries“ column includes consolidated information for the UBS
Americas Holding LLC, UBS Europe SE and UBS Asset Management AG significant sub-groups, as well as standalone information for other subsidiaries.
Consolidated financial statements | UBS AG consolidated financial statements
538
Note 36 Supplemental guarantor information required under SEC regulations (continued)
Supplemental guarantor consolidated statement of comprehensive income
USD million
UBS AG
(standalone)
1
UBS
Switzerland AG
(standalone)
1
Other
subsidiaries
2
Elimination
entries
UBS AG
(consolidated)
For the year ended 31 December 2021
Comprehensive income attributable to shareholders
Net profit / (loss)
7,102
2,788
2,792
(5,649)
7,032
Other comprehensive income
Other comprehensive income that may be reclassified to the income
statement
Foreign currency translation, net of tax
(1)
(419)
(607)
517
(510)
Financial assets measured at fair value through other comprehensive
income, net of tax
0
(157)
0
(157)
Cash flow hedges, net of tax
(1,129)
(279)
(250)
(17)
(1,675)
Cost of hedging, net of tax
(26)
(26)
Total other comprehensive income that may be reclassified to the
income statement, net of tax
(1,155)
(699)
(1,014)
500
(2,368)
Other comprehensive income that will not be reclassified to the
income statement
Defined benefit plans, net of tax
170
(135)
67
0
102
Own credit on financial liabilities designated at fair value, net of tax
46
46
Total other comprehensive income that will not be reclassified to the
income statement, net of tax
217
(135)
67
0
148
Total other comprehensive income
(939)
(834)
(947)
500
(2,220)
Total comprehensive income attributable to shareholders
6,163
1,954
1,845
(5,149)
4,813
Total comprehensive income attributable to non-controlling interests
13
13
Total comprehensive income
6,163
1,954
1,858
(5,149)
4,826
1 Amounts presented for UBS AG standalone and UBS Switzerland AG standalone represent IFRS standalone information. Refer to the UBS AG standalone and UBS Switzerland AG standalone financial statements
under “Complementary financial information” at ubs.com/investors for information prepared in accordance with Swiss GAAP. 2 The ”Other subsidiaries“ column includes consolidated information for the UBS
Americas Holding LLC, UBS Europe SE and UBS Asset Management AG significant sub-groups, as well as standalone information for other subsidiaries.
539
Note 36 Supplemental guarantor information required under SEC regulations (continued)
Supplemental guarantor consolidated balance sheet
USD million
UBS AG
(standalone)
1
UBS
Switzerland AG
(standalone)
1
Other
subsidiaries
2
Elimination
entries
UBS AG
(consolidated)
As of 31 December 2021
Assets
Cash and balances at central banks
53,839
91,031
47,946
192,817
Loans and advances to banks
39,681
7,066
19,858
(51,245)
15,360
Receivables from securities financing transactions
50,566
5,438
40,585
(21,577)
75,012
Cash collateral receivables on derivative instruments
29,939
779
10,314
(10,518)
30,514
Loans and advances to customers
101,458
230,170
93,252
(26,188)
398,693
Other financial assets measured at amortized cost
8,902
6,828
12,377
(1,870)
26,236
Total financial assets measured at amortized cost
284,385
341,312
224,332
(111,397)
738,632
Financial assets at fair value held for trading
116,370
79
16,740
(2,156)
131,033
of which: assets pledged as collateral that may be
sold or repledged by counterparties
47,891
0
6,073
(10,568)
43,397
Derivative financial instruments
113,426
4,199
35,567
(35,047)
118,145
Brokerage receivables
14,563
7,283
(7)
21,839
Financial assets at fair value not held for trading
37,532
5,413
33,940
(17,243)
59,642
Total financial assets measured at fair value through profit or loss
281,891
9,691
93,531
(54,454)
330,659
Financial assets measured at fair value
through other comprehensive income
1,007
7,837
8,844
Investments in subsidiaries and associates
54,204
37
40
(53,038)
1,243
Property, equipment and software
6,501
1,456
4,048
(293)
11,712
Goodwill and intangible assets
213
6,138
28
6,378
Deferred tax assets
936
7,903
8,839
Other non-financial assets
5,757
2,424
1,656
(1)
9,836
Total assets
634,894
354,921
345,484
(219,154)
1,116,145
Liabilities
Amounts due to banks
34,691
33,453
50,405
(105,448)
13,101
Payables from securities financing transactions
16,711
526
9,910
(21,615)
5,533
Cash collateral payables on derivative instruments
30,260
153
11,845
(10,458)
31,801
Customer deposits
101,093
286,488
142,967
14,287
544,834
Funding from UBS Group AG
57,295
57,295
Debt issued measured at amortized cost
73,045
9,460
(73)
82,432
Other financial liabilities measured at amortized cost
4,477
2,477
5,057
(2,245)
9,765
Total financial liabilities measured at amortized cost
317,572
332,556
220,184
(125,551)
744,762
Financial liabilities at fair value held for trading
25,711
372
7,652
(2,046)
31,688
Derivative financial instruments
116,588
4,053
35,731
(35,063)
121,309
Brokerage payables designated at fair value
30,497
13,548
(1)
44,045
Debt issued designated at fair value
70,660
785
14
71,460
Other financial liabilities designated at fair value
11,127
24,454
(3,167)
32,414
Total financial liabilities measured at fair value through profit or loss
254,584
4,425
82,171
(40,263)
300,916
Provisions
2,023
297
1,153
(21)
3,452
Other non-financial liabilities
1,799
1,278
5,528
(33)
8,572
Total liabilities
575,978
338,556
309,036
(165,868)
1,057,702
Equity attributable to shareholders
58,916
16,365
36,108
(53,287)
58,102
Equity attributable to non-controlling interests
340
340
Total equity
58,916
16,365
36,448
(53,287)
58,442
Total liabilities and equity
634,894
354,921
345,484
(219,154)
1,116,145
1 Amounts presented for UBS AG standalone and UBS Switzerland AG standalone represent IFRS standalone information. Refer to the UBS AG standalone and UBS Switzerland AG standalone financial statements,
available under “Complementary financial information” at ubs.com/investors, for information prepared in accordance with Swiss GAAP. 2 The ”Other subsidiaries“ column includes consolidated information for the
UBS Americas Holding LLC, UBS Europe SE and UBS Asset Management AG significant sub-groups, as well as standalone information for other subsidiaries.
Consolidated financial statements | UBS AG consolidated financial statements
540
Note 36 Supplemental guarantor information required under SEC regulations (continued)
Supplemental guarantor consolidated statement of cash flows
USD million
UBS AG
1
UBS
Switzerland AG
1
Other
1
UBS AG
(consolidated)
For the year ended 31 December 2021
Net cash flow from / (used in) operating activities
5,714
2,131
22,718
30,563
Cash flow from / (used in) investing activities
Purchase of subsidiaries, associates and intangible assets
0
(1)
0
(1)
Disposal of subsidiaries, associates and intangible assets
2
16
0
577
593
Purchase of property, equipment and software
(656)
(276)
(650)
(1,581)
Disposal of property, equipment and software
294
0
1
295
Purchase of financial assets measured at fair value through other comprehensive income
(1,006)
0
(4,795)
(5,802)
Disposal and redemption of financial assets measured at fair value through other comprehensive
income
189
0
4,863
5,052
Net (purchase) / redemption of debt securities measured at amortized cost
(807)
772
(380)
(415)
Net cash flow from / (used in) investing activities
(1,970)
495
(385)
(1,860)
Cash flow from / (used in) financing activities
Net short-term debt issued / (repaid)
(3,073)
(21)
0
(3,093)
Distributions paid on UBS AG shares
(4,539)
0
0
(4,539)
Issuance of debt designated at fair value and long-term debt measured at amortized cost
3
97,250
1,177
193
98,619
Repayment of debt designated at fair value and long-term debt measured at amortized cost
3
(78,385)
(1,093)
(320)
(79,799)
Net cash flows from other financing activities
(280)
0
20
(261)
Net activity related to group internal capital transactions and dividends
5,240
(537)
(4,702)
0
Net cash flow from / (used in) financing activities
16,212
(475)
(4,811)
10,927
Total cash flow
Cash and cash equivalents at the beginning of the year
39,400
93,342
40,689
173,430
Net cash flow from / (used in) operating, investing and financing activities
19,957
2,151
17,523
39,630
Effects of exchange rate differences on cash and cash equivalents
(1,462)
(2,693)
(1,151)
(5,306)
Cash and cash equivalents at the end of the year
4
57,895
92,799
57,061
207,755
of which: cash and balances at central banks
53,729
91,031
47,946
192,706
of which: loans and advances to banks
3,258
1,588
8,975
13,822
of which: money market paper
5
908
179
139
1,227
1 Cash flows generally represent a third-party view from a UBS AG consolidated perspective, except for Net activity related to group internal capital transactions and dividends. 2 Includes cash proceeds from the
sale of the minority stake in Clearstream Fund Centre AG and dividends received from associates. 3 Includes funding from UBS Group AG to UBS AG. 4 Balances with an original maturity of three months or less.
USD
3,408
through other comprehensive income, Financial assets at fair value not held for trading and Other financial assets measured at amortized cost.
541
Note 36 Supplemental guarantor information required under SEC regulations (continued)
Supplemental guarantor consolidated income statement
USD million
UBS AG
(standalone)
1
UBS
Switzerland AG
(standalone)
1
Other
subsidiaries
2
Elimination
entries
UBS AG
(consolidated)
For the year ended 31 December 2020
Operating income
Interest income from financial instruments measured at amortized cost and
fair value through other comprehensive income
3,386
3,636
2,612
(818)
8,816
Interest expense from financial instruments measured at amortized cost
(3,694)
(513)
(1,261)
1,134
(4,333)
Net interest income from financial instruments measured at fair value through
profit or loss
1,103
164
311
(273)
1,305
Net interest income
794
3,288
1,662
43
5,788
Other net income from financial instruments measured at fair value through
profit or loss
4,857
911
1,044
118
6,930
Credit loss (expense) / release
(352)
(286)
(56)
0
(695)
Fee and commission income
3,731
4,585
13,651
(984)
20,982
Fee and commission expense
(644)
(829)
(1,263)
961
(1,775)
Net fee and commission income
3,087
3,756
12,388
(23)
19,207
Other income
4,671
233
2,585
(5,941)
1,549
Total operating income
13,057
7,902
17,623
(5,803)
32,780
Operating expenses
Personnel expenses
3,458
2,017
9,211
0
14,686
General and administrative expenses
3,507
3,313
4,147
(2,481)
8,486
Depreciation, amortization and impairment of non-financial assets
1,013
261
750
(115)
1,909
Total operating expenses
7,978
5,591
14,108
(2,596)
25,081
Operating profit / (loss) before tax
5,079
2,311
3,515
(3,207)
7,699
Tax expense / (benefit)
238
444
912
(107)
1,488
Net profit / (loss)
4,840
1,868
2,603
(3,100)
6,211
Net profit / (loss) attributable to non-controlling interests
0
0
15
0
15
Net profit / (loss) attributable to shareholders
4,840
1,868
2,588
(3,100)
6,196
1 Amounts presented for UBS AG standalone and UBS Switzerland AG standalone represent IFRS standalone information. Refer to the UBS AG standalone and UBS Switzerland AG standalone financial statements
under “Complementary financial information” at ubs.com/investors for information prepared in accordance with Swiss GAAP. 2 The ”Other subsidiaries“ column includes consolidated information for the UBS
Americas Holding LLC, UBS Europe SE and UBS Asset Management AG significant sub-groups, as well as standalone information for other subsidiaries.
Consolidated financial statements | UBS AG consolidated financial statements
542
Note 36 Supplemental guarantor information required under SEC regulations (continued)
Supplemental guarantor consolidated statement of comprehensive income
USD million
UBS AG
(standalone)
1
UBS
Switzerland AG
(standalone)
1
Other
subsidiaries
2
Elimination
entries
UBS AG
(consolidated)
For the year ended 31 December 2020
Comprehensive income attributable to shareholders
Net profit / (loss)
4,840
1,868
2,588
(3,100)
6,196
Other comprehensive income
Other comprehensive income that may be reclassified to the income
statement
Foreign currency translation, net of tax
81
1,228
690
(969)
1,030
Financial assets measured at fair value through other comprehensive
income, net of tax
0
0
137
0
136
Cash flow hedges, net of tax
902
26
101
(18)
1,011
Cost of hedging, net of tax
(13)
(13)
Total other comprehensive income that may be reclassified to the
income statement, net of tax
971
1,254
928
(988)
2,165
Other comprehensive income that will not be reclassified to the
income statement
Defined benefit plans, net of tax
(67)
(107)
40
0
(134)
Own credit on financial liabilities designated at fair value, net of tax
(293)
(293)
Total other comprehensive income that will not be reclassified to the
income statement, net of tax
(360)
(107)
40
0
(427)
Total other comprehensive income
611
1,147
968
(988)
1,738
Total comprehensive income attributable to shareholders
5,451
3,015
3,556
(4,088)
7,934
Total comprehensive income attributable to non-controlling interests
36
36
Total comprehensive income
5,451
3,015
3,592
(4,088)
7,970
1 Amounts presented for UBS AG standalone and UBS Switzerland AG standalone represent IFRS standalone information. Refer to the UBS AG standalone and UBS Switzerland AG standalone financial statements
under “Complementary financial information” at ubs.com/investors for information prepared in accordance with Swiss GAAP. 2 The ”Other subsidiaries“ column includes consolidated information for the UBS
Americas Holding LLC, UBS Europe SE and UBS Asset Management AG significant sub-groups, as well as standalone information for other subsidiaries.
543
Note 36 Supplemental guarantor information required under SEC regulations (continued)
Supplemental guarantor consolidated balance sheet
USD million
UBS AG
(standalone)
1
UBS
Switzerland AG
(standalone)
1
Other
subsidiaries
2
Elimination
entries
UBS AG
(consolidated)
As of 31 December 2020
Assets
Cash and balances at central banks
34,426
91,638
32,167
158,231
Loans and advances to banks
40,171
6,385
19,465
(50,678)
15,344
Receivables from securities financing transactions
56,568
4,026
43,350
(29,735)
74,210
Cash collateral receivables on derivative instruments
32,771
1,543
10,093
(11,671)
32,737
Loans and advances to customers
99,952
228,279
73,513
(20,767)
380,977
Other financial assets measured at amortized cost
8,411
8,084
13,368
(2,644)
27,219
Total financial assets measured at amortized cost
272,299
339,956
191,957
(115,495)
688,717
Financial assets at fair value held for trading
110,812
55
16,260
(1,634)
125,492
of which: assets pledged as collateral that
may be sold or repledged by counterparties
54,468
1
6,247
(13,617)
47,098
Derivative financial instruments
154,313
6,342
44,005
(45,041)
159,618
Brokerage receivables
16,898
7,763
(2)
24,659
Financial assets at fair value not held for trading
46,198
13,068
36,444
(15,672)
80,038
Total financial assets measured at fair value through profit or loss
328,221
19,464
104,473
(62,350)
389,808
Financial assets measured at fair value
through other comprehensive income
187
8,072
8,258
Investments in subsidiaries and associates
53,606
38
439
(52,526)
1,557
Property, equipment and software
6,999
1,335
3,975
(350)
11,958
Goodwill and intangible assets
217
6,234
28
6,480
Deferred tax assets
840
1
8,334
(1)
9,174
Other non-financial assets
6,641
2,063
854
(183)
9,374
Total assets
669,010
362,857
324,337
(230,878)
1,125,327
Liabilities
Amounts due to banks
41,414
34,096
43,066
(107,527)
11,050
Payables from securities financing transactions
17,247
566
18,407
(29,899)
6,321
Cash collateral payables on derivative instruments
35,875
561
12,495
(11,618)
37,313
Customer deposits
98,441
293,371
112,372
23,745
527,929
Funding from UBS Group AG
53,979
53,979
Debt issued measured at amortized cost
75,658
9,687
3
3
85,351
Other financial liabilities measured at amortized cost
5,285
2,567
5,745
(3,175)
10,421
Total financial liabilities measured at amortized cost
327,898
340,848
192,088
(128,470)
732,364
Financial liabilities at fair value held for trading
28,800
335
5,989
(1,529)
33,595
Derivative financial instruments
156,192
5,593
44,359
(45,043)
161,102
Brokerage payables designated at fair value
25,045
13,704
(7)
38,742
Debt issued designated at fair value
58,986
935
(54)
59,868
Other financial liabilities designated at fair value
11,255
23,445
(2,927)
31,773
Total financial liabilities measured at fair value through profit or loss
280,279
5,927
88,433
(49,559)
325,080
Provisions
1,293
301
1,197
2,791
Other non-financial liabilities
2,173
987
3,907
(49)
7,018
Total liabilities
611,643
348,063
285,625
(178,078)
1,067,254
Equity attributable to shareholders
57,367
14,794
38,393
(52,800)
57,754
Equity attributable to non-controlling interests
319
319
Total equity
57,367
14,794
38,712
(52,800)
58,073
Total liabilities and equity
669,010
362,857
324,337
(230,878)
1,125,327
1 Amounts presented for UBS AG standalone and UBS Switzerland AG standalone represent IFRS standalone information. Refer to the UBS AG standalone and UBS Switzerland AG standalone financial statements,
available under “Complementary financial information” at ubs.com/investors, for information prepared in accordance with Swiss GAAP. 2 The ”Other subsidiaries“ column includes consolidated information for the
UBS Americas Holding LLC, UBS Europe SE and UBS Asset Management AG significant sub-groups, as well as standalone information for other subsidiaries.
Consolidated financial statements | UBS AG consolidated financial statements
544
Note 36 Supplemental guarantor information required under SEC regulations (continued)
Supplemental guarantor consolidated statement of cash flows
USD million
UBS AG
1
UBS
Switzerland AG
1
Other
1
UBS AG
(consolidated)
For the year ended 31 December 2020
Net cash flow from / (used in) operating activities
(14,883)
24,661
26,804
36,581
Cash flow from / (used in) investing activities
Purchase of subsidiaries, associates and intangible assets
0
(3)
(43)
(46)
Disposal of subsidiaries, associates and intangible assets
2
14
0
660
674
Purchase of property, equipment and software
(714)
(162)
(697)
(1,573)
Disposal of property, equipment and software
361
0
3
364
Purchase of financial assets measured at fair value through other comprehensive income
(77)
0
(6,213)
(6,290)
Disposal and redemption of financial assets measured at fair value through other comprehensive
income
79
0
4,451
4,530
Net (purchase) / redemption of debt securities measured at amortized cost
(3,021)
132
(1,277)
(4,166)
Net cash flow from / (used in) investing activities
(3,357)
(33)
(3,117)
(6,506)
Cash flow from / (used in) financing activities
Net short-term debt issued / (repaid)
23,828
17
0
23,845
Distributions paid on UBS AG shares
(3,848)
0
0
(3,848)
Issuance of debt designated at fair value and long-term debt measured at amortized cost
3
78,867
1,057
229
80,153
Repayment of debt designated at fair value and long-term debt measured at amortized cost
3
(86,204)
(776)
(118)
(87,099)
Net cash flows from other financing activities
(290)
0
(263)
(553)
Net activity related to group internal capital transactions and dividends
2,984
(1,307)
(1,677)
0
Net cash flow from / (used in) financing activities
15,336
(1,009)
(1,829)
12,498
Total cash flow
Cash and cash equivalents at the beginning of the year
39,598
62,551
17,655
119,804
Net cash flow from / (used in) operating, investing and financing activities
(2,905)
23,619
21,859
42,573
Effects of exchange rate differences on cash and cash equivalents
2,706
7,171
1,175
11,053
Cash and cash equivalents at the end of the year
4
39,400
93,342
40,689
173,430
of which: cash and balances at central banks
34,283
91,638
32,167
158,088
of which: loans and advances to banks
4,085
1,695
8,148
13,928
of which: money market paper
5
1,032
9
374
1,415
1 Cash flows generally represent a third-party view from a UBS AG consolidated perspective, except for Net activity related to group internal capital transactions and dividends. 2 Includes cash proceeds from the
sale of the majority stake in Fondcenter AG and dividends received from associates. 3 Includes funding from UBS Group AG to UBS AG. 4 Balances with an original maturity of three months or less. USD
3,828
million of cash and cash equivalents were restricted. 5 Money market paper is included in the balance sheet under Financial assets at fair value held for trading, Financial assets measured at fair value through other
comprehensive income, Financial assets at fair value not held for trading and Other financial assets measured at amortized cost.
545
Note 36 Supplemental guarantor information required under SEC regulations (continued)
Supplemental guarantor consolidated income statement
USD million
UBS AG
(standalone)
1
UBS
Switzerland AG
(standalone)
1
Other
subsidiaries
2
Elimination
entries
UBS AG
(consolidated)
For the year ended 31 December 2019
Operating income
Interest income from financial instruments measured at amortized cost and
fair value through other comprehensive income
4,864
4,048
3,719
(1,928)
10,703
Interest expense from financial instruments measured at amortized cost
(6,547)
(737)
(2,317)
2,298
(7,303)
Net interest income from financial instruments measured at fair value through
profit or loss
1,177
(228)
394
(327)
1,015
Net interest income
(506)
3,083
1,796
42
4,415
Other net income from financial instruments measured at fair value through
profit or loss
5,116
924
1,114
(322)
6,833
Credit loss (expense) / release
(51)
7
(33)
0
(78)
Fee and commission income
3,285
4,342
12,527
(997)
19,156
Fee and commission expense
(674)
(819)
(1,188)
986
(1,696)
Net fee and commission income
2,610
3
3,523
3
11,338
(11)
17,460
Other income
4,899
259
1,960
(6,442)
677
Total operating income
12,069
7,796
16,176
(6,733)
29,307
Operating expenses
Personnel expenses
3,251
1,936
8,614
0
13,801
General and administrative expenses
3,467
3,181
4,565
(2,627)
8,586
Depreciation, amortization and impairment of non-financial assets
954
221
772
(196)
1,751
Total operating expenses
7,672
5,338
13,951
(2,823)
24,138
Operating profit / (loss) before tax
4,396
2,458
2,225
(3,911)
5,169
Tax expense / (benefit)
175
514
530
(21)
1,198
Net profit / (loss)
4,221
1,944
1,695
(3,890)
3,971
Net profit / (loss) attributable to non-controlling interests
0
0
6
0
6
Net profit / (loss) attributable to shareholders
4,221
1,944
1,689
(3,889)
3,965
1 Amounts presented for UBS AG standalone and UBS Switzerland AG standalone represent IFRS standalone information. Refer to the UBS AG standalone and UBS Switzerland AG standalone financial statements
under “Complementary financial information” at ubs.com/investors for information prepared in accordance with Swiss GAAP. 2 The ”Other subsidiaries“ column includes consolidated information for the UBS
Americas Holding LLC, UBS Europe SE and UBS Asset Management AG significant sub-groups, as well as standalone information for other subsidiaries. 3 Includes the effects of the transfer in 2019 of beneficial
ownership of a portion of Global Wealth Management international business booked in Switzerland from UBS Switzerland AG to UBS AG. Refer to “Note 25 Changes in organization and other events affecting
comparability” in the “UBS AG standalone financial statements” section of the UBS AG Standalone financial statements and regulatory information for the year ended 31 December 2019.
Consolidated financial statements | UBS AG consolidated financial statements
546
Note 36 Supplemental guarantor information required under SEC regulations (continued)
Supplemental guarantor consolidated statement of comprehensive income
USD million
UBS AG
(standalone)
1
UBS
Switzerland AG
(standalone)
1
Other
subsidiaries
2
Elimination
entries
UBS AG
(consolidated)
For the year ended 31 December 2019
Comprehensive income attributable to shareholders
Net profit / (loss)
4,221
1,944
1,689
(3,889)
3,965
Other comprehensive income
Other comprehensive income that may be reclassified to the income
statement
Foreign currency translation, net of tax
5
150
39
(102)
92
Financial assets measured at fair value through other
comprehensive income, net of tax
0
0
117
0
117
Cash flow hedges, net of tax
870
140
147
(15)
1,143
Total other comprehensive income that may be reclassified to the
income statement, net of tax
875
290
303
(117)
1,351
Other comprehensive income that will not be reclassified to the
income statement
Defined benefit plans, net of tax
(89)
(6)
(75)
0
(170)
Own credit on financial liabilities designated at fair value, net of tax
(392)
(392)
Total other comprehensive income that will not be reclassified to
the income statement, net of tax
(481)
(6)
(75)
0
(562)
Total other comprehensive income
394
284
228
(117)
789
Total comprehensive income attributable to shareholders
4,616
2,228
1,917
(4,007)
4,754
Total comprehensive income attributable to non-controlling interests
2
2
Total comprehensive income
4,616
2,228
1,919
(4,007)
4,756
1 Amounts presented for UBS AG standalone and UBS Switzerland AG standalone represent IFRS standalone information. Refer to the UBS AG standalone and UBS Switzerland AG standalone financial statements
under “Complementary financial information” at ubs.com/investors for information prepared in accordance with Swiss GAAP. 2 The ”Other subsidiaries“ column includes consolidated information for the significant
sub-groups UBS Americas Holding LLC, UBS Europe SE and UBS Asset Management AG, as well as standalone information for other subsidiaries.
547
Note 36 Supplemental guarantor information required under SEC regulations (continued)
Supplemental guarantor consolidated statement of cash flows
USD million
UBS AG
1
UBS
Switzerland AG
1
Other
1
UBS AG
(consolidated)
For the year ended 31 December 2019
Net cash flow from / (used in) operating activities
17,531
8,882
(7,608)
18,805
Purchase of subsidiaries, associates and intangible assets
(6)
0
(20)
(26)
Disposal of subsidiaries, associates and intangible assets
2
100
0
14
114
Purchase of property, equipment and software
(628)
(173)
(600)
(1,401)
Disposal of property, equipment and software
10
0
1
11
Purchase of financial assets measured at fair value through other comprehensive income
(10)
0
(3,414)
(3,424)
Disposal and redemption of financial assets measured at fair value through other comprehensive
income
10
0
3,904
3,913
Net (purchase) / redemption of debt securities measured at amortized cost
(1,045)
437
45
(562)
Net cash flow from / (used in) investing activities
(1,569)
264
(70)
(1,374)
Cash flow from / (used in) financing activities
Net short-term debt issued / (repaid)
(17,150)
0
0
(17,149)
Distributions paid on UBS AG shares
(3,250)
0
0
(3,250)
Issuance of debt designated at fair value and long-term debt measured at amortized cost
3
64,285
621
142
65,047
Repayment of debt designated at fair value and long-term debt measured at amortized cost
3
(67,113)
(752)
(1,017)
(68,883)
Net cash flows from other financing activities
(262)
0
(242)
(504)
Net activity related to group internal capital transactions and dividends
3,569
(2,055)
(1,514)
0
Net cash flow from / (used in) financing activities
(19,922)
(2,186)
(2,630)
(24,738)
Total cash flow
Cash and cash equivalents at the beginning of the year
42,895
54,757
28,201
125,853
Net cash flow from / (used in) operating, investing and financing activities
(3,960)
6,961
(10,308)
(7,307)
Effects of exchange rate differences on cash and cash equivalents
664
833
(239)
1,258
Cash and cash equivalents at the end of the year
4
39,598
62,551
17,655
119,804
of which: cash and balances at central banks
36,275
60,926
9,756
106,957
of which: loans and advances to banks
2,697
1,127
7,493
11,317
of which: money market paper
5
626
498
406
1,530
1 Cash flows generally represent a third-party view from a UBS AG consolidated perspective, except for Net activity related to group internal capital transactions and dividends. 2 Includes dividends received from
associates. 3 Includes funding from UBS Group AG to UBS AG. 4 Balances with an original maturity of three months or less. USD
3,192
paper is included in the balance sheet under Financial assets at fair value held for trading, Financial assets measured at fair value through other comprehensive income, Financial assets at fair value not held for trading
and Other financial assets measured at amortized cost.
p
Significant
regulated
subsidiary and
sub-group
information
6
549
Financial and regulatory key figures for our significant regulated
subsidiaries and sub-groups
UBS AG
(standalone)
UBS Switzerland AG
(standalone)
UBS Europe SE
(consolidated)
UBS Americas Holding
LLC
(consolidated)
All values in million, except where indicated
USD
CHF
EUR
USD
Financial and regulatory requirements
Swiss GAAP
Swiss SRB rules
Swiss GAAP
Swiss SRB rules
IFRS
EU regulatory rules
US GAAP
US Basel III rules
As of or for the year ended
31.12.21
31.12.20
31.12.21
31.12.20
31.12.21
31.12.20
31.12.21
31.12.20
Financial information
1
Income statement
Total operating income
12,951
8,490
7,185
1,123
1,054
14,490
12,675
Total operating expenses
8,370
5,472
5,590
800
878
11,925
10,842
Operating profit / (loss) before tax
4,581
3,018
1,595
323
176
2,565
1,833
Net profit / (loss)
4,539
2,452
1,271
227
163
1,812
975
Balance sheet
Total assets
509,024
320,656
316,829
46,411
48,591
209,718
172,385
Total liabilities
456,628
305,919
304,194
42,664
43,896
182,633
144,103
Total equity
52,396
14,736
12,634
3,747
4,696
27,085
28,283
Capital
2
Common equity tier 1 capital
2,764
3,703
13,002
14,384
Additional tier 1 capital
290
290
4,049
3,047
Total going concern capital / Tier 1 capital
3,054
3,993
17,051
17,431
Tier 2 capital
125
736
Total capital
3,054
3,993
17,176
18,166
Total gone concern loss-absorbing capacity
2,414
3
1,784
3
7,000
4
5,600
4
Total loss-absorbing capacity
5,468
5,777
24,051
23,031
Risk-weighted assets and leverage ratio denominator
2
Risk-weighted assets
12,328
13,175
72,979
63,929
Leverage ratio denominator
5
46,660
41,376
188,246
154,609
Supplementary leverage ratio denominator
6
212,167
150,019
Capital and leverage ratios (%)
2
Common equity tier 1 capital ratio
5
Going concern capital ratio / Tier 1 capital ratio
Total capital ratio
Total loss-absorbing capacity ratio
Tier 1 leverage ratio
Supplementary tier 1 leverage ratio
Going concern leverage ratio
5
10.9
Total loss-absorbing capacity leverage ratio
Gone concern capital coverage ratio
Liquidity coverage ratio
2,7
High-quality liquid assets (billion)
89
84
91
92
17
17
32
Net cash outflows (billion)
52
53
64
62
10
11
22
Liquidity coverage ratio (%)
8,9
173
159
143
148
170
151
147
Net stable funding ratio
2,10
Total available stable funding
257,992
225,239
15,358
Total required stable funding
289,195
158,072
8,963
Net stable funding ratio (%)
89
11
142
11
171
Other
Joint and several liability between UBS AG and UBS Switzerland AG
(billion)
12
5
9
1 The financial information disclosed does not represent financial statements under the respective GAAP / IFRS. 2 Refer to the 31 December 2021 Pillar 3 Report, available under “Pillar 3 disclosures” at
ubs.com/investors, for more information. 3 Consists of positions that meet the conditions laid down in Art. 72a–b of the Capital Requirements Regulation (CRR) II with regard to contractual, structural or
legal subordination. 4 Consists of eligible long-term debt that meets the conditions specified in 12 CFR 252.162 of the final TLAC rules. TLAC is the sum of tier 1 capital and eligible long-term debt. 5 Leverage
ratio denominators and going concern leverage ratios for UBS AG standalone and UBS Switzerland AG standalone for 31 December 2020 do not reflect the effects of the temporary exemption that applied from
25 March 2020 until 1 January 2021 and was granted by FINMA in connection with COVID-19. Refer to the “Introduction and basis for preparation” section of the 31 December 2021 Pillar 3 Report. 6 US
regulatory authorities temporarily eased the requirements for the supplementary leverage ratio (the SLR), allowing for the exclusion of US Treasury securities and deposits at the Federal Reserve Banks from the
SLR denominator through March 2021. This exclusion resulted in an increase in the SLR of 170 bps on 31 December 2020. 7 There was no local disclosure requirement for UBS Americas Holding LLC as of
31 December 2020. 8 In the fourth quarter of 2021, the liquidity coverage ratio (the LCR) of UBS AG was 173%, remaining above the prudential requirements communicated by FINMA. 9 In the fourth
quarter of 2021, the LCR of UBS Switzerland AG, which is a Swiss SRB, was 143%, remaining above the prudential requirement communicated by FINMA in connection with the Swiss Emergency Plan. 10 For
UBS AG standalone and UBS Switzerland AG standalone, the local disclosure requirement for the net stable funding ratio (the NSFR) came into force in July 2021. For UBS Europe SE consolidated, the local
disclosure requirement for the NSFR came into force in June 2021. For UBS Americas Holding LLC consolidated, the NSFR requirement became effective as of 1 July 2021 and related disclosures will come into
effect in the second quarter of 2023. 11 In accordance with Art. 17h para. 3 and 4 of the Liquidity Ordinance, UBS AG standalone is required to maintain a minimum NSFR of at least 80% without taking
into account excess funding of UBS Switzerland AG and 100% after taking into account such excess funding. 12 Refer to the “Capital, liquidity and funding, and balance sheet” section of this report for more
information about the joint and several liability. Under certain circumstances, the Swiss Banking Act and FINMA’s Banking Insolvency Ordinance authorize FINMA to modify, extinguish or convert to common
equity liabilities of a bank in connection with a resolution or insolvency of such bank.
Significant regulated subsidiary and sub-group information
550
UBS Group AG is a holding company and conducts substantially
all of its operations through UBS AG and subsidiaries thereof. UBS
Group AG and UBS AG have contributed a significant portion of
their respective capital to, and provide substantial liquidity to,
such
subsidiaries. Many of these subsidiaries are subject to
regulations requiring compliance with minimum capital, liquidity
and similar requirements. The table in this section summarizes the
regulatory capital components and capital ratios of our significant
regulated
subsidiaries and sub
-
groups determined under the
regulatory framework of each subsidiary’s or sub-group’s home
jurisdiction.
›
Refer to “Capital and capital ratios of our significant regulated
subsidiaries” in the “Capital, liquidity and funding, and balance
sheet” section of this report for more information
›
Refer to “Note 23 Restricted and transferred financial assets” in
the “Consolidated financial statements” section of this report for
more information.
Supervisory authorities generally have discretion to impose
higher requirements or to otherwise limit the activities of
subsidiaries. Supervisory authorities also may require entities to
measure capital and leverage ratios on a stressed basis and may
limit the ability of an entity to engage in new activities or take
capital actions based on the results of those tests.
Effective 1 October 2021, UBS Americas Holding LLC is subject
to a stress capital buffer (an SCB) of 7.1%, in addition to minimum
capital requirements. The SCB was determined by the Federal
Reserve Board following the completion of the Comprehensive
Capital Analysis and Review (based on Dodd–Frank Act Stress Test
(DFAST) results and planned future dividends). The SCB, which
replaces the static capital conservation buffer of 2.5%, is subject
to change on an annual basis or as otherwise determined by the
Federal Reserve Board.
Standalone regulatory information for UBS AG and UBS
Switzerland AG, as well as consolidated regulatory information
for UBS Europe SE and UBS Americas Holding LLC, is provided in
the 31 December 2021 Pillar 3 Report, available under “Pillar 3
disclosures” at
ubs.com/investors
.
Standalone financial statements for UBS Group AG, as well as
standalone financial statements and regulatory information for
UBS AG and UBS Switzerland AG, are available under “Holding
company and significant regulated subsidiaries and sub-groups” at
ubs.com/investors.
Additional
regulatory
information
7
553
Table of contents
553
553
554
554
556
556
557
558
558
559
559
559
561
563
563
564
564
564
565
565
566
566
568
568
569
570
570
571
571
571
573
575
575
576
576
576
UBS Group AG consolidated supplemental disclosures required under SEC regulations
554
UBS Group AG consolidated supplemental
disclosures required under SEC regulations
A – Introduction
The following pages contain supplemental UBS Group AG
disclosures that are required under SEC regulations. In September
2020, the SEC issued final rules updating and codifying the
disclosure requirements for banking registrants set forth in
Industry Guide
3, Statistical Disclosure by Bank Holding
Companies. Under the final rules, Industry Guide 3 was rescinded
and replaced with a new Subpart 1400 of Regulation S-K, which
has come into effect for UBS Group AG’s 2021 reporting. Part D
of this section provides the information required by Subpart 1400
of Regulation S-K and where applicable, prior-period comparative
information has been revised to align with the new requirements.
UBS Group AG’s consolidated financial statements have been
prepared in accordance with International Financial Reporting
Standards (IFRS) as issued by the International Accounting
Standards Board (IASB) and are denominated in US dollars (USD),
which is also the functional currency of: UBS Group AG; UBS AG’s
Head Office; UBS AG London Branch; and UBS’s US-based
operations.
555
B – Selected financial data
Key figures
As of or for the year ended
USD million, except where indicated
31.12.21
31.12.20
31.12.19
31.12.18
31.12.17
Group results
Operating income
Operating expenses
Operating profit / (loss) from continuing operations before tax
Net profit / (loss) attributable to shareholders
Diluted earnings per share (USD)
1
Profitability and growth
2
Return on equity (%)
Return on tangible equity (%)
Return on common equity tier 1 capital (%)
Return on risk-weighted assets, gross (%)
Return on leverage ratio denominator, gross (%)
3
Cost / income ratio (%)
Effective tax rate (%)
Net profit growth (%)
Resources
2
Total assets
Equity attributable to shareholders
Common equity tier 1 capital
4
Risk-weighted assets
4
Common equity tier 1 capital ratio (%)
4
Going concern capital ratio (%)
4
Total loss-absorbing capacity ratio (%)
4
Leverage ratio denominator
3,4
Common equity tier 1 leverage ratio (%)
3,4
Going concern leverage ratio (%)
3,4
Total loss-absorbing capacity leverage ratio (%)
4
Net stable funding ratio (%)
5
UBS Group AG consolidated supplemental disclosures required under SEC regulations
556
Key figures (continued)
As of or for the year ended
USD million, except where indicated
31.12.21
31.12.20
31.12.19
31.12.18
31.12.17
Other
Invested assets (USD billion)
6
Personnel (full-time equivalents)
Americas
of which: USA
Asia Pacific
Europe, Middle East and Africa (excluding Switzerland)
of which: UK
of which: rest of Europe (excluding Switzerland)
of which: Middle East and Africa
Switzerland
Market capitalization
7
Total book value per share (USD)
7
Tangible book value per share (USD)
7
Registered ordinary shares (number)
7
Treasury shares (number)
7
1 Refer to “Share information and earnings per share” in the “Consolidated financial statements” section of this report for more information. 2 Refer to the “Targets, aspirations and capital guidance” section of
this report for more information about our performance targets. 3 Leverage ratio denominators and leverage ratios for year 2020 do not reflect the effects of the temporary exemption that applied from 25 March
2020 until 1 January 2021 and was granted by FINMA in connection with COVID-19. Refer to the “Regulatory and legal developments” section of our Annual Report 2020 for more information. 4 Based on the
Swiss systemically relevant bank framework as of 1 January 2020. Refer to the “Capital, liquidity and funding, and balance sheet” section of the report for the respective period for more information. 5 The final
Swiss net stable funding ratio (NSFR) regulation became effective on 1 July 2021. Prior to this date, the NSFR was based on estimated pro forma reporting. Refer to the “Capital, liquidity and funding, and balance
sheet” section of this report for more information. 6 Consists of invested assets for Global Wealth Management, Asset Management and Personal & Corporate Banking. Refer to “Note 32 Invested assets and net
new money” in the “Consolidated financial statements” section of this report for more information. 7 Refer to “UBS shares” in the “Capital, liquidity and funding, and balance sheet” section of this report for more
information.
557
Income statement data
For the year ended
USD million, except where indicated
31.12.21
31.12.20
31.12.19
31.12.18
31.12.17
Net interest income
Other net income from financial instruments measured at fair value through profit or loss
Credit loss (expense) / release
Fee and commission income
Fee and commission expense
Net fee and commission income
Other income
Total operating income
Total operating expenses
Operating profit / (loss) before tax
Tax expense / (benefit)
Net profit / (loss)
Net profit / (loss) attributable to non-controlling interests
Net profit / (loss) attributable to shareholders
Cost / income ratio (%)
Per share data
Basic earnings per share (USD)
1
Diluted earnings per share (USD)
1
Ordinary cash dividends declared per share (CHF)
2,3
Ordinary cash dividends declared per share (USD)
2,3
Rates of return (%)
Return on equity attributable to shareholders
1 Refer to “Share information and earnings per share” in the “Consolidated financial statements” section of this report for more information. 2 Dividends and / or distributions out of the capital contribution reserve
are normally approved and paid in the year subsequent to the reporting period. Beginning in 2020, dividends have been declared in US dollars. The Swiss franc equivalent amount for the 2021 dividend will be
determined after the Annual General Meeting using the exchange rate applicable on that date and is therefore not provided in this table. 3 Refer to “Statement of proposed appropriation of total profit and dividend
distribution out of total profit and capital contribution reserve” in the “Standalone financial statements” section of this report for more information.
Cash dividends received from investments in subsidiaries
In 2021, UBS Group AG received cash dividends of USD 4,672 million (2020: USD 3,853 million; 2019: USD 3,400 million) from its
subsidiaries. Dividends disclosed have been translated to US dollars from the functional currency of the entity paying the dividend,
using the closing exchange rate of the month the dividend was received.
UBS Group AG consolidated supplemental disclosures required under SEC regulations
558
Balance sheet data
USD million
31.12.21
31.12.20
31.12.19
31.12.18
31.12.17
Assets
Cash and balances at central banks
Loans and advances to banks
Receivables from securities financing transactions
Cash collateral receivables on derivative instruments
Loans and advances to customers
Other financial assets measured at amortized cost
Total financial assets measured at amortized cost
Financial assets at fair value held for trading
of which: assets pledged as collateral that may be sold or repledged by counterparties
Derivative financial instruments
Brokerage receivables
Financial assets at fair value not held for trading
Total financial assets measured at fair value through profit or loss
Financial assets measured at fair value through other comprehensive income
Investments in associates
Property, equipment and software
Goodwill and intangible assets
Deferred tax assets
Other non-financial assets
Total assets
Liabilities
Amounts due to banks
Payables from securities financing transactions
Cash collateral payables on derivative instruments
Customer deposits
Debt issued measured at amortized cost
Other financial liabilities measured at amortized cost
Total financial liabilities measured at amortized cost
Financial liabilities at fair value held for trading
Derivative financial instruments
Brokerage payables designated at fair value
Debt issued designated at fair value
Other financial liabilities designated at fair value
Total financial liabilities measured at fair value through profit or loss
Provisions
Other non-financial liabilities
Total liabilities
Equity attributable to shareholders
Equity attributable to non-controlling interests
Total equity
Total liabilities and equity
559
C – Information about the company
Property, plant and equipment
As of 31 December 2021, UBS operated about 690 business and
banking locations worldwide, of which approximately 33% were
in Switzerland, 47% in the Americas, 10% in the rest of Europe,
Middle East and Africa, and 10% in Asia Pacific. Of the business
and banking locations in Switzerland, 30% were owned directly
by UBS, with the remainder, along with most of UBS’s offices
outside Switzerland, being held under commercial leases. These
premises are subject to continuous maintenance and upgrading
and are considered suitable and adequate for current and
anticipated operations.
UBS Group AG consolidated supplemental disclosures required under SEC regulations
560
D – Information required by Subpart 1400 of Regulation S-K
Selected statistical information
The following tables set forth select statistical information
regarding the Group’s banking operations extracted from its
financial statements. Unless otherwise indicated, average
balances for the years ended 31 December 2021, 31 December
2020 and 31 December 2019 are calculated from monthly data.
Unless otherwise indicated, the distinction between domestic
(Swiss) and foreign (non-Swiss) is generally based on the booking
location.
Average balances and interest rates
The following table sets forth average interest-earning assets and
average interest -bearing liabilities, along with the average yield,
for 2021, 2020 and 2019. Refer to “Note 3 Net interest income
and other net income from financial instruments measured at fair
value through profit or loss” in the “Consolidated financial
statements” section of this report for more information about
interest income and interest expense.
For the year ended
31.12.21
31.12.20
31.12.19
USD million, except where indicated
Average
balance
Interest
income
Average
yield (%)
Average
balance
Interest
income
Average
yield (%)
Average
balance
Interest
income
Average
yield (%)
Assets
Balances at central banks
Domestic
Foreign
Loans and advances to banks
Domestic
Foreign
Receivables from securities financing transactions
1
Domestic
Foreign
Loans and advances to customers
Domestic
Foreign
Financial assets at fair value
1,2
Domestic
Foreign
of which: taxable
of which: non-taxable
Other interest-earning assets
Domestic
Foreign
Total interest-earning assets
Net interest income on swaps
Interest income on off-balance sheet securities and other
Interest income and average interest-earning assets
3
3
3
Non-interest-earning assets
4
Total average assets
1 Reverse repurchase agreements are presented on a gross basis and therefore, for the purpose of this disclosure, do not reflect the effect of netting permitted under IFRS. 2 Includes financial assets at fair value
held for trading, financial assets at fair value not held for trading, financial assets at fair value through other comprehensive income and brokerage receivables. 3 For the purpose of this disclosure, negative interest
income on assets is presented as a reduction to interest income, while in the consolidated income statement negative interest income on assets is presented as interest expense. Refer to Note 3 in the “Consolidated
financial statements” section of this report for more information. 4 Mainly includes derivative financial instruments, equity instruments at fair value held for trading and financial assets for unit-linked investment
contracts.
561
Average balances and interest rates (continued)
For the year ended
31.12.21
31.12.20
31.12.19
USD million, except where indicated
Average
balance
Interest
expense
Average
interest
rate (%)
Average
balance
Interest
expense
Average
interest
rate (%)
Average
balance
Interest
expense
Average
interest
rate (%)
Liabilities and equity
Amount due to banks
Domestic
Foreign
Payables from securities financing transactions
1
Domestic
Foreign
Customer deposits
Domestic
of which: demand deposits
of which: savings deposits
of which: time deposits
Foreign
of which: demand deposits
of which: savings deposits
of which: time deposits
Commercial paper
Domestic
Foreign
Other short-term debt issued measured at amortized cost
Domestic
Foreign
Long-term debt issued measured at amortized cost
Domestic
Foreign
Financial liabilities at fair value (excluding debt issued
designated at fair value)
1,2
Domestic
Foreign
Debt issued designated at fair value
Domestic
Foreign
Other interest-bearing liabilities
Domestic
Foreign
Total interest-bearing liabilities
Swap interest on hedged debt issued and other swaps
Interest expense on off-balance sheet securities and other
Interest expense and average interest-bearing liabilities
3
3
3
Non-interest-bearing liabilities
4
Total liabilities
Total equity
Total average liabilities and equity
Net interest income
Net yield on interest-earning assets
1 Repurchase agreements are presented on a gross basis and therefore, for the purpose of this disclosure, do not reflect the effect of netting permitted under IFRS. 2 Includes financial liabilities at fair value held for
trading, other financial liabilities designated at fair value and brokerage payables designated at fair value. 3 For the purpose of this disclosure, negative interest expense on liabilities is presented as a reduction to
interest expense, while in the consolidated income statement negative interest income on liabilities is presented as interest income. Refer to Note 3 in the “Consolidated financial statements” section of this report for
more information. 4 Mainly includes derivative financial instruments, equity instruments at fair value held for trading and financial liabilities related to unit-linked investment contracts.
The percentage of total average interest-earning assets
attributable to foreign activities was 60% for 2021 (2020: 62%;
2019: 64%). The percentage of total average interest-bearing
liabilities attributable to foreign activities was 56% for 2021
(2020: 61%; 2019: 62%). All assets and liabilities are translated
into US dollars at uniform month-end rates. Interest income and
expense are translated at monthly average rates.
Average rates earned and paid on assets and liabilities can
change from period to period based on the changes in interest
rates in general, but are also affected by changes in the currency
mix included in the assets and liabilities. Tax-exempt income is not
recorded on a tax-equivalent basis. For all three years presented,
tax-exempt income is considered to be insignificant and the effect
from such income is therefore negligible.
UBS Group AG consolidated supplemental disclosures required under SEC regulations
562
Analysis of changes in interest income and expense
The following tables provide information by categories of interest-
earning assets and interest-bearing liabilities on the changes in
interest income and expense due to changes in volume and
interest rates for the year ended 31 December 2021 compared
with the year ended 31 December 2020, and for the year ended
31 December 2020 compared with the year ended 31 December
2019. Volume and rate variances have been calculated on
movements in average balances and changes in interest rates.
Changes due to a combination of volume and rates have been
allocated proportionally.
2021 compared with 2020
2020 compared with 2019
Increase / (decrease)
due to changes in
Increase / (decrease)
due to changes in
USD million
Average
volume
Average
interest rate
Net
change
Average
volume
Average
interest rate
Net
change
Interest income from interest-earning assets
Balances at central banks
Domestic
Foreign
Loans and advances to banks
Domestic
Foreign
Receivables from securities financing transactions
Domestic
Foreign
Loans and advances to customers
Domestic
Foreign
Financial assets at fair value
Domestic
Foreign
of which: taxable
of which: non-taxable
Other interest-earning assets
Domestic
Foreign
Interest income
Domestic
Foreign
Total interest income from interest-earning assets
Net interest income on swaps
Interest income on off-balance sheet securities and other
Total interest income
563
Analysis of changes in interest income and expense (continued)
2021 compared with 2020
2020 compared with 2019
Increase / (decrease)
due to changes in
Increase / (decrease)
due to changes in
USD million
Average
volume
Average
interest rate
Net
change
Average
volume
Average
interest rate
Net
change
Interest expense on interest-bearing liabilities
Amount due to banks
Domestic
Foreign
Payables from securities financing transactions
Domestic
Foreign
Customer deposits
Domestic
of which: demand deposits
of which: savings deposits
of which: time deposits
Foreign
of which: demand deposits
of which: savings deposits
of which: time deposits
Commercial paper
Domestic
Foreign
Other short-term debt issued measured at amortized cost
Domestic
Foreign
Long-term debt issued measured at amortized cost
Domestic
Foreign
Financial liabilities at fair value (excluding debt issued designated at fair value)
Domestic
Foreign
Debt issued designated at fair value
Domestic
Foreign
Other interest-bearing liabilities
Domestic
Foreign
Interest expense
Domestic
Foreign
Total interest expense on interest-bearing liabilities
Swap interest on hedged debt issued and other swaps
Interest expense on off-balance sheet securities and other
Total interest expense
UBS Group AG consolidated supplemental disclosures required under SEC regulations
564
Deposits
The following table analyzes average deposits and average rates
on each deposit category for the years ended 31 December 2021,
2020
and
2019
.
For the purpose of this disclosure, foreign
deposits represent deposits from depositors who are based
outside of Switzerland. Deposits by foreign depositors in domestic
offices were
USD
77,011 million
as of 31
December
2021
(31 December 2020: USD 76,167 million; 31 December 2019:
USD 54,251 million).
31.12.21
31.12.20
31.12.19
USD million, except where indicated
Average
deposits
Average
rate (%)
Average
deposits
Average
rate (%)
Average
deposits
Average
rate (%)
Due to banks
Domestic
Demand deposits
Time deposits
Total domestic
Foreign
1
Interest-bearing deposits
Total due to banks
Customer deposits
Domestic
Demand deposits
Savings deposits
Time deposits
Total domestic
Foreign
1
Demand deposits
Savings deposits
Time deposits
Total foreign
Total customer deposits
1 For the purpose of this table, the distinction between foreign and domestic deposits is based on the domicile of the depositor, while foreign and domestic deposits disclosed in previous tables are based on the
booking location.
Uninsured deposits
From the combined total of Due to banks and Customer deposits
as of 31 December 2021, total estimated uninsured deposits were
USD 392 billion (31 December 2020: USD 380 billion;
31 December 2019: USD 318 billion). Uninsured deposits are
deposits that are in excess of local deposit insurance or protection
scheme limits in the key locations in which UBS operates,
calculated based on the respective local regulations, as well as
deposits in uninsured accounts. The main deposit insurance
schemes applicable to UBS deposits are the Swiss depositor
protection scheme in Switzerland (which protects applicable
deposits up to a maximum of CHF 100,000 per client and per
bank or securities firm), the Compensation Scheme of German
Banks, EdB, in combination with the Deposit Protection Fund of
the Association of German Banks in Germany (which protects
applicable deposits up to a maximum of EUR 597 million per
client) and the Federal Deposit Insurance Corporation (the FDIC)
scheme in the Americas (which protects applicable deposits up to
a maximum of USD 250,000 per depositor, per insured bank, for
each account ownership category).
The table below presents the maturity of estimated uninsured
time deposits as of 31 December 2021. Where a depositor holds
multiple accounts, which in aggregate are in excess of a deposit
insurance or protection limit, the insured amount is first allocated
to the account with the shortest time to maturity.
USD million
1
Within 3 months
44,912
3 to 6 months
2,748
6 to 12 months
2,437
Over 12 months
85
Total uninsured time deposits as of 31 December 2021
50,182
1 Amounts are estimated based on the methodologies defined in each local jurisdiction. As of 31 December 2021, there were no US time deposits subject to the FDIC scheme that were in excess of the FDIC insurance
limit.
565
Investments in debt instruments
The table below presents the carrying amount and weighted
average yield of debt instruments presented within Financial
assets measured at fair value through other comprehensive
income and Other financial assets measured at amortized cost on
the balance sheet by contractual maturity bucket. The yield for
each range of maturities is calculated by dividing the annualized
interest income by the average balance of the investment per
contractual maturity bucket. The maturity information presented
does not consider any early redemption features and debt
instruments without fixed maturities are not included.
Within 1 year
1 up to 5 years
5 to 10 years
Over 10 years
Total carrying
amount
USD million, except where indicated
Carrying
amount
Yield (%)
Carrying
amount
Yield (%)
Carrying
amount
Yield (%)
Carrying
amount
Yield (%)
Debt instruments measured at fair value through
other comprehensive income
Asset-backed securities
Government bills/bonds
Corporate and other
Subtotal as of 31 December 2021
Debt securities measured at amortized cost
Asset-backed securities
Government bills/bonds
Corporate and other
Subtotal as of 31 December 2021
Total as of 31 December 2021
Loan portfolio
The table below provides the maturity profile of UBS’s core loan portfolio as of 31 December 2021. The contractual maturity is based
on carrying amounts and includes the effect of callable features. For loans due after one year, a breakdown between fixed and
adjustable or floating interest rates is also provided.
USD million
31.12.21
Within 1 year
1 - 5 years
5 - 15 years
Over 15 years
Total
of which: over 1 year
Fixed rate
Adjustable or
floating rate
Private clients with mortgages
Real estate financing
Large corporate clients
SME clients
Lombard
Credit cards
Commodity trade finance
Other loans and advances to customers
Loans to financial advisors
Total
Allowance for credit losses
For the years ended 31 December 2021, 2020 and 2019, the ratio
of net charge-offs (i.e., write-offs of expected credit loss
allowances to gross carrying amount of the average loans
outstanding) during the period was not material for UBS’s core
loan portfolio, both on an overall basis and on an individual loan
category basis. Total write-offs for 31 December 2021 were USD
137 million (31 December 2020: USD 356 million, 31 December
2019: USD 142 million). Refer to the coverage ratio tables in
“Note 9 Financial assets at amortized cost and other positions in
scope of expected credit loss measurement” in the "Consolidated
financial statements" section of this report for the ratio of
expected credit loss allowances to total loans outstanding at each
period end.
UBS AG consolidated supplemental disclosures required under SEC regulations
566
UBS AG consolidated supplemental
disclosures required under SEC regulations
A
–
The following pages contain supplemental UBS AG disclosures
that are required under SEC regulations. In September 2020, the
SEC issued final rules updating and codifying the disclosure
requirements for banking registrants set forth in Industry Guide
3, Statistical Disclosure by Bank Holding Companies. Under the
final rules, Industry Guide 3 was rescinded and replaced with a
new Subpart 1400 of Regulation S-K, which has come into effect
for UBS AG’s 2021 reporting. Part D of this section provides the
information required by Subpart 1400 of Regulation S-K and
where applicable, prior-period comparative information has been
revised to align with the new requirements.
UBS AG’s consolidated financial statements have been
prepared in accordance with International Financial Reporting
Standards
(IFRS) as issued by the International Accounting
Standards Board (IASB) and are denominated in US dollars (USD),
which is also the functional currency of: UBS AG’s Head Office;
UBS AG London Branch; and UBS AG’s US-based operations.
567
B – Selected financial data
Key figures
As of or for the year ended
USD million, except where indicated
31.12.21
31.12.20
31.12.19
31.12.18
31.12.17
Results
Operating income
Operating expenses
Operating profit / (loss) from continuing operations before tax
Net profit / (loss) attributable to shareholders
Profitability and growth
1
Return on equity (%)
Return on tangible equity (%)
Return on common equity tier 1 capital (%)
Return on risk-weighted assets, gross (%)
Return on leverage ratio denominator, gross (%)
2
Cost / income ratio (%)
Net profit growth (%)
Resources
1
Total assets
Equity attributable to shareholders
Common equity tier 1 capital
3
Risk-weighted assets
3
Common equity tier 1 capital ratio (%)
3
Going concern capital ratio (%)
3
Total loss-absorbing capacity ratio (%)
3
Leverage ratio denominator
2,3
Common equity tier 1 leverage ratio (%)
2,3
Going concern leverage ratio (%)
2,3
Total loss-absorbing capacity leverage ratio (%)
3
UBS AG consolidated supplemental disclosures required under SEC regulations
568
Key figures (continued)
As of or for the year ended
USD million, except where indicated
31.12.21
31.12.20
31.12.19
31.12.18
31.12.17
Other
Invested assets (USD billion)
4
Personnel (full-time equivalents)
Americas
of which: USA
Asia Pacific
Europe, Middle East and Africa (excluding Switzerland)
of which: UK
of which: rest of Europe (excluding Switzerland)
of which: Middle East and Africa
Switzerland
Registered ordinary shares (number)
Treasury shares (number)
1 Refer to the “Targets, aspirations and capital guidance” section of this report for more information about our performance measurement. 2 Leverage ratio denominators and leverage ratios for year 2020 do not
reflect the effects of the temporary exemption that applied from 25 March 2020 until 1 January 2021 and was granted by FINMA in connection with COVID-19. Refer to the “Regulatory and legal developments”
section of our Annual Report 2020 for more information. 3 Based on the Swiss systemically relevant bank framework as of 1 January 2020. Refer to the “Capital, liquidity and funding, and balance sheet” section
of the report for the respective period for more information. 4 Consists of invested assets for Global Wealth Management, Asset Management and Personal & Corporate Banking. Refer to “Note 32 Invested assets
and net new money” in the “Consolidated financial statements” section of this report for more information.
569
Income statement data
For the year ended
USD million, except where indicated
31.12.21
31.12.20
31.12.19
31.12.18
31.12.17
Net interest income
Other net income from financial instruments measured at fair value through profit or loss
Credit loss (expense) / release
Fee and commission income
Fee and commission expense
Net fee and commission income
Other income
Total operating income
Total operating expenses
Operating profit / (loss) before tax
Tax expense / (benefit)
Net profit / (loss)
Net profit / (loss) attributable to preferred noteholders
Net profit / (loss) attributable to non-controlling interests
Net profit / (loss) attributable to shareholders
Cost / income ratio (%)
Rates of return (%)
Return on equity attributable to shareholders
Dividends received from investments in subsidiaries and associates
In 2021, UBS AG received dividends of USD 6,401 million (2020: USD 3,214 million; 2019: USD 3,508 million) from its subsidiaries
and associates. Dividends disclosed have been translated to US dollars from the functional currency of the entity paying the dividend,
using the closing exchange rate of the month the dividend was received.
UBS AG consolidated supplemental disclosures required under SEC regulations
570
Balance sheet data
USD million
31.12.21
31.12.20
31.12.19
31.12.18
31.12.17
Assets
Cash and balances at central banks
Loans and advances to banks
Receivables from securities financing transactions
Cash collateral receivables on derivative instruments
Loans and advances to customers
Other financial assets measured at amortized cost
Total financial assets measured at amortized cost
Financial assets at fair value held for trading
of which: assets pledged as collateral that may be sold or repledged by counterparties
Derivative financial instruments
Brokerage receivables
Financial assets at fair value not held for trading
Total financial assets measured at fair value through profit or loss
Financial assets measured at fair value through other comprehensive income
Investments in associates
Property, equipment and software
Goodwill and intangible assets
Deferred tax assets
Other non-financial assets
Total assets
Liabilities
Amounts due to banks
Payables from securities financing transactions
Cash collateral payables on derivative instruments
Customer deposits
Funding from UBS Group AG
Debt issued measured at amortized cost
Other financial liabilities measured at amortized cost
Total financial liabilities measured at amortized cost
Financial liabilities at fair value held for trading
Derivative financial instruments
Brokerage payables designated at fair value
Debt issued designated at fair value
Other financial liabilities designated at fair value
Total financial liabilities measured at fair value through profit or loss
Provisions
Other non-financial liabilities
Total liabilities
Equity attributable to shareholders
Equity attributable to non-controlling interests
Total equity
Total liabilities and equity
571
C – Information about the company
Property, plant and equipment
As of 31 December 2021, UBS AG operated about 680 business
and banking locations worldwide, of which approximately 33%
were in Switzerland, 48% in the Americas, 10% in the rest of
Europe, Middle East and Africa, and 9% in Asia Pacific. Of the
business and banking locations in Switzerland, 30% were owned
directly by UBS AG, with the remainder, along with most of UBS
AG’s offices outside Switzerland, being held under commercial
leases. These premises are subject to continuous maintenance and
upgrading and are considered suitable and adequate for current
and anticipated operations.
UBS AG consolidated supplemental disclosures required under SEC regulations
572
D – Information required by Subpart 1400 of Regulation S-K
Selected statistical information
The following tables set forth select statistical information
regarding UBS AG’s banking operations extracted from
its
financial statements. Unless otherwise indicated, average
balances for the years ended 31 December 2021, 31 December
2020 and 31 December 2019 are calculated from monthly data.
Unless otherwise indicated, the distinction between domestic
(Swiss) and foreign (non-Swiss) is generally based on the booking
location.
Average balances and interest rates
The following table sets forth average interest-earning assets and
average interest -bearing liabilities, along with the average yield,
for 2021, 2020 and 2019. Refer to “Note 3 Net interest income
and other net income from financial instruments measured at fair
value through profit or loss” in the “Consolidated financial
statements” section of this report for more information about
interest income and interest expense.
For the year ended
31.12.21
31.12.20
31.12.19
USD million, except where indicated
Average
balance
Interest
income
Average
yield (%)
Average
balance
Interest
income
Average
yield (%)
Average
balance
Interest
income
Average
yield (%)
Assets
Balances at central banks
Domestic
Foreign
Loans and advances to banks
Domestic
Foreign
Receivables from securities financing transactions
1
Domestic
Foreign
Loans and advances to customers
Domestic
Foreign
Financial assets at fair value
1,2
Domestic
Foreign
of which: taxable
of which: non-taxable
Other interest-earning assets
Domestic
Foreign
Total interest-earning assets
Net interest income on swaps
Interest income on off-balance sheet securities and other
Interest income and average interest-earning assets
3
3
3
Non-interest-earning assets
4
Total average assets
1 Reverse repurchase agreements are presented on a gross basis and therefore, for the purpose of this disclosure, do not reflect the effect of netting permitted under IFRS. 2 Includes financial assets at fair value
held for trading, financial assets at fair value not held for trading, financial assets at fair value through other comprehensive income and brokerage receivables. 3 For the purpose of this disclosure, negative interest
income on assets is presented as a reduction to interest income, while in the consolidated income statement negative interest income on assets is presented as interest expense. Refer to Note 3 in the “Consolidated
financial statements” section of this report for more information. 4 Mainly includes derivative financial instruments, equity instruments at fair value held for trading and financial assets for unit-linked investment
contracts.
573
Average balances and interest rates (continued)
For the year ended
31.12.21
31.12.20
31.12.19
USD million, except where indicated
Average
balance
Interest
expense
Average
interest
rate (%)
Average
balance
Interest
expense
Average
interest
rate (%)
Average
balance
Interest
expense
Average
interest
rate (%)
Liabilities and equity
Amount due to banks
Domestic
Foreign
Payables from securities financing transactions
1
Domestic
Foreign
Customer deposits
Domestic
of which: demand deposits
of which: savings deposits
of which: time deposits
Foreign
of which: demand deposits
of which: savings deposits
of which: time deposits
Funding from UBS Group AG
Domestic
Foreign
Commercial paper
Domestic
Foreign
Other short-term debt issued measured at amortized cost
Domestic
Foreign
Long-term debt issued measured at amortized cost
Domestic
Foreign
Financial liabilities at fair value (excluding debt issued
designated at fair value)
1,2
Domestic
Foreign
Debt issued designated at fair value
Domestic
Foreign
Other interest-bearing liabilities
Domestic
Foreign
Total interest-bearing liabilities
Swap interest on hedged debt instruments and other swaps
Interest expense on off-balance sheet securities and other
Interest expense and average interest-bearing liabilities
3
3
3
Non-interest-bearing liabilities
4
Total liabilities
Total equity
Total average liabilities and equity
Net interest income
Net yield on interest-earning assets
1 Repurchase agreements are presented on a gross basis and therefore, for the purpose of this disclosure, do not reflect the effect of netting permitted under IFRS. 2 Includes financial liabilities at fair value held for
trading, other financial liabilities designated at fair value and brokerage payables designated at fair value. 3 For the purpose of this disclosure, negative interest expense on liabilities is presented as a reduction to
interest expense, while in the consolidated income statement negative interest income on liabilities is presented as interest income. Refer to Note 3 in the “Consolidated financial statements” section of this report
for more information. 4 Mainly includes derivative financial instruments, equity instruments at fair value held for trading and financial liabilities related to unit-linked investment contracts.
The percentage of total average interest-earning assets
attributable to foreign activities was 60% for 2021 (2020: 62%;
2019: 64%). The percentage of total average interest-bearing
liabilities attributable to foreign activities was 56% for 2021
(2020: 61%; 2019: 61%). All assets and liabilities are translated
into US dollars at uniform month-end rates. Interest income and
expense are translated at monthly average rates.
Average rates earned and paid on assets and liabilities can
change from period to period based on the changes in interest
rates in general, but are also affected by changes in the currency
mix included in the assets and liabilities. Tax-exempt income is not
recorded on a tax-equivalent basis. For all three years presented,
tax-exempt income is considered to be insignificant and the effect
from such income is therefore negligible.
UBS AG consolidated supplemental disclosures required under SEC regulations
574
Analysis of changes in interest income and expense
The following tables provide information by categories of interest-
earning assets and interest-bearing liabilities on the changes in
interest income and expense due to changes in volume and
interest rates for the year ended 31 December 2021 compared
with the year ended 31 December 2020, and for the year ended
31 December 2020 compared with the year ended 31 December
2019. Volume and rate variances have been calculated on
movements in average balances and changes in interest rates.
Changes due to a combination of volume and rates have been
allocated proportionally.
2021 compared with 2020
2020 compared with 2019
Increase / (decrease)
due to changes in
Increase / (decrease)
due to changes in
USD million
Average
volume
Average
interest rate
Net
change
Average
volume
Average
interest rate
Net
change
Interest income from interest-earning assets
Balances at central banks
Domestic
Foreign
Loans and advances to banks
Domestic
Foreign
Receivables from securities financing transactions
Domestic
Foreign
Loans and advances to customers
Domestic
Foreign
Financial assets at fair value
Domestic
Foreign
of which: taxable
of which: non-taxable
Other interest-earning assets
Domestic
Foreign
Interest income
Domestic
Foreign
Total interest income from interest-earning assets
Net interest income on swaps
Interest income on off-balance sheet securities and other
Total interest income
575
Analysis of changes in interest income and expense (continued)
2021 compared with 2020
2020 compared with 2019
Increase / (decrease)
due to changes in
Increase / (decrease)
due to changes in
USD million
Average
volume
Average
interest rate
Net
change
Average
volume
Average
interest rate
Net
change
Interest expense on interest-bearing liabilities
Amount due to banks
Domestic
Foreign
Payables from securities financing transactions
Domestic
Foreign
Customer deposits
Domestic
of which: demand deposits
of which: savings deposits
of which: time deposits
Foreign
of which: demand deposits
of which: savings deposits
of which: time deposits
Funding from UBS Group AG
Domestic
Foreign
Commercial paper
Domestic
Foreign
Other short-term debt issued measured at amortized cost
Domestic
Foreign
Long-term debt issued measured at amortized cost
Domestic
Foreign
Financial liabilities at fair value (excluding debt issued designated at fair value)
Domestic
Foreign
Debt issued designated at fair value
Domestic
Foreign
Other interest-bearing liabilities
Domestic
Foreign
Interest expense
Domestic
Foreign
Total interest expense on interest-bearing liabilities
Swap interest on hedged debt instruments and other swaps
Interest expense on off-balance sheet securities and other
Total interest expense
UBS AG consolidated supplemental disclosures required under SEC regulations
576
Deposits
The following table analyzes average deposits and average rates
on each deposit category for the years ended 31 December 2021,
2020
and
2019
.
For the purpose of this disclosure, foreign
deposits represent deposits from depositors who are based
outside of Switzerland. Deposits by foreign depositors in domestic
offices were
USD
77
,
070
million
as of 31
December
2021
(31 December 2020: USD 76,200 million; 31 December 2019:
USD 54,262 million).
31.12.21
31.12.20
31.12.19
USD million, except where indicated
Average
deposits
Average
rate (%)
Average
deposits
Average
rate (%)
Average
deposits
Average
rate (%)
Due to banks
Domestic
Demand deposits
Time deposits
Total domestic
Foreign
1
Interest-bearing deposits
Total due to banks
Customer deposits
Domestic
Demand deposits
Savings deposits
Time deposits
Total domestic
Foreign
1
Demand deposits
Savings deposits
Time deposits
Total foreign
Total customer deposits
1 For the purpose of this table, the distinction between foreign and domestic deposits is based on the domicile of the depositor, while foreign and domestic deposits disclosed in previous tables are based on the
booking location.
Uninsured deposits
From the combined total of Due to banks and Customer deposits
as of 31 December 2021, total estimated uninsured deposits were
USD 395 billion (31 December 2020: USD 383 billion;
31 December 2019: USD 320 billion). Uninsured deposits are
deposits that are in excess of local deposit insurance or protection
scheme limits in the key locations in which UBS AG operates,
calculated based on the respective local regulations, as well as
deposits in uninsured accounts. The main deposit insurance
schemes applicable to UBS AG deposits are the Swiss depositor
protection scheme in Switzerland (which protects applicable
deposits up to a maximum of CHF 100,000 per client and per
bank or securities firm), the Compensation Scheme of German
Banks, EdB, in combination with the Deposit Protection Fund of
the Association of German Banks in Germany (which protects
applicable deposits up to a maximum of EUR 597 million per
client) and the Federal Deposit Insurance Corporation (the FDIC)
scheme in the Americas (which protects applicable deposits up to
a maximum of USD 250,000 per depositor, per insured bank, for
each account ownership category).
The table below presents the maturity of estimated uninsured
time deposits as of 31 December 2021. Where a depositor holds
multiple accounts, which in aggregate are in excess of a deposit
insurance or protection limit, the insured amount is first allocated
to the account with the shortest time to maturity.
USD million
1
Within 3 months
3 to 6 months
6 to 12 months
Over 12 months
Total uninsured time deposits as of 31 December 2021
1 Amounts are estimated based on the methodologies defined in each local jurisdiction. As of 31 December 2021, there were no US time deposits subject to the FDIC scheme that were in excess of the FDIC insurance
limit.
577
Investments in debt instruments
The table below presents the carrying amount and weighted
average yield of debt instruments presented within Financial
assets measured at fair value through other comprehensive
income and Other financial assets measured at amortized cost on
the balance sheet by contractual maturity bucket. The yield for
each range of maturities is calculated by dividing the annualized
interest income by the average balance of the investment per
contractual maturity bucket. The maturity information presented
does not consider any early redemption features and debt
instruments without fixed maturities are not included.
Within 1 year
1 up to 5 years
5 to 10 years
Over 10 years
Total
carrying
amount
USD million, except where indicated
Carrying
amount
Yield (%)
Carrying
amount
Yield (%)
Carrying
amount
Yield (%)
Carrying
amount
Yield (%)
Debt instruments measured at fair value
through other comprehensive income
Asset-backed securities
Government bills/bonds
Corporate and other
Subtotal as of 31 December 2021
Debt securities measured at amortized cost
Asset-backed securities
Government bills/bonds
Corporate and other
Subtotal as of 31 December 2021
Total as of 31 December 2021
Loan portfolio
The table below provides the maturity profile of UBS AG’s core loan portfolio as of 31 December 2021. The contractual maturity is
based on carrying amounts and includes the effect of callable features. For loans due after one year, a breakdown between fixed and
adjustable or floating interest rates is also provided.
USD million
31.12.21
Within 1 year
1 - 5 years
5 - 15 years
Over 15 years
Total
of which: over 1 year
Fixed rate
Adjustable or
floating rate
Private clients with mortgages
Real estate financing
Large corporate clients
SME clients
Lombard
Credit cards
Commodity trade finance
Other loans and advances to customers
Loans to financial advisors
Total
Allowance for credit losses
For the years ended 31 December 2021, 2020 and 2019, the ratio
of net charge-offs (i.e., write-offs of expected credit loss
allowances to gross carrying amount of the average loans
outstanding) during the period was not material for UBS AG’s
core loan portfolio, both on an overall basis and on an individual
loan category basis. Total write-offs for 31 December 2021 were
USD 137 million (31 December 2020: USD 356 million, 31
December 2019: USD 142 million). Refer to the coverage ratio
tables in “Note 9 Financial assets at amortized cost and other
positions in scope of expected credit loss measurement” in the
"Consolidated financial statements" section of this report for the
ratio of expected credit loss allowances to total loans outstanding
at each period end.
UBS AG consolidated supplemental disclosures required under SEC regulations
578
579
Appendix
A
Appendix
580
Alternative performance measures
Alternative performance measures
An alternative performance measure (an APM) is a financial measure of historical or future financial performance, financial position
or cash flows other than a financial measure defined or specified in the applicable recognized accounting standards or in other
applicable regulations. We report a number of APMs in the discussion of the financial and operating performance of the Group, our
business divisions and our Group Functions. We use APMs to provide a more complete picture of our operating performance and to
reflect management’s view of the fundamental drivers of our business results. A definition of each APM, the method used to calculate
it and the information content are presented in alphabetical order in the table below. Our APMs may qualify as non-GAAP measures
as defined by US Securities and Exchange Commission (SEC) regulations.
APM label
Calculation
Information content
Active Digital Banking clients in
Corporate & Institutional Clients (%)
– P&C
Calculated as the average number of active clients for
each month in the relevant period divided by the
average number of total clients. “Clients” refers to the
number of unique business relationships or legal
entities operated by Corporate & Institutional Clients,
excluding clients that do not have an account, mono-
product clients and clients that have defaulted on loans
or credit facilities. At the end of each month, any client
that has logged on at least once in that month is
determined to be “active” (a log-in time stamp is
allocated to all business relationship numbers or per
legal entity in a digital banking contract).
This measure provides information about the
proportion of active Digital Banking clients in the total
number of UBS clients (within the aforementioned
meaning) which are serviced by Corporate &
Institutional Clients.
Active Digital Banking clients in
Personal Banking (%)
– P&C
Calculated as the average number of active clients for
each month in the relevant period divided by the
average number of total clients. “Clients” refers to the
number of unique business relationships operated by
Personal Banking, excluding persons under the age of
15, clients who do not have a private account, clients
domiciled outside Switzerland and clients who have
defaulted on loans or credit facilities. At the end of
each month, any client that has logged on at least once
in that month is determined to be “active” (a log-in
time stamp is allocated to all business relationship
numbers in a digital banking contract).
This measure provides information about the
proportion of active Digital Banking clients in the total
number of UBS clients (within the aforementioned
meaning) who are serviced by Personal Banking.
Business volume for Personal
Banking (CHF and USD)
– P&C
Calculated as the sum of client assets and loans.
This measure provides information about the volume
of client assets and loans.
Client assets (USD and CHF)
– P&C
Calculated as the sum of invested assets and other
assets held purely for transactional purposes or custody
only. Net new money is not measured for Personal &
Corporate Banking.
This measure provides information about the volume
of client assets managed by or deposited with UBS for
investment purposes, including other assets held
purely for transactional purposes or custody only.
Cost / income ratio (%)
Calculated as operating expenses divided by operating
income before credit loss expense or release
(annualized as applicable).
This measure provides information about the
efficiency of the business by comparing operating
expenses with gross income.
Fee-generating assets (USD)
– GWM
Calculated as the sum of discretionary and non-
discretionary wealth management portfolios (mandate
volume) and assets where generated revenues are
predominantly of a recurring nature, i.e., mainly
investment and mutual funds, including hedge funds
and private markets, where we have a distribution
agreement.
This measure provides information about the volume
of invested assets that create a revenue stream,
whether as a result of the nature of the contractual
relationship with clients or through the fee structure
of the asset. An increase in the level of fee-generating
assets results in an increase in the associated revenue
stream.
581
APM label
Calculation
Information content
Fee-generating asset margin (bps)
– GWM
Calculated as revenues from fee-generating assets (a
portion of which is included in recurring fee income
and a portion of which is included in transaction-
based income, annualized as applicable) divided by
average fee-generating assets for the relevant
mandate fee billing period. For the US, fees have
been billed on daily balances since the fourth quarter
of 2020 and average fee-generating assets are
calculated as the average of the monthly average
balances. Prior to the fourth quarter 2020, billing was
based on prior quarter-end balances, and the average
fee-generating assets were thus the prior quarter-end
balance. For balances outside of the US, billing is
based on prior month-end balances and average fee-
generating assets are thus the average of the prior
month-end balances.
This measure provides information about the revenues
from fee-generating assets in relation to their average
volume during the relevant mandate fee billing
period.
Gross margin on invested assets (bps)
– AM
Calculated as operating income before credit loss
expense or release (annualized as applicable) divided
by average invested assets.
This measure provides information about the
operating income before credit loss expense or release
of the business in relation to invested assets.
Impaired loan portfolio as a percentage
of total loan portfolio, gross (%)
– GWM, P&C
Calculated as impaired loan portfolio divided by total
gross loan portfolio.
This measure provides information about the
proportion of impaired loan portfolio in the total gross
loan portfolio.
Invested assets (USD and CHF)
– GWM, P&C, AM
Calculated as the sum of managed fund assets,
managed institutional assets, discretionary and
advisory wealth management portfolios, fiduciary
deposits, time deposits, savings accounts, and wealth
management securities or brokerage accounts.
This measure provides information about the volume
of client assets managed by or deposited with UBS for
investment purposes.
Loan penetration (%)
– GWM
Calculated as loans divided by invested assets.
This measure provides information about loan volume
in relation to invested assets.
Mobile Banking log-in share in Personal
Banking (%)
– P&C
Calculated as the number of Mobile Banking app
log-ins divided by total log-ins via E-Banking and the
Mobile Banking app in Personal Banking. If a digital
banking contract is linked to multiple business
relationships, the log-in is attributed to the business
relationship with the most banking products in use.
This measure provides information about the
proportion of Mobile Banking app log-ins in the total
number of log-ins via E-Banking and the Mobile
Banking app in Personal Banking.
Net interest margin (bps)
– P&C
Calculated as net interest income (annualized as
applicable) divided by average loans.
This measure provides information about the
profitability of the business by calculating the
difference between the price charged for lending and
the cost of funding, relative to loan value.
Net margin on invested assets (bps)
– AM
Calculated as operating profit before tax (annualized
as applicable) divided by average invested assets.
This measure provides information about the
operating profit before tax of the business in relation
to invested assets.
Net new business volume for Personal
Banking (CHF and USD)
– P&C
Calculated as the sum of net inflows and outflows of
client assets and loans during a specific period
(annualized as applicable).
This measure provides information about the business
volume as a result of net new business volume flows
during a specific period.
Net new business volume growth for
Personal Banking (%)
– P&C
Calculated as the sum of net inflows and outflows of
client assets and loans during a specific period
(annualized as applicable) divided by total business
volume / client assets at the beginning of the period.
This measure provides information about the growth
of business volume as a result of net new business
volume flows during a specific period.
Net new fee-generating assets (USD)
– GWM
Calculated as the sum of the net amount of fee-
generating assets inflows and outflows, including
dividend and interest inflows into mandates and
outflows from mandate fees paid by clients, during a
specific period.
This measure provides information about the
development of fee-generating assets during a
specific period as a result of net flows and excludes
movements due to market performance and foreign
exchange translation.
Net new money (USD)
– GWM, AM
Calculated as the sum of the net amount of inflows
and outflows of invested assets (as defined in UBS
policy) recorded during a specific period.
This measure provides information about the
development of invested assets during a specific
period as a result of net new money flows and
excludes movements due to market performance,
foreign exchange translation, dividends, interest and
fees.
Net profit growth (%)
Calculated as the change in net profit attributable to
shareholders from continuing operations between
current and comparison periods divided by net profit
attributable to shareholders from continuing
operations of the comparison period.
This measure provides information about profit
growth in comparison with the prior period.
Appendix
582
APM label
Calculation
Information content
Pre-tax profit growth (%)
Calculated as the change in net profit before tax
attributable to shareholders from continuing
operations between current and comparison periods
divided by net profit before tax attributable to
shareholders from continuing operations of the
comparison period.
This measure provides information about pre-tax
profit growth in comparison with the prior period.
Recurring net fee income
(USD and CHF)
– GWM, P&C
Calculated as the total of fees for services provided on
an ongoing basis, such as portfolio management fees,
asset-based investment fund fees and custody fees,
which are generated on client assets, and
administrative fees for accounts.
This measure provides information about the amount
of recurring net fee income.
Return on attributed equity (%)
Calculated as annualized business division operating
profit before tax divided by average attributed equity.
This measure provides information about the
profitability of the business divisions in relation to
attributed equity.
Return on common equity tier 1
capital (%)
Calculated as annualized net profit attributable to
shareholders divided by average common equity tier 1
capital.
This measure provides information about the
profitability of the business in relation to common
equity tier 1 capital.
Return on equity (%)
Calculated as annualized net profit attributable to
shareholders divided by average equity attributable to
shareholders.
This measure provides information about the
profitability of the business in relation to equity.
Return on leverage ratio denominator,
gross (%)
Calculated as annualized operating income before
credit loss expense or release divided by average
leverage ratio denominator.
This measure provides information about the revenues
of the business in relation to leverage ratio
denominator.
Return on risk-weighted
assets, gross (%)
Calculated as annualized operating income before
credit loss expense or release divided by average risk-
weighted assets.
This measure provides information about the revenues
of the business in relation to risk-weighted assets.
Return on tangible equity (%)
Calculated as annualized net profit attributable to
shareholders divided by average equity attributable to
shareholders less average goodwill and intangible
assets.
This measure provides information about the
profitability of the business in relation to tangible
equity.
Secured loan portfolio as a percentage
of total loan portfolio, gross (%)
– P&C
Calculated as secured loan portfolio divided by total
gross loan portfolio.
This measure provides information about the
proportion of the secured loan portfolio in the total
gross loan portfolio.
Tangible book value per share
(USD and CHF
1
)
Calculated as equity attributable to shareholders less
goodwill and intangible assets divided by the number
of shares outstanding.
This measure provides information about tangible net
assets on a per-share basis.
Total book value per share
(USD and CHF
1
)
Calculated as equity attributable to shareholders
divided by the number of shares outstanding.
This measure provides information about net assets
on a per-share basis.
Transaction-based income
(USD and CHF)
– GWM, P&C
Calculated as the total of the non-recurring portion of
net fee and commission income, mainly composed of
brokerage and transaction-based investment fund
fees, and credit card fees, as well as fees for payment
and foreign exchange transactions, together with
other net income from financial instruments
measured at fair value through profit or loss.
This measure provides information about the amount
of the non-recurring portion of net fee and
commission income.
1
583
Abbreviations frequently used in our financial reports
A
ABS
asset
-
backed securities
AG
M
Annual G
eneral
M
eeting
of
shareholders
A
-
IRB
advanced internal ratings
-
based
AIV
alternative investment
vehicle
ALCO
Asset and Liability
Committee
AMA
advanced measurement
approach
AML
anti
-
money laundering
AoA
Articles of Association
APM
alternative pe
rformance
measure
ARR
alternative reference rate
ARS
auction rate securities
ASF
available stable funding
AT1
additional tier 1
AuM
assets under management
B
BCBS
Basel Committee on
Banking Supervision
BIS
Bank for International
Settlements
BoD
Board of Directors
C
CAO
Capital Adequacy
Ordinance
CCAR
Comprehensive Capital
Analysis and Review
CCF
credit conversion factor
CCP
central counterparty
CCR
counterparty credit risk
CCRC
Corporate Culture and
Responsibility Committee
CDS
credit defa
ult swap
CEA
Commodity Exchange Act
CEO
Chief Executive Officer
CET1
common equity tier 1
CFO
Chief Financial Officer
CFTC
US Commodity Futures
Trading Commission
C
GU
c
ash
-
generating unit
CHF
Swiss franc
CIO
Chief Investment Office
CLS
C
ontinuous
Linked
Settlement
C&ORC
Compliance & Operational
Risk Control
CRD IV
EU Capital Requirements
Directive of 2013
CRM
credit risk mitigation (credit
risk) or comprehensive risk
measure (market risk)
CST
combined stress test
CUSIP
Committee on Unif
orm
Security Identification
Procedures
CVA
credit valuation adjustment
D
DBO
defined benefit obligation
DCCP
Deferred Contingent
Capital Plan
DM
discount margin
DOJ
US Department of Justice
DTA
deferred tax asset
DVA
debit valuation adjustment
E
EAD
exposure at default
EB
Executive Board
EC
European Commission
ECB
European Central Bank
ECL
expected credit loss
EGM
Extraordinary General
Meeting of shareholders
EIR
effective interest rate
EL
expected loss
EMEA
Europe, Middle East and
Africa
EOP
Equity Ownership Plan
EPS
earnings per share
ESG
environmental, social and
governance
ETD
exchange
-
traded derivative
s
ETF
exchange
-
traded fund
EU
European Union
EUR
euro
EURIBOR
Euro Interbank Offered Rate
ESR
e
nvironmental and social
risk
EVE
economic va
lue of equity
EY
Ernst & Young Ltd
F
FA
financial advisor
FCA
UK Financial Conduct
Authority
FCT
foreign currency translation
FINMA
Swiss Financial Market
Supervisory Authority
FMIA
Swiss Financial Market
Infrastructure Act
Appendix
584
Abbreviations frequently used in our financial reports (continued)
FSB
Financial Stability Board
F
TA
Swiss Federal Tax
Administration
FVA
funding valuation
adjustment
FVOCI
fair value through other
comprehensive income
FVTPL
fair value through profit or
loss
FX
foreign exchange
G
GAAP
generally accepted
accounting principles
GCRG
Group
Compliance,
Regulatory & Governance
GBP
pound sterling
GDP
gross domestic product
GEB
Group Executive Board
GHG
greenhouse gas
GIA
Group Internal Audit
GMD
Group Managing Director
GRI
Global Reporting Initiative
G
-
SIB
global systemically
important bank
H
Hong Kong
SAR
Hong Kong Special
Administrative Region of
the People’s Republic of
China
HQLA
high-quality liquid assets
I
IAS
International Accounting
Standards
IASB
International Accounting
Standards Board
IBOR
interbank offered rate
IFRIC
International Financial
Reporting Interpretations
Committee
IFRS
International Financial
Reporting Standards
IRB
internal ratings
-
based
IRRBB
interest rate risk in the
banking book
ISDA
International Swaps and
Derivatives Association
ISIN
International Se
curities
Identification Number
K
KRT
Key Risk Taker
L
LAS
liquidity
-
adjusted stress
LCR
liquidity coverage ratio
LGD
loss given default
LIBOR
London Interbank Offered
Rate
LLC
limited liability company
LoD
lines of defense
LRD
leverage ratio
denominator
LTIP
Long
-
Term Incentive Plan
LTV
loan
-
to
-
value
M
M&A
mergers and acquisitions
MiFID II
Markets in Financial
Instruments Directive II
MRT
Material Risk Taker
N
NAV
net asset value
NII
net interest income
NSFR
net stable funding ratio
NYSE
Ne
w York Stock Exchange
O
OCA
own credit adjustment
OCI
other comprehensive
income
ORF
operational risk framework
OTC
over
-
the
-
counter
P
PD
probability of default
PIT
point in time
P&L
profit or loss
POCI
purchased or originated
credit-impaired
PRA
UK Prudential Regulation
Authority
PRV
positive replacement value
R
RBA
role
-
based allowance
RBC
risk
-
based capital
RbM
risk
-
based monitoring
REIT
r
eal estate investment trust
RMBS
residential mortgage
-
backed securities
RniV
risks not
in VaR
RoCET1
return on CET1 capital
RoTE
return on tangible equity
RoU
right
-
of
-
use
rTSR
r
elative total shareholder
return
RWA
risk
-
weighted assets
585
Abbreviations frequently used in our financial reports (continued)
S
SA
standardized approach
SA
-
CCR
standardized approach for
counterparty credit risk
SAR
stock appreciation righ
t
or
Special Administrative
Region
SBC
Swiss Bank Corporation
SDG
Sustainable Development
Goal
SE
structured entity
SEC
US Securities and Exchange
Commission
SEEOP
Senior Executive Equity
Ownership Plan
SFT
securities financing
transaction
SI
sustainable investing
or
sustainable
investments
SIBOR
Singapore Interbank
Offered Rate
SICR
significant increase in credit
risk
SIX
SIX Swiss Exchange
SME
small and medium
-
sized
entities
SMF
Senior Management
Function
SNB
Swiss National Bank
SOR
Singapore Swap Offer Rate
SPPI
solely payments of principal
and interest
SRB
systemically relevant bank
SRM
specific risk measure
SVaR
stressed value
-
at
-
risk
T
TBTF
too big to fail
TCFD
Task Force on Climate
-
related Financial Disclosures
TIBOR
Tokyo Inte
rbank Offered
Rate
TLAC
total loss
-
absorbing capacity
U
UoM
units of measure
USD
US dollar
V
VaR
value
-
at
-
risk
VAT
value added tax
This is a general list of the abbreviations frequently used in our financial reporting. Not all of the listed abbreviations may appear in
this particular report.
Appendix
586
Information sources
Reporting publications
Annual publications
Annual Report (SAP No. 80531):
volume report provides descriptions of: our Group strategy and
performance; the strategy and performance of the business
divisions and Group Functions; risk, capital and funding, and
balance sheet management; corporate governance, corporate
responsibility and our compensation framework, including
information about compensation for the Board of Directors and
the Group Executive Board members; and financial information,
including the financial statements.
Geschäftsbericht (SAP No. 80531):
translation into German of selected sections of our
Annual
Report.
Annual Review (SAP No. 80530):
This booklet contains key
information about our strategy and performance, with a focus on
corporate responsibility at UBS. It is published in English, German,
French and Italian.
Compensation Report (SAP No. 82307):
compensation framework and provides information about
compensation for the Board of Directors and the Group Executive
Board members. It is available in English and German.
Quarterly publications
The quarterly financial report provides an update on our strategy
and performance for the respective quarter. It is available in
English.
How to order publications
The annual and quarterly publications are available in .pdf format
at
ubs.com/investors
, under “Financial information,” and printed
copies can be requested from UBS free of charge. For annual
publications, refer to the “Investor services” section at
ubs.com/investors.
Alternatively, they can be ordered by quoting
the SAP number and the language preference, where applicable,
from UBS AG, F4UK–AUL, P.O. Box, CH-8098 Zurich, Switzerland.
Other information
Website
The “Investor Relations” website at
ubs.com/investors
the following information about UBS: news releases; financial
information, including results-related filings with the US Securities
and Exchange Commission (the SEC); information for
shareholders, including UBS share price charts, as well as data and
dividend information, and for bondholders; the UBS corporate
calendar; and presentations by management for investors and
financial analysts. Information is available online in English, with
some information also available in German.
Results presentations
Our quarterly results presentations are webcast live. Playbacks
of most presentations can be download
ed
from
ubs.com/presentations
.
Messaging service
Email alerts to news about UBS can be subscribed for under “UBS
News Alert” at
ubs.com/global/en/investor-relations/contact/
investor-services.html
. Messages are sent in English, German,
French or Italian, with an option to select theme preferences for
such alerts.
Form 20-F and other submissions to the US Securities and
Exchange Commission
We file periodic reports and submit other information about UBS
to the US Securities and Exchange Commission (the SEC). Principal
among these filings is the annual report on Form 20-F, filed
pursuant to the US Securities Exchange Act of 1934. The filing of
Form 20-F is structured as a wrap-around document. Most
sections of the filing can be satisfied by referring to the combined
UBS Group AG and UBS AG annual report. However, there is a
small amount of additional information in Form 20-F that is not
presented elsewhere and is particularly targeted at readers in the
US. Readers are encouraged to refer to this additional disclosure.
Any document that we file with the SEC is available on the SEC’s
website:
sec.gov
. Refer to
ubs.com/investors
for more
information.
587
Cautionary Statement Regarding Forward-Looking Statements |
but not limited to management’s outlook for UBS’s financial performance, statements relating to the anticipated effect of transactions and strategic initiatives
on UBS’s business and future development and goals or intentions to achieve climate, sustainability and other social objectives. While these forward-looking
statements represent UBS’s judgments, expectations and objectives concerning the matters described, a number of risks, uncertainties and other important
factors could cause actual developments and results to differ materially from UBS’s expectations. Russia’s invasion of Ukraine has led to heightened volatility
across global markets and to the coordinated implementation of sanctions on Russia, Russian entities and nationals. Russia’s invasion of Ukraine already has
caused significant population displacement, and as the conflict continues, the disruption will likely increase. The scale of the conflict and the speed and extent
of sanctions, as well as the uncertainty as to how the situation will develop, may have significant adverse effects to the market and macroeconomic conditions,
including in ways that cannot be anticipated. This creates significantly greater uncertainty about forward-looking statements. The COVID-19 pandemic and the
measures taken to manage it have had and may also continue to have a significant adverse effect on global and regional economic activity, including disruptions
to global supply chains, inflationary pressures, and labor market displacements. Factors that may affect our performance and ability to achieve our plans, outlook
and other objectives also include, but are not limited to: (i) the degree to which UBS is successful in the ongoing execution of its strategic plans, including its cost
reduction and efficiency initiatives and its ability to manage its levels of risk-weighted assets (RWA) and leverage ratio denominator (LRD), liquidity coverage ratio
and other financial resources, including changes in RWA assets and liabilities arising from higher market volatility; (ii) the degree to which UBS is successful in
implementing changes to its businesses to meet changing market, regulatory and other conditions; (iii) the continuing low or negative interest rate environment
in Switzerland and other jurisdictions; (iv) developments in the macroeconomic climate and in the markets in which UBS operates or to which it is exposed,
including movements in securities prices or liquidity, credit spreads, and currency exchange rates, and the effects of economic conditions, market developments,
and increasing geopolitical tensions, and changes to national trade policies on the financial position or creditworthiness of UBS’s clients and counterparties, as
well as on client sentiment and levels of activity; (v) changes in the availability of capital and funding, including any changes in UBS’s credit spreads and ratings,
as well as availability and cost of funding to meet requirements for debt eligible for total loss-absorbing capacity (TLAC); (vi) changes in central bank policies or
the implementation of financial legislation and regulation in Switzerland, the US, the UK, the European Union and other financial centers that have imposed, or
resulted in, or may do so in the future, more stringent or entity-specific capital, TLAC, leverage ratio, net stable funding ratio, liquidity and funding requirements,
heightened operational resilience requirements, incremental tax requirements, additional levies, limitations on permitted activities, constraints on remuneration,
constraints on transfers of capital and liquidity and sharing of operational costs across the Group or other measures, and the effect these will or would have on
UBS’s business activities; (vii) UBS’s ability to successfully implement resolvability and related regulatory requirements and the potential need to make further
changes to the legal structure or booking model of UBS Group in response to legal and regulatory requirements, or other external developments; (viii) UBS’s
ability to maintain and improve its systems and controls for complying with sanctions and for the detection and prevention of money laundering to meet evolving
regulatory requirements and expectations, in particular in current geopolitical turmoil; (ix) the uncertainty arising from domestic stresses in certain major
economies; (x) changes in UBS’s competitive position, including whether differences in regulatory capital and other requirements among the major financial
centers adversely affect UBS’s ability to compete in certain lines of business; (xi) changes in the standards of conduct applicable to our businesses that may result
from new regulations or new enforcement of existing standards, including measures to impose new and enhanced duties when interacting with customers and
in the execution and handling of customer transactions; (xii) the liability to which UBS may be exposed, or possible constraints or sanctions that regulatory
authorities might impose on UBS, due to litigation, contractual claims and regulatory investigations, including the potential for disqualification from certain
businesses, potentially large fines or monetary penalties, or the loss of licenses or privileges as a result of regulatory or other governmental sanctions, as well as
the effect that litigation, regulatory and similar matters have on the operational risk component of our RWA, as well as the amount of capital available for return
to shareholders; (xiii) the effects on UBS’s cross-border banking business of sanctions, tax or regulatory developments and of possible changes in UBS’s policies
and practices relating to this business; (xiv) UBS’s ability to retain and attract the employees necessary to generate revenues and to manage, support and control
its businesses, which may be affected by competitive factors; (xv) changes in accounting or tax standards or policies, and determinations or interpretations
affecting the recognition of gain or loss, the valuation of goodwill, the recognition of deferred tax assets and other matters; (xvi) UBS’s ability to implement new
technologies and business methods, including digital services and technologies, and ability to successfully compete with both existing and new financial service
providers, some of which may not be regulated to the same extent; (xvii) limitations on the effectiveness of UBS’s internal processes for risk management, risk
control, measurement and modeling, and of financial models generally; (xviii) the occurrence of operational failures, such as fraud, misconduct, unauthorized
trading, financial crime, cyberattacks, data leakage and systems failures, the risk of which is increased with cyberattack threats from nation states and while
COVID-19 control measures require large portions of the staff of both UBS and its service providers to work remotely; (xix) restrictions on the ability of UBS Group
AG to make payments or distributions, including due to restrictions on the ability of its subsidiaries to make loans or distributions, directly or indirectly, or, in the
case of financial difficulties, due to the exercise by FINMA or the regulators of UBS’s operations in other countries of their broad statutory powers in relation to
protective measures, restructuring and liquidation proceedings; (xx) the degree to which changes in regulation, capital or legal structure, financial results or other
factors may affect UBS’s ability to maintain its stated capital return objective; (xxi) uncertainty over the scope of actions that may be required by UBS, governments
and others to achieve goals relating to climate, environmental and social matters, as well as the evolving nature of underlying science and industry and
governmental standards; and (xxii) the effect that these or other factors or unanticipated events may have on our reputation and the additional consequences
that this may have on our business and performance. The sequence in which the factors above are presented is not indicative of their likelihood of occurrence or
the potential magnitude of their consequences. Our business and financial performance could be affected by other factors identified in our past and future filings
and reports, including those filed with the SEC. More detailed information about those factors is set forth in documents furnished by UBS and filings made by
UBS with the SEC, including UBS’s Annual Report on Form 20-F for the year ended 31 December 2021. UBS is not under any obligation to (and expressly disclaims
any obligation to) update or alter its forward-looking statements, whether as a result of new information, future events, or otherwise.
Rounding |
disclosed in text and tables are calculated on the basis of unrounded figures. Absolute changes between reporting periods disclosed in the text, which can be
derived from numbers presented in related tables, are calculated on a rounded basis.
Tables |
available as of the relevant date or for the relevant period. Zero values generally indicate that the respective figure is zero on an actual or rounded basis. Values
that are zero on a rounded basis can be either negative or positive on an actual basis.

UBS Group AG
P.O. Box
CH-8098 Zurich
ubs.com