UNITED STATES
SECURITIES AND EXCHANGE COMMISSION
Washington, D.C. 20549
FORM N-CSRS
CERTIFIED SHAREHOLDER REPORT OF REGISTERED MANAGEMENT
INVESTMENT COMPANIES |
| | Investment Company Act file number 811-02739 and 811-10179
Name of Fund: BlackRock Basic Value Fund, Inc. and Master Basic Value LLC
Fund Address: 100 Bellevue Parkway, Wilmington, DE 19809
Name and address of agent for service: Donald C. Burke, Chief Executive Officer, BlackRock Basic
Value Fund, Inc. and Master Basic Value LLC, 800 Scudders Mill Road, Plainsboro, NJ,
08536. Mailing address: P.O. Box 9011, Princeton, NJ, 08543-9011
Registrant’s telephone number, including area code: (800) 441-7762
Date of fiscal year end: 06/30/2009
Date of reporting period: 12/31/2008
Item 1 – Report to Stockholders |
EQUITIES FIXED INCOME REAL ESTATE LIQUIDITY ALTERNATIVES BLACKROCK SOLUTIONS
BlackRock Basic Value
Fund, Inc.
SEMI-ANNUAL REPORT
DECEMBER 31, 2008 | (UNAUDITED)

NOT FDIC INSURED
MAY LOSE VALUE
NO BANK GUARANTEE
| Table of Contents | | |
| |
| | | Page |
| A Letter to Shareholders | | 3 |
| Semi-Annual Report: | | |
| Fund Summary | | 4 |
| About Fund Performance | | 6 |
| Disclosure of Expenses | | 6 |
| Fund Financial Statements: | | |
| Statement of Assets and Liabilities | | 7 |
| Statement of Operations | | 8 |
| Statements of Changes in Net Assets | | 9 |
| Fund Financial Highlights | | 10 |
| Fund Notes to Financial Statements | | 15 |
| Portfolio Information | | 18 |
| Master LLC Financial Statements: | | |
| Schedule of Investments | | 19 |
| Statement of Assets and Liabilities | | 21 |
| Statement of Operations | | 22 |
| Statements of Changes in Net Assets | | 23 |
| Master LLC Financial Highlights | | 23 |
| Master LLC Notes to Financial Statements | | 24 |
| Officers and Directors | | 28 |
| Additional Information | | 29 |
| Mutual Fund Family | | 31 |
2 BLACKROCK BASIC VALUE FUND, INC.
DECEMBER 31, 2008
A Letter to Shareholders
Dear Shareholder
The present time may well be remembered as one of the most tumultuous periods in financial market history. Over the past year, the bursting of the hous-
ing bubble and the resultant credit crisis swelled into an all-out global financial market meltdown that featured the collapse of storied financial firms, vola-
tile swings in the world’s financial markets and monumental government responses designed to prop up the economy and stabilize the financial system.
The US economy appeared relatively resilient through the first half of 2008, when rising food and energy prices stoked fears of inflation. The tenor
changed dramatically in the second half, as inflationary pressure subsided amid plummeting oil prices, while economic pressures escalated in the
midst of a rapid deterioration in consumer spending, employment and other key indicators. By period-end, the National Bureau of Economic Research
had confirmed what most already knew — the United States was in a recession, which officially began in December 2007. The Federal Reserve Board
(the “Fed”), after slashing interest rates aggressively in the early months of the year, resumed that rate-cutting campaign in the fall, with the final reduc-
tion in December bringing the target federal funds rate to a record low range of between zero and 0.25% . Importantly, the central bank pledged that
future policy moves to revive the global economy and financial markets would comprise primarily of nontraditional and quantitative easing measures,
such as capital injections, lending programs and government guarantees.
Against this backdrop, US equity markets experienced intense volatility, with periods of downward pressure punctuated by sharp rebounds. Declines
were significant and broad-based, though smaller cap stocks posted somewhat better relative performance. Non-US stocks started off the year stronger,
but quickly lost ground as the credit crisis revealed itself to be global in nature and as the global economy turned south. Overall, domestic equities
notched better results than non-US equities, reversing the prior years’ trend of international equity outperformance.
In fixed income markets, investors shunned risky assets and sought the safety and liquidity of US Treasury issues. Prices soared, while yields fell to
record lows, with the Treasury sector topping all other asset classes over the reporting period. Amid spillover from historic events in the financial sector,
municipals contended with fewer market participants, lack of liquidity, a challenging funding environment and a backlog of new-issue supply, all of
which contributed to the sector’s underperformance relative to taxable issues. At the same time, economic turmoil combined with dislocated credit
markets and substantial technical pressures resulted in the worst year on record for the high yield market.
| In all, an investor flight to safety prevailed, as evidenced in the six- and 12-month returns of the major benchmark indexes: | | |
| Total Returns as of December 31, 2008 | | 6-month | | 12-month |
| US equities (S&P 500 Index) | | (28.48)% | | (37.00)% |
| Small cap US equities (Russell 2000 Index) | | (26.94) | | (33.79) |
| International equities (MSCI Europe, Australasia, Far East Index) | | (36.41) | | (43.38) |
| US Treasury securities (Merrill Lynch 10-Year US Treasury Index) | | 17.70 | | 20.06 |
| Taxable fixed income (Barclays Capital US Aggregate Index*) | | 4.07 | | 5.24 |
| Tax-exempt fixed income (Barclays Capital Municipal Bond Index*) | | (2.49) | | (2.47) |
| High yield bonds (Barclays Capital US Corporate High Yield 2% Issuer Capped Index*) | | (25.07) | | (25.88) |
* Formerly a Lehman Brothers index.
Past performance is no guarantee of future results. Index performance shown for illustrative purposes only. You cannot invest directly in an index.
Through periods of market turbulence, as ever, BlackRock’s full resources are dedicated to the management of our clients’ assets. For our most current
views on the economy and financial markets, we invite you to visit www.blackrock.com/funds. As always, we thank you for entrusting BlackRock with
your investments, and we look forward to continuing to serve you in the months and years ahead.

| THIS PAGE NOT PART OF YOUR FUND REPORT |
Fund Summary as of December 31, 2008 BlackRock Basic Value Fund, Inc.
Portfolio Management Commentary
How did the Fund perform?
•During the six-month period, the Fund’s Institutional and Investor A
shares outperformed the benchmark S&P 500 Citigroup Value Index,
while Investor B, Investor C and Class R shares trailed the index. All
share classes outpaced the broad-market S&P 500 Index.
What factors influenced performance?
•The Fund’s outperformance relative to the benchmark resulted from
strong attribution in the healthcare, financials, industrials and utilities
sectors, offset somewhat by weak results in energy, materials, consumer
discretionary and information technology (IT).
•Within healthcare, favorable stock selection and an overall overweight
in the sector benefited performance. Results were especially strong in
the pharmaceuticals subsector, where Bristol-Myers Squibb Co. and
Schering-Plough Corp. were standouts. Successful stock selection and
an underweight in the financials sector, particularly in capital markets
and mortgage-related companies, contributed positively as well. The
Fund’s position in The Travelers Cos., Inc. and its reduced weighting in
Citigroup, Inc. proved most advantageous. In industrials, positive stock
selection and an underweight, mainly in road & rail
companies and industrial conglomerates, aided performance. A position
in Raytheon Co. and a reduced weighting in General Electric Co. also
bolstered returns within this sector. Stock selection within utilities added
value as well, with strong results from The Southern Co. Moreover, the
Fund’s cash position was beneficial as it reduced exposure to the market’s
decline over the period.
•In energy, the negative impact of stock selection overshadowed the posi-
tive impact of an overweight within the sector. Poor performance from
Halliburton Co., BJ Services Co. and Peabody Energy Corp. all hindered
Fund returns. Disappointing stock selection in the materials and con-
sumer discretionary sectors also detracted from results. Key laggards
included Alcoa, Inc. and E.I. du Pont de Nemours & Co. The lack of owner-
ship of McDonald’s Corp. and Comcast Corp. also hurt relative returns.
In IT, the combination of stock selection and an overweight, particularly in
semiconductors and office electronics, hampered performance. Here, hold-
ings Micron Technology, Inc., Fairchild Semiconductor International, Inc.
and LSI Corp. did not produce the results we anticipated for the period.
Describe recent portfolio activity.
•During the six months, we increased the Fund’s exposure to the con-
sumer discretionary, healthcare, consumer staples and telecommunica-
tion services sectors by adding to existing holdings and initiating new
positions. The Fund’s largest additions included Carnival Corp., Microsoft
Corp., Corning, Inc., Emerson Electric Co., Nucor Corp. and Air Products
& Chemicals, Inc.
•We reduced Fund exposure to financials by trimming existing positions
and eliminating holdings in Wells Fargo & Co., Hartford Financial
Services Group, Inc., American International Group, Inc., Lehman
Brothers Holdings Inc. and Morgan Stanley.
Describe Fund positioning at period-end.
•As of December 31, 2008, the Fund was overweight in IT, energy and
healthcare, and underweight in financials, industrials, utilities and con-
sumer discretionary. The Fund was neutral in consumer staples, materi-
als and telecommunication services.
•We expect more volatility in 2009, as negative economic and company
headlines continue to frighten investors. We aim to utilize this market
volatility to slowly and selectively shift from the lower-risk approach we
adopted in 2008 to a more high-risk, cyclical positioning. We believe the
economy will eventually recover, and that the equity market should rally
in 2009. Our cautious optimism is predicated on: a) an unprecedented
amount of fiscal and monetary stimulus on a global basis; b) an exorbi-
tant amount of investor fear, illustrated by the record levels of cash on
the sidelines and invested in low-yielding government securities; and,
c) valuations near record-low levels on trough earnings. We are cautiously
optimistic that the stage is set for a rebound of risk assets in 2009 that
will include equities.
The views expressed reflect the opinions of BlackRock as of the date of this report and are subject to change based on changes in market, economic or other conditions.
These views are not intended to be a forecast of future events and are no guarantee of future results.
| | | | | Actual | | | | | | Hypothetical2 | | |
| | | Beginning | | Ending | | Expenses Paid | | Beginning | | Ending | | Expenses Paid |
| | | Account Value | | Account Value | | During | | Account Value | | Account Value | | During |
| | | July 1, 2008 | | December 31, 2008 | | the Period1 | | July 1, 2008 | | December 31, 2008 | | the Period1 |
| Institutional | | $1,000 | | $725.50 | | $2.52 | | $1,000 | | $1,022.28 | | $2.96 |
| Investor A | | $1,000 | | $724.40 | | $3.82 | | $1,000 | | $1,020.76 | | $4.48 |
| Investor B | | $1,000 | | $720.90 | | $7.76 | | $1,000 | | $1,016.18 | | $9.10 |
| Investor C | | $1,000 | | $721.00 | | $7.37 | | $1,000 | | $1,016.63 | | $8.64 |
| Class R | | $1,000 | | $722.80 | | $5.47 | | $1,000 | | $1,018.85 | | $6.41 |
1 For each class of the Fund, expenses are equal to the annualized expense ratio for the class (0.58% for Institutional, 0.88% for Investor A, 1.79% for Investor B, 1.70% for
Investor C and 1.26% for Class R), multiplied by the average account value over the period, multiplied by 184/365 (to reflect the one-half year period shown). Because the
Fund is a feeder fund, the expense table example reflects the expenses of both the feeder fund and the master portfolio in which it invests.
2 Hypothetical 5% annual return before expenses is calculated by pro-rating the number of days in the most recent fiscal half year divided by 365.
See “Disclosure of Expenses” on page 6 for further information on how expenses were calculated.
| 4 BLACKROCK BASIC VALUE FUND, INC. DECEMBER 31, 2008 |
Total Return Based on a $10,000 Investment
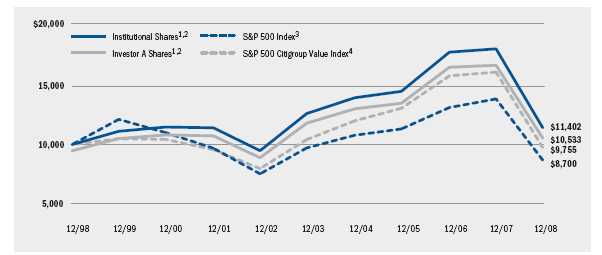
1 Assuming maximum sales charge, if any, transaction costs and other operating expenses, including advisory fees.
2 The Fund invests all of its assets in Master Basic Value LLC. Master Basic Value LLC invests in securities, primarily equities, that management
of the Fund believes are undervalued and therefore represent basic investment value.
3 This unmanaged Index covers 500 industrial, utility, transportation and financial companies of the US markets (mostly New York Stock
Exchange (“NYSE”) issues) representing about 75% of NYSE market capitalization and 30% of NYSE issues.
4 This unmanaged Index is designed to provide a comprehensive measure of large-cap US equity “value” performance. It is an unmanaged
float adjusted market capitalization weighted index comprised of stocks representing approximately half the market capitalization of the
S&P 500 Index that have been identified as being on the value end of the growth-value spectrum.
Past performance is not indicative of future results.
| Performance Summary for the Period Ended December 31, 2008 |
| | | | | | | | | Average Annual Total Returns1 | | | | |
| | | | | 1 Year | | | | 5 Years | | | | 10 Years |
| | | 6-Month | | w/o sales | | w/sales | | w/o sales | | w/sales | | w/o sales | | w/sales |
| | | Total Returns | | charge | | charge | | charge | | charge | | charge | | charge |
| Institutional | | (27.45)% | | (36.45)% | | N/A | | (1.96)% | | N/A | | 1.32% | | N/A |
| Investor A | | (27.56) | | (36.62) | | (39.95)% | | (2.22) | | (3.27)% | | 1.06 | | 0.52% |
| Investor B | | (27.91) | | (37.20) | | (39.93) | | (3.01) | | (3.28) | | 0.44 | | 0.44 |
| Investor C | | (27.90) | | (37.18) | | (37.78) | | (2.99) | | (2.99) | | 0.27 | | 0.27 |
| Class R | | (27.72) | | (36.89) | | N/A | | (2.51) | | N/A | | 0.83 | | N/A |
| S&P 500 Index | | (28.48) | | (37.00) | | N/A | | (2.19) | | N/A | | (1.38) | | N/A |
| S&P 500 Citigroup Value Index | | (27.61) | | (39.22) | | N/A | | (1.31) | | N/A | | (0.25) | | N/A |
1 Assuming maximum sales charges. Average annual total returns with and without sales charges reflect reductions for distribution and service fees. See “About Fund
Performance” on page 6 for a detailed description of share classes, including any related sales charges and fees.
N/A — Not applicable as share class and index do not have a sales charge.
Past performance is not indicative of future results.
BLACKROCK BASIC VALUE FUND, INC. DECEMBER 31, 2008 5
About Fund Performance
•Institutional Shares are not subject to any sales charge. Institutional
Shares bear no ongoing distribution or service fees and are available
only to eligible investors.
•Investor A Shares incur a maximum initial sales charge (front-end load)
of 5.25% and a service fee of 0.25% per year (but no distribution fee).
•Investor B Shares are subject to a maximum contingent deferred sales
charge of 4.50% declining to 0% after six years. In addition, Investor B
Shares are subject to a distribution fee of 0.75% per year and a service
fee of 0.25% per year. These shares automatically convert to Investor A
Shares after approximately eight years. (There is no initial sales charge
for automatic share conversions.) All returns for periods greater than
eight years reflect this conversion.
•Investor C Shares are subject to a distribution fee of 0.75% and a service
fee of 0.25% per year. In addition, Investor C Shares are subject to a 1%
contingent deferred sales charge if redeemed within one year of purchase.
•Class R Shares do not incur a maximum initial sales charge (front-end
load) or deferred sales charge. These shares are subject to a distribution
fee of 0.25% per year and a service fee of 0.25% per year. Class R
Shares are available only to certain retirement plans. Prior to inception,
Class R Share performance results are those of Institutional Shares
(which have no distribution or service fees) restated to reflect Class R
Share fees.
Performance information reflects past performance and does not guar-
antee future results. Current performance may be lower or higher than the
performance data quoted. Refer to www.blackrock.com/funds to obtain
performance data current to the most recent month-end. Performance
results do not reflect the deduction of taxes that a shareholder would
pay on fund distributions or the redemption of fund shares. Figures
shown in the performance table on page 5 assume reinvestment of
all dividends and capital gain distributions, if any, at net asset value
on the ex-dividend date. Investment return and principal value of shares
will fluctuate so that shares, when redeemed, may be worth more or
less than their original cost. Dividends paid to each class of shares will
vary because of the different levels of service, distribution and transfer
agency fees applicable to each class, which are deducted from the
income available to be paid to shareholders.
Disclosure of Expenses
Shareholders of this Fund may incur the following charges: (a) expenses
related to transactions, including sales charges, redemption fees and
exchange fees; and (b) operating expenses including advisory fees, distri-
bution fees including 12b-1 fees, and other Fund expenses. The expense
example on page 4 (which is based on a hypothetical investment of
$1,000 invested on July 1, 2008 and held through December 31,
2008) is intended to assist shareholders both in calculating expenses
based on an investment in the Fund and in comparing these expenses
with similar costs of investing in other mutual funds.
The table provides information about actual account values and actual
expenses. In order to estimate the expenses a shareholder paid during the
period covered by this report, shareholders can divide their account value
by $1,000 and then multiply the result by the number corresponding
to their share class under the heading entitled “Expenses Paid During
the Period.”
The table also provides information about hypothetical account values
and hypothetical expenses based on the Fund’s actual expense ratio and
an assumed rate of return of 5% per year before expenses. In order to
assist shareholders in comparing the ongoing expenses of investing in this
Fund and other funds, compare the 5% hypothetical example with the 5%
hypothetical examples that appear in other funds’ shareholder reports.
The expenses shown in the table are intended to highlight shareholders’
ongoing costs only and do not reflect any transactional expenses, such
as sales charges, redemption fees or exchange fees. Therefore, the hypo-
thetical example is useful in comparing ongoing expenses only, and will
not help shareholders determine the relative total expenses of owning
different funds. If these transactional expenses were included, shareholder
expenses would have been higher.
| 6 BLACKROCK BASIC VALUE FUND, INC. DECEMBER 31, 2008 |
| Statement of Assets and Liabilities | | BlackRock Basic Value Fund, Inc. |
| December 31, 2008 (Unaudited) | | |
| Assets | | |
| Investment at value — Master Basic Value LLC (the “Master LLC”) (cost — $4,066,863,471) | | $3,798,730,773 |
| Withdrawals receivable from the Master LLC | | 18,119,757 |
| Capital shares sold receivable | | 2,187,284 |
| Prepaid expenses | | 34,283 |
| Other assets | | 181,628 |
| Total assets | | 3,819,253,725 |
| |
| Liabilities | | |
| Capital shares redeemed payable | | 20,307,041 |
| Other affiliates payable | | 1,967,535 |
| Distribution fees payable | | 824,149 |
| Officer’s and Directors’ fees payable | | 1,750 |
| Total liabilities | | 23,100,475 |
| Net Assets | | $3,796,153,250 |
| |
| Net Assets Consist of | | |
| Institutional Shares, $0.10 par value, 400,000,000 shares authorized | | $ 9,678,444 |
| Investor A Shares, $0.10 par value, 200,000,000 shares authorized | | 7,643,001 |
| Investor B Shares, $0.10 par value, 400,000,000 shares authorized | | 1,254,849 |
| Investor C Shares, $0.10 par value, 200,000,000 shares authorized | | 2,581,398 |
| Class R Shares, $0.10 par value, 400,000,000 shares authorized | | 109,082 |
| Paid-in capital in excess of par | | 4,331,994,541 |
| Undistributed net investment income | | 3,209,080 |
| Accumulated net realized loss allocated from the Master LLC | | (292,184,447) |
| Net unrealized appreciation/depreciation allocated from the Master LLC | | (268,132,698) |
| Net Assets | | $3,796,153,250 |
| |
| Net Asset Value | | |
| Institutional — Based on net assets of $1,746,653,115 and 96,784,435 shares outstanding | | $ 18.05 |
| Investor A — Based on net assets of $1,372,304,554 and 76,430,005 shares outstanding | | $ 17.96 |
| Investor B — Based on net assets of $221,345,184 and 12,548,488 shares outstanding | | $ 17.64 |
| Investor C — Based on net assets of $436,802,699 and 25,813,979 shares outstanding | | $ 16.92 |
| Class R — Based on net assets of $19,047,698 and 1,090,818 shares outstanding | | $ 17.46 |
See Notes to Financial Statements.
BLACKROCK BASIC VALUE FUND, INC.
| Statement of Operations | | BlackRock Basic Value Fund, Inc. |
| Six Months Ended December 31, 2008 (Unaudited) | | |
| |
| Investment Income | | |
| Net investment income allocated from the Master LLC: | | |
| Dividends | | $ 75,338,334 |
| Securities lending — affiliated | | 939,513 |
| Income — affiliated | | 150,306 |
| Foreign taxes withheld | | (256,035) |
| Expenses | | (10,600,432) |
| Total income | | 65,571,686 |
| |
| Expenses | | |
| Service — Investor A | | 2,138,341 |
| Service and distribution — Investor B | | 1,508,058 |
| Service and distribution — Investor C | | 2,786,700 |
| Service and distribution — Class R | | 59,297 |
| Transfer agent — Institutional | | 1,472,997 |
| Transfer agent — Investor A | | 1,563,210 |
| Transfer agent — Investor B | | 518,314 |
| Transfer agent — Investor C | | 712,159 |
| Transfer agent — Class R | | 37,169 |
| Printing | | 135,790 |
| Registration | | 48,833 |
| Professional | | 42,228 |
| Officer and Directors | | 3,164 |
| Miscellaneous | | 12,212 |
| Total expenses | | 11,038,472 |
| Net investment income | | 54,533,214 |
| |
| Realized and Unrealized Loss Allocated from the Master LLC | | |
| Net realized loss on investments, foreign currency and options written | | (219,583,406) |
| Net change in unrealized appreciation/depreciation on investments and options written | | (1,404,250,521) |
| Total realized and unrealized loss | | (1,623,833,927) |
| Net Decrease in Net Assets Resulting from Operations | | $(1,569,300,713) |
| See Notes to Financial Statements. |
8 BLACKROCK BASIC VALUE FUND, INC.
| Statements of Changes in Net Assets | | BlackRock Basic Value Fund, Inc. |
| |
| | | Six Months | | |
| | | Ended | | Year Ended |
| | | December 31, 2008 | | June 30, |
| Increase (Decrease) in Net Assets: | | (Unaudited) | | 2008 |
| Operations | | | | |
| Net investment income | | $ 54,533,214 | | $ 107,265,031 |
| Net realized gain (loss) | | (219,583,406) | | 521,979,113 |
| Net change in unrealized appreciation/depreciation | | (1,404,250,521) | | (2,043,639,498) |
| Net decrease in net assets resulting from operations | | (1,569,300,713) | | (1,414,395,354) |
| |
| Dividends and Distributions to Shareholders From | | | | |
| Net investment income: | | | | |
| Institutional | | (56,372,234) | | (32,835,680) |
| Investor A | | (38,111,190) | | (18,429,627) |
| Investor B | | (3,159,712) | | (1,294,782) |
| Investor C | | (7,911,748) | | (2,876,816) |
| Class R | | (443,707) | | (201,332) |
| Net realized gain: | | | | |
| Institutional | | (47,280,236) | | (210,850,845) |
| Investor A | | (35,805,612) | | (145,029,284) |
| Investor B | | (6,480,815) | | (33,941,670) |
| Investor C | | (12,527,725) | | (50,862,726) |
| Class R | | (522,499) | | (2,085,725) |
| Decrease in net assets resulting from dividends and distributions to shareholders | | (208,615,478) | | (498,408,487) |
| |
| Capital Share Transactions | | | | |
| Net decrease in net assets derived from capital share transactions | | (267,134,529) | | (752,444,648) |
| |
| Net Assets | | | | |
| Total decrease in net assets | | (2,045,050,720) | | (2,665,248,489) |
| Beginning of period | | 5,841,203,970 | | 8,506,452,459 |
| End of period | | $3,796,153,250 | | $5,841,203,970 |
| End of period undistributed net investment income | | $ 3,209,080 | | $ 54,674,457 |
| See Notes to Financial Statements. |
| BLACKROCK BASIC VALUE FUND, INC. |
| Financial Highlights | | | | | | | | | | BlackRock Basic Value Fund, Inc. |
| |
| | | | | | | | | Institutional | | | | | | |
| | | Six Months | | | | | | | | | | | | | | |
| | | Ended | | | | | | | | | | | | | | |
| | | December 31, 2008 | | | | Year Ended June 30, | | | | |
| | | (Unaudited) | | | | 2008 | | 2007 | | 2006 | | | | 2005 | | 2004 |
| Per Share Operating Performance | | | | | | | | | | | | | | | | |
| Net asset value, beginning of period | | $ 26.12 | | $ 33.96 | | $ 32.87 | | $ 31.19 | | $ 31.89 | | $ 25.83 |
| Net investment income1 | | 0.29 | | | | 0.54 | | 0.55 | | 0.48 | | | | 0.46 | | 0.40 |
| Net realized and unrealized gain (loss) | | (7.33) | | | | (6.28) | | 6.98 | | 3.18 | | | | 0.64 | | 6.06 |
| Net increase (decrease) from investment operations | | (7.04) | | | | (5.74) | | 7.53 | | 3.66 | | | | 1.10 | | 6.46 |
| Dividends and distributions from: | | | | | | | | | | | | | | | | |
| Net investment income | | (0.57) | | | | (0.28) | | (0.80) | | (0.47) | | | | (0.43) | | (0.40) |
| Net realized gain | | (0.46) | | | | (1.82) | | (5.64) | | (1.51) | | | | (1.37) | | — |
| Total dividends and distributions | | (1.03) | | | | (2.10) | | (6.44) | | (1.98) | | | | (1.80) | | (0.40) |
| Net asset value, end of period | | $ 18.05 | | $ 26.12 | | $ 33.96 | | $ 32.87 | | $ 31.19 | | $ 31.89 |
| |
| Total Investment Return2 | | | | | | | | | | | | | | | | |
| Based on net asset value | | (27.45)%3 | | | | (17.84)% | | 25.11% | | 12.18%4 | | | | 3.77% | | 25.23% |
| |
| Ratios to Average Net Assets5 | | | | | | | | | | | | | | | | |
| Total expenses | | 0.58%6 | | | | 0.53% | | 0.54% | | 0.57% | | | | 0.57% | | 0.56% |
| Net investment income | | 2.57%6 | | | | 1.76% | | 1.63% | | 1.52% | | | | 1.49% | | 1.36% |
| |
| Supplemental Data | | | | | | | | | | | | | | | | |
| Net assets, end of period (000) | | $ 1,746,653 | | $ 2,721,795 | | $ 4,071,437 | | $ 3,655,602 | | $ 3,992,702 | | $ 4,220,353 |
| Portfolio turnover of the Master LLC | | 19% | | | | 45% | | 31% | | 42% | | | | 45% | | 33% |
1 Based on average shares outstanding.
2 Total investment returns exclude the effects of any sales charges.
3 Aggregate total investment return.
4 A portion of total investment return consists of payments by the previous investment advisor to the Master LLC for compensation as a result of a securities class action
entitlement recovery and as a result of a corporate action, which increased the return by 0.10% . Excluding these items, the total return would have been 12.08% .
5 Includes the Fund’s share of the Master LLC’s allocated expenses and/or net investment income.
6 Annualized.
| See Notes to Financial Statements. |
10 BLACKROCK BASIC VALUE FUND, INC.
| Financial Highlights (continued) | | | | | | | | | | BlackRock Basic Value Fund, Inc. |
| |
| | | | | | | | | Investor A | | | | | | |
| | | Six Months | | | | | | | | | | | | | | |
| | | Ended | | | | | | | | | | | | | | |
| | | December 31, 2008 | | | | Year Ended June 30, | | | | |
| | | (Unaudited) | | | | 2008 | | 2007 | | 2006 | | | | 2005 | | 2004 |
| Per Share Operating Performance | | | | | | | | | | | | | | | | |
| Net asset value, beginning of period | | $ 25.94 | | $ 33.78 | | $ 32.69 | | $ 31.03 | | $ 31.74 | | $ 25.72 |
| Net investment income1 | | 0.25 | | | | 0.45 | | 0.46 | | 0.40 | | | | 0.38 | | 0.33 |
| Net realized and unrealized gain (loss) | | (7.27) | | | | (6.24) | | 6.95 | | 3.16 | | | | 0.63 | | 6.02 |
| Net increase (decrease) from investment operations | | (7.02) | | | | (5.79) | | 7.41 | | 3.56 | | | | 1.01 | | 6.35 |
| Dividends and distributions from: | | | | | | | | | | | | | | | | |
| Net investment income | | (0.50) | | | | (0.23) | | (0.68) | | (0.39) | | | | (0.35) | | (0.33) |
| Net realized gain | | (0.46) | | | | (1.82) | | (5.64) | | (1.51) | | | | (1.37) | | — |
| Total dividends and distributions | | (0.96) | | | | (2.05) | | (6.32) | | (1.90) | | | | (1.72) | | (0.33) |
| Net asset value, end of period | | $ 17.96 | | $ 25.94 | | $ 33.78 | | $ 32.69 | | $ 31.03 | | $ 31.74 |
| |
| Total Investment Return2 | | | | | | | | | | | | | | | | |
| Based on net asset value | | (27.56)%3 | | | | (18.08)% | | 24.81% | | 11.89%4 | | | | 3.49% | | 24.90% |
| |
| Ratios to Average Net Assets5 | | | | | | | | | | | | | | | | |
| Total expenses | | 0.88%6 | | | | 0.82% | | 0.80% | | 0.82% | | | | 0.82% | | 0.81% |
| Net investment income | | 2.28%6 | | | | 1.48% | | 1.37% | | 1.28% | | | | 1.24% | | 1.11% |
| |
| Supplemental Data | | | | | | | | | | | | | | | | |
| Net assets, end of period (000) | | $ 1,372,305 | | $ 2,026,095 | | $ 2,759,567 | | $ 2,266,626 | | $ 2,242,881 | | $ 2,223,869 |
| Portfolio turnover of the Master LLC | | 19% | | | | 45% | | 31% | | 42% | | | | 45% | | 33% |
1 Based on average shares outstanding.
2 Total investment returns exclude the effects of sales charges.
3 Aggregate total investment return.
4 A portion of total investment return consists of payments by the previous investment advisor to the Master LLC for compensation as a result of a securities class action
entitlement recovery and as a result of a corporate action, which increased the return by 0.10% . Excluding these items, the total return would have been 11.79% .
5 Includes the Fund’s share of the Master LLC’s allocated expenses and/or net investment income.
6 Annualized.
| See Notes to Financial Statements. |
| BLACKROCK BASIC VALUE FUND, INC. |
| Financial Highlights (continued) | | | | | | | | | | BlackRock Basic Value Fund, Inc. |
| |
| | | | | | | | | Investor B | | | | | | |
| | | Six Months | | | | | | | | | | | | | | |
| | | Ended | | | | | | | | | | | | | | |
| | | December 31, 2008 | | | | Year Ended June 30, | | | | |
| | | (Unaudited) | | | | 2008 | | 2007 | | 2006 | | | | 2005 | | 2004 |
| Per Share Operating Performance | | | | | | | | | | | | | | | | |
| Net asset value, beginning of period | | $ 25.30 | | $ 33.10 | | $ 32.00 | | $ 30.39 | | $ 31.08 | | $ 25.19 |
| Net investment income1 | | 0.15 | | | | 0.19 | | 0.19 | | 0.15 | | | | 0.14 | | 0.10 |
| Net realized and unrealized gain (loss) | | (7.11) | | | | (6.10) | | 6.80 | | 3.09 | | | | 0.62 | | 5.92 |
| Net increase (decrease) from investment operations | | (6.96) | | | | (5.91) | | 6.99 | | 3.24 | | | | 0.76 | | 6.02 |
| Dividends and distributions from: | | | | | | | | | | | | | | | | |
| Net investment income | | (0.24) | | | | (0.07) | | (0.25) | | (0.12) | | | | (0.08) | | (0.13) |
| Net realized gain | | (0.46) | | | | (1.82) | | (5.64) | | (1.51) | | | | (1.37) | | — |
| Total dividends and distributions | | (0.70) | | | | (1.89) | | (5.89) | | (1.63) | | | | (1.45) | | (0.13) |
| Net asset value, end of period | | $ 17.64 | | $ 25.30 | | $ 33.10 | | $ 32.00 | | $ 30.39 | | $ 31.08 |
| |
| Total Investment Return2 | | | | | | | | | | | | | | | | |
| Based on net asset value | | (27.91)%3 | | | | (18.76)% | | 23.82% | | 11.01%4 | | | | 2.72% | | 23.95% |
| |
| Ratios to Average Net Assets5 | | | | | | | | | | | | | | | | |
| Total expenses | | 1.79%6 | | | | 1.66% | | 1.59% | | 1.59% | | | | 1.59% | | 1.58% |
| Net investment income | | 1.35%6 | | | | 0.62% | | 0.59% | | 0.50% | | | | 0.47% | | 0.35% |
| |
| Supplemental Data | | | | | | | | | | | | | | | | |
| Net assets, end of period (000) | | $ 221,345 | | $ 389,812 | | $ 729,334 | | $ 860,121 | | $ 1,212,392 | | $ 1,594,286 |
| Portfolio turnover of the Master LLC | | 19% | | | | 45% | | 31% | | 42% | | | | 45% | | 33% |
1 Based on average shares outstanding.
2 Total investment returns exclude the effects of sales charges.
3 Aggregate total investment return.
4 A portion of total investment return consists of payments by the previous investment advisor to the Master LLC for compensation as a result of a securities class action
entitlement recovery and as a result of a corporate action, which increased the return by 0.10% . Excluding these items, the total return would have been 10.91% .
5 Includes the Fund’s share of the Master LLC’s allocated expenses and/or net investment income.
6 Annualized.
See Notes to Financial Statements.
12 BLACKROCK BASIC VALUE FUND, INC.
| Financial Highlights (continued) | | | | | | | | | | BlackRock Basic Value Fund, Inc. |
| |
| | | | | | | | | Investor C | | | | | | |
| | | Six Months | | | | | | | | | | | | | | |
| | | Ended | | | | | | | | | | | | | | |
| | | December 31, 2008 | | | | Year Ended June 30, | | | | |
| | | (Unaudited) | | | | 2008 | | 2007 | | 2006 | | | | 2005 | | 2004 |
| Per Share Operating Performance | | | | | | | | | | | | | | | | |
| Net asset value, beginning of period | | $ 24.37 | | $ 31.97 | | $ 31.15 | | $ 29.66 | | $ 30.42 | | $ 24.68 |
| Net investment income1 | | 0.15 | | | | 0.19 | | 0.19 | | 0.15 | | | | 0.14 | | 0.09 |
| Net realized and unrealized gain (loss) | | (6.84) | | | | (5.87) | | 6.60 | | 3.01 | | | | 0.61 | | 5.79 |
| Net increase (decrease) from investment operations | | (6.69) | | | | (5.68) | | 6.79 | | 3.16 | | | | 0.75 | | 5.88 |
| Dividends and distributions from: | | | | | | | | | | | | | | | | |
| Net investment income | | (0.30) | | | | (0.10) | | (0.33) | | (0.16) | | | | (0.14) | | (0.14) |
| Net realized gain | | (0.46) | | | | (1.82) | | (5.64) | | (1.51) | | | | (1.37) | | — |
| Total dividends and distributions | | (0.76) | | | | (1.92) | | (5.97) | | (1.67) | | | | (1.51) | | (0.14) |
| Net asset value, end of period | | $ 16.92 | | $ 24.37 | | $ 31.97 | | $ 31.15 | | $ 29.66 | | $ 30.42 |
| |
| Total Investment Return2 | | | | | | | | | | | | | | | | |
| Based on net asset value | | (27.90)%3 | | | | (18.71)% | | 23.83% | | 11.02%4 | | | | 2.70% | | 23.93% |
| |
| Ratios to Average Net Assets5 | | | | | | | | | | | | | | | | |
| Total expenses | | 1.70%6 | | | | 1.62% | | 1.58% | | 1.59% | | | | 1.59% | | 1.59% |
| Net investment income | | 1.45%6 | | | | 0.68% | | 0.59% | | 0.50% | | | | 0.46% | | 0.33% |
| |
| Supplemental Data | | | | | | | | | | | | | | | | |
| Net assets, end of period (000) | | $ 436,803 | | $ 675,654 | | $ 906,972 | | $ 763,451 | | $ 743,882 | | $ 679,667 |
| Portfolio turnover of the Master LLC | | 19% | | | | 45% | | 31% | | 42% | | | | 45% | | 33% |
1 Based on average shares outstanding.
2 Total investment returns exclude the effects of sales charges.
3 Aggregate total investment return.
4 A portion of total investment return consists of payments by the previous investment advisor to the Master LLC for compensation as a result of a securities class action
entitlement recovery and as a result of a corporate action, which increased the return by 0.10% . Excluding these items, the total return would have been 10.92% .
5 Includes the Fund’s share of the Master LLC’s allocated expenses and/or net investment income.
6 Annualized.
| See Notes to Financial Statements. |
| BLACKROCK BASIC VALUE FUND, INC. |
| Financial Highlights (concluded) | | | | | | | | | | | | BlackRock Basic Value Fund, Inc. |
| |
| | | | | | | | | Class R | | | | | | | | |
| | | Six Months | | | | | | | | | | | | | | | | |
| | | Ended | | | | | | | | | | | | | | | | |
| | | December 31, 2008 | | | | Year Ended June 30, | | | | |
| | | (Unaudited) | | | | 2008 | | 2007 | | | | 2006 | | | | 2005 | | 2004 |
| Per Share Operating Performance | | | | | | | | | | | | | | | | | | |
| Net asset value, beginning of period | | $ 25.19 | | $ 32.92 | | $ 31.98 | | $ 30.41 | | $ 31.17 | | $ 25.36 |
| Net investment income1 | | 0.20 | | | | 0.33 | | 0.35 | | | | 0.32 | | | | 0.30 | | 0.25 |
| Net realized and unrealized gain (loss) | | (7.07) | | | | (6.06) | | 6.79 | | | | 3.08 | | | | 0.63 | | 5.93 |
| Net increase (decrease) from investment operations | | (6.87) | | | | (5.73) | | 7.14 | | | | 3.40 | | | | 0.93 | | 6.18 |
| Dividends and distributions from: | | | | | | | | | | | | | | | | | | |
| Net investment income | | (0.40) | | | | (0.18) | | (0.56) | | | | (0.32) | | | | (0.32) | | (0.37) |
| Net realized gain | | (0.46) | | | | (1.82) | | (5.64) | | | | (1.51) | | | | (1.37) | | — |
| Total dividends and distributions | | (0.86) | | | | (2.00) | | (6.20) | | | | (1.83) | | | | (1.69) | | (0.37) |
| Net asset value, end of period | | $ 17.46 | | $ 25.19 | | $ 32.92 | | $ 31.98 | | $ 30.41 | | $ 31.17 |
| |
| Total Investment Return | | | | | | | | | | | | | | | | | | |
| Based on net asset value | | (27.72)%2 | | | | (18.37)% | | 24.46% | | | | 11.59%3 | | | | 3.28% | | 24.58% |
| |
| Ratios to Average Net Assets4 | | | | | | | | | | | | | | | | | | |
| Total expenses | | 1.26%5 | | | | 1.18% | | 1.09% | | | | 1.07% | | | | 1.07% | | 1.07% |
| Net investment income | | 1.89%5 | | | | 1.12% | | 1.08% | | | | 1.02% | | | | 0.98% | | 0.80% |
| |
| Supplemental Data | | | | | | | | | | | | | | | | | | |
| Net assets, end of period (000) | | $ 19,048 | | $ 27,849 | | $ 39,143 | | $ 27,114 | | $ 24,817 | | $ 13,821 |
| Portfolio turnover of the Master LLC | | 19% | | | | 45% | | 31% | | | | 42% | | | | 45% | | 33% |
1 Based on average shares outstanding.
2 Aggregate total investment return.
3 A portion of total investment return consists of payments by the previous investment advisor to the Master LLC for compensation as a result of a securities class action
entitlement recovery and as a result of a corporate action, which increased the return by 0.10% . Excluding these items, the total return would have been 11.49% .
4 Includes the Fund’s share of the Master LLC’s allocated expenses and/or net investment income.
5 Annualized.
| See Notes to Financial Statements. |
14 BLACKROCK BASIC VALUE FUND, INC.
Notes to Financial Statements (Unaudited) BlackRock Basic Value Fund, Inc.
1. Organization and Significant Accounting Policies:
BlackRock Basic Value Fund, Inc. (the “Fund”) is registered under the
Investment Company Act of 1940, as amended (the “1940 Act”), as a
diversified, open-end management investment company. The Fund is
organized as a Maryland corporation. The Fund seeks to achieve its
investment objective by investing all of its assets in Master Basic Value
LLC (the “Master LLC”), which has the same investment objective and
strategies as the Fund. The value of the Fund’s investment in the Master
LLC reflects the Fund’s proportionate interest in the net assets of the
Master LLC. The performance of the Fund is directly affected by the
performance of the Master LLC. The financial statements of the Master
LLC, including the Schedule of Investments, are included elsewhere in
this report and should be read in conjunction with the Fund’s financial
statements. The Fund’s financial statements are prepared in conformity
with accounting principles generally accepted in the United States of
America, which may require the use of management accruals and esti-
mates. Actual results may differ from these estimates. The percentage of
the Master LLC owned by the Fund at December 31, 2008 was 99.9% .
The Fund offers multiple classes of shares. Institutional Shares are sold
without a sales charge and only to certain eligible investors. Investor A
Shares are generally sold with a front-end sales charge. Investor B and
Investor C Shares may be subject to a contingent deferred sales charge.
Class R Shares are available only to certain retirement plans. All classes
of shares have identical voting, dividend, liquidation and other rights
and the same terms and conditions, except that Investor A, Investor B,
Investor C and Class R Shares bear certain expenses related to the
shareholder servicing of such shares, and Investor B, Investor C and
Class R Shares also bear certain expenses related to the distribution
of such shares. Each class has exclusive voting rights with respect to
matters relating to its shareholder servicing and distribution expenditures
(except that Investor B shareholders may vote on material changes to
the Investor A distribution plan).
The following is a summary of significant accounting policies followed by
the Fund:
Valuation of Investments: The Fund records its investment in the Master
LLC at fair value. Valuation of securities held by the Master LLC is dis-
cussed in Note 1 of the Master LLC’s Notes to Financial Statements,
which are included elsewhere in this report.
Effective July 1, 2008, the Fund adopted Financial Accounting Standards
Board Statement of Financial Accounting Standards No. 157, “Fair Value
Measurements” (“FAS 157”). FAS 157 clarifies the definition of fair
value, establishes a framework for measuring fair values and requires
additional disclosures about the use of fair value measurements. Various
inputs are used in determining the fair value of investments, which are
as follows:
•Level 1 — price quotations in active markets/exchanges for identical
securities
•Level 2 — other observable inputs (including, but not limited to:
quoted prices for similar assets or liabilities in markets that are not
active, inputs other than quoted prices that are observable for the
assets or liabilities (such as interest rates, yield curves, volatilities,
prepayment speeds, loss severities, credit risks, and default rates) or
other market-corroborated inputs)
•Level 3 — unobservable inputs based on the best information avail-
able in the circumstance, to the extent observable inputs are not
available (including the Fund’s own assumption used in determining
the fair value of investments)
The inputs or methodology used for valuing securities are not necessarily
an indication of the risk associated with investing in those securities.
The following table summarizes the inputs used as of December 31,
2008 in determining the fair valuation of the Fund’s investments:
| | | Investments in |
| Valuation Inputs | | Securities |
| | | Assets |
| Level 1 | | — |
| Level 2 | | $3,798,730,773 |
| Level 3 | | — |
| Total | | $3,798,730,773 |
Investment Transactions and Net Investment Income: Investment trans-
actions in the Master LLC are accounted for on a trade date basis. The
Fund records daily its proportionate share of the Master LLC’s income,
expenses and realized and unrealized gains and losses. In addition, the
Fund accrues its own expenses. Income and realized and unrealized
gains and losses are allocated daily to each class based on its relative
net assets.
Dividends and Distributions to Shareholders: Dividends and distribu-
tions paid by the Fund are recorded on the ex-dividend dates.
Income Taxes: It is the Fund’s policy to comply with the requirements of
the Internal Revenue Code applicable to regulated investment compa-
nies and to distribute substantially all of its taxable income to its share-
holders. Therefore, no federal income tax provision is required.
The Fund files US federal and various state and local tax returns. No
income tax returns are currently under examination. The statute of limita-
tions on the Fund’s US federal tax returns remains open for the years
ended June 30, 2005 through June 30, 2007. The statutes of limitations
on the Fund’s state and local tax returns may remain open for an addi-
tional year depending upon the jurisdiction.
Recent Accounting Pronouncement: In March 2008, Statement of
Financial Accounting Standards No. 161, “Disclosures about Derivative
Instruments and Hedging Activities — an amendment of FASB Statement
No. 133” (“FAS 161”), was issued. FAS 161 is intended to improve
financial reporting for derivative instruments by requiring enhanced
disclosure that enables investors to understand how and why an entity
BLACKROCK BASIC VALUE FUND, INC. DECEMBER 31, 2008 15
Notes to Financial Statements (continued) BlackRock Basic Value Fund, Inc.
uses derivatives, how derivatives are accounted for, and how derivative
instruments affect an entity’s results of operations and financial
position. FAS 161 is effective for financial statements issued for fiscal
years and interim periods beginning after November 15, 2008. The
impact on the Fund’s financial statement disclosures, if any, is currently
being assessed.
Other: Expenses directly related to the Fund or its classes are charged to
that Fund or class. Other operating expenses shared by several funds are
pro-rated among those funds on the basis of relative net assets or other
appropriate methods. Other expenses of the Fund are allocated daily to
each class based on its relative net assets.
2. Transactions with Affiliates:
The Fund has entered into an Administration Agreement with BlackRock
Advisors, LLC (the “Administrator”), an indirect, wholly owned subsidiary
of BlackRock, Inc., to provide administration services (other than invest-
ment advice and related portfolio activities). Currently the Fund pays
the Administrator no fees pursuant to the agreement. Merrill Lynch &
Co., Inc. (“Merrill Lynch”) and The PNC Financial Services Group, Inc.
(“PNC”) are the largest stockholders of BlackRock, Inc. As of December
31, 2008, Merrill Lynch and PNC are affiliates of BlackRock, Inc.
Effective October 1, 2008, the Fund has entered into a Distribution
Agreement and Distribution Plans with BlackRock Investments, Inc.
(“BII”), which replaced FAM Distributors, Inc. (“FAMD”) and BlackRock
Distributors, Inc. and its affiliates (“BDI”) (collectively, the “Distributor”)
as the sole distributor of the Fund. FAMD is a wholly owned subsidiary
of Merrill Lynch Group, Inc. BII and BDI are affiliates of BlackRock,
Inc. The service and distribution fees did not change as a result of
this transaction.
Pursuant to the Distribution Plans adopted by the Fund in accordance
with Rule 12b-1 under the 1940 Act, the Fund pays the Distributor
ongoing service and distribution fees. The fees are accrued daily and
paid monthly at annual rates based upon the average daily net assets
of the shares as follows:
| | | Service | | Distribution |
| | | Fee | | Fee |
| Investor A | | 0.25% | | — |
| Investor B | | 0.25% | | 0.75% |
| Investor C | | 0.25% | | 0.75% |
| Class R | | 0.25% | | 0.25% |
Pursuant to sub-agreements with the Distributor, broker-dealers, includ-
ing Merrill Lynch, Pierce, Fenner & Smith Incorporated (“MLPF&S”), a
wholly owned subsidiary of Merrill Lynch, and the Distributor provide
shareholder servicing and distribution services to the Fund. The on-
going service fee and/or distribution fee compensates the Distributor
and each broker-dealer for providing shareholder servicing and/or
distribution-related services to Investor A, Investor B, Investor C and
Class R shareholders.
For the six months ended December 31, 2008, the Distributor earned
underwriting discounts, direct commissions and dealer concessions on
sales of the Fund’s Investor A Shares, which totaled $177,186.
For the six months ended December 31, 2008, affiliates received contin-
gent deferred sales charges of $116,626 and $42,041 relating to trans-
actions in Investor B and Investor C Shares, respectively.
Furthermore, affiliates received contingent deferred sales charges of
$1,560 relating to transactions subject to front-end sales charge waivers
on Investor A Shares.
PNC Global Investment Servicing (US) Inc., an indirect, wholly owned
subsidiary of PNC and an affiliate of the Administrator, serves as transfer
agent and dividend disbursing agent. Each class of the Fund bears the
costs of transfer agent fees associated with such respective classes.
Transfer agency fees borne by each class of the Fund are comprised of
those fees charged for all shareholder communications including mail-
ing of shareholder reports, dividend and distribution notices, and proxy
materials for shareholders meetings, as well as per account and per
transaction fees related to servicing and maintenance of shareholder
accounts, including the issuing, redeeming and transferring of shares of
each class of the Fund, 12b-1 fee calculation, check writing, anti-money
laundering services, and customer identification services.
Pursuant to written agreements, certain affiliates provide the Fund with
sub-accounting, recordkeeping, sub-transfer agency and other admini-
strative services with respect to sub-accounts they service. For these
services, these affiliates receive an annual fee per shareholder account
which will vary depending on share class. For the six months ended
December 31, 2008, the Fund paid $3,912,290 in return for these
services, which are a component of the transfer agent fees in the
accompanying Statement of Operations.
The Fund may earn income on positive cash balances in demand deposit
accounts that are maintained by the transfer agent on behalf of the
Fund. For the six months ended December 31, 2008, the Fund earned
$1,869, which is included in income — affiliated in the Statement
of Operations.
The Administrator maintains a call center, which is responsible for pro-
viding certain shareholder services to the Fund, such as responding to
shareholder inquiries and processing transactions based upon instruc-
tions from shareholders with respect to the subscription and redemption
of Fund shares. For the six months ended December 31, 2008, the Fund
reimbursed the Advisor the following amounts for costs incurred running
the call center, which are a component of the transfer agent fees in the
accompanying Statement of Operations.
| 16 BLACKROCK BASIC VALUE FUND, INC. DECEMBER 31, 2008 |
| | Notes to Financial Statements (concluded) BlackRock Basic Value Fund, Inc. |
| | | Call Center |
| | | Fees |
| Institutional | | $16,506 |
| Investor A | | $22,458 |
| Investor B | | $ 5,298 |
| Investor C | | $ 7,140 |
| Class R | | $ 168 |
Certain officers and/or directors of the Fund are officers and/or directors
of BlackRock, Inc. or its affiliates. The Fund reimburses the Advisor for
compensation paid to the Fund’s Chief Compliance Officer.
3. Capital Loss Carryforward:
On June 30, 2008, the Fund had a capital loss carryforward of $8,227,
all of which expires in 2010. This amount will be available to offset
future realized capital gains.
4. Capital Share Transactions:
Transactions in shares for each class were as follows: |
| | | Six Months Ended | | | | Year Ended | | |
| | | December 31, 2008 | | June 30, 2008 |
| | | Shares | | Amount | | Shares | | | | Amount |
| Institutional | | | | | | | | | | | | |
| Shares sold | | 7,012,664 | | $ 148,328,392 | | 13,980,368 | | $ 418,812,576 |
| Shares issued to shareholders in reinvestment of distributions | | 4,499,728 | | 95,083,334 | | 7,285,389 | | | | 226,137,570 |
| Total issued | | 11,512,392 | | 243,411,726 | | 21,265,757 | | | | 644,950,146 |
| Shares redeemed | | (18,921,768) | | (385,708,011) | | (36,967,297) | | (1,084,515,563) |
| Net decrease | | (7,409,376) | | $ (142,296,285) | | (15,701,540) | | $ (439,565,417) |
| |
| Investor A | | | | | | | | | | | | |
| Shares sold and automatic conversion of shares | | 6,716,341 | | $ 145,859,641 | | 10,606,602 | | $ 319,907,553 |
| Shares issued to shareholders in reinvestment of distributions | | 3,209,773 | | 67,428,127 | | 4,772,054 | | | | 147,284,060 |
| Total issued | | 9,926,114 | | 213,287,768 | | 15,378,656 | | | | 467,191,613 |
| Shares redeemed | | (11,597,107) | | (241,582,847) | | (18,973,165) | | | | (567,821,408) |
| Net decrease | | (1,670,993) | | $ (28,295,079) | | (3,594,509) | | $ (100,629,795) |
| |
| Investor B | | | | | | | | | | | | |
| Shares sold | | 615,253 | | $ 12,639,523 | | 1,375,035 | | $ 40,678,829 |
| Shares issued to shareholders in reinvestment of distributions | | 416,763 | | | | 8,808,027 | | 1,069,890 | | | | 32,391,163 |
| Total issued | | 1,032,016 | | 21,447,550 | | 2,444,925 | | | | 73,069,992 |
| Shares redeemed and automatic conversion of shares | | (3,890,598) | | (81,812,278) | | (9,072,515) | | | | (268,510,355) |
| Net decrease | | (2,858,582) | | $ (60,364,728) | | (6,627,590) | | $ (195,440,363) |
| |
| Investor C | | | | | | | | | | | | |
| Shares sold | | 1,755,201 | | $ 34,547,193 | | 3,711,488 | | $ 105,711,256 |
| Shares issued to shareholders in reinvestment of dividends | | | | | | | | | | | | |
| and distributions | | 929,878 | | 18,735,771 | | 1,701,515 | | | | 49,581,265 |
| Total issued | | 2,685,079 | | 53,282,964 | | 5,413,003 | | | | 155,292,521 |
| Shares redeemed | | (4,598,658) | | (89,277,290) | | (6,053,227) | | | | (169,997,824) |
| Net decrease | | (1,913,579) | | $ (35,994,326) | | (640,224) | | $ (14,705,303) |
| |
| Class R | | | | | | | | | | | | |
| Shares sold | | 192,110 | | $ 4,076,556 | | 546,707 | | $ 16,370,482 |
| Shares issued to shareholders in reinvestment of dividends | | | | | | | | | | | | |
| and distributions | | 46,865 | | | | 965,415 | | 76,088 | | | | 2,285,601 |
| Total issued | | 238,975 | | | | 5,041,971 | | 622,795 | | | | 18,656,083 |
| Shares redeemed | | (253,717) | | | | (5,226,082) | | (706,374) | | | | (20,759,853) |
| Net decrease | | (14,742) | | $ (184,111) | | (83,579) | | $ (2,103,770) |
5. Subsequent Event:
On January 1, 2009, Bank of America Corporation announced that it
had completed its acquisition of Merrill Lynch, one of the largest stock-
holders of BlackRock, Inc.
BLACKROCK BASIC VALUE FUND, INC. DECEMBER 31, 2008 17
| Portfolio Information | | | | | | Master Basic Value LLC |
| |
| As of December 31, 2008 | | | | | | |
| | | Percent of | | | | Percent of |
| | | Long-Term | | | | Long-Term |
| Ten Largest Equity Holdings | | Investments | | Investment Criteria | | Investments |
| Bristol-Myers Squibb Co. | | 5% | | Above-Average Yield | | 40% |
| Exxon Mobil Corp. | | 5 | | Below-Average Price/Earnings Ratio | | 25 |
| The Travelers Cos., Inc. | | 5 | | Low Price-to-Book Value | | 21 |
| Xerox Corp. | | 4 | | Special Situations | | 10 |
| Time Warner, Inc. | | 4 | | Price-to-Cash Flow | | 4 |
| JPMorgan Chase & Co. | | 4 | | | | |
| General Mills, Inc. | | 3 | | | | |
| Kraft Foods, Inc. | | 3 | | | | |
| Unilever NV | | 3 | | | | |
| Kimberly-Clark Corp. | | 3 | | | | |
18 BLACKROCK BASIC VALUE FUND, INC.
| Schedule of Investments December 31, 2008 (Unaudited) | | Master Basic Value LLC |
| | | | | | | (Percentages shown are based on Net Assets) |
| Common Stocks | | Shares | | Value | | Common Stocks | | Shares | | Value |
| Above-Average Yield — 40.2% | | | | | | Below-Average Price/Earnings Ratio (concluded) | | |
| Aerospace & Defense — 0.9% | | | | | | Diversified Financial Services — 1.8% | | | | |
| Honeywell International, Inc. | | 995,500 | | $ 32,682,265 | | Bank of America Corp. | | 4,645,600 | | $ 65,410,048 |
| Capital Markets — 1.8% | | | | | | Citigroup, Inc. | | 563,600 | | 3,781,756 |
| The Bank of New York Mellon Corp. | | 2,409,000 | | 68,246,970 | | | | | | 69,191,804 |
| Chemicals — 1.7% | | | | | | Food Products — 5.9% | | | | |
| E.I. du Pont de Nemours & Co. | | 2,634,000 | | 66,640,200 | | Kraft Foods, Inc. | | 4,301,469 | | 115,494,443 |
| Diversified Financial Services — 3.6% | | | | | | Unilever NV (a) | | 4,509,300 | | 110,703,315 |
| JPMorgan Chase & Co. | | 4,380,100 | | 138,104,553 | | | | | | 226,197,758 |
| Diversified Telecommunication Services — 5.0% | | | | | | Health Care Providers & Services — 0.9% | | | | |
| AT&T Inc. | | 3,484,100 | | 99,296,850 | | Cardinal Health, Inc. | | 1,036,883 | | 35,741,357 |
| Verizon Communications, Inc. | | 2,687,800 | | 91,116,420 | | Insurance — 6.5% | | | | |
| | | | | 190,413,270 | | MetLife, Inc. | | 1,880,300 | | 65,547,258 |
| Electric Utilities — 1.8% | | | | | | Prudential Financial, Inc. | | 167,400 | | 5,065,524 |
| The Southern Co. | | 1,807,100 | | 66,862,700 | | The Travelers Cos., Inc. | | 3,893,976 | | 176,007,715 |
| Electrical Equipment — 0.1% | | | | | | | | | | 246,620,497 |
| Emerson Electric Co. | | 113,500 | | 4,155,235 | | Media — 1.6% | | | | |
| Food Products — 3.2% | | | | | | Viacom, Inc. Class B (b) | | 3,161,400 | | 60,256,284 |
| General Mills, Inc. | | 1,990,900 | | 120,947,175 | | Metals & Mining — 0.1% | | | | |
| Household Products — 0.7% | | | | | | Nucor Corp. | | 84,200 | | 3,890,040 |
| Clorox Co. | | 449,800 | | 24,990,888 | | Office Electronics — 3.7% | | | | |
| Industrial Conglomerates — 0.2% | | | | | | Xerox Corp. | | 17,772,371 | | 141,645,797 |
| General Electric Co. | | 398,200 | | 6,450,840 | | Software — 0.8% | | | | |
| Metals & Mining — 1.1% | | | | | | Microsoft Corp. | | 1,460,007 | | 28,382,536 |
| Alcoa, Inc. | | 3,834,400 | | 43,175,344 | | Total Below-Average Price/Earnings Ratio | | | | 934,796,448 |
| Multi-Utilities — 1.4% | | | | | | | | | | |
| Dominion Resources, Inc. | | 1,538,698 | | 55,146,936 | | Low Price-to-Book Value — 21.2% | | | | |
| Oil, Gas & Consumable Fuels — 6.8% | | | | | | | | | | |
| Chevron Corp. | | 995,500 | | 73,637,135 | | Aerospace & Defense — 2.5% | | | | |
| Exxon Mobil Corp. | | 2,312,100 | | 184,574,943 | | Raytheon Co. | | 1,830,094 | | 93,407,998 |
| | | | | 258,212,078 | | Communications Equipment — 0.2% | | | | |
| | | | | | | Corning, Inc. | | 833,100 | | 7,939,443 |
| Pharmaceuticals — 10.6% | | | | | | | | | | |
| Bristol-Myers Squibb Co. | | 8,471,800 | | 196,969,350 | | Energy Equipment & Services — 2.3% | | | | |
| Johnson & Johnson | | 1,025,700 | | 61,367,631 | | Halliburton Co. | | 4,759,800 | | 86,533,164 |
| Pfizer, Inc. | | 3,321,100 | | 58,816,681 | | Hotels, Restaurants & Leisure — 0.1% | | | | |
| Wyeth | | 2,289,600 | | 85,882,896 | | Carnival Corp. | | 165,600 | | 4,027,392 |
| | | | | 403,036,558 | | Household Products — 2.6% | | | | |
| Semiconductors & Semiconductor | | | | | | Kimberly-Clark Corp. | | 1,906,200 | | 100,532,988 |
| Equipment — 1.3% | | | | | | Industrial Conglomerates — 0.9% | | | | |
| Analog Devices, Inc. | | 2,520,339 | | 47,936,848 | | Tyco International Ltd. | | 1,622,225 | | 35,040,060 |
| Total Above-Average Yield | | | | 1,527,001,860 | | Machinery — 1.7% | | | | |
| | | | | | | Deere & Co. | | 1,690,600 | | 64,783,792 |
| |
| Below-Average Price/Earnings Ratio — 24.6% | | | | | | Media — 5.3% | | | | |
| | | | | | | Time Warner, Inc. (c) | | 13,956,200 | | 140,399,372 |
| Aerospace & Defense — 1.0% | | | | | | Walt Disney Co. | | 2,760,400 | | 62,633,476 |
| Northrop Grumman Corp. | | 796,400 | | 35,869,856 | | | | | | 203,032,848 |
| Chemicals — 0.2% | | | | | | Oil, Gas & Consumable Fuels — 1.0% | | | | |
| Air Products & Chemicals, Inc. | | 149,700 | | 7,525,419 | | Anadarko Petroleum Corp. | | 946,800 | | 36,499,140 |
| Computers & Peripherals — 2.1% | | | | | | | | | | |
| Hewlett-Packard Co. | | 2,190,000 | | 79,475,100 | | | | | | |
See Notes to Financial Statements.
BLACKROCK BASIC VALUE FUND, INC. DECEMBER 31, 2008 19 |
Schedule of Investments (concluded) Master Basic Value LLC
(Percentages shown are based on Net Assets) |
| Common Stocks | | Shares | | Value |
| Low Price-to-Book Value (concluded) | | | | |
| Semiconductors & Semiconductor | | | | |
| Equipment — 4.6% | | | | |
| Fairchild Semiconductor International, Inc. (b) | | 8,396,442 | | $ 41,058,601 |
| LSI Corp. (b)(c) | | 24,651,096 | | 81,102,106 |
| Micron Technology, Inc. (b)(c) | | 19,804,588 | | 52,284,112 |
| | | | | 174,444,819 |
| Total Low Price-to-Book Value | | | | 806,241,644 |
| |
| Price-to-Cash Flow — 3.4% | | | | |
| Diversified Telecommunication Services — 2.5% | | | | |
| Qwest Communications International Inc. (c) | | 26,339,800 | | 95,876,872 |
| Oil, Gas & Consumable Fuels — 0.9% | | | | |
| Peabody Energy Corp. | | 1,467,900 | | 33,394,725 |
| Total Price-to-Cash Flow | | | | 129,271,597 |
| |
| Special Situations — 10.3% | | | | |
| Computers & Peripherals — 2.0% | | | | |
| International Business Machines Corp. | | 917,900 | | 77,250,464 |
| Energy Equipment & Services — 2.3% | | | | |
| BJ Services Co. | | 7,532,068 | | 87,899,234 |
| Health Care Equipment & Supplies - 1.7% | | | | |
| Baxter International, Inc. | | 581,900 | | 31,184,021 |
| Covidien Ltd. | | 871,000 | | 31,565,040 |
| | | | | 62,749,061 |
| Pharmaceuticals — 2.6% | | | | |
| Schering-Plough Corp. | | 5,895,100 | | 100,393,553 |
| Semiconductors & Semiconductor | | | | |
| Equipment — 1.7% | | | | |
| Intel Corp. | | 4,329,700 | | 63,473,402 |
| Total Special Situations | | | | 391,765,714 |
| Total Long-Term Investments | | | | |
| (Cost — $4,058,082,611) — 99.7% | | | | 3,789,077,263 |
| |
| | | Beneficial | | |
| | | Interest | | |
| | | (000) | | |
| Short-Term Securities — 4.2% | | | | |
| BlackRock Liquidity Series, LLC | | | | |
| Cash Sweep Series, 1.64% (d)(e) | | $ 17,552 | | 17,552,035 |
| BlackRock Liquidity Series, LLC | | | | |
| Money Market Series, 0.80% (d)(e)(f) | | 143,984 | | 143,983,800 |
| Total Short-Term Securities | | | | |
| (Cost — $161,535,835) — 4.2% | | | | 161,535,835 |
| Total Investments (Cost — $4,219,618,446*) — 103.9% | | 3,950,613,098 |
| Liabilities in Excess of Other Assets — (3.9)% | | | | (148,369,945) |
| Net Assets — 100.0% | | | | $3,802,243,153 |
* The cost and unrealized appreciation (depreciation) of investments as of
December 31, 2008, as computed for federal income tax purposes, were
as follows:
| Aggregate cost | | $ 4,261,185,487 |
| Gross unrealized appreciation | | $ 601,139,601 |
| Gross unrealized depreciation | | (911,711,990) |
| Net unrealized depreciation | | $ (310,572,389) |
(a) Depositary receipts.
(b) Non-income producing security.
(c) Security, or a portion of security, is on loan.
(d) Investments in companies considered to be an affiliate of the Master LLC, for
purposes of Section 2(a)(3) of the Investment Company Act of 1940, were
as follows:
| | | Net | | |
| Affiliate | | Activity | | Income |
| BlackRock Liquidity Series, LLC | | | | |
| Cash Sweep Series | | $ 17,552,035 | | $148,528 |
| BlackRock Liquidity Series, LLC | | | | |
| Money Market Series | | $(480,183,511) | | $940,061 |
(e) Represents the current yield as of report date.
(f) Security was purchased with cash proceeds from securities loans.
•For Master LLC compliance purposes, the Master LLC’s industry classifications
refer to any one or more of the industry sub-classifications used by one or more
widely recognized market indexes or ratings group indexes, and/or as defined by
Master LLC management. This definition may not apply for purposes of this
report, which may combine industry sub-classifications for reporting ease.
•Effective July 1, 2008, the Master LLC adopted Financial Accounting Standards
Board Statement of Financial Accounting Standards No. 157, "Fair Value
Measurements" ("FAS 157"). FAS 157 clarifies the definition of fair value,
establishes a framework for measuring fair values and requires additional
disclosures about the use of fair value measurements. Various inputs are used
in determining the fair value of investments, which are as follows:
•Level 1 — price quotations in active markets/exchanges for identical securities
•Level 2 — other observable inputs (including, but not limited to: quoted prices
for similar assets or liabilities in markets that are not active, inputs other than
quoted prices that are observable for the assets or liabilities (such as interest
rates, yield curves, volatilities, prepayment speeds, loss severities, credit risks,
and default rates) or other market-corroborated inputs)
•Level 3 — unobservable inputs based on the best information available in
the circumstance, to the extent observable inputs are not available (including
the Master LLC's own assumption used in determining the fair value of
investments)
The inputs or methodology used for valuing securities are not necessarily an
indication of the risk associated with investing in those securities. For infor-
mation about Master LLC's policy regarding valuation of investments and
other significant accounting policies, please refer to Note 1 of the Notes to
Financial Statements.
The following table summarizes the inputs used as of December 31, 2008 in
determining the fair valuation of the Master LLC’s investments:
| Valuation | | Investments in |
| Inputs | | Securities |
| | | Assets |
| Level 1 | | $ 3,789,077,263 |
| Level 2 | | 161,535,835 |
| Level 3 | | — |
| Total | | $ 3,950,613,098 |
See Notes to Financial Statements.
| 20 BLACKROCK BASIC VALUE FUND, INC. DECEMBER 31, 2008 |
| Statement of Assets and Liabilities | | Master Basic Value LLC |
| |
| December 31, 2008 (Unaudited) | | |
| Assets | | |
| Investments at value — unaffiliated (including securities loaned of $133,320,175) (cost — $4,058,082,611) | | $3,789,077,263 |
| Investments at value — affiliated (cost — $161,535,835) | | 161,535,835 |
| Dividends receivable | | 9,524,090 |
| Investments sold receivable | | 7,567,468 |
| Securities lending income receivable — affiliated | | 236,856 |
| Prepaid expenses | | 187,171 |
| Other assets | | 17,973 |
| Total assets | | 3,968,146,656 |
| |
| Liabilities | | |
| Collateral at value — securities loaned | | 143,983,800 |
| Bank overdraft | | 106,847 |
| Withdrawals payable to investors | | 18,113,984 |
| Investments purchased payable | | 2,021,302 |
| Investment advisory fees payable | | 1,276,807 |
| Other affiliates payable | | 51,840 |
| Other accrued expenses payable | | 260,251 |
| Officer’s and Directors’ fees payable | | 1,752 |
| Other liabilities | | 86,920 |
| Total liabilities | | 165,903,503 |
| Net Assets | | $3,802,243,153 |
| |
| Net Assets Consist of | | |
| Investors’ capital | | $4,071,248,501 |
| Net unrealized appreciation/depreciation | | (269,005,348) |
| Net Assets | | $3,802,243,153 |
| See Notes to Financial Statements. |
| BLACKROCK BASIC VALUE FUND, INC. |
| Statement of Operations | | Master Basic Value LLC |
| |
| Six Months Ended December 31, 2008 (Unaudited) | | |
| Investment Income | | |
| Dividends | | $ 75,385,472 |
| Foreign taxes withheld | | (256,228) |
| Income — affiliated | | 150,397 |
| Securities lending — affiliated | | 940,061 |
| Total income | | 76,219,702 |
| |
| Expenses | | |
| Investment advisory | | 9,827,150 |
| Accounting services | | 386,570 |
| Custodian | | 122,674 |
| Officer and Directors | | 92,812 |
| Professional | | 82,156 |
| Printing | | 7,132 |
| Miscellaneous | | 88,287 |
| Total expenses | | 10,606,781 |
| Net investment income | | 65,612,921 |
| |
| Realized and Unrealized Gain (Loss) | | |
| Net realized gain (loss) from: | | |
| Investments | | (226,447,581) |
| Foreign currency | | 1,610 |
| Options written | | 6,700,746 |
| | | (219,745,225) |
| Net change in unrealized appreciation/depreciation on: | | |
| Investments | | (1,403,521,382) |
| Options written | | (1,615,254) |
| | | (1,405,136,636) |
| Total realized and unrealized loss | | (1,624,881,861) |
| Net Decrease in Net Assets Resulting from Operations | | $(1,559,268,940) |
See Notes to Financial Statements.
22 BLACKROCK BASIC VALUE FUND, INC.
| Statements of Changes in Net Assets | | | | | | | | Master Basic Value LLC |
| |
| | | | | | | | | | | Six Months | | |
| | | | | | | | | | | Ended | | Year Ended |
| | | | | | | | | December 31, 2008 | | June 30, |
| Increase (Decrease) in Net Assets: | | | | | | | | | | (Unaudited) | | 2008 |
| Operations | | | | | | | | | | | | |
| Net investment income | | | | | | | | $ 65,612,921 | | $ 137,476,570 |
| Net realized gain (loss) | | | | | | | | | | (219,745,225) | | 521,706,871 |
| Net change in unrealized appreciation/depreciation | | | | | | | | (1,405,136,636) | | (2,043,627,609) |
| Net decrease in net assets resulting from operations | | | | | | | | (1,559,268,940) | | (1,384,444,168) |
| |
| Capital Transactions | | | | | | | | | | | | |
| Proceeds from contributions | | | | | | | | | | 348,153,258 | | 904,423,324 |
| Fair value of withdrawals | | | | | | | | | | (833,346,204) | | (2,183,537,046) |
| Net decrease in net assets derived from capital transactions | | | | | | | | | | (485,192,946) | | (1,279,113,722) |
| |
| Net Assets | | | | | | | | | | | | |
| Total decrease in net assets | | | | | | | | (2,044,461,886) | | (2,663,557,890) |
| Beginning of period | | | | | | | | 5,846,705,039 | | 8,510,262,929 |
| End of period | | | | | | | | $ 3,802,243,153 | | $ 5,846,705,039 |
| |
| |
| |
| |
| Financial Highlights | | | | | | | | | | Master Basic Value LLC |
| |
| | | Six Months | | | | | | | | | | |
| | | Ended | | | | | | | | | | |
| | | December 31, 2008 | | | | | | Year Ended June 30, | | |
| | | (Unaudited) | | 2008 | | 2007 | | 2006 | | 2005 | | 2004 |
| Total Investment Return | | | | | | | | | | | | |
| Total investment return | | (27.36)%1 | | (17.73)% | | 25.25% | | 12.32%2 | | 3.91% | | 25.38% |
| |
| Ratios to Average Net Assets | | | | | | | | | | | | |
| Total expenses | | 0.44%3 | | 0.43% | | 0.43% | | 0.43% | | 0.43% | | 0.43% |
| Net investment income | | 2.71%3 | | 1.87% | | 1.74% | | 1.66% | | 1.63% | | 1.50% |
| |
| Supplemental Data | | | | | | | | | | | | |
| Net assets, end of period (000) | | $ 3,802,243 | | $ 5,846,705 | | $ 8,510,263 | | $ 7,581,315 | | $ 8,228,928 | | $ 8,747,240 |
| Portfolio turnover | | 19% | | 45% | | 31% | | 42% | | 45% | | 33% |
1 Aggregate total investment return.
2 A portion of total investment return consists of payments by the previous investment advisor for compensation as a result of a securities class action entitlement recovery
and as a result of a corporate action, which increased the return by 0.10% . Excluding these items, the total return would have been 12.22% .
3 Annualized.
| See Notes to Financial Statements. |
| BLACKROCK BASIC VALUE FUND, INC. |
Notes to Financial Statements (Unaudited) Master Basic Value LLC
1. Organization and Significant Accounting Policies:
Master Basic Value LLC (the “Master LLC”) is registered under the
Investment Company Act of 1940, as amended (the “1940 Act”), and
is organized as a Delaware limited liability company. The Limited Liability
Company Agreement permits the Board of Directors (the “Directors”) to
issue nontransferable interests in the Master LLC, subject to certain
limitations. The Master LLC’s financial statements are prepared in
conformity with accounting principles generally accepted in the United
States of America, which may require the use of management accruals
and estimates. Actual results may differ from these estimates.
The following is a summary of significant accounting policies followed by
the Master LLC:
Valuation of Investments: Equity investments traded on a recognized
securities exchange or the NASDAQ Global Market System are valued at
the last reported sale price that day or the NASDAQ official closing price,
if applicable. For equity investments traded on more than one exchange,
the last reported sale price on the exchange where the stock is primarily
traded is used. Equity investments traded on a recognized exchange for
which there were no sales on that day are valued at the last available
bid price. If no bid price is available, the prior day’s price will be used,
unless it is determined that such prior day’s price no longer reflects the
fair value of the security. The Master LLC values its investments in Cash
Sweep Series and Money Market Series, each of the BlackRock Liquidity
Series, LLC, at fair value, which is ordinarily based upon their pro-rata
ownership in the net assets of the underlying fund.
Exchange-traded options are valued at the mean between the last bid
and ask prices at the close of the options market in which the options
trade. An exchange-traded option for which there is no mean price is
valued at the last bid (long positions) or ask (short positions) price. If
no bid or ask price is available, the prior day’s price will be used unless
it is determined that the prior day’s price no longer reflects the fair value
of the option. Over-the-counter (“OTC”) options are valued by an inde-
pendent pricing service using a mathematical model which incorporates
a number of market data factors, such as the trades and prices of the
underlying securities.
In the event that application of these methods of valuation results in
a price for an investment which is deemed not to be representative of
the market value of such investment, the investment will be valued by
a method approved by the Board as reflecting fair value (“Fair Value
Assets”). When determining the price for Fair Value Assets, the invest-
ment advisor and/or sub-advisor seeks to determine the price that the
Fund might reasonably expect to receive from the current sale of that
asset in an arm’s-length transaction. Fair value determinations shall
be based upon all available factors that the investment advisor and/or
sub-advisor deems relevant. The pricing of all Fair Value Assets is subse-
quently reported to the Board or a committee thereof.
Generally, trading in foreign securities, is substantially completed each
day at various times prior to the close of business on the New York Stock
Exchange (“NYSE”). The values of such securities used in computing the
net assets of the Master LLC are determined as of such times. Foreign
currency exchange rates will be determined as of the close of business
on the NYSE. Occasionally, events affecting the values of such securities
and such exchange rates may occur between the times at which they
are determined and the close of business on the NYSE that may not be
reflected in the computation of the Master LLC’s net assets. If events
(for example, a company announcement, market volatility or a natural
disaster) occur during such periods that are expected to materially
affect the value of such securities, those securities may be valued at
their fair value as determined in good faith by the Board or by the
investment advisor using a pricing service and/or procedures approved
by the Board. Foreign currency exchange contracts are valued at the
mean between the bid and ask prices. Interpolated values are derived
when the settlement date of the contract is an interim date for which
quotations are not available.
Derivative Financial Instruments: The Master LLC may engage in various
portfolio investment strategies both to increase the return of the Master
LLC and to hedge, or protect, its exposure to interest rate movements
and movements in the securities markets. Losses may arise if the value
of the contract decreases due to an unfavorable change in the price
of the underlying security, or if the counterparty does not perform under
the contract.
•Options — The Master LLC may purchase and write call and put
options. A call option gives the purchaser of the option the right
(but not the obligation) to buy, and obligates the seller to sell (when
the option is exercised), the underlying position at the exercise price
at any time or at a specified time during the option period. A put
option gives the holder the right to sell and obligates the writer to
buy the underlying position at the exercise price at any time or at
a specified time during the option period.
When the Master LLC purchases (writes) an option, an amount equal
to the premium paid (received) by the Master LLC is reflected as an
asset and an equivalent liability. The amount of the asset (liability) is
subsequently marked-to-market to reflect the current market value of
the option written. When a security is purchased or sold through an
exercise of an option, the related premium paid (or received) is added
to (or deducted from) the basis of the security acquired or deducted
from (or added to) the proceeds of the security sold. When an option
expires (or the Master LLC enters into a closing transaction), the
Master LLC realizes a gain or loss on the option to the extent of the
premiums received or paid (or gain or loss to the extent the cost of
the closing transaction exceeds the premium received or paid). When
the Master LLC writes a call option, such option is “covered” meaning
that the Master LLC holds the underlying security subject to being
| 24 BLACKROCK BASIC VALUE FUND, INC. DECEMBER 31, 2008 |
Notes to Financial Statements (continued) Master Basic Value LLC
called by the option counterparty, or cash in an amount sufficient to
cover the obligation. When the Master LLC writes a put option, such
option is covered by cash in an amount sufficient to cover the obliga-
tion. Certain call options are written as part of an arrangement where
the counterparty to the transaction borrows the underlying security
from the Master LLC in a securities lending transaction.
In purchasing and writing options, the Master LLC bears the market
risk of an unfavorable change in the price of the underlying security.
Exercise of a written option could result in the Master LLC purchas-
ing a security at a price different from the current market value. The
Master LLC may execute transactions in both listed and OTC options.
Transactions in certain OTC options may expose the Master LLC to
the risk of default by the counterparty to the transaction.
Foreign Currency Transactions: Foreign currency amounts are translated
into United States dollars on the following basis: (i) market value
of investment securities, assets and liabilities at the current rate of
exchange; and (ii) purchases and sales of investment securities, income
and expenses at the rates of exchange prevailing on the respective
dates of such transactions.
The Master LLC reports foreign currency related transactions as com-
ponents of realized gains for financial reporting purposes, whereas
such components are treated as ordinary income for Federal income
tax purposes.
Segregation and Collateralization: In cases in which the 1940 Act and
the interpretive positions of the Securities and Exchange Commission
(“SEC”) require that the Master LLC segregates assets in connection with
certain investments (e.g., options, written options), the Master LLC will,
consistent with certain interpretive letters issued by the SEC, designate
on its books and records cash or other liquid securities having a market
value at least equal to the amount that would otherwise be required
to be physically segregated. Furthermore, based on requirements and
agreements with certain exchanges and third party broker-dealers, the
Master LLC may also be required to deliver or deposit securities as
collateral for certain investments (e.g., written options).
Investment Transactions and Investment Income: Investment trans-
actions are recorded on the dates the transactions are entered into
(the trade dates). Realized gains and losses on security transactions
are determined on the identified cost basis. Dividend income is
recorded on the ex-dividend dates. Interest income is recognized on
the accrual basis.
Securities lending: The Master LLC may lend securities to financial
institutions that provide cash or securities issued or guaranteed by the
US government as collateral, which will be maintained at all times
in an amount equal to at least 100% of the current market value of
the loaned securities. The market value of the loaned securities is deter-
mined at the close of business of the Master LLC and any additional
required collateral is delivered to the Master LLC on the next business
day. The Master LLC typically receives the income on the loaned securities
but does not receive the income on the collateral. Where the Master
LLC receives cash collateral, it may invest such collateral and retain the
amount earned on such investment, net of any amount rebated to the
borrower. The Master LLC may receive a flat fee for its loans. Loans of
securities are terminable at any time and the borrower, after notice, is
required to return borrowed securities within the standard time period
for settlement of securities transactions. The Master LLC may pay reason-
able lending agent, administrative and custodial fees in connection
with its loans. In the event that the borrower defaults on its obligation to
return borrowed securities because of insolvency or for any other reason,
the Master LLC could experience delays and costs in gaining access to
the collateral. The Master LLC also could suffer a loss where the value
of the invested collateral falls below the market value of the borrowed
securities either in the event of borrower default or in the event of losses
on investments made with cash collateral. For the six months ended
December 31, 2008, the Master LLC received only cash collateral for
any securities loaned.
Income Taxes: The Master LLC is classified as a “pass-through entity”
for federal income tax purposes. As such, each investor in the Master LLC
is treated as owner of its proportionate share of the net assets, income,
expenses and realized and unrealized gains and losses of the Master
LLC. Therefore, no federal income tax provision is required.
It is intended that the Master LLC’s assets will be managed so an
investor in the Master LLC can satisfy the requirements of Subchapter M
of the Internal Revenue Code.
Recent Accounting Pronouncement: In March 2008, Statement of
Financial Accounting Standards No. 161, “Disclosures about Derivative
Instruments and Hedging Activities — an amendment of FASB Statement
No. 133” (“FAS 161”), was issued. FAS 161 is intended to improve
financial reporting for derivative instruments by requiring enhanced
disclosure that enables investors to understand how and why an entity
uses derivatives, how derivatives are accounted for, and how derivative
instruments affect an entity’s results of operations and financial
position. FAS 161 is effective for financial statements issued for fiscal
years and interim periods beginning after November 15, 2008. The
impact on the Master LLC’s financial statement disclosures, if any, is
currently being assessed.
Bank Overdraft: The Master LLC recorded a bank overdraft which result-
ed from estimates of available cash.
| BLACKROCK BASIC VALUE FUND, INC. DECEMBER 31, 2008 25 |
Notes to Financial Statements (continued) Master Basic Value LLC
Other: Expenses directly related to the Master LLC are charged to the
Master LLC. Other operating expenses shared by several funds are pro-
rated among those funds on the basis of relative net assets or other
appropriate methods.
2. Investment Advisory Agreement and Other Transactions
with Affiliates:
The Master LLC entered into an Investment Advisory Agreement with
BlackRock Advisors, LLC (the “Advisor”), an indirect, wholly owned
subsidiary of BlackRock, Inc., to provide investment advisory and
administration services. Merrill Lynch & Co., Inc. (“Merrill Lynch”)
and The PNC Financial Services Group, Inc. (“PNC”) are the largest
stockholders of BlackRock, Inc. As of December 31, 2008, Merrill Lynch
and PNC are affiliates of BlackRock, Inc.
The Advisor is responsible for the management of the Master LLC’s
investments and provides the necessary personnel, facilities, equipment
and certain other services necessary to the operations of the Master
LLC. For such services, the Master LLC pays the Advisor a monthly fee
based upon the average daily value of the Master LLC’s average daily
net assets at the following annual rates: 0.60% of the Master LLC’s aver-
age daily net assets not exceeding $100 million; 0.50% of average daily
net assets in excess of $100 million but not exceeding $200 million;
and 0.40% of average daily net assets in excess of $200 million.
The Advisor has entered into a sub-advisory agreement with BlackRock
Investment Management, LLC (“BIM”), an affiliate of the Advisor, under
which the Advisor pays BIM for services it provides, a monthly fee that is
a percentage of the investment advisory fee paid by the Master LLC to
the Advisor.
For the six months ended December 31, 2008, the Master LLC reim-
bursed the Advisor $57,122 for certain accounting services, which is
included in accounting services in the Statement of Operations.
The Master LLC has received an exemptive order from the SEC permitting
it to lend portfolio securities to Merrill Lynch, Pierce, Fenner & Smith
Incorporated (“MLPF&S”), a wholly owned subsidiary of Merrill Lynch,
or its affiliates. Pursuant to that order, the Master LLC has retained BIM
as the securities lending agent for a fee based on a share of the returns
on investment of cash collateral. BIM may, on behalf of the Master LLC,
invest cash collateral received by the Master LLC for such loans, among
other things, in a private investment company managed by the Advisor or
in registered money market funds advised by the Advisor or its affiliates.
The share of income owned by the Master LLC on such investments is
shown as securities lending — affiliated on the Statement of Operations.
For the six months ended December 31, 2008, BIM received $156,419
in securities lending agent fees.
In addition, MLPF&S received $350,638 in commissions on the execu-
tion of portfolio security transactions for the Master LLC for the six
months ended December 31, 2008.
The Master LLC may earn income on positive cash balances in demand
deposit accounts. For the six months ended December 31, 2008, the
Master LLC earned $1,869, which is included in income — affiliated in
the Statement of Operations.
Certain officers and/or directors of the Master LLC are officers
and/or directors of BlackRock, Inc. or its affiliates. The Master LLC
reimburses the Advisor for compensation paid to the Master LLC’s Chief
Compliance Officer.
3. Investments:
Purchases and sales of investments, excluding short-term securities, for
the six months ended December 31, 2008 were $903,355,904 and
$1,334,768,753, respectively.
Transactions in call options written for the six months ended December
31, 2008 were as follows:
| | | | | Premiums |
| Call Options Written | | Contracts | | Received |
| Outstanding call options written, | | | | |
| beginning of period | | 12,610 | | $ 7,511,604 |
| Options closed | | (12,610) | | (7,511,604) |
| Outstanding call options written, end | | | | |
| of period | | — | | — |
4. Short-Term Borrowings:
The Master LLC, along with certain other funds managed by the Advisor
and its affiliates, is a party to a $500,000,000 credit agreement with a
group of lenders, which expired November 2008 and was subsequently
renewed until November 2009. The Master LLC may borrow under the
credit agreement to fund shareholder redemptions and for other lawful
purposes other than for leverage. The Master LLC may borrow up to the
maximum amount allowable under the Master LLC’s current Prospectus
and Statement of Additional Information, subject to various other legal,
regulatory or contractual limits. The Master LLC paid its pro rata share of
a 0.02% upfront fee on the aggregate commitment amount based on its
net assets as of October 31, 2008. The Master LLC pays a commitment
fee of 0.08% per annum based on the Master LLC’s pro rata share of
the unused portion of the credit agreement, which is included in miscel-
laneous in the Statement of Operations. Amounts borrowed under the
credit agreement bear interest at a rate equal to, the higher of the (a)
federal funds effective rate and (b) reserve adjusted one month LIBOR,
plus, in each case, the higher of (i) 1.50% and (ii) 50% of the CDX
Index (as defined in the credit agreement) in effect from time to time.
The Master LLC did not borrow under the credit agreement during the
six months ended December 31, 2008.
| 26 BLACKROCK BASIC VALUE FUND, INC. DECEMBER 31, 2008 |
Notes to Financial Statements (concluded) Master Basic Value LLC
5. Market and Credit Risk:
In the normal course of business, the Master LLC invests in securities
and enters into transactions where risks exist due to fluctuations in the
market (market risk) or failure of the issuer of a security to meet all its
obligations (credit risk). The value of securities held by the Master LLC
may decline in response to certain events, including those directly involv-
ing the companies whose securities are owned by the Master LLC; condi-
tions affecting the general economy; overall market changes; local,
regional or global political, social or economic instability; and currency
and interest rate and price fluctuations. Similar to credit risk, the Master
LLC may be exposed to counterparty risk, or the risk that an entity with
which the Master LLC has unsettled or open transactions may default.
Financial assets, which potentially expose the Master LLC to credit and
counterparty risks, consist principally of investments and cash due from
counterparties. The extent of the Master LLC’s exposure to credit and
counterparty risks with respect to these financial assets is approximated
by their value recorded in the Master LLC’s Statement of Assets and
Liabilities.
6. Subsequent Event:
On January 1, 2009, Bank of America Corporation announced that
it had completed its acquisition of Merrill Lynch, one of the largest
stockholders of BlackRock, Inc.
| BLACKROCK BASIC VALUE FUND, INC. DECEMBER 31, 2008 27 |
Officers and Directors
Robert M. Hernandez, Chairman of the Board, Director and Member of
the Audit Committee
Fred G. Weiss, Vice Chair of the Board, Chairman of the Audit Committee
and Director
James H. Bodurtha, Director
Bruce R. Bond, Director
Donald W. Burton, Director
Richard S. Davis, Director
Stuart E. Eizenstat, Director
Laurence D. Fink, Director
Kenneth A. Froot, Director
Henry Gabbay, Director
John F. O’Brien, Director
Roberta Cooper Ramo, Director
Jean Margo Reid, Director
David H. Walsh, Director
Richard R. West, Director and Member of the Audit Committee
Donald C. Burke, Fund President and Chief Executive Officer
Anne F. Ackerley, Vice President
Neal J. Andrews, Chief Financial Officer
Jay M. Fife, Treasurer
Brian . Kindelan, Chief Compliance Officer
Howard B. Surloff, Secretary
Custodian
The Bank of New York Mellon
New York, NY 10286
Transfer Agent
PNC Global Investment
Servicing (U.S.) Inc.
Wilmington, DE 19809
Accounting Agent
State Street Bank and
Trust Company
Princeton, NJ 08540
Independent Registered Public Accounting Firm
Deloitte & Touche LLP
Princeton, NJ 08540
Legal Counsel
Willkie Farr &
Gallagher LLP
New York, NY 10019
| 28 BLACKROCK BASIC VALUE FUND, INC. DECEMBER 31, 2008 |
Additional Information
BlackRock Privacy Principles
BlackRock is committed to maintaining the privacy of its current and
former fund investors and individual clients (collectively, “Clients”) and
to safeguarding their non-public personal information. The following
information is provided to help you understand what personal informa-
tion BlackRock collects, how we protect that information and why in cer-
tain cases we share such information with select parties.
If you are located in a jurisdiction where specific laws, rules or regula-
tions require BlackRock to provide you with additional or different
privacy-related rights beyond what is set forth below, then BlackRock
will comply with those specific laws, rules or regulations.
BlackRock obtains or verifies personal non-public information from and
about you from different sources, including the following: (i) information
we receive from you or, if applicable, your financial intermediary, on
applications, forms or other documents; (ii) information about your
transactions with us, our affiliates, or others; (iii) information we receive
from a consumer reporting agency; and (iv) from visits to our websites.
BlackRock does not sell or disclose to non-affiliated third parties any
non-public personal information about its Clients, except as permitted
by law or as is necessary to respond to regulatory requests or to service
Client accounts. These non-affiliated third parties are required to protect
the confidentiality and security of this information and to use it only for
its intended purpose.
We may share information with our affiliates to service your account or
to provide you with information about other BlackRock products or serv-
ices that may be of interest to you. In addition, BlackRock restricts
access to non-public personal information about its Clients to those
BlackRock employees with a legitimate business need for the informa-
tion. BlackRock maintains physical, electronic and procedural safeguards
that are designed to protect the non-public personal information of its
Clients, including procedures relating to the proper storage and disposal
of such information.
Availability of Additional Information
Electronic copies of most financial reports and prospectuses are available
on the Fund’s website or shareholders can sign up for e-mail notifications
of quarterly statements, annual and semi-annual reports and prospectuses
by enrolling in the Fund’s electronic delivery program.
To enroll:
Shareholders Who Hold Accounts with Investment Advisors, Banks or
Brokerages:
Please contact your financial advisor. Please note that not all investment
advisors, banks or brokerages may offer this service.
Shareholders Who Hold Accounts Directly with BlackRock:
1) Access the BlackRock website at
http://www.blackrock.com/edelivery
2) Click on the applicable link and follow the steps to sign up
3) Log into your account
Householding
The Fund will mail only one copy of shareholder documents, including
prospectuses, annual and semi-annual reports and proxy statements, to
shareholders with multiple accounts at the same address. This practice is
commonly called “householding” and it is intended to reduce expenses
and eliminate duplicate mailings of shareholder documents. Mailings of
your shareholder documents may be householded indefinitely unless you
instruct us otherwise. If you do not want the mailing of these documents
to be combined with those for other members of your household, please
contact the Fund at (800) 441-7762.
| BLACKROCK BASIC VALUE FUND, INC. DECEMBER 31, 2008 29 |
Additional Information (concluded)
Availability of Additional Information (concluded)
Availability of Proxy Voting Policies and Procedures
A description of the policies and procedures that the Fund uses to
determine how to vote proxies relating to portfolio securities is available
(1) without charge, upon request, by calling toll-free (800) 441-7762;
(2) at www.blackrock.com; and (3) on the Securities and Exchange
Commission’s (the “SEC”) website at http://www.sec.gov.
Availability of Proxy Voting Record
Information about how the Fund votes proxies relating to securities
held in the Fund’s portfolio during the most recent 12-month period
ended June 30 is available upon request and without charge (1) at
www.blackrock.com or by calling (800) 441-7762 and (2) on the SEC’s
website at http://www.sec.gov.
Availability of Quarterly Portfolio Schedule
The Fund files its complete schedule of portfolio holdings with the SEC
for the first and third quarters of each fiscal year on Form N-Q. The Fund’s
Forms N-Q are available on the SEC’s website at http://www.sec.gov and
may also be reviewed and copied at the SEC’s Public Reference Room
in Washington, D.C. Information on the operation of the Public Reference
Room may be obtained by calling (800) SEC-0330. The Fund’s Forms
N-Q may also be obtained upon request and without charge by calling
(800) 441-7762.
Shareholder Privileges
Account Information
Call us at (800) 441-7762 8:00 AM to 6:00 PM EST to get information
about your account balances, recent transactions and share prices. You
can also reach us on the Web at www.blackrock.com/funds.
Automatic Investment Plans
Investor Class shareholders who want to invest regularly can arrange to
have $50 or more automatically deducted from their checking or savings
account and invested in any of the BlackRock funds.
Systematic Withdrawal Plans
Investor Class shareholders can establish a systematic withdrawal plan
and receive periodic payments of $50 or more from their BlackRock
funds, as long as their account is at least $10,000.
Retirement Plans
Shareholders may make investments in conjunction with Traditional,
Rollover, Roth, Coverdell, Simple IRAs, SEP IRAs and 403(b) Plans.
| 30 BLACKROCK BASIC VALUE FUND, INC. DECEMBER 31, 2008 |
A World-Class Mutual Fund Family
BlackRock offers a diverse lineup of open-end mutual funds crossing all investment styles and managed by experts in equity, fixed income and
tax-exempt investing. |
| Equity Funds | | | | |
| BlackRock All-Cap Energy & Resources Portfolio | | BlackRock Global Opportunities Portfolio | | BlackRock Mid-Cap Value Equity Portfolio |
| BlackRock Asset Allocation Portfolio† | | BlackRock Global SmallCap Fund | | BlackRock Mid Cap Value Opportunities Fund |
| BlackRock Aurora Portfolio | | BlackRock Health Sciences Opportunities Portfolio | | BlackRock Natural Resources Trust |
| BlackRock Balanced Capital Fund† | | BlackRock Healthcare Fund | | BlackRock Pacific Fund |
| BlackRock Basic Value Fund | | BlackRock Index Equity Portfolio* | | BlackRock Science & Technology |
| BlackRock Capital Appreciation Portfolio | | BlackRock International Fund | | Opportunities Portfolio |
| BlackRock Energy & Resources Portfolio | | BlackRock International Diversification Fund | | BlackRock Small Cap Core Equity Portfolio |
| BlackRock Equity Dividend Fund | | BlackRock International Index Fund | | BlackRock Small Cap Growth Equity Portfolio |
| BlackRock EuroFund | | BlackRock International Opportunities Portfolio | | BlackRock Small Cap Growth Fund II |
| BlackRock Focus Growth Fund | | BlackRock International Value Fund | | BlackRock Small Cap Index Fund |
| BlackRock Focus Value Fund | | BlackRock Large Cap Core Fund | | BlackRock Small Cap Value Equity Portfolio* |
| BlackRock Fundamental Growth Fund | | BlackRock Large Cap Core Plus Fund | | BlackRock Small/Mid-Cap Growth Portfolio |
| BlackRock Global Allocation Fund† | | BlackRock Large Cap Growth Fund | | BlackRock S&P 500 Index Fund |
| BlackRock Global Dynamic Equity Fund | | BlackRock Large Cap Value Fund | | BlackRock U.S. Opportunities Portfolio |
| BlackRock Global Emerging Markets Fund | | BlackRock Latin America Fund | | BlackRock Utilities and Telecommunications Fund |
| BlackRock Global Financial Services Fund | | BlackRock Mid-Cap Growth Equity Portfolio | | BlackRock Value Opportunities Fund |
| BlackRock Global Growth Fund | | | | |
| |
| Fixed Income Funds | | | | |
| BlackRock Emerging Market Debt Portfolio | | BlackRock Inflation Protected Bond Portfolio | | BlackRock Short-Term Bond Fund |
| BlackRock Enhanced Income Portfolio | | BlackRock Intermediate Bond Portfolio II | | BlackRock Strategic Income Portfolio |
| BlackRock GNMA Portfolio | | BlackRock Intermediate Government | | BlackRock Total Return Fund |
| BlackRock Government Income Portfolio | | Bond Portfolio | | BlackRock Total Return Portfolio II |
| BlackRock High Income Fund | | BlackRock International Bond Portfolio | | BlackRock World Income Fund |
| BlackRock High Yield Bond Portfolio | | BlackRock Long Duration Bond Portfolio | | |
| BlackRock Income Portfolio | | BlackRock Low Duration Bond Portfolio | | |
| BlackRock Income Builder Portfolio | | BlackRock Managed Income Portfolio | | |
| |
| Municipal Bond Funds | | | | |
| BlackRock AMT-Free Municipal Bond Portfolio | | BlackRock Intermediate Municipal Fund | | BlackRock New York Municipal Bond Fund |
| BlackRock California Insured Municipal Bond Fund | | BlackRock Kentucky Municipal Bond Portfolio | | BlackRock Ohio Municipal Bond Portfolio |
| BlackRock Delaware Municipal Bond Portfolio | | BlackRock Municipal Insured Fund | | BlackRock Pennsylvania Municipal Bond Fund |
| BlackRock Florida Municipal Bond Fund | | BlackRock National Municipal Fund | | BlackRock Short-Term Municipal Fund |
| BlackRock High Yield Municipal Fund | | BlackRock New Jersey Municipal Bond Fund | | |
| |
| Target Risk & Target Date Funds | | | | |
| BlackRock Prepared Portfolios | | BlackRock Lifecycle Prepared Portfolios | | |
| Conservative Prepared Portfolio | | Prepared Portfolio 2010 | | Prepared Portfolio 2030 |
| Moderate Prepared Portfolio | | Prepared Portfolio 2015 | | Prepared Portfolio 2035 |
| Growth Prepared Portfolio | | Prepared Portfolio 2020 | | Prepared Portfolio 2040 |
| Aggressive Growth Prepared Portfolio | | Prepared Portfolio 2025 | | Prepared Portfolio 2045 |
| | | | | Prepared Portfolio 2050 |
| * See the prospectus for information on specific limitations on investments in the fund. | | |
| † Mixed asset fund. | | | | |
BlackRock mutual funds are currently distributed by BlackRock Investments, Inc. You should consider the investment objectives, risks, charges and
expenses of the funds under consideration carefully before investing. Each fund’s prospectus contains this and other information and is available at
www.blackrock.com or by calling (800) 882-0052 or from your financial advisor. The prospectus should be read carefully before investing. |
| BLACKROCK BASIC VALUE FUND, INC. |

This report is not authorized for use as an offer of sale or a solicita-
tion of an offer to buy shares of the Fund unless accompanied or
preceded by the Fund’s current prospectus. Past performance
results shown in this report should not be considered a representa-
tion of future performance. Investment return and principal value
of shares will fluctuate so that shares, when redeemed, may be
worth more or less than their original cost. Statements and other
information herein are as dated and are subject to change. Please
see the Fund’s prospectus for a description of risks associated
with global investments.
BlackRock Basic Value Fund, Inc.
100 Bellevue Parkway
Wilmington, DE 19809

Item 2 – Code of Ethics – Not Applicable to this semi-annual report
Item 3 – Audit Committee Financial Expert – Not Applicable to this semi-annual report
Item 4 – Principal Accountant Fees and Services – Not Applicable to this semi-annual report
Item 5 – Audit Committee of Listed Registrants – Not Applicable
Item 6 – Investments
(a) The registrant’s Schedule of Investments is included as part of the Report to
Stockholders filed under Item 1 of this form.
(b) Not Applicable due to no such divestments during the semi-annual period covered since
the previous Form N-CSR filing.
Item 7 – Disclosure of Proxy Voting Policies and Procedures for Closed-End Management
Investment Companies – Not Applicable
Item 8 – Portfolio Managers of Closed-End Management Investment Companies – Not Applicable
Item 9 – Purchases of Equity Securities by Closed-End Management Investment Company and
Affiliated Purchasers – Not Applicable
Item 10 – Submission of Matters to a Vote of Security Holders – The registrant’s Nominating and
Governance Committee will consider nominees to the board of directors recommended by
shareholders when a vacancy becomes available. Shareholders who wish to recommend a
nominee should send nominations that include biographical information and set forth the
qualifications of the proposed nominee to the registrant’s Secretary. There have been no
material changes to these procedures.
Item 11 – Controls and Procedures
11(a) – The registrant’s principal executive and principal financial officers or persons performing
similar functions have concluded that the registrant’s disclosure controls and procedures (as
defined in Rule 30a-3(c) under the Investment Company Act of 1940, as amended (the
“1940 Act”)) are effective as of a date within 90 days of the filing of this report based on the
evaluation of these controls and procedures required by Rule 30a-3(b) under the 1940 Act
and Rule 15(d)-15(b) under the Securities Exchange Act of 1934, as amended.
11(b) – There were no changes in the registrant’s internal control over financial reporting (as
defined in Rule 30a-3(d) under the 1940 Act) that occurred during the second fiscal quarter
of the period covered by this report that have materially affected, or are reasonably likely to
materially affect, the registrant’s internal control over financial reporting.
Item 12 – Exhibits attached hereto
12(a)(1) – Code of Ethics – Not Applicable to this semi-annual report
12(a)(2) – Certifications – Attached hereto
12(a)(3) – Not Applicable
12(b) – Certifications – Attached hereto |
Pursuant to the requirements of the Securities Exchange Act of 1934 and the Investment
Company Act of 1940, the registrant has duly caused this report to be signed on its behalf by
the undersigned, thereunto duly authorized.
BlackRock Basic Value Fund, Inc. and Master Basic Value LLC
By: /s/ Donald C. Burke
Donald C. Burke
Chief Executive Officer of
BlackRock Basic Value Fund, Inc. and Master Basic Value LLC
Date: February 23, 2009
Pursuant to the requirements of the Securities Exchange Act of 1934 and the Investment
Company Act of 1940, this report has been signed below by the following persons on behalf
of the registrant and in the capacities and on the dates indicated.
By: /s/ Donald C. Burke
Donald C. Burke
Chief Executive Officer (principal executive officer) of
BlackRock Basic Value Fund, Inc. and Master Basic Value LLC
Date: February 23, 2009
By: /s/ Neal J. Andrews
Neal J. Andrews
Chief Financial Officer (principal financial officer) of
BlackRock Basic Value Fund, Inc. and Master Basic Value LLC
Date: February 23, 2009 |