AS FILED WITH THE SECURITIES AND EXCHANGE COMMISSION ON JUNE 29, 2011
UNITED STATES
SECURITIES AND EXCHANGE COMMISSION
Washington, D.C. 20549
FORM 20-F
(Mark One)
| | | |
| o | | Registration Statement pursuant to Section 12(b) or (g) of the Securities Exchange Act of 1934 |
or
| | | |
| þ | | Annual Report pursuant to Section 13 or 15(d) of the Securities Exchange Act of 1934 |
| | | |
| | | for the fiscal year ended December 31, 2010 |
or
| | | |
| o | | Transition report pursuant to Section 13 or 15(d) of the Securities Exchange Act of 1934 |
| | | |
| | | for the transition period from to |
or
| | | |
| o | | Shell Company Report Pursuant to Section 13 or 15(d) of the Securities Exchange Act of 1934 |
| | | |
| | | Date of event requiring this Shell Company Report |
Commission File Number 000-30852
GRUPO FINANCIERO GALICIA S.A.
(Exact name of Registrant as specified in its charter)
GALICIA FINANCIAL GROUP
(Translation of Registrant’s name into English)
REPUBLIC OF ARGENTINA
(Jurisdiction of incorporation or organization)
Grupo Financiero Galicia S.A.
Tte. Gral. Juan D. Perón 456
C1038 AAJ-Buenos Aires, Argentina
(Address of principal executive offices)
Pedro Richards, Chief Executive Officer
Tel: 54 11 4 343 7528 / Fax: 54 11 4 331 9183, prichards@gfgsa.com
Perón 456, 2° Piso C1038AAJ Buenos Aires ARGENTINA
(Name, Telephone, E-mail and/or Facsimile number and Address of Company Contact Person)
Securities registered or to be registered pursuant to Section 12(b) of the Act:
American Depositary Shares, each representing ten Class B ordinary Shares
Name of each exchange on which registered
Nasdaq Capital Market
Title of each class
Class B Ordinary Shares, Ps.1.00 par value, (not for trading but only in connection with the listing of the American Depositary Shares on the Nasdaq Capital Market)
Securities registered or to be registered pursuant to Section 12(g) of the Act:
None
Securities for which there is a reporting obligation pursuant to Section 15(d) of the Act:
None
Indicate the number of outstanding shares of each of the issuer’s classes of capital or common stock as of the close of the period covered by the annual report:
| | | | | |
| Class A Ordinary Shares, Ps.1.00 par value | | | 281,221,650 | |
| Class B Ordinary Shares, Ps.1.00 par value | | | 960,185,367 | |
Indicate by check mark if the registrant is a well-known seasoned issuer, as defined in Rule 405 of the Securities Act. Yeso Noþ
If this report is an annual or transition report, indicate by check mark if the registrant is not required to file reports pursuant to Section 13 or 15(d) of the Securities Exchange Act of 1934. Yeso Noþ
Indicate by check mark whether the registrant (1) has filed all reports required to be filed by Section 13 or 15(d) of the Securities Exchange Act of 1934 during the preceding 12 months (or for such shorter period that the registrant was required to file such reports), and (2) has been subject to such filing requirements for the past 90 days. Yesþ Noo
Indicate by check mark whether the registrant has submitted electronically and posted on its corporate Web site, if any, every Interactive Data File required to be submitted and posted pursuant to Rule 405 of Regulation S-T during the preceding 12 months (or for such shorter period that the registrant was required to submit and post such files). Yesþ Noo
Indicate by check mark whether the registrant is a large accelerated filer, an accelerated filer, or a non-accelerated filer. See definition of “accelerated filer and larger accelerated filer” in Rule 12b-2 of the Exchange Act. (Check one):
| | | | | |
Large accelerated filero | | Accelerated filerþ | | Non-accelerated filero |
Indicate by check mark which basis of accounting the registrant has used to prepare the financial statements included in this filing:
| | | | | |
| U.S. GAAPo | | International Financial Reporting Standards | | Otherþ |
| | | As issued by the International Accounting Standards Boardo | | |
Indicate by check mark which financial statement item the registrant has elected to follow. Item 17o Item 18þ
If this is an annual report, indicate by check mark whether the registrant is a shell company (as defined in Rule 12b-2 of the Exchange Act). Yeso Noþ
TABLE OF CONTENTS
| | | | | |
| | | Page | |
| | | | | |
| | | 4 | |
| | | | | |
| | | 4 | |
| | | | | |
| | | 4 | |
| | | | | |
| | | 4 | |
| | | | | |
| | | 7 | |
| | | | | |
| | | 8 | |
| | | | | |
| | | 8 | |
| | | | | |
| | | 8 | |
| | | | | |
| | | 20 | |
| | | | | |
| | | 20 | |
| | | | | |
| | | 21 | |
| | | | | |
| | | 22 | |
| | | | | |
| | | 29 | |
| | | | | |
| | | 36 | |
| | | | | |
| | | 38 | |
| | | | | |
| | | 40 | |
| | | | | |
| | | 41 | |
| | | | | |
| | | 42 | |
| | | | | |
| | | 73 | |
| | | | | |
| | | 78 | |
| | | | | |
| | | 88 | |
| | | | | |
| | | 88 | |
| | | | | |
| | | 90 | |
| | | | | |
| | | 90 | |
| | | | | |
| | | 90 | |
| | | | | |
| | | 90 | |
| | | | | |
| | | 91 | |
| | | | | |
| | | 95 | |
| | | | | |
| | | 95 | |
| | | | | |
| | | 96 | |
| | | | | |
| | | 110 | |
| | | | | |
| | | 120 | |
| | | | | |
| | | 126 | |
| | | | | |
| | | 127 | |
| | | | | |
| | | 128 | |
| | | | | |
| | | 128 | |
| | | | | |
| | | 133 | |
| | | | | |
| | | 134 | |
| | | | | |
| | | 135 | |
| | | | | |
| | | 136 | |
| | | | | |
| | | 141 | |
| | | | | |
| | | 142 | |
| | | | | |
| | | 142 | |
| | | | | |
| | | 144 | |
| | | | | |
| | | 147 | |
| | | | | |
| | | 149 | |
| | | | | |
| | | 149 | |
| | | | | |
| | | 149 | |
| | | | | |
| | | 149 | |
| | | | | |
| | | 152 | |
| | | | | |
| | | 152 | |
(i)
TABLE OF CONTENTS
(continued)
(ii)
PRESENTATION OF FINANCIAL INFORMATION
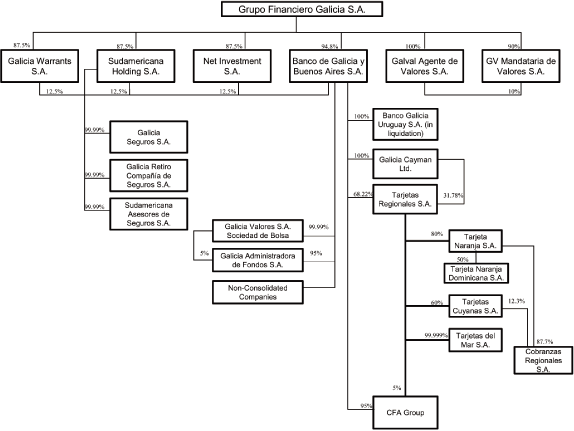
Grupo Financiero Galicia S.A. (“Grupo Financiero Galicia”) is a financial services holding company incorporated in Argentina and is one of Argentina’s largest financial services groups. In this annual report, references to “we”, “our”, and “us” are to Grupo Financiero Galicia and its consolidated subsidiaries, except where otherwise noted. Our consolidated financial statements consolidate the accounts of the following companies:
| | • | | Grupo Financiero Galicia; |
| | • | | Banco de Galicia y Buenos Aires S.A., our largest subsidiary, its wholly-owned subsidiaries Banco Galicia Uruguay S.A. (in liquidation), (“Galicia Uruguay”) and Galicia Cayman Limited (“Galicia Cayman”), and other subsidiaries and affiliated companies required to be consolidated under Argentine Banking GAAP (collectively “Banco Galicia” except where otherwise noted); |
| | • | | Tarjetas Regionales S.A., a wholly owned subsidiary of Banco Galicia, and its operating subsidiaries; |
| | • | | Compañía Financiera Argentina S.A. (“Compañía Financiera Argentina” or “CFA”), Cobranzas y Servicios S.A. and Procesadora Regional S.A. (collectively the “CFA Group”) |
| | • | | Sudamericana Holding S.A., and its subsidiaries; |
| | • | | Galicia Warrants S.A. (“Galicia Warrants”); |
| | • | | Net Investment S.A. (“Net Investment”), |
| | • | | Galval Agente de Valores S.A. (“Galval”); and |
| | • | | GV Mandataria de Valores S.A. (“GV Mandataria”). |
We maintain our financial books and records in Argentine Pesos and prepare our financial statements in conformity with the accounting rules of the Argentine Central Bank, which entity prescribes the generally accepted accounting principles for all financial institutions in Argentina. This annual report refers to those accounting principles as “Argentine Banking GAAP”. Argentine Banking GAAP differs in certain relevant respects from generally accepted accounting principles in Argentina, which we refer to as “Argentine GAAP”. Argentine Banking GAAP also differs in certain significant respects from the generally accepted accounting principles in the United States, which we refer to as “U.S. GAAP”. See Note 33 to our audited consolidated financial statements included in this annual report for a description of the differences between Argentine GAAP and Argentine Banking GAAP, and Note 35 to our audited consolidated financial statements for a reconciliation of the principal differences between Argentine Banking GAAP and U.S. GAAP and a reconciliation to U.S. GAAP of our net income and total shareholders’ equity for the three fiscal years ended December 31, 2010 and Item 5. “Operating and Financial Review and Prospects-Item 5.A. “Operating Results-U.S. GAAP and Argentine Banking GAAP Reconciliation”.
In this annual report, references to “US$”, “US Dollars”, and “Dollars” are to United States Dollars and references to “Ps.” or “Pesos” are to Argentine Pesos. The exchange rate used in translating Pesos into US Dollars and used in calculating the convenience translations included in the following tables is the “Reference Exchange Rate” which is published by the Argentine Central Bank and which was Ps.3.9758, Ps.3.7967 and Ps.3.4537 per US$1.00 as of December 31, 2010, December 31, 2009 and December 31, 2008, respectively. The exchange rate translations contained in this annual report should not be construed as representations that the stated Peso amounts actually represent or have been or could be converted into US Dollars at the rates indicated or at any other rate.
Our fiscal year ends on December 31, and references in this annual report to any specific fiscal year are to the twelve-month period ended December 31 of such year.
References to the “Government” or “Governmental” are to the Argentine Federal Government unless otherwise indicated.
Unless otherwise indicated, all information regarding deposit and loan market shares and other financial industry information has been derived from information published by the Argentine Central Bank.
We have expressed all amounts in millions of Pesos, except percentages, ratios, multiples and per-share data.
In this annual report, we refer to the “2001-2002 crisis” as the series of events that unfolded in Argentina between late 2001 and 2002, a period of great political, economic and social instability, with severe consequences for the Argentine economy by any variable used as a measure, including a banking crisis, and a material negative impact on financial institutions operating in Argentina, including us. The 2001-2002 crisis triggered a series of far reaching measures that produced structural changes in the Argentine economy and legal framework.
Also, in this annual report, “Asymmetric Pesification” refers to the compulsory conversion in January 2002 of most Dollar-denominated assets and certain Dollar-denominated liabilities held by financial institutions operating in Argentina, into Peso-denominated assets and liabilities at different exchange rates. In addition, “Compensatory Bond” and “Hedge Bond” refer to the bonds that the Government issued to Banco Galicia (as well as to other financial institutions), as compensation for the negative effects of the Asymmetric Pesification on Banco Galicia’s and other financial institutions’ financial condition. This is more fully described in Item 4. “Information on the Company-Government Regulation-Compensation to Financial Institutions”. The remaining effects of the 2001-2002 crisis were settled during 2010.
FORWARD LOOKING STATEMENTS
This annual report contains forward-looking statements that involve substantial risks and uncertainties, including, in particular, statements about our plans, strategies and prospects under the captions Item 4. “Information on the Company-Capital Investments and Divestitures”, Item 5. “Operating and Financial Review and Prospects-Item 5.A. Operating Results-Principal Trends” and Item 5. “Operating and Financial Review and Prospects-Item 5.B. Liquidity and Capital Resources”. All statements other than statements of historical facts contained in this annual report (including statements regarding our future financial position, business strategy, budgets, projected costs and management’s plans and objectives for future operations) are forward-looking statements. In addition, forward-looking statements generally can be identified by the use of such words as “may”, “will”, “expect”, “intend”, “estimate”, “anticipate”, “believe”, “continue” or other similar terminology. Although we believe that the expectations reflected in these forward-looking statements are reasonable, no assurance can be provided with respect to these statements. Because these statements are subject to risks and uncertainties, actual results may differ materially and adversely from those expressed or implied by such forward-looking statements. Factors that could cause actual results to differ materially and adversely from those contemplated in such forward-looking statements include but are not limited to:
| | • | | changes in Government regulations applicable to financial institutions, including tax regulations and changes in or failures to comply with banking or other regulations; |
| | • | | changes in general political, legal, social or other conditions in Argentina, Latin America or abroad; |
| | • | | fluctuations in the Argentine rate of inflation; |
| | • | | changes in capital markets in general that may affect policies or attitudes toward lending to Argentina or Argentine companies, including expected or unexpected turbulence or volatility in domestic or international financial markets; |
| | • | | changes in the macroeconomic situation at the regional, national or international levels, and the influence of these changes on the microeconomic conditions of the financial markets in Argentina; |
| | • | | increased competition in the banking, financial services, credit card services, insurance, asset management and related industries; |
| | • | | changes in interest rates which may, among other things, adversely affect margins; |
| | • | | a loss of market share by any of Banco Galicia’s main businesses; |
| | • | | a change in the credit cycle and increased borrower defaults; |
| | • | | Banco Galicia’s inability to sustain or improve its performance; |
| | • | | Banco Galicia’s inability to obtain additional debt or equity financing on attractive conditions or at all, which may limit its ability to fund existing operations and to finance new activities; |
| | • | | technological changes and changes in Banco Galicia’s ability to implement new technologies; |
| | • | | changes in the saving and consumption habits of its customers and other structural changes in the general demand for financial products, such as those offered by Banco Galicia; |
| | • | | possible financial difficulties of the Government; |
| | • | | volatility of the Peso and the exchange rates between the Peso and foreign currencies; and |
| | • | | other factors discussed under Item 3. “Key Information-Item 3.D. “Risk Factors” in this annual report. |
-2-
You should not place undue reliance on forward-looking statements, which speak only as of the date that they were made. Moreover, you should consider these cautionary statements in connection with any written or oral forward-looking statements that we may issue in the future. We do not undertake any obligation to release publicly any revisions to forward-looking statements after completion of this annual report to reflect later events or circumstances or to reflect the occurrence of unanticipated events.
In light of the risks and uncertainties described above, the forward-looking events and circumstances discussed in this annual report might not occur and are not guarantees of future performance.
-3-
PART I
| | |
| Item 1. | | Identity of Directors, Senior Management and Advisers |
Not applicable.
| | |
| Item 2. | | Offer Statistics and Expected Timetable |
Not applicable.
| | |
| Item 3.A. | | Selected Financial Data |
The following table presents summary historical financial and other information about us as of the dates and for the periods indicated.
Our financial statements do not include any effect for inflation accounting other than the adjustments to non-monetary assets through February 28, 2003.
The selected consolidated financial information as of December 31, 2010 and December 31, 2009 and for the fiscal years ended December 31, 2010, 2009 and 2008 has been derived from our audited consolidated financial statements included in this annual report. The selected consolidated financial information as of December 31, 2008, December 31, 2007 and December 31, 2006 and for the fiscal years ended December 31, 2007 and December 31, 2006 has been derived from our audited consolidated financial statements not included in this annual report.
You should read this data in conjunction with Item 5. “Operating and Financial Review and Prospects” and our audited consolidated financial statements included in this annual report.
-4-
| | | | | | | | | | | | | | | | | | | | | | | | | |
| | | Fiscal Year Ended December 31, | |
| | | 2010 | | | 2010 | | | 2009 | | | 2008 | | | 2007 | | | 2006 | |
| | | (in millions | | | | | | | | | | | | | | | | | | | | |
| | | of US | | | | | | | | | | | | | | | | | | | | |
| | | Dollars, | | | | | | | | | | | | | | | | | | | | |
| | | except as | | | | | | | | | | | | | | | | | | | | |
| | | noted)(1) | | | | | | | | | | | | | | | | | | | | |
| | | Unaudited | | | (in millions of Pesos, except as noted)(1) | |
Consolidated Income Statement in Accordance with Argentine Banking GAAP | | | | | | | | | | | | | | | | | | | | | | | | |
| Financial Income | | | 909.5 | | | | 3,616.1 | | | | 3,005.6 | | | | 2,559.3 | | | | 1,997.9 | | | | 2,229.8 | |
| Financial Expenses | | | 355.3 | | | | 1,412.7 | | | | 1,460.5 | | | | 1,421.0 | | | | 1,246.7 | | | | 1,851.6 | |
Net Financial Income(2) | | | 554.2 | | | | 2,203.4 | | | | 1,545.1 | | | | 1,138.3 | | | | 751.2 | | | | 378.2 | |
| Provision for Losses on Loans and Other Receivables | | | 138.7 | | | | 551.5 | | | | 639.5 | | | | 395.4 | | | | 255.5 | | | | 110.9 | |
| Income before Taxes | | | 167.8 | | | | 667.1 | | | | 385.3 | | | | 250.8 | | | | 117.5 | | | | 75.3 | |
| Income Tax | | | (65.0 | ) | | | (258.2 | ) | | | (156.0 | ) | | | (74.0 | ) | | | (71.5 | ) | | | (94.2 | ) |
| | | | | | | | | | | | | | | | | | | |
| Net Income / (Loss) | | | 102.8 | | | | 408.9 | | | | 229.3 | | | | 176.8 | | | | 46.0 | | | | (18.9 | ) |
| | | | | | | | | | | | | | | | | | | |
| Earnings / (Loss) per Share (in Pesos) | | | 0.083 | | | | 0.329 | | | | 0.185 | | | | 0.142 | | | | 0.037 | | | | (0.015 | ) |
| Cash Dividends per Share (in Pesos) | | | — | | | | — | | | | — | | | | — | | | | — | | | | — | |
| Stock Dividends per Share (in Pesos) | | | — | | | | — | | | | — | | | | — | | | | — | | | | — | |
| Book Value per Share (in Pesos) | | | 0.500 | | | | 1.989 | | | | 1.653 | | | | 1.487 | | | | 1.333 | | | | 1.296 | |
Amounts in Accordance with U.S. GAAP | | | | | | | | | | | | | | | | | | | | | | | | |
| Net Income / (Loss) | | | 576.9 | | | | 2,293.6 | | | | 770.2 | | | | (1,171.0 | ) | | | 592.9 | | | | 3,524.9 | |
| Basic and Diluted Earnings / (Losses) per Share (in Pesos) | | | 0.465 | | | | 1.848 | | | | 0.620 | | | | (0.943 | ) | | | 0.478 | | | | 2.841 | |
| Book Value / (Deficit) per Share (in Pesos) | | | 0.607 | | | | 2.414 | | | | 0.996 | | | | (0.608 | ) | | | 0.192 | | �� | | 0.117 | |
| Financial Income | | | 1,202.1 | | | | 4,779.2 | | | | 3,374.8 | | | | 1,201.7 | | | | 2,433.2 | | | | 5,456.4 | |
| Financial Expenses | | | 337.9 | | | | 1,343.4 | | | | 1,434.4 | | | | 1,391.3 | | | | 1,160.1 | | | | 1,863.6 | |
| Net Financial Income / (Loss) | | | 864.2 | | | | 3,435.8 | | | | 1,940.4 | | | | (189.6 | ) | | | 1,273.1 | | | | 3,592.8 | |
| Provision for Losses on Loans and Other Receivables | | | 138.3 | | | | 549.7 | | | | 527.3 | | | | 450.1 | | | | 203.4 | | | | 160.3 | |
| Income Tax | | | 127.8 | | | | 508.1 | | | | (54.5 | ) | | | 50.9 | | | | (92.5 | ) | | | (277.1 | ) |
Consolidated Balance Sheet in Accordance with Argentine Banking GAAP | | | | | | | | | | | | | | | | | | | | | | | | |
| Cash and Due from Banks | | | 1,420.0 | | | | 5,645.6 | | | | 3,696.3 | | | | 3,405.1 | | | | 2,960.0 | | | | 2,294.8 | |
| Government Securities, Net | | | 570.4 | | | | 2,267.7 | | | | 3,907.2 | | | | 1,531.8 | | | | 1,693.0 | | | | 3,188.3 | |
| Loans, Net | | | 5,370.9 | | | | 21,353.8 | | | | 13,477.9 | | | | 11,774.6 | | | | 11,601.0 | | | | 10,525.0 | |
| Total Assets | | | 8,981.4 | | | | 35,708.1 | | | | 27,602.4 | | | | 24,735.8 | | | | 22,828.7 | | | | 23,615.4 | |
| Deposits | | | 5,589.5 | | | | 22,222.8 | | | | 17,039.4 | | | | 14,056.1 | | | | 13,165.6 | | | | 10,779.4 | |
Other Funds(3) | | | 2,770.8 | | | | 11,015.8 | | | | 8,510.5 | | | | 8,834.0 | | | | 8,008.6 | | | | 11,227.5 | |
| Total Shareholders’ Equity | | | 621.1 | | | | 2,469.5 | | | | 2,052.5 | | | | 1,845.7 | | | | 1,654.5 | | | | 1,608.5 | |
| | | | | | | | | | | | | | | | | | | |
Average Total Assets(4) | | | 7,323.9 | | | | 29,118.4 | | | | 24,685.3 | | | | 23,412.5 | | | | 21,332.4 | | | | 24,614.5 | |
| | | | | | | | | | | | | | | | | | | |
Percentage of Period-end Balance Sheet Items Denominated in Dollars: | | | | | | | | | | | | | | | | | | | | | | | | |
| Loans, Net of Allowances | | | 14.53 | | | | 14.53 | | | | 17.78 | | | | 16.97 | | | | 15.13 | | | | 16.66 | |
| Total Assets | | | 18.98 | | | | 18.98 | | | | 24.95 | | | | 28.85 | | | | 27.60 | | | | 28.94 | |
| Deposits | | | 18.08 | | | | 18.08 | | | | 18.16 | | | | 16.98 | | | | 15.53 | | | | 14.13 | |
| Total Liabilities | | | 23.01 | | | | 23.01 | | | | 27.73 | | | | 32.47 | | | | 32.84 | | | | 30.41 | |
Amounts in Accordance with U.S. GAAP | | | | | | | | | | | | | | | | | | | | | | | | |
| Trading Securities | | | 679.2 | | | | 2,700.4 | | | | 2,011.9 | | | | 989.6 | | | | 476.2 | | | | 208.2 | |
| Available-for-Sale Securities | | | 599.9 | | | | 2,384.9 | | | | 3,916.9 | | | | 2,050.0 | | | | 3,717.3 | | | | 5,214.6 | |
| Total Assets | | | 10,210.2 | | | | 40,593.9 | | | | 30,377.6 | | | | 25,159.7 | | | | 24,429.1 | | | | 24,107.0 | |
| Total Liabilities | | | 9,456.4 | | | | 37,596.9 | | | | 29,141.3 | | | | 25,914.1 | | | | 24,191.0 | | | | 23,961.2 | |
| Shareholders’ Equity (Deficit) | | | 753.8 | | | | 2,997.1 | | | | 1,236.3 | | | | (754.4 | ) | | | 238.1 | | | | 145.8 | |
-5-
| | | | | | | | | | | | | | | | | | | | | |
| | | Fiscal Year Ended December 31, | |
| | | 2010 | | | 2009 | | | 2008 | | | 2007 | | | 2006 | |
| | | (in millions of Pesos, except as noted)(1) | |
Selected Ratios in Accordance with Argentine Banking GAAP | | | | | | | | | | | | | | | | | | | | |
Profitability and Efficiency | | | | | | | | | | | | | | | | | | | | |
Net Yield on Interest Earning Assets(5) | | | 11.38 | % | | | 9.10 | % | | | 5.72 | % | | | 4.13 | % | | | 1.21 | % |
Financial Margin(6) | | | 10.02 | | | | 8.41 | | | | 5.72 | | | | 4.12 | | | | 1.74 | |
Return on Average Assets(7) | | | 1.76 | | | | 1.12 | | | | 0.91 | | | | 0.37 | | | | 0.00 | |
Return on Average Shareholders’ Equity(8) | | | 18.63 | | | | 11.69 | | | | 10.13 | | | | 2.86 | | | | (1.15 | ) |
Net Income from Services as a Percentage of Operating Income(9) | | | 44.71 | | | | 45.90 | | | | 51.07 | | | | 54.86 | | | | 63.99 | |
Efficiency ratio(10) | | | 71.39 | | | | 71.05 | | | | 76.57 | | | | 77.29 | | | | 92.80 | |
Capital | | | | | | | | | | | | | | | | | | | | |
| Shareholders’ Equity as a Percentage of Total Assets | | | 6.92 | % | | | 7.44 | % | | | 7.46 | % | | | 7.25 | % | | | 6.81 | % |
| Total Liabilities as a Multiple of Shareholders’ Equity | | | 13.46 | x | | | 12.45 | x | | | 12.40 | x | | | 12.80 | x | | | 13.68 | x |
| Total Capital Ratio | | | 15.19 | % | | | 14.35 | % | | | 13.92 | % | | | 15.54 | % | | | 15.03 | % |
Liquidity | | | | | | | | | | | | | | | | | | | | |
| Cash and Due from Banks as a Percentage of Total Deposits | | | 25.40 | % | | | 21.69 | % | | | 24.23 | % | | | 22.48 | % | | | 21.29 | % |
| Loans, Net as a Percentage of Total Assets | | | 59.80 | | | | 48.83 | | | | 47.60 | | | | 50.82 | | | | 44.57 | |
Credit Quality | | | | | | | | | | | | | | | | | | | | |
Past Due Loans(11) as a Percentage of Total Loans | | | 2.57 | % | | | 3.95 | % | | | 2.87 | % | | | 2.77 | % | | | 2.38 | % |
Non-Accrual Loans(12) as a Percentage of Total Loans | | | 3.37 | | | | 4.77 | | | | 3.49 | | | | 3.14 | | | | 2.58 | |
Allowance for Loan Losses as a Percentage of Non-accrual Loans(12) | | | 137.57 | | | | 118.64 | | | | 123.11 | | | | 114.05 | | | | 117.16 | |
Net Charge-Offs(13) as a Percentage of Average Loans | | | 2.37 | | | | 2.84 | | | | 1.83 | | | | 0.65 | | | | 1.42 | |
Ratios in Accordance with U.S. GAAP | | | | | | | | | | | | | | | | | | | | |
Capital | | | | | | | | | | | | | | | | | | | | |
| Shareholders’ Equity (deficit) as a Percentage of Total Assets | | | 7.38 | % | | | 4.07 | % | | | (3.00 | )% | | | 0.97 | % | | | 0.60 | % |
| Total Liabilities as a Multiple of Total Shareholders’ Equity | | | 12.54 | x | | | 23.57 | x | | | (34.35 | )x | | | 101.61 | x | | | 164.33 | x |
Liquidity | | | | | | | | | | | | | | | | | | | | |
| Loans, Net as a Percentage of Total Assets | | | 52.56 | % | | | 45.55 | % | | | 49.59 | % | | | 49.36 | % | | | 40.10 | % |
Credit Quality | | | | | | | | | | | | | | | | | | | | |
| Allowance for Loan Losses as a Percentage of Non-Accrual Loans | | | 163.37 | | | | 108.37 | | | | 141.34 | | | | 132.13 | | | | 168.58 | |
Inflation and Exchange Rate | | | | | | | | | | | | | | | | | | | | |
Wholesale Inflation(14) | | | 14.56 | % | | | 10.04 | % | | | 8.82 | % | | | 14.56 | % | | | 7.14 | % |
Consumer Inflation(15) | | | 10.92 | | | | 7.69 | | | | 7.24 | | | | 8.47 | | | | 9.84 | |
Exchange Rate Variation(16) (%) | | | 4.72 | | | | 9.93 | | | | 9.61 | | | | 2.66 | | | | 1.25 | |
CER(17) | | | 11.04 | | | | 6.95 | | | | 7.97 | | | | 8.50 | | | | 10.08 | |
The ratios disclosed above are considered significant by the management of Grupo Financiero Galicia despite of the fact that they are not a specific requirement of any GAAP.
-6-
| | | |
| (1) | | The exchange rate used to convert the December 31, 2010 amounts into US Dollars was Ps.3.9758 per US$1.00. All amounts are stated in millions of Pesos, except inflation and exchange rates, percentages, ratios, multiples andper-share data. |
| |
| (2) | | Net financial income primarily represents income from interest on loans and other receivables resulting from financial brokerage plus net income from government and corporate debt securities, including gains and losses, minus interest on deposits and other liabilities from financial intermediation. It also includes the CER adjustment. |
| |
| (3) | | Includes primarily liabilities with other banks and international entities. Until December 31, 2006, debt with the Argentine Central Bank was also included. |
| |
| (4) | | The average balances of assets, including the related interest that is due are calculated on a daily basis for Banco Galicia and for Galicia Uruguay, as well as for Tarjetas Regionales S.A consolidated with its operating subsidiaries, and on a monthly basis for Grupo Financiero Galicia and its non-banking subsidiaries. |
| |
| (5) | | Net interest earned divided by interest-earning assets. For a description of net interest earned, see Item 4. “Information on the Company-Selected Statistical Information-Interest-Earning Assets-Net Yield on Interest-Earning Assets”. |
| |
| (6) | | Financial margin represents net financial income divided by average interest-earning assets. |
| |
| (7) | | Net income excluding minority interest as a percentage of average total assets. |
| |
| (8) | | Net income as a percentage of average shareholders’ equity. |
| |
| (9) | | Operating income is defined as net financial income plus net income from services. |
| |
| (10) | | Administrative expenses as a percentage of operating income as defined above. |
| |
| (11) | | Past-due loans are defined as the aggregate principal amount of a loan plus any accrued interest that is due and payable for which either the principal or any interest payment is 91 days or more past due. |
| |
| (12) | | Non-Accrual loans are defined as those loans in the categories of: (a) Consumer portfolio: “Medium Risk”, “High Risk”, “Uncollectible”, and “Uncollectible Due to Technical Reasons”, and (b) Commercial portfolio: “With problems”, “High Risk of Insolvency”, “Uncollectible”, and “Uncollectible Due to Technical Reasons”. |
| |
| (13) | | Charge-offs plus direct charge-offs minus bad debts recovered. |
| |
| (14) | | As measured by the annual change in the end-of-period Wholesale Price Index (“WPI”), published by INDEC. |
| |
| (15) | | As measured by the annual change in the end-of-period Consumer Price Index (“CPI”), published by INDEC. |
| |
| (16) | | Annual change in the end-of-period exchange rate expressed in Pesos per US Dollar. |
| |
| (17) | | The “CER” is the “Coeficiente de Estabilización de Referencia”, an adjustment coefficient based on changes in the Consumer Price Index. |
Exchange Rate Information
The following table sets forth the annual high, low, average and period-end exchange rates for US Dollars for the periods indicated, expressed in Pesos per Dollar and not adjusted for inflation.
| | | | | | | | | | | | | | | | | |
| | | Exchange Rate(1) | |
| | | High | | | Low | | | Average(2) (3) | | | Period-End | |
| | | (in Pesos per US Dollar) | |
| 2006 | | | 3.1072 | | | | 3.0305 | | | | 3.0784 | (3) | | | 3.0695 | |
| 2007 | | | 3.1797 | | | | 3.0553 | | | | 3.1196 | (3) | | | 3.1510 | |
| 2008 | | | 3.4537 | | | | 3.0128 | | | | 3.1797 | (3) | | | 3.4537 | |
| 2009 | | | 3.8545 | | | | 3.4497 | | | | 3.7478 | (3) | | | 3.7967 | |
| 2010 | | | 3.9857 | | | | 3.7942 | | | | 3.9226 | (3) | | | 3.9758 | |
| | | | | | | | | | | | | | | | | |
| December 2010 | | | 3.9857 | | | | 3.9732 | | | | 3.9776 | | | | 3.9758 | |
| January 2011 | | | 4.0008 | | | | 3.9715 | | | | 3.9813 | | | | 4.0008 | |
| February 2011 | | | 4.0305 | | | | 4.0088 | | | | 4.0220 | | | | 4.0305 | |
| March 2011 | | | 4.0520 | | | | 4.0288 | | | | 4.0372 | | | | 4.0520 | |
| April 2011 | | | 4.0837 | | | | 4.0495 | | | | 4.0655 | | | | 4.0805 | |
| May 2011 | | | 4.0887 | | | | 4.0788 | | | | 4.0839 | | | | 4.0887 | |
| | | |
| (1) | | Using closing reference exchange rates as published by the Argentine Central Bank. |
| |
| (2) | | Monthly average of daily closing quotations, unless otherwise noted. |
| |
| (3) | | Based on the annual average of the last day of each month’s closing quotation. |
As of June 15, 2011, the exchange rate was Ps.4.0932 for US$1.00.
-7-
| | |
| Item 3.B. | | Capitalization and Indebtedness |
Not applicable.
| | |
| Item 3.C. | | Reasons for the Offer and Use of Proceeds |
Not applicable.
You should carefully consider the risks described below in addition to the other information contained in this annual report. In addition, most, if not all, of the risks described below must be evaluated bearing in mind that our most important asset is our equity interest in Banco Galicia, thus, a material change in Banco Galicia’s shareholders’ equity or income statement would also adversely affect our businesses and results of operations. We may also face risks and uncertainties that are not presently known to us or that we currently deem immaterial, which may impair our business. Our operations, property and customers are located mainly in Argentina. Accordingly, the quality of our customer portfolio, loan portfolio, financial condition and results of operations depend, to a significant extent, on the macroeconomic and political conditions prevailing in Argentina. In general, the risk assumed when investing in the securities of issuers from countries such as Argentina, is higher than when investing in the securities of issuers from developed countries.
Risk Factors Relating to Argentina
Political and economic instability in Argentina and Government intervention in the economy as well as market conditions may adversely affect Grupo Financiero Galicia’s business and prospects.
Grupo Financiero Galicia’s results of operations may be affected by inflation, fluctuations in the exchange rate, modifications in interest rates, changes in the Government’s policies (among other, foreign investments or tax policies), social instability and other political, economic or international developments in Argentina or somehow affecting the country. It should be taken into account that in recent years the Government has exercised and currently exercises a marked influence on the Argentine economy.
Historically, the Argentine economy has experienced periods of high levels of instability and volatility, low or negative economic growth and high and variable inflation and devaluation levels. During 2001 and 2002, Argentina went through a period of major political, economic and social instability, which led to a partial default by Argentina in the payment of its sovereign debt, and the devaluation of the Peso in January 2002, after over ten years of parity with the Dollar.
The Argentine economy in general, the operating results of Grupo Financiero Galicia and its subsidiaries or the rights of the holders of securities issued by such institutions or their value, may be materially and adversely affected by a number of possible factors, including, among others, Argentina’s inability to sustain its current economic recovery, the effects of inflation, Argentina’s limited ability to obtain external financing, a decline in the international prices for Argentina’s main commodity exports, a significant real appreciation of the Peso against the Dollar, intervention by the Government in the form of an ever-changing regulatory framework, the vulnerability of the Argentine economy to external shocks, a devaluation of the Peso or exchange rate controls.
Argentina’s economic growth since the 2001-2002 economic crisis may not be sustainable in light of current economic conditions and any significant decline in Argentina’s rate of recovery could adversely affect Grupo Financiero Galicia’s financial condition.
Although general economic conditions in Argentina have recovered significantly during the years since the 2001-2002 economic crisis, there is uncertainty as to whether this growth is sustainable. This is mainly because the economic growth was initially dependent on a significant devaluation of the Argentine Peso, a high excess production capacity resulting from a long period of deep recession and high commodity prices. The global economic crisis of 2008 led to a sudden economic decline in Argentina during 2009, accompanied by political and social unrest, inflationary and Peso depreciation pressures and lack of consumer and investor confidence. According to the Argentine Statistics and Census Agency (Instituto Nacional de Estadísticas y Censos, “INDEC”), Argentina’s Gross Domestic Product (“GDP”), in real terms, grew by 6.8% in 2008, 0.9% in 2009 and 9.2% in 2010, and there is uncertainty as to whether Argentina will be able to maintain the current level of economic growth.
-8-
The economic and financial crises in certain European countries, a decline in the international demand for Argentine products, a lack of stability and competitiveness of the Peso against foreign currencies, a decline in confidence among consumers and foreign and domestic investors, a higher rate of inflation and future political uncertainties (including the upcoming presidential and parliamentary elections during 2011 and the uncertainty regarding the economic policy to be carried out by the new government), among other factors, may affect the development of the Argentine economy and cause volatility in the local securities markets, which could have a material adverse effect on the financial condition and the results of operations of Grupo Financiero Galicia and its subsidiaries.
The Argentine economy remains fragile, as reflected by the following economic conditions:
| | • | | the recovery has depended to some extent on high commodity prices, which are volatile and beyond the control of the Government; |
| | • | | inflation has risen and threatens to accelerate; |
| | • | | the current fiscal situation is at risk of deterioration; |
| | • | | the regulatory environment continues to be uncertain and has been subject to frequent change; |
| | • | | Argentina’s international financing is limited; |
| | • | | the availability of long-term fixed rate credit is scarce; and |
| | • | | investment as a percentage of GDP remains low. |
We cannot provide any assurance that a decline in economic growth or increased economic instability, developments over which we have no control, would not have an adverse effect on our business and financial condition or results of operations.
Domestic and international uncertainty concerning the current political and social environment in Argentina may have an impact on capital flows.
Domestic, as well as international uncertainty, may adversely impact Argentina’s ability to attract capital. During the first half of 2009, capital outflows increased abruptly (influenced by domestic and international uncertainty), although this increase began to level off during the second half of 2009. In 2010 until now, the process of capital flight has not been reversed completely.
An abrupt change in the economic policies of developed economies, or changes in domestic policy, may adversly impact the flow of capital towards Argentina. Such changes would likely negatively impact the liquidity of the local market and the operations of Grupo Financiero Galicia and its subsidiaries.
Inflation could increase from current levels, and materially and adversely affect the Argentine economy and Grupo Financiero Galicia’s financial position and business.
Following the Government’s decision in January 2002 to abandon the fixed exchange rate regime set forth in the Argentine Convertibility Act, the corresponding devaluation of the Peso created pressure on the domestic pricing system and caused inflation in 2002 after several years of price stability. In 2003, inflation decreased significantly and stabilized. However, according to INDEC, the consumer price index increased by 7.2% in 2008, 7.7% in 2009 and 10.9% in 2010; while the wholesale price index went up 8.8% in 2008, 10.0% in 2009 and 14.6% in 2010. The accuracy of the measurements of the INDEC is in doubt, and the actual consumer price index and wholesale price index could be substantially higher than those indicated by the INDEC. For example, according to private estimates, the consumer price index increased by 19.4% (rather than 7.2%) in 2008, 16.3% (rather than 7.7%) in 2009 and 22.9% (rather than 10.9%) in 2010. In the past, inflation has materially undermined the Argentine economy and the Government’s ability to generate conditions that fostered economic growth. In addition, high inflation or a high level of volatility with respect to the same would materially and adversely affect the business volume of the financial system and prevent the growth of intermediation activity levels. This result, in turn, would adversely affect the level of economic activity and employment.
-9-
High inflation would also undermine Argentina’s foreign competitiveness and adversely affect economic activity, employment, real salaries, consumption and interest rates. A high level of uncertainty with respect to these economic variables, and a general lack of stability with respect to inflation would shorten contract terms and affect the ability of businesses to plan and make decisions, thereby materially and adversely affecting economic activity, and lowering consumers’ income and their purchasing power, all of which would have a material adverse effect on the financial position and business of Grupo Financiero Galicia and its subsidiaries.
Argentina’s ongoing litigation in relation to its default on its indebtedness in 2001 may limit its ability, and that of private sector companies in Argentina, to obtain financing and to attract direct foreign investment, and may have material adverse effects on the economy and the financial performance of Grupo Financiero Galicia.
Argentina has very limited access to foreign financing. As of December 31, 2001, Argentina’s total public debt amounted to US$144.5 billion. In December of 2001, Argentina defaulted on over US$81.8 billion in external debt to bondholders. In addition, since 2002, Argentina suspended payments on over US$15.7 billion in debt to multilateral financial institutions (e.g. the IMF and the Paris Club) and other financial institutions. In 2006, Argentina cancelled all of its outstanding debt with the IMF totaling approximately US$9.5 billion, and through various exchange offers made to bondholders between 2004 and 2010, restructured over US$74 billion of its defaulted debt. Although on September 2, 2008, pursuant to Decree No. 1,394/2008, Argentina officially announced its decision to pay its debt owed to its creditor nations who are members of the Paris Club, a decision which was accepted by the Paris Club, negotiations related to such repayment remain open. As of December 31, 2010, the Government was still in default with respect to over US$7 billion of debt to bondholders. As of such date, Argentina’s total public debt amounted to US$156.7 billion (excluding the debt in default to bondholders).
In addition, the foreign shareholders of several Argentine companies, including public utilities and bondholders that did not participate in the exchange offers described above, have filed claims that exceed US$20 billion with the International Centre for Settlement of Investment Disputes (“ICSID”) alleging that the emergency measures adopted by the Government differ from the just and equal treatment dispositions set forth in several bilateral investment treaties to which Argentina is a party. The ICSID has ruled that the Government must pay an amount equal to US$1 billion, plus interest and incurred expenses, in respect of such claims. Additionally, on October 7, 2008, an ICSID tribunal, in a case in which it had already awarded compensation to the claimants, issued a decision ordering Argentina to pay the compensation previously awarded to the claimants within 60 days. In its decision, the ICSID tribunal stated that, based on the interpretation of the Bilateral Treaty on Protection and Reciprocal Promotion of Investments (“IBT”) executed between the United States and Argentina, (i) to the extent the compensation orders are not revoked, the compensation payments ordered to be made by the ICSID should be made immediately and claimants do not need to file subsequent actions or execution proceedings seeking payment of the awarded compensation and (ii) Argentina’s position of waiting for the claimants to file execution proceedings to seek collection of already awarded amounts is in flagrant breach of the international law obligations undertaken by Argentina under the IBT.
Furthermore, under the United Nations Commission on International Trade Law (“UNCITRAL”) arbitration rules, arbitration tribunals ordered Argentina (i) in December 2007, to pay US$185 million to British Gas (shareholder of Argentine gas company Metrogas); and (ii) in November 2008, to pay US$53.5 million to National Grid PLC (shareholder of Argentine electricity transportation company Transener). Argentina filed a petition with the U.S. District Court for the District of Columbia to vacate both awards. The annulment of the National Grid PLC award was rejected by the U.S. District Court for the District of Columbia, whereas the British Gas annulment suit is still pending as of the date of this annual report.
Litigation, as well as ICSID and UNCITRAL claims against the Government have resulted in material judgments and may result in new material judgments against the government, which could result in attachments of or injunctions relating to assets of Argentina that the government intended for other uses. As a result, the government may not have all the financial resources necessary to implement reforms and foster growth, which could have a material adverse effect on the country’s economy, and consequently, our financial condition. In August, 2010, the U.S. Second Circuit Court of Appeals in New York upheld a ruling issued by District Judge Thomas Griesa, which allows for the attachment of certain assets held in trust by the Government that will be stayed until a final ruling on the matter. The trust is administered by U.S. Bank Trust N.A., and was established in 1999 to hold American Depositary Shares (“ADSs”) issued by Banco Hipotecario S.A., a state-owned lender bank that was being privatized at the time. Such depositary shares corresponded to class D shares of Banco Hipotecario S.A., which were to be used to satisfy investor redemptions of options. The rulings have been issued in connection with a request from EM Ltd. and NML Capital, Ltd., two of Argentina’s largest sovereign debt holders. Pursuant to such rulings, government assets amounting to approximately US$90 million held in such trust have been attached for the benefit of outstanding government creditors.
-10-
On March 1, 2010, the executive branch of the Government issued Executive Decree 298/2010, which created the “Fund for the Repayment of Argentine Debt” (Fondo de Desendeudamiento Argentino) for an amount of US$4,382 million, to be used for the payment of Argentine public debt. In addition, the executive branch of the Government abrogated Executive Decree 2010/09 which had created the “Bicentennial Fund for Stability and Repayment of Debt” (Fondo del Bicentenario para el Desendeudamiento y la Estabilidad). Decree 298/2010 was judicially attacked by the opposing political parties and its application was suspended temporarily by an Argentine court. The suspension was subsequently lifted. The Argentine Court of Appeals allowed the use of Argentine Central Bank reserves by the above-mentioned fund for the repayment of Argentine debt; subsequently, the executive branch of the Government proceeded to pay public debt on April 4, 2010, with its first payment in the amount of US$204 million going towards the repayment of Government bonds in Dollars at 7%, due in 2015 (“Boden 2015 Bonds”). Subsequent repayments of Argentine public debt have been made, and it is estimated that the Fund for the Repayment of Argentine Debt has been used in its entirety for such repayments.
Argentina’s default with respect to the payment of its foreign debt, and the aforementioned complaints filed against Argentina could prevent the Government and private sector companies in Argentina from accessing the international capital markets and receiving direct foreign investment. Accordingly, the Government may not have sufficient financial resources to foster economic growth. Moreover, investment in the private sector, which is also necessary to promote economic growth, may not occur at the necessary levels due to a lack of financing.
If Argentina does not fully recuperate its ability to access the international capital markets and attract direct foreign investment, there is a risk that the country will not obtain the requisite capital to foster the investment cycle and sustain a fast-paced economic growth. The country’s fiscal condition could be adversely affected, which in turn could generate more inflation and undermine the government’s ability to implement economic policies designed to foster growth. Unless a sustained growth cycle materializes, political, social and economic instability could prevail once again, all of which would have a material adverse effect on the prospects of the Argentine economy and, therefore, a material adverse impact on Grupo Financiero Galicia’s activities.
A decline in the international prices for Argentina’s main commodity exports and a significant real appreciation of the Peso against the US Dollar could affect Argentina’s economy, create new pressures on the exchange market and have a material adverse effect on the prospects of Grupo Financiero Galicia.
Argentina’s economic growth since the 2001-2002 economic crisis has taken place within a context of increasing prices for exports, such as soy. High prices for commodities have contributed to the increase in exports by Argentina since the third quarter of 2002, and to increased tax revenues for the Government, mainly from export taxes (withholdings).
Fluctuations in prices for commodities exported by Argentina and a significant increase in the value of the Peso (in real terms) may reduce Argentina’s competitiveness and significantly affect the country’s exports. A decrease in exports could affect Argentina’s economy, have a material adverse effect on public finances due to a loss of tax revenues, cause an imbalance in the country’s exchange market which, in turn, could lead to increased volatility with respect to the exchange rate. In addition, and more importantly in the short term, a significant appreciation of the Peso could materially reduce the Government’s revenues in real terms and affect its ability to make payments on its debt obligations, as these revenues are heavily derived from export taxes (withholdings). This could worsen the financial condition of the Argentine public sector and lead to an increase in taxes or a need to inject additional currency into the Argentine financial system through the printing of money, which could lead to inflation and materially and adversely affect the Argentine economy, as well as Grupo Financero Galicia’s business.
-11-
High volatility in the regulatory framework, specifically with respect to financial institutions, could have a material adverse effect on the country’s economy in general, and Grupo Financiero Galicia’s financial position specifically.
In response to the economic crisis mentioned above, the Government enacted numerous laws and mandated extensive regulation which adversely affected the economy in general, and economic activity in particular. The Government continues to exert significant control over the economy. Political and social pressures could inhibit the implementation by the Government of policies designed to maintain price stability, generate growth and enhance consumer and investor confidence.
Financial institutions are particularly subject to significant regulation from multiple regulatory authorities, including the Argentine Central Bank, the Argentine National Securities Commission (Comisión Nacional de Valores,the “CNV”) and the Financial Information Unit (Unidad de Información Financiera,the “UIF”), all of whom may, amongst other things, impose sanctions on Grupo Financiero Galicia’s businesses, including Banco Galicia, for non-compliance with their applicable regulations.
It is not certain whether any material regulatory proceeding in the future will be initiated against, or result in a resolution adverse to, Grupo Financiero Galicia, its shareholders or directors.
As of the date of this annual report, three different bills to amend Law No. 21,526 as amended (Ley de Entidades Financieras,“the Financial Institutions’ Law”) have been presented for review in the Argentine Congress by congressmen Heller, Pinedo and Millman, respectively, seeking to amend different aspects of the Financial Institutions’ Law. If any such bill is passed, or any other amendment to the Financial Institutions’ Law is made, no assurances can be provided about what effects the subsequent changes in banking regulations could have on financial institutions in general, and on its business, financial conditions and/or results of operations.
There is a material risk that future enactments of governmental regulation by Argentine authorities affect the assets or the operating results of companies in the private sector, including Grupo Financiero Galicia and its subsidiaries, the rights of the holders of securities issued by such entities, or the value of such securities.
The lack of a stable regulatory framework could impose significant limitations on the activities of the financial system and the business of Grupo Financiero Galicia, including Banco Galicia, and would create uncertainty with respect to Grupo Financiero Galicia’s future financial situation and results of operations.
The Argentine economy and its goods and financial services and securities markets remain vulnerable to external shocks, which could materially and adversely affect the country’s economic growth and Grupo Financiero Galicia’s prospects.
The financial and securities markets in Argentina are influenced, to varying degrees, by economic and market conditions in other countries. Although such conditions may vary from country to country, investor reactions to events occurring in one country may substantially affect capital flows to issuers in other countries, and may substantially affect the trading prices of their securities. Decreased capital inflows and lower prices in the exchange markets of a country may have a material adverse effect on the real economy of such country in the form of higher interest rates or volatility in the exchange rate. This has had and may have in the future, a negative impact on the Argentine economy and could continue to adversely affect the country’s economy in the near future.
In the past, Argentina’s economy was adversely affected by developments in other markets, such as, among others, the political and economic events that occurred in Mexico at the end of 1994, and the collapse of various Asian economies between 1997 and 1998. There is a risk that similar events may have a material adverse effect on the Argentine economy in the future.
In addition, at the end of 2007 and in early 2008, the U.S. economy started to show signs of weakness caused by the uncertainty in the world economy. The subprime mortgage market crisis in the U.S. quickly spread into other regions such as Europe, Asia, and Latin America.
The number of defaults with respect to the repayment of mortgage loans in the U.S. subprime mortgage market increased dramatically due to the steep fall in real property prices and higher interest rates. The considerable decrease in the value of financial products related to these subprime mortgage market loans initially led to the closing and bankruptcy of certain banks, which later turned into a general confidence and liquidity crisis in the international financial sector.
-12-
Due to these events, long-term interest rates began to decrease in the second half of 2008. At the beginning of the international financial markets crisis, central banks mainly focused on the potential adverse effects on their economies. However, the Dollar began to weaken, reaching historic lows during 2007, especially as compared to the strong Euro, which reached exchange rates of almost US$1.6 per Euro (this trend has since reversed as a result of the spread of the lack of confidence of the U.S. in the European markets). During this crisis, the principal world financial institutions suffered significant losses, further increasing the lack of confidence in the international financial system. At the same time, various financial institutions have become insolvent, filed for bankruptcy, been rescued by their country’s regulators, or merged with other institutions. In addition to, and as a consequence of, the historic fluctuations in the world’s principal stock exchanges during 2008 and 2009, there have been strong fluctuations in the price of oil and an abrupt fall in the price of other commodities.
In 2010, although the world economic recovery continued at a solid pace, fears of a sovereign debt crisis developed concerning some European countries. This, in turn, led to a crisis of confidence as well as the widening of bond yield spreads and risk insurance on credit default swaps between these countries and other European Union members, including Germany. Concerns around rising government deficits and debt levels across the globe, together with a wave of downgrades with respect to European sovereign debt, created alarm in financial markets.
During 2011 Greece, and to a lesser extent other European countries like Portugal and Ireland, remain a high stake problem and the risk of contagion is still an issue. The problems of the European Union periphery, stemming from the combined interactions of low growth, fiscal woes, and financial pressures, are particularly acute. Reestablishing fiscal and financial sustainability in the face of low or negative growth and high interest rates is a substantial challenge.
From the beginning of 2011 fears have turned to commodity prices which have increased more than expected, reflecting a combination of strong demand growth and supply shocks. In turn inflation has been on the rise all over the world even in many advanced economies where output is still far from potential. However the challenge is stronger in emerging and developing economies, where the consumption share of food and fuel is larger and the credibility of monetary policy is often weaker.
In addition growth concerns around developed countries have gained momentum in recent months. While a double dip recession is not the most likely scenario, it still cannot be completely ruled out.
The Argentine economy is vulnerable to the evolution of the aforementioned developments. Both inflation and growth concerns, if materialized, could prove to be a turning point in the current favorable external conditions. It is difficult to predict the manner and the extent to which these events may materially and adversely affect Argentina.
This could create an unfavorable international economic environment for Argentina, which could require government-driven adjustments to Argentine economic policy and result in lower economic growth and consequently may affect the business of Grupo Financiero Galicia and its subsidiaries, including Banco Galicia, which could adversely affect their results.
A future devaluation of the Peso could limit the ability of, or prevent Grupo Financiero Galicia from, being able to make payments with respect to its foreign currency denominated obligations.
After several years of price stability in Argentina, the devaluation of the Peso in January 2002 imposed pressures on the domestic price system that generated high inflation throughout 2002, and had a broad adverse effect on the Argentine economy, the financial situation of Argentine companies, and the general population. The devaluation had an adverse effect on the ability of Argentine companies to fulfill their foreign currency denominated obligations, generated high inflation throughout 2002, significantly reduced real salaries, and had an adverse effect on companies that were focused on the domestic market, such as public services companies and financial companies. It also adversely affected the ability of the Government to honor its foreign debt obligations.
If the Peso were to devalue significantly in the future, the aforementioned adverse effects on the Argentine economy could occur again, which could materially and adversely affect Grupo Financiero Galicia’s businesses and impair its ability to honor its obligations denominated in a foreign currency.
-13-
We may be unable to make payments in Dollars and/or to make payments outside of Argentina due to exchange controls.
Decree No. 1570/01, which became effective on December 3, 2001, imposed certain restrictions on the transfer of foreign currency abroad by prohibiting usual transfer transactions of funds to accounts outside of Argentina. The same restriction was maintained by Decree No. 1606/01, which also included certain additional exceptions for the transfer of funds into Argentina after December 3, 2001.
Additionally, pursuant to Decree N° 616/05 (and related provisions), the Government has regulated incoming and outgoing flows of funds. Generally, this rule provides that, subject to certain exceptions, certain funds transferred into Argentina by residents or non-residents are subject to the creation of a mandatory deposit called an“encaje”equal to 30% of the amount transferred, which is to be deposited in Dollars, for one year, in a non-transferable, non-interest-bearing account at a local financial institution. This rule establishes that, subject to certain exceptions, in order to transfer currency from Argentina to foreign accounts, the approval of the Argentine Central Bank must be obtained, and it further establishes certain maximum amounts that individuals may acquire in the foreign exchange market. For a further description of these and other foreign exchange control actions, see Item 10. “Additional Information-Exchange Controls”. No assurance can be provided that the above-mentioned regulations will not be amended, or that new regulations (or implementation measures) will not be enacted in the future that operate to further limit foreign exchange flows into and out of Argentina. Any such measures, as well as any additional controls and/or restrictions, could materially and adversely affect Grupo Financiero Galicia’s ability to access international capital markets, make payments of principal and/or interest on its liabilities denominated in a foreign currency or transfer abroad (totally or partially) funds and adversely affect the financial condition and results of Grupo Financiero Galicia’s operations. Therefore, non-resident investors and Argentine residents with assets located outside of Argentina should particularly take into account the regulation (and its amendments) that govern access to the foreign exchange market. Grupo Financiero Galicia may be unable to make payments in Dollars and/or to make payments outside of Argentina due to the exchange market restrictions currently in place and/or due to restrictions on the ability of companies to transfer funds abroad.
Foreign judgments may not be enforceable in Argentina.
Grupo Financiero Galicia and most of its subsidiaries are companies incorporated under the laws of Argentina. Most of its shareholders, directors, members of the audit and executive committees, officers and some experts named herein reside in Argentina, and a substantial portion of the assets of Grupo Financiero Galicia are located in Argentina.
Pursuant to Argentine law, a foreign judgment will be enforced in Argentina, provided that the requirements set forth in Sections 517 through 519 of the Argentine Code of Civil and Commercial Procedure are met; if it is a matter of provincial law, the requirements in the local codes of procedure must be met. In both instances, the foreign judgment must not infringe the principles of Argentine public policy, as determined by the competent courts of Argentina.
Grupo Financiero Galicia cannot assure you that the enforcement of a foreign judgment that orders an Argentine entity to make payments pursuant to foreign-currency denominated debt instruments, outside of Argentina would not be held by an Argentine court to be contrary to the principles of Argentine public policy.
The Reform of the Retirement and Pension Integrated System materially and adversely affected the local capital markets and may materially and adversely affect Grupo Financiero Galicia’s ability to obtain liquidity for its operations.
The Argentine Congress approved, through its enactment of Law No. 26,425 on November 20, 2008, the elimination of the private retirement system led by the Retirement and Pension Fund Administrators (the “AFJPs”), which was merged into, and replaced by, a single public regime, referred to as the Integrated Social Security System (Sistema Integrado Previsional Argentino). The law provided that, among other measures: (i) funds accumulated in the private retirement system over the previous fourteen years would be administered by the National Social Security Administration (Administración Nacional de la Seguridad Social, the “ANSES”) going forward and (ii) the retirement system would be public and citizens would be required to make their social security payments to this new system.
-14-
The elimination of this system created a significant change in the operations of the local capital markets, as the AFJPs were, historically, significant institutional investors in respect of local issuances of debt. The elimination of these investors from the local market could also materially and adversely affect Grupo Financiero Galicia’s future ability to access liquidity through the domestic capital markets to fund its operations. Any of these scenarios could materially and adversely affect Grupo Financiero Galicia’s financial position and ability to undertake financing transactions domestically.
The Government may order salary increases to be paid to employees in the private sector, which would increase Grupo Financiero Galicia’s operating costs.
In the past, the Government has passed laws, regulations and decrees requiring companies in the private sector to increase wages and provide specified benefits to employees, and may do so again in the future. In the aftermath of the Argentine economic crisis, employers both in the public and private sectors have experienced significant pressure from their employees and labor organizations to increase wages and to provide additional employee benefits. Due to the high levels of inflation, the employees and labor organizations are demanding significant wage increases. It is possible that the Government could adopt measures mandating salary increases and/or the provision of additional employee benefits in the future. Any such measures could have a material and adverse effect on Grupo Financiero Galicia’s expenses and business, results of operations and financial condition.
Risk Factors Relating to the Argentine Financial System
The stability of the Argentine banking system is uncertain.
During 2001 and the first half of 2002, a significant amount of deposits were withdrawn from Argentine banks. This massive withdrawal of deposits was mainly due to the loss of depositor confidence in the ability of the Government to pay its debts and to maintain the Peso-Dollar parity in the context of its solvency crisis.
If depositors once again withdraw significant holdings from banks, there may be a substantial negative impact on the manner in which financial institutions, including Banco Galicia, conduct their business, and on their ability to operate as financial intermediaries. International loss of confidence in the financial institutions may also affect the sensibility of Argentine depositors.
To prevent the run on the Dollar reserves of local banks, the Government restricted the amount of money that account holders could withdraw from the banks and introduced exchange controls to restrict the flow of capital out of institutions.
While conditions have improved in the financial system, an adverse economic situation, even if not related to the financial system, could result in a transfer of capital from local financial institutions, as depositors seek to protect their assets from a new crisis. Any massive withdrawal of deposits could cause liquidity problems for financial institutions, and as a result, a contraction in credit supply.
In the case of a future shock such as the insolvency of one or more banks, or a crisis in confidence of depositors, the Government could impose new controls on foreign exchange market or transfers to foreign markets, or take other measures that could lead to new social and political tensions and undermine the financial progress of the government, which would adversely affect Argentina’s economy and growth prospects.
This could impact Grupo Financiero Galicia’s and its subsidiaries’ results.
If the volume of financial intermediation is not restored to significant levels, the capacity of financial institutions, including Banco Galicia, to generate profits will be negatively affected.
As a result of the 2001-2002 economic crisis, the volume of financial intermediation activity in Argentina decreased dramatically: private sector credit fell from 24% of GDP in December 2000 to 7.7% in June 2004 and total deposits as a percentage of GDP fell from 31% to 23.2% during the same period. The depth of the crisis and the effect of the crisis on depositors’ confidence in the financial system created significant uncertainties as to the likelihood that the financial system would fully recover its ability to act as an intermediary between savings and credit. Further, the ratio of total private sector deposits and loans to gross domestic product in Argentina are low when compared to international levels and lower than the periods prior to the crisis, especially in the case of loans to the private sector, which represented approximately 13% of Argentine GDP as of December 31, 2010, as compared to a maximum of approximately 23% at the end of 1999.
-15-
There are no assurances that the necessary steps will be taken to restore financial intermediation activities to levels that allow for an adequate income generation capacity by Argentine financial institutions, including Banco Galicia, or that such actions will be sufficient to prevent Argentine financial institutions, such as Banco Galicia, from having to assume excessive risks in terms of maturity mismatches. Under these circumstances and for an undetermined period of time, the scale of operations of financial institutions that operate in Argentina, including Banco Galicia, their business volume, the size of their assets and liabilities or their ability to generate results could be lower than before the crisis which, in turn, may impact the results of its operations.
The limited availability of medium- and long-term funding sources in Argentina may limit the capacity of Argentine financial institutions, including Banco Galicia, to generate profits.
Since the 2001-2002 economic crisis, most deposits in the Argentine financial system are either demand or short-term time deposits. The sources of medium- and long-term funding for financial institutions are currently limited, and have consisted, to a large extent, primarily since 2004, in the securitization of loan portfolios. Such securities were negatively affected by the replacement of the retirement and pension system of the AFJPs, which invested in loan securitization, by the Integrated Social Security System. The limited availability of medium- and long-term funding for Argentine financial institutions has caused such institutions to depend on the Argentine Central Bank as a liquidity backstop or on other liquidity sources which may or may not be available or which may be very costly. To the extent that Argentine financial institutions, such as Banco Galicia, are unable to access adequate funding sources or are required to pay high costs in order to obtain the same, their results of operations may be negatively impacted which, in the case of Banco Galicia, may adversely impact its ability to repay its debt.
Argentine financial institutions continue to have exposure to the public sector and its repayment capacity which, in periods of economic downturn, may negatively impact their results of operations.
As a result of certain measures taken by the Government during the 2001-2002 economic crisis, Argentine financial institutions continue to have exposure to the public sector and its repayment capacity. The Government’s ability to honor its financial obligations is dependent on, among other things, its ability to establish economic policies that succeed in fostering sustainable economic growth in the long-term, generating tax revenues and controlling public expenditures, which could, either partially or totally, fail to take place.
With respect to Banco Galicia, in particular, as of December 31, 2010, its net position in the Argentine public sector reached Ps.3,861 million, representing approximately 11% of its total assets and 1.5 times its shareholders’ equity. Of this total, Ps.1,468 million corresponded to Government securities while the remaining Ps.2,393 million were Argentine Central Bank debt instruments. As a result, Banco Galicia’s income generating capacity may be materially impacted, or may be particularly impacted by the Argentine public sector’s repayment capacity and the performance of public sector bonds, which, in turn, is dependent on the factors referred to above. Banco Galicia’s ability to honor its financial obligations could be adversely affected by the Government’s payment capacity or its failure to meet its obligations in regard to Government obligations owed to Banco Galicia.
The Government may once again impose limitations on the enforcement of creditor rights in Argentina which could adversely affect the businesses of financial institutions, including Banco Galicia’s.
To protect debtors affected by the 2001-2002 economic crisis, beginning in 2002 the Government adopted measures that temporarily suspended proceedings for the enforcement of creditors’ rights, including mortgage foreclosures and bankruptcy petitions. Most of these measures have been rescinded. The Government, however, could adopt additional measures that could adversely affect the businesses of financial institutions, including those of Banco Galicia.
-16-
The application of the Consumer Protection Law may prevent or limit the collection of payments with respect to services rendered by Grupo Financiero Galicia and its subsidiaries.
Argentine Law No. 24,240 (the “Consumer Protection Law”) sets forth certain rules and principles designed to protect consumers, which include Banco Galicia’s customers. The Consumer Protection Law was amended on March 12, 2008 by Law No. 26.361 to expand its applicability and the penalties associated with violations thereof.
Additionally, Law No. 25,065 (as amended by Law No. 26,010 and Law No. 26,361, the “Credit Card Law”) sets forth several mandatory regulations designed to protect credit card holders.
Both the involvement of the applicable administrative authorities at the federal, provincial and local levels, and the enforcement of the Consumer Protection Law and the Credit Card Law by the courts are increasing. This trend has increased general consumer protection levels. In the event that Grupo Financiero Galicia and its subsidiaries are found to be in violation of any provision of the Consumer Protection Law or the Credit Card Law, the penalties and remedies outlined above could prevent or limit the collection of payments due from services and financing provided by Grupo Financiero Galicia and its subsidiaries and materially and adversely affect their financial results. Grupo Financiero Galicia cannot provide any assurance that judicial and administrative rulings based on the newly enacted regulation, or measures adopted by the enforcement authorities, will not increase the consumer protection given to debtors and other clients in the future, or that they will not favor the claims initiated by consumer groups or associations.
Class actions against financial entities for an indeterminate amount may adversely affect the profitability of the financial system and Banco Galicia’s business and financial condition.
Certain public and private organizations have initiated class actions against financial institutions in Argentina. The Argentine National Constitution and the Consumer Protection Law contain certain provisions regarding class actions. However, their guidance with respect to procedural rules for instituting and trying class action cases is limited. Nonetheless, by means of an ad hoc doctrine construction, Argentine courts have admitted class actions in some cases, including various lawsuits against financial entities (including Banco Galicia) related to “collective interests” such as alleged overcharging on products, applied interest rates and advice in the sale of public securities, etc. If class action plaintiffs were to prevail against financial institutions, their success could have an adverse effect on the financial industry and, consecuently, Banco Galicia’s business and financial condition.
Risk Factors Relating to Us
Increased competition and reduced spreads without a corresponding increase in lending volumes could adversely affect Banco Galicia’s operations and profits.
We expect competition in the financial market to increase and a continued consolidation among the number of market participants. Such consolidation and increased competition could require Banco Galicia to expend significant resources to defend its current market share in the agricultural and livestock sector, small and medium sized companies (“SMEs”) business sector and consumer finance operations. Banco Galicia and other subsidiaries of Grupo Financiero Galicia could experience reduced prices and margins and/or decreased volume of operations and market share, and therefore, the results of their operations could be adversely affected.
Similarly, we expect that competition to gain market share in the SMEs business segments is likely to increase. As a result, even if the demand for financial products and services from these markets continues to grow, competition may adversely affect the results of Banco Galicia’s operations by decreasing the margins it is able to generate from this sector of clients.
Tax audits or disputes, or changes in the tax laws applicable to Grupo Financiero Galicia, could materially increase its tax payments, and certain administrative proceedings started by tax authorities against financial institutions such as Banco Galicia could generate losses to such institutions.
Certain tax authorities in the provinces and in the City of Buenos Aires initiated administrative proceedings against certain financial institutions in order to collect higher gross income taxes from such financial institutions from year-end 2002 onwards. Provincial tax authorities claim a substantial amount in connection with gross income generated by financial institutions in 2002, as such authorities include the income related to the Compensatory Bond (as defined below), into the income subject of the tax. The purpose of the Compensatory Bond was to compensate financial institutions for the losses that they would otherwise incur as a result of the measures implemented to face the 2001-2002 economic crisis, in particular, the Asymmetric Pesification. Although the final decision of these proceedings is uncertain, financial institutions, including Banco Galicia, could suffer material losses.
-17-
Banco Galicia’s net position in assets adjustable by the Reference Stabilization Coefficient (Coeficiente de Estabilización de Referencia, “CER”) exposes it to real interest rate variation.
The amendments and modifications of Banco Galicia’s assets and liabilities resulting from the Government measures to address the 2001-2002 economic crisis have created mismatches between its assets and liabilities in terms of currency, interest rate and terms. Currently, Banco Galicia has a net position in CER-adjustable assets (which index varies based on changes in consumer retail prices) that accrue a fixed interest rate on the adjusted principal. This position is funded by non-CER-adjustable liabilities, which bear market rates that are repriced, generally in the short term. This mismatch exposes Banco Galicia to fluctuations in real interest rates, with an adverse impact on income. Such mismatches may occur if there is a significant increase in real interest rates paid on our Peso-denominated liabilities, which occurs when the nominal interest rate increases more than the CER-adjusted interest rate linked to inflation.
Adverse conditions in the credit and capital markets and in the exchange rates may have a material adverse effect on Grupo Financiero Galicia’s financial condition and results of operations and adversely impact some of Grupo Financiero Galicia’s important funding sources, therefore limiting its ability to access funding from such sources in a cost effective and/or timely manner.
Grupo Financiero Galicia may sustain losses relating to its investment in fixed or variable income securities in capital stock, and in its monetary position due to, among other reasons, changes in market prices, defaults and fluctuations in interest rates and in the exchange rate. A deterioration in the capital markets may cause Grupo Financiero Galicia to record net losses due to a decrease in the value of its investment portfolios, in addition to the losses from trading positions caused by volatility in the prices of the financial markets, even if the economy does not suffer overall. Any of these losses could have a material adverse effect on our results of operations.
Some of Banco Galicia’s liquidity is derived from domestic banking institutions and/or the domestic capital markets. As of December 31, 2010, Banco Galicia’s liquidity ratio was 33.98%, as measured by liquid assets as a percentage of total deposits (liquid assets include cash and due from banks, holdings of securities issued by the Argentine Central Bank (“Lebac and Nobac”), net interbank loans, short-term placements with correspondent banks and reverse repurchase agreement transactions in the local market). Any disruptions in the local capital markets or in the local banking market, as have been experienced in Argentina in the past from time to time, may result in a reduction in availability and/or increased cost of financing for liquidity obtained from such sources. These conditions may impact Banco Galicia’s ability to replace, in a cost effective and/or timely manner, maturing liabilities and/or access funding to execute its growth strategy. Any such event may adversely affect Banco Galicia’s financial condition and/or results of operations.
Grupo Financiero Galicia estimates and establishes reserves for potential credit risk and credit losses, which may be inaccurate or insufficient, which may, in turn, materially and adversely affect its financial condition and results of operations.
Grupo Financiero Galicia estimates and establishes reserves for potential credit risk and credit losses related to changes in levels of income of borrowers, increased rates of inflation or an increase in interest rates. This process requires complex and subjective analysis, including economic projections and assumptions regarding the ability of debtors to repay their loans.
Therefore, if in the future Grupo Financiero Galicia is unable to effectively control the level of quality of its loan portfolio, if loss reserves for loans are inadequate to cover future losses on loans, or if it is required to increase its loss reserves due to an increase in the amount of its non-performing portfolio loans, the financial condition of Grupo Financiero Galicia and its results of operations could be materially and adversely affected.
-18-
Changes in market conditions, and any risks associated thereto, could materially and adversely affect the financial condition and results of operations of Grupo Financiero Galicia.
Grupo Financiero Galicia is directly and indirectly affected by changes in market conditions. Market risk, or risk in the valuation of assets, liabilities or revenues may be adversely affected by a change in market conditions. This risk is inherent in the products and instruments associated with our operations, including long-term loans and short-term deposits, securities and bonds. Changes in market conditions could materially and adversely affect our financial condition and results of operations, including fluctuations in interest and currency exchange rates, stock prices, changes in the volatility of interest rates and foreign currency exchange, among others.
Grupo Financiero Galicia’s main subsidiary, Banco Galicia, could fail to fully or timely detect money laundering and other illegal or inappropriate activities which could result in Banco Galicia incurring additional liability and could harm its business and reputation.
Banco Galicia must be in compliance with all applicable laws against money laundering, terrorism financing and other regulations in Argentina. These laws and regulations require, among other things, that Banco Galicia adopt and implement policies and procedures which involve “getting to know the client” and reporting suspicious and material transactions to the applicable regulatory authorities. While Banco Galicia has adopted policies and procedures intended to detect and prevent the use of its bank network for money laundering activities and by terrorists, terrorist organizations and other general individual organizations, such policies and procedures may fail to fully eliminate the risk that Banco Galicia has been or is currently being used by other parties, without it’s knowledge, to engage in activities related to money laundering or other illegal or inappropriate activities. To the extent that Banco Galicia has not detected or does not detect such illegal activities, the relevant Governmental agencies to which it reports have the power and authority to impose fines and other penalties on Banco Galicia. In addition, its business and reputation could be adversely affected if clients use it for money laundering activities or illegal or inappropriate purposes.
Interruption or failure in Banco Galicia’s information technology systems could adversely affect its operations and financial position.
As a financial institution, Banco Galicia’s success is dependent upon the efficient and uninterrupted operation of its communications and computer hardware systems, including those systems related to the operation of its ATMs and website. Banco Galicia’s communications and computer hardware systems and transactions could be harmed or interrupted by fire, flood, power failures, defective telecommunications, computer viruses, electronic or physical theft and similar events or interruptions. Any of the foregoing events could cause system interruptions, delays and the loss of critical data and could prevent the Bank from operating at optimal levels or at all. In addition, disaster recovery planning may not be sufficient to cover all of these events and Banco Galicia could have inadequate insurance coverage or limits which could prevent it from receiving full compensation for its losses from a principal interruption. If any of these events occur, it could damage its reputation, be costly to cure and adversely affect its transactions as well as its results of operations and financial position.
Payment defaults by customers may materially and adversely affect the financial and operating results of Banco Galicia’s credit card subsidiaries, and in turn, those of the Bank.
Certain of Banco Galicia’s subsidiaries are credit card companies that create, develop, direct, manage, market and operate credit card and/or related consumer credit programs in Argentina. This type of business can be materially and adversely affected by cardholders’ failure to make payments on their credit cards or personal loans when due, difficulties in enforcing payment in court, the existence of installments that are unlikely to be collected, and bad debts. Current default levels, collection efforts and bad debts may vary and be affected by a number of factors beyond these credit card subsidiaries’ control, including, without limitation: (i) adverse changes in the general Argentine economy and/or local economies, (ii) political instability, (iii) increasing unemployment rates and (iv) depreciation of real and/or nominal wages. These and other factors may have a material adverse effect on current default levels, enforcement proceedings and losses; any one or more of these consequences could have a material adverse effect on the results of the business of Banco Galicia’s credit card subsidiaries.
-19-
A decrease in the interest rates charged to clients of Banco Galicia’s credit card subsidiaries and related fees charged to merchants could materially and adversely affect the financial results of its credit card subsidiaries, and therefore its ability to make payments.
The rules that govern the credit card business provide for certain caps on the interest rates that clients may be charged and the fees that merchants may be charged by companies such as Banco Galicia’s credit card subsidiaries. Furthermore, general legal provisions exist pursuant to which courts could decrease the interest rates and/or fees agreed upon by the parties on the grounds that they are excessively high. A change in applicable law or the existence of court decisions that lower the cap on interest rates that clients may be charged and fees that merchants may be charged would reduce the revenues of the credit card companies, which could materially and adversely affect Grupo Financiero Galicia’s results.
Grupo Financiero Galicia could be unable to invest in its business developments and/or to repay its financial obligations due to a lack of liquidity caused by it being a holding company.
Grupo Financiero Galicia, as a holding company, conducts its operations through its subsidiaries. Consequently, it does not operate nor hold substantial assets, except for equity investments in its subsidiaries. Except for such assets, Grupo Financiero Galicia’s ability to invest in its business developments and/or to repay obligations is subject to the funds generated by its subsidiaries and their ability to pay cash dividends. In the absence of such funds, Grupo Financiero Galicia could have to resort to financing options at unappealing prices, rates and conditions. Additionally, such financing could be unavailable when Grupo Financiero Galicia may need it.
Grupo Financiero Galicia’s subsidiaries are under no obligation to pay any amount to enable Grupo Financiero Galicia to carry out investment activities and/or to cancel its liabilities, or to give Grupo Financiero Galicia funds for such purposes. Each of the subsidiaries is a legal entity separate from Grupo Financiero Galicia, and due to certain circumstances, legal or contractual restrictions, as well as to the subsidiaries’ financial condition and operating requirements, Grupo Financiero Galicia’s ability to receive dividends could be limited and, its ability to develop its business and/or to comply with its payment obligations could be limited.
In addition, under certain regulations, Banco Galicia has certain restrictions related to dividend distribution. Notwithstanding the fact that investments in its business developments and the repayment of Grupo Financiero Galicia’s obligations could be afforded through means other than dividends, such as bank loans or new issuances in the capital market, investors should take such restrictions into account when analyzing Grupo Financiero Galicia’s investment developments and/or its ability to cancel its obligations. For further information on dividend distribution restrictions, see Item 8. “Financial Information-Dividend Policy and Dividends”.
| | |
| Item 4. | | Information on the Company |
History and Development of the Company
Our legal name is Grupo Financiero Galicia S.A. We are a financial services holding company that was incorporated on September 14, 1999, as a “sociedad anónima” (“a stock corporation”) under the laws of Argentina. As a holding company we do not have operations of our own and conduct our business through our subsidiaries. Banco Galicia is our main subsidiary and one of Argentina’s largest full-service banks. Through the operating subsidiaries of Tarjetas Regionales S.A., a holding company wholly owned by Banco Galicia, and Compañía Financiera Argentina (95% Banco Galicia, 5% Tarjetas regionales S.A.), we provide proprietary brand credit cards and consumer finance services throughout Argentina. Through Sudamericana Holding S.A. and its subsidiaries or “Sudamericana” we provide insurance products in Argentina. We directly or indirectly own other companies providing financial related products as explained herein. We are one of Argentina’s largest financial services groups with consolidated assets of Ps.35,708 million as of December 31, 2010.
Our goal is to consolidate our position as one of Argentina’s leading comprehensive financial services providers while continuing to strengthen Banco Galicia’s position as one of Argentina’s leading banks. We seek to broaden and complement the operations and businesses of Banco Galicia, through holdings in companies and undertakings whose objectives are related to and/or can produce synergies with financial activities. Our non-banking subsidiaries operate in financial and related activities that Banco Galicia cannot undertake or in which it is limited to invest in due to restrictive banking regulations.
-20-
Our domicile is in Buenos Aires, Argentina. Under our bylaws, our corporate duration is until June 30, 2100. Our duration can be extended by a resolution passed at a general extraordinary shareholders’ meeting. Our principal executive offices are located at Teniente General Juan D. Perón 456, Second Floor, (C1038AAJ), Buenos Aires, Argentina. Our telephone number is (54-11) 4343-7528.
Our agent for service of process in the United States is C T Corporation System, presently located at 111 Eighth Avenue, New York, New York 10011.
Organizational Structure
The following table illustrates our organizational structure as of December 31, 2010. Percentages indicate the ownership interests held. All of the companies shown in the chart are incorporated in Argentina, except for:
| | • | | Galicia Uruguay, incorporated in Uruguay and currently not an operating financial institution; |
| | • | | Galval, incorporated in Uruguay; |
| | • | | Galicia Cayman, incorporated in the Cayman Islands; |
| | • | | Tarjeta Naranja Dominicana S.A., incorporated in the Dominican Republic. |
-21-
History
Grupo Financiero Galicia
Grupo Financiero Galicia was formed on September 14, 1999 as a financial services holding company to hold all of the shares of the capital stock of Banco Galicia held by members of the Escasany, Ayerza and Braun families. Its initial nominal capital amounted to 24,000 common shares, 12,516 of which were designated as class A ordinary (common) shares (the “class A shares”) and 11,484 of which were designated as class B ordinary (common) shares (the “class B shares”).
Following Grupo Financiero Galicia’s formation, the holding companies that held the shares in Banco Galicia on behalf of the Escasany, Ayerza and Braun families were merged into Grupo Financiero Galicia. Following the merger, Grupo Financiero Galicia held 46.34% of the outstanding shares of Banco Galicia. In addition, and due to the merger, Grupo Financiero Galicia’s capital increased from 24,000 to 543,000,000 common shares, 281,221,650 of which were designated as class A shares and 261,778,350 of which were designated as class B shares. Following this capital increase, all of our class A shares were held by EBA Holding S.A., an Argentine corporation that is 100% owned by our controlling shareholders, and our class B shares were held directly by our controlling shareholders in an amount equal to their ownership interests in the holding companies that were merged into Grupo Financiero Galicia.
-22-
On May 16, 2000, our shareholders held an extraordinary shareholders’ meeting during which they unanimously approved a capital increase of up to Ps.628,704,540 and the public offering and listings of our class B shares. All of the new common shares were designated as class B shares, with a par value of Ps.1.00. During this extraordinary shareholders’ meeting, all of our existing shareholders waived their preemptive rights. In addition, the shareholders determined that the exchange ratio for the exchange offer would be one class B share of Banco Galicia for 2.5 of our class B shares and one ADS of Banco Galicia for one of our ADSs. The exchange offer was completed in July 2000 and the resulting capital increase was of Ps.549,407,017. At date of completion of the exchange offer, our only significant asset was our 93.23% interest in Banco Galicia.
On January 2, 2004, our shareholders held an extraordinary shareholders’ meeting during which they approved a capital increase of up to 149,000,000 preferred shares, each of them mandatorily convertible into one of our class B shares on the first anniversary of the date of issuance, to be subscribed for in up to US$100.0 million of face value of subordinated notes to be issued by Banco Galicia to its creditors in the restructuring of the foreign debt of its head office in Argentina (the “Head Office”) and its Cayman Branch, or cash. This capital increase was carried out in connection with the restructuring of Banco Galicia’s foreign debt. On May 13, 2004, we issued 149,000,000 preferred non-voting shares, with preference over the ordinary shares in the event of liquidation, each with a face value of Ps.1.00. The preferred shares were converted into class B shares on May 13, 2005. With this capital increase, our capital increased to Ps.1,241,407,017. For more information on Banco Galicia’s debt restructuring, please see below.
In January 2005, we created Galval, a securities broker based in Uruguay, with the purpose of providing trading and custody services. We own 100% of the capital and voting rights of this subsidiary.
In August 2007, Grupo Financiero Galicia exercised its preemptive rights in Banco Galicia’s share issuance and subscribed for 93.6 million shares of Banco Galicia. The consideration consisted of: (i) US$102.2 million face value of negotiable obligations due 2014 issued by Banco Galicia in May 2004, and (ii) cash. After the capital increase, Grupo Financiero Galicia held 94.66% of Banco Galicia’s shares, up from 93.60%. For more information on Banco Galicia’s capital increase, please see “-Banco Galicia-Banco Galicia’s 2007 Capital Increase”.
As of December 31, 2009, the controlling percentage held by Grupo Financiero Galicia in Banco Galicia was 94.71%, while as of December 31, 2010, such controlling percentage reached 94.84%.
Banco Galicia
Banco de Galicia y Buenos Aires S.A. is a banking corporation organized as a stock corporation under Argentine law and supervised and licensed to operate as a commercial bank by theSuperintendencia de Entidades Financieras y Cambiarias(Superintendency of Financial Institutions and Exchange Bureaus or the “Superintendency”).
Banco Galicia was founded in September 1905 by a group of businessmen from the Spanish community in Argentina and initiated its activities in November of that year. Two years later, in 1907, Banco Galicia’s stock was listed on the Buenos Aires Stock Exchange (“BASE”). Banco Galicia’s business and branch network increased significantly by the late 1950s and continued expanding in the following decades, after regulatory changes allowed Banco Galicia to exercise its potential and gain a reputation for innovation, thereby achieving a leading role within the domestic banking industry.
In the late 1950s, Banco Galicia launched the equity fund FIMA Acciones and founded the predecessor of the asset manager Galicia Administradora de Fondos S.A., Sociedad Gerente de Fondos Comunes de Inversión (“Galicia Administradora de Fondos”). Beginning in the late 1960s Banco Galicia began to establish an international network mainly comprised of branches in New York and in the Cayman Islands, a bank in Uruguay and several representative offices.
In order to develop automated banking in Argentina and avoid bank disintermediation (i.e., when consumers directly access information or goods rather than using intermediaries) in the provision of electronic information and fund transfer services, in 1985, Banco Galicia established, together with four other private- sector banks operating in Argentina, Banelco S.A. to operate a nationwide automated teller system, which became the largest in the country. During the same year, Banco Galicia also acquired an interest in VISA Argentina S.A., and is currently one of the largest issuers of such cards in Argentina.
-23-
During the 1990s, Banco Galicia implemented a growth and modernization strategy directed at achieving economies of scale and increasing productivity and, therefore, heavily invested in developing new businesses, acquiring new customers, widening its product offering, developing its IT and human resources capabilities, and expanding its distribution capacity. This was comprised of traditional channels (branches) and, especially, alternative channels, including new types of branches (in-store for example), ATMs, banking centers, phone banking and internet banking.
As part of its growth strategy, in 1995, Banco Galicia began a new expansion drive into the “Interior” of Argentina where high growth potential was believed to exist. Argentines refer to theInterioras that part of the country’s territory different from the federal capital and the areas surrounding the city of Buenos Aires (“Greater Buenos Aires”), i.e., the provinces, including the Buenos Aires Province but excluding the city of Buenos Aires and its surroundings. Typically the Interior is underserved relative to the city of Buenos Aires and its surroundings with respect to access to financial services and its population tends to use fewer banking services. As such, mainly between 1995 and 1999, Banco Galicia acquired equity interests in entities or formed several non-banking companies providing financial services to individuals in the Interior through the issuance of proprietary brand credit cards. See “-Regional Credit Card Companies” below. In addition, in 1997, Banco Galicia acquired a regional bank that was merged into it, with branches located mainly in Santa Fe and Córdoba, two of the wealthiest and more populated Argentine provinces.
In order to fund its strategy, during the 1990s, Banco Galicia tapped the international capital markets for both equity and debt. In June 1993, Banco Galicia carried out its initial international public offering in the United States and Europe and, as a result, began to list its American Depositary Receipts (“ADRs”) on the Nasdaq Stock Market until 2000, when Banco Galicia’s shares were exchanged for our shares. In 1991, it was the first Argentine bank to issue debt in the European capital markets and, in 1994, it was the first Latin American issuer of a convertible bond. In 1996, Banco Galicia raised equity again through a local and international public offering.
In 1996, Banco Galicia entered the bank-assurance business through an agreement with ITT Hartford Life Insurance Co. for the joint development of initiatives in the life insurance business. In this same year, Banco Galicia initiated its internet presence, which evolved into a full e-banking service for both companies and individuals.
At the end of 2000, Banco Galicia was the largest private-sector bank in the Argentine market with a 9.8% deposit market share.
In 2001 and 2002 Argentina experienced a severe political and financial crisis, which had a material adverse effect on the financial system, including on Banco Galicia, and on financial businesses as a whole but especially on financial intermediation activity. However, during the crisis, the provision of banking services of a transactional nature was maintained. With the normalization of the Argentine economy’s situation and the subsequent growth cycle that began in mid 2002, financial activities began to expand at high rates, which translated into high growth at the level of the financial system as a whole, including Banco Galicia. The provision of services continued to develop, even further than prior to the crisis, and financial intermediation resumed progressively.
Beginning in May 2002, Banco Galicia began to implement a series of initiatives to deal with the liquidity shortage caused by the systemic deposit run, the unavailability of funding and other adverse effects of the 2001-2002 crisis on the financial system as a whole. Banco Galicia significantly streamlined its operations and reduced its administrative expenses and, immediately after launching such initiatives, restored its liquidity. Also, in late 2002 and early 2003, Banco Galicia closed all of its operating units abroad or began to wind them down. In addition, Banco Galicia: (i) restructured most of its commercial loan portfolio, a process that was substantially completed in 2005, (ii) restructured its foreign debt, a process that began in 2002 and that was completed in May 2004, and resulted in an increase in its capitalization, and (iii) in February 2004, finalized the restructuring of its debt with the Argentine Central Bank incurred as a consequence of the 2001-2002 crisis.
-24-
Together with the launching of the above-mentioned initiatives, Banco Galicia began to normalize its activities, progressively restoring its customer relations and growing its business with the private sector. Banco Galicia’s deposit base began to increase in the second half of 2002 and loan origination picked up in late 2003. In parallel to the implementation of the above-mentioned initiatives, and while consistently expanding its business, Banco Galicia undertook to progressively strengthen its balance sheet by (i) obtaining compensation from the Government for the negative effects of the Asymmetric Pesification, (ii) consistently reducing its high exposure to the public sector that was a legacy of the 2001-2002 crisis as well as (iii) reducing those liabilities incurred as a consequence of such crisis. Between 2005 and 2007, Banco Galicia significantly reduced its exposure to the public sector by, among others, using public-sector assets to repay in advance Argentine Central Bank debt and restructured foreign debt. In 2007, Banco Galicia finalized the full repayment in advance of its debt with the Argentine Central Bank incurred as a consequence of the 2001-2002 crisis. In addition, in August 2007, Banco Galicia repaid in full the negotiable obligations that it had issued to restructure the debt of its New York Branch and undertook a share offering to increase its capitalization, in order to be able to support the increase in regulatory capital requirements on a bank’s exposure to the public sector and the growth of its business with the private sector. For more information, see “-Banco Galicia’s 2007 Capital Increase” below.
On June 1, 2009, Banco Galicia entered into a stock purchase agreement with AIG and with AIG Consumer Finance Group Inc. for the purchase of the shares of the CFA Group, Argentine companies that are involved in financial and related activities.
Pursuant to Resolution No. 124, dated June 7, 2010, the Argentine Central Bank authorized the purchase of the shares of the CFA Group by Banco Galicia and Tarjetas Regionales S.A. and on August 31, 2010, through Resolution No. 299, the National Commission for the Defense of Competition (Comisión Nacional de Defensa de la Competencia) approved the transaction. The purchase of the shares of CFA Group was completed by Banco Galicia (95%) and Tarjetas Regionales S.A. (5%) on June 24, 2010. The fair market value of the price to acquire the shares of these companies was Ps.333.9 million. This purchase was financed with Banco Galicia’s available cash, within its ordinary course of business. See “—Compañía Financiera Argentina” below.
Restructuring of the Foreign Debt of Banco Galicia’s Head Office in Argentina and its Cayman Branch
On May 18, 2004, Banco Galicia successfully completed the restructuring of US$1,320.9 million of the debt of Banco Galicia’s Head Office and its Cayman Branch, consisting of bank debt (including debt with multilateral credit agencies) and bonds. This amount represented 98.2% of the foreign debt eligible for restructuring. As of December 31, 2010, the principal amount of old debt, the holders of which did not participate in the exchange offer was US$1.7 million.
Based on the final amounts validly tendered, on May 18, 2004, Banco Galicia paid creditors who elected to participate in the cash offer and the Boden offer and issued the following new debt instruments:
| | • | | US$648.5 million of long-term Dollar-denominated debt instruments, of which US$464.8 million were Dollar-denominated negotiable obligations due 2014 (referred to as the “Step Up Notes Due 2014” or the “2014 Notes”) issued under an indenture. |
| | • | | US$399.8 million of medium-term Dollar-denominated debt instruments, of which US$352.8 million were Dollar-denominated negotiable obligations due 2010 (referred to as the “Floating Rate Notes Due 2010” or the “2010 Notes”) issued under an indenture. |
| | • | | US$230.0 million of subordinated Dollar-denominated debt instruments, of which US$218.2 million were Dollar-denominated negotiable obligations due 2019 (referred to as the “Subordinated Notes Due 2019” or the “2019 Notes”) issued under an indenture. |
As of December 31, 2010, the outstanding principal amount of debt resulting from the above-mentioned restructuring amounted to US$317.1 million, US$239.2 million lower than as of December 31, 2009 and US$371.4 million lower than as of December 31, 2008, due to amortization, prepayments and advance cancellations. For more information see Item 5. “Operating and Financial Review and Prospects-Item 5.A. “Operating Results-Contractual Obligations”, and “Funding”.
Banco Galicia’s 2007 Capital Increase
On October 11, 2006, Banco Galicia’s shareholders resolved to increase Banco Galicia’s capital stock by up to 100 million ordinary (common) book-entry, class B shares, with one vote per share and a nominal value of Ps.1.0 each. The new shares could be purchased, at the option of the purchaser, in cash or in 2010 Notes, 2014 Notes and/or 2019 Notes. The offer was made only to shareholders. The purpose of the capital increase was to guarantee Banco Galicia’s compliance with the Argentine Central Bank’s capital adequacy rules, in light of the increase in such requirements. This increase was expected because of the current and projected growth of Banco Galicia’s business volume with the private sector and the Argentine Central Bank’s regulations establishing increasing capital requirements in respect of public-sector assets. See Item 4. “Information on the Company-Selected Statistical Information-Regulatory Capital-Banco Galicia”.
-25-
On July 27, 2007, we purchased 93,604,637 new shares through the exercise of our preemptive rights. During August 2007, Banco Galicia issued 93,664,806 new shares through the exercise of its shareholders’ preemptive and accretion rights. In total, the transaction led to a net increase in Banco Galicia’s shareholders’ equity of Ps.493 million, of which Ps.466 million was an aggregate increase in Banco Galicia’s shareholders’ equity items capital stock and issuance premiums, net of issuance costs, and Ps.27 million was a profit in connection with the portion paid for in 2014 Notes, given that these notes were received by Banco Galicia at a value lower than their book value.
Banco Galicia Uruguay S.A. and Galicia (Cayman) Ltd.
In 1983, Galicia Uruguay was established as a “Casa Bancaria”, a license that granted an offshore status, as an alternative service location for Banco Galicia’s customers. In September and October 1999, the Uruguayan government’s executive branch and the Uruguayan Central Bank, respectively, approved Galicia Uruguay’s status as a full service domestic bank. Due to the effects of the 2001-2002 crisis on Galicia Uruguay, in early 2002, the Central Bank of Uruguay suspended its activities and assumed control and management of Galicia Uruguay. In December 2002, Galicia Uruguay restructured its deposits into debt maturing in 2011. On June 1, 2004, Galicia Uruguay’s license to operate as a domestic commercial bank was revoked by the Central Bank of Uruguay, but it retained the license from the Uruguayan government’s executive branch. Control and management of Galicia Uruguay by the Central Bank of Uruguay ended on February 22, 2007. On May 15, 2009, Galicia Uruguay made available to its clients in advance US$27.3 million, corresponding to the remaining balance of its restructured debt, which was initially due in September 2011. At the date of this annual report, Galicia Uruguay was in the process of being liquidated and therefore was not engaged in any active business and its restructured debt (time deposits and negotiable obligations), has been repaid in full.
On May 29, 2009, the Special General Meeting of Galicia Uruguay approved the voluntary reduction of capital by redemption of shares. Following such capital reduction, Banco Galicia held 100% of the capital stock of Galicia Cayman, of which formerly 65.34% was controlled by Galicia Uruguay and the remaining 34.66% by Banco Galicia. As of the closing of fiscal year 2010 the shareholders’ equity of Galicia Uruguay amounted to Ps.46.0 million.
Galicia Cayman was established in 1988 in the Cayman Islands as another alternative service location for Banco Galicia’s customers. Galicia Uruguay’s situation adversely affected its subsidiary Galicia Cayman, which commenced voluntary liquidation and surrendered its banking license effective as of December 31, 2002. In May 2003, Galicia Cayman together with the provisional liquidators designated by the Grand Court of the Cayman Islands completed a debt restructuring plan and, with the authorization of such Court, presented it to all creditors for their consideration. The plan was approved, in whole, by the vote of 99.7% of creditors, exceeding the legal majority required, on July 10, 2003, and became effective and mandatory for all creditors. On February 2, 2006, the Grand Court of the Cayman Islands declared the plan as terminated and ended the involvement of any third parties in the company’s management beginning on February 23, 2006.
Regional Credit Card Companies
In the mid ‘90s, Banco Galicia made the strategic decision to target the “non-banked” individuals market, which, in Argentina, typically includes the low and medium-low income segments of the population which typically live in the Interior of the country, in addition to certain locations of the Greater Buenos Aires. To implement this strategic decision, among others, in 1995, Banco Galicia began investing in non-bank companies operating in certain regions of the Interior, providing financial services to individuals through the issuance of credit cards with proprietary brands and extending credit to its customers through such cards. We refer to these companies in aggregate as the “Regional Credit Card Companies”.
-26-
In 1995, Banco Galicia made the first investment in this business by acquiring a minority stake in Tarjeta Naranja S.A. The remaining stake remained in the hands of the founders of the company, who currently retain a minority interest. This company had begun operations in 1985 in the city of Córdoba, the second largest city in Argentina, by marketing “Tarjeta Naranja”, its proprietary brand credit card, in this city and had enjoyed local growth.
In 1996, Banco Galicia formed Tarjetas Cuyanas S.A., to operate in the Cuyo Region (the provinces of Mendoza, San Juan and San Luis) in partnership with local businessmen, who currently retain a minority interest in the company. This company launched the “Nevada Card” in May 1996 in the city of Mendoza. Also in 1996, Banco Galicia formed a new company, Tarjetas del Mar S.A., to operate in the city of Mar del Plata and its area of influence. Tarjetas del Mar S.A. began marketing the “Mira” card in March 1997.
In early 1997, Banco Galicia purchased an interest in Comfiar S.A., a consumer finance company operating in the provinces of Santa Fe and Entre Ríos, which was merged into Tarjeta Naranja S.A. in January 2004.
In 1999, Banco Galicia reorganized its participation in this business through Tarjetas Regionales S.A., a holding company wholly owned by Banco Galicia and Galicia Cayman, which achieved control of Tarjeta Naranja S.A., Comfiar S.A., Tarjetas Cuyanas S.A., and Tarjetas del Mar S.A. In addition, in 1999, Tarjetas Regionales S.A. acquired a 12.5% interest in Tarjetas del Sur S.A., a credit card company operating in southern Argentina. In January 2000, this interest increased to 60% and, in February of the same year, Tarjeta Naranja S.A. acquired the remaining 40%. In March 2001, Tarjetas del Sur S.A. merged into Tarjeta Naranja S.A.
As of December 31, 2010, Banco Galicia held 68.22% of Tarjetas Regionales S.A. while Galicia Cayman held the remaining 31.78%. Directly or indirectly, as of that date, Banco Galicia held 80.0% of Tarjeta Naranja S.A., 60.0% of Tarjetas Cuyanas S.A., and 99.999% of Tarjetas del Mar S.A.
These companies have experienced a significant expansion of their customer bases, in absolute terms and with respect to the range of customers served, number of cards issued, distribution networks and size of operations, as well as a technological upgrade and general modernization. By mid 1995, Tarjeta Naranja S.A. had approximately 200,000 cards outstanding. As of December 31, 2010, the Regional Credit Card Companies had more than 5.6 million- cards outstanding in the aggregate and were the largest proprietary brand credit card operation in Argentina.
In terms of funding, the Regional Credit Card Companies have no currency or maturity mismatches and are determined to maintain the most diversified sources of funding. These companies strengthen their cash position with commitments contracts carried out with different banks, share the sales efforts and customer financing with the merchants, carry out a permanent reinvestment of their profits and plan their financial decisions giving priority to liquidity and funds reserve.
The above-mentioned is translated into a conservative financial policy aiming to maintain the business in the long term, providing services according to their customer’s needs and minimizing risks during periods of liquidity problems.
Compañía Financiera Argentina
CFA is a financial company which operates under the Financial Institutions’ Law and other regulations set forth by the Argentine Central Bank.
CFA is a leading financial company in Argentina in the personal loans business, providing consumer personal loans through different products. Within this framework, CFA grants unsecured personal loans within the Argentine territory, mainly through its“Efectivo Sí”offices, intermediary entities (mutuals, unions, cooperatives, etc.) and the financing of purchases through its affiliated merchants. It also issues credit cards, but on a small scale.
CFA had different names before adopting its current name. It was originally set up under the name “Río de la Plata Sociedad Anónima Comercial y de Financiaciones” on August 16, 1960, and in 1977 the name was changed to “Burofinanz S.A. Compañía Financiera” (authorized by Resolution No. 424 of the Argentine Central Bank, dated December 29, 1977).
-27-
In 1992, CFA carried out its commercial activities under the name “Interbonos Compañía Financiera S.A.” (authorized by Resolution No. 284 of the Argentine Central Bank, dated June 17, 1992), as agent of theMercado Abierto(fixed income brokerage) and later it shifted its activities to personal financing, providing small loans through retail merchants for the acquisition of different consumer goods. In 1994, it created“Efectivo Sí", which is a product aimed at satisfying the financial needs of the “non-bankarized” population sector, or that segment of the population characterized by limited interaction with traditional banks.
In 1995, Banco de Crédito Argentino acquired an interest in the company’s capital stock and later Banco de Crédito Argentino was acquired by BBVA Banco Francés S.A., which became the major shareholder of CFA. Subsequently, the“División Convenios”(Agreements Division) was created, which allowed CFA to enter the market of agreements with mutuals, unions, cooperatives and other intermediary organizations, and grant loans to its associates.
The Argentine Central Bank, through its Resolution No. 85 dated February 7, 1996, registered CFA’s change of denomination to “Compañía Financiera Argentina S.A.” and authorized it to operate as a financial company under the Financial Institutions’ Law, thus allowing CFA to initiate its activities since February 27, 1996.
In 1998, most of CFA’s capital stock was acquired by AIG Consumer Finance Group Inc., a company controlled by AIG American International Group Inc. Six years later, in 2004, the“Cuota Sí”product was designed, aimed at financing purchases through affiliated merchants.
Finally, in June 2010, Compañía Financiera Argentina was acquired by Banco Galicia and Tarjetas Regionales S.A., which hold an interest in CFA’s capital stock of 95% and 5%, respectively
Sudamericana
In 1996, Banco Galicia entered the bank-assurance business, through the establishment of a joint venture with Hartford Life International to sell life insurance and annuities, in which it had a 12.5% interest. In December 2000, Banco Galicia sold its interest in this company and purchased 12.5% of Sudamericana, a subsidiary of Hartford Life International. As a result of various acquisitions, Grupo Financiero Galicia owns 87.5% of Sudamericana (with the remaining 12.5% being held by Banco Galicia) which offers life, retirement and property and casualty insurance products in Argentina through its subsidiaries Galicia Seguros S.A. (“Galicia Seguros”), which provides property and casualty and life insurance, Galicia Retiro Compañía de Seguros S.A. (“Galicia Retiro”), which provides retirement insurance and Sudamericana Asesores de Seguros S.A. (insurance broker).
Net Investment S.A.
Net Investment was established in February 2000 as a holding company (87.5% owned by Grupo Financiero Galicia and 12.5% owned by Banco Galicia) whose initial purpose was to invest in and develop businesses related to technology, communications, internet connectivity and web contents. Net Investment has performed its activities in the areas of business to business e-commerce, with the purpose of creating and exchanging synergies with Banco Galicia’s business activities.
The board of directors of Net Investment has been analyzing new business alternatives and the shareholders decided to amend the corporate purpose to be able to have an interest in other companies that carry out related, accessory and/or else supplementary activities to those carried out by Net Investment. Furthermore, during this fiscal year Net Investment subscribed shares of a company that carries out activities related to business development through the internet. The equity investment held by Net Investment is equivalent to 0.23% of said company’s net worth.
The board of directors of Net Investment is analyzing the possibility of carrying out other business alternatives and opportunities for the current fiscal year.
-28-
Galicia Warrants S.A.
Galicia Warrants was founded in April 1993, when it obtained the authorization from the relevant authorities to store goods and issue certificates of deposits of goods and warrants under the provisions of Law N° 9,643.
Galicia Warrants is a leading company in the deposit certificates and warrants issuance market and its main customers belong to the agricultural, industrial and agro-industrial sectors, as well as exporters and retailers. Its main objective is to enable its customers to access credit and financing, which are secured by the property kept under custody. Its shareholders are Grupo Financiero Galicia, with an 87.5% stake, and Banco Galicia, with the remaining 12.5%
Galval
Galval was formed in January 2005 under the laws of República Oriental del Uruguay and gradually started to operate in September 2005. Galval is a company that indirectly makes use of the free trade zone of Montevideo and renders brokerage services in República Oriental del Uruguay. Grupo Financiero Galicia owns the 100% of this company’s capital stock and voting rights.
GV Mandataria
In March 2008, GV Mandataria was incorporated with the purpose of carrying out securities related representations, mandates and commissions of all types, whether involving domestic or international companies. Grupo Financiero Galicia holds 90% of GV Mandataria’s stock, and the remaining 10% is held by Galval.
Business
Banking
Banco Galicia is our largest subsidiary. Banco Galicia operates in Argentina and substantially all of its customers, operations and assets are located in Argentina. Banco Galicia is a bank that provides, directly or through its subsidiaries, a wide variety of financial products and services to large corporations, “SMEs”, and individuals.
Banco Galicia is one of the main banks within the Argentine financial system, and is a leading provider of financial services in Argentina. As per the information published by the Argentine Central Bank, as of December 31, 2010, Banco Galicia ranked third in terms of assets and deposits and second in terms of its loan portfolio within private-sector banks. As of the same date, Banco Galicia was also ranked first among private-sector domestic banks in terms of loans and deposits. Its market share of private sector deposits and of loans to the private sector was of 8.14% and 8.28% respectively, as of the end of 2010. On a consolidated basis, as of the end of fiscal year 2010, Banco Galicia had total assets of Ps.35,299 million, total loans of Ps.21,334 million, total deposits of Ps.22,243 million, and its shareholders’ equity amounted to Ps.2,596 million.
Banco Galicia provides a full range of financial services through one of the most extensive and diversified distribution platforms amongst private-sector financial institutions in Argentina. This distribution platform is comprised of 239 full service banking branches, located throughout the country, 1,472 ATMs and self-service terminals owned by Banco Galicia, phone banking and e-banking facilities. Banco Galicia’s customer base reaches more than 2.1 million customers, who were comprised of mostly individuals but who also included more than 53,000 companies. Banco Galicia has a strong competitive position in retail banking, both with respect to individuals and SMEs. Specifically, it is one of the primary providers of financial services to individuals, one of the largest providers of credit cards, the primary private-sector institution serving the SMEs sector, and has traditionally maintained a leading position in the agriculture and livestock sectors.
For a breakdown of Banco Galicia’s revenues by category of activity for the last three financial years, see Item 5. “Operating and Financial Review and Prospects“—Item 5.A. Operating Results-Results by Segments-Banking.
-29-
Wholesale Banking
The Wholesale Banking Division includes the entire Agriculture and Livestock Sector, the Capital Markets and Investment Banking Department, the Non-financial Public Sector Department and the Foreign Trade Department. The Wholesale Banking Division manages Banco Galicia’s business transactions with companies, aimed at developing value-added financial solutions and services, focused on the optimization of the business process of companies from the different economic sectors, thus contributing both to their business development and their competitive growth.
Banco Galicia is firmly committed to Argentina’s economic growth, which is reflected in their over 53,000 corporate customers and in the composition of Banco Galicia’s total loan portfolio (without consolidation with Tarjetas Regionales S.A. and CFA), 57% of which corresponds to credit provided to the manufacturing sector (40% to SMEs and to the agriculture and livestock sector and 17% to credit provided to large companies and corporations).
During the fiscal year ended December 31, 2010, Banco Galicia maintained its leading position in the SMEs and agriculture and livestock sectors, as well as a strong presence in the corporate sector. Throughout its history of over 100 years, Banco Galicia has demonstrated its commitment to the agriculture and livestock sector, building a direct and close relationship with producers and collectives of producers, developing tailor-made products and services and providing the professional and customized advisory services that such customers need.
Banco Galicia has a strong presence in the corporate sector, which has strengthened year after year due in part to the development of value-added solutions to meet its customers’ needs and the advisory services that Banco Galicia’s experienced team of professionals can provide.
An indicator of the efforts being undertaken by Banco Galicia in order to provide better quality products and services is the receipt by Banco Galicia of the ISO 9001 Certification, a recognition which is very valuable for Banco Galicia’s businesses, as it allows it to optimize its collection systems.
Banco Galicia offers several different collection and payment services, which are designed to reduce costs. During the fiscal year ended December 31, 2010,Cobranza Integrada Galicia(Galicia Integrated Collections),Pago a Proveedores(Payment to Suppliers) andPago de Haberes(Payroll Payments) experienced large increases in transaction volume.
With nine Corporate Banking Centers distributed in the principal business areas of Argentina, Banco Galicia offers solutions adapted to the problems of each region, meeting the demands of customers on site, within the socio-economic environment in which they operate, and decentralizing decisions from Banco Galicia’s main office.
In respect of the commercial credit-card market, Banco Galicia strengthened its leading position by offering more benefits through its Galicia Business and Galicia Corporate credit cards, which are aimed at the SMEs and the large corporations segments, respectively.
Galicia Rural, the leading credit card within the agriculture and livestock sector, continued to offer financing options for the purchase of agricultural supplies and services on the following favorable terms: 0% interest rate and terms from 90 to 180 days for the purchase of seeds, agrochemicals, fertilizers, bulk liquefied gas, machines and services, among others.
Galicia Office is Banco Galicia’s corporate e-banking service, which companies use, without any cost, to make inquiries and requests about their banking products (accounts, loans, investments, Visa and Galicia Rural liquidations), as well as gain access to a wide range of information about their check portfolio and returned checks, request and ratify checkbooks, make transfers between their accounts and third party accounts, make investments, consult Banco Galicia regarding their foreign trade transaction balance, make payments to their employees with maximum security, renew their digital signature online and make payments to their suppliers. The volume of queries and transactions made through Galicia Office continues to grow year after year as well as the volume of companies currently subscribed to the service; currently more than 40,000 companies are using Galicia Office. During the fiscal year ended December 31, 2010, over 66 million queries and 2.7 million transactions were recorded.
-30-
With respect to direct payroll deposits, the volume of transactions during the fiscal year ended December 31, 2010 exceeded the figure recorded in 2009 by 57%. With respect to foreign trade, the annual volume of transactions exceeded the figure recorded the previous fiscal year by 38%.
Capital Markets and Investment Banking
Banco Galicia’s capital market activity is focused on corporate debt transactions and, to a lesser extent, on securitization transactions. In addition, Banco Galicia contributes to the optimization of its affiliated companies’ financing strategies.
Non-Financial Public Sector
During the fiscal year ended December 31, 2010, Banco Galicia continued improving its position as a service provider for the public sector, by visiting and offering services to several municipalities and national universities. As a result of these actions, new agreements were entered into and additional services were offered to the municipal sector. Furthermore, Banco Galicia continued taking part in different public bids on direct payroll deposits. The interest in such offered services shown by the municipal sector places Banco Galicia in a good position to continue doing business in this sector in fiscal year 2011.
Foreign Trade
During 2010, import and export operations conducted through Banco Galicia totaled US$10,410 million, thus increasing its market share from 8% in 2009 to 8.3% in 2010.
Galicia Comex, the first internet portal specializing in foreign trade in the Argentine financial system, is increasingly being used by customers as a source of information and consultation. Through Galicia Comex, customers may access valuable information for their business, such as tools, key news, sector-specific reports, analyses on external markets and interpretation of regulations and articles written by specialists, among others, in order to provide a comprehensive review of the international markets, combining both operational and commercial aspects.
Retail Banking
The Retail Banking Division manages Banco Galicia’s business with individuals from all income brackets, micro and smaller businesses (i.e., those businesses with revenues below Ps.20,000,000 annually) and small retailers and professionals. Retail Banking provides a wide range of financial products and services, encompassing transactions, loans, and investments. On the transactions side, Banco Galicia offers its customers checking and savings accounts, credit and debit cards, and payroll direct deposit, among other services. Banco Galicia’s customers have access to its services through its branch network as well as through its electronic distribution channels. See “—Sales and Marketing.”
In 2010, communication efforts were focused on reinforcing the “Cada día más”(More Every Day) concept. Banco Galicia focused on communicating with its customers on a more regular basis, rendering better services to its customers based on their daily needs, and on providing attractive offers and savings.
Ten commercials were aired throughout the year. Based on surveys conducted, high awareness and strong brand recognition were achieved. This campaign mainly aired on TV, but also included strong online and radio advertising.
In 2010, Banco Galicia launched theZona Galicia(Galicia Zone) application for cellular phones.Zona Galiciais a unique application that allows customers to access all the special offers from neighboring stores that are available to them. Banco Galicia is the first and only bank in Argentina to offer its customers the ability to access savings, branch and special offer information from their cellular phones, in an easy and cost-free manner.
Banco Galicia divides its customer base in respect of customer activity and income level in order to better meet the needs of each customer segment. For example, Galicia Prefer is a comprehensive financial package that was created for higher-income customers through which Banco Galicia renders distinctive services and financial products according to the needs of this customer segment. As part of this financial package, during 2009, Banco Galicia launched Galicia Prefer Platinum, a new service that includes exclusive features such as personal concierge, broad insurance coverage, preferential rates both for assets and investments, and higher financing limits, among others.
-31-
Banco Galicia provides direct payroll deposit services to over 17,500 companies, which is comprised of accounts for approximately 590,000 customers. As of December 2010, Banco Galicia has more than 35,000 customers in the micro and small business segment, and more than 1.6 million individual clients.
Private Banking offers services to individuals with medium to high net incomes through management of their investment portfolios and provision of financial advisory services. Private Banking offers its customers a wide range of domestic financial investment alternatives, giving priority to Banco Galicia’s products (deposits and FIMA mutual funds, among others) and to trusts and securities for which Banco Galicia acts as an arranger. In addition, Private Banking offers broad geographic coverage, with 13 service centers throughout Argentina.
Banco Galicia’s retail banking customer service model received the ISO 9001 Certification and the ISO 9001:2008 Certification, which further establishes Private Banking’s commitment to the ongoing improvement of its customer service quality.
Banco Galicia issues Visa, Visa Débito, American Express and MasterCard credit cards, and currently has 1.35 million active accounts, in addition to the proprietary credit cards issued by the Regional Credit Card Companies.
Banco Galicia has placed special emphasis on its personal loan customer base and has aimed at sustaining growth while maintaining its excellent risk levels. With this goal in mind, Banco Galicia has continued to simplify credit screening measures (through an automatic credit rating process) for those customers whose salaries are directly deposited in Banco Galicia or those who already have an outstanding loan.
Banco Galicia is focused on offering tailored lines of credit with characteristics that are in line with the different needs and income segments of its customers. Such focus has allowed Banco Galicia to increase the amount of lines of credit it offers, while also achieving increasing profitability levels.
Banco Galicia’s extensive branch network is one of the key components of its distribution network, and is one of its most important competitive advantages. Banco Galicia’s distribution network is supported by the use of its intranet (Banco Galicia’s system of branch-to-branch communication), the use of its information technology systems, the customer incentives that it consistently offers and the constant monitoring of its customer service quality.
As of December 31, 2010, Banco Galicia’s branch network’s geographical distribution was as follows:
| | | | | |
| Geographical Area | | Number of Branches | |
| City of Buenos Aires | | | 77 | |
| Greater Buenos Aires | | | 62 | |
| Rest of the Province of Buenos Aires | | | 28 | |
| Santa Fe | | | 15 | |
| Córdoba | | | 15 | |
| Mendoza | | | 9 | |
| Entre Ríos and Chubut | | 4 each | |
| Río Negro | | | 3 | |
| Corrientes, La Pampa, Misiones, San Luis, Tierra del Fuego and Tucumán | | 2 each | |
| Catamarca, Chaco, Formosa, Jujuy, La Rioja, Neuquén, Salta, Santa Cruz, Santiago del Estero and San Juan | | 1 each | |
| | | | |
Total | | | 239 | |
| | | | |
-32-
Apart from its branches, Banco Galicia uses Red Galicia 24, the bancogalicia.com portal, Galicia Servicios Móviles and its Retail Sales Division, which are service, transactional and sales channels focused on individual and corporate customers.
Banco Galicia’s ATMs and self-service terminals provide its customers with a means of solving their transactional needs in a simple, safe and affordable way, on a 24/7 basis. They are distributed all over the country in the branch network and other locations, such as gas stations, supermarkets and shopping malls.
During the first quarter of the fiscal year ended December 31, 2009, Banco Galicia completed the replacement of all of the ATMs in its branches and other locations. In addition, toward the end of 2009, Banco Galicia was the first bank in Argentina to provide an ATM that allows customers to deposit funds without using an envelope. This technology immediately authorizes deposits in Issuer accounts and the money is immediately credited online. This technology provides additional speed and sophistication for deposits, thus eliminating the use of envelopes, the only way to deposit money in Argentina prior to the use of this type of ATM technology. During the fiscal year ended December 31, 2010, Banco Galicia installed 18 ATMs with such technology.
The bancogalicia.com website makes it possible for customers to request products according to their needs with the assistance of an interactive advisor, obtain information on promotions in the innovative benefits catalogue, and get information about all the products and services offered by Banco Galicia. It also facilitates access to Banco Galicia’s specific web pages for both individuals (Galicia Home Banking) and companies (Galicia Office), allowing customers to access Banco Galicia’s products and services from any location, 365 days a year.
Galicia Servicios Móviles is a suite of services for cell phones (SMS, WAP, and Java and iPhone applications), allowing customers to inquire about their accounts, pay balances, subscribe to alerts and obtain information regarding their credit cards.
Regional Credit Card Companies
The companies devoted to the issuance of regional credit cards and the provision of financing transactions to consumers are subsidiaries of Banco Galicia through Tarjetas Regionales S.A. (Tarjeta Naranja S.A., Tarjetas Cuyanas S.A. and Tarjetas del Mar S.A.).
These Regional Credit Card Companies are estimated to comprise the largest operations of their kind in Argentina. These companies issue proprietary brand credit cards (the “Naranja,” “Nevada” and “Mira” cards) to their customers that are primarily located in the interior (i.e. outside of the Greater Buenos Aires area), which allow their holders to charge purchases of goods or services in a network of more than 100,000 retailers that have agreed to accept the cards. These companies accept and process from each participating retailer the charges arising from cardholder purchases. The cards can be used as charge cards or purchases can be financed through different optional payment schedules, which vary from merchant to merchant. These Regional Credit Card Companies also extend personal loans to their cardholders to be repaid in up to 24 fixed installments. Through these cards, customers also have access to the ATM networks throughout Argentina (Banelco and Link), through which customers can make cash withdrawals and access automatic debit services, among other services. These Regional Credit Card Companies also issue Visa, American Express and MasterCard cards to holders of their proprietary brand cards. All customer products are managed through a single statement.
As of December 31, 2010, the Regional Credit Card Companies’ branch network was composed of 231 service centers and the staff of all of the Regional Credit Card Companies was comprised of almost 5,000 employees.
As of December 31, 2010, the number of statements issued and the number of cards managed by the Regional Credit Card Companies exceeded 2.1 million and 5.4 million, respectively. With respect to business volume, aggregate annual purchases made by cardholders exceeded Ps.13,052 million during the fiscal year ended December 31, 2010, representing an increase of 44% from the fiscal year ended December 31, 2009, and the loan portfolio of the Regional Credit Card Companies (before allowances for loan losses and including securitized loans) for the fiscal year ended December 31, 2010 amounted to Ps.5,598 million, representing a 53.7% increase from the end of 2009. In 2010, the total number of transactions (purchase coupons plus loan and advance operations) amounted to 99.2 million, representing a 29.2% increase from the end of the fiscal year ended December 31, 2009.
-33-
During the fiscal year ended December 31, 2009, aggregate annual purchases made by cardholders were more than Ps.9,061 million, representing an increase of almost 20% from the fiscal year ended December 31, 2008, and the loan portfolio of the Regional Credit Card Companies (before allowances for loan losses and including securitized loans) for the fiscal year ended December 31, 2009 amounted to Ps.3,641 million, representing a 12.1% increase from the end of the fiscal year ended December 31, 2008. In the fiscal year ended December 31, 2009, the total number of transactions (purchase coupons plus loan and advance operations) amounted to approximately 77 million.
For a breakdown of the Regional Credit Card Companies’ revenues for the last three financial years, see Item 5. “Operating and Financial Review and Prospects“—Item 5.A. “Operating Results-Results by Segments-Regional Credit Cards”.
CFA
CFA is the leading financial company in Argentina in the personal loan business. As of December 31, 2010, CFA’s assets were over Ps.1,728 million and its shareholders’ equity was Ps.768.7 million. CFA Group employed 1,160 people. With 59 branches and 36 points of sale throughout Argentina, CFA offers its products to 470,000 customers, who belong, in general, to the low-to-medium income segments, characterized by limited interaction with traditional banks. Such customers often seek a more simplified and quick processing regime for their loans and other banking products.
Main products:
| | • | | Efectivo Sí:Unsecured personal loans payable in installments. |
| | • | | Cuota Sí:Product to finance purchases of goods through merchants associated with CFA, without using any cash or credit cards. Such goods include home appliances, household goods and construction materials. |
| | • | | Loans to Public Sector Employees:Loans targeted to public sector employees on the national level, which are deducted directly from their salary. |
| | • | | Loans to Financial Brokerage Firms and Employees.Payroll loans to affiliates or associate members of brokerage firms (mutuals, cooperatives, unions, etc.) and to company employees. |
| | • | | Credit Cards:Issued by Visa and MasterCard, both at domestic and international level. |
| | • | | Pagos Jubilatorios de la ANSES(Retirement and pension payment — National Social Security Administration): Aimed at retired people and pensioners collecting their payments at CFA. |
| | • | | Microfinance:Credit lines for small ventures in specific geographic areas across the country. |
| | • | | Insurance:CFA sells different types of insurance policies from leading companies of the market to meet customers’ needs. |
For a breakdown of CFA’s revenues for the last financial year, see Item 5. “Operating and Financial Review and Prospects“—Item 5.A. “Operating Results-Results by Segments-CFA Personal Loans”.
Financial Division
The Financial Division of Banco Galicia includes the Treasury, Banking Relations and Management of Assets and Liabilities departments. In addition, this division is also involved in the mutual funds business and in the brokerage business through Galicia Valores S.A. Sociedad de Bolsa (“Galicia Valores”).
The Treasury Department is responsible for, among other things, managing liquidity and the different financial risks of Banco Galicia, based on the parameters determined by Banco Galicia’s board of directors. It manages positions in foreign currency and government securities, and it also acts as an intermediary and distributes financial instruments for its own customers (institutional investors) and corporate customers and individuals. The Treasury Department participates in different markets in its capacity as agent of theMercado Abierto Electrónico(“MAE”) and member of the Rosario Futures Exchange, Financial Products Division. Through Galicia Valores, this department offers customers the ability to buy and sell securities on the BASE.
-34-
In 2010, Banco Galicia was ranked 4th in the MAE’s annual ranking for transactions of fixed-income instruments. In the wholesale foreign exchange market, the total amount corresponding to transactions made by Banco Galicia through the MAE totaled US$9,023 million, which represented a 61% increase from 2009.
During 2010, Banco Galicia increased its operations in the interest rate derivatives market within the MAE, and ranked 3rd place in swaps and in futures contracts, in terms of volume.
The Banking Relations Department is responsible, at the international level, for managing Banco Galicia’s business relationships with banks, international credit agencies, official credit agencies and international mutual funds and, since the fourth quarter of the fiscal year ended December 31, 2009, with financial institutions and exchange houses within the domestic sector.
The Management of Assets and Liabilities Department is in charge of preparing and analyzing information aimed at managing the mismatches to which Banco Galicia’s activities are subject, and maintaining the exposure within the policies determined by Banco Galicia’s board of directors. This department’s responsibilities include the provision of support to the Assets and Liabilities Committee (ALCO) through the analysis, quantification and control of the risks associated with different business strategies and market scenarios, as well as the follow-up and control of liquidity policies and currency mismatches, whether due to regulations of the Argentine Central Bank or Banco Galicia’s operations.
Banco Galicia distributes the FIMA mutual funds through its broad distribution network (branches, electronic banking and telephone banking) to different customer segments (institutions, companies and individuals), while it acts as custodian of the assets that make up the funds in its role as depository. Galicia Administradora de Fondos is the company that manages investments and determines the value of the mutual fund units on a daily basis. The total value of the FIMA mutual funds was Ps.1,417 million as of December 31, 2010, with a market share of 6.9%.
The Comprehensive Corporate Services Division integrates all of Banco Galicia’s operations so as to improve the efficiency of Banco Galicia’s operational processes.
Insurance
Galicia Seguros is a provider of a variety of property and casualty (“P&C”) and life insurance products. Its most important line of business is group life insurance, including employee benefit plans and credit related insurance. With regard to P&C insurance products, it primarily underwrites home and ATM theft insurance. Galicia Retiro provides annuity products, and Sudamericana Asesores de Seguros S.A. is an insurance broker. These companies operations are all located in Argentina.
Total insurance production of the aforementioned insurance companies amounted to Ps.417.5 million during 2010, 28% higher than the volume of premiums of the previous year (Ps.325.5 million).
This increase in insurance production was recorded mainly for Galicia Seguros, with Ps.92.1 million more premiums written than in the same period of the previous fiscal year. As regards Galicia Seguros’ business transactions, the focus was placed on continuing to increase the company’s turnover and sales, which in 2010 amounted to Ps.151.7 million of annualized premiums. This represented a 60% growth when compared to the previous year, thus increasing the insurance policy laps ratio and extending the types of coverage offered.
The coming into force of Law N° 26,425 that creates the Argentine Integrated Social Security System (SIPA as per its initials in Spanish) meant the end of pension-linked life annuities, the main product marketed by Galicia Retiro. Consequently, the company is analyzing whether or not to re-launch new voluntary retirement products, both individual and group.
Within the current economic framework, measures aimed at complying with the goals established in the Business Plan will continue during 2011.
-35-
Other Businesses
Galicia Warrants: this company is a leading company in the deposit certificates and warrants issuance market. It has been continuously conducting transactions since 1994, supporting medium and large companies in regard to the custody of stocks. Galicia Warrants main objective is to enable its customers access to credit and financing, which are secured by the property kept under custody. Galicia Warrants main customers belong to the agricultural, industrial and agro-industrial sectors, and also include exporters and retailers. Within the framework of growth the Argentine economy has been experiencing, industrial and agro-industrial higher activity levels, resulted in higher demand for credit and, therefore, an increase in financing-related activities. This trend is expected to continue during the next fiscal year. During 2010 the company recorded income from services for Ps.10.5 million, with a net income amounting to Ps.2.1 million at the fiscal year-end.
Net Investment: this company has performed its activities in the areas of intercompany e-commerce, with the purpose of creating and exchanging synergies with Banco Galicia’s business activities.
The board of directors of Net Investment has been analyzing new business alternatives and the shareholders decided to amend the corporate purpose to be able to have an interest in other companies that carry out related, accessory and/or else supplementary activities to those carried out by Net Investment. Furthermore, during this fiscal year Net Investment subscribed for shares of a company that carries out activities related to business development through the internet. The equity investment held by Net Investment is equivalent to 0.23% of said company’s net worth.
The board of directors of Net Investment is analyzing the possibility of carrying out other business alternatives and opportunities for the current fiscal year.
Galval: this company mainly generates fee income from brokerage and custodial services. As of December 31, 2010; it had customers’ securities held in custody for US$121.95 million, of which US$14.3 million corresponded to the holding of securities of Grupo Financiero Galicia.
GV Mandataria: The company’s main purpose is to represent, act as agent and carry out brokerage activities of any sort, both for domestic and foreign companies. During 2010, income from services amounted to Ps.3.3 million, with a pretax net income of Ps.0.2 million.
For a breakdown of the other businesses’ revenues for the last three financial years, see Item 5. “Operating and Financial Review and Prospects“—Item 5.A. “Operating Results-Results by Segments-Other Grupo Businesses”.
Competition
Due to our financial holding structure, competition is experienced at the level of our operating subsidiaries. We face strong competition in most of the areas in which our subsidiaries are active. For a breakdown of our total revenues, for each of the past three fiscal years, for the activities discussed below (i.e., banking, regional credit cards, CFA personal loans and insurance), see Item 5. “Operating and Financial Review and Prospects“—Item 5.A. “Operating Results-Results by Segments”.
Banking
Banco Galicia faces significant competition in all of its principal areas of operation. Banco Galicia faces competition from foreign banks operating in Argentina, mainly large retail banks which are subsidiaries or branches of banks with global operations, Argentine national and provincial government-owned banks, private-sector domestic banks and cooperative banks, as well as non-bank financial institutions.
With respect to private-sector customers, the principal segment for Banco Galicia, the main competitors are large foreign banks and certain domestically-owned private-sector banks, which, prior to the crisis, operated in commercial or private banking and that, after the 2001-2002 crisis, acquired the retail operations of banks that left the business as a result of such crisis. Competition from public-sector banks has decreased since the immediate post-crisis period, as the public initially attracted to such institutions as a safe harbor began to search for better service with private-sector financial institutions. However, the three largest government-owned banks are of a significant size and also compete with Banco Galicia.
-36-
Banco Galicia’s estimated deposit market share of private-sector deposits in the Argentine financial system was 8.14% as of December 31, 2010, compared to 7.73% as of December 31, 2009 and 7.5% as of December 31, 2008.
According to information published by the Argentine Central Bank, as of December 31, 2010, Banco Galicia was the third largest private-sector bank as measured by its assets and by its deposits, the second largest bank measured by its loan portfolio, and ranked sixth in terms of net worth.
Banco Galicia believes that it has a strong competitive position in retail banking, both with respect to individuals and SMEs. Specifically, Banco Galicia believes it is one of the primary providers of financial services to individuals, the primary private-sector institution serving the SMEs sector, and has traditionally maintained a leading position in the agriculture and livestock sector.
Argentine Banking System
As of December 31, 2010, the Argentine financial system consisted of 80 financial institutions, of which 64 were banks and 16 were financial non-bank institutions (including finance companies, credit unions and savings and loans associations). Of the 64 banks, 12 were Argentine national and provincial government-owned or related banks. Of the 52 private-sector banks, 31 were private-sector domestically-owned banks; 20 were foreign-owned banks (i.e., local branches or subsidiaries of foreign banks); and 1 was a cooperative bank, also domestically-owned.
As of the same date, the largest private-sector banks, in terms of total deposits, were: Banco Santander Río, BBVA Banco Francés, Banco Galicia, Banco Macro, HSBC Bank, Credicoop and Banco Patagonia. Banco Galicia, Banco Macro and Credicoop are domestically-owned banks and the others are foreign-owned banks. According to information published by the Argentine Central Bank as of December 31, 2010, private-sector banks accounted for 52.8% of total deposits and 62.2% of total net loans in the Argentine financial system. Argentine financial industry regulations do not raise significant entry or exit barriers, nor do they make any differentiation between locally or foreign-owned institutions. The only cooperative bank is active principally in consumer and middle-market banking, with a special emphasis on the lower end of the market. As of December 31, 2010, financial institutions (other than banks) accounted for approximately 0.3% of deposits and 2.8% of net loans in the Argentine financial system.
As of December 31, 2010, the largest Argentine national and provincial government-owned or related banks, in terms of total deposits, were Banco Nación and Banco de la Provincia de Buenos Aires. Under the provisions the Financial Institutions’ Law, public-sector banks have comparable rights and obligations to private banks, except that public-sector banks are usually chosen as depositaries for public-sector revenues and promote regional development and certain public-sector banks have preferential tax treatment. The bylaws of some public-sector banks provide that the governments that own them (both national and provincial governments) guarantee their commitments. Under current law, Banco de la Provincia de Buenos Aires is not subject to any taxes, levies or assessments that the Government may impose. According to information published by the Argentine Central Bank, as of December 31, 2010, government-owned banks and banks in which the national, provincial and municipal governments had an ownership interest accounted for 46.9% of deposits and 35% of loans in the Argentine financial system.
Consolidation has been a dominant theme in the Argentine banking sector since the 1990’s, with the total number of financial institutions declining from 214 in 1991 to 80 at December 31, 2010, with the ten largest banks holding 76.96% of the system’s deposits and 71.6% of the system’s loans as of December 31, 2010.
Foreign banks continue to have significant presence, despite the fact that the number of foreign banks decreased by 19 through December 2010, as compared to the end of 2001, and that foreign banks’ share of total deposits has decreased since the 2001-2002 crisis while the share of domestic private-sector banks has increased.
-37-
Regional Credit Cards
No official data is available about the credit card market and the consumer of financial services’ market in the Interior, where the Regional Credit Card Companies operate. However, the Regional Credit Card Companies’ operation is estimated to be the largest of its kind in Argentina and Tarjeta Naranja S.A. is estimated to be the largest proprietary-brand credit card issuer in Argentina among approximately 150 existing companies.
Compañía Financiera Argentina
CFA markets all of its financial products mainly to C1, C2, C3 and D1 segments (medium and low income segments). CFA’s main competitors are: Banco Cetelem, Banco Columbia (which acquired the branch network of GE Money), Banco de Servicios y Transacciones (formerly Credilogros), Provencred (acquired by Banco Comafi to Citibank), Cooperativa la Capital del Plata, Caja de Crédito Cuenca, Banco de Servicios Financieros (Grupo Carrefour), Banco Supervielle and Banco Sáenz (Grupo Frávega). It’s worth mentioning that CFA is ranked 8th within national personal loans market, over entities such as Citibank, HSBC, Banco Patagonia, Banco Credicoop and Banco Hipotecario.
CFA also faces competition with certain entities which render non-regulated services, or small chains, located in less populated cities. Some big chains also offer their own financing, such as Garbarino, Frávega, Megatone and Riveiro, through the issuance of financial trusts.
Insurance
Sudamericana’s subsidiaries face significant competition since, as of December 2010, the Argentine insurance industry was comprised of approximately 181 insurance companies, 38 of which were dedicated exclusively to life insurance and 21 to annuities. Subsidiaries of foreign insurance companies and the world’s largest insurance companies with global operations are among these companies. In addition, as of that date, the number of brokers amounted to approximately 22,900 individuals and 450 companies.
During 2010, the insurance industry continued growing. Production amounted to Ps.41,202.9 million, 15.8% higher than the level recorded for 2009 at constant values.
Out of the total insurance production, 81% relates to property insurance, 17% relates to life and personal insurance, and 2% relates to retirement insurance.
Within the 81% corresponding to property insurance, the automotive insurance segment continues to be the most significant one (45%), followed by the workers’ compensation segment (29%).
Within the life insurance business, the group life insurance segment is the most significant, representing 65%, followed by individual life insurance, representing 16%, and personal accident insurance, representing 13%.
As of December 2010, Galicia Seguros ranked seventh in terms of net premium of life insurance policies underwritten and first in terms of net premium of home insurance policies underwritten.
Sales and Marketing
Banco Galicia’s, the Regional Credit Card Companies’ and CFA’s distribution capabilities are our principal marketing channels. Our distribution network is one of the largest and most flexible distribution platforms in the country and has nationwide coverage. The network of offices of the Regional Credit Card Companies mainly serves the medium and low income segments of the population, which generally make less use of bank services, through offices located all across the Interior of the country. CFA’s network serves the low income segment of the population, mainly in Buenos Aires and its outskirts. Through Banco Galicia, we operate a nationwide distribution network, which is one of the most extensive and diversified distribution networks among private-sector financial institutions in Argentina.
| | | | | |
| | | March 2011 | |
Branches(number) | | | | |
| Bank Branches | | | 240 | |
| Regional Credit Card Cos. Branches | | | 175 | |
| CFA Branches | | | 95 | |
| Business Centers and In-House Facilities | | | 21 | |
| Private-Banking Centers | | | 13 | |
| | | | |
Electronic Banking Terminals(number) | | | | |
| ATMs | | | 701 | |
| Self-Service Terminals | | | 786 | |
| | | | |
Electronic Banking Transactions(thousands per month) | | | | |
| ATMs + Self-Service Terminals | | | 14,134 | |
| Phone-Banking | | | 331 | |
| e-banking | | | 23,561 | |
| | | | |
-38-
Banco Galicia markets all of its financial products and services to high-, medium- and medium- to low-income individuals, including loans, insurance and FIMA family of mutual funds, among others, through its branch network, which operates on-line in real time. Within the branches, the sales force is specialized by type of customer and by customer segment. Banco Galicia’s sales policy encourages tellers to perform sales functions as well. Wealthy individuals who are private banking customers are served by specialized officers and a specialized network of service centers, including a head office facility.
Commercial and investment banking services to large corporations and other entities are provided in a centralized manner. Branch officers are responsible for Banco Galicia’s relationship with middle-market and small businesses and most of the agriculture and livestock sector customers. Banco Galicia also has established specialized centers that concentrate on providing service to businesses, which are distributed across the country and located in main cities of the Interior and certain customer companies facilities.
All of Banco Galicia’s individual and corporate customers have access to Banco Galicia’s electronic distribution channels, including the ATM and self-service terminals network and self-service terminals (“Red Galicia 24”), a multifunction call center (the “CCC”), an e-banking website (bancogalicia.com) and a banking service through cell phones (“Galicia Móvil”).
Banco Galicia is client service oriented and assigns great importance to its service model and seeks to improve it constantly.
Banco Galicia has a segmented marketing approach and designs marketing campaigns focused on specific segments of Banco Galicia’s customer base. Banco Galicia’s marketing strategy is also focused on the development of long-term relationships with customers based on a deep and increasing knowledge of those customers. As part of this client-oriented strategy, Banco Galicia implemented a customer relationship management technology. Banco Galicia’s investment in advertising has increased in the last years, in line with the general market’s trend and particularly, the Argentine financial system’s increase in investment and number of advertisers. These actions, along with massive events in shopping centers across the country and many direct-marketing programs have reinforced the perception of Banco Galicia as a close and friendly bank and have strengthened the brand image, allowing Banco Galicia to regain the “top of mind” (immediate brand recollection) leadership in its category.
Banco Galicia considers quality of service as the main element capable of distinguishing it from competitors. In order to measure this indicator, Banco Galicia periodically performs surveys, with positive results in recent years, showing high customer satisfaction. The Regional Credit Card Companies market their products and services through a network of branches and service centers, the size of which depends on the size of the locations in which they operate. The companies’ culture is strongly client service oriented and assigns great importance to quality of service. Sales officials receive intensive training in personalized sale of the companies’ products and quality of service, given that the bulk of sales is conducted on a one-on-one basis. Quality of service at the branches is permanently monitored by third parties and availability is enhanced through extended business hours. In addition, each of the companies has a web site through which they conduct sales, receive customers’ requests (such as requests for statements, loans or increases in the credit limits assigned and new cards, among others), provide information on and promote products. These sites include a link that allows payments to be made. In addition, each company has a call center, through which sales, post-sales and collection functions are performed. CFA markets its products through a network of 59 branches and 36 points of sales, located throughout Argentina. The company leads the personal loan business among financial institutions in Argentina and offers its products to customers who belong, in general, to the low-to-medium income segments, characterized by limited interaction with traditional banks. As such, CFA offers its product"Cuota SI”in approximately 4,800 merchants, of which 800 are active, while the agreements are offered out of the branches through different channels. Such customers often seek a more simplified and quick processing regime for their loans and other banking products.
-39-
To market its products, Sudamericana’s subsidiaries mainly use Banco Galicia’s and the Regional Credit Card Companies’ distribution networks. They also use the sales officers of Sudamericana Asesores de Seguros S.A. In addition Sudamericana has a telemarketing center of its own.
Property
The following are our main property assets, as of December 31, 2010:
| | | | | | | | | |
| | | | | Square | | | |
| | | | | Meters | | | |
| Property | | Address | | (approx.) | | | Main Uses |
| Grupo Financiero Galicia | | | | | | |
| - Owned | | -Tte. Gral. Juan D. Perón 456, 2nd floor, Buenos Aires, Argentina | | | 191 | | | Administrative activities |
Banco de Galicia y Buenos Aires S.A. | | | | | | |
| - Owned | | -Tte. Gral. Juan D. Perón 407, Buenos Aires, Argentina | | | 17,300 | | | Administrative activities |
| | | -Tte. Gral. Juan D. Perón 430, Buenos Aires, Argentina | | | 42,000 | | | Administrative activities |
| | | -Florida 361, Buenos Aires, Argentina | | | 7,300 | | | Administrative activities |
| - Rented | | -San Martín 178/200, Buenos Aires, Argentina | | | 3,600 | | | Administrative activities |
| | | | | | | | | |
| Banco Galicia Uruguay S.A. (in liquidation) | | | | | | |
| - Rented | | -Montevideo, Uruguay | | | 580 | | | Storage |
| | | -Dr. Americo Ricaldoni 2468, Montevideo, Uruguay | | | 400 | | | Administrative activities |
| | | | | | | | | |
Tarjeta Naranja S.A. | | | | | | |
| - Owned | | -Sucre 152, 154 and 541, Córdoba, Argentina | | | 6,307 | | | Administrative activities |
| | | -Humberto Primo, Córdoba, Argentina | | | 4,883 | | | Administrative activities |
| | | -Jujuy 542, Córdoba, Argentina | | | 853 | | | Administrative activities |
| | | -Ruta Nacional 36, km. 8, Córdoba, Argentina | | | 49,249 | | | Storage |
| | | -Río Grande, Tierra del Fuego, Argentina | | | 309 | | | Administrative activities |
| | | -San Jerónimo 2348 and 2350, Santa Fe, Argentina | | | 1,475 | | | Administrative activities |
| - Rented | | -Sucre 145/151, La Rioja 359, 364 and 375, Córdoba, Argentina | | | 4,450 | | | Administrative activities and printing centre |
| | | | | | | | | |
| Tarjetas Cuyanas S.A. | | | | | | |
| - Rented | | -Belgrano 1415, Mendoza, Argentina | | | 1,160 | | | Administrative activities |
| | | -Belgrano 1462, Mendoza, Argentina | | | 1,156 | | | Administrative activities |
| | | -Belgrano 1478, Mendoza, Argentina | | | 175 | | | Printing centre |
| | | | | | | | | |
| Tarjetas del Mar S.A. | | | | | | |
| - Rented | | -Luro 3001, Mar del Plata, Buenos Aires, Argentina | | | 100 | | | Administrative Activities |
| | | -Luro 2943, Mar del Plata, Buenos Aires, Argentina | | | 980 | | | Administrative Activities |
| | | -Catamarca 1586, Mar del Plata, Buenos Aires, Argentina | | | 170 | | | |
| | | | | | | | | |
| Compañía Financiera Argentina | | | | | | |
| - Rented | | -Florida 238, Buenos Aires, Argentina | | | 4,500 | | | Administrative Activities |
| | | -Azopardo 467, Buenos Aires, Argentina | | | 3,700 | | | Administrative Activities |
| | | | | | | | | |
| Galicia Seguros S.A. | | | | | | |
| - Owned | | -Maipú 241, Buenos Aires, Argentina | | | 3,261 | | | Administrative activities |
| | | | | | | | | |
| Galicia Warrants S.A. | | | | | | |
| - Owned | | -Tte. Gral. Juan D. Perón 456, 6th floor, Buenos Aires, Argentina | | | 118 | | | Administrative activities |
| | | -Alsina 3396/3510, San Miguel de Tucumán, Tucumán, Argentina | | | 12,800 | | | Storage |
| - Rented | | -Alto Verde, Chicligasta, Tucumán, Argentina | | | 2,000 | | | Storage |
Galval Agente de Valores S.A. | | | | | | |
| - Rented | | -Zona Franca, Montevideo, Uruguay | | | 300 | | | Administrative activities |
| | | | | | | | | |
| GV Mandataria de Valores S.A. | | | | | | |
| - Rented | | -25 de Mayo 432, 3rd floor, Buenos Aires, Argentina (1) | | | 336 | | | Administrative activities |
| | | |
| (1) | | Banco Galicia leases, from September 1, 2008 to August 31, 2011, a property to GV Mandataria, for US$4,500 per month during the first year, US$4,635 during the second year and US$4,775 during the third year. |
-40-
As of December 31, 2010, our distribution network consisted of:
| | • | | Banco Galicia: 239 branches located in Argentina, 137 of which were owned and 102 of which were rented by Banco Galicia, located in all of Argentina’s 23 provinces. |
| | • | | Tarjeta Naranja S.A.: 122 sales points located in 21 of the 23 Argentine provinces, 120 of which were rented by the company. |
| | • | | Tarjetas Cuyanas S.A.: 42 sales points in the provinces of Mendoza, San Juan, San Luis, Santiago del Estero, La Pampa, La Rioja, Catamarca, Neuquén, Rio Negro, Salta, Jujuy and Tucumán. All of them were rented. |
| | • | | Tarjetas del Mar S.A.: 12 sales points located in the Province of Buenos Aires, all of which were rented. In addition, it owns 11 client assistance centers located in the Province of Buenos Aires and 48 sales stands located in premises that belong to La Anónima supermarket chain, in the provinces of Buenos Aires, La Pampa, Neuquén, Río Negro, Chubut and Tierra del Fuego. |
| | • | | CFA: 41 branches, 38 mini-branches and 16 payment centers, all of which were rented, located in all of Argentina’s provinces, with at least one branch located in each province. |
Capital Investments and Divestitures
During 2010, our capital expenditures amounted to Ps.330.5 million, distributed as follows:
| | • | | Ps.105.7 million in fixed assets (real estate, machinery and equipment, vehicles, furniture and fittings); |
| | • | | Ps.13.1 million in construction in progress; and |
| | • | | Ps.211.7 million in organizational and IT system development expenses. |
During 2009, our capital expenditures amounted to Ps.179.5 million, distributed as follows:
| | • | | Ps.56.6 million in fixed assets (real estate, machinery and equipment, vehicles, furniture and fittings); |
| | • | | Ps.4.7 million in construction in progress; and |
| | • | | Ps.118.2 million in organizational and IT system development expenses. |
During 2008, our capital expenditures amounted to Ps.279.9 million, distributed as follows:
| | • | | Ps.103.4 million in fixed assets (real estate, machinery and equipment, vehicles, furniture and fittings); |
| | • | | Ps.44 million in construction in progress; and |
| | • | | Ps.132.5 million in organizational and IT system development expenses. |
These capital expenditures were made mainly in Argentina.
In June, 2009, Banco Galicia entered into an agreement with American International Inc. (“AIG”) and AIG Consumer Finance Group Inc. to purchase the outstanding shares of the CFA Group, a group of Argentine companies devoted to financial and complementary activities.
During fiscal year 2010, Banco Galicia purchased 95% of the shares of CFA and Tarjetas Regionales S.A. purchased the remaining 5% of the shares of CFA. The total cost for the shares was Ps.333.9 million (including acquisition costs), generating a negative goodwill of Ps.517.4 million resulting from the difference between the amount paid as acquisition cost and the book value of the net assets received.
During July, 2009, Galicia Warrants sold its Silos plant in San Salvador, province of Entre Ríos, generating a profit before tax of Ps.10.6 million.
During September 2008, the interests and credits that Banco Galicia had in Aguas Argentinas S.A. and Aguas Provinciales de Santa Fe S.A. (in liquidation) were sold, and the contingent obligations timely assumed in relation to such investments were also settled. As of December 31, 2007, the interests were fully provisioned, while the credits had their related regulatory provisions according to the debtor’s standing. As of September 30, 2008, and as a result of this transaction, a profit amounting to Ps.23.4 million was generated.
-41-
We have budgeted capital expenditures for the fiscal year ending December 31, 2011, for the following purposes and amounts:
| | | | | |
| | | (In millions of Pesos) | |
| Infrastructure of Corporate Buildings, Tower and Branches (construction, furniture, equipment, phones, etc.) | | Ps. | 226.8 | |
| Fixed Assets | | | 102.3 | |
| Organizational and IT System Development | | | 294.4 | |
| | | | |
Total | | Ps. | 623.5 | |
| | | | |
These capital expenditures will be made mainly in Argentina.
Management considers that internal funds will be sufficient to finance fiscal year 2011 capital expenditures.
Selected Statistical Information
You should read this information in conjunction with the other information provided in this annual report, including our audited consolidated financial statements and Item 5. “Operating and Financial Review and Prospects”. We prepared this information from our financial records, which are maintained under accounting methods established by the Argentine Central Bank under Argentine Banking GAAP, and do not reflect adjustments necessary to reflect the information in accordance with U.S. GAAP.
The exchange rate used in translating Pesos into US Dollars, which is used in calculating the convenience translations included in the following tables is the Reference Exchange Rate published by the Argentine Central Bank, which was Ps.3.9758, Ps.3.7967 and Ps.3.4537 per US$1.00 as of December 31, 2010, December 31, 2009 and December 31, 2008, respectively. The exchange rate translations contained in this annual report should not be construed as representations that the stated Peso amounts actually represent or have been or could be converted into US Dollars at the rates indicated or any other rate. See Item 3. “Key Information-Exchange Rate Information”.
Average Balance Sheet and Income from Interest-Earning Assets and Expenses from Interest-Bearing Liabilities
The average balances of interest-earning assets and interest-bearing liabilities, including the related interest that is receivable and payable, are calculated on a daily basis for Banco Galicia, Galicia Uruguay, Tarjetas Regionales S.A. and CFA on a consolidated basis. CFA was consolidated since the third quarter of fiscal year 2010. The average balances of interest-earning assets and interest bearing liabilities are calculated on a monthly basis for Grupo Financiero Galicia and its other non-banking subsidiaries.
Average balances have been separated between those denominated in Pesos and those denominated in Dollars. The average yield/rate is the amount of interest earned or paid during the period divided by the related average balance.
Net gains/losses on government securities and related differences in quoted market prices are included in interest earned. We manage our trading activities in government securities as an integral part of our business. We do not distinguish between interest income and market gains or losses on our government securities portfolio. The non-accrual loans balance is included in the average loan balance calculation.
-42-
The following table shows our consolidated average balances, accrued interest and nominal interest rates for interest-earning assets and interest-bearing liabilities for the fiscal year ended December 31, 2010.
| | | | | | | | | | | | | | | | | | | | | | | | | | | | | | | | | | | | | |
| | | Fiscal Year Ended December 31, 2010 (*) | |
| | | Pesos | | | Dollars | | | Total | |
| | | | | | | | | | | Average | | | | | | | | | | | Average | | | | | | | | | | | Average | |
| | | Average | | | Accrued | | | Yield/ | | | Average | | | Accrued | | | Yield/ | | | Average | | | Accrued | | | Yield/ | |
| | | Balance | | | Interest | | | Rate | | | Balance | | | Interest | | | Rate | | | Balance | | | Interest | | | Rate | |
| | | (in millions of Pesos, except rates) | |
Assets | | | | | | | | | | | | | | | | | | | | | | | | | | | | | | | | | | | | |
| Government Securities | | | 2,770.6 | | | | 567.6 | | | | 20.49 | | | | 573.5 | | | | (181.0 | ) | | | (31.56 | ) | | | 3,344.1 | | | | 386.6 | | | | 11.56 | |
| Loans | | | | | | | | | | | | | | | | | | | | | | | | | | | | | | | | | | | | |
| Private Sector | | | 14,191.4 | | | | 3,002.5 | | | | 21.16 | | | | 2,609.0 | | | | 116.1 | | | | 4.45 | | | | 16,800.4 | | | | 3,118.6 | | | | 18.56 | |
| Banco Galicia and Regional Credit Card Companies | | | 13,551.0 | | | | 2,683.1 | | | | 19.80 | | | | 2,609.0 | | | | 116.1 | | | | 4.45 | | | | 16,160.0 | | | | 2,799.2 | | | | 17.32 | |
| CFA | | | 640.4 | | | | 319.4 | | | | 49.88 | | | | — | | | | — | | | | — | | | | 640.4 | | | | 319.4 | | | | 49.88 | |
| Public Sector | | | 0.4 | | | | — | | | | 0.20 | | | | — | | | | — | | | | — | | | | 0.4 | | | | — | | | | 0.20 | |
| | | | | | | | | | | | | | | | | | | | | | | | | | | | |
Total Loans (1) | | | 14,191.8 | | | | 3,002.5 | | | | 21.16 | | | | 2,609.0 | | | | 116.1 | | | | 4.45 | | | | 16,800.8 | | | | 3,118.6 | | | | 18.56 | |
| | | | | | | | | | | | | | | | | | | | | | | | | | | | |
| Other | | | 1,571.8 | | | | 85.3 | | | | 5.43 | | | | 266.6 | | | | 3.9 | | | | 1.46 | | | | 1,838.4 | | | | 89.2 | | | | 4.85 | |
| | | | | | | | | | | | | | | | | | | | | | | | | | | | |
Total Interest-Earning Assets | | | 18,534.2 | | | | 3,655.4 | | | | 19.72 | | | | 3,449.1 | | | | (61.0 | ) | | | (1.77 | ) | | | 21,983.3 | | | | 3,594.4 | | | | 16.35 | |
| | | | | | | | | | | | | | | | | | | | | | | | | | | | |
| Cash and Gold | | | 2,084.8 | | | | — | | | | — | | | | 2,233.0 | | | | — | | | | — | | | | 4,317.8 | | | | — | | | | — | |
| Equity in Other Companies | | | 702.5 | | | | — | | | | — | | | | 147.7 | | | | — | | | | — | | | | 850.2 | | | | — | | | | — | |
| Other Assets | | | 2,735.0 | | | | — | | | | — | | | | 183.6 | | | | — | | | | — | | | | 2,918.6 | | | | — | | | | — | |
| Allowances | | | (901.1 | ) | | | — | | | | — | | | | (50.4 | ) | | | — | | | | — | | | | (951.5 | ) | | | — | | | | — | |
| | | | | | | | | | | | | | | | | | | | | | | | | | | | |
Total Assets | | | 23,155.4 | | | | — | | | | — | | | | 5,963.0 | | | | — | | | | — | | | | 29,118.4 | | | | — | | | | — | |
| | | | | | | | | | | | | | | | | | | | | | | | | | | | |
Liabilities and Equity | | | | | | | | | | | | | | | | | | | | | | | | | | | | | | | | | | | | |
| Deposits | | | | | | | | | | | | | | | | | | | | | | | | | | | | | | | | | | | | |
| Current Accounts | | | 328.1 | | | | 5.5 | | | | 1.67 | | | | 180.0 | | | | — | | | | — | | | | 508.1 | | | | 5.5 | | | | 1.08 | |
| Savings Accounts | | | 2,717.5 | | | | 7.7 | | | | 0.28 | | | | 1,298.7 | | | | — | | | | — | | | | 4,016.2 | | | | 7.7 | | | | 0.19 | |
| Time Deposits | | | 7,083.8 | | | | 741.8 | | | | 10.47 | | | | 1,470.5 | | | | 11.7 | | | | 0.79 | | | | 8,554.3 | | | | 753.5 | | | | 8.81 | |
| | | | | | | | | | | | | | | | | | | | | | | | | | | | |
| Total Interest-Bearing Deposits | | | 10,129.4 | | | | 755.0 | | | | 7.45 | | | | 2,949.2 | | | | 11.7 | | | | 0.40 | | | | 13,078.6 | | | | 766.7 | | | | 5.86 | |
| | | | | | | | | | | | | | | | | | | | | | | | | | | | |
| Argentine Central Bank | | | — | | | | — | | | | — | | | | 0.7 | | | | — | | | | — | | | | 0.7 | | | | — | | | | — | |
| Other Financial Entities | | | 335.2 | | | | 61.3 | | | | 18.29 | | | | 281.2 | | | | 7.1 | | | | 2.53 | | | | 616.4 | | | | 68.4 | | | | 11.10 | |
| Debt Securities | | | 256.7 | | | | 32.3 | | | | 12.58 | | | | 2,019.4 | | | | 196.2 | | | | 9.72 | | | | 2,276.1 | | | | 228.5 | | | | 10.04 | |
| Other | | | 147.5 | | | | 10.7 | | | | 7.25 | | | | 543.2 | | | | 18.9 | | | | 3.48 | | | | 690.7 | | | | 29.6 | | | | 4.29 | |
| | | | | | | | | | | | | | | | | | | | | | | | | | | | |
Total Interest-Bearing Liabilities | | | 10,868.8 | | | | 859.3 | | | | 7.91 | | | | 5,793.7 | | | | 233.9 | | | | 4.04 | | | | 16,662.5 | | | | 1,093.2 | | | | 6.56 | |
| | | | | | | | | | | | | | | | | | | | | | | | | | | | |
| Demand Deposits | | | 4,746.0 | | | | — | | | | — | | | | 390.7 | | | | — | | | | — | | | | 5,136.7 | | | | — | | | | — | |
| Other Liabilities | | | 3,995.8 | | | | — | | | | — | | | | 786.5 | | | | — | | | | — | | | | 4,782.3 | | | | — | | | | — | |
| Minority Interests | | | 341.9 | | | | — | | | | — | | | | — | | | | — | | | | — | | | | 341.9 | | | | — | | | | — | |
| Shareholders’ Equity | | | 2,195.0 | | | | — | | | | — | | | | — | | | | — | | | | — | | | | 2,195.0 | | | | — | | | | — | |
| | | | | | | | | | | | | | | | | | | | | | | | | | | | |
Total Liabilities and Equity | | | 22,147.5 | | | | — | | | | — | | | | 6,970.9 | | | | — | | | | — | | | | 29,118.4 | | | | — | | | | — | |
| | | | | | | | | | | | | | | | | | | | | | | | | | | | |
Spread and Net Yield | | | | | | | | | | | | | | | | | | | | | | | | | | | | | | | | | | | | |
| Interest Rate Spread | | | | | | | | | | | 11.81 | | | | | | | | | | | | (5.81 | ) | | | | | | | | | | | 9.79 | |
| Cost of Funds Supporting Interest-Earning Assets | | | | | | | | | | | 4.64 | | | | | | | | | | | | 6.78 | | | | | | | | | | | | 4.97 | |
| Net Yield on Interest-Earning Assets | | | | | | | | | | | 15.09 | | | | | | | | | | | | (8.55 | ) | | | | | | | | | | | 11.38 | |
| | | |
| (*) | | Rates include the CER adjustment. |
| |
| (1) | | Non accruing loans have been included in average loans. |
-43-
The following table shows our consolidated average balances, accrued interest and nominal interest rates for interest-earning assets and interest-bearing liabilities for the fiscal year ended December 31, 2009.
| | | | | | | | | | | | | | | | | | | | | | | | | | | | | | | | | | | | | |
| | | Fiscal Year Ended December 31, 2009 (*) | |
| | | Pesos | | | Dollars | | | Total | |
| | | | | | | | | | | Average | | | | | | | | | | | Average | | | | | | | | | | | Average | |
| | | Average | | | Accrued | | | Yield/ | | | Average | | | Accrued | | | Yield/ | | | Average | | | Accrued | | | Yield/ | |
| | | Balance | | | Interest | | | Rate | | | Balance | | | Interest | | | Rate | | | Balance | | | Interest | | | Rate | |
| | | (in millions of Pesos, except rates) | |
Assets | | | | | | | | | | | | | | | | | | | | | | | | | | | | | | | | | | | | |
| Government Securities | | | 2,500.7 | | | | 505.0 | | | | 20.19 | | | | 2,185.8 | | | | 50.1 | | | | 2.29 | | | | 4,686.5 | | | | 555.1 | | | | 11.84 | |
| Loans | | | | | | | | | | | | | | | | | | | | | | | | | | | | | | | | | | | | |
| Private Sector | | | 9,431.6 | | | | 2,049.8 | | | | 21.73 | | | | 1,912.0 | | | | 140.3 | | | | 7.34 | | | | 11,343.6 | | | | 2,190.1 | | | | 19.31 | |
| Public Sector | | | 120.0 | | | | 27.0 | | | | 22.50 | | | | — | | | | — | | | | — | | | | 120.0 | | | | 27.0 | | | | 22.50 | |
| | | | | | | | | | | | | | | | | | | | | | | | | | | | |
Total Loans(1) | | | 9,551.6 | | | | 2,076.8 | | | | 21.74 | | | | 1,912.0 | | | | 140.3 | | | | 7.34 | | | | 11,463.6 | | | | 2,217.1 | | | | 19.34 | |
| | | | | | | | | | | | | | | | | | | | | | | | | | | | |
| Other | | | 1,717.9 | | | | 111.2 | | | | 6.47 | | | | 510.0 | | | | 4.0 | | | | 0.78 | | | | 2,227.9 | | | | 115.2 | | | | 5.17 | |
| | | | | | | | | | | | | | | | | | | | | | | | | | | | |
Total Interest-Earning Assets | | | 13,770.2 | | | | 2,693.0 | | | | 19.56 | | | | 4,607.8 | | | | 194.4 | | | | 4.22 | | | | 18,378.0 | | | | 2,887.4 | | | | 15.71 | |
| | | | | | | | | | | | | | | | | | | | | | | | | | | | |
| Cash and Gold | | | 1,515.2 | | | | — | | | | — | | | | 1,913.5 | | | | — | | | | — | | | | 3,428.7 | | | | — | | | | — | |
| Equity in Other Companies | | | 843.2 | | | | — | | | | — | | | | 157.2 | | | | — | | | | — | | | | 1,000.4 | | | | — | | | | — | |
| Other Assets | | | 2,482.3 | | | | — | | | | — | | | | 162.9 | | | | — | | | | — | | | | 2,645.2 | | | | — | | | | — | |
| Allowances | | | (724.8 | ) | | | — | | | | — | | | | (42.2 | ) | | | — | | | | — | | | | (767.0 | ) | | | — | | | | — | |
| | | | | | | | | | | | | | | | | | | | | | | | | | | | |
Total Assets | | | 17,886.1 | | | | — | | | | — | | | | 6,799.2 | | | | — | | | | — | | | | 24,685.3 | | | | — | | | | — | |
| | | | | | | | | | | | | | | | | | | | | | | | | | | | |
Liabilities and Equity | | | | | | | | | | | | | | | | | | | | | | | | | | | | | | | | | | | | |
| Deposits | | | | | | | | | | | | | | | | | | | | | | | | | | | | | | | | | | | | |
| Current Accounts | | | 790.0 | | | | 12.9 | | | | 1.63 | | | | 497.3 | | | | — | | | | — | | | | 1,287.3 | | | | 12.9 | | | | 1.00 | |
| Savings Accounts | | | 1,988.4 | | | | 5.7 | | | | 0.29 | | | | 1,026.1 | | | | — | | | | — | | | | 3,014.5 | | | | 5.7 | | | | 0.19 | |
| Time Deposits | | | 6,073.9 | | | | 843.2 | | | | 13.88 | | | | 1,318.0 | | | | 19.1 | | | | 1.45 | | | | 7,391.9 | | | | 862.3 | | | | 11.67 | |
| | | | | | | | | | | | | | | | | | | | | | | | | | | | |
| Total Interest-Bearing Deposits | | | 8,852.3 | | | | 861.8 | | | | 9.74 | | | | 2,841.4 | | | | 19.1 | | | | 0.67 | | | | 11,693.7 | | | | 880.9 | | | | 7.53 | |
| | | | | | | | | | | | | | | | | | | | | | | | | | | | |
| Argentine Central Bank | | | — | | | | — | | | | — | | | | 0.6 | | | | — | | | | — | | | | 0.6 | | | | — | | | | — | |
| Other Financial Entities | | | 236.5 | | | | 44.8 | | | | 18.94 | | | | 167.9 | | | | 9.0 | | | | 5.36 | | | | 404.4 | | | | 53.8 | | | | 13.30 | |
| Debt Securities | | | 325.8 | | | | 59.7 | | | | 18.32 | | | | 2,404.1 | | | | 164.6 | | | | 6.85 | | | | 2,729.9 | | | | 224.3 | | | | 8.22 | |
| Other | | | 162.9 | | | | 12.2 | | | | 7.49 | | | | 931.9 | | | | 44.1 | | | | 4.73 | | | | 1,094.8 | | | | 56.3 | | | | 5.14 | |
| | | | | | | | | | | | | | | | | | | | | | | | | | | | |
Total Interest-Bearing Liabilities | | | 9,577.5 | | | | 978.5 | | | | 10.22 | | | | 6,345.9 | | | | 236.8 | | | | 3.73 | | | | 15,923.4 | | | | 1,215.3 | | | | 7.63 | |
| | | | | | | | | | | | | | | | | | | | | | | | | | | | |
| Demand Deposits | | | 3,058.8 | | | | — | | | | — | | | | 6.2 | | | | — | | | | — | | | | 3,065.0 | | | | — | | | | — | |
| Other Liabilities | | | 2,816.3 | | | | — | | | | — | | | | 669.5 | | | | — | | | | — | | | | 3,485.8 | | | | — | | | | — | |
| Minority Interests | | | 249.9 | | | | — | | | | — | | | | — | | | | — | | | | — | | | | 249.9 | | | | — | | | | — | |
| Shareholders’ Equity | | | 1,961.2 | | | | — | | | | — | | | | — | | | | — | | | | — | | | | 1,961.2 | | | | — | | | | — | |
| | | | | | | | | | | | | | | | | | | | | | | | | | | | |
Total Liabilities and Equity | | | 17,663.7 | | | | — | | | | — | | | | 7,021.6 | | | | — | | | | — | | | | 24,685.3 | | | | — | | | | — | |
| | | | | | | | | | | | | | | | | | | | | | | | | | | | |
Spread and Net Yield | | | | | | | | | | | | | | | | | | | | | | | | | | | | | | | | | | | | |
| Interest Rate Spread | | | | | | | | | | | 9.34 | | | | | | | | | | | | 0.49 | | | | | | | | | | | | 8.08 | |
| Cost of Funds Supporting Interest-Earning Assets | | | | | | | | | | | 7.11 | | | | | | | | | | | | 5.14 | | | | | | | | | | | | 6.61 | |
| Net Yield on Interest-Earning Assets | | | | | | | | | | | 12.45 | | | | | | | | | | | | (0.92 | ) | | | | | | | | | | | 9.10 | |
| | | |
| (*) | | Rates include the CER adjustment. |
| |
| (1) | | Non accruing loans have been included in average loans. |
-44-
The following table shows our consolidated average balances, accrued interest and nominal interest rates for interest-earning assets and interest-bearing liabilities for the fiscal year ended December 31, 2008.
| | | | | | | | | | | | | | | | | | | | | | | | | | | | | | | | | | | | | |
| | | Fiscal Year Ended December 31, 2008 (*) | |
| | | Pesos | | | Dollars | | | Total | |
| | | | | | | | | | | Average | | | | | | | | | | | Average | | | | | | | | | | | Average | |
| | | Average | | | Accrued | | | Yield/ | | | Average | | | Accrued | | | Yield/ | | | Average | | | Accrued | | | Yield/ | |
| | | Balance | | | Interest | | | Rate | | | Balance | | | Interest | | | Rate | | | Balance | | | Interest | | | Rate | |
| | | (in millions of Pesos, except rates) | |
Assets | | | | | | | | | | | | | | | | | | | | | | | | | | | | | | | | | | | | |
| Government Securities | | | 1,161.4 | | | | 72.2 | | | | 6.22 | | | | 2,480.8 | | | | 76.3 | | | | 3.08 | | | | 3,642.2 | | | | 148.5 | | | | 4.08 | |
| Loans | | | | | | | | | | | | | | | | | | | | | | | | | | | | | | | | | | | | |
| Private Sector | | | 8,848.1 | | | | 1,756.6 | | | | 19.85 | | | | 1,964.4 | | | | 132.6 | | | | 6.75 | | | | 10,812.5 | | | | 1,889.2 | | | | 17.47 | |
| Public Sector | | | 1,264.8 | | | | 165.7 | | | | 13.10 | | | | — | | | | — | | | | — | | | | 1,264.8 | | | | 165.7 | | | | 13.10 | |
| | | | | | | | | | | | | | | | | | | | | | | | | | | | |
Total Loans(1) | | | 10,112.9 | | | | 1,922.3 | | | | 19.01 | | | | 1,964.4 | | | | 132.6 | | | | 6.75 | | | | 12,077.3 | | | | 2,054.9 | | | | 17.01 | |
| | | | | | | | | | | | | | | | | | | | | | | | | | | | |
Other(2) | | | 2,908.1 | | | | 197.0 | | | | 6.77 | | | | 1,264.9 | | | | 15.2 | | | | 1.20 | | | | 4,173.0 | | | | 212.2 | | | | 5.09 | |
| | | | | | | | | | | | | | | | | | | | | | | | | | | | |
Total Interest-Earning Assets | | | 14,182.4 | | | | 2,191.5 | | | | 15.45 | | | | 5,710.1 | | | | 224.1 | | | | 3.92 | | | | 19,892.5 | | | | 2,415.6 | | | | 12.14 | |
| | | | | | | | | | | | | | | | | | | | | | | | | | | | |
| Cash and Gold | | | 599.2 | | | | — | | | | — | | | | 287.9 | | | | — | | | | — | | | | 887.1 | | | | — | | | | — | |
| Equity in Other Companies | | | 708.4 | | | | — | | | | — | | | | 63.8 | | | | — | | | | — | | | | 772.2 | | | | — | | | | — | |
| Other Assets | | | 2,211.6 | | | | — | | | | — | | | | 218.2 | | | | — | | | | — | | | | 2,429.8 | | | | — | | | | — | |
| Allowances | | | (479.1 | ) | | | — | | | | — | | | | (90.0 | ) | | | — | | | | — | | | | (569.1 | ) | | | — | | | | — | |
| | | | | | | | | | | | | | | | | | | | | | | | | | | | |
Total Assets | | | 17,222.5 | | | | — | | | | — | | | | 6,190.0 | | | | — | | | | — | | | | 23,412.5 | | | | — | | | | — | |
| | | | | | | | | | | | | | | | | | | | | | | | | | | | |
Liabilities and Equity | | | | | | | | | | | | | | | | | | | | | | | | | | | | | | | | | | | | |
| Deposits | | | | | | | | | | | | | | | | | | | | | | | | | | | | | | | | | | | | |
| Current Accounts | | | 697.7 | | | | 21.6 | | | | 3.10 | | | | 250.4 | | | | — | | | | — | | | | 948.1 | | | | 21.6 | | | | 2.28 | |
| Savings Accounts | | | 1,849.3 | | | | 4.7 | | | | 0.25 | | | | 738.4 | | | | — | | | | — | | | | 2,587.7 | | | | 4.7 | | | | 0.18 | |
| Time Deposits | | | 5,797.6 | | | | 749.9 | | | | 12.93 | | | | 971.8 | | | | 17.8 | | | | 1.83 | | | | 6,769.4 | | | | 767.7 | | | | 11.34 | |
| | | | | | | | | | | | | | | | | | | | | | | | | | | | |
| Total Interest-Bearing Deposits | | | 8,344.6 | | | | 776.2 | | | | 9.30 | | | | 1,960.6 | | | | 17.8 | | | | 0.91 | | | | 10,305.2 | | | | 794.0 | | | | 7.70 | |
| | | | | | | | | | | | | | | | | | | | | | | | | | | | |
| Argentine Central Bank | | | — | | | | — | | | | — | | | | 0.4 | | | | — | | | | — | | | | 0.4 | | | | — | | | | — | |
| Other Financial Entities | | | 297.7 | | | | 53.8 | | | | 18.07 | | | | 797.5 | | | | 39.3 | | | | 4.93 | | | | 1,095.2 | | | | 93.1 | | | | 8.50 | |
| Debt Securities | | | 487.3 | | | | 70.5 | | | | 14.47 | | | | 2,312.5 | | | | 209.6 | | | | 9.06 | | | | 2,799.8 | | | | 280.1 | | | | 10.00 | |
| Other | | | 224.9 | | | | 21.6 | | | | 9.60 | | | | 1,269.0 | | | | 88.9 | | | | 7.01 | | | | 1,493.9 | | | | 110.5 | | | | 7.40 | |
| | | | | | | | | | | | | | | | | | | | | | | | | | | | |
Total Interest-Bearing Liabilities | | | 9,354.5 | | | | 922.1 | | | | 9.86 | | | | 6,340.0 | | | | 355.6 | | | | 5.61 | | | | 15,694.5 | | | | 1,277.7 | | | | 8.14 | |
| | | | | | | | | | | | | | | | | | | | | | | | | | | | |
| Demand Deposits | | | 2,873.6 | | | | — | | | | — | | | | 12.4 | | | | — | | | | — | | | | 2,886.0 | | | | — | | | | — | |
| Other Liabilities | | | 2,313.1 | | | | — | | | | — | | | | 559.5 | | | | — | | | | — | | | | 2,872.6 | | | | — | | | | — | |
| Minority Interests | | | 214.4 | | | | — | | | | — | | | | — | | | | — | | | | — | | | | 214.4 | | | | — | | | | — | |
| Shareholders’ Equity | | | 1,745.0 | | | | — | | | | — | | | | — | | | | — | | | | — | | | | 1,745.0 | | | | — | | | | — | |
| | | | | | | | | | | | | | | | | | | | | | | | | | | | |
Total Liabilities and Equity | | | 16,500.6 | | | | — | | | | — | | | | 6,911.9 | | | | — | | | | — | | | | 23,412.5 | | | | — | | | | — | |
| | | | | | | | | | | | | | | | | | | | | | | | | | | | |
Spread and Net Yield | | | | | | | | | | | | | | | | | | | | | | | | | | | | | | | | | | | | |
| Interest Rate Spread | | | | | | | | | | | 5.59 | | | | | | | | | | | | (1.69 | ) | | | | | | | | | | | 4.00 | |
| Cost of Funds Supporting Interest-Earning Assets | | | | | | | | | | | 6.50 | | | | | | | | | | | | 6.23 | | | | | | | | | | | | 6.42 | |
| Net Yield on Interest-Earning Assets | | | | | | | | | | | 8.95 | | | | | | | | | | | | (2.30 | ) | | | | | | | | | | | 5.72 | |
| | | |
| (*) | | Rates include the CER adjustment. |
| |
| (1) | | Non accruing loans have been included in average loans. (2) Includes, among other amounts, the amounts corresponding to the Compensatory Bond and the Hedge Bond to be received. |
-45-
Changes in Net Interest Income-Volume and Rate Analysis
The following table allocates, by currency of the underlying asset or liability, changes in our consolidated interest income and interest expenses between changes in the average volume of interest-earning assets and interest-bearing liabilities and changes in their respective average yield/rate for (i) the fiscal year ended December 31, 2010 compared with the fiscal year ended December 31, 2009; and (ii) the fiscal year ended December 31, 2009, compared with the fiscal year ended December 31, 2008. Differences related to rate and volume are allocated proportionally to the rate variance and the volume variance, respectively.
| | | | | | | | | | | | | | | | | | | | | | | | | |
| | | Fiscal Year 2010/ Fiscal Year 2009, Increase | | | Fiscal Year 2009/ Fiscal Year 2008, Increase | |
| | | (Decrease) due to changes in | | | (Decrease) due to changes in | |
| | | Volume | | | Rate | | | Net Change | | | Volume | | | Rate | | | Net Change | |
| | | (in millions of Pesos) | |
Interest Earning Assets | | | | | | | | | | | | | | | | | | | | | | | | |
| Government Securities | | | | | | | | | | | | | | | | | | | | | | | | |
| Pesos | | | 55.2 | | | | 7.4 | | | | 62.6 | | | | 146.6 | | | | 286.2 | | | | 432.8 | |
| Dollars | | | (11.0 | ) | | | (220.1 | ) | | | (231.1 | ) | | | (8.4 | ) | | | (17.8 | ) | | | (26.2 | ) |
| | | | | | | | | | | | | | | | | | | |
| Total | | | 44.2 | | | | (212.7 | ) | | | (168.5 | ) | | | 138.2 | | | | 268.4 | | | | 406.6 | |
| Loans | | | | | | | | | | | | | | | | | | | | | | | | |
| Private Sector | | | | | | | | | | | | | | | | | | | | | | | | |
| Banco Galicia and Regional Credit Card Companies | | | | | | | | | | | | | | | | | | | | | | | | |
| Pesos | | | 795.3 | | | | (162.0 | ) | | | 633.3 | | | | 120.4 | | | | 172.8 | | | | 293.2 | |
| Dollars | | | 303.1 | | | | (327.3 | ) | | | (24.2 | ) | | | (3.4 | ) | | | 11.1 | | | | 7.7 | |
| | | | | | | | | | | | | | | | | | | |
| Total | | | 1,098.4 | | | | (489.3 | ) | | | 609.1 | | | | 117.0 | | | | 183.9 | | | | 300.9 | |
| CFA | | | | | | | | | | | | | | | | | | | | | | | | |
| Pesos | | | 319.4 | | | | (*) | | | | 319.4 | | | | — | | | | — | | | | — | |
| Dollars | | | — | | | | — | | | | — | | | | — | | | | — | | | | — | |
| | | | | | | | | | | | | | | | | | | |
| Total | | | 319.4 | | | | — | | | | 319.4 | | | | — | | | | — | | | | — | |
| Public Sector | | | | | | | | | | | | | | | | | | | | | | | | |
| Pesos | | | (14.1 | ) | | | (12.9 | ) | | | (27.0 | ) | | | (668.4 | ) | | | 529.7 | | | | (138.7 | ) |
| Dollars | | | — | | | | — | | | | — | | | | — | | | | — | | | | — | |
| | | | | | | | | | | | | | | | | | | |
| Total | | | (14.1 | ) | | | (12.9 | ) | | | (27.0 | ) | | | (668.4 | ) | | | 529.7 | | | | (138.7 | ) |
| Other | | | | | | | | | | | | | | | | | | | | | | | | |
| Pesos | | | (8.9 | ) | | | (17.0 | ) | | | (25.9 | ) | | | (77.4 | ) | | | (8.4 | ) | | | (85.8 | ) |
| Dollars | | | 0.1 | | | | (0.2 | ) | | | (0.1 | ) | | | (7.0 | ) | | | (4.2 | ) | | | (11.2 | ) |
| | | | | | | | | | | | | | | | | | | |
| Total | | | (8.8 | ) | | | (17.2 | ) | | | (26.0 | ) | | | (84.4 | ) | | | (12.6 | ) | | | (97.0 | ) |
Total Interest-Earning Assets | | | | | | | | | | | | | | | | | | | | | | | | |
| Pesos | | | 1,146.9 | | | | (184.5 | ) | | | 962.4 | | | | (478.8 | ) | | | 980.3 | | | | 501.5 | |
| Dollars | | | 292.2 | | | | (547.6 | ) | | | (255.4 | ) | | | (18.8 | ) | | | (10.9 | ) | | | (29.7 | ) |
| | | | | | | | | | | | | | | | | | | |
Total | | | 1,439.1 | | | | (732.1 | ) | | | 707.0 | | | | (497.6 | ) | | | 969.4 | | | | 471.8 | |
| | | | | | | | | | | | | | | | | | | |
Interest Bearing Liabilities | | | | | | | | | | | | | | | | | | | | | | | | |
| Demand Account | | | | | | | | | | | | | | | | | | | | | | | | |
| Pesos | | | (7.7 | ) | | | 0.3 | | | | (7.4 | ) | | | 3.4 | | | | (12.1 | ) | | | (8.7 | ) |
| Dollars | | | — | | | | — | | | | — | | | | — | | | | — | | | | — | |
| | | | | | | | | | | | | | | | | | | |
| Total | | | (7.7 | ) | | | 0.3 | | | | (7.4 | ) | | | 3.4 | | | | (12.1 | ) | | | (8.7 | ) |
| Savings Account | | | | | | | | | | | | | | | | | | | | | | | | |
| Pesos | | | 2.0 | | | | — | | | | 2.0 | | | | 0.4 | | | | 0.6 | | | | 1.0 | |
| Dollars | | | — | | | | — | | | | — | | | | — | | | | — | | | | — | |
| | | | | | | | | | | | | | | | | | | |
| Total | | | 2.0 | | | | — | | | | 2.0 | | | | 0.4 | | | | 0.6 | | | | 1.0 | |
| Time Deposits | | | | | | | | | | | | | | | | | | | | | | | | |
| Pesos | | | 212.3 | | | | (313.7 | ) | | | (101.4 | ) | | | 36.8 | | | | 56.5 | | | | 93.3 | |
| Dollars | | | 2.6 | | | | (10.0 | ) | | | (7.4 | ) | | | 3.2 | | | | (1.9 | ) | | | 1.3 | |
| | | | | | | | | | | | | | | | | | | |
| Total | | | 214.9 | | | | (323.7 | ) | | | (108.8 | ) | | | 40.0 | | | | 54.6 | | | | 94.6 | |
| With Other Financial Entities | | | | | | | | | | | | | | | | | | | | | | | | |
| Pesos | | | 18.0 | | | | (1.5 | ) | | | 16.5 | | | | (11.8 | ) | | | 2.8 | | | | (9.0 | ) |
| Dollars | | | 4.2 | | | | (6.1 | ) | | | (1.9 | ) | | | (33.9 | ) | | | 3.6 | | | | (30.3 | ) |
| | | | | | | | | | | | | | | | | | | |
| Total | | | 22.2 | | | | (7.6 | ) | | | 14.6 | | | | (45.7 | ) | | | 6.4 | | | | (39.3 | ) |
| Negotiable Obligations | | | | | | | | | | | | | | | | | | | | | | | | |
| Pesos | | | (11.1 | ) | | | (16.3 | ) | | | (27.4 | ) | | | (55.5 | ) | | | 44.7 | | | | (10.8 | ) |
| Dollars | | | (19.5 | ) | | | 51.1 | | | | 31.6 | | | | 8.7 | | | | (53.7 | ) | | | (45.0 | ) |
| | | | | | | | | | | | | | | | | | | |
| Total | | | (30.6 | ) | | | 34.8 | | | | 4.2 | | | | (46.8 | ) | | | (9.0 | ) | | | (55.8 | ) |
| Other liabilities | | | | | | | | | | | | | | | | | | | | | | | | |
| Pesos | | | (1.1 | ) | | | (0.4 | ) | | | (1.5 | ) | | | (5.2 | ) | | | (4.2 | ) | | | (9.4 | ) |
| Dollars | | | (15.4 | ) | | | (9.8 | ) | | | (25.2 | ) | | | (20.2 | ) | | | (24.6 | ) | | | (44.8 | ) |
| | | | | | | | | | | | | | | | | | | |
| Total | | | (16.5 | ) | | | (10.2 | ) | | | (26.7 | ) | | | (25.4 | ) | | | (28.8 | ) | | | (54.2 | ) |
Total Interest Bearing Liabilities | | | | | | | | | | | | | | | | | | | | | | | | |
| Pesos | | | 212.4 | | | | (331.6 | ) | | | (119.2 | ) | | | (31.9 | ) | | | 88.3 | | | | 56.4 | |
| Dollars | | | (28.1 | ) | | | 25.2 | | | | (2.9 | ) | | | (42.2 | ) | | | (76.6 | ) | | | (118.8 | ) |
Total | | | 184.3 | | | | (306.4 | ) | | | (122.1 | ) | | | (74.1 | ) | | | 11.7 | | | | (62.4 | ) |
| | | | | | | | | | | | | | | | | | | |
| | | |
| (*) | | Regarding CFA’s loans and comparative disclosures for the year ended December 31, 2010, the information related to changes in volumes and rates is not presented, due to the fact that average balances or interest amounts did not exist for these activities for the above-mentioned periods in 2009. CFA’s loans were included in 2010 information since its acquisition in June 2010. |
The increase of Ps.707.0 million in interest income for the fiscal year ended December 31, 2010, as compared to the previous year, is explained by the Ps.1,439.1 million benefit from the increase in total interest-earning assets, partially offset by the Ps.732.1 million decrease in interest rates.
In particular, the Ps.962.4 million benefit from Peso-denominated assets was mainly due to the increase in the volume of loans to the private sector, while the decrease from Dollar-denominated assets reflects the decline in the interest rate payable on government securities, primarily as a consequence of the establishment of a valuation allowance on the Government bonds denominated in Dollars at a Libor interest rate, due in 2012 (“Boden 2012 Bonds”), equivalent to the estimated difference between the book value and the realizable value that we consider reasonable. During the fiscal year ended December 31, 2010, these securities were sold.
In terms of interest expenses, the Ps.122.1 million decrease was mainly due to the increase in the volume of time deposits, partially offset by the reduction in interest rates.
-46-
Interest-Earning Assets-Net Yield on Interest-Earning Assets
The following table analyzes, by currency of denomination, the levels of our average interest-earning assets and net interest earned, and illustrates the net yields and spreads obtained, for each of the periods indicated.
| | | | | | | | | | | | | |
| | | Fiscal Year Ended December 31, | |
| | | 2010 | | | 2009 | | | 2008 | |
| | | (in millions of Pesos, except percentages) | |
Total Average Interest-Earning Assets | | | | | | | | | | | | |
| Pesos | | | 18,534.2 | | | | 13,770.2 | | | | 14,182.4 | |
| Dollars | | | 3,449.1 | | | | 4,607.8 | | | | 5,710.1 | |
| | | | | | | | | | |
Total | | | 21,983.3 | | | | 18,378.0 | | | | 19,892.5 | |
| | | | | | | | | | |
Net Interest Earned(1) | | | | | | | | | | | | |
| Pesos | | | 2,796.1 | | | | 1,714.5 | | | | 1,269.4 | |
| Dollars | | | (294.9 | ) | | | (42.4 | ) | | | (131.5 | ) |
| | | | | | | | | | |
Total | | | 2,501.2 | | | | 1,672.1 | | | | 1,137.9 | |
| | | | | | | | | | |
Net Yield on Interest-Earning Assets(2)(%) | | | | | | | | | | | | |
| Pesos | | | 15.09 | | | | 12.45 | | | | 8.95 | |
| Dollars | | | (8.55 | ) | | | (0.92 | ) | | | (2.30 | ) |
| | | | | | | | | | |
Weighted-Average Yield | | | 11.38 | | | | 9.10 | | | | 5.72 | |
| | | | | | | | | | |
Interest Spread, Nominal Basis(3)(%) | | | | | | | | | | | | |
| Pesos | | | 11.81 | | | | 9.34 | | | | 5.59 | |
| Dollars | | | (5.81 | ) | | | 0.49 | | | | (1.69 | ) |
| | | | | | | | | | |
Weighted-Average Yield | | | 9.79 | | | | 8.08 | | | | 4.00 | |
| | | | | | | | | | |
Credit Related Fees Included in Net Interest Earned | | | | | | | | | | | | |
| Pesos | | | 109.5 | | | | 84.2 | | | | 69.9 | |
| Dollars | | | — | | | | — | | | | — | |
| | | | | | | | | | |
Total | | | 109.5 | | | | 84.2 | | | | 69.9 | |
| | | | | | | | | | |
| | | |
| (1) | | Net interest earned corresponds to the net financial income (“Financial Income” minus “Financial Expenses”, as setforth in the Income Statement), plus (i) financial fees included in “Income from Services — In Relation to Lending Transactions” in the Income Statement,(ii) contributions to the Deposits Insurance Fund included in the item with the same denomination that is part of the “Financial Expenses” caption in the Income Statement, and (iii) contributions and taxes on financial income included in the Income Statement under “Financial Expenses — Others”; minus (i) net income from corporate securities, included under “Financial Income/Expenses — Interest Income and Gains/Losses from Holdings of Government and Corporate Securities”, in the Income Statement,(ii) differences in quotation of gold and foreign currency included in the item with the same denomination that is part of the Financial Expenses/Income caption in the Income Statement, and (iii) the premiums and adjustments on forward transactions in foreign currency, included in the item “Financial Income-Others” in the Income Statement. Net interest earned also includes income from government securities used as security margins in repurchase agreement transactions. This income/loss is included in “Miscellaneous Income/Loss — Others” in the Income Statement. Net income from government securities includes both interest and gains/losses due to the variation of market quotations. |
| |
| (2) | | Net interest earned, divided by average interest-earning assets. |
| |
| (3) | | Interest spread, nominal basis is the difference between the average nominal interest rate on interest-earning assets and the average nominal interest rate on interest-bearing deposits. |
-47-
Government and Corporate Securities
The following table shows our holdings of government and corporate securities at the balance sheet dates stated below, and the breakdown of the portfolio in accordance with the Argentine Central Bank classification system and by the currency of denomination of the relevant securities. Our holdings of government securities represent mainly holdings of Banco Galicia.
| | | | | | | | | | | | | |
| | | Fiscal Year Ended December 31, | |
| | | 2010 | | | 2009 | | | 2008 | |
| | | (in millions of Pesos) | |
Government Securities | | | | | | | | | | | | |
Pesos | | | | | | | | | | | | |
Investment | | | 133.7 | | | | 43.3 | | | | 22.8 | |
| Issued by Argentine Central Bank — Lebac and Nobac | | | — | | | | 43.3 | | | | 22.8 | |
| Bonar Bonds | | | 133.7 | | | | — | | | | — | |
Trading | | | 38.4 | | | | 100.7 | | | | 233.7 | |
| Bonar Bonds | | | 13.3 | | | | 42.7 | | | | — | |
| Bogar Bonds | | | — | | | | — | | | | 1.6 | |
| Others | | | 25.1 | | | | 58.0 | | | | 232.1 | |
Issued by Argentine Central Bank | | | 2,065.7 | | | | 1,615.1 | | | | 550.2 | |
| Lebac Unquoted | | | 257.5 | | | | 934.6 | | | | — | |
| Lebac Quoted | | | 359.1 | | | | 633.9 | | | | — | |
| Nobac Unquoted | | | 1,265.0 | | | | 29.5 | | | | 520.2 | |
| Nobac Quoted | | | 3.9 | | | | 17.1 | | | | 30.0 | |
| Lebac Repurchase Agreement Transactions | | | 180.2 | | | | — | | | | — | |
Without Quotation | | | — | | | | 945.7 | | | | 69.8 | |
| Bonar Bonds | | | — | | | | 323.7 | | | | — | |
| Discount Bonds in Pesos | | | — | | | | 622.0 | | | | 69.8 | |
| | | | | | | | | | |
Total Government Securities in Pesos | | | 2,237.8 | | | | 2,704.8 | | | | 876.5 | |
| | | | | | | | | | |
Dollars | | | | | | | | | | | | |
Investment | | | — | | | | — | | | | 527.4 | |
| Boden 2012 Bonds | | | — | | | | — | | | | 525.9 | |
| Boden 2013 Bonds | | | — | | | | — | | | | 1.5 | |
Trading | | | 29.9 | | | | 13.5 | | | | 0.4 | |
| Boden 2012 Bonds | | | — | | | | — | | | | — | |
| Others | | | 29.9 | | | | 13.5 | | | | 0.4 | |
Government Securities for Repurchase Agreement Transactions with the Argentinte Central Bank | | | — | | | | 152.7 | | | | 127.5 | |
| Boden 2013 — 2015 Bonds | | | — | | | | — | | | | 127.5 | |
| Bonar Bonds | | | — | | | | 152.7 | | | | — | |
Without Quotation | | | — | | | | 1,036.2 | | | | — | |
| Boden 2012 Bonds | | | — | | | | 1,032.4 | | | | — | |
| Others | | | — | | | | 3.8 | | | | — | |
| | | | | | | | | | |
Total Government Securities in Dollars | | | 29.9 | | | | 1,202.4 | | | | 655.3 | |
| | | | | | | | | | |
Total Government Securities | | | 2,267.7 | | | | 3,907.2 | | | | 1,531.8 | |
| | | | | | | | | | |
Corporate Securities | | | 10.3 | | | | 13.2 | | | | 0.1 | |
| Corporate Equity Securities (Quoted) in Pesos | | | 10.3 | | | | 0.1 | | | | 0.1 | |
| Corporate Equity Securities (Quoted) in Dollars | | | — | | | | 13.1 | | | | — | |
| | | | | | | | | | |
Total Government and Corporate Securities | | | 2,278.0 | | | | 3,920.4 | | | | 1,531.9 | |
The decrease in our holdings of government securities in 2010 can mainly be attributed to the sale of Boden 2012 Bonds, bonds issued by the Government due in 2015 (“Bonar 2015 Bonds”), Government discount bonds (“Discount Bonds”) and Argentine GDP-linked negotiable securities (“GDP-Linked Negotiable Securities”). The investment portfolio in Pesos reflects Banco Galicia’s holdings of Bonar 2015 Bonds for Ps.133.7 million.
The increase in Banco Galicia’s holdings of government securities in 2009 mainly reflects an increase in its “without quotation” holdings of Boden 2012 Bonds, Bonar 2015 Bonds and Discount Bonds (Ps.1,912.1 million), and in its holdings of notes issued by the Argentine Central Bank (Ps.1,064.9 million). It also includes a decrease in investment securities (Ps.527.4 million).
The increase of Bonar Bonds was due to the swap made by Banco Galicia in which it exchanged Government bonds in Pesos at 2%, due in 2014 (“Boden 2014 Bonds”) with a face value of Ps.683.6 million (recorded in Banco Galicia’s books in February 2009, within the scope of an exchange transaction of national secured loans at market price) for Bonar 2015 Bonds with a face value of Ps.912.7 million.
All government securities, except for the Lebac and Nobac, which are issued by the Argentine Central Bank, were issued by the Government.
-48-
Government Securities — Net Position
The following table shows our net position in government and corporate securities at the balance sheet date, and the breakdown of the portfolio in accordance with the Argentine Central Bank classification system and by the securities’ currency of denomination. The net position is defined as holdings plus forward purchases and spot purchases pending settlement, minus forward sales and spot sales pending settlement.
| | | | | | | | | | | | | | | | | | | | | | | | | |
| | | As of December 31, 2010 | |
| | | | | | | | | | | | | | | Spot | | | Spot | | | | |
| | | | | | | Forward | | | Forward | | | purchases | | | sales | | | Net | |
| | | Holdings | | | Purchases | | | Sales | | | to be settled | | | to be settled | | | Position | |
| | | (in millions of Pesos) | |
Government Securities | | | | | | | | | | | | | | | | | | | | | | | | |
Investment Portfolio | | | | | | | | | | | | | | | | | | | | | | | | |
| Pesos | | | 133.7 | | | | 508.4 | | | | — | | | | — | | | | — | | | | 642.1 | |
Trading or Financial Brokerage Portfolio | | | | | | | | | | | | | | | | | | | | | | | | |
| Pesos | | | 38.4 | | | | — | | | | — | | | | 0.2 | | | | 7.7 | | | | 30.9 | |
| Dollars | | | 29.9 | | | | — | | | | — | | | | 11.8 | | | | 14.4 | | | | 27.3 | |
Securities issued by the Argentine Central Bank | | | | | | | | | | | | | | | | | | | | | | | | |
| Pesos | | | 2,065.7 | | | | 399.4 | | | | 180.2 | | | | 32.2 | | | | 24.0 | | | | 2,293.1 | |
| Dollars | | | — | | | | — | | | | — | | | | — | | | | — | | | | — | |
| Other Provided as Collateral | | | — | | | | 118.3 | | | | — | | | | — | | | | — | | | | 118.3 | |
Total Government Securities | | | 2,267.7 | | | | 1,026.1 | | | | 180.2 | | | | 44.2 | | | | 46.1 | | | | 3,111.7 | |
| | | | | | | | | | | | | | | | | | | |
Corporate Equity Securities (Quoted) | | | 10.3 | | | | — | | | | — | | | | — | | | | — | | | | 10.3 | |
| | | | | | | | | | | | | | | | | | | |
Total Government and Corporate Securities | | | 2,278.0 | | | | 1,026.1 | | | | 180.2 | | | | 44.2 | | | | 46.1 | | | | 3,122.0 | |
| | | | | | | | | | | | | | | | | | | |
The net position of government securities as of December 31, 2010 amounted to Ps.3,111.7 million.
The investment portfolio in Pesos reflects the holding of Bonar 2015 Bonds. The net position of trading securities in Pesos mainly corresponds to bonds issued by Argentina (Bonar Bonds, Discount Bonds and Boden Bonds).
During the fiscal year ended December 31, 2010, Banco Galicia sold its holdings recorded under “Government Securities without Quotation,” which corresponded to Government discount bonds (“Discount Bonds”) in Pesos and GDP-Linked Negotiable Securities, Bonar 2015 Bonds and Boden 2012 Bonds.
The securities issued by the Argentine Central Bank in Pesos consist of Argentine Central Bank Bills (“Lebac”) and Nobac totaling Ps.2,465.1 million, as of December 31, 2010.
Remaining Maturity and Weighted-Average Yield
The following table analyzes the remaining maturity and weighted-average yield of our holdings of investment and trading government and corporate securities as of December 31, 2010. Our government securities portfolio yields do not contain any tax equivalency adjustments.
Maturity Yield
| | | | | | | | | | | | | | | | | | | | | | | | | | | | | | | | | | | | | |
| | | | | | | | | | | | | | | Maturing after 1 | | | Maturing after 5 | | | | |
| | | | | | | Maturing | | | year but within | | | years but within | | | Maturing | |
| | | Total | | | within 1 year | | | 5 years | | | 10 years | | | after 10 years | |
| | | Book | | | Book | | | | | | | Book | | | | | | | Book | | | | | | | Book | | | | |
| | | Value | | | Value | | | Yield(1) | | | Value | | | Yield(1) | | | Value | | | Yield(1) | | | Value | | | Yield(1) | |
| | | (in millions of Pesos, except percentages) | |
Government Securities | | | | | | | | | | | | | | | | | | | | | | | | | | | | | | | | | | | | |
Held for Trading and Brokerage | | | | | | | | | | | | | | | | | | | | | | | | | | | | | | | | | | | | |
Purposes (carried at market value) | | | | | | | | | | | | | | | | | | | | | | | | | | | | | | | | | | | | |
| Pesos | | | 38.4 | | | | 2.0 | | | | 6.7 | % | | | 27.5 | | | | 10.1 | % | | | 1.0 | | | | 11.4 | % | | | 7.9 | | | | 10.8 | % |
| Dollars | | | 29.9 | | | | 5.6 | | | | 3.1 | % | | | 24.3 | | | | 4.3 | % | | | — | | | | — | | | | — | | | | 10.1 | % |
Held for Investment (carried at amortized cost) | | | | | | | | | | | | | | | | | | | | | | | | | | | | | | | | | | | | |
| Pesos | | | 133.7 | | | | — | | | | 17.3 | % | | | 133.7 | | | | 17.3 | % | | | — | | | | — | | | | — | | | | — | |
Instruments Issued by the Argentine Central Bank | | | | | | | | | | | | | | | | | | | | | | | | | | | | | | | | | | | | |
| Pesos | | | 2,065.7 | | | | 2,065.7 | | | | 10.5 | % | | | — | | | | — | | | | — | | | | — | | | | — | | | | — | |
Securities Without Quotation | | | | | | | | | | | | | | | | | | | | | | | | | | | | | | | | | | | | |
| Pesos | | | — | | | | — | | | | — | | | | — | | | | — | | | | — | | | | — | | | | — | | | | — | |
| Dollars | | | — | | | | — | | | | — | | | | — | | | | — | | | | — | | | | — | | | | — | | | | — | |
| | | | | | | | | | | | | | | | | | | | | | | | | | | | |
Total Government Securities | | | 2,267.7 | | | | 2,073.3 | | | | 10.5 | % | | | 185.5 | | | | 14.5 | % | | | 1.0 | | | | 10.4 | % | | | 7.9 | | | | 10.8 | % |
| | | | | | | | | | | | | | | | | | | | | | | | | | | | |
Corporate Debt Securities | | | 10.3 | | | | 10.3 | | | | 8.0 | % | | | — | | | | — | | | | — | | | | — | | | | — | | | | — | |
| | | | | | | | | | | | | | | | | | | | | | | | | | | | |
Total Portfolio | | | 2,278.0 | | | | 2,083.6 | | | | 10.5 | % | | | 185.5 | | | | 14.5 | % | | | 1.0 | | | | 10.4 | % | | | 7.9 | | | | 10.8 | % |
| | | | | | | | | | | | | | | | | | | | | | | | | | | | |
| | | |
| (1) | | Effective yield based on December 31, 2010 quoted market values. |
-49-
As of December 31, 2010, we had the following investments in securities of issuers that exceeded 10% of our shareholders’ equity.
December 31, 2010
| | | | | | | | | | | |
| In millions of Pesos | | Issuer | | Book Value | | | Market Value | |
| Securities issued by the Argentine Central Bank | | Argentine Central Bank | | | 2,411.4 | | | | 2,405.6 | |
| | | | | | | | | |
Total | | | | | 2,411.4 | | | | 2,405.6 | |
| | | | | | | | | |
Loan Portfolio
Our total loans reflect Banco Galicia’s, the Regional Credit Card Companies’ and the CFA’s loan portfolios including past due principal amounts. Personal loans and credit-card loans are typically loans to individuals granted by Banco Galicia or the Regional Credit Card Companies. The Regional Credit Card Companies’ loans are included under “Credit card loans”. Also, certain amounts related to advances, promissory notes, mortgage loans and pledge loans are extended to individuals. However, advances and promissory notes mostly represent loans to companies. The following table analyzes our loan portfolio, i.e., Banco Galicia’s loan portfolio consolidated with the Regional Credit Card Companies’ and the CFA’s loan portfolio, by type of loan and total loans with guarantees.
| | | | | | | | | | | | | | | | | | | | | |
| | | As of December 31, | |
| | | 2010 | | | 2009 | | | 2008 | | | 2007 | | | 2006 | |
| | | (in millions of Pesos) | |
| Principal and Interest | | | | | | | | | | | | | | | | | | | | |
| Non-Financial Public Sector | | | 3.2 | | | | 5.0 | | | | 1,319.6 | | | | 1,210.5 | | | | 2,690.6 | |
| Local Financial Sector | | | 80.6 | | | | 25.4 | | | | 148.1 | | | | 110.0 | | | | 311.6 | |
Non-Financial Private Sector and Residents Abroad(1) | | | | | | | | | | | | | | | | | | | | |
| Advances | | | 979.2 | | | | 630.1 | | | | 594.4 | | | | 792.1 | | | | 346.3 | |
| Promissory Notes | | | 4,534.3 | | | | 3,205.4 | | | | 2,116.3 | | | | 2,911.2 | | | | 2,143.7 | |
| Mortgage Loans | | | 950.2 | | | | 964.3 | | | | 1,026.8 | | | | 945.1 | | | | 688.0 | |
| Pledge Loans | | | 119.2 | | | | 64.8 | | | | 81.0 | | | | 94.5 | | | | 67.1 | |
Personal Loans(2) | | | 4,093.6 | | | | 1,724.4 | | | | 1,217.6 | | | | 977.9 | | | | 563.2 | |
| Credit Card Loans | | | 9,120.1 | | | | 5,691.3 | | | | 4,378.4 | | | | 3,630.1 | | | | 2,458.6 | |
| Placements in Banks Abroad | | | 215.3 | | | | 440.7 | | | | 334.5 | | | | 158.0 | | | | 608.0 | |
| Other Loans | | | 2,081.2 | | | | 1,387.9 | | | | 883.3 | | | | 1,010.8 | | | | 794.8 | |
| Accrued Interest, Adjustment and Quotation Differences Receivable | | | 277.1 | | | | 178.8 | | | | 185.8 | | | | 177.0 | | | | 155.0 | |
| Documented Interest | | | (81.8 | ) | | | (54.2 | ) | | | (38.5 | ) | | | (42.5 | ) | | | (23.3 | ) |
| | | | | | | | | | | | | | | | |
| Total Non-Financial Private-Sector and Residents Abroad | | | 22,288.4 | | | | 14,233.5 | | | | 10,779.6 | | | | 10,654.2 | | | | 7,801.4 | |
| | | | | | | | | | | | | | | | |
Total Gross Loans | | | 22,372.2 | | | | 14,263.9 | | | | 12,247.3 | | | | 11,974.7 | | | | 10,803.6 | |
| | | | | | | | | | | | | | | | |
| Allowance for Loan Losses | | | (1,038.5 | ) | | | (806.4 | ) | | | (526.8 | ) | | | (428.6 | ) | | | (327.0 | ) |
| | | | | | | | | | | | | | | | |
Total Loans | | | 21,333.7 | | | | 13,457.5 | | | | 11,720.5 | | | | 11,546.1 | | | | 10,476.6 | |
| | | | | | | | | | | | | | | | |
| Loans with Guarantees | | | | | | | | | | | | | | | | | | | | |
With Preferred Guarantees(3) | | | 1,257.1 | | | | 1,142.2 | | | | 1,332.8 | | | | 1,289.8 | | | | 1,076.2 | |
| Other Guarantees | | | 3,694.5 | | | | 2,453.9 | | | | 2,971.1 | | | | 3,180.2 | | | | 4,103.6 | |
| | | | | | | | | | | | | | | | |
Total Loans with Guarantees | | | 4,951.6 | | | | 3,596.1 | | | | 4,303.9 | | | | 4,470.0 | | | | 5,179.8 | |
| | | | | | | | | | | | | | | | |
| | | |
| (1) | | Categories of loans include: |
| | • | | Advances: short-term obligations drawn on by customers through overdrafts. |
-50-
| | • | | Promissory Notes: endorsed promissory notes, negotiable obligations and other promises to pay signed by one borrower or group of borrowers and factored loans. |
| |
| | • | | Mortgage Loans: loans granted to purchase or improve real estate and collateralized by such real estate and commercial loans secured by a real estate mortgage. |
| |
| | • | | Pledge Loans: loans secured by collateral (such as cars or machinery) other than real estate, where such collateral is an integral part of the loan documents. |
| |
| | • | | Personal Loans: loans to individuals. |
| |
| | • | | Credit-Card Loans: loans granted through credit cards to credit card holders. |
| |
| | • | | Placements in Banks Abroad: short-term loans to banks abroad. |
| |
| | • | | Other Loans: loans not included in other categories. |
| |
| | • | | Documented Interest: discount on notes and bills. |
| | | |
| (2) | | As of December 31, 2010 includes loans incorporated as a consequence of the acquisition of CFA. |
| |
| (3) | | Preferred guarantees include mortgages on real estate property or pledges on movable property, such as cars or machinery, where Banco Galicia has priority, endorsements of the Federal Office of the Secretary of Finance, pledges of Government securities, or gold or cash as collateral. |
As of December 31, 2010, Banco Galicia’s loan portfolio before allowances for loan losses amounted to Ps.22,372.2 million, as compared to Ps.14,263.9 million as of December 31, 2009. This change is due to a significant increase in the portfolio of loans to the private sector, in line with the increase experienced by the Argentine market in general, together with the acquisition of CFA whose loan portfolio before allowances for loan losses amounted to Ps.1,378.4 million.
Loans to the financial and non-financial public sector as of the end of the fiscal year ended December 31, 2010 were Ps.3.2 million, 36% lower than the Ps.5.0 million outstanding as of the close of the previous fiscal year.
As of December 31, 2010, the loans to the private sector before the allowance for loan losses were Ps.22,369.0 million, a 56.88% increase (47.21% without CFA’s portfolio), as compared to the Ps.14,258.9 million at the end of the previous fiscal year, and a share in the total loan portfolio of 99.99%, compared to 99.96% the previous fiscal year. Loans to corporations and individuals in the total loan portfolio increased from 96.67% at the end of the fiscal year ended December 31, 2009 to 98.56% at the end of the fiscal year ended December 31, 2010.
In fiscal year 2009, our loan portfolio before the allowance for loan losses increased 16.47% compared to the previous fiscal year end, due to a significant increase in the portfolio of loans of the private sector and a decrease in the public non-financial sector. Loans to the financial and non-financial public sector as of fiscal year end 2009 amounted to Ps.5.0 million, with a 99.65% decrease in comparison with the Ps.1,426.7 million outstanding as of the close of the previous fiscal year.
Loans by Type of Borrower
The following table shows the breakdown of our total loan portfolio, by type of borrower at December 31, 2010, 2009 and 2008. The middle-market companies’ category includes Banco Galicia’s loans to SMEs and the agricultural and livestock sectors while the individuals’ category includes loans granted by Banco Galicia, the Regional Credit Card Companies and CFA. Loans to individuals comprise both consumer loans and commercial loans extended to individuals with a commercial activity.
| | | | | | | | | | | | | | | | | | | | | | | | | |
| | | As of December 31, | |
| | | 2010 | | | 2009 | | | 2008 | |
| | | Amount | | | % of Total | | | Amount | | | % of Total | | | Amount | | | % of Total | |
| | | (in millions of Pesos, except percentages) | |
| Corporate | | | 2,768.1 | | | | 12.37 | | | | 1,801.1 | | | | 12.63 | | | | 1,148.6 | | | | 9.38 | |
| Middle-Market Companies | | | 6,641.9 | | | | 29.69 | | | | 4,844.5 | | | | 33.96 | | | | 3,716.8 | | | | 30.35 | |
| - Agribusiness | | | 2,458.2 | | | | 10.99 | | | | 1,962.9 | | | | 13.76 | | | | 1,461.4 | | | | 11.93 | |
| - SMEs | | | 4,183.8 | | | | 18.70 | | | | 2,881.6 | | | | 20.20 | | | | 2,255.4 | | | | 18.42 | |
| Commercial Loans | | | 9,410.0 | | | | 42.06 | | | | 6,645.6 | | | | 46.59 | | | | 4,865.4 | | | | 39.73 | |
| Individuals | | | 12,640.9 | | | | 56.51 | | | | 7,142.8 | | | | 50.07 | | | | 5,578.3 | | | | 45.55 | |
| - Bank | | | 6,807.0 | | | | 30.43 | | | | 4,296.4 | | | | 30.12 | | | | 3,232.0 | | | | 26.39 | |
| - Regional Credit Card Companies | | | 4,455.9 | | | | 19.92 | | | | 2,846.4 | | | | 19.95 | | | | 2,346.3 | | | | 19.16 | |
| - CFA | | | 1,378.0 | | | | 6.16 | | | | — | | | | — | | | | — | | | | — | |
Financial Sector(1) | | | 318.0 | | | | 1.42 | | | | 470.5 | | | | 3.30 | | | | 484.0 | | | | 3.95 | |
| Non-Financial Public Sector | | | 3.2 | | | | 0.01 | | | | 5.0 | | | | 0.04 | | | | 1,319.6 | | | | 10.77 | |
| | | | | | | | | | | | | | | | | | | |
Total(2) | | | 22,372.1 | | | | 100.00 | | | | 14,263.9 | | | | 100.00 | | | | 12,247.3 | | | | 100.00 | |
| | | | | | | | | | | | | | | | | | | |
| | | |
| (1) | | Includes local and international financial sector. Financial Sector loans are primarily composed of interbank loans (call money loans), overnight deposits at international money center banks and loans to provincial banks. |
| |
| (2) | | Before the allowance for loan losses. |
-51-
Consumer loans continue to be the most significant category in the loan portfolio, representing 54.68% of the total portfolio as of December 31, 2010, higher than in the end of the previous fiscal year, where the portion of the loan portfolio consisting of consumer loans was 47.54%. The share portion of the loan portfolio consisting of consumer loans as of December 31, 2008 was 43.23%.
Loans by Economic Activity
The following table sets forth as of the dates indicated an analysis of our loan portfolio according to the borrower’s main economic activity. Figures include principal and interest.
| | | | | | | | | | | | | | | | | | | | | | | | | |
| | | As of December 31, | |
| | | 2010 | | | 2009 | | | 2008 | |
| | | Amount | | | % of Total | | | Amount | | | % of Total | | | Amount | | | % of Total | |
| | | (in millions of Pesos, except percentages) | |
Financial Sector(1) | | | 318.0 | | | | 1.42 | | | | 470.5 | | | | 3.30 | | | | 484.0 | | | | 3.95 | |
| | | | | | | | | | | | | | | | | | | |
| Services | | | | | | | | | | | | | | | | | | | | | | | | |
| Non-Financial Public Sector | | | 3.2 | | | | 0.01 | | | | 5.0 | | | | 0.04 | | | | 1,319.6 | | | | 10.77 | |
| Communications, Transportation Health and Others | | | 1,315.3 | | | | 5.88 | | | | 1,020.2 | | | | 7.15 | | | | 838.3 | | | | 6.84 | |
| Electricity, Gas, Water Supply and Sewage Services | | | 111.2 | | | | 0.50 | | | | 43.7 | | | | 0.31 | | | | 30.7 | | | | 0.25 | |
| Other Financial Services | | | 54.0 | | | | 0.24 | | | | 12.8 | | | | 0.09 | | | | 44.5 | | | | 0.37 | |
| | | | | | | | | | | | | | | | | | | |
Total | | | 1,483.7 | | | | 6.63 | | | | 1,081.7 | | | | 7.59 | | | | 2,233.1 | | | | 18.23 | |
| | | | | | | | | | | | | | | | | | | |
| Primary Products | | | | | | | | | | | | | | | | | | | | | | | | |
| Agriculture and Livestock | | | 2,268.0 | | | | 10.14 | | | | 1,803.8 | | | | 12.65 | | | | 1,274.5 | | | | 10.41 | |
| Fishing, Forestry and Mining | | | 199.3 | | | | 0.89 | | | | 177.8 | | | | 1.25 | | | | 60.9 | | | | 0.49 | |
| | | | | | | | | | | | | | | | | | | |
Total | | | 2,467.3 | | | | 11.03 | | | | 1,981.6 | | | | 13.90 | | | | 1,335.4 | | | | 10.90 | |
| | | | | | | | | | | | | | | | | | | |
Consumer | | | 12,232.7 | | | | 54.68 | | | | 6,781.5 | | | | 47.54 | | | | 5,294.9 | | | | 43.23 | |
| | | | | | | | | | | | | | | | | | | |
Retail Trade | | | 906.2 | | | | 4.05 | | | | 719.5 | | | | 5.04 | | | | 537.2 | | | | 4.39 | |
| | | | | | | | | | | | | | | | | | | |
Wholesale Trade | | | 1,532.8 | | | | 6.85 | | | | 931.4 | | | | 6.53 | | | | 647.0 | | | | 5.28 | |
| | | | | | | | | | | | | | | | | | | |
Construction | | | 318.1 | | | | 1.42 | | | | 177.0 | | | | 1.24 | | | | 82.2 | | | | 0.67 | |
| | | | | | | | | | | | | | | | | | | |
Manufacturing | | | | | | | | | | | | | | | | | | | | | | | | |
| Foodstuffs | | | 1,098.4 | | | | 4.91 | | | | 773.2 | | | | 5.42 | | | | 533.6 | | | | 4.36 | |
| Transportation Materials | | | 70.9 | | | | 0.32 | | | | 41.9 | | | | 0.29 | | | | 81.5 | | | | 0.67 | |
| Chemicals and Oil | | | 454.3 | | | | 2.03 | | | | 378.3 | | | | 2.65 | | | | 293.2 | | | | 2.39 | |
| Manufacturing Industries | | | 1,388.7 | | | | 6.21 | | | | 891.5 | | | | 6.25 | | | | 682.6 | | | | 5.57 | |
| | | | | | | | | | | | | | | | | | | |
Total | | | 3,012.3 | | | | 13.47 | | | | 2,084.9 | | | | 14.61 | | | | 1,590.9 | | | | 12.99 | |
| | | | | | | | | | | | | | | | | | | |
Other Loans | | | 101.1 | | | | 0.45 | | | | 35.8 | | | | 0.25 | | | | 42.6 | | | | 0.36 | |
| | | | | | | | | | | | | | | | | | | |
Total(2) | | | 22,372.2 | | | | 100.00 | | | | 14,263.9 | | | | 100.00 | | | | 12,247.3 | | | | 100.00 | |
| | | | | | | | | | | | | | | | | | | |
| | | |
| (1) | | Includes local and international financial sectors. |
| |
| (2) | | Before the allowance for loan losses. |
-52-
By economic sector, the most significant categories during the fiscal year ended December 31, 2010 were consumer loans, loans to the manufacturing industry, the primary production sector and trade (wholesale and retail) with a participation in the total loan portfolio of 54.68%, 13.46%, 11.03% and 10.9%, respectively.
The most significant growth was reflected in the consumer sector, particularly given the size of this portfolio, with increases of 80.38%, as compared to the end of 2009; such increase was caused mainly by Banco Galicia’s acquisition of CFA. The services sector registered a decline in respect of the total loan portfolio, from 7.58% at the end of 2009 to 6.63% at the end of 2010.
Maturity Composition of the Loan Portfolio
The following table sets forth an analysis by type of loan and time remaining to maturity of our loan portfolio as of December 31, 2010.
| | | | | | | | | | | | | | | | | | | | | | | | | | | | | |
| | | | | | | After 1 | | | After 6 | | | | | | | After 3 | | | | | | | | |
| | | | | | | Month but | | | Months but | | | After 1 Year | | | Years but | | | | | | | Total at | |
| | | Within 1 | | | within 6 | | | within 12 | | | but within 3 | | | within 5 | | | After 5 | | | December | |
| | | Month | | | Months | | | Months | | | Years | | | Years | | | Years | | | 31, 2010 | |
| | | (in millions of Pesos) | |
Non-Financial Public Sector(1) | | | 3.2 | | | | — | | | | — | | | | — | | | | — | | | | — | | | | 3.2 | |
Financial Sector(1) | | | 80.6 | | | | — | | | | — | | | | — | | | | — | | | | — | | | | 80.6 | |
Private Sector and Residents Abroad | | | 11,620.2 | | | | 5,264.4 | | | | 1,969.3 | | | | 2,485.3 | | | | 771.4 | | | | 177.8 | | | | 22,288.4 | |
| - Advances | | | 685.7 | | | | 280.0 | | | | 12.8 | | | | 0.8 | | | | — | | | | — | | | | 979.2 | |
| - Promissory Notes | | | 1,847.3 | | | | 1,905.9 | | | | 369.1 | | | | 338.6 | | | | 67.2 | | | | 6.2 | | | | 4,534.3 | |
| - Mortgage Loans | | | 30.6 | | | | 91.9 | | | | 94.6 | | | | 340.0 | | | | 243.7 | | | | 149.4 | | | | 950.2 | |
| - Pledge Loans | | | 8.1 | | | | 21.5 | | | | 22.1 | | | | 59.8 | | | | 6.7 | | | | 0.9 | | | | 119.1 | |
| - Personal Loans | | | 247.0 | | | | 957.9 | | | | 866.8 | | | | 1,546.8 | | | | 453.8 | | | | 21.3 | | | | 4,093.6 | |
| - Credit-Card Loans | | | 6,620.4 | | | | 1,811.8 | | | | 569.1 | | | | 118.7 | | | | — | | | | — | | | | 9,120.1 | |
| - Other Loans | | | 1,986.8 | | | | 195.4 | | | | 34.8 | | | | 80.6 | | | | — | | | | — | | | | 2,297.6 | |
| - Accrued Interest and Quotation | | | | | | | | | | | | | | | | | | | | | | | | | | | | |
Differences Receivable(1) | | | 277.1 | | | | — | | | | — | | | | — | | | | — | | | | — | | | | 277.1 | |
| - (Documented Interest) | | | (81.8 | ) | | | — | | | | — | | | | — | | | | — | | | | — | | | | (81.8 | ) |
| - (Unallocated Collections) | | | (1.0 | ) | | | — | | | | — | | | | — | | | | — | | | | — | | | | (1.0 | ) |
Allowance for Loan Losses(2) | | | (1,038.5 | ) | | | | | | | | | | | | | | | | | | | | | | | (1,038.5 | ) |
| | | | | | | | | | | | | | | | | | | | | | |
Total Loans, Net | | | 10,665.5 | | | | 5,264.4 | | | | 1,969.3 | | | | 2,485.3 | | | | 771.4 | | | | 177.8 | | | | 21,333.7 | |
| | | | | | | | | | | | | | | | | | | | | | |
| | | |
| (1) | | Interest and the CER adjustment were assigned to the first month. |
| |
| (2) | | Allowances were assigned to the first month as were past due loans and loans in judicial proceedings. |
Interest Rate Sensitivity of Outstanding Loans
The following table presents the interest rate sensitivity of our outstanding loans by denomination as of December 31, 2010.
| | | | | | | | | |
| | | In millions of Pesos | | | As a % of Total Loans | |
Variable Rate(1)(2) | | | | | | | | |
| Pesos | | | 922.7 | | | | 26.87 | % |
| Dollars | | | 202.0 | | | | 5.88 | % |
| | | | | | | |
Total | | | 1,124.7 | | | | 32.75 | % |
| | | | | | | |
Fixed Rate(2)(3) | | | | | | | | |
| Pesos | | | 2,203.5 | | | | 64.15 | % |
| Dollars | | | 106.3 | | | | 3.10 | % |
| | | | | | | |
Total | | | 2,309.8 | | | | 67.25 | % |
| | | | | | | |
| Past Due Loans | | | | | | | | |
| Pesos | | | — | | | | — | |
| Dollars | | | — | | | | — | |
| | | | | | | |
Total | | | — | | | | — | |
| | | | | | | |
| | | |
| (1) | | Includes overdraft loans. |
| |
| (2) | | Includes past due loans and excludes interest receivable, differences in quotations and the CER adjustment. |
| |
| (3) | | Includes short-term and long-term loans whose rates are determined at the beginning of the loans’ life. |
-53-
Credit Review Process
Credit risk is the potential for financial loss resulting from the failure of a borrower to honor its financial contractual obligations. Our credit risk arises mainly from Banco Galicia’s, the Regional Credit Card Companies’ and CFA’s lending activities, and from the fact that, in the normal course of business, these subsidiaries are parties to certain transactions with off-balance sheet treatment and associated risk, mainly commitments to extend credit and guarantees granted. See also Item 5. “Operating and Finance Review and Prospects” —Item 5.A. “Operating Results-Off-Balance Sheet Arrangements”.
Our credit approval and credit risk analysis is a centralized process based on the concept of “opposition of interests”. This is achieved through the existing division among the risk management, the credit and the origination functions both in retail and wholesale businesses, thus enabling us to achieve an ongoing and efficient control of asset quality, a proactive management of loans with problems, aggressive write-offs of uncollectible loans, and adequate loan loss provisioning. Apart from that, it includes the follow-up of the models for measuring the portfolio risk at the operation and customer levels, facilitating the detection of loans with problems and the losses associated thereto, what in turn allows the early detection of situations that could entail some degree of portfolio deterioration and provides appropriate protection of our assets.
Banco Galicia
The Credit Risk Management and Insurance Division approves credit risk policies and procedures, verifies the compliance thereof and assesses credit risk on a continuous basis.
The credit granting policy for retail banking focuses on the use of an automatic loan granting process. This is based on behavior analysis models. Banco Galicia is focused on obtaining portfolios with direct payroll deposits, which statistically have a better loan compliance behavior when compared to other types of portfolios.
As for the wholesale banking, credit granting is based on analyses conducted on credit, cash-flow, balance sheet, capacity of the applicant. These are supported by statistical rating models.
During fiscal year 2010, the review-by-sector policy was implemented, which determines the levels of review for the economic activities belonging to the private-sector portfolio according to the concentration they show with regard to total credit and/or computable regulatory capital (“RPC”, as per its initials in Spanish).
The Credit Risk Management and Insurance Division also constantly monitors its portfolio through different indicators (asset quality of the loan portfolio, provisioning of the non-accrual portfolio, non-performance, roll rates, credit quality indicators, etc), as well as the classification and concentration thereof (through maximum ratios between the exposure to each client, its own RPC or regulatory capital, and that of each customer). The loan portfolio classification as well as its concentration control, are carried out following the regulations provided for by the Argentine Central Bank.
Credit
The Credit Division’s mission is to assure quality of loan portfolio through the origination of businesses and the optimization of loan recovery strategies in accordance with standards of best practices.
This division performs the following functions: credit granting, preventive management, tracking down and classification of customers, together with recovery of past-due loans. In order to provide timely information and with a flexible and efficient structure that helps respond and adjust to the current macro and microeconomic variables, the above-mentioned functions have been split, not only for companies but also for individuals, and sectors were created that report directly to the Division, thus looking for a more efficient decision-making process.
-54-
This division has specific areas to service large businesses and/or fast-growing companies in the Argentine economy over the last years: banks, capital markets and the agriculture and livestock businesses. In addition, there is an area for the revision and analysis of sectors by activity and environmental risk.
The analysis and granting in relation to the retail portfolio is made on a centralized basis by the Individuals Credit Department.
Applications for products, such as credit cards, current account overdrafts and secured or unsecured personal loans, are automatically assessed through computerized credit scoring systems that take into account different criteria to determine the customer’s credit background and repayment capacity, as well as through granting guidelines based on the customer’s credit history within the financial system (which is verified against the information provided by a company that provides credit information) or with Banco Galicia (credit screening).
Credit approval of corporate loan portfolio is carried out through two specialized teams: The Corporate Credit Department responsible for credit granting and the Credit Analysis Department, in charge of the analysis of large amount transactions.
Before approving a loan, Banco Galicia performs an assessment of the potential borrower and his/her financial condition. For credit exceeding certain amounts, an analysis of each credit line and of each customer is carried out. For credits lower to certain amounts, Banco Galicia uses automated risk assessment systems that provide financial and non-financial information on the borrower, and that perform projections on the financial statements and generate automatic warnings about situations that may indicate an increase in the risk.
Banco Galicia performs its risk assessment based on the following factors:
| | | |
| Qualitative Analysis | | Assessment of the corporate borrower’s creditworthiness performed by the officer in charge of the account based on personal knowledge. |
| | | |
| Economic and Financial Risk | | Quantitative analysis of the borrower’s balance sheet amounts. |
| | | |
| Economic Risk of the Sector | | Measurement of the general risk of the financial sector where the borrower operates (based on statistical information, internal and external). |
| | | |
| Environmental Risk | | Environmental impact analysis (required for all investment projects of significant amounts). |
Loans are approved by the Corporate Approval Department, pursuant to authorization levels previously granted, except loans exceeding certain amount and loans granted to (domestic or foreign) financial institutions and to related customers; these loans are approved by the Credit Committee.
The Information and Management Division provides information for the decision-making process, for the compliance with internal credit policies and regulations from regulating authorities, and for the ongoing review of processes by establishing efficiency ratios and suggesting proposals for continuous improvement.
The Policy and Strategy Department is responsible for reviewing and proposing changes to Banco Galicia’s internal policies, both as regards credit granting and recovery of past-due loans. This area constantly interfaces with Risk Management Division.
The Preventive Management and Analysis Division is in charge of the primary reorganization of Banco Galicia’s portfolio through strategic models of behavior, as well as sector, environmental, economic and financial analysis that help anticipate non-performing credit customers.
The Customer Credit Recovery Division is responsible for reducing the deterioration of the portfolio under management and pursuing customers’ reinsertion in the commercial line; whereas the Portfolio Recovery area covers the court and out-of-court proceedings of customers within the individuals and companies portfolio.
-55-
Regional Credit Card Companies
Each of the Regional Credit Card Companies maintains its own credit products and limits; however, their credit approval and credit risk analysis procedures are basically the same. Assessment of the credit risk of each customer is based on certain information required and provided by the customer, which is verified by the companies, as well as on information on customers’ credit records obtained from credit bureaus and other entities. Once the information is verified, the credit card is issued. There are certain requirements such as age, minimum levels of income (depending on the type of customer, i.e. employee, self-employed, etc.) and domicile area that must be fulfilled in order to qualify for a credit card. Credit limits are defined based on customers’ income. Credit limits may be raised for a particular customer, either at the customer’s request or based on the customer’s past payment profile, at the companies’ discretion or for all customers, due to, among other factors, macroeconomic conditions such as inflation, salary trends or interest rates.
Credit risk assessment, credit approval (the extension of a credit card and the assignment of a limit) and classification (in accordance with the current loan classification criteria defined by the Argentine Central Bank regulations) of the loan portfolio are managed by each company on a centralized basis by a unit that is separate from the sales units. The credit process is described in manuals and Tarjeta Naranja S.A., the largest regional credit card company, has certified all of its processes under the ISO 9001/2000 standard. Credit limits and policies are defined by the board of directors of each regional credit card company.
With regards to recovery of past due loans, the Regional Credit Card Companies manage the early stages of delinquency through their branch personnel and use different types of contact with customers (letters, phone calls, etc.). After 90 days, recovery is turned over to collection agencies that manage out of court proceedings, and if the loan is not recovered, court proceedings could be initiated by other specialized agencies. Cobranzas Regionales S.A., a subsidiary of Tarjeta Naranja S.A and Tarjetas Cuyanas S.A., supervises the whole process of recovery, including recovery procedures of said collection agencies.
CFA
CFA maintains its own credit products and limits. Assessment of the credit risk of each customer is based on certain information required and provided by the customer, which is verified by the company, as well as on information on customers’ credit records obtained from credit bureaus and other entities
Credit risk assessment, credit approval and classification (in accordance with the current loan classification criteria defined by the Argentine Central Bank regulations) of the loan portfolio are managed by the company on a centralized basis by a unit that is separate from the sales units.
Main Argentine Central Bank’s Rules on Loan Classification and Loan Loss Provisions
General
Regardless of the internal policies and procedures designed to minimize risks undertaken, Banco Galicia complies with the Argentine Central Bank regulations.
In 1994, the Argentine Central Bank introduced the current loan classification system and the corresponding minimum loan-loss provision requirements applicable to loans and other types of credit (together referred to as “loans” in this section) to private sector borrowers.
The current loan classification system applies certain criteria to classify loans in a bank’s “consumer” portfolio, and another set of criteria to classify loans in its “commercial” portfolio. The classification system is independent of the currency in which the loan is denominated.
The loan classification criteria applied to loans in the consumer portfolio is based on objective guidelines related to the borrower’s degree of fulfillment of its obligations or its legal status, the information provided by the Financial System’s Debtors System-whenever debtors reflect lower quality levels than the rating assigned by the Bank-, by the Non-Performing Debtors’ database from former financial institutions and the status resulting from the enforcement of the refinance guidelines. In the event of any disagreement, the guidelines indicating the greater risk level of loan losses should be considered.
-56-
For the purposes of the Argentine Central Bank’s regulations, consumer loans are defined as mortgage loans, pledge loans, credit card loans and other types of loans in installments granted to individuals. All other loans are considered commercial loans. In addition, in accordance with an option set forth in these regulations, Banco Galicia applies the consumer portfolio classification criteria to commercial loans of up to Ps.750,000 (until August 2009, said amount was up to Ps.500,000). This classification is based on the level of fulfillment and the situation thereof.
The main classification criterion for loans in the commercial portfolio is each borrower’s ability to pay, mainly in terms of such borrower’s future cash flows. If a customer has both commercial and consumer loans, all these loans will be considered as a whole to determine eligibility for classification in the corresponding portfolio. Loans backed with preferred guarantees will be considered at 50% of their face value.
By applying the Argentine Central Bank’s classification to commercial loans, banks must assess the following factors: the current and projected financial situation of the borrower, the customer’s exposure to currency risk, the customer’s managerial and operating background, the borrower’s ability to provide accurate and timely financial information, as well as the overall risk of the sector in which the borrower operates and the borrower’s relative position within that sector.
The Argentine Central Bank’s regulations also establish that a team independent from the departments in charge of credit origination must carry out a periodic review of the commercial portfolio. Banco Galicia’s Credit Division, which is independent from the business units that generate transactions, is in charge of these reviews.
The review must be carried out on each borrower with debt pending payment equal to the lesser of the following amounts: Ps.2 million (until August 2009 said figure was Ps.1 million) or 1% of the bank’s RPC (computable capital) but, in any case, the review shall cover at least 20% of the total loan portfolio. The frequency of the review of each borrower depends on the bank’s exposure to that borrower. The Argentine Central Bank requires that the larger the exposure is, the more frequent the review should be. This review must be conducted every calendar quarter when credit exposure to that borrower is equal to or in excess of 5% of the bank’s RPC, or every six months when exposure equals or exceeds the lesser of the following amounts: Ps.2 million or 1% of the bank’s RPC. In all cases, at least 50% of Banco Galicia’s commercial portfolio must be reviewed once every six months; and all other borrowers in Banco Galicia’s commercial portfolio must be reviewed during the fiscal year, so that the entire commercial portfolio is reviewed every fiscal year.
In addition, only one level of discrepancy is permitted between the classification assigned by a bank and the lowest classification assigned by at least two other banks whose combined credit to the borrower represents 40% or more of the total credit of the borrower, considering all banks. If Banco Galicia’s classification was different by more than one level from the lowest classification granted, Banco Galicia must immediately downgrade its classification of the debtor to the same classification level, or else within one classification level.
Communiqué “A” 4738 issued by the Argentine Central Bank on November 26, 2007, introduced certain amendments to the classification rules applicable to debtors pertaining to the consumer portfolio, with the purpose of reflecting the customer’s total risk more accurately. Consequently, the rule establishes a new identification of the consumer portfolio categories. Said Communiqué also establishes that, in order to determine the degree of timely fulfillment of obligations, it will be necessary to analyze the customer’s arrears, legal situation and the classification assigned by the rest of the financial institutions whether currently operating or under liquidation, and whether the fulfillment of obligations depends on any kind of refinancing.
Pursuant to this Communiqué, those customers having received any kind of refinancing may achieve a better credit status than the one they had at the time of such refinancing, by previously repaying a certain number of installments for monthly or bimonthly amortization loans or a percentage of the debt for any other type of loans, without incurring any arrears exceeding 31 days.
-57-
In August 2009, the Argentine Central Bank amended these requirements as per Communiqué “A” 4975 (effective since January 2010):
| | | | | | | | | | | | | | | | | | | |
| | | Refinancing | | | Judicial Agreements | |
| | | Monthly or | | Others | | | Previous | | | Com. “A” | |
| | | Bimonthly | | Previous % | | | Com. “A” 4975 | | | % | | | 4975 | |
| Category change from 5 to 4 | | 3 installments | | | 20 | % | | | 15 | % | | | | | | | | |
| Category change from 4 to 3 | | 3 installments | | | 15 | % | | | 10 | % | | | | | | | | |
| Category change from 3 to 2 | | 2 installments | | | 10 | % | | | 5 | % | | | 20 | % | | | 15 | % |
| Category change from 2 to 1 | | 1 installment | | | 10 | % | | | 5 | % | | | 20 | % | | | 15 | % |
In addition: (i) to achieve this better quality status, the customer must comply with the rest of the requirements for the new category; (ii) in case the customer has refinanced and non-refinanced transactions, the resulting classification shall be the lowest from the individual analysis of each transaction; (iii) if a customer with a refinanced loan received or had received additional financial assistance, it will remain within the category for 180 days after the refinancing or the granting of additional credit, whichever is more recent; and (iv) debtors with arrears of over 31 days must be classified within the category resulting from adding the number of days in arrears corresponding to the refinanced debt’s first unpaid installment and those of the minimum arrears set forth for the category in which the debtor is classified at the time of default.
For customers in a normal situation, the additional financial assistance granted shall not be deemed refinancing as long as it leads to an increase in principal owed and the customer’s ability to pay the obligation resulting from said expansion is assessed. The rest of the cases where no debt increase is recorded will be deemed refinancing and only those customers who have not exceeded two refinancing instances within 12 months since the last refinancing will be kept within category 1.
To comply with the commercial obligations included in this portfolio, the following cases shall not be deemed refinancing: (i) any additional credit facilities granted with respect to already agreed limits to the extent said facilities imply additional funds and they do not exceed 10% of the original limits set; and (ii) a higher financial assistance to fund working capital increases or additional investments arisen from business expansion to the extent they are in agreement with the borrower’s ordinary course of business and provided that there exists the ability to honor payments of the remaining financial obligations.
Loan Classification
The following tables contain the six loan classification categories corresponding to the different risk levels set forth by the Argentine Central Bank. Banco Galicia’s total exposure to a private sector customer must be classified according to the riskier classification corresponding to any part of said exposure.
-58-
Commercial Portfolio.
| | | |
| Loan Classification | | Description |
| | | |
| 1. Normal Situation | | The debtor is widely able to meet its financial obligations, demonstrating significant cash flows, a liquid financial situation, an adequate financial structure, a timely payment record, competent management, available information in a timely, accurate manner and satisfactory internal controls. The debtor is in the upper 50% of a sector of activity that is operating properly and has good prospects. |
| | | |
| 2. With Special Follow-up | | Cash flow analysis reflects that the debt may be repaid even though it is possible that the customer’s future payment ability may deteriorate without a proper follow-up. |
| | | This category is divided into two subcategories: |
| | | (2.a). Under Observation; |
| | | (2.b). Under Negotiation or Refinancing Agreements. |
| | | |
| 3. With Problems | | Cash flow analysis evidences problems to repay the debt, and therefore, if these problems are not solved, there may be some losses. |
| | | |
| 4. High Risk of Insolvency | | Cash flow analysis evidences that repayment of the full debt is highly unlikely. |
| | | |
| 5. Uncollectible | | The amounts in this category are deemed total losses. Even though these assets may be recovered under certain future circumstances, inability to make payments is evident at the date of the analysis. It includes loans to insolvent or bankrupt borrowers. |
| | | |
| 6. Uncollectible due to Technical Reasons | | Loans to borrowers indicated by the Argentine Central Bank to be in non-accrual status with financial institutions that have been liquidated or are being liquidated, or whose authorization to operate has been revoked. It also includes loans to foreign banks and other institutions that are not: |
| | | (i) classified as “normal”; |
| | | (ii) subject to the supervision of the Argentine Central Bank or other similar authority of the country of origin; |
| | | (iii) classified as “investment grade” by any of the rating agencies admitted pursuant to Communiqué “A” 2729 of the Argentine Central Bank. |
Consumer Portfolio.
| | | |
| Loan Classification | | Description |
| | | |
| 1. Normal Situation | | Loans with timely repayment or arrears not exceeding 31 days, both of principal and interest. |
| | | |
| 2. Low Risk | | Occasional late payments, with a payment in arrears of more than 32 days and up to 90 days. A customer classified as “Normal” having been refinanced may be recategorized within this category, as long as he amortizes one principal installment (whether monthly or bimonthly) or repays 5% of principal. |
| | | |
| 3. Medium Risk | | Some inability to make payments, with arrears of more than 91 days and up to 180 days. A customer classified as “Low Risk” having been refinanced may be recategorized within this category, as long as he amortizes two principal installments (whether monthly or bimonthly) or repays 5% of principal. |
| | | |
| 4. High Risk | | Judicial proceedings demanding payment have been initiated or arrears of more than 180 days and up to one year. A customer classified as “Medium Risk” having been refinanced may be recategorized within this category, as long as he amortizes three principal installments (whether monthly or bimonthly) or repays 10% of principal. |
| | | |
| 5. Uncollectible | | Loans to insolvent or bankrupt borrowers, or subject to judicial proceedings, with little or no possibility of collection, or with arrears in excess of one year. |
| | | |
| 6. Uncollectible due to Technical Reasons | | Loans to borrowers who fall within the conditions described above under “Commercial Portfolio-Uncollectible due to Technical Reasons” |
-59-
Loan Loss Provision Requirements
Allocated Provisions. Minimum allowances for loan losses are required for the different categories in which loans are classified. The rates vary by classification and by whether the loans are secured. The percentages apply to total customer obligations, both principal and interest. The allowance for loan losses on the performing portfolio is unallocated, while the allowances for the other classifications are individually allocated. Regulations provide for the suspension of interests’ accrual or the requirement of allowances equivalent to 100% of the interests for customers classified as “With Problems” and “Medium Risk”, or lower. The allowances are set forth as follows:
Minimum Allowances for Loan Losses
| | | | | | | | | |
| Category | | Secured | | | Unsecured | |
| 1. Normal Situation | | | 1.0 | % | | | 1.0 | % |
| 2. (a) “Under Observation” and “Low Risk” | | | 3.0 | % | | | 5.0 | % |
| 2. (b) “Under Negotiation or Refinancing Agreements” | | | 6.0 | % | | | 12.0 | % |
| 3. “With Problems” and “Medium Risk” | | | 12.0 | % | | | 25.0 | % |
| 4. “High Risk of Insolvency” and “High Risk” | | | 25.0 | % | | | 50.0 | % |
| 5. “Uncollectible” | | | 50.0 | % | | | 100.0 | % |
| 6. “Uncollectible Due to Technical Reasons” | | | 100.0 | % | | | 100.0 | % |
Loans backed with preferred guarantees “A” (loans assigned or pledged in such a way that a financial institution may be assured of its full repayment due to the existence of a solvent third party or secondary markets available for the sale of the assets) require a 1% provision independently of the customer category.
General Provisions. In addition to the specific loan loss allowances described above, the Argentine Central Bank requires the establishment of a general allowance of 1% for all loans in its “Normal Situation” category. This general allowance is not required for interbank financial transactions of less than thirty days, or loans to the non-financial public sector or to financial institutions majority-owned by the Argentine national, provincial or city governments with governmental guarantees. Besides these general provisions, Banco Galicia may establish additional provisions, determined based on Banco Galicia’s judgment of the entire loan portfolio risk at each reporting period.
As of fiscal year ended December 31, 2010, Banco Galicia decided to implement a counter-cyclical provisioning policy, which requires it to provision for an amount that is higher than that required by the Argentine Central Bank during periods of macroeconomic expansion in Argentina, so that during periods of macroeconomic contraction, Banco Galicia has excess liquidity that it can use to account for any increases in its non-performing portfolio.
As of December 31, 2010, 2009 and 2008, we maintained a general loan loss allowance of Ps.614.2 million, Ps.439.8 million and Ps.298.4 million, respectively, which exceeded by Ps.393 million, Ps.303.4 million and Ps.200.0 million, respectively, the 1% minimum general allowance required by the Argentine Central Bank. The increase in these amounts in fiscal years 2008 and 2009 was related to the seasoning of the individuals’ loan portfolio and to the possible occurrence of certain cases of default in the commercial loan portfolio, as a consequence of the worsening of certain macroeconomic variables. The increase in the amount in the fiscal year ended December 31, 2010 was related to the counter-cyclical policy mentioned above.
-60-
Classification of the Loan Portfolio based on Argentine Central Bank Regulations
The following tables set forth the amounts of our loans past due and the amounts not yet due of the loan portfolio, including the loan portfolios of Banco Galicia, the Regional Credit Card Companies and CFA, applying the Argentine Central Bank’s loan classification criteria in effect at the dates indicated.
| | | | | | | | | | | | | | | | | | | | | | | | | |
| | | As of December 31, 2010 | |
| | | Amounts Not Yet Due | | | Amounts Past Due | | | Total Loans | |
| | | (in millions of Pesos, except percentages) | |
| | | Amounts | | | % | | | Amounts | | | % | | | Amounts | | | % | |
Loan Portfolio Classification | | | | | | | | | | | | | | | | | | | | | | | | |
| 1. Normal and Normal Performance | | | 21,230.1 | | | | 97.40 | | | | — | | | | — | | | | 21,230.1 | | | | 94.90 | |
| 2. With Special Follow-up — Under observation and Low Risk | | | 387.2 | | | | 1.78 | | | | — | | | | — | | | | 387.2 | | | | 1.73 | |
| 3. With Problems and Medium Risk | | | 114.2 | | | | 0.52 | | | | 144.6 | | | | 25.11 | | | | 258.8 | | | | 1.15 | |
| 4. High Risk of Insolvency and High Risk | | | 64.8 | | | | 0.30 | | | | 251.7 | | | | 43.71 | | | | 316.5 | | | | 1.41 | |
| 5. Uncollectible | | | — | | | | — | | | | 178.4 | | | | 30.98 | | | | 178.4 | | | | 0.80 | |
| 6. Uncollectible Due to Technical Reasons | | | — | | | | — | | | | 1.2 | | | | 0.20 | | | | 1.2 | | | | 0.01 | |
| | | | | | | | | | | | | | | | | | | |
Total | | | 21,796.3 | | | | 100.00 | | | | 575.9 | | | | 100.00 | | | | 22,372.2 | | | | 100.00 | |
| | | | | | | | | | | | | | | | | | | |
| | | | | | | | | | | | | | | | | | | | | | | | | |
| | | As of December 31, 2009 | |
| | | Amounts Not Yet Due | | | Amounts Past Due | | | Total Loans | |
| | | (in millions of Pesos, except percentages) | |
| | | Amounts | | | % | | | Amounts | | | % | | | Amounts | | | % | |
Loan Portfolio Classification | | | | | | | | | | | | | | | | | | | | | | | | |
| 1. Normal and Normal Performance | | | 13,273.6 | | | | 96.89 | | | | — | | | | — | | | | 13,273.6 | | | | 93.06 | |
| 2. With Special Follow-up — Under observation and Low Risk | | | 310.6 | | | | 2.27 | | | | — | | | | — | | | | 310.6 | | | | 2.18 | |
| 3. With Problems and Medium Risk | | | 85.1 | | | | 0.62 | | | | 146.2 | | | | 25.92 | | | | 231.3 | | | | 1.62 | |
| 4. High Risk of Insolvency and High Risk | | | 30.5 | | | | 0.22 | | | | 308.1 | | | | 54.62 | | | | 338.6 | | | | 2.37 | |
| 5. Uncollectible | | | — | | | | — | | | | 109.0 | | | | 19.32 | | | | 109.0 | | | | 0.76 | |
| 6. Uncollectible Due to Technical Reasons | | | — | | | | — | | | | 0.8 | | | | 0.14 | | | | 0.8 | | | | 0.01 | |
| | | | | | | | | | | | | | | | | | | |
Total | | | 13,699.8 | | | | 100.00 | | | | 564.1 | | | | 100.00 | | | | 14,263.9 | | | | 100.00 | |
| | | | | | | | | | | | | | | | | | | |
| | | | | | | | | | | | | | | | | | | | | | | | | |
| | | As of December 31, 2008 | |
| | | Amounts Not Yet Due | | | Amounts Past Due | | | Total Loans | |
| | | (in millions of Pesos, except percentages) | |
| | | Amounts | | | % | | | Amounts | | | % | | | Amounts | | | % | |
Loan Portfolio Classification | | | | | | | | | | | | | | | | | | | | | | | | |
| 1. Normal and Normal Performance | | | 11,430.6 | | | | 96.09 | | | | — | | | | — | | | | 11,430.6 | | | | 93.33 | |
| 2. With Special Follow-up — Under observation and Low Risk | | | 388.8 | | | | 3.27 | | | | — | | | | — | | | | 388.8 | | | | 3.18 | |
| 3. With Problems and Medium Risk | | | 54.1 | | | | 0.46 | | | | 103.1 | | | | 29.29 | | | | 157.2 | | | | 1.28 | |
| 4. High Risk of Insolvency and High Risk | | | 21.8 | | | | 0.18 | | | | 185.4 | | | | 52.67 | | | | 207.2 | | | | 1.69 | |
| 5. Uncollectible | | | — | | | | — | | | | 62.0 | | | | 17.61 | | | | 62.0 | | | | 0.51 | |
| 6. Uncollectible Due to Technical Reasons | | | — | | | | — | | | | 1.5 | | | | 0.43 | | | | 1.5 | | | | 0.01 | |
| | | | | | | | | | | | | | | | | | | |
Total | | | 11,895.3 | | | | 100.00 | | | | 352.0 | | | | 100.00 | | | | 12,247.3 | | | | 100.00 | |
| | | | | | | | | | | | | | | | | | | |
| | | | | | | | | | | | | | | | | | | | | | | | | |
| | | As of December 31, 2007 | |
| | | Amounts Not Yet Due | | | Amounts Past Due | | | Total Loans | |
| | | (in millions of Pesos, except percentages) | |
| | | Amounts | | | % | | | Amounts | | | % | | | Amounts | | | % | |
Loan Portfolio Classification | | | | | | | | | | | | | | | | | | | | | | | | |
| 1. Normal and Normal Performance | | | 11,242.7 | | | | 96.57 | | | | — | | | | — | | | | 11,242.7 | | | | 93.89 | |
| 2. With Special Follow-up — Under observation and Low Risk | | | 356.2 | | | | 3.06 | | | | — | | | | — | | | | 356.2 | | | | 2.97 | |
| 3. With Problems and Medium Risk | | | 31.7 | | | | 0.27 | | | | 56.0 | | | | 16.87 | | | | 87.7 | | | | 0.73 | |
| 4. High Risk of Insolvency and High Risk | | | 12.1 | | | | 0.10 | | | | 221.0 | | | | 66.57 | | | | 233.1 | | | | 1.95 | |
| 5. Uncollectible | | | — | | | | — | | | | 48.1 | | | | 14.49 | | | | 48.1 | | | | 0.40 | |
| 6. Uncollectible Due to Technical Reasons | | | — | | | | — | | | | 6.9 | | | | 2.07 | | | | 6.9 | | | | 0.06 | |
| | | | | | | | | | | | | | | | | | | |
Total | | | 11,642.7 | | | | 100.00 | | | | 332.0 | | | | 100.00 | | | | 11,974.7 | | | | 100.00 | |
| | | | | | | | | | | | | | | | | | | |
-61-
| | | | | | | | | | | | | | | | | | | | | | | | | |
| | | As of December 31, 2006 | |
| | | Amounts Not Yet Due | | | Amounts Past Due | | | Total Loans | |
| | | (in millions of Pesos, except percentages) | |
| | | Amounts | | | % | | | Amounts | | | % | | | Amounts | | | % | |
Loan Portfolio Classification | | | | | | | | | | | | | | | | | | | | | | | | |
| 1. Normal and Normal Performance | | | 10,149.9 | | | | 96.24 | | | | — | | | | — | | | | 10,149.9 | | | | 93.94 | |
| 2. With Special Follow-up — Under observation and Low Risk | | | 374.6 | | | | 3.54 | | | | — | | | | — | | | | 374.6 | | | | 3.47 | |
| 3. With Problems and Medium Risk | | | 12.2 | | | | 0.12 | | | | 30.0 | | | | 11.69 | | | | 42.2 | | | | 0.39 | |
| 4. High Risk of Insolvency and High Risk | | | 10.2 | | | | 0.10 | | | | 192.7 | | | | 75.07 | | | | 202.9 | | | | 1.88 | |
| 5. Uncollectible | | | — | | | | — | | | | 28.8 | | | | 11.22 | | | | 28.8 | | | | 0.27 | |
| 6. Uncollectible Due to Technical Reasons | | | — | | | | — | | | | 5.2 | | | | 2.02 | | | | 5.2 | | | | 0.05 | |
| | | | | | | | | | | | | | | | | | | |
Total | | | 10,546.9 | | | | 100.00 | | | | 256.7 | | | | 100.00 | | | | 10,803.6 | | | | 100.00 | |
| | | | | | | | | | | | | | | | | | | |
Amounts Past Due and Non-Accrual Loans
The following table analyzes amounts past due by 90 days or more in our loan portfolio, by type of loan and by type of guarantee as of the dates indicated, as well as our non-accrual loan portfolio, by type of guarantee, our allowance for loan losses and the main asset quality ratios as of the dates indicated.
| | | | | | | | | | | | | | | | | | | | | |
| | | As of December 31, | |
| | | 2010 | | | 2009 | | | 2008 | | | 2007 | | | 2006 | |
| | | (in millions of Pesos, except ratios) | |
Total Loans(1) | | | 22,372.2 | | | | 14,263.9 | | | | 12,247.3 | | | | 11,974.7 | | | | 10,803.6 | |
| | | | | | | | | | | | | | | | |
Non-Accrual Loans(2) | | | | | | | | | | | | | | | | | | | | |
| With Preferred Guarantees | | | 27.9 | | | | 33.7 | | | | 42.0 | | | | 43.5 | | | | 40.2 | |
| With Other Guarantees | | | 37.4 | | | | 97.9 | | | | 10.3 | | | | 5.0 | | | | 5.1 | |
| Without Guarantees | | | 689.6 | | | | 548.1 | | | | 375.6 | | | | 327.3 | | | | 233.8 | |
| | | | | | | | | | | | | | | | |
Total Non-Accrual Loans(2) | | | 754.9 | | | | 679.7 | | | | 427.9 | | | | 375.8 | | | | 279.1 | |
| | | | | | | | | | | | | | | | |
Past Due Loan Portfolio | | | | | | | | | | | | | | | | | | | | |
| Non-Financial Public Sector | | | — | | | | — | | | | — | | | | — | | | | — | |
| Local Financial Sector | | | — | | | | — | | | | — | | | | — | | | | — | |
| Non-Financial Private Sector and Residents Abroad | | | | | | | | | | | | | | | | | | | | |
| Advances | | | 94.3 | | | | 64.4 | | | | 25.9 | | | | 23.0 | | | | 20.9 | |
| Promissory Notes | | | 53.1 | | | | 90.5 | | | | 24.5 | | | | 134.5 | | | | 135.2 | |
| Mortgage Loans | | | 16.0 | | | | 16.8 | | | | 24.9 | | | | 30.0 | | | | 28.4 | |
| Pledge Loans | | | 6.8 | | | | 2.7 | | | | 1.1 | | | | 0.8 | | | | 0.3 | |
| Personal Loans | | | 131.2 | | | | 69.8 | | | | 45.7 | | | | 17.6 | | | | 4.1 | |
| Credit-Card Loans | | | 237.8 | | | | 285.9 | | | | 215.0 | | | | 115.4 | | | | 62.7 | |
| Placements with Correspondent Banks | | | — | | | | — | | | | — | | | | — | | | | — | |
| Other Loans | | | 36.7 | | | | 34.0 | | | | 14.9 | | | | 10.7 | | | | 5.1 | |
| | | | | | | | | | | | | | | | |
Total Past Due Loans | | | 575.9 | | | | 564.1 | | | | 352.0 | | | | 332.0 | | | | 256.7 | |
| | | | | | | | | | | | | | | | |
| Past Due Loans | | | | | | | | | | | | | | | | | | | | |
| With Preferred Guarantees | | | 19.1 | | | | 19.8 | | | | 26.0 | | | | 30.8 | | | | 28.9 | |
| With Other Guarantees | | | 35.1 | | | | 66.9 | | | | 9.0 | | | | 4.2 | | | | 4.3 | |
| Without Guarantees | | | 521.7 | | | | 477.4 | | | | 317.0 | | | | 297.0 | | | | 223.5 | |
| | | | | | | | | | | | | | | | |
Total Past Due Loans | | | 575.9 | | | | 564.1 | | | | 352.0 | | | | 332.0 | | | | 256.7 | |
| | | | | | | | | | | | | | | | |
Allowance for Loan Losses | | | 1,038.5 | | | | 806.4 | | | | 526.8 | | | | 428.6 | | | | 327.0 | |
| | | | | | | | | | | | | | | | |
Ratios (%) | | | | | | | | | | | | | | | | | | | | |
| As a % of Total Loans: | | | | | | | | | | | | | | | | | | | | |
| - Total Past Due Loans | | | 2.57 | | | | 3.95 | | | | 2.87 | | | | 2.77 | | | | 2.38 | |
| - Past Due Loans with Preferred Guarantees | | | 0.09 | | | | 0.14 | | | | 0.21 | | | | 0.26 | | | | 0.27 | |
| - Past Due Loans with Other Guarantees | | | 0.16 | | | | 0.47 | | | | 0.07 | | | | 0.03 | | | | 0.04 | |
| - Past Due Unsecured Amounts | | | 2.32 | | | | 3.34 | | | | 2.59 | | | | 2.48 | | | | 2.07 | |
- Non-Accrual Loans(2) | | | 3.37 | | | | 4.77 | | | | 3.49 | | | | 3.14 | | | | 2.58 | |
- Non-Accrual Loans(2) (Excluding Interbank Loans) | | | 3.42 | | | | 4.93 | | | | 3.60 | | | | 3.18 | | | | 2.79 | |
Non-Accrual Loans(2) as a Percentage of Loans to the Private Sector | | | 3.37 | | | | 4.77 | | | | 3.95 | | | | 3.53 | | | | 3.49 | |
| Allowance for Loan Losses as a % of: | | | | | | | | | | | | | | | | | | | | |
| - Total Loans | | | 4.64 | | | | 5.65 | | | | 4.30 | | | | 3.58 | | | | 3.03 | |
| - Total Loans Excluding Interbank Loans | | | 4.70 | | | | 5.84 | | | | 4.44 | | | | 3.63 | | | | 3.27 | |
- Total Non-Accrual Loans(2) | | | 137.57 | | | | 118.64 | | | | 123.11 | | | | 114.05 | | | | 117.16 | |
Non-Accrual Loans with Guarantees as a Percentage of Non-Accrual Loans(2) | | | 8.65 | | | | 19.36 | | | | 12.22 | | | | 12.91 | | | | 16.23 | |
| Non-Accrual Loans as a Percentage of Total Past Due Loans | | | 131.08 | | | | 120.49 | | | | 121.56 | | | | 113.20 | | | | 108.73 | |
| | |
| (1) | | Before the allowance for loan losses. |
| |
| (2) | | Non-Accrual loans are defined as those loans in the categories of: (a) Consumer portfolio: “Medium Risk”, “High Risk”, “Uncollectible”, and “Uncollectible Due to Technical Reasons”, and (b) Commercial portfolio: “With problems”, “High Risk of Insolvency”, “Uncollectible”, and “Uncollectible Due to Technical Reasons”. |
-62-
At the end of the fiscal year ended December 31, 2010, our non-accrual loans to the private sector ratio was 3.37%, lower than the 4.77% recorded at the end of the fiscal year ended December 31, 2009, mainly due to the improvement in the commercial loan portfolio, together with the growth experienced in the total loan portfolio.
As of December 31, 2009, due to the seasoning of the individuals’ portfolio and increased defaults on the commercial portfolio as a consequence of deteriorating macroeconomic conditions, the non-accrual loans to the private sector ratio rose from 3.95% as of December 31, 2008 to 4.77% as of December 31, 2009.
The Bank has entered into certain troubled debt restructuring agreements with customers. The Bank has eliminated any differences between the principal and accrued interest due under the original loan and the new loan amount through a charge against the allowance for loan losses. Loans under such agreements are included within past due and accruing loans, which amounted to Ps.123.5 million, Ps.197.5 million and Ps.240.9 million as of December 31, 2010, 2009 and 2008, respectively.
For the past three fiscal years, Banco Galicia’s coverage of non-accrual loans with allowances for loan losses has exceeded 100%.
Under Argentine Central Bank rules, we are required to cease the accrual of interest or to establish provisions equal to 100% of the interest accrued on all loans pertaining to the non-accrual loan portfolio, that is, all loans to borrowers in the categories of:
| | • | | in the consumer portfolio: “Medium Risk”, “High Risk”, “Uncollectible” and “Uncollectible Due to Technical Reasons”. |
| | • | | in the commercial portfolio: “With Problems”, “High Risk of Insolvency”, “Uncollectible” and “Uncollectible Due to Technical Reasons”. |
The table below shows the interest income that would have been recorded on non-accrual loans on which the accrual of interest was discontinued and the recoveries of interest on loans classified as non-accrual on which the accrual of interest had been discontinued:
| | | | | | | | | | | | | | | | | | | | | |
| | | As of December 31, | |
| | | 2010 | | | 2009 | | | 2008 | | | 2007 | | | 2006 | |
| | | (in millions of Pesos) | |
| Interest Income that Would Have Been Recorded on Non-Accrual Loans on which the Accrual of Interest was Discontinued | | | 56.0 | | | | 52.0 | | | | 35.4 | | | | 35.9 | | | | 23.7 | |
| | | | | | | | | | | | | | | | | | | | | |
Recoveries of Interest on Loans Classified as Non-Accrual on which the Accrual of Interest had been Discontinued(1) | | | 2.8 | | | | 2.6 | | | | 1.8 | | | | 1.8 | | | | 1.2 | |
| | |
| (1) | | Recorded under “Miscellaneous Income”. |
-63-
Loan Loss Experience
The following table presents an analysis of our allowance for loan losses and of our credit losses as of and for the periods indicated. Certain loans are charged off directly to the income statement and, therefore, are not reflected in the allowance.
| | | | | | | | | | | | | | | | | | | | | |
| | | Fiscal Year Ended | |
| | | December 31, | |
| | | 2010 | | | 2009 | | | 2008 | | | 2007 | | | 2006 | |
| | | (in millions of Pesos, except ratios) | |
Total Loans, Average(1) | | | 16,800.8 | | | | 11,481.9 | | | | 12,077.3 | | | | 10,528.9 | | | | 10,851.0 | |
| | | | | | | | | | | | | | | | |
Allowance for Loan Losses at Beginning of Period(2) | | | 806.4 | | | | 526.8 | | | | 428.6 | | | | 327.0 | | | | 427.9 | |
Changes in the Allowance for Loan Losses During the Period(2) | | | | | | | | | | | | | | | | | | | | |
| Provisions Charged to Income | | | 523.6 | | | | 625.9 | | | | 384.6 | | | | 248.4 | | | | 105.3 | |
| Prior Allowances Reversed | | | — | | | | (5.4 | ) | | | (6.5 | ) | | | (21.5 | ) | | | (32.5 | ) |
| Charge-Offs (A) | | | (487.3 | ) | | | (354.5 | ) | | | (289.2 | ) | | | (125.4 | ) | | | (200.8 | ) |
Inflation and Foreign Exchange Effect and Other Adjustments(3) | | | 195.8 | | | | 13.6 | | | | 9.3 | | | | 0.1 | | | | 27.1 | |
| | | | | | | | | | | | | | | | |
Allowance for Loan Losses at End of Period | | | 1,038.5 | | | | 806.4 | | | | 526.8 | | | | 428.6 | | | | 327.0 | |
| | | | | | | | | | | | | | | | |
Charge to the Income Statement during the Period | | | | | | | | | | | | | | | | | | | | |
Provisions Charged to Income(2) | | | 523.6 | | | | 625.9 | | | | 384.6 | | | | 248.4 | | | | 105.3 | |
| Direct Charge-Offs, Net of Recoveries (B) | | | (88.6 | ) | | | (27.9 | ) | | | (68.4 | ) | | | (57.2 | ) | | | (46.4 | ) |
| Recoveries of Provisions | | | — | | | | (5.4 | ) | | | (6.5 | ) | | | (21.5 | ) | | | (32.5 | ) |
| | | | | | | | | | | | | | | | |
Net Charge (Benefit) to the Income Statement | | | 435.0 | | | | 592.6 | | | | 309.7 | | | | 169.7 | | | | 26.4 | |
| | | | | | | | | | | | | | | | |
Ratios (%) | | | | | | | | | | | | | | | | | | | | |
Charge-Offs Net of Recoveries (A+B) to Average Loans(4) | | | 2.37 | | | | 2.84 | | | | 1.83 | | | | 0.65 | | | | 1.42 | |
Net Charge to the Income Statement to Average Loans(4) | | | 2.59 | | | | 5.16 | | | | 2.56 | | | | 1.61 | | | | 0.24 | |
| | |
| (1) | | Before the allowance for loan losses. |
| |
| (2) | | Includes quotation differences for Galicia Uruguay and Cayman Branch. |
| |
| (3) | | Includes Ps.185.4 million corresponding to the allowance for loan losses of CFA as of the date of its acquisition.(4) Charge-offs plus direct charge-offs minus bad debts recovered. |
The increase in allowance for loan losses in fiscal year 2010 is mainly attributable to the seasoning of the individuals’ loan portfolio.
Allocation of the Allowance for Loan Losses
The following table presents the allocation of our allowance for loan losses among the various loan categories and shows such allowances as a percentage of our total loan portfolio before deducting the allowance for loan losses, in each case for the periods indicated.The table also shows each loan category as a percentage of our total loan portfolio before deducting the allowance for loan losses at the dates indicated.
| | | | | | | | | | | | | | | | | | | | | | | | | | | | | | | | | | | | | |
| | | As of December 31, | |
| | | 2010 | | | 2009 | | | 2008 | |
| | | | | | | | | | | Loan | | | | | | | | | | | Loan | | | | | | | | | | | Loan | |
| | | | | | | % of | | | Category | | | | | | | % of | | | Category | | | | | | | % of | | | Category | |
| | | Amount | | | Loans | | | % | | | Amount | | | Loans | | | % | | | Amount | | | Loans | | | % | |
| | | (in millions of Pesos, except percentages) | |
| Non-Financial Public Sector | | | — | | | | — | | | | — | | | | — | | | | — | | | | — | | | | — | | | | — | | | | 10.77 | |
| Local Financial Sector | | | — | | | | — | | | | 0.36 | | | | — | | | | — | | | | 0.18 | | | | — | | | | — | | | | 1.21 | |
| Non-Financial Private Sector and Residents Abroad | | | | | | | | | | | | | | | | | | | | | | | | | | | | | | | | | | | | |
| Advances | | | 55.1 | | | | 0.25 | | | | 4.38 | | | | 31.7 | | | | 0.22 | | | | 4.42 | | | | 14.5 | | | | 0.12 | | | | 4.85 | |
| Promissory Notes | | | 43.3 | | | | 0.19 | | | | 20.27 | | | | 80.3 | | | | 0.56 | | | | 22.47 | | | | 34.9 | | | | 0.28 | | | | 17.28 | |
| Mortgage Loans | | | 10.6 | | | | 0.05 | | | | 4.25 | | | | 11.8 | | | | 0.08 | | | | 6.76 | | | | 21.9 | | | | 0.18 | | | | 8.38 | |
| Pledge Loans | | | 2.6 | | | | — | | | | 0.53 | | | | 1.5 | | | | — | | | | 0.45 | | | | 0.5 | | | | — | | | | 0.66 | |
| Personal Loans | | | 139.2 | | | | 0.62 | | | | 18.30 | | | | 63.9 | | | | 0.45 | | | | 12.09 | | | | 37.8 | | | | 0.31 | | | | 9.94 | |
| Credit-Card Loans | | | 166.8 | | | | 0.75 | | | | 40.77 | | | | 168.3 | | | | 1.18 | | | | 39.90 | | | | 111.4 | | | | 0.91 | | | | 35.75 | |
| Placements in Correspondent Banks | | | — | | | | — | | | | 0.96 | | | | — | | | | — | | | | 3.09 | | | | — | | | | — | | | | 2.73 | |
| Other | | | 16.9 | | | | 0.08 | | | | 10.17 | | | | 16.0 | | | | 0.11 | | | | 10.60 | | | | 7.4 | | | | 0.06 | | | | 8.43 | |
Unallocated(1) | | | 604.0 | | | | 2.69 | | | | — | | | | 432.9 | | | | 3.04 | | | | — | | | | 298.4 | | | | 2.44 | | | | — | |
| | | | | | | | | | | | | | | | | | | | | | | | | | | | |
Total | | | 1,038.5 | | | | 4.64 | | | | 100.00 | | | | 806.4 | | | | 5.65 | | | | 100.00 | | | | 526.8 | | | | 4.30 | | | | 100.00 | |
| | | | | | | | | | | | | | | | | | | | | | | | | | | | |
-64-
| | | | | | | | | | | | | | | | | | | | | | | | | |
| | | As of December 31, | |
| | | 2007 | | | 2006 | |
| | | Amount | | | % of Loans | | | Loan Category % | | | Amount | | | % of Loans | | | Loan Category % | |
| | | (in millions of Pesos, except percentages) | |
| Non-Financial Public Sector | | | — | | | | — | | | | 10.11 | | | | — | | | | — | | | | 24.90 | |
| Local Financial Sector | | | — | | | | — | | | | 0.92 | | | | — | | | | — | | | | 2.88 | |
| Non-Financial Private Sector and Residents Abroad | | | | | | | | | | | | | | | | | | | | | | | | |
| Advances | | | 16.2 | | | | 0.13 | | | | 6.61 | | | | 16.3 | | | | 0.15 | | | | 3.21 | |
| Promissory Notes | | | 119.8 | | | | 1.00 | | | | 24.31 | | | | 151.1 | | | | 1.40 | | | | 19.84 | |
| Mortgage Loans | | | 26.5 | | | | 0.22 | | | | 7.89 | | | | 25.0 | | | | 0.23 | | | | 6.37 | |
| Pledge Loans | | | 0.3 | | | | — | | | | 0.79 | | | | 0.4 | | | | — | | | | 0.62 | |
| Personal Loans | | | 14.0 | | | | 0.12 | | | | 8.17 | | | | 3.7 | | | | 0.03 | | | | 5.21 | |
| Credit-Card Loans | | | 56.0 | | | | 0.47 | | | | 30.31 | | | | 28.5 | | | | 0.26 | | | | 22.76 | |
| Placements in Correspondent Banks | | | — | | | | — | | | | 1.32 | | | | — | | | | — | | | | 5.63 | |
| Other | | | 7.9 | | | | 0.07 | | | | 9.57 | | | | 1.0 | | | | 0.01 | | | | 8.58 | |
Unallocated(1) | | | 187.9 | | | | 1.57 | | | | — | | | | 101.0 | | | | 0.95 | | | | — | |
| | | | | | | | | | | | | | | | | | | |
Total | | | 428.6 | | | | 3.58 | | | | 100.00 | | | | 327.0 | | | | 3.03 | | | | 100.00 | |
| | | | | | | | | | | | | | | | | | | |
| | |
| (1) | | The unallocated reserve consists of the allowances established on the portfolio classified in the “normal situation” category and includes additional reserves in excess of Argentine Central Bank minimum requirements. |
Charge-Offs
The following table sets forth the allocation of the main charge-offs made by Banco Galicia, the Regional Credit Card Companies and CFA during the years ended December 31, 2010, 2009 and 2008.
| | | | | | | | | | | | | |
| | | Fiscal Year Ended | |
| | | December 31, | |
| | | 2010 | | | 2009 | | | 2008 | |
| | | (in millions of Pesos) | |
Charge-offs by Type | | | | | | | | | | | | |
| Advances | | | 18.5 | | | | 21.3 | | | | 17.3 | |
| Promissory Notes | | | 82.5 | | | | 20.3 | | | | 92.3 | |
| Mortgage Loans | | | 1.5 | | | | 9.9 | | | | 7.9 | |
| Pledge Loans | | | 0.9 | | | | 0.3 | | | | 0.1 | |
| Personal Loans | | | 106.8 | | | | 60.8 | | | | 27.5 | |
| Credit-Card Loans | | | | | | | | | | | | |
| Banco Galicia | | | 52.4 | | | | 54.9 | | | | 31.6 | |
| Regional Credit Card Companies | | | 217.9 | | | | 178.6 | | | | 107.7 | |
| Other Loans | | | 6.8 | | | | 8.4 | | | | 4.8 | |
| | | | | | | | | | |
Total | | | 487.3 | | | | 354.5 | | | | 289.2 | |
| | | | | | | | | | |
-65-
During fiscal year 2010, Ps.487.3 million were written off against allowance for loan losses, including the Regional Credit Card Companies’ and CFA’s portfolios. The increased amount as compared to the prior year was attributable to the seasoning of the individuals’ loan portfolio, which represented more than 50% of charge-offs.
During fiscal year 2009, Ps.354.5 million were written off against allowance for loan losses in connection with loans to individuals, including the Regional Credit Card Companies’ and CFA’s portfolios, and the increased amount as compared to the prior year was attributable to the seasoning of the individuals’ loan portfolio.
Foreign Outstandings
Cross-border or foreign outstandings for a particular country are defined as the sum of all claims against third parties domiciled in that country and comprise loans (including accrued interest), acceptances, interest-bearing deposits with other banks, other interest-bearing investments and any other monetary assets that are denominated in Dollars or other non-local currency. The following were our foreign outstandings as of the dates indicated representing 1.00% or more of our total assets:
| | | | | | | | | | | | | |
| | | Fiscal Year Ended | |
| | | December 31, | |
| Country | | 2010 | | | 2009 | | | 2008 | |
| | | (in millions of Pesos) | |
United Kingdom | | | | | | | | | | | | |
| Demand Deposits | | | 1.4 | | | | 5.5 | | | | 6.0 | |
| Forward Purchases of Boden 2012 Bonds | | | — | | | | — | | | | 829.0 | |
| Forward Purchases of Discount Bonds in Pesos | | | — | | | | — | | | | 603.2 | |
| Forward Purchases of Bonar 2015 Bonds | | | 544.8 | | | | — | | | | — | |
| Other | | | 0.1 | | | | — | | | | — | |
| | | | | | | | | | |
Total | | | 546.3 | | | | 5.5 | | | | 1,438.2 | |
| | | | | | | | | | |
United States | | | | | | | | | | | | |
| Demand Deposits | | | 191.5 | | | | 178.6 | | | | 353.4 | |
| Overnight Placements | | | 215.3 | | | | 440.5 | | | | 317.3 | |
| Other | | | 44.4 | | | | 21.6 | | | | 0.7 | |
| | | | | | | | | | |
Total | | | 451.2 | | | | 640.7 | | | | 671.4 | |
| | | | | | | | | | |
Germany | | | | | | | | | | | | |
| Demand Deposits | | | 0.3 | | | | 2.1 | | | | 3.0 | |
| Forward Purchases of Boden 2012 Bonds | | | — | | | | 803.4 | | | | 1,087.9 | |
| Other | | | 1.3 | | | | — | | | | — | |
| | | | | | | | | | |
Total | | | 1.6 | | | | 805.5 | | | | 1,090.9 | |
| | | | | | | | | | |
As of December 31, 2010, we had the following foreign outstandings:
| | • | | Ps.546.3 million (1.5% of our total assets) with United Kingdom financial institutions, of which Ps.544.8 million represented two forward purchases of Bonar 2015 Bonds in connection with repurchase agreement transactions with the applicable financial institution, and Ps.1.4 million corresponded to demand deposits with such institution. |
| | • | | Ps.451.2 million (1.3% of our total assets) representing liquid placements with United States financial institutions, of which Ps.191.5 million corresponded to demand deposits and Ps.215.3 million represented overnight placements. |
| | • | | Ps.1.6 million with German financial institutions, of which Ps.0.3 million corresponded to demand deposits. |
-66-
Deposits
The following table sets out the composition of our deposits as of December 31, 2010, 2009 and 2008. Our deposits represent deposits with Banco Galicia.
| | | | | | | | | | | | | |
| | | As of December 31, | |
| | | 2010 | | | 2009 | | | 2008 | |
| | | (in millions of Pesos) | |
| Current Accounts and Other Demand Deposits | | | 5,565.7 | | | | 3,719.2 | | | | 3,105.4 | |
| Savings Accounts | | | 6,362.0 | | | | 4,994.7 | | | | 4,035.0 | |
| Time Deposits | | | 9,724.9 | | | | 7,954.7 | | | | 6,548.0 | |
Other Deposits (1) | | | 463.2 | | | | 248.8 | | | | 263.2 | |
| Plus: Accrued Interest, Quotation Differences and CER Adjustment | | | 107.0 | | | | 122.0 | | | | 104.5 | |
| | | | | | | | | | |
Total Deposits | | | 22,222.8 | | | | 17,039.4 | | | | 14,056.1 | |
| | | | | | | | | | |
| | |
| (1) | | Includes among other, deposits originated by Decree No. 616/05, Reprogrammed Deposits under judicial proceedings and other demand deposits. |
In 2010, our consolidated deposits increased 30.4% mainly as a result of a Ps.3,213.9 million increase in deposits in current and savings accounts and a Ps.1,770.2 million increase in time deposits. As in prior years, these increases were due to deposits received by Banco Galicia’s Argentine operation.
In 2009, our consolidated deposits increased 21.2% mainly as a result of a Ps.1,573.4 million increase in deposits in current and savings accounts and Ps.1,406.7 million increase in time deposits. As in prior years, these increases were due to deposits received by Banco Galicia’s Argentine operation. As of December 31, 2009, time deposits included Ps.14.9 million of CER-adjusted time deposits.
In 2008, our consolidated deposits increased 6.8% mainly as a result of a Ps.1,084.9 million increase in deposits in current and savings accounts. As in prior years, these increases were due to deposits received by Banco Galicia’s Argentine operation. As of December 31, 2008, time deposits included Ps.47.3 million of CER-adjusted time deposits.
For more information, see Item 5.A. “Operating Results-Funding”.
The following table provides a breakdown of our consolidated deposits as of December 31, 2010, by contractual term and currency of denomination.
| | | | | | | | | | | | | | | | | | | | | | | | | |
| | | Peso-Denominated | | | Dollar-Denominated | | | Total | |
| | | | | | | % of | | | | | | | % of | | | | | | | % of | |
| | | Amount | | | Total | | | Amount | | | Total | | | Amount | | | Total | |
| | | (in millions of Pesos, except percentages) | |
| Current Accounts and Demand Deposits | | Ps. | 5,565.7 | | | | 30.8 | % | | | — | | | | — | % | | Ps. | 5,565.7 | | | | 25.2 | % |
| Savings Accounts | | | 4,186.6 | | | | 23.1 | | | Ps. | 2,175.4 | | | | 54.2 | | | | 6,362.0 | | | | 28.8 | |
| Time Deposits | | | 8,028.1 | | | | 44.4 | | | | 1,696.8 | | | | 42.3 | | | | 9,724.9 | | | | 44.0 | |
| Maturing Within 30 Days | | | 1,584.3 | | | | 8.8 | | | | 407.6 | | | | 10.2 | | | | 1,991.9 | | | | 9.0 | |
| Maturing After 31 Days but Within 59 Days | | | 2,982.4 | | | | 16.5 | | | | 391.4 | | | | 9.8 | | | | 3,373.8 | | | | 15.3 | |
| Maturing After 60 Days but Within 89 Days | | | 1,243.6 | | | | 6.9 | | | | 213.0 | | | | 5.3 | | | | 1,456.6 | | | | 6.6 | |
| Maturing After 90 Days but Within 179 Days | | | 1,420.6 | | | | 7.9 | | | | 428.4 | | | | 10.7 | | | | 1,849.0 | | | | 8.4 | |
| Maturing After 180 Days but Within 365 Days | | | 490.8 | | | | 2.7 | | | | 207.8 | | | | 5.2 | | | | 698.6 | | | | 3.2 | |
| Maturing After 365 Days | | | 306.4 | | | | 1.6 | | | | 48.6 | | | | 1.1 | | | | 355.0 | | | | 1.5 | |
| Other Deposits | | | 319.9 | | | | 1.8 | | | | 143.3 | | | | 3.6 | | | | 463.2 | | | | 2.1 | |
| Maturing Within 30 Days | | | 158.9 | | | | 0.9 | | | | 116.4 | | | | 2.9 | | | | 275.3 | | | | 1.2 | |
| Maturing After 31 Days but Within 59 Days | | | — | | | | — | | | | — | | | | — | | | | — | | | | — | |
| Maturing After 60 Days but Within 89 Days | | | — | | | | — | | | | — | | | | — | | | | — | | | | — | |
| Maturing After 90 Days but Within 179 Days | | | — | | | | — | | | | — | | | | — | | | | — | | | | — | |
| Maturing After 180 Days but Within 365 Days | | | 123.0 | | | | 0.7 | | | | — | | | | — | | | | 123.0 | | | | 0.6 | |
| Maturing After 365 Days | | | 38.0 | | | | 0.2 | | | | 26.9 | | | | 0.7 | | | | 64.9 | | | | 0.3 | |
| | | | | | | | | | | | | | | | | | | |
Total Deposits(1) | | Ps. | 18,100.3 | | | | 100.0 | % | | | 4,015.5 | | | | 100.0 | % | | Ps. | 22,115.8 | | | | 100.0 | % |
| | | | | | | | | | | | | | | | | | | |
| | |
| (1) | | Only principal. Excludes the CER adjustment |
-67-
The categories with the highest concentration of maturities per original term are those within the segments “within 30 days” and “after 31 days but within 59 days” (Pesos and Dollars), which accounted for 25.3% of the total and mainly corresponded to Peso-denominated time deposits. The rest of the terms have a homogeneous participation. As of December 31, 2010, the average original term of non-adjusted Peso and US Dollar-denominated time deposits was approximately 81 days. Dollar-denominated deposits, for Ps.4,015.5 million (only principal), represented 18.2% of total deposits.
The following table provides information about the maturity of our outstanding time deposits exceeding Ps.100,000, based on to whether they were made at our domestic or foreign branches, as of December 31, 2010.
| | | | | | | | | |
| | | Domestic Offices | | | Foreign Offices | |
| | | (in millions of Pesos) | |
| Time Deposits | | | | | | | | |
| Within 30 Days | | | 1,206.3 | | | | — | |
| After 31 Days but Within 59 Days | | | 2,467.7 | | | | — | |
| After 60 Days but Within 89 Days | | | 972.8 | | | | — | |
| After 90 Days but Within 179 Days | | | 1,233.8 | | | | — | |
| After 180 Days but Within 365 Days | | | 708.2 | | | | — | |
| After 365 Days | | | 333.4 | | | | — | |
| | | | | | | |
Total Time Deposits | | | 6,922.2 | | | | — | |
| | | | | | | |
| Other Deposits | | | — | | | | — | |
| | | | | | | |
Total Deposits(1) | | | 6,922.2 | | | | — | |
| | | | | | | |
Return on Equity and Assets
The following table presents certain selected financial information and ratios for the periods indicated.
| | | | | | | | | | | | | |
| | | Fiscal Year Ended | |
| | | December 31, | |
| | | 2010 | | | 2009 | | | 2008 | |
| | | (in millions of Pesos, except percentages) | |
| Net Income / (Loss) | | | 408.9 | | | | 229.3 | | | | 176.8 | |
| Average Total Assets | | | 29,118.4 | | | | 24,685.3 | | | | 23,412.5 | |
| Average Shareholders’ Equity | | | 2,195.0 | | | | 1,961.2 | | | | 1,745.0 | |
| Shareholders’ Equity at End of the Period | | | 2,469.5 | | | | 2,052.5 | | | | 1,845.7 | |
| Net Income as a Percentage of: | | | | | | | | | | | | |
| Average Total Assets | | | 1.76 | | | | 1.12 | | | | 0.91 | |
| Average Shareholders’ Equity | | | 18.63 | | | | 11.69 | | | | 10.13 | |
| Declared Cash Dividends | | | — | | | | — | | | | — | |
| Dividend Payout Ratio | | | — | | | | — | | | | — | |
| Average Shareholders’ Equity as a Percentage of Average Total Assets | | | 7.54 | | | | 7.94 | | | | 7.45 | |
| Shareholders’ Equity at the End of the Period as a Percentage of Average Total Assets | | | 8.48 | | | | 8.31 | | | | 7.88 | |
Short-term Borrowings
Our short-term borrowings include all of our borrowings (including repurchase agreement transactions, debt securities and negotiable obligations) with a contractual maturity of less than one year, owed to foreign or domestic financial institutions or holders of negotiable obligations.
| | | | | | | | | | | | | |
| | | As of December 31, | |
| | | 2010 | | | 2009 | | | 2008 | |
| | | (in millions of Pesos) | |
Short-Term Borrowings | | | | | | | | | | | | |
| Argentine Central Bank | | | 0.7 | | | | 2.1 | | | | 1.7 | |
| Other Banks and International Entities | | | | | | | | | | | | |
| Credit Lines from Domestic Banks | | | 155.4 | | | | 86.9 | | | | 43.6 | |
| Credit Lines from Foreign Banks | | | 409.0 | | | | 180.0 | | | | 354.6 | |
| Repurchases with Domestic Banks | | | 359.1 | | | | 278.1 | | | | 34.7 | |
| Negotiable Obligations | | | 155.4 | | | | 125.8 | | | | 108.9 | |
| | | | | | | | | | |
Total | | | 1,079.6 | | | | 672.9 | | | | 543.5 | |
| | | | | | | | | | |
-68-
As of the end of fiscal year 2010, our short-term borrowings consisted mainly of credit lines from foreign banks and repurchase agreements transactions with domestic banks.
The Bank also borrows funds under different credit arrangements from local and foreign banks and international lending agencies as follows:
| | | | | | | | | | | | | |
| | | As of December 31, | |
| | | 2010 | | | 2009 | | | 2008 | |
| | | (in millions of Pesos) | |
Banks and International Entities | | | | | | | | | | | | |
| Contractual Short-term Liabilities | | | | | | | | | | | | |
| Other Lines from Foreign Banks | | | 409.0 | | | | 180.0 | | | | 354.6 | |
| Total Short-term Liabilities | | | 409.0 | | | | 180.0 | | | | 354.6 | |
| | | | | | | | | | |
Total Banks and International Entities | | | 409.0 | | | | 180.0 | | | | 354.6 | |
| | | | | | | | | | |
Domestic and Financial Institutions | | | | | | | | | | | | |
| Contractual Short-term Liabilities: | | | | | | | | | | | | |
| Other Lines from Credit from Domestic Banks | | | 155.4 | | | | 86.9 | | | | 43.6 | |
| Total Short-term Liabilities | | | 155.4 | | | | 86.9 | | | | 43.6 | |
| | | | | | | | | | |
Total Domestic and Financial Institutions | | | 155.4 | | | | 86.9 | | | | 43.6 | |
| | | | | | | | | | |
Total | | | 564.4 | | | | 266.9 | | | | 398.2 | |
| | | | | | | | | | |
The outstanding amounts and the terms corresponding to the outstanding negotiable obligations as of the dates indicated were as follows:
| | | | | | | | | | | | | | | | | | | | | |
| | | | | | | Annual Interest | | | As of December 31, | |
| (in millions of Pesos) | | Maturity | | | Rate | | | 2010 | | | 2009 | | | 2008 | |
Negotiable Obligations(*) | | | | | | | | | | | | | | | | | | | | |
| Tarjeta Naranja Class X | | | 2011 | | | Badlar + 275 basis points (“b.p.”) | | | | 48.2 | | | | — | | | | — | |
(Quarterly interest, principal payable at maturity) | | | | | | | | | | | | | | | | | | | | |
| Tarjeta Naranja Class XI | | | 2011 | | | Badlar + 295 b.p. | | | | 40.9 | | | | — | | | | — | |
(Quarterly interest, principal payable at maturity) | | | | | | | | | | | | | | | | | | | | |
| Tarjetas Cuyanas Class I | | | 2011 | | | Badlar + 300 b.p. | | | | 28.8 | | | | — | | | | — | |
(Quarterly interest, principal payable at maturity) | | | | | | | | | | | | | | | | | | | | |
| Tarjetas Cuyanas Class II | | | 2011 | | | | 9.95 | % | | | 37.5 | | | | — | | | | — | |
(Quarterly interest, principal payable at maturity) | | | | | | | | | | | | | | | | | | | | |
| Grupo Financiero Galicia Series I | | | 2010 | | | | — | | | | — | | | | 125.8 | | | | — | |
(Discounted base, principal payable at maturity) | | | | | | | | | | | | | | | | | | | | |
| Tarjeta Naranja Class VIII | | | 2009 | | | | 11.00 | % | | | — | | | | — | | | | 69.1 | |
(Fixed interest, principal payable at maturity) | | | | | | | | | | | | | | | | | | | | |
| Tarjetas Cuyanas Series XIX | | | 2009 | | | | 14.00 | % | | | — | | | | — | | | | 39.8 | |
| | | | | | | | | | | | | | | | |
(Fixed interest, principal payable at maturity) | | | | | | | | | | | | | | | | | | | | |
Total | | | | | | | | | | | 155.4 | | | | 125.8 | | | | 108.9 | |
| | | | | | | | | | | | | | | | |
-69-
The following table shows for our significant short-term borrowings for the fiscal years ended December 31, 2010, 2009 and 2008:
| | • | | the weighted-average interest rate at year-end, |
| | • | | the maximum balance recorded at the monthly closing dates of the periods, |
| | • | | the average balances for each period, and |
| | • | | the weighted-average interest rate for each period. |
| | | | | | | | | | | | | |
| | | As of December 31, | |
| | | 2010 | | | 2009 | | | 2008 | |
| | | (in millions of Pesos, except percentages) | |
Argentine Central Bank | | | | | | | | | | | | |
| Weighted-average Interest Rate at End of Period | | | — | | | | — | | | | — | |
| Maximum Balance Recorded at the Monthly Closing Dates | | Ps. | 1.9 | | | Ps. | 2.8 | | | Ps. | 1.7 | |
| Average Balances for Each Period | | Ps. | 0.7 | | | Ps. | 1.3 | | | Ps. | 1.1 | |
| Weighted-average Interest Rate for the Period | | | — | | | | — | | | | — | |
Credit Lines from Domestic Banks | | | | | | | | | | | | |
| Weighted-average Interest Rate at End of Period | | | 16.1 | % | | | 10.9 | % | | | 24.7 | % |
| Maximum Balance Recorded at the Monthly Closing Dates | | Ps. | 343.0 | | | Ps. | 86.9 | | | Ps. | 261.5 | |
| Average Balances for Each Period | | Ps. | 150.7 | | | Ps. | 45.6 | | | Ps. | 72.9 | |
| Weighted-average Interest Rate for the Period | | | 11.0 | % | | | 12.2 | % | | | 13.7 | % |
Credit Lines from Foreign Banks | | | | | | | | | | | | |
| Weighted-average Interest Rate at End of Period | | | 1.4 | % | | | 2.5 | % | | | 5.4 | % |
| Maximum Balance Recorded at the Monthly Closing Dates | | Ps. | 409.0 | | | Ps. | 257.2 | | | Ps. | 457.4 | |
| Average Balances for Each Period | | Ps. | 266.8 | | | Ps. | 153.1 | | | Ps. | 373.6 | |
| Weighted-average Interest Rate for the Period | | | 1.9 | % | | | 5.1 | % | | | 4.5 | % |
Repurchases with Domestic Banks | | | | | | | | | | | | |
| Weighted-average Interest Rate at End of Period | | | 10.4 | % | | | 9.8 | % | | | 10.5 | % |
| Maximum Balance Recorded at the Monthly Closing Dates | | Ps. | 359.1 | | | Ps. | 278.1 | | | Ps. | 400.6 | |
| Average Balances for Each Period | | Ps. | 39.3 | | | Ps. | 25.9 | | | Ps. | 132.8 | |
| Weighted-average Interest Rate for the Period | | | 9.8 | % | | | 9.6 | % | | | 10.5 | % |
Repurchases with Foreign Banks | | | | | | | | | | | | |
| Weighted-average Interest Rate at End of Period | | | — | | | | — | | | | — | |
| Maximum Balance Recorded at the Monthly Closing Dates | | | — | | | | — | | | | — | |
| Average Balances for Each Period | | | — | | | | — | | | | — | |
| Weighted-average Interest Rate for the Period | | | — | | | | — | | | | — | |
Negotiable Obligations | | | | | | | | | | | | |
| Weighted-average Interest Rate at End of Period | | | 13.6 | % | | | — | % | | | 12.1 | % |
| Maximum Balance Recorded at the Monthly Closing Dates | | Ps. | 176.8 | | | Ps. | 247.7 | | | Ps. | 108.9 | |
| Average Balances for Each Period | | Ps. | 69.3 | | | Ps. | 139.8 | | | Ps. | 49.8 | |
| Weighted-average Interest Rate for the Period | | | 9.0 | % | | | 5.5 | % | | | 9.9 | % |
Regulatory Capital
Grupo Financiero Galicia
The capital adequacy of Grupo Financiero Galicia is not under the supervision of the Argentine Central Bank. Grupo Financiero Galicia has to comply with the minimum capital requirement established by Law No. 19,550, as amended, (Ley de Sociedades Comerciales, the “Corporations’ Law”), which, is required to be Ps.0.012 million.
-70-
Banco Galicia
Banco Galicia is subject to the capital adequacy rules of the Argentine Central Bank. Banks have to comply with capital requirements both on an individual basis and on a consolidated basis with their significant subsidiaries. For the purposes of Argentine Central Bank capital adequacy rules, Banco Galicia’s significant subsidiaries that it is consolidated with are Tarjetas Regionales S.A. (consolidated) and CFA. Through its Communiqués “A” 3959 and “A” 3986, respectively, the Argentine Central Bank established a new capital adequacy rule effective as of January 1, 2004. The new capital adequacy rule is based on the Basel Committee methodology, similar to the previous rule, and establishes the minimum capital a financial institution is required to maintain in order to cover the different risks inherent in its business activity and thus incorporated into its assets. Such risks include mainly: credit risk, generated both by exposure to the private sector and to the public sector; market risk, generated by foreign-currency, securities and CER positions; and interest-rate risk, generated by the mismatches between assets and liabilities in terms of interest rate repricing. The minimum capital requirement stated by the new rule is 8% of an entity’s risk-weighted assets, with a 100% risk weighting for public-sector assets (within the previous rule, this risk-weighting was 0%) and private-sector assets; with said requirement being lower depending on the existence of certain guarantees in the case of private-sector assets and for certain liquid assets.
The above-mentioned Argentine Central Bank rules provided a schedule for the gradual compliance by entities with the new rule over time. For this, it established the application, beginning on January 2004, of two coefficients known as “Alfa 1” and “Alfa 2”, in order to temporarily, and in a decreasing manner, reduce the minimum capital requirement to cover the credit risk of public-sector assets and interest-rate risk, respectively. The Alfa 1 coefficient value increased progressively, in January of each year, until it reached 1.00 on January 1, 2009, and the value of the Alfa 2 coefficient increased in the same manner until it reached 1.00 on January 1, 2007, as shown in the table below:
| | | | | | | | | |
| January 1st/ December 31st | | Alfa 1 | | | Alfa 2 | |
| 2004 | | | 0.05 | | | | 0.20 | |
| 2005 | | | 0.15 | | | | 0.40 | |
| 2006 | | | 0.30 | | | | 0.70 | |
| 2007 | | | 0.50 | | | | 1.00 | |
| 2008 | | | 0.75 | | | | — | |
| 2009 | | | 1.00 | | | | — | |
Under Argentine Central Bank rules, core capital primarily corresponds to a bank’s shareholders’ equity at the beginning of the fiscal year and supplemental capital primarily is comprised of 50% of the fiscal year’s profits and 100% of fiscal year’s losses, and subordinated debt. In the case of Banco Galicia, supplemental capital includes the subordinated debt maturing in 2019 issued as a result of the restructuring of Banco Galicia’s foreign debt. Pursuant to Argentine Central Bank regulations on this point, subordinated debt computable as supplemental capital is limited to 50% of core capital and supplemental capital cannot exceed the latter.
Communiqué “A” 4782 of the Argentine Central Bank, dated March 3, 2008, broadened the range of subordinated contractual obligations that financial institutions may include in their calculation of supplementary shareholders’ equity. Pursuant to this Communiqué, it is possible to record as such not only subordinated debt securities with a public offering, but also any other liability contractually subordinated that meets the requirements set forth in the regulation, regardless of whether such debt had a public offering and notwithstanding the manner of execution (which allows supplementary capital to include liabilities such as loans or credit lines from abroad, for example).
-71-
The table below shows information on Banco Galicia’s consolidated computable regulatory capital, or RPC or adjusted shareholders’ equity, and minimum capital requirements as of the dates indicated.
| | | | | | | | | | | | | |
| | | As of December 31, | |
| | | 2010 | | | 2009 | | | 2008 | |
| | | (in millions of Pesos, except percentages) | |
Shareholders’ Equity | | | 2,595.7 | | | | 2,126.5 | | | | 1,954.7 | |
| | | | | | | | | | |
Argentine Central Bank Minimum Capital Requirements(1) | | | | | | | | | | | | |
| Allocated to Financial Assets | | | 1,618.4 | | | | 1,064.1 | | | | 1,014.1 | |
| Allocated to Fixed Assets, Intangible and Unquoted Equity Investments | | | 165.2 | | | | 168.7 | | | | 169.5 | |
| Allocated to Market Risk | | | 5.8 | | | | 14.3 | | | | 5.4 | |
| Allocated to Interest-Rate Risk | | | 70.1 | | | | 20.7 | | | | 50.7 | |
| Lending to the Non-Financial Public Sector | | | 147.6 | | | | 343.7 | | | | 324.8 | |
| | | | | | | | | | |
Total (A) | | | 2,007.1 | | | | 1,611.5 | | | | 1,564.5 | |
| | | | | | | | | | |
Computable Regulatory Capital Calculated Under Argentine Banking GAAP | | | | | | | | | | | | |
| Core Capital | | | 2,192.4 | | | | 1,991.2 | | | | 1,789.1 | |
| Supplemental Capital | | | 1,333.3 | | | | 1,070.2 | | | | 994.7 | |
| Deductions | | | | | | | | | | | | |
| Investments in Financial Entities | | | (2.0 | ) | | | (1.9 | ) | | | (1.7 | ) |
| Organization Expenses | | | (394.6 | ) | | | (274.9 | ) | | | (191.3 | ) |
| Goodwill Recorded from June 30, 1997 | | | (11.5 | ) | | | (17.5 | ) | | | (28.5 | ) |
| Negative Goodwill CFA | | | 467.2 | | | | — | | | | — | |
| Real Estate Properties for Banco Galicia’s Own Use and Miscellaneous, for which No Title Deed has been Made | | | (2.6 | ) | | | (8.4 | ) | | | (6.3 | ) |
| Other | | | (8.2 | ) | | | (9.9 | ) | | | (17.0 | ) |
| | | | | | | | | | |
| Total | | | 48.3 | | | | (312.6 | ) | | | (244.8 | ) |
| | | | | | | | | | |
| Additional Capital — Market Variation | | | 19.9 | | | | 40.4 | | | | 13.3 | |
| | | | | | | | | | |
Total (B) | | | 3,593.9 | | | | 2,789.2 | | | | 2,552.3 | |
| | | | | | | | | | |
Excess Capital | | | | | | | | | | | | |
| Excess Over Required Capital (B)-(A) | | | 1,586.8 | | | | 1,177.7 | | | | 987.8 | |
| Excess Over Required Capital as a % of Required Capital | | | 79.06 | | | | 73.08 | | | | 63.14 | |
| | | | | | | | | | |
Total Capital Ratio | | | 15.19 | | | | 14.35 | | | | 13.92 | |
| | | | | | | | | | |
| | | |
| (1) | | In accordance with Argentine Central Bank rules applicable at each date. |
As of December 31, 2010, Banco Galicia’s computable capital amounted to Ps.3,593.9 million, exceeding the minimum capital requirement by Ps.1,586.8 million pursuant to the regulations provided for by the Argentine Central Bank effective at that date. This excess amount was Ps.1,177.7 million as of December 31, 2009. The increase of Ps.409.1 million in the excess was due to integration of principal by Ps.804.7 million, offset by the rise in the minimum capital requirement of Ps.395.6 million.
The greater minimum capital requirement was mainly the result of the Ps.542 million higher requirements in connection with financing to the private sector, due to the growth of this portfolio, partially offset by the Ps.196 million decrease related to the non-financial public sector, mainly due to the sale of government securities during the last twelve months.
The Ps.395.6 million increase in computable capital when compared to December 31, 2009 was mainly attributable to higher core capital of Ps.201.2 million, mainly due to 2009 fiscal year’s net income, higher supplemental capital of Ps.263.1 million, due to the increase in the balance of Banco Galicia’s subordinated debt, attributable to the increase in the quotation of the Dollar and of fiscal year’s net income, and (iii) the negative goodwill stemming from the acquisition of CFA (included in “Deductions”).
Regional Credit Card Companies
Since the Regional Credit Card Companies are not financial institutions, their capital adequacy is not regulated by the Argentine Central Bank. The Regional Credit Card Companies have to comply with the minimum capital requirement established by the Corporations’ Law, which was required to be Ps.0.012 million. However, as noted above, Banco Galicia has to comply with the Argentine Central Bank’s capital adequacy rules on a consolidated basis, which includes the Regional Credit Card Companies.
-72-
Compañía Financiera Argentina
Since CFA is a financial institution, its capital adequacy is subject to rules of the Argentine Central Bank, the same as Banco Galicia.
Minimum Capital Requirements of Insurance Companies
The insurance companies controlled by Sudamericana must meet the minimum capital requirements set by General Resolution No. 31,134 of the National Insurance Superintendency. This resolution requires insurance companies to maintain a minimum capital level equivalent to the highest of the amounts calculated as follows:
| (a) | | By line of insurance: this method establishes a fixed amount by line of insurance. For life insurance companies, it is Ps.4 million, increasing to Ps.5 million for companies that offer pension-linked life insurance. For providers of retirement insurance that do not offer pension-linked annuities, the requirement is Ps.3 million (increasing to Ps.5 million for companies that offer pension-linked annuities). For companies that offer property insurance that includes damage coverage (excluding those related to vehicles) the requirement is Ps.1.5 million (increasing to Ps.8 million for companies that offer all P&C products). |
| (b) | | By premiums and additional fees: to use this method, the company must calculate the sum of the premiums written and additional fees earned in the last 12 months. Based on the total, the company must calculate 16%. Finally, it must adjust the total by the ratio of net paid claims to gross paid claims for the last 36 months. This ratio must be at least 50%. |
| (c) | | By claims: to use this method, the company must calculate the sum of gross claims paid during the 36 months prior to the end of the period under analysis. To that amount, it must add the difference between the balance of unpaid claims as of the end of the period under analysis and the balance of unpaid claims as of the 36th month prior to the end of the period under analysis. The resulting figure must be divided by three. Then the company must calculate 23%. The resulting figure must be adjusted by the ratio of net paid claims to gross paid claims for the last 36 months. This ratio must be at least 50%. |
| (d) | | For life insurance companies that offer policies with an investment component, the figures obtained in b) and c) must be increased by an amount equal to 4% of the technical reserves adjusted by the ratio of net technical reserves to gross technical reserves (at least 85%), plus 0.3% of at-risk capital adjusted by the ratio of retained at-risk capital to total at-risk capital (at least 50%). |
The minimum required capital must then be compared to computable capital, defined as shareholders’ equity less non-computable assets. Non-computable assets consist mainly of deferred charges, pending capital contributions, and excess investments in authorized instruments. As of December 31, 2010, the computable capital of the companies controlled by Sudamericana Holding S.A. exceeded the minimum requirement of Ps.64.2 million by Ps.21.0 million.
Sudamericana also holds Sudamericana Asesores de Seguros S.A., a company dedicated to brokerage in different lines of insurance that is regulated by the guidelines of the Corporations’ Law, which provided for a minimum capital requirement of Ps.0.012 million.
Government Regulation
General
All companies operating in Argentina must be registered with the Argentine Superintendency of Companies whose regulations are applicable to all companies in Argentina but may be superseded by other regulatory entities’ rules, depending on the matter, such as the CNV or the Argentine Central Bank. All companies operating in Argentina are regulated by the Corporations’ Law.
-73-
In their capacity as companies listed in Argentina, Grupo Financiero Galicia and Banco Galicia must comply with the disclosure, reporting, governance and other rules applicable to such companies issued by the markets in which they are listed and their regulators, including Law No. 17,811, as amended, Law No. 20,643 and Decrees No. 659/74 and No. 2,220/80, as well as Decree No. 677/01 otherwise known as the Decree for Transparency in the Public Offering (“Régimen de la Transparencia de la Oferta Pública”). In their capacity as public issuers of securities these companies are subject to the above-mentioned rules. As Grupo Financiero Galicia has publicly listed ADSs in the United States, it is also subject to the reporting requirements of the Securities and Exchange Act of 1934 of the United States (the “Exchange Act”) for foreign private issuers and to the provisions applicable to foreign private issuers under the Sarbanes Oxley Act. See Item 9. “The Offer and Listing-Market Regulations”.
Our operating subsidiaries are also subject to the following laws: Law No. 25,156 (the Competition Defense Law, “Ley de Defensa de la Competencia”), Law No. 22,820 (Fair Business Practice Law, “Ley de Lealtad Comercial”) and the Consumer Protection Law.
As a financial services holding company, we do not have a specific institution that regulates our activities. Our banking and insurance subsidiaries are regulated by different regulatory entities. In the case of Banco Galicia, the Argentine Central Bank is the main regulatory and supervising entity.
The banking industry is highly regulated in Argentina. Banking activities in Argentina are regulated by the Financial Institutions’ Law, which places the supervision and control of the Argentine banking system in the hands of the Argentine Central Bank. The Argentine Central Bank regulates all aspects of financial activity. See “-Argentine Banking Regulation” below.
Banco Galicia and our insurance subsidiaries are subject to Law No. 25,246, which was passed on April 13, 2000, as amended, which provides for an anti-money laundering framework in Argentina, including Law No. 26,268, which amends the latter to include within the scope of criminal activities those associated with terrorism and its financing.
Sudamericana’s insurance subsidiaries are regulated by the National Insurance Superintendency and Laws No.17,418 and No. 20,091. Sudamericana Asesores de Seguros S.A. is regulated by the National Insurance Superintendency, through Law No. 22,400.
The activity of the Regional Credit Card Companiesand the credit card activities of Banco Galicia are regulated by Law No. 25,065, as amended, or the Credit Cards Law (“Ley de Tarjetas de Crédito��). Both the Argentine Central Bank and the National Undersecretary of Industry and Trade have issued regulations to, among other things, enforce public disclosure of companies’ pricing (fees and interest rates) in order to assure consumer awareness of such pricing. See “-Credit Cards Regulation”.
Net Investment and GV Mandataria are regulated by the Corporations’ Law, as previously noted, and are not regulated by any specific regulatory agency. Galicia Warrants is regulated by Law No. 9,643.
On January 6, 2002, the Argentine Congress enacted Law No. 25,561, or the Public Emergency Law, which together with various decrees and Argentine Central Bank rules, provided for the principal measures in order to deal with the 2001 and 2002 crisis, including Asymmetric Pesification, among others. The period of effectiveness of the Public Emergency Law was extended again until December 31, 2011.
Galval is located in Uruguay and is regulated by the local legal framework according to the following detail: Corporation’s Law No. 16,060, legal framework related to exchange markets issued by the Banco Central del Uruguay (B.C.U.), Law No. 15,921 -Zona Franca and Law No. 17,835 -Anti-money laundering.
Foreign Exchange Market
In late 2001 and early 2002, restrictions were imposed on access to the Argentine foreign exchange market and on capital movements, which were tightened by the middle of 2002. The Public Emergency Law granted the executive branch of the Government the power to regulate the local foreign exchange market.
Since its creation this regime was subject to various modifications. Only the principal features currently in force are detailed below.
-74-
On June 9, 2005, the executive branch of the Government issued Decree No. 616/05, which established certain major amendments to the rules for capital movements into and from Argentina:
| | (a) | | Foreign exchange flows into and from the local foreign exchange market and all resident new debt transactions that may imply future foreign exchange payments to nonresidents must be registered with the Argentine Central Bank. |
| | (b) | | All new debt of the private sector with non-residents must be for a minimum term of 365 days, except for international trade financing and primary issuances of debt securities, if such securities’ public offering and listing on self-regulated markets in Argentina has been duly authorized. |
| | (c) | | All inflows of foreign exchange resulting from such indebtedness, with the exceptions mentioned in the previous item and those regulated by the Argentine Central Bank which are detailed below, and all inflows of foreign exchange by non-residents, excluding direct foreign investments and certain portfolio investments (subscriptions of primary issuances of debt and equity securities, which public offering and listing in self-regulated markets in Argentina has been duly authorized, and government securities acquired in the secondary market), must be kept in Argentina for a term of at least 365 days and will be subject to a 30% deposit requirement. |
| | (d) | | Such deposit requirement will be held in a local financial institution as an unremunerated, no-transferable Dollar-denominated time deposit maturing in at least 365 days; such funds will not be available as a guarantee for any kind of debt and, upon the deposit maturity date, such funds will become available within the country and, therefore, will be subject to the applicable restrictions on foreign exchange transfers abroad. |
| | (e) | | The 30% deposit is not required for, among other things, inflows of foreign currency resulting from: |
| | (i) | | loans granted to residents by local financial institutions in foreign currency; |
| | (ii) | | direct investment contributions in Argentina capital contributions to local institutions, when the contributor owns, previously or as a result of such contributions, 10% or more of the company’s capital or votes, subject to compliance with certain requirements; |
| | (iii) | | sales of ownership interests in local entities to direct investors, to the extent certain documentation; |
| | (iv) | | to be applied to real estate acquisitions; |
| | (v) | | an indebtedness with multilateral and bilateral credit agencies either directly or through their related agencies, in so far as such funds pertain to transactions conducted in full compliance with their purposes; however, when such inflows are related to the integration (or acquisition) of securities issued by financial trusts, it is necessary to comply with other requirements to avoid the 30% deposit. other foreign indebtedness of the local non-financial private sector, with an average life of no less than two years (including principal and interest), the proceeds of which will be applied to the acquisition of non-financial investments (as defined by the Argentine Central Bank); |
| | (vi) | | other foreign indebtedness with no resident creditor of the financial sector and of the private, non-financial sector, to extent the proceeds from the foreign exchange settlement are simultaneously applied, net of taxes an expenses to (i) the acquisition of foreign currency to repay external debts service and/or (ii) the formation of long-term off-shore assets; |
| | (vii) | | that will be utilized within 10 business days from their liquidation in the local foreign exchange market for purposes listed as “current transactions within the international accounts” (as defined by the Argentine Central Bank), among others, within such purposes are the payment by non-Argentine residents of certain local taxes; or |
| | (viii) | | resulting from the sale of foreign assets of residents in order to subscribe to primary issuances of public debt issued by the Government; and |
-75-
| | (f) | | The proceeds of sales of foreign assets brought into the country by residents (“capital repatriation”) will be subject to the 30% deposit requirement noted in (c) above, which will apply to any amounts exceeding US$2.0 million per month if certain other operative requirements are met. |
The Argentine Ministry of Economy is entitled to modify the percentages and terms detailed above, when a change in the macroeconomic situation so requires. It is also entitled to modify the rest of the requirements established by Decree No. 616/05, and/or establish new ones, and/or increase the types of foreign currency inflows included. The Argentine Central Bank is entitled to regulate and control compliance with the regime established by Decree No. 616/05, and to enforce the applicable penalties.
In addition to Decree No. 616/05, the Argentine Ministry of Economy issued Resolution No. 637/05, dated November 16, 2005, which established that, the restrictions established in said Decree are also applicable to all inflows of funds to the local foreign exchange market for the subscription of primary issuances of debt securities or certificates of participation by financial trusts, if such restrictions were applicable to capital inflows to be used to acquire any of the trusts’ assets. The corresponding criminal regime will be applicable in the case that any of these rules are violated.
In addition, currently, access to the local foreign exchange market by non-residents (both individuals and entities) to transfer funds abroad is permitted:
| | (a) | | With no limit in the case of: (i) proceeds from the principal amortization of government debt securities and guarantee loans in local currency; (ii) recoveries from local bankruptcies; (iii) proceeds from the sale of direct investments (as it is defined by the Argentina Central Bank) in the non-financial private sector in Argentina if they were made with foreign currency that entered the local foreign exchange market no less than 365 days before; and (iv) certain other specific cases. |
| | (b) | | With a US$500,000 monthly limit in the case of the aggregate proceeds of the sale of portfolio investments made with foreign currency that entered the local foreign exchange market no less than 365 days before. |
| | (c) | | With a US$5,000 monthly limit in the aggregated of the entities authorized to deal with foreign exchange, in cases not contemplated above, unless authorization from the Argentine Central Bank is obtained. |
Access to the local foreign exchange market by residents (both individuals and entities) to make real estate investment abroad, contributions pertaining to direct investment or portfolio investments abroad or buy foreign currency bills or traveler checks is allowed but limited to US$2.0 million per month if certain other operative requirements are met. Such limits may be increased in certain specific cases.
Access to the foreign exchange local market for the transfer of profits and dividends abroad is permitted when corresponding to audited and final balance sheets.
Pursuant to Decree No. 260/02, all foreign exchange transactions in Argentina must be executed only through the “mercado libre y único de cambios” (free and single foreign exchange market) on which the Argentine Central Bank buys and sells currency.
Compensation to Financial Institutions
For the Asymmetric Pesification and its Consequences
Decree No. 214/02 provided for compensation to financial institutions, for:
| | • | | the losses caused by the mandatory conversion into Pesos of certain liabilities at the Ps.1.4 per US$1.0 exchange rate, which exchange rate was greater than the Ps.1.0 per US$1.0 exchange rate established for the conversion into Pesos of certain Dollar-denominated assets. This was to be achieved through the delivery of a Peso-denominated compensatory bond issued by the Government. |
| | • | | the currency mismatch left on financial institutions’ balance sheets after the compulsory pesification of certain of their assets and liabilities after the conversion of the Peso-denominated compensatory bond into a Dollar-denominated compensatory bond. This would be achieved by the purchase by financial institutions of a Dollar-denominated hedge bond. For such purpose, the Government established the issuance of a Dollar-denominated bond bearing Libor and maturing in 2012 (Boden 2012 Bonds). |
-76-
Among others, Decree No. 905/02 established the methodology for calculating the compensation to be received by financial institutions. We recorded the compensation for the amounts we had determined according to the regulations. The Argentine Central Bank had to confirm the amounts after a review.
In March 2005, we agreed to receive US$2,178.0 million of face value of Boden 2012 Bonds, comprised of US$906.3 million of face value of Boden 2012 Bonds corresponding to the Compensatory Bond (fully delivered to us in November 2005) and US$1,271.7 million of face value of Boden 2012 Bonds corresponding to the Hedge Bond (fully delivered to us in April 2007).
For Differences Related to Amparo Claims
As a result of the provisions of Decree No. 1,570/01, the Public Emergency Law, Decree No. 214/02 and concurrent regulations, and as a result of the restrictions on cash withdrawals and of the issuance of measures that established the pesification and restructuring of foreign-currency deposits, since December 2001, a significant number of claims have been filed against the Government and/or financial institutions, formally challenging the emergency regulations and requesting prompt payment of deposits in their original currency. Most lower and upper courts have declared the emergency regulations unconstitutional.
Through Communication “A” 3916, dated April 3, 2003, the Argentine Central Bank allowed for the recording of an intangible asset on account of the difference between the amount paid by financial institutions pursuant to legal actions, and the amount resulting from the conversion into Pesos of the balance of the Dollar deposits reimbursed, at the exchange rate of Ps.1.4 per US Dollar (adjusted by the CER plus accrued interest as of the payment date). In addition, it established that the corresponding amount must be amortized in 60 monthly equal and consecutive installments beginning in April 2003.
On November 17, 2005, through Communication “A” 4439, the Argentine Central Bank established that, beginning in December 2005, financial institutions having provided, as from that date, new commercial loans with an average life of more than two years could defer the losses related to the amortization ofamparo claims. The maximum deferrable amount is 10% of a financial institution’s RPC or 50% of the new commercial loans. Likewise, financial institutions are not able to reduce the remainder of their commercial loan portfolio. This methodology was applied until December 2008, when the balances recorded as of that date began to be amortized in up to 36 monthly equal and consecutive installments.
With respect to judicial deposits that have been subject to pesification, the Argentine Central Bank established that, beginning in July 2007, financial institutions must establish a provision in an amount equal to the difference that results from comparing such deposits’ balances at each month’s end, considered in their original currency, and the corresponding Peso balances actually recorded on the books. Such provision, established as of December 31, 2010 and charged to income, amounted to Ps.1.8 million.
As of December 31, 2010, Banco Galicia’s amortization of all deferred losses related toamparo claimsduring 2010 amounted to Ps.281.0 million. During fiscal years 2009 and 2008, Banco Galicia recorded losses of Ps.109.3 million and Ps.39.5 million in connection withamparo claims, respectively.
Banco Galicia has complied with Argentine Central Bank regulations concerning the amortization ofamparo claims. However, Banco Galicia reserves the right to make claims in view of the negative effect on its financial condition caused by compliance with court orders, in excess of the provisions of the above-mentioned regulations. On December 30, 2003, Banco Galicia formally requested of the executive branch of the Government, with a copy of such request sent to the Argentine Ministry of Economy and to the Argentine Central Bank, the payment of due compensation for the losses incurred in connection with Asymmetric Pesification.
-77-
Argentine Banking Regulation
The following is a summary of certain matters relating to the Argentine banking system, including provisions of Argentine law and regulations applicable to financial institutions in Argentina. This summary is not intended to constitute a complete analysis of all laws and regulations applicable to financial institutions in Argentina.
General
Since 1977, banking activities in Argentina have been regulated by the Financial Institution’s Law, which places the supervision and control of the Argentine banking system in the hands of the autonomous Argentine Central Bank. The Argentine Central Bank enforces the Financial Institution’s Law and grants authorization to banks to operate in Argentina. The Financial Institution’s Law confers numerous powers to the Argentine Central Bank, including the ability to grant and revoke bank licenses, authorize the establishment of branches of Argentine banks outside of Argentina, approve bank mergers, capital increases and certain transfers of stock, set minimum capital, liquidity and solvency requirements and lending limits, grant certain credit facilities to financial institutions in cases of temporary liquidity problems and promulgate other regulations that further the intent of the Financial Institution’s Law. The Argentine Central Bank has vested the Superintendency with most of the Argentine Central Bank’s supervisory powers. In this section, unless otherwise stated, references to the Argentine Central Bank should be understood to be references to the Argentine Central Bank acting through the Superintendency. The Financial Institution’s Law grants to the Argentine Central Bank broad access to the accounting systems, books, correspondence, and other documents belonging to banking institutions. The Argentine Central Bank regulates the supply of credit and monitors the liquidity of, and generally supervises the operation of, the Argentine banking system.
Current regulations equally regulate Argentine and foreign owned banks.
Principal Regulatory Changes since 2002
On January 6, 2002, the Government enacted the Emergency Law (Ley de Emergencia) to address the 2001-2002 economic crisis. The principal measures taken by the Government during 2002, both through the enactment of the Emergency Law and a series of decrees and other regulations, include the following: (i) the ratification of the suspension of payments on most of the public debt, with the exception of debts owed to multilateral lending agencies; (ii) the repeal of sections of the Convertibility Law (Ley de Convertibilidad) that established, since 1991, a 1 to 1 parity between the Peso and the Dollar, the devaluation of the Peso, and the establishment of an exchange rate fluctuation regime, which resulted in an increase in the value of the Peso against the Dollar of around 240% during 2002; (iii) the amplification of exchange controls and restrictions on transfers abroad, measures which began to be eased towards the end of 2002; (iv) the ratification and extension of the restrictions on cash withdrawals from bank deposits that were established in December 2001 (the “corralito”), and later lifted in December 2002; (v) Asymmetric Pesification, the specific details of which are as follows: (a) the Dollar-denominated debts of individuals and companies with financial institutions were converted into debt denominated in Pesos at an exchange rate of Ps.1.00 per US$1.00 (1:1), (b) Dollar-denominated public sector debt to the financial sector were converted into Peso-denominated debt instruments at an exchange rate of Ps.1.40 per US$1.00 (1.40:1), and (c) the Dollar-denominated bank deposits were converted into Peso-denominated bank deposits at an exchange rate of Ps.1.40 per US$1.00 (1.40:1), while foreign regulated public sector debt held by banks and companies remained Dollar-denominated; (vi) the modification of the return on assets and cost of liabilities pesified at the rate of Ps.1.40 per US$1.00 through the establishment of maximum and minimum interest rates and capital adjustments in accordance with retail price or wage change indices; (vii) the extension of the maturities of Peso-denominated time deposits and deposits originally denominated in Dollars, above a certain amount, which established a payment schedule with maturities in 2003 or 2005, depending on whether the deposits were originally made in Pesos or Dollars (the “corralón”); (viii) the voluntary exchange ofcorralitoorcorralóndeposits for Government bonds (through Decree No. 739/03, dated April 1, 2003, thecorralónwas eliminated); (ix) the amendment of the charter of the Argentine Central Bank (see “-General” above); and (x) the compensation to financial institutions, through bonds issued by the Government for the losses caused by Asymmetric Pesification. The executive branch of the Government and the Argentine Central Bank have provided a set of rules for determining the amount of compensation for losses related to Asymmetric Pesification, although certain financial entities claim that the compensation established by such rules is not adequate to cover the losses that they have experienced.
The Argentine Congress recently extended the validity of the Emergency Law until December 31, 2011.
-78-
Supervision
As the regulator of the Argentine financial system, the Argentine Central Bank requires financial institutions to submit information on a daily, monthly, quarterly, semiannual and annual basis. These reports, which include balance sheets and income statements, information relating to reserve funds, use of deposits, portfolio quality (including details on debtors and any established loan loss provisions) and other pertinent information, allow the Argentine Central Bank to monitor financial institutions’ financial condition and business practices.
The Argentine Central Bank periodically carries out formal inspections of all banking institutions for the purpose of monitoring compliance by banks with legal and regulatory requirements. If the Argentine Central Bank rules are breached, it may impose various sanctions depending on the gravity of the violation. These sanctions range from calling attention to the infraction, to the imposition of fines or even the revocation of the financial institution’s operating license. Moreover, non-compliance with certain rules may result in the obligatory presentation to the Argentine Central Bank of specific adequacy or regularization plans. The Argentine Central Bank must approve these plans in order for the financial institution to remain operational.
Financial institutions operating in Argentina have been subject to the supervision of the Argentine Central Bank on a consolidated basis since 1994. Information set out in “-Limitations on Types of Business,” “-Capital Adequacy Requirements,” “-Lending Limits,” and “-Loan Classification System and Loan Loss Provisions” below, relating to a bank’s loan portfolio, is calculated on a consolidated basis. However, regulations relating to a bank’s deposits are not based on consolidated information, but on such bank’s deposits in Argentina (for example, liquidity requirements and contributions to the deposit insurance system).
Examination by the Argentine Central Bank
The Argentine Central Bank began to rate financial institutions based on the “CAMEL” quality rating system in 1994. Each letter of the CAMEL system corresponds to an area of the operations of each bank being rated, with: “C” standing for capital, “A” for assets, “M” for management, “E” for earnings, and “L” for liquidity. Each factor is evaluated and rated on a scale from 1 to 5, with 1 being the highest rating an entity can receive. The Argentine Central Bank modified the supervision system in September of 2000. The objective and basic methodology of the new system, referred to as “CAMELBIG,” do not differ substantially from the CAMEL system. The components were redefined in order to evaluate business risks separately from management risks. The components used to rate the business risks are: capital, assets, market, earnings, liquidity and business. The components to rate management risks are: internal control and the quality of management. By combining the individual factors that are under evaluation, a combined index can be populated that represents the final rating for the financial institution.
After temporarily halting such examinations as a result of the 2001-2002 economic crisis, the Argentine Central Bank resumed the examination process, which continues to be in effect today. In Banco Galicia’s case, the first examination after the 2001-2002 economic crisis was based on the information as of June 30, 2005. New examinations have been conducted, the last one of which was based on information as of September 30, 2010.
Minimum Capital Requirements
Banco Galicia, as a commercial bank, must maintain capital equal to or greater than the value calculated by comparing the minimum capital requirements applicable to a bank with similar characteristics and the capital requirement amounts related to credit risk, market risk and interest rate risk.
The minimum capital requirements applicable to a commercial bank with headquarters in the Autonomous City of Buenos Aires, such as Banco Galicia, amount to Ps.25,000,000. The minimum capital requirements related to credit or counterparty risk, which are calculated using a formula created by the Argentine Central Bank, aim to estimate the minimum capital required to counteract the risk associated with counterparties to the assets under review. The minimum capital requirements related to interest rate risk aim to counteract the risk associated with mismatches between lending and deposit rates earned on assets and liabilities held by Banco Galicia. Finally, the minimum capital requirements related to market risk not only aim to counteract the risk associated with the counterparty to each asset, but the change in its market price.
-79-
BASIC System
The Argentine Central Bank established a control system (“BASIC”) with the purpose of allowing the public access to a greater level of information and increased security with respect to their holdings in the Argentine financial system. Each letter corresponds to one of the following procedures:
| | • | | B (“Bonos” or Bonds). On an annual basis, all financial institutions in Argentina were required to engage in certain debt issuing transactions in order to expose them to scrutiny and analysis by third parties with high standards. This requirement was eliminated by the Argentine Central Bank effective March 1, 2002. |
| | • | | A (“Auditoría” or Audit). The Argentine Central Bank requires a set of external audit procedures that include: (a) the creation of a registry of auditors; (b) the implementation of strict accounting procedures to be complied with by external auditors; (c) the payment of a performance guarantee by those auditors to induce their compliance with the procedures, and (d) the creation of a department within the Argentine Central Bank liable for verifying that the procedures are followed. The purpose of this requirement is to assure accurate disclosure by the financial institutions to both the Superintendency and the public. |
| | • | | S (“Supervisión” or Supervision). The Argentine Central Bank has the right to inspect financial institutions from time to time. |
| | • | | I (“Información” or Information). Financial institutions are required to file on a monthly basis certain daily, weekly, monthly and quarterly statistical information. |
| | • | | C (“Calificación” or Rating). The Argentine Central Bank established a system that required the periodic credit evaluation of financial entities by internationally recognized rating agencies, which was suspended by Communiqué “A” 3601 in May 2002. |
Legal Reserve
The Argentine Central Bank requires that every year banks allocate to a legal reserve a percentage of their net profits established by the Argentine Central Bank, which currently amounts to 20.0%. Such reserve may only be used during periods of bank losses and after using up every allowance and other reserves. Distribution of dividends will not be allowed if the legal reserve has been impaired. See Item 8. “Financial Information-Dividend Policy and Dividends”.
Limitations on Types of Business
In accordance with the provisions of the Financial Institutions Law, commercial banks are authorized to carry out all those activities and operations which are not strictly prohibited by law or by the Argentine Central Bank regulations. Permitted activities include the capacity to: grant and receive loans; receive deposits from the general public in local and foreign currency; secure its customers’ debts; acquire, place and trade with shares and debt securities in the Argentine over-the-counter market, subject to the prior approval of the CNV; carry out operations in foreign currencies; act as trustee; and issue credit cards.
Financial institutions are not allowed to own commercial, industrial, agricultural or any other type of company, unless they are authorized by the Argentine Central Bank. Pursuant to the rules of the Argentine Central Bank, a commercial bank’s total equity investments (including interest in local mutual funds) may not exceed 50% of the bank’s adjusted shareholders’ equity or its RPC. Also, the following investments may not exceed 15%, in the aggregate, of the bank’s adjusted shareholders’ equity: (i) shares not listed on stock exchanges except for (a) shares in companies providing services supplementary to the ones offered by the bank, and (b) certain equity interests requiring the provision of utility services, if applicable; (ii) listed shares and participation certificates in mutual funds not included for the purposes of determining capital requirements associated with market risk; and (iii) listed shares that don’t have a “largely publicly available market price” (when there are daily quotations of relevant operations, which should not be substantially affected by the provision of ownership by the bank of such shares).
In order to carry out the calculation of limits described above, it is not necessary to deduct the capital stock allocated to foreign branches from a bank’ shareholders’ equity.
-80-
Pursuant to the Argentine Central Bank’s regulations, financial institutions are not allowed to engage directly in insurance activities or hold more than a 12.5% interest (or more than a specific percentage of the financial institution’s adjusted shareholders’ equity) in the outstanding capital of a company which does not provide services supplementary to those offered by financial institutions. The Argentine Central Bank determines which services are complementary to those provided by financial institutions; it has been determined that such services include those offered in connection with stock brokerage, the issuance of credit, debit or similar cards, financial intermediation in leasing and factoring transactions.
As regards non-banking financial institutions (such as CFA), they are not allowed to provide certain services and activities, such as current accounts, foreign trade transactions, etc.
Computable Regulatory Capital
Pursuant to the Argentine Central Bank’s regulations, a bank’s RPC is calculated as: (a) the minimum core capital, including capital contributions, capital adjustments, reserves, irrevocable capital contributions pending capitalization, unassigned unaudited results (of past fiscal years) and, as of October 1, 2006, long-term debt securities complying with certain prerequisites (including a maturity not exceeding 30 years and that the amounts payable thereunder do not exceed the net accounting revenue of the Bank and should provide for non-cumulative defaults so as to allow payments to be deferred and paid at the stated maturity in a lump sum), so long as they do not exceed the predetermined percentage of net worth (generally 30% with periodic reductions until reaching the international standard of 15% on January 1, 2013); plus (b) the supplementary capital, which may not exceed the minimum core capital and includes (i) with respect to results of past fiscal years: 100% of the results (plus or minus depending on whether they are positive or negative) registered on the latest audited quarterly financials, in the event the yearly financials are not audited; (ii) for the current fiscal year, the entire results (plus or minus depending on whether they are positive or negative) registered at the close of the fiscal year once the results are audited; (iii) 50% of the revenues and 100% of the losses from the latest available audited quarterly or yearly statements; (iv) 50% of the reserves required by the Argentine Central Bank for “current” and “in current situation” loans; (v) subordinated-debt not exceeding 50% of the minimum core capital with a 5 year maturity minimum, and as of October 1, 2006, including debt instruments that comply with the prerequisites to be considered minimum core capital and that exceed the limits set forth in the above clause, debt instruments with a residual term equal to or shorter than 10 years and those that set forth non-cumulative defaults (the limit for such calculations is set at 50% of the minimum core capital), and (vi) breakdowns not included in financial statements or the corresponding auditors report and the accounts payable or collectable of the net worth accounts with uncollected valuation disparities; minus (c) the sum of (i) participation in other financial entities, (ii) securities deposited with custodians that are not registered, (iii) securities issued by foreign countries with ratings under the Government’s rating, (iv) demand securities placed with foreign financial institutions with ratings below “investment grade,” (v) unregistered ownership over real property, (vi) goodwill, (vii) incorporation and development expenses and (viii) provisioning deficiencies as determined by the Superintendency.
Financial institutions must comply with capital adequacy requirements both on an individual and consolidated basis.
Capital Adequacy Requirements
See “-Selected Statistical Information-Regulatory Capital”.
Capitalization of Debt Instruments
Through Communiqué “A” 4652, dated April 25, 2007, the Argentine Central Bank modified Item 7.3 “Capital Contributions” of “Chapter VI. Capital Adequacy- Section 7. Regulatory Capital” of its LISOL 1 rule. Through such Communiqué, the Argentine Central Bank broadened the set of financial instruments different from cash that it expressly allows to be contributed as capital for the purposes of all regulations related to capital, capital calculations and capital increases. Besides cash, in which case no special authorization from the Argentine Central Bank is required, the regulation establishes that subject to the prior authorization by the Superintendency, the following instruments are allowed as capital contributions: (i) securities issued by the Government, (ii) debt instruments issued by the Argentine Central Bank, and (iii) a financial institution’s deposits and other liabilities resulting from financial brokerage, including subordinated obligations. In cases (i) and (ii), the contributions must be recorded at market value. It is understood that an instrument has a market value when it has regular quotations in stock markets and regulated local and foreign markets. In case (iii), contributions must be recorded at market value, as defined in the previous sentence or, in the case of financial institutions that publicly offer their stock, at the price determined by the regulatory authority. When the previous situation is not verified, contributions will be admitted at their accounting value, pursuant to Argentine Central Bank rules.
-81-
Profit Distribution
See Item 8. “Financial Information-Dividend Policy and Dividends”.
Legal Reserve Requirements for Liquidity Purposes
The “minimum cash requirements” that banks are required to carry are established as a percentage of the balances of the different types of bank deposits and, for time deposits, the percentage varies with the remaining maturity. The deposit amount minus the minimum cash requirement is such deposits “lending capacity”.
The Argentine Central Bank modifies from time to time the percentages of the minimum cash requirements depending on monetary policy considerations. Compliance with the minimum cash requirements must be accomplished with certain assets (see below), in the same currency as the deposit that triggers such requirement. Compliance with the minimum cash requirements is determined in averages, for monthly periods. The Argentine Central Bank can modify this practice, depending on monetary policy considerations.
Through Communiqué “A” 3486, dated March 22, 2002, and Communiqué “A” 3528, dated March 25, 2002, the Argentine Central Bank established that foreign currency denominated deposits lending capacity must only be applied to US Dollar-denominated international trade financing, interbank loans and Lebac, and that any such lending capacity not applied to the aforementioned purposes will constitute a greater cash minimum requirement in Pesos, for the same amount. Subsequently, other purposes were added, allowing for the financing of activities that do not directly generate cash flows in foreign currency, such as the granting of loans to finance the importing of capital goods to be used to increase the production for the local market.
Pursuant to Communiqué “A” 4449, dated December 2, 2005, the Argentine Central Bank established that, effective December 2005, the minimum cash requirement in Pesos is to be applied over the monthly average of the daily balances of the obligations comprised, except for the period from December to February of the following year, for which the quarterly average was used.
At the end of fiscal year 2010, the percentages of minimum cash requirements applicable in accordance with Argentine Central Bank rules, were as follows:
| | • | | Peso-denominated current accounts and savings accounts: 19%. |
| | • | | Dollar-denominated savings accounts: 20%. |
| | • | | Time deposits, including those adjusted by CER (by remaining maturity): |
| | • | | Peso-denominated: up to 29 days: 14%; from 30 to 59 days: 11%; from 60 to 89 days: 7%; from 90 to 179 days: 2%; from 180 to 365 days: 0%. |
| | • | | Dollar-denominated: up to 29 days: 20%; from 30 to 59 days: 15%; from 60 to 89 days: 10%; from 90 to 179 days: 5%; from 180 to 365 days: 2%; and more than 365 days: 0%. |
The assets computable for compliance with this requirement are the technical cash, which includes cash (bills and coins in vaults, in ATMs and branches, and in transportation and in armored truck companies, up to a 67% maximum beginning on October 1, 2006, as established by the Argentine Central Bank’s Communiqué “A” 4580), the balances of the Peso- and Dollar-denominated accounts at the Argentine Central Bank and that of the escrow accounts held at the Argentine Central Bank in favor of clearing houses.
As of December 31, 2010, Banco Galicia was in compliance with its legal reserve requirements, and has continued to be up to the date of this annual report.
-82-
Lending Limits
The total equity stake and credit, including collateral, a bank is allowed to grant to a customer at any time is based on the bank’s adjusted shareholders’ equity as of the last day of the immediately preceding month and on the customer’s shareholders’ equity.
In accordance with the Argentine Central Bank’s regulations, a commercial bank shall not lend or provide credit (“financial assistance”) in favor of, nor hold shares in the capital stock of only one unrelated customer (together with its affiliates) for amounts higher than 15% of Banco Galicia’s adjusted shareholders’ equity or 100% of the customer’s shareholders’ equity. Nevertheless, a bank may provide additional financial assistance to such customer up to a sum equivalent to 10% of the bank’s adjusted shareholders’ equity, if the additional financial assistance is secured by certain liquid assets, including government or private debt securities.
The total amount of financial assistance a bank is authorized to provide to a borrower and its affiliates is also limited based on the borrower’s shareholders’ equity. The total amount of financial assistance granted to a borrower and its affiliates shall not be higher than, in the aggregate, 100% of such borrower’s shareholders’ equity, although such limit may be increased an additional 200% of the borrower’s shareholders’ equity if the sum does not exceed 2.5% of the bank’s adjusted shareholders’ equity.
Since October 1, 1995, the Argentine Central Bank has required that the granting of any kind of loans exceeding 2.5% of a bank’s adjusted shareholders’ equity be approved by the branch’s manager, the regional manager, the senior administrative officer of the credit division, the general manager and the credit committee, if any, and it must also have the approval by the board of directors, management board or another similar board.
With regards to the assistance to non-financial public sector, Communiqué “A” 3911, dated March 28, 2003, established certain limits, effective as from April 1, 2003. These limits do not include the banks’ current exposure as of March 31, 2003 or bonds received as compensation pursuant to Decree No 905/02 or to be received pursuant to other rules, nor the extension of amortization payments. The same treatment is given to bonds issued pursuant to the conditions established by Decree 1735/04 (through which the debt exchange offer was made official), received as part of the Argentine debt restructuring, in exchange for preexisting eligible securities as of March 31, 2003. Global exposure to the public sector (national, provincial and municipal public sector) shall not be higher than 75% of an institution’s adjusted shareholders’ equity. Additionally, section 12 of the aforementioned Communiqué establishes that, since January 2006, the average financial assistance to non-financial public sector, in the aggregate, shall not be higher than 40% of the bank’s total assets as of the end of the previous month. Later, through Communiqué “A” 4546, this limit was reduced to 35%, to be effective as from July 1, 2007 to present.
The Argentine Central Bank also regulates the level of “total financial exposure” (defined as financial assistance or credit plus equity participations) of bank to a “related party” (defined as a bank’s affiliates and related individuals). For purposes of these limits, “affiliate” means any entity over which a bank, directly or indirectly, has control, is controlled by, or is under common control with, or any entity over which a bank has, directly or indirectly, significant influence with respect to such entity’s corporate decisions. “Related individuals” mean a bank’s directors, senior management, syndics and such persons’ direct relatives.
The Argentine Central Bank limits the level of total financial exposure that a bank can have outstanding to related parties, depending on the rating granted to each bank by the Superintendency. Banks rated 4 or 5 are forbidden to extend financial assistance to related parties. For banks ranked between 1 and 3, the financial assistance without guarantees to related parties cannot exceed, together with any equity participation held by the bank in its affiliates, 5% of such bank’s RPC. The bank may increase its financing to such related parties up to an amount equal to 10% of such bank’s RPC if the financial assistance is secured.
However, a bank may grant additional financial assistance to such related parties up to the following limits:
| | • | | Financial institutions rated 1, 2 or 3, subject to consolidation with the lender or the borrower: |
| | • | | If the affiliate is a financial institution rated 1, the amount of total financial exposure can reach 100% of a bank’s RPC, and 50% for additional financial assistance. |
| | • | | If the receiving affiliate financial institution is rated 2, the amount of total financial exposure can reach 20% and an additional 105% can be included. |
| | • | | If the affiliate is a financial institution rated 3, the amount of total financial exposure can reach 10%, and additional financial assistance can reach 40%. |
-83-
| | • | | Financial institutions not subject to consolidation with the lender or the borrower: 10% |
| | • | | Domestic companies with complementary services associated with brokerage of shares, financial brokerage in leasing and factoring operations, and temporary acquisition of shares in companies to facilitate their development in order to sell such shares afterwards. |
| | • | | Controlling company rated 1: General assistance: 100% |
| |
| | • | | Controlling company rated 2: General assistance 10% / Additional assistance 90% |
| | • | | Domestic companies with complementary services related to the issuance of credit cards, debit cards or other cards: |
| | • | | Controlling company rated 1: General assistance: 100% / Additional assistance 50% |
| |
| | • | | Controlling company rated 2: General assistance 20% / Additional assistance 105% |
| |
| | • | | Controlling company rated 3: General assistance 10% / Additional assistance 40% |
| | • | | Domestic companies with complementary services, not subject to consolidation with the lender or the borrower : 10% |
| | • | | Foreign financial entities: |
| | • | | Investment grade: 10% |
| |
| | • | | No Investment grade: Unsecured 5%; Secured 10% |
In addition, the aggregate amount of a bank’s total financial exposure to its related parties, plus non-exempt financial assistance may not exceed 20% of such bank’s RPC.
Notwithstanding the limitations described above, financial assistance is also limited in order to prevent risk concentration. To that end, a bank’s aggregate amount of non-exempt total financial exposure (including equity interests) independently of whether customers qualify as such bank’s related parties or not, in the case in which such exposure exceeds 10% of such bank’s RPC, may not exceed three times the bank’s RPC excluding total financial exposure to domestic financial institutions, or five times the bank’s RPC, including such exposure.
For a second floor financial institution (i.e. a financial institution which only provides financial products to other banks and not to the public) the latter limit is 10 times the bank’s RPC.
Banco Galicia has historically complied with such rules.
Loan Classification System and Loan Loss Provisions
For a description of the Argentine Central Bank’s loan classification system and the Argentine Central Bank’s minimum loan loss provisions requirements, see “-Selected Statistical Information-Main Argentine Central Bank’s Rules on Loan Classification and Loan Loss Provisions”.
Valuation of Public Sector Assets
Since March 1, 2011, the Argentine Central Bank amended the valuation criterion applicable to holdings of public sector debt according to the probable allocation of the assets:
| | (a) | | Reasonable market value: the debt instruments are registered at the corresponding market closing price or at present value; it is applicable to debt instruments included in the list of volatilities or present values published by the Argentine Central Bank. |
-84-
| | (b) | | Cost plus yield: the debt instruments not included in the list mentioned in a) above, are registered at incorporation value increased on an exponential basis according to their internal rate of return (“IRR”). The monthly accrual shall be recorded in the income statement or in a contra asset account according to the debt instrument: |
| | (i) | | Debt instruments stemming from sovereign debt exchanges: as long as the market value is lower than the book value, 50% of the yield will be allocated to income and the remaining 50% will be recorded with a counterpart under contra asset accounts, which will be reversed by means of an allocation to income as long as their balance exceeds the positive difference between the market value and the book value of said account. |
| | (ii) | | Argentine Central Bank instruments: the yield will be allocated to income. |
| | (iii) | | Debt instruments not stemming from sovereign debt exchanges and not included in the list mentioned in a) above: registered at present value, discounting the cash flows at a discount rate equal to the yield of debt instruments with volatility published by the Argentine Central Bank with similar duration. As long as the present value is lower than the book value, the monthly accrual shall be recorded with a counterpart under contra asset account. |
It is also allowed to register debt instruments subject to market prices under cost plus yield, up to certain amounts, if the objective is to hold the debt instrument till maturity.
Financial Assistance from the Argentine Central Bank
Financial Assistance for Liquidity Support Granted After March 10, 2003
Communiqué “A” 3901, issued on March 19, 2003, established an automatic mechanism to regulate the provision by the Argentine Central Bank of assistance for liquidity support to financial institutions. This mechanism does not apply to the financial assistance granted for such reasons during the 2001-2002 crisis.
Financial Assistance for Liquidity Support Granted Before April 1, 2003
Through Decree No. 739/03, dated April 1, 2003, the Government established a voluntary procedure for the restructuring of the financial assistance granted by the Argentine Central Bank to financial institutions during the 2001-2002 crisis. On March 2, 2007, Banco Galicia repaid the total outstanding balance of the financial assistance it received from the Argentine Central Bank as a consequence of the 2001-2002 crisis.
Foreign Currency Position
Through Communiqué “A” 4350, dated May 12, 2005, the Argentine Central Bank suspended, effective May 1, 2005, the limit on the positive Global Foreign Currency Net Position (defined as assets and liabilities from financial brokerage and securities denominated in foreign currencies) established at the lowest of 30% of a bank’s RPC or a bank’s liquid shareholders’ equity as of the end of the previous month. Although, at that moment the Argentine Central Bank kept the limit on the negative foreign currency net position at 30% of a bank’s RPC, through Communiqué “A” 4577, issued on September 28, 2006, and effective January 1, 2007, it established that this position should not exceed 15% of the RPC of the preceding month. Subsequently, through Communiqué “A” 4598, dated November 17, 2006, the Argentine Central Bank allowed, in certain cases, the limit to increase by 15%. Communiqué “A” 4577 also clarified that participation certificates or debt securities issued by financial trusts and credit rights on ordinary trusts, in the corresponding proportion, should be calculated when the trust’s underlying assets are denominated in foreign currency.
-85-
Deposit Insurance System
In 1995, Law No. 24,485 and Decree No.540/95, as amended, created a deposit insurance system for bank deposits and delegated to the Argentine Central Bank the organization and start-up of the deposit insurance system. The deposit insurance system was implemented through the creation of a fund namedFondo de Garantía de los Depósitos(“FGD”), which is administered by Seguros de Depósitos S.A. (“Sedesa”). The shareholders of Sedesa are the Government, through the Argentine Central Bank, which holds at least one share, and a trust constituted by the financial institutions which participate in the fund. The Argentine Central Bank establishes the extent of participation by each institution in proportion to the resources contributed by each such institution to the FGD. Banks must contribute to the FGD on a monthly basis in an amount that is currently equal to 0.015% of the monthly average of daily balances of a financial institution’s deposits (both Pesos and foreign currency denominated). The deposit insurance system covers all Peso and foreign currency deposits held in demand deposit accounts, savings accounts and time deposits for an amount up to Ps.30,000. Deposits made after July 1, 1995, with an interest rate 200 b.p.’s above the interest rate quoted by Banco Nación for deposits with equivalent maturities are not covered by this system. The guarantee provided by the deposit insurance system must be made effective within 30 days from the revocation of the license of a financial institution, subject to the outcome of the exercise by depositors of their priority rights described under “-Priority Rights of Depositors” below. The Argentine Central Bank may modify, at any time, and with general scope, the amount of the mandatory deposit guarantee insurance. As from January 2011, the Argentine Central Bank decided to increase the limit of the deposit insurance to Ps.120,000.
Decree No. 1292/96, enhanced Sedesa’s functions to allow it to provide equity capital or make loans to Argentine financial institutions experiencing difficulties and to institutions that buy such financial institutions or their deposits. As a result of such decree, Sedesa has the flexibility to intervene in the restructuring of a financial institution experiencing difficulties prior to bankruptcy.
Priority Rights of Depositors
According to section 49 e) of the Financial Institutions’ Law, in the event of a judicial liquidation or the bankruptcy of a financial entity, the holders of deposits in Pesos and foreign currency benefit from a general priority right to obtain repayment of their deposits up to the amount set forth below, with priority over all other creditors, with the exception of the following: (i) credits secured by a mortgage or pledge, (ii) rediscounts and overdrafts granted to financial entities by the Argentine Central Bank, according to section 17 subsections b), c) and f) of the Argentine Central Bank Charter, (iii) credits granted by the Banking Liquidity Fund created by Decree No. 32 of December 26, 2001, secured by a mortgage and pledge and (iv) certain labor credits, including accrued interest until their total cancellation.
The holders of the following deposits are entitled to the general preferential right established by the Financial Institutions’ Law (following this order of preference),
| | • | | deposits of individuals or entities up to Ps.50,000 or the equivalent thereof in foreign currency, with only one person per deposit being able to use this preference. For the determination of this preference, all deposits of the same person registered by the entity shall be computed; |
| | • | | deposits in excess of Ps.50,000 or the equivalent thereof in foreign currency, referred to above; |
| | • | | liabilities originated on commercial credit lines granted to the financial entity, which are directly related with international trade. |
According to the Financial Institutions’ Law, the preferences set forth in previous paragraphs (i) and (ii)above, are not applicable to deposits held by persons who are affiliates of the financial entity, either directly or indirectly as determined by the Argentine Central Bank.
In addition, under section 53 of the Financial Institutions’ Law, the Argentine Central Bank has an absolute priority over all other creditors of the entity except as provided by the Financial Institutions’ Law.
Financial Institutions with Economic Difficulties
The Financial Institutions’ Law establishes that financial institutions, including commercial banks such as Banco Galicia, which evidence a deficiency in their cash reserves, have not complied with certain required technical standards, including minimum capital requirements, or whose solvency or liquidity is deemed to be impaired by the Argentine Central Bank must submit a restructuring plan to the Argentine Central Bank. Such restructuring plan must be presented to the Argentine Central Bank on the date specified by the Argentine Central Bank, which should not be later than 30 calendar days from the date on which the request is made by the Argentine Central Bank. In order to facilitate the implementation of a restructuring plan, the Argentine Central Bank is authorized to provide a temporary exemption from compliance with technical regulations and/or the payment of charges and fines that arise from such non-compliance.
-86-
The Argentine Central Bank may also, in relation to a restructuring plan presented by a financial institution, require such financial institution to provide guarantees or limit the distribution of profits, and appoint a supervisor, to oversee such financial institutions’ management, with the power to veto decisions taken by the financial institution’s corporate authorities.
In addition, the Argentine Central Bank’s charter authorizes the Superintendency, subject only to the prior approval of the president of the Argentine Central Bank, to suspend for up to 30 days, in whole or in part, the operations of a financial institution if its liquidity or solvency have been adversely affected. Notice of this decision must be given to the board of directors of the Argentine Central Bank. If at the end of such suspension period the Superintendency considers it is necessary to renew it, it can only be authorized by the board of directors of the Argentine Central Bank, for an additional period not to exceed 90 days. During the suspension period: (i) there is an automatic stay of claims, enforcement actions and precautionary measures; (ii) any commitment increasing the financial institution’s liabilities is void, and (iii) acceleration of indebtedness and interest accrual is suspended.
If, in the judgment of the Argentine Central Bank, a financial institution is in a situation which, under the Financial Institutions’ Law, would authorize the Argentine Central Bank to revoke the financial institution’s license to operate as such, the Argentine Central Bank may, prior to considering such revocation, order a variety of measures, including (1) taking steps to reduce, increase or sell the financial institution’s capital; (2) revoking the approval granted to the shareholders of the financial institution to own an interest therein, giving a term for the transfer of such shares; (3) excluding and transferring assets and liabilities; (4) constituting trusts with part or all the financial institution’s assets; (5) granting of temporary exemptions to comply with technical regulations and/or pay charges and fines arising from such defective compliance; or (6) appointing a bankruptcy trustee and removing statutory authorities.
Furthermore, any actions authorized, commissioned or decided by the Argentine Central Bank under section 35 bis of the Financial Institutions’ Law, involving the transfer of assets and liabilities, or complementing it, or necessary to execute the restructuring of a financial institution, as well as those related to the reduction, increase and sale of equity, are not subject to any court authorization and cannot be deemed inefficient in respect of the creditors of the financial institution which was the owner of the excluded assets, even though its insolvency preceded any of such actions.
Dissolution and Liquidation of Financial Institutions
The Argentine Central Bank must be notified of any decision to dissolve a financial institution pursuant to the Financial Institutions’ Law. The Argentine Central Bank, in turn, must then notify a court of competent jurisdiction which will determine who will liquidate the entity (the corporate authorities or an appointed, independent liquidator). This determination is based on whether or not sufficient assurances exist regarding the ability of such corporate authorities to carry out the liquidation properly.
Pursuant to the Financial Institutions’ Law, the Argentine Central Bank no longer acts as liquidator of financial institutions. However, when a restructuring plan has failed or is not considered viable, local and regulatory violations exist, or substantial changes have occurred in the financial institution’s condition since the original authorization was granted, the Argentine Central Bank may decide to revoke the license of the financial institution to operate as such. In this case, the law allows judicial or extrajudicial liquidation as in the case of voluntary liquidation described in the preceding paragraph.
The bankruptcy of a financial institution cannot be adjudicated until the license is revoked by the Argentine Central Bank. No creditor, with the exception of the Argentine Central Bank, may request the bankruptcy of the former financial institution before 60 days have elapsed since the revocation of its license.
-87-
Credit Cards Regulation
The Credit Cards Law establishes the general framework for credit card activities. Among other regulations, this law:
| | • | | sets a 3% cap on the rate a credit card company can charge merchants for processing customer card holders’ transactions with such merchants, calculated as a percentage of the customers’ purchases. With respect to debit cards, the cap is set at 1.5% and the amounts relating to the customers’ purchases should be processed in a maximum of 3 business days; |
| | • | | establishes that credit card companies must provide the Argentine Central Bank with the information on their loan portfolio that such entity requires; and |
| | • | | sets a cap on the interest rate a credit card company can charge a card holder, which cannot exceed by more than 25% the average interest rate charged by the issuer on personal loans and, for non-bank issuers, it cannot exceed by more than 25% the financial system’s average interest rate on personal loans (published by the Argentine Central Bank). |
Both the Argentine Central Bank and the National Undersecretary of Industry and Trade have issued regulations, among others, to enforce public disclosure of companies’ pricing (fees and interest rates) to ensure consumer awareness of such pricing.
Concealment and Laundering of Assets of a Criminal Origin
Law No. 25,246 (as amended by Laws No. 26,087, No. 26,119 and No. 26,268) incorporates money laundering as a crime under the Argentine Criminal Code. Additionally, with the goal of preventing and stopping money laundering, the UIF was created under the jurisdiction of the Argentine Ministry of Justice, Security and Human Rights.
Regulations in force establish, among other things, that:
| | i) | | Any person who converts, transfers, administers, sells, encumbers or uses money or any other asset derived from any crime in which he was not involved, with the possible result of giving those original or secondary assets the appearance of having a legal origin and as long as their value is greater than Ps.50,000, whether through a single act or through a series of related events, will be imprisoned for two to ten years and will be fined an amount that will be between two and ten times the amount of the transaction. |
| | ii) | | Any person that was not involved in a crime committed by another person but that (a) helps a person to elude or escape from an investigation by the relevant authority; (b) hides, alters or destroys any trail, evidence or object related to the crime or helps the perpetrator of the crime or any participant to hide them, alter them or make them disappear; (c) acquires, receives or hides money or objects arising from a crime; (d) does not report a crime or does not identify a perpetrator of or participant in a crime that is known to him when obligated to do so in order to promote the criminal prosecution of a crime of such nature; or (e) secures or helps the perpetrator of or participant in a crime to secure the product or profit of a crime, will be imprisoned for six months to three years. |
The minimum and maximum of the criminal scale will be doubled when (a) the foregoing acts were crimes that are particularly serious, meaning those crimes with a punishment that is greater than three years of imprisonment; (b) the perpetrator committed the crime for profit; and (c) the perpetrator regularly performs concealment activities. The criminal scale will only be increased once, even when more than one of the above-mentioned acts occurs. In such a case the court may take into consideration the multiple acts when individualizing the punishment.
In addition, regulations establish that: (a) within the framework of a review of reported suspicious activity, the persons that are obligated to provide information may not withhold information required by the UIF because such information is a banking, stock market or professional secret nor because it is legally or contractually confidential; (b) if after having completed its analysis of the reported activity, the UIF has found sufficient elements to suspect that the activity is a money laundering operation pursuant to the law, then the UIF shall notify the Public Ministry in order to determine if a criminal prosecution should begin; and (c) those persons who have acted for their spouse, any relative that is related by blood up to the fourth degree or by marriage up to the second degree or a close friend or a person to whom they owe special gratitude, shall be exempted from criminal responsibility.
-88-
Notwithstanding the foregoing, pursuant to the Argentine Criminal Code, the exemption shall not be effective in the following cases: (i) with respect to a person who secures or helps the perpetrator of or a participant in a crime to secure the product or profit of the crime; (ii) with respect to a perpetrator that committed the crime for profit; (iii) with respect to a perpetrator that regularly performs concealment activities; or (iv) with respect to a person that converts, transfers, administers, sells, encumbers or uses money or any other asset derived from any crime in which he was not involved, with the possible result of giving those original or secondary assets the appearance of having a legal origin and as long as their value is greater than Ps.50,000, whether through a single act or through a series of related events.
The law lists the parties that are obligated to report to the UIF; these parties include, among others: financial institutions, agents and stock companies, insurance companies, notary publics and those registered professionals whose activities are governed by theConsejo de Profesionales de Ciencias Económica(Economic Sciences Professional Council). Such reporting obligation generally consists of performing due diligence in order to get to know the client and in order to understand the corresponding transaction and, if applicable, in order to report any irregular or suspicious activity to the UIF, pursuant to the terms and conditions established by the regulation applicable to such obligated party.
Likewise, Law No. 26,119 modified the composition and the structure of the UIF, which is now comprised of a President and a Vice-president that are appointed by the executive branch based on a proposal made by the Argentine Ministry of Justice and an advisory council comprised of representatives of the Argentine Central Bank, the Argentine Revenue Service (“AFIP”), the CNV, the SEDRONAR (the Government’s secretary for the prevention of drug use and dealing), the Argentine Ministry of Justice, Security and Human Rights, the Argentine Ministry of Economy and the Argentine Ministry of Interior.
On June 13, 2007 Law No. 26,268 was enacted. Such law establishes the punishments and sanctions applicable to those individuals that are part of an unlawful association the purpose of which is, through the execution of crimes, the terrorizing of a population and the forcing of a government or an international organization to commit an act or refrain from committing an act, as long as the following characteristics are fulfilled: (a) there is a plan to spread hate regarding specific ethnic, religious or political groups; (b) the association has an international operational network; and (c) the association has at its disposal war weapons, explosives, chemical or bacterial agents or any other instruments that can put the life or safety of an uncertain number of people in danger.
In light of the above described framework, in 2000, Banco Galicia formed a Board Committee, the “Committee for the Control and Prevention of Money Laundering”, the name of which was changed in 2005 to the “Committee for the Control and Prevention of Money Laundering and Funding of Terrorist Activities”, which is in charge of establishing the general guidelines for Banco Galicia’s strategy to control and prevent money laundering and the financing of terrorism. For more information, see “Item 6. Directors, Senior Management and Employees-Functions of the Board of Directors of Banco Galicia”. In addition, a unit specializing in this area was created, the Anti-Money Laundering Unit, which is responsible for the execution of the policies passed by the committee and for the monitoring of control systems and procedures in order to ensure that they are adequate. CFA also has a Committee for the Control and Prevention of Money Laundering.
The “guide for unusual or suspicious transactions within the scope of the financial and foreign exchange system” (passed by Resolution No. 2/02 of the UIF) establishes the obligation to report the following investment related transactions: (a) investments related to purchases of government or corporate securities given in custody to the financial institution if such securities’ value appears to be inappropriate due to the type of business of the client; (b) deposits or “back to back” loan transactions with branches, subsidiaries or affiliates of the bank in places known to be “tax havens” or countries or territories considered by the Financial Action Task Force as non-cooperative, (c) client requests for investment management services (whether in foreign currency, shares or trusts) where the source of the funds is not clear or is not consistent with its business; (d) significant and unusual movements in custodial accounts; (e) frequent use by infrequent clients of special investment accounts whose owner is the financial entity; and (f) regular securities transactions, through purchases and sales on the same day and for identical volumes and nominal values, taking advantage of quotation differences, when such transactions are not consistent with the client’s profile and regular activity.
-89-
| | |
| Item 4A. | | Unresolved Staff Comments |
None.
| | |
| Item 5. | | Operating and Financial Review and Prospects |
| | |
| Item 5.A. | | Operating Results |
The following discussion and analysis is intended to help you understand and assess the significant changes and trends in our historical results of operations and the factors affecting our resources. You should read this section in conjunction with our audited consolidated financial statements and their related notes included elsewhere in this annual report.
Overview
In the last three years, in order to increase our recurrent earnings generation capacity, we have undertaken to:
| | • | | Expand the volume of our business with the private sector; |
| | • | | Progressively strengthen our balance sheet by consistently reducing Banco Galicia’s high exposure to the public sector, as well as those liabilities incurred by Banco Galicia as a consequence of the 2001-2002 crisis, and |
| | • | | Capitalize Banco Galicia. |
This strategy responds to the consequences of the 2001-2002 crisis on us, which left Banco Galicia with a very low exposure to the private sector and an unusually high and low yielding exposure to the public sector with expensive liabilities supporting such assets, mainly our restructured foreign debt. Therefore, we have undertaken to significantly increase the relative size of our business with the private sector in terms of our total balance sheet, reducing low yielding public-sector assets, strengthening our balance sheet and improving our bottom line. In addition we have undertaken to increase Banco Galicia’s capital in order for it to be able to support the growth of its business.
Our strategy for reducing Banco Galicia’s liabilities has been to use Banco Galicia’s public-sector exposure to repay them, through the proceeds of sales at market conditions in order to minimize the impact on our shareholders’ equity.
We reduced our exposure to the public sector from Ps.6,054.3 million to Ps.3,944.5 million between December 31, 2008 and December 31, 2010, representing a reduction of Ps.2,109.8 million or 34.8% of the former amount.
We have increased our regulatory capital through the purchase of CFA and through internal origination (positive results).
We have expanded our operations significantly since mid 2002, increasing our customer base and our fee based and financial intermediation activities with the private sector, strengthening our position as a leading domestic private-sector financial institution. In addition, our total deposits (which began to increase in the second half of 2002) and loan origination (which began to increase gradually in 2003) increased, both at the level of Banco Galicia and at the level of the Regional Credit Card Companies, and since June 2010 also at the level of CFA.
The increase in our overall level of activity, which led to the above-mentioned increase in the volume of our fee based business and financial intermediation with the private sector, has had a positive impact on our net financial income and on our net income from services. At the beginning of the recovery of the Argentine economy, the decreasing risk profile of the loan portfolio reduced the need to establish loan loss reserves and the improvement in the quality of the loan portfolio allowed for the reversal of provisions and strong loan recoveries, which reduced the impact of net credit losses on our bottom line. Nevertheless this effect decreased progressively, and loan loss provisions increased due to the seasoning of individuals’ loan portfolios and to the incorporation of CFA’s loan portfolio since June 2010.
-90-
During this period, following the expansion of our business volume we decided to expand our distribution network, with a related increase in personnel and a greater use of resources in general, as well as considerable expenses for advertising and publicity. In addition, the administrative expenses reflect an inflationary environment and the adjustment of salaries that has taken place.
During 2008, and the first half of 2009, the international financial crisis and certain preexisting domestic problems and the Government’s decision to nationalize the private pension funds system dampened domestic confidence and raised uncertainty regarding future economic policies. The uncertainty triggered a strong dollarization of portfolios, with a reduction of private sector Peso deposits, and, in turn, a deceleration in growth rates of the loans to the private sector and a deterioration of asset quality. In spite of the adverse international and local financial condition, Banco Galicia managed to expand its business with the private sector and to improve its income generation, while strengthening its financial condition, the coverage of its credit risks in a scenario of deterioration of asset quality, and the provisioning for other contingencies.
The second half of 2009 showed a recovery of the world economy and of the local economy, which favorably impacted deposits and loan growth with an improvement in asset quality that extended throughout 2010.
In summary, in recent years, our results of operations were still influenced by the negative effect on our net financial income of certain consequences of the 2001-2002 crisis and the 2008 and beginning of 2009 financial crisis. However, our operating profitability was positively impacted by the strengthening of our balance sheet, including the progressive reduction of public-sector assets and liabilities and the growth of our business with the private sector, both the financial intermediation and fee based businesses, in a still low credit risk environment, but within a context of growing inflation.
Banco Galicia has finished with most of the negative effects of the 2001-2002 crisis during 2010 (i.e. amortization ofamparo claims) and profitability should continue to increase during 2011.
The Argentine Economy
During 2010, the global economy continued to experience the economic recovery that began in 2009. However, 2010 was not without fears of a recessionary relapse. In particular, doubts in the U.S. began to surface mid-year relating to the strength of its recovery, which influenced the U.S. Federal Reserve to maintain a highly expansionary monetary policy. In Europe, although gradual improvements in economic performance were evident, doubts about the financial health of some countries created uncertainty and impacted negatively the international financial markets. In order to calm nervousness and defend the Euro, the European Central Bank intervened through purchases of troubled sovereign debt and aid packages in conjunction with the IMF. Relaxed monetary policy in advanced economies generated an environment of low rates and abundant liquidity, from which emerging economies benefited, receiving much of the international flow of funds seeking higher yields.
Within this favorable economic environment, accompanied by increased Argentine export prices, the Argentine economy began to experience the economic recovery that had begun worldwide during the second half of 2009. A significant recovery took place in the agricultural sector, after the drought during 2008 and 2009, which contributed extensively to the recent overall Argentine economic recovery. The financial sector benefited from the favorable international economic climate and the relatively low level of domestic political and social volatility. Growth of over 9% was achieved by the Argentine economy from the fiscal year ended December 31, 2009 to the fiscal year ended December 31, 2010. According to the General Activity Index prepared by Orlando J. Ferreres y asociados’ Consulting Firm (IGA-OJF), the Argentine economy experienced an 8.2% expansion in 2010. The Argentine economy was expanding at a seasonally adjusted quarterly average rate of 3.2% during the first half of 2010, driven in large part by the contribution of the agricultural sector. By the second half of 2010, a slight slowdown occurred in the pace of economic growth, with average quarterly growth of 0.9% (seasonally adjusted).
The highest performing production sector of the Argentine economy was agriculture, with an annual expansion of 19.7%, followed by manufacturing (10.5% expansion) and trade (9.4% expansion). After the severe drought of 2009, crops recovered significantly and showed an increase of 55% over the previous year. In addition, during 2010, certain service sectors experienced growth, such as health services (2.2% expansion), public administration (3.2% expansion) and electricity, gas and water supply (3.4% expansion). These sectors were the least affected by the economic crisis of 2008/2009.
-91-
The industrial sector, as determined by the Industrial Production Index prepared by FIEL (IPI-FIEL), experienced an 8.8% increase in 2010, making a strong recovery. Among the highest performing sectors of the economy was the automotive sector, with a 43.1% increase in 2010, and the iron and steel industry, with a 23.1% increase during the same period. These sectors experienced the highest levels of contraction during the economic crisis of 2008/2009. The industrial sector benefited from increased demand generated by the global recovery, in particular in Brazil, the largest buyer of the Argentine automotive sector, for example.
The unemployment rate for the fiscal year ended December 31, 2010 fell to 7.5% of the “economically active population” in Argentina, or the segment of the Argentine population that is employed, or unemployed and actively seeking employment, from 8.4% for fiscal year ended December 31, 2009, reflecting a moderate increase in the performance of the labor market.
In the monetary sector, the primary indicators experienced increases during the fiscal year ended December 31, 2010. The monetary base ended the fiscal year ended December 31, 2010 with an expansion of 31.6%, as compared to 15.7% for the fiscal year ended December 31, 2009. The Ps.38,100 million expansion experienced during the fiscal year ended December 31, 2010 was mainly attributable to the intervention of the Argentine Central Bank in the foreign exchange market in the amount of Ps.46,300 million, and was partially offset by the contraction of the availability of domestic credit in the amount of Ps.8,200 million. The expansion was also attributable in large part to the issuance by the Argentine Central Bank of various securities in the aggregate amount of Ps.20,300 million. Due to transactions carried out with the government, the monetary base expanded by Ps.19,500 million, mainly as a result of the transfer of the Argentine Central Bank’s 2009 profits to the Argentine Treasury Department.
This trend was also reflected in the performance of the private M2 (money in circulation and deposits in savings and checking accounts, in Pesos, that belong to the private sector), which grew by 33.1% in the fiscal year ended December 31, 2010, as compared to the fiscal year ended December 31, 2009, an increase of more than 3 percentage points above the target set by the monetary program, which was updated during the second half of 2010. As of December 31, 2010, the total M2 (i.e., a money supply indicator that is an aggregate of all publicly held money in circulation plus public and private sector savings and checking account deposits denominated in Pesos) experienced an expansion of 28.1%.
Interest rates remained relatively stable throughout 2010, although during the last months they have exhibited a slight upward trend, which could be explained by the strong growth in credit and the consequent reduction of liquidity in the financial system.
The reference exchange rate established by the Argentine Central Bank increased from Ps.3.797 to Ps.3.976 per Dollar between December 31, 2009 and December 31, 2010 (equivalent to a 4.7% depreciation), while the average exchange rate increased from Ps.3.731 per Dollar in 2009 to Ps.3.913 per Dollar in 2010.
Inflation for 2010 amounted to 10.9%, as measured by the CPI of the INDEC, higher than the 7.7% recorded in 2009. The WPI experienced a 14.6% increase.
According to private sector estimates, consumer prices increased 22.9% in 2010. Food and beverage prices experienced an increase that was 10 percentage points above a normal annual increase. Increases in beef prices contributed 4.5 percentage points to the overall 22.9% increase in consumer prices.
In the fiscal area, the recovery in activity levels and the upward trend in prices, coupled with the excellent performance of the external sector (mainly in volume, but prices did rebound by the end of the year), resulted in a 35.2% increase in tax revenue (including social security) for 2010. Growth in spending was 33.9% in 2010, reaching a growth rate of almost 40% by the end of the fiscal year. The Argentine public sector achieved a surplus of Ps.25,115 million in 2010, equivalent to 1.7% of GDP, in line with that observed in 2009. After the payment of interest of Ps.22,047 million, the financial surplus amounted to Ps.3,068 million, equivalent to 0.2% of GDP. See “Risk Factors-Risk Factors Relating to Argentina-Inflation could increase from current levels, and materially and adversely affect the Argentine economy and Grupo Financiero Galicia’s financial position and business”.
-92-
The balance of payments on current accounts maintained a surplus as a result of the high excess in the country’s trade balance. However, in terms of GDP, Argentina would have experienced a significant decrease, from 3.6% in the fiscal year ended December 31, 2009, to 0.9% in the fiscal year ended December 31, 2010. The trade balance showed a US$12,057 million surplus in 2010, lower than the US$16,980 million of the previous year.
Exports showed a significant recovery, expanding 23% from the previous year, which was mainly attributable to the increase of 18% in export volumes. Commodities, which included increased demand for Argentina’s crops, displayed an increase of 63% (almost all by volume). Prices began to trend upwards towards year-end 2010, which indicates healthy economic growth for fiscal year 2011. The global recovery generally, and the recovery of Brazil’s economy specifically, impacted positively the performance of Argentina’s industrial goods, which expanded 28% in 2010. Imports in the fiscal year ended December 31, 2010 also grew by nearly 46% when compared to the fiscal year ended December 31, 2009.
Within a framework of a gradual improvement in the international economy, private sector capital experienced a net foreign currency outflow of US$844 million during the first nine months of 2010, sharply below the outflow of US$8,963 million during the same period in 2009. In fact, the third quarter of 2010 exhibited a net income of US$974 million and it is estimated that when these figures are released, the fourth quarter of 2010 will be in line with the third quarter. Thus, the fiscal year ended December 31, 2010 ended with an almost neutral capital outflow, following an outflow of more than US$8,000 million for the fiscal year ended December 31, 2009. As of December 31, 2010, the Argentine Central Bank’s international reserves amounted to US$52,190 million, US$4,222 million above the amount held as of December 31, 2009.
The Argentine Financial System
The situation described above with respect to the general Argentine economy had a positive impact on the Argentine financial system, resulting in an increase in the levels of private sector intermediation, while still far from the levels reached by Argentina prior to the 2001-2002 Argentine economic crisis and those reached by neighboring countries such as Chile and Brazil.
The financial system’s total deposits grew by 38.7% during the fiscal year ended December 31, 2010, reaching Ps.373,862 million; deposits from the non-financial private sector increased 29.7%, amounting to Ps.256,028 million; and public sector deposits were Ps.115,841 million, an increase of 67.9% over the fiscal year ended December 31, 2009. Total deposits from the private sector, as of December 31, 2010, were composed of savings and current account deposits in the amount of Ps.138,036 million and time deposits in the amount of Ps.107,401 million, which represented increases of 34.3% and 25.4%, respectively.
Total loans to the private sector grew by 37.8% from the fiscal year ended December 31, 2009 to the fiscal year ended December 31, 2010, reaching Ps.197,279 million. The fastest growing category was that of short-term commercial loans, consisting of cash advances in current accounts and promissory notes, which experienced an increase of 45.8%, and were Ps.61,780 million as of December 31, 2010. Consumer loans for the fiscal year ended December 31, 2010, which include credit cards and personal loans, were Ps.68,894 million, a 37.2% increase over the fiscal year ended December 31, 2009. Secured loans rose by 34.5%, with a balance as of December 31, 2010 of Ps.9,841 million, while mortgage loans were Ps.21,093 million for the fiscal year ended December 31, 2010, an increase of 13.3% over the fiscal year ended December 31, 2009. Loans to the public sector accounted for 12.2% of total assets, declining 2.3 percentage points during the fiscal year ended December 31, 2010, far from the 48.9% decrease in 2002.
The average interest rate paid by private banks in December 2010 (deposits for up to 59 days) was 10.29%, an increase of 58 b.p.’s from December 2009. The average interest rate applicable to time deposits in Pesos over Ps.1 million was 11.11% for the fiscal year ended December 31, 2010, an increase of 130 b.p. from the fiscal year ended December 31, 2009. As of December 31, 2010, the interest rates applicable to cash advances reached 19.23%, which represented a decrease of 205 b.p. from the fiscal year ended December 31, 2009, even though interest rates applicable to cash advances in amounts over Ps.10 million experienced a rise of 40 b.p. and were at 11.1% as of December 31, 2010.
-93-
During the fiscal year ended December 31, 2010, financial institutions, such as Banco Galicia, increased their levels of liquidity relative to total deposits, further contributing to financial stability. The average liquidity ratio decreased from an average of 28.6% in December 2009 to 28% in December 2010.
The Argentine Central Bank placed debt securities, Lebac and Nobac, in the amount of Ps.26,598 million during the fiscal year ended December 31, 2010, which grew a combined 60.5% as compared to 2009, reaching Ps.70,578 million as of December 31, 2010. In addition to this growth, the private M2 exceeded by 3.2% the maximum limit established by the Argentine Central Banks’ monetary program, a tool that it uses to make projections relating to the performance of monetary policy instruments, reaching an average balance of Ps.220,534 million, equivalent to a growth of 33.1%. Purchases of foreign currency by the Argentine Central Bank in the foreign exchange market and loans by entities in the Argentine financial system to the private sector were major factors in the growth of the overall monetary supply in Argentina during the period, which monetary supply is measured by the Argentine Central Bank using the following indicators: M1, or publicly held money in circulation and public and private sector checking accounts in Pesos, M2 (described above) and M3, or publicly held money in circulation and total public and private sector deposits in Pesos.
The Argentine financial system’s net worth increased by Ps.9,247 million during the fiscal year ended December 31, 2010, which represents a 19.1% improvement from the fiscal year ended December 31, 2009. The system’s profitability in 2010 was equivalent to 2.8% of total assets, while return on shareholders’ equity was 24.3%, higher than the 19.2% recorded in 2009 and the 13.4% recorded in 2008. Income from interests and services represented 4.3% and 3.8% of total assets, respectively. The increase in the listed prices of government securities led to an improvement in income from holding such securities, representing 3.3% of total assets.
Administrative expenses increased slightly, from 6.7% of total assets in the fiscal year ended December 31, 2009 to 6.8% of total assets in the fiscal year ended December 31, 2010. Provisions for loan losses decreased from 1.1% of total assets in 2009 to 0.8% of total assets in 2010, reflecting an improvement in portfolio quality. In line with such performance, the non-accrual loan portfolio to the non-financial private sector decreased from 3.5% in December 2009 to 2.3% in November 2010, representing the latest data available. Within the context of conservative monetary policy, coverage of the private sector non-accrual loan portfolio (with allowances) continued to grow, reaching the record levels of 157.1% in December 2010, a 126.2% increase over December 2009.
As of December 31, 2010, 80 financial institutions were in operation, taking into account both banking and non-banking institutions. Of these 80, 64 were banks, 52 of which were private-sector banks (accounting for 52.8% of total deposits in the financial system). In turn, 32 were domestic banks, one of which was a cooperative bank (accounting for 28.8% of total deposits) and 20 were foreign-owned banks (which represented 23.99% of total deposits). There were 12 government-owned banks (which represented 46.9% of total deposits), and there were 16 non-banking financial institutions, with only a 0.3% share of total deposits.
The concentration of the financial system, measured by the deposit-market share of the ten leading banks, reached 76.96% as of December 31, 2010. This percentage was 0.86 percentage points higher than the market share recorded as of December 31, 2009.
Based on information as of December 2010, the financial system employed a total of 99,739 people, 62.2% of which were employed by the private sector, representing a 2.33% increase since the beginning of 2010.
The Argentine Insurance Industry
During 2010, the insurance industry continued to experience growth. Production amounted to Ps.41,202.9 million, 15.8% higher than the level recorded for 2009, at constant values. Out of the total insurance production, 81% related to property insurance, 17% related to life and personal insurance, and 2% related to retirement insurance. Within the 81% corresponding to property insurance, the automotive insurance segment continues to be the most significant one (45%), followed by the workers’ compensation segment (29%).
Within the life insurance business, the group life insurance segment is the most significant, representing 65%, followed by individual life insurance, representing 16%, and personal accident insurance, representing 13%.
-94-
Inflation
Historically, inflation in Argentina has played a significant role in influencing, often negatively, the economic conditions in Argentina and, in turn, the operations and financial results of companies operating in Argentina, such as Grupo Financiero Galicia.
The chart below presents a comparison of inflation rates published by INDEC, measured by the wholesale price index and the consumer price index, for the fiscal years 2010, 2009 and 2008. In addition, the chart below presents the evolution of the CER index, published by the Argentine Central Bank, used to adjust the principal of certain of our assets and liabilities, for the periods indicated.
| | | | | | | | | | | | | |
| | | For the 12-month period ended December 31, | |
| (in percentages) | | 2010 | | | 2009 | | | 2008 | |
Price Indices(1) (2) | | | | | | | | | | | | |
| Wholesale Price Index (“WPI”) | | | 14.56 | | | | 10.27 | | | | 8.82 | |
| Consumer Price Index (“CPI”) | | | 10.92 | | | | 7.69 | | | | 7.24 | |
| Adjustment Indices | | | | | | | | | | | | |
| CER | | | 11.04 | | | | 6.95 | | | | 7.97 | |
| | | |
| (1) | | Data for December of each year as compared to December of the immediately preceding year. Source: INDEC/the Argentine Central Bank. |
| |
| (2) | | The accuracy of the measurements of the INDEC is in doubt, and the actual consumer price index and wholesale price index could be substantially higher than those indicated by the INDEC. For example, according to private sector estimates, the consumer price index increased by 19.4% (rather than 7.2%) in 2008, 16.3% (rather than 7.7%) in 2009 and 22.9% (rather than 10.9%) in 2010. |
In the first five months of 2011, the WPI increased 5.02% and the CPI increased 3.94%. Over the same period, the CER increased 4.03%.
Currency Composition of Our Balance Sheet
The following table sets forth our assets and liabilities denominated in foreign currency, in Pesos and adjustable by the CER, at the dates indicated.
| | | | | | | | | | | | | |
| | | As of December 31, | |
| | | 2010 | | | 2009 | | | 2008 | |
| | | (In millions of Pesos) | |
Assets | | | | | | | | | | | | |
| In Pesos, Unadjusted | | | 28,319.4 | | | | 19,791.0 | | | | 15,165.1 | |
| In Pesos, Adjusted by the CER | | | 610.8 | | | | 926.3 | | | | 2,439.2 | |
In Foreign Currency(1) | | | 6,777.9 | | | | 6,885.1 | | | | 7,131.5 | |
| | | | | | | | | | |
Total Assets | | | 35,708.1 | | | | 27,602.4 | | | | 24,735.8 | |
| | | | | | | | | | |
Liabilities and Shareholders’ Equity | | | | | | | | | | | | |
| In Pesos, Unadjusted, Including Shareholders’ Equity | | | 28,059.5 | | | | 20,513.1 | | | | 17,262.1 | |
| In Pesos, Adjusted by the CER | | | 13.6 | | | | 14.9 | | | | 50.3 | |
In Foreign Currency(1) | | | 7,635.0 | | | | 7,074.3 | | | | 7,423.4 | |
| | | | | | | | | | |
Total Liabilities and Shareholders’ Equity | | | 35,708.1 | | | | 27,602.3 | | | | 24,735.8 | |
| | | | | | | | | | |
| | | |
| (1) | | If adjusted to reflect forward sales and purchases of foreign exchange made byBanco Galicia and recorded off-balance sheet, assets amounted to Ps.10,186.3 million and liabilities to Ps.10,210.2 million. |
Funding of our long position in CER-adjusted assets through Peso-denominated liabilities bearing a market interest rate (and no principal adjustment linked to inflation) exposes us to differential fluctuations in the inflation rate and in market interest rates, with a significant increase in market interest rates vis-à-vis the inflation rate (which is reflected in the CER variation) having a negative impact on our net financial income.
-95-
Results of Operations for the Fiscal Years Ended December 31, 2010, December 31, 2009 and December 31, 2008
We discuss below our results of operations for the fiscal year ended December 31, 2010 as compared with our results of operations for the fiscal year ended December 31, 2009, and our results of operations for the fiscal year ended December 31, 2009 as compared with our results of operations for the fiscal year ended December 31, 2008.
Net Income/Loss
| | | | | | | | | | | | | | | | | | | | | |
| | | Fiscal Year Ended | | | Change | |
| | | December 31, | | | December 31, | |
| | | 2010 | | | 2009 | | | 2008 | | | 2010/2009 | | | 2009/2008 | |
| | | (in millions of Pesos, except percentages) | |
Consolidated Income Statement | | | | | | | | | | | | | | | | | | | | |
| Financial Income | | | 3,616.1 | | | | 3,005.6 | | | | 2,559.3 | | | | 610.5 | | | | 446.3 | |
| Financial Expenses | | | 1,412.7 | | | | 1,460.5 | | | | 1,421.0 | | | | (47.8 | ) | | | 39.5 | |
| Net financial Income | | | 2,203.4 | | | | 1,545.1 | | | | 1,138.3 | | | | 658.3 | | | | 406.8 | |
| Provision for Losses on Loans and Other Receivables | | | 551.5 | | | | 639.5 | | | | 395.4 | | | | (88.0 | ) | | | 244.1 | |
| Net income from Services | | | 1,781.9 | | | | 1,310.9 | | | | 1,187.9 | | | | 471.0 | | | | 123.0 | |
| Administrative Expenses | | | 2,845.3 | | | | 2,029.1 | | | | 1,781.1 | | | | 816.2 | | | | 248.0 | |
| Minority Interest | | | (104.3 | ) | | | (46.5 | ) | | | (35.8 | ) | | | (57.8 | ) | | | (10.7 | ) |
| Income / (Loss) from Equity Investments | | | 62.1 | | | | 11.3 | | | | 56.8 | | | | 50.8 | | | | (45.5 | ) |
| Miscellaneous Income / (Loss), Net | | | 120.8 | | | | 233.1 | | | | 80.1 | | | | (112.3 | ) | | | 153.0 | |
| Income Tax | | | (258.2 | ) | | | (156.0 | ) | | | (74.0 | ) | | | (102.2 | ) | | | (82.0 | ) |
| | | | | | | | | | | | | | | | |
Net income / (Loss) | | | 408.9 | | | | 229.3 | | | | 176.8 | | | | 179.6 | | | | 52.5 | |
| | | | | | | | | | | | | | | | |
Return on Average Assets(1) | | | 1.8 | | | | 1.1 | | | | 0.9 | | | | 0.6 | | | | 0.2 | |
| Return on Average Shareholders’ Equity | | | 18.6 | | | | 11.7 | | | | 10.1 | | | | 6.9 | | | | 1.6 | |
| | | |
| (1) | | For the calculation of the return on average assets, profits or losses corresponding to minority interests are excluded from net income. |
Net income for the fiscal year ended December 31, 2010 was Ps.408.9 million, as compared to Ps.229.3 million for the fiscal year ended December 31, 2009 and Ps.176.8 million for the fiscal year ended December 31, 2008.
Net earnings per share for the fiscal year ended December 31, 2010 were Ps.0.329, as compared to Ps.0.185 for the fiscal year ended December 31, 2009. The return on average assets and the return on average shareholders’ equity for the fiscal year ended December 31, 2010 were 1.8% and 18.6%, respectively, as compared to 1.1% and 11.7%, respectively, for the fiscal year ended December 31, 2009. For the fiscal year ended December 31, 2008, net income per share was Ps.0.142, the return on average assets was 0.9% and the return on average shareholders’ equity was 10.1%.
Fiscal Year 2010 Compared to Fiscal Year 2009
Net income for the fiscal year ended December 31, 2010 was Ps.408.9 million, as compared to Ps.229.3 million for the fiscal year ended December 31, 2009, a Ps.179.6 million increase, or 78.3%. Such increase was primarily attributable to:
| | • | | a Ps.610.5 million increase in financial income, from Ps.3,005.6 million to Ps.3,616.1 million, |
| | • | | a Ps.471.0 million increase in net income from services, from Ps.1,310.9 million to Ps.1,781.9 million, |
| | • | | a Ps.88.0 million decrease in provisions for loan losses, from Ps.639.5 million to Ps.551.5 million, |
| | • | | a Ps.47.8 million decrease in financial expenses, from Ps.1,460.5 million to Ps.1,412.7 million, |
| | • | | an increase of Ps.50.8 million in income from equity investments, from Ps.11.3 million to Ps.62.1 million. |
-96-
Such changes were partially offset by:
| | • | | a Ps.816.2 million increase in administrative expenses, from Ps.2,029.1 million to Ps.2,845.3 million, |
| | • | | a Ps.112.3 million decrease in miscellaneous net loss, from Ps.233.1 million to Ps.120.8 million, and |
| | • | | an increase in income tax of Ps.102.2 million, from Ps.156.0 million to Ps.258.2 million. |
The operating income for the fiscal year ended December 31, 2010 was Ps.3,985.3 million, as compared to Ps.2,856.0 million for the fiscal year ended December 31, 2009. Such increase was primarily attributable both to a Ps.658.3 million higher net financial income (Ps.282.2 million of which corresponded to CFA) and a Ps.471.0 million higher net income from services (Ps.14.7 million of which corresponded to CFA).
Fiscal Year 2009 Compared to Fiscal Year 2008
During fiscal year 2009, net income amounted to Ps.229.3 million, a Ps.52.5 million increase compared to the previous fiscal year. This increase was mainly attributable to:
| | • | | a Ps.446.3 million increase in financial income, from Ps.2,559.3 million to Ps.3,005.6 million, |
| | • | | a Ps.153.0 million increase in miscellaneous net income, from Ps.80.1 million to Ps.233.1 million, and |
| | • | | a Ps.123.0 million increase in net income from services, from Ps.1,187.9 million to Ps.1,310.9 million. |
These factors were partially offset by:
| | • | | a Ps.244.1 million increase in provisions for loan losses from Ps.395.4 million to Ps.639.5 million, |
| | • | | a Ps.248.0 million increase in administrative expenses, from Ps.1,781.1 million to Ps.2,029.1 million, |
| | • | | an increase in income tax of Ps.82.0 million, from Ps.74.0 million to Ps.156.0 million, and |
| | • | | a decrease of Ps.45.5 million in income from equity investments, from Ps.56.8 million to Ps.11.3 million. |
Financial Income
Our financial income was composed of the following:
| | | | | | | | | | | | | |
| | | Fiscal Year Ended | |
| | | December 31, | |
| | | 2010 | | | 2009 | | | 2008 | |
| | | (in millions of Pesos) | |
| Income on Loans and Other Receivables Resulting from Financial Brokerage and Premiums Earned on Reverse Repurchases | | | 3,061.3 | | | | 2,207.7 | | | | 1,930.3 | |
| Income from Government and Corporate Securities, Net | | | 409.2 | | | | 559.1 | | | | 238.1 | |
| CER Adjustment | | | 5.3 | | | | 24.4 | | | | 123.9 | |
Other(1) | | | 140.3 | | | | 214.4 | | | | 267.0 | |
| | | | | | | | | | |
Total | | | 3,616.1 | | | | 3,005.6 | | | | 2,559.3 | |
| | | | | | | | | | |
| | | |
| (1) | | Reflects income from financial leases, net, and differences in the quotation of gold and foreign currency as well as premiums on forward sales of foreign exchange. |
-97-
The following table shows our yields on interest-earning assets and cost of funds:
| | | | | | | | | | | | | | | | | | | | | | | | | |
| | | As of December 31, | |
| | | 2010 | | | 2009 | | | 2008 | |
| | | Average | | | | | | | Average | | | | | | | Average | | | | |
| | | Balance | | | Rate | | | Balance | | | Rate | | | Balance | | | Rate | |
| | | (in millions of Pesos, except rates) | |
Interest-Earning Assets | | | 21,983.3 | | | | 16.35 | | | | 18,378.0 | | | | 15.71 | | | | 19,892.5 | | | | 12.14 | |
| | | | | | | | | | | | | | | | | | | |
| Government Securities | | | 3,344.1 | | | | 11.56 | | | | 4,686.5 | | | | 11.84 | | | | 3,642.2 | | | | 4.08 | |
| Loans | | | 16,800.8 | | | | 18.56 | | | | 11,463.6 | | | | 19.34 | | | | 12,077.3 | | | | 17.01 | |
| Other | | | 1,838.4 | | | | 4.85 | | | | 2,227.9 | | | | 5.17 | | | | 4,173.0 | | | | 5.09 | |
| | | | | | | | | | | | | | | | | | | |
Interest-Bearing Liabilities | | | 16,662.5 | | | | 6.56 | | | | 15,923.4 | | | | 7.63 | | | | 15,694.5 | | | | 8.14 | |
| | | | | | | | | | | | | | | | | | | |
| Current Accounts | | | 508.1 | | | | 1.08 | | | | 1,287.3 | | | | 1.00 | | | | 948.1 | | | | 2.28 | |
| Savings Accounts | | | 4,016.2 | | | | 0.19 | | | | 3,014.5 | | | | 0.19 | | | | 2,587.7 | | | | 0.18 | |
Time Deposits(1) | | | 8,554.3 | | | | 8.81 | | | | 7,391.9 | | | | 11.67 | | | | 6,769.4 | | | | 11.34 | |
| Argentine Central Bank | | | 0.7 | | | | — | | | | 0.6 | | | | — | | | | 0.4 | | | | — | |
| Debt Securities | | | 2,276.1 | | | | 10.04 | | | | 2,729.9 | | | | 8.22 | | | | 2,799.8 | | | | 10.00 | |
| Other Interest-bearing Liabilities | | | 1,307.1 | | | | 7.50 | | | | 1,499.2 | | | | 7.34 | | | | 2,589.1 | | | | 7.86 | |
Spread and Net Yield | | | | | | | | | | | | | | | | | | | | | | | | |
Interest Spread, Nominal Basis(2) | | | | | | | 9.79 | | | | | | | | 8.08 | | | | | | | | 4.00 | |
Net Yield on Interest-earning Assets(3) | | | | | | | 11.38 | | | | | | | | 9.10 | | | | | | | | 5.72 | |
Financial Margin(4) | | | | | | | 10.02 | | | | | | | | 8.41 | | | | | | | | 5.72 | |
| | | |
| (1) | | Includes restructured deposits certificates and restructured deposits with amparo claims. |
| |
| (2) | | Reflects the difference between the average nominal interest rate on interest-earning assets and the average nominal interest rate on interest-bearing liabilities. Interest rates include the CER adjustment. |
| |
| (3) | | Net interest earned divided by average interest-earning assets. Interest rates include the CER adjustment. |
| |
| (4) | | Represents net financial income, divided by average interest-earning assets. |
Fiscal Year 2010 Compared to Fiscal Year 2009
Financial income for the fiscal year ended December 31, 2010 was Ps.3,616.1 million, as compared to Ps.3,005.6 million for the fiscal year ended December 31, 2009, a 20.3% increase. Such increase was the result of a higher average volume of interest-earning assets together with higher average yield.
The average yield on interest-earning assets for the fiscal year ended December 31, 2010 was 16.35%, as compared to 15.71% for the fiscal year ended December 31, 2009, a 64 b.p. increase. Such increase was primarily attributable to a change in the mix of interest earning assets, for example, loan participations grew from 62.4% to 76.4% of total interest-earning assets, while the remaining individual components of “Interest-Earning Assets” (“Government Securities” and “Other Interest-Earning Assets”) experienced decreases. See the table “Yield on Interest-Earning Assets and Cost of Funds” above.
The average interest-earning assets for the fiscal year ended December 31, 2010 was Ps.21,983.3 million, as compared to Ps.18,378.0 million for the fiscal year ended December 31, 2009, a 19.6% increase, which was primarily attributable to the 46.6% growth in the average loan portfolio. Such increase was partially offset by the 28.6% decrease in the average balance of the net position in government securities.
The average loan portfolio balance for the fiscal year ended December 31, 2010 was Ps.16,800.8 million, as compared to Ps.11,463.6 million for the fiscal year ended December 31, 2009, a 46.6% increase, which was primarily attributable to the growth of both loans to individuals and to companies. Excluding CFA’s average loans of Ps.640.4 million, such increase was 41.0%. Taking into account fiscal year end balances of loans to the private sector, such increase was 56.9% or Ps.8,110.1 million. Excluding the CFA portion of loans, such increase was 47.2%. These increases are net of charge-offs against allowances for loan losses during the fiscal year ended December 31, 2010.
The estimated market share of loans to the private sector, without considering those granted by the regional credit card companies and by CFA, was 8.28% as of December 31, 2010, as compared to 7.67% as of December 31, 2009, a 61 b.p. increase. Including loans granted by CFA, such market share reached 8.95% as of December 31, 2010.
-98-
The average balance of loans to the public sector for the fiscal year ended December 31, 2010 was Ps.0.4 million, as compared to Ps.120.0 million for the fiscal year ended December 31, 2009, a Ps.119.6 million decrease, which was mainly attributable to the exchange transaction ofpréstamos garantizados nacionales, or secured loans (“PGN”), for Argentine government securities carried out in January 2009. Loans to the private sector for the fiscal year ended December 31, 2010 were Ps.16,800.4 million, as compared to Ps.11,343.6 million for the fiscal year ended December 31, 2009, a Ps.5,456.8 million or 48.1% increase, in line with the increase experienced by the Argentine market in general. Taking into account fiscal year end balances of loans to the private sector, such increase amounted to Ps.8,110.1 million, a 56.9% increase. These increases are net of charge-offs against allowances for loan losses for the fiscal year ended December 31, 2010.
The average interest rate on total loans, including the CER adjustment, was 18.56% for the fiscal year ended December 31, 2010, as compared to 19.34% for the fiscal year ended December 31, 2009, a decrease of 78 b.p. Such decrease was mainly attributable to the factors discussed below. The portfolio of loans to the private sector accrued at an 18.56% average interest rate and the public-sector loan portfolio accrued at a 0.20% average interest rate, including the CER adjustment, for the fiscal year ended December 31, 2010, as compared to 19.31% and 22.50%, respectively, for the fiscal year ended December 31, 2009. Such decreases were mainly attributable to the factors discussed below.
The average interest rate for the fiscal year ended December 31, 2010 on Peso-denominated loans to the private sector was 21.16%, as compared to 21.73% for the fiscal year ended December 31, 2009, a 57 b.p. decrease. The average interest rate on foreign currency denominated loans to the private sector for the fiscal year ended December 31, 2010 was 4.45%, as compared to 7.34% for the fiscal year ended December 31, 2009, a 289 b.p. decrease. Such decreases were mainly attributable to changes in the mix of loans and the fluctuation of interest rates in Argentina.
The average position in government securities for the fiscal year ended December 31, 2010 was Ps.3,344.1 million, as compared to Ps.4,686.5 million for the fiscal year ended December 31, 2009, a 28.6% decrease, which was mainly attributable to the sale of Boden 2012 Bonds and Discount Bonds.
The average yield on government securities for the fiscal year ended December 31, 2010 was 11.56%, as compared to 11.84% for the fiscal year ended December 31, 2009, a 28 b.p. decrease, which was mainly attributable to changes in the bond portfolio.
The average interest rate on government securities denominated in Dollars for the fiscal year ended December 31, 2010 was -31.56%, as compared to 2.29% in the fiscal year ended December 31, 2009, a decrease of 3,385 b.p. In 2010, the negative rate was the consequence of valuation allowances made during the year that allowed Banco Galicia to sell all of its Boden 2012 Bonds.
The average “Other Interest-Earning Assets” for the fiscal year ended December 31, 2010 were Ps.1,838.4 million, as compared to Ps.2,227.9 million for the fiscal year ended December 31, 2009, a decrease of Ps.389.5 million or 17.5%. Such decrease was primarily attributable to a reduction in the holding of certain residual interests in financial trusts in connection with securitizations.
The average rate of “Other Interest-Earning Assets” for the fiscal year ended December 31, 2010 was 4.85%, as compared to 5.17% for the fiscal year ended December 31, 2009, a 32 b.p. decrease. Such decrease was attributable to the concentration of transactions in Pesos rather than other currencies, since the average rate of other interest-earning assets in Pesos decreased by 104 b.p., from 6.47% to 5.43%, while the average rate in foreign currency increased 68 b.p., from 0.78% to 1.46%.
The financial income for the fiscal year ended December 31, 2010 included a Ps.27.7 million profit from fluctuations in foreign currency exchange rates, including the result of forward transactions in foreign currency. This financial income also includes a Ps.138.4 million gain from foreign exchange brokerage activities and a Ps.110.7 million loss from the valuation of the net position in foreign currency. The financial income for the fiscal year ended December 31, 2009 included a Ps.85.1 million profit from fluctuations in foreign currency exchange rates, including the result of forward transactions in foreign currency, a Ps.127.1 million gain from foreign exchange brokerage activities and a Ps.42.0 million loss from the valuation of the net position in foreign currency.
-99-
The following table shows our market shares:
| | | | | | | | | | | | | |
| | | Fiscal Year Ended | |
| | | December 31, | |
| (in percentages) | | 2010 | | | 2009 | | | 2008 | |
| Total Deposits | | | 5.94 | | | | 6.29 | | | | 5.93 | |
| Private-Sector Deposits | | | | | | | | | | | | |
| Total | | | 8.33 | | | | 7.81 | | | | 7.61 | |
| Deposits in Current and Savings Accounts and Non-Restructured Time Deposits | | | 8.59 | | | | 8.07 | | | | 7.87 | |
| | | | | | | | | | |
| Total Loans | | | 7.95 | | | | 6.91 | | | | 6.16 | |
| Private-Sector Loans | | | 8.95 | | | | 7.67 | | | | 6.12 | |
| | | | | | | | | | |
Exclusively Banco Galicia. within the Argentine market, based on daily information on deposits and loans prepared by the Argentine Central Bank. Beginning in June 30, 2010, these figures include deposits and loans corresponding to CFA. End-of-month balances are used. Deposits and loans include only principal. The Regional Credit Card Companies’ data is not included.
Fiscal Year 2009 Compared to Fiscal Year 2008
Financial income for the fiscal year 2009 amounted to Ps.3,005.6 million, a 17.4% increase compared to the Ps.2,559.3 million recorded in fiscal year 2008. This increase in financial income was the result of a higher average yield on interest-earning assets, partially offset by lower average volume.
The average yield on interest-earning assets was 15.71%, a 357 b.p. increase, which can be explained by increases of 776 b.p. and 233 b.p. in the average lending interest rate on government securities and on loans, respectively.
Average interest-earning assets decreased 7.6%, from Ps.19,892.5 million to Ps.18,378.0 million. This was a result of the 46.6% drop in the average balance of other interest-earning assets, and 5.1% in the average balance of total loan portfolio. This effect was partially offset by a 28.7% increase in the average balance of the net position in government securities.
The average loan balance amounted to Ps.11,463.6 million, 5.1% lower than the Ps.12,077.3 million in fiscal year 2008. This decrease was mainly due to the fact that in January 2009 Banco Galicia made a swap at market prices of Secured Loans for other public sector assets (Nobac 2010, Bogar 2018 Bonds, Boden 2014 Bonds and Discount Bonds 2033). These assets, in the table Yield on Interest-Earning Assets and Cost of Funds, shown above, are presented in the line of “Government Securities” and caused a decrease in the “Loans” line. As a consequence of the foregoing, the average balance of loans to public sector decreased by Ps.1,144.8 million (90.5%). As regards to the private sector loans, an average increase of Ps.531.1 million (4.9%) was recorded.
The average interest rate on total loans, including the CER adjustment, was 19.34% in fiscal year 2009, compared to 17.01% in fiscal year 2008. The portfolio of loans to the private sector accrued a 19.31% average interest rate and the public-sector loan portfolio accrued a 22.50% average interest rate, including the CER adjustment.
The estimated market share of Banco Galicia, on an individual basis, in the Argentine financial system’s total loans to the private sector was 7.67% at the end of December 2009, whereas such market share was 6.12% as of December 31, 2008.
The average interest rate on Peso-denominated loans to the private sector increased by 188 b.p., from 19.85% in fiscal year 2008 to 21.73% in fiscal year 2009. This increase reflected the increase experienced in the Argentine market in general. The average interest rate on foreign-currency denominated loans to the private sector increased by 59 b.p., from 6.75% in fiscal year 2008 to 7.34% in fiscal year 2009.
The average position in government securities amounted to Ps.4,686.5 million, an increase of Ps1,044.3 million (28.7%), compared to Ps.3,642.2 million in fiscal year 2008. This variation is mainly due to the increase of Ps.1,339.3 million in the average balance of the position in government securities in Pesos, as a result of the government securities received as part of the Secured Loans exchange transaction carried out by the end of January 2009. This increase was partially offset by the decrease of Ps.295.0 million in the average balance of government securities in Dollars due, mainly, to the sale in June 2009 of the 15th interest and amortization coupon of Boden 2012 Bonds due in August 2009. This decrease was partially offset by the increase in the price of the Dollar during the year 2009 (December 2008: Ps.3.45 — December 2009: Ps.3.80).
-100-
The average yield on government securities increased by 776 b.p., from 4.08% in fiscal year 2008 to 11.84% in fiscal year 2009. This variation is composed of a 1,397 b.p. increase in the average interest rate on government securities in Pesos, partially offset by a 79 b.p. decrease in the average interest rate on government securities in Dollars.
As a result of the Secured Loans exchange transaction mentioned above, the new portfolio of government securities received was assessed as a special investment, pursuant to the guidelines of the Argentine Central Bank. Consequently, these holdings are stated at their equity value, exponentially increased in terms of the IRR, and adjusted by the CER, if applicable. When the market value of each item is lower than its book value, the monthly accrual of the IRR and the CER is offset, on a cumulative basis, against an asset regularization account, until the book value equals the market value. Such asset regularization account is reversed and charged to income as long as the balance thereof exceeds the positive difference between the market value and the book value. Moreover, during fiscal year 2009, a portion of such portfolio of government securities was sold, generating an income. Both effects mainly justify the rise in the average rate of the government security portfolio in Pesos. On the other hand, the nominal rate for 2009 and 2008 is influenced by the fact that in the item “Government Securities” are included Discount Bonds in Pesos and GDP-Linked Negotiable Securities, which accounting is governed by Communiqué “A” 4270 issued by the Argentine Central Bank.
The decrease in the average interest rate on government securities in US Dollars was mainly due to the decrease of the Libo rate accrued by Boden 2012 Bonds. Apart from that, the average interest rate for fiscal year was influenced by the sale of the 15th interest and amortization coupon of Boden 2012 Bonds.
The average balance of the “Other Interest-Earning Assets” section amounted to Ps.2,227.9 million, a Ps.1,945.1 million decrease as compared to the average recorded in fiscal year 2008. This was mainly due to the fact the Argentine Central Bank eliminated the rate on funds deposited with said entity corresponding to the minimum cash requirement on term liabilities.
The average rate of the “Other Interest-Earning Assets” section increased by 8 p.b. as of December 31, 2009 in comparison to December 31, 2008, from 5.09% in 2008 to 5.17% in 2009, resulting from the variation of the Peso in respect to the transactions in Pesos and in foreign currency, since the average rate of the other interest-earning assets in Pesos was 6.77% in 2008 to 6.47% in 2009, with a decrease of 30 p.b., while the average rate of the foreign currency decreased from 1.20% in 2008 to 0.78% in 2009, a decrease of 42 p.b.
Financial income for fiscal year 2009 includes a Ps.103.5 million profit from foreign-exchange quotation differences, which includes income from foreign exchange forward transactions. The above-mentioned profit includes a Ps.127.1 million gain from foreign exchange brokerage activities and a Ps.23.6 million loss from the valuation of the net position in foreign currency. Financial income for fiscal year 2008 includes Ps.173.3 million profit from foreign-exchange quotation differences, which includes a Ps.163.7 million profit from foreign-exchange brokerage activities and a Ps.9.6 million profit from foreign currency net position valuation.
-101-
Financial Expenses
Our financial expenses were composed of the following:
| | | | | | | | | | | | | |
| | | Fiscal Year Ended | |
| | | December 31, | |
| | | 2010 | | | 2009 | | | 2008 | |
| | | (in millions of Pesos) | |
| Interest on Deposits | | | 765.5 | | | | 877.9 | | | | 786.1 | |
| Negotiable Obligations | | | 230.8 | | | | 284.5 | | | | 288.8 | |
| Contributions and Taxes | | | 268.6 | | | | 161.7 | | | | 135.9 | |
| CER Adjustment | | | 0.1 | | | | 0.3 | | | | 9.2 | |
Other(1) | | | 147.6 | | | | 136.1 | | | | 201.0 | |
| | | | | | | | | | |
Total | | | 1,412.6 | | | | 1,460.5 | | | | 1,421.0 | |
| | | | | | | | | | |
| | | |
| (1) | | Includes accrued interest on liabilities resulting from financial brokerage with banks and international entities and premiums payable on repurchases. |
Fiscal Year 2010 Compared to Fiscal Year 2009
The financial expenses for the fiscal year ended December 31, 2010 were Ps.1,412.6 million, as compared to Ps.1,460.5 million for the fiscal year ended December 31, 2009, a 3.3% decrease. Such decrease was mainly attributable to a 107 b.p. decrease in the average cost of funds, partially offset by a 4.6% increase in the average balance of interest-bearing liabilities.
The average interest-bearing liabilities for the fiscal year ended December 31, 2010 were Ps.16,662.5 million, as compared to Ps.15,923.4 million for the fiscal year ended December 31, 2009, a 4.6% increase. Such increase was attributable to the Ps.1,384.9 million increase in total interest-bearing deposits, which rose from Ps.11,693.7 million to Ps.13,078.6 million, partially offset by a Ps.453.8 million decrease in the average balance of debt securities from Ps.2.729,9 million to Ps.2.276.1 million and a decrease in “Other Interest-Bearing Liabilities” from Ps.1,499.2 million to Ps.1,307.1 million.
The increase in the average balance of interest-bearing deposits was mainly attributable to the increase of the deposits in Argentina in savings accounts and time deposits. The decrease in the average balance of interest-bearing checking accounts was due to the elimination of such accounts by the Argentine Central Bank. Taking into consideration the final balances of total deposits in Argentina, such increases totaled Ps.5,214.3 million or 30.5% for the fiscal year ended December 31, 2010 as compared to an increase of Ps.3,074.5 million for the fiscal year ended December 31, 2009.
Average savings and checking account deposits increased 31.1% for the fiscal year ended December 31, 2010, as compared to 14.7% for the fiscal year ended December 31, 2009, while time deposits increased 15.7% and 9.2% during such time periods, respectively, which allowed for an improvement in the structure of interest-bearing deposits. Excluding those from CFA, said deposits amounted to Ps.21,975.9 million, as compared to Ps.17,083.3 million for the fiscal year ended December 31, 2009, a 28.6% increase.
Regarding the total average interest-bearing deposits for the fiscal year ended December 31, 2010, Ps.2,949.2 million were Dollar-denominated deposits and Ps.10,129.4 million were Peso-denominated deposits, as compared to Ps.2,841.4 million and Ps.8,852.3 million, respectively, for the fiscal year ended December 31, 2009.
Considering only deposits from the private sector in checking and savings accounts and time deposits, Banco Galicia’s estimated deposit market share in the Argentine financial system was 8.44% for the fiscal year ended December 31, 2010, as compared to 8.07% for the fiscal year ended December 31, 2009, a 37 b.p. increase. Including CFA’s deposits, the market share reached 8.59% as of December 31, 2010.
The average rate on interest-bearing deposits for the fiscal year ended December 31, 2010 was 5.86%, as compared to 7.53% for the fiscal year ended December 31, 2009, a 168 b.p. decrease. Peso-denominated deposits (including those adjusted by CER) for the fiscal year ended December 31, 2010 accrued at a 7.45% average interest rate, as compared to 9.74% for the fiscal year ended December 31, 2009, a 229 b.p. decrease. This decrease was experienced by the Argentine market as a whole in 2010. The rate of Dollar-denominated deposits for the fiscal year ended December 31, 2010 was 0.40%, as compared to 0.67% for the fiscal year ended December 31, 2009, a 27 b.p. decrease. This decrease was mainly attributable to the fluctuations in international interest rates.
-102-
The average balance of debt securities for the fiscal year ended December 31, 2010 was Ps.2,276.1 million, as compared to Ps.2,729.9 million for the fiscal year ended December 31, 2009, a 16.6% decrease. This decrease was mainly attributable to a net reduction in the year end balance of Banco Galicia’s outstanding negotiable obligations. Such reduction resulted from amortizations and the redemption of negotiable obligations due 2014 for an outstanding principal amount of US$102.3 million and the capitalization of the subordinated negotiable obligations due 2019 owned by Grupo. Such reduction was partially offset by the increase in the Dollar exchange rate from December 31, 2009 to December 31, 2010.
The average rate for debt securities for the fiscal year ended December 31, 2010 was 10.04%, as compared to 8.22% for the fiscal year ended December 31, 2009, a 182 b.p. increase. Such increase was mainly attributable to changes in the bond portfolio, which are set forth in detail below.
The average interest rate for the fiscal year ended December 31, 2009 was favorably affected by a Ps.68.6 million profit derived from the repurchase of Banco Galicia’s negotiable obligations due 2014 for a face value of US$82.4 million. Had we not repurchased such negotiable obligations, the average interest rate for debt securities would have increased to 10.73%.
The average balance of “Other Interest-Bearing Liabilities” for the fiscal year ended December 31, 2010 was Ps.1,307.1 million, with an average rate of 7.50%, as compared to Ps.1,499.2 million for the fiscal year ended December 31, 2009, with an average rate of 7.34%, a 12.8% decrease in average balance and a 16 b.p. increase in average rate, respectively. This item includes mainly Dollar-denominated debt with international banks and credit entities, and Dollar-denominated obligations in connection with repurchase agreement transactions of government securities. The Ps.192.1 million decrease in the average balance was mainly attributable to the lower average balance of repurchase agreement transactions.
The average rate increase was related to transactions in Pesos, since the average rate increased 65 b.p., from 14.27% for the fiscal year ended December 31, 2009 to 14.92% for the fiscal year ended December 31, 2010, while the average rate in Dollars decreased 168 b.p., from 4.83% for the fiscal year ended December 31, 2009 to 3.15% for the fiscal year ended December 31, 2010.
Fiscal Year 2009 Compared to Fiscal Year 2008
Financial expenses for fiscal year 2009 amounted to Ps.1,460.5 million, representing a 2.8% increase from the Ps.1,421.0 million for fiscal year 2008.
This variation stemmed from a 51 b.p. decrease in the average cost of funds, partially mitigated by a 1.5% increase in the average balance of interest-bearing liabilities.
Average interest-bearing liabilities amounted to Ps.15,923.4 million, compared to Ps.15,694.5 million in fiscal year 2008. This variation was due to the Ps.1,388.5 million increase in total interest-bearing deposits, which rose from Ps.10,305.2 million to Ps.11,693.7 million, partially offset by a Ps.1,089.9 million decrease in the “Other Interest-Bearing Liabilities” (from Ps.2,589.1 million to Ps.1,499.2 million), and Ps.69.9 million average balance of debt securities, (from Ps.2,799.8 million to Ps.2,729.9 million).
The increase in the average balance of interest-bearing deposits was mainly the result of the increase in Banco Galicia’s deposits in Argentina, in current accounts, savings accounts and time deposits. Taking into consideration the final balances of Banco Galicia’s total deposits in Argentina, such increase totaled Ps.3,074.5 million for fiscal year, equivalent to a 21.9% increase from the previous fiscal year-end total. Average transactional deposits increased 21.7%, while time deposits grew 9.2%, which allowed for an improvement of interest-bearing deposits.
Of the total average interest-bearing deposits, Ps.2,841.4 million were Dollar-denominated deposits and Ps.8,852.3 million were Peso-denominated, compared to Ps.1,960.6 million and Ps.8,344.6 million, respectively, in fiscal year 2008.
-103-
Considering only private-sector deposits in current and savings accounts and time deposits, raised by Banco Galicia only in Argentina, the estimated deposit market share of Banco Galicia in the Argentine financial system rose from 7.87% as of December 31, 2008 to 8.07% as of December 31, 2009.
The average rate on interest-bearing deposits was 7.53%, 17 b.p. lower than the 7.70% average rate recorded in fiscal year 2008. Peso-denominated deposits (including those adjusted by CER) accrued an average rate of 9.74%, higher by 44 b.p. than the average interest rate of 9.30% in fiscal year 2008. This increase was experienced by the Argentine market as a whole in 2009. Likewise, the cost of Dollar-denominated deposits was 0.67%, lower by 24 b.p. than the average interest rate of 0.91% recorded in fiscal year 2008.
The average balance of debt securities amounted to Ps.2,729.9 million, Ps.69.9 million lower than the Ps.2,799.8 million in fiscal year 2008. This decrease is mainly related to a US$131.9 million net decrease (taking into consideration the capitalization of interests on Subordinated Notes Due 2019) in the final balance of Banco Galicia’s foreign debt recorded as notes, due to amortizations, redemptions and advance cancellations. It should be mentioned that Grupo Financiero Galicia was authorized by the CNV to create the program for the issuance of notes for a nominal value of US$60 million (or its equivalent in other currencies). The offer of notes for a nominal value of US$45 million, whose subscription period ended on June 2, 2009, was totally subscribed. This issuance partially mitigated the reductions made by Banco Galicia. Also, this variation was partially offset by an increase in the price of the Dollar between December 31, 2008 and the same date in 2009.
The average cost of debt securities was 8.22% in fiscal year 2009, while it was 10.00% in fiscal year 2008. The average rate for fiscal year 2009 was mainly influenced by the Ps.68.6 million gain resulting from the repurchase and advance cancellation of part of Banco Galicia’s foreign debt (Notes Due 2014 for a nominal value of US$82.4 million). Otherwise, the average rate of the debt securities would have increased to 10.73%. The rate was also influenced by the issuance of notes mentioned in the above paragraph, as the series I were issued at a price of 92.68% and for a nominal amount of US$34.4 million, which amounted to an annual cost of 8% and, as the series II were issued at a price of 103.48%, equal to an annual cost of 10.5% and for a nominal amount of US$10.6 million.
The average balance of the “Other Interest-Bearing Liabilities” caption was Ps.1,499.2 million, with an average rate of 7.34% while, for fiscal year 2008, the average balance amounted to Ps.2,589.1 million and the average rate was 7.86%. This item records, mainly, Dollar-denominated debt with international banks and credit agencies and Dollar-denominated obligations in connection with repurchase agreement transactions of Government securities. The decrease of Ps.1,089.9 million in the average balance is mainly due to the decrease in the average of repurchase agreement transactions and the repayment in advance on January 6, 2009, by Grupo Financiero Galicia of foreign financial loans for US$62 million, through a single final payment of US$39.1 million.
The decrease in the average rate is due to Dollar and Peso operations, as the Dollar rate was 6.20% in 2008 and 4.83% in 2009, a decrease of 137 b.p., and the average rate in Pesos decreased 16 b.p., from 14.43% in 2008 to 14.27% in 2009.
Net Financial Income
Fiscal Year 2010 compared to Fiscal Year 2009
Net financial income for the fiscal year ended December 31, 2010 was Ps.2,203.4 million (including Ps.282.2 million from CFA), with a corresponding financial margin of 10.02%, as compared to Ps.1,545.1 million for the fiscal year ended December 31, 2009, with a corresponding financial margin of 8.41%, a Ps.658.3 million increase and a 161 b.p. increase, respectively. Including financial income from security margins of repurchase agreement transactions, net financial income amounted to Ps.2,219.3 million and Ps.1,564.0 million, respectively, before the adjustment to the valuation of public sector assets (a Ps.4.1 million gain in the fiscal year ended December 31, 2009).
The increase in net financial income for the fiscal year ended December 31, 2010 was mainly attributable to a significant increase in the volume of activity with the private sector, a higher average spread and the increase recorded in non interest-bearing liabilities, together with the incorporation of net financial income from CFA.
-104-
Fiscal Year 2009 compared to Fiscal Year 2008
Net financial income for fiscal year 2009 amounted to Ps.1,545.1 million, and the financial margin was 8.41%. In fiscal year 2008, the corresponding amounts were Ps.1,138.3 million and 5.72%, respectively.
Excluding the income from the valuation adjustment of public-sector assets (Ps.4.1 million profit), and including the financial income related to margin requirements of repurchase agreement transactions (Ps.23.0 million profit), net financial income amounted to Ps.1,564.0 million and the corresponding adjusted financial margin was 8.51%. During fiscal year 2008, net financial income, calculated the same way, amounted to Ps.1,163.3 million, and the corresponding adjusted financial margin was 5.85%.
Net financial income for fiscal year 2009 was mainly due to the profit from the Peso-denominated matched portfolio, offset by the loss recorded by the matched portfolio in foreign currency.
The improvement in the adjusted net financial margin is mainly attributable to: (i) a decrease in the average cost of liabilities resulting from the change in their structure as a consequence of the change in the composition of deposits, with an increase in transactional deposits, and the reduction of foreign debt; (ii) an increase in income from intermediation with the private sector, with an increase in the volume of average loans and an increase in the average interest rate on such loans; and (iii) an increase in income related to the government securities portfolio.
Provision for Losses on Loans and Other Receivables
Fiscal Year 2010 compared to Fiscal Year 2009
Provisions for losses on loans and other receivables for the fiscal year ended December 31, 2010 were Ps.551.5 million, as compared to Ps.639.5 million for the fiscal year ended December 31, 2009, a Ps.88.0 million decrease. Such decrease was mainly attributable to the improvement in the credit quality of the loan portfolio due to favorable economic conditions. This figure included Ps.44.8 million corresponding to CFA.
Provisions for losses on loans and other receivables amounted to Ps.639.5 million in fiscal year 2009, Ps.244.1 million higher than the Ps.395.4 million for fiscal year 2008. A significant part of this increase was due to the seasoning of the individuals’ loan portfolio and to the possible occurrence of certain cases of default in the commercial loan portfolio, as a consequence of the worsening of certain macroeconomic variables, mainly during the first semester of 2009.
Provisions for losses on loans and other receivables amounted to Ps.395.4 million in fiscal year 2008, Ps.139.9 million higher than the Ps.255.5 million of fiscal year 2007. A significant percentage of this increase was due to the seasoning of our loan portfolio, mainly the individuals’ portfolio.
For more information on asset quality, see Item 4. “Information on the Company-Selected Statistical Information-Amounts Past Due and Non-Accrual Loans” and “-Selected Statistical Information-Loan Loss Experience”.
-105-
Net Income from Services
Our net income from services consisted of:
| | | | | | | | | | | | | | | | | | | | | |
| | | Fiscal Year Ended | | | % Change | |
| | | December 31, | | | December 31, | |
| | | 2010 | | | 2009 | | | 2008 | | | 2010/2009 | | | 2009/2008 | |
| | | (in millions of Pesos) | | | (in percentages) | |
| Income From | | | | | | | | | | | | | | | | | | | | |
| Credit Cards | | | 1,576.6 | | | | 1,148.2 | | | | 952.6 | | | | 37.3 | | | | 20.5 | |
| CFA | | | 32.9 | | | | — | | | | — | | | | — | | | | — | |
| Deposits Accounts | | | 325.5 | | | | 252.9 | | | | 201.7 | | | | 28.7 | | | | 25.4 | |
| Cash Management | | | 24.7 | | | | 18.6 | | | | 17.8 | | | | 32.8 | | | | 4.5 | |
| Safe Deposit Box | | | 51.2 | | | | 30.2 | | | | 18.0 | | | | 69.5 | | | | 67.8 | |
| Services for Shipments | | | 18.1 | | | | 14.9 | | | | 11.1 | | | | 21.5 | | | | 34.2 | |
| Product Package | | | 23.5 | | | | 14.3 | | | | 11.4 | | | | 64.3 | | | | 25.4 | |
| Financial Fees | | | 56.7 | | | | 50.1 | | | | 42.0 | | | | 13.2 | | | | 19.3 | |
| Credit-related Fees | | | 150.7 | | | | 96.5 | | | | 95.7 | | | | 56.2 | | | | 0.8 | |
| Check Collection | | | 44.9 | | | | 33.0 | | | | 33.9 | | | | 36.1 | | | | (2.7 | ) |
| Collection Services (Taxes and Utility Bills) | | | 36.9 | | | | 25.7 | | | | 19.5 | | | | 43.6 | | | | 31.8 | |
| International Trade | | | 67.2 | | | | 51.8 | | | | 46.1 | | | | 29.7 | | | | 12.4 | |
| Other (1) | | | 106.0 | | | | 90.6 | | | | 122.3 | | | | 17.0 | | | | (25.9 | ) |
| | | | | | | | | | | | | | | | |
Total Income | | | 2,514.9 | | | | 1,826.8 | | | | 1,572.1 | | | | 37.7 | | | | 16.2 | |
| | | | | | | | | | | | | | | | |
Total Expenses | | | 733.0 | | | | 515.9 | | | | 384.2 | | | | 42.1 | | | | 34.3 | |
| | | | | | | | | | | | | | | | |
Net Income from Services | | | 1,781.9 | | | | 1,310.9 | | | | 1,187.9 | | | | 35.9 | | | | 10.4 | |
| | | | | | | | | | | | | | | | |
| | | |
| (1) | | Includes, among others, fees from investment banking activities, asset management, assets under custody and guarantees granted. |
Fiscal Year 2010 Compared to Fiscal Year 2009
Net income from services for the fiscal year ended December 31, 2010 was Ps.1,781.9 million, including Ps.14.7 million from CFA, as compared to Ps.1,310.9 million for the fiscal year ended December 31, 2009, a 35.9% increase. Excluding net income from services from CFA, the increase would have been 34.8%. All items under net income from services recorded a significant increase, which was mainly attributable to the increase in the volume of transactions, within a framework of business expansion, together with an increase in the price of certain services, in line with general financial market trends.
Banco Galicia’s income from credit and debit card transactions, on an individual basis, for the fiscal year ended December 31, 2010 was Ps.664.7 million, as compared to Ps.465.3 million for the fiscal year ended December 31, 2009, a 42.9% increase. Such increase was mainly attributable not only to the greater number of credit cards managed, but also to the greater average number of purchases made with each card during the year. The total number of cards managed by Banco Galicia excluding those managed by the Regional Credit Card Companies and CFA, for the fiscal year ended December 31, 2010 was 1,576.4 thousand, as compared to 1,356.2 thousand for the fiscal year ended December 31, 2009, a 16.2% increase.
Income from services corresponding to the Regional Credit Card Companies for the fiscal year ended December 31, 2010 was Ps.911.9 million, as compared to Ps.682.9 million for the fiscal year ended December 31, 2009, a 33.5% increase. Such increase was mainly attributable to the increase in the purchases made during the fiscal year together with a greater number of credit cards. These Regional Credit Card Companies managed 5,365.6 thousand credit cards for the fiscal year ended December 31, 2010, as compared to 4,618.2 thousand credit cards for the fiscal year ended December 31, 2009, a 16.2% increase.
Total deposit accounts for the fiscal year ended December 31, 2010 were 1,969.0 thousand, as compared to 1,734.1 thousand for the fiscal year ended December 31, 2009, a 13.5% increase.
Significant growth levels were achieved by Banco Galicia for the fiscal year ended December 31, 2010, particularly safe deposit box (69.5%), credit-related fees (56.2%), collection services (43.6%), check collection (36.1%), international trade (29.7%), deposits accounts (28.7%) and financial fees (13.2%) as compared to the growth levels achieved mainly in safe deposit box (67.8%), collection services (31.8%), deposit accounts (25.4)%, financial fees (19.3%) and international trade (12.4%) for the fiscal year ended December 31, 2009.
Expenses from services for the fiscal year ended December 31, 2010 were Ps.733.0 million, as compared to Ps.515.9 million for the fiscal year ended December 31, 2009, a 42.1% increase. Such increase was mainly attributable to an increase in the number and frequency of promotions related to credit cards.
-106-
Fiscal Year 2009 Compared to Fiscal Year 2008
Net income from services amounted to Ps.1,310.9 million, 10.3% higher than the Ps.1,187.9 million recorded in fiscal year 2008. Almost all categories grew, mainly as a consequence of an increase in the volume of transactions together with an increase in the price of certain services, in line with the dynamics of the financial market.
Banco Galicia’s income from credit and debit card transactions, on an individual basis, amounted to Ps.465.3 million, a 26.5% increase over the Ps.367.7 million recorded in fiscal year 2008. This higher income was attributable not only to the greater number of credit cards managed, but also to the greater average purchases made with such cards during the year. The total number of cards managed by Banco Galicia (excluding those managed by the Regional Credit Card Companies) increased 9.5%, reaching 1,356.2 thousand as of December 31, 2009, compared to 1,238.5 thousand as of December 31, 2008.
Income from services corresponding to the Regional Credit Card Companies was Ps.682.9 million, 16.8% higher than the Ps.584.9 million recorded in fiscal year 2008. This variation was mainly due to the increase in the purchases made with these credit cards during fiscal year 2009. These companies managed 4,618.2 thousand cards as of December 31, 2009, a 2.6% decrease from December 31, 2008.
Total deposit accounts of Banco Galicia, the only company from Grupo Financiero Galicia that owns deposit accounts, amounted to 1,734.1 thousand as of December 31, 2009, 12.6% higher than the previous year.
Reflecting the increase in the volume of deposits and in the number of accounts, the higher sales of products, and the increase in the price of certain services, significant growth was achieved during fiscal year 2009 in income from the services related to deposit accounts (25.4%), financial transactions (19.3%), safe deposit boxes (67.8%), collection services (31.8%) and foreign trade (12.4%).
Expenses from services increased 34.3%, from Ps.384.2 million in fiscal year 2008 to Ps.515.9 million in fiscal year 2009.
The following table sets forth the number of credit cards outstanding as of the dates indicated:
| | | | | | | | | | | | | | | | | | | | | |
| | | | | | | | | | | | | | | % Change | |
| | | December 31, | | | December 31, | |
| Credit Cards | | 2010 | | | 2009 | | | 2008 | | | 2010/2009 | | | 2009/2008 | |
| | | (number of credit cards, except otherwise noted) | | | (percentages) | |
Visa | | | 1,102,730 | | | | 982,866 | | | | 936,267 | | | | 12.20 | | | | 4.98 | |
| “Gold” | | | 292,400 | | | | 262,388 | | | | 203,464 | | | | 11.44 | | | | 28.96 | |
| International | | | 504,687 | | | | 471,766 | | | | 470,709 | | | | 6.98 | | | | 0.22 | |
| Domestic | | | 164,120 | | | | 189,626 | | | | 227,785 | | | | (13.45 | ) | | | (16.75 | ) |
| “Business” | | | 36,878 | | | | 28,430 | | | | 20,976 | | | | 29.72 | | | | 35.54 | |
| “Corporate” | | | 1,718 | | | | 1,130 | | | | 960 | | | | 52.04 | | | | 17.71 | |
| “Platinum” | | | 102,927 | | | | 29,526 | | | | 12,373 | | | | 248.60 | | | | 138.63 | |
Galicia Rural | | | 8,716 | | | | 7,157 | | | | 6,215 | | | | 21.78 | | | | 15.16 | |
American Express | | | 392,247 | | | | 308,942 | | | | 241,145 | | | | 26.96 | | | | 28.11 | |
| “Gold” | | | 168,899 | | | | 143,899 | | | | 99,970 | | | | 17.37 | | | | 43.94 | |
| International | | | 153,526 | | | | 145,111 | | | | 133,644 | | | | 5.80 | | | | 8.58 | |
| Platinum | | | 69,822 | | | | 19,932 | | | | 7,531 | | | | 250.30 | | | | 164.67 | |
MasterCard | | | 72,738 | | | | 57,276 | | | | 54,916 | | | | 27.00 | | | | 4.30 | |
| “Gold” | | | 24,613 | | | | 19,452 | | | | 16,790 | | | | 26.53 | | | | 15.85 | |
| MasterCard | | | 47,186 | | | | 36,670 | | | | 36,531 | | | | 28.68 | | | | 0.38 | |
| Argencard | | | 939 | | | | 1,154 | | | | 1,595 | | | | (18.63 | ) | | | (27.65 | ) |
Regional Credit Card Companies | | | 5,365,638 | | | | 4,618,199 | | | | 4,742,816 | | | | 16.18 | | | | (2.63 | ) |
| Local Brands | | | 3,324,826 | | | | 2,944,544 | | | | 2,864,709 | | | | 12.91 | | | | 2.79 | |
| Visa | | | 1,699,240 | | | | 1,424,453 | | | | 1,628,185 | | | | 19.29 | | | | (12.51 | ) |
| MasterCard | | | 317,759 | | | | 221,575 | | | | 217,090 | | | | 43.41 | | | | 2.07 | |
| American Express | | | 23,813 | | | | 27,627 | | | | 32,832 | | | | (13.81 | ) | | | (15.85 | ) |
CFA | | | 53,369 | | | | — | | | | — | | | | — | | | | — | |
| Visa | | | 38,834 | | | | — | | | | — | | | | — | | | | — | |
| MasterCard | | | 14,535 | | | | — | | | | — | | | | — | | | | — | |
| | | | | | | | | | | | | | | | |
Total | | | 6,995,438 | | | | 5,974,440 | | | | 5,981,359 | | | | 17.09 | | | | (0.12 | ) |
| | | | | | | | | | | | | | | | |
Total Amount of Purchases(in millions of Pesos) | | Ps. | 26,880 | | | Ps. | 18,142 | | | Ps. | 14,949 | | | | 48.16 | | | | 21.36 | |
| | | | | | | | | | | | | | | | |
-107-
Administrative Expenses
The following table sets forth the components of our administrative expenses:
| | | | | | | | | | | | | | | | | | | | | |
| | | Fiscal Year Ended | | | % Change | |
| | | December 31, | | | December 31, | |
| | | 2010 | | | 2009 | | | 2008 | | | 2010/2009 | | | 2009/2008 | |
| | | (in millions of Pesos) | | | (in percentages) | |
| Salaries and Social Security Contributions | | | 1,408.0 | | | | 975.8 | | | | 805.2 | | | | 44.3 | | | | 21.2 | |
| Property-related Expenses | | | 162.5 | | | | 136.1 | | | | 113.2 | | | | 19.4 | | | | 20.2 | |
| Personnel Services | | | 89.3 | | | | 76.8 | | | | 90.8 | | | | 16.3 | | | | (15.4 | ) |
| Advertising and Publicity | | | 189.6 | | | | 127.8 | | | | 146.5 | | | | 48.4 | | | | (12.8 | ) |
| Amount Accrued in Relation to Directors’ and Syndics’ Compensation | | | 11.4 | | | | 8.6 | | | | 8.2 | | | | 32.6 | | | | 4.9 | |
| Electricity and Communications | | | 106.4 | | | | 85.9 | | | | 72.7 | | | | 23.9 | | | | 18.2 | |
| Taxes | | | 190.7 | | | | 139.3 | | | | 104.0 | | | | 36.9 | | | | 33.9 | |
| Other | | | 687.4 | | | | 478.8 | | | | 440.5 | | | | 43.6 | | | | 8.7 | |
| | | | | | | | | | | | | | | | |
Total | | | 2,845.3 | | | | 2,029.1 | | | | 1,781.1 | | | | 40.2 | | | | 13.9 | |
| | | | | | | | | | | | | | | | |
Fiscal Year 2010 Compared to Fiscal Year 2009
Administrative expenses for the fiscal year ended December 31, 2010 were Ps.2,845.3 million, including Ps.148.5 million from CFA, as compared to Ps.2,029.1 million for the fiscal year ended December 31, 2009, a 40.2% increase. Such increase was mainly attributable to the increase in personnel expenses related to salary increases, a 10.2% staff increase and the incorporation of CFA. The remaining administrative expenses increased following the trend of the financial system within an inflationary context.
Salaries, social security contributions and expenses related to personnel services for the fiscal year ended December 31, 2010 were Ps.1,497.3 million, as compared to Ps.1,052.6 million for the fiscal year ended December 31, 2009, a 42.2% increase. Such increase was mainly attributable to the incorporation of CFA and Ps.66.9 million in expenses associated with such acquisition, the salary increase agreement with the national bank employee union in force since January 2010 and the 10.2% increase in number of employees. The remaining administrative expenses for the fiscal year ended December 31, 2010 were Ps.1,348.0 million, as compared to Ps.976.5 million for the fiscal year ended December 31, 2009, a 38.0% increase. Ps.81.6 million of this increase corresponded to CFA. Such increase was mainly attributable to a higher level of activity, to the geographical expansion of Banco Galicia and the Regional Credit Card Companies and to increased inflation during the period.
Fiscal Year 2009 Compared to Fiscal Year 2008
In fiscal year 2009, administrative expenses amounted to Ps.2,029.1 million, 13.9% higher than the Ps.1,781.1 million recorded in the previous fiscal year.
Salaries and social security contributions and expenses related to personnel services increased 17.5%, from Ps.896.0 million in fiscal year 2008 to Ps.1,052.6 million in fiscal year 2009. This increase was mainly due to higher salaries, given the staff experienced a 2.8% decrease, from 9,408 employees as of December 31, 2008 to 9,142 in December 31, 2009.
The remaining administrative expenses amounted to Ps.976.5 million in fiscal year 2009, thus reflecting a 10.3% increase from the Ps.885.1 million recorded in the previous fiscal year. This increase was associated to a successful policy of expenses control within the framework of an inflationary context.
-108-
Income/(Loss) from Equity Investments
Fiscal Year 2010 compared to Fiscal Year 2009
Income from equity investments for the fiscal year ended December 31, 2010 was Ps.62.1 million, as compared to Ps.11.3 million for the fiscal year ended December 31, 2009, a Ps.50.8 million increase. Such increase was mainly attributable to the Ps.51.7 million amortization of the negative goodwill stemming from the acquisition of the CFA Group, which is required to be amortized in 60 months using the straight-line method, in accordance with regulations of the Argentine Central Bank.
Fiscal Year 2009 compared to Fiscal Year 2008
In fiscal year 2009, a Ps.11.3 million gain from equity investments was recorded, compared to a Ps.56.8 million profit recorded in fiscal year 2008, mainly due to the profit from the dividends received from Banco Galicia’s interest in Visa Argentina S.A.. Income for fiscal year 2008 was mainly a consequence of the Ps.53.8 million profit from dividends received due to Banco Galicia’s interest in Visa Argentina S.A. The magnitude of these dividends was related to the initial public offering of Visa Inc.’s shares.
Miscellaneous Income/(Loss), Net
Fiscal Year 2010 compared to Fiscal Year 2009
Miscellaneous net income for the fiscal year ended December 31, 2010 was Ps.120.8 million, including a gain of Ps.37.0 million from CFA, as compared to Ps.233.1 million for the fiscal year ended December 31, 2009, a Ps.112.3 million decrease.
Excluding profits from security margins of repurchase agreement transactions of Ps.15.9 million, which are of a financial nature, net miscellaneous income for the fiscal year ended December 31, 2010 was Ps.104.9 million, as compared to Ps.210.1 million, also excluding the above-mentioned financial income of Ps.23.0 million, for the fiscal year ended December 31, 2009, a Ps.105.2 million decrease. The variation in results between the two periods was mainly due to: i) the decision to accelerate amortization of the total amount of deferred losses fromamparo claims of Ps.281.0 million in comparison to the year 2009 (Ps.109.3 million), and ii) the revenue, in fiscal year 2010, of Ps.85.5 million resulting from the early cancellation of the foreign denominated financial loan and the absence of the Ps.12.7 million profit from the sale by Galicia Warrants of its Silos plant in San Salvador, in the province of Entre Rios recorded in 2009. These results were offset by : i) the lower net provisions for Ps.45.1 million in comparison to the year 2009, ii) the higher recovered loans of Ps.67.3 million and iii) the higher punitive interest of Ps.19.0 million.
Fiscal Year 2009 compared to Fiscal Year 2008
Miscellaneous net income for fiscal year 2009 amounted to Ps.233.1 million, compared to a Ps.80.1 million profit for fiscal year 2008. Excluding the income of a financial nature from security margins of repurchase agreement transactions (of Ps.23.0 million), miscellaneous net income in fiscal year 2009 amounted to Ps.210.1 million, while in fiscal year 2008 a gain of Ps.45.9 million was recorded (also excluding the above-mentioned financial income for Ps.34.2 million).
The variation in results between the two periods was mainly due to the revenue of Ps.85.5 million corresponding to the result from the early cancellation of the foreign financial loan, the Ps.55.3 million net operating income of Sudamericana recorded under “Miscellaneous Income/Loss” for consolidation purposes and the Ps.12.7 million profit from the sale by Galicia Warrants of its Silos plant in San Salvador, in the province of Entre Rios. These results were offset by the higher amortization ofamparo claimsfor the year 2009 (Ps.39.2 million) in comparison to the year 2008, as from January 2009, the amount deferred at December 31 2008 began to be amortized in 36 monthly installments.
-109-
Income Tax
Fiscal Year 2010 compared to Fiscal Year 2009
The income tax charge for the fiscal year ended December 31, 2010 was Ps.258.2 million, as compared to Ps.156.0 million for the fiscal year ended December 31, 2009, a Ps.102.2 million increase. Such increase was mainly attributable to the increase in the profit before tax of Tarjetas Regionales S.A. and to the incorporation of CFA. Such tax charges for the fiscal year ended December 31, 2010 mainly corresponded to Tarjetas Regionales S.A. consolidated with its operating subsidiaries in the amount of Ps.188.9 million, to CFA in the amount of Ps.51.2 million, to Sudamericana in the amount of Ps.16.3 million and Ps.1.2 million, Ps.0.8 million and Ps.0.6 million to Galicia Warrants, Galicia Administradora de Fondos and Galicia Valores, respectively.
Fiscal Year 2009 compared to Fiscal Year 2008
The income tax charge for fiscal year 2009 was Ps.156.0 million (an Ps.82.0 million increase when compared to fiscal year 2008), of which Ps.111.6 million corresponded to Tarjetas Regionales S.A. consolidated with its operating subsidiaries, Ps.24.8 million corresponded to Grupo Financiero Galicia, individually, and Ps.14.2 million and Ps.4.4 million corresponded to Sudamericana and Galicia Warrants, respectively.
U.S. GAAP and Argentine Banking GAAP Reconciliation
General
We prepare our financial statements in accordance with Argentine Banking GAAP. The more significant differences between Argentine Banking GAAP and U.S. GAAP relate to the determination of the allowance for loan losses, the carrying value of certain government securities and receivables for government securities, the accounting of Banco Galicia’s foreign debt restructuring and recognition of deferred income taxes. For more detail on differences in accounting treatment between Argentine Banking GAAP and U.S. GAAP as of December 31, 2010, see Note 35 to our consolidated financial statements.
Allowances for Loan Losses
With respect to the determination of the allowance for loan losses, we follow the rules of the Argentine Central Bank. Under these rules, reserves are based on minimum reserve requirements established by the Argentine Central Bank. U.S. GAAP requires that an impaired loan be generally valued at the present value of expected future cash flows discounted at the loan’s effective rate or at the fair value of the collateral if the loan is collateral dependent. For the purposes of analyzing our loan loss reserve under U.S. GAAP, we divide our loan portfolio into performing and non-performing commercial and consumer loans.
The following table shows the allowance for loan losses for the periods indicated under Argentine Banking GAAP and U.S. GAAP and the corresponding shareholders’ equity adjustment under U.S. GAAP:
| | | | | | | | | | | | | |
| | | December 31, | | | December 31, | | | December 31, | |
| | | 2010 | | | 2009 | | | 2008 | |
| | | (in millions of Pesos) | |
| Argentine Banking GAAP | | | 870.2 | (1) | | | 815.9 | | | | 526.8 | |
| U.S. GAAP | | | | | | | | | | | | |
| ASC 310 | | | | | | | | | | | | |
| Allowance for Loan Losses | | | 61.6 | | | | 64.8 | | | | 93.6 | |
| | | | | | | | | | | | | |
| ASC 450 | | | 743.1 | | | | 687.5 | | | | 481.7 | |
| | | | | | | | | | |
U.S. GAAP Shareholders’ Equity Adjustment (2) | | | 65.5 | | | | 63.6 | | | | (48.5 | ) |
| | | | | | | | | | |
| | | |
| (1) | | The balance does not include Ps.185,381 of CFA allowances for loan losses as of the acquisition date. |
| |
| (2) | | Including qualitative and quantitative adjustments. |
-110-
ASC 310 Analysis
The non-performing commercial loan portfolio is comprised of loans falling into the following classifications of the Argentine Central Bank:
| | • | | “High Risk of Insolvency” |
The following table shows our loan loss reserve under ASC 310 for our non-performing commercial loan portfolio as of the dates indicated.
| | | | | | | | | | | | | |
| | | December 31,
2010 | | | December 31,
2009 | | | December 31,
2008 | |
| | | (in millions of Pesos) | |
| Loan Loss Reserve Under U.S. GAAP — ASC 310 Analysis | | | 61.6 | | | | 64.8 | | | | 93.6 | |
For such non-performing commercial loans, we applied the procedures required by ASC 310. For loans that were not collateral dependent, the expected future cash flows to be received from the loans were discounted using the interest rate at each balance sheet date for variable loans. Loans that were collateral dependent, and for which there was an expectation that the loan balance would be recovered via the exercise of collateral, were valued using the fair value of the collateral. In addition, in order to assess the fair value of collateral, we discounted collateral valuations due to the extended period of time that it can take to foreclose on assets in Argentina.
ASC 450 Analysis
To calculate the allowance required for smaller-balance impaired loans and unimpaired loans, we perform an analysis of historical losses from our consumer and performing commercial loan portfolios in order to estimate losses for U.S. GAAP purposes resulting from loan losses that had been incurred in such loan portfolios at the balance sheet date but which had not been individually identified.
Loss estimates are analyzed by loan type and thus for homogeneous groups of clients. Such historical ratios are updated to incorporate the most recent data reflecting current economic conditions, industry performance trends, geographic or obligor concentrations within each portfolio segment, and any other pertinent information that may affect the estimation of the allowance for loan losses. Many factors can affect Banco Galicia’s estimates of allowance for loan losses, including volatility of default probability, migrations and estimated loss severity.
We estimate that, on average, it takes a period of up to one year between the trigger of an impairment event and identification of a loan as being a probable loss for consumer and performing commercial loans.
The increase in the allowances recorded under ASC 450 is mostly due to a higher volume of credit card and personal loans granted during 2010 and 2009 and the rise of the loan loss reserves migration ratios. The table below shows our loan loss reserve under ASC 450 for consumer and performing commercial loans as of the dates indicated.
| | | | | | | | | | | | | |
| | | December 31, | | | December 31, | | | December 31, | |
| | | 2010 | | | 2009 | | | 2008 | |
| | | (in millions of Pesos) | |
| Loan Loss Reserve Under U.S. GAAP — ASC 450 Analysis | | | 743.1 | | | | 687.5 | | | | 481.7 | |
In addition to assessing the reasonableness of the loan loss reserve as described above, Banco Galicia makes an overall determination of the adequacy of each period’s reserve based on such ratios as:
| | • | | Loan loss reserves as a percentage of non-accrual loans, |
| | • | | Loan loss reserves as a percentage of total amounts past due, and |
| | • | | Loan loss reserves as a percentage of past-due unsecured amounts. |
-111-
The table below shows the above-mentioned ratios as of the dates indicated.
| | | | | | | | | | | | | |
| | | December 31,
2010 | | | December 31,
2009 | | | December 31,
2008 | |
| Loan Loss Reserves as a Percentage of Non-accrual Loans | | | 163.37 | % | | | 108.37 | % | | | 141.34 | % |
| Loan Loss Reserves as a Percentage of Total Amounts Past Due | | | 116.04 | % | | | 130.58 | % | | | 171.81 | % |
| Loan Loss Reserves as a Percentage of Past-due Unsecured Amounts | | | 189.79 | % | | | 154.29 | % | | | 190.78 | % |
The allowance for loan losses has increased approximately 7% during 2010 under US GAAP. This variation is due to an increase in the portfolio of loans to the private sector and to the qualitative approach reflecting current economic conditions, industry performance trends, geographic or obligor concentrations, within each portfolio segment required for smaller-balance impaired and unimpaired.
Carrying Value of Certain Government Securities and Receivables for Government Securities
As of December 31, 2010, our holding of Bonar 2015 Bonds have been recorded at their acquisition cost increased according to the accrual of their IRR under Argentine Banking GAAP.
Under U.S. GAAP, the Bonar 2015 Bonds were considered as “available for sale securities” and recorded at fair value with the unrealized gains or losses recognized as a charge or credit to equity through other comprehensive income.
Under U.S. GAAP, all of these assets are carried at fair value as fully explained in Note 35 to our financial statements and “-U.S. GAAP — Critical Accounting Policies”.
Government securities under investment accounts are classified as “holdings of investment account securities” under Argentine Central Bank rules.
As of December 31, 2009 under Argentine Banking GAAP, our holdings of Boden 2012 Bonds, Bonar 2015 Bonds, securities issued by the Argentine Central Bank and Discount Bonds in Pesos were recorded in accordance with Argentine Central Bank valuation rules for public-sector assets. During 2010, the position of these bonds, as a whole, has been realized.
Under U.S. GAAP, all of these assets were carried at fair value.
Government securities under investment accounts were classified as government securities without quotation under Argentine Central Bank rules (Boden 2012 Bonds corresponding to the Compensatory Bond or Hedge Bond received, Bonar 2015 Bonds, securities issued by the Argentine Central Bank and Discount Bonds in Pesos), were considered as available for sale under U.S. GAAP. As of December 31, 2009, unrealized gains or losses on these securities were reflected in other comprehensive income. During the year ended December 31, 2010, Boden 2012 Bonds corresponding to the Compensatory Bond or Hedge Bond received and Discount Bonds in Pesos were sold. Therefore, the 2010 U.S. GAAP net income reconciliation includes the reversal of the 2009 shareholders’ equity adjustment previously recorded through other comprehensive income that are being realized and reversed through the income statement.
As of December 31, 2008, the amortized cost exceeded the fair value of these securities by Ps.711.1 million. For U.S. GAAP purposes, we have recorded an other-than-temporary impairment of these securities, based on a variety of factors, including the length of time and extent to which the market value has been less than cost, and our intent and ability to hold these securities to recovery. The fair value of these securities was determined on the balance sheet date, based on their quoted market price, and constitutes the new cost basis for this investment.
-112-
The table below shows the book value, market value and amortized cost of Bonar 2015 Bonds and Boden 2012 Bonds, Discount Bonds and Bonar 2015 Bonds as of December 31, 2010 and 2009, respectively.
| | | | | | | | | | | | | | | | | | | | | | | | | | | | | | | | | | | | | | | | | |
| | | December 31, 2010 | | | December 31, 2009 | |
| | | | | | | Book | | | | | | | | | | | | | | | | | | | Book | | | | | | | | | | | | |
| | | | | | | Value | | | | | | | | | | | | | | | | | | | Value | | | | | | | | | | | | |
| | | Amortized | | | Argentine | | | | | | | | | | | Shareholders’ | | | Amortized | | | Argentine | | | | | | | | | | | Shareholders’ | |
| | | Cost US | | | Banking | | | Market | | | Unrealized | | | Equity | | | Cost US | | | Banking | | | Market | | | Unrealized | | | Equity | |
| (In millions of Pesos) | | GAAP | | | GAAP | | | Value | | | (Loss)/Gain | | | Adjustment | | | GAAP | | | GAAP | | | Value | | | (Loss)/Gain | | | Adjustment | |
| Boden 2012 Bonds | | | — | | | | — | | | | — | | | | — | | | | — | | | | 901.0 | | | | 1,906.9 | | | | 1,731.1 | | | | 830.1 | | | | (175.8 | ) |
| Discount Bonds | | | — | | | | — | | | | — | | | | — | | | | — | | | | 169.9 | | | | 622.0 | | | | 337.9 | | | | 132.2 | | | | (284.1 | ) |
| Bonar 2015 Bonds | | | 527.9 | | | | 642.1 | | | | 726.6 | | | | 198.7 | | | | 84.5 | | | | 591.5 | | | | 359.0 | | | | 676.6 | | | | 85.0 | | | | (317.6 | ) |
Foreign Debt Restructuring
On May 18, 2004, we completed the restructuring of its foreign debt. As a result of this restructuring, we recorded a Ps.142.5 million gain under Argentine Banking GAAP.
For U.S. GAAP purposes, the restructuring is accounted for in each of two steps. The first step of the restructuring required the holders of our debt to exchange its old debt for new debt in two tranches. Pursuant to “Determining Whether a Debtor’s Modification or Exchange of Debt Instruments” is within the scope of ASC 470 (ASC 820), we did not receive any concession from the holders of the debt and therefore, the first step of the restructuring was not considered a trouble debt restructuring. Pursuant to “Debtors Accounting for a Modification or Exchange of Debt Instruments” ASC 470-50, the first step of the restructuring was accounted for as a modification of the old debt and therefore we did not recognize any gain or loss. The second step of the restructuring offers the holders of our debt issued in the first step explained above the option to exchange it for new securities including cash, Boden 2012 Bonds and our equity shares. Pursuant to U.S. GAAP, this second step of the restructuring was accounted for in accordance with “Accounting by Debtors and Creditors for Trouble Debt Restructurings” ASC 310-40, as a partial settlement of the debt through the transfer of certain assets and equity at its fair value. After deducting the considerations used to repay the debt, ASC 310-40 requires the comparison of the future cash outflows of the restructured debt and the carrying of the debt at the restructuring date.
Gain on troubled debt restructuring is only recognized when the remaining carrying value of the debt at the date of the restructuring exceeds the total future cash payments of the restructured debt reduced by the fair value of the assets and equity given as payment of the debt. Since the total future cash outflows of the restructured debt exceeds the carrying value of the old debt, no gain on restructuring was recorded under U.S. GAAP.
As a result, under U.S. GAAP, the carrying amount of the restructured debt is greater than the amount recorded under Argentine Banking GAAP. Therefore, under U.S. GAAP, a new effective interest rate was determined to reflect the present value of the future cash payments of the restructured debt.
Furthermore, under U.S. GAAP, expenses incurred in a trouble debt restructuring are expensed as incurred. Expenses related to the issuance of equity were deducted directly from the shareholders’ equity.
We repurchased part of the debt maturing in 2010 and 2014. In addition, negotiable obligations were repaid in advance. For U.S. GAAP purposes, these transactions were considered as an extinguishment of debt. Therefore, the U.S. GAAP adjustment recorded in previous years related to the debt extinguished was reversed in 2008, 2009 and 2010 respectively, generating a gain of approximately Ps.34.5 million, Ps.20.5 million and Ps.8.7 million included in 2010, 2009 and 2008 U.S. GAAP net income reconciliation.
-113-
Securitizations
The following table summarizes the adjustment for U.S. GAAP purposes related to securitization transactions as of December 31, 2010 and 2009:
| | | | | | | | | | | | | | | | | | | | | | | | | |
| | | As of December 31, | |
| | | 2010 | | | 2009 | |
| | | (In millions of Pesos) | |
| | | Book Value | | | Fair Value – | | | U.S. GAAP | | | Book Value | | | Fair Value – | | | U.S. GAAP | |
| | | Argentine | | | Book value | | | Shareholders’ | | | Argentine | | | Book value | | | Shareholders’ | |
| | | Banking | | | under U.S. | | | Equity | | | Banking | | | under U.S. | | | Equity | |
| | | GAAP | | | GAAP | | | Adjustment | | | GAAP | | | GAAP | | | Adjustment | |
Galtrust I(1) | | | 521.9 | | | | 521.9 | | | | — | | | | 584.1 | | | | 211.6 | | | | (372.5 | ) |
Financial Trust Galicia(2) | | | 96.3 | | | | 36.2 | | | | (60.1 | ) | | | 80.0 | | | | 28.7 | | | | (51.3 | ) |
| Others | | | 13.5 | | | | 19.5 | | | | 6.0 | | | | 56.5 | | | | 51.0 | | | | (5.5 | ) |
| | | | | | | | | | | | | | | | | | | |
Total | | | 631.7 | | | | 577.6 | | | | (54.1 | ) | | | 720.6 | | | | 291.3 | | | | (429.3 | ) |
| | | | | | | | | | | | | | | | | | | |
(1) Financial Trust “Galtrust I”
The financial trust “Galtrust I” was created in October 2000 in connection with the securitization of provincial loans for a total amount of Ps.1,102 million. The securitized loans were from the portfolio of loans granted to provincial governments, guaranteed by the federal tax revenues shared with the provincial governments.
During 2002, the portfolio of loans included and the related retained interest in Galtrust I were subject to the pesification. As a result, the retained interest in the trust was converted into Pesos at an exchange rate of Ps.1.40 to US$1.00 and the interest rate for their debt securities changed to CER plus 10%. During 2003, Galtrust I had swapped its provincial loans for Bogar Bonds.
Under Argentine Banking GAAP, this transaction was accounted for as sales and the debt securities and certificates retained by Banco Galicia are accounted for at cost plus accrued interest for the debt securities, and the equity method is used to account for the residual interest in the trust.
The retained interest in the trust was recorded under Argentine Central Bank rules in the “Other Receivables from Financial Brokerage”, and its balance as of December 31, 2010 and 2009, was Ps.521.9 million and Ps.584.1 million, respectively.
As of December 31, 2010, under Argentine Banking GAAP, we recorded certain reserves to adjust the equity method used to account for the residual interest in the trust, at its fair value.
December 31, 2009 and 2008
As of December 31, 2009 and 2008, Banco Galicia considered this transaction as a sale under U.S. GAAP, in accordance with ASC 860. Galtrust I certificate of participation retained by us was considered as “available for sale securities” under U.S. GAAP and the unrealized gains on this security was reported as an adjustment to shareholders’ equity through Other Comprehensive Income.
The fair value of these securities was determined on the balance sheet date, based on an internal valuation technique estimating future cash flows for this certificate of participation, discounted at a present value with a rate comparable with internal rates of return of other CER adjusted bonds. Such fair value constituted the new cost basis for this investment.
As of December 31, 2009, we have determined that unrealized losses on these investments are temporary in nature based on its ability and intent to hold the investment for a period of time sufficient to allow for any anticipated recovery and the results of its review conducted to identify and evaluate investments that have indications of possible impairments.
As of December 31, 2008 we have recorded an other-than-temporary impairment of these securities for an amount of Ps.357.7 million, based on a variety of factors, mostly including the length of time and extent to which the market value has been less than cost, and the weakening of the global and local markets condition in which the e operate, with no immediate prospect of recovery.
December 31, 2010
Effective January 1, 2010, we implemented new accounting guidance provided by SFAS 166 and 167 (ASU 2009-16 and ASU 2009-17, respectively, under the new codification), which amend the accounting for transfers of financial assets and consolidation of variable interest entities (“VIEs”).
-114-
The new guidance eliminates the concept of qualified special purpose entities (“QSPEs”) that were previously exempt from consolidation and introduces a new framework for determining the primary beneficiary of a VIE. The primary beneficiary of a VIE is required to consolidate the assets and liabilities of the VIE. Therefore, we must evaluate all existing securitization trusts that formerly qualified as QSPEs to determine whether they must be consolidated in accordance with ASU 2009-17. An entity is considered a VIE if it possesses one of the following characteristics:
| | • | | Insufficient equity investment at risk |
| | • | | Equity lacks decision-making rights |
| | • | | Equity with non-substantive voting rights |
| | • | | Lacking the obligation to absorb an entity’s expected losses |
| | • | | Lacking the right to receive an entity’s expected residual returns |
Under the new guidance, the primary beneficiary is the party that has both (1) the power to direct the activities of an entity that most significantly impact the VIE’s economic performance; and (2) through its interests in the VIE, the obligation to absorb losses or the right to receive benefits from the VIE that could potentially be significant to the VIE.
To assess whether we have the power to direct the activities of a VIE that most significantly impact the VIE’s economic performance, we consider all facts and circumstances, including the role in establishing the VIE and its ongoing rights and responsibilities. This assessment includes, first, identifying the activities that most significantly impact the VIE’s economic performance; and second, identifying which party, if any, has power over those activities.
Under ASC 810-10-65, we should measure the components of the newly consolidated financial trusts at their carrying amounts as of the adoption date. We must determine the amounts of the assets, liabilities, and non-controlling interests of the newly consolidated financial trusts, that would have been recorded in our financial statements as of January 1, 2010, as if ASU 2009-17 had been effective as of the date of our initial involvement with the financial trusts. Any difference between the net amount added (net assets of each financial trusts where we are primary beneficiary) from our balance sheet and the amount of any previously recognized retained interest is recognized as a cumulative-effect adjustment to retained earnings as of December 31, 2010.
For U.S. GAAP purposes, as of December 31, 2010 the trust, a formerly qualified QSPE, was considered a variable interest entity. In accordance with ASC 810, we were deemed to be the primary beneficiary of this trust and, therefore, Banco Galicia reconsolidated the assets and liabilities of the mentioned trust. Upon consolidation, the Bogar Bonds were classified as available-for-sale securities and measured at fair value with changes recorded in other comprehensive income. Since the fair value of the residual interest in the trust recorded under Argentine Central Bank rules was determined based on the fair value of the Bogar Bonds, recorded as an asset in the trust, there is no difference in the measurement basis of the net assets held and recorded under Argentine Central Bank rules and U.S. GAAP. The only difference between both standards is that under U.S. GAAP, changes in the fair value of the Bogar Bonds are recorded in other comprehensive income, while under Argentine Banking GAAP, changes are recorded in the consolidated income statement.
(2) Financial Trust Galicia
Under this trust, Government promissory notes in Pesos at 2% due 2014 for Ps.108.0 million were transferred and a certificate of participation and debt securities were received in exchange. Those Government promissory notes were previously received in exchange of national secured loans held by us.
For Argentine Banking GAAP purposes, the debt securities and certificates retained by Banco Galicia are accounted for at cost plus accrued interest for the debt securities, and the equity method is used to account for the residual interest in the trust. The cost of these securities was determined based on the book value of the promissory notes transferred.
This transfer was not considered a true sale for U.S. GAAP purposes, and therefore, it was recorded as a “secured borrowing” according to ASC 860. Therefore, we reconsolidated the promissory notes transferred to the financial trust.
-115-
Under U.S. GAAP, the promissory notes were classified as loans recorded at amortized cost with the corresponding loan loss reserve, as applicable. The U.S. GAAP adjustment is related to the difference between the cost basis used under both standards. For Argentine Banking GAAP, the cost was determined based on the carrying value of national secured loans previously hold and exchange for the promissory notes, while under U.S. GAAP, the cost was determined based on the fair value of each national secured loans transferred in exchange of the promissory notes received.
BG Financial Trust
During 2005, we entered into a securitization transaction of commercial and consumer non-performing loans. For Argentine Banking GAAP, no assets are recognized as of December 31, 2010 and 2009 as all the debt securities and certificates of participations were subscribed by third parties. Under U.S. GAAP, this transaction was not considered a true sale and therefore it was recorded as a secured borrowing according with ASC 860.
Additional information required by U.S. GAAP
The table below presents the aggregated assets and liabilities of the financial trusts which have been consolidated for U.S. GAAP purposes:
| | | | | | | | | |
| | | As of December 31, | |
| (In millions of Pesos) | | 2010 | | | 2009 | |
| Cash and Due from Banks | | Ps. | 11.6 | | | Ps. | 15.2 | |
| Government Securities | | | 1,009.2 | | | | — | |
| Loans (Net of Allowances) | | | — | | | | 463.8 | |
| Other Assets | | | 1.1 | | | | 8.8 | |
| | | | | | | |
Total Assets | | Ps. | 1,021.9 | | | Ps. | 487.8 | |
| | | | | | | |
| Debt Securities | | Ps. | 414.5 | | | Ps. | 279.6 | |
| Certificates of Participation | | | 604.7 | | | | 193.3 | |
| Other Liabilities | | | 2.7 | | | | 14.9 | |
| | | | | | | |
Total Liabilities | | Ps. | 1,021.9 | | | Ps. | 487.8 | |
| | | | | | | |
Our maximum loss exposure, which amounted to Ps.1,021.9 million and Ps.487.8 million as of December 31, 2010 and 2009, respectively, is based on the unlikely events that all of the assets in the VIE’s become worthless and incorporates potential losses associated with assets recorded on our balance sheet.
Other transfers of financial assets accounted for as sales under U.S. GAAP
As of December 31, 2009 and 2008, Banco Galicia has entered into different securitizations as described in Note 30 to the attached financial statements that were accounted for as sales under Argentine Banking GAAP. The transfers of financial assets related to the creation of certain trusts were considered sales for U.S. GAAP purposes under ASC 860 and for that reason debt securities and certificates retained by Banco Galicia are considered to be “available for sale securities” under U.S. GAAP.
The retained interests were initially recorded at an amount equal to a portion of the previous aggregate carrying amount of assets sold and retained. The portion is determinate based on the relative fair values of the assets sold and assets retained as of the date of the transfer based on their allocated book value using the relative fair value allocation method.
Subsequently, the unrealized gains (losses) on these securities are reported as an adjustment to shareholders’ equity, unless unrealized losses are deemed to be other than temporary in accordance with ASC 325-40.
-116-
The fair value of these retained interests in the trusts is determined based upon an estimate of cash flows to be collected by us as holder of the retained interests, discounted at an estimated market rate and will constitute the new cost basis of these securities.
The U.S. GAAP shareholders’ equity adjustment for all the transfers of financial assets described above amounted to Ps.(5.4) million and Ps.(19.6) million as of December 31, 2009 and 2008, respectively.
Additionally, we have analyzed servicing assets and/or liabilities concluding that the benefits of servicing are not expected to be adequate compensation. As of December 31, 2009 and 2008, servicing liabilities of Ps.0.1 million and Ps.1.4 million has been recorded for U.S. GAAP purposes, respectively.
As of December 31, 2010 these financial trusts had been liquidated. Therefore, the 2010 U.S. GAAP net income reconciliation includes the reverse of the previous year’s adjustments.
There were no restrictions on assets reported by the entity in its statement of financial position related to any transferred financial asset.
Negative Goodwill — Compañía Financiera Argentina and subsidiaries
The Argentine Central Bank’s board of directors, through Resolution No.124 dated June 7, 2010, authorized Banco Galicia to purchase 95% of the shares belonging to the following companies: Compañía Financiera Argentina, Cobranzas y Servicios S.A. and Procesadora Regional S.A. (former Universal Processing Center S.A.). Furthermore, through the above-mentioned resolution the Argentine Central Bank authorized the subsidiary Tarjetas Regionales S.A. to purchase the remaining 5% of the shares belonging to said companies.
On August 31, 2010, through Resolution No.299, the Argentine Commission of Competence Defense(Comisión Nacional de Defensa de la Competencia)authorized the above-mentioned purchase and sale transaction, of which Banco Galicia was informed on September 1, 2010.
The total purchase price paid amounted to Ps.328.3 million for Compañía Financiera Argentina, Ps.0.8 million for Cobranzas y Servicios S.A. and Ps.4.8 million for Procesadora Regional S.A. (former Universal Processing Center S.A.).
The transaction will enable Banco Galicia to serve a greater number of customers with our current structure, to complement lines of business and to achieve greater economies of scale by additionally providing Compañía Financiera Argentina and the above-mentioned companies with a more efficient financing structure and permitting its clients access to a network with a greater geographical coverage. Nevertheless, CFA is still a separated segment considering how the business is analyzed by the management.
Pursuant to Argentine Central Bank rules, and due to the difference between the acquisition cost and the estimated fair value of assets and liabilities acquired as of June 30, 2010, a negative goodwill amounting to Ps.500.6 million was recorded by Compañía Financiera Argentina and a negative goodwill of Ps.16.8 million was recorded by Cobranzas y Servicios S.A., both of which were recorded under Liabilities-Provisions. With regard to Procesadora Regional S.A. (former Universal Processing Center S.A.), a goodwill amounting to Ps.4.0 million was recorded under Intangible Assets — Goodwill. The negative goodwill is subsequently charged to Income on a straight-line basis during 60 months.
-117-
As of December 31, 2010 we had a balance of Ps.465.6 million related to the negative goodwill.
Under U.S. GAAP, ASC 805 requires the acquisition of controlling interest of Compañía Financiera Argentina, Cobranzas y Servicios S.A. and Procesadora Regional S.A. (former Universal Processing Center S.A.) to be accounted for as a business combination applying the purchase method, recognizing all net assets acquired at their fair value. We applied the following guidance:
| | • | | If the consideration transferred exceeds the fair value of assets acquired and liabilities assumed, the acquirer shall recognize goodwill as of the acquisition date, or, |
| | • | | If the consideration transferred is lower than the fair value of assets acquired and liabilities assumed, the acquirer shall recognize the resulting gain in earnings on the acquisition date. |
No intangible assets were identified as part of the acquisition considering the type of assets acquired (mainly consumer loans) and the profile of the deposits in these companies.
Considering that the net assets acquired were originally recorded at their estimated fair value under Argentine Banking GAAP, no adjustments for U.S. GAAP purposes were recorded in this regard. However, the negative goodwill recorded as a liability and being amortized over a 60 months period under Argentine Banking GAAP, has been fully recognized as a gain in the consolidated statement of income for U.S. GAAP purposes under the caption Miscellaneous Income.
In addition, the amortization of negative goodwill recorded under Argentine Banking GAAP has been reversed for U.S. GAAP purposes.
Income Tax
Argentine Central Bank regulations do not require the recognition of deferred tax assets and liabilities and, therefore, income taxes for Banco Galicia are recognized on the basis of amounts due in accordance with Argentine tax regulations. However, we and our non-bank subsidiaries apply the deferred income tax method.
For the purposes of U.S. GAAP reporting, we applied ASC 740-10 “Accounting for Income Taxes”. Under this method, income tax is recognized based on the assets and liabilities method whereby deferred tax assets and liabilities are established for temporary differences between the financial reporting and tax basis of our assets and liabilities. Deferred tax assets are recognized if it is more likely than not those assets will be realized.
We had significant accumulated tax loss carryforward at December 31, 2008. Based on the analysis performed, management believes that we would recover only temporary differences with future taxable income. Therefore, the net operating tax loss carryforward and presumed minimum income tax was more likely than not to be recovered in the carryforward period and hence a valuation allowance was provided against this amount as of December 31, 2008.
As of December 31, 2009, based on the analysis performed, we believe that it is more likely than not that it will recover only the net operating tax loss carryforward and the temporary differences, with future taxable income. Therefore, presumed minimum income tax was not more likely than not to be recovered in the carryforward period and hence a valuation allowance was provided against this amount as of December 31, 2009.
As of December 31, 2010 based on the analysis performed, we believe that is more likely than not that it will recover the net operating tax loss carryforward, the temporary differences and the presumed minimum income tax, with future taxable income. Among other factors, we considered that as of the date of the issuance of the attached financial statements, the taxable income mainly due to the sales of Government bonds has been consumed the total tax loss carryforward. In addition, according to the taxable income projections, we estimated that the presumed minimum income tax will be utilized during the following years 2011 and 2012. Therefore, no valuation allowance was provided against presumed minimum income tax.
-118-
“Accounting for Uncertainty in Income Taxes”, ASC 740-10 was issued in July 2006 and interprets FASB Statement of Financial Accounting Standards ASC 740-10. ASC 740-10 became effective for us on January 1, 2007 and prescribes a comprehensive model for the recognition, measurement, financial statement presentation and disclosure of uncertain tax positions taken or expected to be taken in a tax return. ASC 740-10 provides guidance on derecognition, classification, interest and penalties, accounting in interim periods, disclosure and transition.
We classify income tax-related interest and penalties as income taxes in the financial statements. The adoption of this pronouncement had no effect on our overall financial position or results of operations.
Summary
As a result of the above and other differences, our net income and shareholders’ equity under Argentine Banking GAAP and U.S. GAAP for the periods indicated were as follows:
| | | | | | | | | | | | | | | | | |
| | | Net Income (Loss) | | | Shareholders’ Equity (Deficit) | |
| | | Argentine Banking | | | | | | | Argentine Banking | | | | |
| | | GAAP | | | U.S. GAAP | | | GAAP | | | U.S. GAAP | |
| | | (in millions of Pesos) | |
| Fiscal Year 2010 | | | 408.9 | | | | 2,293.6 | | | | 2,469.5 | | | | 2,997.1 | |
| Fiscal Year 2009 | | | 229.3 | | | | 770.2 | | | | 2,052.5 | | | | 1,236.3 | |
| Fiscal Year 2008 | | | 176.8 | | | | (1,171.0 | ) | | | 1,845.7 | | | | (754.4 | ) |
The significant differences that result between shareholders’ equity under U.S. GAAP and shareholders’ equity under Argentine Banking GAAP primarily reflect that under U.S. GAAP:
| | • | | Bonar 2015 Bonds are reflected at market values, with changes from market values at the time of exchange being recognized as other comprehensive income. With the improvement in the Argentine economy, market values have increased, with a favorable influence on our financial position. |
| | • | | The difference between the consideration transferred for the acquisition of Compañía Financiera Argentna S.A. and Cobranzas y Servicicios S.A. and the fair value of the assets acquired and liabilities assumed was recognized as a gain in earnings on the acquisition date. Instead, under Argentine Banking GAAP, such difference was recorded under Liabilities-Provisions. |
| | | | Pursuant to the Argentine Central Bank regulations, the negative goodwill has to be charged to Income with regard to the causes that have originated it, not to exceed a 60-month straight-line method amortization. |
| | • | | The recognition of the Deffered Income Taxes under U.S. GAAP due to the fact that we consider that it is more likely than not that it will recover the net operating tax loss carryforward, the temporary differences and the presumed minimum income tax, with future taxable income. In addition, according to the taxable income projections, we estimated that the presumed minimum income tax will be utilized during the following years 2011 and 2012. Therefore, no valuation allowance was provided against presumed minimum income tax. As of December 31, 2009 we have recorded a valuation allowance against the presumed minimum income tax. |
The significant differences that result between net income under U.S. GAAP and net income under Argentine Banking GAAP primarily reflect that under U.S. GAAP:
| | • | | The sale of Boden 2012 Bonds and Discount Bonds generated a significant income for U.S. GAAP due to as of December 31, 2009 an unrealized gain was recorded under Other Comprehensive Income. |
| | • | | The difference between the consideration transferred for the acquisition of Compañía Financiera Argentina and Cobranzas y Servicios S.A. and the fair value of the assets acquired and liabilities assumed was recognized as a gain in earnings on the acquisition date. Instead, under Argentine Banking GAAP, the negative goodwill is charged to Income on a straight-line basis during 60 months. |
| | • | | The recognition of the Deffered Income Taxes under U.S. GAAP due to the fact that we consider that it is more likely than not that it will recover the net operating tax loss carryforward, the temporary differences and the presumed minimum income tax, with future taxable income. In addition, according to the taxable income projections, we estimated that the presumed minimum income tax will be utilized during the following years 2011 and 2012. Therefore, no valuation allowance was provided against presumed minimum income tax. As of December 31, 2009 we have recorded a valuation allowance against the presumed minimum income tax. |
-119-
Results by Segments
Our segment disclosures for the years ended December 31, 2010, 2009 and 2008 are presented on a basis that corresponds with our internal reporting structure, considering the banking business as one single segment that is evaluated regularly by the board of directors of Grupo Financiero Galicia (“the Board of Directors”) in deciding how to allocate resources and in assessing performance of our business.
We measure the performance of each of our business segments primarily in terms of “Net income”, in accordance with the regulatory reporting requirements of the Argentine Central Bank. Net income and other information by segment are based on Argentine Banking GAAP and are consistent with the presentation of our consolidated financial statements.
Our segments are the following:
| | • | | Banking: our banking business segment represents Banco Galicia consolidated line by line with Galicia Uruguay, Galicia Cayman and its subsidiaries and the results of other small banking-related subsidiaries. |
| | • | | Regional Credit Cards: our regional credit cards business segment represents the accounts of Tarjetas Regionales S.A. consolidated with its subsidiaries. |
| | • | | CFA Personal Loans: the CFA Group’s business segment primarily extends unsecured personal loans to low and middle-income segments of the Argentine population, with Cobranzas & Servicios S.A. and Procesadora Regional S.A. primarily providing processing services to CFA. |
| | • | | Insurance: our insurance business segment represents the accounts of Sudamericana and its subsidiaries. |
| | • | | Other Grupo Businesses: this segment includes the results of Net Investment, Galicia Warrants, GV Mandataria and Galval. |
Our results by segments are shown in Note 31 to our audited consolidated financial statements. Below is a discussion of our results of operations by segments for the years ended December 31, 2010, December 31, 2009 and December 31, 2008.
Banking
The table below shows the results of our banking business segment.
| | | | | | | | | | | | | |
| | | As of December 31, | |
| In millions of Pesos, except percentages | | 2010 | | | 2009 | | | 2008 | |
| Net Financial Income | | | 1,428.0 | | | | 1,144.2 | | | | 847.3 | |
| Net Income from Services | | | 880.6 | | | | 727.9 | | | | 655.0 | |
| | | | | | | | | | |
Net Operating Revenue | | | 2,308.6 | | | | 1,872.1 | | | | 1,502.3 | |
| | | | | | | | | | |
| Provisions for Loan Losses | | | 307.2 | | | | 388.7 | | | | 214.9 | |
| Administrative Expenses | | | 1,693.1 | | | | 1,321.8 | | | | 1,166.5 | |
| | | | | | | | | | |
Net Operating Income | | | 308.3 | | | | 161.6 | | | | 120.9 | |
| | | | | | | | | | |
| Income from Equity Investments | | | | | | | | | | | | |
| Tarjetas Regionales SA | | | 270.5 | | | | 133.0 | | | | 76.4 | |
Compañía Financiera Argentina S.A.(*) | | | 133.3 | | | | — | | | | — | |
| Sudamericana | | | 4.0 | | | | 3.4 | | | | 2.9 | |
| Others | | | 13.7 | | | | 13.1 | | | | 58.1 | |
| | | | | | | | | | |
Income from Equity Investments | | | 421.5 | | | | 149.5 | | | | 137.4 | |
| | | | | | | | | | |
Other Income (Loss) | | | (260.6 | ) | | | (139.3 | ) | | | (63.0 | ) |
| | | | | | | | | | |
Net Income | | | 469.1 | | | | 171.8 | | | | 195.3 | |
| | | | | | | | | | |
| Net Income as a % of Grupo Financiero Galicia’s Net Income | | | 115 | % | | | 75 | % | | | 110 | % |
| Average Loans | | | 12,818.6 | | | | 8,959.4 | | | | 8,707.5 | |
| Average Deposits | | | 18,112.0 | | | | 14,765.9 | | | | 13,199.0 | |
| | | |
| (*) | | Includes negative amortization of goodwill. |
-120-
This segment recorded Ps.469.1 million net income for the fiscal year ended December 31, 2010, as compared to Ps.171.8 million for the fiscal year ended December 31, 2009, a Ps.297.3 million increase, which in turn was Ps.23.5 million lower than the Ps.195.3 million for the fiscal year ended December 31, 2008.
The increase in the net income for the fiscal year ended December 31, 2010 was mainly attributable to the increase of Ps.436.5 million in its net operating revenue, the Ps.271.9 million increase in income from equity investments and the decrease in provisions for loan losses of Ps.81.5 million, as compared to that of the fiscal year ended December 31, 2009. This increase was partially offset by an increase from the fiscal year ended December 31, 2009 to the fiscal year ended December 31, 2010 in both administrative expenses in the amount of Ps.371.3 million and other losses in the amount of Ps.121.3 million.
Since the third quarter of 2010, 95% of the results of operations of CFA (net of results from transactions not involving third parties) were consolidated with those of the Bank, which during the second half of the fiscal year ended December 31, 2010, amounted to Ps.83.7 million, as well as the Ps.49.6 million profit from the amortization of the negative goodwill stemming from its acquisition. Such negative goodwill amounted to Ps.446.1 million as of December 31, 2010.
Net income from services was Ps.880.6 million for the fiscal year ended December 31, 2010, as compared to Ps.727.9 million for the fiscal year ended December 31, 2009, a 21% increase, which was in turn 11.1% higher than the Ps.655.0 million for the fiscal year ended December 31, 2008. These increases, which were in line with the growth exhibited by the general Argentine financial market, can mainly be attributed to an increase in the volume of transactions together with an increase in the price of certain services.
Provisions for loan losses and other receivables were Ps.307.2 million for the fiscal year ended December 31, 2010, as compared to Ps.388.7 million for the fiscal year ended December 31, 2009, a decrease of Ps.81.5 million. Such provisions for the fiscal year ended December 31, 2009 were Ps.173.8 million higher than those for the fiscal year ended December 31, 2008. The decrease during the fiscal year ended December 31, 2010 was due to the improvement experienced by the loan portfolio within a favorable economic environment, while the increase during the fiscal year ended December 31, 2009 was mainly attributable to the seasoning of the loan portfolio, within an environment of economic deterioration.
Administrative expenses were Ps.1,693.1 million for the fiscal year ended December 31, 2010, as compared to Ps.1,321.8 million for the fiscal year ended December 31, 2009, a 28.1% increase. Such expenses for the fiscal year ended December 31, 2009 were 13.3% higher than the Ps.1,166.5 million for the fiscal year ended December 31, 2008. These increases were mainly attributable to the increase in personnel expenses and in other administrative expenses. For the fiscal years ended December 31, 2010 and 2009, the increases in personnel expenses (salaries, Argentine social security contributions and expenses related to personnel services), as compared to the previous fiscal year, were mainly attributable to wage increases provided to the Bank’s employees. For the fiscal year ended December 31, 2010, the increase in other administrative expenses was mainly attributable to the higher level of activity and to the effect of inflation. For the fiscal year ended December 31, 2009, the increase in other administrative expenses showed a controlled growth, as a result of a successful policy of expense control within the context of an inflationary environment.
Income from equity investments was Ps.421.5 million for the fiscal year ended December 31, 2010, as compared to Ps.149.5 million and Ps.137.4 million for the fiscal years ended December 31, 2009 and 2008, respectively. The increase in income from equity investments for the fiscal year ended December 31, 2010 was mainly attributable to: i) the incorporation in the third quarter of 2010 of 95% of the results of operations of CFA (net of results from transactions not involving third parties) into those of the Bank, which during the second half of the fiscal year ended December 31, 2010 amounted to Ps.83.7 million, and the accrual of negative goodwill generated by the purchase of CFA in the amount of Ps.49.6 million; and ii) the income that resulted from the Bank’s equity investment in Tarjetas Regionales S.A. of Ps.270.5 million. The increase in income from equity investments for the fiscal year ended December 31, 2009 was mainly due to the Bank’s gain from its interest in Tarjetas Regionales S.A. of Ps.133.0 million, while for the fiscal year ended December 31, 2008 it was mainly due to the Bank’s gain from its interest in Tarjetas Regionales S.A. of Ps.76.4 million and the Ps.53.8 million profit from dividends received because of the Bank’s interest in Visa Argentina S.A.
-121-
Miscellaneous net losses were Ps.260.6 million for the fiscal year ended December 31, 2010, as compared to Ps.139.3 million and Ps.63.0 million for the fiscal years ended December 31, 2009 and 2008, respectively. The loss for the fiscal year ended December 31, 2010 was mainly attributable to the amortization of the total amount of deferred losses fromamparo claimsof Ps.281.0 million. The loss for the fiscal year ended December 31, 2009 was mainly attributable to the amortization of deferred losses fromamparo claimsof Ps.109.3 million. The increase in amortizations ofamparo claimsof Ps.69.8 million in 2009, as compared to the fiscal year ended December 31, 2008, is mainly attributable to the fact that, beginning in January of 2009, the Bank began to amortize in 36 monthly installments the amount deferred at December 31, 2008. The loss for the fiscal year ended December 31, 2008 was mainly attributable to the amortization of deferred losses fromamparo claimsof Ps.39.5 million, together with the provisions set aside for such claims. This effect was partially offset by income related to loan recoveries of Ps.54.6 million and financial income from margin requirements in connection with repurchase agreement transactions of Ps.34.2 million.
Regional Credit Cards
The table below shows the results of our regional credit cards business segment.
| | | | | | | | | | | | | |
| | | As of December 31, | |
| In millions of Pesos, except percentages | | 2010 | | | 2009 | | | 2008 | |
| Net Financial Income | | | 503.4 | | | | 375.5 | | | | 296.2 | |
| Net Income from Services | | | 1,040.1 | | | | 737.0 | | | | 571.8 | |
| | | | | | | | | | |
Net Operating Revenue | | | 1,543.5 | | | | 1,112.5 | | | | 868.0 | |
| | | | | | | | | | |
| Provisions for Loan Losses | | | 199.5 | | | | 250.8 | | | | 180.4 | |
| Administrative Expenses | | | 905.0 | | | | 621.9 | | | | 554.5 | |
| | | | | | | | | | |
Net Operating Income | | | 439.0 | | | | 239.8 | | | | 133.1 | |
| | | | | | | | | | |
| Other Income (Loss) | | | 101.7 | | | | 54.9 | | | | 45.2 | |
| Minority Interests | | | (78.4 | ) | | | (32.6 | ) | | | (20.6 | ) |
| | | | | | | | | | |
Pre-tax Income | | | 462.3 | | | | 262.1 | | | | 157.7 | |
| | | | | | | | | | |
| Income Tax Provision | | | 191.8 | | | | 129.1 | | | | 81.3 | |
| | | | | | | | | | |
Net Income | | | 270.5 | | | | 133.0 | | | | 76.4 | |
| | | | | | | | | | |
| Net Income as a % of Grupo Financiero Galicia’s Net Income | | | 66 | % | | | 58 | % | | | 43 | % |
| Average Loans | | | 3,341.8 | | | | 2,402.5 | | | | 2,105.0 | |
In fiscal year 2010, the business segment of the Regional Credit Card Companies recorded net income of Ps.270.5 million, as compared to Ps.133.0 million for the fiscal year ended December 31, 2009, a 103.4% increase. The net income for the fiscal year ended December 31, 2009 was 74.1% higher than that of the fiscal year ended December 31, 2008, which amounted to Ps.76.4 million.
Beginning in the third quarter of 2010, 5% of the results of operations of CFA were consolidated with those of the Regional Credit Card Companies along with the accrual of negative goodwill generated by the acquisition of CFA.
The increase in income corresponding to the Regional Credit Card Companies for the fiscal year ended December 31, 2010 was mainly attributable to: i) net operating revenue of Ps.431.0 million, ii) a decrease in loan loss provisions of Ps.51.3 million and iii) an increase in other income of Ps.46.8 million. This increase was partially offset by an increase in administrative expenses of Ps.283.1 million and an increase in income tax provision of Ps.62.7 million.
The increase in income corresponding to the Regional Credit Card Companies for the fiscal year ended December 31, 2009 was mainly attributable to the increase in net operating revenues of Ps.244.5 million, which was higher than the increase in the provisions for loan losses of Ps.70.4 million and the increase in administrative expenses of Ps.67.4 million.
-122-
The Regional Credit Card Companies experienced growth in the following key indicators during the fiscal year ended December 31, 2010, as compared to the fiscal year ended December 31, 2009:
| | • | | average statements issued: 11.7% growth between December 31, 2010 and December 31, 2009, reaching an annual average of 2.2 million customers; |
| | • | | increase in retail sales: 43%, from Ps.9,311 million as of December 31, 2009 to Ps.13,317 million as of December 31, 2010; |
| | • | | increase in loan portfolio (including managed portfolio): 44.2%, amounting to Ps.6,940 million during the fiscal year ended December 31, 2010; |
| | • | | increase in the number of purchase transactions: 17.3%, reaching 90.7 million during the fiscal year ended December 31, 2010; and |
| | • | | increase in the size of the distribution network: 11%, reaching a total of 231 service centers as of December 31, 2010. |
Tarjeta Naranja opened five locations in Greater Buenos Aires and opened its first branch in the Autonomous City of Buenos Aires. In addition, Tarjetas del Mar launched, together with Supermercados La Anónima, the credit card “La Anónima” distributed by 48 service centers in La Anónima’s stores. The Regional Credit Card Companies employed 5,008 employees as of December 31, 2010, which represents a 27% increase over the employee total for the fiscal year ended December 31, 2009.
During the fiscal year ended December 31, 2009, the Regional Credit Card Companies experienced growth in the following key indicators as compared to the fiscal year ended December 31, 2008:
| | • | | average statements issued: 6.6%, reaching 1.85 million on annual average; |
| | • | | loan portfolio (including managed portfolio): 3.8%, amounting to Ps.3,376 million at year-end; |
| | • | | turnover: 20%, reaching Ps.9,061 million on an annual basis; |
| | • | | number of purchase transactions: 10.5%, reaching 74.7 million during the year; |
| | • | | the size of the distribution network remained unchanged: 209 service centers; and |
| | • | | the number of personnel remained almost unchanged, reaching 3,936 employees as of December 31, 2009. |
The decrease in the Regional Credit Card Companies’ provisions for loan losses from Ps.250.8 million for the fiscal year ended December 31, 2009 to Ps.199.5 million for the fiscal year ended December 31, 2010 was mainly attributable to the improvements in the credit card sector (due to the application of higher creditworthiness standards to potential customers) and increased rates of collection (due to technological and organizational advances), in the context of a more favorable economic environment. In the fiscal year ended December 31, 2009, the higher provisions for loan losses and other receivables were mainly related to the advanced maturity of the credit card companies’ loan portfolios.
The increases in administrative expenses in fiscal years ended December 31, 2010 and 2009 were mainly attributable to the increased level of activity among the Regional Credit Card Companies, increased inflation and geographical expansion.
In fiscal years 2010 and 2009, miscellaneous net income mainly reflected loans recovered.
-123-
CFA Personal Loans
The table below sets forth the results of operations of the CFA Group’s personal loans business segment:
| | | | | |
| | | As of December 31, | |
| In millions of Pesos, except percentages | | 2010(*) | |
| Net Financial Income | | | 282.0 | |
| | | | |
| Net Income from Services | | | 25.9 | |
| | | | |
Net Operating Revenue | | | 307.9 | |
| | | | |
| Provisions for Loan Losses | | | 44.8 | |
| | | | |
| Administrative Expenses | | | 159.2 | |
| | | | |
Net Operating Income | | | 103.9 | |
| | | | |
| Other Income (Loss) | | | 37.5 | |
| | | | |
Pre-tax Income | | | 141.4 | |
| | | | |
| Income Tax Provision | | | 51.2 | |
| | | | |
Net Income | | | 90.2 | |
| | | | |
| Net Income as a % of Grupo Financiero Galicia’s Net Income | | | 22 | % |
| | | | |
| Average Loans | | | 640.4 | |
| | | | |
| Average Deposits | | | 116.5 | |
| | | | |
| | | |
| (*) | | Results of operations correspond to the second half of the fiscal year ended December 31, 2010, subsequent to the Bank’s acquisition of CFA Group. |
On June 24, 2010, Banco Galicia acquired 95% of the outstanding stock of the CFA Group; the remaining 5% was acquired by Tarjetas Regionales S.A.
The most significant entity in the CFA Group, in terms of revenue generation, is CFA, a leading non-bank financial institution that engages in retail lending and focuses on the area of unsecured personal loans and consumer credit cards within Argentina.
CFA customers are characterized by a limited relationship with traditional banks and a desire for quick and easy access to credit. CFA’s customers usually belong to the lower and middle-class sectors of the Argentine economy. “Efectivo Sí,” the leading brand of CFA, has an especially strong presence in Greater Buenos Aires.
As of December 31, 2010, CFA had 470,000 clients, 1,160 employees, 59 branches and 36 customer service centers located throughout Argentina. It had net loans to the private sector of Ps.1,192.8 million and a net worth of Ps.768.7 million.
Net income for the second half of 2010 amounted to Ps.90.2 million, as a consequence of net operating revenues of Ps.307.9 million and other income of Ps.37.5 million, respectively. These results were partially offset by losses arising from: i) administrative expenses of Ps.159.2 million; ii) loan loss provisions of Ps.44.8 million; and iii) income tax provision of Ps.51.2 million.
Insurance
The table below shows the results of our insurance business segment.
| | | | | | | | | | | | | |
| | | As of September 30, | |
| In millions of Pesos, except percentages | | 2010 | | | 2009 | | | 2008 | |
| Net Financial Income | | | 28.7 | | | | 28.5 | | | | 20.2 | |
| | | | | | | | | | |
| Net Operating Revenue | | | 28.7 | | | | 28.5 | | | | 20.2 | |
| | | | | | | | | | |
| Administrative Expenses | | | 56.2 | | | | 42.9 | | | | 30.0 | |
| | | | | | | | | | |
Net Operating Income | | | (27.5 | ) | | | (14.4 | ) | | | (9.8 | ) |
| | | | | | | | | | |
| Other Income (Loss) | | | 75.1 | | | | 55.3 | | | | 43.5 | |
| | | | | | | | | | |
Pre-tax Income | | | 47.6 | | | | 40.9 | | | | 33.7 | |
| | | | | | | | | | |
| Income Tax Provision | | | 16.3 | | | | 14.1 | | | | 11.1 | |
| | | | | | | | | | |
Net Income | | | 31.3 | | | | 26.8 | | | | 22.6 | |
| | | | | | | | | | |
| Net Income as a % of Grupo Financiero Galicia’s Net Income | | | 8 | % | | | 12 | % | | | 13 | % |
-124-
The accounting rules of the Argentine Central Bank establish that the accounts of non-homogeneous activities must be included under “Other Income/Loss”, therefore the income statement of Sudamericana was reclassified and that is why, in the table above, its main accounts (earned premiums, claims, acquisition costs, etc.) are included in such item. The results of this segment mainly represent the results of Galicia Seguros. For consolidation purposes, we have used Sudamericana’s consolidated financial statements as of September 30 of each year.
In the twelve-month period ended September 30, 2010, the insurance segment recorded Ps.31.3 million in net income. In the same period, Galicia Seguros recorded gains of Ps.29.1 million. This segment’s net income was mainly due to: (i) Ps.360.6 million of earned premiums, claims of Ps.53.3 million, and acquisition costs of Ps.144.3 million, (ii) net financial income of Ps.28.7 million, and (iii) administrative expenses amounting to Ps.56.2 million, of which approximately 37% corresponded to personnel expenses. Earned premiums for the twelve months ended September 30, 2010 were Ps.51.1 million greater than in the same period of 2009, representing a 16% increase.
In the twelve-month period ended September 30, 2009, the insurance segment recorded Ps.26.8 million in net income. In the same period, Galicia Seguros recorded gains of Ps.24.4 million. This segment’s net income was mainly due to: (i) Ps.309.5 million of earned premiums, claims of Ps.40.7 million, and acquisition costs of Ps.114.3 million, (ii) net financial income of Ps.28.5 million, and (iii) administrative expenses amounting to Ps.42.9 million, of which approximately 36% corresponded to personnel expenses. Earned premiums for the twelve months ended September 30, 2009 were Ps.83.5 million greater than in the same period of 2008, representing a 37% increase.
In the twelve-month period ended September 30, 2008, the insurance segment recorded Ps.22.6 million in net income. In the same period, Galicia Seguros recorded gains of Ps.20.7 million. This segment’s net income was mainly due to: (i) Ps.221.4 million of earned premiums and additional fees, claims for Ps.22.1 million, and acquisition costs of Ps.90.2 million; (ii) net financial income of Ps.20.2 million, and (iii) administrative expenses amounting to Ps.30.0 million, of which approximately 41% corresponded to personnel expenses.
During the three fiscal years, the company’s growths in premiums earned were mainly the result of Galicia Seguros’ performance through group life insurance, home insurance and accidental, death and dismemberment insurance sold through Banco Galicia and the Regional Credit Card Companies. The sales call center (customer contact center) helped to achieve such growths.
During 2010, 2009 and 2008, acquisition costs grew following the increases in underwritten premiums, while increases in administrative expenses were mainly due to the fact that a part of the value added tax is recorded at cost (certain life insurance products are exempt from such tax but the fees paid to the brokers and other expenses related thereto are subject to such tax) and to the salary increases and increases in other expenses within an inflationary context. It is important to note that during the three years the claims ratio have remained at practically the same level.
Other Grupo Businesses
This segment includes the results of Net Investment, Galicia Warrants, Galval and GV Mandataria. In fiscal year 2010, the segment recorded Ps.2.0 million in net loss, compared to Ps.2.3 million in net income in fiscal year 2009 and Ps.0.1 million in fiscal year 2008. In fiscal year 2010, this segment’s results were attributable to the net loss of Galicia Warrants and Net Investment of Ps.4.0 million and Ps.0.1 million, respectively, partially offset by a Ps.2.0 million and Ps.0.1 million attributable to Galicia Warrants’s and GV Mandataria’s net income, respectively. In fiscal year 2009, this segment’s results were attributable to the net income of Galicia Warrants and GV Mandataria of Ps.7.7 million and Ps.0.1 million, respectively, partially offset by losses of Ps.4.7 million and Ps.0.8 million corresponding to Galval and Net Investment, respectively.
In fiscal year 2008, this segment’s results were attributable to Galicia Warrant’s net income of Ps.2.4 million, partially offset by a Ps.1.2 million, Ps.1.1 million and Ps.0.02 million losses of Net Investment, Galval and GV Mandataria, respectively.
-125-
Consolidated Assets
The structure and main components of our consolidated assets as of the dates indicated were as follows:
| | | | | | | | | | | | | | | | | | | | | | | | | |
| | | As of December 31, | |
| | | 2010 | | | 2009 | | | 2008 | |
| | | Amounts | | | % | | | Amounts | | | % | | | Amounts | | | % | |
| | | (in millions of Pesos, except percentages) | |
| Cash and Due from Banks | | | 5,645.6 | | | | 15.8 | | | | 3,696.3 | | | | 13.4 | | | | 3,405.1 | | | | 13.8 | |
| Government and Corporate Securities | | | 2,278.0 | | | | 6.4 | | | | 3,920.4 | | | | 14.2 | | | | 1,531.9 | | | | 6.2 | |
| Loans | | | 21,353.8 | | | | 59.8 | | | | 13,477.9 | | | | 48.8 | | | | 11,774.6 | | | | 47.6 | |
| Other Assets | | | 6,430.7 | | | | 18.0 | | | | 6,507.8 | | | | 23.6 | | | | 8,024.2 | | | | 32.4 | |
| | | | | | | | | | | | | | | | | | | |
Total | | | 35,708.1 | | | | 100.0 | | | | 27,602.4 | | | | 100.0 | | | | 24,735.8 | | | | 100.0 | |
| | | | | | | | | | | | | | | | | | | |
Of our Ps.35,708.1 million total assets as of December 31, 2010, Ps.35,298.9 million, equivalent to 98.9% of the total, corresponded to Banco Galicia on a consolidated basis. The remaining 1.1% was attributable mainly to Sudamericana on a consolidated basis (Ps.293.9 million). The composition of our assets shows an increase in the participation of the line items “Loans” and “Cash and Due from Banks”, to the detriment of “Government and Corporate Securities” and “Other Assets”.
The item “Cash and Due from Banks” included cash for Ps.1,489.4 million, balances held at the Argentine Central Bank for Ps.3,932.3 million and balances held in correspondent banks for Ps.223.9 million. The balance held at the Argentine Central Bank and part of the cash are computable for meeting the minimum cash requirements set by the Argentine Central Bank.
Our holdings of government and corporate securities as of December 31, 2010 amounted to Ps.2,278.0 million, of which Ps.2,267.7 million were government securities. Our holdings of government and corporate securities are shown in more detail in Item 4. “Information on the Company-Selected Statistical Information-Government and Corporate Securities”.
Our total net loans amounted to Ps.21,353.8 million, of which Ps.21,333.7 million corresponded to Banco Galicia (including the Regional Credit Card Companies’ portfolios) and the remaining amount to secured loans held by Sudamericana. For more information on Banco Galicia’s loan portfolio, see Item 4. “Information on the Company-Selected Statistical Information-Loan Portfolio”.
| | • | | The “Other Assets” item mainly includes the following items recorded on our balance sheet under “Other Receivables Resulting from Financial Brokerage”, unless otherwise noted: Ps.1,483.6 million recorded under “Bank Premises and Equipment”, “Miscellaneous Assets” and “Intangible Assets”. |
| | • | | Ps.521.9 million corresponding to our holdings of debt securities and participation certificates issued by the Galtrust I Financial Trust, resulting from the securitization of loans to the provincial public sector in late 2000. |
| | • | | Ps.508.4 million of forward purchases of Bonar 2015 Bonds in connection with repurchase agreement transactions (including the corresponding security margins recorded as “Miscellaneous Receivables” in the balance sheet). |
| | • | | Ps.428.1 million corresponding to “Assets under Financial Leases”. |
| | • | | Ps.399.4 million of forward purchases in connection with repurchase agreement transactions. |
| | • | | Ps.395.7 million corresponding to the minimum presumed income tax recorded under “Miscellaneous Receivables”. |
| | • | | Ps.379.6 million corresponding to balances deposited at the Argentine Central Bank as guarantees in favor of clearing houses. |
| | • | | Ps.271.7 million corresponding to participation certificates in, and debt securities of, different financial trusts, created by Banco Galicia or by third parties. |
| | • | | Ps.168.5 million corresponding to holdings of the participation certificate in, and debt securities of, the special fund (referred to as “Special Fund Former Almafuerte Bank”) jointly formed by Banco Galicia with other private-sector banks in order to facilitate the recovery of the assets of former Almafuerte Bank. |
| | • | | Ps.52.9 million corresponding to equity investments. |
-126-
The “Other Assets” item decreased 1.2% as compared to fiscal year 2009, mainly as a consequence of: a) the write off of deferred losses in connection withamparo claims(which as of December 31, 2009 amounted to Ps.259.1 million) fully amortized during 2010; b) a decrease of Ps.62.7 million corresponding to our holdings in debt securities and participation certificates issued by Galtrust I Financial Trust because we recorded certain reserves to adjust the equity method used to account for the residual interest in the trust, at its fair value; c) a decrease of Ps.260.2 million corresponding to holdings of the participation certificates in, and debt securities of, the special fund Almafuerte, as a consequence of the fact that the outstanding balance of Class “A” participation certificates was fully paid and the special fund’s balance was partially paid and d) an increase of Ps.88.9 million in assets under financial leases originated in the increase of the volume operated.
Exposure to the Argentine Public Sector
The following table shows our total net exposure to the Argentine public sector as of December 31, 2010, 2009 and 2008. This exposure mainly consisted of exposure of Banco Galicia.
| | | | | | | | | | | | | |
| | | As of December 31, | |
| | | 2010 | | | 2009 | | | 2008 | |
| | | (in millions of Pesos) | |
Net Position in Government Securities | | | 3,111.7 | | | | 4,933.0 | | | | 3,645.3 | |
| | | | | | | | | | |
| Trading and Investment Accounts | | | 2,469.6 | | | | 1,810.5 | | | | 627.6 | |
| Boden 2012 Bonds | | | — | | | | 1,906.9 | | | | 2,350.8 | |
| Nobac 2010 | | | — | | | | 269.9 | | | | — | |
| Bonar 2015 Bonds | | | 642.1 | | | | 323.7 | | | | — | |
| Discount Bonds in Pesos and GDP-Linked Negotiable Securities | | | — | | | | 622.0 | | | | 666.9 | |
| | | | | | | | | | |
Loans | | | 24.6 | | | | 25.4 | | | | 1,480.7 | |
| | | | | | | | | | |
| Financial Sector | | | — | | | | — | | | | 107.1 | |
| Secured Loans and Others | | | 24.6 | | | | 25.4 | | | | 1,373.6 | |
| | | | | | | | | | |
Other Receivables Resulting from Financial Brokerage | | | 808.2 | | | | 924.6 | | | | 928.3 | |
| | | | | | | | | | |
| Trusts’ Certificates of Participation and Securities | | | 807.0 | | | | 923.7 | | | | 927.5 | |
| | | | | | | | | | |
| Other | | | 1.2 | | | | 0.9 | | | | 0.8 | |
| | | | | | | | | | |
Total Assets(1) | | | 3,944.5 | | | | 5,883.0 | | | | 6,054.3 | |
| | | | | | | | | | |
| | | |
| (1) | | Does not include deposits with the Argentine Central Bank, which constitute one of the items by which Banco Galicia complies with the Argentine Central Bank’s minimum cash requirements. |
As of December 31, 2010, our total exposure to the public sector amounted to Ps.3,944.5 million. The decrease as compared to the previous fiscal year was mainly attributable to the sale of Banco Galicia’s holdings of Boden 2012 Bonds and Discount Bonds.
Excluding Banco Galicia’s holding of debt securities issued by the Argentine Central Bank (Ps.2,393.0 million, Ps.1,953.7 million and Ps.583.8 million, for fiscal years 2010, 2009 and 2008, respectively), net exposure to the non-financial public sector decreased by Ps.2,377.8 million compared to 2009 and by Ps.3,919.0 million compared to 2008, which represents decreases of 60.5% and 71.6%, respectively.
As of December 31, 2009, our total exposure to the public sector amounted to Ps.5,883 million. The decrease as compared to the previous fiscal year was mainly due to the sale of part of the public sector assets portfolio received from the exchange of Secured Loans carried out by the end of January, 2009 and to the sale in June 2009 of the 15th interest and amortization coupon of Boden 2012 Bonds due in August 2009. Likewise, but with lower impact, it was due to the fact of having received assets issued by the Argentine Central Bank during said exchange.
-127-
Securitization of Assets
In the normal course of business, our operating subsidiaries (Banco Galicia and the Regional Credit Card Companies) use the securitization of assets as a source of funding. The securitization of assets basically involves a company transferring assets to a trust and the trust funding the purchase by issuing securities that are sold to third parties. A trust is a special-purpose entity, not an operating entity; typically, a trust is set up for the single purpose of completing the securitization transaction, has a limited life and no employees. Trust securities can be publicly offered, which is the case in those financial trusts in which Banco Galicia or the Regional Credit Card Companies acted as trustor. See Note 30 to our audited financial statements for a description of the outstanding trusts as of December 31, 2010.
During 2010, we didn’t generate funds through the securitization and sale of on-balance sheet and off-balance sheet loans of Banco Galicia and the Regional Credit Card Companies, while in 2009 and 2008 we generated funds through the securitization and sale of on-balance sheet and off-balance sheet loans of Banco Galicia and the Regional Credit Card Companies, for aggregate amounts of Ps.40 million and Ps.644.3 million, respectively. No gains or losses were recognized in the sale of these loans. As a result of these securitizations, we retained certain interests in those trusts through senior debt securities and certificates of participation in the amount of Ps.14.5 million in fiscal year 2009 and Ps.101.1 million in fiscal year 2008.
Funding
Banco Galicia’s and the Regional Credit Card Companies’ lending activities are our main asset-generating businesses. Accordingly, most of our borrowing and liquidity needs are associated with these activities. We also have liquidity needs at the level of our holding company, which are discussed in Item 5. “Operating and Financial Review and Prospects-Item 5.B. “Liquidity and Capital Resources-Liquidity-Holding Company on an Individual Basis”. Our objective is to maintain cost-effective and well diversified funding to support current and future asset growth in our businesses. For this, we rely on diverse sources of funding and have also engaged in a process of reducing Banco Galicia’s high cost liabilities incurred as a consequence of the 2001-2002 crisis. The use and availability of funding sources depends on market conditions, both local and foreign, and prevailing interest rates. Market conditions in Argentina include a structurally limited availability of domestic long-term funding.
Our funding activities and liquidity planning are integrated into our asset and liability management and our financial risks management and policies. The liquidity policy of Banco Galicia, our main subsidiary, is described in Item 5. “Operating and Financial Review and Prospects-Item 5.B. “Liquidity and Capital Resources-Banco Galicia’s Liquidity Management” and our other financial risk policies, including interest rate, currency and market risks are described in Item 11. “Quantitative and Qualitative Disclosures about Market Risk”. Our funding sources are discussed below.
Traditionally, our primary source of funding has been Banco Galicia’s deposit taking activity. Although Banco Galicia has access to Argentine Central Bank financing, management does not view this as a primary source of funding in line with our overall strategies discussed herein.
Other important sources of funding have traditionally included issuing Dollar-denominated medium and long-term debt securities issued in foreign capital markets and borrowing from international banks and multilateral credit agencies. After the restructuring of its foreign debt in May 2004 and until the US$300 million bond issuance in May 2011, Banco Galicia had not relied on the issuance of new debt securities, and entered into three long term loan agreements with the International Finance Corporation (“IFC”) in 2005, 2007 and 2010 for US$130 million, with the purpose of funding long-term loans to SMEs. In addition, Banco Galicia entered into a long-term loan agreement with Netherlands Financierings-Moatschappy Voor Ont Wikkelingslanden N.V. (“FMO”) on December 17, 2010 for US$20.0 million and a long-term loan agreement with the Inter-American Development Bank (“IDB”) on February 15, 2011 for US$30.0 million.
The Regional Credit Card Companies and CFA issue debt securities in the local and foreign capital markets.
Selling government securities under repurchase agreement transactions has been another recurrent source of funding for Banco Galicia. In 2010, the repurchase transactions of government securities increased Ps.187.0 million (principal and interest) and in 2009 decreased Ps.373.1 million (principal and interest). Within its liquidity policy, Banco Galicia considers its unencumbered liquid government securities holdings as part of its available excess liquidity. See Item 5. “Operating and Financial Review and Prospects”-Item 5.B. “Liquidity and Capital Resources-Banco Galicia’s Liquidity Management”.
-128-
Historically (prior to 2009 and 2010), the securitization of assets in the local market has also been a significant and growing source of medium-term funding, for up to approximately four years for Banco Galicia, while for the Regional Credit Card companies the terms are shorter (approximately two years). In fiscal year 2008, the securitization of loans generated funds of Ps.261.5 million from the securitization of loans granted by Banco Galicia on an individual basis, and of Ps.382.8 million from the securitization of the Regional Credit Card Companies’ loan portfolios. See “-Securitization of Assets”.
The Regional Credit Card Companies fund their business through the issuance of debt securities in the local and international capital markets, borrowing from local financial institutions, asset securitization and debt with merchants generated in the ordinary course of business of any credit card issuing company. In 2010, the Regional Credit Card Companies issued securities in an amount equal to Ps.504.6 million.
Below is a breakdown of our funding as of the dates indicated:
| | | | | | | | | | | | | | | | | | | | | | | | | |
| | | December 31, | |
| | | 2010 | | | 2009 | | | 2008 | |
| | | Amounts | | | % | | | Amounts | | | % | | | Amounts | | | % | |
| | | (in millions of Pesos, except percentages) | |
Deposits | | | 22,222.8 | | | | 62.2 | | | | 17,039.4 | | | | 61.7 | | | | 14,056.1 | | | | 56.8 | |
| Current Accounts and Other Demand Deposits | | | 5,565.7 | | | | 15.6 | | | | 3,719.1 | | | | 13.5 | | | | 3,105.4 | | | | 12.6 | |
| Savings Accounts | | | 6,362.0 | | | | 17.8 | | | | 4,994.7 | | | | 18.1 | | | | 4,035.0 | | | | 16.3 | |
| Time Deposits | | | 9,724.9 | | | | 27.2 | | | | 7,954.8 | | | | 28.8 | | | | 6,548.1 | | | | 26.5 | |
| Other Deposits | | | 463.2 | | | | 1.3 | | | | 248.7 | | | | 0.9 | | | | 263.2 | | | | 1.1 | |
| Accrued Interest, Quotation Differences and CER Adjustment | | | 107.0 | | | | 0.3 | | | | 122.1 | | | | 0.4 | | | | 104.5 | | | | 0.4 | |
| | | | | | | | | | | | | | | | | | | |
Debt with Financial Institutions(1) | | | 2,114.5 | | | | 5.9 | | | | 1,480.1 | | | | 5.4 | | | | 2,172.9 | | | | 8.8 | |
| Domestic Financial Institutions | | | 668.3 | | | | 1.9 | | | | 322.3 | | | | 1.2 | | | | 248.6 | | | | 1.0 | |
| International Banks and Credit Agencies | | | 649.5 | | | | 1.8 | | | | 548.1 | | | | 2.0 | | | | 941.5 | | | | 3.8 | |
| Repurchases | | | 796.7 | | | | 2.2 | | | | 609.7 | | | | 2.2 | | | | 982.8 | | | | 4.0 | |
| | | | | | | | | | | | | | | | | | | |
Negotiable Obligations (Unsubordinated and Subordinated) (1) | | | 2,041.7 | | | | 5.7 | | | | 2,716.6 | | | | 9.8 | | | | 2,932.5 | | | | 11.9 | |
| | | | | | | | | | | | | | | | | | | |
Other obligations | | | 6,859.6 | | | | 19.2 | | | | 4,314.0 | | | | 15.6 | | | | 3,728.6 | | | | 15.0 | |
| | | | | | | | | | | | | | | | | | | |
Shareholders’ Equity | | | 2,469.5 | | | | 6.9 | | | | 2,052.5 | | | | 7.4 | | | | 1,845.7 | | | | 7.5 | |
| | | | | | | | | | | | | | | | | | | |
Total Funding | | | 35,708.1 | | | | 100.0 | | | | 27,602.6 | | | | 100.0 | | | | 24,735.8 | | | | 100.0 | |
| | | | | | | | | | | | | | | | | | | |
| | | |
| (1) | | Includes accrued interest, quotation differences, and CER adjustment where applicable. |
As of December 31, 2010, deposits represented 62.2% of our funding, up from 61.7% as of December 31, 2009 and up from 56.8% as of December 31, 2008. Our deposit base has increased 30.4% in 2010 and 21.2% in 2009. In 2010, the increase in deposits of Ps.5,183.4 million was due to the increase in transactional deposits (deposits in current and savings accounts) and time deposits. The increase in 2009 was also the result of an increase in transactional deposits and time deposits. All of the growth was due to deposits received by Banco Galicia’s Argentine operations. For more information on deposits, see Item 4. “Information on the Company-Selected Statistical Information-Deposits”.
As of December 31, 2010, credit lines from international banks and credit agencies representing Dollar-denominated debt subject to foreign law amounted to Ps.649.5 million. Of this total, Ps.410.6 million corresponded to trade loans and Ps.230.7 million corresponded to an IFC loan granted to Banco Galicia in 2005 which increased at the end of 2010 with the signing of a new agreement. Credit lines from international banks and credit agencies increased to Ps.649.5 million at the end of 2010 from Ps.548.1 million as of December 31, 2009. The increase was mainly due to the increase in trade loans.
-129-
Our debt securities outstanding amounted to Ps.2,041.7 million (principal and interest) as of December 31, 2010, as compared to Ps.2,716.6 million as of December 31, 2009, and Ps.2,932.5 million as of December 31, 2008. Of our debt securities outstanding at the end of fiscal year 2010, Ps.1,700.0 million (only principal) corresponded to Dollar-denominated debt subject to foreign law and Ps.264.9 million (only principal) corresponded to Peso-denominated debt of the Regional Credit Card Companies structured as negotiable obligations. As of December 31, 2010, the breakdown of our Dollar-denominated debt was as follows:
| | • | | Ps.1,188.8 million of 2019 Notes, issued in 2004 and corresponding to new debt of Banco Galicia resulting from the foreign debt restructuring completed in May of said year. |
| | • | | Ps.147.3 million of class XII negotiable obligations, maturing in 2011, issued by Tarjeta Naranja S.A. |
| | • | | Ps.58.0 million of class IX series II negotiable obligations, in 2011, issued by Tarjeta Naranja S.A. |
| | • | | Ps.79.8 million of series XXII negotiable obligations, maturing in 2011, issued by Tarjetas Cuyanas S.A. |
| | • | | Ps.70.5 million and Ps.106.8 million of class II series II and III negotiable obligations, respectively, maturing in 2012 and 2013, issued by Grupo Financiero Galicia. |
| | • | | Ps.42.1 million of class I series II negotiable obligations, maturing in 2011, issued by Grupo Financiero Galicia. |
| | • | | Ps.6.7 million of past due foreign debt included in Banco Galicia’s 2004 debt restructuring, the holders of which did not participate in such restructuring. |
The decrease in our debt securities outstanding as of December 31, 2010 from the amount as of December 31, 2009 was mainly the consequence of the following: i) the payment of the last principal installment for the 2010 Notes of 12.5%, for a total of US$34.2 million and ii) the cancellation in advance of 2014 Notes for US$194.6 million.
The decrease in our debt securities outstanding as of December 31, 2009 from the amount as of December 31, 2008 was mainly the consequence of the following: i) the payment of two principal installments for the 2010 Notes of 12.5% each, for a total of US$68.4 million, ii) the cancellation in advance of 2014 Notes for US$77.3 million, which were acquired in market transactions carried out during the fiscal year, (iii) the full amortization of Galicia Uruguay’s restructured debt structured as negotiable obligations by US$16.1 million and (iv) the issuance of Ps.125.8 million and Ps.40.3 million of series I and series II negotiable obligations, respectively, by Grupo Financiero Galicia.
For more information see “-Contractual Obligations” below.
-130-
Ratings
The following are our ratings as of the date of this annual report:
LOCAL RATINGS
| | | | | | | | | |
| | | Standard & | | | | Evaluadora | | |
| | | Poor’s | | Fitch Argentina | | Latinoamericana | | Moody’s |
Grupo Financiero Galicia S.A. | | | | | | | | |
| Rating of Shares | | 1 | | | | | | |
Short-/Medium Term Debt (1) | | | | | | AA- | | |
Banco de Galicia y Buenos Aires S.A. | | | | | | | | |
| Counterparty Rating | | raAA- | | | | | | |
Long-Term Debt(2) (3) | | raAA- | | | | | | Aa3.ar |
Subordinated Debt(2) (4) | | raA+ | | | | A+ | | Aa3.ar |
| Deposits (Long Term / Short Term) | | raAA- / raA-1+ | | | | | | |
| Deposits (Local Currency / Foreign Currency) | | | | | | | | Aa2.ar / Ba1.ar |
| Trustee | | | | | | | | TQ1(-).ar |
Tarjeta Naranja S.A. | | | | | | | | |
Medium-/Long-Term Debt(2) (5) | | | | AA(arg) | | | | |
Short-Term Debt(2) (6) | | | | A1+(arg) | | | | |
Tarjetas Cuyanas S.A. | | | | | | | | |
Long-Term Debt(2) (7) | | | | AA-(arg) | | | | |
Short-Term Debt(2) (8) | | | | A1(arg) | | | | |
CFA S.A. | | | | | | | | |
Long-Term Debt(9) | | | | AA-(arg) | | | | Aa2.ar |
Short-Term Debt(10) | | | | A1(arg) | | | | Aa2.ar |
| Deposits (Local Currency / Foreign Currency) | | | | | | | | Aa2.ar / Ba1.ar |
| |
INTERNATIONAL RATINGS | | | | | | | | |
Banco de Galicia y Buenos Aires S.A. | | | | | | | | |
Long-Term Debt(2) (3) | | B | | | | | | B2 |
Tarjeta Naranja S.A. | | | | | | | | |
Medium-/Long-Term Debt(2) (11) | | | | B | | | | |
Tarjetas Cuyanas S.A. | | | | | | | | |
Long-Term Debt(2) (12) | | | | B | | | | |
| | | |
| (1) | | Class I series II, class II series II and class II series III negotiableobligations. |
| |
| (2) | | See “-Contractual Obligations”. |
| |
| (3) | | Class I negotiable obligations. |
| |
| (4) | | Subordinated Negotiable Obligations Due in 2019. |
| |
| (5) | | Class IV, class IX series II, class XII and class XIII negotiable obligations. |
| |
| (6) | | Class XI negotiable obligations. |
| |
| (7) | | Class I series II, class III and series XVIII negotiable obligations. |
| |
| (8) | | Class II and class IV negotiable obligations. |
| |
| (9) | | Class III series II negotiable obligations. |
| |
| (10) | | Class III series I negotiable obligations. |
| |
| (11) | | Class IV, class XII and class XIII negotiable obligations. |
| |
| (12) | | Class XVIII negotiable obligations. |
Debt Programs
On March 9, 2009, our shareholders, during the ordinary shareholders’ meeting, and the Board of Directors created a global short-, medium- and long-term negotiable obligations program, for a maximum outstanding amount of US$60 million. This program was authorized pursuant to Resolution No. 16,113 of April 29, 2009 of the CNV. On March 16, 2009 and on April 24, 2009, the Board of Directors approved the terms and conditions of the issuance of the class I, series I and series II negotiable obligations.
Within the program, on June 4, 2009 Grupo Financiero Galicia issued two series of bonds for a total amount of US$45 million, with the following characteristics: (i) US$34.4 million of non-interest bearing class I, series I negotiable obligations, due on May 30, 2010, this bond was issued at a price of 92.68/100 and with a yield of 8%; and (ii) US$10.6 million of 12.5% class I, series II negotiable obligations, due on May 25, 2011, this bond was issued at a price of 103.48/100 with a yield of 10.5%. Interest is payable on the notes described in (ii) semiannually.
-131-
On April 14, 2010, our shareholders held an ordinary and extraordinary shareholders’ meeting during which they approved an increase of US$40 million in the amount of the global program of simple short-, medium- and/or long- term negotiable obligations. Therefore, the maximum amount of the program, which was originally set at US$60 million or its equivalent in any other currency, was increased to US$100 million or its equivalent in any other currency.
Moreover, during fiscal year 2010, Grupo Financiero Galicia repaid, upon maturity, its class I, series I negotiable obligations, for US$34.4 million and made an offer of negotiable obligations for a face value of US$45 million. The subscription period ended on June 4, 2010; negotiable obligations were fully subscribed and Grupo Financiero Galicia decided not to issue series I, which was planned to be issued at a discount. The cut-off rate for series II was 101.82%, for a face value of US$18.1 million, equivalent to a 7% annual yield. As regards series III, the cut-off rate was 101.28%, for a face value of US$26.9 million, equivalent to an 8.5% annual yield.
On June 8, 2010 Grupo Financiero Galicia issued two series of bonds for a total amount of US$45 million, with the following characteristics: (i) US$18.14 million of 8% class II, series II negotiable obligations, due in 2012, issued at a price of 101.82/100, with a yield of 7% and (ii) US$26.86 million of 9% class II, series III negotiable obligations due in 2013, issued at a price of 101.28/100, with a yield of 8.5%. Interest is payable semiannually.
During 2011, Grupo Financiero Galicia repaid, upon maturity, the class I, series II negotiable obligations for US$10.6 million.
Banco Galicia has a program outstanding for the issuance and re-issuance of non-convertible negotiable obligations, subordinated or non-subordinated, adjustable or non-adjustable, secured or unsecured, with a term from 30 days to up to the current permitted maximum (30 years), for a maximum outstanding face value during the period of such program of up to US$342.5 million. This program was approved by the CNV on November 4, 2005 and the extension of the program was approved by the CNV pursuant to Resolution No. 16,454, dated November 11, 2010. The term of the program is for five years commencing on the date of approval of the extension by the CNV. On May 4, 2011 Banco Galicia issued 8.75% class I notes due 2018 in the aggregate principal amount of US$300.0 million under this program. These notes are subject to a number of significant covenants, which are subject to important qualifications and exceptions, that, among other things, restrict the ability of (i) Banco Galicia and certain of its subsidiaries to directly or indirectly, create, incur, assume or suffer to exist liens upon its present or future assets to secure any indebtedness and (ii) Banco Galicia to merge, consolidate or amalgamate with or into, or convey or transfer or lease all or substantially all of its properties and assets, whether in one transaction or a series of related transactions.
Tarjeta Naranja S.A. has a program outstanding with the same characteristics, for a maximum outstanding face value during the period of such program of up to US$350 million. The program was approved by the CNV on November 16, 2007. As of December 31, 2010, debt for a principal amount outstanding of US$94.6 million had been issued under the program. Tarjeta Naranja S.A.’s program contains certain restrictions on liens, subject to the provisions established in the applicable pricing supplement with respect to each class and/or series of negotiable obligations, so long as any note issued under such program remains outstanding. Certain notes issued under Tarjeta Naranja S.A.’s program are subject to covenants that limit the ability of Tarjeta Naranja S.A. and certain of its subsidiaries, subject to important qualifications and exceptions, to pay dividends on its capital stock or redeem, repurchase or retire its capital stock or subordinated indebtedness, make certain restricted payments, and consolidate, merge or transfer assets, among others.
Tarjetas Cuyanas S.A. has a program outstanding with the same characteristics, for a maximum outstanding face value during the period of such program of up to US$80 million. The CNV approved the program on May 2, 2007 and approved the increase of its maximum outstanding face value to up to US$120 million on May 18, 2010. As of December 31, 2010, debt for a principal amount outstanding of US$45.1 million had been issued under this program.
CFA has a program outstanding for the issuance of ordinary short, medium or long term, secured or unsecured, subordinated or non-subordinated, negotiable obligations, for a maximum outstanding face value during the period of such program of up to Ps.200 million. The CNV approved this program on August 3, 2006, and approved the increase of its maximum outstanding face value to up to Ps.500 million on March 19, 2008. As of December 31, 2010, there was no outstanding debt issued under CFA’s program. On January 27, 2011 the CNV approved an extension of the program and approved the increase of its maximum outstanding face value to up to US$250 million. On March 28, 2011 CFA issued debt in the aggregate principal amount of Ps.100 million under its program. See “-Significant Changes”.
-132-
Contractual Obligations
The table below identifies the principal amounts of our main on balance-sheet contractual obligations, their currency of denomination, remaining maturity and interest rate and the breakdown of payments due, as of December 31, 2010.
| | | | | | | | | | | | | | | | | | | | | | | | | | | | | |
| | | | | | | Annual | | | | | | | Less than | | | 1 to 3 | | | 3 to 5 | | | Over 5 | |
| | | Maturity | | | Interest Rate | | | Total | | | 1 Year | | | Years | | | Years | | | Years | |
Grupo Financiero Galicia | | | | | | | | | | | | | | | | | | | | | | | | | | | | |
| Negotiable Obligations Series II Due 2011 (US$) | | | 2011 | | | 12.50% | | | 42.8 | | | | 42.8 | | | | — | | | | — | | | | — | |
| Negotiable Obligations Class II Series II Due 2012 (US$) | | | 2012 | | | 8.00% | | | 71.2 | | | | 0.7 | | | | 70.5 | | | | — | | | | — | |
| Negotiable Obligations Class II Series III Due 2013 (US$) | | | 2013 | | | 9.00% | | | 107.5 | | | | 0.7 | | | | 106.8 | | | | — | | | | — | |
Banco Galicia | | | | | | | | | | | | | | | | | | | | | | | | | | | | |
Deposits | | | | | | | | | | | | | | | | | | | | | | | | | | | | |
| Time Deposits (Pesos/US$) | | Various | | Various | | | 9,862.1 | | | | 9,826.8 | | | | 35.0 | | | | 0.2 | | | | 0.1 | |
Bonds | | | | | | | | | | | | | | | | | | | | | | | | | | | | |
2019 Notes (US$)(1) (2) | | | 2019 | | | 11.00% | | | 1,253.0 | | | | — | | | | — | | | | — | | | | 1,253.0 | |
9% Notes Due 2003 (US$)(3) | | | 2003 | | | 9.00% | | | 12.2 | | | | 12.2 | | | | — | | | | — | | | | — | |
Loans | | | | | | | | | | | | | | | | | | | | | | | | | | | | |
Floating Rate Loans Due 2019 (US$)(1) (4) | | | 2019 | | | Libor + 578 bp | | | 8.5 | | | | — | | | | — | | | | — | | | | 8.5 | |
| IFC Financial Loans (US$) | | Various | | Libor + 350 bp | | | 230.6 | | | | 68.7 | | | | 120.9 | | | | 41.0 | | | | — | |
Other Financial Loans (US$)(5) | | | 2010 | | | Various | | | 410.0 | | | | 410.0 | | | | — | | | | — | | | | — | |
| IDB Financial Loans (Pesos) | | Various | | Various | | | 54.9 | | | | 12.0 | | | | 21.4 | | | | 12.6 | | | | 8.9 | |
| Fontar Financial Loans (Pesos) | | Various | | Various | | | 47.7 | | | | 14.7 | | | | 20.1 | | | | 8.9 | | | | 4.0 | |
| BICE Financial Loans (Pesos) | | Various | | Various | | | 10.2 | | | | 2.7 | | | | 4.6 | | | | 2.9 | | | | — | |
| BICE Financial Loans (US$) | | Various | | Various | | | 13.7 | | | | 2.9 | | | | 5.5 | | | | 5.3 | | | | — | |
Repurchases (Pesos)(6) | | | 2010 | | | Various | | | 359.1 | | | | 359.1 | | | | — | | | | — | | | | — | |
Repurchases (US$)(6) | | | 2010 | | | Various | | | 437.7 | | | | 40.1 | | | | 397.6 | | | | — | | | | — | |
| | | | | | | | | | | | | | | | | | | | | | |
Tarjetas Regionales S.A. | | | | | | | | | | | | | | | | | | | | | | | | | | | | |
| Financial Loans with Local Banks (Pesos) | | Various | | Various | | | 376.5 | | | | 190.4 | | | | 186.1 | | | | — | | | | — | |
| Negotiable Obligations (Pesos/US$) | | Various | | Various | | | 552.5 | | | | 543.7 | | | | 8.8 | | | | — | | | | — | |
| | | | | | | | | | | | | | | | | | | | | | |
CFA | | | | | | | | | | | | | | | | | | | | | | | | | | | | |
| Local Financing (Pesos) | | Various | | Various | | | 212.5 | | | | 137.5 | | | | 75.0 | | | | — | | | | — | |
| | | | | | | | | | | | | | | | | | | | | | |
Total | | | | | | | | | | | 4,200.6 | | | | 1,838.2 | | | | 1,017.3 | | | | 70.7 | | | | 1,274.4 | |
| | | | | | | | | | | | | | | | | | | | | | |
Principal and interest. Includes the CER adjustment, where applicable.
| | | |
| (1) | | Issued in 2004 as part of the restructuring of the foreign debt of Banco Galicia’s Head Office and its Cayman Branch. |
| |
| (2) | | Subordinated Notes Due 2019: Interest paid in cash: 6% per annum from January 1, 2004 until (but not including) January 1, 2014, payable semiannually, on January 1 and July 1 of each year, beginning on July 1, 2004. Unless the notes are previously redeemed, the annual interest rate will increase to 11% per annum from that date until (but not including) January 1, 2019. Interest paid in additional subordinated negotiable obligations due 2019: 5% per annum from January 1, 2004, to be paid on January 1, 2014 and January 1, 2019. Principal amortizes in full on January 1, 2019, unless the notes are previously redeemed at par plus accrued but unpaid interest, in whole or in part, at Banco Galicia’s option, at any time after the 2010 Notes and the 2014 Notes have been repaid in full and, otherwise, in accordance with the terms of the agreements governing such notes. |
| |
| (3) | | The balance represents debt not tendered by its holders to the exchange offered by Banco Galicia to restructure its foreign debt, which was completed in May 2004. |
| |
| (4) | | Interest payable in cash: Libor+78 b.p., per annum from January 1, 2004, until (but not including) January 1, 2014, payable semiannually, on January 1 and July 1 of each year, beginning on July 1, 2004. Unless the loans are previously redeemed, the annual interest rate will increase to Libor+578 b.p. per annum from that date until (but not including) January 1, 2019. Also pays interest in additional subordinated loans, due 2019: 5% per annum from January 1, 2004, to be paid on January 1, 2014 and January 1, 2019. Principal amortizes in full on January 1, 2019 unless the loans are previously redeemed at part plus accrued interest and additional amounts, if any, in whole or in part at Banco Galicia’s option, in accordance with the terms of the agreements governing such loans. |
| |
| (5) | | Borrowings to finance international trade operations to Bank customers. |
| |
| (6) | | Includes premiums. |
-133-
Off- Balance Sheet Contractual Obligations
Operating Leases
As of December 31, 2010, we also had off-balance sheet contractual obligations arising from the leasing of certain properties used as a part of our distribution network. The estimated future lease payments in connection with these properties are as follows:
| | | | | |
| | | (In millions of Pesos) | |
| 2011 | | | 50.40 | |
| 2012 | | | 61.49 | |
| 2013 | | | 71.94 | |
| 2014 | | | 80.57 | |
| 2015 | | | 88.63 | |
| 2016 and After | | | 95.72 | |
| | | | |
Total | | | 448.75 | |
| | | | |
Other
As a shareholder of Aguas Cordobesas S.A., Banco Galicia is a guarantor with respect to compliance with certain obligations arising from the concession contract signed by Aguas Cordobesas S.A. In addition, Banco Galicia and the other shareholders committed, in certain circumstances, to provide financial support to the company if it was unable to fulfill the commitments it had undertaken with various international financial institutions.
Banco Galicia, as a shareholder and proportionally to its 10.833% interest, is jointly responsible, to the Province of Córdoba, for contractual obligations under the concession contract for its entire term. Should any of the other shareholders fail to comply with the commitments arising from their joint responsibility, the province may force Banco Galicia to assume the unfulfilled commitment, but only in proportion and to the extent of the interest held by Banco Galicia. See Note 3 to our consolidated financial statements.
Off-Balance Sheet Arrangements
Our off-balance sheet risk mainly arises from Banco Galicia’s activities.
In the normal course of its business, Banco Galicia is a party to financial instruments with off-balance sheet risk which are entered into in order to meet the financing needs of its customers. These instruments expose us to credit risk in addition to the amounts recognized on our consolidated balance sheets. These financial instruments include commitments to extend credit, standby letters of credit, guarantees granted and acceptances.
Commitments to Extend Credit, Stand-By Letters of Credit and Guarantees Granted
Guarantees granted are surety guarantees in connection with transactions between two parties. Standby letters of credit and guarantees granted are conditional commitments issued by Banco Galicia to guarantee the performance of a customer to a third party. Acceptances are conditional commitments for foreign trade transactions.
Commitments to extend credit are agreements to lend to a customer at a future date, subject to meeting certain contractual terms. Commitments generally have fixed expiration dates or other termination clauses and may require payment of a fee. Since many of the commitments are expected to expire without being drawn upon, total commitment amounts do not necessarily represent actual future cash requirements. We evaluate each customer’s creditworthiness on a case-by-case basis.
We use the same credit policies in making commitments, conditional obligations and guarantees as we do for granting loans. In the opinion of management, our outstanding commitments and guarantees do not represent unusual credit risk.
Our exposure to credit loss in the event of non-performance by the other party to the financial instrument for commitments to extend credit, standby letters of credit, guarantees granted and acceptances is represented by the contractual notional amount of those investments.
-134-
Our credit exposure related to these items as of December 31, 2010, is summarized below:
| | | | | |
| | | December 31, | |
| | | 2010 | |
| | | (in millions of Pesos) | |
| Commitments to Extend Credit | | | 1,840.2 | |
| Standby Letters of Credit | | | 335.8 | |
| Guarantees Granted | | | 213.8 | |
| Acceptances | | | 111.7 | |
In addition to the above commitments, as of December 31, 2010, purchase limits available for credit-card holders amounted to Ps.25,950.0 million.
As of December 31, 2010, main fees related to the above-mentioned commitments were Ps.9.4 million corresponding to standby letters of credit, Ps.6.4 million from guarantees provided and Ps.1.0 million from commitments to extend credit.
The credit risk involved in issuing letters of credit and granting guarantees is essentially the same as that involved in extending loan facilities to customers. In order to grant guarantees to our customers, we may require counter guarantees. As of December 31, 2010, these counter guarantees, classified by type, were as follows:
| | | | | |
| | | December 31, | |
| | | 2010 | |
| | | (in millions of Pesos) | |
| Preferred Counter Guarantees | | | 15.5 | |
| Other Counter Guarantees | | | 48.6 | |
For more detailed information about off-balance sheet financial instruments, see Note 25 to our audited consolidated financial statements.
Other
We account for checks drawn on us and other financial institutions, as well as other items in the process of collection, such as notes, bills and miscellaneous items, in memorandum accounts until the related item clears or is accepted. In management’s opinion, the risk of loss on these clearing transactions is not significant. The amounts of clearing items in process as of December 31, 2010, were as follows:
| | | | | |
| | | December 31,
2010 | |
| | | (in millions of Pesos) | |
| Checks Drawn on Banco Galicia | | | 419.4 | |
| Checks Drawn on Other Banks | | | 529.2 | |
| Bills and Other Items for Collection | | | 3,575.9 | |
With respect to fiduciary risk, we act as trustee of trust agreements to guarantee obligations arising from various contracts between the parties. As of December 31, 2010, the trust funds amounted to Ps.2,503.0 million.
In addition, we hold securities in custody, which as of December 31, 2010 amounted to Ps.10,634.8 million.
For more detailed information about off-balance sheet financial instruments, see Note 25 to our audited consolidated financial statements.
Critical Accounting Policies
We believe that the following are our critical accounting policies under Argentine Banking GAAP, as they are important to the portrayal of our financial condition and results of operations and require our most difficult, subjective and complex judgment and the need to make estimates about the effect of matters that are inherently uncertain.
-135-
Allowance for Loan Losses
Our allowance for loan losses including the allowance for loan losses of the regional credit card companies and CFA is maintained in accordance with Argentine Central Bank rules. Under such rules, a minimum allowance for loan losses is calculated primarily based upon the classification of Banco Galicia’s commercial loan borrowers and upon delinquency aging (or the number of days the loan is past due) for individual loan borrowers of both Banco Galicia and the regional credit card companies and for Banco Galicia’s commercial loans of less than Ps.750,000. Although we are required to follow the methodology and guidelines for determining the minimum loan loss allowance as set forth by the Argentine Central Bank, we are allowed to establish additional allowances for loan losses. The determination of the allowance for loan losses requires a significant degree of judgment.
For commercial loans, we are required to classify all of our commercial loan borrowers. In order to perform the classification, we must consider the management and operating history of the borrower, the present and projected financial situation of the borrower, the borrower’s payment history and ability to service the debt, the capability of the borrower’s internal information and control systems and the risk in the sector in which the borrower operates. We apply the minimum loss percentages required by the Argentine Central Bank to our commercial loan borrowers based on the loan classification and the nature of the collateral, or guarantee in respect of the loan. In addition, based on the overall risk of the portfolio, we consider whether or not additional loan loss reserves in excess of the minimum required are warranted.
For our consumer loan portfolio, including the loan portfolios of Banco Galicia, the regional credit card companies and CFA, we classify loans based upon delinquency aging, consistent with the requirements of the Argentine Central Bank. Minimum loss percentages required by the Argentine Central Bank are also applied to the totals in each loan classification.
Other Receivables Resulting from Financial Brokerage and Miscellaneous Receivables
We carry other receivables resulting from financial brokerage and miscellaneous receivables net of allowances for uncollectible amounts. Our judgment regarding the ultimate collectibility is performed on an account-by-account basis and considers our assessment of the borrower’s ability to pay based on factors such as the borrower’s financial condition, past payment history, guarantees and past-due status.
Goodwill
Goodwill is carried at cost less accumulated amortization. The carrying amount of goodwill is analyzed for impairment based on estimates of future undiscounted cash flows generated by the business acquired. The estimate of future cash flows requires complex management judgment.
Pursuant to the Argentine Central Bank regulations, the negative goodwill has to be charged to Income with regard to the causes that have originated it, not to exceed a 60-month straight-line method amortization.
U.S. GAAP — Critical Accounting Policies
Additional information in connection with critical accounting policies for U.S. GAAP purposes is described as follows.
Other-than-temporary impairment
Under U.S. GAAP, Government bonds, including Bonar 2015 Bonds, Galtrust I and the investment in Almafuerte Special fund, were classified as available-for-sale securities, and therefore, carried at fair value with changes in the fair value reflected in other comprehensive income for the years ended December 31, 2010 and 2009.
“Recognition and Presentation of Other-Than-Temporary Impairments” ASC 320 establishes a new method of recognizing and reporting other-than-temporary impairments of debt securities. Impairment is now considered to be other than temporary if an entity:
1. intends to sell the security;
2. is more likely than not to be required to sell the security before recovering its cost; or
3. does not expect to recover the security’s entire amortized cost basis (even if the entity does not intend to sell)—that is, a ‘credit loss’.
-136-
This credit loss is based on the present value of cash flows expected to be collected from the debt security. If a credit loss exists but an entity does not intend to sell the impaired debt security and it is more likely than not to be required to sell before recovery, the impairment is other than temporary. It should therefore be separated into:
1. the estimated amount relating to the credit loss, and
2. all other changes in fair value.
Only the estimated credit loss amount is recognized in profit or loss; the remaining change in fair value is recognized in ‘other comprehensive income’. This approach more closely aligns the impairment models for debt securities and loans by reflecting only credit losses as impairment in profit and loss.
As of December 31, 2010 and 2009 the fair value of the securities exceeded their amortized cost. Therefore for U.S. GAAP purposes we concluded that there was no recognition of impairment.
As of December 31, 2008, the amortized cost exceeded the fair value of these securities by Ps.846.8 million. Therefore, for U.S. GAAP purposes, we have recorded an other-than-temporary impairment of these securities, based on a variety of factors, including the length of time and extent to which the market value has been less than cost, and our intent and ability to hold these securities to recovery.
Allowance for Loan Losses
Under U.S. GAAP, Banco Galicia considers loans to be impaired when it is probable that all amounts of principal and interest will not be collected according to the contractual terms of the loan agreement. The allowance for significant impaired loans are assessed based on the present value of estimated future cash flows discounted at the current effective loan rate or the fair value of the collateral in the case where the loan is considered collateral-dependent. An allowance for impaired loans is provided when discounted future cash flows or collateral fair value is lower than book value.
In addition, if necessary, a specific allowance for loan losses is established for individual loans, based on regular reviews of individual loans, recent loss experience, credit scores, the risk characteristics of the various classifications of loans and other factors directly influencing the potential collectibility and affecting the quality of the loan portfolio.
To calculate the allowance required for smaller-balance impaired loans and unimpaired loans, we perform an analysis of historical losses from our consumer and performing commercial loan portfolios in order to estimate losses for U.S. GAAP purposes resulting from loan losses that had been incurred in such loan portfolios at the balance sheet date but which had not been individually identified. Loss estimates are analyzed by loan type and thus for homogeneous groups of clients. Such historical ratios are updated to incorporate the most recent data reflecting current economic conditions, industry performance trends, geographic or obligor concentrations within each portfolio segment, and any other pertinent information that may affect the estimation of the allowance for loan losses.
We estimate that, on average, it takes a period of up to one year between the trigger of an impairment event and identification of a loan as being a probable loss for consumer and performing commercial loans.
Many factors can affect Banco Galicia’s estimates of allowance for loan losses, including volatility of default probability, migrations and estimated loss severity.
A ten percent decrease in the expected cash flows of significant impaired loans individually analyzed, could result in an additional impairment of approximately Ps.7.5 million.
A ten percent increase in the historical loss ratios for loans collectively analyzed could result in an additional impairment of approximately Ps.92.8 million.
-137-
These sensitivity analyses do not represent management’s expectations of the deterioration in risk ratings or the increases in loss rates but are provided as hypothetical scenarios to assess the sensitivity of the allowance for loan and lease losses to changes in key inputs. We believe the risk ratings and loss severities currently in use are appropriate and represent management’s expectations about the credit risk inherent in its loan portfolio.
Determining the allowance for loan losses requires significant management judgments and estimates including, among others, identifying impaired loans, determining customers’ ability to pay and estimating the fair value of underlying collateral or the expected future cash flows to be received. Actual events are likely to differ from the estimates and assumptions used in determining the allowance for loan losses.
Fair Value Estimates
A portion of our assets is carried at fair value, including trading and available-for-sale securities, retained interests in assets transferred to financial trusts, futures and forwards transactions.
ASC 820-10 defines fair value as the price that would be received to sell an asset or paid to transfer a liability in an orderly transaction between market participants at the measurement date. ASC 820-10, among other things, requires Grupo Financiero Galicia to maximize the use of observable inputs and minimize the use of unobservable inputs when measuring fair value.
In addition, ASC 825-10 provides an option to elect fair value as an alternative measurement for selected financial assets, financial liabilities, unrecognized firm commitments and written loan commitments not previously recorded at fair value. Under ASC 825-10, fair value is used for both the initial and subsequent measurement of the designated assets, liabilities and commitments, with the changes on fair value recognized in net income. As a result of ASC 825-10 analysis, Grupo Financiero Galicia has not elected to apply fair value accounting for any of its financial instruments not previously carried at fair value.
Fair Value Hierarchy
ASC 820-10 defines fair value as the price that would be received to sell an asset or paid to transfer a liability in an orderly transaction between market participants at the measurement date.
ASC 820-10 establishes a three-level valuation hierarchy for disclosure of fair value measurements. The valuation hierarchy is based upon the transparency of inputs to the valuation of an asset or liability as of the measurement date. The three levels are defined as follows:
| | • | | Level 1: inputs to the valuation methodology are quoted prices (unadjusted) for identical assets or liabilities in active markets. |
| | • | | Level 2: inputs to the valuation methodology include quoted prices for similar assets and liabilities in active markets, and inputs that are observable for the asset or liability, either directly or indirectly, for substantially the full term of the asset or liability. |
| | | Inputs include the following: |
| | (a) | | Quoted prices for similar assets or liabilities in active markets; |
| |
| | (b) | | Quoted prices for identical or similar assets or liabilities in non-active markets; |
| |
| | (c) | | Pricing models whose inputs are observable for substantially the full term of the asset or liability; and |
| |
| | (d) | | Pricing models whose inputs are derived principally from or corroborated by observable market data through correlation or other means. |
| | • | | Level 3: inputs to the valuation methodology are unobservable and significant to the fair value measurement. |
A financial instrument’s categorization within the valuation hierarchy is based upon the lowest level of input that is significant to the fair value measurement.
-138-
Determination of Fair Value
Fair value is based upon quoted market prices, where available. If listed prices or quotes are not available, fair value is based upon internally developed models that use primarily market-based or independently-sourced market parameters, including interest rate yield curves, option volatilities and currency rates. Valuation adjustments may be made to ensure that financial instruments are recorded at fair value. These adjustments include amounts to reflect counterparty credit quality, Banco Galicia’s creditworthiness, liquidity and unobservable parameters that are applied consistently over time.
Grupo Financiero Galicia believes its valuation methods are appropriate and consistent with other market participants, the use of different methodologies, or assumptions, to determine the fair value of certain financial instruments could result in a different estimate of fair value at the reporting date.
Impairment of Assets Other Than Loans
Certain assets, such as goodwill and equity investments are subject to an impairment review. Asset impairment charges require considerable judgment and are recorded when market value declines below the carrying value, for declines other-than-temporary, or where the cost of the asset is deemed to not be recoverable.
Goodwill impairment exists when the fair value of the reporting unit to which the goodwill is allocated is not enough to cover the book value of its assets and liabilities and the goodwill. The fair value of the reporting units is estimated using discounted cash flow techniques. The sustained value of the majority of the goodwill is supported ultimately by revenue from our banking and credit-card businesses. A decline in earnings as a result of a lack of growth, or our inability to deliver cost-effective services over sustained periods, could lead to a perceived impairment of goodwill, which would be evaluated and, if necessary, recorded as a write-down in our consolidated income statement. On an annual basis, or as circumstances dictate, management reviews goodwill and evaluates events or other developments that may indicate impairment in the carrying amount. The evaluation methodology for potential impairment is inherently complex and involves significant management judgment in the use of estimates and assumptions. These estimates involve many assumptions, including the expected results of the reporting unit, an assumed discount rate and an assumed growth rate for the reporting unit.
As of December 31, 2010 and 2009, no impairment was recorded. As of December 31, 2008 Grupo Financiero Galicia performed the impairment test of the goodwill related to the acquisition of a loan portfolio of the ABN-AMRO Bank and an impairment loss was recognized.
The fair value of equity investments is determined using discounted cash flow techniques. This technique involves complex management judgment in terms of estimating the future cash flows of the companies and in defining the applicable interest rate to discount those cash flows.
Deferred Tax Asset Valuation Allowance
Deferred tax assets and liabilities are recorded for the estimated future tax effects of temporary differences between the carrying amounts of assets and liabilities recorded for accounting and tax reporting purposes and for the future tax effects of net operating loss carryforwards. We had a significant amount of deferred tax assets as of December 31, 2010, 2009 and 2008. Recognition of those deferred tax assets is subject to management’s judgment based on available evidence that realization is more likely than not and they are reduced, if necessary, by a valuation reserve. Management’s judgment on the likelihood that deferred tax assets can be realized is subjective and involves estimates and assumptions about matters that are inherently uncertain. This judgment involves estimating future taxable income and the timing at which the temporary differences between book and taxable income will be reversed. Underlying estimates and assumptions can change over time, influencing our overall tax positions, as a result of unanticipated events or circumstances.
Grupo Financiero Galicia had significant accumulated tax loss carryforward at December 31, 2008. Based on the analysis performed management believes that Grupo Financiero Galicia would recover only temporary differences with future taxable income. Therefore, the net operating tax loss carryforward and presumed minimum income tax was more likely than not to be recovered in the carryforward period and hence a valuation allowance was provided against this amount as of December 31, 2008.
-139-
As of December 31, 2009 based on the analysis performed, Grupo Financiero Galicia believes that it is more likely than not that it will recover only the net operating tax loss carryforward and the temporary differences, with future taxable income. Therefore, presumed minimum income tax was not more likely than not to be recovered in the carryforward period and hence a valuation allowance was provided against this amount as of December 31, 2009.
As of December 31, 2010 based on the analysis performed, Grupo Financiero Galicia believes that it is more likely than not that it will recover the net operating tax loss carryforward, the temporary differences and the presumed minimum income tax, with future taxable income. Among other factors, Grupo Financiero Galicia considered that as of the date of the issuance of the attached financial statements, the taxable income mainly due to the sales of Government bonds has been consumed the total tax loss carryforward. In addition, according to the taxable income projections, Grupo Financiero Galicia estimated that the presumed minimum income tax will be utilized during the following years 2011 and 2012. Therefore, no valuation allowance was provided against presumed minimum income tax.
Assets Not Recognized Under U.S. GAAP
Under US GAAP, assets are defined as “... probable future economic benefits obtained or controlled by an entity as a result of past transactions or events”. In addition, one of the three essential characteristics of an asset is that an entity can obtain the benefit and can control others’ access to it. Determining if a company has control of an asset involves in certain cases some judgment.
As of December 31, 2009 and 2008, under Argentine Banking GAAP, Banco Galicia had recorded under “Intangible Assets” the difference arising from the reimbursement of Reprogrammed Deposits at the market exchange rate pursuant toamparoclaims and the carrying value of these deposits. The receivable for differences related toamparoclaims does not represent an asset under U.S. GAAP. As of December 31, 2010, this item has been fully amortized.
Securitizations
Under US GAAP, prior to January 1, 2010, Grupo Financiero Galicia adopted SFAS No. 140, “Accounting for Transfers and Servicing of Financial Assets and Extinguishments of Liabilities”, as amended by SFAS 156, both of them codified under the topic ASC No. 860 “Transfers and Servicing” (“ASC No. 860”). ASC No. 860 required an entity to recognize the financial and servicing assets it controls and the liabilities it had incurred and to derecognize financial assets when control has been surrendered.
Effective January 1, 2010, Grupo Financiero Galicia implemented new accounting guidance provided by SFAS 166 and 167 (ASU 2009-16 and ASU 2009-17, respectively, under the new codification), which amend the accounting for the transfers of financial assets and the consolidation of VIEs.
The new guidance eliminates the concept of QSPEs that were previously exempt from consolidation and introduces a new framework for determining the primary beneficiary of a VIE. The primary beneficiary of a VIE is required to consolidate the assets and liabilities of the VIE. Therefore, Grupo Financiero Galicia must evaluate all existing securitization trusts that qualify as QSPEs to determine whether they must be consolidated in accordance with ASU 2009-17. An entity is considered a VIE if it possesses one of the following characteristics:
| | • | | Insufficient equity investment at risk |
| | • | | Equity lacks decision-making rights |
| | • | | Equity with non-substantive voting rights |
| | • | | Lacking the obligation to absorb an entity’s expected losses |
| | • | | Lacking the right to receive an entity’s expected residual returns |
-140-
Under the new guidance, the primary beneficiary is the part that has both (1) the power to direct the activities of an entity that most significantly impact the VIE’s economic performance; and (2) through its interests in the VIE, the obligation to absorb losses or the right to receive benefits from the VIE that could potentially be significant to the VIE.
To assess whether Grupo Financiero Galicia has the power to direct the activities of a VIE that most significantly impact the VIE’s economic performance, Grupo Financiero Galicia considers all facts and circumstances, including its role in establishing the VIE and its ongoing rights and responsibilities. This assessment includes, first, identifying the activities that most significantly impact the VIE’s economic performance; and second, identifying which party, if any, has power over those activities.
Under ASC 810-10-65, Banco Galicia should measure the components of the newly consolidated financial trusts at their carrying amounts as of the adoption date. Grupo Financiero Galicia must determine the amounts of the assets, liabilities, and non-controlling interests of the newly consolidated financial trusts, that would have been recorded in Grupo Financiero Galicia’s financial statements as of January 1, 2010, as if ASU 2009-17 had been effective as of the date of Grupo Financiero Galicia’s initial involvement with the financial trusts. Any difference between the net amount added (assets less liabilities of each financial trusts where Grupo Financiero Galicia is primary beneficiary) from Grupo Financiero Galicia’s balance sheet and the amount of any previously recognized retained interest is recognized as a cumulative-effect adjustment to retained earnings.
Based on the mentioned evaluation as of December 31, 2010 Grupo Financiero Galicia consolidated the financial trust Galtrust I in which Grupo Financiero Galicia had a controlling financial interest and for which it is the primary beneficiary
Exchange of Assets
In accordance with U.S. GAAP, specifically ASC 310-20, satisfaction of one monetary asset by the receipt of another monetary asset for the creditor is generally based on the market value of the asset received in satisfaction of the debt (an extinguishment). In this particular case, the securities being received are substantially different in structure and in interest rates than the debt securities swapped. Therefore, such amounts should initially be recognized at their fair value. The estimated fair value of the securities received will constitute the cost basis of the asset. Any difference between the old asset and the fair value of the new asset is recognized as a gain or loss.
Banco Galicia exchanged Government Bonds denominated in Pesos at 2% due 2014 (Boden 2014 Bonds) with a face value of Ps.683.6 million (recorded in Banco Galicia’s shareholders’ equity in February 2009 within the scope of an exchange transaction of National Secured Loans at market price) for Bonar 2015 Bonds with a face value of Ps.912.7 million.
Under U.S. GAAP, the Bonar 2015 Bonds were considered as available for sale securities and recorded at fair value with the unrealized gains or losses recognized as a charge or credit to equity through other comprehensive income.
Principal Trends
Related to Argentina
The momentum in consumption as a result of the Government’s expansive monetary policy and an increase in salaries, as well as a very good harvest with high international commodity prices were the main drivers of Argentina’s GDP growth, which in real terms grew 9.2% in 2010 according to INDEC.
Even though the strong expansion of GDP in 2010 indicates that in 2011 the economy could expand at a rate of around 5.5%, a slight slowdown is expected as compared to 2010. In this sense, if the current levels of global growth, abundant liquidity and increasing commodity prices can be maintained, the Argentine economy may continue to experience growth, even though both the agricultural and industrial sectors of the Argentine economy, will likely show more moderate growth rates as compared to their unusually high figures for 2010. However, presidential elections will be held this year, which could be accompanied by uncertainty and increased volatility.
The decrease in uncertainty at a global level, despite some economic uncertainty relating to a sovereign debt crisis in some European countries, together with the recovery being experienced by most economies worldwide, and in particular the principal business partners of Argentina, generates a promising outlook for growth potential within Argentina. Our management believes that if the economic outlook for Argentina remains positive, our business will be positively affected.
-141-
Related to the Financial System
With respect to the Argentine financial system, it is expected to continue to strengthen its solvency, as a result of increased levels of financial intermediation with the private sector. In order to accomplish these increased levels, challenges such as inflation and the reliability of the data provided by INDEC must be overcome. In addition, income from services will continue to make up a large part of operating income. Management of the various financial institutions must also focus on controlling administrative expenses in an effort to improve operational efficiency. With respect to the evolution of portfolio quality, we expect the improvement observed during the last quarter of 2010 to continue, maintaining high coverage with provisions for the non-accruing portfolio.
Related to Us
It is expected that the level of activity of all of the subsidiaries of Grupo Financiero Galicia will be consistent with expectations generated by a more favorable economic context. Given that Banco Galicia is the most significant asset of Grupo Financiero Galicia, we refer to the trends related to Banco Galicia.
During recent years, and despite passing through various periods of crisis, both internationally and domestically, Banco Galicia managed to increase its volume of business with the private sector and improve its overall capital structure, which had a positive impact on its ability to generate financial and service-related income. In 2011, with the goal of continued improvement of recurring operating results, Banco Galicia will maintain its strategy of increasing its volume of intermediation activities with the private sector, reducing its exposure to the public sector and to assets with very low or no yield maintaining an adequate diversification and risk coverage, as well as improving the structure of its liabilities and reducing its foreign debt.
The analysis of these trends should be read in conjunction with the discussion in Item 3. “Key Information— Risk Factors”, and with consideration that the Argentine economy has been historically volatile, which has negatively affected the volume and growth of the financial system.
| | |
| Item 5.B. | | Liquidity and Capital Resources |
Liquidity — Holding Company on an Individual Basis
We generate our net earnings/losses from our operating subsidiaries, especially Banco Galicia, our main operating subsidiary. Although, from 2002 to 2010 we did not receive any dividends from Banco Galicia, it is the primary source of funds available to us. On April 27, 2011, Banco Galicia’s shareholders held a shareholders’ meeting during which they approved the distribution of cash dividends for a total amount of Ps.100.1 million. During May 2011, according to our participation of 94.84%, we received a cash dividend of Ps.94.9 million. Additionally, during 2010, we received from other subsidiaries Ps.18.8 million in cash dividends.
Banco Galicia’s dividend-paying ability has been affected since late 2001 (and until 2010) by the effects of the 2001-2002 crisis on its liquidity and income-generation capacity. In addition, there were other restrictions on Banco Galicia’s ability to pay dividends resulting from applicable Argentine Central Bank rules andthe loan agreements entered into by Banco Galicia as part of its foreign debt restructuring. See Item 8. “Financial Information-Dividend Policy and Dividends”.
The extent to which a banking subsidiary may extend credit or otherwise provide funds to a holding company is limited by Argentine Central Bank rules. For a description of these rules, see Item 4. “Information on the Company-Argentine Banking Regulation-Lending Limits”.
According to Grupo Financiero Galicia’s policy for the distribution of dividends and due to the fact that most of the profits for fiscal year 2010 correspond to income by holdings and just a fraction corresponds to the realized and liquid profits meeting the requirements to be distributed as per Section 68 of the Corporations’ Law, and taking as well into consideration Grupo Financiero Galicia’s financial condition and, particularly, the need to pay the outstanding foreign-currency denominated negotiable obligations issued, at the shareholders’ meeting held on April 27, 2011, our shareholders approved the payment of dividends in cash for Ps.24.8 million, which represents 2% with regard to 1,241,407,017 class “A” and “B” ordinary shares with a face value of Ps.1 each.
-142-
Pursuant to what is set forth in the last paragraph of the section incorporated by Act No. 25,585 after Section 25 of Act No. 23,966, as applicable, Grupo Financiero Galicia will be restored the amounts corresponding to the tax on personal assets it paid for fiscal year 2010 in its capacity as substitute taxpayer of the shareholders subject to the above-mentioned tax.
As of December 31, 2010, Grupo Financiero Galicia, on an individual basis, had cash and due from banks for Ps.0.8 million and short-term investments for Ps.26.5 million. Grupo Financiero Galicia’s short-term investments were made up of: (i) special current account deposits for Ps.24.8 million, (ii) time deposits for Ps.0.5 million, and (iii) investments in mutual funds for Ps.1.2 million.
As of December 31, 2009, Grupo Financiero Galicia, on an individual basis, had cash and due from banks for Ps.3.8 million and short-term investments for Ps.28.7 million. Grupo Financiero Galicia’s short-term investments were made up of: (i) special current account deposits for Ps.3.2 million, (ii) time deposits for Ps.10.6 million, (iii) investments in mutual funds for Ps.1.8 million, (iv) negotiable obligations issued by companies from abroad for Ps.5.6 million, and (v) ETFs for Ps.7.5 million.
As of December 31, 2008, on a non-consolidated basis, we had cash and due from banks in the amount of Ps.0.2 million and short-term investments for Ps.27.3 million.
In July 2007, in exercise of our preemptive rights, we used US$102.2 million of face value of 2014 Notes and cash to subscribe for 93.6 million shares of Banco Galicia, in the offering carried out by Banco Galicia. To fund such cash subscription we entered into an US$80 million loan agreement in July 2007, the first installment of which was repaid in July 2008, for US$24.3 million (US$18.0 million of principal and US$6.3 million in interest).
On January 6, 2009, the remaining outstanding of US$62 million was cancelled in advance, with a single and final payment of US$39.1 million, with our own funds and funds from financing granted by local entities.
On March 9, 2009, our shareholders held the general ordinary shareholders’ meeting during which they approved the creation of a global program for simple negotiable obligations, not convertible into shares, for a maximum principal amount of US$60 million. On June 4, 2009 series I and series II notes corresponding to the class I notes were issued in the amount of US$45 million. Series I, with a one-year term, was issued for a principal amount of US$34.4 million and a yield of 8%; series II, with a two-year term, was issued for a principal amount of US$10.6 million and an annual yield of 10.5%. With the proceeds of these issuances, we proceeded to cancel the funding from local entities.
On April 14, 2010, Grupo Financiero Galicia’s shareholders held the ordinary and extraordinary shareholders’ meeting during which they approved an extension of US$40 million in the amount of the global program of simple short-, medium- and/or long- term negotiable obligations. Therefore, the maximum amount of the program, which was originally set at US$60 million or its equivalent in any other currency, was increased to US$100 million or its equivalent in any other currency.
Furthermore, during fiscal year 2010 Grupo Financiero Galicia made an offer of negotiable obligations for a face value of US$45.0 million. The subscription period ended on June 4, 2010; the negotiable obligations were fully subscribed and Grupo Financiero Galicia decided not to issue series I, which was planned to be issued at a discount. The cut-off rate for series II was 101.82%, for a face value of US$18.1 million, equivalent to a 7% annual yield. As regards series III, the cut-off rate was 101.28%, for a face value of US$26.9 million, equivalent to an 8.5% annual yield. Accordingly, during fiscal year 2010, Grupo Financiero Galicia repaid, upon maturity, the class I, series I negotiable obligations for US$34.4 million. During 2011, Grupo Financiero Galicia repaid, upon maturity, the class I, series II negotiable obligations for US$10.6 million.
Each of our subsidiaries is responsible for their own liquidity management. For a discussion of Banco Galicia’s liquidity management, see “-Banco Galicia’s Liquidity Management-Banco Galicia (Unconsolidated) Liquidity Management”.
-143-
Consolidated Cash Flows
Our consolidated statements of cash flows were prepared using the measurement methods prescribed by the Argentine Central Bank, but in accordance with the presentation requirements of Statement of Cash Flows, ASC 230-10. See our consolidated cash flow statements as of and for the fiscal years ended December 31, 2010, December 31, 2009 and December 31, 2008, included in this annual report.
As of December 31, 2010, on a consolidated basis, we had Ps.7,443.5 million in available cash (defined as total cash on hand and cash equivalents), representing a Ps.2,014.8 million increase from the Ps.5,428.7 million as of December 31, 2009. At the end of fiscal year 2009, our available cash (and cash equivalents) had increased in the amount of Ps.633.3 million from the Ps.4,795.4 million of available cash (and cash equivalents) at the end of the prior fiscal year.
Effective May 14, 2007, and in accordance with the provisions of Argentine Central Bank’s Communiqué “A” 4667, cash equivalents are comprised of the following: Argentine Central Bank debt instruments (Nobac and Lebac) having a remaining maturity that does not exceed 90 days, securities in connection with reverse repurchase agreement transactions with the Argentine Central Bank, short term call loans to corporations, local interbank loans and overnight placements in correspondent banks abroad. Cash equivalents also comprise, in the case of the Regional Credit Card Companies, time deposit certificates and mutual fund shares.
The table below summarizes the information from our consolidated statements of cash flows for the three fiscal years ended December 31, 2010, 2009 and 2008 which is also discussed in more detail below.
| | | | | | | | | | | | | |
| | | December 31, | |
| | | 2010 | | | 2009 | | | 2008 | |
| | | (in millions of Pesos) | |
Funds (1) at the Beginning of the Fiscal Year | | Ps. | 5,428.7 | | | Ps. | 4,795.4 | | | Ps. | 3,766.2 | |
| | | | | | | | | | |
Funds Provided (Used) by Operating Activities | | | 872.2 | | | | 1,464.8 | | | | 852.0 | |
| | | | | | | | | | |
| - Funds Provided by the Sale Of or Proceeds From Government Securities Trading | | | 327.8 | | | | 1,120.9 | | | | 802.6 | |
| - CER Adjustment | | | 15.0 | | | | 6.5 | | | | (113.2 | ) |
| - Other | | | 529.4 | | | | 337.4 | | | | 162.6 | |
| | | | | | | | | | |
Funds Provided (Used) by Investing Activities | | | (2,813.1 | ) | | | (1,526.0 | ) | | | 1,093.6 | |
| | | | | | | | | | |
| - Net (Increase)/Decrease in Loans | | | (4,539.4 | ) | | | (1,185.6 | ) | | | 1,501.3 | |
| Loans to the Private Sector | | | (4,435.0 | ) | | | (1,193.6 | ) | | | 1,444.6 | |
| Loans to the Public Sector | | | (104.4 | ) | | | 8.0 | | | | 56.7 | |
| - Funds Provided by the Sale Of or Proceeds From Government Securities Available for Sale | | | 2,376.5 | | | | — | | | | 36.5 | |
| - Other | | | (650.2 | ) | | | (340.4 | ) | | | (444.2 | ) |
| | | | | | | | | | |
Funds Provided (Used) by Financing Activities | | | 3,844.7 | | | | 517.9 | | | | (1.065.6 | ) |
| | | | | | | | | | |
| - Net Increase/(Decrease) in Deposits | | | 4,180.9 | | | | 1,838.7 | | | | (57.0 | ) |
| - Funds Provided/(Used) by Repurchases | | | 211.0 | | | | (409.3 | ) | | | (376.6 | ) |
| - Funds Raised by the Regional Credit Card Companies | | | 460.3 | | | | 197.7 | | | | 269.5 | |
| - Payments on Long-term Debt | | | (1,452.8 | ) | | | (778.6 | ) | | | (743.5 | ) |
| - Other | | | 445.3 | | | | (330.6 | ) | | | (158.0 | ) |
| | | | | | | | | | |
-Effect of Exchange Rate on Cash and Cash Equivalents | | | 111.1 | | | | 176.7 | | | | 149.2 | |
| | | | | | | | | | |
Funds at the End of the Fiscal Year | | Ps. | 7,443.5 | | | Ps. | 5,428.7 | | | Ps. | 4,795.4 | |
| | | | | | | | | | |
| | | |
| (1) | | Cash and cash equivalents. |
Our investing activities primarily consist of our origination of loans and other credits to the private sector. Our financing activities primarily include raising customer deposits, in addition to entering into sales of government securities under repurchase agreement transactions or not, issuing bonds in the local and foreign capital markets and borrowing from foreign and local banks and international credit agencies. In the last few years, these activities have also included reducing expensive liabilities incurred as a consequence of the 2001-2002 crisis.
-144-
As shown in the table above, and explained in more detail below, in the last three years and consistently with our strategy of strengthening our balance sheet, we have generated significant amounts of cash from our exposure to the public sector, which represents mainly Banco Galicia’s exposure, for approximately Ps.2,614.9 million in 2010, Ps.1,135.4 million in 2009 and Ps.782,7 million in 2008, and have used cash generated by such assets (as well as these assets directly) mainly to repay restructured foreign debt, incurred as a consequence of or related to the 2001-2002 crisis.
In 2010 and 2009 funds generated by operating and financing activities were used for investing activities, mainly due to the increase in loans to the private sector.
In 2008, due to the international economic crisis and its local impact, our main source of funds was funds available at the end of the fiscal year due to a decrease in loans to the private sector (in replacement of our principal source of funding: deposits).
Management believes that cash flows from operations and available cash and cash equivalent balances, will be sufficient to fund our financial commitments and capital expenditures for fiscal year 2011.
Cash Flows from Operating Activities
In fiscal year 2010, net cash provided by operating activities exceeded our net income of Ps.408.9 million and amounted to Ps.872.2 million, due to the depreciation and amortization of intangibles assets, which represent non-cash expenses, of Ps.433.2 million, loan loss provisions, which, similarly, do not require cash at the time of provision and which, net of reversals, amounted to Ps.346.7 million and a decrease of Ps.327.8 million of government securities attributable to the increase of Ps.363.6 million of Argentine Central Bank debt instruments (Nobac and Lebac) having a remaining maturity that exceed 90 days and offset by Ps.35.8 million of other securities. In addition, net cash was provided by other fluctuations in operating assets and liabilities: (i) Ps.15.0 million of the collection of CER adjustment, (ii) Ps.104.4 million of foreign exchange brokerage, (iii) Ps.144.2 million of the liquidation corresponding to Tarjeta Naranja Financial Trust, (iv) Ps.224.1 million of collections on account of third parties and (v) Ps.723.2 million of the decrease of net other assets and liabilities.
In fiscal year 2009, net cash provided by operating activities exceeded our net income of Ps.229.3 million and amounted to Ps.1,464.8 million, due to the depreciation and amortization of intangibles assets, which represent non-cash expenses, of Ps.241.5 million, loan loss provisions, which, similarly, do not require cash at the time of provision and which, net of reversals, amounted to Ps.487.6 million and a decrease of Ps.1,120.9 million of government securities attributable to sales and to the collection of amortization and interest on Boden 2012 Bonds for Ps.637.4 million, Ps.1,170.1 million of sales of securities in Pesos, net of Ps.894.2 million of Argentine Central Bank debt instruments (Nobac and Lebac) having a remaining maturity that exceed 90 days and the increase of Ps.166.6 million of trading securities. In addition, net cash was provided by other fluctuations in operating assets and liabilities: (i) Ps.6.5 million collection of CER adjustment, (ii) Ps.160.9 million of foreign exchange brokerage, (iii) Ps.17.8 million of deposit in connection with Decree No. 616, and (iv) Ps.57.0 million of the liquidation corresponding to Tarjeta Naranja Financial Trust. Cash generated from operating activities was higher than in fiscal year 2008, basically because of more sales of government securities.
In fiscal year 2008, net cash provided by operating activities exceeded our net income of Ps.176.8 million and amounted to Ps.852.0 million, due to the depreciation and amortization of intangibles assets, which represent non-cash expenses, of Ps.161.3 million, loan loss provisions, which, similarly, do not require cash at the time of provision and which, net of reversals, amounted to Ps.335.7 million and a decrease of Ps.802.6 million of government securities attributable to the collection of amortization and interest on Boden 2012 Bonds for Ps.620.5 million, sales of Argentine bonds for Ps.36.8 million, sales of other securities for Ps.80.8 million and Ps.64.5 million of Argentine Central Bank debt instruments (Nobac and Lebac) having a remaining maturity that exceed 90 days. In addition, net cash was provided by other fluctuations in operating assets and liabilities: (i) Ps.113.2 million corresponding to the capitalization of CER adjustment, (ii) Ps.86.8 million of interest on repurchase agreement transactions, (iii) Ps.76.0 million of minimum presumed income tax, and (iv) Ps.79.3 million of securitization of loans which represents non-cash income. Cash generated from operating activities was lower than in fiscal year 2007, basically because of fewer sales of government securities.
-145-
Cash Flows from Investing Activities
In fiscal year 2010, net cash used by investing activities amounted to Ps.2,813.1 million. This increase was mainly attributable to the increase of Ps.4,539.4 million in our private-sector loan portfolio. In addition, cash equal to Ps.391.1 million was applied to bank premises and equipment, miscellaneous and intangible assets and Ps.339.3 attributable to investments in other companies. These amounts were offset by sales and the collection of amortization and interest on Boden 2012 Bonds for Ps.1,808.6 million, Ps.487.2 million of sales of Discount Bonds, Ps.80.7 million of sales of Bonar 2015 Bonds, and Ps.80.2 million corresponding to other intangible assets.
In fiscal year 2009, net cash used by investing activities increased to Ps.1,526.0 million. This increase was mainly attributable to the increase of Ps.1,185.6 million in our private-sector loan portfolio. In addition, cash equal to Ps.282.6 million was applied to bank premises and equipment, miscellaneous and intangible assets, including payments of deposits pursuant toamparo claims. Cash used by investing activities increased from 2008, as our private-sector loan portfolio increased, because of the international financial crisis and its local impact as seen on 2008.
In fiscal year 2008, net cash generated by investing activities decreased to Ps.1,093.6 million. This decrease was mainly attributable to the decrease of Ps.1,501.3 million in our private-sector loan portfolio. In addition, cash equal to Ps.403.1 million was applied to bank premises and equipment, miscellaneous and intangible assets, including payments of deposits pursuant toamparo claims. Cash used by investing activities decreased from 2007, as our private-sector loan portfolio decreased, because of the international financial crisis and its local impact.
Cash Flows from Financing Activities
In fiscal year 2010, financing activities generated cash in the amount of Ps.3,844.6 million due to a Ps.4,180.9 million increase in deposits, corresponding to: (a) an increase of Ps.3,326.9 million in demand deposits and (b) an increase of Ps.854.0 million in time deposits. In addition, cash for Ps.211.0 million was generated by net repurchase agreement transactions and Ps.445.3 million was generated by an increase in short-term borrowings. These amounts were offset by Ps.992.5 million net decrease in long-term credit facilities, mainly corresponding to: (a) payments of interest on restructured debt, the payment of two amortization installments on debt due 2010 and the prepayment of Banco Galicia’s 2014 Notes for Ps.1,031.7 million, (b) payments of long-term debt for Ps.421.1 million and (c) a Ps.460.3 million net increase in funds obtained by the Regional Credit Card Companies through the issuance of negotiable obligations and long term foreign credit facilities.
In fiscal year 2009, financing activities generated cash in the amount of Ps.517.9 million due to a Ps.1,838.7 million increase in deposits, corresponding to: (a) an increase of Ps.1,793.9 million in demand deposits and (b) an increase of Ps.44.8 million in time deposits, which was offset by the following: (i) a Ps.580.9 million net decrease in long term credit facilities, mainly corresponding to: (a) payments of interest on restructured debt for US$41.4 million, (b) the payment of two amortization installments on debt due 2010 for US$68.4 million, (c) the prepayment of Banco Galicia’s 2014 Notes for US$77.3 million, (d) a decrease of Ps.6.8 million of IFC loans and (e) a Ps.86 million net decrease in funds obtained by the Regional Credit Card Companies through the issuance of negotiable obligations; (ii) a Ps.409.3 million net decrease in repurchase agreement transactions; and (iii) a Ps.319.9 million net decrease in short-term borrowings, mainly due to the decrease in borrowings from local and foreign banks, for Ps.327.5 million.
In addition, on January 7, 2009, Grupo Financiero Galicia paid in advance, through a single and final payment of US$39.1 million, the remaining balance of the loan entered into with Merrill Lynch International. In order to make the above-mentioned prepayment, Grupo Financiero Galicia used its own funds plus funds from a 180-day loan entered into with Sudamericana on January 6, 2009 for the amount of Ps.97 million.
On March 9, 2009 Grupo Financiero Galicia’s shareholders, at their ordinary shareholders’ meeting, approved the creation of a negotiable obligation program for up to US$60 million. The CNV approved said program on April 29, 2009, and, on May 9, 2009, also approved a pricing supplement for the offering of negotiable obligations for up to US$45 million. See Item 5.A. “Operating Results-Funding-Debt Programs”.
On June 4, 2009, Grupo Financiero Galicia issued two bonds amounting to US$45 million: (i) US$34.4 million of non-interest bearing bonds due on May 30, 2010, these bonds were issued at a price of 92.68/100 and their yield will be 8%, and (ii) US$10.6 million of bonds with a 12.5% coupon, due on May 25, 2011, these bonds were issued at a price of 103.48/100 and their yield will be 10.5%. Interest on the bonds noted in (ii) is payable semiannually. With the proceeds of said bonds, Grupo Financiero Galicia cancelled the bridge loan that it had entered with Sudamericana on January 6, 2009.
-146-
In fiscal year 2008, financing activities used cash in the amount of Ps.1,065.6 million, mainly due to: (i) a Ps.474.0 million net decrease in long term credit facilities, mainly corresponding to: (a) the payments of interest on restructured debt for US$49 million, (b) the payment of two amortization installments on debt due 2010 for US$68.4 million, (c) the prepayment of Banco Galicia’s 2014 Notes for US$30.2 million, (d) the reduction of US$24.6 million of Galicia Uruguay’s restructured debt structured as negotiable obligations, (e) the increase of Ps.153.6 million of IFC loans and (f) the Ps.80.5 million net decrease in funds obtained by the Regional Credit Card Companies through the issuance of negotiable obligations; (ii) a Ps.376.6 million net decrease in repurchase agreement transactions; (iii) a Ps.156.6 million net decrease in short-term borrowings, mainly due to: (a) the decrease in borrowings from local and foreign banks, for Ps.81.0 million and (b) the payment of US$24.0 million as part of a US$80 million loan granted to us in last year; and (iv) a Ps.57.0 million decrease in deposits, corresponding to: (a) a decrease of Ps.908.4 million in time deposits and (b) an increase of Ps.868.1 million in demand deposits.
For a description of the types of financial interests we use and the maturity profile of our debt, currency and interest rate structure, see Item 5. “Operating and Financial Review and Prospects”-Item 5.A. “Operating Results”.
Banco Galicia’s Liquidity Management
Banco Galicia Consolidated Liquidity Gaps
Liquidity risk is the risk that liquid assets are not available for Banco Galicia to meet financial commitments at contractual maturity, take advantage of potential investment opportunities and meet demand for credit. To monitor and control liquidity risk, Banco Galicia monitors and systematically calculates the gaps between financial assets and liabilities maturing within set time intervals based on contractual remaining maturity, on a consolidated basis with the Regional Credit Card Companies and CFA. All of the deposits in current accounts and other demand deposits and deposits in savings accounts are included in the first time interval. These figures are used to simulate different liquidity crisis scenarios based on assumptions stemming from historical experience.
As of December 31, 2010, the consolidated gaps between maturities of Banco Galicia’s financial assets and liabilities based on contractual remaining maturity were as follows
| | | | | | | | | | | | | | | | | | | | | |
| | | As of December 31, 2010(1) | |
| | | Less than | | | | | | | | | | | | | |
| | | one Year | | | 1 - 5 Years | | | 5 - 10 Years | | | Over 10 Years | | | Total | |
| | | (in millions of Pesos, except ratios) | |
Assets | | | | | | | | | | | | | | | | | | | | |
| Cash and Due from Banks | | | 1,730.1 | | | | — | | | | — | | | | — | | | | 1,730.1 | |
| Argentine Central Bank — Escrow Accounts | | | 4,283.9 | | | | — | | | | — | | | | — | | | | 4,283.9 | |
| Overnight Placements | | | 215.3 | | | | — | | | | — | | | | — | | | | 215.3 | |
| Loans — Public Sector | | | 2.0 | | | | — | | | | — | | | | — | | | | 2.0 | |
| Loans — Private Sector | | | 17,444.3 | | | | 3,256.4 | | | | 163.0 | | | | 13.0 | | | | 20,876.7 | |
| Government Securities | | | 2,043.6 | | | | 643.2 | | | | — | | | | — | | | | 2,686.8 | |
| Negotiable Obligations and Corporate Securities | | | 45.8 | | | | 23.6 | | | | 7.1 | | | | — | | | | 76.5 | |
| Financial Trusts | | | 411.4 | | | | 308.4 | | | | 270.0 | | | | — | | | | 989.8 | |
| Special Fund Former Almafuerte Bank | | | 0.0 | | | | 164.7 | | | | — | | | | — | | | | 164.7 | |
| Other Financing | | | 9.5 | | | | — | | | | — | | | | — | | | | 9.5 | |
| Assets under Financial Lease | | | 162.4 | | | | 263.6 | | | | 43.1 | | | | — | | | | 469.1 | |
| Other | | | 359.4 | | | | — | | | | — | | | | — | | | | 359.4 | |
| | | | | | | | | | | | | | | | |
Total Assets | | | 26,707.7 | | | | 4,659.9 | | | | 483.2 | | | | 13.0 | | | | 31,863.8 | |
| | | | | | | | | | | | | | | | |
Liabilities | | | | | | | | | | | | | | | | | | | | |
| Savings Accounts | | | 6,190.0 | | | | — | | | | — | | | | — | | | | 6,190.0 | |
| Demand Deposits | | | 6,018.8 | | | | — | | | | — | | | | — | | | | 6,018.8 | |
| Time Deposits | | | 9,896.9 | | | | 35.1 | | | | 0.1 | | | | 0.1 | | | | 9,932.2 | |
| Negotiable Obligations | | | 554.4 | | | | 1,201.0 | | | | — | | | | — | | | | 1,755.4 | |
| International Banks and Credit Agencies | | | 476.6 | | | | 226.5 | | | | — | | | | — | | | | 703.1 | |
| Domestic Banks | | | 357.2 | | | | 342.4 | | | | 12.8 | | | | 0.1 | | | | 712.5 | |
Other Liabilities(1) | | | 4,255.2 | | | | 397.6 | | | | — | | | | — | | | | 4,652.8 | |
| | | | | | | | | | | | | | | | |
Total Liabilities | | | 27,749.1 | | | | 2,202.6 | | | | 12.9 | | | | 0.2 | | | | 29,964.8 | |
| | | | | | | | | | | | | | | | |
| Asset / Liability Gap | | | (1,041.4 | ) | | | 2,457.3 | | | | 470.3 | | | | 12.8 | | | | 1,899.0 | |
| Cumulative Gap | | | (1,041.4 | ) | | | 1,415.9 | | | | 1,886.2 | | | | 1,899.0 | | | | 1,899.0 | |
| Ratio of Cumulative Gap to Cumulative Liabilities | | | (3.8 | )% | | | 4.7 | % | | | 6.3 | % | | | 6.3 | % | | | | |
| Ratio of Cumulative Gap to Total Liabilities | | | (3.5 | )% | | | 4.7 | % | | | 6.3 | % | | | 6.3 | % | | | | |
Principal plus CER adjustment. Does not include interest.
| | | |
| (1) | | Includes, mainly, debt with retailers due to credit card operations, liabilities in connection with repurchase transactions, debt with domestic credit agencies and collections for third parties. The “Less than One Year” bucket also includes Ps.6.7 million corresponding to Banco Galicia’s foreign debt not tendered by its holders in the exchange offered to restructure such foreign debt, which was completed in May 2004. |
-147-
The table above is prepared taking into account contractual maturity. Therefore, all financial assets and liabilities with no maturity date are included in the “Less than 1 Year” category.
Banco Galicia must comply with a maximum limit set by its board of directors for liquidity mismatches. This limit has been established at -25% (minus 25%) for the ratio of cumulative gap to total liabilities within the first year. As shown in the table above, Banco Galicia complies with the established policy, since such gap was -3.5% (minus 3.5%) as of December 31, 2010.
Banco Galicia (Unconsolidated) Liquidity Management
The following is a discussion of Banco Galicia’s liquidity management, excluding the consolidated companies.
Banco Galicia’s policy is to maintain a level of liquid assets that allows it to meet financial commitments at contractual maturity, take advantage of potential investment opportunities, and meet customer’s credit demand. To set the appropriate level, forecasts are made based on historical experience and on an analysis of possible scenarios. This enables management to project funding needs and alternative funding sources, as well as excess liquidity and placement strategies for such funds. As of December 31, 2010, Banco Galicia’s unconsolidated liquidity structure was as follows:
| | | | | |
| | | As of December 31, 2010 | |
| | | (in millions of Pesos) | |
| Legal Requirement | | Ps. | 4,861.1 | |
| Management Liquidity | | | 2,647.5 | |
| | | | |
Total Liquidity(1) | | Ps. | 7,508.6 | |
| | | | |
| | | |
| (1) | | Excludes cash and due from banks of consolidated companies. |
The legal liquidity requirements in the table above correspond to the Minimum Cash Requirements for Peso- and Dollar-denominated liabilities determined by Argentine Central Bank regulations. For more information on the Argentine Central Bank regulations regarding reserve requirements for liquidity purposes, see Item 4. “Information on the Company-Argentine Banking Regulation-Legal Reserve Requirements for Liquidity Purposes”.
The assets included in this calculation are technical cash, which consists of bills and coins, the balances of Peso- and Dollar-denominated deposit accounts at the Argentine Central Bank and escrow accounts held at the Argentine Central Bank in favor of clearing houses.
Management liquidity consists of the following items: (i) 100% of the balance of overnight placements in banks abroad, (ii) the net amount of the margin requirement for short-term loans (call loans) to highly-rated companies, (iii) 90% of the Lebac balance, (iv) 100% of the market value of available government securities, due to the potential liquidity that might be obtained through sales or repurchase transactions, (v) net short-term interbank loans (call loans), and (vi) 100% of the balance at the Argentine Central Bank, including escrow accounts in favor of clearing houses, in excess of the amounts necessary to cover the Minimum Cash Requirements.
During the shareholders’ meeting of Banco Galicia held on April 27, 2011, Banco Galicia’s shareholders approved the proposal of its board of directors in connection with the payment of a cash dividend for Ps.100.1 million. This proposal was previously authorized by the Superintendency, required by regulations in force established by the Argentine Central Bank. From said dividend, the personal asset tax corresponding to fiscal year 2010 will be withheld, at the appropriate time.
-148-
Capital
Our capital management policy is designed to ensure prudent levels of capital. The following table analyzes our capital resources as of the dates indicated.
| | | | | | | | | | | | | |
| | | As of December 31, | |
| | | 2010 | | | 2009 | | | 2008 | |
| | | (in millions of Pesos, except ratios, multiples and percentages) | |
| Shareholders’ Equity | | Ps. | 2,469.5 | | | Ps. | 2,052.5 | | | Ps. | 1,845.7 | |
| Shareholders’ Equity as a Percentage of Total Assets | | | 6.92 | % | | | 7.44 | % | | | 7.46 | % |
| Total Liabilities as a Multiple of Total Shareholders’ Equity | | | 13.46 | x | | | 12.45 | x | | | 12.40 | x |
Tangible Shareholders’ Equity(1) as a Percentage of Total Assets | | | 5.64 | % | | | 5.36 | % | | | 5.17 | % |
| | | |
| (1) | | Tangible shareholders’ equity represents shareholders’ equity minus intangible assets. |
For information on our capital adequacy and that of our operating subsidiaries, see Item 4. “Information on the Company-Selected Statistical Information-Regulatory Capital”.
Capital Expenditures
In the course of our business, our capital expenditures are mainly related to fixed assets, construction and organizational and IT system development. In general terms, our capital expenditures are not significant when compared to our total assets.
For a more detailed description of our capital expenditures in 2010 and our capital commitments for 2011, see Item 4. “Information on the Company-Capital Investments and Divestitures”. For a description of financing of our capital expenditures, see “-Consolidated Cash Flows”.
| | |
| Item 6. | | Directors, Senior Management and Employees |
Our Board of Directors
Our ordinary shareholders’ meeting took place on April 27, 2011. The following table sets out the members of our Board of Directors as of that date (all of whom reside in Buenos Aires, Argentina), the positions they hold within Grupo Financiero Galicia, their dates of birth, their principal occupations and the dates of their appointment and on which their current terms will expire. Terms expire when the annual shareholders’ meeting takes place.
| | | | | | | | | | | |
| | | | | | | Principal | | Member | | Current |
| Name | | Position | | Date of Birth | | Occupation | | Since | | Term Ends |
| Eduardo J. Escasany | | Chairman | | June 30, 1950 | | Businessman | | April 2005 | | December 2012 |
| Pablo Gutiérrez | | Vice chairman | | December 9, 1959 | | Banker | | April 2003 | | December 2012 |
| Abel Ayerza | | Director | | May 27, 1939 | | Businessman | | September 1999 | | December 2011 |
| Federico Braun | | Director | | February 4, 1950 | | Businessman | | September 1999 | | December 2013 |
| Enrique Martin | | Director | | October 19, 1945 | | Businessman | | April 2006 | | December 2011 |
| Luis O. Oddone | | Director | | May 11, 1938 | | Businessman | | April 2005 | | December 2012 |
| Silvestre Vila Moret | | Director | | April 26, 1971 | | Businessman | | June 2002 | | December 2013 |
| Eduardo J. Zimmermann | | Director | | January 3, 1931 | | Businessman | | April 2000 | | December 2011 |
| Guido C. Forcieri | | Director | | May 15, 1980 | | Lawyer | | April 2011 | | December 2013 |
María Ofelia Hordeñana
de Escasany | | Alternate Director | | December 30, 1920 | | Businesswoman | | April 2000 | | December 2013 |
| Sergio Grinenco | | Alternate Director | | May 26, 1948 | | Banker | | April 2003 | | December 2013 |
| Alejandro Rojas Lagarde | | Alternate Director | | July 17, 1937 | | Lawyer | | April 2000 | | December 2011 |
| Luis S. Monsegur | | Alternate Director | | August 15, 1936 | | Accountant | | April 2000 | | December 2013 |
-149-
The following is a summary of the biographies of the members of our Board of Directors:
Eduardo Escasany:Mr. Escasany obtained a degree in economics at the Universidad Católica Argentina. He was associated with Banco Galicia from 1973 to 2002. He was appointed to Banco Galicia’s board of directors in 1975. In 1979, he was elected as the vice chairman and from 1989 to March 21, 2002 he was the chairman of Banco Galicia’s board of directors and its chief executive officer. He served as the vice chairman of the board between 1989 and 1993 and then, he was elected as the chairman of the Argentine Bankers Association from 1993 to 2002. He was also chairman of the Board of Directors from September, 1999 until June, 2002. He was elected again as a member of the Board of Directors in April 2005, and re-elected in April 2007. In April 2010, he was re-elected as member of the Board of Directors and appointed as chairman. He is also a lifetime trustee and vice chairman of the Fundación Banco de Galicia y Buenos Aires. Mr. Escasany is Mrs. María Ofelia Hordeñana de Escasany’s son and Mr. Silvestre Vila Moret’s uncle.
Pablo Gutiérrez:Mr. Gutierrez obtained a degree in business administration at the Universidad de Buenos Aires. He has been associated with Banco Galicia since 1985. In April 2005, he was appointed to the board of directors of Banco Galicia. He served as the head of Banco Galicia’s Treasury Division until April 2007. Mr. Gutierrez is also chairman of Galicia Valores, director of Argenclear S.A., vice chairman of Galicia Pension Fund Limited and an alternate trustee of the Fundación Banco de Galicia y Buenos Aires. He has been an alternate director of Grupo Financiero Galicia since April 2003, and was re-elected in April 2006 and in April 2009. In April 2010, he was re-elected as member of the Board of Directors and appointed as vice chairman. Mr. Gutierrez is Mr. Abel Ayerza’s nephew.
Abel Ayerza:Mr. Ayerza obtained a degree in business administration at the Universidad Católica Argentina. He was associated with Banco Galicia from 1966 to 2002, having served as a member of Banco Galicia’s board of directors from 1976 to 2002. Mr. Ayerza is also the chairman of Aygalpla S.A., a lifetime trustee and second vice chairman of the Fundación Banco de Galicia y Buenos Aires and the managing partner of Cribelco S.R.L., Crisabe S.R.L. and Huinca Cereales S.R.L. He has been a member of the Board of Directors since September, 1999. In April 2000 he was elected as vice chairman, and on June 3, 2002 he was appointed as chairman of the Board of Directors. On April 23, 2003 he was elected for his current position, and later he was re-elected on April 27, 2006 and on April 28, 2009. Mr. Ayerza is the uncle of Mr. Pablo Gutierrez.
Federico Braun:Mr. Braun obtained a degree in industrial engineering at the Universidad de Buenos Aires. He was associated with Banco Galicia from 1984 to 2002, having served as a member of the Board of Directors during such period. Mr. Braun is also the chairman of Asociación Argentina de Codificación de Productos Comerciales (Código), Campos de la Patagonia S.A., Estancia Anita S.A. and S.A. Importadora and Exportadora de la Patagonia; the vice chairman of Club de Campo Los Pingüinos S.A., Inmobiliaria y Financiera “La Josefina” S.A. and Asociación de Supermercados Unidos y Mayorista Net S.A.; a member of Asociación Empresaria Argentina and a lifetime trustee of the Fundación Banco de Galicia y Buenos Aires. He has been a member of the Board of Directors since September, 1999. He was elected for his current position on June 3, 2002, and was re-elected on April 28, 2005, on April 29, 2008 and on April 27, 2011.
Enrique Martin:Mr. Martin obtained a degree in law at the Universidad de Buenos Aires. He was a professor at said university for more than 20 years and has a post-graduate certificate in international economics from the University of London. He was associated with Banco Galicia from 1977 until 2002 and was responsible for the International Banking Relations Department. Mr. Martin is Advisor to ZEIG S.A. He is also a director of the Argentine-Chilean Chamber of Commerce and an advisor to the Canadian-Argentine Chamber of Commerce. He has been a member of the Board of Directors since April 2006, and was re-elected in April 2009.
-150-
Luis Oddone:Mr. Odonne obtained a degree in national public accounting at the Universidad de Buenos Aires. He was appointed as Grupo Financiero Galicia’s syndic from 1999 until April 2005. Mr. Oddone is also the chairman of La Cigarra S.A. and Scharstof S.A., a director of Petrolera de Conosur S.A. and a syndic for Santa Emilia de Martin S.A. and Promotora S.A. He has been a member of the Board of Directors since April, 2005, and was re-elected in April 2007 and in April 2010.
Silvestre Vila Moret: Mr. Vila Moret obtained a degree in banking administration at the Universidad Católica Argentina. He was associated with Banco Galicia from 1997 until May 2002. Mr. Vila Moret is also vice chairman of El Benteveo S.A. and Santa Ofelia S.A. He has been a member of the Board of Directors since June 2002, and was re-elected in April 2005, 2008 and 2011. Mr. Vila Moret is the grandson of Mrs. María Ofelia Hordeñana de Escasany and nephew of Mr. Eduardo Escasany.
Eduardo Zimmermann:Mr. Zimmermann obtained a degree in banking administration at the Universidad Argentina de la Empresa. He was associated with Banco Galicia between 1958 and 2002, where he acted as a director from 1975 to 2002. Mr. Zimmermann is also a lifetime trustee of the Fundación Banco de Galicia y Buenos Aires. He has been a member of the Board of Directors since April 2000, and was re-elected to his current position in April 2006 and in April 2009.
César Forcieri: Mr. Forcieri obtained a degree in Law at the Universidad Argentina de la Empresa (UADE) in 2005 and a Master in Finance at the Universidad del CEMA in 2008. As from 2006 to 2010, he held different offices in ANSES, performing duties in its Technical and Administrative Department and its Acquisitions and Public Contracts Office, as well as in the Wealth Fund for the Pension System (Fondo de Garantía de Sustentabilidad para el Sistema Integrado Previsional Argentino—FGS-SIPA), where he served as Liaison Manager from 2009 through May 2010. During the same period, he was a regular director at Quickfood S.A., a public company partially owned by the FGS-SIPA. As from May to August 2010 he served as Acting Chief of Staff at the Argentine Ministry of Economy and Finance, when he was confirmed by Presidential Decree 1182/10. He remains in office. Amongst the duties entrusted to him, Mr. Forcieri represents Argentina as Deputy Finance Minister to the Group of Twenty and chairs the Ministry’s Working Group for the Analysis of Investment Projects applying to the Bicentennial Investment Loans Programme (Programa de Financiamiento Productivo del Bicentenario).
María Ofelia Hordeñana de Escasany:Mrs. Hordeñana de Escasany has held several positions in different subsidiaries of Banco Galicia. She is currently the chairman of the Fundación Banco de Galicia y Buenos Aires and Santamera S.A. She has been an alternate director of Grupo Financiero Galicia since April 2000, and was re-elected to her current position in April 2005, 2008 and 2011. Mrs. Hordeñana de Escasany is the mother of Mr. Eduardo Escasany and the grandmother of Mr. Silvestre Vila Moret.
Sergio Grinenco: Mr. Grinenco obtained a degree in economics at the Universidad Católica Argentina and a master’s degree in business administration from Babson College in Wellesley, Massachusetts. He has been associated with Banco Galicia since 1977. He was elected as an alternate director of Banco Galicia in September 2001 and as the vice chairman in April 2003, a position he currently holds after being re-elected in April 2006, 2009 and 2011. Mr. Grinenco is also the chairman of Galicia Factoring y Leasing S.A., liquidator of Galicia Capital Markets S.A. (in liquidation) and an alternate trustee of the Fundación Banco de Galicia y Buenos Aires.
Alejandro María Rojas Lagarde:Mr. Rojas obtained a degree in law at the Universidad de Buenos Aires. He has held a variety of positions at Banco Galicia since 1963. From 1965 to January 2000, he was responsible for the general counsel office of Banco Galicia. He was re-elected to his current position in April 2005 and in April 2008. He is also a manager of Rojas Lagarde S.R.L., director of Santiago Salud S.A. and lifetime trustee of the Fundación Banco de Galicia y Buenos Aires.
Luis Sila Monsegur:Mr. Monsegur obtained a degree in national public accounting at the Universidad de Buenos Aires. He held a variety of positions at Banco Galicia from 1962 to 1992 and is an alternate trustee of the Fundación Banco de Galicia y Buenos Aires. He was re-elected to his current position in April 2005, 2008 and 2011.
-151-
Our Board of Directors may consist of between three and nine permanent members. Currently our Board of Directors has nine members. In addition, the number of alternate directors-individuals who act in the temporary or permanent absence of a director-has been set at four. The directors and alternate directors are elected by the shareholders at our annual general shareholders’ meeting. Directors and alternate directors are elected for a three-year term.
Messrs. Sergio Grinenco and Pablo Gutiérrez are also directors of Banco Galicia. In addition, some members of our Board of Directors may serve on the board of directors of any subsidiary we establish in the future.
Five of our directors and one of our alternate directors are members of the families that are the controlling shareholders of Grupo Financiero Galicia.
Our Audit Committee
In compliance with CNV rules regarding the composition of the Audit Committee of companies listed in Argentina, which require that the Audit Committee be comprised of at least three directors, with a majority of independent directors, the Board of Directors established an Audit Committee with three members. Currently, Messrs. Luis O. Oddone, Eduardo Zimmermann and C. Enrique Martin are the members of the Audit Committee. All of the members of our Audit Committee are independent directors under the CNV and Nasdaq requirements. All three members of the Audit Committee are financially literate and have extensive managerial experience. Mr. Oddone is the financial expert serving on our Audit Committee.
According to the CNV rules, the Audit Committee is primarily responsible for (i) issuing a report on the Board of Directors’ proposals for the appointment of the independent auditors and the compensation for the Directors, (ii) issuing a report detailing the activities performed according to the CNV requirements, (iii) issuing the Audit Committee’s annual plan and implementing the plan each fiscal year, (iv) evaluating the external auditors’ independence, work plans and performance, (v) evaluating the plans and performance of the internal auditors, (vi) supervising the reliability of our internal control systems, including the accounting system, and of external reporting of financial or other information, (vii) following-up on the use of information policies on risk management at Grupo Financiero Galicia’s main subsidiaries, (viii) evaluating the reliability of the financial information to be filed with the CNV and the SEC, (ix) verifying compliance with the applicable conduct rules, and (x) issuing a report on related party transactions and disclosing any transaction where a conflict of interest exists with corporate governance bodies and controlling shareholders. The Audit Committee has access to all information and documentation that it requires and is broadly empowered to fulfill its duties. During 2010, the Audit Committee held twelve meetings.
Our Supervisory Committee
Our bylaws provide for a Supervisory Committee consisting of three members who are referred to as syndics (“syndics”) and three alternate members who are referred to as alternate syndics (“alternate syndics”). In accordance with the Corporations’ Law and our bylaws, the syndics and alternate syndics are responsible for ensuring that all of our actions are in accordance with applicable Argentine law. Syndics and alternate syndics are elected by the shareholders at the annual general shareholders’ meeting. Syndics and alternate syndics do not have management functions. Syndics are responsible for, among other things, preparing a report to shareholders analyzing our financial statements for each year and recommending to the shareholders whether to approve such financial statements. Alternate syndics act in the temporary or permanent absence of a syndic. Currently, there are three syndics and three alternate syndics. Syndics and alternate syndics are elected for a one-year term.
The following table shows the members of our Supervisory Committee. Each of our syndics was appointed at the ordinary shareholders’ meeting held on April 27, 2011. Terms expire when the annual shareholders’ meeting takes place.
| | | | | | | |
| | | | | Principal | | Current |
| Name | | Position | | Occupation | | Term Ends |
| Norberto Corizzo | | Syndic | | Accountant | | December 2011 |
| Luis A. Díaz | | Syndic | | Accountant | | December 2011 |
| Enrique M. Garda Olaciregui | | Syndic | | Lawyer | | December 2011 |
| Miguel Armando | | Alternate Syndic | | Lawyer | | December 2011 |
| Fernando Noetinger | | Alternate Syndic | | Lawyer | | December 2011 |
| Horacio Tedín | | Alternate Syndic | | Lawyer | | December 2011 |
-152-
The following is a summary of the biographies of the members of our Supervisory Committee:
Norberto Corizzo:Mr. Corizzo obtained a degree in national public accounting at the Universidad de Buenos Aires. He has developed taxes activities in companies such as López González Raimondi y Asoc., Noel y Cía and Price Waterhouse. He has been syndic at Grupo Financiero Galicia since April 2003. He has been associated with Banco Galicia since 1977. Mr. Corizzo is also a syndic of Banco Galicia, EBA Holding, Tarjetas Regionales S.A., Cobranzas Regionales S.A., Tarjeta Naranja S.A., Tarjetas Cuyanas S.A., Tarjetas del Mar S.A., Compañía Financiera Argentina, and of other subsidiaries of Banco Galicia and Grupo Financiero Galicia.
Luis Díaz:Mr. Díaz obtained a degree in national public accounting at the Universidad de Buenos Aires. He has provided services to Banco Galicia since 1965, and was elected as a syndic of Banco Galicia and Grupo Financiero Galicia at the shareholders’ meetings held on April 28, 2009. Additionally, he is a syndic of Tarjetas Regionales S.A., Tarjetas del Mar S.A., Galicia Factoring y Leasing S.A. (“in liquidation”), Galicia Valores, Galicia Warrants, Compañía Financiera Argentina and of other subsidiaries of Banco Galicia and Grupo Financiero Galicia.
Enrique M. Garda Olaciregui:Mr. Garda Olaciregui obtained a degree in law at the Universidad del Salvador. He has a master in Finances at Universidad del CEMA and a degree in Corporate Law at Universidad Austral. He has been associated with Banco Galicia since 1970. He served as legal advisor to Banco Galicia between September 2001 and April 2003. He has provided services as a Secretary Director between April 2003 and April 2010, when he was designated as regular syndic of Banco de Galicia. Additionally, he is a regular syndic at Grupo Financiero Galicia, Galicia Factoring y Leasing (“in liquidation”), Galicia Warrants, Tarjetas Regionales S.A., GV Mandataria, Tarjetas Cuyanas S.A., Tarjeta Naranja S.A. Tarjetas del Mar S.A., Galicia Valores, Galicia Capital Markets S.A. (“in liquidation”), Cobranzas Regionales S.A., Compañía Financiera Argentina and of other subsidiaries of Banco Galicia and Grupo Financiero Galicia.
Miguel Armando: Mr. Armando obtained a degree in law at the Universidad de Buenos Aires. He was first elected as an alternate syndic of Banco Galicia in 1986. He is vice chairman of Arnoar S.A. and member of the board of Directors of Santiago de Compostela Promotora de Seguros S.A. Mr. Armando is also a syndic of EBA Holding S.A. and an alternate syndic of Banco Galicia, Grupo Financiero Galicia, Galicia Valores, Tarjetas Regionales S.A., Tarjeta Naranja S.A., Tarjetas Cuyanas S.A., Tarjetas del Mar S.A. and Compañía Financiera Argentina, among others.
Fernando Noetinger: Mr. Noetinger obtained a degree in law at the Universidad de Buenos Aires. He has been associated with Banco Galicia since 1987. Mr. Noetinger is also chairman of Arnoar S.A., and an alternate syndic of EBA Holding S.A., Banco Galicia, Electrigal S.A., GV Mandataria, Tarjetas del Mar S.A., Tarjetas Regionales S.A., Santiago Salud S.A., Galicia Warrants, Galicia Valores, Galicia Factoring y Leasing S.A., Galicia Capital Markets S.A (“in liquidation”), Galicia Retiro, Galicia Seguros, Sudamericana Holding S.A., Compañía Financiera Argentina and Net Investment, among others.
Horacio Tedín: Mr. Tedín obtained a degree in law at the Universidad de Buenos Aires. In 1981 he founded his own law firm, which has actively worked for Banco Galicia and other big corporate clients. Mr. Tedín has been an alternate syndic of Grupo Financiero Galicia since 2006. He is also a syndic of Electrigal S.A. and an alternate syndic of EBA Holding S.A., GV Mandataria, Compañía Financiera Argentina, Tarjetas Regionales S.A. and Galicia Administradora de Fondos, among others.
Compensation of Our Directors
Compensation for the members of the Board of Directors is considered by the shareholders at the shareholders’ meeting once the fiscal year has ended. Our independent directors are paid an annual fee based on the functions they carry out and they may receive partial advance payments during the year. We do not pay fees to the members of our Board of Directors who are also members of the board of directors of Banco Galicia. At the ordinary shareholders’ meeting held on April 27, 2011 the compensation for the Board of Directors was set at Ps.512,000 for the fiscal year ending on December 31, 2010. For a description of the amounts to be paid to the board of directors of Banco Galicia, see “—Compensation of Banco Galicia’s Directors and Officers” below.
-153-
We do not maintain a stock-option, profit-sharing or pension plan for the benefit of our directors. In connection with Banco Galicia’s foreign debt restructuring, we agreed to limit the amounts paid per fiscal year to the members of our Board of Directors and agreed not to make any payments to our management in excess of market compensation. See Item 10. “Additional Information-Material Contracts”.
We do not have a policy establishing any termination benefits for our directors.
Management of Grupo Financiero Galicia
Our organizational structure consists of a chief executive officer (“CEO”) who reports to the Board of Directors, and the Chief Financial Officer who reports to the CEO and is in charge of the Financial and Accounting Division.
The CEO’s main function consists in implementing the policies defined by the Board of Directors, as well as suggesting to the Board of Directors the application of plans, budgets and company organization. He is also in charge of supervising the Financial & Accounting Division, assessing the attainment of goals and the performance of Grupo Financiero Galicia. The position also takes part in the board of directors of some subsidiaries. Our CEO is Mr. Pedro Richards, who was born on November 14, 1952.
The Financial & Accounting Division is mainly responsible for the assessment of investment alternatives, thus suggesting whether to invest or withdraw Grupo Financiero Galicia’s positions in different companies or businesses. It also plans and coordinates Grupo Financiero Galicia’s administrative services and financial resources in order to guarantee its proper management. This division also aims at meeting requirements set by several controlling authorities, complying with information and internal control needs and budgeting purposes. Furthermore, it includes the investor relations function, aimed at planning, preparing, coordinating, controlling and providing financial information to the stock exchanges where Grupo Financiero Galicia’s shares are listed, regulatory bodies and both domestic and international investors and analysts. It assesses the materials published by analysts, carrying out a follow-up of their opinions, as well as those of shareholders and investors in general.
Our compensation policy, which is essentially the same as the policy followed by the companies that we control, consists of arranging salary levels in order of importance based on a system that describes and assesses job positions based on objective factors (the Hay System). The purpose of such system is to pay compensation that is similar to the compensation that is paid for a similar position in the domestic market. Managers who are our employees or our controlled companies’ employees receive a fixed salary and may receive a bonus based on individual performance. This policy for compensation includes the possibility of having access to retirement insurance. We do not maintain stock-option, profit-sharing or pension plans or any other retirement plans for the benefit of our managers.
We have established a Disclosure Committee in response to the U.S. Sarbanes-Oxley Act of 2002. The main responsibility of this committee is to review and approve controls over the public disclosure of financial and related information, and other procedures necessary to enable our chief financial officer and chief executive officer to provide their certifications of our annual report that is filed with the SEC. The members are Messrs. Pedro Richards, José Luis Gentile, Adrián Enrique Pedemonte and Ms. Mariana Saavedra. In addition, at least one of the members of this committee attends all of the meetings of our principal subsidiaries’ disclosure committees.
-154-
Board of Directors of Banco Galicia
At the ordinary shareholders’ meeting held on April 27, 2011, the size of Banco Galicia’s board of directors was set at seven members and five alternate directors. The following table sets out the members of Banco Galicia’s board of directors as of April 27, 2011, all of whom are residents of Buenos Aires, Argentina, the position currently held by each of them, their dates of birth, their principal occupations, the dates of their appointment and the year in which their current terms will expire. The business address of the members of the Banco Galicia’s board of directors is Tte. General J. D. Perón 407, (C1038AAI) Buenos Aires, Argentina.
| | | | | | | | | | | |
| | | | | Date of | | Principal | | Member | | Current |
| Name | | Position | | Birth | | Occupation | | Since | | Term Ends |
| Antonio R. Garcés | | Chairman of the Board | | May 30, 1942 | | Banker | | September 2001 | | December 2011 |
| Sergio Grinenco | | Vice chairman | | May 26, 1948 | | Banker | | April 2003 | | December 2011 |
| Guillermo J. Pando | | Secretary Director | | October 23, 1948 | | Banker | | April 2003 | | December 2013 |
| Pablo Gutierrez | | Director | | December 9, 1959 | | Banker | | April 2005 | | December 2013 |
| Luis M. Ribaya | | Director | | July 17, 1952 | | Banker | | September 2001 | | December 2013 |
Pablo M. Garat(1) | | Director | | January 12, 1953 | | Lawyer | | April 2004 | | December 2012 |
Ignacio A. González García(1) | | Director | | April 23, 1944 | | Accountant | | April 2010 | | December 2012 |
| Enrique García Pinto | | Alternate Director | | August 10, 1948 | | — | | April 2009 | | December 2011 |
| Raúl H. Seoane | | Alternate Director | | July 18, 1953 | | Banker | | April 2005 | | December 2011 |
Juan C. Fossatti(2) | | Alternate Director | | September 11, 1955 | | Lawyer | | June 2002 | | December 2012 |
Julio P. Naveyra(2) | | Alternate Director | | March 24, 1941 | | Accountant | | April 2004 | | December 2012 |
Osvaldo H. Canova(2) | | Alternate Director | | December 8, 1934 | | Accountant | | April 2004 | | December 2012 |
| | | |
| (1) | | In accordance with the rules of the CNV, and pursuant to the classifications adopted by the CNV, Messrs. Garat and González García are independent and were elected at the ordinary shareholders’ meeting held on April 14, 2010. The board of directors’ meeting held on April 15, 2010 elected them as members of the Audit Committee. Messrs. Garat and González García are also independent directors in accordance with the Nasdaq rules. |
| |
| (2) | | In accordance with the rules of the CNV, and pursuant to the classifications adopted by the CNV, Messrs. Fossatti, Canova and Naveyra are independent alternate directors. They would replace the independent directors in case of vacancy. They are also independent directors in accordance with the Nasdaq rules. |
The following are the biographies of the members of the board of directors of Banco Galicia:
Antonio Roberto Garcés: Mr. Garcés obtained a degree in national public accounting at the Universidad de Buenos Aires. He has been associated with the Issuer since 1959. In April 1985, he was appointed as an alternate director of Banco Galicia. Subsequently, he was appointed as the vice chairman of Banco Galicia in September 2001, the chairman of the board of directors of Banco Galicia from March 2002 until August 2002, and then the vice chairman from August 2002 until April 2003, when he was elected as the chairman of Banco Galicia’s board of directors, a position he currently holds, after being re-elected on April 28, 2009. From April 2003 until April 2011, he was a member of the Board of Directors and served as its chairman from April 23, 2003 to April 2010. Mr. Garcés is also the first vice chairman of the Argentine Bankers Association (ADEBA), a director of Compañía Financiera Argentina and a lifetime trustee of the Fundación.
Sergio Grinenco: See “—Our Board of Directors”.
Guillermo Juan Pando: Mr. Pando has been associated with Banco Galicia since 1969. He was first elected as an alternate director of Banco Galicia from September 2001 until June 2002, and in April 2003 he was elected as a director. He is also the chairman of Galicia Cayman and Private Equity Management Corporation Ltd., vice chairman of Distrocuyo S.A. and Electrigal S.A., director of Santiago Salud S.A. an alternate director of Compañía Financiera Argentina, Tarjetas Regionales S.A., Tarjetas del Mar S.A. and Tarjeta Naranja S.A., the liquidator of Galicia Factoring y Leasing S.A. (in liquidation) and Galicia Capital Markets S.A. (in liquidation) and an alternate trustee of Fundación Banco de Galicia y Buenos Aires.
Pablo Gutierrez: See “—Our Board of Directors”.
Luis María Ribaya: Mr. Ribaya obtained a degree in law from the Universidad de Buenos Aires. He has been associated with Banco Galicia since 1971. He was elected as a director of Banco Galicia in September 2001, as an alternate director in June 2002 and again as a director in April 2003. Mr. Ribaya is also the chairman of Argencontrol S.A. and MAE, a director of Galicia Valores, and an alternate trustee of Fundación Banco de Galicia y Buenos Aires.
Pablo María Garat: Mr. Garat obtained a degree in law at the Universidad de Buenos Aires. He has been associated with Banco Galicia as an independent director since April 2004. Mr. Garat has been an official representative of the Province of Tierra del Fuego and an advisor to the Argentine Senate, and he currently develops its professional independent activity at his own law firm and is a professor at the University of Constitutional Law and Constitutional Tributary Law.
-155-
Ignacio Abel González García:Mr. González García obtained a degree in national public accounting at the Universidad de Buenos Aires and a master in Auditing at Drew University, New Jersey. Previously, he served as a Member of the International Committee of Finance & Value Sharing, PricewaterhouseCoopers. He was appointed as director of Banco Galicia at the shareholders’ meeting held on April 14, 2010. He is also syndic of Sociedad Anónima La Nación, La Nación Nuevos Medios, Publirevistas S.A., Sociedad Anónima Importadora y Exportadora de la Patagonia and Banelco S.A., Founder and President of P.O.D.ER (Polo de Desarrollo Educativo Renovador).
Raúl Héctor Seoane: Mr. Seoane obtained a degree in economics from the Universidad de Buenos Aires. He has been associated with Banco Galicia since 1988. Mr. Seoane has served as an alternate director of Banco Galicia since April 2005.
Enrique García Pinto:Mr. García Pinto has been associated with Banco Galicia since 1970. Previous to such time he served at Nobleza Piccardo SAYCYF and Saturno Agropecuaria SCA. Mr. García Pinto was appointed as an alternate director of Banco Galicia at the shareholders’ meeting held on April 28, 2009. He is also vice chairman of Galicia Internacional S.A. and an alternate director of Sullair S.A. and Distrocuyo S.A.
Juan Carlos Fossatti: Mr. Fossatti obtained a degree in law from the Universidad de Buenos Aires. He has been associated with Banco Galicia since June 2002, when he was elected as an independent alternate director at the annual general shareholders’ meeting. Mr. Fossatti is also the chairman of Tierras del Bermejo S.A. and of Tierras del Tigre S.A. and director of Baerlocher do Brazil S.A. (Sao Paulo — Brazil).
Julio Pedro Naveyra:Mr. Naveyra obtained a degree in accounting at the Universidad de Buenos Aires. He has been associated with Banco Galicia since April 2004 when he was elected as an independent alternate director. Mr. Naveyra has also been a member of Harteneck, López y Cía. (now Price Waterhouse & Co. S.R.L.). He is also a syndic of S.A. La Nación, Supermercados Makro S.A., Sandoz S.A., Exxon Mobil S.A., Plan Ovalo S.A. de Ahorro, Ford Motor Argentina S.R.L. and Ford Credit Argentina S.A., and a director of Gas Natural Ban S.A., Telecom Argentina S.A. and Grupo Concesionario del Oeste S.A.
Osvaldo Héctor Canova:Mr. Canova obtained a degree in accounting at the Universidad de Buenos Aires. He has been associated with Banco Galicia since April 2004 when he was elected as an independent alternate director. Mr. Canova has also been a member of Harteneck, López y Cía. (now Price Waterhouse & Co. S.R.L.) and Mcduliffe, Turquan Young. Mr. Canova is also President of Maynor S.A. and a syndic of Unilever Argentina S.A., Helket S.A., Sociedad Anónima Grasas Refinadas Argentinas Comercial e Industrial (SAGRA), Arisco S.A., Novartis S.A., Ford Credit de Argentina S.A., Plan Ovalo S.A. de Ahorro and Ford Credit Holding Argentina S.A.
Functions of the Board of Directors of Banco Galicia
Banco Galicia’s board of directors may consist of three to nine permanent members. In addition, there can be one or more alternate directors who can act during the temporary or permanent absence of a director. As of the date of this annual report, five directors and one alternate director were engaged on a full time basis in the day-to-day operations of Banco Galicia. Messrs. García Pinto, Fossatti, Garat, González García, Canova and Naveyra are not employees of Banco Galicia.
Banco Galicia’s board of directors meets formally twice each week and informally on a daily basis, is in charge of Banco Galicia’s general management and makes all the necessary decisions. Members of Banco Galicia’s board of directors serve on the following committees:
Risk Management Committee:This committee is composed of four directors, the CEO, the managers of the Planning and Financial Control and the Risk Management Divisions, and the Internal Audit Department manager. This committee is in charge of approving risk management strategies, policies, processes and procedures and the contingency plans thereof. It is also responsible for setting specific limits for the exposure to each risk and approving, when applicable, temporary excesses over said limits as well as being informed of each risk position and compliance with policies. This committee meets at least once every two months. Its resolutions are summarized in writing.
-156-
Credit Committee:This committee is composed of five directors, the CEO and the managers of the Credit and Risk Management Divisions. The managers of the Wholesale Banking, Retail Banking and Financial Divisions must attend the meetings if the bank account pending approval by this committee corresponds to any of the above-mentioned divisions. This committee meets at least once every week. It is in charge of granting loans for amounts higher than Ps.50 million and all loans to financial institutions (local or international) and related parties. Approved operations are recorded in signed and dated documents.
Information Technology Committee:This committee is composed of three directors, the CEO, the Comprehensive Corporate Services Division manager and the IT Department manager. This committee is in charge of supervising and approving the development plans of new systems and their budgets, as well as controlling these systems’ budget control. It is also responsible for approving the general design of the systems’ structure, the main processes thereof and the systems implemented, as well as monitoring the quality of Banco Galicia’s systems. This committee meets at least once every three months. It can hold extraordinary meetings when there exist issues that require to be considered urgently. The IT Department manager usually calls for the meeting and requests the documents to be considered. However, any member of the Committee can do so. Its resolutions are summarized in writing.
Audit Committee:In accordance with the requirements set forth by the Argentine Central Bank regulations, Banco Galicia has an Audit Committee composed of two directors, one of which is an independent director, and the Internal Audit Department manager. In addition, in its capacity as a publicly listed company (in Argentina), Banco Galicia must comply with the transparency regime for public companies set forth by Decree No. 677/01 and by the rules established by the CNV in its resolutions No. 400, 402 and supplementary regulations. In compliance with the CNV regulations, the Audit Committee is made up of three directors, two of which are independent directors.
Committee for the Control and Prevention of Money Laundering and Funding of Terrorist Activities:This committee is responsible for planning, coordinating and enforcing compliance with the policies for the prevention and control of money laundering and funding of terrorist activities established and approved by Banco Galicia’s board of directors, based on regulations in force. Furthermore, this committee is in charge of the design of internal controls, personnel training plans and the control of the fulfillment thereof by the internal audit. It is composed of two directors, the CEO, the person in charge of the Anti-Money Laundering Unit (UAL), the managers of the following divisions: Financial, Wholesale and Retail Banking and Comprehensive Corporate Services, as well as the Risk Management Division manager and the Internal Audit Department manager. The syndics can be invited to attend any meeting called by this committee. The Anti-Money Laundering Unit reports directly to Banco Galicia’s board of directors. In addition, in compliance with the regulations set forth by the Argentine Central Bank, Director Mr. Guillermo Juan Pando, was appointed Banco Galicia’s officer responsible for the control and prevention of money laundering and funding of terrorist activities. Likewise, the Financial Division manager is the officer in charge of financial intermediation transactions.
This committee is scheduled to meet at least once every two months and its resolutions must be registered in a minutes book bearing folios and seals.
Committee for Information Integrity:This Committee was created to comply with the provisions of the U.S. Sarbanes-Oxley Act. It is composed of two directors, the CEO, the manager in charge of the Planning and Financial Control Division, the Internal Audit Department manager, and the managers of the Accounting Department, the Management of Assets and Liabilities Department and the Investor Relations Department. The syndics can be invited to attend any meeting called by this committee. A member of this committee that was created for the same purpose by Grupo Financiero Galicia also attends the meetings held by this committee. Likewise, this committee may call officers from Banco Galicia’s different divisions whenever it may deem necessary. This committee will meet every month or as long as there exist issues that require to be considered
Human Resources Committee:This committee is in charge of the appointment and assignment, transfer, rotation, development, headcount and compensation of the personnel included in salary levels 9 and above. It is composed of four directors, the CEO and the Organizational Development and Human Resources Division manager. This committee meets every six months or whenever there are issues that require consideration. Its resolutions are summarized in writing.
-157-
Asset and Liabilities Committee (ALCO):This committee is in charge of analyzing the evolution of Banco Galicia’s business from a financial point of view, in regard to fund raising and different assets placement. It is also in charge of the follow-up and control of liquidity, interest rate and currency mismatches. This committee is in charge of analyzing and making recommendations to the business divisions in connection with the management of interest rate, currency and maturity mismatches, with the goal of maximizing financial and foreign-exchange results within acceptable parameters of risk and capital use. This Committee is also responsible for suggesting changes to these parameters, if necessary, to Banco Galicia’s board of directors. Five directors, the CEO, the Retail Banking Division manager, the Wholesale Banking Division manager, the Financial Division manager, the Risk Management Division manager and the Planning and Financial Control Division manager are members of this committee. This committee meets at least once a month. Its resolutions are summarized in writing and signed by two of its members.
Customer Assistance Committee:This committee is in charge of the general supervision of the activities related to the servicing, follow-up and resolution of customer complaints. This committee establishes the standards for customer service, with the purpose of implementing improvements to minimize the number of complaints and shorten response times. It is made up of one director, the Head of the Center for Retail Business Contacts and the Galicia Responde Service, and the division and department managers and other officers whose participation is deemed relevant. This committee is scheduled to meet at least once every two months. Its resolutions are summarized in writing.
Planning and Management Control Committee:This committee is composed of five directors, the CEO, the Risk Management Division manager, the Planning and Financial Control Division manager and the Internal Audit Department manager. The syndics can be invited to attend any meeting called by this committee. This committee is in charge of the analysis, definition and follow-up of the consolidated balance sheet and income statement. This committee meets at least once every month. Quarterly budgetary follow-up by division must be made in meetings, in which three directors, the CEO, the Planning and Financial Control Division manager and those managers who are called upon may attend. Its resolutions are summarized in writing and signed by two of the above-mentioned officers.
Segments and Business Management Committee:This committee is composed of three directors, the CEO, the division managers, the department managers and those officers whose participation is deemed necessary and those whose presence is specifically requested. It is in charge of the analysis, definition and follow-up of businesses and segments. This committee meets at least once every three months. Its resolutions are summarized in writing and signed by two of the above-mentioned officers.
Crisis Committee:This committee is composed of five directors, the CEO and those other officers whose participation is deemed to be necessary and those who are invited to attend. This committee is in charge of the assessment of any liquidity crisis and the implementation of actions designed to resolve the same. Its resolutions are summarized in writing and are signed by any two of the previously described members.
Periodically, the board of directors of Banco Galicia is informed of the actions taken by the committees, which are recorded in minutes.
Banco Galicia’s Executive Officers
On August 31, 2009, Mr. Daniel A. Llambías, an accountant, was appointed CEO of Banco Galicia, by decision of its board of directors. The CEO is in charge of implementing the strategic goals established by the board of directors of Banco Galicia. Likewise, he coordinates the managers of Banco Galicia’s divisions, while reporting to Banco Galicia’s board of directors.
Daniel Antonio Llambías: Mr. Llambías was born on February 8, 1947. He obtained a degree in national public accounting at the Universidad de Buenos Aires. He has been associated with Banco Galicia since 1964. He was elected as an alternate director of Banco Galicia in September 1997 and as a director in September 2001 until August 2009, when he was appointed CEO. Mr. Llambías is also the chairman of Sudamericana Holding S.A., the vice chairman of Visa Argentina S.A and Tarjetas del Mar S.A., a director of Tarjeta Naranja S.A., Tarjetas Regionales S.A., Tarjetas Cuyanas S.A., IDEA and Fincas de La Juanita S.A., as well as a member of the supervisory committee of Automóvil Club Argentino, and an alternate trustee of the Fundación Banco de Galicia y Buenos Aires.
-158-
The following divisions and department managers report to Banco Galicia’s CEO:
| | | |
| Division | | Manager |
| Retail Banking | | Juan Sarquis |
| Wholesale Banking | | Gastón Bourdieu |
| Financial | | Pablo María Leon |
| Risk Management | | Juan Carlos L’Afflitto |
| Credit | | Marcelo Poncini |
| Comprehensive Corporate Services | | Miguel Ángel Peña |
| Organizational Development and Human Resources | | Rafael Pablo Bergés |
| Planning and Financial Control | | Raúl Héctor Seoane |
Retail Banking Division: This division is responsible for designing, planning and implementing the vision, strategies, policies and goals for the Retail Banking Division’s businesses and for each customer segment and distribution channel. It is also in charge of the definition and control of this division’s business goals. The following departments report to this division: Private Banking, Segments, Products, Alternative Channels, Branch Network, Publicity, Promotion and Image, and Operating Supervision of Branches and Planning.
Wholesale Banking Division: This division is responsible for designing, planning and implementing the vision, strategies, policies and goals for the Wholesale Banking Division’s businesses and for each customer segment (corporate, SMEs, agriculture and livestock companies and public-sector companies) and products. It is also in charge of the definition and control of this division’s business goals. The following departments report to this division: Agriculture and Livestock Sector, Corporate, SMEs, Public Sector, Wholesale Products and Marketing, Capital Markets and Investment Banking, Business Analysis and Planning.
Financial Division: This division is responsible for planning and managing the correct use of financial resources and providing the appropriate funding for Banco Galicia’s businesses, establishing and applying Banco Galicia’s deposit-raising and funding policies within the parameters established by Banco Galicia’s risk policies. It also manages short-term resources and Banco Galicia’s investment portfolio, ensuring the correct execution of transactions. The following departments report to this division: Management of Assets and Liabilities, Treasury, Banking Relations and Information Support and Management.
Risk Management Division: This division is responsible for monitoring and actively managing the various risks faced by the Bank (credit, financial and operational) and its subsidiaries, as well as ensuring the Bank’s compliance with Argentine and international policies in place to control and prevent money laundering and terrorist financing. The following departments report to this division: Credit Risk and Insurance, Financial Risk, Operational Risk, Information and Risk Analysis and Development and Management of Models.
Credit Division: This division is responsible for developing and proposing the strategies for credit and credit-granting policies, as well as managing and monitoring credit origination processes, follow-up and control thereof, and the recovery of past-due loans. This aims at ensuring the quality of the loan portfolio, cost and time efficiency, and recovery optimization, thus minimizing loan losses and optimizing efficiency in processes and business credit granting. The following departments report to this division: Credit Analysis, Corporate Credit, Consumer Credit, Preventative Management and Analysis, Customer Credit Recovery, Portfolio Recovery, Information and Management of the Area, Policies and Strategies and Special Projects.
Comprehensive Corporate Services Division: This division is responsible for designing, planning and implementing the strategies and policies for the IT, Organization, Operations, Purchase of Goods and Services and Infrastructure divisions, and the maintenance thereof. It is as well in charge of Banco Galicia’s physical and information safety, with the purpose of ensuring and maintaining the logistic support for its operations and activities. The following departments report to this division: Operations, IT, Organization, Engineering and Maintenance, Purchases and Contracts, Security, Management Control and Information Security.
Organizational Development and Human Resources Division: This division is in charge of designing, planning and implementing human resources strategies and policies, as well as defining and controlling management goals of Banco Galicia’s human resources with the purpose of ensuring homogeneous practices, availability of qualified and motivated personnel and a proper work environment. The following departments report to this division: Human Resources, Internal Communications and Change Management, Management Development, Compensation and Benefits, Quality Assurance and Corporate Social Responsibility.
-159-
Planning and Financial Control Division: This division is responsible for planning and controlling budget, accounting and tax activities. The following departments report to this division: Accounting, Tax Advisory, Planning and Management Control, Investors Relations and Fiduciary Administration and Supplementary Businesses.
The following departments report to the CEO:
| | | |
| Department | | Manager |
| Legal Advisory Services Department | | María Elena Casasnovas |
| Research Department | | Nicolás Dujovne |
Legal Advisory Services Department: This department is responsible for providing advisory services and determining the steps to be taken for Banco Galicia’s business conduction under the regulations in force, with the purpose of ensuring the legitimacy thereof and avoiding loss of rights, indemnifications and/or penalties.
Research Department: This department is responsible for providing Banco Galicia’s different areas with the analysis and information that may contribute to increasing income and customer portfolios, as well as facilitating the decision-making process.
The following departments report to the board of directors of Banco Galicia:
| | | |
| Department | | Manager |
| Internal Audit | | Omar Severini |
| Institutional Affairs and Press Department | | Diego Francisco Videla |
| Anti-money Laundering Unit | | Claudia Estecho |
Internal Audit Department: This department is responsible for assessing and monitoring the effectiveness of internal control systems with the purpose of ensuring compliance with applicable laws and regulations.
Institutional Affairs and Press Department: This department is responsible for managing and controlling press and institutional image promotion activities, providing advice to the different areas.
Anti-money Laundering Unit: This unit is responsible for monitoring and detecting unusual possible operations to assure compliance with the Control and Prevention of Money Laundering regulations.
The following are the biographies of Banco Galicia’s CEO and the senior executive officers mentioned above and not provided in the sections “—Board of Directors of Banco Galicia” or “—Our Board of Directors” above.
Daniel Antonio Llambías: Mr. Llambías was born on February 8, 1947. He obtained a degree in national public accounting at the Universidad de Buenos Aires. He has been associated with the Issuer since 1964. He was elected as an alternate director of the Issuer in September 1997 and as a director in September 2001 until August 2009, when he was appointed chief executive officer of the Issuer. Mr. Llambías is also the chairman of Sudamericana Holding S.A., the vice chairman of Visa Argentina S.A. and Tarjetas del Mar S.A., a director of Tarjeta Naranja S.A., Tarjetas Regionales S.A., Tarjetas Cuyanas S.A., IDEA and Fincas de La Juanita S.A., as well as a member of the supervisory committee of Automóvil Club Argentino, and an alternate trustee of the Fundación.
Juan H. Sarquís:Mr. Sarquís was born on June 23, 1957. He obtained a degree in economics at the Universidad Católica Argentina. He has been associated with Banco Galicia since 1982. Mr. Sarquis is also a director of Sudamericana Holding S.A. and Banelco S.A., an alternate director of Visa Argentina S.A., Banelsip S.A., Tarjetas Regionales S.A., Tarjeta Naranja S.A., Tarjetas del Mar S.A. and Tarjetas Cuyanas S.A.
-160-
Gastón Bourdieu: Mr. Bourdieu was born on August 31, 1956. He obtained a degree in agricultural administration at UADE University. He has been associated with Banco Galicia since 1981 as a member of the young professional program in the Credit Division. He is also a director of Galicia Warrants.
Pablo M. Leon: Mr. Leon was born on August 31, 1964. He obtained a degree in finance at the Universidad de Palermo and two PDF (Programs for Executive Development) at IAE (Instituto Argentino de Empresas) and IMD, Lausanne, Switzerland. He has been associated with Banco Galicia since 1987. He is also the chairman of Galicia Valores and director of Argenclear S.A.
Juan Carlos L’Afflitto: Mr. L’Afflitto was born on September 15, 1958. He received a degree in national public accounting at the Universidad de Buenos Aires. He has been associated with Banco Galicia since 1986. Prior to such time, he worked at Morgan, Benedit y Asociados, where he acted as an advisor and accountant. He was a professor at the Universidad Católica Argentina until 1990.
Marcelo Poncini: Mr. Poncini was born on November 11, 1961. He obtained a degree in business administration at the Universidad de Morón. He has been associated with Banco Galicia since 1987.
Miguel Angel Peña:Mr. Peña was born on January 22, 1962. He obtained a degree in information systems from the Universidad Nacional Tecnológica. He has been associated with Banco Galicia since 1994. Mr. Peña is director of Tarjeta Naranja S.A. He is also a voting member of the ONG-Usuaria (Asociación Argentina de Usuarios de la Informática y las Comunicaciones).
Rafael Pablo Bergés:Mr. Bergés was born on Septembre 10, 1963. He obtained de degree in industrial ingeneering. He has been asociate with Banco Galicia since August 2010. Prior to sucha time, he worked at Techint and at a several muntinational companies in managerial positions. From 1998 to 2009 he was vice president in the Human Resources Division of Grupo Telefónica.
Raúl Héctor Seoane: See “Board of Directors of Banco Galicia".
María Elena Casasnovas: Mrs. Casasnovas was born on May 10, 1951. She obtained a degree in law at the Pontificia Universidad Católica Santa María de los Buenos Aires. She has been associated with Banco Galicia since 1972.
Nicolás Dujovne: Mr. Dujovne was born on May 18, 1967. He received a degree in economics at the Universidad de Buenos Aires and a master’s degree in Economics at the Universidad Torcuato Di Tella. He has been associated with Banco Galicia since 1997. Prior to such time, he worked at Citibank Argentina, Alpha and Macroeconómica. In 1998, he served as the chief of advisors to the Secretary of the Argentine Treasury and, in 2000, as the representative of the Argentine Ministry of Economy at the Argentine Central Bank’s board of directors. He also worked as a consultant for The World Bank. In 2001, he returned to Banco Galicia as the Chief Economist.
Omar Severini:Mr. Severini was born on July 30, 1958. He obtained a degree in national public accounting from the Universidad de Belgrano. He has been associated with Banco Galicia since 1978.
Diego Francisco Videla:Mr. Videla was born on November 7, 1947. He has been associated with Banco Galicia since 1997. Prior to such time, he acted as an advisor in the privatization of Banco de la Provincia de Misiones S.A. Mr. Videla is a voting member of the Fundación Policía Federal Argentina and a secretary of Fundación Escuela de Guerra Naval Argentina.
Claudia Raquel Estecho:Mrs. Estecho was born on September 24, 1957. She obtained a degree in public accounting at the Universidad de Buenos Aires. She has been associated with Banco Galicia since 1976.
-161-
Banco Galicia’s Supervisory Committee
Banco Galicia’s bylaws provide for a Supervisory Committee consisting of three syndics and three alternate syndics. Pursuant to Argentine law and to the provisions of Banco Galicia’s bylaws, Banco Galicia’s syndics and alternate syndics are responsible of ensuring that all of Banco Galicia’s actions are in accordance with applicable Argentine law. Syndics and alternate syndics do not participate in business management and cannot have managerial functions of any type. Syndics are responsible for, among other things, the preparation of a report to the shareholders analyzing Banco Galicia’s financial statements for each year and the recommendation to the shareholders as to whether to approve such financial statements. Syndics and alternate syndics are elected at the ordinary shareholders’ meeting for a one-year term and they can be re-elected. Alternate syndics act in the temporary or permanent absence of a syndic.
The table below shows the composition of Banco Galicia’s Supervisory Committee as they were re-elected by the annual shareholders’ meeting held on April 14, 2010.
| | | | | | | | | | | |
| | | Year of | | | | | Principal | | |
| Name | | Appointment | | | Position | | Occupation | | Current Term Ends |
| Enrique M. Garda Olaciregui | | 2011 | | | Syndic | | Lawyer | | December 31, 2011 |
| Norberto D. Corizzo | | 2011 | | | Syndic | | Accountant | | December 31, 2011 |
| Luis A. Díaz | | 2011 | | | Syndic | | Accountant | | December 31, 2011 |
| Fernando Noetinger | | 2011 | | | Alternate Syndic | | Lawyer | | December 31, 2011 |
| Miguel N. Armando | | 2011 | | | Alternate Syndic | | Lawyer | | December 31, 2011 |
| Ricardo A. Bertoglio | | 2011 | | | Alternate Syndic | | Accountant | | December 31, 2011 |
For the biographies of Messrs. Enrique M. Garda Olaciregui, Norberto D. Corizzo, Luis A. Díaz, Fernando Noetinger and Miguel N. Armando, see “-Our Supervisory Committee”.
Ricardo Adolfo Bertoglio: Mr. Bertoglio obtained a degree in national public accounting at the Universidad de Buenos Aires. He has been associated with Banco Galicia since 2002. He was elected as a syndic in June 2002 and served as a syndic until April 2006, at which time he was elected as an alternate syndic.
Compensation of Banco Galicia’s Directors and Officers
Banco Galicia’s board of directors establishes the policy for compensation of Banco Galicia’s personnel. Banco Galicia’s managers receive a fixed compensation and they may receive a variable compensation, based on their performance. Five directors and an alternate director are employees of Banco Galicia and, therefore, receive a fixed compensation and may also receive a variable compensation based on their performance, provided that these additional payments do not exceed the standard levels of similar entities in the Argentine financial market, a provision that is applicable to managers as well. The compensation regime includes the possibility of acquiring a retirement insurance policy. Banco Galicia does not maintain stock-option plans or pension plans or any other retirement plans for the benefit of its directors and managers. Banco Galicia does not have a policy establishing any termination benefits for its directors.
For fiscal year 2010, Banco Galicia’s ordinary shareholders’meeting held on April 27, 2011, approved compensation for the independent directors in the total amount of Ps.0.73 million.
During 2010, provisions were established to cover the variable compensation of Banco Galicia’s board of directors and managers for the fiscal year. In January 2010, Banco Galicia’s board of directors decided to pay the variable compensation corresponding to fiscal year 2009, based on the compensation for similar or equivalent positions in the market, in recognition of the performance and professional development of the respective beneficiaries during said fiscal year. In March 2011, Banco Galicia’s board of directors decided to pay a variable compensation to certain employees of Banco Galicia for the fiscal year 2010, based on the compensation for similar or equal job positions in the labor market, in recognition of the performance and professional development of the respective beneficiaries during fiscal year 2010.
-162-
Employees
The following table shows the composition of our staff:
| | | | | | | | | | | | | |
| | | As of December 31, | |
| | | 2010 | | | 2009 | | | 2008 | |
Grupo Financiero Galicia S.A. | | | 13 | | | | 10 | | | | 9 | |
Banco de Galicia y Buenos Aires S.A. | | | 5,185 | | | | 5,028 | | | | 5,324 | |
| Branches | | | 2,685 | | | | 2,636 | | | | 2,888 | |
| Head Office | | | 2,500 | | | | 2,392 | | | | 2,436 | |
Galicia Uruguay | | | 7 | | | | 8 | | | | 10 | |
Regional Credit-Card Companies | | | 4,699 | | | | 3,936 | | | | 3,898 | |
CFA | | | 1,160 | | | | — | | | | — | |
Sudamericana Consolidated | | | 126 | | | | 116 | | | | 105 | |
Other Subsidiaries | | | 48 | | | | 44 | | | | 62 | |
| | | | | | | | | | |
Total | | | 11,238 | | | | 9.142 | | | | 9,408 | |
| | | | | | | | | | |
Within the current legal framework, membership in an employee union is voluntary and there is only one union of bank employees with national representation. As of December 31, 2010, approximately 14% of Banco Galicia’s employees were affiliated with the national bank employee union. The employees of the Regional Credit Card Companies are affiliated with the national commerce employee union, in a percentage that ranged from 1.5% to 8.8%, depending on the company, as of December 31, 2010. During the first four months of 2010, 2009 and 2008, the bank employee union and the national commerce employee union renegotiated their respective collective labor agreements in order to establish new minimum wages. As a result, between March and April of each year, salary increases were granted. Banco Galicia has not experienced a strike by its employees since 1973 and the Regional Credit Card Companies have never experienced any strike event. We believe that our relationship with our employees has developed within normal and satisfactory parameters.
We have a human resources policy that aims at providing our employees possibilities for growth and personal and socio-economic achievement. We will continue our current policy of monitoring both wage levels and labor conditions in the financial industry in order to be competitive. Our employees receive fixed compensation and may receive variable compensation according to their level of achievement. We do not maintain any profit-sharing programs for our employees.
The Fundación Banco de Galicia y Buenos Aires (the “Fundación”) is an Argentine non-profit organization that provides various services to Banco Galicia employees. The various activities of the Fundación include, among others, managing the medical services of Banco Galicia employees and their families, purchasing school materials for the children of Banco Galicia’s employees and making donations to hospitals and other charitable causes, including cultural events. The Fundación is managed by a Council, certain members and alternate members of which are members of our Board of Directors and supervisory committee. Members and alternate members of the Council do not receive remuneration for their services as trustees.
Nasdaq Corporate Governance Standards
Pursuant to Nasdaq Marketplace Rule 5615(a) (3), a foreign private issuer may follow home country corporate governance practices in lieu of the requirements of the Rule 5600 Series, provided that the foreign private issuer complies with certain sections of the Rule 5000 Series, discloses each requirement that it does not follow and describes the home relevant country practice followed in lieu of such requirement. The requirements of the Rule 5000 Series and the Argentine corporate governance practice that we follow in lieu thereof are described below:
| | (i) | | Rule 5250 (d) — Distribution of Annual and Interim Reports. In lieu of the requirements of Rule 5250 (d), we follow Argentine law, which requires that companies make public a Spanish language annual report, including annual audited consolidated financial statements, by filing such annual report with the CNV and the BASE, within 70 calendar days of the end of the company’s fiscal year. Interim reports must be filed with the CNV and the BASE within 42 calendar days of the end of each fiscal quarter. The BASE publishes the annual reports and interim reports in the BASE bulletin and makes the bulletin available for inspection at its offices. In addition, our shareholders can receive copies of our annual reports and any interim reports upon such shareholders’ request. English language translations of our annual reports and interim reports are furnished to the SEC. We also post the English language translation of our annual reports and quarterly press releases on our website. Furthermore, under the terms of the Second Amended and Restated Deposit Agreement, dated as of June 22, 2000, among us, The Bank of New York, as depositary, and owners of ADSs issued thereunder, we are required to furnish The Bank of New York with, among other things, English language translations of our annual reports and each of our |
-163-
| | | | quarterly press releases. Annual reports and quarterly press releases are available for inspection by ADRs holders at the offices of The Bank of New York located at, 101 Barclay Street, New York, New York. Finally, Argentine law requires that 20 calendar days before the date of a shareholders’ meeting, the board of directors must provide to the shareholders, at the company’s executive office or through electronic means, all information relevant to the shareholders’ meeting, including copies of any documents to be considered by the shareholders (which includes the annual report), as well as proposals of the company’s board of directors. |
| | (ii) | | Rule 5605 (b) (1) — Majority of Independent Directors. In lieu of the requirements of Rule 5605 (b) (1), we follow Argentine law, which does not require that a majority of the board of directors be comprised of independent directors. Argentine law instead requires that public companies in Argentina such as us must have a sufficient number of independent directors to be able to form an audit committee of at least three members, the majority of which must be independent pursuant to the criteria established by the CNV. In addition, because we are a “controlled company” as defined in Rule 5615 (c) (1), we are relying on the exemption provided thereby for purposes of complying with Rule 5615 (c) (2). |
| | (iii) | | Rule 5605 (b) (2) — Executive Sessions of Independent Directors. In lieu of the requirements of Rule 5605 (b) (2), we follow Argentine law which does not require independent directors to hold regularly scheduled meetings at which only such independent directors are present (i.e., executive sessions). Our Board of Directors as a whole is responsible for monitoring our affairs. In addition, under Argentine law, the board of directors may approve the delegation of specific responsibilities to designated directors or non-director managers of the company. Also, it is mandatory for public companies to form a supervisory committee (composed ofsyndics), which is responsible for monitoring the legality of the company’s actions under Argentine law and the conformity thereof with its by-laws. Finally, our audit committee has regularly scheduled meetings and, as such, such meetings will serve a substantially similar purpose as executive sessions. |
| | (iv) | | Rule 5605 (d) — Compensation of Officers. In lieu of the requirements of Rule 5605 (d), we follow Argentine law, which does not require companies to form a compensation committee comprised solely of independent directors. It also is not required in Argentine law that the compensation of the chief executive officer and all other executive officers be determined by either a majority of the independent directors or a compensation committee comprised solely of independent directors. Under Argentine law, the board of directors is the corporate body responsible for determining the compensation of the chief executive officer and all other executive officers, so long as they are not directors. In addition, under Argentine law, the audit committee shall give its opinion about the reasonableness of management’s proposals on fees and option plans for directors or managers of the company. Finally, because we are a “controlled company” as defined in Rule 5615 (c) (1), we are relying on the exemption provided thereby for purposes of complying with Rule 5615 (c) (2). |
| | (v) | | Rule 5605 (e) (1) — Nomination of Directors. In lieu of the requirements of Rule 5605 (e) (1), we follow Argentine law which requires that directors be nominated directly by the shareholders at the shareholders’ meeting and that they be selected and recommended by the shareholders themselves. Under Argentine law, it is the responsibility of the ordinary shareholders’ meeting to appoint and remove directors and to set their compensation. In addition, because we are a “controlled company” as defined in Rule 5615 (c) (1), we are relying on the exemption provided thereby for purposes of complying with Rule 5615 (c) (2). |
| | (vi) | | Rule 5605 (c) (1) — Audit Committee Charter. In lieu of the requirements of Rule 5605 (c) (1), we follow Argentine law, which requires that audit committees have a charter but does not require that companies certify as to the adoption of the charter nor does it require an annual review and assessment thereof. Argentine law instead requires that companies prepare a proposed plan or course of action with respect to those matters, which are the responsibility of the company’s audit committee. Such plan or course of action could, at the discretion of our audit committee, include a review and assessment of the audit committee charter. |
-164-
| | (vii) | | Rule 5605 (c) (2) — Audit Committee Composition. Argentine law does not require, and it is equally not customary business practice in Argentina, that companies have an audit committee comprised solely of independent directors. Argentine law instead requires that companies establish an audit committee with at least three members comprised of a majority of independent directors as defined by Argentine law. Nonetheless, although not required by Argentine law, we have a three member audit committee comprised of entirely independent directors, as independence is defined in Rule 10 A-3 (b) (1), one of which the Board of Directors has determined to be an audit committee financial expert. In addition, we have a supervisory committee (“comisión fiscalizadora”) composed of three syndics, which are in charge of monitoring the legality, under Argentine law, of the actions of our board of directors and the conformity of such actions with our by-laws. |
| | (viii) | | Rule 5620 (c) — Quorum. In lieu of the requirements of Rule 5620 (c), we follow Argentine law and our bylaws, which distinguish between ordinary meetings and extraordinary meetings and require, in connection with ordinary meetings, that a quorum consist of a majority of stock entitled to vote. If no quorum is present at the first meeting, a second meeting may be called at which the shareholders present, whatever their number, constitute a quorum and resolutions may be adopted by an absolute majority of the votes present. Argentine law and our bylaws require, in connection with extraordinary meetings, that a quorum consist of 60% of the stock entitled to vote. However, if such quorum is not present at the first meeting, our bylaws provide that a second meeting may be called which may be held with the number of shareholders present. In both ordinary and extraordinary meetings, decisions are adopted by an absolute majority of votes present at the meeting, except for certain fundamental matters (such as mergers and spin-offs (when we are not the surviving entity and the surviving entity is not listed on any stock exchange), anticipated liquidation, a change in our domicile to outside of Argentina, total or partial recapitalization of our statutory capital following a loss, any transformation in our corporate legal form or a substantial change in our corporate purpose) which require an approval by vote of the majority of all the stock entitled to vote (all stock being entitled to only one vote). |
| | (ix) | | Rule 5620 (b) — Solicitation of Proxies. In lieu of the requirements of Rule 5620 (b), we follow Argentine law which requires that notices of shareholders’ meetings be published, for five consecutive days, in the Official Gazette and in a widely circulated newspaper in Argentina no earlier than 45 calendar days prior to the meeting and at least 20 calendar days prior to such meeting. In order to attend a meeting and be listed on the meeting registry, shareholders are required to submit evidence of their book-entry share account held at Caja de Valores S.A. (“Caja de Valores”) up to three business days prior to the scheduled meeting date. If entitled to attend the meeting, a shareholder may be represented by proxy (properly executed and delivered with a certified signature) granted to any other person, with the exception of a director, syndic, member of the surveillance committee (“consejo de vigilancia”), manager or employee of the issuer, which are prohibited by Argentine law from acting as proxies. In addition, our ADRs holders receive, prior to the shareholders’ meeting, a notice listing the matters on the agenda, a copy of the annual report and a voting card. |
| | (x) | | Rule 5630 (a) — Conflicts of Interest. In lieu of the requirements of Rule 5630 (a), we follow Argentine law which requires that related party transactions be approved by the audit committee when the transaction exceeds one percent (1%) of the corporation’s net worth, measured pursuant to the last audited balance sheet, so long as the relevant transaction exceeds the equivalent of three hundred thousand Argentine Pesos (Ps.300,000). Directors can contract with the corporation only on terms consistent with prevailing market terms. If the contract is not in accordance with prevailing market terms, such transaction must be pre-approved by the board of directors (excluding the interested director). In addition, under Argentine law, a shareholder is required to abstain from voting on a business transaction in which its interests may be in conflict with the interests of the company. In the event such shareholder votes on such business transaction and such business transaction would not have been approved without such shareholders’ vote, such shareholder may be liable to the company for damages and the resolution may be declared void. |
Other than as noted above, we are in full compliance with all other applicable Nasdaq corporate governance standards.
-165-
Share Ownership
For information on the share ownership of our directors and executive officers as of December 31, 2010, see Item 7. “Major Shareholders and Related Party Transactions-Major Shareholders”.
| | |
| Item 7. | | Major Shareholders and Related Party Transactions |
Major Shareholders
As of April 30, 2011, our capital structure was made up of class A shares, each of which is entitled to five votes and class B shares, each of which is entitled to one vote. As of April 30, 2011, we had 1,241,407,017 shares outstanding composed of 281,221,650 class A shares and 960,185,367 class B shares (397,228,430 of which were evidenced by 39,722,843 ADSs).
Our controlling shareholders are members of the Escasany, Ayerza and Braun families and the Fundación. As of April 30, 2011, the controlling shareholders owned 100% of our class A shares through EBA Holding (representing 22.65% of our total outstanding shares) and 13.99% of our class B shares (or 10.82% of our total outstanding shares), therefore directly and indirectly owning 33.47% of our shares and 65.09% of total votes.
Based on information that is available to us, the table below sets forth, as of April 30, 2011, the number of our class A and class B shares held by holders of more than 5% of each class of shares, the percentage of each class of shares held by such holder, and the percentage of votes that each class of shares represent as a percentage of our total possible votes.
Class A Shares
| | | | | | | | | | | |
| Name | | Class A Shares | | % of Class A Shares | | | % of Total Votes | |
| EBA Holding S.A. | | 281,221,650 class A shares | | | 100 | | | | 59.4 | |
Class B Shares
| | | | | | | | | | | |
| Name | | Class B Shares | | % of Class B Shares | | | % of Total Votes | |
The Bank of New York (1) | | 397,228,430 class B shares | | | 41.4 | | | | 16.8 | |
ANSES(2) | | 253,745,743 class B shares | | | 26.4 | | | | 10.7 | |
EBA Holding Shareholders (3) | | 134,284,871 class B shares | | | 14.0 | | | | 5.7 | |
Carmignac Gestión (4) | | 86,020,000 class B shares | | | 9.0 | | | | 3.6 | |
| | | |
| (1) | | Pursuant to the requirements of Argentine law, all class B shares represented by ADSs are owned of record by The Bank of New York, as Depositary. The address for the Bank of New York is 101 Barclay Street, New York 10286, and the country of organization is the United States. |
| |
| (2) | | ANSES’ holding is obtained through information supplied by Caja de Valores and information gathered from the ANSES. Said holding includes 46,521,340 shares in ADSs. |
| |
| (3) | | No member holds more than 2.0% of the capital stock. Said holding includes 37,036,150 shares in the form of ADSs. |
| |
| (4) | | Information is based on available public information dated March 31, 2011. The address for Carmignac Gestion S.A. is 34 place Vendome 75001, Paris, France. |
Based on information that is available to us, the table below sets forth, as of April 30, 2011, the shareholders that either directly or indirectly have more than 5% of our votes or shares.
| | | | | | | | | | | | | |
| Name | | Shares | | % of Shares | | % of Total Votes | |
| The Bank of New York | | 397,228,430 class B shares | | | 32.0 | | | | 16.8 | |
| EBA Holding S.A. | | 281,221,650 class A shares | | | 22.7 | | | | 59.4 | |
| ANSES | | 253,745,743 class B shares | | | 20.4 | | | | 10.7 | |
| EBA Holding Shareholders | | 134,284,871 class B shares | | | 10.8 | | | | 5.7 | |
Carmignac Gestión(1) | | 86,020,000 class B shares | | | 6.9 | | | | 3.6 | |
| | | |
| (1) | | Information is based on available public information dated March 31, 2011. |
-166-
Members of the three controlling families have owned the majority of the issued share capital of Banco Galicia since 1959. Members of the Escasany family have been on the board of directors of Banco Galicia since 1923. The Ayerza and Braun families have been represented on Banco Galicia’s board of directors since 1943 and 1947, respectively. Currently, there is one member of these families on Banco Galicia’s board of directors and five members of these families on our Board of Directors. In addition, there is one alternate director on our Board of Directors that is member of the controlling families.
On September 13, 1999, the controlling shareholders of Banco Galicia formed EBA Holding S.A., an Argentine corporation, which is 100% owned by our controlling shareholders. EBA Holding holds 100% of our class A shares.
Currently, EBA Holding only has class A shares outstanding. EBA Holding’s bylaws provide for certain restrictions on the sale or transfer of its class A shares. While the class A shares of EBA Holding may be transferred to any other class A shareholder of EBA Holding, any transfer of such class A shares to third parties would automatically result in the conversion of the sold shares into class B shares of EBA Holding having one vote per share. In addition, EBA Holding’s bylaws contain rights of first refusal, buy-sell provisions and tag-along rights.
A public shareholder of Banco Galicia, who indirectly owns approximately 4.5% of the outstanding capital stock of Banco Galicia, has granted a right of first refusal for the purchase of all or part of its shares to certain of our controlling shareholders in the event such public shareholder decides to sell all or part of its Banco Galicia shares.
As of December 31, 2010, we had 81 identified United States record shareholders (not considering The Bank of New York), of which 13 held our class B shares and 68 held our ADSs. Such United States holders, in the aggregate, held approximately 122.3 million of our class B shares, representing approximately 9.8% of our total outstanding capital stock as of said date.
Related Party Transactions
Other than as set forth below, Grupo Financiero Galicia and its non-banking subsidiaries are not a party to any transactions with, and have not made any loans to any (i) enterprises that directly or indirectly through one or more intermediaries, control or are controlled by Grupo Financiero Galicia or its non-banking subsidiaries, (ii) associates (i.e. an unconsolidated enterprise in which Grupo Financiero Galicia or its non-banking subsidiaries has a significant influence or which has significant influence over Grupo Financiero Galicia or its non-banking subsidiaries), (iii) individuals owning, directly or indirectly, an interest in the voting power of Grupo Financiero Galicia or its non-banking subsidiaries that gives them significant influence over Grupo Financiero Galicia or its non-banking subsidiaries, as applicable, and close members of any such individual’s family (i.e. those family members that may be expected to influence, or be influenced by, that person in their dealings with Grupo Financiero Galicia or its non-banking subsidiaries, as applicable), (iv) key management personnel (i.e. persons that have authority and responsibility for planning, directing and controlling the activities of Grupo Financiero Galicia or its non-banking subsidiaries, including directors and senior management of companies and close members of such individual’s family) or (v) enterprises in which a substantial interest is owned, directly or indirectly, by any person described in (iii) or (iv) over which such a person is able to exercise significant influence nor are there any proposed transactions with such persons. For purposes of this paragraph, this includes enterprises owned by directors or major shareholders of Grupo Financiero Galicia or its non-banking subsidiaries that have a member of key management in common with Grupo Financiero Galicia or its non-banking subsidiaries, as applicable. In addition, “significant influence” means the power to participate in the financial and operating policy decisions of the enterprise but means less than control. Shareholders beneficially owning a 10% interest in the voting power of Grupo Financiero Galicia or its non-banking subsidiaries are presumed to have a significant influence on Grupo Financiero Galicia or its non-banking subsidiaries, as applicable.
-167-
Grupo Financiero Galicia has granted working capital loans to the following entities that it directly or indirectly controls:
| | | | | | | | | | | | | | | | | | | | | |
| | | | | | | | | | | | | | | Outstanding amount | |
| Entity | | Granted in | | | Rate | | | Original Amount | | | December 31, 2010 | | | December 31, 2009 | |
| | | | | | | % | | | | | | | (in millions of Pesos) | |
| Net Investment S.A. | | Nov/Apr 2009 | | | | 0.0 | | | Ps. | 0.20 | | | Ps. | 0 | | | Ps. | 0.20 | |
| GV Mandataria de Valores S.A. | | Nov/Sep 2009 | | | | 0.0 | | | Ps. | 0.57 | | | Ps. | 0 | | | Ps. | 0.76 | |
Some of our directors and the directors of Banco Galicia have been involved in certain credit transactions with Banco Galicia as permitted by Argentine law. The Corporations’ Law and the Argentine Central Bank’s regulations allow directors of a limited liability company to enter into a transaction with such company if such transaction follows prevailing market conditions. Additionally, a bank’s total financial exposure to related individuals or legal entities is subject to the regulations of the Argentine Central Bank. Such regulations set limits on the amount of financial exposure that can be extended by a bank to affiliates based on, among other things, a percentage of a bank’s RPC. See Item 4. “Information on the Company-Argentine Banking Regulation-Lending Limits”.
Banco Galicia is required by the Argentine Central Bank to present to its board of directors, on a monthly basis, the outstanding amounts of financial assistance granted to directors, controlling shareholders, officers and other related entities, which are transcribed in the minute books of the board of directors of Banco Galicia. The Argentine Central Bank establishes that the financial assistance to directors, controlling shareholders, officers and other related entities must be granted on an equal basis with respect to rates, tenor and guarantees as loans granted to the general public.
In this section “total financial exposure” comprises equity interests and financial assistance (all credit related items such as loans, holdings of corporate debt securities without quotation, guarantees granted and unused balances of loans granted, among others), as this term is defined in “Item 4. Information on the Company-Argentine Banking Regulation-Lending Limits”.
“Related parties” refers to our directors and the directors of Banco Galicia, our senior officers and senior officers of Banco Galicia, our syndics and Banco Galicia’s syndics, our controlling shareholders as well as all individuals who are related to them by a family relationship of up to the second degree by blood and/or first degree by marriage and any entities directly or indirectly affiliated with any of these parties, not required to be consolidated.
The following table presents the aggregate amounts of total financial exposure of Banco Galicia to related parties, the number of recipients, the average amounts and the single largest exposures as of the end of the three fiscal years ended December 31, 2010 and as of April 30, 2011, the last date for which information is available.
| | | | | | | | | | | | | | | | | |
| | | April 30, 2011 | | | December 31, 2010 | | | December 31, 2009 | | | December 31, 2008 | |
| | | In millions of Pesos, except as noted | |
| Aggregate Total Financial Exposure | | Ps. | 111 | | | Ps. | 126.1 | | | Ps. | 76.0 | | | Ps. | 74.9 | |
| Number of Recipient Related Parties | | | 231 | | | | 230 | | | | 219 | | | | 221 | |
| Individuals | | | 177 | | | | 175 | | | | 172 | | | | 174 | |
| Companies | | | 54 | | | | 55 | | | | 47 | | | | 47 | |
| Average Total Financial Exposure | | Ps. | 0.5 | | | Ps. | 0.5 | | | Ps. | 0.3 | | | Ps. | 0.3 | |
| Single Largest Exposure | | Ps. | 25.1 | | | Ps. | 39 | | | Ps. | 18.9 | | | Ps. | 30.5 | |
The financial assistance granted to our directors, officers and related parties by Banco Galicia, including the financial assistance that was restructured, was granted in the ordinary course of business, on substantially the same terms, including interest rates and collateral, as those prevailing at the time for comparable transactions with other non-related parties, and did not involve more than the normal risk of collectibility or present other unfavorable features.
Banco Galicia and Grupo Financiero Galicia have executed a trademark license agreement under which Banco Galicia has authorized Grupo Financiero Galicia to use the word “Galicia” in our corporate name and has authorized our direct or indirect subsidiaries, other than those of Banco Galicia, to use in their corporate names Banco Galicia’s registered trademarks, including the word “Galicia”, in marketing their products and services. The trademark license agreement has a 10-year term until July 1, 2010, at which point it becomes automatically renewable every two years. This agreement provides for the payment of an annual royalty, which in 2010 amounted to Ps.1.3 million.
-168-
| | |
| Item 8. | | Financial Information |
We have elected to provide the financial information set forth in Item 18 of this annual report.
Legal Proceedings
We are a party to the following legal proceedings:
Banco Galicia
In response to certain pending legal proceedings, Banco Galicia has made allowances to cover (i) various types of claims filed by customers against it (e.g., claims for thefts from safe deposit boxes, collections of checks that had been fraudulently altered, discrepancies related to deposit and payment services rendered to Banco Galicia’s customers, etc.) and (ii) estimated amounts payable under labor-related lawsuits filed against Banco Galicia by former employees.
In connection with the application by financial institutions of emergency measures implemented by the executive branch of the Government during and in respect of the 2001-2002 economic crisis, which mandated the Asymmetric Pesification of deposits originally denominated in Dollars and the restructuring of such deposits, in 2002 individuals and institutions initiated a significant number of legal actions known asamparo claimsagainst financial institutions, including Banco Galicia, on the basis that these measures violated their constitutional and other rights. These legal actions have resulted in losses for financial institutions, including Banco Galicia, as a result of court orders mandating the reimbursement of restructured deposits at values greater than those established by the emergency measures.
The Argentine Central Bank issued regulations allowing for the deferral and amortization of such losses, but the Government did not provide for any compensation for such losses to financial institutions; the Argentine Supreme Court has issued rulings with respect to Asymmetric Pesification, and varying conclusions can be drawn from these rulings. Banco Galicia has repeatedly reserved its right to make claims with respect to the negative effect that pesification has had on its results of operations. The method of accounting for such right as a deferred loss, as established by Argentine Central Bank regulations, does not affect a given right’s existence or legitimacy. On December 30, 2003, Banco Galicia formally requested of the executive branch of the Government, with a copy of such request to both the Argentine Ministry of Economy and the Argentine Central Bank, the payment of due compensation for the losses incurred by Banco Galicia caused by Asymmetric Pesification. Banco Galicia has reserved its right to further extend such request in order to encompass losses that may be incurred due to new court judgments.
As of the date of this annual report, provincial tax collection authorities, as well as tax collection authorities from the Autonomous City of Buenos Aires, are in the process (at various stages of completion) of conducting audits related to taxes on gross income corresponding to fiscal year 2002, mainly regarding the Argentine Compensatory Bond. Banco Galicia has been expressing its disagreement regarding these adjustments through corresponding administrative and/or legal proceedings. These proceedings and their possible effects are constantly being monitored by the management of Banco Galicia. Even though the foregoing has not yet been finally resolved, Banco Galicia believes it has complied with its tax liabilities in full pursuant to current regulations and has provisioned the amounts considered adequate according to the different stages of each process.
In addition, Theseus S.A. and Lagarcué S.A., two minority shareholders of Banco de Galicia y Buenos Aires S.A., initiated legal proceedings on March 11, 2003 against Banco Galicia requesting that the court “declare null the corporate legal action effected by Grupo Financiero Galicia with the cooperation of Banco Galicia pursuant to which there was an exchange of class B shares of Banco Galicia for class B shares of Grupo Financiero Galicia.” Banco Galicia and Grupo Financiero Galicia have answered the claim, arguing that the transaction complied with applicable legal requirements. The plaintiff in these civil proceedings has petitioned the court, pursuant to the provisions of Article 1101 of the Argentine Civil Code, for suspension of such proceedings until final sentencing takes place in the related, and currently pending, criminal proceedings. The judge presiding over the civil proceedings granted this request; Banco Galicia subsequntly appealed this decision. These civil proceedings are currently before the Argentine Business Court (Cámara Argentina de Comercio), pending resolution of Banco Galicia’s appeal.
-169-
The material effect that the lawsuit could have, if it were successful, which Banco Galicia considers unlikely, is not assessed in monetary terms, since such effects are not indicated in the lawsuit. Banco Galicia believes that the result of this lawsuit is unlikely to produce a significant adverse effect on its financial condition.
Regional Credit Card Companies
As of the date of this annual report, the Argentine Revenue Service (AFIP), the Revenue Board of the Province of Córdoba and the municipalities of the cities of Mendoza and San Luis are in the process of conducting audits in respect of the activities of certain of the credit card subsidiaries of Banco Galicia. Such entities have served notices and made claims regarding taxes applicable to the subsidiaries of Tarjetas Regionales S.A. Based on the opinions of their tax advisors, these companies believe that the above-mentioned claims are both legally and technically without merit and that taxes related to the claims have been correctly calculated in accordance with applicable tax regulations and case law. Therefore, these companies are taking the corresponding administrative and legal steps in order to resolve such issues.
Compañía Financiera Argentina
With respect to CFA, the company acquired by Banco Galicia in June 2010, the AFIP initiated two separate proceedings in which it questioned certain deductions made by CFA. CFA filed appeals before the federal tax courts, and these cases are still pending resolution.
In addition, two consumer groups have initiated class action suits against CFA. In the first class action, the claim is for the repayment of amounts paid by consumers for certain life insurance policies and the nullification of all outstanding life insurance policies issued by CFA. The second class action is on behalf of all customers holding credit, debit or purchase cards of CFA, and the claimants are seeking the return of a portion of interest paid and alleging that the CFA is a non-bank entity, despite being regulated by the Argentine Central Bank. These proceedings are currently before the federal courts, and are still pending resolution.
Dividend Policy and Dividends
Dividend Policy
Grupo Financiero Galicia’s policy for the distribution of dividends envisages, among other factors, the obligatory nature of establishing a legal reserve, the company’s financial condition and its indebtedness, the business requirements of affiliated companies and, mainly, that the profits recorded in the financial statements are, to a great extent, income from holdings and not realized and liquid profits, a requirement of Section 68 of the Corporations’ Law so that it is possible to distribute them as dividends. The proposal to distribute dividends arising from such analysis has to be approved at the shareholders’ meeting that discusses the Financial Statements corresponding to each fiscal year.
We may only declare and pay dividends out of our retained earnings representing the profit realized on our operations and investments. The Corporations’ Law and our bylaws state that no profits may be distributed until prior losses are covered. Dividends paid on our class A shares and class B shares will equal one another on a per share basis. As required by the Corporations’ Law, 5% of our net income is allocated to a legal reserve until the reserve equals 20% of our outstanding capital. Dividends may not be paid if the legal reserve has been impaired until it is fully restored. The legal reserve is not available for distribution to shareholders.
Our ability to pay dividends to our shareholders principally depends on (i) our net income (on a consolidated basis), (ii) availability of cash and (iii) applicable legal requirements.
-170-
Holders of our ADSs will be entitled to receive any dividends payable in respect of our underlying class B shares. We will pay cash dividends to the ADSs depositary in Pesos, although we reserve the right to pay cash dividends in any other currency, including Dollars. The ADSs deposit agreement provides that the depositary will convert cash dividends received by the ADSs depositary in Pesos to Dollars and, after deduction or upon payment of fees and expenses of the ADSs depositary and deduction of other amounts permitted to be deducted from such cash payments in accordance with the ADSs deposit agreement (such as for unpaid taxes by the ADSs holders in connection with personal asset taxes or otherwise), will make payment to holders of our ADSs in Dollars.
Argentine Central Bank regulations allowed the distribution of cash dividends by Banco Galicia.
By means of Communiqués “A” 4589 and “A” 4591, issued on October 29 and November 8, 2006, the Argentine Central Bank modified the criteria by which a financial institution determines if it can distribute profits. According to the new rules, profits can be distributed up to the positive amount resulting after deducting from retained earnings the reserves that may be legally and statutory required, as well as the following items: the difference between the book value and the market value of a financial institution’s portfolio of public-sector assets and/or debt issued by the Argentine Central Bank not marked-to-market, the amount of assets representing the losses from lawsuits related to deposits(amparos), and any adjustments required by the external auditors or the Argentine Central Bank not having been recognized. In addition, to be able to distribute profits, a financial institution must comply with the capital adequacy rule, with the minimum capital requirement and the regulatory capital calculated, only for the purpose of determining its ability to distribute profits, by deducting from its assets and retained earnings all the items mentioned in above, as well as the asset recorded in connection with the minimum presumed income tax and the amounts allocated to the repayment of long-term debt instruments computable as core capital pursuant to Communiqué “A” 4576. Likewise, in such calculation, a financial institution will not be able to compute any regulatory forbearance that the Argentine Central Bank may provide, affecting minimum capital requirements, RPC or a financial institution’s capital adequacy, and the amount of profits that it wishes to distribute.
In May 2010, the Argentine Central Bank modified the conditions necessary to pay dividends through Communiqué “A” 5072:
| | • | | Calculation of the distributable profits subtracting the net difference between the book value and the market price of the government debt. |
| | • | | Compliance with minimum capital requirements plus 30% after the payment of the dividend. |
| | • | | Compliance with minimum capital cash reserves after the payment of the dividend. |
Under the new rules, dividend distribution requires the prior authorization of the Argentine Central Bank, with such authorization having the purpose of verifying that the aforementioned requirements have been fulfilled.
Dividends
As a holding company, our principal source of cash from which to pay dividends on our shares is dividends or other intercompany transfers from our subsidiaries, primarily Banco Galicia. Due to the dividend restrictions contained in Banco Galicia’s loan agreements in connection with Banco Galicia’s foreign debt restructuring and in Argentine Central Bank regulations, our ability to distribute cash dividends to our shareholders has been materially and adversely affected since late 2001 until 2010.
Banco Galicia
At the close of the fiscal year ended December 31, 2010, Banco Galicia’s capital, non-capitalized contributions, profit reserves, adjustments to shareholders’ equity and retained earnings (not including the fiscal year’s net income) totaled Ps.2,126.5 million. Banco Galicia’s net income for fiscal year 2010 amounted to Ps.469.1 million. In addition to the retained earnings at the previous fiscal year end, of Ps.297.4 million, Banco Galicia’s total retained earnings amounted to Ps.766.6 million.
Taking into consideration the Argentine Central Bank rules regarding the distribution of profits, as explained above, Banco Galicia’s board of directors proposed at the shareholders’ meeting held on April 27, 2011, and such shareholders approved, the distribution of Ps.93.8 million to legal reserve and Ps.100.1 million to cash dividends (ordinary shares, 17.8% of Ps.562,326,651). The amount distributed was previously authorized by the Superintendency.
-171-
Grupo Financiero Galicia
Due to the fact that most of the profits for fiscal year correspond to income by holdings and just a fraction corresponds to the realized and liquid profits meeting the requirements to be distributed as per Section 68 of the Corporations’ Law, and taking as well into consideration Grupo Financiero Galicia’s financial condition and, particularly, the need to pay the outstanding foreign-currency denominated negotiable obligations issued, during the shareholders’ meeting our shareholders approved the payment of dividends in cash for the amount of Ps.24.8 million, which represents 2% with regard to 1,241,407,017 class “A” and “B” ordinary shares with a face value of Ps.1 each.
Pursuant to what is set forth in the last paragraph of the section incorporated by Act No. 25,585 after Section 25 of Act No. 23,966, as applicable, Grupo Financiero Galicia will be restored the amounts corresponding to the tax on personal assets it paid for fiscal year 2010 in its capacity as substitute taxpayer of the shareholders subject to the above-mentioned tax.
Significant Changes
Grupo Financiero Galicia
On April 27, 2011, our shareholders held a shareholders’ meeting during which they approved the payment of dividends in cash in the amount of Ps.24.8 million which represents 2% with regard to 1,241,407,017 class “A” and “B” ordinary shares with a face value of Ps.1 each.
In May 2011, Grupo Financiero Galicia repaid, upon maturity, the class I, series II negotiable obligations for US$10.6 million.
Banco Galicia
After the end of the fiscal year ended December 31, 2010, Banco Galicia made the decision to partially redeem the capitalized interest corresponding to its subordinated negotiable obligations due 2019 (5% annual interest, payable semiannually), which had accrued from January 1, 2004, to December 31, 2010, and was originally scheduled to be paid on January 1, 2014. The cash payment took place on February 22, 2011, and represented 41.30% of face value. In addition, this payment included the 11% annual interest accrued and unpaid from January 1, 2011 to February 21, 2011 on the amount being redeemed, equivalent to 0.64% of face value. After this payment, for a total principal amount of US$90.1 million, the outstanding principal amount of such subordinated negotiable obligations amounts to US$218.2 million.
During the shareholders’ meeting of Banco Galicia held on April 27, 2011, Banco Galicia’s shareholders approved the proposal of its board of directors in connection with the payment of a cash dividend for Ps.100.1 million. This proposal was previously authorized by the Superintendency, required by regulations in force established by the Argentine Central Bank. From said dividend, the personal asset tax corresponding to fiscal year 2010 will be withheld, at the appropriate time.
On May 4, 2011, Banco Galicia issued its class I negotiable obligations, within its global short-term, medium-term and/or long-term note program, for an outstanding face value at any time of up to US$342.5 million, or the equivalent amount in other currencies. The amount issued was US$300.0 million. The aggregate principal amount will mature on May 4, 2018. The notes will bear 8.75% interest per annum, which will be payable semi-annually, commencing on November 4, 2011.
Tarjetas Regionales
On January 28, 2011, Tarjeta Naranja S.A. issued US$200 million of 9.0% senior unsecured notes due 2017 pursuant to Rule 144A/Regulation S of the Securities Act of 1933. Tarjeta Naranja S.A. plans to use these funds for working capital and to finance its business expansion.
-172-
On April 15, 2011, Tarjetas Cuyanas issued its class IV negotiable obligations, within its global short-term, medium-term and/or long-term note program, for an outstanding face value of up to US$120.0 million, or the equivalent amount in other currencies. The aggregate principal amount issued of Ps.50 million will mature on January 10, 2012. The notes will bear a floating interest rate equal to the simple arithmetic average of the private BADLAR plus 2.85%, which will be payable on July 14, 2011, on October 12, 2011 and on January 10, 2012.
CFA
On January 27, 2011, the CNV approved an extension of CFA’s program for the issuance of ordinary short-, medium- or long-term, secured or unsecured, subordinated or non-subordinated, negotiable obligations and approved the increase of its maximum outstanding face value to up to US$250 million.
On March 28, 2011, CFA issued its class III negotiable obligations under its program. The amount issued of series I was Ps.56.0 million, and the aggregate amount will mature on December 23, 2011. The notes will bear floating interest rate equal to the simple arithmetic average of the private BADLAR plus 3.26%, which will be payable on June 26, 2011, September 24, 2011 and on the date of maturity.
The amount issued of series II was Ps.44.0 million, and will be amortized in three installments, on June 28, 2012 (33.33%), on September 28, 2012 (33.33%) and on December 28, 2012 (33.34%). The notes will bear a floating interest rate equal to the simple arithmetic average of the private BADLAR plus 4.08%, which will be payable quarterly, commencing on June 28, 2011 and until December 28, 2012.
On April 20, 2011, distribution of a cash dividend for Ps.55.6 million was approved at CFA’s shareholders’ meeting.
| | |
| Item 9. | | The Offer and Listing |
Shares and ADSs
Our class B shares are listed on the BASE and the Córdoba Stock Exchange under the symbol “GGAL”. Our ADSs, each representing ten class B shares, are listed on the Nasdaq Capital Market, under the symbol “GGAL”. Our ADSs have been listed on Nasdaq Capital Market since August 2002. Previously, our ADSs had been listed on the Nasdaq National Market since July 24, 2000.
On May 13, 2004, we issued 149 million preferred shares in connection with the restructuring of the foreign debt of Banco Galicia’s Head Office and its Cayman Branch. Under the terms and conditions of the restructuring, our preferred shares were automatically convertible into class B shares on May 13, 2005. Such conversion took place on May, 13, 2005. Our preferred shares were listed on the BASE and the Córdoba Stock Exchange under the symbol “GGAL” between May 13, 2004 and May 12, 2005.
The following tables present, for the periods indicated, the high and low closing prices and the average trading volume of our class B shares and preferred shares on the BASE as reported by the BASE and the high and low closing prices and the average trading volume of our ADSs on the Nasdaq as reported by the Nasdaq Capital Market. There has been low trading volume of our class B shares on the Córdoba Stock Exchange. The following prices have not been adjusted for any stock dividends and/or stock splits.
-173-
Grupo Financiero Galicia — Class B Shares—Buenos Aires Stock Exchange (in Pesos)
| | | | | | | | | | | | | |
| | | | | | | | | | | Average Daily Volume | |
| | | High | | | Low | | | (in thousands of Class B shares) | |
Calendar Year | | | | | | | | | | | | |
2006 | | | 2.86 | | | | 1.72 | | | | 2,045.3 | |
2007 | | | 3.37 | | | | 2.23 | | | | 1,924.8 | |
2008 | | | 2.36 | | | | 0.57 | | | | 3,549.4 | |
2009 | | | 2.30 | | | | 0.61 | | | | 2,471.5 | |
2010 | | | 6.69 | | | | 1.84 | | | | 2,341.3 | |
| | | | | | | | | | | | | |
Two Most Recent Fiscal Years | | | | | | | | | | | | |
2009 | | | | | | | | | | | | |
| First Quarter | | | 0.88 | | | | 0.61 | | | | 1,497.9 | |
| Second Quarter | | | 1.28 | | | | 0.70 | | | | 2,669.4 | |
| Third Quarter | | | 1.81 | | | | 1.26 | | | | 1,747.7 | |
| Fourth Quarter | | | 2.30 | | | | 1.76 | | | | 1,742.8 | |
2010 | | | | | | | | | | | | |
| First Quarter | | | 2.41 | | | | 1.84 | | | | 1,315.5 | |
| Second Quarter | | | 2.53 | | | | 2.02 | | | | 1,957.0 | |
| Third Quarter | | | 4.01 | | | | 2.29 | | | | 2,988.9 | |
| Fourth Quarter | | | 6.69 | | | | 3.91 | | | | 3,094.7 | |
2011 | | | | | | | | | | | | |
| First Quarter | | | 6.69 | | | | 5.23 | | | | 1,299.7 | |
| Second Quarter (through May 31, 2011) | | | 5.85 | | | | 5.15 | | | | 1,418.4 | |
| | | | | | | | | | | | | |
Most Recent Six Months | | | | | | | | | | | | |
| December 2010 | | | 6.69 | | | | 5.71 | | | | 2,117.0 | |
| January 2011 | | | 6.69 | | | | 6.10 | | | | 1,057.6 | |
| February 2011 | | | 6.62 | | | | 5.91 | | | | 1,467.9 | |
| March 2011 | | | 5.98 | | | | 5.23 | | | | 1,390.3 | |
| April 2011 | | | 5.85 | | | | 5.43 | | | | 1,574.4 | |
| May 2011 | | | 5.84 | | | | 5.15 | | | | 1,277.2 | |
As of June 15, 2011, the closing price of our class B shares was Ps.5.45.
Grupo Financiero Galicia — ADSs — Nasdaq Capital Market (in US$)
| | | | | | | | | | | | | |
| | | | | | | | | | | Average Daily Volume | |
| | | High | | | Low | | | (in thousands of ADRs) | |
Calendar Year | | | | | | | | | | | | |
2006 | | | 9.56 | | | | 5.61 | | | | 190.2 | |
2007 | | | 11.12 | | | | 6.98 | | | | 273.1 | |
2008 | | | 7.60 | | | | 1.45 | | | | 251.6 | |
2009 | | | 6.10 | | | | 1.56 | | | | 160,0 | |
2010 | | | 16.77 | | | | 4.72 | | | | 447.1 | |
| | | | | | | | | | | | | |
Two Most Recent Fiscal Years | | | | | | | | | | | | |
2009 | | | | | | | | | | | | |
| First Quarter | | | 2.42 | | | | 1.56 | | | | 100.9 | |
| Second Quarter | | | 3.28 | | | | 1.80 | | | | 191.1 | |
| Third Quarter | | | 4.71 | | | | 3.10 | | | | 163.0 | |
| Fourth Quarter | | | 6.10 | | | | 4.55 | | | | 187.7 | |
2010 | | | | | | | | | | | | |
| First Quarter | | | 6.20 | | | | 4.72 | | | | 113.6 | |
| Second Quarter | | | 6.48 | | | | 5.12 | | | | 147.7 | |
| Third Quarter | | | 10.15 | | | | 5.67 | | | | 658.8 | |
| Fourth Quarter | | | 16.77 | | | | 9.86 | | | | 847.8 | |
2011 | | | | | | | | | | | | |
| First Quarter | | | 16.52 | | | | 12.32 | | | | 376.8 | |
| Second Quarter (through May 31, 2011) | | | 13.94 | | | | 11.12 | | | | 258.1 | |
| | | | | | | | | | | | | |
Most Recent Six Months | | | | | | | | | | | | |
| December 2010 | | | 16.77 | | | | 14.27 | | | | 613.8 | |
| January 2011 | | | 16.52 | | | | 15.05 | | | | 424.7 | |
| February 2011 | | | 16.01 | | | | 13.83 | | | | 443.8 | |
| March 2011 | | | 14.38 | | | | 12.32 | | | | 279.9 | |
| April 2011 | | | 13.94 | | | | 12.72 | | | | 288.2 | |
| May 2011 | | | 13.53 | | | | 11.12 | | | | 229.5 | |
-174-
As of June 15, 2011, the closing price of our ADSs was US$12.65.
The following tables present for the periods indicated the high and low closing prices and the average trading volume of Banco Galicia’s class B shares on the BASE as reported by the BASE. Banco Galicia class B shares continue to be listed on the BASE with very low trading volume.
Banco Galicia — Class B Shares — Buenos Aires Stock Exchange (in Pesos)
| | | | | | | | | | | | | |
| | | | | | | | | | | Average Daily Trading Volume | |
| | | High | | | Low | | | (in thousand Class B shares) | |
Calendar Year | | | | | | | | | | | | |
2006 | | | 4.50 | | | | 3.04 | | | | 1.56 | |
2007 | | | 6.46 | | | | 4.25 | | | | 2.74 | |
2008 | | | 4.45 | | | | 2.15 | | | | 3.30 | |
2009 | | | 3.55 | | | | 2.10 | | | | 6.47 | |
2010 | | | 11.91 | | | | 3.12 | | | | 3.51 | |
| | | | | | | | | | | | | |
Two Most Recent Fiscal Years | | | | | | | | | | | | |
2009 | | | | | | | | | | | | |
| First Quarter | | | 2.38 | | | | 2.17 | | | | 0.69 | |
| Second Quarter | | | 2.30 | | | | 2.15 | | | | 4.03 | |
| Third Quarter | | | 3.00 | | | | 2.10 | | | | 14.85 | |
| Fourth Quarter | | | 3.55 | | | | 3.04 | | | | 6.06 | |
2010 | | | | | | | | | | | | |
| First Quarter | | | 4.08 | | | | 3.12 | | | | 3.51 | |
| Second Quarter | | | 4.05 | | | | 3.44 | | | | 1.67 | |
| Third Quarter | | | 6.28 | | | | 3.79 | | | | 3.11 | |
| Fourth Quarter | | | 11.91 | | | | 6.15 | | | | 5.76 | |
2011 | | | | | | | | | | | | |
| First Quarter | | | 11.66 | | | | 9.06 | | | | 2.59 | |
| Second Quarter (through May 31, 2011) | | | 11.90 | | | | 10.78 | | | | 2.62 | |
| | | | | | | | | | | | | |
Most Recent Six Months | | | | | | | | | | | | |
| December 2010 | | | 10.83 | | | | 8.46 | | | | 3.45 | |
| January 2011 | | | 11.52 | | | | 9.06 | | | | 2.68 | |
| February 2011 | | | 11.66 | | | | 10.24 | | | | 2.57 | |
| March 2011 | | | 10.93 | | | | 10.14 | | | | 2.51 | |
| April 2011 | | | 11.71 | | | | 10.78 | | | | 2.43 | |
| May 2011 | | | 11.90 | | | | 10.80 | | | | 1.79 | |
As of June 15, 2011, the closing price of Banco Galicia’s class B shares was Ps.13.15.
Argentine Securities Market
The principal and oldest exchange for the Argentine securities market is the BASE. The BASE started operating in 1854 and handles approximately 95% of all equity trading in Argentina. Securities listed on the BASE include corporate equity and debt securities and government securities. Debt securities listed on the BASE may also be listed on the MAE. The Buenos Aires Stock Market (the “MERVAL”), which is affiliated with the BASE, was founded in 1929 and is the largest stock market in Argentina. The MERVAL is a corporation whose 134 shareholder members are the only individuals and entities authorized to trade, either as principal or as agent, in the securities listed on the BASE. Although there are 183 MERVAL shares outstanding, some banks and brokers own more than one share and currently there are 134 members. We are a member of the MERVAL through Galicia Valores, who owns three shares.
-175-
Trading on the BASE is conducted mostly through theSistema Integrado de Negociación Asistida por Computación(Integrated Computer Assisted Trading System, “SINAC”) although there are still some transactions carried out by continuous open outcry, the traditional auction system, from 11:00 a.m. to 5:00 p.m. each business day of the year. SINAC is a computer trading system that permits trading in debt and equity securities and is accessed by brokers directly from workstations located at their offices. As a result of an agreement between the MERVAL and the MAE, equity securities are traded exclusively on the BASE and corporate and government debt securities are traded on the MAE and the BASE. Currently, all transactions relating to listed corporate and government debt securities can be effected on SINAC. In addition, a substantial over-the-counter market exists for private trading in listed debt securities and, prior to the agreement described above, equity securities. Such trades are reported on the MAE.
Although companies may list all of their capital stock on the BASE, in most cases the controlling shareholders retain the majority of a company’s capital stock. This results in only a relatively small percentage of most companies’ stock being available for active trading by the public on the BASE. Even though individuals have historically constituted the largest group of investors in Argentina’s equity markets, in recent years, banks and insurance companies have shown an interest in these markets. Argentine mutual funds, by contrast, continue to have very low participation in the market. Although 106 companies had equity securities listed on the BASE as of December 31, 2010, the 10 most-traded companies on the exchange accounted for approximately 81.28% of total trading value during 2010. Our shares were the second most-traded shares on the BASE in 2010, with a 16.35% share of trading volume.
The Córdoba Stock Exchange is another important stock market in Argentina. Securities listed on the Córdoba Stock Exchange include both corporate equity and debt securities and government securities. Through an agreement with the BASE, all of the securities listed on the BASE are authorized to be listed and subsequently traded on the Córdoba Stock Exchange. Thus, many transactions that originate on the Córdoba Stock Exchange relate to companies listed on the BASE and such trades are subsequently settled in Buenos Aires.
Market Regulations
The CNV oversees the Argentine securities markets and is responsible for authorizing public offerings of securities and supervising brokers, public companies and mutual funds. Argentine pension funds and insurance companies are regulated by separate Government agencies, while financial institutions are regulated mainly by the Argentine Central Bank. The Argentine securities markets are governed generally by Law No. 17,811, as amended, which created the CNV and regulates stock exchanges, market operations and the public offering of securities.
In compliance with the provisions of Law No. 20,643 and the Decrees No. 659/74 and No. 2220/80, most debt and equity securities traded on the exchanges and the MAE must, unless otherwise instructed by the shareholders, be deposited by the shareholders in Caja de Valores, which is a corporation owned by the BASE, the MERVAL and certain provincial exchanges. Caja de Valores is the central securities depository of Argentina, which provides depository facilities for securities and acts as a transfer and paying agent in connection therewith. It also handles settlement of securities transactions carried out on the BASE and operates the computerized exchange information system.
The level of regulation of the market for Argentine securities and investors’ activities is low relatively as compared to the United States and certain other countries, and enforcement of existing regulatory provisions has been limited. In addition, there may be less publicly available information about Argentine companies than is regularly published by or about companies in these countries. However, the CNV has taken steps to strengthen disclosure and regulatory standards for the Argentine securities market, including the issuance of regulations prohibiting insider trading and requiring insiders to report on their ownership of securities, with associated penalties for non-compliance.
In order to improve Argentine securities market regulation, Decree No. 677/01 or “Decree for Transparency in the Public Offering”, was promulgated and took effect on June 1, 2001. This decree has come to be regarded as the financial consumer’s “bill of rights”. Its objective is to provide transparency and protection to participants in the capital markets. The decree applies to individuals and entities that participate in the public offering of securities and to stock exchanges as well. Among its key provisions, the decree broadens the definition of “security;” governs the treatment of negotiable securities; obligates publicly listed companies to form audit committees composed of three or more members of the board of the directors, the majority of whom must be independent under CNV regulations; authorizes market-stabilization transactions under certain circumstances; governs insider trading, market manipulation and securities fraud; and regulates going-private transactions and acquisitions of voting shares, including controlling stakes in public companies.
-176-
In order to offer securities to the public in Argentina, an issuer must meet certain requirements of the CNV regarding assets, operating history, management and other matters, and only securities for which an application for a public offering has been approved by the CNV may be listed on the corresponding stock exchange. This approval does not imply any kind of certification of assurance related to the merits of the quality of the securities, or the solvency of the issuer. Issuers of listed securities are required to file unaudited quarterly financial statements and audited annual financial statements, as well as various other periodic reports, with the CNV and the corresponding stock exchange.
Securities can be freely traded on the Argentine markets but certain restrictions exist regarding access by residents and non-residents to the local foreign exchange market and to transfers of foreign exchange abroad. See Item 4. “Information on the Company-Government Regulation-Foreign Exchange Market”.
On October 2007, the CNV passed Resolution No. 516/07 providing for the voluntary adoption of a corporate governance code. The CNV recommends adoption of such code by public companies but requires that their policy with respect to each topic described in the code be disclosed in detail in the annual report. This resolution was effective for fiscal years beginning on January 1, 2008 and after and, therefore, public companies, including us, have to report on their degree of fulfillment of each topic of such code.
| | |
| Item 10. | | Additional Information |
Description of Our Bylaws
General
Set forth below is a brief description of certain provisions of our bylaws and Argentine law and regulations with regard to our capital stock. Your rights as a holder of our capital stock are subject to Argentine corporate law, which may differ from the corporate laws of other jurisdictions. This description is not purported to be complete and is qualified in its entirety by reference to our bylaws, Argentine law and the rules of the BASE, the Córdoba Stock Exchange as well as the CNV. A copy of our bylaws has been filed with and can be examined at the CNV in Buenos Aires and the SEC in Washington, D.C.
We were incorporated on September 14, 1999, as a stock corporation under the laws of Argentina and registered on September 30, 1999, with the Argentine Superintendency of Companies or IGJ, under corporate registration number 14,519 of Book 7, Volume of Stock Corporations. Our domicile is in Buenos Aires, Argentina. Under our bylaws, our duration is until June 30, 2100 and we are exclusively a financial and investment company (as stated in “Chapter 2. Purpose. Article 3.” of our by-laws). This duration may be extended by resolution taken at a general extraordinary shareholders’ meeting.
Our bylaws do not contain any provision governing the ownership threshold above which shareholder ownership must be disclosed.
During the shareholders’ meeting held on April 23, 2003, we decided not to adhere to the “Optional Statutory System for the Mandatory Acquisition of Shares in a Public Offering” regime in compliance with Decree No.677/01, which requires a company to announce whether it has adopted this regime.
Outstanding Capital Stock
Our total subscribed and paid-in share capital as of December 31, 2010, amounted to Ps.1,241,407,017, composed of class A shares and class B shares, each with a par value of Ps.1.00. The following table presents the number of our shares outstanding as of December 31, 2010, and the voting interest that the shares represent.
| | | | | | | | | | | | | |
| | | As of December 31, 2010 | |
| Shares | | Number of Shares | | | % of Capital Stock | | | % of Voting Rights | |
| Class A Shares | | | 281,221,650 | | | | 22.65 | | | | 59.42 | |
| Class B Shares | | | 960,185,367 | | | | 77.35 | | | | 40.58 | |
| | | | | | | | | | |
Total | | | 1,241,407,017 | | | | 100.00 | | | | 100.00 | |
| | | | | | | | | | |
-177-
Registration and Transfer
The class B shares are book-entry common shares held through Caja de Valores. Caja de Valores maintains a stock registry for us and only those persons listed in such registry will be recognized as our shareholders. Caja de Valores periodically delivers to us a list of the shareholders as at a certain date.
The class B shares are transferable on the books of Caja de Valores. Caja de Valores records all transfers in our registry. Within 10 days of any such transfer, Caja de Valores is required to confirm the registration of transfer with the transferor.
Voting Rights
At shareholders’ meetings, each class A share is entitled to five votes and each class B share is entitled to one vote. However, class A shares are entitled to only one vote in certain matters, such as:
| | • | | a merger or spin-off in which we are not the surviving corporation, unless the acquirer’s shares are authorized to be publicly offered or listed on any stock exchange; |
| | • | | a transformation in our legal corporate form; |
| | • | | a fundamental change in our corporate purpose; |
| | • | | a change of our domicile to outside Argentina; |
| | • | | a voluntary termination of our public offering or listing authorization; |
| | • | | our continuation following a delisting or a mandatory cancellation of our public offering or listing authorization; |
| | • | | a total or partial recapitalization of our statutory capital following a loss; or |
| | • | | the appointment of syndics. |
All distinctions between our class A shares and our class B shares will be eliminated upon the occurrence of any of the following change of control events:
| | • | | EBA Holding sells 100% of its class A shares; |
| | • | | EBA Holding sells a portion of our class A shares to a third person who, when aggregating all our class A shares with our class B shares owned by such person, if any, obtains 50% plus one vote of our total votes; or |
| | • | | the current shareholders of EBA Holding sell shares of EBA Holding that will allow the buyer to exercise more than 50% of the voting power of EBA Holding at any general shareholders’ meeting of EBA Holding shareholders, except for transfers to other current shareholders of EBA Holding or to their heirs or their legal successors or to entities owned by any of them. |
Limited Liability of Shareholders
Shareholders are not liable for our obligations. Shareholders’ liability is limited to the payment of the shares for which they subscribe. However, shareholders who have a conflict of interest with us and do not abstain from voting may be held liable for damages to us. Also, shareholders who willfully or negligently vote in favor of a resolution that is subsequently declared void by a court as contrary to Argentine law or our bylaws may be held liable for damages to us or to third parties, including other shareholders, resulting from such resolutions.
Directors
Our bylaws provide that the board of directors shall be composed by at least three and at most nine members, as decided at a general ordinary shareholders’ meeting. To be appointed to our Board of Directors, such person must have been presented as a candidate by shareholders who represent at least 10% of our voting rights, at least three business days before the date the general ordinary shareholders’ meeting is to be held. Our bylaws do not state an age limit over which the directors cannot serve on our board.
-178-
At each annual shareholders’ meeting, the term of one third of the members of our Board of Directors (no fewer than three directors) expires and their successors are elected to serve for a term of three years. The shareholders’ meeting shall have the power to fix a shorter period (one or two years) for the terms of office of one, several or all of the directors. This system of electing directors is intended to help maintain the continuity of the board. Alternate directors replace directors until the following general ordinary shareholders’ meeting is held. Directors may also be replaced by alternate directors if a director will be absent from a board meeting. The board of directors is required to meet at least once every month and anytime any one of the directors or syndics so requests.
Our bylaws state that the board of directors may decide to appoint an executive committee and/or a delegate director.
Our bylaws do not provide for any arrangements or understandings with major shareholders, customers, suppliers or others, pursuant to which any person referred to in this annual report was selected as a director or member of senior management.
Additionally, pursuant to our bylaws, any borrowing powers on behalf of the Company are granted to our Board of Directors. Our Board of Directors has the power to delegate these borrowing powers to our directors through a power of attorney and currently certain of our directors have powers of attorney to negotiate the terms of and borrow money on behalf of the Company. Furthermore, as stated by our bylaws, the chairman of our Board of Directors is also the legal representative of the Company. Although our bylaws do not expressly address a director’s power to vote on proposals, arrangements or contracts in which the director has a material interest, pursuant to customary Argentine business practice and certain tenants of Argentine corporate law, our directors do not vote on proposals, arrangements or contracts in which the director has a material interest.
Appointment of Directors and Syndics by Cumulative Voting
The Corporations’ Law provides for the use of cumulative voting to enable minority shareholders to appoint members of the board of directors and syndics. Upon the completion of certain requirements, shareholders are entitled to appoint up to one third of the vacancies to be filled on the board of directors by cumulative voting. Each shareholder voting cumulatively has the number of votes resulting from multiplying the number of votes to which such shareholder would normally be entitled by the number of vacancies to be filled. Such shareholder may apportion his votes or cast all such votes for one or a number of candidates not exceeding one third of the vacancies to be filled.
Compensation of Directors
The Corporations’ Law and the CNV establish rules regarding the compensation of directors. The maximum amount of aggregate compensation that the members of the board of directors may receive, including salaries and other compensation for the performance of permanent technical and administrative services, may not exceed 25.0% of profits of each fiscal year. This maximum amount shall be limited to 5.0% when no dividends are distributed to the shareholders and shall be increased proportionately to the dividend distribution until the 25.0% limit is reached when all profits are distributed.
The Corporations’ Law provides that aggregate director compensation may exceed the maximum percentage of computable profit in any one year when the company’s profits are non-existent or too small as to allow payment of a reasonable compensation to board members which have been engaged in technical or administrative services to the company, provided that such proposal is described in the notice of the agenda for the ordinary shareholders’ meeting and is approved by a majority of shareholders present at such shareholders’ meeting.
In addition to the above, our bylaws establish that best practices and national and international market standards regarding directors with similar duties and responsibilities shall be considered when determining the compensation of board members.
-179-
Syndics
Our bylaws, in accordance with Argentine law, provide for the maintenance of a supervisory committee whose members are three permanent syndics and three alternate syndics. Syndics are elected for a one-year term and may be re-elected. Alternate syndics replace permanent syndics in case of absence. For the appointment of syndics, each of our class A shares and class B shares has only one vote. Fees for syndics are established by the shareholders at the annual ordinary shareholders’ meeting. Their function is to oversee the management of the company, to control the legality of the actions of the board of directors, to attend all board of directors’ meetings, to attend all shareholders’ meetings, to prepare reports for the shareholders on the financial statements with their opinion, and to provide information regarding the company to shareholders that represent at least 2% of the capital stock. Syndics’ liabilities are joint and several and unlimited for the non-fulfillment of their duties. They are also jointly and severally liable, together with the members of the board of directors, if the proper fulfillment of their duties as syndics would have avoided the damage or the losses caused by the members of the board of directors.
Shareholders’ Meetings
Shareholders’ meetings may be ordinary meetings or extraordinary meetings. An annual ordinary shareholders’ meeting is required to be held in each fiscal year to consider the matters outlined in Article 234 of the Corporations’ Law, including, among others:
| | • | | approval of the financial statements and general performance of the management for the preceding fiscal year; |
| | • | | appointment and remuneration of directors and members of the supervisory committee; |
| | • | | allocation of profits; and |
| | • | | any other matter the board of directors decides to submit to the shareholders’ meeting concerning the company’s business administration. Matters which may be discussed at these or other ordinary meetings include resolutions regarding the responsibility of directors and members of the supervisory committee, as well as capital increases and the issuance of negotiable obligations. |
Extraordinary shareholders’ meetings may be called at any time to discuss matters beyond the competence of the ordinary meeting, including but not limited to amendments to the bylaws, matters related to the liquidation of a company, limitation of the shareholders’ preemptive rights to subscribe new shares, issuance of bonds and debentures, transformation of the corporate form, a merger into another company and spin-offs, early winding-up, change of the company’s domicile to outside Argentina, total or partial repayment of capital for losses, and a substantial change in the corporate purpose set forth in the bylaws.
Shareholders’ meetings may be convened by the board of directors or by the syndics. A shareholder or group of shareholders holding at least 5.0% in the aggregate of our capital stock may request the board of directors or the syndics to convene a general shareholders’ meeting to discuss the matters indicated by the shareholder.
Once a meeting has been convened with an agenda, the agenda limits the matters to be decided upon at such meeting and no other matters may be decided upon.
Additionally, our bylaws provide that any shareholder holding at least 5% in aggregate of our capital stock may present, in writing, to the Board of Directors, before February 28 of each year, proposals of items to be included in the agenda at the annual general ordinary shareholders’ meeting. The Board of Directors is not obligated to include such items in the agenda.
Class B shares represented by ADSs will be voted or caused to be voted by the Depositary in accordance with instructions of the holders of such ADSs. In the event instructions are not received from the holder, the Depositary shall give a discretionary proxy for the shares represented by such ADSs to a person designated by us.
Notice of each shareholders’ meeting must be published in the Official Gazette, and in a widely circulated newspaper in the country’s territory, at least twenty days prior to the meeting but not more than forty-five days prior to the date on which the meeting is to be held. The board of directors will determine the appropriate publication of notices outside Argentina in accordance with the requirements of the jurisdictions and exchanges on which our shares are traded. In order to attend a meeting and to be listed on the meeting registry, shareholders must submit evidence of their book-entry share account held at Caja de Valores at least three business days prior to the scheduled meeting date without counting the meeting day.
-180-
The quorum for ordinary meetings consists of a majority of stock entitled to vote, and resolutions may be adopted by the affirmative vote of 50% plus one vote (an “absolute majority”) of the votes present whether in person or participating via electronic means of communication. If no quorum is present at the first meeting, a second meeting may be called at which the shareholders present, whatever their number, shall constitute a quorum. Resolutions are to be adopted by an absolute majority of the votes present. The second meeting may be convened to be held one hour later on the same day as the first meeting had been called for, provided that it is an ordinary shareholders’ meeting, or within thirty days of the date for which the first ordinary meeting was called.
The quorum for extraordinary shareholders’ meetings consists of 60% of stock entitled to vote, and resolutions may be adopted by an absolute majority of the votes present. If no quorum is present at the first meeting, a second meeting may be called at which the shareholders present, whatever their number, shall constitute a quorum. Resolutions are to be adopted by an absolute majority of the votes present. The second meeting has to be convened to be held within thirty days of the date for which the first extraordinary meeting was called, and the notice must be published for three days, at least eight days before the date of the second meeting. Some special matters require a favorable vote of the majority of all the stock holding voting rights, the class A shares being granted the right to only one vote each. The special matters are described in “-Voting Rights” above.
Dividends
Dividends may be lawfully paid and declared only out of our retained earnings representing the profit realized and liquid on our operations and investments reflected in our annual financial statements, as approved at our annual general shareholders’ meeting. No profits may be distributed until prior losses are covered. Dividends paid on our class A shares and class B shares will equal one another on a per-share basis.
As required by the Corporations’ Law, 5% of our net income is allocated to a legal reserve until the reserve equals 20% of our outstanding capital. Dividends may not be paid if the legal reserve has been impaired. The legal reserve is not available for distribution to shareholders.
Our Board of Directors submits our financial statements for the previous fiscal year, together with reports prepared by our supervisory committee, to our shareholders for approval at the general ordinary shareholders’ meeting. The shareholders, upon approving the financial statements, determine the allocation of our net income.
Our Board of Directors is allowed by law and by our bylaws to decide to pay anticipated dividends on the basis of a balance sheet especially prepared for purposes of paying such dividends.
Under CNV regulations and our bylaws, cash dividends must be paid to shareholders within 30 days of the shareholders’ meeting approving the dividend. Payment of dividends in shares requires authorization from the CNV, the BASE and the Córdoba Stock Exchange, whose authorizations must be requested within 10 business days after the shareholders’ meeting approving the dividend. We must make a distribution of the shares available to shareholders not later than three months after receiving authorization to do so from the CNV.
Shareholders may no longer claim the payment of dividends from us after three years have elapsed from the date on which the relevant dividends were made available to such shareholders.
Capital Increases and Reductions
We may increase our capital upon resolution of the general ordinary shareholders’ meeting. All capital increases must be reported to the CNV, published in the Official Gazette and registered with the Public Registry of Commerce. Capital reductions may be voluntary or mandatory. A voluntary reduction of capital must be approved by an extraordinary shareholders’ meeting after the corresponding authorization by the BASE, the Córdoba Stock Exchange and the CNV and may take place only after notice of such reduction has been published and creditors have been given an opportunity to obtain payment or guarantees for their claims or attachment. A reduction of capital is mandatory when losses have exceeded reserves and more than 50% of the share capital of the company.
-181-
Preemptive Rights
Under Argentine law, it is mandatory that a shareholder of ordinary shares of any given class have preemptive rights, proportional to the number of shares he or she owns, to subscribe for shares of capital stock of the same class or of any other class if the new subscription offer does not include all classes of shares. Shareholders may only decide to suspend or limit preemptive rights by supermajority at an extraordinary shareholders’ meeting and only in exceptional cases. Shareholders may waive their preemptive rights only on a case-by-case basis.
In the event of an increase in our capital, holders of class A shares and class B shares have a preemptive right to subscribe for any issue of class B shares in an amount sufficient to maintain the proportion of capital then held by them. Holders of class A shares are entitled to subscribe for class B shares because no further class A shares carrying five votes each are allowed to be issued in the future. Under Argentine law, companies are prohibited from issuing stock with multiple voting rights after they have been authorized to make a public offering of securities.
Preemptive rights are exercisable following the last publication of the notification to shareholders of the opportunity to exercise preemptive rights in the Official Gazette and an Argentine newspaper of wide circulation for a period of 30 days, provided that such period may be reduced to no less than 10 days if so approved by an extraordinary shareholders’ meeting.
Shareholders who have exercised their preemptive rights and indicated their intention to exercise additional preemptive rights are entitled to additional preemptive rights (“accretion rights”), on a pro rata basis, with respect to any unsubscribed shares, in accordance with the terms of the Corporations’ Law. Class B shares not subscribed for by shareholders through the exercise of their preemptive or accretion rights may be offered to third parties.
Holders of ADSs may be restricted in their ability to exercise preemptive rights if a registration statement relating to such rights has not been filed or is not effective or if an exemption from registration is not available.
Appraisal Rights
Whenever our shareholders approve:
| | • | | a merger or spin-off in which we are not the surviving corporation, unless the acquirer’s shares are authorized to be publicly offered or listed on any stock exchange, |
| | • | | a transformation in our legal corporate form, |
| | • | | a fundamental change in our corporate purpose, |
| | • | | a change of our domicile to outside Argentina, |
| | • | | a voluntary termination of our public offering or listing authorization, |
| | • | | our continuation following a delisting or a mandatory cancellation of our public offering or listing authorization, or |
| | • | | a total or partial recapitalization of our statutory capital following a loss, |
any shareholder that voted against such action or did not attend the relevant meeting may exercise its right to have its shares canceled in exchange for the book value of its shares, determined on the basis of our latest balance sheet prepared in accordance with Argentine laws and regulations, provided that such shareholder exercises its appraisal rights within the periods set forth below.
There is, however, doubt as to whether holders of ADSs, will be able to exercise appraisal rights with respect to class B shares represented by ADSs.
Appraisal rights must be exercised within five days following the adjournment of the meeting at which the resolution was adopted, in the event that the dissenting shareholder voted against such resolutions, or within 15 days following such adjournment if the dissenting shareholder did not attend such meeting and can prove that he was a shareholder on the date of such meeting. In the case of a merger or spin-off involving an entity authorized to make a public offering of its shares, appraisal rights may not be exercised if the shares to be received as a result of such transaction are listed on any stock exchange. Appraisal rights are extinguished if the resolution giving rise to such rights is overturned at another shareholders’ meeting held within 75 days of the meeting at which the resolution was adopted.
-182-
Payment of the appraisal rights must be made within one year from the date of the shareholders’ meeting at which the resolution was adopted, except if the resolution was to delist our capital stock, in which case the payment period is reduced to 60 days from the date of the related resolution.
Preferred Stock
According to the Corporations’ Law and our bylaws, an ordinary shareholders’ meeting may approve the issuance of preferred stock. Such preferred stock may have a fixed dividend, cumulative or not cumulative, with or without additional participation in our profits, as decided by shareholders at a shareholders’ meeting when determining the conditions of the issuance. They may also have other preferences, such as a preference in the event of our liquidation.
The holders of preferred stock shall not be entitled to voting rights. Notwithstanding the foregoing, in the event that no dividends are paid to such holders for their preferred stock, and for as long as such dividends are not paid, the holders of preferred stock shall be entitled to voting rights. Holders of preferred stock are also entitled to vote on certain special matters, such as the transformation of the corporate form, a merger into another company and spin-offs (when we are not the surviving entity and the surviving entity is not listed on any stock exchange), early winding-up, a change of our domicile to outside Argentina, total or partial repayment of capital for losses and a substantial change in the corporate purpose set forth in our bylaws or in the event our preferred stock is traded on stock exchanges and such trading is suspended or terminated.
Conflicts of Interest
As a protection to minority shareholders, under the Corporations’ Law, a shareholder is required to abstain from voting on any resolution in which its direct or indirect interests conflict with that of or are different than ours. In the event such shareholder votes on such resolution, and such resolution would not have been approved without such shareholders’ vote, the resolution may be declared void by a court and such shareholder may be liable for damages to the company as well as to any third party, including other shareholders.
Redemption or Repurchase
According to Decree No.677/01, a stock corporation may acquire the shares issued by it, provided that the public offering and listing thereof has been authorized, subject to the following terms and conditions and those set forth by the CNV. The CNV has not yet issued its regulations. The above-mentioned conditions are: (a) the shares to be acquired shall be fully paid up; (b) there shall be a resolution signed by the board of directors to such effect; (c) the acquisition shall be made out of net profits or free or voluntary reserves; and (d) the total amount of shares acquired by the company, including previously acquired shares, shall not exceed 10% of the capital stock or such lower percentage determined by the CNV. The shares acquired by the company in excess of such limit shall be disposed of within the term of 90 days after the date of the acquisition originating such excess.
The shares acquired by the company shall be disposed of by the company within the maximum term of three years counted as from the date of acquisition thereof. Upon disposing of the shares, the company shall make a preemptive offer thereof. Such an offer will not be obligatory if the shares are used in connection with a compensation plan or program for the company’s employees or if the shares are distributed among all shareholders pro rata their shareholdings. If shareholders do not exercise, in whole or in part, their preemptive rights, the sale shall be made at a stock exchange.
Liquidation
Upon our liquidation, one or more liquidators may be appointed to wind up our affairs. If no such appointment is made, our Board of Directors will act as liquidator. All outstanding common shares will be entitled to participate equally in any distribution upon liquidation. In the event of a liquidation, in Argentina as well as in any other country, our assets shall first be applied to satisfy our debts and liabilities.
-183-
Other Provisions
Our bylaws are governed by Argentine law and the ownership of any kind of our shares represents acceptance of our bylaws and submission to the exclusive jurisdiction of the ordinary commercial courts of Buenos Aires for any claim or dispute related to us, our shareholders, directors and members of the supervisory committee.
Exchange Controls
For a description of the exchange controls that would affect us or the holders of our securities, see Item 4. “Information on the Company-Government Regulation-Foreign Exchange Market”.
Taxation
The following is a summary of the principal Argentine and U.S. Federal tax consequences arising from the acquisition, ownership and disposition of our class B shares and ADSs. It is based upon Argentine and U.S. Federal tax laws and regulations in effect as of the date of this annual report and is subject to any subsequent changes in such laws and regulations that may come into effect after such date. Any change could apply retroactively and could affect the continued validity of this summary. The summary which follows does not constitute legal advice or a legal opinion with respect to the transactions that the holders of our class B shares or ADSs may enter into, but rather is only a brief description of certain (and not all) aspects of the Argentine and U.S. Federal taxation system related to the acquisition, ownership and disposition of our class B shares and ADSs. In addition, although the following summary is believed to be a reasonable interpretation of the current taxation rules and regulations, we cannot assure you that the applicable authorities or tribunals will agree with all of, or any of, the tax consequences outlined below. Currently, there is no tax treaty between the United States and Argentina.
Argentine Taxes
Taxation of Dividends
In general, dividend payments on ADSs or ordinary shares, whether in cash, property, or stock, are not subject to Argentine withholding tax or other taxes.
There is an exception under which a 35% tax (“equalization tax”) will be imposed on certain dividends approved by the registrant’s shareholders. The equalization tax will be applied only to the extent that distributions of dividends exceed the taxable income of the company increased by non-taxable dividends received by the distributing company in prior years and reduced by Argentine income tax paid by the distributing company.
In this situation the equalization tax will be imposed as a withholding tax on the shareholder receiving the dividend. Dividends distributions made in property (other than cash) will be subject to the same tax rules as cash dividends. Stock dividends are not subject to Argentine taxation.
Taxation of Capital Gains
Pursuant to Decree No.2,284/91 (the “Deregulation Decree”), capital gains derived by non-resident individuals or foreign companies from the sale, exchange or other disposition of ADSs or class B shares are not currently subject to income tax.
Beginning on January 1, 2001, capital gains from the sale, exchange or other dispositions of shares not listed in a stock exchange will be subject to income tax when derived by individuals domiciled in Argentina.
In addition, in the case of entities or permanent organizations incorporated or domiciled abroad that, pursuant to their bylaws, charters, documents or the applicable regulatory framework, have as their principal activity investing outside of the jurisdiction of their incorporation or domicile, or are generally restricted from doing business in their country of incorporation, it will be assumed, without any proof to the contrary being admitted, that the seller is an individual domiciled in Argentina. Such entities will be subject to income tax imposed as a withholding tax on the seller receiving the payment (for payments made beginning on April 30, 2001) at the rate of 17.50% (that is, 35% on 50% of the amount of the payment), but the foreign party may choose instead to pay a tax of 35% on the net gain realized on the sale. In such situation, the Deregulation Decree will not be applicable.
-184-
On July 3, 2003, the Government’s Chief Counsel (“Procurador del Tesoro”) issued an opinion that the provisions of the income tax law that taxed capital gains arising from shares without quotation obtained by resident individuals or “offshore companies”, as defined by the Argentine Income Tax Law, are no longer in force because they have been implicitly abrogated. The validity of this opinion is difficult to assess. Opinions of the Government’s Chief Counsel are binding upon all Government attorneys, including attorneys of the Argentine tax administration.
Transfer Taxes
No Argentine transfer taxes are applicable on the sale or transfer of ADSs or class B shares.
Tax on Minimum Notional Income
The tax reform in force since 1999 reinstituted a tax on assets on Argentine companies. This tax is similar to the asset tax that was previously in effect in Argentina from 1990 to 1995. It applies at a general rate of 1% on a broadly defined asset base encompassing most of the taxpayer’s gross assets at the end of any fiscal year ending after December 31, 1998.
Specifically, the Law establishes that banks, other financial institutions and insurance companies will consider a taxable base equal to 20% of the value of taxable assets.
A company’s asset tax liability for a tax year will be reduced by its income tax payments, and asset tax payments for a tax year can be carried forward to be applied against the company’s income tax liability in any of the following ten tax years.
Personal Assets Tax
Individuals domiciled and undivided estates located in Argentina or abroad will be subject to an annual tax in respect of assets located in Argentina and abroad. The tax rate is from 0.5% to 1.25%, depending on the total amount of assets. Individuals domiciled abroad will pay the tax only in respect of the assets they hold in Argentina. In the case of individuals domiciled abroad, the tax will be paid by the individuals or entities domiciled in Argentina which, as of December 31 of each year, hold the joint ownership, possession, use, enjoyment, deposit, safekeeping, custody, administration or tenure of the assets located in Argentina subject to the tax belonging to the individuals domiciled abroad. When the direct ownership of negotiable obligations, government securities and certain other investments, except shares issued by companies ruled by the Corporations’ Law, corresponds to companies domiciled abroad in countries that do not enforce registration systems for private securities (with the exception of insurance companies, open-end investment funds, pension funds or banks and financial entities with head offices in countries that have adopted the international banking supervision standards laid down by the Basel Committee on Banking Supervision) or that pursuant to their bylaws, charter, documents or the applicable regulatory framework, have as their principal activity investing outside of the jurisdiction of their organization or domicile, or are generally restricted from doing business in their country of incorporation, it will be assumed, without any proof to the contrary being admitted, that those assets belong ultimately to individuals and therefore the system for paying the tax for such individuals domiciled abroad is applicable to them.
There is an exception pursuant to a tax reform that was published in the Official Gazette as Law No.25,585, which went into effect on December 31, 2002. This tax reform introduced a mechanism to collect the personal assets tax on shares issued by companies ruled by the Corporations’ Law, which ownership belongs to individuals domiciled in Argentina or abroad and companies or entities domiciled abroad. In the case of companies or entities domiciled abroad, it will be assumed, without any proof to the contrary being admitted, that those shares belong ultimately to individuals domiciled abroad.
The tax will be assessed and paid by those companies ruled by the Corporations’ Law at the rate of 0.5% on the value of the shares or equity interest. The valuation of the shares, whether listed or not, must be made according to their proportional equity value. These companies may eventually seek reimbursement from the direct owner of their shares in respect of any amounts paid to the Argentine tax authorities as personal assets tax. Grupo Financiero Galicia has sought reimbursement for the amount paid corresponding to December 31, 2002. The board of directors submitted the decision on how to proceed with respect to fiscal year 2003 to the annual shareholders’ meeting held on April 22, 2004. At that meeting, our shareholders voted to suspend all claims on our shareholders for amounts unpaid for fiscal year 2002 and to have us absorb the amounts due for fiscal year 2003 onward when not withheld from dividends.
-185-
Other Taxes
There are no Argentine federal inheritance, succession or gift taxes applicable to the ownership, transfer or disposition of ADSs or class B shares. There are no Argentine stamps, issue, registration or similar taxes or duties payable by holders of ADSs or class B shares.
Deposit and Withdrawal of Class B Shares in Exchange for ADSs
No Argentine tax is imposed on the deposit or withdrawal of class B shares in exchange for ADSs.
United States Taxes
The following is a summary of the material U.S. Federal income tax consequences of the acquisition, ownership and disposition of class B shares or ADSs, as such securities are set forth in the documents or the forms thereof, relating to such securities as in existence on the date hereof, but it does not purport to address all of the tax considerations that may be relevant to a decision to purchase, own or dispose of class B shares or ADSs. This summary assumes that the class B shares or ADSs will be held as capital assets and does not address tax consequences to all categories of investors, some of which (such as dealers or traders in securities or currencies, real estate investment trusts, regulated investment companies, grantor trusts, tax-exempt entities, banks, insurance companies, persons that received class B shares or ADSs as compensation for the performance of services, persons owning (or deemed to own for U.S. tax purposes) at least 10% or more (by voting power or value) of our shares, investors whose functional currency is not the US Dollar and persons that will hold the class B shares or ADSs as part of a position in a “straddle” or as part of a “hedging” or “conversion” transaction for U.S. tax purposes) may be subject to special tax rules. Moreover, this summary does not address the U.S. federal estate and gift or alternative minimum tax consequences of the acquisition, ownership and disposition of class B shares or ADSs.
This summary (i) is based the Internal Revenue Code of 1986, as amended (the “Code”), existing, proposed and temporary United States Treasury Regulations and judicial and administrative interpretations thereof, in each case as in effect and available on the date hereof; and (ii) is based in part on representations of the Depository and the assumption that each obligation in the Deposit Agreement and any related agreement will be performed in accordance with its terms. All of the foregoing are subject to change, which change could apply retroactively and could affect the tax consequences described below.
The U.S. Treasury Department has expressed concern that depositaries for ADRs, or other intermediaries between the holders of shares of an issuer and the issuer, may be taking actions that are inconsistent with the claiming of U.S. foreign tax credits by U.S. holders of such receipts or shares. Accordingly, the U.S. foreign tax credit analysis described below could be affected by future actions that may be taken by the U.S. Treasury Department.
For purposes of this summary, a “U.S. Holder” is a beneficial owner of class B shares or ADSs who, for U.S. Federal income tax purposes, is (i) a citizen or resident of the United States, (ii) a corporation organized in or under the laws of the United States or any state thereof or the District of Columbia, (iii) an estate the income of which is subject to U.S. Federal income taxation regardless of its source, or (iv) a trust if such trust validly elects to be treated as a United States person for United States federal income tax purposes or if (a) a United States court can exercise primary supervision over its administration and (b) one or more United States persons have the authority to control all of the substantial decisions of such trust. A “Non-U.S. Holder” is a beneficial owner of class B shares or ADSs that is neither a U.S. Holder nor a partnership (or other entity treated as such for U.S. federal income tax purposes).
If a partnership (or any other entity treated as a partnership for U.S. federal income tax purposes) holds class B shares or ADSs, the tax treatment of the partnership and a partner in such partnership will generally depend on the status of the partner and the activities of the partnership. Such a partner or partnership should consult its tax advisor as to its tax consequences.
-186-
Each prospective purchaser should consult its own tax advisor with respect to the U.S. Federal, state, local and foreign tax consequences of acquiring, owning or disposing of class B shares or ADSs.
Ownership of ADSs in General
In general, for U.S. Federal income tax purposes holders of ADSs will be treated as the owners of the ADSs evidenced thereby and of the class B shares represented by such ADSs.
Taxation of Cash Dividends and Distribution of Stock
Subject to the discussion below under “Passive Foreign Investment Company Considerations”, for U.S. Federal income tax purposes, the gross amount of distributions by Grupo Financiero Galicia of cash or property (other than certain distributions, if any, of class B shares or ADSs distributed pro rata to all shareholders of Grupo Financiero Galicia, including holders of ADSs) made with respect to the class B shares or ADSs before reduction for any Argentine taxes withheld therefrom, will constitute dividends to the extent that such distributions are paid out of Grupo Financiero Galicia’s current and accumulated earnings and profits, and will be included in the gross income of a U.S. Holder as dividend income. Subject to the discussion below under “Passive Foreign Investment Company Considerations”, non-corporate U.S. Holders generally may be taxed on such distributions on ADSs (or shares that are readily tradable on an established securities market in the United States at the time of such distribution) at the lower rates applicable to long-term capital gains for taxable years beginning on or before December 31, 2012 (i.e., gains from the sale of capital assets held for more than one year). Non-corporate U.S. Holders that do not meet a minimum holding period requirement during which they are not protected from the risk of loss with respect to such ADSs (or shares), that elect to treat the dividend income as “investment income” pursuant to Section 163(d)(4)(B) of the Code or that receive dividends with respect to which they are obligated to make related payments, will not be eligible for the reduced rates of taxation. Such dividends will not be eligible for the dividends received deduction generally allowed to corporations under the Internal Revenue Code of 1986, as amended (the “Code”).
Subject to the discussion below under “Passive Foreign Investment Company Considerations”, if distributions with respect to the class B shares exceed Grupo Financiero Galicia’s current and accumulated earnings and profits, the excess would be treated first as a tax-free return of capital to the extent of such U.S. Holder’s adjusted tax basis in the class B shares or ADSs. Any amount in excess of the amount of the dividend and the return of capital would be treated as capital gain. Grupo Financiero Galicia does not maintain calculations of its earnings and profits under U.S. federal income tax principles.
Dividends paid in Pesos will be included in the gross income of a U.S. Holder in an amount equal to the US Dollar value of the Pesos on the date of receipt, which, in the case of ADSs, is the date they are received by the depositary. The amount of any distribution of property other than cash will be the fair market value of such property on the date of distribution. Any gains or losses resulting from the conversion of Pesos between the time of the receipt of dividends paid in Pesos and the time the Pesos are converted into US Dollars will be treated as ordinary income or loss, as the case may be, of a U.S. Holder. Dividends received by a U.S. Holder with respect to the class B shares or ADSs will be treated as foreign source income, which may be relevant in calculating such holder’s foreign tax credit limitation. Subject to certain conditions and limitations, Argentine tax withheld on dividends may be deducted from taxable income or credited against a U.S. Holder’s U.S. Federal income tax liability. The limitation on foreign taxes eligible for credit is calculated separately with respect to specific categories of income. For this purpose, dividend income with respect to your class B shares or ADSs should generally constitute “passive category income”, or in the case of certain U.S. Holders, “general category income”. The rules governing the foreign tax credit are complex. You are urged to consult your tax advisors regarding the availability of the foreign tax credit under your particular circumstances.
Subject to the discussion below under “Backup Withholding and Information Reporting Requirements”, a Non-U.S. Holder generally will not be subject to U.S. Federal income or withholding tax on dividends received on class B shares or ADSs, unless such income is effectively connected with the conduct by the Non-U.S. Holder of a trade or business in the United States.
-187-
Taxation of Capital Gains
Subject to the discussion below under “Passive Foreign Investment Company Considerations”, U.S. Holders that hold class B shares or ADSs as capital assets will recognize capital gain or loss for U.S. Federal income tax purposes upon a sale or exchange of such class B shares or ADSs in an amount equal to the difference between such U.S. Holder’s adjusted tax basis in the class B shares or ADSs and the amount realized on their disposition. In the case of a non-corporate U.S. Holder, the maximum marginal U.S. Federal income tax rate applicable to such gain will be lower than the maximum marginal federal income tax rate for ordinary income (other than certain dividends) if the U.S. Holder’s holding period for the class B shares or ADSs exceeds one year. Gain or loss, if any, recognized by a U.S. Holder generally will be treated as United States source income or loss for U.S. foreign tax credit purposes. Certain limitations exist on the deductibility of capital losses for U.S. Federal income tax purposes.
The initial tax basis of the class B shares to a U.S. Holder is the US Dollar value of the Pesos denominated purchase price determined on the date of purchase. If the class B shares or ADSs are treated as traded on an “established securities market”, a cash basis U.S. Holder (or, if it elects, an accrual basis U.S. Holder) will determine the Dollar value of the cost of such class B shares or ADSs by translating the amount paid at the spot rate of exchange on the settlement date of the purchase.
With respect to the sale or exchange of class B shares or ADSs, the amount realized generally will be the US Dollar value of the payment received determined on (i) the date of receipt of payment in the case of a cash basis U.S. Holder and (ii) the date of disposition in the case of an accrual basis U.S. Holder. If the class B shares or ADSs are treated as traded on an “established securities market”, a cash basis taxpayer (or, if it elects, an accrual basis taxpayer) will determine the US Dollar value of the amount realized by translating the amount received at the spot rate of exchange on the settlement date of the sale.
Subject to the discussion below under “Backup Withholding Tax and Information Reporting Requirements”, a Non-U.S. Holder generally will not be subject to U.S. Federal income or withholding tax on gain realized on the sale or exchange of class B shares or ADSs unless (i) such gain is effectively connected with the conduct by the Non-U.S. Holder of a trade or business in the United States or (ii) in the case of gain realized by an individual Non-U.S. Holder, the Non-U.S. Holder is present in the United States for 183 days or more in the taxable year of the sale or exchange and certain other conditions are met.
Passive Foreign Investment Company Considerations
A Non-United States corporation will be classified as a “passive foreign investment company”, or a PFIC, for U.S. federal income tax purposes in any taxable year in which, after applying certain look-through rules, either (1) at least 75 percent of its gross income is “passive income” or (2) at least 50 percent of the average value of its gross assets is attributable to assets that produce “passive income” or is held for the production of passive income. Passive income for this purpose generally includes dividends, interest, royalties, rents and gains from commodities and securities transactions, other than certain income derived in the active conduct of a banking business.
The application of the PFIC rules to certain banks is unclear under U.S. federal income tax law. The IRS has issued a notice and certain proposed Treasury Regulations that exclude from passive income any income derived in the active conduct of a banking business by a qualifying foreign bank (the “Active Bank Exception”). However, the IRS notice and proposed Treasury Regulations are inconsistent in certain respects. Since final Treasury Regulations have not been issued, there can be no assurance that Grupo Financiero Galicia or its subsidiaries will satisfy the Active Bank Exception for any given taxable year.
Based on certain estimates of its gross income and gross assets, the nature of its business and relying on the Active Bank Exception, Grupo Financiero Galicia believes that it will not be classified as a PFIC for the taxable year ended December 31, 2010. Grupo Financiero Galicia’s status in future years will depend on its assets and activities in those years. Grupo Financiero Galicia has no reason to believe that its assets or activities will change in a manner that would cause it to be classified as a PFIC, but there can be no assurance that Grupo Financiero Galicia will not be considered a PFIC for any taxable year. If Grupo Financiero Galicia were a PFIC, a U.S. Holder of class B shares or ADSs generally would be subject to imputed interest charges and other disadvantageous tax treatment (including the denial of the taxation of certain dividends at the lower rates applicable to long-term capital gains, as discussed above under “Taxation of Cash Dividends and Distribution of Stock”) with respect to any gain from the sale or exchange of, and certain distributions with respect to, the class B shares or ADSs.
-188-
If Grupo Financiero Galicia were a PFIC, a U.S. Holder of class B shares or ADSs could make a variety of elections that may alleviate certain of the tax consequences referred to above, and one of these elections may be made retroactively. However, it is expected that the conditions necessary for making certain of such elections will not apply in the case of the class B shares or ADSs. U.S. Holders should consult their own tax advisors regarding the tax consequences that would arise if Grupo Financiero Galicia were treated as a PFIC.
Backup Withholding and Information Reporting
United States backup withholding tax and information reporting requirements generally apply to certain payments to certain holders of stock.
Information reporting generally will apply to payments of dividends on, and to proceeds from the sale or redemption of, class B shares or ADSs made within the United States, or by a U.S. payor or U.S. middleman, to a holder of class B shares or ADSs (other than an “exempt recipient”, including a payee that is not a United States person that provides an appropriate certification and certain other persons).
A payor will be required to withhold backup withholding tax from any payments of dividends on, or proceeds from the sale or redemption of, class B shares or ADSs within the United States, or by a U.S. payor or U.S. middleman, to a holder (other than an exempt recipient such as a corporation or a payee that is not a United States person and that provides an appropriate certification) if such Holder fails to furnish its correct taxpayer identification number or otherwise fails to comply with, or establish an exemption from, such backup withholding tax requirements. The backup withholding tax rate is 28% through 2012.
In addition, certain U.S. Holders who are individuals are required to report information relating to an interest in our class B shares of ADSs, subject to certain exceptions (including an exception for the class B shares or ADSs held in accounts maintained by certain financial institutions). U.S. Holders are urged to consult their tax advisers regarding the effect, if any, of new U.S. federal income tax legislation on their ownership and disposition of the class B shares or ADSs.
Medicare Tax on Investment Income
Certain U.S. Holders who are individuals, estates or trusts are required to pay a 3.8% tax on, among other things, dividends and capital gains from the sale or other disposition of shares of the class B shares or ADSs for taxable years beginning after December 31, 2012.
THE ABOVE SUMMARIES ARE NOT INTENDED TO CONSTITUTE A COMPLETE ANALYSIS OF ALL TAX CONSEQUENCES RELATING TO THE OWNERSHIP OF THE CLASS B SHARES OR ADSs. YOU SHOULD CONSULT AN INDEPENDENT TAX ADVISOR CONCERNING THE TAX CONSEQUENCES OF YOUR PARTICULAR SITUATION.
Material Contracts
In connection with its foreign debt restructuring, Banco Galicia entered into various restructured loan agreements with its bank creditors and into an indenture with The Bank of New York, acting as trustee, pursuant to which bonds were issued. These restructured loan agreements and the indenture include, on a combined basis, a number of significant covenants that, among other things, restrict Banco Galicia��s ability to: (i) pay dividends on stock or purchase stock (see Item 8. “Financial Information-Dividend Policy and Dividends”); (ii) use the proceeds received from the sale of certain assets or from the issuance of debt or equity securities; (iii) engage in certain transactions with affiliates; or (iv) engage in business activities unrelated to Banco Galicia’s current business. In addition, certain of the restructured loan agreements also require Banco Galicia to maintain specified financial ratios and to comply with certain reporting and informational requirements.
In December of 2004, Banco Galicia entered into an amendment and waiver of the restructured loan agreements, whereby Banco Galicia and the lenders agreed principally to: (i) amend certain terms to allow for certain securitization transactions and to allow for the financing of the construction of the new corporate tower and (ii) waive the delivery requirement for certain documents in connection with certain transactions.
-189-
In August of 2006, Banco Galicia entered into a second amendment to each of the restructured loan agreements, whereby Banco Galicia and the lenders agreed principally to: (i) permit the use of proceeds received from the sale of various government securities and other similar assets to effect open market purchases of negotiable instruments issued by Banco Galicia and to prepay loans outstanding with the lenders and (ii) permit us to further capitalize Banco Galicia with negotiable obligations of Banco Galicia owned by us and issued in connection with the restructuring of Banco Galicia’s debt.
In December of 2007, Banco Galicia entered into a third amendment to each of the restructured loan agreements, whereby Banco Galicia and the lenders agreed principally to: (i) the modification of the mergers, consolidations, sales and leases covenant and the transactions with affiliates covenant in order to afford Banco Galicia greater flexibility with respect to transactions contemplated by such covenants, (ii) the deletion of covenants limiting Banco Galicia’s ability to dispose of its assets, make capital expenditures or investments or compensate its directors and (iii) the modification of the amendment, waiver or consent provision of such restructured loan agreements so that certain notes or loans held by Banco Galicia and its affiliates may be counted for purposes of entering into amendments, waivers or consents to such agreements.
In connection with Banco Galicia’s issuance on May 4, 2011 of its class I negotiable obligations, due 2018, in the aggregate principal amount of US$300.0 million, within its global short-term, medium-term and/or long-term note program, for an outstanding face value at any time of up to US$342.5 million, or the equivalent amount in other currencies, Banco Galicia entered into an indenture, dated as of May 4, 2011, with The Bank of New York Mellon, acting as trustee, pursuant to which the above-mentioned negotiable obligations were issued. This indenture includes a number of significant covenants, which are subject to important qualifications and exceptions, that, among other things, restrict the ability of (i) Banco Galicia and certain of its subsidiaries to directly or indirectly, create, incur, assume or suffer to exist liens upon its present or future assets to secure any indebtedness and (ii) Banco Galicia to merge, consolidate or amalgamate with or into, or convey or transfer or lease all or substantially all of its properties and assets, whether in one transaction or a series of related transactions.
In connection with Tarjeta Naranja S.A.’s issuance on January 28, 2011 of its class XIII negotiable obligations, due 2017, in the aggregate principal amount of US$200.0 million, within its global short-term, medium-term and/or long-term note program, for an outstanding face value at any time of up to US$350.0 million, or the equivalent amount in other currencies, Tarjeta Naranja S.A. entered into an indenture with The Bank of New York Mellon, acting as trustee, pursuant to which the above-mentioned negotiable obligations were issued. This indenture includes a number of significant covenants, which are subject to important qualifications and exceptions, that, among other things, restrict the ability of Tarjeta Naranja S.A. (and certain of its subsidiaries in specific instances) to (i) incur or guarantee certain indebtedness; (ii) declare or pay certain dividends or make certain distributions; (iii) purchase, redeem, retire or otherwise acquire for value any of its capital stock; (iv) purchase, repurchase, redeem, defease or otherwise acquire or retire for value, prior to scheduled maturity, scheduled repayments or scheduled sinking fund payments, certain subordinated obligations, or intercompany indebtedness between or among Tarjeta Naranja S.A. and certain of its subsidiaries; (v) make certain investments; (vi) enter into sale and lease-back transactions; (vii) make certain asset dispositions; (viii) issue, assume or guarantee certain indebtedness secured by a lien (or cause or permit certain of its subsidiaries to do so); (ix) engage in certain transactions with affiliates; (x) engage in business activities unrelated to its current business; (xi) limit or encumber the ability of certain of its subsidiaries to pay dividends, pay indebtedness, make loans or advances or transfer properties or assets; (xii) consolidate with or merge into another person or convey, transfer or lease its properties and assets substantially as an entirety to any person; or (xiii) transfer, convey, sell, lease (or otherwise dispose of) or issue voting stock of certain of its subsidiaries.
Other Loans
The improved position of Banco Galicia after the foreign debt restructuring mentioned above, allowed Banco Galicia to have access to new facilities to finance medium- and long-term investment projects. In May 2005 and in November 2007, the IFC granted Banco Galicia a US$40 million loan and a US$50 million loan respectively, both facilities fully utilized, with a tenor of up to 8 years, for the financing of investment projects of SMEs mainly active in the agribusiness sector and export oriented. As of December 31, 2010, the principal amount of those facilities amounted to Ps.221.6 million.
-190-
In September of 2010, IFC granted Banco Galicia a US$40 million loan, with a 5 year term. In December of 2010, FMO granted Banco Galicia a US$20 million loan, with a 6 year term. The purpose of these facilities is to fund long-term loans to SMEs. The proceeds of these facilities, as of December 31, 2010, have been utilized in the amount of US$2 million. In addition, in February of 2011, IDB granted Banco Galicia a US$30 million loan, with a 5 year term, the proceeds of which are to be used to fund investment projects (green line and microfinance).
Documents on Display
We are subject to the informational requirements of the Exchange Act. In accordance with these requirements, we file reports and other information with the SEC. These materials, including this annual report and its exhibits, may be inspected and printed or copied for a fee at the SEC’s Public Reference Room at 100 F Street, N.E., Washington, D.C. 20549. You may obtain information about the operation of the Public Reference Room by calling the SEC at (202) 942-8090. These materials are also available on the SEC’s website at http://www.sec.gov. Material submitted by us can also be inspected at the offices of The Nasdaq Stock Market, Inc., 1735 K Street, N.W., Washington, D.C. 20006-1506.
| | |
| Item 11. | | Quantitative and Qualitative Disclosures About Market Risk |
General
Market risks faced by us are the risks arising from the fluctuations in interest rates and in foreign exchange rates. Our market risk arises mainly from the operations of Banco Galicia in its capacity as a financial intermediary. Our subsidiaries and equity investees other than Banco Galicia are also subject to market risk. However, the amount of these risks is not significant and they are not discussed below. Policies regarding these risks are applied at the level of our operating subsidiaries.
In compliance with the Argentine Central Bank’s regulations, based on the best practices and international standards, Banco Galicia has a Risk Management Division responsible for identifying, monitoring and actively and integrally managing the different risks Banco Galicia and its subsidiaries are exposed to (credit, financial and operational risks). The aim of the Division is to guarantee Banco Galicia’s board of directors that it is fully aware of the risks Banco Galicia is exposed to. It also creates and proposes the policies and procedures necessary to mitigate and control such risks. The Risk Management Committee, made-up of four members of the board of directors of Banco Galicia, the CEO and the managers of the Risk Management Division, the Planning and Financial Control Division and Internal Audit, is the highest corporate body to which Banco Galicia’s board of directors delegates integral risk management and the executive responsibility to define and enforce risk management policies, procedures and controls. This Committee is also responsible for setting specific limits for the exposure to each risk and approving, when applicable, temporary excesses over said limits as well as being informed of each risk position and compliance with policies.
See Item 6. “Directors, Senior Management and Employees-Functions of the Board of Directors of Banco Galicia”. Liquidity management is discussed in Item 5. “Operating and Financial Review and Prospects"-Item 5.B. “Liquidity and Capital Resources”. Credit risk management is discussed in Item 4. “Information on the Company-Selected Statistical Information-Credit Review Process” and other sections under Item 4. “Information on the Company-Selected Statistical Information” describing Banco Galicia’s loan portfolio and loan loss experience.
The following sections contain information on Banco Galicia’s sensitivity to interest-rate risk and exchange-rate risk that constitute forward-looking statements that involve risks and uncertainties. Actual results could differ from those projected in the forward-looking statements.
-191-
Interest Rate Risk
Another distinctive and natural characteristic of financial brokerage is the existence of interest-earning assets and interest-bearing liabilities with different maturities (or different rate repricing periods) and interest rates that can be fixed or variable. This situation leads to a gap or mismatch that arises from the balance sheet and measures the imbalance between fixed- and variable-rate assets and liabilities, and results in the so-called interest-rate risk or else balance sheet structural risk. A commercial bank can face the interest rate risk on both sides of its balance sheet: with regard to the income generated by assets (loans and securities) and the expenses related to the interest-bearing liabilities (deposits and others sources of funds).
The policy currently in force defines this gap as the risk that the financial margin and the economic value of the shareholders’ equity may vary as a consequence of fluctuations in market interest rates. The magnitude of such variation is associated to the sensitivity to interest rates of the structure of Banco Galicia’s assets and liabilities.
| | | | Aimed at managing and limiting the sensitivity of Banco Galicia’s economic value and results with respect to variations in the interest rate inherent to the structure of certain assets and liabilities, the following caps have been determined: |
| • | | Limit on the net financial income for the first year. |
| • | | Limit on the net present value of assets and liabilities. |
Limit on the Net Financial Income for the First Year
The effect of interest rate fluctuations on the net financial income for the first year is calculated using the methodology known as scenario simulation. On a monthly basis, net financial income for the first year is simulated in a base scenario and in a “+100 b.p.” scenario. In order to prepare each scenario, different criteria are assumed regarding the sensitivity to interest rates of assets and liabilities, depending on the historical performance observed of the different balance sheet items. Net financial income for the first year in the “+100 b.p.” scenario is compared to the net financial income for the first year in the base scenario. The resulting difference is related to the annualized accounting net financial income for the last calendar trailing quarter available, for Banco Galicia on a consolidated basis, before quotation differences and CER adjustment.
The limit on a potential loss in the “+100 b.p.” scenario with respect to the base scenario was established at 20% of the net financial income for the first year, as defined in the above paragraph. As of December 31, 2010, the negative difference between the net financial income for the first year corresponding to the “+100 b.p.” scenario and that corresponding to the base scenario accounted for -0.5% (minus 0.5%) of the net financial income for the first year. As of December 31, 2009 such loss represented 1.3% of the net financial income for the first year.
The tables below show as of December 31, 2010 and December 31, 2009, in absolute and percentage terms, the change in Banco Galicia’s net financial income (“NFI”) of the first year, as compared to the NFI of the “base” scenario corresponding to various interest-rate scenarios in which interest rates change 50, 100, 150 and 200 b.p. from those in the “base” scenario. Banco Galicia’s net portfolio is broken down into trading and non-trading. The trading net portfolio represents primarily securities issued by the Argentine Central Bank (Lebac and Nobac).
| | | | | | | | | | | | | | | | | |
| Net Portfolio | | Net Financial Income (1) | |
| (In millions of Pesos, except percentages) | | As of December 31, 2010 | | | As of December 31, 2009 | |
| Change in Interest Rates in b.p. | | Variation | | | % Change in the NFI | | | Variation | | | % Change in the NFI | |
| 200 | | | (30.4 | ) | | | (0.92 | )% | | | (47.3 | ) | | | (2.65 | )% |
| 150 | | | (22.9 | ) | | | (0.69 | )% | | | (35.4 | ) | | | (1.98 | )% |
| 100 | | | (16.2 | ) | | | (0.49 | )% | | | (23.5 | ) | | | (1.32 | )% |
| 50 | | | (7.8 | ) | | | (0.23 | )% | | | (11.8 | ) | | | (0.66 | )% |
| Static | | | — | | | | — | | | | — | | | | — | |
| (50) | | | 8.4 | | | | 0.25 | % | | | 12.1 | | | | 0.68 | % |
| (100) | | | 16.7 | | | | 0.50 | % | | | 24.8 | | | | 1.39 | % |
| (150) | | | 25.0 | | | | 0.75 | % | | | 37.4 | | | | 2.10 | % |
| (200) | | | 33.3 | | | | 1.00 | % | | | 50.1 | | | | 2.80 | % |
-192-
| | | | | | | | | | | | | | | | | |
| Net Trading Portfolio | | Net Financial Income (1) | |
| (In millions of Pesos, except percentages) | | As of December 31, 2010 | | | As of December 31, 2009 | |
| Change in Interest Rates in b.p. | | Variation | | | % Change in the NFI | | | Variation | | | % Change in the NFI | |
| 200 | | | 40.9 | | | | 1.23 | % | | | 32.5 | | | | 1.82 | % |
| 150 | | | 30.7 | | | | 0.92 | % | | | 24.4 | | | | 1.37 | % |
| 100 | | | 20.4 | | | | 0.61 | % | | | 16.3 | | | | 0.91 | % |
| 50 | | | 10.2 | | | | 0.31 | % | | | 8.1 | | | | 0.45 | % |
| Static | | | — | | | | — | | | | — | | | | — | |
| (50) | | | (10.3 | ) | | | (0.31 | )% | | | (8.2 | ) | | | (0.46 | )% |
| (100) | | | (20.5 | ) | | | (0.62 | )% | | | (16.3 | ) | | | (0.91 | )% |
| (150) | | | (30.7 | ) | | | (0.92 | )% | | | (24.4 | ) | | | (1.37 | )% |
| (200) | | | (41.0 | ) | | | (1.23 | )% | | | (32.6 | ) | | | (1.83 | )% |
| | | | | | | | | | | | | | | | | |
| Net Non Trading Portfolio | | Net Financial Income (1) | |
| (In millions of Pesos, except percentages) | | As of December 31, 2010 | | | As of December 31, 2009 | |
| Change in Interest Rates in b.p. | | Variation | | | % Change in the NFI | | | Variation | | | % Change in the NFI | |
| 200 | | | (71.3 | ) | | | (2.15 | )% | | | (79.8 | ) | | | (4.47 | )% |
| 150 | | | (53.6 | ) | | | (1.61 | )% | | | (59.8 | ) | | | (3.35 | )% |
| 100 | | | (36.6 | ) | | | (1.10 | )% | | | (39.8 | ) | | | (2.23 | )% |
| 50 | | | (18.0 | ) | | | (0.54 | )% | | | (19.9 | ) | | | (1.11 | )% |
| Static | | | — | | | | — | | | | — | | | | — | |
| (50) | | | 18.7 | | | | 0.56 | % | | | 20.3 | | | | 1.14 | % |
| (100) | | | 37.2 | | | | 1.12 | % | | | 41.1 | | | | 2.30 | % |
| (150) | | | 55.7 | | | | 1.68 | % | | | 61.8 | | | | 3.46 | % |
| (200) | | | 74.3 | | | | 2.23 | % | | | 82.7 | | | | 4.63 | % |
| | | |
| (1) | | Net interest of the first year. |
Net Present Value of Assets and Liabilities
The net present value of assets and liabilities is also calculated on a monthly basis and taking into account the assets and liabilities of Banco Galicia’s consolidated balance sheet. The net present value of the consolidated assets and liabilities, as mentioned, is calculated for a “base” scenario in which the portfolio of securities with quotation is discounted using interest rates obtained according to “yield curves” determined based on the market yields of different reference bonds denominated in Pesos, in US Dollars and adjusted by CER. Yield curves for assets and liabilities without quotation are also created using market interest rates. The net present value of assets and liabilities is also obtained for another scenario where portfolios are discounted at the rates of the aforementioned yield curves plus 100 b.p. It is worth mentioning that, in order to prepare the second scenario, it was assumed that an increase in domestic interest rates is not transferred to the yield curves of the portfolios in US Dollars.By comparing the values obtained for each scenario, the difference between the present values of shareholders’ equity in each scenario can be drawn.
The limit on a potential loss in the present value of shareholders’ equity resulting from a 100 b.p. increase in interest rates regarding the base scenario was established at 3% of the RPC. As of the fiscal year-end 2010, a 100 b.p. increase in interest rates (as mentioned in the paragraph above) resulted in a reduction in the present value of Banco Galicia’s shareholders’ equity in comparison to the value calculated for the base scenario, equivalent to -1.5% (minus 1.5%) of the RPC. For fiscal year end 2009 this reduction was -2.0% (minus 2.0%).
The analysis made was based on deterministic methods, which take in consideration only the aforementioned scenario. With the purposes of covering a larger number of scenarios, and therefore, a greater variation range of the pertinent variables, during 2010 a Balance Sheet Structural Risk Manager was developed, which, with stochastic simulations, will allow to cover a wider range of scenarios and generate results for a large variety of analyses.
One of the main applications of the manager will be the estimation of the economic capital consumption of the balance sheet structural risk. Thanks to the manager it will be possible to estimate the “VaR” (Value at Risk) inherent to Banco Galicia’s asset and interest bearing liabilities, based on the generation of a considerable number of simulations of interest rates’ movements. Likewise, the “EaR” (Earnings at Risk) will be estimated taking into consideration different interest rates evolution paths and their impact on the net financial income. Both results, —VaR and EaR— are associated with specific levels of likelihood of occurrence or degree of confidence.
-193-
In fiscal year 2011, the implementation of this tool will be completed, and economic capital will start to be estimated systematically within a comprehensive risk management framework as regards Banco Galicia.
The tables below show as of December 31, 2010 and December 31, 2009, in absolute and percentage terms, the change in Banco Galicia’s RPC versus the RPC of the “base” scenario, corresponding to various interest-rate scenarios in which interest rates change 50, 100, 150 and 200 b.p. from those in the “base” scenario. Banco Galicia’s net portfolio is broken down into trading and non-trading. The trading net portfolio represents primarily securities issued by the Argentine Central Bank (Lebac and Nobac).
| | | | | | | | | | | | | | | | | |
| Net Portfolio | | Net Fair Value | |
| (In millions of Pesos, except percentages) | | As of December 31, 2010 | | | As of December 31, 2009 | |
| Change in Interest Rates in b.p. | | Variation | | | % Change in the RPC | | | Variation | | | % Change in the RPC | |
| 200 | | | (103.6 | ) | | | (2.89 | )% | | | (104.6 | ) | | | (3.80 | )% |
| 150 | | | (78.4 | ) | | | (2.18 | )% | | | (80.1 | ) | | | (2.91 | )% |
| 100 | | | (52.7 | ) | | | (1.47 | )% | | | (54.6 | ) | | | (1.98 | )% |
| 50 | | | (26.6 | ) | | | (0.74 | )% | | | (27.9 | ) | | | (1.01 | )% |
| Static | | | — | | | | — | | | | — | | | | — | |
| (50) | | | 27.0 | | | | 0.75 | % | | | 29.2 | | | | 1.06 | % |
| (100) | | | 54.5 | | | | 1.52 | % | | | 59.7 | | | | 2.17 | % |
| (150) | | | 82.4 | | | | 2.30 | % | | | 91.7 | | | | 3.33 | % |
| (200) | | | 110.8 | | | | 3.09 | % | | | 125.3 | | | | 4.55 | % |
| | | | | | | | | | | | | | | | | |
| Net Trading Portfolio | | Net Fair Value | |
| (In millions of Pesos, except percentages) | | As of December 31, 2010 | | | As of December 31, 2009 | |
| Change in Interest Rates in b.p. | | Variation | | | % Change in the RPC | | | Variation | | | % Change in the RPC | |
| 200 | | | (2.4 | ) | | | (0.07 | )% | | | (5.3 | ) | | | (0.19 | )% |
| 150 | | | (1.8 | ) | | | (0.05 | )% | | | (4.0 | ) | | | (0.15 | )% |
| 100 | | | (1.2 | ) | | | (0.03 | )% | | | (2.6 | ) | | | (0.09 | )% |
| 50 | | | (0.6 | ) | | | (0.02 | )% | | | (1.3 | ) | | | (0.05 | )% |
| Static | | | — | | | | — | | | | — | | | | — | |
| (50) | | | 0.6 | | | | 0.02 | % | | | 1.3 | | | | 0.05 | % |
| (100) | | | 1.2 | | | | 0.03 | % | | | 2.6 | | | | 0.09 | % |
| (150) | | | 1.8 | | | | 0.05 | % | | | 3.9 | | | | 0.14 | % |
| (200) | | | 2.4 | | | | 0.07 | % | | | 5.2 | | | | 0.19 | % |
| | | | | | | | | | | | | | | | | |
| Net Non Trading Portfolio | | Net Fair Value | |
| (In millions of Pesos, except percentages) | | As of December 31, 2010 | | | As of December 31, 2009 | |
| Change in Interest Rates in b.p. | | Variation | | | % Change in the RPC | | | Variation | | | % Change in the RPC | |
| 200 | | | (101.2 | ) | | | (2.82 | )% | | | (99.3 | ) | | | (3.61 | )% |
| 150 | | | (76.6 | ) | | | (2.13 | )% | | | (76.1 | ) | | | (2.76 | )% |
| 100 | | | (51.5 | ) | | | (1.43 | )% | | | (52.0 | ) | | | (1.89 | )% |
| 50 | | | (26.0 | ) | | | (0.72 | )% | | | (26.6 | ) | | | (0.97 | )% |
| Static | | | — | | | | — | | | | — | | | | — | |
| (50) | | | 26.4 | | | | 0.74 | % | | | 27.9 | | | | 1.01 | % |
| (100) | | | 53.3 | | | | 1.48 | % | | | 57.1 | | | | 2.07 | % |
| (150) | | | 80.6 | | | | 2.25 | % | | | 87.8 | | | | 3.19 | % |
| (200) | | | 108.4 | | | | 3.02 | % | | | 120.1 | | | | 4.36 | % |
-194-
Foreign Exchange Rate Risk
Exchange-rate sensitivity is the relationship between the fluctuations of exchange rates and Banco Galicia’s net financial income resulting from the revaluation of Banco Galicia’s assets and liabilities denominated in foreign currency. The impact of variations in the exchange rate on Banco Galicia’s net financial income depends on whether Banco Galicia has a net asset foreign currency position (the amount by which foreign currency denominated assets exceed foreign currency denominated liabilities) or a short foreign currency position (the amount by which foreign currency denominated liabilities exceed foreign currency denominated assets). In the first case an increase/decrease in the exchange rate results in a gain/loss, respectively. In the second case, an increase/decrease results in a loss/gain, respectively. Banco Galicia has established limits for its consolidated foreign currency mismatches for the asset and liability positions of 30% and -10% (minus 10%) of Banco Galicia’s RPC, respectively. At the end of the fiscal year, Banco Galicia’s net asset position in foreign currency represented 2.2% of its RPC.
As of December 31, 2010, Banco Galicia had a net asset foreign currency position of Ps.40.7 million equivalent to US$10.2 million, after adjusting its on-balance sheet net liability position of Ps.792.5 million (US$199.3 million) by net forward purchases of foreign currency without delivery of the underlying asset, for Ps.833.2 million (US$209.6 million), recorded off-balance sheet.
As of December 31, 2009, Banco Galicia had a net asset foreign currency position of Ps.61.1 million equivalent to US$16.1 million, after adjusting its on-balance sheet net liability position of Ps.176.0 million (US$46.3 million) by net forward purchases of foreign currency without delivery of the underlying asset, for Ps.237.1 million (US$62.4 million), recorded off-balance sheet.
As of December 31, 2008, Banco Galicia had a net asset foreign currency position of Ps.227.6 million equivalent to US$65.9 million, after adjusting its on-balance sheet net liability position of Ps.162.2 million (US$47.0 million) by net forward purchases of foreign currency without delivery of the underlying asset, for Ps.389.8 million (US$112.9 million), recorded off-balance sheet.
The tables below show the effects of changes in the exchange rate of the Peso vis-à-vis the US Dollar on the value of Banco Galicia’s foreign currency net asset position as of December 31, 2010, 2009 and 2008. As of these dates, the breakdown of Banco Galicia’s foreign currency net asset position into trading and non-trading is not presented, as Banco Galicia’s foreign currency trading portfolio was not material.
| | | | | | | | | | | | | |
| | | Value of Foreign Currency Net Position as of | |
| | | December 31, 2010 | |
| Percentage Change in the Value of the Peso Relative to the Dollar(1) | | Amount | | | Absolute Variation | | | % Change | |
| | | (In millions of Pesos, except percentages) | |
| 40% | | | 57.0 | | | | 16.3 | | | | 40.0 | |
| 30% | | | 52.9 | | | | 12.2 | | | | 30.0 | |
| 20% | | | 48.8 | | | | 8.1 | | | | 19.9 | |
| 10% | | | 44.8 | | | | 4.1 | | | | 10.1 | |
| Static | | | 40.7 | (2) | | | — | | | | — | |
| (10)% | | | 36.6 | | | | (4.1 | ) | | | (10.1 | ) |
| (20)% | | | 32.6 | | | | (8.1 | ) | | | (19.9 | ) |
| (30)% | | | 28.5 | | | | (12.2 | ) | | | (30.0 | ) |
| (40)% | | | 24.4 | | | | (16.3 | ) | | | (40.0 | ) |
| | | |
| (1) | | Devaluation / (Revaluation). |
| |
| (2) | | Adjusted to reflect forward purchases and sales of foreign currency without delivery of the underlying asset, registered in memorandum accounts. |
| | | | | | | | | | | | | |
| | | Value of Foreign Currency Net Position as of | |
| | | December 31, 2009 | |
| Percentage Change in the Value of the Peso Relative to the Dollar(1) | | Amount | | | Absolute Variation | | | % Change | |
| | | (In millions of Pesos, except percentages) | |
| 40% | | | 85.5 | | | | 24.4 | | | | 39.9 | |
| 30% | | | 79.4 | | | | 18.3 | | | | 30.0 | |
| 20% | | | 73.3 | | | | 12.2 | | | | 20.0 | |
| 10% | | | 67.2 | | | | 6.1 | | | | 10.0 | |
| Static | | | 61.1 | (2) | | | — | | | | — | |
| (10)% | | | 55.0 | | | | (6.1 | ) | | | (10.0 | ) |
| (20)% | | | 48.9 | | | | (12.2 | ) | | | (20.0 | ) |
| (30)% | | | 42.8 | | | | (18.3 | ) | | | (30.0 | ) |
| (40)% | | | 36.7 | | | | (24.4 | ) | | | (39.9 | ) |
| | | |
| (1) | | Devaluation / (Revaluation). |
| |
| (2) | | Adjusted to reflect forward purchases and sales of foreign currency without delivery of the underlying asset, registered in memorandum accounts. |
-195-
| | | | | | | | | | | | | |
| | | Value of Foreign Currency Net Position as of | |
| | | December 31, 2008 | |
| Percentage Change in the Value of the Peso Relative to the Dollar(1) | | Amount | | | Absolute Variation | | | % Change | |
| | | (In millions of Pesos, except percentages) | |
| 40% | | | 318.6 | | | | 91.0 | | | | 40.0 | |
| 30% | | | 295.9 | | | | 68.3 | | | | 30.0 | |
| 20% | | | 273.1 | | | | 45.5 | | | | 20.0 | |
| 10% | | | 250.4 | | | | 22.8 | | | | 10.0 | |
| Static | | | 227.6 | (2) | | | — | | | | — | |
| (10)% | | | 204.8 | | | | (22.8 | ) | | | (10.0 | ) |
| (20)% | | | 182.1 | | | | (45.5 | ) | | | (20.0 | ) |
| (30)% | | | 159.3 | | | | (68.3 | ) | | | (30.0 | ) |
| (40)% | | | 136.6 | | | | (91.0 | ) | | | (40.0 | ) |
| | | |
| (1) | | Devaluation / (Revaluation). |
| |
| (2) | | Adjusted to reflect forward purchases and sales of foreign currency without delivery of the underlying asset, registered in memorandum accounts. |
Currency Mismatches
Financial brokerage naturally involves the raising of funds and the subsequent use thereof. Both funding (deposits and other alternative sources of financing) and the use of the funds in loans and/or investments can be carried out in assets and liabilities denominated in different currencies. This possible currency mismatch between liabilities and the use thereof on assets generates a source of risk that arises from the variations in the different foreign currency exchange rates. This risk is inherent to the structure of assets and liabilities per currency.
Currency risk is defined as the risk of incurring in equity losses as a consequence of variations in the foreign currency exchange rates in which assets and liabilities (both on and off the Balance Sheet) are denominated.
For purposes of the management and mitigation of the currency risk, two other currencies have been defined apart from the Argentine Peso: Assets and liabilities adjusted by CER and foreign currency.
The policy framework currently in force establishes limits in terms of maximum net asset positions (assets denominated in a currency which are higher than the liabilities denominated in such currency) and net liability positions (assets denominated in a currency which are lower than the liabilities denominated in such currency) for mismatches in Pesos adjusted by CER and in foreign currency, as a proportion of Banco Galicia’s RPC, on a consolidated basis.
Banco Galicia manages mismatches not only regarding assets and liabilities, but also covering mismatches through the foreign currency futures market. Transactions in foreign currency futures (US Dollar futures) are subject to limits that take into consideration particular characteristics of each trading environment.
-196-
The table below shows the composition of Banco Galicia’s shareholders’ equity by currency and type of principal adjustment, that is Banco Galicia’s assets and liabilities denominated in foreign currency, in Pesos and adjustable by the CER, as of December 31, 2010.
| | | | | | | | | | | | | |
| | | As of December 31, 2010 | |
| | | Assets | | | Liabilities | | | Gap | |
| | | (In millions of Pesos) | |
Financial Assets and Liabilities | | | 32,948.7 | | | | 31,091.5 | | | | 1,857.2 | |
| Pesos — Adjusted by CER | | | 577.0 | | | | 13.6 | | | | 563.4 | |
| Pesos — Unadjusted | | | 25,668.4 | | | | 23,582.1 | | | | 2,086.3 | |
Foreign Currency(1) | | | 6,703.3 | | | | 7,495.8 | | | | (792.5 | ) |
Other Assets and Liabilities | | | 2,350.2 | | | | 1,611.7 | | | | 738.5 | |
| | | | | | | | | | |
Total Gap | | | 35,298.9 | | | | 32,703.2 | | | | 2,595.7 | |
| | | | | | | | | | |
| | | | | | | | |
Adjusted for Forward Transactions Recorded in Memo Accounts | | | | | | | | | | | | |
Financial Assets and Liabilities | | | 32,948.7 | | | | 31,091.5 | | | | 1,857.2 | |
| Pesos — Adjusted by the CER | | | 577.0 | | | | 13.6 | | | | 563.4 | |
Pesos — Unadjusted, Including Shareholders’ Equity(2) | | | 22,260.0 | | | | 21,006.9 | | | | 1,253.1 | |
Foreign Currency(1)(2) | | | 10,111.7 | | | | 10,071.0 | | | | 40.7 | |
Other Assets and Liabilities | | | 2,350.2 | | | | 1,611.7 | | | | 738.5 | |
| | | | | | | | | | |
Total Adjusted Gap | | | 35,298.9 | | | | 32,703.2 | | | | 2,595.7 | |
| | | | | | | | | | |
| | | |
| (1) | | In Pesos, at an exchange rate of Ps.3.9758 per US$1.0. |
| |
| (2) | | Adjusted for forward sales and purchases of foreign exchange made by Banco Galicia and recorded off-balance sheet. |
As of December 31, 2010, considering the adjustments from forward transactions registered under memorandum accounts, Banco Galicia had net asset positions in all currencies.
The paragraphs below describe the composition of the different currency mismatches as of December 31, 2010.
Peso-denominated Assets and Liabilities Adjusted by CER
At fiscal year-end, Banco Galicia had a net asset position of Ps.563.4 million, mainly made up of Ps.521.9 million corresponding to the participation certificate in Galtrust I Financial Trust.
The limit established for the CER-adjusted mismatch is at 100% and at 25% of Banco Galicia’s RPC for the net asset position and the net liability position, respectively. At fiscal year-end, the asset position in Pesos adjusted by CER accounted for 15.7% of Banco Galicia’s RPC.
Assets and Liabilities Denominated in Foreign Currency
Banco Galicia’s assets denominated in foreign currency mainly comprised the following: (i) Loans to the non-financial private sector and residents abroad for Ps.3,103.4 million (principal and interests, net of allowances), and (ii) cash and balances held at the Argentine Central Bank and correspondent banks for Ps.3,120.9 million.
Banco Galicia’s liabilities denominated in foreign currency consisted mainly of: (i) Deposits for Ps.4,023.1 million (principal, interests and quotation differences); (ii) Ps.1,551.7 million of subordinated and unsubordinated negotiable obligations issued by Banco Galicia and the Regional Credit Card Companies (iii) debt with banks and international credit agencies for Ps.703.1 million, (iv) Ps.613.3 million in connection with collections for third parties, (v) Ps.437.7 million corresponding to creditors on account of the repurchase agreement transactions agreed upon with the Bonar 2015 Bonds portfolio (principal plus premiums), and (vi) Ps.12.8 million of payable accrued interests for other liabilities resulting from financial brokerage.
A net liability position of Ps.792.5 million stems from the consolidated balance sheet. Furthermore, forward transactions in foreign currency without delivery of the underlying asset for Ps.833.2 million were recorded in memorandum accounts. Therefore, as of that date, Banco Galicia’s net position in foreign currency adjusted to reflect these transactions was an asset position of Ps.40.7 million, equivalent to US$10.2 million.
Banco Galicia has set limits as regards foreign-currency mismatches at 30% and 10% of Banco Galicia’s RPC for its net asset position and its short position, respectively. At the end of the fiscal year, Banco Galicia’s net asset position in foreign currency represented 1.1% of its RPC.
-197-
Non-Adjusted Peso-Denominated Assets and Liabilities
Banco Galicia’s non-adjusted Peso-denominated assets mainly comprised the following: (i) Loans to the non-financial private sector for Ps.18,161.9 million (principal plus interests, net of allowances); (ii) cash and balances held at the Argentine Central Bank and correspondent banks for Ps.2,890.1 million (including the balance of escrow accounts); (iii) Ps.2,047.2 million corresponding to the holdings of securities issued by the Argentine Central Bank; (iv) Ps.907.8 million of forward purchases related to repurchase agreement transactions of Bonar 2015 Bonds, Lebac and Nobac; (v) Ps.409.0 million corresponding to debt securities and participation certificates in various financial trusts; and (vi) Ps.133.8 million corresponding to holdings of Bonar 2015 Bonds.
Banco Galicia’s non-adjusted Peso-denominated liabilities mainly comprised: (i) Deposits for Ps.18,206.1 million (principal plus interests); (ii) liabilities with stores in connection with credit card activities corresponding to Banco Galicia and the Regional Credit Card Companiesfor Ps.2,952.8 million; (iii) Ps.599.6 million in liabilities with local financial institutions (almost all corresponding to the Regional Credit Card Companies); and (iv) Ps.359.1 million (principal plus premium) corresponding to creditors on account of repurchase agreement transactions of Lebac and Nobac.
The net asset position in non-adjusted Peso-denominated assets and liabilities was of Ps.1,253.1 million at fiscal year-end.
Other Assets and Liabilities
In the category “Other Assets and Liabilities”, the assets were mainly the following: (i) Bank, premises and equipment, miscellaneous and intangible assets for Ps.1,448.9 million; (ii) miscellaneous receivables for Ps.779.4 million, and (iii) equity investments for Ps.65.8 million. Liabilities mainly included Ps.816.5 million recorded under “Miscellaneous Liabilities” and allowances for other contingencies for Ps.695.5 million.
Market Risk
The exposure to portfolios of listed financial instruments, whose value varies according to the movement in their market prices, is subject to a specific policy framework that regulates the risk of incurring a loss as a consequence of the variation of the market price of financial assets whose value is subject to negotiation.
Brokerage transactions and/or investments in government securities, currencies, derivative products and debt instruments issued by the Argentine Central Bank are governed by the policy that limits the maximum tolerable loss in a given fiscal year.
In order to measure and monitor this source of risk, the VaR model is used, among others. This model determines intra-daily, for Banco Galicia individually, the possible loss that could be generated by the positions in securities, derivative instruments and currencies under certain parameters.
The parameters taken into consideration are as follows:
| | (i) | | The VaR model enjoys a measured 95% – 99% degree of accuracy. |
| | (ii) | | VaR estimates are made for holding periods of one day and “n” days, where “n” is defined as the number of days necessary to settle the position in each security. |
| | (iii) | | In the case of new issuances, the available trading days are taken into consideration; if there are not enough trading days or if there are no quotations, the volatility of bonds from domestic issuers with similar risk and characteristics is used. |
Likewise, the measurement method known as Dollar Value of One Basis Point (“DVO1”) is also applied to measure and monitor the trading of debt instruments issued by the Argentine Central Bank.
-198-
Banco Galicia’s policy requires that the Risk Management and Treasury Divisions agree on the parameters under which the models work and establishes the maximum losses authorized both for securities, foreign-currency, Argentine Central Bank’s debt instruments and derivative products in a fiscal year. Maximum losses were established in:
| | | | | |
|
| Securities | | Ps. | 15.0 million. | |
| Currencies | | Ps. | 1.0 million. | |
| Interest Rate Derivatives | | Ps. | 0.5 million. | |
| Lebac / Nobac | | Ps. | 0.9 million. | |
Banco Galicia was within policy guidelines.
During 2011, a comprehensive review of the methods to measure and control market risk is planned with the purpose of evaluating the need to adjust the existing models and / or move towards the design of more sophisticated measuring tools.
Stress Test
The policies approved for the respective financial risks, limit exposures taking into account the different risk factors that may come about within certain ranges of occurrence. Extreme, unlikely and high-impact events are not strictly provided for in the policies.
In order to assess the effect of adverse and highly unlikely scenarios regarding the different exposures to which Banco Galicia’s business is subject to, the analysis is supplemented with stress tests. These practices are intended to evaluate the impact of extreme scenarios and allow estimating the loss that the occurrence of any of these events could cause.
The information provided by this tool, not only allows to measure a special market condition but also provides supporting evidence for a possible modification of a current policy or the implementation of corrective measures to tailor Banco Galicia’s risk profile. Also, stress tests are common practice when designing or updating a policy.
In fiscal year 2011, periodic stress tests will be developed and gradually performed on Banco Galicia’s main risk exposures. The implementation of these tests, together with the existing policies, will contribute to an efficient assessment of risk exposures and to their management and mitigation.
| | |
| Item 12. | | Description of Securities Other Than Equity Securities |
| | |
| Item 12.D. | | American Depositary Shares |
Fees and Charges Applicable to ADS Holders
The depositary collects its fees for delivery and surrender of ADSs directly from investors depositing shares or surrendering ADSs for the purpose of withdrawal or from intermediaries acting for them. The depositay collects fees for making distributions to investors by deducting those fees from the amounts distributed or by selling a portion of distributable property to pay the fees. The depositary may collect its annual fee for depositary services by deductions from cash distributions or by directly billing investors or by charging the book-entry system accounts of participants acting for them. The depositary may generally refuse to provide fee-attracting services until its fees for those services are paid.
| | | |
| Persons depositing or withdrawing shares must pay | | For: |
| $5.00 (or less) per 100 ADSs (or portion of 100 ADSs) | | • Issuance of ADSs, including issuances resulting from a distribution of shares or rights or other property |
| | | • Cancellation of ADSs for the purpose of withdrawal, including if the deposit agreement terminates |
| $0.02 (or less) per ADS | | • Any cash distribution to ADS registered holders |
| A fee equivalent to the fee that would be payable if securities distributed to you had been shares and the shares had been deposited for issuance of ADSs | | • Distribution of securities distributed to holders of deposited securities which are distributed by the depositary to ADS registered holders |
-199-
| | | |
| Persons depositing or withdrawing shares must pay | | For: |
| Registration or transfer fees | | • Transfer and registration of shares on our share register to or from the name of the depositary or its agent when you deposit or withdraw shares |
| Expenses of the depositary | | • Cable, telex and facsimile transmissions (when expressly provided in the deposit agreement) |
| | | • Converting foreign currency to US Dollars |
| Taxes and other governmental charges the depositary or the custodian have to pay on any ADS or share underlying an ADS, for example, stock transfer taxes, stamp duty or withholding taxes. | | • As necessary |
Any charges incurred by the depositary or its agents
for servicing the deposited securities | | • As necessary |
Fees and Direct and Indirect Payments Made by the Depositary to Us
Past Fees and Payments
During 2010, Grupo Financiero Galicia S.A. received a payment of US$350,000 for services rendered in 2009 and US$247,552.76 regarding the same services rendered in 2010, for continuing annual stock exchange listing fees, standard out-of-pocket maintenance costs for the ADRs (consisting of the expenses of postage and envelopes for mailing annual and interim financial reports, printing and distributing dividend checks, electronic filing of U.S. Federal tax information, mailing required tax forms, stationery, postage, facsimile and telephone calls) accounting fees and legal fees.
Future Fees and Payments
The Bank of New York Mellon, as depositary, has agreed to reimburse the Company for expenses they incur that are related to establishment and maintenance expenses of the ADSs program. The depositary has agreed to reimburse the Company for its continuing annual stock exchange listing fees and certain accounting and legal fees. The depositary has also agreed to pay the standard out-of-pocket maintenance costs for the ADRs, which consists of the expenses of postage and envelopes for mailing annual and interim financial reports, printing and distributing dividend checks, electronic filing of U.S. Federal tax information, mailing required tax forms, stationery, postage, facsimile, and telephone calls. It has also agreed to reimburse the Company annually for certain investor relationship programs or special investor relations promotional activities. There are limits on the amount of expenses for which the depositary will reimburse the Company, but the amount of reimbursement available to the Company is not tied to the amount of fees the depositary collects from investors.
The depositary collects its fees for delivery and surrender of ADSs directly from investors depositing shares or surrendering ADSs for the purpose of withdrawal or from intermediaries acting for them. The depositary collects fees for making distributions to investors by deducting those fees from the amounts distributed or by selling a portion of distributable property to pay the fees. The depositary may collect its annual fee for depositary services by deduction from cash distributions or by directly billing investors or by charging the book-entry system accounts of participants acting for them. The depositary may generally refuse to provide fee-attracting services until its fees for those services are paid.
We expect to receive a similar reimbursement from the depositary for expenses for the fiscal year 2011, to the one we received for the fiscal year 2010.
-200-
PART II
| | |
| Item 13. | | Defaults, Dividend Arrearages and Delinquencies |
Not applicable.
| | |
| Item 14. | | Material Modifications to the Rights of Security Holders and Use of Proceeds |
Not applicable.
| | |
| Item 15. | | Controls and Procedures |
(a) Disclosure Controls and Procedures.
We maintain disclosure controls and procedures (as defined in Rules 13a-15(e) and 15d-15(e) of the Exchange Act, as amended). We performed an evaluation of the effectiveness of our disclosure controls and procedures that are designed to ensure that information required to be disclosed by us in the reports that we file with or submit to the SEC under the Exchange Act, as amended, is recorded, processed, summarized and reported, within the time periods specified in the SEC’s rules and forms and is accumulated and communicated to our management, including our Chief Executive Officer and Chief Financial Officer, as appropriate to allow timely decisions regarding required disclosure. Based on our evaluation, our Chief Executive Officer and Chief Financial Officer concluded that, as of the end of the period covered by this annual report, our disclosure controls and procedures were effective. Notwithstanding the effectiveness of our disclosure controls and procedures, these disclosure controls and procedures cannot provide absolute assurance of achieving their objectives because of their inherent limitations. Disclosure controls and procedures are processes that involve human diligence and compliance and are subject to error in judgment. Because of such limitations, there is a risk that material misstatements may not be prevented or detected on a timely basis by our disclosure controls and procedures.
(b) Management’s Annual Report on Internal Control Over Financial Reporting.
1) Our management is responsible for establishing and maintaining adequate internal control over financial reporting for us and our consolidated subsidiaries. Internal control over financial reporting is defined in Rule 13a-15(f) and 15d-15(f) under the Exchange Act, as amended, as a process designed by, or under the supervision of, our principal executive and principal financial officers, and effected by our Board of Directors, management and other personnel, to provide reasonable assurance regarding the reliability of financial reporting and the preparation of consolidated financial statements in accordance with applicable generally accepted accounting principles. Internal controls and procedures are processes that involve human diligence and compliance and are subject to error in judgment. Because of its inherent limitations, internal control over financial reporting may not prevent or detect all misstatements. Also, projections of any evaluation of effectiveness to future periods are subject to the risk that controls may become inadequate because of changes in conditions, or that the degree of compliance with the policies or procedures may deteriorate.
2) Our management, including our Chief Executive Officer and Chief Financial Officer has evaluated the effectiveness of our internal control over financial reporting as of the end of the period covered by this annual report. In making this assessment, we used the criteria established in “Internal Control — Integrated Framework issued by the Committee of Sponsoring Organizations” of the Treadway Commission, or COSO.
3) Based on our assessment, we and our management have concluded that, as of the end of the period covered by this annual report, our internal control over financial reporting was effective.
-201-
4) Price Waterhouse & Co. S.R.L., an independent registered public accounting firm, has audited as of the end of the period the effectiveness of our internal control over financial reporting as of December 31, 2010, as stated in their report to our financial statements.
(c) See Item 18. “Financial Statements-Report of the Independent Registered Public Accounting Firm as of and for the fiscal years ended December 31, 2010, 2009 and 2008” for our registered public accounting firm’s attestation report on management’s assessment of our internal control over financial reporting.
(d) Changes in Internal Control Over Financial Reporting.
During the period covered by this report, there have not been any changes in our internal control over financial reporting (as such term is defined in Rules 13a-15(f) and 15d-15(f) under the Exchange Act, as amended) that have materially affected or are reasonably likely to materially affect, our internal control over financial reporting.
| | |
| Item 16A. | | Audit Committee Financial Expert |
Mr. Luis O. Oddone is our Audit Committee financial expert and he is independent as that term is defined under Nasdaq National Market listing requirements.
We have adopted a code of ethics (for Grupo Financiero Galicia and its main subsidiaries) in accordance with the requirements of Section 406 of the Sarbanes-Oxley Act of 2002. We did not modify our code of ethics during fiscal year 2010. In addition, we did not grant any waivers to our code of ethics during fiscal year 2010. In June 2009, we adopted a code of corporate governance good practices in accordance with Argentine legal requirements that received minor modifications in 2010. Our code of ethics and our code of corporate governance good practices are attached hereto as Exhibits 11.1 and 11.2.
| | |
| Item 16C. | | Principal Accountants’ Fees and Services |
The following table sets forth the total amount billed to us by our independent registered public accounting firm, Price Waterhouse & Co. S.R.L., during the fiscal years ended December 31, 2010 and 2009.
| | | | | | | | | |
| | | 2010 | | | 2009 | |
| | | (In thousands of Pesos) | |
| Audit Fees | | | 8,018 | | | | 6,882 | |
| Audit Related Fees | | | 1,717 | | | | 1,648 | |
| Tax Fees | | | 981 | | | | 891 | |
| All Other Fees | | | 919 | | | | 964 | |
| | | | | | | |
Total | | | 11,635 | | | | 10,385 | |
| | | | | | | |
Audit Fees
Audit fees are mainly the fees billed in relation with professional services for auditing our consolidated financial statements under local and U.S. GAAP requirements for fiscal years 2010 and 2009.
-202-
Audit-Related Fees
Audit-related fees are fees billed for professional services related to attestation, review and verification services with respect to our financial information and the provision of services in connection with special reports in 2010 and 2009.
Tax Fees
Tax fees are fees billed with respect to tax compliance and advisory services related to tax liabilities.
All Other Fees
All other fees include fees paid for professional services other than the services reported above under “audit fees”, “audit related fees” and “tax fees” in each of the fiscal periods above.
Audit Committee Pre-approval
Our audit committee is required to pre-approve all audit and non-audit services to be provided by our independent registered public accounting firm. Since 2004, our Audit Committee has reviewed and approved audit and non-audit services fees proposed by our independent auditors.
| | |
| Item 16D. | | Exemptions from the Listing Standards for Audit Committees |
Not applicable.
| | |
| Item 16E. | | Purchases of Equity Securities by the Issuer and Affiliated Purchasers |
None.
-203-
PART III
| | |
| Item 17. | | Financial Statements |
Not applicable.
| | |
| Item 18. | | Financial Statements |
Report of the Independent Registered Public Accounting Firm as of and for the fiscal years ended December 31, 2010, 2009 and 2008.
Consolidated Balance Sheets as of December 31, 2010 and 2009.
Consolidated Statements of Income for the years ended December 31, 2010, 2009 and 2008.
Consolidated Statements of Cash Flows for the years ended December 31, 2010, 2009 and 2008.
Consolidated Statements of Changes in Shareholders’ Equity for the years ended December 31, 2010, 2009 and 2008.
Notes to the Consolidated Financial Statements.
You can find our audited consolidated financial statements on pages F-1 to F-105 of this annual report.
| | | | | |
| Exhibit | | Description |
| | | | | |
| | 1.1 | | | Unofficial English language translation of the Bylaws (estatutos sociales).**** |
| | | | | |
| | 2.1 | | | Form of Deposit Agreement between The Bank of New York and the registrant, including the form of American Depositary Receipt.* |
| | | | | |
| | 2.2 | | | Indenture, dated as of May 18, 2004, among Banco Galicia, The Bank of New York and Banco Rio de la Plata S.A.** |
| | | | | |
| | 2.3 | | | Indenture, dated as of June 4, 2009, among Grupo Financiero Galicia, The Bank of New York Mellon, Banco de Valores S.A. and The Bank of New York (Luxembourg) S.A.******* |
| | | | | |
| | 2.4 | | | Indenture, dated as of June 8, 2010, among Grupo Financiero Galicia, The Bank of New York Mellon, Banco de Valores S.A. and The Bank of New York Mellon (Luxembourg) S.A.******** |
| | | | | |
| | 2.5 | | | Indenture, dated as of May 4, 2011, among Banco de Galicia y Buenos Aires S.A., The Bank of New York Mellon, Banco de Valores S.A. and The Bank of New York Mellon (Luxembourg) S.A. |
| | | | | |
| | 2.6 | | | Indenture, dated as of January 28, 2011, among Tarjeta Naranja S.A., The Bank of New York Mellon, Banco de Valores S.A. and The Bank of New York Mellon (Luxembourg) S.A. |
| | | | | |
| | 4.1 | | | English translation of form of Financial Trust Contract, dated April 16, 2002, among Banco Galicia, Banco Provincia de Buenos Aires and BAPRO Mandatos y Negocios S.A.*** |
| | | | | |
| | 4.2 | | | Form of Restructured Loan Facility (as evidenced by the Note Purchase Agreement, dated as of April 27, 2004, among Banco de Galicia y Buenos Aires S.A., Barclays Bank PLC, the holders party thereto and Deutsche Bank Trust Company Americas).** |
-204-
| | | | | |
| Exhibit | | Description |
| | | | | |
| | 4.3 | | | Form of First Amendment and Waiver to Restructured Loan Facility (as evidenced by the First Amendment and Waiver to the Note Purchase Agreement, dated as of December 20, 2004, among Banco de Galicia y Buenos Aires S.A., the holders party thereto and Deutsche Bank Trust Company Americas).**** |
| | | | | |
| | 4.4 | | | Form of Second Amendment to Restructured Loan Facility (as evidenced by the Second Amendment to the Note Purchase Agreement, dated as of August 25, 2006, among Banco de Galicia y Buenos Aires S.A., the holders party thereto and Deutsche Bank Trust Company Americas).***** |
| | | | | |
| | 4.5 | | | Form of Third Amendment to Restructured Loan Facility (as evidenced by the Third Amendment to the Note Purchase Agreement, dated as of December 28, 2007, among Banco de Galicia y Buenos Aires S.A., the holders party thereto and Deutsche Bank Trust Company Americas).****** |
| | | | | |
| | 4.6 | | | Loan Agreement, dated as of July 24, 2007, between Grupo Financiero Galicia S.A. and Merrill Lynch International.****** |
| | | | | |
| | 4.7 | | | Stock Purchase Agreement, dated as of June 1, 2009, among American International Group Inc., AIG Consumer Finance Group, Inc. and Banco de Galicia y Buenos Aires S.A., and the other parties signatory thereto.******** |
| | | | | |
| | 4.8 | | | Loan Agreement, dated as of September 8, 2010, between Banco de Galicia y Buenos Aires S.A. and International Finance Corporation. |
| | | | | |
| | 4.9 | | | Loan Agreement, dated as of December 17, 2010, between Banco de Galicia y Buenos Aires S.A. and Netherlands Financierings-Moatschappy Voor Ont Wikkelingslanden N.V. |
| | | | | |
| | 4.10 | | | Loan Agreement, dated as of February 15, 2011, between Banco de Galicia y Buenos Aires S.A. and Inter-American Development Bank. |
| | | | | |
| 8.1 | | For a list of our subsidiaries as of the end of the fiscal year covered by this annual report, please see Item 4. “Information on the Company-Organizational Structure”. |
| | | | | |
| | 11.1 | | | Code of Ethics.******* |
| | | | | |
| | 11.2 | | | Code of Corporate Governance Good Practices. |
| | | | | |
| | 12.1 | | | Certification of the principal executive officer required under Rule 13a-14(a) or Rule 15d-14(a), pursuant to Section 302 of the Sarbanes-Oxley Act of 2002. |
| | | | | |
| | 12.2 | | | Certification of the principal financial officer required under Rule 13a-14(a) or Rule 15d-14(a), pursuant to Section 302 of the Sarbanes-Oxley Act of 2002. |
| | | | | |
| | 13.1 | | | Certification of the principal executive officer required pursuant to 18 U.S.C. Section 1350, as adopted pursuant to Section 906 of the Sarbanes-Oxley Act of 2002. |
| | | | | |
| | 13.2 | | | Certification of the principal financial officer required pursuant to 18 U.S.C. Section 1350, as adopted pursuant to Section 906 of the Sarbanes-Oxley Act of 2002. |
| | | |
| * | | Incorporated by reference from our Registration Statement on Form F-4 (333-11960). |
| |
| ** | | Incorporated by reference from our Annual Report on Form 20-F for the year ended December 31, 2003. |
| |
| *** | | Incorporated by reference from our Annual Report on Form 20-F for the year ended December 31, 2002. |
| |
| **** | | Incorporated by reference from our Annual Report on Form 20-F for the year ended December 31, 2004. |
| |
| ***** | | Incorporated by reference from our Annual Report on Form 20-F for the year ended December 31, 2006. |
| |
| ****** | | Incorporated by reference from our Annual Report on Form 20-F for the year ended December 31, 2007. |
| |
| ******* | | Incorporated by reference from our Annual Report on Form 20-F for the year ended December 31, 2008. |
| |
| ******** | | Incorporated by reference from our Annual Report on Form 20-F for the year ended December 31, 2009. |
-205-
SIGNATURE
The registrant hereby certifies that it meets all of the requirements for filing on Form 20-F and that it has duly caused and authorized the undersigned to sign this annual report on its behalf.
| | | | | |
| | GRUPO FINANCIERO GALICIA S.A.
| |
| | By: | /s/ Pedro Alberto Richards | |
| | | Name: | Pedro Alberto Richards | |
| | | Title: | Chief Executive Officer | |
| | | |
| | By: | /s/ José Luis Gentile | |
| | | Name: | José Luis Gentile | |
| | | Title: | Chief Financial Officer | |
Date: June 29, 2011
-206-
GRUPO FINANCIERO GALICIA S.A. AND SUBSIDIARIES
INDEX TO CONSOLIDATED FINANCIAL STATEMENTS
| | | | | |
| | | Page | |
| | | | | |
| | | F-2 | |
| | | | | |
| | | F-3 | |
| | | | | |
| | | F-6 | |
| | | | | |
| | | F-8 | |
| | | | | |
| | | F-10 | |
| | | | | |
| | | F-11 | |
| | | | | |
F-1
Report of Independent Registered Public Accounting Firm
To the Board of Directors and Shareholders of Grupo Financiero Galicia S.A.
In our opinion, the accompanying consolidated balance sheets and the related consolidated statements of income, change in shareholders’ equity and cash flows present fairly, in all material respects, the financial position of Grupo Financiero Galicia S.A. and its subsidiaries (the “Company”) at December 31, 2010 and 2009, and the results of their operations and their cash flows for each of the three years in the period ended December 31, 2010 in conformity with accounting rules prescribed by the Banco Central de la República Argentina (the “BCRA”). Also in our opinion, the Company maintained, in all material respects, effective internal control over financial reporting as of December 31, 2010, based on criteria established in Internal Control — Integrated Framework issued by the Committee of Sponsoring Organizations of the Treadway Commission (COSO). The Company’s management is responsible for these financial statements, for maintaining effective internal control over financial reporting and for its assessment of the effectiveness of internal control over financial reporting, included in the Management’s Annual Report on Internal Control Over Financial Reporting appearing in Item 15. Our responsibility is to express opinions on these financial statements and on the Company’s internal control over financial reporting based on our integrated audits. We conducted our audits in accordance with the standards of the Public Company Accounting Oversight Board (United States). Those standards require that we plan and perform the audits to obtain reasonable assurance about whether the financial statements are free of material misstatement and whether effective internal control over financial reporting was maintained in all material respects. Our audits of the financial statements included examining, on a test basis, evidence supporting the amounts and disclosures in the financial statements, assessing the accounting principles used and significant estimates made by management, and evaluating the overall financial statement presentation. Our audit of internal control over financial reporting included obtaining an understanding of internal control over financial reporting, assessing the risk that a material weakness exists, and testing and evaluating the design and operating effectiveness of internal control based on the assessed risk. Our audits also included performing such other procedures as we considered necessary in the circumstances. We believe that our audits provide a reasonable basis for our opinions.
Accounting rules prescribed by the BCRA vary in certain significant respects from accounting principles generally accepted in Argentina for enterprises in general and from accounting principles generally accepted in the United States of America. Information relating to the nature and effect of such differences is presented in Notes 33 and 35 to the consolidated financial statements, respectively.
A company’s internal control over financial reporting is a process designed to provide reasonable assurance regarding the reliability of financial reporting and the preparation of financial statements for external purposes in accordance with generally accepted accounting principles. A company’s internal control over financial reporting includes those policies and procedures that (i) pertain to the maintenance of records that, in reasonable detail, accurately and fairly reflect the transactions and dispositions of the assets of the company; (ii) provide reasonable assurance that transactions are recorded as necessary to permit preparation of financial statements in accordance with generally accepted accounting principles, and that receipts and expenditures of the company are being made only in accordance with authorizations of management and directors of the company; and (iii) provide reasonable assurance regarding prevention or timely detection of unauthorized acquisition, use, or disposition of the company’s assets that could have a material effect on the financial statements.
Because of its inherent limitations, internal control over financial reporting may not prevent or detect misstatements. Also, projections of any evaluation of effectiveness to future periods are subject to the risk that controls may become inadequate because of changes in conditions, or that the degree of compliance with the policies or procedures may deteriorate.
/s/ Price Waterhouse & Co. S.R.L.
Buenos Aires, Argentina
February 17, 2011, except for notes 27, 31, 34 and 35 as to which the date is June 29, 2011.
F-2
Grupo Financiero Galicia S.A. and Subsidiaries
Consolidated Balance Sheets
As of December 31, 2010 and 2009
(Expressed in thousands of Argentine pesos)
| | | | | | | | | |
| | | December 31, | |
| | | 2010 | | | 2009 | |
ASSETS | | | | | | | | |
| A. Cash and due from banks | | | | | | | | |
| Cash | | | 1,489,374 | | | | 1,379,888 | |
| Financial institutions and correspondents | | | 4,156,197 | | | | 2,316,421 | |
| Argentine Central Bank | | | 3,932,281 | | | | 2,066,792 | |
| Other local financial institutions | | | 14,607 | | | | 6,783 | |
| Foreign | | | 209,309 | | | | 242,846 | |
| | | | | | | |
| | | Ps. | 5,645,571 | | | Ps. | 3,696,309 | |
| B. Government and corporate securities | | | | | | | | |
| Holdings of investment account securities | | | 133,756 | | | | — | |
| Holdings of securities in special investment account | | | — | | | | 43,350 | |
| Holdings of trading securities | | | 68,231 | | | | 114,186 | |
| Government securities from repo transactions with the Argentine Central Bank | | | — | | | | 152,650 | |
| Government securities without quotation | | | — | | | | 1,981,972 | |
| Securities issued by the Argentine Central Bank | | | 2,065,723 | | | | 1,615,078 | |
| Investments in quoted corporate securities | | | 10,302 | | | | 13,171 | |
| | | | | | | |
| | | Ps. | 2,278,012 | | | Ps. | 3,920,407 | |
| C. Loans | | | | | | | | |
| To the non-financial public sector | | | 24,565 | | | | 25,416 | |
| To the financial sector | | | 80,633 | | | | 25,352 | |
| Interbank loans — (call money loans granted) | | | 32,500 | | | | 25,300 | |
| Other loans to domestic financial institutions | | | 47,968 | | | | 24 | |
| Accrued interest, adjustments and exchange rate differences receivable | | | 165 | | | | 28 | |
| To the non-financial private sector and residents abroad | | | 22,287,056 | | | | 14,233,579 | |
| Overdrafts | | | 977,890 | | | | 630,068 | |
| Promissory notes | | | 4,534,326 | | | | 3,205,433 | |
| Mortgage loans | | | 950,237 | | | | 964,291 | |
| Pledge loans | | | 119,175 | | | | 64,819 | |
| Personal loans | | | 4,093,559 | | | | 1,724,413 | |
| Credit card loans | | | 9,120,092 | | | | 5,691,335 | |
| Other | | | 2,297,507 | | | | 1,828,591 | |
| Accrued interest, adjustments and quotation differences receivable | | | 277,070 | | | | 178,837 | |
| Documented interest | | | (81,804 | ) | | | (54,185 | ) |
| Unallocated collections | | | (996 | ) | | | (23 | ) |
| Allowances | | | (1,038,473 | ) | | | (806,446 | ) |
| | | | | | | |
| | | Ps. | 21,353,781 | | | Ps. | 13,477,901 | |
| D. Other receivables resulting from financial brokerage | | | | | | | | |
| Argentine Central Bank | | | 402,386 | | | | 493,129 | |
| Amounts receivable for spot and forward sales to be settled | | | 237,333 | | | | 23,650 | |
| Securities receivable under spot and forward purchases to be settled | | | 914,124 | | | | 681,148 | |
| Negotiable obligations without quotation | | | 99,237 | | | | 38,979 | |
| Balances from forward transactions without delivery of underlying asset to be settled | | | 5,403 | | | | 1,040 | |
| Other | | | 1,799,313 | | | | 2,127,991 | |
| Allowances | | | (131,806 | ) | | | (30,570 | ) |
| | | | | | | |
| | | Ps. | 3,325,990 | | | Ps. | 3,335,367 | |
The accompanying Notes are an integral part of these consolidated financial statements
F-3
Grupo Financiero Galicia S.A. and Subsidiaries
Consolidated Balance Sheets — Continued
As of December 31, 2010 and 2009
(Expressed in thousands of Argentine pesos)
| | | | | | | | | |
| | | December 31, | |
| | | 2010 | | | 2009 | |
ASSETS (Continued) | | | | | | | | |
| E. Assets under financial leases | | | | | | | | |
| Assets under financial leases | | | 426,626 | | | | 362,298 | |
| Interest and adjustments | | | 6,923 | | | | 7,989 | |
| Allowances | | | (5,469 | ) | | | (6,070 | ) |
| | | | | | | |
| | | Ps. | 428,080 | | | Ps. | 364,217 | |
| | | | | | | | | |
| F. Equity investments | | | | | | | | |
| In financial institutions | | | 1,971 | | | | 1,882 | |
| Other | | | 64,140 | | | | 57,973 | |
| Allowances | | | (13,263 | ) | | | (5,960 | ) |
| | | | | | | |
| | | Ps. | 52,848 | | | Ps. | 53,895 | |
| | | | | | | | | |
| G. Miscellaneous receivables | | | | | | | | |
| Receivables for assets sold | | | 35,403 | | | | 34,106 | |
| Tax on minimum presumed income — Tax credit | | | 395,738 | | | | 328,619 | |
| Other | | | 677,151 | | | | 820,875 | |
| Accrued interest on receivables for assets sold | | | 135 | | | | 124 | |
| Other accrued interest and adjustments receivable | | | 159 | | | | 109 | |
| Allowances | | | (26,025 | ) | | | (28,655 | ) |
| | | | | | | |
| | | Ps. | 1,082,561 | | | Ps. | 1,155,178 | |
| | | | | | | | | |
| H. Bank premises and equipment | | Ps. | 948,067 | | | Ps. | 898,321 | |
| | | | | | | | | |
| I. Miscellaneous assets | | Ps. | 81,403 | | | Ps. | 63,841 | |
| | | | | | | | | |
| J. Intangible assets | | | | | | | | |
| Goodwill | | | 23,467 | | | | 26,346 | |
| Organization and development expenses | | | 430,648 | | | | 545,978 | |
| | | | | | | |
| | | Ps. | 454,115 | | | Ps. | 572,324 | |
| | | | | | | | | |
| K. Unallocated items | | | 4,844 | | | | 27,239 | |
| | | | | | | | | |
| L. Other Assets | | | 52,791 | | | | 37,367 | |
| | | | | | | |
Total Assets | | Ps. | 35,708,063 | | | Ps. | 27,602,366 | |
| | | | | | | |
The accompanying Notes are an integral part of these consolidated financial statements
F-4
Grupo Financiero Galicia S.A. and Subsidiaries
Consolidated Balance Sheets — Continued
As of December 31, 2010 and 2009
(Expressed in thousands of Argentine pesos)
| | | | | | | | | |
| | | December 31, | |
| | | 2010 | | | 2009 | |
LIABILITIES AND SHAREHOLDERS’ EQUITY | | | | | | | | |
| M. Deposits | | | | | | | | |
| Non-financial public sector | | Ps. | 874,201 | | | Ps. | 1,377,236 | |
| Financial sector | | | 9,934 | | | | 228,480 | |
| Non-financial private sector and residents abroad | | | 21,338,629 | | | | 15,433,650 | |
| Current accounts | | | 5,466,532 | | | | 3,631,399 | |
| Saving accounts | | | 6,356,877 | | | | 4,765,626 | |
| Time deposits | | | 8,975,889 | | | | 6,727,792 | |
| Investment accounts | | | 156,935 | | | | 109 | |
| Other | | | 306,139 | | | | 248,247 | |
| Accrued interest and quotation differences payable | | | 76,257 | | | | 60,477 | |
| | | | | | | |
| | | Ps. | 22,222,764 | | | Ps. | 17,039,366 | |
| | | | | | | | | |
| N. Other liabilities resulting from financial brokerage | | | | | | | | |
| Argentine Central Bank | | | 2,105 | | | | 3,215 | |
| Other | | | 2,105 | | | | 3,215 | |
| Banks and international entities | | | 646,745 | | | | 545,022 | |
| Unsubordinated negotiable obligations | | | 775,863 | | | | 1,539,754 | |
| Amounts payable for spot and forward purchases to be settled | | | 950,453 | | | | 618,375 | |
| Securities to be delivered under spot and forward sales to be settled | | | 229,684 | | | | 175,655 | |
| Loans from domestic financial institutions | | | 613,197 | | | | 251,481 | |
| Interbank loans (call money loans received) | | | — | | | | 70,000 | |
| Other loans from domestic financial institutions | | | 610,022 | | | | 179,701 | |
| Accrued interest payable | | | 3,175 | | | | 1,780 | |
| Balances from forward transactions without delivery of underlying asset to be settled | | | 11,085 | | | | 8,060 | |
| Other | | | 4,358,049 | | | | 2,934,951 | |
| Accrued interest and quotation differences payable | | | 20,890 | | | | 42,924 | |
| | | | | | | |
| | | Ps. | 7,608,071 | | | Ps. | 6,119,437 | |
| | | | | | | | | |
| O. Miscellaneous liabilities | | | | | | | | |
| Dividends payable | | | 20,000 | | | | 17,000 | |
| Directors’ and Syndics’ fees | | | 9,672 | | | | 7,071 | |
| Other | | | 879,957 | | | | 554,628 | |
| Adjustments and accrued interests | | | 3 | | | | — | |
| | | | | | | |
| | | Ps. | 909,632 | | | Ps. | 578,699 | |
| | | | | | | | | |
| P. Provisions | | | 698,244 | | | | 255,922 | |
| Q. Subordinated negotiable obligations | | | 1,253,027 | | | | 1,137,447 | |
| R. Unallocated items | | | 24,456 | | | | 7,393 | |
| S. Other Liabilities | | | 140,158 | | | | 122,994 | |
| T. Non-controlling interests | | | 382,211 | | | | 288,569 | |
| | | | | | | |
| Total Liabilities | | Ps. | 33,238,563 | | | Ps. | 25,549,827 | |
| | | | | | | |
| | | | | | | | | |
| SHAREHOLDERS’ EQUITY | | | 2,469,500 | | | | 2,052,539 | |
| | | | | | | |
| Total Liabilities and Shareholders’ Equity | | Ps. | 35,708,063 | | | Ps. | 27,602,366 | |
| | | | | | | |
The accompanying Notes are an integral part of these consolidated financial statements
F-5
Grupo Financiero Galicia S.A. and Subsidiaries
Consolidated Statements of Income
For the fiscal years ended December 31, 2010, 2009 and 2008
(Expressed in thousands of Argentine pesos)
| | | | | | | | | | | | | |
| | | December 31, | |
| | | 2010 | | | 2009 | | | 2008 | |
| A. Financial income | | | | | | | | | | | | |
| Interest on cash and due from banks | | Ps. | 746 | | | Ps. | 638 | | | Ps. | 8,765 | |
| Interest on loans granted to the financial sector | | | 8,542 | | | | 4,819 | | | | 3,896 | |
| Interest on overdrafts | | | 186,443 | | | | 191,791 | | | | 182,804 | |
| Interest on promissory notes | | | 498,436 | | | | 400,898 | | | | 440,490 | |
| Interest on mortgage loans | | | 103,888 | | | | 118,474 | | | | 126,543 | |
| Interest on pledge loans | | | 11,535 | | | | 11,305 | | | | 14,998 | |
| Interest on credit card loans | | | 1,143,592 | | | | 837,484 | | | | 656,477 | |
| Interest on financial leases | | | 63,749 | | | | 82,458 | | | | 82,166 | |
| Interest on other loans | | | 981,709 | | | | 436,759 | | | | 317,501 | |
| Interest on other receivables resulting from financial brokerage | | | 15,438 | | | | 23,255 | | | | 33,994 | |
| Net income from government and corporate securities | | | 409,165 | | | | 559,099 | | | | 238,098 | |
| Income from secured loans — Decree No. 1387/01 | | | 3,608 | | | | 11,460 | | | | 59,851 | |
| Consumer price index adjustment (CER) | | | 5,331 | | | | 24,429 | | | | 123,948 | |
| Exchange rate differences on foreign currency | | | 76,296 | | | | 127,454 | | | | 77,898 | |
| Other | | | 107,648 | | | | 175,314 | | | | 191,922 | |
| | | | | | | | | | |
| | | Ps. | 3,616,126 | | | Ps. | 3,005,637 | | | Ps. | 2,559,351 | |
| | | | | | | | | | | | | |
| B. Financial expenses | | | | | | | | | | | | |
| Interest on current account deposits | | | 5,476 | | | | 12,852 | | | | 21,641 | |
| Interest on savings account deposits | | | 5,442 | | | | 3,722 | | | | 3,446 | |
| Interest on time deposits | | | 748,205 | | | | 858,468 | | | | 757,699 | |
| Interest on interbank loans received (call money loans) | | | 6,158 | | | | 3,702 | | | | 5,696 | |
| Interest on financing from the financial sector | | | 6,525 | | | | 1,276 | | | | 774 | |
| Interest on other liabilities resulting from financial brokerage | | | 165,604 | | | | 231,972 | | | | 297,026 | |
| Interest on subordinated obligations | | | 137,788 | | | | 125,343 | | | | 101,424 | |
| Other interest | | | 6,367 | | | | 2,882 | | | | 3,313 | |
| Consumer price index adjustment | | | 59 | | | | 345 | | | | 9,249 | |
| Contributions made to Deposit Insurance Fund | | | 31,839 | | | | 26,030 | | | | 23,555 | |
| Other | | | 299,218 | | | | 193,867 | | | | 197,196 | |
| | | | | | | | | | |
| | | Ps. | 1,412,681 | | | Ps. | 1,460,459 | | | Ps. | 1,421,019 | |
| | | | | | | | | | | | | |
| C. Gross brokerage margin | | | 2,203,445 | | | | 1,545,178 | | | | 1,138,332 | |
| | | | | | | | | | | | | |
| Loan loss provisions | | | 551,524 | | | | 639,505 | | | | 395,389 | |
| | | | | | | | | | | | | |
| D. Income from services | | | | | | | | | | | | |
| In relation to lending transactions | | | 660,987 | | | | 456,466 | | | | 379,752 | |
| In relation to borrowing transactions | | | 543,309 | | | | 440,633 | | | | 370,181 | |
| Other commissions | | | 42,152 | | | | 26,781 | | | | 22,415 | |
| Other | | | 1,268,486 | | | | 902,903 | | | | 799,800 | |
| | | | | | | | | | |
| | | Ps. | 2,514,934 | | | Ps. | 1,826,783 | | | Ps. | 1,572,148 | |
| | | | | | | | | | | | | |
| E. Expenses for services | | | | | | | | | | | | |
| Commissions | | | 291,701 | | | | 197,714 | | | | 164,780 | |
| Other | | | 441,356 | | | | 318,149 | | | | 219,500 | |
| | | | | | | | | | |
| | | Ps. | 733,057 | | | Ps. | 515,863 | | | Ps. | 384,280 | |
The accompanying Notes are an integral part of these consolidated financial statements
F-6
Grupo Financiero Galicia S.A. and Subsidiaries
Consolidated Statements of Income — Continued
For the fiscal years ended December 31, 2010, 2009 and 2008
(Expressed in thousands of Argentine pesos)
| | | | | | | | | | | | | |
| | | December 31, | |
| | | 2010 | | | 2009 | | | 2008 | |
| | | | | | | | | | | | | |
| F. Administrative expenses | | | | | | | | | | | | |
| Personnel expenses | | | 1,602,711 | | | | 1,119,084 | | | | 966,213 | |
| Directors’ and syndics’ fees | | | 11,402 | | | | 8,563 | | | | 8,153 | |
| Other fees | | | 99,702 | | | | 70,144 | | | | 56,938 | |
| Advertising and publicity | | | 189,596 | | | | 127,836 | | | | 146,496 | |
| Taxes | | | 190,722 | | | | 139,327 | | | | 103,998 | |
| Depreciation of bank premises and equipment | | | 76,899 | | | | 73,904 | | | | 61,910 | |
| Amortization of organization expenses | | | 63,132 | | | | 45,908 | | | | 37,950 | |
| Other operating expenses | | | 373,641 | | | | 280,104 | | | | 249,219 | |
| Other | | | 237,509 | | | | 164,259 | | | | 150,201 | |
| | | | | | | | | | |
| | | Ps. | 2,845,314 | | | Ps. | 2,029,129 | | | Ps. | 1,781,078 | |
| | | | | | | | | | | | | |
| Net Income from financial brokerage | | Ps. | 588,484 | | | Ps. | 187,464 | | | Ps. | 149,733 | |
| | | | | | | | | | | | | |
| G. Non-controlling interests result | | Ps. | (104,333 | ) | | Ps. | (46,512 | ) | | Ps. | (35,812 | ) |
| | | | | | | | | | | | | |
| H. Miscellaneous income | | | | | | | | | | | | |
| Net lncome from equity investments | | | 62,054 | | | | 11,347 | | | | 56,764 | |
| Default interests | | | 56,193 | | | | 37,243 | | | | 4,429 | |
| Loans recovered and allowances reversed | | | 154,328 | | | | 48,347 | | | | 103,992 | |
| Other | | | 474,262 | | | | 502,346 | | | | 333,646 | |
| Consumer price index adjustment (CER) | | | 45 | | | | 78 | | | | 28 | |
| | | | | | | | | | |
| | | Ps. | 746,882 | | | Ps. | 599,361 | | | Ps. | 498,859 | |
| | | | | | | | | | | | | |
| I. Miscellaneous losses | | | | | | | | | | | | |
| Default interests and charges in favor of the Argentine Central Bank | | | 58 | | | | 72 | | | | 17 | |
| Loan loss provisions for miscellaneous receivables and other provisions | | | 102,387 | | | | 109,296 | | | | 161,703 | |
| Amortization of differences arising from court resolutions | | | 280,946 | | | | 109,310 | | | | 39,545 | |
| Depreciation and losses from miscellaneous assets | | | 1,347 | | | | 1,708 | | | | 1,405 | |
| Amortization of goodwill | | | 11,330 | | | | 11,457 | | | | 20,462 | |
| Other | | | 167,832 | | | | 123,168 | | | | 138,784 | |
| Consumer price index adjustment | | | 41 | | | | 35 | | | | 31 | |
| | | | | | | | | | |
| | | Ps. | 563,941 | | | Ps. | 355,046 | | | Ps. | 361,947 | |
| | | | | | | | | | | | | �� |
| Net Income before tax | | | 667,092 | | | | 385,267 | | | | 250,833 | |
| | | | | | | | | | | | | |
| J. Income tax | | Ps. | 258,191 | | | Ps. | 155,992 | | | Ps. | 74,014 | |
| | | | | | | | | | |
| | | | | | | | | | | | | |
| Net Income for the fiscal year | | Ps. | 408,901 | | | Ps. | 229,275 | | | Ps. | 176,819 | |
| | | | | | | | | | |
| | | | | | | | | | | | | |
| Net Income per common share (basic and assuming full dilution) in Argentine Pesos | | | 0.329 | | | | 0.185 | | | | 0.142 | |
The accompanying Notes are an integral part of these consolidated financial statements
F-7
Grupo Financiero Galicia S.A. and Subsidiaries
Consolidated Statements of Cash Flows
For the fiscal years ended December 31, 2010, 2009 and 2008
(Expressed in thousands of Argentine pesos)
| | | | | | | | | | | | | |
| | | December 31, | |
| | | 2010 | | | 2009 | | | 2008 | |
Cash Flow from operating activities: | | | | | | | | | | | | |
| Net Income for the year | | Ps. | 408,901 | | | Ps. | 229,275 | | | Ps. | 176,819 | |
| Adjustments to reconcile net income to net cash from operating activities: | | | | | | | | | | | | |
| Depreciation of bank premises and equipment and miscellaneous assets | | | 77,824 | | | | 74,856 | | | | 63,309 | |
| Amortization of intangible assets | | | 355,408 | | | | 166,675 | | | | 97,957 | |
| Increase in allowances for loan and other losses, net of reversals | | | 346,657 | | | | 487,636 | | | | 335,658 | |
| Equity gain of unconsolidated subsidiaries | | | (62,054 | ) | | | (11,347 | ) | | | (56,764 | ) |
| Gain on sale of premises and equipment | | | (5,184 | ) | | | (13,997 | ) | | | (695 | ) |
| Consumer price index adjustment (CER/CVS) | | | 14,977 | | | | 6,482 | | | | (113,226 | ) |
| Unrealized foreign exchange loss | | | (270,210 | ) | | | (420,052 | ) | | | (229,426 | ) |
| Decrease in government securities | | | 327,802 | | | | 1,120,852 | | | | 802,604 | |
| Increase in other assets | | | (98,009 | ) | | | (37,908 | ) | | | (122,938 | ) |
| Decrease in other liabilities | | | (223,912 | ) | | | (137,712 | ) | | | (101,284 | ) |
| | | | | | | | | | |
Net cash provided by operating activities | | Ps. | 872,200 | | | Ps. | 1,464,760 | | | Ps. | 852,014 | |
| | | | | | | | | | | | | |
Cash Flow from investing activities: | | | | | | | | | | | | |
| Payment for the CFA acquisitions net of cash acquired | | | (221,729 | ) | | | — | | | | — | |
| (Increase) / Decrease in loans, net | | | (4,539,425 | ) | | | (1,185,582 | ) | | | 1,501,309 | |
| Decrease of available for sales securities | | | 2,376,489 | | | | — | | | | 36,548 | |
| Sales of investments in other companies | | | 846 | | | | — | | | | 10,421 | |
| Increase in equity investments in other companies | | | — | | | | (7,231 | ) | | | (5,063 | ) |
| Increase in deposits at the Argentine Central Bank | | | (62,431 | ) | | | (72,188 | ) | | | (76,838 | ) |
| Additions to bank premises and equipment, miscellaneous, and intangible assets | | | (391,080 | ) | | | (282,553 | ) | | | (403,085 | ) |
| Proceeds from sales of premises and equipment | | | 24,190 | | | | 21,551 | | | | 30,337 | |
| | | | | | | | | | |
Net cash (used in) / provided by investing activities | | Ps. | (2,813,140 | ) | | Ps. | (1,526,003 | ) | | Ps. | 1,093,629 | |
| | | | | | | | | | | | | |
Cash Flow from financing activities: | | | | | | | | | | | | |
| | | | | | | | | | | | | |
| Cash dividends paid to Non-controlling interests | | | (10,877 | ) | | | (10,728 | ) | | | (1,404 | ) |
| Increase / (Decrease) in deposits, net | | | 4,180,854 | | | | 1,838,725 | | | | (57,029 | ) |
| Borrowings under credit facilities — long-term | | | 460,280 | | | | 197,677 | | | | 269,498 | |
| Payments on credit facilities — long-term | | | (1,452,817 | ) | | | (778,594 | ) | | | (743,476 | ) |
| Increase / (Decrease) in short-term borrowings, net | | | 456,209 | | | | (319,911 | ) | | | (156,579 | ) |
| Increase / (Decrease) in repurchase agreements | | | 210,987 | | | | (409,314 | ) | | | (376,645 | ) |
| | | | | | | | | | |
Net cash used in financing activities | | Ps. | 3,844,636 | | | Ps. | 517,855 | | | Ps. | (1,065,635 | ) |
The accompanying Notes are an integral part of these consolidated financial statements
F-8
Grupo Financiero Galicia S.A. and Subsidiaries
Consolidated Statements of Cash Flows — Continued
For the fiscal years ended December 31, 2010, 2009 and 2008
(Expressed in thousands of Argentine pesos)
| | | | | | | | | | | | | |
| | | December 31, | |
| | | 2010 | | | 2009 | | | 2008 | |
Increase in cash and cash equivalents, net | | Ps. | 1,903,696 | | | Ps. | 456,612 | | | Ps. | 880,008 | |
Cash and cash equivalents at the beginning of the year | | | 5,428,730 | | | | 4,795,383 | | | | 3,766,207 | |
Effect of exchange rate changes on cash and cash equivalents | | | 111,091 | | | | 176,735 | | | | 149,168 | |
| | | | | | | | | | |
Cash and cash equivalents at the end of the year | | Ps. | 7,443,517 | | | Ps. | 5,428,730 | | | Ps. | 4,795,383 | |
| | | | | | | | | | | | | |
Supplemental disclosures relative to cash flows: | | | | | | | | | | | | |
| | | | | | | | | | | | | |
| Interest paid | | Ps. | 1,084,707 | | | Ps. | 1,285,145 | | | Ps. | 1,227,389 | |
| | | | | | | | | | | | | |
| Income tax paid | | Ps. | 98,278 | | | Ps. | 124,653 | | | Ps. | 64,914 | |
| | | | | | | | | | | | | |
| Minimum Presumed Income Tax (*) | | Ps. | 52,947 | | | Ps. | 35,501 | | | Ps. | 19,767 | |
| Non-Cash Investing and financing activities | | | | | | | | | | | | |
| Trust Interest | | Ps. | — | | | Ps. | 40,998 | | | Ps. | 159,376 | |
| Asset’s Exchange Transactions | | Ps. | — | | | Ps. | 1,333,647 | | | Ps. | — | |
| | |
| (*) | | The MPIT is calculated based on assets and can be credited against future income tax. |
The accompanying Notes are an integral part of these consolidated financial statements
F-9
Grupo Financiero Galicia S.A. and Subsidiaries
Consolidated Statements of Changes in Shareholders’ Equity
For the years ended December 31, 2010, 2009 and 2008
(Expressed in thousands of Argentine pesos)
| | | | | | | | | | | | | | | | | | | | | | | | | | | | | |
| | | | | | | | | | | Inflation | | | | | | | | | | | | | | | |
| | | | | | | | | | | adjustments to | | | | | | | | | | | (Accumulated | | | | |
| | | | | | | | | | | Capital Stock | | | | | | | | | | | deficit) / | | | Total | |
| | | Capital | | | Paid in | | | and Paid in | | | Profit reserves | | | Retained | | | Shareholders’ | |
| | | Stock | | | Capital | | | Capital | | | Legal | | | Other | | | earnings | | | Equity | |
Balance at December 31, 2007 | | Ps. | 1,241,407 | | | Ps. | 606 | | | Ps. | 278,131 | | | Ps. | 34,855 | | | Ps. | 53,469 | | | Ps. | 46,037 | | | Ps. | 1,654,505 | |
| | | | | | | | | | | | | | | | | | | | | | |
| Distribution of retained earnings by the shareholders’ meeting on April 29, 2008 | | | | | | | | | | | | | | | | | | | | | | | | | | | | |
| Legal Reserve | | | — | | | | — | | | | — | | | | 2,302 | | | | | | | | (2,302 | ) | | | — | |
| Discretionary Reserve | | | — | | | | — | | | | — | | | | — | | | | 43,735 | | | | (43,735 | ) | | | — | |
| Valuation Differences | | | | | | | | | | | | | | | — | | | | 14,421 | | | | — | | | | 14,421 | |
| Net Income for the year | | | — | | | | — | | | | — | | | | — | | | | — | | | | 176,819 | | | | 176,819 | |
| | | | | | | | | | | | | | | | | | | | | | |
Balance at December 31, 2008 | | Ps. | 1,241,407 | | | Ps. | 606 | | | Ps. | 278,131 | | | Ps. | 37,157 | | | Ps. | 111,625 | | | | 176,819 | | | | 1,845,745 | |
| | | | | | | | | | | | | | | | | | | | | | |
| Distribution of retained earnings by the shareholders’ meeting on April 28, 2009 | | | | | | | | | | | | | | | | | | | | | | | | | | | | |
| Legal Reserve | | | — | | | | — | | | | — | | | | 8,841 | | | | | | | | (8,841 | ) | | | — | |
| Discretionary Reserve | | | — | | | | — | | | | — | | | | — | | | | 167,978 | | | | (167,978 | ) | | | — | |
| Valuation Differences | | | | | | | | | | | | | | | — | | | | (22,481 | ) | | | — | | | | (22,481 | ) |
| Net Income for the year | | | — | | | | — | | | | — | | | | — | | | | | | | | 229,275 | | | | 229,275 | |
| | | | | | | | | | | | | | | | | | | | | | |
Balance at December 31, 2009 | | Ps. | 1,241,407 | | | Ps. | 606 | | | Ps. | 278,131 | | | Ps. | 45,998 | | | Ps. | 257,122 | | | | 229,275 | | | | 2,052,539 | |
| | | | | | | | | | | | | | | | | | | | | | |
| Distribution of retained earnings by the shareholders’ meeting on April 14, 2010 | | | | | | | | | | | | | | | | | | | | | | | | | | | | |
| Legal Reserve | | | — | | | | — | | | | — | | | | 11,464 | | | | | | | | (11,464 | ) | | | — | |
| Discretionary Reserve | | | — | | | | — | | | | — | | | | — | | | | 217,811 | | | | (217,811 | ) | | | — | |
| Valuation Differences | | | | | | | | | | | | | | | — | | | | 8,060 | | | | — | | | | 8,060 | |
| Net Income for the year | | | — | | | | — | | | | — | | | | — | | | | — | | | | 408,901 | | | | 408,901 | |
| | | | | | | | | | | | | | | | | | | | | | |
Balance at December 31, 2010 | | Ps. | 1,241,407 | | | Ps. | 606 | | | Ps. | 278,131 | | | Ps. | 57,462 | | | Ps. | 482,993 | | | | 408,901 | | | | 2,469,500 | |
| | | | | | | | | | | | | | | | | | | | | | |
The accompanying Notes are an integral part of these consolidated financial statements
F-10
Grupo Financiero Galicia S.A. and Subsidiaries
Notes to the Consolidated Financial Statements
For the years ended December 31, 2010, 2009 and 2008
(Expressed in thousands of Argentine pesos)
1. Basis of Presentation.
Grupo Financiero Galicia S.A. (“Grupo Galicia”, the “Company” or the “Group”) is a corporation that is organized under the laws of Argentina and acts as a holding company for Banco de Galicia y Buenos Aires S.A. and its subsidiaries (“Banco Galicia” or the “Bank”). Grupo Galicia was formed by the controlling shareholders of the Bank on September 14, 1999 to consummate an exchange of shares with the shareholders of Banco Galicia and establish Grupo Galicia as the Bank’s holding company. Grupo Galicia was formed with two classes of shares: Class A shares, which are entitled to 5 votes per share, and Class B shares, which are entitled to 1 vote per share. To effect the exchange, Grupo Galicia offered to exchange Grupo Galicia class B shares for all outstanding Banco Galicia class B shares on a 2.5-for-1 basis and to exchange Grupo Galicia ADSs for all outstanding Banco Galicia ADSs on a 1-for-1 basis. The controlling shareholders retained all of the class A shares. As a result of the exchange, which was consummated on July 26, 2000, the Company became holder of 93.23% of the Bank’s capital stock, and the remaining 6.77% remained as a Non-controlling interest in the Bank. At December 31, 2010 and 2009, the Company’s interest in Banco Galicia as a result of open market purchases was 94.84074% and 94.70505% respectively.
Banco Galicia is a private-sector commercial bank organized under the laws of Argentina which provides general banking services, through its branches, to corporate and retail customers.
As mentioned in note 32, on June 30, 2010 the Bank purchased the 95% of the shares belonging to the following companies: Compañía Financiera Argentina S.A., Cobranzas y Servicios S.A. and Procesadora Regional S.A. (former Universal Processing Center S.A.) and, Tarjetas Regionales S.A. purchased the remaining 5% of the shares belonging to said companies.
Grupo Galicia’s consolidated financial statements as of December 31, 2010 and 2009 include the assets, liabilities and results of the controlled companies detailed below. The percentages directly or indirectly held in those companies’ capital stock are as follows:
| | | | | | | | | |
| | | December 31, | |
| Issuing Company | | 2010 | | | 2009 | |
Grupo Financiero Galicia S.A. | | | | | | | | |
| Galval Agente de Valores S.A. | | | 100.00 | % | | | 100.00 | % |
| GV Mandataria de Valores S.A. | | | 100.00 | % | | | 100.00 | % |
| Net Investment S.A. | | | 99,36 | % | | | 99.34 | % |
| Galicia Warrants S.A. | | | 99.36 | % | | | 99.34 | % |
| Sudamericana Holding S.A. | | | 99.36 | % | | | 99.34 | % |
| Banco de Galicia y Buenos Aires S.A. | | | 94.84 | % | | | 94.71 | % |
| Banco Galicia Uruguay S.A. (In Liquidation) | | | 94.84 | % | | | 94.71 | % |
| Tarjetas Regionales S.A. | | | 94.84 | % | | | 94.71 | % |
| Galicia Administradora de Fondos S.A.Sociedad Gerente de Fondos Comunes de Inversión | | | 94.84 | % | | | 94.71 | % |
| Galicia (Cayman) Ltd. | | | 94.84 | % | | | 94.71 | % |
| Tarjetas del Mar S.A. | | | 94.84 | % | | | 94.70 | % |
| Compañía Financiera Argentina S.A. | | | 94.84 | % | | | — | |
| Cobranzas y Servicios S.A. | | | 94.84 | % | | | — | |
| Procesadora Regional S.A. | | | 94.84 | % | | | — | |
| Galicia Valores S.A. Sociedad de Bolsa | | | 94.83 | % | | | 94.70 | % |
| Tarjeta Naranja S.A. | | | 75.87 | % | | | 75.76 | % |
| Cobranzas Regionales S.A. | | | 73.54 | % | | | 73.43 | % |
| Tarjetas Cuyanas S.A. | | | 56.90 | % | | | 56.82 | % |
| Tarjeta Naranja Dominicana S.A. | | | 37.94 | % | | | 37.88 | % |
| Galicia Factoring y Leasing S.A. ( In Liquidation ) | | | — | | | | 94.69 | % |
F-11
Grupo Financiero Galicia S.A. and Subsidiaries
Notes to the Consolidated Financial Statements
For the years ended December 31, 2010, 2009 and 2008
(Expressed in thousands of Argentine pesos)
The financial statements of the controlled companies were adapted to the accounting and disclosure standards set by the Argentine Central Bank and cover the same period as that of the financial statements of the Group.
Intercompany transactions have been eliminated for the purposes of these statements.
2. Significant Accounting Policies.
The accounting policies and financial statements presentation conform to the rules of the Argentine Central Bank which prescribes the generally accepted accounting principles for all banks in Argentina (the “Argentine Banking GAAP”). This differs in certain significant respects from generally accepted accounting principles in Argentina applicable to enterprises in general (“Argentine GAAP”) (see Note 33) and from generally accepted accounting principles in the United States of America (“U.S. GAAP”). (see Note 35 ).
Certain required disclosures have not been presented herein since they are not material to the accompanying financial statements. In addition, certain presentations and disclosures, including the statements of cash flows, have been included in the accompanying financial statements to comply with the Securities and Exchange Commission’s regulations for foreign registrants.
Certain reclassifications of prior years information have been made to conform to current year presentation.
Such reclassifications do not have a significant impact on the Group’s financial statements.
The following is a summary of significant policies followed by the Group in the preparation of the consolidated financial statements.
2.1 Presentation of Financial Statements in Constant Argentine Pesos.
Effective September 1, 1995, pursuant to Decree No. 316/95, the Bank discontinued its prior practice of adjusting the financial statements for inflation. Effective January 1, 2002, however, as a result of the application of Argentine Central Bank, National Securities Commission (“CNV”) and Argentine Federation of Professional Councils in Economic Sciences “FACPCE” rules, the Group re-applied the application of the adjustment for inflation.
In 2002, Argentina experienced a high rate of inflation. The wholesale Price Index “WPI” increased approximately 118.44% in 2002.
Primarily as a result of the stabilization of the WPI during the first half of 2003, the Argentine government, the Argentine Central Bank and the CNV eliminated the requirement that financial statements be prepared in constant currency.
F-12
Grupo Financiero Galicia S.A. and Subsidiaries
Notes to the Consolidated Financial Statements
For the years ended December 31, 2010, 2009 and 2008
(Expressed in thousands of Argentine pesos)
2.2 Foreign Currency.
Foreign currency is stated at the U.S. dollar rate of exchange set by the Argentine Central Bank, prevailing at the close of operations on the last business day of each year.
Assets and liabilities valued in foreign currencies other than the U.S. dollar are converted into U.S. dollars using the year end exchange rates issued by the Argentine Central Bank.
For financial reporting purposes, these assets and liabilities are then translated into pesos at the year end U.S. dollar to Argentine peso exchange rate.
2.3 Government and Corporate Securities.
Government securities mainly represent obligations of the Argentine government. Corporate securities included in this caption consist of listed corporate equity securities, mutual funds and listed debt securities.
Realized and unrealized gains and losses on sales and interest income on government and corporate securities are included as “Net Income from government and corporate securities” in the accompanying statements of income.
Valuation of Government Securities under Argentine Banking GAAP
The Argentine Central Bank established the categories in which banks classify Argentine government securities listed on local or foreign markets and the accounting valuation for the securities in each of these categories. According to the categories established by the Argentine Central Bank, the Group recorded in their securities under the following captions:
a) Holdings of investment account securities:
Includes Peso denominated Bond issued by the Argentine government at Badlar rate due 2015 (Bonar 2015).
As of December 31, 2010, these holdings have been valued at their acquisition cost increased on an exponential basis according to their internal rate of return (I.R.R.) The same criterion was applied to holdings of such bonds used in reverse repo transactions. Had these securities been valued at market price, Shareholders’ Equity would have been increased by Ps.84,496 as of December 31, 2010.
b) Holdings of securities in special investment accounts:
During this fiscal year, the position of these securities, has been realized.
As of December 31, 2009, these holdings have been valued pursuant to the provisions of the Argentine Central Bank at its cost increased on an exponentially basis according to their I.R.R..
The same criterion was applied to holdings of such bonds used in repurchase agreement transactions recorded under “Other Receivables Resulting from Financial Brokerage” and “Miscellaneous Receivables.”
c) Holding of Trading Securities:
These securities are recorded at fair value, and any difference between book value and their fair value is recognized as a gain or loss in the income statement.
d) Government Securities without quotation:
These holdings include the following securities:
i) National Government Bonds in U.S. dollars Libor due 2012 — Compensatory and Hedge Bonds (Boden 2012): during 2010, the position of these bonds, has been realized, which as of the beginning of the fiscal year amounted to Ps.1,731,089.
F-13
Grupo Financiero Galicia S.A. and Subsidiaries
Notes to the Consolidated Financial Statements
For the years ended December 31, 2010, 2009 and 2008
(Expressed in thousands of Argentine pesos)
As of December 31, 2009 these Bonds have been valued at their “technical value” (face value plus accrued interest and less capital amortization according to the contractual terms of the instrument). The same criterion was applied to holdings of such bonds used in repo transactions recorded under “Other Receivables Resulting from Financial Brokerage” and “Miscellaneous Receivables”.
ii) Discount Bonds and GDP-Linked Negotiable Securities: During 2010, the position of these bonds, has been realized, which as of the beginning of the fiscal year amounted to Ps. 621,983.
As of December 31, 2009, the securities were recorded at the lowest of the total future nominal cash payments up to maturity, specified by the terms and conditions of the new securities and the carrying value of the securities tendered as of March 17, 2005. Said amount was net of charged financial services.
iii) Peso-denominated Bonds issued by the Argentine Nation at Badlar rate due 2015 (Bonar 2015 Bonds):
As of December 31, 2009, these bonds have been valued at their acquisition cost increased according to the accrual of their internal rate of return (IRR). At December 31, 2010 and 2009 the book value of these investments amounted to Ps.642,147 and Ps.358,984 respectively. The fair value of such investments amounted to Ps.726,643 and to Ps.676,580 at December 31, 2010 and 2009 respectively. In January 2010, face value of Ps.627,178 were reclassified to investment accounts.
During this fiscal year, the position of these securities has been realized.
e) Securities issued by the Argentine Central Bank:
i) Listed Securities: These are recorded at marked to market, and any difference between book value and their fair value is recognized as a gain or loss in the income statement.
ii) Unlisted Securities: Holdings of unlisted securities were valued at their acquisition cost increased on an exponential basis according to their internal rate of return, with gain and losses were recorded in the income statement.
f) Investment in quoted corporate securities
These securities are recorded at fair value, and any difference between book value and their fair value is recognized as a gain or loss in the income statement.
2.4 Financial Trust Debt Securities and Certificates of Participation.
The debt securities were incorporated and recorded at their face value; the remaining holdings were recorded according to their internal rate of return. Certificates of participation are accounted for under the equity method.
2.5 Interest Income (Expense) Recognition.
For loans and deposits, interest is recognized on a compounded basis, which provides for an increasing effective rate over the life of the loan or deposit.
The Bank suspends the accrual of interest generally when the related loan is past due and the collection of interest and principal is in doubt. The suspension of interest corresponds to the loans classified as “with problems” and “deficient performance” or below, under the Argentine Central Bank’s classification rules. Accrued interest remains on the Bank’s books and is considered to be part of the loan balance when determining the allowance for loan losses. Regarding impaired loans, interest is recognized on a cash basis after reducing the balance of accrued interest, if applicable.
F-14
Grupo Financiero Galicia S.A. and Subsidiaries
Notes to the Consolidated Financial Statements
For the years ended December 31, 2010, 2009 and 2008
(Expressed in thousands of Argentine pesos)
Reference Stabilization Index (“CER”) is accrued in all lending and borrowing transactions originally carried out in foreign currency prior to the pesification process.
2.6 Allowances for Loan Losses.
The Bank provides for estimated future possible losses on loans and the related accrued interest through the establishment of an allowance for loan losses. The allowance charged to expense is determined by management based upon loan classification, actual loss experience, current and expected economic conditions, delinquency aging, and an evaluation of potential losses in the current loan portfolio. Specific attention is given to loans with evidence that may negatively affect the Group’s ability to recover the loan and accrued interest.
2.7 Provisions for Contingencies.
The Group has certain contingent liabilities with respect to existing or potential claims, lawsuits and other proceedings, including those involving labor and other matters. The Group accrues liabilities when it is probable that future costs will be incurred and such costs can be reasonably estimated. Such accruals are based on developments to date, the Group’s estimates of the outcomes of these matters and the Group’s lawyers’ experience in responding, litigating and settling other matters. As the scope of the liabilities becomes better defined, there may be changes in the estimates of future costs, which could have a material effect on the Group’s future results of income and financial condition or liquidity.
2.8 Equity Investments.
Equity Investments include equity investments in companies where a non-controlling interest is held.
Under Argentine Banking GAAP, the equity method is used to account for investments, considering the recoverable amount of those investments, where a significant influence in the corporate decision making process exists. Significant influence is considered to be present if one of the following applies:
| • | | Ownership of a portion of a related company’s capital granting the voting power necessary to influence the approval of such company’s financial statements and profits distribution. |
| • | | Representation in the related company’s board of directors or corporate governance body. |
| • | | Participation in the definition of the related company’s policies. |
| • | | Existence of significant transactions between the company holding the interest and the related company (for example, when the former is the latter’s only supplier or by far its most important client). |
| • | | Interchange of senior officers among companies. |
| • | | Technical dependence of one of the companies on the other. |
Equity investments in companies where corporate decisions are not influenced, in terms of the criteria listed above, are accounted for, considering the recoverable amount of those investments, at the lower of cost or equity method.
F-15
Grupo Financiero Galicia S.A. and Subsidiaries
Notes to the Consolidated Financial Statements
For the years ended December 31, 2010, 2009 and 2008
(Expressed in thousands of Argentine pesos)
2.9 Bank Premises and Equipment and Miscellaneous Assets.
Bank premises and equipment and miscellaneous assets are valued at cost adjusted for inflation (as described in Note 2.1), less accumulated depreciation.
Construction in progress is carried at cost adjusted for inflation (as described in Note 2.1).
Financial leases that mainly transfer risks and benefits inherent to the leased property are registered at the beginning of the lease either by the cash value of the leased property or the present value of cash flows established in the financial lease, whichever is the lowest.
Accumulated depreciation is computed under the straight-line method at rates over the estimated useful lives of the assets, which generally are estimated to be 50 years for properties, 10 years for furniture and fixtures, and 5 years for others. Leasehold improvements are depreciated using the straight-line method over the shorter of the lease term or the estimated useful life of the asset.
The cost of maintenance and repairs is charged to expense as incurred. The cost of significant renewals and improvements is added to the carrying amount of the respective fixed assets. When assets are retired or otherwise disposed of, the cost and the related accumulated depreciation are removed from the accounts, and any resulting gain or loss is reflected in the consolidated statement of income.
2.10 Intangible Assets.
Intangible assets are valued at cost adjusted for inflation (as described in Note 2.1) and are amortized on a straight-line basis over 120 months for goodwill and over a range of 60 months for organization and development costs. Under Argentine Banking GAAP, goodwill is no longer recognized as an asset when it is estimated that amounts of future income will not be sufficient to absorb the amortization of goodwill or when there are other reasons to presume that the amount of an investment made, will not be recovered in full.
Effective March 2003, the Argentine Central Bank established that the difference resulting from compliance with court decisions made in lawsuits filed challenging the current regulations applicable to deposits with the financial system, within the framework of the provisions of Law No. 25,561, Decree No. 214/02 and supplementary regulations, must also be recorded under this caption. Such difference must be amortized in a maximum of 60 equal monthly and consecutive installments as of April 2003.
As of December 31, 2009 the bank recorded assets for Ps.259,053. During 2010, the Group amortized such assets and certain legal claims recognized during this fiscal year.
As of December 31, 2010 there are not pending claims to be amortized.
The Bank carried out the abovementioned amortization for the purposes of complying with the provisions set forth by the Argentine Central Bank only. However, the Bank has repeatedly reserved its right to make claims in view of the negative effect caused on its financial condition by the reimbursement of deposits originally in U.S. dollars pursuant to court orders, which exceeded the amount established in the aforementioned regulation. On November 30, 2003, the bank formally requested the National Executive Branch, with a copy to the Ministry of Economy (“MECON”) and to the Argentine Central Bank, the payment of due compensation for the losses incurred that were generated by the “asymmetric pesification” and especially for the negative effect on its financial condition caused by court resolutions.
F-16
Grupo Financiero Galicia S.A. and Subsidiaries
Notes to the Consolidated Financial Statements
For the years ended December 31, 2010, 2009 and 2008
(Expressed in thousands of Argentine pesos)
2.11 Shareholders’ Equity.
Shareholders’ Equity accounts have been adjusted for inflation following the procedure described in Note 2.1, except for the “Capital Stock” and “Paid-in Capital” accounts, which have been stated at their original values. The adjustment of these accounts was allocated to the “Inflation adjustments to capital stock and paid-in capital” account.
2.12 Minimum Presumed Income Tax and Income Tax.
Effective 1998, a Minimum Presumed Income Tax (“MPIT”) was established as a complementary component of income tax obligations. MPIT is a minimum taxation, which assesses at the tax rate of 1% of certain assets. Ultimately, the tax obligation will be the higher of MPIT or income tax. For financial entities, the taxable basis is 20% of their computable assets. If in a fiscal year, the MPIT obligation exceeds the income tax liability, the surplus will be available as a credit against future income tax.
The Bank has recognized the MPIT amount paid in the year and the accumulated amount paid in prior years as an asset for future tax deductions.
Based on the provisions set forth by the Argentine Central Bank, the Group recorded an asset related to the MPIT amounting to Ps.395,738 and Ps.328,619, as of December 31, 2010 and 2009, respectively.
Argentine Central Bank regulations do not require the recognition of deferred tax assets and liabilities and therefore income taxes for Banco Galicia are recognized on the basis of amounts due in accordance with Argentine tax regulations. However, Grupo Galicia and Grupo Galicia’s non-bank subsidiaries apply the deferred income tax method. As a result, Grupo Galicia and its non-bank subsidiaries had recognized a deferred tax asset as of December 31, 2010 and 2009.
2.13 Statements of Cash Flows.
The consolidated statements of cash flows were prepared using the measurement methods prescribed by the Argentine Central Bank and in accordance with the presentation requirements ofStatement of Cash Flows(“ASC 230-10”).
Cash and cash equivalents include cash and due from banks and highly liquid investments with an original maturity of less than three months.
2.14 Use of Estimates.
The preparation of financial statements in conformity with Argentine Banking GAAP requires management to make estimates and assumptions that affect the reported amounts of assets and liabilities and disclosures of contingent liabilities at the date of the financial statements, and the reported amounts of revenues and expenses during the reporting periods. Actual results could differ from those estimates.
3. Restricted Assets.
3.1 Pursuant to Argentine Central Bank regulations, Banco Galicia must maintain a monthly average liquidity level. Computable assets for complying with the minimum cash requirement are cash and the checking accounts opened at the Argentine Central Bank.
F-17
Grupo Financiero Galicia S.A. and Subsidiaries
Notes to the Consolidated Financial Statements
For the years ended December 31, 2010, 2009 and 2008
(Expressed in thousands of Argentine pesos)
The minimum cash requirement at the end of each fiscal year was as follows (as measured in average daily balances):
| | | | | | | | | |
| | | December 31, | |
| | | 2010 | | | 2009 | |
| | | | | | | | | |
| Peso balances | | Ps. | 2,841,388 | | | Ps. | 1,985,771 | |
| Foreign currency balances | | | 1,903,774 | | | | 1,715,157 | |
3.2 Certain of the Group’s other assets are pledged or restricted from use under various agreements. The following assets were restricted at each balance sheet date:
| | | | | | | | | |
| | | December 31, | |
| | | 2010 | | | 2009 | |
| | | | | | | | | |
| Funds and securities pledged under various arrangements | | Ps. | 943,830 | | | Ps. | 1,043,398 | |
| Shares on equity investments (*) | | | 5,250 | | | | 5,250 | |
| Deposits in the Argentine Central Bank, restricted under Argentine Central Bank regulations | | | 2,402 | | | | 3,668 | |
| Loans pledged and real property granted as collateral-Banco Galicia Uruguay S.A. (**) | | | — | | | | 3,857 | |
| Loans granted as collateral(***) | | | 85,147 | | | | 199,801 | |
| | | | | | | |
| Total | | Ps. | 1,036,629 | | | Ps. | 1,255,974 | |
| | | | | | | |
| | |
| (*) | | Shares over which transferability is subject to prior approval of the National or Provincial authorities, as applicable, under the terms of certain concession contracts signed. |
| |
| | | The Bank, as a shareholder of Aguas Cordobesas S. A. and proportionally to its 10.833% interest, is jointly responsible for the contractual obligations arising from the concession contract during the entire term thereof. Should any of the other shareholders fail to comply with the commitments arising from their joint responsibility, the Bank may be forced to assume the unfulfilled commitment by the grantor, but only in the proportion and to the extent of the interest held by the Bank. |
| |
| (**) | | Under a fixed pledged agreement signed on July 24, 2003 and registered with the Registry of Property —Movable Property — Pledges Division of Montevideo — Uruguay, on August 5, 2003, Galicia Uruguay S.A.’s credit rights against all of its debtors have been pledged in favor of the holders of transferable time deposit certificates and/or negotiable obligations issued in compliance with the debt restructuring plan approved. Galicia Uruguay S.A. wholly repaid in advance the remaining balance of the debt restructuring plan and therefore and having fulfilled its obligations, its shareholders have resolved, at the Shareholders’ Meeting held on June 30, 2010, to voluntarily dissolve and liquidate the company. |
| |
| (***) | | Securities granted as collateral for lines of credit provided by the International Finance Corporation (“IFC”). The Bank used Bonar 2015 to collateralized Ps.55,075 IFC lines of credit at December 31, 2010. At December 2009, the Bank used BODEN 2012 to collateralized Ps.70,983 of IFC lines of credit. |
F-18
Grupo Financiero Galicia S.A. and Subsidiaries
Notes to the Consolidated Financial Statements
For the years ended December 31, 2010, 2009 and 2008
(Expressed in thousands of Argentine pesos)
4. Interest-Bearing Deposits with Other Banks.
As of December 31, 2010 and 2009, the overnight foreign bank interest-bearing deposits included under the caption “Loans — Other” amounted to Ps. 215,282 and Ps. 383,794, respectively.
5. Government and Corporate Securities.
Government and corporate securities consist of the following at the respective balance sheet dates:
| | | | | | | | | |
| | | December 31, | |
| | | 2010 | | | 2009 | |
| Government Securities | | | | | | | | |
| | | | | | | | | |
| In investment accounts: | | | | | | | | |
| Peso-denominated Argentine Bonds Private Badlar + 275 bp due in 2015 | | | 133,756 | | | | — | |
| | | | | | | |
| Total in investment accounts | | Ps. | 133,756 | | | Ps. | — | |
| | | | | | | |
| | | | | | | | | |
In special investment accounts: | | | | | | | | |
| Argentine Central Bank Notes | | | — | | | | 43,350 | |
| | | | | | | |
| Total in special investment accounts | | Ps. | — | | | Ps. | 43,350 | |
| | | | | | | |
| | | | | | | | | |
| For trading purposes: | | | | | | | | |
| U.S. dollar-denominated National Government Bonds Libor due in 2015 | | | 8,303 | | | | — | |
| National Government Bonds in U.S. dollars due in 2012 | | | 4,800 | | | | — | |
| U.S. dollar-denominated Argentine Bonds 7% due in 2011-BONAR V | | | 4,570 | | | | 5,174 | |
| Peso-denominated Argentine Bonds Badlar Privada + 300 bp due in 2015 | | | 13,404 | | | | 39,014 | |
| Other Government Bonds | | | 25,023 | | | | 60,354 | |
| Other | | | 12,131 | | | | 9,644 | |
| | | | | | | |
| Total trading purposes | | Ps. | 68,231 | | | Ps. | 114,186 | |
| | | | | | | |
| | | | | | | | | |
| From repo transactions with the Argentine Central Bank: | | | | | | | | |
| U.S. dollar-denominated National Government Bonds Libor 7% due in 2013 | | | — | | | | 152,650 | |
| | | | | | | |
| Total from repo transactions with the Argentine Central Bank | | Ps. | — | | | Ps. | 152,650 | |
| | | | | | | |
| | | | | | | | | |
| Without quotation: | | | | | | | | |
| National Government Bonds in U.S. dollars due in 2012 | | | — | | | | 1,032,412 | |
| Cordoba Province Government’s Bonds | | | — | | | | 3.833 | |
| Peso-denominated Argentine Bonds Badlar Privada + 300 bp due in 2015 | | | — | | | | 323,744 | |
| Discount Bonds due in 2033 and GDP-Linked Negotiable Securities | | | — | | | | 621,983 | |
| | | | | | | |
| Total Without quotation | | Ps. | — | | | Ps. | 1,981,972 | |
| | | | | | | |
| | | | | | | | | |
| Securities issued by the Argentine Central Bank: | | | | | | | | |
| For Repo Transaction (*) | | | 180,232 | | | | — | |
| Securities with quotation (**) | | | 363,050 | | | | 651,050 | |
| Securities without quotation (***) | | | 1,522,441 | | | | 964,028 | |
| | | | | | | |
| Total Securities issued by the Argentine Central Bank | | Ps. | 2,065,723 | | | Ps. | 1,615,078 | |
| | | | | | | |
| Total government securities | | Ps. | 2,267,710 | | | Ps. | 3,907,236 | |
| | | | | | | |
| | | | | | | | | |
| Corporate Securities: | | | | | | | | |
| Shares | | | 68 | | | | 53 | |
| Marketable Negotiable obligations | | | 4,484 | | | | 5,613 | |
| Negotiable Mutual Funds | | | 5,750 | | | | 7,505 | |
| | | | | | | |
| Total corporate securities | | Ps. | 10,302 | | | Ps. | 13,171 | |
| | | | | | | |
| Total government and corporate securities | | Ps. | 2,278,012 | | | Ps. | 3,920,407 | |
| | | | | | | |
F-19
Grupo Financiero Galicia S.A. and Subsidiaries
Notes to the Consolidated Financial Statements
For the years ended December 31, 2010, 2009 and 2008
(Expressed in thousands of Argentine pesos)
| | |
| (*) | | The Securites for repo transactions correspond to Compañía Financiera Argentina S.A. |
| |
| (**) | | Includes Ps.266,635 of Compañía Financiera Argentina S.A. |
| |
| (***) | | Includes Ps.4,920 of Compañía Financiera Argentina S.A. |
As of December 31, 2010, Bonar 2015 Bonds and Securities issued by Argentine Central Bank sold under repurchase agreements amounted to Ps.394,833 and Ps.359,428, respectively and were recorded under the caption “Other Receivables resulting from financial brokerage”.
As of December 31, 2009, Boden 2012 Bonds and Securities issued by Argentine Central Bank sold under repurchase agreements amounted to Ps.472,599 and Ps.203,917, respectively and were recorded under the caption “Other Receivables resulting from financial brokerage”.
6. Loans.
The lending activities of the Bank consist of the following:
• Loans to the non-financial public sector: loans to the federal and provincial governments of Argentina.
• Loans to the financial sector: loans to local banks and financial entities.
• Loans to the non-financial private sector and residents abroad: include the following types of lending:
| | | Overdrafts— short-term obligations drawn on by customers through overdrafts. |
| | | Promissory Notes— endorsed promissory notes, discounted and purchased bills and factored loans. |
| | | Mortgage loans— loans to purchase or improve real estate and collateralized by such real estate or commercial loans secured by real estate. |
| | | Pledge loans— loans where collateral is pledged as an integral part of the loan document. |
| | | Credit card loans— loans to credit card holders. |
Personal loans— loans to individuals.
| | | Others— includes mainly short-term placements in foreign banks. |
Pursuant to Argentine Central Bank regulations, financial entities must disclose the breakdown of their loan portfolio to: the non-financial public sector, the financial sector and the non-financial private sector and residents abroad. In addition, financial entities must disclose the type of collateral established on the applicable loans to the non-financial private sector and the pledges granted on loans (preferred guarantees relative to a registered senior pledge).
F-20
Grupo Financiero Galicia S.A. and Subsidiaries
Notes to the Consolidated Financial Statements
For the years ended December 31, 2010, 2009 and 2008
(Expressed in thousands of Argentine pesos)
As of December 31, 2010 and 2009, the classification of the Group’s loan portfolio was as follows:
| | | | | | | | | |
| | | December 31, | |
| | | 2010 | | | 2009 | |
| | | | | | | | | |
| Non-financial public sector | | Ps. | 24,565 | | | Ps. | 25,416 | |
| Financial sector (Argentine) | | | 80,633 | | | | 25,352 | |
| Non-financial private sector and residents abroad | | | 22,287,056 | | | | 14,233,579 | |
| • With preferred guarantees | | | 1,257,111 | | | | 1,142,199 | |
| • With other guarantees | | | 3,694,518 | | | | 2,450,075 | |
| • Unsecured (*) | | | 17,335,427 | | | | 10,641,305 | |
| | | | | | | |
| Subtotal | | | 22,392,254 | | | | 14,284,347 | |
| | | | | | | |
| Allowance for loan losses (See Note 7) | | | (1,038,473 | ) | | | (806,446 | ) |
| | | | | | | |
| Total | | Ps. | 21,353,781 | | | Ps. | 13,477,901 | |
| | | | | | | |
| | |
| (*) | | As of December 31, 2010 includes Ps. 1,378,363 of Compañía Financiera Argentina S.A. |
The Bank also records its loan portfolio by industry segment. The following industry segments comprised the most significant loan concentrations as of December 31, 2010 and 2009, respectively:
| | | | | | | | | |
| | | December 31, | |
| | | 2010 | | | 2009 | |
| Consumer | | | 54.68 | % | | | 47.54 | % |
| Manufacturing | | | 13.47 | % | | | 14.61 | % |
| Primary Products | | | 11.03 | % | | | 13.90 | % |
| Wholesale Trade | | | 6.85 | % | | | 6.53 | % |
| Services | | | 6.63 | % | | | 7.59 | % |
| Retail Trade | | | 4.05 | % | | | 5.04 | % |
| Financial Sector | | | 1.42 | % | | | 3.30 | % |
| Construction | | | 1.42 | % | | | 1.24 | % |
7. Allowance for Loan Losses.
The activity in the allowance for loan losses for the fiscal years ended December 31, 2010, 2009 and 2008, was as follows:
| | | | | | | | | | | | | |
| | | December 31, | |
| | | 2010 | | | 2009 | | | 2008 | |
| | | | | | | | | | | | | |
| Balance at beginning of year | | Ps. | 806,446 | | | Ps. | 526,801 | | | Ps. | 428,607 | |
| Provision charged to income | | | 523,588 | | | | 625,897 | | | | 384,606 | |
| Recoveries | | | (8 | ) | | | (5,424 | ) | | | (6,510 | ) |
| Foreign exchange effect and other adjustments (*) | | | 195,776 | | | | 13,693 | | | | 9,289 | |
| Loans charged off | | | (487,329 | ) | | | (354,521 | ) | | | (289,191 | ) |
| | | | | | | | | | |
| Balance at end of year | | Ps. | 1,038,473 | | | Ps. | 806,446 | | | Ps. | 526,801 | |
| | | | | | | | | | |
| | |
| (*) | | Includes Ps. 185,381 of allowances as of the acquisition date of Compañia Financiera Argentina S.A. |
F-21
Grupo Financiero Galicia S.A. and Subsidiaries
Notes to the Consolidated Financial Statements
For the years ended December 31, 2010, 2009 and 2008
(Expressed in thousands of Argentine pesos)
Certain loans, principally small loans, are charged directly to income and are not reflected in the activity in the allowance for loan losses. The “Loan loss provision” in the accompanying statements of income includes:
| | | | | | | | | | | | | |
| | | December 31, | |
| | | 2010 | | | 2009 | | | 2008 | |
| | | | | | | | | | | | | |
| Provisions charged to income | | Ps. | 523,588 | | | Ps. | 625,897 | | | Ps. | 384,606 | |
| Direct charge-offs | | | 17,079 | | | | 10,501 | | | | 7,307 | |
| Other receivable losses | | | 9,921 | | | | 3,051 | | | | 2,545 | |
| Financial leases | | | 936 | | | | 56 | | | | 931 | |
| | | | | | | | | | |
| | | Ps. | 551,524 | | | Ps. | 639,505 | | | Ps. | 395,389 | |
| | | | | | | | | | |
The Bank has entered into certain troubled debt restructuring agreements with customers. The Bank has eliminated any differences between the principal and accrued interest due under the original loan and the new loan amount through a charge against the allowance for loan losses. Loans under such agreements amounted to Ps.123,462, Ps.197,460 and Ps.240,917 as of December 31, 2010, 2009 and 2008, respectively.
8. Other Receivables Resulting from Financial Brokerage.
The composition of other receivables from financial brokerage, by type of guarantee, is as follows:
| | | | | | | | | |
| | | December 31, | |
| | | 2010 | | | 2009 | |
| | | | | | | | | |
| Preferred guarantees, including deposits with | | | | | | | | |
| The Argentine Central Bank | | Ps. | 420,328 | | | Ps. | 516,001 | |
| Other guarantees | | | 604 | | | | 90,192 | |
| Unsecured | | | 3,036,864 | | | | 2,759,744 | |
| Less: Allowance for doubtful accounts | | | (131,806 | ) | | | (30,570 | ) |
| | | | | | | |
| | | Ps. | 3,325,990 | | | Ps. | 3,335,367 | |
| | | | | | | |
The breakdown of the caption “other” included in the balance sheet was as follows:
| | | | | | | | | |
| | | December 31, | |
| | | 2010 | | | 2009 | |
| | | | | | | | | |
| Mutual funds | | Ps. | 147,009 | | | Ps. | 126,936 | |
| Galtrust I | | | 620,501 | | | | 584,111 | |
| Other financial trust participation certificates | | | 455,874 | | | | 941,542 | |
| Accrued commissions | | | 38,418 | | | | 28,896 | |
| Others | | | 537,511 | | | | 446,506 | |
| | | | | | | |
| | | Ps. | 1,799,313 | | | Ps. | 2,127,991 | |
| | | | | | | |
F-22
Grupo Financiero Galicia S.A. and Subsidiaries
Notes to the Consolidated Financial Statements
For the years ended December 31, 2010, 2009 and 2008
(Expressed in thousands of Argentine pesos)
9. Equity Investments.
Equity investments in other companies consisted of the following as of the respective balance sheet dates:
| | | | | | | | | |
| | | December 31, | |
| | | 2010 | | | 2009 | |
| | | | | | | | | |
In Financial Institutions, complementary and authorized activities | | | | | | | | |
| Banelco S.A. | | Ps. | 9,569 | | | Ps. | 8,681 | |
| Visa Argentina S.A. | | | 3,000 | | | | 3,169 | |
| Mercado de Valores de Buenos Aires S.A. | | | 8,138 | | | | 8,143 | |
| Banco Latinoamericano de Exportaciones S.A. | | | 1,971 | | | | 1,882 | |
| Others | | | 790 | | | | 852 | |
| | | | | | | |
Total equity investments in Financial Institutions, complementary and authorized activities | | Ps. | 23,468 | | | Ps. | 22,727 | |
| | | | | | | |
| | | | | | | | | |
In Non-financial Institutions | | | | | | | | |
| Electrigal S.A. | | | 5,455 | | | | 5,455 | |
| A.E.C. S.A. | | | 26,703 | | | | 21,379 | |
| Aguas Cordobesas S.A. | | | 8,911 | | | | 8,911 | |
| Other | | | 1,574 | | | | 1,383 | |
| | | | | | | |
Total equity investments in non-financial institutions | | Ps. | 42,643 | | | Ps. | 37,128 | |
| | | | | | | |
Allowances | | Ps. | (13,263 | ) | | Ps. | (5,960 | ) |
| | | | | | | |
Total Equity investments | | Ps. | 52,848 | | | Ps. | 53,895 | |
| | | | | | | |
10. Bank Premises and Equipment and Intangible Assets.
The major categories of Grupo Financiero Galicia’s premises and equipment and accumulated depreciation, as of December 31, 2010 and 2009, were as follows:
| | | | | | | | | |
| | | December 31, | |
| | | 2010 | | | 2009 | |
| | | | | | | | | |
| Land and buildings | | Ps. | 973,556 | | | Ps. | 927,100 | |
| Furniture and fittings | | | 227,155 | | | | 197,563 | |
| Machinery and equipment | | | 423,111 | | | | 345,273 | |
| Vehicles | | | 8,528 | | | | 2,592 | |
| Others | | | 4,444 | | | | 4,671 | |
| Accumulated depreciation | | | (688,727 | ) | | | (578,878 | ) |
| | | | | | | |
| | | Ps. | 948,067 | | | Ps. | 898,321 | |
| | | | | | | |
Depreciation expense recorded for the fiscal years ended December 31, 2010, 2009 and 2008, was Ps.76,899, Ps. 73,904 and Ps. 61,910, respectively.
F-23
Grupo Financiero Galicia S.A. and Subsidiaries
Notes to the Consolidated Financial Statements
For the years ended December 31, 2010, 2009 and 2008
(Expressed in thousands of Argentine pesos)
The major categories of intangible assets as of December 31, 2010 and 2009, were as follows:
| | | | | | | | | |
| | | December 31, | |
| | | 2010 | | | 2009 | |
| | | | | | | | | |
| Goodwill, net of accumulated amortization of Ps.98,767 and Ps.87,700, respectively | | Ps. | 23,467 | | | Ps. | 26,346 | |
| Organization and development expenses, net of accumulated amortization of Ps.336,276 and Ps.202,214, respectively | | | 430,648 | | | | 286,925 | |
| Legal actions related to the payment of deposits (“amparo claims”), net of accumulated amortization of Ps.859,638 and Ps.578,692, respectively (see Note 2.10) | | | — | | | | 259,053 | |
| | | | | | | |
| | | Ps. | 454,115 | | | Ps. | 572,324 | |
| | | | | | | |
Total amortization expenses for the fiscal years ended December 31, 2010, 2009 and 2008, was Ps. 355,408, Ps.166,675 and Ps.97,957, respectively.
Organization and development expenses included software and the related implementation services purchased from third parties, with a net book value of Ps.349,527; Ps.213,226 and Ps.139,722 at December 31, 2010, 2009 and 2008, respectively.
The table below shows the components of goodwill by type of activity and reportable segment (see note 31) for the periods presented.
| | | | | | | | | |
| | | December 31, | |
| | | 2010 | | | 2009 | |
| | | | | | | | | |
| Banking | | | 19,903 | | | | 26,346 | |
| Data Processing | | | 3,564 | | | | — | |
| | | | | | | |
| | | Ps. | 23,467 | | | Ps. | 26,346 | |
| | | | | | | |
11. Miscellaneous Assets.
Miscellaneous assets consisted of the following as of December 31, 2010 and 2009:
| | | | | | | | | |
| | | December 31, | |
| | | 2010 | | | 2009 | |
| | | | | | | | | |
| Construction in progress | | Ps. | 5,423 | | | Ps. | 1,370 | |
| Deposits on fixed asset purchases | | | 2,848 | | | | 831 | |
| Stationery and supplies | | | 12,254 | | | | 15,363 | |
| Real estate held for sale | | | 3,584 | | | | 5,561 | |
| Assets under leasing agreements | | | 19,157 | | | | 19,503 | |
| Others | | | 38,137 | | | | 21,213 | |
| | | | | | | |
| | | Ps. | 81,403 | | | Ps. | 63,841 | |
| | | | | | | |
F-24
Grupo Financiero Galicia S.A. and Subsidiaries
Notes to the Consolidated Financial Statements
For the years ended December 31, 2010, 2009 and 2008
(Expressed in thousands of Argentine pesos)
12. Allowances and Provisions.
Allowances on other assets and reserves for contingencies were as follows:
| | | | | | | | | |
| | | December 31, | |
| | | 2010 | | | 2009 | |
| | | | | | | | | |
| Allowances against asset accounts: | | | | | | | | |
| Other receivables resulting from financial brokerage, for collection risk (a) | | | 131,806 | | | | 30,570 | |
| Assets under financial leases (a) | | | 5,469 | | | | 6,070 | |
| Equity investments in other companies (b) | | | 13,263 | | | | 5,960 | |
| Miscellaneous receivables, for collection risk (a) | | | 26,025 | | | | 28,655 | |
| | | | | | | | | |
| Reserves for contingencies: | | | | | | | | |
| For severance payments (c) | | | 12,139 | | | | 5,892 | |
| Litigations (d) | | | 84,051 | | | | 57,042 | |
| Other contingencies (e) | | | 89,802 | | | | 148,352 | |
| Sundry liabilities arising from credit card activities (f) | | | 46,493 | | | | 44,493 | |
| Other commitments (g) | | | 125 | | | | 143 | |
| Negative Goodwill (h) | | | 465,634 | | | | — | |
| | | | | | | |
| Total reserves for contingencies | | Ps. | 698,244 | | | Ps. | 255,922 | |
| | | | | | | |
| | |
| (a) | | Based upon an assessment of debtors’ performance, the economic and financial situation and the guarantees collateralizing their respective transactions. Includes Ps.98,638 of valuation allowances to adjust certificates of participation held in Galtrust I to its fair value. |
| |
| (b) | | Includes the estimated losses due to the excess of the cost plus dividend method over the equity method in non-majority owned equity investments. |
| |
| (c) | | Estimated amounts payable under labor lawsuits filed against the Bank by former employees. |
| |
| (d) | | Litigation arising from different types of claims from customers (e.g., claims for thefts from safe deposit boxes, the cashing of checks that have been fraudulently altered, discrepancies in deposits and payments services that the Bank renders, etc). |
| |
| (e) | | At the date of these consolidated financial statements, there are several review and assessment processes ongoing, at different progress stages, initiated by the provincial and Autonomous City of Buenos Aires’ Tax Authorities related to the turnover tax, mainly corresponding to fiscal year 2002, and basically in connection with the Compensatory Bond set forth by the National Government in order to compensate financial institutions for the losses resulting from the asymmetric pesification of loans and deposits. |
The Bank has been expressing its disagreement regarding these adjustments at the corresponding administrative and/or legal proceedings. These proceedings and their possible effects are constantly being monitored by the management division. Even though the foregoing has not been finally resolved yet, the Bank considers it has complied with its tax liabilities in full pursuant to current regulations, since it is not possible to foresee the final outcome, the Bank has established provisions deemed suitable according to each process’s status.
As regards Compañía Financiera Argentina S.A., the Argentine Revenue Service (AFIP) conducted audits on fiscal years 1998 and 1999, not accepting certain uncollectible loans to be recorded as uncollectible receivables deductible from income tax and minimum presumed income tax. The original amount claimed for taxes by the tax collection authorities totals Ps.2,094.
F-25
Grupo Financiero Galicia S.A. and Subsidiaries
Notes to the Consolidated Financial Statements
For the years ended December 31, 2010, 2009 and 2008
(Expressed in thousands of Argentine pesos)
Since the final resolution of this controversy is still uncertain, provisions have been set up to cover such contingencies.
| | |
| (f) | | Reserves for a guarantee of credit-cards receivable and for the estimated liability for the insurance of the payment of credit-cards balance in the event of the death of the credit-card holders. |
At the date of these consolidated financial statements, the Argentine Revenue Service (AFIP), the Revenue Board of the Province of Córdoba and the Municipalities of the cities of Mendoza and San Luis are in the process of conducting audits, with respect to claims made by such agencies, regarding taxes applicable to Credit Cards issuing companies. The original amount claimed for such reason, totals Ps.10,500, approximately.
Based on the opinions of their tax advisors, the companies believe that the abovementioned claims are both legally and technically groundless.
However, since the final outcome of these measures cannot be foreseen, provisions have been set up to cover such contingencies. Therefore, both companies are taking the corresponding administrative and legal steps in order to solve such issues.
| | |
| (g) | | Represents contingent commitments in connection with customers classified in categories other than the “normal” categories under Argentine Banking GAAP. |
| |
| (h) | | The Board of Directors of the Argentine Central Bank through Resolution No. 124 dated June 7, 2010, authorized the acquisition of 95% of stocks of Compañía Financiera Argentina S.A., Cobranzas y Servicios S.A. and Procesadora Regional S.A. Also, said Resolution authorized subsidiary company Tarjetas Regionales S.A. to acquire the remaining 5% of said companies’ stocks. |
On August 31, 2010, through Resolution No. 299, the National Commission for the Defense of Competition authorized the abovementioned trading transaction which was notified to the Bank on September 1, 2010.
The total acquisition cost paid by the Group amounted to Ps.328,279 for Compañía Financiera Argentina, Ps.835 for Cobranzas y Servicios S.A. and Ps.4,809 for Procesadora Regional S.A..
In accordance with Argentine Central Bank regulations, as a result of the difference between the cost of acquisition and the value of assets and liabilities acquired as of June 30, 2010, consistently valued with those of the Group, a negative goodwill of Ps.450,547 was recorded for Compañía Financiera Argentina S.A. and Ps.15,087 for Cobranzas y Servicios S.A., which were recorded under the caption “Liabilities — Provisions”. In the case of Procesadora Regional S.A, a positive goodwill of Ps. 3,565 was recorded under Intangible Assets — Goodwill.
The allocation to income of the negative goodwill is carried out on a straight-line basis over 60 months, taking into account Argentine Central Bank regulations on the subject.
F-26
Grupo Financiero Galicia S.A. and Subsidiaries
Notes to the Consolidated Financial Statements
For the years ended December 31, 2010, 2009 and 2008
(Expressed in thousands of Argentine pesos)
| 13. | | Other Liabilities Resulting from Financial Brokerage- Banks and International Entities, and Loans from Domestic Financial Institutions |
The Bank also borrows funds under different credit arrangements from local and foreign banks and international lending agencies as follows:
| | | | | | | | | |
| | | December 31, | |
| | | 2010 | | | 2009 | |
Description | | | | | | | | |
Bank and International Entities | | | | | | | | |
| Contractual long-term Liabilities | | | | | | | | |
| Floating Rate Bank Loans 2010 | | Ps. | — | | | Ps. | 2,024 | |
| Floating Rate Bank Loans 2014 | | | — | | | | 94,902 | |
| Floating Rate Bank Loans 2019 | | | 8,232 | | | | 7,364 | |
| Internacional Finance Corp. (I.F.C.) | | | 229,540 | | | | 260,771 | |
| | | | | | | |
| Total long-term liabilities | | Ps. | 237,772 | | | Ps. | 365,061 | |
| | | | | | | |
| | | | | | | | | |
| Contractual short-term liabilities: | | | | | | | | |
| Other lines from foreign banks | | | 408,973 | | | | 179,961 | |
| | | | | | | |
| Total short-term liabilities | | Ps. | 408,973 | | | Ps. | 179,961 | |
| | | | | | | |
| | | | | | | | | |
Total Banks and International Entities | | Ps. | 646,745 | | | Ps. | 545,022 | |
| | | | | | | |
| | | | | | | | | |
Domestic and Financial Institutions | | | | | | | | |
| Contractual long-term liabilities: | | | | | | | | |
| BICE (Banco de Inversión y Comercio Exterior) | | | 23,709 | | | | — | |
| Other lines from domestic banks | | | 434,064 | | | | 164,612 | |
| | | | | | | |
| Total long-term liabilities | | Ps. | 457,773 | | | Ps. | 164,612 | |
| Contractual short-term liabilities: | | | | | | | | |
| Other lines from credit from domestic banks | | | 155,424 | | | | 86,869 | |
| | | | | | | |
| Total short-term liabilities | | Ps. | 155,424 | | | Ps. | 86,869 | |
| | | | | | | |
| | | | | | | | | |
Total Domestic and Financial Institutions | | Ps. | 613,197 | | | Ps. | 251,481 | |
| | | | | | | |
| | | | | | | | | |
TOTAL | | Ps. | 1,259,942 | | | Ps. | 796,503 | |
| | | | | | | |
Accrued interest on the above liabilities in the amount of Ps.6,245 and Ps.4,525 as of December 31, 2010 and 2009, respectively, is included in “Others” under the caption “Other Liabilities Resulting from Financial Brokerage” in the accompanying balance sheet.
Long-term debt of Ps.695,545 corresponds mainly to: (a) a line of credit from the IFC for Ps.229,540 for financing investment projects, b) debt issued as a result of the Bank’s foreign debt restructuring completed in May 2004 for Ps.8,232, (c) debt with domestic banks for Ps.434,064, corresponding mainly of the regional credit-card companies, (d) lines of credit from the BICE for Ps.23,709 for financing investment projects.
F-27
Grupo Financiero Galicia S.A. and Subsidiaries
Notes to the Consolidated Financial Statements
For the years ended December 31, 2010, 2009 and 2008
(Expressed in thousands of Argentine pesos)
As of December 31, 2010, maturities of the above long-term loans for each of the following five fiscal years and thereafter were as follows:
| | | | | |
|
| Contractual long-term Liabilities | | | | |
| 2011 | | | 241,201 | |
| 2012 | | | 286,237 | |
| 2013 | | | 111,334 | |
| 2014 | | | 30,137 | |
| 2015 | | | 18,405 | |
| Thereafter | | | 8,231 | |
| | | | |
| | | Ps. | 695,545 | |
| | | | |
14. Other Liabilities Resulting from Financial Brokerage — Negotiable Obligations
The amounts outstanding and the terms corresponding to outstanding negotiable obligations at the dates indicated were as follows:
| | | | | | | | | | | | | | | | | |
| | | | | | | Annual | | | As of December 31, | |
| | | Maturity | | | Interest Rate | | | 2010 | | | 2009 | |
| Negotiable Obligations (1) | | | | | | | | | | | | | | | | |
| | | | | | | | | | | | | | | | | |
| Long-term liabilities: | | | | | | | | | | | | | | | | |
| 9% Notes Due 2003 | | | 2003 | | | | 9,00 | % | | | 6,652 | | | | 6,352 | |
| (Semi-annual interest, principal payable at maturity) | | | | | | | | | | | | | | | | |
| Banco Galicia- Due 2010-Libor + 350 PB | | | 2010 | | | | 0,00 | % | | | — | | | | 129,858 | |
| (Semi-annual interest) | | | | | | | | | | | | | | | | |
| Banco Galicia- Due 2014 | | | 2014 | | | | 7,00 | % | | | — | | | | 736,542 | |
| (Semi-annual interest) | | | | | | | | | | | | | | | | |
| Banco Galicia- Subordinated Due 2019 | | | 2019 | | | | 11,00 | % | | | 1,253,027 | | | | 1,137,447 | |
| (Semi-annual interest, principal payable at maturity) | | | | | | | | | | | | | | | | |
| Tarjetas Naranja S.A. Class IV | | | 2011 | | | | 15,50 | % | | | 77,064 | | | | 156,794 | |
| (Interest fixed,semi-annual interest - principal payable every six months) | | | | | | | | | | | | | | | | |
| Tarjetas Cuyanas S.A. S. XVIII | | | 2012 | | | | 12,00 | % | | | 39,164 | | | | 79,506 | |
| (Interest fixed,semi-annual interest - principal payable every six months) | | | | | | | | | | | | | | | | |
| Tarjetas Cuyanas S.A. S. XX | | | 2010 | | | | — | | | | — | | | | 75,934 | |
| (Issued at a discounted base, principal payable at maturity) | | | | | | | | | | | | | | | | |
| Tarjetas Cuyanas S.A. Class III | | | 2011 | | | | 6,00 | % | | | 79,841 | | | | — | |
| (Issued at a discounted base, principal payable at maturity) | | | | | | | | | | | | | | | | |
| Tarjetas Naranja S.A. Class IX Serie I | | | 2010 | | | | — | | | | — | | | | 133,296 | |
| (Issued at a discounted base, principal payable at maturity) | | | | | | | | | | | | | | | | |
| Tarjetas Naranja S.A. Class IX Serie II | | | 2011 | | | | 12,50 | % | | | 59,038 | | | | 55,416 | |
| (Interest fixed,semi-annual interest, principal payable at maturity) | | | | | | | | | | | | | | | | |
F-28
| | | | | | | | | | | | | | | | | |
| | | | | | | Annual | | | As of December 31, | |
| | | Maturity | | | Interest Rate | | | 2010 | | | 2009 | |
| Tarjetas Naranja S.A. Class XII | | | 2011 | | | | 6,10 | % | | | 139,214 | | | | — | |
| (Interest fixed,quarterly interest, principal payable at maturity) | | | | | | | | | | | | | | | | |
| Grupo Financiero Galicia Class I Serie II | | | 2011 | | | | 12,50 | % | | | 42,128 | | | | 40,263 | |
| (Interest fixed,semi-annual interest, principal payable at maturity) | | | | | | | | | | | | | | | | |
| Grupo Financiero Galicia Class II Serie II | | | 2012 | | | | 8,00 | % | | | 70,546 | | | | — | |
| (Interest fixed,semi-annual interest, principal payable at maturity) | | | | | | | | | | | | | | | | |
| Grupo Financiero Galicia Class II Serie III | | | 2013 | | | | 9,00 | % | | | 106,782 | | | | — | |
| (Interest fixed,semi-annual interest, principal payable at maturity) | | | | | | | | | | | | | | | | |
| | | | | | | | | | | | | | | | | |
| | | | | | | | | | | | | | | |
Total | | | Ps. | | | | | | | | 1,873,456 | | | | 2,551,408 | |
| | | | | | | | | | | | | | | |
| | | | | | | | | | | | | | | | | |
| | | | | | | Annual | | | As of December 31, | |
| | | Maturity | | | Interest Rate | | | 2010 | | | 2009 | |
Short-term liabilities: | | | | | | | | | | | | | | | | |
| | | | | | | | | | | | | | | | | |
| Tarjeta Naranja Class X | | | 2011 | | | Badlar + 275 bp | | | 48,177 | | | | — | |
| (Quarterly interest, principal payable at maturity) | | | | | | | | | | | | | | | | |
| Tarjeta Naranja Class XI | | | 2011 | | | Badlar + 295 bp | | | 40,919 | | | | — | |
| (Quarterly interest, principal payable at maturity) | | | | | | | | | | | | | | | | |
| Tarjetas Cuyanas S.A. Class I | | | 2011 | | | Badlar + 300 bp | | | 28,854 | | | | — | |
| (Quarterly interest, principal payable at maturity) | | | | | | | | | | | | | | | | |
| Tarjetas Cuyanas S.A. Class II | | | 2011 | | | | 9,95 | % | | | 37,484 | | | | — | |
| (Quarterly interest, principal payable at maturity) | | | | | | | | | | | | | | | | |
| | | | | | | | | | | | | | | | | |
| Grupo Financiero Galicia Serie I | | | 2010 | | | | — | | | | — | | | | 125,793 | |
| (Issued at a discounted base, principal payable at maturity) | | | | | | | | | | | | | | | | |
| | | | | | | | | | | | | | | |
| | | | | | | | | | | | | | | | | |
Total | | | Ps. | | | | | | | | 155,434 | | | | 125,793 | |
| | | | | | | | | | | | | | | |
Total Negotiable Obligations | | | Ps. | | | | | | | | 2,028,890 | | | | 2,677,201 | |
| | | | | | | | | | | | | | | |
| | |
| (1) | | Only principal, except for Subordinated Obligations which include accrued interest for Ps.64,234 . |
As of December 31, 2010 and 2009, interest and principal on all of the above debt securities were payable in U.S. dollars except for Tarjeta Naranja’s Class IV Notes and Tarjetas Cuyanas’ Class XVIII Notes, which were payable in Pesos.
F-29
Grupo Financiero Galicia S.A. and Subsidiaries
Notes to the Consolidated Financial Statements
For the years ended December 31, 2010, 2009 and 2008
(Expressed in thousands of Argentine pesos)
Accrued interest on the above liabilities for Ps.12,885 and Ps.39,350 as of December 31, 2010 and 2009, respectively, was included in “Other” under the caption “Other Liabilities Resulting from Financial Brokerage “ in the accompanying balance sheet.
Long-term negotiable obligations as of December 31, 2010 mature as follows:
| | | | | |
| | | Maturity Long Term | |
| Past Due (*) | | | 6,652 | |
| 2011 | | | 427,742 | |
| 2012 | | | 79,253 | |
| 2013 | | | 106,782 | |
| 2014 | | | — | |
| 2015 | | | — | |
| Thereafter | | | 1,253,027 | |
| | | | |
| | | | 1,873,456 | |
| | | | |
| | |
| (*) | | Corresponds to past due debt not yet restructured. |
15. Balances in Foreign Currency.
The balances of assets and liabilities denominated in foreign currencies (principally in U.S. dollars) were as follows:
| | | | | | | | | |
| | | December 31, | |
| | | 2010 | | | 2009 | |
Assets: | | | | | | | | |
| Cash and due from banks | | Ps. | 3,131,530 | | | Ps. | 1,867,910 | |
| Government and corporate securities | | | 40,169 | | | | 1,215,571 | |
| Loans | | | 3,103,434 | | | | 2,395,667 | |
| Other receivables resulting from financial brokerage | | | 426,779 | | | | 899,804 | |
| Assets under financial leases | | | 28,018 | | | | 29,147 | |
| Equity investments in other companies | | | 2,046 | | | | 1,939 | |
| Miscellaneous receivables | | | 45,879 | | | | 462,434 | |
| Bank premises and equipment | | | 419 | | | | 738 | |
| Miscellaneous assets | | | 40 | | | | 38 | |
| Intangible assets | | | — | | | | 569 | |
| Unallocated items | | | 45 | | | | 12,572 | |
| Other assets | | | 6 | | | | 70 | |
| | | | | | | |
Total | | Ps. | 6,778,365 | | | Ps. | 6,886,459 | |
| | | | | | | |
| | | | | | | | | |
Liabilities: | | | | | | | | |
| Deposits | | Ps. | 4,017,664 | | | Ps. | 3,094,442 | |
| Other liabilities resulting from financial brokerage | | | 2,344,487 | | | | 2,827,321 | |
| Miscellaneous liabilities | | | 19,233 | | | | 11,951 | |
| Subordinated Negotiable Obligations | | | 1,253,027 | | | | 1,137,447 | |
| Provisions | | | 13,868 | | | | 11,493 | |
| Unallocated items | | | 472 | | | | 3,078 | |
| Other Liabilities | | | 101 | | | | 86 | |
| | | | | | | |
Total | | Ps. | 7,648,852 | | | Ps. | 7,085,818 | |
| | | | | | | |
Exchange rate 3.9758 as of December 31, 2010 and 3.7967 as of December 31, 2009
F-30
Grupo Financiero Galicia S.A. and Subsidiaries
Notes to the Consolidated Financial Statements
For the years ended December 31, 2010, 2009 and 2008
(Expressed in thousands of Argentine pesos)
16. Transactions with Related Parties
The Group has granted loans to certain related parties including related officers, equity-method investees and consolidated companies. Total loans outstanding as of December 31, 2010 and 2009, amounted to Ps.126,502 and Ps.76,433, respectively, and the change from December 31, 2009 to December 31, 2010, reflects payments amounting to Ps.3,572 and advances of Ps.52,301. Furthermore, there were CER adjustments and foreign exchange differences of Ps.1,340 on the above-mentioned portfolio between those dates.
Such loans were made in the ordinary course of business at normal credit terms, including interest rates and collateral requirements, and, in management’s opinion, such loans represent normal credit risk.
17. Breakdown of Captions Included in the Income Statement.
| | | | | | | | | | | | | |
| | | December 31, | |
| | | 2010 | | | 2009 | | | 2008 | |
Financial Income | | | | | | | | | | | | |
| | | | | | | | | | | | | |
Interest on other receivables resulting from financial brokerage: | | | | | | | | | | | | |
| Interest on purchased certificates of deposits | | | 11,684 | | | | 14,914 | | | | 6,033 | |
| Additional interest on current accounts and special accounts with the Argentine Central Bank | | | — | | | | — | | | | 12,241 | |
| Advance payment-Leasing | | | 1,968 | | | | 2,928 | | | | 12,332 | |
| Other | | | 1,786 | | | | 5,413 | | | | 3,388 | |
| | | | | | | | | | |
| | | Ps. | 15,438 | | | Ps. | 23,255 | | | Ps. | 33,994 | |
| | | | | | | | | | |
| | | | | | | | | | | | | |
Other | | | | | | | | | | | | |
| Premiums on forward purchases of Government securities under repos | | | 29,584 | | | | 16,114 | | | | 7,013 | |
| Interest on pre-export and export financing | | | 73,298 | | | | 94,517 | | | | 69,238 | |
| Result from other credits by financial brokerage | | | 4,543 | | | | 60,550 | | | | 11,076 | |
| Net position of valuation public sector loans | | | — | | | | 4,106 | | | | 9,157 | |
| Net position of forward transactions in pesos | | | — | | | | 27 | | | | 95,433 | |
| Other | | | 223 | | | | — | | | | 5 | |
| | | | | | | | | | |
| | | Ps. | 107,648 | | | Ps. | 175,314 | | | Ps. | 191,922 | |
| | | | | | | | | | |
| | | | | | | | | | | | | |
Financial Expenses | | | | | | | | | | | | |
| |
Interest on other liabilities resulting from financial brokerage: | | | | | | | | | | | | |
| Interest on negotiable obligations | | | 92,980 | | | | 157,970 | | | | 187,320 | |
| Interest on other liabilities resulting from financial brokerage from other banks and international entities | | | 72,624 | | | | 74,002 | | | | 109,706 | |
| | | | | | | | | | |
| | | Ps. | 165,604 | | | Ps. | 231,972 | | | Ps. | 297,026 | |
| | | | | | | | | | |
| | | | | | | | | | | | | |
Other interest | | | | | | | | | | | | |
| Interest for other deposits | | | 3,702 | | | | 2,860 | | | | 3,301 | |
| Other | | | 2,665 | | | | 22 | | | | 12 | |
| | | | | | | | | | |
| | | Ps. | 6,367 | | | Ps. | 2,882 | | | Ps. | 3,313 | |
| | | | | | | | | | |
F-31
Grupo Financiero Galicia S.A. and Subsidiaries
Notes to the Consolidated Financial Statements
For the years ended December 31, 2010, 2009 and 2008
(Expressed in thousands of Argentine pesos)
| | | | | | | | | | | | | |
| | | December 31, | |
| | | 2010 | | | 2009 | | | 2008 | |
| | | | | | | | | | | | | |
Other | | | | | | | | | | | | |
| Premiums on repo transactions | | | 13,169 | | | | 33,780 | | | | 84,823 | |
| Contributions and taxes on financial income | | | 236,792 | | | | 135,644 | | | | 112,373 | |
| Net position of forward transactions in pesos | | | 48,630 | | | | 24,068 | | | | — | |
| Other | | | 627 | | | | 375 | | | | — | |
| | | | | | | | | | |
| | | Ps. | 299,218 | | | Ps. | 193,867 | | | Ps. | 197,196 | |
| | | | | | | | | | |
| | | | | | | | | | | | | |
Income from services | | | | | | | | | | | | |
| Other | | | | | | | | | | | | |
| Commissions on credit cards | | | 1,127,881 | | | | 781,367 | | | | 652,040 | |
| Safety rental | | | 51,248 | | | | 30,221 | | | | 18,003 | |
| Insurance premiums | | | 337 | | | | 12,671 | | | | 58,901 | |
| Other | | | 89,020 | | | | 78,644 | | | | 70,856 | |
| | | | | | | | | | |
| | | Ps. | 1,268,486 | | | Ps. | 902,903 | | | Ps. | 799,800 | |
| | | | | | | | | | |
| | | | | | | | | | | | | |
Expenses for services | | | | | | | | | | | | |
| Other | | | | | | | | | | | | |
| Gross revenue taxes | | | 131,260 | | | | 91,016 | | | | 74,339 | |
| Linked with credit cards | | | 295,150 | | | | 212,427 | | | | 130,813 | |
| Other | | | 14,946 | | | | 14,706 | | | | 14,348 | |
| | | | | | | | | | |
| | | Ps. | 441,356 | | | Ps. | 318,149 | | | Ps. | 219,500 | |
| | | | | | | | | | |
| | | | | | | | | | | | | |
Administrative expenses | | | | | | | | | | | | |
| Other operating expenses | | | | | | | | | | | | |
| Rentals | | | 85,551 | | | | 62,234 | | | | 51,292 | |
| Electricity and communications | | | 106,439 | | | | 85,850 | | | | 72,712 | |
| Maintenance and repair expenses | | | 67,274 | | | | 52,134 | | | | 43,841 | |
| Security Services | | | 75,707 | | | | 50,282 | | | | 42,255 | |
| Other operating expenses | | | 38,670 | | | | 29,604 | | | | 39,119 | |
| | | | | | | | | | |
| | | Ps. | 373,641 | | | Ps. | 280,104 | | | Ps. | 249,219 | |
| | | | | | | | | | |
| | | | | | | | | | | | | |
Miscellaneous income | | | | | | | | | | | | |
| Other | | | | | | | | | | | | |
| Interest on miscellaneous receivables | | | 25,375 | | | | 31,076 | | | | 39,382 | |
| Premiums and commissions from insurance business | | | 388,486 | | | | 333,669 | | | | 276,019 | |
| Waiver for repayment of debt | | | — | | | | 85,550 | | | | — | |
| Other | | | 60,401 | | | | 52,051 | | | | 18,245 | |
| | | | | | | | | | |
| | | Ps. | 474,262 | | | Ps. | 502,346 | | | Ps. | 333,646 | |
| | | | | | | | | | |
| | | | | | | | | | | | | |
Miscellaneous losses | | | | | | | | | | | | |
| Other | | | | | | | | | | | | |
| Claims | | | 3,412 | | | | 2,561 | | | | 1,821 | |
| Commissions and expenses on insurance business | | | 136,228 | | | | 93,686 | | | | 119,045 | |
| Other | | | 28,192 | | | | 26,921 | | | | 17,918 | |
| | | | | | | | | | |
| | | Ps. | 167,832 | | | Ps. | 123,168 | | | Ps. | 138,784 | |
| | | | | | | | | | |
F-32
Grupo Financiero Galicia S.A. and Subsidiaries
Notes to the Consolidated Financial Statements
For the years ended December 31, 2010, 2009 and 2008
(Expressed in thousands of Argentine pesos)
18. Income Taxes.
Income tax for the fiscal years ended December 31, 2010, 2009 and 2008, amounted to Ps.258,191, Ps.155,992 and Ps.74,014, respectively. The statutory income tax rate as of December 31, 2010, 2009 and 2008 was 35%. As of December 31, 2010 and 2009, the Group had tax loss carryforwards in the approximate amount of Ps.262,400 and Ps.268,060, respectively, that may reduce future year’s taxable income for income tax purposes. Such tax loss carryforwards expire over the following five years.
As of December 31, 2010 and 2009, the consolidated Group’s MPIT available to credit against future income tax amounts to Ps.395,738 and Ps.328,619, respectively. Such MPIT expire over the following ten years.
19. Shareholders’ Equity and Restrictions Imposed on the Distribution of Dividends.
The distribution of retained earnings in the form of dividends is governed by the Corporations Law and CNV regulations. These rules obligate Grupo Galicia to transfer 5% of its net income to a legal reserve until the reserve reaches an amount equal to 20% of the company’s capital stock.
In the case of Banco Galicia, Argentine Central Bank rules require 20% of the profits shown in the income statement plus (less) prior year adjustments to be allocated to a legal reserve.
This proportion applies regardless of the ratio of the legal reserve to the capital stock. Should the legal reserve be used to absorb losses, dividends shall be distributed only if the value of the legal reserve exceeds 20% of the capital stock plus the capital adjustment.
The Argentine Central Bank set forth the criteria for the distribution of dividends by financial institutions. According to the new rules, dividends can be distributed up to the positive amount resulting after deducting from retained earnings the reserves that may be legally and statutory required, as well as the following items: the difference between the book value and the market value of a financial institution’s portfolio of public sector assets and/or debt instruments issued by the Argentine Central Bank not valued at market price, the amount of the asset representing the losses from lawsuits related to deposits and any adjustments required by the external auditors or the Argentine Central Bank to be recognized.
In addition, to be able to distribute dividends, a financial institution must comply with the capital adequacy rule, with the minimum capital requirement and the regulatory capital calculated with the purpose to determine its ability to distribute dividends, by deducting from its assets and retained earnings all the items mentioned in the paragraph above, as well as the asset recorded in connection with the MPIT and the amounts allocated to the repayment of long-term debt instruments computable as core capital.
Moreover, in such calculation, a financial institution will not be able to compute the temporary reductions in the capital affecting minimum capital requirements, computable regulatory capital or a financial institution’s capital adequacy.
In addition to the above-mentioned, the Argentine Central Bank shall not accept distribution of profits as long as computable capital is lower than minimum capital requirements increased by 30%.
Distribution of profits shall require the prior authorization of the Argentine Central Bank’s Superintendence of Financial and Foreign Exchange Institutions, which intervention shall have the purpose of verifying the aforementioned requirements have been fulfilled.
In turn, the shareholders of Tarjeta Naranja S.A., ratified the decision made by the Board of Directors and, set forth the following policy for the distribution of dividends: a) to keep under retained earnings those retained earnings corresponding to fiscal years prior to 2005 and, therefore, not to distribute them as dividends, and b) to set the maximum limit for the distribution of dividends at 25% of the realized and liquid profits of each fiscal year from and after fiscal year 2005. These restrictions shall remain in force as long as this company’s shareholder’s equity is below Ps.300,000.
F-33
Grupo Financiero Galicia S.A. and Subsidiaries
Notes to the Consolidated Financial Statements
For the years ended December 31, 2010, 2009 and 2008
(Expressed in thousands of Argentine pesos)
Also, Tarjeta Naranja S.A. agreed, pursuant to the terms and conditions of the Class IV and IX Negotiable Obligations, not to distribute profits exceeding 50% of net income.
20. Minimum Capital.
Grupo Galicia is not subject to the minimum capital requirements established by the Argentine Central Bank.
In addition, Grupo Galicia meets the minimum capital requirements established by the Corporations Law, which amount to Ps.12.
Pursuant to Argentine Central Bank regulations, Banco Galicia is required to maintain a minimum capital, which is calculated by weighting the risks related to assets and to the balances of bank premises and equipment and miscellaneous and intangible assets.
As called for by Argentine Central Bank regulations, as of December 31, 2010 and 2009, the minimum capital requirements were as follows:
| | | | | | | | | | | | | |
| | | | | | | | | | | Computable Capital as | |
| | | | | | | | | | | a % of Minimum | |
| | | Minimum Capital | | | Computable Capital | | | Capital | |
| December 31, 2010 | | Ps. | 2,007,081 | | | Ps. | 3,593,930 | | | | 179,06 | |
| December 31, 2009 | | Ps. | 1,611,504 | | | Ps. | 2,789,198 | | | | 173,08 | |
21. Earnings per Share.
Earnings per share are based upon the weighted average of common shares outstanding of Grupo Galicia in the amount of 1,241,407 for the fiscal years ended December 31, 2010, 2009 and 2008.
Earnings per share for the fiscal years ended December 31, 2010, 2009 and 2008, were 0.329, 0.185, and 0.142, respectively.
As of December 31, 2010, 2009 and 2008, there were no outstanding dilutive instruments and therefore for the purposes of calculating earnings per share Grupo Galicia had a simple capital structure.
22. Contribution to the Deposit Insurance System.
Law No. 24,485 and Decree No. 540/95 established the creation of the Deposit Insurance System to cover the risk attached to bank deposits, in addition to the system of privileges and safeguards envisaged in the Financial Institutions Law.
The National Executive Branch through Decree No. 1127/98 dated September 24, 1998, extended this insurance system to demand deposits and time deposits of up to Ps.30 denominated either in pesos and/or in foreign currency.
This system does not cover deposits made by other financial institutions (including time deposit certificates acquired through a secondary transaction), deposits made by parties related to Banco Galicia, either directly or indirectly, deposits of securities, acceptances or guarantees and those deposits set up after July 1, 1995, at an interest rate exceeding the one established regularly by the Argentine Central Bank based on a daily survey conducted by it. Also excluded are those deposits whose ownership has been acquired through endorsement and those placements made as a result of incentives other than the interest rate. This system has been implemented through the creation of the Deposit Insurance Fund (“FGD”), which is managed by a company called Seguros de Depósitos S.A. (SEDESA). The shareholders of SEDESA are the Argentine Central Bank and the financial institutions, in the proportion determined for each one by the Argentine Central Bank based on the contributions made to the fund.
F-34
Grupo Financiero Galicia S.A. and Subsidiaries
Notes to the Consolidated Financial Statements
For the years ended December 31, 2010, 2009 and 2008
(Expressed in thousands of Argentine pesos)
As of January 1, 2005, the Argentine Central Bank set this contribution in 0.015%.
As of December 31, 2010, 2009 and 2008, the standard contribution to the Deposits Insurance System amounted to Ps.31,839, Ps.26,030 and Ps.23,555, respectively, recorded in the Consolidated Statements of Income in Financial Expenses under the caption “Contributions made to Deposit Insurance Fund”.
It should be noted that from January 2011, the Argentine Central Bank decided to increase the limit of deposit insurance up to the amount of Ps.120.
23. Statements of Income and Balance Sheets.
The presentation of financial statements according to the Argentine Central Bank rules differs significantly from the format required by the Securities and Exchange Commission under Rules 210.9 to 210.9-07 of Regulation S-X (Article 9). The statement of income presented below discloses the categories required by Article 9 using Argentine Banking GAAP:
| | | | | | | | | | | | | |
| | | December 31, | |
| | | 2010 | | | 2009 | | | 2008 | |
Interest income: | | | | | | | | | | | | |
| Interest and fees on loans (*) | | Ps. | 3,174,796 | | | Ps. | 2,278,655 | | | Ps. | 2,099,393 | |
| Interest and dividends on investment securities: | | | | | | | | | | | | |
| Non taxable interest income | | | 21,263 | | | | 270,353 | | | | 76,912 | |
| Interest on interest bearing deposits with other banks | | | 746 | | | | 638 | | | | 8,765 | |
| Interest on other receivables from financial brokerage | | | 135,620 | | | | 90,186 | | | | 163,420 | |
| Trading account interest, net | | | 318,121 | | | | 284,837 | | | | 71,515 | |
| | | | | | | | | | |
| Total interest income | | | 3,650,546 | | | | 2,924,669 | | | | 2,420,005 | |
| | | | | | | | | | |
| | | | | | | | | | | | | |
Interest expense | | | | | | | | | | | | |
| Interest on deposits | | | 766,710 | | | | 880,775 | | | | 794,037 | |
| Interest on securities sold under agreements to repurchase | | | 13,169 | | | | 33,780 | | | | 84,823 | |
| Interest on short-term liabilities from financial intermediation | | | 77,350 | | | | 67,283 | | | | 82,667 | |
| Interest on long-term liabilities from financial intermediation (*) | | | 235,985 | | | | 233,477 | | | | 316,141 | |
| | | | | | | | | | |
| Total interest expense | | | 1,093,214 | | | | 1,215,315 | | | | 1,277,668 | |
| | | | | | | | | | |
| | | | | | | | | | | | | |
| Net interest income | | | 2,557,332 | | | | 1,709,354 | | | | 1,142,337 | |
| | | | | | | | | | |
| | | | | | | | | | | | | |
| Provision for loan losses, net of reversals | | | 445,833 | | | | 595,713 | | | | 313,188 | |
| | | | | | | | | | |
| Net interest income after provision for loan losses | | | 2,111,499 | | | | 1,113,641 | | | | 829,149 | |
| | | | | | | | | | |
| | |
| (*) | | Includes CER/CVS adjustments. |
F-35
Grupo Financiero Galicia S.A. and Subsidiaries
Notes to the Consolidated Financial Statements
For the years ended December 31, 2010, 2009 and 2008
(Expressed in thousands of Argentine pesos)
| | | | | | | | | | | | | |
| | | December 31, | |
| | | 2010 | | | 2009 | | | 2008 | |
Non-interest income: | | | | | | | | | | | | |
| Service charges on deposit accounts | | Ps. | 323,328 | | | Ps. | 253,299 | | | Ps. | 201,653 | |
| Credit-card service charges and fees | | | 981,215 | | | | 704,025 | | | | 548,629 | |
| Other commissions | | | 1,188,063 | | | | 882,084 | | | | 897,715 | |
| Income from equity in other companies | | | 62,054 | | | | 11,347 | | | | 56,764 | |
| Premiums and commissions on insurance business | | | 388,486 | | | | 333,669 | | | | 276,019 | |
| Other | | | 127,723 | | | | 195,426 | | | | 139,949 | |
| | | | | | | | | | |
| Total non-interest income | | Ps. | 3,070,869 | | | Ps. | 2,379,850 | | | Ps. | 2,120,729 | |
| | | | | | | | | | |
| | | | | | | | | | | | | |
Non-interest expense: | | | | | | | | | | | | |
| Commissions | | | 601,797 | | | | 424,847 | | | | 309,808 | |
| Salaries and social security charges | | | 1,407,961 | | | | 975,767 | | | | 805,197 | |
| Fees and external administrative services | | | 268,235 | | | | 183,730 | | | | 161,192 | |
| Depreciation of bank premises and equipment | | | 76,899 | | | | 73,904 | | | | 61,910 | |
| Personnel services | | | 89,345 | | | | 76,760 | | | | 90,791 | |
| Rentals | | | 85,551 | | | | 62,234 | | | | 51,292 | |
| Electricity and communications | | | 106,439 | | | | 85,850 | | | | 72,712 | |
| Advertising and publicity | | | 189,596 | | | | 127,836 | | | | 146,496 | |
| Taxes | | | 608,485 | | | | 406,161 | | | | 324,475 | |
| Amortization of organization and development expenses | | | 63,132 | | | | 45,908 | | | | 37,950 | |
| Maintenance and repair expenses | | | 67,274 | | | | 52,134 | | | | 43,841 | |
| Commissions and expenses on insurance business | | | 136,228 | | | | 93,686 | | | | 119,045 | |
| Amortization of “Amparo claims” | | | 280,946 | | | | 109,310 | | | | 39,545 | |
| Other Provisions and reserves | | | 102,387 | | | | 109,296 | | | | 161,703 | |
| Other | | | 326,668 | | | | 234,289 | | | | 237,276 | |
| | | | | | | | | | |
| Total non-interest expense | | Ps. | 4,410,943 | | | Ps. | 3,061,712 | | | Ps. | 2,663,233 | |
| | | | | | | | | | |
| Income before tax expense | | | 771,425 | | | | 431,779 | | | | 286,645 | |
| Income tax expense | | | 258,191 | | | | 155,992 | | | | 74,014 | |
| | | | | | | | | | |
| Net Income | | Ps. | 513,234 | | | Ps. | 275,787 | | | Ps. | 212,631 | |
| | | | | | | | | | |
| | | | | | | | | | | | | |
| Less: Net Income attributable to non-controlling interest | | | 104,333 | | | | 46,512 | | | | 35,812 | |
| | | | | | | | | | |
| Net Income attributable to Controlling interest | | Ps. | 408,901 | | | Ps. | 229,275 | | | Ps. | 176,819 | |
| | | | | | | | | | |
| Net income per Ordinary Share in Argentine Pesos | | | 0.329 | | | | 0.185 | | | | 0.142 | |
| | | | | | | | | | |
F-36
Grupo Financiero Galicia S.A. and Subsidiaries
Notes to the Consolidated Financial Statements
For the years ended December 31, 2010, 2009 and 2008
(Expressed in thousands of Argentine pesos)
Argentine Central Bank rules also require certain classifications of assets and liabilities, which are different from those required by Article 9. The following balance sheet presents Grupo Galicia’s balance sheet as of December 31,2010 and 2009, as if they had followed Article 9 balance sheet disclosure requirements using Argentine Banking GAAP.
| | | | | | | | | |
| | | December 31, | |
| | | 2010 | | | 2009 | |
Assets: | | | | | | | | |
| Cash and due from banks | | Ps. | 5,657,730 | | | Ps. | 3,713,335 | |
| Interest-bearing deposits in other banks | | | 215,282 | | | | 440,745 | |
| Federal funds sold and securities purchased under resale agreements or similar agreements | | | 240,811 | | | | 178,474 | |
| Trading account assets | | | 2,706,167 | | | | 2,011,860 | |
| Investment securities | | | 2,297,543 | | | | 4,471,928 | |
| Loans | | | 21,861,678 | | | | 14,368,457 | |
| Allowances for loan losses | | | (1,038,473 | ) | | | (812,354 | ) |
| Miscellaneous receivables | | | 823,602 | | | | 619,944 | |
| Bank Premises and Equipment | | | 948,067 | | | | 898,321 | |
| Intangible Assets | | | 454,115 | | | | 572,234 | |
| Other assets | | | 1,945,243 | | | | 1,540,164 | |
| | | | | | | |
| Total assets | | Ps. | 36,111,765 | | | Ps. | 28,003,108 | |
| | | | | | | |
| | | | | | | | | |
Liabilities and Shareholders’ Equity: | | | | | | | | |
| Deposits | | Ps. | 22,115,956 | | | Ps. | 16,917,453 | |
| Short-term borrowing | | | 719,831 | | | | 392,623 | |
| Other liabilities | | | 273,792 | | | | 313,526 | |
| Amounts payable for spot and forward purchases to be settled | | | 950,453 | | | | 618,375 | |
| Other liabilities resulting from financial brokerage | | | 5,022,761 | | | | 3,489,899 | |
| Long-term debt | | | 2,569,001 | | | | 3,081,081 | |
| Miscellaneous Liabilities | | | 909,632 | | | | 578,699 | |
| Contingent liabilities | | | 698,244 | | | | 255,922 | |
| | | | | | | |
| Total Liabilities | | | 33,259,670 | | | | 25,647,578 | |
| | | | | | | |
| | | | | | | | | |
| Common Stock | | | 1,241,407 | | | | 1,241,407 | |
| Other stockholders’ equity | | | 1,228,093 | | | | 811,132 | |
| Non-controlling Interest | | | 382,595 | | | | 302,991 | |
| | | | | | | |
| Total Shareholders’ Equity | | | 2,852,095 | | | | 2,355,530 | |
| | | | | | | |
| Total Liabilities and Equity | | Ps. | 36,111,765 | | | Ps. | 28,003,108 | |
| | | | | | | |
F-37
Grupo Financiero Galicia S.A. and Subsidiaries
Notes to the Consolidated Financial Statements
For the years ended December 31, 2010, 2009 and 2008
(Expressed in thousands of Argentine pesos)
The carrying value and market value of each classification of investment securities in the Article 9 balance sheet were as follows:
| | | | | | | | | | | | | | | | | | | | | | | | | | | | | | | | | |
| | | December 31, 2010 | | | December 31, 2009 | |
| | | | | | | Unrealized | | | | | | | | | | | Unrealized | | | | |
| | | Carrying value | | | Gains | | | Losses | | | Market value | | | Carrying value | | | Gains | | | Losses | | | Market value | |
| Bonar 2015 Bonds Investments | | | 642,147 | | | | 198,693 | | | | — | | | | 726,643 | | | | — | | | | — | | | | — | | | | — | |
| Boden 2012 Bonds — Compensatory Bond and Hedge Bond | | | — | | | | — | | | | — | | | | — | | | | 1,906,907 | | | | 830,119 | | | | — | | | | 1,731,089 | |
| GalTrust I | | | 783,761 | | | | 566,115 | | | | — | | | | 783,761 | | | | 584,111 | | | | 193,651 | | | | — | | | | 211,647 | |
| Discount Bonds | | | — | | | | — | | | | — | | | | — | | | | 598,601 | | | | 132,209 | | | | — | | | | 302,124 | |
| Bonar 2015 Bonds | | | — | | | | — | | | | — | | | | — | | | | 323,744 | | | | 85,032 | | | | — | | | | 641,340 | |
| Other assets | | | 871,635 | | | | — | | | | (3,167 | ) | | | 874,459 | | | | 1,058,565 | | | | 88,347 | | | | (5,018 | ) | | | 1,030,678 | |
| | | | | | | | | | | | | | | | | | | | | | | | | |
| TOTAL | | Ps. | 2,297,543 | | | Ps. | 764,808 | | | Ps. | (3,167 | ) | | Ps. | 2,384,863 | | | Ps. | 4,471,928 | | | Ps. | 1,329,358 | | | Ps. | (5,018 | ) | | Ps. | 3,916,878 | |
| | | | | | | | | | | | | | | | | | | | | | | | | |
As of December 31, 2010 and 2009 the Group maintained investments in certificates of participation in Almafuerte Special Fund and Trusts sponsored by Banco Galicia and its subsidiaries. At such dates the Group has determined that unrealized losses on these investments were temporary in nature based on its ability and intent to hold them for a period of time sufficient to allow them for any anticipated recovery.
The maturities as of December 31, 2010, of the Investment securities included in the Article 9 balance sheet were as follows:
| | | | | | | | | | | | | | | | | | | | | |
| | | December 31, 2010 | |
| | | | | | | | | | | | | | | Maturing | | | | |
| | | | | | | | | | | Maturing | | | after | | | | |
| | | | | | | Maturing | | | after 1 year | | | 5 years but | | | Maturing | |
| | | Carrying | | | within | | | but within 5 | | | within 10 | | | after | |
| | | Value | | | 1 year | | | years | | | years | | | 10 years | |
| Galtrust I | | | 783,761 | | | | 80,615 | | | | 416,065 | | | | 287,081 | | | | — | |
| Bonar 2015 Bonds Investments | | | 642,147 | | | | — | | | | 642,147 | | | | — | | | | — | |
| Other assets | | | 871,635 | | | | 485,464 | | | | 362,737 | | | | 23,434 | | | | — | |
| | | | | | | | | | | | | | | | |
| TOTAL | | Ps. | 2,297,543 | | | | 566,079 | | | | 1,420,949 | | | | 310,515 | | | | — | |
| | | | | | | | | | | | | | | | |
The following table presents realized gains and losses from AFS securities:
| | | | | | | | | | | | | |
| Year ended December 31, | | 2010 | | | 2009 | | | 2008 | |
| | | | | | | | | | | | | |
| Proceeds from sales | | | 2,376,489 | | | | — | | | | 36,548 | |
| | | | | | | | | | | | | |
| Gross realized gains | | | 971,680 | | | | — | | | | 2,090 | |
| | | | | | | | | | | | | |
| Gross realized losses | | | — | | | | — | | | | — | |
| | | | | | | | | | | | | |
| Net unrealized gains | | | 408,981 | | | | 1,312,212 | | | | 9,915 | |
| | | | | | | | | | | | | |
| Losses reclasiffied out of OCI | | | — | | | | — | | | | (156,237 | ) |
24. Operations by Geographical Segment.
The main financial information, classified by country where transactions originate, is shown below. Most of the transactions originated in the Republic of Uruguay were with Argentine citizens and enterprises, and were denominated in U.S. dollars. Transactions between different geographical segments have been eliminated for the purposes of this Note.
F-38
Grupo Financiero Galicia S.A. and Subsidiaries
Notes to the Consolidated Financial Statements
For the years ended December 31, 2010, 2009 and 2008
(Expressed in thousands of Argentine pesos)
| | | | | | | | | | | | | |
| | | December 31, | |
| | | 2010 | | | 2009 | | | 2008 | |
| Total revenues:(*) | | | | | | | | | | | | |
| Republic of Argentina | | Ps. | 6,868,807 | | | Ps. | 5,417,227 | | | Ps. | 4,582,947 | |
| Republic of Uruguay | | | 8,195 | | | | 14,489 | | | | 47,411 | |
| Grand Cayman Island | | | 940 | | | | 65 | | | | — | |
| Net income (loss), net of monetary effects allocable to each country: | | | | | | | | | | | | |
| Republic of Argentina | | | 418,066 | | | | 238,740 | | | | 166,368 | |
| Republic of Uruguay | | | (8,647 | ) | | | (7,274 | ) | | | 10,451 | |
| Grand Cayman Island | | | (518 | ) | | | (2,191 | ) | | | — | |
| Total assets: | | | | | | | | | | | | |
| Republic of Argentina | | | 35,538,519 | | | | 27,350,754 | | | | 24,349,404 | |
| Republic of Uruguay | | | 167,749 | | | | 237,544 | | | | 386,386 | |
| Grand Cayman Island | | | 1,795 | | | | 14,068 | | | | — | |
| Bank Premises and Equipment | | | | | | | | | | | | |
| Republic of Argentina | | | 947,648 | | | | 897,583 | | | | 866,179 | |
| Republic of Uruguay | | | 419 | | | | 738 | | | | 5,090 | |
| Miscellaneous assets | | | | | | | | | | | | |
| Republic of Argentina | | | 81,363 | | | | 63,803 | | | | 78,326 | |
| Republic of Uruguay | | | 40 | | | | 38 | | | | 297 | |
| Goodwill | | | | | | | | | | | | |
| Republic of Argentina | | | 23,467 | | | | 26,346 | | | | 37,804 | |
| Other intangible assets | | | | | | | | | | | | |
| Republic of Argentina | | | 430,648 | | | | 545,409 | | | | 528,115 | |
| Republic of Uruguay | | | — | | | | 569 | | | | 1,060 | |
| Geographical segment assets as a percentage of total assets | | | | | | | | | | | | |
| Republic of Argentina | | | 99.53 | % | | | 99.09 | % | | | 98.44 | % |
| Republic of Uruguay | | | 0.47 | % | | | 0.86 | % | | | 1.56 | % |
| Grand Cayman Island | | | — | | | | 0.05 | % | | | — | |
| | |
| (*) | | The caption Revenues include financial income, income from services and miscellaneous income. |
F-39
Grupo Financiero Galicia S.A. and Subsidiaries
Notes to the Consolidated Financial Statements
For the years ended December 31, 2010, 2009 and 2008
(Expressed in thousands of Argentine pesos)
25. Financial Instruments with Off-Balance Sheet Risk.
The Group has been party to financial instruments with off-balance sheet risk in the normal course of its business in order to meet the financing needs of its customers. These instruments expose the Bank to credit risk above and beyond the amounts recorded in the consolidated balance sheets. These financial instruments include commitments to extend credit, standby letters of credit, guarantees granted and acceptances.
The Group uses the same credit policies in making commitments, conditional obligations and guarantees as it does for granting loans. In management’s opinion, the Group’s outstanding commitments and guarantees do not represent unusual credit risk.
The Group’s exposure to credit loss in the event of non-performance by the counterparty to the financial instrument for commitments to extend credit, standby letters of credit, guarantees granted and acceptances is represented by the contractual notional amount of those investments.
A summary of the credit exposure related to these items is shown below:
| | | | | | | | | |
| | | December 31, | |
| | | 2010 | | | 2009 | |
| | | | | | | | | |
| Commitments to extend credit | | Ps. | 1,840,214 | | | Ps. | 1,323,498 | |
| Standby letters of credit | | | 335,761 | | | | 175,525 | |
| Guarantees granted | | | 213,830 | | | | 194,474 | |
| Acceptances | | | 111,744 | | | | 58,904 | |
Commitments to extend credit are agreements to lend to a customer at a future date, subject to the meeting of the contractual terms. Commitments generally have fixed expiration dates or other termination clauses and may require payment of a fee. Since many of the commitments are expected to expire without being drawn upon, total commitment amounts do not necessarily represent actual future cash requirements of the Group. The Group evaluates each customer’s creditworthiness on a case-by-case basis. In addition to the above commitments, as of December 31, 2010 and 2009, the available purchase limits for credit card holders amounted to Ps.25,950,025 and Ps.17,591,132, respectively.
Standby letters of credit and guarantees granted are conditional commitments issued by the Group to guarantee the performance of a customer to a third party.
Acceptances are conditional commitments for foreign trade transactions.
The credit risk involved in issuing letters of credit and granting guarantees is essentially the same as that involved in extending loan facilities to customers. In order to grant guarantees to its customers, the Group may require counter-guarantees. These financial customer guarantees are classified by type, as follows:
| | | | | | | | | |
| | | December 31, | |
| | | 2010 | | | 2009 | |
| Preferred counter-guarantees | | Ps. | 15,503 | | | Ps. | 15,353 | |
| Other counter-guarantees | | | 48,640 | | | | 33,344 | |
F-40
Grupo Financiero Galicia S.A. and Subsidiaries
Notes to the Consolidated Financial Statements
For the years ended December 31, 2010, 2009 and 2008
(Expressed in thousands of Argentine pesos)
The Group accounts for checks drawn on it and other banks, as well as other items in process of collection, such as notes, bills and miscellaneous items, in memorandum accounts until such time when the related item clears or is accepted. In management’s opinion, the risk of loss on these clearing transactions is not significant. The amounts of clearing items in process were as follows:
| | | | | | | | | |
| | | December 31, | |
| | | 2010 | | | 2009 | |
| | | | | | | | | |
| Checks drawn on the Bank | | Ps. | 419,405 | | | Ps. | 378,631 | |
| Checks drawn on the other Bank | | | 529,215 | | | | 458,411 | |
| Bills and other items for collection | | | 3,575,900 | | | | 2,262,278 | |
As of December 31, 2010 and 2009, the trusts’ funds amounted to Ps.2,502,979 and Ps.1,406,805, respectively.
In addition, the Group had securities in custody, which as of December 31, 2010 and 2009, amounted to Ps. 10,634,818 and Ps.8,119,755, respectively.
As of December 31, 2010, the Group also has off-balance sheet contractual obligations arising from the leasing of certain properties used as a part of our distribution network. The estimated future lease payments in connection with these properties are as follows:
| | | | | |
| 2011 | | | 50,400 | |
| 2012 | | | 61,488 | |
| 2013 | | | 71,941 | |
| 2014 | | | 80,574 | |
| 2015 | | | 88,631 | |
| 2016 and After | | | 95,722 | |
| | | | |
| Total | | Ps. | 448,756 | |
| | | | |
26. Derivative Financial Instruments.
The Group’s management of financial risks is carried within the limits of the policies approved by the Board of Directors in such respect. In that sense, derivatives allow, depending on market conditions, to adjust risk exposures to the established limits, thus contributing to keep such exposures within the parameters set forth by said policies. The Group plans to continue to use these instruments in the future, as long as their use is favorably assessed, in order to limit certain risk exposures.
F-41
Grupo Financiero Galicia S.A. and Subsidiaries
Notes to the Consolidated Financial Statements
For the years ended December 31, 2010, 2009 and 2008
(Expressed in thousands of Argentine pesos)
The derivative instruments held by the Group as of December 31, 2010 and 2009 were as follows:
| | | | | | | | | | | | | | | | | | | | | | | | | | | | | |
| | | | | | | | | | | | | | | Net Book | | | Net Book | | | | | | | |
| | | | | | | | | | | | | | | Value as | | | Value as | | | | | | | |
| | | | | | | | | | | Notional | | | of | | | of | | | | | | | |
| | | | | | | Average | | | Amount as | | | December | | | December | | | Fair Value | | | Fair Value | |
| | | | | | | Weighted | | | of | | | 31, 2010 | | | 31, 2009 | | | as of | | | as of | |
| | | | | | | Maturity | | | December | | | Asset / | | | Asset / | | | December | | | December | |
| Type of Contract | | Underlying | | | Term | | | 31, 2010 | | | (Liability) | | | (Liability) | | | 31, 2010 | | | 31, 2009 | |
FORWARDS (a) | | | | | | | | | | | | | | | | | | | | | | | | | | | | |
| • Purchases | | Foreign currency | | 2 months | | | 3,341,808 | | | | (3,163 | ) | | | — | | | | (3,163 | ) | | | — | |
| • Sales | | Foreign currency | | 1 months | | | 2,393,976 | | | | 1,932 | | | | — | | | | 1,932 | | | | — | |
FUTURES (a) | | | | | | | | | | | | | | | | | | | | | | | | | | | | |
| • Purchases | | Interest Rate | | 6 months | | | 1,140,100 | | | | — | | | | — | | | | — | | | | — | |
| • Sales | | Interest Rate | | 4 months | | | 780,100 | | | | — | | | | — | | | | — | | | | — | |
FORWARDS — CLIENTS (b) | | | | | | | | | | | | | | | | | | | | | | | | | | | | |
| • Purchases | | Foreign currency | | 1 months | | | 23,598 | | | | (92 | ) | | | — | | | | (92 | ) | | | — | |
| • Sales | | Foreign currency | | 6 months | | | 117,698 | | | | 3,471 | | | | 1,040 | | | | 3,471 | | | | 1,040 | |
| FORWARD FOREIGN CURRENCY HEDGE CONTRACT (c) | | | | | | | | | | | | | | | | | | | | |
| • Purchases | | Foreign currency | | 4 months | | | — | | | | — | | | | (8,060 | ) | | | — | | | | (8,060 | ) |
| • Purchases | | Foreign currency | | 3 months | | | 10,000 | | | | (2,710 | ) | | | — | | | | (2,710 | ) | | | — | |
| • Purchases | | Foreign currency | | 5 months | | | 20,000 | | | | (5,120 | ) | | | — | | | | (5,120 | ) | | | — | |
OPTIONS (d) | | | | | | | | | | | | | | | | | | | | | | | | | | | | |
| • Put option written Boden 2012 coupon | | National government securities | | 18 months | | | 21,680 | | | | — | | | | — | | | | (302 | ) | | | — | |
| • Put option written Boden 2013 coupon | | National government securities | | 22 months | | | 77,063 | | | | — | | | | — | | | | (3,421 | ) | | | (3,997 | ) |
INTEREST RATE SWAP (e) | | | | | | | | | | | | | | | | | | | | | | | | | | | | |
| • Fixed for variable interest rate | | Other | | 9 months | | | 60,000 | | | | — | | | | — | | | | — | | | | — | |
| • Variable for fixed interest rate | | Other | | 11 months | | | 78,000 | | | | — | | | | — | | | | — | | | | — | |
SWAPS WITH CUSTOMERS (f) | | | | | | | | | | | | | | | | | | | | | | | | | | | | |
| • Variable for fixed interest rate | | Other | | 10 months | | | 40,000 | | | | — | | | | — | | | | — | | | | — | |
| | |
| (*) | | As of December 31, 2010 and 2009, the amounts correspond to sales as well as purchases. |
| |
| (a) | | These transactions are made through recognized exchange markets, such as Mercado Abierto Electrónico (MAE) and Mercado a Término de Rosario (ROFEX). |
The general settlement method for these transactions does not require delivery of the traded underlying asset. Rather, settlement is carried on a daily basis for the difference, if any, between the closing price of the underlying asset and the closing price or value of the underlying asset corresponding to the previous day, the difference in price being charged to income.
F-42
Grupo Financiero Galicia S.A. and Subsidiaries
Notes to the Consolidated Financial Statements
For the years ended December 31, 2010, 2009 and 2008
(Expressed in thousands of Argentine pesos)
As of December 31, 2010 there are pending purchases-sales forwards transactions amounts to Ps.(3,163) and Ps.1,932, respectively. As of December 31, 2010 and 2009, there are not pending amounts recorded for purchases-sales futures transactions.
| | |
| (b) | | These transactions have been conducted directly with customers. The Group records under “Other Receivables from Financial Brokerage” and / or “Other Liabilities Resulting from Financial Brokerage”, as the case may be, the difference between the agreed foreign currency exchange rate and such exchange rate at the end of the year according with the future prices published by Rofex. |
| |
| (c) | | The Group entered into forward foreign currency hedge contracts, aimed to hedge the risk associated with the exchange rate exposure of financial debt designated in U.S. Dollars. |
On May 31, 2010, the contract entered into in fiscal year 2009 was settled, recording a Ps.(10,329) loss, which was charged to Income for the fiscal year.
The settlement of the outstanding transactions at the settlement date shall be carried without the physical delivery of the currency. That is to say, it shall be by compensation or difference between the spot exchange rate for settlement and the forward exchange rate.
| | |
| (d) | | As established by Decree 1836/02 and Argentine Central Bank regulations, in connection with the second exchange offered by the government to exchange restructured deposits for government bonds, the Bank granted an option to sell coupons to the holders of restructured deposits certificates who had opted to receive Boden 2013 Bonds and Boden 2012 Bonds in exchange for their certificates. |
The exercise price will be equal to that resulting from converting to pesos the face value of each coupon in U.S. dollars at a rate of Ps.1.40 per U.S. dollar adjusted by applying the CER, which arises from comparing the index at February 3, 2002 to that corresponding to the due date of the coupon. That value shall in no case exceed the principal and interest amounts in pesos resulting from applying the face value of the coupon in U.S. dollars at the buying exchange rate quoted by Banco de la Nación Argentina (Banco Nación) on the payment date of that coupon.
As of December 31, 2010 and 2009, the options bought and sold were recorded at their exercise price in memorandum accounts. The premiums collected and/or paid have been accrued on a straight-line basis over the life of the contract.
| | |
| (e) | | These transactions are conducted within the environment created by the MAE, and the settlement thereof is carried out on a monthly basis, in pesos, for the difference between the cash flows calculated using a variable rate (Badlar for time deposits of 30 to 35 days of private banks) and the cash flows calculated using a fixed rate, or vice versa, on the notional value traded, the difference in price being charged to income. |
In case accrued balances pending settlement exist, they are recorded under “Other Receivables from Financial Brokerage” and/or “Other Liabilities Resulting from Financial Brokerage”, as the case may be.
As of December 31, 2010, there are not pending amounts recorded for purchases-sales futures transactions.
| | |
| (f) | | These transactions have been conducted directly with customers pursuant to the above mentioned conditions |
As of December 31, 2010, there are not pending amounts recorded for purchases-sales futures transactions.
F-43
Grupo Financiero Galicia S.A. and Subsidiaries
Notes to the Consolidated Financial Statements
For the years ended December 31, 2010, 2009 and 2008
(Expressed in thousands of Argentine pesos)
27. Disclosure about Fair Value of Financial Instruments.
ASC 825, “Disclosures about Fair Value of Financial Instruments” requires disclosures of estimates of fair value of financial instruments. These estimates were made at the end of December 2010 and 2009. Because many of the Bank’s financial instruments do not have a readily trading market from which to determine fair value, the disclosures are based upon estimates regarding economic and current market conditions and risk characteristics. Such estimates are subjective and involve matters of judgment and, therefore, are not precise and may not be reasonably comparable to estimates of fair value for similar instruments made by other financial institutions.
The estimated fair values do not include the value of assets and liabilities not considered financial instruments.
In order to determine the fair value, cash flows were discounted for each category or group of loans having similar characteristics, based on credit risk, guarantees and/or maturities, using rates offered for similar loans by the Bank as of December 31, 2010 and 2009, respectively.
| | | | | | | | | | | | | | | | | |
| | | 2010 | | | 2009 | |
| | | Book Value | | | Fair Value | | | Book Value | | | Fair Value | |
Derivative activities: (see Note 26) | | | | | | | | | | | | | | | | |
| Assets | | Ps. | 5,403 | | | Ps. | 5,403 | | | Ps. | 1,040 | | | Ps. | 1,040 | |
| Liabilities | | | 11,085 | | | | 14,808 | | | | 8,060 | | | | 12,057 | |
| | | | | | | | | | | | | | | | | |
Non derivative activities: | | | | | | | | | | | | | | | | |
| Assets: | | | | | | | | | | | | | | | | |
| Cash and due from banks (1) | | Ps. | 5,645,571 | | | Ps. | 5,645,571 | | | Ps. | 3,696,309 | | | Ps. | 3,696,309 | |
| Government securities (2) | | | | | | | | | | | | | | | | |
| Trading | | | 2,133,954 | | | | 2,128,146 | | | | 1,881,914 | | | | 1,882,548 | |
| Without quotation | | | — | | | | — | | | | 1,981,972 | | | | 1,920,869 | |
| Investment | | | 133,756 | | | | 151,356 | | | | 43,350 | | | | 43,395 | |
| Corporate Equity Securities | | | 10,302 | | | | 10,302 | | | | 13,171 | | | | 13,171 | |
| Loans (3) | | | 21,353,781 | | | | 22,122,026 | | | | 13,477,901 | | | | 13,732,385 | |
| Others (4) | | | 3,526,930 | | | | 3,514,578 | | | | 3,830,321 | | | | 3,322,184 | |
| | | | | | | | | | | | | | | | | |
| Liabilities: | | | | | | | | | | | | | | | | |
| Deposits (5) | | Ps. | 22,222,764 | | | Ps. | 20,210,974 | | | Ps. | 17,039,366 | | | Ps. | 17,047,003 | |
| Other liabilities resulting from financial | | | | | | | | | | | | | | | | |
| Intermediation: | | | | | | | | | | | | | | | | |
| Banks and international entities and Loans from Domestic Financial Institutions (6) and | | | | | | | | | | | | | | | | |
| Negotiable obligations (7) | | | 3,307,905 | | | | 3,307,916 | | | | 3,517,579 | | | | 3,359,272 | |
| Others (8) | | | 5,542,108 | | | | 5,240,036 | | | | 3,731,245 | | | | 3,537,588 | |
F-44
Grupo Financiero Galicia S.A. and Subsidiaries
Notes to the Consolidated Financial Statements
For the years ended December 31, 2010, 2009 and 2008
(Expressed in thousands of Argentine pesos)
The following is a description of the estimating techniques applied:
| | |
| (1) | | Cash and due from banks:By definition, cash and due from banks are short-term and do not possess credit loss risk. The carrying values as of December 31, 2010 and 2009 are a reasonable estimate of fair value. |
| |
| (2) | | Government securities:Government securities held for trading purposes are carried at fair value. Holdings of investment account securities correspond to securities issued by Argentine Central Bank which fair value corresponds to their quoted market value. As of December 31, 2010 securities without quotation include Bonar 2015 Bonds. Such bonds had quoted market values and therefore their fair value where determined using the mentioned quoted market values. As of December 31, 2009 securities included Boden 2012 Bonds, Discount Bonds and Bonar 2015 Bonds. During fiscal year 2010 positions of Boden 2012 and Discount Bonds have been realized. |
| |
| (3) | | Loans:The fair values of loans are estimated for groups of similar characteristics, including type of loan, credit quality incorporating the credit risk factor. For floating- or adjustable-rate loans, which mature or are repriced within a short period of time, the carrying values are considered to be a reasonable estimate of fair values. For fixed-rate loans, market prices are not generally available and the fair values are estimated discounting the estimated future cash flows based on the contracted maturity of the loans. The discount rates are based on the current market rates corresponding to the applicable maturity. Where quoted market prices or estimated fair values are available, primarily for loans to refinancing countries, loans held for dispositions or sales and certain other foreign loans, the fair values are based on such market prices and estimated fair values, including secondary market prices. For nonperforming loans, the fair values are generally determined on an individual basis by discounting the estimated future cash flows and may be based on the appraisal value of underlying collateral as appropriate. |
| |
| (4) | | Others:Includes other receivables from financial brokerage and equity investments in other companies. A majority of the items include purchases of government securities held for investment purposes which fair value is determined by the quoted market value of the underlying government securities, mostly Bonar 2015 Bonds and Securities issued by Argentine Central Bank. This caption also include financial trusts certificates of participation which their fair value is estimated using valuation techniques to convert the future amounts to a single present amount discounted. The measurement is based on the value indicated by current market expectation about those future amounts. The estimated of the cash flows is based on the future cash flows from the securitized assets, considering the prepayments, historical loan performance, etc. Equity investments in companies where significant influence is exercised are not within the scope of ASC 825, Financial Instruments. Equity investments in other companies are carried at market value less costs to sell. |
| |
| (5) | | Deposits:The fair value of deposit liabilities on demand and savings account deposits is similar to its book value. The fair value of time deposits was calculated by discounting contractual cash flows using current market rates for instruments with similar maturities. |
| |
| (6) | | Banks and international entities and loans from domestic financial institutions:Includes credit lines borrowed under different credit arrangements from local and foreign banks and entities. Most of them were restructured as of May 2004. As of December 2010 and 2009, when no quoted market prices were available, the estimated fair value has been calculated by discounting the contractual cash flows of these liabilities at estimated market rates. |
| |
| (7) | | Negotiable obligations:As of December 31, 2010 and 2009, the fair value of the negotiable obligations was determined based on quoted market prices and when no quoted market prices were available, the estimated fair value has been calculated by discounting the contractual cash flows of these liabilities at estimated market rates. |
| |
| (8) | | Others:Includes other liabilities resulting from financial brokerage. Their fair value was estimated at the expected future cash flows discounted at the estimated rates at year-end. |
F-45
Grupo Financiero Galicia S.A. and Subsidiaries
Notes to the Consolidated Financial Statements
For the years ended December 31, 2010, 2009 and 2008
(Expressed in thousands of Argentine pesos)
28. Situation of Banco Galicia Uruguay S.A. (in liquidation).
During fiscal year 2009, Banco Galicia Uruguay S.A. (in liquidation) wholly repaid in advance the debt restructuring plan entered into with its creditors. Therefore and having fulfilled its obligations, its shareholders have resolved, at the Shareholders’ Meeting held on June 30, 2010, to voluntarily dissolve and liquidate the company.
Furthermore, taking into consideration the financial condition and the evolution estimated in the liquidation process, shareholders decided to reduce the company’s computable capital for a value equal to US$2,069 through the voluntary redemption of shares, which was carried out on October 28, 2010.
Pursuant to current regulations, the corporate name is, as from said date, Banco Galicia Uruguay S.A. (in liquidation).
At fiscal year-end, Banco Galicia Uruguay S.A. (in liquidation)’s Shareholder’s Equity amounts to Ps.46,036.
29. Preferred Liabilities of the former Banco Almafuerte Coop. Ltdo.
As a consequence of the dissolution of former Banco Almafuerte Coop. Ltdo., the Bank assumed certain preferred liabilities corresponding to five branches of said financial institution. As a counterpart, the Bank received a Class “A” Participation Certificate of the Nues Trust Fund and has been involved in the creation of a Special Fund. Both transactions were implemented pursuant to Resolution No. 659, dated November 27, 1998, adopted by the Board of Directors of the Argentine Central Bank within the framework of Section 35 bis, section II, clauses a) and b) of the Financial Institutions Law.
On June 30, 2006, the holders of Class “A” Participation Certificates of the Nues Trust and the contributors to the Special Fund subscribed a new agreement in order to achieve the total repayment of unpaid balances corresponding to Class “A” Participation Certificates and the subsequent liquidation of the Special Fund.
On July 6, 2010, the outstanding balance of Class “A” participation certificates was fully paid and the Special Fund’s balance was partially paid, thus generating a remaining balance equal to the original contribution to the fund.
As of December 31, 2010 the Special Fund’s balance amounts to Ps.169,890. At the end of the previous fiscal year, said balance amounted to Ps.373,313 and that of the Participation Certificate amounted to Ps. 59,910.
As of December 31, 2010 the underlying assets of the Special Fund were invested in Bonar 2014 Bonds amounting to Ps.370,946. As of December 31, 2009, the underlying assets of the Nues Trust and the Special Fund were invested in cash, securities issued by the Argentine Central Bank and secured loans amounting to Ps.417,163, Ps.148,834 and Ps.506,784, respectively. As of December 31, 2010 the Bank held 45% of the Special Fund and the previous fiscal year, the Bank held 25,898% of the total certificates of participation of the Nues Trust and 45% of the Special Fund.
F-46
Grupo Financiero Galicia S.A. and Subsidiaries
Notes to the Consolidated Financial Statements
For the years ended December 31, 2010, 2009 and 2008
(Expressed in thousands of Argentine pesos)
30. Financial Trusts.
a) Financial trusts with the Bank as trustee outstanding at fiscal year-end:
| | | | | | | | | | | | | | | | | | | | | | | | | | | | | |
| | | | | | | Estimated | | | | | | | | | | | | | | | Book value of securities held in | |
| | | Issuance | | | maturity | | | | | | | | | | | Portfolio | | | own portfolio | |
| Name | | Date | | | date | | | Trustee | | Trust assets | | transferred | | | 12/31/10 | | | 12/31/09 | |
| Galtrust I | | | 10/13/00 | | | | 10/10/15 | | | First Trust of New York N.A. | | Secured Bonds in Pesos at 2% due 2018 (1) | | | U.S. 490,224 | (*) | | Ps. | 521,862 | (**) | | Ps. | 584,111 | |
| Galicia | | | 04/16/02 | | | | 05/06/32 | | | Bapro Mandatos y Negocios S.A. | | National Government Bonds in Pesos at 2% due 2014 (2) | | Ps. | 108,000 | | | Ps. | 96,364 | | | Ps. | 79,990 | |
| Créditos Inmobiliarios Galicia II | | | 10/12/05 | | | | 12/15/25 | | | Deustche Bank S.A. | | Mortgage loans | | Ps. | 150,000 | | | Ps. | 721 | | | Ps. | 56,172 | |
| Galicia Personales VI | | | 09/28/07 | | | | 06/15/12 | | | Deustche Bank S.A. | | Personal loans | | Ps. | 108,081 | | | | — | | | Ps. | 17,175 | |
| Galicia Personales VII | | | 02/21/08 | | | | 11/15/12 | | | Deustche Bank S.A. | | Personal loans | | Ps. | 150,000 | | | Ps. | 1,652 | | | Ps. | 35,216 | |
| Galicia Personales VIII | | | 07/04/08 | | | | 04/15/13 | | | Deustche Bank S.A. | | Personal loans | | Ps. | 187,500 | | | | — | | | Ps. | 55,518 | |
| | | | | | | | | | | | | | | | | | | Totals | | Ps. | 620,599 | | | Ps. | 828,182 | |
| | |
| (*) | | The remaining US$9,776 was transferred in cash. |
| |
| (**) | | Net of the allowance for impairment of value. |
| |
| (1) | | In exchange for loans to the Provincial Governments. |
| |
| (2) | | In exchange for secured loans. |
b) As of December 31, 2010 and 2009, the Bank records financial trusts in own portfolio:
• Received as loan repayment for Ps.20,752 and Ps.58,662, respectively.
• Acquired as investments for Ps.140,084 and Ps.52,232, respectively.
c) BG Financial Trust
The “BG Financial Trust” was created in December 2005. The Bank transferred to the trustee (“Equity Trust Company (Argentina) S.A.”) Ps.264,426 of loans classified in category “3” in accordance with the Argentine Central Bank rules or in a lower category, for an amount, net of allowances, of Ps.91,290. The Bank received in exchange cash for an equal amount. The debt securities issued by the trust were fully subscribed by third parties. The Bank has been appointed Servicer and Collection Manager of the Trust, thus assuming a special management commitment that will enable the Bank to receive a compensation incentive equal to 55% of the excess of net cash flows, upon the occurrence of the following: (i) no later than December 31, 2009, the net cash flow effectively collected equals or exceeds the price paid for the transferred portfolio; and (ii) no later than December 31, 2012, an IRR equal to or greater than 18% is reached. In the event the two objectives of the special management commitment fail to be met, a penalty equal to the difference shall be paid to the trustee.
F-47
Grupo Financiero Galicia S.A. and Subsidiaries
Notes to the Consolidated Financial Statements
For the years ended December 31, 2010, 2009 and 2008
(Expressed in thousands of Argentine pesos)
As of April 2008, the requirements stated in items (i) and (ii) have been fulfilled, thus the Bank became entitled to receive the compensation incentive beginning on such date.
d) Financial trusts with the companies controlled by Tarjetas Regionales S.A. as trustees outstanding at fiscal year-end:
Tarjeta Naranja S.A.
| | | | | | | | | | | | | | | | | | | | | | | | | | | | | |
| | | | | | | Estimated | | | | | | | | | | | | | | | Book value of securities | |
| | | Issuance | | | maturity | | | | | | | | | | | Portfolio | | | held in own portfolio | |
| Name | | Date | | | date | | | Trustee | | Trust assets | | transferred | | | 12/31/10 | | | 12/31/09 | |
| Tarjeta Naranja Trust VI | | | 12/11/07 | | | | 01/23/10 | | | Equity Trust Company (Argentina) S.A. | | Certain credit rights against cardholders | | Ps. | 150,003 | | | | — | | | Ps. | 25,115 | |
| Tarjeta Naranja Trust VII | | | 02/19/08 | | | | 07/23/10 | | | Equity Trust Company (Argentina) S.A. | | Certain credit rights against cardholders | | Ps. | 142,913 | | | | — | | | Ps. | 24,664 | |
| Tarjeta Naranja Trust VIII | | | 08/05/08 | | | | 09/20/10 | | | Equity Trust Company (Argentina) S.A. | | Certain credit rights against cardholders | | Ps. | 138,742 | | | | — | | | Ps. | 47,917 | |
| Tarjeta Naranja Trust IX | | | 12/12/08 | | | | 05/20/10 | | | Equity Trust Company (Argentina) S.A. | | Certain credit rights against cardholders | | Ps. | 90,615 | | | | — | | | Ps. | 24,786 | |
| | | | | | | | | | | | | | | | | | | Totals | | | — | | | Ps. | 122,482 | |
As of December 31, 2009, Tarjeta Naranja S.A.’s holdings of participation certificates and debt securities totaled Ps. 91,475 and Ps. 31,007, respectively. As of December 31, 2010 Tarjeta Naranja S.A. do not hold participation certificates neither debt securities.
Tarjetas Cuyanas S.A.
| | | | | | | | | | | | | | | | | | | | | | | | | | | | | |
| | | | | | | Estimated | | | | | | | | | | | | | | | Book value of securities | |
| | | Issuance | | | maturity | | | | | | | | | | | Portfolio | | | held in own portfolio | |
| Name | | Date | | | date | | | Trustee | | Trust assets | | transferred | | | 12/31/10 | | | 12/31/09 | |
| Tarjetas Cuyanas Trust V | | | 02/04/08 | | | | 03/15/10 | | | Equity Trust Company (Argentina) S.A. | | Certain credit rights against cardholders | | Ps. | 61,700 | | | | — | | | Ps. | 21,637 | |
| | | | | | | | | | | | | | | | | | | Totals | | | — | | | Ps. | 21,637 | |
As of December 31, 2009, Tarjetas Cuyanas S.A.’s holding of participation certificates totaled Ps. 21,637, and as of December 31, 2010 Tarjetas Cuyanas S.A. do not hold participation certificates neither debt securities.
F-48
Grupo Financiero Galicia S.A. and Subsidiaries
Notes to the Consolidated Financial Statements
For the years ended December 31, 2010, 2009 and 2008
(Expressed in thousands of Argentine pesos)
e) Trust Activities
| • | | Trust contracts for purposes of guaranteeing compliance with obligations: |
Purpose: in order to guarantee compliance with contractual obligations, the parties to these agreements have agreed to deliver to the Bank, amounts as fiduciary property, to be invested according to the following detail:
| | | | | | | | | | | |
| | | | | Balances of | | | | |
| | | | | Trust Funds | | | Maturity Date | |
| Date of Contract | | Trustor | | Ps. | | | (1) | |
| 11/01/06 | | Peñaflor | | | 1 | | | | 12/31/11 | |
| 04/10/07 | | Sullair | | | 1 | | | | 01/31/13 | |
| 02/12/08 | | Sinteplast | | | 2 | | | | 01/28/13 | |
| 12/21/09 | | Las Blondas | | | 1 | | | | 12/31/11 | |
| 09/24/10 | | Grupo Gestión | | | 2,031 | | | | 09/30/12 | |
| | | Totals | | | 2,036 | | | | | |
| | |
| (1) | | These amounts shall be released monthly until settlement date of trustor obligations or maturity date, whichever occurs first. |
| • | | Financial trust contracts: |
Purpose: to administer and exercise the fiduciary ownership of the trust assets until the redemption of debt securities and participation certificates:
| | | | | | | | | | | | | | | |
| | | | | Balances of Trust Funds | | | | |
| Date of Contract | | Trust | | Ps. | | | U.S. | | | Maturity Date | |
| 07/13/05 | | Rumbo Norte I | | | 2,301 | | | | 42 | | | | 07/13/11 | (3) |
| 10/12/05 | | Hydro I | | | 15,126 | | | | — | | | | 09/05/17 | (2) |
| 12/05/06 | | Faid 2011 | | | 52,223 | | | | — | | | | 02/28/12 | (3) |
| 12/06/06 | | Gas I | | | 27,039 | | | | — | | | | 12/31/11 | (3) |
| 03/02/07 | | Agro Nitralco | | | 534 | | | | — | | | | 12/31/11 | (3) |
| 09/05/07 | | Saturno VII | | | 123 | | | | — | | | | 12/31/11 | (3) |
| 11/22/07 | | Radio Sapienza VI | | | 51 | | | | — | | | | 06/30/11 | (3) |
| 05/06/08 | | Agro Nitralco II | | | 15,165 | | | | — | | | | 12/31/11 | (3) |
| 05/14/09 | | Gas II | | | 2,371,093 | | | | — | | | | 05/31/14 | (3) |
| 08/31/10 | | Sursem I | | | 17,119 | | | | — | | | | 09/30/11 | (3) |
| | | Totals | | | 2,500,774 | | | | 42 | | | | | |
| | |
| (2) | | These amounts shall be released monthly until redemption of debt securities. |
| |
| (3) | | Estimated date, since maturity date shall occur at the time of the distribution of all of trust assets. |
31. Segment Reporting.
The Group has disclosed its segment information in accordance with the “Disclosures about Segments of an Enterprise and Related Information” ASC 280-10. Operating segments are defined as components of an enterprise about which separate financial information is available and which is regularly reviewed by the Board of Directors in deciding how to allocate resources and in assessing performance. Reportable segments consist of one or more operating segments with similar economic characteristics, distribution systems and regulatory environments. The information provided for Segment Reporting is based on internal reports used by management.
F-49
Grupo Financiero Galicia S.A. and Subsidiaries
Notes to the Consolidated Financial Statements
For the years ended December 31, 2010, 2009 and 2008
(Expressed in thousands of Argentine pesos)
The Group measures the performance of each of its business segments primarily in terms of “Net income” in accordance with the regulatory reporting requirements of the Argentine Central Bank. Net income and other segment information are based on Argentine Banking GAAP and are consistent with the presentation of the Group’s consolidated financial statements.
The following summarizes the aggregation of Grupo Financiero Galicia’s operating segments into reportable segments:
Banking: corresponds to the results of our banking business and represents the accounts of Banco de Galicia y Buenos Aires S.A. consolidated line by line with Banco Galicia Uruguay S.A. and it subsidiaries. The results Galicia Valores S.A. Sociedad de Bolsa, and Galicia Administradora de Fondos S.A. Sociedad Gerente de Fondos Comunes de Inversión, which are controlled by the Bank are shown under income from equity investments.
Regional Credit Cards: shows the results of our regional credit card and consumer finance business and represents the accounts of Tarjetas Regionales S.A. consolidated with its subsidiaries. As of December 31, 2010, Tarjetas Regionales S.A.’s main subsidiaries were Tarjeta Naranja S.A. , Tarjetas Cuyanas S.A. and Tarjetas del Mar S.A..
CFA Personal Loans: shows the results of Compañía Financiera Argentina S.A..This Company was incorporated as of June 30, 2010 in the consolidated financial statements of the Bank.
Insurance: includes the results of our insurance business and represents the accounts of Sudamericana Holding S.A. and its subsidiaries, including the results of the 12.5% interest owned by the Bank. As of December 31, 2010, Grupo Financiero Galicia S.A. maintained, through Sudamericana Holding S.A., controlling interests in Galicia Vida Compañía de Seguros S.A., Galicia Retiro Compañía de Seguros S.A. and Sudamericana Asesores de Seguros S.A..
Other Grupo Businesses: shows the results of Galicia Warrants S.A., Net Investment S.A. (in both cases, including the 12.5% interest of the Bank), Galval Agente de Valores S.A. and GV Mandataria de Valores S.A..
The column “Adjustments” comprises (i) intercompany transactions between us and our consolidated subsidiaries and among these companies, if corresponding, which are eliminated in our consolidated income statement; (ii) adjustments to compensate for not showing the results of Galicia Valores S.A. Sociedad de Bolsa, Galicia Administradora de Fondos S.A. Sociedad Gerente de Fondos Comunes de Inversión consolidated line by line with Banco Galicia but as income from equity investments, while in our consolidated financial statements, the accounts of these companies are shown line by line; (iii) the results corresponding to Non-controlling interests in the Bank and (iv) all of our stand alone income and expenses, including goodwill amortization, different from income from our interests in our subsidiaries.
F-50
Grupo Financiero Galicia S.A. and Subsidiaries
Notes to the Consolidated Financial Statements
For the years ended December 31, 2010, 2009 and 2008
(Expressed in thousands of Argentine pesos)
| | | | | | | | | | | | | | | | | | | | | | | | | | | | | |
| | | | | | | | | | | CFA | | | | | | | | | | | | | | | |
| | | | | | | Regional | | | Personal | | | | | | | Other Grupo’s | | | | | | | Consolidated | |
| In Pesos Thousands | | Banking | | | Credit Cards | | | Loans | | | Insurance | | | Businesses | | | Adjustments | | | Total | |
Year ended December 31, 2010 | | | | | | | | | | | | | | | | | | | | | | | | | | | | |
| Net Financial Income | | | 1,427,982 | | | | 503,385 | | | | 282,021 | | | | 28,656 | | | | (738 | ) | | | (37,861 | ) | | | 2,203,445 | |
| Net Income from Services | | | 880,591 | | | | 1,040,109 | | | | 25,902 | | | | — | | | | 12,835 | | | | (177,560 | ) | | | 1,781,877 | |
Net Operating Revenue | | | 2,308,573 | | | | 1,543,494 | | | | 307,923 | | | | 28,656 | | | | 12,097 | | | | (215,421 | ) | | | 3,985,322 | |
| Provisions for Loan Losses | | | 307,240 | | | | 199,461 | | | | 44,823 | | | | — | | | | — | | | | — | | | | 551,524 | |
| Administrative Expenses | | | 1,693,034 | | | | 905,035 | | | | 159,165 | | | | 56,188 | | | | 17,351 | | | | 14,541 | | | | 2,845,314 | |
Net Operating Income | | | 308,299 | | | | 438,998 | | | | 103,935 | | | | (27,532 | ) | | | (5,254 | ) | | | (229,962 | ) | | | 588,484 | |
Income from Equity Investment | | | | | | | | | | | | | | | | | | | | | | | | | | | | |
Tarjetas Regionales SA | | | 270,494 | | | | — | | | | | | | | — | | | | — | | | | (270,494 | ) | | | — | |
Compañía Financiera Argentina SA | | | 133,277 | | | | — | | | | — | | | | — | | | | — | | | | (133,277 | ) | | | — | |
Sudamericana | | | 4,023 | | | | — | | | | — | | | | — | | | | — | | | | (4,023 | ) | | | — | |
Others | | | 13,665 | | | | — | | | | — | | | | — | | | | — | | | | 48,389 | | | | 62,054 | |
| Other Income (Loss) | | | (260,624 | ) | | | 101,716 | | | | 37,473 | | | | 75,102 | | | | 4,602 | | | | 162,618 | | | | 120,887 | |
| Non-controlling interests | | | — | | | | (78,417 | ) | | | — | | | | — | | | | — | | | | (25,916 | ) | | | (104,333 | ) |
Pre-tax Income | | | 469,134 | | | | 462,297 | | | | 141,408 | | | | 47,570 | | | | (652 | ) | | | (452,665 | ) | | | 667,092 | |
| Income tax provision | | | — | | | | 191,803 | | | | 51,195 | | | | 16,269 | | | | 1,303 | | | | (2,379 | ) | | | 258,191 | |
Net Income | | | 469,134 | | | | 270,494 | | | | 90,213 | | | | 31,301 | | | | (1,955 | ) | | | (450,286 | ) | | | 408,901 | |
| Net Income as a % of Grupo Financiero Galicia’s Net Income | | | 115 | % | | | 66 | % | | | 22 | % | | | 8 | % | | | (1 | )% | | | — | | | | — | |
| | | | | | | | | | | | | | | | | | | | | | | | | | | | | |
Average: | | | | | | | | | | | | | | | | | | | | | | | | | | | | |
| Private Loans | | | 12,818,609 | | | | 3,341,756 | | | | 640,405 | | | | — | | | | — | | | | 2 | | | | 16,800,722 | |
| Deposits | | | 18,111,998 | | | | — | | | | 116,499 | | | | — | | | | — | | | | (13,095 | ) | | | 18,215,402 | |
End of Period: | | | | | | | | | | | | | | | | | | | | | | | | | | | | |
| Assets | | | 30,212,422 | | | | 4,888,094 | | | | 1,754,255 | | | | 293,886 | | | | 37,810 | | | | (1,478,404 | ) | | | 35,708,063 | |
| Equity | | | 2,595,660 | | | | 812,252 | | | | 787,460 | | | | 105,102 | | | | 22,599 | | | | (1,853,573 | ) | | | 2,469,500 | |
F-51
Grupo Financiero Galicia S.A. and Subsidiaries
Notes to the Consolidated Financial Statements
For the years ended December 31, 2010, 2009 and 2008
(Expressed in thousands of Argentine pesos)
| | | | | | | | | | | | | | | | | | | | | | | | | |
| | | | | | | Regional | | | | | | | Other Grupo | | | | | | | Consolidated | |
| In Pesos Thousands | | Banking | | | Credit Cards | | | Insurance | | | Businesses | | | Adjustments | | | Total | |
Year ended December 31, 2009 | | | | | | | | | | | | | | | | | | | | | | | | |
| Net Financial Income | | | 1,144,226 | | | | 375,491 | | | | 28,543 | | | | (1,931 | ) | | | (1,151 | ) | | | 1,545,178 | |
| Net Income from Services | | | 727,855 | | | | 736,985 | | | | — | | | | 12,485 | | | | (166,405 | ) | | | 1,310,920 | |
Net Operating Revenue | | | 1,872,081 | | | | 1,112,476 | | | | 28,543 | | | | 10,554 | | | | (167,556 | ) | | | 2,856,098 | |
| Provisions for Loan Losses | | | 388,665 | | | | 250,840 | | | | — | | | | — | | | | — | | | | 639,505 | |
| Administrative Expenses | | | 1,321,785 | | | | 621,865 | | | | 42,984 | | | | 19,255 | | | | 23,240 | | | | 2,029,129 | |
Net Operating Income | | | 161,631 | | | | 239,771 | | | | (14,441 | ) | | | (8,701 | ) | | | (190,796 | ) | | | 187,464 | |
Income from Equity Investment | | | | | | | | | | | | | | | | | | | | | | | | |
Tarjetas Regionales SA | | | 133,028 | | | | — | | | | — | | | | — | | | | (133,028 | ) | | | — | |
Sudamericana | | | 3,352 | | | | — | | | | — | | | | — | | | | (3,352 | ) | | | — | |
Others | | | 13,139 | | | | — | | | | — | | | | — | | | | (1,792 | ) | | | 11,347 | |
| Other Income (Loss) | | | (139,303 | ) | | | 54,966 | | | | 55,327 | | | | 15,629 | | | | 246,349 | | | | 232,968 | |
| Non-controlling interests | | | — | | | | (32,642 | ) | | | — | | | | — | | | | (13,870 | ) | | | (46,512 | ) |
Pre-tax Income | | | 171,847 | | | | 262,095 | | | | 40,886 | | | | 6,928 | | | | (96,489 | ) | | | 385,267 | |
| Income tax provision | | | | | | | 129,067 | | | | 14,153 | | | | 4,576 | | | | 8,196 | | | | 155,992 | |
Net Income | | | 171,847 | | | | 133,028 | | | | 26,733 | | | | 2,352 | | | | (104,685 | ) | | | 229,275 | |
| Net Income as a % of Grupo Financiero Galicia’s Net Income | | | 75 | % | | | 58 | % | | | 12 | % | | | 1 | % | | | — | | | | — | |
| | | | | | | | | | | | | | | | | | | | | | | | | |
Average: | | | | | | | | | | | | | | | | | | | | | | | | |
| Private Loans | | | 8,959,360 | | | | 2,402,489 | | | | — | | | | — | | | | (18,215 | ) | | | 11,343,634 | |
| Deposits | | | 14,765,933 | | | | — | | | | — | | | | — | | | | (7,376 | ) | | | 14,758,557 | |
End of Period: | | | | | | | | | | | | | | | | | | | | | | | | |
| Assets | | | 27,224,687 | | | | 3,365,737 | | | | 260,694 | | | | 39,209 | | | | (3,287,961 | ) | | | 27,602,366 | |
| Equity | | | 2,126,522 | | | | 586,757 | | | | 90,801 | | | | 21,854 | | | | (773,395 | ) | | | 2,052,539 | |
F-52
Grupo Financiero Galicia S.A. and Subsidiaries
Notes to the Consolidated Financial Statements
For the years ended December 31, 2010, 2009 and 2008
(Expressed in thousands of Argentine pesos)
| | | | | | | | | | | | | | | | | | | | | | | | | |
| | | | | | | Regional | | | | | | | Other Grupo | | | | | | | Consolidated | |
| In Pesos thousand | | Banking | | | Credit Cards | | | Insurance | | | Businesses | | | Adjustments | | | Total | |
Year ended December 31, 2008 | | | | | | | | | | | | | | | | | | | | | | | | |
| Net Financial Income | | | 847,282 | | | | 296,156 | | | | 20,156 | | | | (80 | ) | | | (25,182 | ) | | | 1,138,332 | |
| Net Income from Services | | | 654,952 | | | | 571,829 | | | | — | | | | 12,897 | | | | (51,810 | ) | | | 1,187,868 | |
Net Operating Revenue | | | 1,502,234 | | | | 867,985 | | | | 20,156 | | | | 12,817 | | | | (76,992 | ) | | | 2,326,200 | |
| Provisions for Loan Losses | | | 214,948 | | | | 180,441 | | | | — | | | | — | | | | — | | | | 395,389 | |
| Administrative Expenses | | | 1,166,476 | | | | 554,451 | | | | 29,963 | | | | 13,463 | | | | 16,725 | | | | 1,781,078 | |
Net Operating Income | | | 120,810 | | | | 133,093 | | | | (9,807 | ) | | | (646 | ) | | | (93,717 | ) | | | 149,733 | |
Income from Equity Investment | | | | | | | | | | | | | | | | | | | | | | | | |
Tarjetas Regionales SA | | | 76,436 | | | | — | | | | — | | | | — | | | | (76,436 | ) | | | — | |
Sudamericana | | | 2,866 | | | | — | | | | — | | | | — | | | | (2,866 | ) | | | — | |
Others | | | 58,164 | | | | — | | | | — | | | | — | | | | (1,400 | ) | | | 56,764 | |
| Other Income (Loss) | | | (63,014 | ) | | | 45,242 | | | | 43,506 | | | | 2,104 | | | | 52,310 | | | | 80,148 | |
| Non-controlling interests | | | — | | | | (20,646 | ) | | | — | | | | — | | | | (15,166 | ) | | | (35,812 | ) |
Pre-tax Income | | | 195,262 | | | | 157,689 | | | | 33,699 | | | | 1,458 | | | | (137,275 | ) | | | 250,833 | |
| Income tax provision | | | — | | | | 81,253 | | | | 11,140 | | | | 1,328 | | | | (19,707 | ) | | | 74,014 | |
Net Income | | | 195,262 | | | | 76,436 | | | | 22,559 | | | | 130 | | | | (117,568 | ) | | | 176,819 | |
| Net Income as a % of Grupo Financiero Galicia’s Net Income | | | 110 | % | | | 43 | % | | | 13 | % | | | — | % | | | — | | | | — | |
| | | | | | | | | | | | | | | | | | | | | | | | | |
Average: | | | | | | | | | | | | | | | | | | | | | | | | |
| Loans | | | 8,707,477 | | | | 2,104,993 | | | | — | | | | — | | | | — | | | | 10,812,470 | |
| Deposits | | | 13,199,000 | | | | — | | | | — | | | | — | | | | (7,712 | ) | | | 13,191,288 | |
End of Period: | | | | | | | | | | | | | | | | | | | | | | | | |
| Assets | | | 24,439,812 | | | | 2,763,843 | | | | 227,719 | | | | 22,552 | | | | (2,718,136 | ) | | | 24,735,790 | |
| Equity | | | 1,954,666 | | | | 453,728 | | | | 77,065 | | | | 8,641 | | | | (648,355 | ) | | | 1,845,745 | |
F-53
Grupo Financiero Galicia S.A. and Subsidiaries
Notes to the Consolidated Financial Statements
For the years ended December 31, 2010, 2009 and 2008
(Expressed in thousands of Argentine pesos)
32. Agreement for the purchases of shares
The Argentine Central Bank’s Board of Directors, through Resolution No. 124 dated June 7, 2010, authorized the Bank to purchase 95% of the shares belonging to the following companies: Compañía Financiera Argentina S.A., Cobranzas y Servicios S.A. and Procesadora Regional S.A. (former Universal Processing Center S.A.). Furthermore, through the above-mentioned resolution the Argentine Central Bank authorized the subsidiary Tarjetas Regionales S.A. to purchase the remaining 5% of the shares belonging to said companies.
On August 31, 2010, through Resolution No. 299, the Argentine Commission of Competence Defense (Comisión Nacional de Defensa de la Competencia) authorized the above-mentioned purchase and sale transaction, what was informed to the Bank on September 1, 2010.
The total purchase price paid amounted to Ps.328,279 for Compañía Financiera Argentina, Ps.835 for Cobranzas y Servicios S.A. and Ps.4,809 for Procesadora Regional S.A. (former Universal Processing Center S.A.).
Pursuant to the Argentine Central Bank regulations, and due to the difference between the acquisition cost and the value of assets and liabilities purchased as of June 30, 2010, valued in line with those that belong to the Group, a negative goodwill amounting to Ps.500,608 was recorded by Compañía Financiera Argentina S.A. and a negative goodwill of Ps.16,764 was recorded by Cobranzas y Servicios S.A., both of which were recorded in caption Liabilities-Provisions. As of December 31, 2010 such balances amounted to Ps. 446,054, and Ps. 19,580 respectively. With regard to Procesadora Regional S.A. (former Universal Processing Center S.A.), a positive goodwill amounting to Ps.4,049 was recorded under Intangible Assets — Goodwill.
The negative goodwill is charged to Income on a straight-line basis during 60 months, pursuant to the Argentine Central Bank regulations in that regard.
The table below presents a condensed balance sheet of the mentioned companies according to their financial statements (without adjustments and consolidating eliminations), as of December 31, 2010:
| | | | | | | | | | | | | |
| | | Compañía | | | | | | | Procesadora | |
| | | Financiera | | | Cobranzas | | | Regional | |
| | | Argentina | | | y Servicios | | | S.A. | |
| | | 12/31/2010 | | | 12/31/2010 | | | 12/31/2010 | |
| Cash and due from banks | | | 69,280 | | | | 309 | | | | 424 | |
| Government and corporate securities | | | 211,787 | | | | — | | | | — | |
| Loans and Trade receivables | | | 1,192,815 | | | | — | | | | — | |
| Other receivables resulting from financial brokerage | | | 187,736 | | | | 19,115 | | | | 1,708 | |
| Other assets | | | 66,142 | | | | 2,297 | | | | 2,642 | |
| | | | | | | | | | |
Total Assets | | | 1,727,760 | | | | 21,721 | | | | 4,774 | |
| | | | | | | | | | |
| Deposits | | | 385,324 | | | | — | | | | — | |
| Other liabilities resulting from financial brokerage | | | 435,107 | | | | — | | | | 2 | |
| Provisions | | | 8,150 | | | | — | | | | — | |
| Other liabilities | | | 130,455 | | | | 3,405 | | | | 4,352 | |
| | | | | | | | | | |
Total Liabilities | | | 959,036 | | | | 3,405 | | | | 4,354 | |
| | �� | | | | | | | | |
Shareholder’s Equity | | | 768,724 | | | | 18,316 | | | | 420 | |
| | | | | | | | | | |
Total Liabilities and Shareholder’s Equity | | | 1,727,760 | | | | 21,721 | | | | 4,774 | |
| | | | | | | | | | |
F-54
Additional business combination disclosure as required by ASC 805-10-50-2 (h)
The table below presents unaudited condensed income statement data under Argentine Banking GAAP of the CFA Group for the six-month period ending December 31, 2010, which represents the results of CFA Group since the acquisition date included in Grupo Financiero Galicia’s consolidated income statement for the year ended December 31, 2010.
| | | | | |
| | | Condensed income statement of the CFA Group | |
| | | for the six-month period ending December 31, | |
| | | 2010 | |
| Net financial income | | | 282,021 | |
| Net Income from services | | | 25,902 | |
Net operating revenue | | | 307,923 | |
| Provisions for loan losses | | | (44,823 | ) |
| Administrative expenses | | | (159,165 | ) |
Net operating income | | | 103,935 | |
| Other income loss | | | 37,473 | |
| Non-controlling interest | | | — | |
Pre-tax income | | | 141,408 | |
| Income tax provision | | | (51,195 | ) |
Net Income | | | 90,213 | |
The table below presents the unaudited pro forma condensed consolidated income statement for the year ended December 31, 2010 which give effect to Grupo Financiero Galicia’s acquisition of the CFA Group as if it had occurred on January 1, 2010.
The unaudited pro forma condensed consolidated income statement presented below is derived from the historical financial statements of the CFA Group and Grupo Financiero Galicia in accordance with Argentine Banking GAAP. Such unaudited pro forma consolidated financial information does not include eliminations related to transactions between Grupo Financerio Galicia and the CFA Group, the anticipated realization of cost savings from any operating efficiencies, synergies or restructurings resulting from the integration of the CFA Group.
Grupo Financiero Galicia believes that the assumptions used to derive the unaudited pro forma condensed consolidated income statement are reasonable given the information available; however, such assumptions are subject to change, and the effect of any such change could be material. The unaudited pro forma condensed consolidated income statement has been provided for information purposes only and is not necessarily indicative of the financial condition or results of operations that would have been achieved had the transaction actually been completed on the dates indicated and do not purport to be indicative of results of operations at any future date or for any future period.
Information related to the CFA Group under U.S. GAAP prior to the date of the acquisition of the CFA Group by Grupo Financiero Galicia is not available and therefore, the disclosure required by ASC 805-10-50-2(h) is impracticable.
| | | | | | | | | |
| | | Unaudited pro-forma condensed | | | | |
| | | income statement of Grupo | | | Unaudited pro-forma condensed | |
| | | Financiero Galicia for the twelve- | | | income statement Grupo Financiero | |
| | | month period ending December 31, | | | Galicia for the twelve-month period | |
| | | 2010 | | | ending December 31, 2009 | |
| Net financial income | | | 2,453,977 | | | | 1,918,615 | |
| Net Income from services | | | 1,807,430 | | | | 1,351,678 | |
Net operating revenue | | | 4,261,407 | | | | 3,270,293 | |
| Provisions for loan losses | | | (681,602 | ) | | | (791,689 | ) |
| Administrative expenses | | | (2,999,289 | ) | | | (2,269,451 | ) |
Net operating income | | | 580,516 | | | | 209,153 | |
| Other income | | | 194,764 | | | | 273,057 | |
| Non-controlling interest | | | (104,333 | ) | | | (155,992 | ) |
Pre-tax income | | | 670,947 | | | | 326,218 | |
| Income tax provision | | | (283,428 | ) | | | (65,871 | ) |
Net Income | | | 387,519 | | | | 260,347 | |
F-55
Grupo Financiero Galicia S.A. and Subsidiaries
Notes to the Consolidated Financial Statements
For the years ended December 31, 2010, 2009 and 2008
(Expressed in thousands of Argentine pesos)
33. Differences between the Argentine Central Bank’s regulations and Argentine GAAP in the Autonomous City of Buenos Aires.
The main differences between the Argentine Central Bank’s regulations and Argentine GAAP are detailed below:
Boden 2012 Bonds
As of December 31, 2009 these securities were recorded at face value and increased on the basis of interest accrued under the relative terms and conditions. Under Argentine GAAP these securities should have been value at fair value with the resulting gain or loss reflected in the income statement.
Had such bonds recorded under the abovementioned captions been valued at fair value, the Group’s equity would have been reduced by approximately Ps.175,818 as of December 31, 2009.
During this fiscal year, the position of these bonds, has been sold.
The same criterion was applied to holdings of such bonds used in repo transactions recorded under “Other Receivables Resulting from Financial Brokerage” and “Miscellaneous Receivables”.
Bonar 2015 Bonds
As of December 31, 2009 these bonds have been valued at their acquisition cost increased by the accrual of their internal rate or return (IRR). Under Argentine GAAP these securities should have been marked to market with the resulting gain or loss reflected in the income statement. Had such bonds been valued at market price, the Group’s equity would have been increased by approximately Ps.317,596 as of December 31, 2009.
These holdings amounted to a face value of Ps.746,178 as of December 31, 2009, which total Ps.323,744 (in January 2010, the amount of face value Ps.627,178 were recognized in investment accounts).
During this fiscal year, the position of these securities has been realized.
Bonar 2015 Bonds in Investment Accounts
In January 2010, Bonar 2015 with a face value of Ps.668,178 were recorded in this item, from which face value Ps.627,178 were valued at their acquisition cost increased according to the internal rate of return (I.R.R.) and face value Ps.41,000 were valued at fair values as of the previous fiscal year-end. Holdings of these securities are valued at their acquisition cost at the closing of operations on the day before they were recognized. Consequently, the recognition of face value Ps.627,178 generated income for Ps.240,624.
As of December 31, 2010, these holdings have been valued at their acquisition cost increased on an exponential basis according to their I.R.R. The same criterion was applied to holdings of such bonds used in reverse repo transactions. Under Argentine GAAP these securities should be valued at market price, the Bank’s Shareholders’ Equity would have been increased by Ps.84,496 as of December 31, 2010.
Discount Bonds and GDP-Linked Negotiable Securities
As of December 31, 2009 the securities received have been recorded at the lowest of the total future nominal cash payments up to maturity specified by the terms and conditions of the new securities, and the carrying value of the securities tendered as of March 17, 2005, net of the financial services received.
F-56
Grupo Financiero Galicia S.A. and Subsidiaries
Notes to the Consolidated Financial Statements
For the years ended December 31, 2010, 2009 and 2008
(Expressed in thousands of Argentine pesos)
Pursuant to Argentine GAAP, these assets must have been valued separately and at their fair valur, less estimated selling costs. Had these securities been valued at fair value, as of December 31, 2009 the Group’s shareholders’ equity would have been reduced by approximately Ps.284,111.
During this fiscal year, the position of these bonds has been realized by the Group.
Accounting disclosure of effects generated by court decisions on deposits
As of December 31, 2009, the Group carried assets of Ps.259,053 under “Intangible Assets — Organization and Development Expenses”, for the residual value of the differences resulting from compliance with court decisions on reimbursement of deposits within the framework of Law No. 25,561, Decree No. 214/02 and complementary regulations. Under Argentine GAAP, such assets may be recorded as a receivable and its valuation should be based upon the best estimate of the recoverable amounts.
As of December 31, 2010 this item has been fully amortized.
Conversion of financial statements
The conversion into pesos of the financial statements of the foreign branches and subsidiaries for the purpose of their consolidation with Banco Galicia’s financial statements, made in accordance with Argentine Central Bank regulations differ from Argentine GAAP (Technical Pronouncement No. 18). Argentine GAAP requires that:
a) The measurements in the financial statements that are stated in fiscal year-end foreign currency (current values, recoverable values) be converted into pesos at the balance sheet date exchange rate; and
b) The measurements that are stated in foreign currency of periods predating the closing date (for example: those which represent historical costs, income, expenses) in the financial statements be converted into pesos at the pertinent historical exchange rates, restated at fiscal year-end currency due to the application of Technical Pronouncement No. 17. Quotation differences arising from conversion of the financial statements are treated as financial income or losses, as the case may be.
The application of this criterion instead of that mentioned in Note 2.2 does not have a significant impact on the Group’s financial statements.
Allowance for loan losses — Non-financial public sector
Current Argentine Central Bank regulations on the establishment of allowances provide that receivables from the public sector are not subject to allowances for uncollectibility risk. Under Argentine GAAP, those allowances must be estimated based on the recoverability risk of those assets.
Negative Goodwill
As of December 31, 2010, the Bank and Tarjetas Regionales S. A. have recorded a negative goodwill (net of the accumulated amortizations) for Ps.446,054 and Ps.19,580, respectively, thus regularizing the equity investments. This negative goodwill stems from the difference between the acquisition cost paid by the companies Compañía Financiera Argentina S.A. and Cobranzas y Servicios S.A. and their equity method value estimated at the time of the purchase.
Pursuant to the Argentine Central Bank regulations, the negative goodwill has to be charged to Income with regard to the causes that have originated it, not to exceed a 60-month straight-line method amortization. Pursuant to Argentine GAAP, the negative goodwill that is not related to expenses estimations or estimated future losses should be recognized as a gain at the time of the purchase.
F-57
Grupo Financiero Galicia S.A. and Subsidiaries
Notes to the Consolidated Financial Statements
For the years ended December 31, 2010, 2009 and 2008
(Expressed in thousands of Argentine pesos)
Accounting for income tax according to the deferred tax method
The Bank determines the Income Tax charge by applying the statutory tax rate to the estimated taxable income, without considering the effect of any temporary differences between accounting and tax results.
Under Argentine GAAP, income tax must be recognized using the deferred tax method and, therefore, deferred tax assets or liabilities must be established based on the aforementioned temporary differences. In addition, unused tax loss carryforwards or fiscal credits that may be offset against future taxable income should be recognized as deferred assets, provided that taxable income is likely to be generated.
Adoption of the International Financial Reporting Standards by the National Securities Commission
The international financial reporting standards adopted by the National Securities Commission (C.N.V.) are not applicable to Banco de Galicia y Buenos Aires S.A., Galicia Seguros S.A. and Galicia Retiro S.A.. This is due to the fact that the C.N.V. holds the position to accept accounting criteria set forth by other regulatory or control bodies, such as those established by the Argentine Central Bank for the companies included in the Financial Institutions Law and those established by the Argentine Superintendency of Insurance for insurance companies.
The application of such standards shall be compulsory for Grupo Financiero Galicia S.A. as from the fiscal year commenced on January 1, 2012. The Board of Directors approved the specific implementation plan on April 28, 2010. At the date of these financial statements, the Group is assessing the effects of the adoption of the financial reporting standards may have, which mainly affect the presentation of the Company’s consolidated financial information. In this respect, the Company is working on the information models required by such accounting standards, both for annual and interim reporting information. The main changes will affect (i) the reporting of the consolidated financial statements as main financial statements, (ii) the amendment of information to be included in the Notes to the financial statements, such as the classification of financial instruments, the level of importance of estimates made, and the disclosure of qualitative and quantitative aspects related to the management of financial risks, and (iii) the reconciliation of information by segments, among other aspects related to the presentation of information.
Tarjeta Naranja S.A. and Tarjetas Cuyanas S.A., institutions which are both included in the public offering system because of their Negotiable Obligations pursuant to Law No.17811, are under the scope of General Resolution No. 562 issued in December 2009 by the C.N.V. related to the adoption of the international financial reporting standards. The effective date of the resolution’s application will be January 1, 2012. Therefore, the companies started with the instruction of their management divisions to develop both integral conversion projects in order to comply with the mentioned resolution.
At the date of these financial statements, these companies are assessing some of the effects the adoption of these accounting standards will have, which mainly include: The valuation of receivables from sales, allowances for loan losses and the recording of income, as well as specific requirements for these companies’ presentation of financial information.
The adoption of the international financial reporting standards is not mandatory for the rest of the companies controlled by the Group, either directly or indirectly. However, these companies’ Board of Directors have decided to introduce the described change in regulations as from January 1, 2012, for consolidation purposes with Grupo Financiero Galicia’s financial statements.
F-58
Grupo Financiero Galicia S.A. and Subsidiaries
Notes to the Consolidated Financial Statements
For the years ended December 31, 2010, 2009 and 2008
(Expressed in thousands of Argentine pesos)
34. Subsequent events
Grupo Financiero Galicia
On April 27, 2011, our shareholders held a shareholders’ meeting during which they approved the payment of dividends in cash in the amount of Ps.24.8 million which represents 2% with regard to 1,241,407,017 Class “A” and “B” ordinary shares with a face value of Ps.1 each.
Banco Galicia
After the end of the fiscal year ended December 31, 2010, the Bank made the decision to partially redeem the capitalized interest corresponding to its subordinated negotiable obligations due 2019 (5% annual interest, payable semiannually), which had accrued from January 1, 2004, to December 31, 2010, and was originally scheduled to be paid on January 1, 2014. The cash payment took place on February 22, 2011, and represented 41.30% of face value. In addition, this payment included the 11% annual interest accrued and unpaid from January 1, 2011 to February 21, 2011 on the amount being redeemed, equivalent to 0.64% of face value. After this payment, for a total principal amount of US$90.1 million, the outstanding principal amount of such subordinated negotiable obligations amounts to US$218.2 million.
During the shareholders’ meeting of Banco Galicia held on April 27, 2011, the Bank’s shareholders approved the proposal of its board of directors in connection with the payment of a cash dividend for Ps.100.1 million. This proposal was previously authorized by the Superintendency, required by regulations in force established by the Argentine Central Bank. From said dividend, the personal asset tax corresponding to fiscal year 2010 will be withheld, at the appropriate time.
On May 4, 2011, the Bank issued its class I negotiable obligations, within its global short-term, medium-term and/or long-term note program, for an outstanding face value at any time of up to US$342.5 million, or the equivalent amount in other currencies. The amount issued was US$300.0 million. The aggregate principal amount will mature on May 4, 2018. The notes will bear 8.75% interest per annum, which will be payable semi-annually, commencing on November 4, 2011.
Tarjetas Regionales
On January 28, 2011, Tarjeta Naranja S.A. issued US$200 million of 9.0% senior unsecured notes due 2017 pursuant to Rule 144A/Regulation S of the Securities Act of 1933. Tarjeta Naranja S.A. plans to use these funds for working capital and to finance its business expansion.
On April 15, 2011, Tarjetas Cuyanas issued its class IV negotiable obligations, within its global short-term, medium-term and/or long-term note program, for an outstanding face value of up to US$120.0 million, or the equivalent amount in other currencies. The aggregate principal amount issued of Ps.50 million will mature on January 10, 2012. The notes will bear a floating interest rate equal to the simple arithmetic average of the private BADLAR plus 2.85%, which will be payable on July 14, 2011, on October 12, 2011 and on January 10, 2012.
Compañía Financiera Argentina
On January 27, 2011, the CNV approved an extension of CFA’s program for the issuance of ordinary short-, medium- or long-term, secured or unsecured, subordinated or non-subordinated, negotiable obligations and approved the increase of its maximum outstanding face value to up to US$250 million.
On March 28, 2011, CFA issued its class III negotiable obligations under its program. The amount issued of series I was Ps.56.0 million, and the aggregate amount will mature on December 23, 2011. The notes will bear floating interest rate equal to the simple arithmetic average of the private BADLAR plus 3.26%, which will be payable on June 26, 2011, September 24, 2011 and on the date of maturity.
F-59
Grupo Financiero Galicia S.A. and Subsidiaries
Notes to the Consolidated Financial Statements
For the years ended December 31, 2010, 2009 and 2008
(Expressed in thousands of Argentine pesos)
The amount issued of series II was Ps.44.0 million, and will be amortized in three installments, on June 28, 2012 (33.33%), on September 28, 2012 (33.33%) and on December 28, 2012 (33.34%). The notes will bear a floating interest rate equal to the simple arithmetic average of the private BADLAR plus 4.08%, which will be payable quarterly, commencing on June 28, 2011 and until December 28, 2012.
On April 20, 2011, distribution of a cash dividend for Ps.55.6 million was approved at CFA’s shareholders’ meeting.
35. Summary of Significant Differences between Argentine Central Bank Rules and United States Accounting Principles.
The following is a description of the significant differences between Argentine Banking GAAP and the generally accepted accounting principles in the United States (“U.S. GAAP”).
a. Income tax
Argentine Central Bank regulations do not require the recognition of deferred tax assets and liabilities and, therefore, income taxes for Banco Galicia and CFA are recognized on the basis of amounts due in accordance with Argentine tax regulations. However, Grupo Galicia and Grupo Galicia’s non-bank subsidiaries apply the deferred income tax method. As a result, Grupo Galicia and its non-banking subsidiaries have recognized a deferred tax asset as of December 31, 2010 and 2009.
For the purposes of U.S. GAAP reporting, Grupo Galicia applies ASC 740-10 “Accounting for Income Taxes”. Under this standard, income tax is recognized based on the assets and liabilities method whereby deferred tax assets and liabilities are established for temporary differences between the financial reporting and tax basis of Grupo Galicia’s assets and liabilities. Deferred tax assets are recognized if it is more likely than not that such assets will be realized.
F-60
Grupo Financiero Galicia S.A. and Subsidiaries
Notes to the Consolidated Financial Statements
For the years ended December 31, 2010, 2009 and 2008
(Expressed in thousands of Argentine pesos)
Deferred tax assets (liabilities) are summarized as follows:
| | | | | | | | | | | | | |
| | | December 31, 2010 | |
| | | ASC 740-10 | | | | | | | |
| | | applied to | | | ASC 740-10 | | | | |
| | | Argentine | | | applied to U.S. | | | U.S. GAAP | |
| | | GAAP | | | GAAP | | | Deferred Tax | |
| | | balances | | | adjustments | | | total | |
| Deferred tax assets | | | | | | | | | | | | |
| Allowance for loan losses — private sector | | | 165,836 | | | | (22,919 | ) | | | 142,917 | |
| Intangible assets | | | 997 | | | | 46,766 | | | | 47,763 | |
| Impairment of fixed assets and foreclosed assets | | | — | | | | 19,598 | | | | 19,598 | |
| Debt restructuring | | | — | | | | 26,603 | | | | 26,603 | |
| Investments | | | 7,175 | | | | — | | | | 7,175 | |
| Liabilities | | | 70,838 | | | | — | | | | 70,838 | |
| Others | | | 89,128 | | | | 30,970 | | | | 120,098 | |
| Loss carry forward | | | 91,840 | | | | — | | | | 91,840 | |
| | | | | | | | | | |
| Total gross deferred tax assets | | Ps. | 425,814 | | | Ps. | 101,018 | | | Ps. | 526,832 | |
| | | | | | | | | | | | | |
| Deferred tax liabilities: | | | | | | | | | | | | |
| Allowance for loan losses — public sector | | | (54,514 | ) | | | — | | | | (54,514 | ) |
| Provincial public debt | | | — | | | | (27,541 | ) | | | (27,541 | ) |
| Others | | | (117,998 | ) | | | — | | | | (117,998 | ) |
| | | | | | | | | | |
| Total gross deferred tax liabilities | | Ps. | (172,512 | ) | | Ps. | (27,541 | ) | | Ps. | (200,053 | ) |
| | | | | | | | | | |
| Net deferred income tax asset before valuation allowance | | Ps. | 253,302 | | | Ps. | 73,477 | | | Ps. | 326,779 | |
| | | | | | | | | | |
| Valuation allowance | | | — | | | | — | | | | — | |
| | | | | | | | | | |
| Net deferred income tax assets | | Ps. | 253,302 | | | Ps. | 73,477 | | | Ps. | 326,779 | |
| | | | | | | | | | |
F-61
Grupo Financiero Galicia S.A. and Subsidiaries
Notes to the Consolidated Financial Statements
For the years ended December 31, 2010, 2009 and 2008
(Expressed in thousands of Argentine pesos)
| | | | | | | | | | | | | |
| | | December 31, 2009 | |
| | | ASC 740-10 | | | | | | | |
| | | applied to | | | ASC 740-10 | | | | |
| | | Argentine | | | applied to U.S. | | | U.S. GAAP | |
| | | GAAP | | | GAAP | | | Deferred Tax | |
| | | balances | | | adjustments | | | total | |
| Deferred tax assets | | | | | | | | | | | | |
| Allowance for loan losses — private sector | | | 175,935 | | | | (22,285 | ) | | | 153,650 | |
| Compensatory Bond, Bonar Bonds, Discount Bonds and other investments | | | (41,792 | ) | | | 49,764 | | | | 7,972 | |
| Intangible assets | | | 93,938 | | | | 27,074 | | | | 121,012 | |
| Compensation related to the payment of deposits | | | — | | | | 90,669 | | | | 90,669 | |
| Impairment of fixed assets and foreclosed assets | | | — | | | | 20,087 | | | | 20,087 | |
| Provision for contingencies | | | 71,225 | | | | — | | | | 71,225 | |
| Debt restructuring | | | — | | | | 48,045 | | | | 48,045 | |
| Others | | | 84,921 | | | | 33,723 | | | | 118,644 | |
| Loss carry forward | | | 93,821 | | | | — | | | | 93,821 | |
| | | | | | | | | | |
| Total gross deferred tax assets | | Ps. | 478,048 | | | Ps. | 247,077 | | | Ps. | 725,125 | |
| | | | | | | | | | | | | |
| Deferred tax liabilities: | | | | | | | | | | | | |
| Allowance for loan losses — public sector | | | (25,743 | ) | | | — | | | | (25,743 | ) |
| Others | | | (122,672 | ) | | | — | | | | (122,672 | ) |
| | | | | | | | | | |
| Total gross deferred tax liabilities | | Ps. | (148,415 | ) | | Ps. | — | | | Ps. | (148,415 | ) |
| | | | | | | | | | |
| Net deferred income tax asset before valuation allowance | | Ps. | 329,633 | | | Ps. | 247,077 | | | Ps. | 576,710 | |
| | | | | | | | | | |
| Valuation allowance | | | — | | | | — | | | | — | |
| | | | | | | | | | |
| Net deferred income tax assets | | Ps. | 329,633 | | | Ps. | 247,077 | | | Ps. | 576,710 | |
| | | | | | | | | | |
The following table accounts for the difference between the actual tax provision and the amounts obtained by applying the statutory income tax rate in Argentina to income before income tax, calculated on the basis of U.S. GAAP for the fiscal years ended December 31, 2010, 2009 and 2008:
| | | | | | | | | | | | | |
| | | December 31, | |
| | | 2010 | | | 2009 | | | 2008 | |
| Statutory income tax rate | | | 35 | % | | | 35 | % | | | 35 | % |
| Tax provision computed by applying the statutory rate to the income before taxation calculated in accordance with U.S. GAAP | | Ps. | 965,311 | | | Ps. | 288,659 | | | Ps. | (427,665 | ) |
| Tax exempt income | | | (457,189 | ) | | | 564,995 | | | | 92,791 | |
| Valuation allowance | | | — | | | | (799,138 | ) | | | 283,952 | |
| | | | | | | | | | |
| Actual tax provision under U.S. GAAP | | Ps. | 508,122 | | | Ps. | 54,516 | | | Ps. | (50,922 | ) |
| | | | | | | | | | |
The Group had a significant accumulated tax loss carryforward at December 31, 2008. Based on the analysis performed, management believed that the Group would recover only temporary differences with future taxable income. Therefore, the net operating tax loss carryforward and presumed minimum income tax was more likely than not to be recovered in the carryforward period and hence a valuation allowance was provided against this amount as of December 31, 2008.
F-62
Grupo Financiero Galicia S.A. and Subsidiaries
Notes to the Consolidated Financial Statements
For the years ended December 31, 2010, 2009 and 2008
(Expressed in thousands of Argentine pesos)
As of December 31, 2009 based on the analysis performed, the Group believed that it was more likely that not that it would recover only the net operating tax loss carryforward and the temporary differences, with future taxable income. Therefore, presumed minimum income tax was not more likely than not to be recovered in the carryforward period and hence a valuation allowance was provided against this amount as of December 31, 2009.
As of December 31, 2010 based on the analysis performed, the Group believes that is more likely that not that it will recover the net operating tax loss carryforward, the temporary differences and the presumed minimum income tax, with future taxable income. Among other factors, the Group considered that as of the date of the issuance of these financial statements, the taxable income mainly due to the sales of national government bonds has been consumed the total tax loss carryforward. In addition, according to the taxable income projections, the Group estimated that the presumed minimum income tax will be utilized during 2011 and 2012. Therefore, no valuation allowance was provided against presumed minimum income tax.
“Accounting for Uncertainty in Income Taxes”, ASC 740-10 was issued in July 2006 and interprets FASB Statement of Financial Accounting Standards ASC 740-10. ASC 740-10 became effective for the Group on January 1, 2007 and prescribes a comprehensive model for the recognition, measurement, financial statement presentation and disclosure of uncertain tax positions taken or expected to be taken in a tax return. ASC 740-10 provides guidance on derecognition, classification, interest and penalties, accounting in interim periods, disclosure and transition. As of December 31, 2010, there were no uncertain tax positions.
The Group classifies income tax-related interest and penalties as income taxes in the financial statements. The adoption of this pronouncement had no effect on the Group’s overall financial position or results of operations.
The following table shows the tax years open for examination as of December 31, 2010, by major tax jurisdictions in which the Group operates:
| | | | | |
| Jurisdiction | | Tax year | |
| Argentina | | | 2006 – 2010 | |
| Uruguay | | | 2006 – 2010 | |
b. Commissions on loans
Under Argentine Banking GAAP, the Bank does not defer loan origination fees and costs. In accordance with U.S. GAAP under ASC 310, loan origination fees net of certain direct loan origination costs should be recognized over the life of the related loan as an adjustment of yield.
c. Intangible assets
Goodwill — Amortization and impairment
The following table summarizes the U.S. GAAP shareholders’ equity adjustments as of December 31, 2010 and 2009:
| | | | | | | | | |
| | | December 31, | |
| | | 2010 | | | 2009 | |
| Goodwill impairment (1) | | | (11,483 | ) | | | (16,649 | ) |
| Reversal of amortizations (2) | | | 43,618 | | | | 41,856 | |
| | | | | | | |
| Total | | Ps. | 32,135 | | | Ps. | 25,207 | |
| | | | | | | |
| | | |
| (1) | | The amount mainly includes goodwill recorded on the purchase of regional credit-card companies, the acquisition of assets and liabilities of the retail division of ABN AMRO Bank and other subsidiaries are being amortized over 10 years for Argentine Banking GAAP purposes. |
F-63
Grupo Financiero Galicia S.A. and Subsidiaries
Notes to the Consolidated Financial Statements
For the years ended December 31, 2010, 2009 and 2008
(Expressed in thousands of Argentine pesos)
According to ASC 350-20, since June 30, 2001, goodwill is no longer amortized. Under U.S. GAAP, ASC 350 requires that goodwill should be reviewed annually for impairment or whenever events or changes in circumstances indicate that the carrying amount may not be recoverable, and adjusted in case that an impairment is detected. As of December 31, 2010 and 2009, no impairment was recorded. As of December 31, 2008 the Group performed the impairment test of the goodwill related to the acquisition of certain loan portfolio of the ABN-AMRO Bank and an impairment loss was recognized for an amount of Ps.26,163.
| | | |
| (2) | | Goodwill being amortized for Argentine Banking GAAP purposes included goodwill previously impaired under U.S. GAAP, has been reversed for U.S. GAAP purposes. |
Negative Goodwill — Compañía Financiera Argentina S.A., Cobranzas y Servicios S.A., and Procesadora Regional S.A.
The Argentine Central Bank’s Board of Directors, through Resolution No. 124 dated June 7, 2010, authorized the Bank to purchase 95% of the shares belonging to the following companies: Compañía Financiera Argentina S.A., Cobranzas y Servicios S.A. and Procesadora Regional S.A. (former Universal Processing Center S.A.). Furthermore, through the above-mentioned resolution the Argentine Central Bank authorized the subsidiary Tarjetas Regionales S.A. to purchase the remaining 5% of the shares belonging to said companies.
On August 31, 2010, through Resolution No. 299, the Argentine Commission of Competence Defense (Comisión Nacional de Defensa de la Competencia) authorized the above-mentioned purchase and sale transaction, of which the Bank was informed on September 1, 2010.
The total purchase price paid amounted to Ps.328,279 for Compañía Financiera Argentina, Ps.835 for Cobranzas y Servicios S.A. and Ps.4,809 for Procesadora Regional S.A. (former Universal Processing Center S.A.).
F-64
Grupo Financiero Galicia S.A. and Subsidiaries
Notes to the Consolidated Financial Statements
For the years ended December 31, 2010, 2009 and 2008
(Expressed in thousands of Argentine pesos)
The transaction will enable the Bank to serve a greater number of customers with our current structure, to complement lines of business and to achieve greater economies of scale by additionally providing Compañía Financiera Argentina and the above mentioned companies with a more efficient financing structure and permitting its clients access to a network with a greater geographical coverage. Nevertheless, CFA is still a separated segment considering how the business is analyzed by the management.
Pursuant to Argentine Central Bank rules, and due to the difference between the acquisition cost and the estimated fair value of assets and liabilities acquired as of June 30, 2010, a negative goodwill amounting to Ps.500,608 was recorded by Compañía Financiera Argentina S.A. and a negative goodwill of Ps.16,764 was recorded by Cobranzas y Servicios S.A., both of which were recorded in caption Liabilities-Provisions. With regard to Procesadora Regional S.A. (former Universal Processing Center S.A.), a goodwill amounting to Ps.4,049 was recorded under Intangible Assets — Goodwill. The negative goodwill is subsequently charged to Income on a straight-line basis during 60 months.
As of December 31, 2010 the Group has a balance of Ps. 465,634 related to the negative goodwill.
Under U.S. GAAP, ASC 805 requires the acquisition of controlling interest of Compañía Financiera Argentina, Cobranzas y Servicios S.A. and Procesadora Regional S.A. (former Universal Processing Center S.A.). to be accounted for as a business combination applying the purchase method, recognizing all net assets acquired at their fair value. The Group applies the following guidance:
• if the consideration transferred exceeds the fair value of assets acquired and liabilities assumed, the acquirer shall recognize goodwill as of the acquisition date, or,
• if the consideration transferred is lower than the fair value of assets acquired and liabilities assumed, the acquirer shall recognize the resulting gain in earnings on the acquisition date.
The following table summarizes the consideration transferred and the fair value of identified assets acquired and liabilities assumed at the acquisition date:
| | | | | | | | | | | | | |
| | | Compañía | | | | | | | |
| | | Financiera | | | Cobranzas y | | | Universal | |
| | | Argentina | | | Servicios | | | Processing Center | |
Acquisition date | | June 30, 2010 | | June 30, 2010 | | June 30, 2010 |
Fair value of consideration transferred: | | | | | | | | | | | | |
| | | | | | | | | | | | | |
| Cash | | Ps. | 328,279 | | | Ps. | 835 | | | Ps. | 4,809 | |
| | | | | | | | | | | | | |
Total | | | 328,279 | | | | 835 | | | | 4,809 | |
| | | | | | | | | | | | | |
Recognised amounts of identifiable assets acquired and liabilities assumed: | | | | | | | | | | | | |
| | | | | | | | | | | | | |
| Cash and due from banks | | | 61,125 | | | | 522 | | | | 816 | |
| Government and corporate securities | | | 31,948 | | | | 15,789 | | | | 934 | |
| Loans and Trade receivables | | | 1,138,407 | | | | 3,189 | | | | — | |
| Other receivables resulting from financial brokerage | | | 68,842 | | | | — | | | | — | |
| Other assets | | | 44,605 | | | | 783 | | | | 1,476 | |
| Deposits | | | (304,488 | ) | | | — | | | | — | |
| Other liabilities resulting from financial brokerage | | | (123,759 | ) | | | — | | | | — | |
| Provisions | | | (10,135 | ) | | | (750 | ) | | | — | |
| Other liabilities | | | (77,658 | ) | | | (1,934 | ) | | | (2,466 | ) |
| | | | | | | | | | | | | |
Total identifiable net assets | | | 828,887 | | | | 17,599 | | | | 760 | |
| | | | | | | | | | |
Goodwill /(Negative Goodwill) | | Ps. | (500,608 | ) | | Ps. | (16,764 | ) | | Ps. | 4,049 | |
| | | | | | | | | | |
F-65
Grupo Financiero Galicia S.A. and Subsidiaries
Notes to the Consolidated Financial Statements
For the years ended December 31, 2010, 2009 and 2008
(Expressed in thousands of Argentine pesos)
These acquisitions were approved by the Argentine Central Bank on June 2010. By means of such approval, the Bank took control of the operations in these companies. Therefore, the acquisition date was considered to be June 30, 2010.
No intangible assets were identified as part of the acquisition considering the type of assets acquired (mainly consumer loans) and the profile of the deposits in these companies.
Considering that the net assets acquired were originally recorded at their estimated fair value under Argentine Banking GAAP, no adjustments for U.S. GAAP purposes were recorded in this regard. However, the negative goodwill recorded as a liability and being amortized over a 60 months period under Argentine Banking GAAP, has been fully recognized as a gain in the consolidated statement of income for U.S. GAAP purposes under the caption Miscellaneous Income.
In addition, the amortization of negative goodwill recorded under Argentine Banking GAAP has been reversed for U.S. GAAP purposes.
The tables below present the condensed income statement of the mentioned companies in accordance with Argentine Banking GAAP:
| | • | | for the fiscal year ended December 31, 2010, |
| | • | | for the six-month period ended June 30, 2010, which were not included in Group’s consolidated financial statements for the year ended December 31, 2010, and |
| | • | | for the six-month period ended December 31, 2010 which were the results consolidated in Group’s consolidated financial statements for the year ended December 31, 2010 considering that the acquisition date was June 30, 2010, |
| | • | | Compañía Financiera Argentina |
| | | | | | | | | | | | | |
| | | | | | | Six mounths | | | Six mounths | |
| | | Fiscal year ended | | | period ended | | | period ended | |
| | | 12/31/2010 | | | 06/30/2010 | | | 12/31/2010 (*) | |
| Financial Income | | | 618,290 | | | | 292,689 | | | | 325,601 | |
| Financial Expenses | | | (85,753 | ) | | | (42,156 | ) | | | (43,597 | ) |
| Loan Loss provisions | | | (174,901 | ) | | | (130,078 | ) | | | (44,823 | ) |
| Income from Services | | | 47,631 | | | | 23,674 | | | | 23,957 | |
| Expenses for Services | | | (33,109 | ) | | | (15,314 | ) | | | (17,795 | ) |
| Administrative expenses | | | (276,894 | ) | | | (136,755 | ) | | | (140,139 | ) |
| Miscellaneous Income | | | 67,472 | | | | 25,649 | | | | 41,823 | |
| Miscellaneous Losses | | | (18,191 | ) | | | (13,001 | ) | | | (5,190 | ) |
| Income Tax | | | (75,000 | ) | | | (25,000 | ) | | | (50,000 | ) |
| | | | | | | | | | |
Net Income / (Loss) | | | 69,545 | | | | (20,292 | ) | | | 89,837 | |
| | | | | | | | | | |
| | | |
| (*) | | These amounts do not include adjustments and consolidating eliminations. |
F-66
Grupo Financiero Galicia S.A. and Subsidiaries
Notes to the Consolidated Financial Statements
For the years ended December 31, 2010, 2009 and 2008
(Expressed in thousands of Argentine pesos)
| | | | | | | | | | | | | |
| | | | | | | Six mounths | | | Six mounths | |
| | | Fiscal year ended | | | period ended | | | period ended | |
| | | 12/31/2010 | | | 06/30/2010 | | | 12/31/2010(*) | |
| Financial Income | | | — | | | | — | | | | — | |
| Financial Expenses | | | — | | | | — | | | | — | |
| Loan Loss provisions | | | — | | | | — | | | | — | |
| Income from Services | | | 20,506 | | | | 10,203 | | | | 10,303 | |
| Expenses for Services | | | (664 | ) | | | (326 | ) | | | (338 | ) |
| Administrative expenses | | | (17,160 | ) | | | (8,268 | ) | | | (8,892 | ) |
| Miscellaneous Income | | | 13 | | | | (826 | ) | | | 839 | |
| Miscellaneous Losses | | | — | | | | — | | | | — | |
| Income Tax | | | (1,195 | ) | | | — | | | | (1,195 | ) |
| | | | | | | | | | |
Net Income / (Loss) | | | 1,500 | | | | 783 | | | | 717 | |
| | | | | | | | | | |
| | | |
| (*) | | These amounts do not include adjustments and consolidating eliminations. |
| | • | | Procesadora Regional S.A. |
| | | | | | | | | | | | | |
| | | | | | | Six mounths | | | Six mounths | |
| | | Fiscal year ended | | | period ended | | | period ended | |
| | | 12/31/2010 | | | 06/30/2010 | | | 12/31/2010(*) | |
| Financial Income | | | 16 | | | | (1 | ) | | | 17 | |
| Financial Expenses | | | — | | | | — | | | | — | |
| Loan Loss provisions | | | — | | | | — | | | | — | |
| Income from Services | | | 17,635 | | | | 7,531 | | | | 10,104 | |
| Expenses for Services | | | (564 | ) | | | (235 | ) | | | (329 | ) |
| Administrative expenses | | | (19,086 | ) | | | (8,952 | ) | | | (10,134 | ) |
| Miscellaneous Income | | | 2 | | | | 1 | | | | 1 | |
| Miscellaneous Losses | | | — | | | | — | | | | — | |
| Income Tax | | | (237 | ) | | | (237 | ) | | | — | |
| | | | | | | | | | |
Net Income / (Loss) | | | (2,234 | ) | | | (1,893 | ) | | | (341 | ) |
| | | | | | | | | | |
| | | |
| (*) | | These amounts do not include adjustments and consolidating eliminations. |
Software costs
Under U.S. GAAP, ASC 850-40 defines three stages for the costs of computer software developed or obtained for internal use: the preliminary project stage, the application development stage and the post-implementation operation stage. Only the second stage costs should be capitalized. Under Argentine Banking GAAP, the Bank is to capitalize costs relating to all three of the stages of software development.
During the year ended December 31, 2010, the Bank has capitalized software costs related to the preliminary project stage and the post-implementation operation stage which were expensed as incurred for U.S. GAAP and therefore increasing the U.S. GAAP adjustment as of December 31, 2010.
F-67
Grupo Financiero Galicia S.A. and Subsidiaries
Notes to the Consolidated Financial Statements
For the years ended December 31, 2010, 2009 and 2008
(Expressed in thousands of Argentine pesos)
d. Loan loss reserves
(i) Loans — Non-financial national public sector
During the fiscal year ended December 31, 2001, and as a consequence of Decree No. 1387/01, effective as of November 6, 2001, the Bank swapped part of its Argentine public-sector debt instruments, under the Promissory Note/Bond program, for secured loans.
During January 2009 the National Government offered a public debt swap, including secured loans set forth in Decree No. 1387/01 and other debt securities. Regarding such measure, the Bank took part in an exchange of National Secured Loans “DUE:2009-7%, Bond Promissory Note G+580 Mega (fixed rate)”, for other public sector assets pursuant to their market prices.
Under Argentine Banking GAAP, the Secured Loans have been valued on the basis of the highest value that arises from the difference between the present value, informed by the Argentine Central Bank, and their net book value. The latter value is the book value recorded as of January 31, 2009, increased monthly by the IRR and adjusted by the CER, net of charged financial services received. In the case these Secured Loans’ present value is lower than their book value, the monthly accrual is charged to an asset regularizing account. Such account shall be reversed by charging its balance to Income as long as such balance is higher than the positive difference existing between the present value and the net book value, as recorded in the previous fiscal year.
In accordance with U.S. GAAP, specifically ASC 310-20, satisfaction of one monetary asset (in this case a loan or debt security) by the receipt of another monetary asset (in the case a secured loan) for the creditor is generally based on the market value of the asset received in satisfaction of the debt (an extinguishment). In this particular case, the secured loan being received is substantially different in structure and in interest rates than the debt securities swapped. Therefore, the fair value of the loans was determined on the balance sheet date based on the contractual cash flows of the loan received discounted at an estimated market rate. The estimated fair value of the loan received will constitute the cost basis of the asset. Any difference between the old asset and the fair value of the new asset is recognized as a gain or loss. The difference between the cost basis and amounts expected to be collected is being amortized on an effective yield basis over the life on the loan.
As of December 31, 2009 and 2008 National secured loans amounted to thousands of US dollars 3,273 and 427, 957 (face value).
During the year ended December 31, 2010 the Bank sold its position in these loans. Therefore, as of December 31, 2010, the shareholders’ equity does not include a reconciliation item related to the above mentioned adjustment.
(ii) Loans to the non-financial private sector and residents abroad
For the purposes of analyzing our loan loss reserve under U.S. GAAP, the Bank divides the loan portfolio into performing and non-performing commercial and consumer loans.
The non-performing commercial loan portfolio is comprised of loans falling into the following classifications of the Argentine Central Bank:
| | • | | “With Problems” |
| |
| | • | | “High Risk of Insolvency” |
| |
| | • | | “Uncollectible” |
F-68
Grupo Financiero Galicia S.A. and Subsidiaries
Notes to the Consolidated Financial Statements
For the years ended December 31, 2010, 2009 and 2008
(Expressed in thousands of Argentine pesos)
The Bank applies ASC 310-10 to all commercial loans classified as “With problems”, “High Risk of Insolvency” and “Uncollectible” or commercial loans more than 90 days past due. The Bank specifically calculates the present value of estimated cash flows for commercial loans in excess of Ps.750 and more than 90 days past due. For commercial and other loans in legal proceedings, loans in excess of Ps.750 are specifically reviewed either on a cash-flow or collateral-value basis, both considering the estimated time to settle the proceedings.
For loans that were not collateral dependent, the expected future cash flows to be received from the loans were discounted using the interest rate at each balance sheet date for variable loans. Loans that were collateral dependent, and for which there was an expectation that the loan balance would be recovered via the exercise of collateral, were valued using the fair value of the collateral. In addition, in order to assess the fair value of collateral, we discounted collateral valuations due to the extended period of time that it can take to foreclose on assets in Argentina.
To calculate the allowance required for smaller-balance impaired loans and unimpaired loans, we perform an analysis of historical losses from our consumer and performing commercial loan portfolios in order to estimate losses for U.S. GAAP purposes resulting from loan losses that had been incurred in such loan portfolios at the balance sheet date but which had not been individually identified. Loss estimates are analyzed by loan type and thus for homogeneous groups of clients. Such historical ratios are updated to incorporate the most recent data reflecting current economic conditions, industry performance trends, geographic or obligor concentrations within each portfolio segment, and any other pertinent information that may affect the estimation of the allowance for loan losses. Many factors can affect the Bank’s estimates of allowance for loan losses, including volatility of default probability, migrations and estimated loss severity. The U.S. GAAP shareholders’ equity adjustment for smaller balance impaired loans and unimpaired loans as of December 31, 2010 and 2009 amounted to Ps. (69,826) and Ps.(22,509), respectively.
With respect to the acquisition of Compañia Financiera Argentina S.A., Cobranzas y Servicios S.A. and Procesadora Regional S.A. (former Universal Processing Center S.A.) under Argentine Banking GAAP, the Bank recorded the loan portfolio acquired at fair value. However the presentation in the consolidated balance sheet was made on a gross basis, recording an outstanding amount of principal plus interest of Ps. 1,323,788 and the related allowances for loan losses of Ps. 185,381.
For U.S. GAAP purposes the fair value of the loan portfolio acquired is presented in one line item, for an amount of Ps. 1,138,407, with no amount of allowance for loan losses being recognized at the acquisition date.
| | a. | | Allowance for Credit Losses and Recorded Investments in Financial Receivables |
The following table presents the allowance for loan losses and the related carrying amount of Financial Receivables for the years ended December 31, 2010 and 2009 respectively:
| | | | | | | | | | | | | |
| | | As of December 31, 2010 | |
| | | | | | | Commercial | | | | |
| | | Consumer | | | Loan | | | | |
| | | Loan Portfolio | | | Portfolio | | | Total | |
Allowance for credit losses: | | | | | | | | | | | | |
| | | | | | | | | | | | | |
| Ending balance: individually evaluated for impairment | | | — | | | | 61,607 | | | | 61,607 | |
| Ending balance: collectively evaluated for impairment | | | 729,212 | | | | 13,867 | | | | 743,079 | |
| | | | | | | | | | |
Ending Balance | | | 729,212 | | | | 75,474 | | | | 804,686 | |
| | | | | | | | | | |
Financing receivables: | | | | | | | | | | | | |
| Ending balance: individually evaluated for impairment | | | — | | | | 137,175 | | | | 137,175 | |
| Ending balance: collectively evaluated for impairment | | | 14,123,190 | | | | 9,291,751 | | | | 23,414,941 | |
| | | | | | | | | | |
Ending Balance | | | 14,123,190 | | | | 9,428,926 | | | | 23,552,116 | |
| | | | | | | | | | |
F-69
Grupo Financiero Galicia S.A. and Subsidiaries
Notes to the Consolidated Financial Statements
For the years ended December 31, 2010, 2009 and 2008
(Expressed in thousands of Argentine pesos)
| | | | | | | | | | | | | |
| | | As of December 31, 2009 | |
| | | Consumer | | | Commercial | | | | |
| | | Loan Portfolio | | | Loan Portfolio | | | Total | |
Allowance for credit losses: | | | | | | | | | | | | |
| | | | | | | | | | | | | |
| Ending balance: individually evaluated for impairment | | | — | | | | 64,777 | | | | 64,777 | |
| Ending balance: collectively evaluated for impairment | | | 671,268 | | | | 16,247 | | | | 687,515 | |
| | | | | | | | | | |
Ending Balance | | | 671,268 | | | | 81,024 | | | | 752,292 | |
| | | | | | | | | | |
Financing receivables: | | | | | | | | | | | | |
| Ending balance: individually evaluated for impairment | | | — | | | | 286,256 | | | | 286,256 | |
| Ending balance: collectively evaluated for impairment | | | 8,899,877 | | | | 6,687,669 | | | | 15,587,546 | |
| | | | | | | | | | |
Ending Balance | | | 8,899,877 | | | | 6,973,925 | | | | 15,873,802 | |
| | | | | | | | | | |
b. Loan Charge-off s and recoveries
Under Argentine Banking GAAP, recoveries on previously charged-off loans are recorded directly to income and the amount of charged-off loans in excess of amounts specifically allocated is recorded as a direct charge to the income statement. The Bank does not partially charge off troubled loans until final disposition of the loan, rather, the allowance is maintained on a loan-by-loan basis for its estimated settlement value. Under U.S. GAAP, all charge off and recovery activity is recorded through the allowance for loan loss account. Further, loans are generally charged to the allowance account when all or part of the loan is considered uncollectible. In connection with loans in judicial proceedings, resolution through the judicial system may span several years. Loans in judicial proceedings, greater than three years as of December 31, 2010, 2009 and 2008, amounted to Ps.5,061, Ps.1,726 and Ps.20,800, respectively. Under U.S. GAAP these loans were completely provisioned. The Bank also classified loans, many of which are in judicial proceedings, which amounted approximately Ps.178,400, Ps.109,000 and Ps.62,000 as of December 31, 2010, 2009 and 2008, respectively, as uncollectible, although the Bank may hold preferred guarantees. Under U.S. GAAP, these loans would have been charged off. Therefore, the balance of loans and allowance for loan losses would be decreased by these amounts. The Bank’s practice does not affect the accompanying Statements of Income or Shareholders’ equity as the Bank’s reserve contemplates all losses inherent in those troubled loans.
c. Impaired Loans
ASC 310, requires a creditor to measure impairment of a loan based on the present value of expected future cash flows discounted at the loan’s effective interest rate, or at the loan’s observable market price or the fair value of the collateral if the loan is collateral dependent. This Statement is applicable to all loans (including those restructured in a troubled debt restructuring involving amendment of terms), except large groups of smaller-balance homogenous loans that are collectively evaluated for impairment. Loans are considered impaired when, based on Management’s evaluation, a borrower will not be able to fulfill its obligation under the original loan terms.
F-70
Grupo Financiero Galicia S.A. and Subsidiaries
Notes to the Consolidated Financial Statements
For the years ended December 31, 2010, 2009 and 2008
(Expressed in thousands of Argentine pesos)
The following table discloses the amounts of loans considered impaired in accordance with ASC 310 updated by ASU 2010 — 20, as of December 31, 2010 and 2009:
| | | | | | | | | | | | | |
| | | As of December 31, 2010 | |
| | | | | | | Unpaid | | | | |
| | | Recorded | | | Principal | | | Related | |
| | | Investment | | | Balance | | | Allowance | |
With no related allowance recorded: | | | | | | | | | | | | |
Commercial | | | | | | | | | | | | |
| Impaired Loans | | | 6,147 | | | | 2,956 | | | | — | |
| | | | | | | | | | | | | |
With an allowance recorded: | | | | | | | | | | | | |
Commercial | | | | | | | | | | | | |
| Impaired Loans | | | 131,028 | | | | 236,899 | | | | 61,607 | |
| | | | | | | | | | |
Total | | | 137,175 | | | | 239,855 | | | | 61,607 | |
| | | | | | | | | | |
| | | | | | | | | | | | | |
| | | As of December 31, 2009 | |
| | | | | | | Unpaid | | | | |
| | | Recorded | | | Principal | | | Related | |
| | | Investment | | | Balance | | | Allowance | |
With no related allowance recorded: | | | | | | | | | | | | |
Commercial | | | | | | | | | | | | |
| Impaired Loans | | | 39,052 | | | | 4,632 | | | | — | |
| | | | | | | | | | | | | |
With an allowance recorded: | | | | | | | | | | | | |
Commercial | | | | | | | | | | | | |
| Impaired Loans | | | 247,204 | | | | 149,342 | | | | 64,777 | |
| | | | | | | | | | |
Total | | | 286,256 | | | | 153,974 | | | | 64,777 | |
| | | | | | | | | | |
The average recorded investments for impaired loans were Ps. 184,855 and Ps. 185,270 for the years ended December 31, 2010 and 2009, respectively.
The interest income recognized on impairment loans amounted to Ps. 3,451, Ps. 1,667 and Ps. 831 for the years ended December 31, 2010, 2009 and 2008, respectively.
d. Non-accrual Loans
Non-Accrual loans are defined as those loans in the categories of: (a) Consumer portfolio: “Medium Risk”, “High Risk”, “Uncollectible”, and “Uncollectible Due to Technical Reasons”, and (b) Commercial portfolio: “With problems”, “High Risk of Insolvency”, “Uncollectible”, and “Uncollectible Due to Technical Reasons”.
F-71
Grupo Financiero Galicia S.A. and Subsidiaries
Notes to the Consolidated Financial Statements
For the years ended December 31, 2010, 2009 and 2008
(Expressed in thousands of Argentine pesos)
The following table represents the amounts of nonaccruals, segregated by class of loans, as of December 31, 2010 and 2009, respectively:
| | | | | | | | | |
| | | As of December 31, | |
| | | 2010 | | | 2009 | |
Consumer | | | | | | | | |
| Advances | | | 26,586 | | | | 23,599 | |
| Promissory Notes | | | 25,030 | | | | 18,201 | |
| Mortgage Loans | | | 7,638 | | | | 7,601 | |
| Personal Loans | | | 169,018 | | | | 73,178 | |
| Credit Card Loans | | | 221,786 | | | | 280,111 | |
| Other Loans | | | 12,469 | | | | 8,700 | |
| | | | | | | |
Total Consumer | | | 462,527 | | | | 411,390 | |
| | | | | | | |
Commercial | | | | | | | | |
| Performing Loans | | | — | | | | — | |
| Impaired Loans | | | 135,710 | | | | 274,024 | |
| | | | | | | |
Total Commercial | | | 135,710 | | | | 274,024 | |
| | | | | | | |
| | | | | | | | | |
Total Non accrual loans | | | 598,237 | | | | 685,414 | |
| | | | | | | |
An aging analysis of past due loans, segregated by class of loans, as of December 31, 2010 and 2009 were as follows:
| | | | | | | | | | | | | | | | | | | | | | | | | | | | | |
| | | As of December 31, 2010 | |
| | | 30-90 | | | 91-180 | | | 181-360 | | | | | | | | | | | | | | |
| | | Days Past | | | Days Past | | | Days Past | | | Greater | | | Total Past | | | | | | | Total | |
| | | Due | | | Due | | | Due | | | than 360 | | | Due | | | Current | | | Financing | |
Consumer | | | | | | | | | | | | | | | | | | | | | | | | | | | | |
| Advances | | | 7,124 | | | | 7,879 | | | | 10,705 | | | | 8,002 | | | | 33,710 | | | | 203,599 | | | | 237,309 | |
| Promissory Notes | | | 3,572 | | | | 5,695 | | | | 9,949 | | | | 9,386 | | | | 28,602 | | | | 789,459 | | | | 818,061 | |
| Mortgage Loans | | | 5,489 | | | | 2,585 | | | | 1,222 | | | | 3,831 | | | | 13,127 | | | | 469,721 | | | | 482,848 | |
| Personal Loans | | | 91,978 | | | | 63,211 | | | | 86,722 | | | | 19,085 | | | | 260,996 | | | | 3,757,871 | | | | 4,018,867 | |
| Credit Cards Loans | | | 137,370 | | | | 88,265 | | | | 115,653 | | | | 17,868 | | | | 359,156 | | | | 7,994,885 | | | | 8,354,041 | |
| Other Loans | | | 3,272 | | | | 5,018 | | | | 3,021 | | | | 4,430 | | | | 15,741 | | | | 196,323 | | | | 212,064 | |
| | | | | | | | | | | | | | | | | | | | | | |
Total Consumer Loans | | | 248,805 | | | | 172,653 | | | | 227,272 | | | | 62,602 | | | | 711,332 | | | | 13,411,858 | | | | 14,123,190 | |
| | | | | | | | | | | | | | | | | | | | | | | | | | | | | |
Commercial: | | | | | | | | | | | | | | | | | | | | | | | | | | | | |
| Performing Loans | | | — | | | | — | | | | — | | | | — | | | | — | | | | 9,291,751 | | | | 9,291,751 | |
| Impaired loans | | | — | | | | — | | | | 16,872 | | | | 112,996 | | | | 129,868 | | | | 7,307 | | | | 137,175 | |
| | | | | | | | | | | | | | | | | | | | | | |
Total Commercial Loans | | | — | | | | — | | | | 16,872 | | | | 112,996 | | | | 129,868 | | | | 9,299,058 | | | | 9,428,926 | |
| | | | | | | | | | | | | | | | | | | | | | |
Total | | | 248,805 | | | | 172,653 | | | | 244,144 | | | | 175,598 | | | | 841,200 | | | | 22,710,916 | | | | 23,552,116 | |
| | | | | | | | | | | | | | | | | | | | | | |
F-72
Grupo Financiero Galicia S.A. and Subsidiaries
Notes to the Consolidated Financial Statements
For the years ended December 31, 2010, 2009 and 2008
(Expressed in thousands of Argentine pesos)
| | | | | | | | | | | | | | | | | | | | | | | | | | | | | |
| | | As of December 31, 2009 | |
| | | 30-90 | | | 91-180 | | | 181-360 | | | | | | | | | | | | | | |
| | | Days Past | | | Days Past | | | Days Past | | | Greater | | | Total Past | | | | | | | Total | |
| | | Due | | | Due | | | Due | | | than 360 | | | Due | | | Current | | | Financing | |
Consumer | | | | | | | | | | | | | | | | | | | | | | | | | | | | |
| Advances | | | 3,860 | | | | 6,419 | | | | 10,885 | | | | 6,295 | | | | 27,459 | | | | 166,520 | | | | 193,979 | |
| Promissory Notes | | | 5,524 | | | | 5,622 | | | | 8,226 | | | | 4,353 | | | | 23,725 | | | | 706,986 | | | | 730,711 | |
| Mortgage Loans | | | 6,643 | | | | 1,825 | | | | 1,310 | | | | 4,466 | | | | 14,244 | | | | 463,356 | | | | 477,600 | |
| Personal Loans | | | 28,439 | | | | 19,170 | | | | 38,564 | | | | 15,445 | | | | 101,618 | | | | 1,725,125 | | | | 1,826,743 | |
| Credit Cards Loans | | | 112,350 | | | | 86,491 | | | | 158,200 | | | | 35,420 | | | | 392,461 | | | | 5,110,849 | | | | 5,503,310 | |
| Other Loans | | | 2,901 | | | | 2,343 | | | | 2,882 | | | | 3,474 | | | | 11,600 | | | | 155,934 | | | | 167,534 | |
| | | | | | | | | | | | | | | | | | | | | | |
Total Consumer Loans | | | 159,717 | | | | 121,870 | | | | 220,067 | | | | 69,453 | | | | 571,107 | | | | 8,328,770 | | | | 8,899,877 | |
| | | | | | | | | | | | | | | | | | | | | | | | | | | | | |
Commercial: | | | | | | | | | | | | | | | | | | | | | | | | | | | | |
| Performing Loans | | | — | | | | — | | | | — | | | | — | | | | — | | | | 6,687,669 | | | | 6,687,669 | |
| Impaired loans | | | | | | | | | | | 103,888 | | | | 140,687 | | | | 244,575 | | | | 41,681 | | | | 286,256 | |
| | | | | | | | | | | | | | | | | | | | | | |
Total Commercial Loans | | | — | | | | — | | | | 103,888 | | | | 140,687 | | | | 244,575 | | | | 6,729,350 | | | | 6,973,925 | |
| | | | | | | | | | | | | | | | | | | | | | |
Total | | | 159,717 | | | | 121,870 | | | | 323,955 | | | | 210,140 | | | | 815,682 | | | | 15,058,120 | | | | 15,873,802 | |
| | | | | | | | | | | | | | | | | | | | | | |
Financial receivables that are past due 90 days or more do not accrue interests.
e. Credit Quality Indicators
The following tables contain the loan portfolio classification by credit quality indicator set forth by the Argentine Central Bank.
Commercial Portfolio:
| | | |
| Loan Classification | | Description |
| 1. Normal Situation | | The debtor is widely able to meet its financial obligations, demonstrating significant cash flows, a liquid financial situation, an adequate financial structure, a timely payment record, competent management, available information in a timely, accurate manner and satisfactory internal controls. The debtor is in the upper 50% of a sector of activity that is operating properly and has good prospects. |
| | | |
| 2. With Special Follow-up | | Cash flow analysis reflects that the debt may be repaid even though it is possible that the customer’s future payment ability may deteriorate without a proper follow-up. |
| | | |
| | | This category is divided into two subcategories: |
| | | |
| | | (2.a). Under Observation; |
| | | |
| | | (2.b). Under Negotiation or Refinancing Agreements. |
| | | |
| 3. With Problems | | Cash flow analysis evidences problems to repay the debt, and therefore, if these problems are not solved, there may be some losses. |
| | | |
| 4. High Risk of Insolvency | | Cash flow analysis evidences that repayment of the full debt is highly unlikely. |
| | | |
| 5. Uncollectible | | The amounts in this category are deemed total losses. Even though these assets may be recovered under certain future circumstances, inability to make payments is evident at the date of the analysis. It includes loans to insolvent or bankrupt borrowers. |
Credit quality indicators for the commercial portfolio are reviewed, at a minimum, on a annual basis.
F-73
Grupo Financiero Galicia S.A. and Subsidiaries
Notes to the Consolidated Financial Statements
For the years ended December 31, 2010, 2009 and 2008
(Expressed in thousands of Argentine pesos)
Consumer Portfolio:
| | | |
| Loan Classification | | Description |
| 1. Normal Situation | | Loans with timely repayment or arrears not exceeding 31 days, both of principal and interest. |
| | | |
| 2. Low Risk | | Occasional late payments, with a payment in arrears of more than 32 days and up to 90 days. A customer classified as “Normal” having been refinanced may be recategorized within this category, as long as he amortizes one principal installment (whether monthly or bimonthly) or repays 5% of principal. |
| | | |
| 3. Medium Risk | | Some inability to make payments, with arrears of more than 91 days and up to 180 days. A customer classified as “Low Risk” having been refinanced may be recategorized within this category, as long as he amortizes two principal installments (whether monthly or bimonthly) or repays 5% of principal. |
| | | |
| 4. High Risk | | Judicial proceedings demanding payment have been initiated or arrears of more than 180 days and up to one year. A customer classified as “Medium Risk” having been refinanced may be recategorized within this category, as long as he amortizes three principal installments (whether monthly or bimonthly) or repays 10% of principal. |
| | | |
| 5. Uncollectible | | Loans to insolvent or bankrupt borrowers, or subject to judicial proceedings, with little or no possibility of collection, or with arrears in excess of one year. |
Credit quality indicators for the consumer portfolio are reviewed on a monthly basis.
The following table shows the loan balances categorized by credit quality indicators for the years ended December 31, 2010 and 2009:
| | | | | | | | | | | | | | | | | | | | | | | | | |
| | | As of December 31, 2010 | |
| | | “1” | | | “2” | | | “3” | | | “4” | | | “5” | | | | |
| | | | | | | With special | | | | | | | High risk of | | | | | | | |
| | | Normal | | | follow-up or | | | With problems | | | insolvency or | | | | | | | |
| | | Situation | | | Low Risk | | | or Medium Risk | | | High risk | | | Uncollectible | | | Total | |
Consumer | | | | | | | | | | | | | | | | | | | | | | | | |
| Advances | | | 203,599 | | | | 7,124 | | | | 7,879 | | | | 10,705 | | | | 8,002 | | | | 237,309 | |
| Promissory Notes | | | 789,459 | | | | 3,572 | | | | 5,695 | | | | 9,949 | | | | 9,386 | | | | 818,061 | |
| Mortgage Loans | | | 469,721 | | | | 5,489 | | | | 2,585 | | | | 1,222 | | | | 3,831 | | | | 482,848 | |
| Personal Loans | | | 3,757,871 | | | | 91,978 | | | | 63,211 | | | | 86,722 | | | | 19,085 | | | | 4,018,867 | |
| Credit Cards Loans | | | 7,994,885 | | | | 137,370 | | | | 88,265 | | | | 115,653 | | | | 17,868 | | | | 8,354,041 | |
| Other Loans | | | 196,323 | | | | 3,272 | | | | 5,018 | | | | 3,021 | | | | 4,430 | | | | 212,064 | |
| | | | | | | | | | | | | | | | | | | |
Total Consumer Loans | | | 13,411,858 | | | | 248,805 | | | | 172,653 | | | | 227,272 | | | | 62,602 | | | | 14,123,190 | |
| | | | | | | | | | | | | | | | | | | | | | | | | |
Commercial: | | | | | | | | | | | | | | | | | | | | | | | | |
| Performing loans | | | 9,204,218 | | | | 87,533 | | | | — | | | | — | | | | — | | | | 9,291,751 | |
| Impaired loans | | | — | | | | 1,465 | | | | 53,299 | | | | 78,230 | | | | 4,181 | | | | 137,175 | |
| | | | | | | | | | | | | | | | | | | |
Total Commercial Loans | | | 9,204,218 | | | | 88,998 | | | | 53,299 | | | | 78,230 | | | | 4,181 | | | | 9,428,926 | |
| | | | | | | | | | | | | | | | | | | |
Total Financing Receivables | | | 22,616,076 | | | | 337,803 | | | | 225,952 | | | | 305,502 | | | | 66,783 | | | | 23,552,116 | |
| | | | | | | | | | | | | | | | | | | |
F-74
Grupo Financiero Galicia S.A. and Subsidiaries
Notes to the Consolidated Financial Statements
For the years ended December 31, 2010, 2009 and 2008
(Expressed in thousands of Argentine pesos)
| | | | | | | | | | | | | | | | | | | | | | | | | |
| | | As of December 31, 2009 | |
| | | “1” | | | “2” | | | “3” | | | “4” | | | “5” | | | | |
| | | | | | | With special | | | | | | | High risk of | | | | | | | |
| | | Normal | | | follow-up or | | | With problems | | | insolvency or | | | | | | | |
| | | Situation | | | Low Risk | | | or Medium Risk | | | High risk | | | Uncollectible | | | Total | |
Consumer | | | | | | | | | | | | | | | | | | | | | | | | |
| Advances | | | 166,520 | | | | 3,860 | | | | 6,419 | | | | 10,885 | | | | 6,295 | | | | 193,979 | |
| Promissory Notes | | | 706,986 | | | | 5,524 | | | | 5,622 | | | | 8,226 | | | | 4,353 | | | | 730,711 | |
| Mortgage Loans | | | 463,356 | | | | 6,643 | | | | 1,825 | | | | 1,310 | | | | 4,466 | | | | 477,600 | |
| Personal Loans | | | 1,725,125 | | | | 28,439 | | | | 19,170 | | | | 38,564 | | | | 15,445 | | | | 1,826,743 | |
| Credit Cards Loans | | | 5,110,849 | | | | 112,350 | | | | 86,491 | | | | 158,200 | | | | 35,420 | | | | 5,503,310 | |
| Other Loans | | | 155,934 | | | | 2,901 | | | | 2,343 | | | | 2,882 | | | | 3,474 | | | | 167,534 | |
| | | | | | | | | | | | | | | | | | | |
Total Consumer Loans | | | 8,328,770 | | | | 159,717 | | | | 121,870 | | | | 220,067 | | | | 69,453 | | | | 8,899,877 | |
| | | | | | | | | | | | | | | | | | | | | | | | | |
Commercial: | | | | | | | | | | | | | | | | | | | | | | | | |
| Performing loans | | | 6,568,822 | | | | 118,847 | | | | — | | | | — | | | | — | | | | 6,687,669 | |
| Impaired loans | | | 6,250 | | | | 5,982 | | | | 97,484 | | | | 170,515 | | | | 6,025 | | | | 286,256 | |
| | | | | | | | | | | | | | | | | | | |
Total Commercial Loans | | | 6,575,072 | | | | 124,829 | | | | 97,484 | | | | 170,515 | | | | 6,025 | | | | 6,973,925 | |
| | | | | | | | | | | | | | | | | | | |
Total Financing Receivables | | | 14,903,842 | | | | 284,546 | | | | 219,354 | | | | 390,582 | | | | 75,478 | | | | 15,873,802 | |
| | | | | | | | | | | | | | | | | | | |
As of December 31, 2010 and 2009, the total shareholders’ equity adjustment for loan impairment-private sector was as follows:
| | | | | | | | | | | | | |
| | | Argentine | | | | | | | |
| | | Banking GAAP | | | U.S. GAAP | | | Adjustment | |
| December 31, 2009 | | | 815,963 | | | | 752,292 | | | | 63,671 | |
| | | | | | | | | | | | | |
| Variances | | | 54,206 | | | | 52,394 | | | | 1,812 | |
| | | | | | | | | | |
| | | | | | | | | | | | | |
| December 31, 2010 | | Ps. | 870,169 | (*) | | Ps. | 804,686 | | | Ps. | 65,483 | |
| | | | | | | | | | |
| | | |
| (*) | | The balance does not include Ps. 185,381 of CFA allowances for loan losses as of the acquisition date. |
F-75
Grupo Financiero Galicia S.A. and Subsidiaries
Notes to the Consolidated Financial Statements
For the years ended December 31, 2010, 2009 and 2008
(Expressed in thousands of Argentine pesos)
e. Government securities and other investments
(i) Compensatory and Hedge bonds received and Hedge Bonds in connection with the compensation for foreign currency position and compensatory bonds received and to be received in connection with the compensation for “asymmetric pesification”.
Argentine Central Bank Communiqué “A” 3650 established the regulations necessary to implement the provisions of Decree No.905/02 in connection with the compensation of the negative effects of the conversion into pesos at different exchange rates of financial institutions’ assets and liabilities and the resulting foreign currency mismatches left in their respective balance sheets.
In order to acquire the Hedge Bond, the Bank enters into an advance with the Argentine Central Bank, with interest payable at CER plus 2%. In the case of the Hedge Bond and the related financing to be obtained from the Argentine Central Bank, the transaction to acquire the Hedge Bond was retroactive to February 3, 2002. The Bank could withdraw its request to acquire the Hedge Bond prior to approval of the Argentine Central Bank and prior to the execution of the transaction.
Under U.S. GAAP, the activity of the compensation bonds has been reflected in the income statement considering that the compensation bonds were adjusted to its market value. The activity includes (1) the effect of the exchange rate between the Argentine pesos and the U.S. dollars for the compensation bonds to be received, (2) the cancellation of certain amounts related to the disputes with the Central Bank and (3) the payments made in satisfaction to the deposits held in Uruguay, and foreign debt restructuring.
Under Argentine Banking GAAP, as of December 31, 2009 and 2008 these Bonds have been valued at their “technical value” (face value plus accrued interest and less principal amortization according to the contractual terms of the instrument). The same criterion was applied to holdings of such bonds used in repo transactions recorded under “Other Receivables Resulting from Financial Brokerage” and “Miscellaneous Receivables”.
As of December 31, 2008 and 2009, the Compensatory and Hedge Bond were considered available for sale securities for U.S. GAAP purposes and recorded at fair value with unrealized gains or losses related to changes in prices, recognized as a charge or credit to equity through other comprehensive income.
As of December 31, 2008, the amortized cost exceeded the fair value of these securities by Ps. 711,064. For U.S. GAAP purposes, the Group has recorded an other-than-temporary impairment of these securities, based on a variety of factors, including the length of time and extent to which the market value has been less than cost, and the Group’s intent and ability to hold these securities to recovery. The fair value of these securities was determined on the balance sheet date, based on their quoted market price, and constitutes the new cost basis for this investment.
During the year ended December 31, 2010, all compensatory and hedge bonds were sold. Therefore, the 2010 U.S. GAAP net income reconciliation includes the reversal of the 2009 shareholders’ equity adjustment of Ps. 175,818 plus Ps. 830,119 of gains previously recorded through other comprehensive income that are being realized and reversed through the income statement.
| | | | | | | | | | | | | | | | | | | | | | | | | | | | | | | | | | | | | | | | | |
| | | 2010 | | | 2009 | |
| | | | | | | Book | | | | | | | | | | | | | | | | | | | Book | | | | | | | | | | |
| | | | | | | Value | | | Fair value - | | | | | | | | | | | | | | | Value | | | Fair value - | | | | | | | |
| | | Amortized | | | Argentine | | | Book value | | | | | | | Shareholders’ | | | Amortized | | | Argentine | | | Book value | | | Unrealized | | | Shareholders’ | |
| | | Cost U.S. | | | Banking | | | under U.S. | | | Unrealized | | | equity | | | Cost U.S. | | | Banking | | | under U.S. | | | (Loss)/ | | | equity | |
| | | GAAP | | | GAAP | | | GAAP | | | (Loss)/Gain | | | adjustment | | | GAAP | | | GAAP | | | GAAP | | | Gain | | | adjustment | |
| | | (In thousands of Ps.) | |
| BODEN 2012 Bonds | | | — | | | | — | | | | — | | | | — | | | | — | | | | 900,970 | | | | 1,906,907 | | | | 1,731,089 | | | | 830,119 | | | | (175,818 | ) |
F-76
Grupo Financiero Galicia S.A. and Subsidiaries
Notes to the Consolidated Financial Statements
For the years ended December 31, 2010, 2009 and 2008
(Expressed in thousands of Argentine pesos)
(ii) External Notes / Discount Bonds and GDP-Linked Negotiable Securities
In January 2006, the Bank accepted the offer to exchange its External Notes, for “Discount Bonds in Pesos” and “GDP-Linked Negotiable Securities” issued under Argentine debt restructuring. The Bank received the new instrument for an original principal amount equal to 33.7% for the External Notes carrying value as of December 31, 2004.
Under Argentine Banking GAAP, the Discount Bonds and GDP — Linked Negotiable Securities have been recorded at the lower of the total future nominal cash payments up to maturity, specified by the terms and conditions of the new securities, and the carrying value of the securities tendered as of March 17, 2005, equivalent to the present value of the Bogar Bonds’ cash flows at that date.
Under Argentine Banking GAAP, as of December 31, 2009, the securities were recorded at the lowest of the total future nominal cash payments up to maturity, specified by the terms and conditions of the new securities and the carrying value of the securities tendered as of March 17, 2005. Said amount was net of charged financial services.
As of December 31, 2008 and 2009, the Discount Bonds were considered available for sale securities for U.S. GAAP purposes and recorded at fair value with the unrealized gains or losses recognized as a charge or credit to equity through other comprehensive income.
As of December 31, 2008, the amortized cost exceeded the fair value of these securities by Ps.135,749. For U.S. GAAP purposes, the Group has recorded an other-than-temporary impairment of these securities for such amount, based on a variety of factors, including the length of time and extent to which the market value has been less than cost, and the Group’s intent and ability to hold these securities to recovery.
The fair value of these securities was determined on the balance sheet date, based on their quoted market price, and constitutes the new cost basis for this investment.
The GDP-linked Negotiable Securities are considered a freestanding derivative financial instrument under ASC 815 and carried at fair value with unrealized gains or losses recognized in the income statement.
During the year ended December 31, 2010, the Discount Bonds and GDP-Linked Negotiable Securities were sold. Therefore, the 2010 U.S. GAAP net income reconciliation includes the reversal of the 2009 shareholders’ equity adjustment of Ps. 284,111 plus Ps. 132,209 of gains previously recorded through other comprehensive income that are being realized and reversed through the income statement.
| | | | | | | | | | | | | | | | | | | | | | | | | | | | | | | | | | | | | | | | | |
| | | 2010 | | | 2009 | |
| | | | | | | Book | | | | | | | | | | | | | | | | | | | Book | | | | | | | | | | | |
| | | | | | | Value | | | Fair value - | | | | | | | | | | | | | | | Value | | | Fair value - | | | | | | | | |
| | | Amortized | | | Argentine | | | Book value | | | | | | | Shareholders’ | | | Amortized | | | Argentine | | | Book value | | | | | | | Shareholders’ | |
| | | Cost U.S. | | | Banking | | | under U.S. | | | Unrealized | | | equity | | | Cost U.S. | | | Banking | | | under U.S. | | | Unrealized | | | equity | |
| | | GAAP | | | GAAP | | | GAAP | | | (Loss)/Gain | | | Adjustment | | | GAAP | | | GAAP | | | GAAP | | | (Loss)/Gain | | | Adjustment | |
| | | (In thousands of Ps.) | |
| Discount Bonds | | | — | | | | — | | | | — | | | | — | | | | — | | | | 169,915 | | | | 598,601 | | | | 302,124 | | | | 132,209 | | | | (296,477 | ) |
| GDP linked Bonds | | | — | | | | — | | | | — | | | | — | | | | — | | | | — | | | | 23,382 | | | | 35,748 | | | | — | | | | 12,366 | |
F-77
Grupo Financiero Galicia S.A. and Subsidiaries
Notes to the Consolidated Financial Statements
For the years ended December 31, 2010, 2009 and 2008
(Expressed in thousands of Argentine pesos)
(iii) Bonar 2015 Bonds
The Bank exchanged National Government Bonds in Pesos at 2% due 2014 (Boden 2014 Bonds) with a face value of Ps.683,647 (recorded in the Bank’s Shareholders equity in February 2009 within the scope of an exchange transaction of National Secured Loans at market price) for Bonar 2015 Bonds with a face value of Ps.912,669.
Under Argentine Banking GAAP, the bonds related to public debt instruments subscribed, were stated in the Shareholders’ Equity at the value these exchanged securities had been recorded.
In accordance with U.S. GAAP, specifically ASC 310-20, satisfaction of one monetary asset by the receipt of another monetary asset for the creditor is generally based on the market value of the asset received in satisfaction of the debt (an extinguishment). In this particular case, the securities being received are substantially different in structure and in interest rates than the debt securities swapped. Therefore, such amounts should initially be recognized at their fair value. The estimated fair value of the securities received will constitute the cost basis of the asset. Any difference between the old asset and the fair value of the new asset is recognized as a gain or loss.
As of December 31, 2009 and 2010, the bonds have been recorded at their acquisition cost increased according to the accrual of their internal rate of return (IRR) under Argentine Banking GAAP.
Under U.S. GAAP, the BONAR 2015 bonds were considered as available for sale securities and recorded at fair value with the unrealized gains or losses recognized as a charge or credit to equity through other comprehensive income.
During the year ended December 31, 2010, the Group sold Ps.119 millions (face value) of Bonar 2015 Bonds, and therefore recognized a gain of Ps.14,219 previously recorded through other comprehensive income under U.S. GAAP.
| | | | | | | | | | | | | | | | | | | | | | | | | | | | | | | | | | | | | | | | | |
| | | 2010 | | | 2009 | |
| | | | | | | Book | | | | | | | | | | | | | | | | | | | Book | | | | | | | | | | | |
| | | | | | | Value | | | Fair Value — | | | | | | | | | | | | | | | Value | | | Fair Value — | | | | | | | | |
| | | Amortized | | | Argentine | | | Book value | | | | | | | Shareholders’ | | | Amortized | | | Argentine | | | Book value | | | | | | | Shareholders’ | |
| | | Cost U.S. | | | Banking | | | under U.S. | | | Unrealized | | | equity | | | Cost U.S. | | | Banking | | | under U.S. | | | Unrealized | | | equity | |
| | | GAAP | | | GAAP | | | GAAP | | | (Loss)/Gain | | | Adjustment | | | GAAP | | | GAAP | | | GAAP | | | (Loss)/Gain | | | Adjustment | |
| | | (In thousands of Ps.) | |
| Bonar 2015 Bonds | | | 527,950 | | | | 642,147 | | | | 726,643 | | | | 198,693 | | | | 84,496 | | | | 591,548 | | | | 358,984 | | | | 676,580 | | | | 85,032 | | | | 317,596 | |
| | | |
| (*) | | Under Argentine banking GAAP, Bonar 2015 are recorded in the captions “investment securities”, “other receivable from financial brokerage” and “miscellaneous assets”. |
(iv) Other investments
The following table summarizes the U.S. GAAP adjustment related to other investments, as of December 31, 2010 and 2009:
| | | | | | | | | | | | | | | | | | | | | | | | | |
| | | 2010 | | | 2009 | |
| | | | | | | Fair Value — | | | | | | | | | | | Fair Value — | | | | |
| | | Book Value | | | Book value | | | Shareholders’s | | | Book Value | | | Book value | | | Shareholders’s | |
| | | Argentine | | | under U.S. | | | Equity | | | Argentine | | | under U.S. | | | Equity | |
| | | Banking GAAP | | | GAAP | | | Adjustment | | | Banking GAAP | | | GAAP | | | Adjustment | |
| | | (in thousands of Ps,) | |
| | | | | | | | | | | | | | | | | | | | | | | | | |
| Nues Trust | | | — | | | | — | | | | — | | | | 59,909 | | | | 75,483 | | | | 15,574 | |
| Almafuerte Trust | | | 169,890 | | | | 166,723 | | | | (3,167 | ) | | | 373,313 | | | | 335,219 | | | | (38,094 | ) |
| Securities issued by BCRA | | | 2,411,393 | | | | 2,405,585 | | | | (5,808 | ) | | | 1,953,676 | | | | 1,953,827 | | | | 151 | |
| | | | | | | | | | | | | | | | | | | |
| Total | | | 2,581,283 | | | | 2,572,308 | | | | (8,975 | ) | | | 2,386,898 | | | | 2,364,529 | | | | (22,369 | ) |
| | | | | | | | | | | | | | | | | | | |
F-78
Grupo Financiero Galicia S.A. and Subsidiaries
Notes to the Consolidated Financial Statements
For the years ended December 31, 2010, 2009 and 2008
(Expressed in thousands of Argentine pesos)
Nues Trust and Almafuerte Special Fund
Under Argentine Banking GAAP, the certificate of participation of Nues Trust and Almafuerte Special Fund were accounted at the equity method.
Under U.S. GAAP, theses certificates of participation were classified as available-for-sale securities, and therefore, recognized at fair value with changes in other comprehensive income.
As of December 31, 2010 and 2009, and for U.S. GAAP purposes, the Group has determined that unrealized losses / gains on these investments are temporary in nature based on its ability and intent to hold the investment for a period of time sufficient to allow for any anticipated recovery and the results of its review conducted to identify and evaluate investments that have indications of possible impairments.
Furthermore, under U.S. GAAP the Group has recorded an other-than-temporary impairment for an amount of Ps.110,715 for the year ended December 31, 2008, related to the certificate of participation in the mentioned funds, based on a variety of factors, mostly including the length of time and extent to which the market value has been less than cost and the weakening of the global and local markets condition in which the Group operates, with no immediate prospect of recovery.
On July 6, 2010, the outstanding balance of the certificate of participation of Nues Trust was fully paid.
Securities issued by BCRA
As of December 31, 2009 certain securities issued by the Argentine Central Bank were classified under Argentine Banking GAAP as Holdings in Special Investment Account and were recorded at their cost plus accrued interest determined on an exponentially basis according to their internal rate of return (IRR). Under U.S. GAAP, these securities were classified as available-for-sale and accounted for at its fair value with changes in the other comprehensive income. During the fiscal year ended December 31, 2010 these securities were sold.
As of December 31, 2010 under Argentine Banking GAAP the Group acquired securities issued by the Argentine Central Bank, which were classified under the caption “Securities issued by the Argentine Central Bank”, and recorded at their cost plus accrued interest determined on an exponentially basis according to their internal rate of return (IRR). For U.S. GAAP purposes, these securities were classified as trading and accounted for at its fair value with changes recorded in the income statement.
f. Items in process of collection
The Bank does not give accounting recognition to checks drawn on the Bank or other banks, or other items to be collected until such time as the related item clears or is accepted. Such items are recorded by the Bank in memorandum accounts. U.S. banks, however, account for such items through balance sheet clearing accounts at the time the items are presented to the Bank.
Grupo Galicia’s assets and liabilities would be increased by approximately Ps.4,524,520, Ps.3,099,320 and Ps.2,131,485 applying U.S. GAAP at December 31, 2010, 2009 and 2008, respectively.
g. Compensation related to the payment of deposits
Financial institutions have requested the Government for compensation for the losses generated from the payment of deposits pursuant to judicial orders at the free market exchange rate, which was higher than that established by the government for conversion into pesos of the financial institutions’ assets and liabilities.
F-79
Grupo Financiero Galicia S.A. and Subsidiaries
Notes to the Consolidated Financial Statements
For the years ended December 31, 2010, 2009 and 2008
(Expressed in thousands of Argentine pesos)
Through Communiqué “A” 3916, the Argentine Central Bank allowed the recording of an intangible asset for the difference between the amount paid by financial institutions pursuant to judicial orders and the amount resulting from the conversion into pesos of the dollar balance of the deposits reimbursed at the Ps.1.40 per U.S. dollar exchange rate (adjusted by CER and interest accrued until the date of the reimbursement). The corresponding amount must be amortized over 60 months beginning April 2003. As of December 31, 2009, the amount recorded under “Intangible Assets”, net of accumulated amortization, was Ps.259,053. During the fiscal year ended December 31, 2010, these amounts were totally amortized.
As of the date of preparation of these financial statements, the Supreme Court neither the National Government has not taken any measures to compensate for these issues.
Under U.S. GAAP, the right to obtain this compensation is not considered an asset. Therefore, the U.S. GAAP adjustment reflects the reversal of the amount capitalized under Argentine Central Bank rules. As of December 31, 2010, the shareholders’ equity does not include any reconciliation item considering the total amortization of the assets, under Argentine Central Bank rules.
h. Securitizations
The following table summarizes the adjustment for U.S. GAAP purposes related to securitization transactions as of December 31, 2010 and 2009:
| | | | | | | | | | | | | | | | | | | | | | | | | |
| | | 2010 | | | 2009 | |
| | | Book Value | | | Fair Value — | | | U.S. GAAP | | | Book Value | | | Fair Value — | | | U.S. GAAP | |
| | | Argentine | | | Book value | | | Shareholders’s | | | Argentine | | | Book value | | | Shareholders’s | |
| | | Banking | | | under U.S. | | | Equity | | | Banking | | | under U.S. | | | Equity | |
| | | GAAP | | | GAAP | | | Adjustment | | | GAAP | | | GAAP | | | Adjustment | |
| | | (in thousands of Ps,) | |
| Galtrust I (1) | | | 521,862 | | | | 521,862 | | | | — | | | | 584,111 | | | | 211,647 | | | | (372,464 | ) |
| Financial Trust Galicia (2) | | | 96,364 | | | | 36,241 | | | | (60,123 | ) | | | 79,990 | | | | 28,692 | | | | (51,298 | ) |
| Others | | | 13,491 | | | | 19,482 | | | | 5,991 | | | | 56,458 | | | | 50,940 | | | | (5,518 | ) |
| | | | | | | | | | | | | | | | | | | |
| Total | | | 631,717 | | | | 577,585 | | | | (54,132 | ) | | | 720,559 | | | | 291,279 | | | | (429,280 | ) |
| | | | | | | | | | | | | | | | | | | |
(1) Financial trust “Galtrust I”
The financial trust “Galtrust I” was created in October 2000 in connection with the securitization of provincial loans for a total amount of Ps.1,102 million. The securitized loans were from the portfolio of loans granted to provincial governments, guaranteed by the federal tax revenues shared with the provincial governments.
During 2002, the portfolio of loans included and the related retained interest in Galtrust I were subject to the pesification. As a result the retained interest in the trust was converted into pesos at an exchange rate of 1.40 to 1 and the interest rate for their debt securities changed to CER plus 10%. During 2003, Galtrust I had swapped its provincial loans for Bogar Bonds.
Under Argentine Banking GAAP, this transaction was accounted for as sales and the debt securities and certificates retained by the Bank are accounted for at cost plus accrued interest for the debt securities, and the equity method is used to account for the residual interest in the trust.
The retained interest in the trust was recorded under Argentine Central Bank rules in the “Other Receivables from Financial Brokerage”, and its balance as of December 31, 2010 and 2009, was Ps.521,863 and Ps.584,111, respectively.
As of December 31, 2010, under Argentine Banking GAAP, the Group recorded certain reserves to adjust the equity method used to account for the residual interest in the trust, at its fair value.
F-80
Grupo Financiero Galicia S.A. and Subsidiaries
Notes to the Consolidated Financial Statements
For the years ended December 31, 2010, 2009 and 2008
(Expressed in thousands of Argentine pesos)
December 31, 2009 and 2008
As of December 31, 2009 and 2008, the Bank considered this transaction as a sale under U.S. GAAP, in accordance with ASC 860. Galtrust I certificate of participation retained by the Group was considered as “available for sale securities” under U.S. GAAP and the unrealized gains on this security was reported as an adjustment to shareholders’ equity through Other Comprehensive Income.
The fair value of these securities was determined on the balance sheet date, based on an internal valuation technique estimating future cash flows for this certificate of participation, discount at a present value with a rate comparable with internal rates of return of other CER adjusted bonds. Such fair value constituted the new cost basis for this investment.
As of December 31, 2009, the Group has determined that unrealized losses on these investments are temporary in nature based on its ability and intent to hold the investment for a period of time sufficient to allow for any anticipated recovery and the results of its review conducted to identify and evaluate investments that have indications of possible impairments.
As of December 31, 2008 the Group has recorded an other-than-temporary impairment of these securities for an amount of Ps.357,697; based on a variety of factors, mostly including the length of time and extent to which the market value has been less than cost, and the weakening of the global and local markets condition in which the Group operates, with no immediate prospect of recovery.
December 31, 2010
Effective January 1, 2010, the Group implemented new accounting guidance provided by SFAS 166 and 167 (ASU 2009-16 and ASU 2009-17, respectively, under the new codification), which amend the accounting for transfers of financial assets and consolidation of variable interest entities (VIEs).
The new guidance eliminates the concept of qualified special purpose entities (“QSPEs”) that were previously exempt from consolidation and introduces a new framework for determining the primary beneficiary of a VIE. The primary beneficiary of a VIE is required to consolidate the assets and liabilities of the VIE. Therefore, the Group must evaluate all existing securitization trusts that formerly qualified as QSPEs to determine whether they must be consolidated in accordance with ASU 2009-17. An entity is considered a VIE if it possesses one of the following characteristics:
| | • | | Insufficient Equity Investment at Risk |
| | • | | Equity lacks decision-making rights |
| | • | | Equity with non-substantive voting rights |
| | • | | Lacking the obligation to Absorb an Entity’s Expected Losses |
| | • | | Lacking the right to receive an Entity’s expected residual returns |
Under the new guidance, the primary beneficiary is the party that has both (1) the power to direct the activities of an entity that most significantly impact the VIE’s economic performance; and (2) through its interests in the VIE, the obligation to absorb losses or the right to receive benefits from the VIE that could potentially be significant to the VIE.
To assess whether the Group has the power to direct the activities of a VIE that most significantly impact the VIE’s economic performance, the Group considers all facts and circumstances, including its role in establishing the VIE and its ongoing rights and responsibilities. This assessment includes, first, identifying the activities that most significantly impact the VIE’s economic performance; and second, identifying which party, if any, has power over those activities.
F-81
Grupo Financiero Galicia S.A. and Subsidiaries
Notes to the Consolidated Financial Statements
For the years ended December 31, 2010, 2009 and 2008
(Expressed in thousands of Argentine pesos)
Under ASC 810-10-65, the Group should measure the components of the newly consolidated financial trusts at their carrying amounts as of the adoption date. The Group must determine the amounts of the assets, liabilities, and non-controlling interests of the newly consolidated financial trusts, that would have been recorded in the Group’s financial statements as of January 1st 2010, as if ASU 2009-17 had been effective as of the date of the Group’s initial involvement with the financial trusts. Any difference between the net amount added (net assets of each financial trusts where the Group is primary beneficiary) from the Group’s balance sheet and the amount of any previously recognized retained interest is recognized as a cumulative-effect adjustment to retained earnings as of December 31, 2010.
For U.S. GAAP purposes, as of December 31, 2010 the trust, a formerly qualified QSPE, was considered a variable interest entity. In accordance with ASC 810, the Group was deemed to be the primary beneficiary of this trust and, therefore, the Bank reconsolidated the assets and liabilities of the mentioned trust. Upon consolidation, the Bogar Bonds were classified as available-for-sale securities and measured at fair value with changes recorded in other comprehensive income. Since the fair value of the residual interest in the trust recorded under Argentine Central Bank rules was determined based on the fair value of the Bogar Bonds, recorded as an assets in the trust, there is no difference in the measurement basis of the net assets held and recorded under Argentine Central Bank rules and the assets and liabilities recorded under U.S. GAAP. The only difference between both standards is that under U.S. GAAP, changes in the fair value of the Bogar Bonds are recorded in other comprehensive income, while under Argentine Banking GAAP, changes are recorded in the consolidated income statement.
(2) Financial Trust Galicia
Under this trust, National Government Promissory Notes in pesos at 2% due 2014 for Ps.108,000 were transferred and a Certificate of Participation and Debt Securities were received in exchange. Those National Government Promissory Notes were previously received in exchange of National Secured Loans held by the Group.
For Argentine Banking GAAP purposes, the debt securities and certificates retained by the Bank are accounted for at cost plus accrued interest for the debt securities, and the equity method is used to account for the residual interest in the trust. The cost of these securities was determined based on the book value of the Promissory Notes transferred.
This transfer was not considered a true sale for U.S. GAAP purposes, and therefore, it was recorded as a secured borrowing according with ASC 860. Therefore, the Bank recognized in its consolidated balance sheet, the Promissory Notes transferred to the financial trust.
Under U.S. GAAP, the Promissory notes were classified as loans recorded at amortized cost with the corresponding loan loss reserve, if applicable. The U.S. GAAP adjustment is related to the difference between the cost basis used under both standards. For Argentine Banking GAAP, the cost was determined based on the carrying value of National Secured Loans previously hold and exchange for the Promissory Notes, while under U.S. GAAP, the cost was determined based on the fair value of each National Secured Loans transferred in exchange of the Promissory Notes received.
BG Financial Trust
During 2005, the Group entered into a securitization transaction of commercial and consumer non-performing loans. For Argentine Banking GAAP, no assets are recognized as of December 31, 2010 and 2009 as all the debt securities and certificates of participations were subscribed by third parties. Under U.S. GAAP, this transaction was not considered a true sale and therefore it was recorded as a secured borrowing according with ASC 860.
F-82
Grupo Financiero Galicia S.A. and Subsidiaries
Notes to the Consolidated Financial Statements
For the years ended December 31, 2010, 2009 and 2008
(Expressed in thousands of Argentine pesos)
Additional information required by U.S. GAAP
The table below presents the aggregated assets and liabilities of the financial trusts which have been consolidated for U.S. GAAP purposes:
| | | | | | | | | |
| | | December 31, | | | December 31, | |
| | | 2010 | | | 2009 | |
| Cash and due from banks | | Ps. | 11,626 | | | Ps. | 15,220 | |
| Government securities | | | 1,009,154 | | | | — | |
| Loans (net of allowances) | | | — | | | | 463,742 | |
| Other assets | | | 1,149 | | | | 8,833 | |
| | | | | | | |
| Total Assets | | Ps. | 1,021,929 | | | Ps. | 487,795 | |
| | | | | | | |
| | | | | | | | | |
| Debt Securities | | Ps. | 414,510 | | | Ps. | 279,583 | |
| Certificates of Participation | | | 604,665 | | | | 193,321 | |
| Other liabilities | | | 2,754 | | | | 14,891 | |
| | | | | | | |
| Total Liabilities | | Ps. | 1,021,929 | | | Ps. | 487,795 | |
| | | | | | | |
The Group’s maximum loss exposure, which amounted to Ps. 1,021,929 and Ps. 487,795 as of December 31, 2010 and 2009, respectively is based on the unlikely events that all of the assets in the VIE’s become worthless and incorporates potential losses associated with assets recorded on the Group’s balance sheet.
| | • | | Other transfers of financial assets accounted for as sales under U.S. GAAP |
As of December 31, 2009 and 2008, the Bank has entered into different securitizations as described in Note 30 to these financial statements that were accounted for as sales under Argentine Banking GAAP. The transfers of financial assets related to the creation of certain trusts were considered sales for U.S. GAAP purposes under ASC 860 and for that reason debt securities and certificates retained by the Bank are considered to be “available for sale securities” under U.S. GAAP.
The retained interests were initially recorded at an amount equal to a portion of the previous aggregate carrying amount of assets sold and retained. The portion is determinate based on the relative fair values of the assets sold and assets retained as of the date of the transfer based on their allocated book value using the relative fair value allocation method.
Subsequently, the unrealized gains (losses) on these securities are reported as an adjustment to shareholder’s equity, unless unrealized losses are deemed to be other than temporary in accordance with ASC 325-40.
The fair value of these retained interests in the trusts is determined based upon an estimate of cash flows to be collected by the Group as holder of the retained interests, discounted at an estimated market rate and will constitute the new cost basis of these securities.
The U.S. GAAP shareholder’s equity adjustment for all the transfers of financial assets described above amounted to Ps.(5,380) and Ps.(19,567) as of December 31, 2009 and 2008, respectively.
Additionally, servicing assets and/or liabilities have been analyzed by the Group concluding that the benefits of servicing are not expected to be adequate compensation. As of December 31, 2009 and 2008, servicing liabilities of Ps.138 and Ps.1,375 has been recorded for U.S. GAAP purposes, respectively.
As of December 31, 2010 these financial trusts had been liquidated. Therefore, the 2010 U.S. GAAP net income reconciliation includes de reverse of the previous year’s adjustments.
There were no restrictions on assets reported by the entity in its statement of financial position related to any transferred financial asset.
F-83
Grupo Financiero Galicia S.A. and Subsidiaries
Notes to the Consolidated Financial Statements
For the years ended December 31, 2010, 2009 and 2008
(Expressed in thousands of Argentine pesos)
i. Acceptances
Under Argentine Banking GAAP, acceptances are accounted for in memorandum accounts. Under U.S. GAAP, third party liability for acceptances should be included in “Other Receivables Resulting from Financial Brokerage” representing Group customers’ liabilities on outstanding drafts or bills of exchange that have been accepted by the Group. Acceptances should be included in “Other Liabilities Resulting from Financial Brokerage” representing the Group’s liability to remit payment upon the presentation of the accepted drafts or bills of exchange.
The Group’s assets and liabilities would be increased by approximately Ps.111,744, Ps.58,904 and Ps.69,500, had U.S. GAAP been applied as of December 31, 2010, 2009 and 2008, respectively.
j. Impairment of real estate properties and foreclosed assets
Under Argentine Banking GAAP, real estate properties and foreclosed assets are carried at cost adjusted by depreciation over the life of the assets. In accordance with ASC 360-10 “Impairment of Long-lived Assets”, such assets are additionally subject to: recognition of an impairment loss if the carrying amounts of those assets are not recoverable from their undiscounted cash flows and an impairment loss measured as the difference between the carrying amount and fair value of the assets.
The Group evaluates potential impairment loss relating to long-lived assets by comparing their carrying amounts with the undiscounted future expected cash flows generated by the assets over the remaining life of the assets. If the sum of the expected future undiscounted cash flows is less than the carrying amount of the asset, a loss is recognized for the difference between the fair value and carrying value of the assets. Testing whether an asset is impaired and measuring the impairment loss is performed for asset groupings at the lowest level for which there are identifiable cash flows that are largely independent of the cash flows generated by other asset groups.
Long-lived assets are reviewed for impairment whenever events or changes in circumstances indicate that the carrying amount may not be recoverable. In 2002, the Group determined that the uncertainty of the Argentine economic situation had a significant impact on the recoverability of its long-live assets and evaluated its properties for impairment. An impairment loss was recorded in 2002.
Foreclosed assets are carried at the lower of cost and market. In 2002, the Group recorded a valuation allowance reflecting a decrease in the market values of its foreclosed properties.
In 2010 and 2009, no additional impairment was recorded in real estate properties and foreclosed assets. The Argentine Banking GAAP amortizations for 2010 and 2009 of the assets impaired in 2002 have been reversed for U.S. GAAP purposes.
k. Equity investments in other companies
Under Argentine Banking GAAP, the equity investments in companies where significant influence exists are accounted for under the equity method. The remaining investments have been accounted for under the cost method, taking their equity method value as a limit in book value.
In addition, for U.S. GAAP purposes, under ASC 320, the Group should determine if any factors are present that might indicate the fair value of the investment has been negatively impacted during the fiscal year. If it is determined that the fair value of an investment is less than the related company’s value, an impairment of the investment must be recognized.
F-84
Grupo Financiero Galicia S.A. and Subsidiaries
Notes to the Consolidated Financial Statements
For the years ended December 31, 2010, 2009 and 2008
(Expressed in thousands of Argentine pesos)
As of December 31, 2010 and 2009, the group concluded that the carrying amount of certain investments would not be recoverable and therefore an impairment loss was recorded for U.S. GAAP purposes.
l. Financial Guarantees
Exchange of deposits with the financial system II — Written Options.
Pursuant to the decree 1836/02 and the Argentine Central Bank Communiqué “A” 3828, the Bank entered into an exchange offer to exchange restructured deposit certificates (“CEDROS”) for Boden 2012 Bonds and Boden 2013 Bonds. The Boden Bonds offered to the holders of CEDROS are unsecured government bonds denominated in U.S. dollars. As a part of the restructuring, the Bank granted an option to sell coupons to the holders of restructured deposits certificates who had opted to receive Boden 2013 Bonds and Boden 2012 Bonds in exchange for their certificates.
The exercise price will be equal to that resulting from converting to pesos the face value of each coupon in U.S. dollars at a rate of Ps.1.40 per U.S. dollar adjusted by applying the CER, which arises from comparing the index at February 3, 2002 to that corresponding to the due date of the coupon. That value shall in no case exceed the principal and interest amounts in pesos resulting from applying the face value of the coupon in U.S. dollars at the buying exchange rate quoted by Banco de la Nación Argentina (Banco Nación) on the payment date of that coupon.
Under Argentine Banking GAAP, these options were recorded off-balance. For U.S. GAAP, these options are treated as derivatives, and therefore, the Bank recorded the fair value of such options in accordance with the requirements of ASC 815, with changes in fair value recorded though earnings. The fair value as of December 31, 2010 and 2009, of these options amounted to Ps.3,723 (liability) and Ps.3,997 (liability), respectively.
Other Financial Guarantees.
During 2010 and 2009, the Company entered into different agreements to guarantee lines of credit of selected customers amounting to Ps.443,207 and Ps.285,730, respectively. As of December 31, 2010 and 2009, guarantees granted by the Bank amounted to Ps.124,705 and Ps.112,899, respectively.
As of December 31, 2010 and 2009, the Group maintained the following guarantees:
| | | | | | | | | | | | | |
| | | 2010 | |
| | | | | | | Estimated | | | U.S. GAAP | |
| | | Maximum | | | Proceeds | | | Carrying | |
| | | Potential | | | From collateral | | | Amount - | |
| | | Payments (*) | | | Recourse | | | Liability | |
| Financial guarantees | | | 124,705 | | | | 6,822 | | | | 125 | |
| | | | | | | | | | |
| | | Ps. | 124,705 | | | Ps. | 6,822 | | | Ps. | 125 | |
| | | | | | | | | | |
| | | | | | | | | | | | | |
| | | 2009 | |
| | | | | | | Estimated | | | U.S. GAAP | |
| | | Maximum | | | Proceeds | | | Carrying | |
| | | Potential | | | From collateral | | | Amount - | |
| | | Payments (*) | | | Recourse | | | Liability | |
| Financial guarantees | | | 112,899 | | | | 3,719 | | | | 152 | |
| | | | | | | | | | |
| | | Ps. | 112,899 | | | Ps. | 3,719 | | | Ps | 152 | |
| | | | | | | | | | |
| | | |
| (*) | | The maximum potential payments represent a “worse-case scenario’’, and do not necessarily reflect expected results. Estimated proceeds from collateral and recourse represent the anticipated value of assets that could be liquidated or received from other parties to offset the Company’s payments under guarantees. |
F-85
Grupo Financiero Galicia S.A. and Subsidiaries
Notes to the Consolidated Financial Statements
For the years ended December 31, 2010, 2009 and 2008
(Expressed in thousands of Argentine pesos)
Under U.S. GAAP, effective January 1, 2003, the Bank adopted “Guarantor’s Accounting and Disclosures Requirements for Guarantees, including Indirect Guarantees of Indebtedness of Others”, ASC 460 Guarantees. As of December 31, 2010 and 2009, the Bank recognized a liability for the fair value of the obligations assumed at its inception. Such liabilities are being amortized over the expected term of the guarantee. As of December 31, 2010 and 2009, the fair value of the guarantees amounted to Ps.6,947 and Ps.3,870 respectively.
m. Non-controlling interest
In December 31, 2007, the FASB issued former SFAS 160 (ASC 810) which amend the accounting of non-controlling interests (formerly known as “minority interests”). For Grupo Financiero Galicia, it became effective for fiscal years beginning January 1, 2009. The Group gave it retroactive effect as of December 31, 2008, so as to compare them with the current consolidated financial statements.
Argentine Central Bank rules require to record noncontrolling interests as a component of the liabilities. ASC 810 requires to record such interests as shareholders’ equity. In addition, the U.S. GAAP adjustment represents the allocation to the non-controlling interest of non-wholly owned subsidiaries of certain U.S. GAAP adjustments related to such subsidiaries.
For U.S. GAAP purposes the shareholders’ equity as of December 31, 2008, was negative. Therefore, the effect of the U.S. GAAP adjustments related to the Non-controlling interest at that date, is recognized up to the amount reflected in Non-controlling interest for Argentine Banking GAAP as of December 31, 2008.
n. Foreign Debt Restructuring
On May 18, 2004, the Group completed the restructuring of its foreign debt. As a result of this restructuring, the Group recorded a Ps.142.5 million gain under Argentine Banking GAAP.
For U.S. GAAP purposes, the restructuring is accounted for in each of two steps. The first step of the restructuring required the holders of the Group’s debt to exchange its old debt for new debt in two tranches. Pursuant to “Determining Whether a Debtor’s Modification or Exchange of Debt Instruments is within the scope of ASC 470 (ASC 820), the Group did not receive any concession from the holders of the debt and therefore, the first step restructuring was not considered a trouble debt restructuring. Pursuant to “Debtors Accounting for a Modification or Exchange of Debt Instruments” ASC 470-50, the first step of the restructuring was accounted for as a modification of the old debt and therefore the Group did not recognize any gain or loss. The second step of the restructuring offers the holders of the Group’s debt issued in the first step explained above to exchange it for new securities including cash, Boden 2012 Bonds and equity shares of the Group. Pursuant to U.S. GAAP this second step, the restructuring was accounted for in accordance with “Accounting by Debtors and Creditors for Trouble Debt Restructurings” ASC 310-40, as a partial settlement of the debt through the transfer of certain assets and equity at its fair value. After deducting the considerations used to repay the debt, ASC 310-40 requires the comparison of the future cash outflows of the restructured debt and the carrying of the debt at the restructuring date.
Gain on troubled debt restructuring is only recognized when the remaining carrying value of the debt at the date of the restructuring exceeds the total future cash payments of the restructured debt reduced by the fair value of the assets and equity given as payment of the debt. Since the total future cash outflows of the restructured debt exceeds the carrying value of the old debt, no gain on restructuring was recorded under U.S. GAAP.
F-86
Grupo Financiero Galicia S.A. and Subsidiaries
Notes to the Consolidated Financial Statements
For the years ended December 31, 2010, 2009 and 2008
(Expressed in thousands of Argentine pesos)
As a result, under U.S. GAAP, the carrying amount of the restructured debt is greater than the amount recorded under Argentine Banking GAAP. Therefore, under U.S. GAAP, a new effective interest rate was determined to reflect the present value of the future cash payments of the restructured debt.
Furthermore, under U.S. GAAP, expenses incurred in a trouble debt restructuring are expensed as incurred. Expenses related to the issuance of equity were deducted directly from the shareholder’s equity.
The Group repurchased part of the debt maturing in 2010 and 2014. In addition, Negotiable Obligations were repaid in advance. For U.S. GAAP purposes, these transactions were considered as an extinguishment of debt. Therefore, the U.S. GAAP adjustment recorded in previous years related to the debt extinguished was reversed in 2008, 2009 and 2010 respectively, generating a gain of approximately Ps.34,462, Ps.20,461 and Ps.8,680 included in 2010, 2009 and 2008 U.S. GAAP net income reconciliation.
o. Repurchase Agreements and Reverse Repurchase Agreements (“Repos and Reverse Repos”)
During 2010, 2009 and 2008, the Bank entered into Repo and Reverse Repo agreements of financial instruments: Boden 2012 Bonds, Securities issued by Argentine Central Bank, Discount Bonds and Bonar 2015 Bonds. (See note 35.e)
Under Argentine Banking GAAP, initial measurement of such agreements implies sale or purchase accounting together with the recognition of an asset and liability due to the investing or financing transaction entered into.
For U.S. GAAP purposes these transactions have not qualified as true sales and therefore these transactions were classified as available for sale securities and trading and recorded at fair value. The corresponding net adjustment in shareholders’ equity under U.S. GAAP is included under the caption “Compensatory Bond received”, “Discount Bonds” and “ Bonar 2015 Bonds”.
p. Fair Value Measurements Disclosures
Effective January 1, 2008, ASC 820-10 defines fair value, establishes a consistent framework for measuring fair value and expands disclosure requirements about fair-value measurements. ASC 820 -10, among other things, requires the Group to maximize the use of observable inputs and minimize the use of unobservable inputs when measuring fair value.
In addition, ASC 825-10 provides an option to elect fair value as an alternative measurement for selected financial assets, financial liabilities, unrecognized firm commitments and written loan commitments not previously recorded at fair value. Under ASC 825-10, fair value is used for both the initial and subsequent measurement of the designated assets, liabilities and commitments, with the changes on fair value recognized in net income. As a result of ASC 825-10 analysis, the Group has not elected to apply fair value accounting for any of its financial instruments not previously carried at fair value.
Fair Value Hierarchy
ASC 820-10, defines fair value as the price that would be received to sell an asset or paid to transfer a liability in an orderly transaction between market participants at the measurement date. Effective January 2010, the Group adopted new accounting guidance under ASC 820 that requires additional disclosures including, among other things, (i) the amounts and reasons for certain significant transfers among the three hierarchy levels of inputs, (ii) the gross, rather than net, basis for certain level 3 roll forward information, (iii) use of a “class” rather than a “major category” basis for assets and liabilities, and (iv) valuation techniques and inputs used to estimate level 2 and level 3 fair value measurements. The following information incorporates these new disclosures requirements except for the level 3 roll forward information which is not required until the first quarter of 2011.
F-87
Grupo Financiero Galicia S.A. and Subsidiaries
Notes to the Consolidated Financial Statements
For the years ended December 31, 2010, 2009 and 2008
(Expressed in thousands of Argentine pesos)
In addition, ASC 820-10 establishes a three-level valuation hierarchy for disclosure of fair value measurements. The valuation hierarchy is based upon the transparency of inputs to the valuation of an asset or liability as of the measurement date. The three levels are defined as follows:
| | • | | Level 1 — inputs to the valuation methodology are quoted prices (unadjusted) for identical assets or liabilities in active markets. |
| |
| | • | | Level 2 — inputs to the valuation methodology include quoted prices for similar assets and liabilities in active markets, and inputs that are observable for the asset or liability, either directly or indirectly, for substantially the full term of the asset or liability. |
| |
| | | | Level 2 — inputs include the following: |
| |
| | | | a) Quoted prices for similar assets or liabilities in active markets; |
| |
| | | | b) Quoted prices for identical or similar assets or liabilities in non-active markets; |
| |
| | | | c) Pricing models whose inputs are observable for substantially the full term of the asset or liability; and |
| |
| | | | d) Pricing models whose inputs are derived principally from or corroborated by observable market data through correlation or other means |
| |
| | • | | Level 3 — inputs to the valuation methodology are unobservable and significant to the fair value measurement. |
A financial instrument’s categorization within the valuation hierarchy is based upon the lowest level of input that is significant to the fair value measurement.
Determination of Fair Value
Fair value is based upon quoted market prices, where available. If listed prices or quotes are not available, fair value is based upon internally developed models that use primarily market-based or independently-sourced market parameters, including interest rate yield curves, option volatilities and currency rates. Valuation adjustments may be made to ensure that financial instruments are recorded at fair value. These adjustments include amounts to reflect counterparty credit quality, the Bank’s creditworthiness, liquidity and unobservable parameters that are applied consistently over time.
The Group believes its valuation methods are appropriate and consistent with other market participants, the use of different methodologies, or assumptions, to determine the fair value of certain financial instruments could result in a different estimate of fair value at the reporting date.
The following section describes the valuation methodologies used by the Group to measure various financial instruments at fair value, including an indication of the level in the fair-value hierarchy in which each instrument is generally classified. Where appropriate, the description includes details of the valuation models, the key inputs to those models as well as any significant assumptions.
Assets
a) Government securities and other investments
Listed investment securities: where quoted prices are available in an active market, securities are classified within level 1 of the valuation hierarchy. Level 1 securities includes national and government bonds, instruments issued by BCRA and corporate securities.
Other investments securities: as quoted market prices are not available, then fair values are estimated by using a discount cash flow model which includes assumptions based upon projected finance charges related to the securitized assets, estimated net credit losses, prepayment assumptions and contractual interest paid to third-party investors. These are classified within level 3 of the valuation hierarchy.
F-88
Grupo Financiero Galicia S.A. and Subsidiaries
Notes to the Consolidated Financial Statements
For the years ended December 31, 2010, 2009 and 2008
(Expressed in thousands of Argentine pesos)
b) Securities receivable under repurchase agreements
Securities receivables under repurchase agreements are classified within level 1 of the valuation hierarchy using quoted prices available in the active market for Bonar 2015 Bonds and Securities issued by Argentine Central Bank where the securities are traded.
c) Securitizations
As of December 31, 2009 the Group’s retained interests in certificates of participation of financial trusts. These were classified within level 3 of the valuation hierarchy. As quoted market prices are not available, then fair values were estimated by using a discount cash flow model which includes assumptions based upon projected finance charges related to the securitized assets, estimated net credit losses, prepayment assumptions and contractual interest paid to third-party investors.
As of December 31, 2010 the caption includes the consolidated assets of Galtrust I. The fair value was estimated by using the discounted cash flows of the assets. Therefore, these are classified within level 3 of the valuation hierarchy
d) Derivatives Financial Instruments
Forward transactions traded in autoregulated markets are made through recognized exchange markets, such as Mercado Abierto Electrónico (MAE) and Mercado a Término de Rosario (ROFEX).
The general settlement method for these transactions does not require delivery of the traded underlying asset. Rather, settlement is carried on a daily basis for the difference, if any, between the closing price of the underlying asset and the closing price or value of the underlying asset corresponding to the previous day, the difference in price being charged to income. Therefore, they are classified in Level 1 of the fair-value hierarchy.
Forward transactions conducted directly with customers are recorded as the difference between the agreed foreign currency exchange rate and such exchange rate at the end of the year according with the future prices published by Rofex. Therefore, they are classified in Level 2 of the fair-value hierarchy.
Liabilities
e) Securities to be delivered under spot and forward sales to be settled
Securities to be delivered under spot and forward sales to be settled are classified within level 1 of the valuation hierarchy using quoted prices available in the active market for Securities issued by the Argentine Central Bank where the securities are traded.
f) Derivatives Financial Instruments
Forward transactions traded in autoregulated markets are made through recognized exchange markets, such as Mercado Abierto Electrónico (MAE) and Mercado a Término de Rosario (ROFEX).
The general settlement method for these transactions does not require delivery of the traded underlying asset. Rather, settlement is carried on a daily basis for the difference, if any, between the closing price of the underlying asset and the closing price or value of the underlying asset corresponding to the previous day, the difference in price being charged to income. Therefore, they are classified in Level 1 of the fair-value hierarchy.
Forward transactions conducted directly with customers are recorded as the difference between the agreed foreign currency exchange rate and such exchange rate at the end of the year according with the future prices published by Rofex. Therefore, they are classified in Level 2 of the fair-value hierarchy.
F-89
Grupo Financiero Galicia S.A. and Subsidiaries
Notes to the Consolidated Financial Statements
For the years ended December 31, 2010, 2009 and 2008
(Expressed in thousands of Argentine pesos)
Items measured at fair value on a recurring basis
The following table presents the financial instruments carried at fair value as of December 31, 2010 and 2009, for U.S. GAAP purposes by ASC 820-10 valuation hierarchy (as described above).
| | | | | | | | | | | | | | | | | |
| | | | | | | | | | | Internal | | | Internal | |
| | | | | | | | | | | models with | | | models with | |
| | | | | | | Quoted | | | significant | | | significant | |
| | | | | | | market prices | | | observable | | | unobservable | |
| | | Total | | | in active | | | market | | | market | |
| | | carrying | | | markets | | | parameters | | | parameters | |
| Balances as of December 31, 2010 | | value | | | (Level 1) | | | (Level 2) | | | (Level 3) | |
| ASSETS | | | | | | | | | | | | | | | | |
| a.1) Trading Securities | | | | | | | | | | | | | | | | |
| National Government Securities | | Ps. | 68,231 | | | Ps. | 68,231 | | | Ps. | — | | | Ps. | — | |
| | | | | | | | | | | | | | | | | |
| a.2) Securities issued by Argentine Central Bank | | | | | | | | | | | | | | | | |
| Securities issued by the Argentine Central Bank | | | 2,059,915 | | | | 2,059,915 | | | | — | | | | — | |
| | | | | | | | | | | | | | | | | |
| a.3) Other Investments (*) | | | 166,723 | | | | — | | | | — | | | | 166,723 | |
| | | | | | | | | | | | | | | | | |
| a.4) Corporate Securities | | | | | | | | | | | | | | | | |
| Shares | | | 68 | | | | 68 | | | | — | | | | — | |
| Marketable Negotiable Obligations | | | 4,484 | | | | 4,484 | | | | — | | | | — | |
| Negotiable Mutual Funds | | | 5,750 | | | | 5,750 | | | | — | | | | — | |
| | | | | | | | | | | | | | | | | |
| a.5) In Investment Accounts | | | 151,356 | | | | 151,356 | | | | — | | | | — | |
| | | | | | | | | | | | | | | | | |
| b) Securities receivable under repurchase agreements | | | | | | | | | | | | | | | | |
| | | | | | | | | | | | | | | | | |
| b.1) Securities issued by Argentine Central Bank | | | | | | | | | | | | | | | | |
| Securities issued by Argentine Central Bank | | | 549,901 | | | | 549,901 | | | | — | | | | — | |
| | | | | | | | | | | | | | | | | |
| b.2) In Investment Account | | | 575,287 | | | | 575,287 | | | | — | | | | — | |
| | | | | | | | | | | | | | | | | |
| c) Securitizations | | | | | | | | | | | | | | | | |
| Debt Securities | | | 19,482 | | | | — | | | | — | | | | 19,482 | |
| Galtrust I — Bogar Bonds (**) | | | 783,761 | | | | — | | | | — | | | | 783,761 | |
| | | | | | | | | | | | | | | | | |
| d) Derivatives financial instruments | | | | | | | | | | | | | | | — | |
| Foreign exchange contracts | | | 5,403 | | | | 1,932 | | | | 3,471 | | | | — | |
| | | | | | | | | | | | | |
| TOTAL ASSETS AT FAIR VALUE | | | 4,390,361 | | | | 3,416,924 | | | | 3,471 | | | | 969,966 | |
| | | | | | | | | | | | | |
| | | | | | | | | | | | | | | | | |
| LIABILITIES — By Class | | | | | | | | | | | | | | | | |
| e) Securities to be delivered under spot and forward sales to be settled | | | (204,231 | ) | | | (204,231 | ) | | | — | | | | — | |
| | | | | | | | | | | | | | | | | |
| f) Derivatives financial instruments | | | | | | | | | | | | | | | | |
| Options | | | (3,723 | ) | | | — | | | | (3,723 | ) | | | — | |
| Foreign exchange contracts | | | (11,085 | ) | | | (3,163 | ) | | | (7,922 | ) | | | — | |
| | | | | | | | | | | | | |
| TOTAL LIABILITIES AT FAIR VALUE | | | (219,039 | ) | | | (207,394 | ) | | | (11,645 | ) | | | — | |
| | | | | | | | | | | | | |
| | | |
| (*) | | This amount is related to the fair value of certificates of participation held in the Almafuerte Special Fund |
| |
| (**) | | During the year ended December 31, 2010 and as part of the implementation of ASU 2009-16 and ASU 2009-17, the Group started consolidating Galtrust I. Therefore, the Ps. 783,761 corresponds to the fair value of the Bogar Bonds recorded as an asset in Galtrust I. In 2009 Galtrust I was not consolidated and therefore the amount shown as of December 31, 2009 corresponds to the certificate of participation held by the group in Galtrust I. |
F-90
Grupo Financiero Galicia S.A. and Subsidiaries
Notes to the Consolidated Financial Statements
For the years ended December 31, 2010, 2009 and 2008
(Expressed in thousands of Argentine pesos)
| | | | | | | | | | | | | | | | | |
| | | | | | | | | | | Internal | | | Internal | |
| | | | | | | | | | | models with | | | models with | |
| | | | | | | Quoted | | | significant | | | significant | |
| | | | | | | market prices | | | observable | | | unobservable | |
| | | Total | | | in active | | | market | | | market | |
| | | carrying | | | markets | | | parameters | | | parameters | |
| Balances as of December 31, 2009 | | value | | | (Level 1) | | | (Level 2) | | | (Level 3) | |
| ASSETS | | | | | | | | | | | | | | | | |
| a.1) Trading Securities | | | | | | | | | | | | | | | | |
| National Government Securities | | Ps. | 266,836 | | | Ps. | 266,836 | | | Ps. | — | | | Ps. | — | |
| | | | | | | | | | | | | | | | | |
| a.2) Without Quotation — National Government Securities | | | | | | | | | | | | | | | | |
| Compensatory and Hedge Bond Received | | | 938,340 | | | | 938,340 | | | | — | | | | — | |
| Discount Bonds & GDP Linked Negotiable Sec | | | 337,872 | | | | 337,872 | | | | — | | | | — | |
| Bonar 2015 Bonds | | | 676,580 | | | | 676,580 | | | | — | | | | — | |
| | | | | | | | | | | | | | | | | |
| a.3) Securities issued by Argentine Central Bank | | | | | | | | | | | | | | | | |
| Securities issued by the Argentine Central Bank | | | 1,658,473 | | | | 1,658,473 | | | | — | | | | — | |
| | | | | | | | | | | | | | | | | |
| a.4) Other Investments (*) | | | 410,702 | | | | — | | | | — | | | | 410,702 | |
| | | | | | | | | | | | | | | | | |
| a.5) Corporate Securities | | | | | | | | | | | | | | | | |
| Shares | | | 53 | | | | 53 | | | | — | | | | — | |
| Marketable Negotiable Obligations | | | 5,613 | | | | 5,613 | | | | — | | | | — | |
| Negotiable Mutual Funds | | | 7,505 | | | | 7,505 | | | | — | | | | — | |
| |
| b) Securities receivable under repurchase agreements | | | | | | | | | | | | | | | | |
| | | | | | | | | | | | | | | | | |
| b.1) Without Quotation — National Government Securities | | | | | | | | | | | | | | | | |
| Compensatory and Hedge Bond Received | | | 805,724 | | | | 805,724 | | | | — | | | | — | |
| | | | | | | | | | | | | | | | | |
| b.2) Securities issued by Argentine Central Bank | | | | | | | | | | | | | | | | |
| Securities issued by Argentine Central Bank | | | 226,682 | | | | 226,682 | | | | — | | | | — | |
| | | | | | | | | | | | | | | | | |
| c) Securitizations | | | | | | | | | | | | | | | | |
| Debt Securities and Certificates of Participation | | | 50,939 | | | | — | | | | — | | | | 50,939 | |
| Galtrust I — Certificates of participation | | | 211,647 | | | | — | | | | — | | | | 211,647 | |
| | | | | | | | | | | | | | | | | |
| d) Derivatives financial instruments | | | | | | | | | | | | | | | | |
| Foreign exchange contracts | | | 1,040 | | | | — | | | | 1,040 | | | | — | |
| | | | | | | | | | | | | |
| TOTAL ASSETS AT FAIR VALUE | | | 5,598,006 | | | | 4,923,678 | | | | 1,040 | | | | 673,288 | |
| | | | | | | | | | | | | |
| | | | | | | | | | | | | | | | | |
| LIABILITIES | | | | | | | | | | | | | | | | |
| e) Securities to be delivered under spot and forward sales to be settled | | | (12,975 | ) | | | (12,975 | ) | | | — | | | | — | |
| | | | | | | | | | | | | | | | | |
| f) Derivatives financial instruments | | | | | | | | | | | | | | | | |
| Options | | | (3,997 | ) | | | — | | | | (3,997 | ) | | | — | |
| Foreign exchange contracts | | | (8,060 | ) | | | — | | | | (8,060 | ) | | | — | |
| | | | | | | | | | | | | |
| TOTAL LIABILITIES AT FAIR VALUE | | | (25,032 | ) | | | (12,975 | ) | | | (12,057 | ) | | | — | |
| | | | | | | | | | | | | |
| | | |
| (*) | | This amount is related to the fair value of the Certificate of Participation in Nues Trust of Ps. 75,483 and Ps. 335,219 in the Almafuerte Special Fund. |
F-91
Grupo Financiero Galicia S.A. and Subsidiaries
Notes to the Consolidated Financial Statements
For the years ended December 31, 2010, 2009 and 2008
(Expressed in thousands of Argentine pesos)
Changes in level 3 fair value measurements
The table below includes a roll forward of the balance sheet amounts as of December 31, 2010, 2009 and 2008 (including the change in fair value) for financial instruments classified by the Group within level 3 of the valuation hierarchy. When a determination is made to classify a financial instrument within level 3 of the valuation hierarchy, the determination is based upon the significance of the unobservable factors to the overall fair value measurement.
| | | | | | | | | | | | | | | | | |
| | | Galtrust I - Bogar | | | | | | | | | | | Total Fair Value | |
| | | bonds | | | Debt securities | | | Other investments | | | Measurements | |
Fair value, December 31, 2008 | | Ps. | 67,881 | | | Ps. | 58,177 | | | Ps. | 301,486 | | | Ps. | 427,544 | |
| Total gains or losses (realized/unrealized) | | | 143,766 | | | | 13,718 | | | | 109,216 | | | | 266,700 | |
| Included in earnings | | | | | | | 18,737 | | | | | | | | 18,737 | |
| Included in other comprehensive income | | | 143,766 | | | | (5,019 | ) | | | 109,216 | | | | 247,963 | |
| Purchases | | | — | | | | — | | | | — | | | | — | |
| Issuances | | | — | | | | — | | | | — | | | | — | |
| Settlements | | | — | | | | (20,956 | ) | | | — | | | | (20,956 | ) |
| Transfers in to/ out of level 3 | | | — | | | | — | | | | — | | | | — | |
| | | | | | | | | | | | | |
Fair value, December 31, 2009 | | Ps. | 211,647 | | | Ps. | 50,939 | | | Ps. | 410,702 | | | Ps. | 673,288 | |
| | | | | | | | | | | | | |
| Total gains or losses (realized/unrealized) | | | 572,114 | | | | (7,265 | ) | | | (243,979 | ) | | | 320,870 | |
| Included in earnings | | | — | | | | (7,265 | ) | | | — | | | | (7,265 | ) |
| Included in other comprehensive income | | | 572,114 | | | | 0 | | | | (243,979 | ) | | | 328,135 | |
| Purchases | | | — | | | | — | | | | — | | | | — | |
| Issuances | | | — | | | | — | | | | — | | | | — | |
| Settlements | | | — | | | | (24,192 | ) | | | — | | | | (24,192 | ) |
| Transfers in to/ out of level 3 | | | — | | | | — | | | | — | | | | — | |
| | | | | | | | | | | | | |
Fair value, December 31, 2010 | | Ps. | 783,761 | | | Ps. | 19,482 | | | Ps. | 166,723 | | | Ps. | 969,966 | |
| | | | | | | | | | | | | |
The table below summarizes gains and losses due to changes in fair value, recorded in earnings for level 3 assets and liabilities during the year:
| | | | | | | | | | | | | |
| | | Total Fair Value Measurements | |
| Balances as of December 31, | | 2010 | | | 2009 | | | 2008 | |
Available for sale securities | | | | | | | | | | | | | |
| Classification of gains and losses included in earnings : | | | | | | | | | | | | |
| Financial Income | | Ps. | (7,265 | ) | | Ps. | 18,737 | | | Ps. | (259,762 | ) |
| | | | | | | | | | |
| Total | | Ps. | (7,265 | ) | | Ps. | 18,737 | | | Ps. | (259,762 | ) |
In addition, the Group is required, on a nonrecurring basis, to adjust the carrying value of certain assets or provide valuation allowances related to certain assets using fair value measurements in accordance with GAAP. Loans are generally not recorded at fair value on a recurring basis. Periodically, the Group records nonrecurring adjustments for including certain impairment amounts for impaired loans calculated in accordance with ASC 310-10 when establishing the allowance for loan losses. Estimates of fair value used for impaired loans generally are based on assumptions not observable in the marketplace and therefore such valuations have been classified as Level 3. Loans subject to nonrecurring fair value measurement were Ps. 75,567 and Ps. 157,843 as of December 31, 2010 and 2009 classified as Level 3.
F-92
Grupo Financiero Galicia S.A. and Subsidiaries
Notes to the Consolidated Financial Statements
For the years ended December 31, 2010, 2009 and 2008
(Expressed in thousands of Argentine pesos)
q. New authoritative pronouncements
In August 2010, the FASB issued ASU 2010-21 to amend various SEC paragraphs pursuant to the issuance of Release No. 33-9026: Technical Amendments to Rules, Forms, Schedules and Codification of Financial Reporting Policies. The proposed amendments do not include an effective date, applications must be considered after publication. The Bank does not expect any significant effect in its U.S. GAAP disclosures and financial information.
In December 2010, the FASB issued ASU 2010-28 “When to Perform Step 2 of the Goodwill Impairment Test for Reporting Units with Zero or Negative Carrying Amounts”. Under Topic ASC 350 on goodwill and other intangible assets, testing for goodwill impairment is a two-step test. When a goodwill impairment test is performed (either on an annual or interim basis), an entity must assess whether the carrying amount of a reporting unit exceeds its fair value (Step 1). If it does, an entity must perform an additional test to determine whether goodwill has been impaired and to calculate the amount of that impairment (Step 2). The amendments in this Update affect all entities that have recognized goodwill and have one or more reporting units whose carrying amount for purposes of performing Step 1 of the goodwill impairment test is zero or negative. The amendments in this Update modify Step 1 so that for those reporting units, an entity is required to perform Step 2 of the goodwill impairment test if it is more likely than not that a goodwill impairment exists. In determining whether it is more likely than not that a goodwill impairment exists, an entity should consider whether there are any adverse qualitative factors indicating that an impairment may exist. The qualitative factors are consistent with the existing guidance and examples in paragraph 350-20-35-30, which requires that goodwill of a reporting unit be tested for impairment between annual tests if an event occurs or circumstances change that would more likely than not reduce the fair value of a reporting unit below its carrying amount. For public entities, the amendments in this Update are effective for fiscal years, and interim periods within those years, beginning after December 15, 2010. The Bank does not expect any significant impact in its consolidated financial position after the adoption of these new requirements.
In January 2011, FASB issued ASU 2011-01, “Deferral of the Effective Date of Disclosures about Troubled Debt Restructurings in ASU 2010-20”, to temporarily delay the effective date of the disclosures about troubled debt restructurings in ASU 2010-20 for public entities. The delay is intended to allow the Board time to complete its deliberations on what constitutes a troubled debt restructuring. Under the existing effective date in ASU 2010-20, the Bank would have provided disclosures about troubled debt restructurings for periods beginning on or after December 15, 2010. According to ASU 2011-02, the amendments in this ASU are effective for the first interim or annual period beginning on or after June 15, 2011, and should be applied retrospectively to the beginning of the annual period of adoption.
The Bank does not expect any significant impact in its consolidated financial position after the adoption of these new requirements.
F-93
Grupo Financiero Galicia S.A. and Subsidiaries
Notes to the Consolidated Financial Statements
For the years ended December 31, 2010, 2009 and 2008
(Expressed in thousands of Argentine pesos)
In April 2011, FASB issued ASU 2011-02, “A Creditor’s Determination of whether a Restructuring Is a Troubled Debt Restructuring”, to help creditors in determining whether a creditor has granted a concession and whether a debtor is experiencing financial difficulties for purposes of determining whether a restructuring constitutes a troubled debt restructuring. The new guidance requires for creditors to evaluate modifications and restructurings of receivables using a more principles-based approach, which may result in more modifications and restructurings being considered troubled debt restructurings. In addition, the amendments to Topic 310 clarify that a creditor is precluded from using the effective interest rate test in the debtor’s guidance on restructuring of payables when evaluating whether a restructuring constitutes a troubled debt restructuring. For public entities, the amendments are effective for the first interim or annual period beginning on or after June 15, 2011, and should be applied retrospectively to the beginning of the annual period of adoption. For purposes of measuring impairment of those receivables, an entity should apply the amendments prospectively for the first interim or annual period beginning on or after June 15, 2011. The disclosures required by paragraphs 310-10-50-33 through 50-34, which were deferred by Accounting Standards Update No. 2011-01, Receivables (Topic 310): Deferral of the Effective Date of Disclosures about Troubled Debt Restructurings in Update No. 2010-20, is effective for interim and annual periods beginning on or after June 15, 2011. The Bank does not expect any significant impact in its consolidated financial position after the adoption of these new requirements.
In April 2011, FASB issued ASU 2011-03 “Reconsideration of effective control for repurchase agreements”. The amendments in this update remove from the assessment of effective control (1) the criterion requiring the transferor to have the ability to repurchase or redeem the financial assets on substantially the agreed terms, even in the event of default by the transferee, and (2) the collateral maintenance implementation guidance related to that criterion. The guidance in this Update is effective for the first interim or annual period beginning on or after December 15, 2011. Early adoption is not permitted. The Bank does not expect any significant impact in its consolidated financial position after the adoption of these new requirements.
F-94
Grupo Financiero Galicia S.A. and Subsidiaries
Notes to the Consolidated Financial Statements
For the years ended December 31, 2010, 2009 and 2008
(Expressed in thousands of Argentine pesos)
Consolidated net income
| | | | | | | | | | | | | |
| | | December 31, | |
| | | 2010 | | | 2009 | | | 2008 | |
| Net income as stated | | Ps. | 408,901 | | | Ps. | 229,275 | | | Ps. | 176,819 | |
| Loan origination fees and costs (Note 35 b.) | | | 7,422 | | | | (51,828 | ) | | | 10,300 | |
| Intangible assets: | | | | | | | | | | | | |
| Goodwill amortization and impairment (Note 35 c.) | | | 6,928 | | | | 11,458 | | | | (77,605 | ) |
| Negative goodwill (Note 35 c.) | | | 465,634 | | | | — | | | | — | |
| Software cost (Note 35 c.) | | | (56,259 | ) | | | (30,548 | ) | | | (24,593 | ) |
| Compensation related to the payment of deposits (Note 35 g.) | | | 259,053 | | | | 57,821 | | | | (39,850 | ) |
| Equity investments in other companies — Impairment (Note 35 k.) | | | 1,810 | | | | (4,731 | ) | | | (3,882 | ) |
| Loans —non Financial Public Sector — Secured loans (Note 35 d.(i)) | | | 282 | | | | 32,213 | | | | 48,228 | |
| Loan impairment — Private sector (Note 35 d.(ii)) | | | 1,812 | | | | 112,166 | | | | (54,748 | ) |
| Securitizations (Note 35 h.) | | | (2,334 | ) | | | (18,727 | ) | | | (376,975 | ) |
| Government Securities and other investments: | | | | | | | | | | | | |
| Compensatory Bond received and Hedge Bond (Note 35 e.(i)) | | | 1,005,937 | | | | 91,438 | | | | (838,609 | ) |
| Discount Bonds (Note 35 e.(ii)) | | | 428,686 | | | | 51,587 | | | | (86,849 | ) |
| GDP — Linked Negotiable Securities (Note 35 e.(ii)) | | | (12,366 | ) | | | 2,465 | | | | (31,479 | ) |
| Bonar 2015 Bonds ( Note 35 e. (iii)) | | | (346,761 | ) | | | 232,564 | | | | — | |
| Other investments (Note 35 e. (iv)) | | | 104,908 | | | | — | | | | (110,715 | ) |
| Amortization of real estate properties and foreclosed assets previously impaired under U.S. GAAP (Note 35 j.) | | | 1,395 | | | | 1,395 | | | | 1,395 | |
| Recognition for the fair value of obligations assumed under financial guarantees issued (Note 35 l.) | | | 8,361 | | | | 31,303 | | | | (35,727 | ) |
| Foreign Debt restructuring (Note 35 n.) | | | 61,264 | | | | 34,111 | | | | 29,749 | |
| Deferred Income tax (Note 35 a.) | | | (249,931 | ) | | | 101,476 | | | | 124,936 | |
| Minimum Presumed Income Tax (Note 35 a. ) | | | 328,619 | | | | (44,198 | ) | | | (25,906 | ) |
| Non-controlling interest (Note 35 m.) | | | 104,333 | | | | 46,512 | | | | 35,812 | |
| | | | | | | | | | |
| Net income (loss) in accordance with U.S. GAAP | | Ps. | 2,527,694 | | | Ps. | 885,752 | | | Ps. | (1,279,699 | ) |
| | | | | | | | | | |
| | | | | | | | | | | | | |
| Less Net Loss / (Income) attributable to the Non-controlling Interest (Note 35 m) | | | (234,121 | ) | | | (115,529 | ) | | | 108,721 | |
| | | | | | | | | | |
| Net Income (Loss) attributable to Parent Company in accordance with U.S. GAAP | | Ps. | 2,293,573 | | | Ps. | 770,223 | | | Ps. | (1,170,978 | ) |
| | | | | | | | | | |
| | | | | | | | | | | | | |
| Average number of shares outstanding (in thousands) (Note 21) | | | 1,241,407 | | | | 1,241,407 | | | | 1,241,407 | |
| Basic net income (loss) per share in accordance with U.S. GAAP (Note 21) | | | 1,848 | | | | 0.620 | | | | (0.943 | ) |
| Diluted net income (loss) per share in accordance with U.S. GAAP (Note 21) | | | 1,848 | | | | 0.620 | | | | (0.943 | ) |
| | | | | | | | | | |
F-95
Grupo Financiero Galicia S.A. and Subsidiaries
Notes to the Consolidated Financial Statements
For the years ended December 31, 2010, 2009 and 2008
(Expressed in thousands of Argentine pesos)
Consolidated shareholders’ equity
| | | | | | | | | |
| | | December 31, | |
| | | 2010 | | | 2009 | |
| Shareholders’ equity as stated | | Ps. | 2,469,500 | | | Ps. | 2,052,539 | |
| Loan origination fees and costs (Note 35 b.) | | | (84,642 | ) | | | (92,064 | ) |
| Intangible assets: | | | | | | | | |
| Goodwill amortization and impairment (Note 35 c.) | | | 32,135 | | | | 25,207 | |
| Negative Goodwill (Note 35 c.) | | | 465,634 | | | | — | |
| Software Cost (Note 35 c.) | | | (133,613 | ) | | | (77,354 | ) |
| Compensation related to the payment of deposits (Note 35 g.) | | | — | | | | (259,053 | ) |
| Equity investments in other companies — Impairment (Note 35 k.) | | | (29,738 | ) | | | (31,548 | ) |
| Loans —non Financial Public Sector — Secured loans (Note 35 d.(i)) | | | — | | | | (282 | ) |
| Loan impairment — Private sector (Note 35 d.(ii)) | | | 65,483 | | | | 63,671 | |
| Government securities and other investments: | | | | | | | | |
| Compensatory and Hedge Bond received (Note 35 e.(i)) | | | — | | | | (175,818 | ) |
| Discount Bonds (Note 35 e.(ii)) | | | — | | | | (296,477 | ) |
| GDP — Linked Negotiable Securities (Note 35 e. (ii)) | | | — | | | | 12,366 | |
| Bonar 2015 Bonds (Note 35 e. (iii)) | | | 84,496 | | | | 317,596 | |
| Other Investments (Note 35 e. (iv)) | | | (8,975 | ) | | | (22,369 | ) |
| Securitizations (Note 35 h.) | | | (54,132 | ) | | | (429,280 | ) |
| Impairment of real estate properties and foreclosed assets (Note 35 j.) | | | (67,155 | ) | | | (67,155 | ) |
| Amortization of real estate properties and foreclosed assets previously impaired under U.S. GAAP (Note 35 j.) | | | 11,160 | | | | 9,765 | |
| Minimum Presumed Income Tax (Note 35 a.) | | | — | | | | (328,619 | ) |
| Deferred Income tax (Note 35 a.) | | | 326,779 | | | | 576,710 | |
| Recognition for the fair value of obligations assumed under financial guarantees issued (Note 35 l.) | | | (3,848 | ) | | | (4,149 | ) |
| Foreign debt restructuring (Note 35 n.) | | | (76,008 | ) | | | (137,272 | ) |
| Non-controlling interest (Note 35m.) | | | 382,211 | | | | 288,569 | |
| | | | | | | |
| Consolidated shareholders’ equity (deficit) in accordance with U.S. GAAP | | Ps. | 3,379,287 | | | Ps. | 1,424,983 | |
| | | | | | | |
| Non-controlling Interest (Note 35 m.) | | | (382,220 | ) | | | (188,661 | ) |
| | | | | | | |
| Consolidated Parent Company Shareholders Equity (Deficit) in accordance with U.S. GAAP | | Ps. | 2,997,067 | | | Ps. | 1,236,322 | |
| | | | | | | |
F-96
Grupo Financiero Galicia S.A. and Subsidiaries
Notes to the Consolidated Financial Statements
For the fiscal years ended December 31, 2010, 2009 and 2008
(Expressed in thousands of Argentine pesos)
Roll forward analysis of shareholders’ equity under U.S. GAAP at December 31, 2010, 2009 and 2008:
| | | | | | | | | | | | | | | | | | | | | | | | | | | | | | | | | | | | | |
| | | | | | | | | | | | | | | | | | | | | | | Other | | | | | | | Total | | | | |
| | | | | | | | | | | Adjustments to | | | | | | | | | | | Comprehensive | | | (Accumulated | | | Shareholders’ | | | | |
| | | Capital | | | Paid | | | Shareholders’ | | | Profit reserves | | | Income | | | deficit) /Retained | | | Equity Parent | | | Non controlling | |
| | | Stock | | | in Capital | | | Equity | | | Legal | | | Other | | | (loss) | | | Earnings | | | Company | | | interest | |
| Balance at December 31, 2007 | | Ps. | 1,241,407 | | | Ps. | 606 | | | Ps. | 294,254 | | | Ps. | 34,855 | | | Ps. | 53,469 | | | Ps. | (143,821 | ) | | Ps. | (1,242,688 | ) | | Ps. | 238,082 | | | Ps. | (115,916 | ) |
| | | | | | | | | | | | | | | | | | | | | | | | | | | | |
| | | | | | | | | | | | | | | | | | | | | | | | | | | | | | | | | | | | | |
| Distribution of retained earnings: | | | | | | | | | | | | | | | | | | | | | | | | | | | | | | | | | | | | |
| Absorption approved by the shareholders’ meeting on April 29,2008 | | | | | | | | | | | | | | | | | | | | | | | | | | | | | | | | | | | | |
| Legal Reserve | | | — | | | | — | | | | — | | | | 2,302 | | | | — | | | | — | | | | (2,302 | ) | | | — | | | | — | |
| Discretionary Reserve | | | — | | | | — | | | | — | | | | — | | | | 43,735 | | | | — | | | | (43,735 | ) | | | — | | | | — | |
| Unrealized gain of available-for-sale securities, net of tax | | | — | | | | — | | | | — | | | | — | | | | — | | | | 178,483 | | | | — | | | | 178,483 | | | | 7,195 | |
| Net Income (Loss) in accordance with U.S. GAAP | | | — | | | | — | | | | — | | | | — | | | | — | | | | — | | | | (1,170,978 | ) | | | (1,170,978 | ) | | | 108,721 | |
| | | | | | | | | | | | | | | | | | | | | | | | | | | | |
| Balance at December 31, 2008 | | Ps. | 1,241,407 | | | Ps. | 606 | | | Ps. | 294,254 | | | Ps. | 37,157 | | | Ps. | 97,204 | | | Ps. | 34,662 | | | Ps. | (2,459,703 | ) | | Ps. | (754,413 | ) | | Ps. | — | |
| | | | | | | | | | | | | | | | | | | | | | | | | | | | |
| | | | | | | | | | | | | | | | | | | | | | | | | | | | | | | | | | | | | |
| Distribution of retained earnings: | | | | | | | | | | | | | | | | | | | | | | | | | | | | | | | | | | | | |
| Absorption approved by the shareholders’ meeting on April 28,2009 | | | | | | | | | | | | | | | | | | | | | | | | | | | | | | | | | | | | |
| Legal Reserve | | | — | | | | — | | | | — | | | | 8,841 | | | | — | | | | — | | | | (8,841 | ) | | | — | | | | — | |
| Discretionary Reserve | | | — | | | | — | | | | — | | | | — | | | | 167,978 | | | | — | | | | (167,978 | ) | | | — | | | | — | |
| Net, unrealized gain / (loss) of available-for-sale securities, net of tax | | | — | | | | — | | | | — | | | | — | | | | — | | | | 1,220,512 | | | | — | | | | 1,220,512 | | | | (73,132 | ) |
| Net Income (Loss) in accordance with U.S. GAAP | | | — | | | | — | | | | — | | | | — | | | | — | | | | — | | | | 770,223 | | | | 770,223 | | | | (115,529 | ) |
| | | | | | | | | | | | | | | | | | | | | | | | | | | | |
| Balance at December 31, 2009 | | Ps. | 1,241,407 | | | Ps. | 606 | | | Ps. | 294,254 | | | Ps. | 45,998 | | | Ps. | 265,182 | | | Ps. | 1,255,174 | | | Ps. | (1,866,299 | ) | | Ps. | 1,236,322 | | | Ps. | (188,661 | ) |
| | | | | | | | | | | | | | | | | | | | | | | | | | | | |
| | | | | | | | | | | | | | | | | | | | | | | | | | | | | | | | | | | | | |
| Distribution of retained earnings: | | | | | | | | | | | | | | | | | | | | | | | | | | | | | | | | | | | | |
| Absorption approved by the shareholders’ meeting on April 28,2010 | | | | | | | | | | | | | | | | | | | | | | | | | | | | | | | | | | | | |
| Legal Reserve | | | — | | | | — | | | | — | | | | 11,464 | | | | — | | | | — | | | | (11,464 | ) | | | — | | | | — | |
| Discretionary Reserve | | | — | | | | — | | | | — | | | | — | | | | 217,811 | | | | — | | | | (217,811 | ) | | | — | | | | — | |
| Net, unrealized gain / (loss) of available-for-sale securities, net of tax | | | — | | | | — | | | | — | | | | — | | | | — | | | | (532,828 | ) | | | — | | | | (532,828 | ) | | | 40,562 | |
| Net Income (Loss) in accordance with U.S. GAAP | | | — | | | | — | | | | — | | | | — | | | | — | | | | — | | | | 2,293,573 | | | | 2,293,573 | | | | (234,121 | ) |
| | | | | | | | | | | | | | | | | | | | | | | | | | | | |
| Balance at December 31, 2010 | | Ps. | 1,241,407 | | | Ps. | 606 | | | Ps. | 294,254 | | | Ps. | 57,462 | | | Ps. | 482,993 | | | Ps. | 722,346 | | | Ps. | 197,999 | | | Ps. | 2,997,067 | | | Ps. | (382,220 | ) |
| | | | | | | | | | | | | | | | | | | | | | | | | | | | |
Comprehensive income
“Reporting Comprehensive Income” ASC 220, establishes standards for reporting and the display of comprehensive income and its components (revenues, expenses, gains and losses) in the financial statements. Comprehensive income is the total of net income and all transactions, and other events and circumstances from non-owner sources.
F-97
Grupo Financiero Galicia S.A. and Subsidiaries
Notes to the Consolidated Financial Statements
For the fiscal years ended December 31, 2010, 2009 and 2008
(Expressed in thousands of Argentine pesos)
The following disclosure presented for the fiscal years ended December 31, 2010, 2009 and 2008, shows all periods restated to conform ASC 220:
| | | | | | | | | | | | | |
| | | December 31, | |
| | | 2010 | | | 2009 | | | 2008 | |
| Income Statement | | | | | | | | | | | | |
| Financial Income | | Ps. | 4,779,236 | | | Ps. | 3,374,800 | | | Ps. | 1,201,697 | |
| Financial Expenditures | | | 1,343,357 | | | | 1,434,408 | | | | 1,391,270 | |
| Net Financial Income (Loss) | | | 3,435,879 | | | | 1,940,392 | | | | (189,573 | ) |
| Provision for Loan Losses | | | 549,712 | | | | 527,339 | | | | 450,137 | |
| Income from Services | | | 2,506,687 | | | | 1,802,381 | | | | 1,538,380 | |
| Expenditures from Services | | | 721,124 | | | | 515,648 | | | | 383,654 | |
| Administrative Expenses | | | 2,881,200 | | | | 2,063,546 | | | | 1,799,579 | |
| Net Income / (Loss) from Financial Brokerage | | | 1,790,530 | | | | 636,240 | | | | (1,284,563 | ) |
| Miscellaneous Income | | | 1,542,945 | | | | 594,630 | | | | 494,977 | |
| Miscellaneous Losses | | | 297,659 | | | | 290,602 | | | | 541,035 | |
| Net Income / (Loss) before Income tax | | | 3,035,816 | | | | 940,268 | | | | (1,330,621 | ) |
| Income Tax | | | 508,122 | | | | 54,516 | | | | (50,922 | ) |
| | | | | | | | | | |
| Net income (loss) under U.S. GAAP | | | 2,527,694 | | | | 885,752 | | | | (1,279,699 | ) |
| | | | | | | | | | |
| | | | | | | | | | | | | |
| Less Net (Income) / Loss attributable to the Non-controlling Interest | | | (234,121 | ) | | | (115,529 | ) | | | 108,721 | |
| | | | | | | | | | |
| Net Income / (Loss) attributable to Parent Company | | | 2,293,573 | | | | 770,223 | | | | (1,170,978 | ) |
| | | | | | | | | | |
| | | | | | | | | | | | | |
| Other comprehensive income (loss): | | | | | | | | | | | | |
| | | | | | | | | | | | | |
| Unrealized gains (losses) on securities, net | | | (532,828 | ) | | | 1,220,512 | | | | 178,483 | |
| | | | | | | | | | |
| Other comprehensive income (loss), net | | | (532,828 | ) | | | 1,220,512 | | | | 178,483 | |
| | | | | | | | | | |
| |
| Comprehensive income (Loss) | | Ps. | 1,760,745 | | | Ps. | 1,990,735 | | | Ps. | (992,495 | ) |
| | | | | | | | | | |
Accumulated non-owner changes in equity (accumulated other comprehensive income) as of December 31, 2010, 2009 and 2008 were as follows:
| | | | | | | | | | | | | |
| | | December 31, | |
| | | 2010 | | | 2009 | | | 2008 | |
| Boden 2012 Bonds — Compensatory Bond (1) | | | — | | | | 830,119 | | | | — | |
| GalTrust I (2) | | | 566,115 | | | | 193,651 | | | | — | |
| Discount Bonds (3) | | | — | | | | 132,209 | | | | — | |
| Bonar 2015 Bonds | | | 198,693 | | | | 85,032 | | | | — | |
| Other | | | (3,167 | ) | | | 83,329 | | | | 26,549 | |
| | | | | | | | | | |
| Accumulated other comprehensive income | | Ps. | 761,641 | | | Ps. | 1,324,340 | | | Ps. | 26,549 | |
| | | | | | | | | | |
| | | | | | | | | | | | | |
| Less, accumulated other comprehensive income attributable to the Non-controlling interest | | | (39,295 | ) | | | (69,166 | ) | | | 8,113 | |
| | | | | | | | | | |
| Net accumulated other comprehensive income attributable to Parent Company | | Ps. | 722,346 | | | Ps. | 1,255,174 | | | Ps. | 34,662 | |
| | | | | | | | | | |
F-98
Grupo Financiero Galicia S.A. and Subsidiaries
Notes to the Consolidated Financial Statements
For the fiscal years ended December 31, 2010, 2009 and 2008
(Expressed in thousands of Argentine pesos)
| | | |
| (1) | | During the year ended December 31, 2010, the group sold all it position in Boden 2012 Bonds — Compensatory Bonds, generated a gain of Ps.1,005,937 recorded under the caption “Financial Income” in the consolidated income Statement Under U.S. GAAP. |
| |
| (2) | | In 2010, the Group adopted ASU 2009-16 and ASU 2009-17. Under these new standards, the Group started consolidated Galtrust I, including the Bogar Bonds for an amount of Ps.783,761 recorded as assets in such trust. Prior to 2010, the Group only recorded the Certificates of Participation it held in such trust. |
| |
| (3) | | During the year ended December 31, 2010, the group sold all it position in Discount Bonds, generated a gain of Ps.428,686 recorded under the caption “Financial Income” in the consolidated income Statement Under U.S. GAAP |
There were no available for sale securities with a continuous loss position of 12 months or more. The Group has determined that unrealized losses on investments as of December 31, 2010 are temporary in nature based on its ability and intent to hold the investment for a period of time sufficient to allow for any anticipated recovery and the results of its review conducted to identify and evaluate investments that have indications of possible impairments.
F-99
Grupo Financiero Galicia S.A. and Subsidiaries
Notes to the Consolidated Financial Statements
For the fiscal years ended December 31, 2010, 2009 and 2008
(Expressed in thousands of Argentine pesos)
Concentration of risk — Total exposure to the public sector — Argentine government and provinces
The Group has significant exposure to the Argentine national government and provinces in the form of government securities net positions, secured loans and other debt obligations. As of December 31, 2010 and 2009, the Group had the following bonds and loans outstanding:
| | | | | | | | | | | | | | | | | |
| | | December 31, 2010 | | | December 31, 2009 | |
| | | Argentine | | | | | | | Argentine | | | | |
| | | Banking | | | | | | | Banking | | | | |
| | | GAAP | | | U.S. GAAP | | | GAAP | | | U.S. GAAP | |
| Argentine national government loans | | Ps. | 21,397 | | | Ps. | 21,397 | | | Ps. | 25,416 | | | Ps. | 25,134 | |
| Other Argentine public-sector receivables | | | 266,254 | | | | 202,964 | | | | 344,842 | | | | 271,024 | |
| Galtrust I (securitization of Provincial Loans) | | | 515,966 | | | | 515,966 | | | | 579,730 | | | | 207,266 | |
| Compensatory bond received | | | — | | | | — | | | | 1,906,907 | | | | 1,731,089 | |
| Securities issued by the Argentine Central Bank | | | 2,411,393 | | | | 2,405,585 | | | | 1,953,676 | | | | 1,953,827 | |
| Discount Bonds & GDP Linked Negotiable Securities | | | — | | | | — | | | | 621,983 | | | | 337,872 | |
| Bonar 2015 Bonds | | | 642,147 | | | | 726,643 | | | | 358,984 | | | | 676,580 | |
| Other (1) | | | 87,289 | | | | 87,289 | | | | 91,420 | | | | 91,420 | |
| | | | | | | | | | | | | |
| Total | | Ps. | 3,944,446 | | | Ps. | 3,959,844 | | | Ps. | 5,882,958 | | | Ps. | 5,294,212 | |
| | | | | | | | | | | | | |
| | | |
| (1) | | Includes bonds and other national government bonds. |
Risks and Uncertainties
Government Securities
As of December 31, 2010, the Group’s exposure to the Argentine public sector represented approximately 11,05% of the total Group’s assets. Although the Group’s exposure to the Argentine public sector consists of performing assets, the realization of the Group’s assets, its income and cash flow generation capacity and future financial condition is dependent on the Argentine government ability to comply with its payment obligations.
Argentine Central Bank’s regulations state that, the total exposure of financial institutions to the non-financial public sector must not exceed 35% of their total assets.
As of December 31, 2010 and 2009, the Group was in compliance with the general limit of 35% imposed by the Argentine Central Bank.
F-100
Grupo Financiero Galicia S.A. and Subsidiaries
Notes to the Consolidated Financial Statements
For the fiscal years ended December 31, 2010, 2009 and 2008
(Expressed in thousands of Argentine pesos)
Allowance for loan losses
Management believes that the current level of allowance for loan losses recorded for U.S. GAAP purposes are sufficient to cover incurred losses of the Group’s loan portfolio as of December 31, 2010. Many factors can affect the Group’s estimates of allowance for loan losses, including expected cash flows, volatility of default probability, migrations and estimated loss severity. The process of determining the level of the allowance for credit losses requires a high degree of judgment. It is possible that others, given the same information, may at any point in time reach different reasonable conclusions.
U.S. GAAP estimates
Valuation reserves, impairment charges and estimates of market values on assets and step up bonds discounting, as established by the Group for U.S. GAAP purposes are subject to significant assumptions of future cash flows and interest rates for discounting such cash flows. Losses on the exchange of government and provincial bonds and on retained interests in securitization trusts could be significantly affected by higher discount rates. Should the discount rates change in future years, the carrying amounts and charges to income and shareholders’ equity will also change. In addition, as estimates of future cash flows change, the carrying amounts which are dependent on such cash flows could be affected as well. It is possible that changes to the carrying amounts of loans, investments and other assets will be adjusted in the near term in amounts that are material to the Group’s financial position and results of income.
36. Parent only Financial Statements
The following are the unconsolidated balance sheets of Grupo Galicia as of December 31, 2010 and 2009 and the related unconsolidated statements of income, and cash flows for the fiscal years ended December 31, 2010, 2009 and 2008.
F-101
Grupo Financiero Galicia S.A. and Subsidiaries
Notes to the Consolidated Financial Statements
For the fiscal years ended December 31, 2010, 2009 and 2008
(Expressed in thousands of Argentine pesos)
Balance sheet (Parent Company only)
| | | | | | | | | |
| | | December 31, | |
| | | 2010 | | | 2009 | |
ASSETS | | | | | | | | |
| A. Cash and due from Banks | | | | | | | | |
| Cash | | Ps. | 11 | | | Ps. | 11 | |
| Financial institutions and correspondents | | | 819 | | | | 63 | |
| | | | | | | |
| | | Ps. | 830 | | | Ps. | 74 | |
| | | | | | | | | |
| B. Government and corporate securities | | | | | | | | |
| Holdings of trading securities | | | — | | | | — | |
| Investments in listed corporate securities | | | — | | | | 13,118 | |
| | | | | | | |
| | | Ps. | — | | | Ps. | 13,118 | |
| | | | | | | | | |
| C. Loans | | | | | | | | |
| To the financial sector | | | 57,857 | | | | 52,757 | |
| | | | | | | |
| | | Ps. | 57,857 | | | Ps. | 52,757 | |
| | | | | | | | | |
| D. Other receivables resulting from financial brokerage | | | | | | | | |
| Negotiable obligations without quotation | | | — | | | | — | |
| Balances from forward transactions without delivery of underlying asset to be settled | | | — | | | | — | |
| Other receivables not included in the debtor classification Regulations | | | 1,198 | | | | 1,786 | |
| Other receivables included in the debtor classification Regulations | | | 25,268 | | | | 17,381 | |
| Accrued interest receivable included in the debtor Classification regulations | | | 2 | | | | 181 | |
| | | | | | | |
| | | Ps. | 26,468 | | | Ps. | 19,348 | |
| | | | | | | | | |
| F. Equity investments | | | | | | | | |
| In financial institutions | | | 2,522,197 | | | | 2,072,245 | |
| Other | | | 88,948 | | | | 84,812 | |
| | | | | | | |
| | | Ps. | 2,611,145 | | | Ps. | 2,157,057 | |
| | | | | | | | | |
| G. Miscellaneous receivables | | | | | | | | |
| Tax on minimum presumed income — Tax credit | | | — | | | | 908 | |
| Other | | | 1,428 | | | | 2,980 | |
| | | | | | | |
| | | Ps. | 1,428 | | | Ps. | 3,888 | |
| | | | | | | | | |
| H. Bank premises and equipment | | | 1,012 | | | | 2,993 | |
| | | | | | | | | |
| J. Intangible assets | | | | | | | | |
| Goodwill | | | 12,766 | | | | 9,697 | |
| Organization and development expenses | | | 36 | | | | 26 | |
| | | | | | | |
| | | Ps. | 12,802 | | | Ps. | 9,723 | |
| | | | | | | |
Total Assets | | Ps. | 2,711,542 | | | Ps. | 2,258,958 | |
| | | | | | | |
F-102
Grupo Financiero Galicia S.A. and Subsidiaries
Notes to the Consolidated Financial Statements
For the fiscal years ended December 31, 2010, 2009 and 2008
(Expressed in thousands of Argentine pesos)
| | | | | | | | | |
| | | December 31, | |
| | | 2010 | | | 2009 | |
LIABILITIES AND SHAREHOLDERS’ EQUITY | | | | | | | | |
| N. Other liabilities resulting from financial brokerage | | | | | | | | |
| Banks and international entities | | Ps. | — | | | Ps. | — | |
| Unsubordinated negotiable obligations | | | 221,048 | | | | 166,056 | |
| Balances from forward transactions without delivery of underlying asset to be settled | | | 7,830 | | | | 8,060 | |
| Accrued interest and quotation differences payable | | | 2,133 | | | | 930 | |
| | | | | | | |
| | | | 231,011 | | | | 175,046 | |
| | | | | | | |
| O. Miscellaneous liabilities | | | | | | | | |
| Directors’ and Syndics’ fees | | Ps. | 195 | | | Ps. | 225 | |
| Other | | | 10,836 | | | | 31,148 | |
| | | | | | | |
| | | | 11,031 | | | | 31,373 | |
| | | | | | | |
Total Liabilities | | Ps. | 242,042 | | | Ps. | 206,419 | |
SHAREHOLDERS’ EQUITY | | Ps. | 2,469,500 | | | Ps. | 2,052,539 | |
| | | | | | | |
Total Liabilities and Shareholders’ Equity | | Ps. | 2,711,542 | | | Ps. | 2,258,958 | |
| | | | | | | |
F-103
Grupo Financiero Galicia S.A. and Subsidiaries
Notes to the Consolidated Financial Statements
For the fiscal years ended December 31, 2010, 2009 and 2008
(Expressed in thousands of Argentine pesos)
Statement of Income (Parent Company only)
| | | | | | | | | | | | | |
| | | December 31, | |
| | | 2010 | | | 2009 | | | 2008 | |
| A. Financial income | | | | | | | | | | | | |
| Interest on loans granted to the financial sector | | | 181 | | | | 120 | | | | 97 | |
| Interest on other loans | | | — | | | | — | | | | — | |
| Interest on other receivables resulting from financial brokerage | | | 54 | | | | 74 | | | | 314 | |
| Net income from government and corporate securities | | | 161 | | | | 484 | | | | 126 | |
| Exchange rate differences on gold and foreign currency | | | — | | | | 16,120 | | | | — | |
| Other | | | — | | | | 27 | | | | — | |
| | | | | | | | | | |
| | | Ps. | 396 | | | Ps. | 16,825 | | | Ps. | 537 | |
| B. Financial expenses | | | | | | | | | | | | |
| Interest on other liabilities resulting from financial brokerage | | Ps. | 18,796 | | | Ps. | 11,071 | | | Ps. | 17,062 | |
| Exchange rate differences on gold and foreign currency | | | 23,221 | | | | — | | | | 11,258 | |
| Other | | | 243 | | | | 266 | | | | 280 | |
| | | | | | | | | | |
| | | Ps. | 42,260 | | | Ps. | 11,337 | | | Ps. | 28,600 | |
| | | | | | | | | | | | | |
| C. Gross brokerage margin | | | (41,864 | ) | | | 5,488 | | | | (28,063 | ) |
| | | | | | | | | | | | | |
| F. Administrative expenses | | | | | | | | | | | | |
| Personnel expenses | | | 6,338 | | | | 3,786 | | | | 3,492 | |
| Directors’ and syndics’ fees | | | 1,362 | | | | 1,080 | | | | 1,013 | |
| Other fees | | | 4,144 | | | | 5,125 | | | | 3,182 | |
| Taxes | | | 2,993 | | | | 6,984 | | | | 1,208 | |
| Other operating expenses | | | 717 | | | | 685 | | | | 521 | |
| Other | | | 7,559 | | | | 5,558 | | | | 5,080 | |
| | | | | | | | | | |
| | | Ps. | 23,113 | | | Ps. | 23,218 | | | Ps. | 14,496 | |
| | | | | | | | | | | | | |
| Net Income from financial brokerage | | Ps. | (64,977 | ) | | Ps. | (17,730 | ) | | Ps. | (42,559 | ) |
| | | | | | | | | | | | | |
| H. Miscellaneous income | | | | | | | | | | | | |
| Net income from equity investments | | | 473,918 | | | | 188,069 | | | | 219,688 | |
| Other | | | 2,722 | | | | 86,090 | | | | 1,557 | |
| | | | | | | | | | |
| | | Ps. | 476,640 | | | Ps. | 274,159 | | | Ps. | 221,245 | |
| I. Miscellaneous losses | | | | | | | | | | | | |
| Other | | | 2,733 | | | | 2,401 | | | | 3,952 | |
| | | | | | | | | | |
| | | Ps. | 2,733 | | | Ps. | 2,401 | | | Ps. | 3,952 | |
| | | | | | | | | | |
| | | | | | | | | | | | | |
| Net Income before tax | | | 408,930 | | | | 254,028 | | | | 174,734 | |
| | | | | | | | | | |
| | | | | | | | | | | | | |
| J. Income tax | | Ps. | 29 | | | Ps. | 24,753 | | | Ps. | (2,085 | ) |
| | | | | | | | | | |
| | | | | | | | | | | | | |
| Net income for the fiscal year | | Ps. | 408,901 | | | Ps. | 229,275 | | | Ps. | 176,819 | |
| | | | | | | | | | |
| | | |
| (1) | | Includes the foreign currency position compensation. |
F-104
Grupo Financiero Galicia S.A. and Subsidiaries
Notes to the Consolidated Financial Statements
For the fiscal years ended December 31, 2010, 2009 and 2008
(Expressed in thousands of Argentine pesos)
Statement of cash flows (Parent Company only)
| | | | | | | | | | | | | |
| | | December 31, | |
| | | 2010 | | | 2009 | | | 2008 | |
CHANGES IN CASH AND CASH EQUIVALENTS | | | | | | | | | | | | |
| Cash and cash equivalents at the beginning of the year | | Ps. | 19,422 | | | Ps. | 27,562 | | | Ps. | 26,407 | |
| Increase / (decrease) in cash and cash equivalents | | | 7,876 | | | | (8,140 | ) | | | 1,155 | |
| | | | | | | | | | |
Cash and cash equivalents at end of year | | | 27,298 | | | | 19,422 | | | | 27,562 | |
| | | | | | | | | | | | | |
Cash and cash equivalents provided by (used in) operating activities | | | | | | | | | | | | |
| Less: | | | | | | | | | | | | |
| Operating expenses paid | | | (31,706 | ) | | | (27,160 | ) | | | (15,349 | ) |
| Income Tax payment and prepayment | | | (21,822 | ) | | | — | | | | — | |
| Plus: | | | | | | | | | | | | |
| Other operating income received | | | 1,132 | | | | 2,996 | | | | 5,294 | |
| | | | | | | | | | |
Cash and cash equivalents provided by (used in) operating activities | | Ps. | (52,396 | ) | | Ps. | (24,164 | ) | | Ps. | (10,055 | ) |
| | | | | | | | | | | | | |
Other sources of cash and cash equivalents | | | | | | | | | | | | |
| Collection for the issuance of negotiable obligations | | | 168,745 | | | | 160,345 | | | | — | |
| Loan received | | | — | | | | — | | | | — | |
| Dividends | | | 18,813 | | | | 15,969 | | | | 12,163 | |
| Increase in short-term investment | | | — | | | | 4,022 | | | | 1,676 | |
| Collection of deposit as per Decree 616/2005 | | | — | | | | — | | | | 72,360 | |
| Collection for sale of fixed assets | | | 8,385 | | | | — | | | | — | |
| Other sources of cash and cash equivalents | | | 2,675 | | | | 581 | | | | 1,806 | |
| | | | | | | | | | |
Other sources of cash and cash equivalents | | Ps. | 198,618 | | | Ps. | 180,917 | | | Ps. | 88,005 | |
| | | | | | | | | | | | | |
Other uses of cash and cash equivalents | | | | | | | | | | | | |
| Payment of loans received | | | (134,030 | ) | | | (152,772 | ) | | | (76,760 | ) |
| Increase in fixed assets | | | (246 | ) | | | (39 | ) | | | (24 | ) |
| Increase in long-term investments | | | (4,070 | ) | | | (12,082 | ) | | | (11 | ) |
| | | | | | | | | | |
Total other uses of cash and cash equivalents | | Ps. | (138,346 | ) | | Ps. | (164,893 | ) | | Ps. | (76,795 | ) |
| | | | | | | | | | |
Increase / (decrease) in cash and cash equivalents | | Ps. | 7,876 | | | Ps. | (8,140 | ) | | Ps. | 1,155 | |
| | | | | | | | | | |
The accompanying condensed financial statements have been prepared in accordance with Argentine Banking GAAP. Certain information and footnote disclosures normally included in financial statements prepared in accordance with Argentine Banking GAAP have been condensed or omitted. The Company’s majority-owned subsidiaries are recorded using the equity method of accounting. The footnotes’ disclosures contain supplemental information relating to the operations of Grupo Galicia; as such, these financial statements should be read in conjunction with the notes to the consolidated financial statements of the Company.
F-105