UNITED STATES
SECURITIES AND EXCHANGE COMMISSION
Washington, D.C. 20549
FORM 10-K
☑ ANNUAL REPORT PURSUANT TO SECTION 13 OR 15(d) OF THE SECURITIES EXCHANGE ACT OF 1934
For the fiscal year ended December 31, 2024
OR
☐ TRANSITION REPORT PURSUANT TO SECTION 13 OR 15(d) OF THE SECURITIES EXCHANGE ACT OF 1934
For the transition period from _ to _
Commission File Number 001-37824
IMPINJ, INC.
(Exact name of registrant as specified in its charter)
| |
Delaware | 91-2041398 |
(State or other jurisdiction of incorporation or organization) | (I.R.S. Employer Identification No.) |
400 Fairview Avenue North, Suite 1200, Seattle, Washington | 98109 |
(Address of principal executive offices) | (Zip Code) |
Registrant’s telephone number, including area code: (206) 517-5300
Securities registered pursuant to Section 12(b) of the Act:
| | |
Common Stock, $0.001 par value per share (Title of each class) | PI (Trading Symbol) | The Nasdaq Global Select Market (Name of each exchange on which registered) |
Securities registered pursuant to Section 12(g) of the Act:
None
Indicate by check mark if the registrant is a well-known seasoned issuer, as defined in Rule 405 of the Securities Act. Yes ☐ No ☑
Indicate by check mark if the registrant is not required to file reports pursuant to Section 13 or Section 15(d) of the Act. Yes ☐ No ☑
Indicate by check mark whether the registrant (1) has filed all reports required to be filed by Section 13 or 15(d) of the Securities Exchange Act of 1934 during the preceding 12 months (or for such shorter period that the registrant was required to file such reports), and (2) has been subject to such filing requirements for the past 90 days. Yes ☑ No ☐
Indicate by check mark whether the registrant has submitted electronically every Interactive Data File required to be submitted pursuant to Rule 405 of Regulation S-T (§ 232.405 of this chapter) during the preceding 12 months (or for such shorter period that the registrant was required to submit such files). Yes ☑ No ☐
Indicate by check mark whether the registrant is a large accelerated filer, an accelerated filer, a non-accelerated filer, a smaller reporting company, or an emerging growth company. See the definitions of “large accelerated filer,” “accelerated filer,” “smaller reporting company,” and "emerging growth company" in Rule 12b-2 of the Exchange Act.
| | | | | | |
Large accelerated filer |
| ☑ |
| Accelerated filer |
| ☐ |
Non-accelerated filer |
| ☐ |
| Smaller reporting company |
| ☐ |
Emerging growth company | | ☐ | | | | |
If an emerging growth company, indicate by check mark if the registrant has elected not to use the extended transition period for complying with any new or revised financial accounting standards provided pursuant to Section 13(a) of the Exchange Act. ☐
Indicate by check mark whether the registrant has filed a report on and attestation to its management’s assessment of the effectiveness of its internal control over financing reporting under Section 404(b) of the Sarbanes-Oxley Act (15 U.S.C. 7262(b)) by the registered public accounting firm that prepared or issued its audit report. ☑
If securities are registered pursuant to Section 12(b) of the Act, indicate by check mark whether the financial statements of the registrant included in the filing reflect the correction of an error to previously issued financial statements. ☐
Indicate by check mark whether any of those error corrections are restatements that required a recovery analysis of incentive-based compensation received by any of the registrant’s executive officers during the relevant recovery period pursuant to §240.10D-1(b). ☐
Indicate by check mark whether the registrant is a shell company (as defined in Rule 12b-2 of the Act). Yes ☐ No ☑
As of June 30, 2024, the last business day of the Registrant’s most recently completed second fiscal quarter, the aggregate market value of the Registrant’s common stock held by non-affiliates based upon the closing price of such shares on The Nasdaq Global Market on such date was approximately $3.7 billion.
As of January 31, 2025, 28,538,125 shares of common stock were outstanding.
DOCUMENTS INCORPORATED BY REFERENCE
The information required by Part III of this report, to the extent not set forth herein, is incorporated in this report by reference to the registrant’s definitive proxy statement relating to its 2025 annual meeting of stockholders. The definitive proxy statement will be filed with the Securities and Exchange Commission within 120 days of the registrant’s fiscal year ended December 31, 2024.
Table of Contents
As used in this report, the terms “Impinj,” “the Company,” “we,” “us” and “our” refer to Impinj, Inc., unless the context indicates otherwise.
Risk Factors Summary
Our business is subject to numerous risks and uncertainties, including those highlighted in the section of this report captioned “Risk Factors.” These risks include, but are not limited to, the following:
•we operate in a very competitive market;
•RAIN adoption is concentrated in key markets and the extent and pace of RAIN market adoption beyond those markets is uncertain;
•our ability to deliver enterprise solutions at scale are nascent;
•poor product quality could result in significant costs to us and impair our ability to sell our products;
•end users and partners must design our products into their products and business processes;
•an inability or limited ability of end user systems to exploit RAIN information may adversely affect the market for our products;
•alternative technologies may enable products and services that compete with ours;
•we obtain the products we sell through a limited number of third parties with whom we do not have long-term supply contracts;
•shortages of silicon wafers, integrated-circuit, or IC, post-processing capacity or components used in our readers and gateways may adversely affect our ability to meet demand for our products and adversely affect our revenue and/or gross margins;
•we rely on a small number of customers for a large share of our revenue;
•our ability to affect or determine end-user demand is limited in part because we sell and fulfill primarily through partners and rarely directly to end users;
•our growth strategy depends in part on the success of strategic relationships with third parties and their continued performance and alignment;
•if we are unable to protect our intellectual property, then our business could be adversely affected;
•we have been and may in the future be party to intellectual property disputes which could be time consuming and costly to prosecute, defend or settle, result in the loss of significant rights and adversely affect RAIN adoption or adoption of our products or platform;
•we have a history of losses and have only achieved profitability periodically and we cannot be certain that we will attain or sustain profitability in the future;
•we have a history of significant fluctuations in our quarterly and annual operating results;
•our executive officers, directors and principal stockholders, together with their affiliates, beneficially owned approximately 51.3% of our outstanding common stock as of December 31, 2024, and as a result are able to exercise significant influence over matters subject to stockholder approval; and
•we may not have sufficient cash flow or access to cash necessary to satisfy our obligations under the $287.5 million aggregate principal amount 1.125% convertible senior notes due 2027, also referred to as the 2021 Notes, and our current and future indebtedness may restrict our business.
NOTE REGARDING FORWARD-LOOKING STATEMENTS
This report contains certain forward-looking statements within the meaning of Section 27A of the Securities Act of 1933, as amended, and Section 21E of the Securities Exchange Act of 1934, as amended. Statements containing words such as “may,” “believe,” “anticipate,” “expect,” “intend,” “plan,” “project,” “projections,” “business outlook,” “estimate,” or similar expressions constitute forward-looking statements. You should read these statements carefully because they discuss future expectations, contain projections of future results of operations or financial condition or state other “forward-looking” information. These statements relate to our future plans, objectives, expectations, intentions and financial performance and the assumptions that underlie these statements. They include, but are not limited to, statements about:
•the adoption of RAIN technology and solutions;
•our ability to compete effectively against competitors and competing technologies;
•our market share and product leadership;
•our business model, strategic plans and product development plans;
•the impact of macroeconomic conditions on our business, operations and financial condition;
•the impact of wafer supply and availability on our business, operations and financial condition;
•our future financial performance, including our average selling prices, gross margins and the dependency of our future financial performance on macroeconomic conditions or industry trends;
•the performance of third parties on which we rely for product development, manufacturing, assembly and testing;
•our relationship with other third parties on which we rely for product distribution, sales, integration and deployment;
•our ability to adequately protect our intellectual property;
•the regulatory environment for our products and services; and
•our leadership in industry and standards-setting bodies.
Our actual results may differ materially from those contained in or implied by any forward-looking statements. Factors that could cause or contribute to these differences include those discussed below and elsewhere in this report, including those factors discussed in Part I, Item 1A (Risk Factors).
Considering the significant uncertainties and risks inherent in these forward-looking statements, you should not regard these statements as a representation or warranty by us or anyone else that we will achieve our objectives and plans in any specified time frame, or at all, or as predictions of future events. Moreover, neither we nor any other person assumes responsibility for the accuracy and completeness of any forward-looking statements. We undertake no obligation to publicly update any forward-looking statements, whether as a result of new information, future events or otherwise, except as required by law.
PART I
Item 1. Business
Overview
Our vision is a world in which every item that enterprises manufacture, transport and sell, and that people own, use and recycle, is wirelessly and ubiquitously connected to the cloud. And a world in which the ownership, history and linked information for every one of those items is seamlessly available to enterprises and people. We call our expansive vision a Boundless Internet of Things, or IoT. We design and sell a platform that enables that wireless item-to-cloud connectivity and with which we and our partners innovate IoT solutions.
Our mission is to connect every thing. We have enabled connectivity for more than 120 billion items to date, delivering item visibility and improving operational efficiencies for retailers, supply chain and logistics, or SC&L providers, restaurants and food-service providers, airlines, automobile manufacturers, healthcare companies and many more.
We are today focused on extending item connectivity from tens of billions to trillions of items, and delivering item data not just to enterprises but to people, so they too can derive value from their connected items. We believe the Boundless IoT we are enabling will, in the not-too-distant future, give people ubiquitous access to cloud-based digital twins of every item, each storing the item’s history and linked information and helping people explore and learn about the item. We believe that that connectivity will transform the world.
Impinj Platform
We and our partner ecosystem build item-visibility solutions using products that we design and either sell or license, including silicon RAIN radios; manufacturing, test, encoding and reading systems; and software and cloud services that encapsulate our solutions know-how. We sell two types of silicon integrated circuit, or IC, radios. The first are endpoint ICs that store a serialized number to wirelessly identify an item. Our partners embed endpoint ICs into an item or its packaging. The ICs may also contain a cryptographic key to authenticate the item. The second are reader ICs that our partners use in finished readers to wirelessly discover, inventory and engage the endpoint ICs. Those readers may also protect an item or consumer, for example by authenticating the item as genuine or privatizing the item by rendering the endpoint IC unresponsive without the consumer first providing a password. Our manufacturing, test and encoding systems enable partner products and facilitate enterprise deployments. Our reading systems comprise high-performance finished readers and gateways for autonomous reading solutions. Our software and cloud services focus on solutions enablement.
We sell our products, individually or as a whole platform offering primarily with or through our partner ecosystem. That ecosystem comprises original equipment manufacturers, or OEMs, tag service bureaus, original device manufacturers, or ODMs, systems integrators, or SIs, value-added resellers, or VARs, independent software vendors, or ISVs, and other solution partners.
Our radios follow the RAIN industry’s air-interface standard for their core reading functionality. We create partner and enterprise preference for our radios and solutions by adding differentiated features into our products, supporting those features across our platform and licensing them where appropriate, to deliver solutions capabilities and performance that surpasses mix-and-match solutions built from competitor products.
We are a leader in the RAIN market. We spearheaded developing the RAIN air-interface standard, lobbied governments to allocate radio spectrum and cofounded the RAIN industry alliance that today has more than 150 member companies. Our industry uses free spectrum in 81 countries encompassing roughly 95% of the world’s GDP. We believe RAIN’s capabilities – endpoint ICs with serialized item identifiers, battery-free operation, 30-foot range, not line-of-sight readability, up to 1,000 reads per second, essentially unlimited life and available cryptographic authentication, all at a cost of pennies per item – position RAIN to be the leading item-to-cloud connectivity technology for the IoT. We believe our
success derives from the capabilities and performance of our enterprise solutions, and the visibility those solutions give enterprise to items they manufacture, transport and sell.
RAIN market adoption has historically been slower than we and industry sources have anticipated. For more information related to market adoption, please see the section of this report captioned “Risk Factors.”
Endpoint ICs
Our endpoint IC product family comprises miniature radios-on-a-chip that sell for pennies yet can wirelessly connect almost any item. Each IC attaches to a host item and includes a number to identify the item. The IC may also include or enable features such as user data storage, security, authentication, loss prevention, privacy protection and value-added Impinj custom capabilities, all accessible by our platform.
Our OEM partners typically attach an endpoint IC to a printed or etched antenna on a paper or PET backing, then cover the composite inlay with a paper face to form a tag. More recently, some of our partners have begun embedding the endpoint IC into wire, thread or woven tags. Enterprises attach or embed the tags onto or into items in retail, SC&L, healthcare, automotive, sports, industrial and manufacturing, consumer experience, datacenter, travel, food, banking and other use cases. Regardless of the method by which our partners attach or embed an endpoint IC onto or into an item, we refer to an IC and its host item as an endpoint.
When a consumer purchases an item, a store or supplier will typically procure another item to sell, including another endpoint IC. We believe endpoint ICs represent the first market for consumable silicon and are a reoccurring revenue source for us.
Systems
Our systems comprise our reader ICs; manufacturing, test, encoding and reading systems; and software and cloud services. We and our partners engineer solutions that typically include several of our systems products and endpoint ICs, and often our entire platform. We and they sell those solutions to enterprise end users.
Our reader IC product family comprises multiple products, tiered by performance and functionality, that our OEM and ODM partners use in their mobile or handheld readers, fixed readers, gateways, appliances and other edge devices. We offer easy-to-use application programming interfaces, or APIs, development environments, sample code, drivers and libraries to facilitate partner reader development. We leverage our solutions learnings to continually improve the firmware in our reader ICs. We sell our reader ICs for tens of dollars.
Our reader product family comprises multiple finished products tiered by performance and functionality. Our gateways integrate our readers with beamforming antennas to electrically steer a radio beam like a radar, locating and tracking items in one or two dimensions. Our readers and gateways are easy to deploy and use, can be powered via power-over-Ethernet, or PoE, and are certified for operation in more than 40 countries. They wirelessly provide power to, and communicate bidirectionally with, endpoint ICs on host items. They also read, write, authenticate and engage the endpoint ICs on those items.
Our readers and gateways include software and algorithms that allow us and our partners to solve enterprise business problems such as retail self-checkout and loss prevention. Our software and algorithms run either on our readers and gateways or partly on them and partly on partner devices. We also sell readers and software to encode endpoint ICs. We sell our readers and gateways through distributors, SIs, VARs and solution providers for hundreds to thousands of dollars.
With our acquisition of Voyantic Oy, we sell test and measurement solutions. Finally, we also offer a cloud service to authenticate items.
Competitive Advantages
We believe we can extend our RAIN market leadership by leveraging our competitive strengths, including:
•Platform. Our platform incorporates enhanced functionalities, including extensions to the RAIN air-interface, that we believe improve solution performance, capabilities, reliability and ease-of-use and allow us to surpass mix-and-match solutions built from competitor components.
•Market Leadership. We believe we are the only company with an integrated platform spanning endpoint ICs, reader ICs, readers and gateways, test and measurement solutions and software and cloud services.
•Technology Leadership. Our singular RAIN focus has enabled us to regularly be first-to-market with innovative, high-performing products. Our chief executive officer is a recognized industry thought leader, a prior director of the RAIN Alliance and prior editor of the RAIN radio standard.
•Partner Ecosystem. Our worldwide partner ecosystem, comprising hundreds of tag and reader ODMs and OEMs, distributors, SIs, VARs and software solution partners gives us market reach, penetration and scale we believe few, if any, of our competitors enjoy.
•Trusted Brand. We believe our industry leadership, name recognition and reputation for innovative, high performing, quality products have significantly contributed to our leading market position.
•Intellectual Property. We believe we have the leading RAIN patent portfolio. As of December 31, 2024, our portfolio included 294 issued and allowed U.S. patents, six issued international patents, 18 pending U.S. patent applications and 13 pending international patent applications.
Industry Use Cases
The following use cases are representative of RAIN deployments we serve today.
Retail
Retailers, both traditional brick-and-mortar and online, apply billions of RAIN tags each year, historically to retail apparel and footwear but today, increasingly, to retail general merchandise such as home goods, health and beauty items, tires, toys, sporting goods, automotive parts, consumer electronics and other items. Retailers can obtain these benefits using our platform:
•In-store Inventory Visibility. Our platform delivers accurate and timely data about a retailer’s product inventory, allowing retailers to reduce inventory and increase same-store sales by ensuring each store is properly stocked and allowing staff to focus on customers rather than on inventorying or finding items.
•Omnichannel Fulfillment. The cornerstone of successful omnichannel fulfillment is inventory visibility in stores and warehouses. Our platform can deliver that visibility and thereby facilitate online sales, including online purchasing with pickup in store. It can also help retailers sell from any retail location, confidently sell to the last item and facilitate seamless returns.
•Self-checkout and Loss Prevention. Consumer self-checkout is a clear opportunity for retailers looking to modernize their in-store experience. However, self-checkout requires effective loss prevention. Our platform can enable both – self-checkout via sales terminals that read endpoint ICs on item, and loss prevention that scans the RAIN tags for unsold items leaving the store. As our inlay partners focus on embedding RAIN tags directly into items, we focus on key innovations like our patented Protected Mode that allows a tag to require a PIN for post-point-of-sale readability, enabling loss-prevention solutions to focus on unsold
items while satisfying General Data Protection Regulation, or GDPR, and similar consumer privacy requirements.
Supply Chain and Logistics
SC&L includes shipping companies, third-party logistics providers, postal organizations, captive distribution and other organizations that transport products worldwide. SC&L organizations are increasingly demanding real-time shipping data to virtualize, analyze and optimize their operations. SC&L companies can obtain these benefits using our platform:
•Shipment Verification and Parcel Tracking. Our platform provides real-time data about items passing through dock doors to the systems that run shipping and receiving, helping SC&L companies reduce mistakes, automate processes and drive operational efficiencies.
•Conveyor Sortation. Our platform enables high-speed, real-time, not-line-of-sight reading of packages moving along conveyors, improving sortation accuracy and reducing shipping errors.
•Returnable Transit Item, or RTI, Tracking. By tagging RTI containers, our platform can reduce RTI loss and ensure SC&L companies have the RTI containers they need.
•Asset Management. Our platform enables automated asset check-in/out procedures and location monitoring, reducing loss and improving efficiencies and maintenance-schedule compliance.
Other Industries
These other industries can also obtain benefits using our platform:
•Automotive. Car manufacturers use our platform to track and verify automotive parts for vehicle assembly, reducing mistakes and labor costs and improving operations.
•Aviation. Luggage tags that incorporate our endpoint ICs help airlines give passengers real-time information about their checked bags as well as reduce lost bags.
•Banking. Banks use our endpoint ICs for money bundles and to track information-technology assets.
•Datacenters. Datacenters use our platform for asset tracking.
•Food. Our reader ICs track syrup cartridges for replenishment in soda fountains. Our endpoint ICs track meat, fish and fresh produce for freshness as well as inventory visibility.
•Healthcare. Hospitals use our platform to track assets and manage patient and clinician workflows. Partner products built on our platform include RAIN-enabled medical cabinets and refrigerators.
•Industrial and Manufacturing. Industrial companies track components to increase manufacturing productivity and reduce shipping errors. Manufacturers use our platform to track assets and tools, reducing errors and increasing calibration compliance.
•Linen and Uniform Tracking. Laundry providers embed washable tags into their linens and uniforms for automated sortation.
•Sports. Marathons and other foot races track runners via our endpoint ICs in race bibs. Golf venues score participants’ shots via our endpoint ICs inside golf balls.
•Travel. Driver licenses in some states in the United States include our endpoint ICs to speed border crossings. Fueling stations use vehicle windshield tags to enable automatic and cashless fueling.
Growth Strategies
To continue growing our business and our opportunities, we plan to focus on the following strategic areas:
•Enterprise Solutions: We will continue developing solutions to previously unsolved enterprise business problems. As we mature those solutions, we will focus on solutions repeatability with top-tier partners.
•RAIN silicon: We will continue investing in endpoint IC and reader IC performance, differentiated features, cost reduction and platform integration to win opportunities across markets and geographies.
•Platform preference: We will continue investing in differentiated product capabilities, cloud services, solutions software and algorithms, and test and measurement solutions to enhance our platform’s reach and breadth and enable new use cases and recurring-revenue opportunities.
Sales and Marketing
We have a worldwide sales team with expertise in enterprise solutions, endpoint ICs, reader ICs, readers and gateways, and test and measurement solutions. We primarily sell through our global ecosystem of hundreds of partners as follows:
•Endpoint ICs: Directly to inlay and tag OEMs.
•Solutions: Directly to a small number of lighthouse enterprises, servicing the rest of the market with and through partners.
•Reader ICs: Through distribution to handheld- and fixed-reader OEMs and ODMs.
•Readers and gateways: Through distribution to solutions providers, VARs and SIs.
•Test and measurement solutions: Directly to inlay and tag OEMs, certification bodies and enterprises.
•Cloud services: Access-based services.
We engender preference for our platform in all our sales engagements, encouraging enterprises and partners to use our entire platform. Our business development, product marketing, technical and systems engineers actively engage those enterprises and partners to create awareness, joint solutions, joint selling and sales enablement.
The following table presents revenue concentration from our major customers representing 10% or more of total revenue for the periods presented:
| | | | | | | | | | | | |
| | Year Ended December 31, | |
| | 2024 | | | 2023 | | | 2022 | |
Revenue: | |
| | |
| | |
| |
Customer A | | | 28 | % | | | 33 | % | | | 28 | % |
Customer B | | | 17 | | | | 11 | | | | 10 | |
Customer C | | | 15 | | | * | | | * | |
| | | 60 | % | | | 44 | % | | | 38 | % |
* Customer accounted for less than 10% of total revenue in the period.
Manufacturing
We outsource most of our product manufacturing to third parties that build our products to our specifications, manufacturing only a small portion of our products, principally some of our test and measurement solutions, ourselves. This capital-efficient operating model scales efficiently with volume, allowing us to focus our resources on developing new products and solutions.
Taiwan Semiconductor Manufacturing Company Limited, or TSMC, manufactures our endpoint IC wafers primarily in Taiwan and has been our supplier since 2003. We order endpoint IC wafers on a
purchase-order basis and do not have a long-term supply agreement with TSMC. We test the wafers primarily in Asia. We use multiple subcontractors to post-process the wafers including Stars Microelectronics (Thailand) Public Company Limited, or Stars, Chipbond Technology Corporation, or Chipbond, and Unisem Group, or Unisem. We generally engage all our endpoint IC subcontractors on a purchase-order basis.
TSMC manufactures our reader IC wafers in Asia and has been our supplier since 2021. We order our reader IC wafers on a purchase-order basis and do not have a long-term supply agreement with TSMC. We package and test our reader ICs in Asia. We primarily engage our reader IC subcontractors on a purchase-order basis.
Plexus Corp., or Plexus, manufactures our readers and gateways in Asia and has been our supplier since 2005. We order readers and gateways pursuant to non-exclusive purchase agreements that automatically renew each year, subject to each party’s right to terminate on 180 days’ notice. We use subcontractors on a purchase-order basis to assemble and test printed circuit boards, to build our reader and gateway enclosures and to test our readers and gateways.
We manufacture our test and measurement solutions in Finland, at Voyantic Oy, which we acquired in April 2023. This acquisition added label design, manufacturing and test systems to our platform offering.
Research and Development
We built our company on a foundation of technology leadership, innovation and best-in-class products. Throughout our history we have committed, and we plan to continue committing, significant resources to technology, innovation and product and solutions development. We believe we have achieved our leading market position by continuously improving our product performance, features, quality and reliability while reducing costs, and we plan to invest to continue doing so.
In most situations, we strive to lead the market with new products and innovations, but we sometimes adopt a more deliberate approach depending on the situation. As one example, our nearest endpoint IC competitor migrated from 200mm wafers to 300mm wafers before we did. That migration caused the inlay OEMs to gradually retrofit their inlay assembly machines to handle 300mm wafers. In the meantime, we focused on an endpoint IC process-node migration, which we completed in 2020. Our first products in that process node, the Impinj M730 and M750, were not only on 300mm wafers, but had roughly twice as many ICs per wafer as that competitor and entered the market with the inlay OEMs already able to process 300mm wafers. We then introduced our newest endpoint IC products, the Impinj M830 and M850, in 2023, with approximately 25% more die per wafer than the M700 family and the inlay OEMs again able to immediately assemble the 300mm wafers.
We have a team of skilled engineers that today conduct all our research and most of our product development internally. As of December 31, 2024, we had 241 employees in research and development. We regularly review our technology, products and market development opportunities and reallocate our spending and resources accordingly.
Intellectual Property
We protect our technologies by filing patent applications, retaining trade secrets and defending and enforcing our intellectual property rights where appropriate. As of December 31, 2024, our intellectual property portfolio includes 294 issued and allowed U.S. patents, six issued international patents, 18 pending U.S. patent applications and 13 pending international patent applications. Of our 284 utility patents, 16 will expire in 2025 and of our four design patents, none will expire in 2025. To protect confidential information not otherwise subject to patent protection, we rely on trade secret law and enter into confidentiality agreements with our employees, customers, suppliers and partners.
Because most RAIN products are used in the United States, and because most of our partners, end users and competitors have U.S. operations, we believe U.S. patents hold the most value for our business. Consequently, we have primarily filed U.S. patent applications. Because our portfolio currently comprises mostly U.S. patents, we have limited ability to assert our IP rights outside the United States.
Although our patents and trade secrets are valuable assets, we do not view any one of them as material. Instead, we believe the totality of our patent and trade-secret portfolio creates an advantage for our business.
We have also entered into certain inbound and outbound intellectual property licenses and cross-licenses with other companies. For example, we have licenses to third-party IP we use in our products. As another example, by participating in developing GS1 EPCglobal protocols, such as the RAIN radio protocol, we agreed to license those of our patents necessary to practice those protocols on a royalty-free basis to other GS1 EPCglobal members, subject to reciprocal royalty-free rights from those members. By participating in developing International Organization for Standardization, or ISO, standards, we agreed to grant to all users worldwide a license to those of our patents necessarily infringed by the practice of several ISO standards, including RAIN and non-RAIN, on reasonable and nondiscriminatory terms, here again subject to reciprocity. In addition to the above and other licenses, we as well entered into a broad patent cross-license agreement as a part of a legal settlement. For further information on this agreement, see note 12 of our consolidated financial statements included elsewhere in this report.
We own several trademarks and develop names for our new products and secure trademark protection for them, including domain name registration, in relevant jurisdictions.
Alliances and Standardization
Our platform uses the RAIN technology we pioneered. We spearheaded developing the RAIN radio standard, lobbied governments to allocate frequency spectrum and, along with Google, Intel and Smartrac, cofounded the RAIN Alliance. A member of our management team is currently a RAIN Alliance Director. The Alliance is a global organization promoting the universal adoption of RAIN technology and solutions, with more than 150 members as of December 31, 2024.
We, our enterprise end users, partners and competitors developed the RAIN radio protocol, whose technical name is EPC™ Radio-Frequency Identity Protocols Generation-2 UHF RFID (standardized as ISO/IEC 18000-63 and known colloquially as Gen2) in 2004, with us as editor. Our community delivered backward-compatible updates to this protocol in 2013 and in 2024, both times again with us as editor. Our industry uses the RAIN radio protocol nearly exclusively.
In 2024, we introduced enhancements to the radio and logical layers of the RAIN radio protocol that speed inventory, increase tag read range, declutter the tag environment, protect consumers, inhibit label and item counterfeiting and reduce solution cost. We call these enhancements Gen2X.
By participating in GS1 EPCglobal, which produced Gen2, and ISO, which ratified 18000-63, as well as in other standards bodies, we agreed to license certain necessary patents as described in the section captioned “Intellectual Property.”
Government Regulations
Government regulations require us to certify our readers and gateways in jurisdictions where they operate. For example, we certify our readers and gateways to Federal Communications Commission regulations to operate in the United States and its territories. Our readers and gateways are certified for operation in more than 40 countries worldwide including the United States, Canada, Mexico, China, Japan, South Korea and all of the European Union. The effects of compliance with applicable government regulations are currently not material to our results of operations, capital expenditures or competitive position. However, compliance with changes to existing or new regulations may have material adverse effect on our future results of operations, capital expenditures and competitive position. For more information, see the section of this report captioned “Risk Factors.”
Competition
Each of our competitors competes with some, but not all, of our products. Our primary competition includes:
•Endpoint ICs: NXP B.V., or NXP, EM Microelectronic, Kiloway, Quanray, Shanghai Fudan Microelectronics Group, Alibaba and Alien Technology Corporation, or Alien.
•Reader ICs: Phychips Inc, Shanghai Fudan Microelectronics Group and MagicRF.
•Readers and gateways: Most major reader and gateway suppliers leverage, or have a stated intent to leverage, our platform.
•Test and measurement solutions: CISC Semiconductor GmbH, or CISC.
The markets for RAIN, our platform and our products are highly competitive. New entrants can and do come into our market at any time, and we expect competition to increase as the market and end-user adoption grow. The competitive factors that impact our platform and product sales include:
•portfolio, performance, features, lead times, quality, reliability and price;
•development tools, support, ease of use and reference designs;
•integration and certification with enterprise applications;
•APIs (except in the endpoint IC market);
Although we believe we compete favorably on the above factors, our future competitiveness will depend on our ability to design, develop and deliver compelling products and enable compelling enterprise solutions.
Because our product pricing is denominated in U.S. dollars, we sometimes experience competitive pressures due to prevailing exchange rates. In addition, our competitive position depends on our ability to continue attracting and retaining talent while protecting our IP. For additional information on the risks associated with our business, see “Risk Factors.”
Employees and Culture
Principals and Culture
We firmly believe our success stems, first and foremost, from our corporate culture. Our principles underpin that culture and guide everything we do, from hiring to business relationships to our work ethic. They embody our core objective of making the world a better place. More information on our principles is available at www.impinj.com/about-us/our-principles.
As of December 31, 2024, we had 451 employees in the Americas, Europe and Asia Pacific. Most of our employees are not represented by a labor union.
Compensation
Our people are the foundation of our success. We provide competitive compensation and benefits, as well as equity awards to all eligible employees because we believe all contribute to, and should share in, our long-term success. Additionally, eligible employees participate in our annual variable-performance-based cash bonus plan.
We also offer broad benefits packages that we believe provide the time, resources and flexibility to support the well-being of our employees and their families. Benefits vary by country and meet or exceed all applicable laws and regulations.
Pay Equity
We comply with federal, state and local laws and regulations and are committed to pay equity. We proactively review compensation for all roles at least annually. Our executive leadership team reviews and approves all compensation.
Commitment to Diversity, Equity and Inclusion (DEI)
Our employees from around the globe, each of whom bring varied backgrounds, viewpoints and experiences, form the heart of everything we do. We strengthen who we are and what we can achieve by fostering a diverse and inclusive culture built on respect, equity and collaboration.
Our Diversity, Equity and Inclusion, or DEI, program focuses on making DEI part of our DNA. We build and empower underrepresented populations across our workforce and cultivate an environment where everyone can belong, contribute and be their authentic selves. All employees complete training on the importance of diversity, equity, inclusion and avoiding bias, and on recognizing and preventing harassment and discrimination. We continually work to educate ourselves, learn from others, identify issues, improve our recruiting practices, engage in respectful and constructive dialogue and advance community initiatives.
We do not tolerate discrimination, harassment or impropriety of any kind. We are an equal-opportunity employer and do not discriminate based on race, religion, color, national origin, sex, gender, gender expression, sexual orientation, age, marital status, veteran status, disability status or any other classification.
Training and Development
Our employees are our company. We focus on nurturing each employee individually, rewarding their unique contributions and providing a runway for their career growth. Our leaders strive to provide what each employee needs to thrive.
Employees and managers meet frequently to set and evaluate personal goals as part of a larger program to empower teams to deliver and succeed.
To help our employees excel, we put significant effort into employee training and learning. We facilitate personal and professional development by offering a variety of tools and opportunities to support employee growth, ranging from training programs for new leaders, advanced skills programs for more experienced leaders, technical training and tuition reimbursement. We strive to create a work environment where information sharing is valued, encouraged and recognized because we believe the best learning experiences come from working alongside others.
Available Information
We were incorporated in Delaware in April 2000. Our principal executive office is located at 400 Fairview Avenue North, Suite 1200, Seattle, Washington 98109. Our telephone number is (206) 517-5300. Our website is www.impinj.com. Information contained in, or that can be accessed through, our website is not a part of, and is not incorporated into, this report.
Our filings with the Securities and Exchange Commission, or SEC, including our annual reports on Form 10-K, quarterly reports on Form 10-Q, current reports on Form 8-K, as well as amendments to those reports are available on our website at www.investor.impinj.com, free of charge, as soon as reasonably practicable after the electronic filing of those reports with the SEC. The information contained on our website is not a part of this report or any other document we file with the SEC.
Item 1A. Risk Factors
You should carefully consider the following risk factors, in addition to the other information contained in this report, including the section of this report captioned “Management’s Discussion and Analysis of Financial Condition and Results of Operations” and our financial statements and related notes. If any of the events described in the following risk factors and the risks described elsewhere in this report occur, then our business, operating results and financial condition could be materially impacted. This report also contains forward-looking statements that involve risks and uncertainties. Our actual results could differ materially from those anticipated in the forward-looking statements due to factors that are described below and elsewhere in this report.
Risks Relating to Our Platform, Products and Technologies
We operate in a very competitive market.
Our primary competitors are:
•Endpoint ICs: NXP, EM Microelectronic, Kiloway, Quanray, Shanghai Fudan Microelectronics Group, Alibaba and Alien.
•Reader ICs: Phychips Inc, Shanghai Fudan Microelectronics Group, MagicRF and NationRFID.
•Readers and gateways: Most major reader and gateway suppliers leverage, or have a stated intent to leverage, our platform.
•Test and measurement systems: CISC.
These competitors include companies that have much greater financial, operating, research and development, marketing and other resources than us. To gain market share, they could discount their products and accept lower margins, or they could maintain margins by achieving cost savings through better, more efficient designs or production methods. They could devote more resources than we can to product development, promotion, sales and support. They could also bundle other technologies, including those we do not have in our product portfolio, with their RAIN products.
Our partners, including our OEMs, ODMs, distributors, SIs, VARs and solution partners, may choose to compete with us rather than purchase our products, which would not only reduce our customer base but also increase competition in the market. Companies in adjacent markets or newly formed companies may decide to enter our market, particularly as RAIN adoption grows. Further, the Chinese government has made development of the Chinese semiconductor industry a priority, potentially increasing competition for us globally while possibly restricting our ability to participate in the Chinese market.
RAIN adoption is concentrated in key markets and the extent and pace of RAIN market adoption beyond those markets is uncertain.
Our financial performance depends on the pace of end-user RAIN adoption in key markets, such as retail apparel (our largest market) retail general merchandise and SC&L. Although RAIN has been adopted to some degree by end users in those markets, those end users as well as the markets themselves are subject to business cycles and macroeconomic trends. Continued RAIN adoption by those end users and in those markets may be at risk if and when negative business or economic conditions arise.
The RAIN opportunity is still developing. RAIN adoption, as well as adoption of our platform and products, depends on many factors, including the extent to which end users understand and embrace the benefits that RAIN offers; whether the benefits of RAIN adoption outweigh the cost and time to replace or modify end users’ existing systems and processes; and whether RAIN products and applications meet end users’ current or anticipated needs.
We have, at times, anticipated and forecasted a pace of end-user adoption that exceeded the actual pace of adoption. We expect continued difficulty forecasting the pace of adoption. As a result, we may be
unable to accurately forecast our future operating results including revenue, gross margins, cash flows and profitability, any or all of which could negatively impact our financial performance.
We must introduce new products, product enhancements and services to compete effectively.
We introduce new products and services to advance our business, satisfy increasingly demanding end-user requirements and grow RAIN market adoption. We commit significant resources developing and introducing these new products and services, and to improving the performance and reliability of, and reducing the costs of, our existing products and services.
Whether our new or enhanced products and services will succeed is uncertain. Our success developing the technologies, processes or capabilities necessary or desired for new or enhanced products and services, or licensing or otherwise acquiring them from third parties, and our ability to introduce new or enhanced products and services before our competition, depends on many factors, including:
•our ability to identify new product capabilities or services that end users will widely adopt;
•our timely and efficient completion of the design process;
•our timely and efficient implementation of manufacturing, assembly and testing procedures;
•our attainment of appropriate product or service performance levels and product certifications;
•partnering successfully with others to deliver complementary products or services;
•the quality, reliability and selling price of our product or service; and
•the effectiveness of our marketing, sales and support.
When we introduce new products and services, our success in ramping adoption depends, in part, on us making those products and services easy for our partners and end users to deploy and use. For example, when we launched our M800-family endpoint ICs, we supported our inlay partners in producing high-performing, high-quality M800-based inlays. Without this support, M800 adoption would have been delayed, and our operating results would have suffered. We cannot guarantee that we will be able to provide sufficient support for future products, in which case our operating results could suffer.
Our ability to deliver enterprise solutions at scale are nascent.
We believe we are still at a very early stage in our ability to deliver enterprise solutions. If we do not succeed in identifying, developing, selling and deploying enterprise solutions with top-tier partners and end users across a range of markets and use cases, then our business prospects will suffer.
We have developed, and continue developing, solutions for retail self-checkout and loss prevention and SC&L package routing that have been, or that we expect to continue being, deployed by industry-leading enterprise end users. We have also launched features in Gen2X that we believe will improve RAIN’s ability to deliver cost-effective solutions to enterprises. However, to fully capitalize on our platform's potential, we must make our current offerings repeatable across multiple enterprises and in a variety of market segments. We must also develop relationships with top-tier solution partners to gain access to and address challenging new use cases.
We and our partners may be unable to successfully acquire customers for our enterprise solutions, or to successfully address our market opportunity. Delivering enterprise solutions requires a network of partner products and services that complement our own and that together address enterprise needs. Convincing enterprises to partner with us to solve their business problems—including evaluation, design, deployment, operations and services, as well as integrating RAIN data into the enterprise's information systems—requires tight coordination among our and our partners' sales, marketing, operations and engineering teams. If we do not build our enterprise solutions platform and our partner network to deliver these solutions effectively, our business prospects will suffer.
We rely on endpoint IC sales to generate most of our revenue.
We derive, and expect to continue to derive, most of our revenue from our endpoint ICs. If demand declines, or if we are unable to procure enough wafers to meet the demand we have, or if we are unable to raise prices to offset cost increases, then our business and operating results will suffer. In addition, the continued adoption of, and demand for, our endpoint ICs, derives in part from us demonstrating the benefits of using our systems. If we fail to establish those benefits then we may be unsuccessful in countering competitive endpoint IC price pressures and our business and operating results could be adversely affected.
The average selling prices of our products could fluctuate substantially.
The average selling price, or ASP, of our products has historically decreased with time or to meet end-user demands, encourage adoption, address macroeconomic conditions or respond to competitive pressure. As demand for older products declines, or as competition from competitors with lower product costs or lower profitability expectations increases, or during times of oversupply, ASPs may decline quickly.
To compete profitably, we must continually improve our technology and processes, reduce unit costs in line with lower selling prices, and introduce new, higher margin products. If we are unable to offset ASP reductions with increased sales volumes or reduced product costs, or if we are unable to introduce new products that command higher prices and better gross margins, then our overall revenue and gross margins will suffer.
Though less common, we have also increased prices from time to time, especially during times of increasing wafer costs. For example, we raised prices in 2021, 2022 and 2023 to accommodate higher costs. We may be required to raise prices again if macroeconomic conditions, including inflation, create upward pressure on our product costs. Increased prices could dampen adoption and market growth.
Pricing commitments and other restrictive provisions in our customer agreements could adversely affect our operating results.
In the ordinary course of our business, we enter into agreements containing pricing terms that could, in some instances, adversely affect our operating results and gross margins. For example, some contracts specify future IC, reader or gateway pricing or contain most-favored-customer pricing for certain products. Other agreements may contain exclusivity terms that prevent us from pursuing certain business with other customers during the exclusivity period. Reducing prices or offering favorable terms to one customer could adversely affect our ability to negotiate favorable terms with other customers.
Changes in our product mix could adversely affect our overall gross margin.
Endpoint IC sales, which constitute and likely will continue to constitute the majority of our product revenue, have, for the most part, lower gross margins than our systems product sales. Our overall product gross margins are affected by product mix, which can fluctuate based on supply and demand, competitive pressures and end-user needs and demand. A shift in sales mix away from our higher margin products to lower margin products, either within our endpoint IC product portfolio or from our systems business to our endpoint ICs, could negatively affect our gross margins.
Poor product quality could result in significant costs to us and impair our ability to sell our products.
Our products must meet increasingly demanding specifications for quality, reliability and performance. Our products are both highly technical and deployed in large, complex systems in which errors, defects or incompatibilities can be problematic for our partners and end users.
If we are unable to identify or correct errors, defects, incompatibilities or other problems in our products, we could experience:
•loss of customer orders or customers;
•lost or delayed market acceptance (either of our products and solutions or RAIN generally);
•damage to our brand and reputation;
•impaired ability to attract new customers;
•diversion of development resources;
•increased service and warranty costs;
•legal actions by our partners or end users; and
•increased insurance costs.
Moreover, if we encounter product quality issues, then we may be required to incur significant time and costs to diagnose, test and fix the issues. There can be no assurance that such remediation efforts would be successful. Even if successful, these efforts could further constrain our ability to supply our partners and end users with new products until we have resolved the issues.
End users and partners must design our products into their products and business processes.
Persuading end users or partners to design our products into their business processes or products requires educating them about RAIN’s and our products’ value. They may use other technologies or products and may not be receptive to introducing RAIN into their business processes or products. Even when convinced, they often undertake long pilot programs and qualifications prior to placing orders. These pilot programs and qualifications can be time-consuming and expensive, and there is no assurance they will result in an order for our products. If we fail to develop new products that adequately or competitively address end users’ or our partners’ needs, then we may not receive product orders, which could adversely affect our business, prospects and operating results.
Our visibility into the length of the sales and deployment cycles for our products is limited.
We have limited visibility into end user sales and deployment cycles, and these cycles are often longer than we anticipate. Many factors contribute to our limited visibility, including the time our partners and end users spend evaluating our products, the time educating them on RAIN’s benefits and the time integrating our products with end users’ systems. The length and uncertain timing of the sales and deployment cycles can lead to delayed product orders. In anticipation of those orders, we may incur substantial costs before the sales cycle is complete and before we receive any customer orders or payments, if we receive them at all.
An inability or limited ability of end user systems to exploit RAIN information may adversely affect the market for our products.
A successful end-user deployment requires not only tags and readers or gateways, but RAIN integration with information systems and applications that create business value from the RAIN data. Unless third parties continue developing and advancing business analytics tools, and end users enhance their information systems to use these tools, RAIN deployments could stall. Our efforts to foster third-party development and deployment of these tools could fail. In addition, our guidance to business-analytics providers for integrating our products with their tools could prove ineffective.
Solution providers and SIs are essential to the RAIN market. They provide deployment know-how to enable end users to successfully deploy RAIN solutions. Integrating our products with end-user information systems could prove more difficult or time-consuming than we or they anticipate, which could delay deployments.
Alternative technologies may enable products and services that compete with ours.
Technology developments may affect our business negatively. Breakthroughs in legacy RFID technologies or markets, including those using low frequency or high frequency RFID technology, or in other radio technologies, could adversely affect RAIN market growth and demand for our products.
Likewise, new technologies may enable lower-cost ICs than our products. If we are unable to innovate using new or enhanced technologies or are slow to react to changes in existing technologies or in the market, or if we have difficulty competing with advances in new or legacy technologies, then our development of new or enhanced products could be impacted and result in product obsolescence, decreased revenue and reduced market share.
Significant changes in RAIN standards bodies, standards or qualification processes could impede our ability to sell our products and services.
We have historically taken a leadership position in developing RAIN industry standards, including with GS1 and ISO, and have designed our products to comply with those standards. For any number of reasons we could lose that leadership position or our influence in standards development, or we could choose not to participate in certain standards activities.
New or changed industry standards could affect us negatively. If industry standards were to diverge from our or the RAIN market’s needs, then our products could fail in the market or cause end users to delay their deployments. Moreover, the adoption or expected adoption of new or changed standards could slow sales of our existing products before we can introduce new products that meet the new or changed standards, and could also limit our ability to implement new features. The lost opportunities as well as time and expense to develop new products or change our existing products to comply with new or changed standards could be substantial, and we may not ultimately succeed in developing products that comply with the new or changed standards.
Certain organizations develop requirements for RAIN tags and test tags against those requirements. For example, the ARC Program at Auburn University develops tag performance and quality requirements for end users that engage them. Some participants in the RAIN market are ARC sponsors, but we are not among them. If ARC or a similar organization fails to certify or delays certifying tags incorporating our endpoint ICs, adoption and sales of our products could suffer.
Changes in government spectrum regulations or in their enforcement could adversely affect our ability to sell our products.
Our readers and gateways are collectively certified for use in more than 40 countries worldwide, including the United States, Canada, Mexico, China, Japan, South Korea and every country in the European Union, or the EU.
Our products operate in spectrum bands where they are certified to transmit. If the spectrum regulations were to change, or if our products were found to be noncompliant despite being certified to operate, then we would need to redesign our products, potentially resulting in significant costs, including costs associated with obsolete inventory. Regulatory changes may also cause us to forego opportunities, adversely affecting our business.
In April 2024, NextNav Inc. asked the Federal Communications Commission, or FCC, to initiate a proceeding to reconfigure the 902–928 MHz ISM band, or Lower 900 MHz Band, in which we and other unlicensed services operate, to create a terrestrial backup to the U.S. Global Positioning System. To pay for their proposed system, NextNav also asked to be able to license certain spectral bands, including parts of the Lower 900 MHz Band, to others to deliver 5G broadband services. If approved as proposed, this ISM band reconfiguration could interfere with our RAIN radio transmissions and negatively impact us and our industry.
We and other RAIN providers and end users, as well as other Lower 900 MHz Band users, have already registered opposition to NextNav’s petition and asked the FCC to reject it quickly. If the FCC declines to do so, then we expect a protracted decision-making process. The FCC would be required to consider all relevant comments and material of record before it decides whether to proceed with the proposal, issue a new or modified proposal, or take no action on the proposal. The fate of NextNav’s petition is uncertain at this time, but if the FCC were to adopt NextNav's proposal and our end users were not able to use our RAIN products without harmful interference, then our business would be significantly and negatively affected.
Sales of some of our products could cannibalize revenue from other products.
Some of our partners develop products that compete with our products. For example, some of our OEM partners use our reader ICs to build and sell readers and gateways that compete with our readers and gateways. Similarly, some of our partners use our readers to build and sell gateways that compete with our gateways. If we fail to manage such conflicts successfully, then our business and operating results could be negatively affected.
Our licensing program is nascent.
While we believe we have valuable RAIN intellectual property and aspire to monetize that intellectual property by licensing it to third parties, including third parties who compete with us to some extent, our experience in doing so is nascent, and our ability to grow licensing revenue remains subject to numerous risks and uncertainties. To materially grow our licensing program and revenue, we will need to maintain and grow our intellectual property portfolio and continue to research and develop RAIN innovations that will generate and maintain demand for licenses to our technology and features. We must also develop and maintain an ability to monitor infringement of our intellectual property rights by others and possibly seek enforcement action against those who attempt to infringe our intellectual property rights. These enforcement actions could require significant investments in management time and attention as well as cash as we incur legal and other expenses. They could also compete with our objectives in other areas of our business such as wanting to maintain close, strategic relationships with important partners or end users of our products. These are just some of the risks and uncertainties we face with respect to our nascent licensing program.
We currently derive a substantial share of our licensing revenue from NXP, our primary endpoint IC competitor, based on our Settlement Agreement with them. For more information regarding the terms of our Settlement Agreement with NXP, please refer to Note 12 of our consolidated financial statements included elsewhere in this report. If NXP were to breach its license payment obligations, or if NXP were to design around our intellectual property rights and exercise its right to terminate our license before the end of the agreement's 10-year term, our licensing revenue would decline and our overall results of operations and cash flows would suffer.
Risks Relating to Our Personnel and Business Operations
We obtain the products we sell through a limited number of third parties with whom we do not have long-term supply contracts.
Our ability to secure cost-effective, quality products in a timely manner could be adversely affected by many factors, including:
•Third-party manufacturing capacity may not be available when we need it, particularly from our foundry partners from whom we procure silicon wafers.
•Efforts to diversify our supplier base may be unsuccessful or may not result in us obtaining the anticipated benefits of such diversification.
•Some products have long lead times, and we place orders for them many months before our anticipated delivery dates to our customers. If we inaccurately forecast customer demand, then we may be unable to meet our customers’ delivery requirements or we may accumulate excess inventory, increasing our costs.
•Supply disruptions may affect our ability to meet partner or end-user demand, whether in a cost-effective manner or at all, potentially causing those partners or end users to cancel orders, qualify alternative suppliers or purchase from our competitors. Supply disruptions can also distort demand, making it even harder to meet true demand.
If our suppliers fail to manufacture our products at reasonable prices or with satisfactory quality levels, then our ability to bring those products to market and our reputation could both suffer. If supplier capacity diminishes, whether from equipment failures, closures, bankruptcy, capacity allocation, in response to public health events (such as Covid-19), catastrophic loss of facilities or otherwise, then we could have difficulty fulfilling orders, our revenue could decline and our growth prospects could be impaired. Transitioning our product manufacturing to new providers would take many months and, in the case of ICs, could take years. Any transition would require a requalification by our customers or end users, which could also adversely affect our ability to sell our products as well as our operating results.
Shortages of silicon wafers, IC post-processing capacity or components used in our readers and gateways may adversely affect our ability to meet demand for our products and adversely affect our revenue and/or gross margins.
Wafer shortfalls limit sales and may cause market-share losses. We expect wafer capacity in at least some of the semiconductor nodes we use to be tight for the foreseeable future. We procure wafers on a purchase-order basis, so our wafer supply is not guaranteed, and we may not receive adequate supply from our foundry partners when shortages occur.
Wafer shortfalls may also artificially increase bookings as customers over-order our products, and then cause sales declines as those customers consume their accumulated inventory. Additionally, if our suppliers charge us more but we are unable to raise our prices to cover those higher costs, our gross margins and other financial results could suffer.
Shortfalls of our silicon products can also occur due to post-processing constraints. To convert the wafers we receive from our foundry partner into saleable ICs, we perform additional steps including testing, thinning, bumping and dicing. If our third-party suppliers are unable to efficiently perform these steps, and our production capacity is constrained as a result, we may be unable to satisfy demand for our products, and our financial results could suffer.
We may also experience shortfalls and price increases for components we use in our readers and gateways, as well as in packaging and test capacity for our reader ICs. Any such shortfalls or price increases will negatively impact our product availability and costs and our financial results will suffer.
We bear inventory risks because our products have relatively long lead times, demand for our products are hard to accurately forecast, and we rely on partners to sell and distribute our products.
We maintain inventory to meet customer demand. To guard against wafer shortages, and to allow for production risks given the relatively long lead times for our many of our products, we have in the past and may invest again in inventory to support anticipated business growth. When we introduce new products, we may also initially carry higher inventory or have slower inventory turns depending on market acceptance.
We typically order products from our suppliers based on partner forecasts before we receive purchase orders. However, many of our partners have difficulty accurately forecasting their demand and the timing of that demand, and sometimes cancel orders or reschedule product shipments, in some cases with little or no advance notice to us. Partners will also sometimes give us soft commitments for large orders that do not materialize. We have additional uncertainty arising from competition and from unanticipated external events, such as macroeconomic trends or events and changes in regulatory standards, all of which can adversely affect demand and consequently our inventory levels, sales and operating results.
High inventory levels can increase expenses or reserves and expose us to a higher risk of product obsolescence, especially when we introduce new products and technologies. If we are unable to sell the inventory we purchased, or if we must sell it at lower prices, then our business will be negatively impacted.
Acquisitions could result in operating difficulties, dilution and other harmful consequences.
We regularly evaluate potential strategic transactions, and we may pursue them if complementary to our business. For example, in April 2023 we completed our acquisition of Voyantic Oy, a global provider of RFID (primarily RAIN and NFC) inlay and label design, manufacturing and test systems.
Strategic transactions could be material to our financial condition and operating results. We have limited experience executing acquisitions. Integrating an acquired company, business or technology may create unforeseen operating difficulties and expenditures. Acquisition-related risks include:
•difficulties integrating acquired products or lines of business into our strategy and product plans;
•customers switching from us to new suppliers because of the acquisition;
•inability to retain employees from the business we acquire;
•challenges associated with integrating employees from the acquired company into our organization;
•difficulties integrating accounting, management information, human resource, legal and other administrative systems to permit effective management of the business we acquire;
•potential requirements for remediating controls, procedures and policies appropriate for a public company in the acquired business that, prior to the acquisition, lacked these controls, procedures and policies;
•potential liability for past or present environmental, hazardous substance or contamination concerns associated with the acquired business or its predecessors;
•possible write-offs or impairment charges resulting from the acquisition; and
•unanticipated or unknown liabilities relating to the acquired business.
Foreign acquisitions involve additional risks beyond those above, including those related to integrating operations across different cultures and languages, currency risks and the economic, political and regulatory risks associated with other countries. Also, the anticipated benefit of any acquisition, domestic or foreign, may not materialize. Future acquisitions or dispositions could result in potentially dilutive issuances of our equity securities, debt incurrence, contingent liabilities or amortization expenses or goodwill write-offs, any of which could harm our financial condition. Future acquisitions may require us to obtain additional equity or debt financing, which may not be available on favorable terms or at all.
Changes in global trade policies could have a material adverse effect on us.
Changes in U.S. and foreign laws and policies governing international trade, export controls, manufacturing, development and investment in the jurisdictions where we currently develop and sell products, and any negative consequences resulting from such changes, could materially affect our business.
The state of tariffs and other trade measures between the United States and China remains very uncertain. Starting in 2018, the U.S. and China engaged in an escalating imposition of tariffs and trade restrictions on each other’s products. The two countries signed a preliminary trade agreement in early 2020. However, in February 2025, the U.S. imposed additional tariffs on imports of Chinese-origin goods, and China announced retaliatory tariffs and additional trade restrictions on U.S. goods. Most of our products are not of Chinese or U.S. origin, so the direct impact of tariffs and other trade measures on our products is limited as long as current rules governing a product’s country of origin remain intact. However, China remains a key producer of goods our endpoint ICs connect, and a key producer of readers using our reader ICs, so the indirect impact of tariffs on our business, particularly in the short term, is uncertain and our business and financial results could be negatively affected by the trade tensions between the United States and China.
In February 2025, the United States imposed new tariffs on Mexico and Canada and has threatened member countries of the European Union with tariffs. The tariffs imposed on Mexico and Canada are currently suspended while negotiations take place for a long-term agreement. Here again, our endpoint ICs connect goods imported from these countries, so if the negotiations are not successful then our business could be negatively impacted.
In February 2025, the United States also threatened new tariffs on Taiwan, targeting imports of Taiwanese semiconductor products. Because our endpoint ICs are fabricated primarily in Taiwan, tariffs could have a direct impact on us. We import only a small portion of our wafers into the U.S., so we believe the direct impact of such a tariff should be manageable. But a large portion of products containing our endpoint ICs are imported directly into the United States. The indirect effects of new U.S. tariffs on these products could significantly and negatively affect our business and financial results.
The impact that these and any other trade measures will have on our business and financial results is difficult to predict, particularly because trade is a current focus of the U.S. administration and it is not possible to know how trading partners will respond to the administration’s proposals and actions. Various factors will determine their effect, including whether and when they are implemented and their amount, scope and nature.
We are subject to risks inherent in operating abroad and may not be able to successfully maintain or expand our international operations.
In 2024, we derived 77% of our total revenue from sales outside the United States. We anticipate growing our business, in part, by growing our international operations, which presents a variety of risks, including:
•changes, some unexpected or unanticipated, in regulatory requirements, taxes, trade laws, tariffs, export quotas, custom duties or other trade restrictions;
•lack of established, clear or fairly implemented standards or regulations with which our products must comply;
•greater difficulty in enforcing contracts, judgments and arbitration awards in international courts, and in collecting accounts receivable as well as longer payment and collection periods;
•limited or unfavorable intellectual property protection;
•misappropriation of our intellectual property;
•inflation and fluctuations in foreign currency exchange and interest rates;
•restrictions, or changes thereof, on foreign trade or investment, including currency-exchange controls, including as a result of sanctions against Russia;
•changes in a country’s or region’s political, regulatory, legal or economic conditions, including, for example, global and regional economic disruptions caused by any future public health outbreaks or pandemics, including a resurgence of Covid-19;
•political, social and economic instability abroad; wars and other armed conflicts, such as those in Ukraine; geopolitical tensions, such as those between the United States, China and Taiwan; and terrorist attacks and security concerns in general;
•differing regulations with regard to maintaining operations, products and public information;
•inequities or difficulties obtaining or maintaining export and import licenses;
•differing labor regulations, including where labor laws may be more advantageous to employees than in the United States;
•restrictions on earnings repatriation;
•corrupt or unethical practices in foreign jurisdictions that may subject us to exposure under applicable anti-corruption and anti-bribery laws such as the U.S. Foreign Corrupt Practices Act of 1977, as amended, and the United Kingdom Bribery Act of 2010; and
•regulations, and changes thereof, relating to data privacy, cybersecurity and the unauthorized use of, or access to, commercial and personal information, particularly in Europe.
We are subject to governmental export and import controls, and trade and economic sanctions that could impair our ability to compete in international markets and subject us to liability if we fail to comply.
We must export and import our products and conduct our business activities in compliance with U.S. export controls and trade and economic sanctions, including the Commerce Department’s Export Administration Regulations and economic and trade sanctions established by the Treasury Department’s Office of Foreign Assets Controls, as well as similar controls established in the countries in which we do business. For example, the U.S. government has continued to expand controls restricting the ability to send certain products and technology related to semiconductors and semiconductor manufacturing to and within China and additional destinations. These expanded controls include imposing additional licensing requirements on exports, re-exports, and transfers of certain ICs and products containing those ICs to and within China and additional destinations. In addition, the United States and other countries continue to expand the economic sanctions and export control restrictions imposed against Russia and Belarus and certain Russian nationals and entities after Russia invaded Ukraine. We must undertake additional diligence efforts to comply with these, and other, rules, which may be time-consuming and result in delayed or lost opportunities. We may not always be successful in obtaining necessary export or import licenses, and our failure to obtain required export or import approval for our products or limitations on our ability to export or sell our products may harm our domestic and international sales and negatively affect our revenue.
Tariffs could also have a material impact on our product costs and decrease our ability to sell our products to existing or potential customers as well as harm our ability to compete internationally. For more information, see “Changes in global trade policies could have a material adverse effect on us.” Any changes in our product or in export or import regulations or legislation; shifts or changes in enforcement; or changes in the countries, persons or technologies targeted by these regulations could delay us introducing new products in international markets, decrease use of our products by, or decrease our ability to export or sell our products to, existing or potential customers with international operations, adversely affecting our business and results of operations.
Instability or deterioration in the political, social, business or economic conditions in key jurisdictions could harm our supply or development of products.
Deterioration in the political, social, business or economic conditions in any jurisdictions in which we have significant suppliers, distributors or end users—including as a result of natural disasters, labor strikes, public health crises, geopolitical events or other developments—could slow or halt product shipments or disrupt our ability to manufacture, test or post-process our products., as well as our ability to effectively and timely execute on end user deployments. We outsource our manufacturing and production to suppliers in a small number of Asian jurisdictions including Thailand, Malaysia, Taiwan and China. Some of these jurisdictions experienced significant restrictions during the Covid-19 pandemic. These jurisdictions have also experienced significant changes in political, social, business or economic conditions in the past and may experience them in the future.
We could be forced to transfer our manufacturing, testing and post-processing activities to more stable, and potentially more costly, regions or find alternative suppliers.
We source a significant portion of our wafers from suppliers in Taiwan, and our supply of wafers and other critical components may be materially and adversely affected by diplomatic, geopolitical and other developments between China and Taiwan. Notably, China has refused to renounce the use of military force against Taiwan, and there can be no assurance that relations between China and Taiwan will not deteriorate further, particularly in light of ongoing tensions between the United States and China. Any such developments could materially and adversely affect our business, financial condition and results of operations.
Our business operations could be adversely affected by natural disasters or public health outbreaks and pandemics.
Natural disasters, whether natural or manmade, could decrease demand for our products, disable our facilities, disrupt operations or cause catastrophic losses. We have facilities in areas with known seismic activity, such as our headquarters in Seattle, Washington. We have facilities in areas with known flooding, such as our office in Shanghai, China. We have a wafer post-processing subcontractor in Thailand, a region with a known, and recent, history of flooding. A loss at any of these or other of our or our suppliers’ facilities could disrupt operations, delay production and shipments, reduce revenue and engender potentially large expenses. We do not carry insurance covering potential losses caused by pandemics, earthquakes, floods or other disasters.
Covid-19 created significant worldwide economic volatility, uncertainty and disruption, and presented our business with significant risks and challenges. The Covid-19 global health emergency officially ended in 2023. However, the Covid-19 experience highlights the significant negative impacts a public health outbreak or pandemic could impose on future market demand and our business results.
Risks Relating to Our Relationships with Partners and End Users
We rely on a small number of customers for a large share of our revenue.
We sell our endpoint ICs directly to inlay and tag OEMs and ODMs. We sell our reader ICs to OEMs and ODMs and our readers and gateways to solution providers, VARs and SIs, all primarily through distribution. If we fail to retain our endpoint IC, reader IC, reader or gateway partners or distributors or fail to establish relationships with new partners, then our business, financial condition or operating results could be harmed.
In 2024, sales to three major customers accounted for 60% of our total revenue. Sales concentration to a small number of OEMs decreases our bargaining power and increases the risk that our pricing or sales could decline based on actions taken by our competitors or our own failure to compete effectively.
Our competitors’ relationships with, or acquisitions of, these partners or distributors could interfere with our relationships with them. Any such interference could impair or delay our product sales or increase our cost of sales.
We engage directly with some end users. Their projects, often involving large purchases of our readers and gateways, are often discrete deployments that can result in significant sales for periods of time. They also increase the volatility of our revenue and operating results. If we are unable to replace project-based revenue with new revenue streams, or if end users with large projects change or delay those projects without providing us with adequate notice, then our sales could decline from period to period and harm our stock price.
Our ability to affect or determine end-user demand is limited in part because we sell and fulfill primarily through partners and rarely directly to end users.
End users drive demand for our products but because we sell our products primarily through partners, we are one step removed from those end users and are often unable to directly assess and affect their demand. Our partners may choose to prioritize selling our competitors’ products over ours, or they may offer products that compete with our products or limit sales of our products. If our partners do not sell enough of our products or if they choose to decrease their inventories of our products, then our sales to those partners and our revenue will decline.
Our partners may not properly forecast end users’ demand for our products.
Our reserve estimates for products stocked by our distributors are based primarily on reports provided to us by those distributors, typically monthly. If the inventory and resale information our partners and distributors provide is inaccurate, or if we do not receive it in a timely manner, then we may not have a reliable view of products expected to be sold to end users which could ultimately have a negative impact on our operating results. If our partners overestimate demand, they may invest in building too much capacity, which would put pricing pressure on the RAIN industry. In the short term, our partners might purchase more of our products than they need, increasing their inventory and reducing
our future sales to them, and distributors may, subject to time and quality limitations, seek to return products in exchange for other products. If our partners underestimate demand, we may not be able to satisfy their needs and that of their customers, and adoption might suffer. In either case, our business and operating results could be negatively affected.
Our growth strategy depends in part on the success of strategic relationships with third parties and their continued performance and alignment.
We invest in relationships with solution providers, SIs, VARs and software providers whose product and/or solution offerings complement ours and through which we often fulfill our product sales. Our business will be harmed if we fail to develop and grow these partner relationships. For example, our operating results may suffer if our efforts developing partner relationships increase our costs but do not increase revenue. Partner relationships may also include exclusivity provisions, multiple levels of distribution, discounted pricing or investments in other companies. The cost of developing and maintaining these partner relationships may go unrecovered and our efforts may not generate a corresponding revenue increase.
Occasionally we also engage directly with end users, often at their request, to help them develop solutions for challenging use cases. Such direct engagements could cause, or could be perceived to cause, conflicts with partners that could harm our partner relationships and our business, results of operations or financial condition.
If we fail to maintain or enhance our brand recognition or reputation on which our business depends, then our business could be harmed.
We believe that building our brand and reputation is key to our relationships with partners and end users and our ability to attract new partners and end users. We also believe that our brand and reputation will be increasingly important as market competition increases. Our success depends on a range of factors, including:
•continuing to deliver high-quality, innovative and defect-free products;
•maintaining high partner and end-user satisfaction;
•successfully differentiating our products from those of our competitors; and
•managing both positive and negative publicity.
From time to time, product supply shortages have challenged our ability to meet market needs and we have increased prices in response to our suppliers increasing their prices to us. Our inability to supply partners and end users with products they need, and/or our need to increase our prices could result in long-lasting, negative consequences to our relationships with those partners and end users, to RAIN adoption and to our business overall.
Increasing attention to environmental, social and governance and regulatory matters may cause us to incur additional costs or expose us to additional risks.
Investors, governmental and nongovernmental organizations, partners and end users are increasingly focusing on environmental, social and governance, or ESG, practices. Our ESG practices may not meet their standards, and they as well as advocacy groups may campaign for us to change our business or practices to address their ESG-related concerns. Our failure, or perceived failure, to adequately respond to any such campaigns could harm our business and reputation and negatively impact the market price of our securities. Moreover, our costs related to those ESG practices and reporting and disclosure requirements could increase, which could negatively affect our operating results.
We are subject to disclosure and reporting requirements for companies that use “conflict” minerals mined from the Democratic Republic of Congo and adjoining countries in their products, whether or not these products are manufactured by third parties. These requirements could affect the sourcing and availability of minerals used in manufacturing our products. Additionally, we may face reputational challenges with our customers and other stakeholders if we are unable to sufficiently verify the origins of all minerals used in our products through the due diligence procedures that we implement. We may also
face challenges with government regulators and our customers and suppliers if we are unable to sufficiently verify that the metals used in our products are conflict free.
Risks Relating to Our Intellectual Property
If we are unable to protect and enforce our intellectual property then our business could be adversely affected.
Our success depends in part upon our ability to obtain, maintain and enforce our patents, copyrights, trade secrets, trademarks and other intellectual property rights and prevent third parties from infringing, misappropriating or circumventing those rights. We have historically focused on filing U.S. patent applications, for many reasons, including the fact that a significant portion of RAIN products are sold for use in the United States. We have only a small number of foreign patents and applications. We also only have registered trademarks and domain names in select countries where we believe filing for such protection is appropriate. By focusing our intellectual property protection on the United States and a small number of foreign countries, we have a limited ability to assert intellectual property rights outside the United States, including in some significant foreign markets such as China or Europe. Moreover, the global manufacturing and distribution systems for tags or labels incorporating our endpoint IC products could complicate our efforts to enforce our U.S. patents.
As we increasingly work with third parties, possibly including parties that compete with us to an extent, to advance our technical innovations and features, we cannot guarantee that our efforts to protect our intellectual property will be completely effective.
We cannot guarantee that:
•any of the patents, trademarks, copyrights, trade secrets or other intellectual property rights we presently employ in our business will not lapse or be invalidated, circumvented, challenged or abandoned;
•our intellectual property rights will provide competitive advantages to us;
•our ability to assert our intellectual property rights against potential competitors or to settle current or future disputes successfully;
•any of our pending or future patent applications will issue or have the coverage we originally sought;
•our intellectual property rights can or will be enforced, particularly in jurisdictions where competition may be intense or where legal protections may be weak;
•we will not lose the ability to assert our intellectual property rights against, or to license our technology to, others and collect royalties or other payments; or
•we will retain the right to ask for a royalty-bearing license to an industry standard if we fail to file an intellectual property declaration pursuant to the standards process.
Monitoring and addressing unauthorized use of our intellectual property is difficult and costly, and litigation to enforce our intellectual property rights is time consuming, distracting, expensive and uncertain. Our failure to identify unauthorized use of, or otherwise adequately protect, our intellectual property could adversely affect our business.
We have been and may in the future be party to intellectual property disputes which could be time consuming and costly to prosecute, defend or settle, result in the loss of significant rights, and adversely affect RAIN adoption or adoption of our products or platform.
Patent litigation is complex and uncertain. We may or may not prevail in patent-related proceedings and such proceedings may result in increased legal expenses, additional demands on our management's time and attention, and negative effects on our relationships with partners or end users. If any pending or future proceedings result in an adverse outcome, our intellectual property rights could be weakened and we could be required to:
•cease manufacturing, using or selling the infringing products, processes or technology;
•pay substantial damages for infringement;
•expend significant resources to develop noninfringing products, processes or technology;
•license technology from the party claiming infringement, which license may not be available on commercially reasonable terms or at all;
•cross-license our technology to a competitor to resolve an infringement claim, which could weaken our ability to compete with that competitor; or
•pay substantial damages to our partners or end users for them to discontinue using, or replace, infringing products with noninfringing products.
Even if we do prevail in patent-related proceedings, verdicts and judgments can be modified or even reversed by trial or appellate courts. License agreements entered in settlement of patent litigation, particularly any entered into with our competition, may not be as effective over the long term in providing us with all the benefits we bargained for when we entered into them.
Many companies in our industry, as well as nonpracticing entities, hold patents and other intellectual property rights and may pursue, protect and enforce those intellectual property rights. We receive invitations to license patent and other intellectual property rights to technologies that could be important to our business. We also receive assertions against us, our partners and end users claiming we or they infringe patent or other intellectual property rights. If we decline to accept an invitation to license or to refute an asserted claim, then the offering or claiming party may pursue litigation against us.
Intellectual property disputes have adversely affected RAIN adoption in the past and could disrupt growth prospects in the future. In 2011, Round Rock Research filed lawsuits against 11 end users, including Walmart and Macy’s, for RAIN-related patent infringement. Despite the subsequent availability of an industry-wide license, we believe those lawsuits adversely affected demand for our products from 2011 to 2019. Subsequent litigation, including our patent litigation against NXP between 2019 and early 2024, may not have had as pronounced effects on demand as the Round Rock litigation, but could have dampened RAIN growth particularly in categories beyond those where RAIN is already established such as retail apparel. We, our partners, suppliers or end users could continue to be involved in intellectual property disputes in the future which could adversely affect our operating results and growth prospects.
Many of our agreements require us to indemnify and defend partners and end users from third-party infringement claims and pay damages in the case of adverse rulings. These damages could be sizable and disproportionate to the business we derive from those partners or end users. Moreover, we may not know whether we are infringing a third party’s intellectual property rights due to the large number of RAIN-related patents or to other systemic factors. For example, patent applications in the United States are maintained in confidence for up to 18 months after filing or, in some instances, for the entire time prior to patent issuance. Consequently, we may not be able to account for such rights until after a patent issues.
Intellectual property policies of industry standards organizations in whose working groups we participate could require us to provide royalty-free licenses of some to our intellectual property.
When participating in GS1, ISO, RAIN and other industry-standards organizations, it is a general policy that those who participate in developing a protocol or standard must license, either royalty-free or under reasonable and nondiscriminatory, or RAND, terms, intellectual property that is necessary to implement all or part of the protocol or standard. The standards body may require that the license be granted to members, as in the case of GS1, or to all parties, as in the case of ISO, that implement the protocol or standard.
As a participant in developing GS1 EPCglobal UHF Gen2, UHF Gen2 V2, UHF Gen2 V3, tag data standards, low-level reader protocol and other GS1 EPCglobal protocols, we agreed to license to other GS1 EPCglobal members, on a royalty-free basis, those of our patents necessary to practice those protocols, subject to us receiving reciprocal royalty-free rights from the other GS1 EPCglobal member
practicing the protocol. As a participant in developing ISO standards, we agreed to license on a RAND basis those of our patents necessary to practice those standards, subject to us receiving a reciprocal RAND license from the other entity practicing the standard.
Although the policies themselves seek to advance protocol or standards development, disputes can arise because it may not be clear whether certain intellectual property is necessary to practice a protocol or standard. Such uncertainty could complicate us asserting our not-necessary patents against others, or to use those patents in our own defense, thereby devaluing our intellectual property. Further, some GS1 EPCglobal members declined to license their intellectual property on royalty-free terms, instead retaining the right to license their technology on RAND terms. These members may choose to assert their intellectual property, in which case we will need to defend ourselves within the confines of the GS1 and ISO intellectual property policies.
We rely on third-party license agreements which, if impaired or terminated, could cause production or shipment delays that could harm our business.
We have license agreements with third parties for patents, software and technology we use in our operations and in our products. For example, we license tools from design-automation software vendors to design our silicon ICs. Third-party licenses for patents, software and other technology important to our business may not continue to be available on commercially reasonable terms or may not be available at all. Loss of any such licenses could cause manufacturing interruptions or delays or reductions in product shipments until we can develop, license, integrate and deploy alternative technologies which, if even possible, could harm our business and operating results.
Our use of open-source software may expose us to additional risks and weaken our intellectual property rights.
Our products, processes and technology sometimes use or incorporate software that is subject to an open-source license. Certain open-source licenses require a user who intends to distribute the open-source software as a component of the user’s software to disclose publicly part or all of the user’s source code. In addition, certain open-source software licenses require the user of such software to make derivative works of the open-source software available to others at low or no cost. Open-source licensors generally do not provide warranties or other contractual protections regarding infringement claims or the quality of their code, opening us to business risks that could materially harm our operating results.
We cannot guarantee that we have incorporated open-source software in a manner that is consistent with our policies and procedures relative to such open-source software, or in a manner that will not subject us to liability.
Risks Relating to Privacy and Cybersecurity
Privacy and security concerns relating to RAIN could damage our reputation and deter current or potential customers from using our products.
Privacy advocates and others have raised, and may continue raising, concerns about RAIN compromising consumer privacy or facilitating theft. These concerns include unauthorized parties potentially collecting personal information or personal data, tracking consumers, stealing identities or causing other issues relating to privacy or data protection.
Any such incident could cause our or our partners’ or end users’ operations to be disrupted and subject any of us to regulatory investigations or proceedings and claims, demands or litigation. Consequently, we could face potential liability and significant costs and expenses to remediate or otherwise respond to the incident. Any failure or perceived failure to comply with any privacy- or security-related laws, regulations or contractual or other obligations to which we are or may be subject may result in regulatory actions, claims or litigation; legal and other costs; substantial time and resources; and fines, penalties or other liabilities. Any actions or concerns about security and privacy may be expensive to defend, cause us to expend substantial time and resources and damage our reputation and operating results and/or negatively impact overall RAIN industry development, even if unfounded.
We cannot be sure that any limitation-of-liability provisions in our agreements with customers, contracts with third-party vendors and service providers or other contracts will protect us from liabilities or damages against claims relating to a security breach or other privacy- or security-related issue.
Government regulations and guidelines and other standards relating to consumer privacy and cybersecurity may adversely impact adoption of our products, require us to make design changes or constrain our ability to implement new and desired product features, and actual or alleged violations of laws relating to privacy or cyber security may result in claims, proceedings and liability.
Our partners and end users are subject to laws and regulations related to collecting, storing, transmitting and using personal information and personal data, as well as to additional laws and regulations that address privacy and cybersecurity related to RFID in general. Because RAIN is a type of RFID, we believe these laws and regulations apply to RAIN.
The European Commission, or the EC, has issued guidance to address privacy concerns about RFID. In May 2009, the EC issued a recommendation that retailers in the EU inform their customers when RFID tags are either on or embedded within products. In April 2011, the EC signed a voluntary agreement with private and public entities to develop privacy guidelines for companies using RFID in the EU. Whereas compliance is voluntary, our partners and end users that do business in the EU prefer products that comply with the guidelines. If our products do not comply or enable compliance with the guidelines, then our business may suffer.
More generally, the data security and privacy legislative and regulatory landscape in the United States, EU and other jurisdictions continues evolving. Aspects of key privacy laws and regulations—including the California Consumer Privacy Act of 2018, the California Privacy Rights Act, similar privacy laws enacted in other states and the EU General Data Protection Regulation—remain unclear as of the date of this report and continue evolving, potentially with far-reaching implications. Laws and regulations relating to privacy, data protection and security; related industry standards and guidelines; and continued evolution of these laws, regulations, standards, guidelines and other actual and asserted obligations, as well as their interpretation and enforcement, may require us to modify our products, practices and policies, which we may not be able to do on commercially reasonable terms or at all, and otherwise could cause us to incur substantial costs and expenses. Any failure or perceived failure by us or any third parties with which we do business to comply with these laws and regulations or other actual or asserted obligations relating to privacy, data protection or security may result in claims or litigation; actions against us by governmental entities; legal and other costs; substantial time and resources and fines, penalties or other liabilities. Any such actions may be expensive to defend, may incur substantial legal and other costs and substantial time and resources and likely would damage our reputation and adversely affect our business, financial condition and results of operations.
Additionally, if we fail to develop products that meet end-user privacy requirements, then end users may choose not to use our products.
The RAIN radio protocol includes features addressing consumer privacy and authentication, and we have incorporated additional features in our products that further protect consumer privacy. Nevertheless, a third party could still breach these features and, if such breach occurs, our reputation could be damaged and our business and prospects could suffer.
A breach of security or other security incident impacting our systems or others used in our business could have an adverse effect on our business.
We face risks of security breaches and incidents from a variety of sources including viruses, ransomware, hacking, malicious code, supply-chain attacks as well as social engineering or other employee or contractor negligence, malfeasance or unintentional acts. Accidental or willful security breaches or incidents, or unauthorized access to our facilities or information systems, or to others used in our business, could compromise the security of those facilities or information systems and the confidentiality, integrity and availability of confidential, personal or proprietary information. These risks may be heightened in connection with geopolitical tensions and events.
The consequences of loss, unavailability, misuse, corruption or other unauthorized processing of confidential, personal or proprietary information could include, among other things, unfavorable
publicity, reputational damage, difficulty marketing or selling our products, customer allegations of breach of contract, loss or theft of intellectual property, claims and litigation, governmental and regulatory investigations and other proceedings and fines, penalties and other damages and liabilities. Any of these consequences could have a material adverse effect on our business, financial condition, reputation and business relationships.
We rely on third-party services to store and process data on our behalf, and on third-party security systems in a variety of applications. Our platform operates in conjunction with, and depends on, third-party products, services and components for security. The cybersecurity threat environment continues evolving, especially with heightened activity by state-sponsored actors. If we, our platform, or any of the third parties on which we rely suffers or is believed to have suffered a security breach or incident, vulnerability, error, ransomware or malicious event, then we could face increased costs, claims, liability, reduced revenue and harm to our reputation.
We devote resources to detect and prevent security breaches and other security-related incidents. In the event of an actual or perceived security breach or incident we may need to expend significant resources to mitigate, notify third parties of, and otherwise address the breach or incident, its root cause and take steps to prevent further breaches or incidents. Our insurance may not adequately cover claims relating to an actual or perceived security breach or incident and any breach or incident may increase our insurance costs as well as reduce or eliminate the future availability of such insurance, harming our business and reputation.
Risks Relating to Our Financial Position and Capital Needs
We have a history of losses and have only achieved profitability periodically. We cannot be certain that we will attain or sustain profitability in the future.
Until 2024, we have incurred losses each year since our inception in 2000. Our ability to attain or sustain profitability depends on numerous factors, many of which are out of our control, including continued RAIN industry adoption and us maintaining or growing our market share. Our costs to support operations, product development and business and personnel expansion in sales, engineering and marketing are significant and are likely to increase as we invest to grow the market and our share of it, reduce our costs and improve our operations. If we fail to increase our revenue or manage our expenses, or if our investments in growing the market or our share of it fail, then we may not attain or sustain profitability.
We have a history of significant fluctuations in our quarterly and annual operating results.
Our history shows significant sales volatility and a limited ability to forecast sales. We anticipate that, for the foreseeable future, our visibility to future sales, including volumes and prices, will continue to be limited. That limited visibility may cause fluctuations in our operating results and differences between actual and expected quarterly or annual operating results.
Many factors, some outside our control, may cause or contribute to fluctuations in our quarterly and annual operating results. These fluctuations make financial planning and forecasting difficult. These fluctuations may also cause unanticipated decreases in our available cash, which could negatively affect our business and prospects. Material factors that contribute to fluctuations in our operating results include:
•macroeconomic conditions, including inflation, recession or economic slowdown, and their impact on our business and that of our suppliers, partners and end users;
•fluctuations or delays in RAIN adoption and deployment by end users;
•changes in the pace or direction of major deployments, whether due to macroeconomic conditions or enterprise-specific events or circumstances, and our, or our partners', ability to win business from these deployments;
•fluctuations in demand for our products or platform, including by tag OEMs and other significant partners and end users on whom we rely for a substantial portion of our revenue;
•fluctuations in the pricing and availability or supply of our products or key elements or components of those products, especially semiconductor wafers;
•degradations in product quality, whether due to us or our suppliers, including quality claims or product returns;
•delays in new-product introductions and in the maturity of our new-product technologies;
•decreases in selling prices for our products;
•delays in our product-shipment timing, customer or end-user sales or deployment cycles, or work performed under development contracts;
•intellectual property disputes involving us, our partners, end users or other participants in our industry, or the timing of license payments for our intellectual property;
•adverse outcomes of litigation or governmental proceedings;
•timing variability in product introductions, enhancements, services and technologies by us and our competitors as well as market acceptance of new or enhanced products, services and technologies;
•unanticipated excess or obsolete inventory as a result of significant demand fluctuations, supply-chain mismanagement, new-product introduction, quality issues or otherwise;
•changes in the amount and timing of our operating costs, including those related to expanding our business, operations and infrastructure;
•changes in business cycles or seasonal fluctuations that affect the markets in which we sell;
•changes in industry standards or specifications, or changes in government regulations, relating to our products or our platform;
•late, delayed or cancelled payments from our partners or end users; and
•unanticipated impairment of long-lived assets and goodwill.
A substantial portion of our operating expenses are fixed in the short term, and as a result, fluctuations in revenue or unanticipated expenses can have a material and immediate impact on our profitability and negatively affect our operating results, which could cause the price of our common stock to decline.
We may need to raise additional capital, which may not be available on favorable terms or at all.
In the future, we may need to raise additional capital, including pursuant to shelf registration statements we may file from time to time with the SEC, potentially diluting our stockholders, restricting our operations or otherwise adversely affecting our business.
Debt financing, if available, may include covenants limiting or restricting our ability to take specific actions such as incurring additional debt, expending capital or declaring dividends, or may impose financial covenants that limit our ability to achieve our business objectives.
Our management has broad discretion in how to invest and spend our cash and cash equivalents and the proceeds from financings, including on capital expenditures, product development, working capital and other general corporate purposes. We may spend our cash and cash equivalents in ways that our stockholders may not agree with or that do not yield favorable returns.
If we need additional capital but cannot raise it on acceptable terms, if at all, then we may not be able to meet our business objectives, financial obligations or both. If we raise additional capital but do not deploy it effectively then our business, financial condition, results of operations and prospects could be harmed and the market price of our common stock could suffer.
Risks Relating to U.S. Federal Income Tax
Our ability to use net operating losses and research and development credits to offset future taxable income and income taxes may be limited.
As of December 31, 2024, we had federal U.S. net operating loss carryforwards, or NOLs, of $190.3 million and U.S. federal research and development credit carryforwards of $38.7 million, which we may use to reduce future taxable income or income taxes. We have established a valuation allowance against the carrying value of these deferred tax assets. The U.S. federal NOLs and U.S. federal research and development credit carryforwards began expiring in 2020.
Under Sections 382 and 383 of the U.S. Internal Revenue Code, or the Code, a corporation that experiences a more-than 50% ownership change by one or more stockholders or groups of stockholders who own at least 5% of a company's stock over a three-year testing period is limited in its ability to use its pre-change NOLs and other tax assets to offset future taxable income or income taxes. If we undergo a future ownership change then our ability to use our NOLs and credit carryforwards could be limited by Sections 382 and 383 of the Code. Our NOLs may also be limited under state law. As a result of these limitations, we may not be able to utilize a material portion of, or possibly any of, our NOLs and/or credit carryforwards to reduce future taxable income or income taxes.
We could be subject to additional income tax liabilities.
We are subject to income taxes in the United States and certain foreign jurisdictions. During the ordinary course of business, we use significant judgment in evaluating our worldwide income tax obligations and we conduct many transactions for which the ultimate tax determination is uncertain. Although we believe our tax determinations are proper, the final determination of any tax audits and any possible litigation could be materially different from our historical income tax provisions and accruals. The results of an audit or litigation could have a material effect on our operating results or cash flows in the period or periods for which that determination is made.
Changes in tax laws could have a material adverse effect on our business, cash flow, results of operations or financial conditions.
We are subject to tax laws, regulations and policies of several taxing jurisdictions. Changes in tax laws, as well as other factors, could cause us to experience fluctuations in our tax obligations and effective tax rates and otherwise adversely affect our tax positions and results of our operations. For example, in August 2022, as part of the Inflation Reduction Act of 2022, the United States enacted a 1% excise tax on stock buybacks and a 15% alternative minimum tax on adjusted financial statement income. Additionally, beginning in 2022, the Code eliminated the right to deduct research and development expenditures and instead requires taxpayers to capitalize and amortize U.S. and foreign research and development expenditures over five and 15 tax years, respectively. We have accounted for these changes in accordance with our understanding of the guidance available as of the date of this filing and as described in more detail in our financial statements.
The CHIPS and Science Act, enacted August 9, 2022, provides tax credits for semiconductor manufacturing activities within the United States, but because we outsource our semiconductor manufacturing we do not expect to be entitled to these tax credits.
Many countries, as well as organizations such as the Organization for Economic Cooperation and Development, have implemented or proposed changes to existing tax laws, including a 15% global minimum tax. Any of these developments or changes in U.S. federal, state or international tax laws or tax rulings could adversely affect our effective tax rate and our operating results. There can be no assurance that our effective tax rates, tax payments or tax credits and incentives will not be adversely affected by these or other developments or changes in law.
Taxing authorities may successfully assert that we should have collected or in the future should collect sales and use, value-added or similar taxes.
We do not collect sales and use, value-added or similar taxes in all jurisdictions in which we have sales, based on our belief that such taxes are either not applicable or an exemption from such taxes
applies. Certain jurisdictions may assert that such taxes are applicable, which could result in tax assessments, penalties and interest, and we may be required to collect such taxes in the future, including as a result of a change in law. Such tax assessments, penalties and interest or future requirements may negatively affect our operating results.
Risks Relating to Our Financial Reporting and Disclosure
Any failure to maintain an effective system of disclosure and internal controls over financial reporting, or our ability to produce timely and accurate financial statements, could adversely affect investor confidence in us.
As a public company, we must maintain effective disclosure controls and procedures and internal control over financial reporting. Effective internal controls are necessary for us to provide reliable financial reports and prevent fraud.
Any failure to implement and maintain effective disclosure controls and procedures and internal control over financial reporting, including identifying material weaknesses, could cause investors to lose confidence in the accuracy and completeness of our financial statements and reports, which could adversely affect the market price of our common stock. We could also be subject to sanctions or investigations by The Nasdaq Stock Market, the SEC and other regulatory authorities.
Risks Relating to Owning or Trading Our Securities
The market price of our common stock has been and will likely continue to be volatile, and the value of your investment could decline significantly.
The trading price of our common stock has fluctuated and is likely to continue to fluctuate substantially. The following factors, in addition to general risks and other risks described in this report, may have a material effect on the trading price of our common stock:
•price and volume fluctuations in the overall stock market;
•changes in operating performance, stock market valuations and volatility in the market prices of other technology companies generally, and of those in our industry in particular;
•actual or anticipated quarterly variations in our results of operations or those of our competitors;
•actual or anticipated changes in our growth rate relative to our competitors;
•delays in end-user deployments of RAIN solutions;
•announcements by us or our competitors of acquisitions, new products, significant contracts, commercial relationships or capital commitments;
•supply interruptions, including semiconductor wafer or other product or component shortfalls;
•developments relating to intellectual property rights or in disputes relating to those rights;
•our ability to develop and market new and enhanced products on a timely basis;
•commencement of, or our involvement in, litigation;
•changes in our board of directors or management;
•changes in governmental regulations or in the status of our regulatory approvals;
•unstable political and economic conditions, including instability resulting from wars and other armed conflicts, such as those in Ukraine and the Gaza Strip, or geopolitical tensions, such as those between the United States, China and Taiwan;
•the trading volume of our stock;
•actual or perceived security breaches or incidents;
•any future sales of our common stock or other securities;
•financial analysts dropping or reducing their coverage of us; changes in financial estimates by analysts who do cover us; or our failure to meet analyst estimates or investor expectations;
•fluctuations in the values of companies that investors perceive to be comparable to us;
•the financial projections we may provide to the public, as well as any changes in those projections or our failure to meet those projections; and
•general economic conditions and slow or negative growth in the markets in which we operate.
Technology stocks like ours have experienced extreme price and volume fluctuations, often unrelated or disproportionate to the company’s underlying operating performance. Stock price volatility can cause stockholders to institute securities class-action litigation or stockholder derivative litigation, as occurred to us between 2018 and 2020. If any of our stockholders were to sue us, the defense and disposition of the lawsuit could be costly and divert the time and attention of our management, harm our operating results and negatively impact the trading price of our common stock.
Transactions relating to the 2021 Notes may affect our stock’s value.
If the 2021 Notes are converted by holders, then we are entitled to deliver cash, stock or any combination of cash or stock, at our election. If we elect to deliver stock, the ownership interests of our existing stockholders will be diluted, and public market sales of stock issued upon a conversion could decrease our stock price. Anticipated future conversions of the 2021 Notes into stock could also decrease our stock price, as could short selling by holders of the 2021 Notes to hedge their positions.
In December 2019, we issued the 2019 Notes. When we did so, we entered into privately negotiated capped-call transactions with financial counterparties to mitigate the dilutive impact on the Company above a given stock price. We left those capped-call transactions intact after we acquired the remainder of the outstanding 2019 Notes in June 2022. From time to time, the financial counterparties to the capped calls may modify their hedge positions by entering into or unwinding various derivative transactions involving our stock or by purchasing or selling our stock or other securities of ours in secondary market transactions prior to the maturity of the capped calls. This activity could cause a decrease in our stock price.
For more information on the 2019 Notes, the 2021 Notes and the capped-call transactions, see Note 8 of our consolidated financial statements included elsewhere in this report.
Our principal stockholders and management own a significant percentage of our stock and are able to exercise significant influence over matters subject to stockholder approval.
As of December 31, 2024, our executive officers, directors and principal stockholders, together with their respective affiliates, beneficially owned approximately 51.3% of our stock. As a result, our executive officers, directors and principal stockholders may be able to significantly influence, in their capacity as stockholders, matters requiring approval by our stockholders, including electing directors and approving mergers, acquisitions or other transactions. They may have interests that differ from yours and may vote in a way with which you disagree and which may be adverse to your interests. This ownership concentration could have the effect of delaying or preventing a change in our control or otherwise discouraging a potential acquirer from attempting to obtain control of us, which in turn could have a material adverse effect on our stock price. This ownership concentration could also prevent attempts by our stockholders to replace or remove our board of directors or management.
We may not have sufficient cash flow or access to cash necessary to satisfy our obligations under the 2021 Notes, and our current and future indebtedness may restrict our business.
Our ability to make scheduled payments of the principal of, to pay interest on or to refinance any current or future indebtedness, including the 2021 Notes, or to make cash payments in connection with any conversion of the 2021 Notes or upon any fundamental change if holders require us to repurchase their 2021 Notes for cash, depends on our future performance, which is subject to economic, financial, competitive and other factors beyond our control. Our business may not generate sufficient future cash from operations to service our indebtedness and make necessary capital expenditures. If we are unable to generate sufficient cash flow, then we may be required to pursue other alternatives, such as selling assets, restructuring indebtedness or obtaining additional equity capital on terms that may be onerous or highly dilutive. Our ability to refinance any of our indebtedness, including the 2021 Notes, will depend on the capital markets and our financial condition at that time. We may not be able to pursue these alternatives on favorable terms or at all, which could result in us defaulting on our debt obligations.
Our existing and future indebtedness could have important consequences to our stockholders and significant effects on our business. For example, it could:
•make it more difficult for us to satisfy our debt obligations, including the 2021 Notes;
•increase our vulnerability to general adverse economic and industry conditions;
•require us to dedicate a substantial portion of our cash flow from operations to payments on our indebtedness, thereby reducing the cash available to run our business;
•limit our flexibility in planning for, or reacting to, changes in our business or in our industry;
•restrict us from exploiting business opportunities;
•place us at a competitive disadvantage compared to our competitors that have less indebtedness; and
•limit our ability to borrow additional funds for working capital, capital expenditures, acquisitions, debt service requirements, executing our business strategy or for other purposes.
Anti-takeover provisions in our charter documents and under Delaware or Washington law could prevent, delay or impede an acquisition of us and constrain our stock price.
Provisions of our certificate of incorporation and our bylaws may delay or discourage transactions involving an actual or potential change in our control or in our management, including transactions in which stockholders might otherwise receive a premium for their shares, or transactions that our stockholders might otherwise deem to be in their best interests. These provisions could, therefore, adversely affect our stock price. Among other things, our certificate of incorporation and bylaws:
•permit our board of directors to issue up to 5,000,000 shares of preferred stock, with any rights, preferences and privileges as they may designate;
•provide that the authorized number of directors may be changed only by resolution of the board of directors;
•provide that all vacancies, including newly created directorships, may, except as otherwise required by law, be filled by the affirmative vote of a majority of directors then in office, even if less than a quorum;
•restrict the forum for certain litigation against us to Delaware;
•require that any action taken by our stockholders be effected at a duly called annual or special meeting of stockholders and not by written consent;
•provide that stockholders seeking to present proposals before a meeting of stockholders or to nominate candidates for election as directors at a meeting of stockholders must provide notice in writing in a timely manner, and also specify requirements as to the form and content of a stockholder’s notice;
•do not provide for cumulative voting rights (therefore allowing the holders of a majority of the shares of common stock entitled to vote in any uncontested election of directors to elect all of the directors standing for election, if they should so choose); and
•provide that special meetings of our stockholders may be called only by the chair of the board, our chief executive officer or the board of directors.
In addition, because we are incorporated in Delaware, we are governed by the provisions of Section 203 of the Delaware General Corporation Law, which generally prohibits a Delaware corporation from engaging in any of a broad range of business combinations with any “interested” stockholder for a period of three years following the date on which the stockholder became an “interested” stockholder. Likewise, because our principal executive offices are located in Washington, the anti-takeover provisions of the Washington Business Corporation Act may apply to us under certain circumstances now or in the future. These provisions prohibit a “target corporation” from engaging in any of a broad range of business combinations with any stockholder constituting an “acquiring person” for a period of five years following the date on which the stockholder became an “acquiring person.”
Our bylaws include provisions that could limit our stockholders’ ability to obtain a favorable judicial forum for disputes with us or our directors, officers or employees.
Our bylaws provide that, unless we otherwise consent in writing, the Court of Chancery of the State of Delaware is the exclusive forum for any derivative action or proceeding brought on our behalf; any action asserting a breach of fiduciary duty; any action asserting a claim against us arising pursuant to the Delaware General Corporation Law, our certificate of incorporation or our bylaws; or any action asserting a claim against us that is governed by the internal affairs doctrine. The choice of forum provision may limit stockholders’ ability to bring a claim in a judicial forum favorable for disputes with us or our directors, officers or other employees, which may discourage such lawsuits against us and our directors, officers and other employees. Alternatively, if a court were to find the choice of forum provision contained in our bylaws to be inapplicable or unenforceable in an action, we may incur additional costs associated with resolving such action in other jurisdictions, which could adversely affect our business and financial condition.
Not applicable.
Item 1C. Cybersecurity
Risk Management and Strategy
We have established policies and processes for assessing, identifying and managing material cybersecurity risks, and have integrated these processes into our overall risk-management processes. We have also established policies and processes for managing and responding to material cybersecurity incidents.
We routinely assess material cybersecurity risks, including potential unauthorized occurrences on, or conducted through, our information systems that may compromise the confidentiality, integrity or availability of those systems or information maintained in them. We conduct periodic risk assessments to identify cybersecurity threats, as well as assessments when there is a material change in our business practices that we believe could affect information systems that are vulnerable to cybersecurity threats. These risk assessments include identifying reasonably foreseeable internal and external risks and the potential harm if the risks were to materialize. We conduct these risk assessments directly and also engage third parties to support these processes.
Following these risk assessments, we evaluate how to appropriately implement and maintain reasonable safeguards to mitigate identified risks; reasonably address any identified gaps in existing safeguards; and regularly monitor the effectiveness of our safeguards. We devote significant resources and designate members of our management, including our VP, IT and Facilities, or VP IT, who reports to
our Chief Financial Officer, and our Senior Information Security Manager, or Senior ISM, to manage the risk assessment and mitigation process. We also engage third parties to help us design and implement our cybersecurity systems, as well as monitor and test our safeguards. As part of our overall risk management, we collaborate cross-functionally to monitor and test our safeguards and to train our employees on cybersecurity risks and safeguards. We include employees at all levels and departments, and all contractors, in our cybersecurity training programs.
We require appropriate third-party service providers to certify that they can implement and maintain appropriate security measures, consistent with all applicable laws, in connection with their work for us, and to promptly report any suspected breach of their security measures that may affect our company. We oversee and identify risks from cybersecurity threats associated with our use of service providers through an onboarding vendor risk management program, including an inherent risk assessment.
We have not, to date, experienced a cybersecurity incident which was determined to be material, although, like any technology provider, we have experienced incidents in the past. For additional information regarding whether any risks from cybersecurity threats are reasonably likely to materially affect our company, including our business strategy, results of operations, or financial condition, please refer to Item 1A, “Risk Factors,” in this annual report on Form 10-K, including the risk factors under the heading entitled “Risks Relating to Privacy and Cybersecurity.”
Cybersecurity Governance
One of the key functions of our board of directors is informed oversight of our risk management process, including risks from cybersecurity threats. Our board of directors is responsible for monitoring and assessing our strategic risk exposure, and our executive officers are responsible for day-to-day management of the material risks we face. Our board of directors administers its cybersecurity risk-oversight function as a whole, as well as through the audit committee.
Our Vice President Information Technology, or VP IT, and Senior Information Security Manager, or Senior ISM, are responsible for assessing and managing material risks from cybersecurity threats, as well as managing and responding to material cyber incidents if any occur. Our VP IT has a bachelor’s degree in management information systems and more than 25 years experience managing enterprise information-technology systems and resources. Our Senior ISM has an undergraduate degree in management information systems, an MBA and multiple professional cybersecurity certifications, has specialized in cybersecurity for more than a decade and is focused primarily on cybersecurity.
Our VP IT and Senior ISM provide periodic briefings to the audit committee and to the board of directors about our cybersecurity risks and activities, including cybersecurity incidents and responses, cybersecurity systems testing, third-party activities and related topics. In addition, our policies for managing and responding to cybersecurity incidents include procedures for appropriate escalations to our Chief Compliance Officer and to our audit committee chair.
Item 2. Properties
We have several operating leases for office space, summarized as of December 31, 2024 in the table below. We believe that our facilities are adequate for our current needs.
| | | | | | | | |
Location | | Purpose | | Approximate Square Feet | | | Principal Lease Expiration Dates |
Seattle, Washington | | Corporate headquarters | | | 70,000 | | | 2026 |
Seattle, Washington | | Design laboratory | | | 29,000 | | | 2029 |
Shanghai, China | | General office space | | | 4,000 | | | 2025 |
Helsinki, Finland | | Voyantic office space | | | 7,000 | | | 2027 |
In addition, we lease offices in Thailand, Malaysia, Brazil and San Diego, California. For more information about our lease commitments, please refer to Note 11 to our consolidated financial statements included elsewhere in this report.
Item 3. Legal Proceedings
As of the date of this report, we are not a party to any material legal proceedings. In the normal course of business, we may be named as a party to various legal claims, actions and complaints. We cannot predict whether any resulting liability will have a material adverse effect on our financial position, results of operations, cash flows, market position or stock price.
Item 4. Mine Safety Disclosures
Not applicable.
PART II
Item 5. Market for Registrant’s Common Equity, Related Stockholder Matters and Issuer Purchases of Equity Securities
Market Information
Our common stock has traded on The Nasdaq Global Select Market under the symbol “PI” since July 21, 2016.
Holders of Record
As of January 31, 2025, there were 28 holders of record of our common stock. The actual number of holders is greater than the number of holders of record and includes stockholders who are beneficial owners but whose shares are held in street name by brokers and other nominees. The number of holders of record also does not include stockholders whose shares may be held in trust by other entities.
Dividends
We have never declared or paid a cash dividend on our common stock. We currently intend to apply our available funds and any future earnings to developing and growing our business. We therefore do not anticipate paying any cash dividends on our common stock for the foreseeable future. In addition, future debt instruments, if any, may materially restrict our ability to pay dividends on our common stock. Any future determination to pay dividends on our common stock will depend at least on our results of operations, financial condition and liquidity requirements, restrictions that may be imposed by applicable law or by contracts and any other factors that our board of directors may consider relevant.
Performance Graph
This performance graph shall not be deemed “filed” for purposes of Section 18 of the Securities Exchange Act of 1934, as amended, or the Exchange Act, or incorporated by reference into any filing of Impinj, Inc. under the Securities Act of 1933, as amended, or the Exchange Act, except as shall be expressly set forth by specific reference in such filing.
The following performance graph compares the cumulative total stockholder return of our common stock versus the NASDAQ Composite Index and the Philadelphia Semiconductor Index.
This graph assumes that the investment in our common stock and in each index was $100 on December 31, 2019, and assumes dividend reinvestment, if any. The stock price performance in the graph is not indicative of future stock price performance.
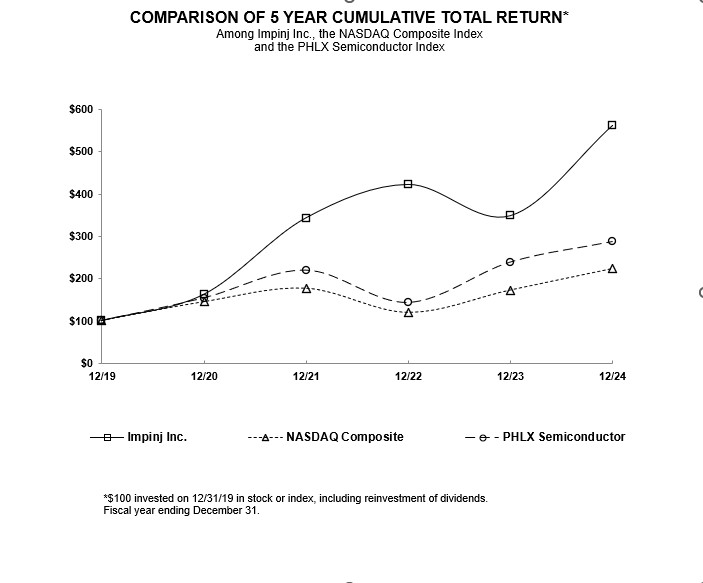
Securities Authorized for Issuance Under Equity Compensation Plans
For more information on securities authorized for issuance under our equity compensation plans, see Note 9 and Note 10 of our consolidated financial statements included elsewhere in this report.
Unregistered Sales of Equity Securities
None.
Use of Proceeds
None.
Repurchases
None.
Item 6. [Reserved]
Item 7. Management’s Discussion and Analysis of Financial Condition and Results of Operations
You should read the following discussion and analysis together with our consolidated financial statements and the related notes to those statements included elsewhere in this report. This discussion contains forward-looking statements that involve risks and uncertainties. As a result of many factors, such as those set forth under “Risk Factors” and elsewhere in this report, our actual results may differ materially from those anticipated in these forward-looking statements.
For our discussion of our fiscal 2023 results compared to fiscal 2022 for both our results of operations and our liquidity and capital resources sections, refer to "Item 7. Management's Discussion and Analysis of Financial Condition and Results of Operations" in our Annual Report on Form 10-K for the fiscal year ended December 31, 2023 filed with the SEC on February 12, 2024 which is incorporated by reference herein.
Overview
Our vision is a world in which every item that enterprises manufacture, transport and sell, and that people own, use and recycle, is wirelessly and ubiquitously connected to the cloud. And a world in which the ownership, history and linked information for every one of those items is seamlessly available to enterprises and people. We call our expansive vision a Boundless Internet of Things, or IoT. We design and sell a platform that enables that wireless item-to-cloud connectivity and with which we and our partners innovate IoT solutions.
Our mission is to connect every thing. We have enabled connectivity for more than 120 billion items to date, delivering item visibility and improving operational efficiencies for retailers, supply chain and logistics, or SC&L providers, restaurants and food-service providers, airlines, automobile manufacturers, healthcare companies and many more. We are today focused on extending item connectivity from tens of billions to trillions of items, and delivering item data not just to enterprises but to people, so they too can derive value from their connected items. We believe the Boundless IoT we are enabling will, in the not-too-distant future, give people ubiquitous access to cloud-based digital twins of every item, each storing the item’s history and linked information and helping people explore and learn about the item. We believe that that connectivity will transform the world.
We and our partner ecosystem build item-visibility solutions using products that we design and either sell or license, including silicon RAIN radios; manufacturing, test, encoding and reading systems, software and cloud services that encapsulate our solutions know-how and intellectual property. We sell two types of silicon IC radios. The first are endpoint ICs that store a serialized number to wirelessly identify an item. Our partners embed endpoint ICs into an item or its packaging. The ICs may also contain a cryptographic key to authenticate the item. The second are reader ICs that our partners use in finished readers to wirelessly discover, inventory and engage the endpoint ICs. Those readers may also protect an item or consumer, for example by authenticating the item as genuine or privatizing the item by rendering the endpoint IC unresponsive without the consumer first providing a password. Our manufacturing, test and encoding systems enable partner products and facilitate enterprise deployments. Our reading systems comprise high-performance finished readers and gateways for autonomous reading solutions. Our software and cloud services focus on solutions enablement.
We sell our products, individually or as a whole platform offering primarily with or through our partner ecosystem. That ecosystem comprises original equipment manufacturers, or OEMs, tag service bureaus, original device manufacturers, or ODMs, systems integrators, or SIs, value-added resellers, or VARs, independent software vendors, or ISVs, and other solution partners.
Our radios follow the RAIN industry’s air-interface standard for their core reading functionality. We create partner and enterprise preference for our radios and solutions by adding differentiated features into our products, including our Gen2X functionality, supporting those features across our platform and licensing them where appropriate, to deliver solutions capabilities and performance that surpasses mix-and-match solutions built from competitor products.
Factors Affecting Our Performance
Inventory Supply
Most of our revenue derives from endpoint ICs that our partners embed into or onto enterprise items and is therefore affected by macroeconomic trends. Further, we sell most of our products, both endpoint ICs and systems, through partners and distributors, limiting our visibility to enterprise demand. We work closely with those partners and distributors to gain as accurate a view as possible, however, correctly forecasting demand for our products and identifying market shifts in a timely manner remains a challenge. As a result, we sometimes experience inventory overages or shortages. Inventory overages can increase expenses, expose us to product obsolescence and/or increased reserves and negatively affect our business. Inventory shortages can cause long lead times, missed opportunities, market-share losses and/or damaged customer relationships, also negatively affecting our business.
In 2021 and 2022, demand for our endpoint ICs increased while worldwide wafer demand also increased, leading to wafer shortfalls for many semiconductor companies, including us. These wafer shortfalls prevented us from fully meeting customer demand and, in some cases, caused customers to cancel orders, qualify alternative suppliers or purchase from our competitors. In 2023, macroeconomic conditions led to softness in demand and inventory overages.
Product Adoption and Unit Growth Rates
Enterprises have significantly adopted RAIN in retail apparel, our largest market, and SC&L, but the rate of adoption and unit growth rates have been uneven and unpredictable. From 2010 to 2024, our overall endpoint IC sales volumes increased at a 27% compounded annual growth rate; however, we have experienced declines in endpoint IC sales volumes during various periods.
Regardless of the uneven pace of retail, SC&L and other industry adoption and growth rates, we believe the long-term trend is continued RAIN adoption and growth and we intend to continue investing in developing new products and expanding our product offerings for the foreseeable future. However, we cannot predict whether historical annual growth rates are indicative of the pace of future growth.
Our systems business, at least for readers and gateways, depends significantly on large-scale deployments at discrete end users, and deployment timing causes large yearly variability in our systems revenue. For example, we generated 14% of total 2019 revenue from a gateway deployment at a large North American SC&L provider. We did not have comparable project-based revenue in 2020. Similarly, in second-quarter 2021, we generated 13% of our revenue from a project-based gateway deployment for RAIN-based self-checkout and loss prevention at a large Europe-based global retailer. Although we continue generating project-based revenue, we have not seen it at a comparable scale in 2022, 2023 or in 2024.
Seasonality and Pricing
We typically negotiate pricing with most of our endpoint IC OEMs with an effective date of the first quarter of the calendar year. In the past, this negotiation typically resulted in reduced revenue and gross margins in the first quarter compared to prior periods, which then normalized in subsequent quarters as we reduced costs and adjust product mix by migrating those OEMs and end users to newer, lower-cost products.
Endpoint IC volumes tend to be lower in the fourth quarter than in the third quarter. System sales tend to be higher in the fourth quarter and lower in the first quarter, we believe due to the availability of residual funding for capital expenditures prior to the end of many end users’ fiscal years.
We did not see these seasonal trends in 2022 or 2023 but began to see them in the second half of 2024. Quarter-to-quarter revenue variability due to macroeconomic conditions and program-launch timing may impact these seasonal trends in the future.
Results of Operations
| | | | | | | | | | | | | | | | | | | | | |
| | Year Ended December 31, | 2024 vs 2023 | | | 2023 vs 2022 | | |
(in thousands, except percentages) | | 2024 | | | 2023 | | | 2022 | | | Change | | | Change | | |
Revenue | | $ | 366,087 | | | $ | 307,539 | | | $ | 257,800 | | | $ | 58,548 | | | $ | 49,739 | | |
Gross profit | | $ | 188,855 | | | $ | 151,982 | | | $ | 137,884 | | | $ | 36,873 | | | $ | 14,098 | | |
Gross margin | | | 51.6 | % | | | 49.4 | % | | | 53.5 | % | | | 2.2 | % | | | (4.1 | )% | |
Loss from operations | | $ | (7,069 | ) | | $ | (43,484 | ) | | $ | (19,479 | ) | | $ | 36,415 | | | $ | (24,005 | ) | |
Revenue and gross profit increased, due primarily to higher endpoint IC and partially offset by lower systems revenue. The endpoint IC revenue increase was driven primarily by higher shipment volumes and licensing revenue partially offset by lower average ASP due to mix and short-term pricing incentives on legacy products, and the systems revenue decrease was due primarily to lower shipment volumes. Gross margin increased due primarily to high-margin licensing revenue recognized in the year that did not occur in the prior year. Loss from operations decreased due primarily to increased gross profit.
Revenue
| | | | | | | | | | | | | | | | | | | | |
| | Year Ended December 31, | | | 2024 vs 2023 | | | 2023 vs 2022 | |
(in thousands) | | 2024 | | | 2023 | | | 2022 | | | Change | | | Change | |
Endpoint ICs | | $ | 305,915 | | | $ | 234,426 | | | $ | 191,532 | | | $ | 71,489 | | | $ | 42,894 | |
Systems | | | 60,172 | | | | 73,113 | | | | 66,268 | | | | (12,941 | ) | | | 6,845 | |
Total revenue | | $ | 366,087 | | | $ | 307,539 | | | $ | 257,800 | | | $ | 58,548 | | | $ | 49,739 | |
We currently derive substantially all our revenue from sales of endpoint ICs, reader ICs, readers, gateways, test and measurement solutions and licensing. We sell our endpoint ICs and test and measurement solutions primarily to inlay manufacturers; our reader ICs primarily to OEMs and ODMs through distributors; and our readers and gateways to solutions providers, VARs and SIs, also primarily through distributors. We expect endpoint IC sales to represent the majority of our revenue for the foreseeable future.
Endpoint IC revenue increased $71.5 million, due primarily to a $79.7 million increase from higher shipment volumes and $15.0 million from licensing revenue that did not occur in the prior year, partially offset by a $23.2 million decrease due to lower average ASP, the latter due primarily to product mix shift, and to a lesser extent, short-term pricing incentives on legacy products.
Systems revenue decreased $12.9 million due primarily to a decrease in shipment volumes. Reader and gateway revenue decreased $5.8 million and $8.6 million, respectively. These decreases were partially offset by an increase of $3.1 million from test and measurement solutions revenue.
Gross Profit and Gross Margin
| | | | | | | | | | | | | | | | | | | | |
| | Year Ended December 31, | | | 2024 vs 2023 | | | 2023 vs 2022 | |
(in thousands, except percentages) | | 2024 | | | 2023 | | | 2022 | | | Change | | | Change | |
Cost of revenue | | $ | 177,232 | | | $ | 155,557 | | | $ | 119,916 | | | $ | 21,675 | | | $ | 35,641 | |
Gross profit | | | 188,855 | | | | 151,982 | | | | 137,884 | | | | 36,873 | | | | 14,098 | |
Gross margin | | | 51.6 | % | | | 49.4 | % | | | 53.5 | % | | | 2.2 | % | | | (4.1 | )% |
Cost of revenue includes costs associated with manufacturing our endpoint ICs, reader ICs, readers, gateways and test and measurement solutions, including direct materials and outsourced manufacturing costs as well as associated overhead costs such as logistics, quality control, planning and procurement. Cost of revenue also includes charges for excess and obsolescence and warranty costs. Our gross margin varies from period to period based on the mix of endpoint IC and systems; underlying product margins driven by changes in mix, ASPs or costs; as well as from inventory excess and obsolescence charges.
Gross profit increased $36.9 million, due primarily to increased endpoint IC revenue partially offset by decreased systems revenue. Gross margin increased, due primarily to high-margin licensing revenue recognized in the year that did not occur in the prior year.
Operating Expenses
Research and Development
| | | | | | | | | | | | | | | | | | | | |
| | Year Ended December 31, | | | 2024 vs 2023 | | | 2023 vs 2022 | |
(in thousands) | | 2024 | | | 2023 | | | 2022 | | | Change | | | Change | |
Research and development | | $ | 98,829 | | | $ | 88,562 | | | $ | 74,106 | | | $ | 10,267 | | | $ | 14,456 | |
Research and development expense comprises primarily personnel expenses (salaries, benefits and other employee related costs) and stock-based compensation expense for our product-development personnel; product development costs which include external consulting and service costs, prototype materials and other new-product development costs; and an allocated portion of infrastructure costs which include occupancy, depreciation and software costs. We expect research and development expense to increase in absolute dollars in future periods as we continue to focus on new product development and introductions.
Research and development expense increased $10.3 million, due primarily to increases of $8.5 million in personnel expenses primarily from higher bonus achievement and to a lesser extent increased headcount, $4.4 million in stock-based compensation expense related primarily to increased outstanding equity grants, and $1.5 million in infrastructure costs primarily from increased depreciation and software costs, partially offset by a decrease of $4.1 million in product development costs.
Sales and Marketing
| | | | | | | | | | | | | | | | | | | | |
| | Year Ended December 31, | | | 2024 vs 2023 | | | 2023 vs 2022 | |
(in thousands) | | 2024 | | | 2023 | | | 2022 | | | Change | | | Change | |
Sales and marketing | | $ | 40,579 | | | $ | 41,123 | | | $ | 37,894 | | | $ | (544 | ) | | $ | 3,229 | |
Sales and marketing expense comprises primarily personnel expenses (salaries, incentive sales compensation, or commission, benefits and other employee-related costs) and stock-based compensation expense for our sales and marketing personnel; travel, advertising and promotional expenses; and an allocated portion of infrastructure costs which include occupancy, depreciation and software costs.
Sales and marketing expense decreased $0.5 million, due primarily to decreases of $0.5 million in marketing related spend and $0.4 million in personnel expenses resulting from lower headcount, partially offset by higher bonus achievement and commissions. These decreases were partially offset by an increase of $0.5 million in stock-based compensation expense related primarily to increased outstanding equity grants.
General and Administrative
| | | | | | | | | | | | | | | | | | | | |
| | Year Ended December 31, | | | 2024 vs 2023 | | | 2023 vs 2022 | |
(in thousands) | | 2024 | | | 2023 | | | 2022 | | | Change | | | Change | |
General and administrative | | $ | 51,802 | | | $ | 60,828 | | | $ | 45,465 | | | $ | (9,026 | ) | | $ | 15,363 | |
General and administrative expense comprises primarily personnel expenses (salaries, benefits and other employee related costs) and stock-based compensation expense for our executive, finance, human resources and information technology personnel; legal, accounting and other professional service fees; travel and insurance expense; and an allocated portion of infrastructure costs which include occupancy, depreciation and software costs.
General and administrative expense decreased $9.0 million, due primarily to a decrease of $18.0 million in professional services related to legal fees and transaction expenses, partially offset by increases of $5.2 million personnel expenses from higher bonus achievement, higher headcount and higher payroll
taxes, and $3.5 million in stock-based compensation expense related primarily to increased outstanding equity grants.
Amortization of Intangibles
| | | | | | | | | | | | | | | | | | | | |
| | Year Ended December 31, | | | 2024 vs 2023 | | | 2023 vs 2022 | |
(in thousands) | | 2024 | | | 2023 | | | 2022 | | | Change | | | Change | |
Amortization of intangibles | | $ | 2,902 | | | $ | 4,953 | | | $ | — | | | $ | (2,051 | ) | | $ | 4,953 | |
Amortization of intangibles decreased by $2.1 million. The decrease relates to the intangibles acquired as part of our April 3, 2023 acquisition of Voyantic Oy. Certain intangible assets acquired had useful life of less than 1 year, resulting in a higher amortization expense in the prior-year period.
Restructuring Costs
| | | | | | | | | | | | | | | | | | | | |
| | Year Ended December 31, | | | 2024 vs 2023 | | | 2023 vs 2022 | |
(in thousands) | | 2024 | | | 2023 | | | 2022 | | | Change | | | Change | |
Restructuring costs | | $ | 1,812 | | | $ | — | | | $ | (102 | ) | | $ | 1,812 | | | $ | 102 | |
The increase in restructuring costs relates to the restructuring we initiated on February 7, 2024. For further information on this restructuring, please refer to Note 18 to our consolidated financial statements included elsewhere in this report.
Income From Settlement of Litigation
| | | | | | | | | | | | | | | | | | | | |
| | Year Ended December 31, | | | 2024 vs 2023 | | | 2023 vs 2022 | |
(in thousands) | | 2024 | | | 2023 | | | 2022 | | | Change | | | Change | |
Income from settlement of litigation | | $ | 45,000 | | | $ | — | | | $ | — | | | $ | 45,000 | | | $ | — | |
The increase in income from settlement of litigation relates to the Settlement Agreement with NXP on March 13, 2024. See Note 12, Commitments and Contingencies for further details.
Other Income, Net
| | | | | | | | | | | | | | | | | | | | |
| | Year Ended December 31, | | | 2024 vs 2023 | | | 2023 vs 2022 | |
(in thousands) | | 2024 | | | 2023 | | | 2022 | | | Change | | | Change | |
Other income, net | | $ | 7,937 | | | $ | 4,644 | | | $ | 2,517 | | | $ | 3,293 | | | $ | 2,127 | |
Other income, net, comprises primarily interest income on our short-term investments.
Other income, net, increased $3.3 million, due to increased interest income given higher invested balances and higher interest rates.
Induced Conversion Expense
| | | | | | | | | | | | | | | | | | | | |
| | Year Ended December 31, | | | 2024 vs 2023 | | | 2023 vs 2022 | |
(in thousands) | | 2024 | | | 2023 | | | 2022 | | | Change | | | Change | |
Induced conversion expense | | $ | — | | | $ | — | | | $ | 2,232 | | | $ | — | | | $ | (2,232 | ) |
There was no induced conversion expense for the years ended December 31, 2024 and 2023.
Interest Expense
| | | | | | | | | | | | | | | | | | | | |
| | Year Ended December 31, | | | 2024 vs 2023 | | | 2023 vs 2022 | |
(in thousands) | | 2024 | | | 2023 | | | 2022 | | | Change | | | Change | |
Interest expense | | $ | 4,873 | | | $ | 4,848 | | | $ | 4,923 | | | $ | 25 | | | $ | (75 | ) |
Interest expense comprises primarily cash interest, amortization of debt issuance costs and debt discount.
Interest expense remained comparable to the prior period.
Income Tax Expense
| | | | | | | | | | | | | | | | | | | | |
| | Year Ended December 31, | | | 2024 vs 2023 | | | 2023 vs 2022 | |
(in thousands) | | 2024 | | | 2023 | | | 2022 | | | Change | | | Change | |
Income tax expense (benefit) | | $ | 157 | | | $ | (322 | ) | | $ | 184 | | | $ | 479 | | | $ | (506 | ) |
We are subject to federal and state income taxes in the United States and foreign jurisdictions.
Income tax expense increased by $0.5 million due to changes in our estimated effective tax rate.
Liquidity and Capital Resources
As of December 31, 2024, we had cash, cash equivalents and short-term investments of $164.7 million, comprising cash deposits held at major financial institutions and short-term investments in a variety of securities, including U.S. government securities, treasury bills, corporate notes and bonds, commercial paper and money market funds. As of December 31, 2024, we had working capital of $(4.8) million, down from $238.8 million as of December 31, 2023. The decrease was driven by the reclassification of our convertible debt from long-term to current, due to certain conditions being met (refer to Note 8 our consolidated financial statements included elsewhere in this report for further information). This decrease was partially offset by an increase in cash and short-term investments.
Historically, we have funded our operations primarily through cash generated from operations and by issuing equity securities, convertible-debt offerings and/or borrowing under our prior senior credit facility.
We believe, based on our current operating plan, that our existing cash, cash equivalents and short-term investments will be sufficient to meet our anticipated cash needs for at least the next 12 months. Over the longer term, we plan to continue investing to enhance and extend our platform. If our available funds are insufficient to fund our future activities or execute our strategy, then we may raise additional capital through equity, equity-linked or debt financing, to the extent such funding sources are available. Alternatively, we may need to reduce expenses to manage liquidity; however, any such reductions could adversely impact our business and competitive position.
Sources of Funds
From time to time, we may explore additional financing sources and ways to reduce our cost of capital, including equity, equity-linked and debt financing. In addition, in connection with any future acquisitions, we may pursue additional financing which may be debt, equity or equity-linked financing or a combination thereof. We can provide no assurance that any additional financing will be available to us on acceptable terms.
2021 Notes
In November 2021, we issued convertible notes due in 2027 in an aggregate principal amount of $287.5 million, which we refer to as the 2021 Notes. The 2021 Notes are our senior unsecured obligation, bearing interest at a fixed rate of 1.125% per year, payable semi-annually in arrears on May 15 and November 15 of each year, beginning on May 15, 2022. The 2021 Notes are convertible into cash, shares of our common stock or a combination thereof, at our election, and will mature on May 15, 2027 unless earlier repurchased, redeemed or converted in accordance with the indenture terms.
The net proceeds from the 2021 Notes were approximately $278.4 million after initial debt issuance costs, fees and expenses. We used approximately $183.6 million of the net proceeds to repurchase approximately $76.4 million aggregate principal amount of convertible notes due 2026, or the 2019 Notes through individual privately negotiated transactions concurrent with the 2021 Notes offering. We used $17.6 million to repurchase the remaining $9.85 million aggregate principal of the 2019 Notes through individual privately negotiated transactions in June 2022. Please refer to the section “Repurchase of the Convertible Senior Notes – 2019” as described in Note 8 to our consolidated financial statements included elsewhere in this report. We will use the rest of the net proceeds for general corporate purposes.
For further information on the terms of this debt, please refer to Note 8 to our consolidated financial statements included elsewhere in this report.
Historical Cash Flow Trends
The following table shows a summary of our cash flows for the periods indicated:
| | | | | | | | | | | | | |
| | Year Ended December 31, | | |
(in thousands) | | 2024 | | | 2023 | | | 2022 | | |
Net cash provided by (used in) operating activities | | $ | 128,310 | | | $ | (49,382 | ) | | $ | 641 | | |
Net cash provided by (used in) investing activities | | | (192,570 | ) | | | 115,808 | | | | (102,799 | ) | |
Net cash provided by (used in) financing activities | | | 15,679 | | | | 8,736 | | | | (2,148 | ) | |
Operating Cash Flows
For the year ended December 31, 2024, we generated $128.3 million of net cash from operating activities. These net cash proceeds were due to $112.3 million of net income adjusted for non-cash items and $16.0 million of working capital proceeds due primarily to higher accrued compensation and employee related benefits and accounts payable, partially offset by lower operating lease liabilities, acquisition related contingent consideration liability and higher inventory.
Investing Cash Flows
For the year ended December 31, 2024, we used $192.6 million of net cash from investing activities. This net cash usage was due primarily to purchases of investment of $202.1 million and property and equipment purchases of $17.1 million, partially offset by proceeds from maturities of investments of $26.6 million.
Financing Cash Flows
For the year ended December 31, 2024, we generated $15.7 million of net cash from financing activities. These net cash proceeds were due to $20.3 million from stock-option exercises and our employee stock purchase plan, or ESPP, partially offset by $4.6 million of cash paid for the earnout payment related to the Voyantic Oy acquisition.
Contractual Obligations
The following table reflects a summary of our contractual obligations as of December 31, 2024:
| | | | | | | | | | | | | | | | | | | | |
| | Payments Due By Period | |
| | Total | | | Less
Than
1 Year | | | 1-3
Years | | | 3-5
Years | | | More
Than
5 Years | |
(in thousands) | | | | | | | | | | | | | | | |
Convertible senior notes (1) | | $ | 295,586 | | | $ | 3,234 | | | $ | 292,352 | | | $ | — | | | $ | — | |
Operating lease obligations | | | | | | | | | | | | | | | |
Operating lease obligations | | | 10,248 | | | | 4,101 | | | | 4,956 | | | | 1,191 | | | | — | |
Purchase commitments (2) | | | 35,021 | | | | 35,021 | | | | — | | | | — | | | | — | |
Total | | $ | 340,855 | | | $ | 42,356 | | | $ | 297,308 | | | $ | 1,191 | | | $ | — | |
(1) The 2021 Notes include $8.1 million in interest payments.
(2) Purchase commitments comprise primarily noncancelable commitments to purchase $24.6 million of inventory as of December 31, 2024, noncancelable software license agreements with vendors and equipment purchases.
Off-Balance-Sheet Arrangements
Since inception, we have not had any relationships with unconsolidated entities, such as entities often referred to as structured finance or special-purpose entities, or financial partnerships that would have been established for the purpose of facilitating off-balance-sheet arrangements or for another contractually narrow or limited purpose.
Critical Accounting Policies and Significant Estimates
Our discussion and analysis of our financial condition and results of operations are based on our consolidated financial statements which we have prepared in accordance with GAAP. Our preparation of these consolidated financial statements requires us to make estimates and judgments that affect the reported amounts of assets and liabilities and related disclosure of contingent assets and liabilities, revenue and expenses at the date of the consolidated financial statements. Generally, we base our estimates on historical experience and on various other assumptions, in accordance with GAAP, that we believe to be reasonable under the circumstances. Our actual results may differ from these estimates under other assumptions or conditions.
Critical accounting policies and estimates are those we consider the most important to the portrayal of our financial condition and results of operations because they require our most difficult, subjective or complex judgments, often as a result of the need to make estimates about the effect of matters that are inherently uncertain. Our critical accounting policies and estimates include those related to:
•stock-based compensation.
Revenue Recognition
We generate revenue primarily from sales of hardware products. We also generate revenue from software, extended warranties, enhanced maintenance, support services and NRE development services, none of which are material.
We recognize revenue when we transfer control of the promised goods or services to our customers, which for hardware sales is generally at the time of product shipment as determined by agreed-upon shipping terms. We measure revenue based on the amount of consideration we expect to be entitled-to in exchange for those goods or services. We expect the period between when we transfer control of promised goods or services and when we receive payment to be one year or less, and that expectation is consistent with our historical experience. As such, we do not adjust our revenue for the effects of a significant financing component. We recognize any variable consideration, which comprises primarily sales incentives, as revenue reduction at the time of revenue recognition. We estimate sales incentives based on our historical experience and current expectations at the time of revenue recognition and update them at the end of each reporting period as additional information becomes available.
Our reader and gateway products are highly dependent on embedded software and cannot function without this embedded software. We account for the hardware and embedded software as a single performance obligation and recognize revenue when control is transferred.
Our customer contracts with multiple performance obligations generally include a combination of hardware products, extended warranty, enhanced maintenance and support services. For these contracts, we account for individual performance obligations separately if they are distinct. We allocate the transaction price to the separate performance obligations on a relative standalone selling-price basis. In instances where the standalone selling price is not directly observable, such as when we do not sell the product or service separately, we determine the standalone selling price using one, or a combination of, the adjusted market assessment or expected cost-plus margin. We defer amounts allocated to extended warranty and enhanced maintenance sold with our reader and gateway products and recognize them on a straight-line basis over the term of the arrangement, which is typically from one to three years. We defer amounts allocated to support services sold with our reader and gateway products and recognize them when we transfer control of the promised services to our customers.
Revenue generated from licensing our intellectual property is governed by licensing agreements. We recognize revenue from licensing the right to use functional intellectual property at the point in time the control of the license transfers to the customer, which is generally upon delivery, or as usage occurs.
If a customer pays consideration before we transfer a good or service under the contract, then we classify those amounts as contract liabilities, or deferred revenue. We recognize contract liabilities as revenue when we transfer control of the promised goods or services to our customers.
Payment terms typically range from 30 to 120 days. We present revenue net of sales tax in our consolidated statements of operations. We include shipping charges billed to customers in revenue and the related shipping costs in cost of revenue.
Practical Expedients and Exemptions: We expense sales commissions when incurred because we expect the amortization period to be one year or less. We record these costs within sales and marketing expenses. We do not disclose the value of unsatisfied performance obligations for (1) contracts with an original expected length of one year or less and (2) contracts for which we recognize revenue at the amount to which we have the right to invoice for services performed.
Inventory
We state inventories at the lower of cost or estimated net realizable value using the average costing method, which approximates a first-in, first-out method. Inventories comprise raw materials, work-in-process and finished goods. We continuously assess our inventory value and write down its value for estimated excess and obsolete inventory. This evaluation includes an analysis of inventory on hand, current and forecasted demand, product development plans and market conditions. If future demand or market conditions are less favorable than our projections, or our product development plans change from current expectations, then a write-down of excess or obsolete inventory may be required and is reflected in cost of goods sold in the period the updated information is known.
Income Taxes
We use the asset and liability approach for accounting, which requires recognizing deferred tax assets and liabilities for the expected future tax consequences of temporary differences between the financial statement and tax bases. We measure deferred tax assets and liabilities using enacted tax rates expected to be in effect when the assets and liabilities are recovered or settled. We recognize the effects of a change in tax rates on deferred tax assets and liabilities in the year that of the enactment date. We determine deferred tax assets, including historical net operating losses and deferred tax liabilities, based on temporary differences between the book and tax bases of the assets and liabilities. We believe that it is currently more likely than not that our deferred tax assets will not be realized and, as such, we have recorded a full valuation allowance for these assets. We evaluate the likelihood of our ability to realize deferred tax assets in future periods on a quarterly basis, and if evidence indicates we will be able to realize some or all of our deferred tax assets then we will revise our valuation allowance accordingly.
We use a two-step approach for evaluating uncertain tax positions. First, we evaluate recognition, which requires us to determine if the weight of available evidence indicates that a tax position is more likely than not to be sustained upon audit, including resolution of related appeals or litigation processes. If we consider a tax position more likely than not to be unsustained, then no benefits of the position are recognized. Second, we measure the uncertain tax position based on the largest amount of benefit which is more likely than not to be realized on effective settlement. This process involves estimating our actual current tax exposure, including assessing the risks associated with tax audits, together with assessing temporary differences resulting from the different treatment of items for tax and financial reporting purposes. If actual results differ from our estimates, then our net operating loss and credit carryforwards could be materially impacted.
Us realizing the benefits of the NOLs and credit carryforwards depends on sufficient taxable income in future years. We have established a valuation allowance against the carrying value of our deferred tax assets, as it is currently more likely than not we will be unable to realize these deferred tax assets. In addition, using NOLs and credits to offset future income subject to taxes may be subject to substantial annual limitations due to the “change in ownership” provisions of the Code and similar state provisions. Events that cause limitations in the amount of NOLs that we may use in any one year include, but are not limited to, a cumulative ownership change of more than 50%, as defined by Code Sections 382 and 383, over a three-year period. Using our NOLs and tax credit carryforwards could be significantly reduced if a cumulative ownership change of more than 50% has occurred in our past or occurs in our future.
We do not anticipate that the amount of our existing unrecognized tax benefits will significantly increase or decrease within the next 12 months. Due to our NOLs, in most jurisdictions our tax years remain open for examination by taxing authorities back to 2004.
Stock-Based Compensation
We have various equity award plans, or Plans for granting share-based awards to employees, consultants and non-employee directors of the Company. The Plans provide for granting several forms of stock compensation such as stock option awards, restricted stock units, or RSUs, RSUs with performance conditions, or PSUs, and RSUs with market and service conditions, or MSUs.
We measure stock-based compensation costs for all share-based awards at fair value on the measurement date, which is typically the grant date. We determine the fair value of stock options using the Black-Scholes option-pricing model, which considers, among other things, estimates and assumptions on the expected life of the options, stock price volatility and market value of the Company’s common stock. We determine the fair value of RSUs and PSUs based on the closing price of our common stock at grant date. Additionally, for awards with a market condition, we use a Monte Carlo simulation model to estimate grant date fair value, which takes into consideration the range of possible stock price of total stockholder return outcomes.
Recent Accounting Pronouncements
For information on recent accounting pronouncements, please refer to Note 2 in our consolidated financial statements included elsewhere in this report.
Item 7A. Quantitative and Qualitative Disclosures About Market Risk
We are exposed to market risks in the ordinary course of our business. Some of these risks are related to fluctuations in interest rates.
Interest Rate Risk
Under our current investment policy, we invest our excess cash in money market funds, U.S. government securities, corporate bonds and notes and commercial paper. Our current investment policy seeks first to preserve principal, second to provide liquidity for our operating and capital needs and third to maximize yield without putting our principal at risk. We do not enter into investments for trading or speculative purposes.
We had cash, cash equivalents and short-term investments of $164.7 million and $113.2 million as of December 31, 2024 and 2023, respectively. Our investments are exposed to market risk due to fluctuations in prevailing interest rates, which may reduce the yield on our investments or their fair value. Because most of our investment portfolio is short-term in nature, we do not believe an immediate 10% increase in interest rates would have a material effect on the fair market value of our portfolio, and therefore we do not expect our results of operations or cash flows to be materially affected by a sudden change in market interest rates.
Our convertible notes have fixed interest rates, thus a hypothetical 100 basis point increase in interest rates would not impact interest expense.
Inflation Risk
We do not believe that inflation has had a material effect on our business, financial condition or results of operations. To date, we have been able to substantially offset higher product costs by increasing our product selling prices. If our product costs became subject to significant future inflationary pressures, then we may not be able to fully offset these higher costs through price increases. Our inability or failure to do so could adversely affect our business, financial condition and results of operations.
Foreign Currency Exchange Risk
We are subject to risks associated with transactions that are denominated in currencies other than our functional currency and the effects of translating amounts denominated in a foreign currency to the U.S. dollar as a normal part of our reporting process. The functional currency of the majority of our foreign subsidiaries is the U.S. dollar. Accordingly, gains and losses resulting from remeasuring transactions denominated in currencies other than U.S. dollars are included in other income, net, on our consolidated statements of operations. One of our European subsidiaries utilizes Euros as their functional currency, which results in a translation adjustment that we include as a component of accumulated other comprehensive income. For any of the periods presented, we did not have material impact from exposure to foreign currency fluctuation. As we grow our operations, our exposure to foreign currency risk will likely become more significant.
Item 8. Financial Statements and Supplementary Data
Report of Independent Registered Public Accounting Firm
To the Stockholders and the Board of Directors of Impinj, Inc.
Opinion on the Financial Statements
We have audited the accompanying consolidated balance sheets of Impinj, Inc. (the Company) as of December 31, 2024 and 2023, the related consolidated statements of operations, comprehensive income (loss), changes in stockholders’ equity (deficit) and cash flows for each of the three years in the period ended December 31, 2024, and the related notes (collectively referred to as the “consolidated financial statements”). In our opinion, the consolidated financial statements present fairly, in all material respects, the financial position of the Company at December 31, 2024 and 2023, and the results of its operations and its cash flows for each of the three years in the period ended December 31, 2024, in conformity with U.S. generally accepted accounting principles.
We also have audited, in accordance with the standards of the Public Company Accounting Oversight Board (United States) (PCAOB), the Company’s internal control over financial reporting as of December 31, 2024, based on criteria established in Internal Control—Integrated Framework issued by the Committee of Sponsoring Organizations of the Treadway Commission (2013 framework), and our report dated February 10, 2025 expressed an unqualified opinion thereon.
Basis for Opinion
These financial statements are the responsibility of the Company’s management. Our responsibility is to express an opinion on the Company’s financial statements based on our audits. We are a public accounting firm registered with the PCAOB and are required to be independent with respect to the Company in accordance with the U.S. federal securities laws and the applicable rules and regulations of the Securities and Exchange Commission and the PCAOB.
We conducted our audits in accordance with the standards of the PCAOB. Those standards require that we plan and perform the audit to obtain reasonable assurance about whether the financial statements are free of material misstatement, whether due to error or fraud. Our audits included performing procedures to assess the risks of material misstatement of the financial statements, whether due to error or fraud, and performing procedures that respond to those risks. Such procedures included examining, on a test basis, evidence regarding the amounts and disclosures in the financial statements. Our audits also included evaluating the accounting principles used and significant estimates made by management, as well as evaluating the overall presentation of the financial statements. We believe that our audits provide a reasonable basis for our opinion.
Critical Audit Matter
The critical audit matter communicated below is a matter arising from the current period audit of the financial statements that was communicated or required to be communicated to the audit committee and that: (1) relates to accounts or disclosures that are material to the financial statements and (2) involved our especially challenging, subjective or complex judgments. The communication of the critical audit matter does not alter in any way our opinion on the consolidated financial statements, taken as a whole, and we are not, by communicating the critical audit matter below, providing a separate opinion on the critical audit matter or on the accounts or disclosures to which it relates.
| |
Inventory valuation |
Description of the Matter | The Company's inventory totaled $99.3 million as of December 31, 2024. As explained in Note 2 to the consolidated financial statements, the Company determines the appropriate value of all inventory in each reporting period. Obsolete inventory or inventory in excess of management's estimated usage requirement is written down to its estimated net realizable value if those amounts are determined to be less than cost. Auditing management's estimates for excess and obsolete inventory involved subjective auditor judgment because the estimates are affected by market and economic conditions outside the Company's control, including management's assumptions about the product demand and life cycle. |
How We Addressed the Matter in Our Audit | We obtained an understanding, evaluated the design, and tested the operating effectiveness of internal controls over the Company's excess and obsolete inventory reserve estimate. This included management's determination of the assumptions and data underlying the excess and obsolete inventory valuation. To test the Company's estimates for excess and obsolete inventory, we performed audit procedures that included, among others, testing the accuracy and completeness of the underlying data used in the estimation calculations and evaluating significant assumptions (e.g., forecasted customer demand and product life cycle). We assessed forecast accuracy by comparing historical forecast to actual results. We also performed sensitivity analysis to evaluate the changes in the excess and obsolete inventory estimates that would result from changes in the underlying assumptions. |
| |
/s/ Ernst & Young LLP We have served as the Company’s auditor since 2020. Seattle, Washington February 10, 2025 | |
Report of Independent Registered Public Accounting Firm
To the Stockholders and the Board of Directors of Impinj, Inc.
Opinion on Internal Control Over Financial Reporting
We have audited Impinj, Inc.’s internal control over financial reporting as of December 31, 2024, based on criteria established in Internal Control—Integrated Framework issued by the Committee of Sponsoring Organizations of the Treadway Commission (2013 framework) (the COSO criteria). In our opinion, Impinj, Inc. (the Company) maintained, in all material respects, effective internal control over financial reporting as of December 31, 2024, based on the COSO criteria.
We also have audited, in accordance with the standards of the Public Company Accounting Oversight Board (United States) (PCAOB), the consolidated balance sheets of the Company as of December 31, 2024 and 2023, the related consolidated statements of operations, comprehensive income (loss), changes in stockholders’ equity (deficit) and cash flows for each of the three years in the period ended December 31, 2024, and the related notes and our report dated February 10, 2025 expressed an unqualified opinion thereon.
Basis for Opinion
The Company’s management is responsible for maintaining effective internal control over financial reporting and for its assessment of the effectiveness of internal control over financial reporting included in the accompanying Management’s Report on Internal Control Over Financial Reporting. Our responsibility is to express an opinion on the Company’s internal control over financial reporting based on our audit. We are a public accounting firm registered with the PCAOB and are required to be independent with respect to the Company in accordance with the U.S. federal securities laws and the applicable rules and regulations of the Securities and Exchange Commission and the PCAOB.
We conducted our audit in accordance with the standards of the PCAOB. Those standards require that we plan and perform the audit to obtain reasonable assurance about whether effective internal control over financial reporting was maintained in all material respects.
Our audit included obtaining an understanding of internal control over financial reporting, assessing the risk that a material weakness exists, testing and evaluating the design and operating effectiveness of internal control based on the assessed risk, and performing such other procedures as we considered necessary in the circumstances. We believe that our audit provides a reasonable basis for our opinion.
Definition and Limitations of Internal Control Over Financial Reporting
A company’s internal control over financial reporting is a process designed to provide reasonable assurance regarding the reliability of financial reporting and the preparation of financial statements for external purposes in accordance with generally accepted accounting principles. A company’s internal control over financial reporting includes those policies and procedures that (1) pertain to the maintenance of records that, in reasonable detail, accurately and fairly reflect the transactions and dispositions of the assets of the company; (2) provide reasonable assurance that transactions are recorded as necessary to permit preparation of financial statements in accordance with generally accepted accounting principles, and that receipts and expenditures of the company are being made only in accordance with authorizations of management and directors of the company; and (3) provide reasonable assurance regarding prevention
or timely detection of unauthorized acquisition, use, or disposition of the company’s assets that could have a material effect on the financial statements.
Because of its inherent limitations, internal control over financial reporting may not prevent or detect misstatements. Also, projections of any evaluation of effectiveness to future periods are subject to the risk that controls may become inadequate because of changes in conditions, or that the degree of compliance with the policies or procedures may deteriorate.
/s/ Ernst & Young LLP
Seattle, Washington
February 10, 2025
Impinj, Inc.
Consolidated Balance Sheets
(in thousands, except par value)
| | | | | | | |
| December 31, 2024 | | | December 31, 2023 | |
Assets: | | | | | |
Current assets: | | | | | |
Cash and cash equivalents | $ | 46,053 | | | $ | 94,793 | |
Short-term investments | | 118,661 | | | | 18,440 | |
Accounts receivable, net | | 56,802 | | | | 54,919 | |
Inventory | | 99,346 | | | | 97,172 | |
Prepaid expenses and other current assets | | 5,536 | | | | 4,372 | |
Total current assets | | 326,398 | | | | 269,696 | |
Long-term investments | | 74,871 | | | | — | |
Property and equipment, net | | 50,610 | | | | 44,891 | |
Intangible assets, net | | 10,291 | | | | 13,913 | |
Operating lease right-of-use assets | | 7,142 | | | | 9,735 | |
Other non-current assets | | 1,045 | | | | 1,478 | |
Goodwill | | 18,723 | | | | 19,696 | |
Total assets | $ | 489,080 | | | $ | 359,409 | |
Liabilities and stockholders' equity: | | | | | |
Current liabilities: | | | | | |
Accounts payable | $ | 17,254 | | | $ | 8,661 | |
Accrued compensation and employee related benefits | | 22,309 | | | | 8,519 | |
Accrued and other current liabilities | | 2,684 | | | | 8,614 | |
Current portion of operating lease liabilities | | 3,589 | | | | 3,373 | |
Current portion of long-term debt | | 283,493 | | | | — | |
Current portion of deferred revenue | | 1,848 | | | | 1,713 | |
Total current liabilities | | 331,177 | | | | 30,880 | |
Long-term debt | | — | | | | 281,855 | |
Operating lease liabilities, net of current portion | | 5,719 | | | | 9,360 | |
Deferred tax liabilities, net | | 2,200 | | | | 2,911 | |
Deferred revenue, net of current portion | | 120 | | | | 272 | |
Total liabilities | | 339,216 | | | | 325,278 | |
Commitments and contingencies (Note 12) | | | | | |
Stockholders' equity: | | | | | |
Preferred stock, $0.001 par value — 5,000 shares authorized, no shares issued and outstanding at December 31, 2024 and 2023 | | — | | | | — | |
Common stock, $0.001 par value — 495,000 shares authorized, 28,504 and 27,166 shares issued and outstanding at December 31, 2024 and 2023, respectively | | 29 | | | | 27 | |
Additional paid-in capital | | 541,090 | | | | 463,900 | |
Accumulated other comprehensive income (loss) | | (1,942 | ) | | | 355 | |
Accumulated deficit | | (389,313 | ) | | | (430,151 | ) |
Total stockholders' equity | | 149,864 | | | | 34,131 | |
Total liabilities and stockholders' equity | $ | 489,080 | | | $ | 359,409 | |
The accompanying notes are an integral part of these consolidated financial statements.
Impinj, Inc.
Consolidated Statements of Operations
(in thousands, except per share data)
| | | | | | | | | | | |
| Year Ended December 31, | |
| 2024 | | | 2023 | | | 2022 | |
Revenue | $ | 366,087 | | | $ | 307,539 | | | $ | 257,800 | |
Cost of revenue | | 177,232 | | | | 155,557 | | | | 119,916 | |
Gross profit | | 188,855 | | | | 151,982 | | | | 137,884 | |
Operating expenses: | | | | | | | | |
Research and development | | 98,829 | | | | 88,562 | | | | 74,106 | |
Sales and marketing | | 40,579 | | | | 41,123 | | | | 37,894 | |
General and administrative | | 51,802 | | | | 60,828 | | | | 45,465 | |
Amortization of intangibles | | 2,902 | | | | 4,953 | | | | — | |
Restructuring costs | | 1,812 | | | | — | | | | (102 | ) |
Total operating expenses | | 195,924 | | | | 195,466 | | | | 157,363 | |
Loss from operations | | (7,069 | ) | | | (43,484 | ) | | | (19,479 | ) |
Other income, net | | 7,937 | | | | 4,644 | | | | 2,517 | |
Income from settlement of litigation | | 45,000 | | | | — | | | | — | |
Induced conversion expense | | — | | | | — | | | | (2,232 | ) |
Interest expense | | (4,873 | ) | | | (4,848 | ) | | | (4,923 | ) |
Income (loss) before income taxes | | 40,995 | | | | (43,688 | ) | | | (24,117 | ) |
Income tax benefit (expense) | | (157 | ) | | | 322 | | | | (184 | ) |
Net income (loss) | $ | 40,838 | | | $ | (43,366 | ) | | $ | (24,301 | ) |
| | | | | | | | |
Net income (loss) per share — basic | $ | 1.46 | | | $ | (1.62 | ) | | $ | (0.95 | ) |
Net income (loss) per share — diluted | $ | 1.39 | | | $ | (1.62 | ) | | $ | (0.95 | ) |
Weighted-average shares outstanding — basic | | 27,953 | | | | 26,752 | | | | 25,539 | |
Weighted-average shares outstanding — diluted | | 29,471 | | | | 26,752 | | | | 25,539 | |
The accompanying notes are an integral part of these consolidated financial statements.
Impinj, Inc.
Consolidated Statements of Comprehensive Income (Loss)
(in thousands)
| | | | | | | | | | | |
| Year Ended December 31, | |
| 2024 | | | 2023 | | | 2022 | |
Net income (loss) | $ | 40,838 | | | $ | (43,366 | ) | | $ | (24,301 | ) |
Other comprehensive income (loss), net of tax: | | | | | | | | |
Unrealized gain (loss) on investments | | (515 | ) | | | 1,198 | | | | (1,210 | ) |
Foreign currency translation adjustment | | (1,782 | ) | | | 406 | | | | — | |
Total other comprehensive income (loss) | | (2,297 | ) | | | 1,604 | | | | (1,210 | ) |
Comprehensive income (loss) | $ | 38,541 | | | $ | (41,762 | ) | | $ | (25,511 | ) |
The accompanying notes are an integral part of these consolidated financial statements.
Impinj, Inc.
Consolidated Statements of Changes in Stockholders’ Equity (Deficit)
(in thousands)
| | | | | | | | | | | | | | | | | | | | | | | | |
| | | | | | | | | | | | | | Accumulated | | | Total | |
| | | | | | | | Additional | | | | | | Other | | | Stockholders' | |
| | Common Stock | | | Paid-in | | | Accumulated | | | Comprehensive | | | Equity | |
| | Shares | | | Amount | | | Capital | | | Deficit | | | Income (loss) | | | (Deficit) | |
Balance at December 31, 2021 | | | 24,737 | | | $ | 25 | | | $ | 351,422 | | | $ | (362,484 | ) | | $ | (39 | ) | | $ | (11,076 | ) |
Issuance of common stock | | | 1,361 | | | | 1 | | | | 15,415 | | | | — | | | | — | | | | 15,416 | |
Stock-based compensation | | | — | | | | — | | | | 42,443 | | | | — | | | | — | | | | 42,443 | |
Induced conversion on 2019 Notes (Note 8) | | | — | | | | — | | | | (5,681 | ) | | | — | | | | — | | | | (5,681 | ) |
Net loss | | | — | | | | — | | | | — | | | | (24,301 | ) | | | — | | | | (24,301 | ) |
Other comprehensive loss | | | — | | | | — | | | | — | | | | — | | | | (1,210 | ) | | | (1,210 | ) |
Balance at December 31, 2022 | | | 26,098 | | | $ | 26 | | | $ | 403,599 | | | $ | (386,785 | ) | | $ | (1,249 | ) | | $ | 15,591 | |
Issuance of common stock | | | 1,041 | | | | 1 | | | | 8,736 | | | | — | | | | — | | | | 8,737 | |
Stock-based compensation | | | — | | | | — | | | | 47,986 | | | | — | | | | — | | | | 47,986 | |
Net loss | | | — | | | | — | | | | — | | | | (43,366 | ) | | | — | | | | (43,366 | ) |
Equity issuance for Voyantic acquisition (Note 6) | | | 27 | | | | — | | | | 3,579 | | | | — | | | | — | | | | 3,579 | |
Other comprehensive income | | | — | | | | — | | | | — | | | | — | | | | 1,604 | | | | 1,604 | |
Balance at December 31, 2023 | | | 27,166 | | | $ | 27 | | | $ | 463,900 | | | $ | (430,151 | ) | | $ | 355 | | | $ | 34,131 | |
Issuance of common stock | | | 1,338 | | | | 2 | | | | 20,278 | | | | — | | | | — | | | | 20,280 | |
Stock-based compensation | | | — | | | | — | | | | 56,546 | | | | — | | | | — | | | | 56,546 | |
Restructuring equity modification expense | | | — | | | | — | | | | 366 | | | | — | | | | — | | | | 366 | |
Net income | | | — | | | | — | | | | — | | | | 40,838 | | | | — | | | | 40,838 | |
Other comprehensive loss | | | — | | | | — | | | | — | | | | — | | | | (2,297 | ) | | | (2,297 | ) |
Balance at December 31, 2024 | | | 28,504 | | | $ | 29 | | | $ | 541,090 | | | $ | (389,313 | ) | | $ | (1,942 | ) | | $ | 149,864 | |
The accompanying notes are an integral part of these consolidated financial statements.
Impinj, Inc.
Consolidated Statements of Cash Flows
(in thousands)
| | | | | | | | | | | | |
| Year Ended December 31, | | |
| 2024 | | | 2023 | | | 2022 | | |
Operating activities: | | | | | | | | | |
Net income (loss) | $ | 40,838 | | | $ | (43,366 | ) | | $ | (24,301 | ) | |
Adjustments to reconcile net income (loss) to net cash provided by operating activities: | | | | | | | | | |
Depreciation and amortization | | 13,588 | | | | 13,623 | | | | 6,044 | | |
Stock-based compensation | | 56,546 | | | | 47,986 | | | | 42,443 | | |
Restructuring equity modification expense | | 366 | | | | — | | | | — | | |
Accretion of discount or amortization of premium on investments | | (1,122 | ) | | | (1,637 | ) | | | (233 | ) | |
Amortization of debt issuance costs | | 1,638 | | | | 1,611 | | | | 1,601 | | |
Loss on fixed asset disposal | | — | | | | — | | | | 57 | | |
Induced conversion expense related to convertible notes | | — | | | | — | | | | 2,232 | | |
Deferred tax expense | | (567 | ) | | | (931 | ) | | | — | | |
Revaluation of acquisition-related contingent consideration liability | | 986 | | | | 1,570 | | | | — | | |
Changes in operating assets and liabilities, net of amounts acquired: | | | | | | | | | |
Accounts receivable | | (1,999 | ) | | | (3,713 | ) | | | (14,547 | ) | |
Inventory | | (2,220 | ) | | | (49,577 | ) | | | (24,439 | ) | |
Prepaid expenses and other assets | | 227 | | | | 1,625 | | | | 852 | | |
Accounts payable | | 9,270 | | | | (12,303 | ) | | | 7,371 | | |
Accrued compensation and employee related benefits | | 13,855 | | | | (1,119 | ) | | | 2,683 | | |
Accrued and other liabilities | | 244 | | | | (591 | ) | | | (215 | ) | |
Acquisition-related contingent consideration liability | | (2,556 | ) | | | — | | | | — | | |
Operating lease right-of-use assets | | 2,560 | | | | 2,607 | | | | 3,414 | | |
Operating lease liabilities | | (3,392 | ) | | | (3,308 | ) | | | (4,126 | ) | |
Deferred revenue | | 48 | | | | (1,859 | ) | | | 1,805 | | |
Net cash provided by (used in) operating activities | | 128,310 | | | | (49,382 | ) | | | 641 | | |
Investing activities: | | | | | | | | | |
Purchases of investments | | (202,063 | ) | | | — | | | | (205,749 | ) | |
Proceeds from sales of investments | | — | | | | 13,372 | | | | — | | |
Proceeds from maturities of investments | | 26,605 | | | | 144,401 | | | | 114,750 | | |
Proceeds from sale of property and equipment | | — | | | | 234 | | | | 279 | | |
Purchases of intangible assets | | — | | | | (250 | ) | | | — | | |
Purchases of property and equipment | | (17,112 | ) | | | (18,592 | ) | | | (12,079 | ) | |
Business acquisitions, net of cash acquired | | — | | | | (23,357 | ) | | | — | | |
Net cash provided by (used in) investing activities | | (192,570 | ) | | | 115,808 | | | | (102,799 | ) | |
Financing activities: | | | | | | | | | |
Proceeds from exercise of stock options and employee stock purchase plan | | 20,281 | | | | 8,736 | | | | 15,416 | | |
Payment of 2019 Notes | | — | | | | — | | | | (17,564 | ) | |
Payment of acquisition-related contingent consideration | | (4,602 | ) | | | — | | | | — | | |
Net cash provided by (used in) financing activities | | 15,679 | | | | 8,736 | | | | (2,148 | ) | |
Effect of exchange rate changes on cash and cash equivalents | | (159 | ) | | | 34 | | | | — | | |
Net increase (decrease) in cash and cash equivalents | | (48,740 | ) | | | 75,196 | | | | (104,306 | ) | |
Cash and cash equivalents | | | | | | | | | |
Beginning of period | | 94,793 | | | | 19,597 | | | | 123,903 | | |
End of period | $ | 46,053 | | | $ | 94,793 | | | $ | 19,597 | | |
| | | | | | | | | |
| | | | | | | | | | | | |
Supplemental disclosure of cashflow information: | | | | | | | | | |
Cash paid for interest | $ | 3,234 | | | $ | 3,234 | | | $ | 3,420 | | |
Purchases of property and equipment not yet paid | $ | 763 | | | $ | 1,417 | | | $ | 6,245 | | |
Operating lease liabilities arising from obtaining ROU assets | $ | — | | | $ | 979 | | | $ | — | | |
Lease liabilities arising from remeasurement of ROU assets | $ | — | | | $ | 159 | | | $ | — | | |
26,396 shares of common stock issued for Voyantic Oy acquisition | $ | — | | | $ | 3,579 | | | $ | — | | |
Acquisition-related contingent consideration liability | $ | — | | | $ | 6,172 | | | $ | — | | |
The accompanying notes are an integral part of these consolidated financial statements.
IMPINJ, INC.
NOTES TO CONSOLIDATED FINANCIAL STATEMENTS
Note 1. Description of Business
Impinj, Inc., a Delaware corporation, is headquartered in Seattle, Washington. The Impinj platform wirelessly connects items and delivers data about the connected items to business and consumer applications. Impinj generates revenue from enterprise solutions that use our platform's constituent elements — endpoint ICs, reader ICs, readers gateways, and test and measurement solutions — as well as from development, service and license agreements.
Note 2. Summary of Significant Accounting Policies
Basis of Presentation and Principles of Consolidation
The accompanying consolidated financial statements include Impinj, Inc. and its wholly owned subsidiaries. We have eliminated intercompany balances and transactions in consolidation. We have prepared these consolidated financial statements in conformity with U.S. generally accepted accounting principles, or GAAP.
All numbers in the consolidated financial statements are rounded to the nearest thousand, except for per share data, and numbers in the notes to the consolidated financial statements are rounded to the nearest million.
Use of Estimates
Preparing financial statements in conformity with GAAP requires management to make certain estimates, judgments and assumptions that affect the reported amounts of assets and liabilities and related disclosures as of the date of the financial statements, as well as the reported revenue and expenses during the periods presented. We evaluate our estimates on an ongoing basis, including those related to revenue recognition, sales incentives, the fair value of assets acquired, liabilities assumed, contingent consideration in business combinations, inventory excess and obsolescence and income taxes. To the extent there are material differences between our estimates, judgments or assumptions and actual results, our financial statements will be affected.
Concentrations of Credit Risk
Financial instruments, which potentially subject us to credit-risk concentration, comprise primarily cash equivalents, investments and accounts receivable. We place our cash and cash equivalents and investments with major financial institutions, which management assesses to be of high credit quality, to limit our investment exposure. We extend credit to customers based on our evaluation of the customer’s financial condition and generally do not require collateral. The following tables present total revenue and accounts receivable concentration for the indicated periods as of the dates presented:
| | | | | | | | | | | | |
| | Year Ended December 31, | |
| | 2024 | | | 2023 | | | 2022 | |
Revenue: | |
| | |
| | |
| |
Customer A | | | 28 | % | | | 33 | % | | | 28 | % |
Customer B | | | 17 | | | | 11 | | | | 10 | |
Customer C | | | 15 | | | * | | | * | |
| | | 60 | % | | | 44 | % | | | 38 | % |
* Customer accounted for less than 10% of total revenue in the period.
| | | | | | | | |
| | As of December 31, | |
| | 2024 | | | 2023 | |
Accounts Receivable: | |
| | |
| |
Customer A | | | 22 | % | | | 39 | % |
Customer B | | | 17 | | | | 11 | |
Customer C | | | 22 | | | * | |
| | | 61 | % | | | 50 | % |
* Customer accounted for less than 10% of total accounts receivable in the period.
Concentration of Supplier Risk
We outsource the manufacturing and production of our hardware products to a small number of suppliers. We believe other suppliers could provide similar products on comparable terms if needed. However, a supplier change could delay manufacturing and cause a sales loss, which would adversely affect our operating results.
Cash and Cash Equivalents
Cash includes demand deposits with banks or financial institutions. Cash equivalents include short-term, highly liquid investments that are both readily convertible to known amounts of cash and so near their maturity that they present minimal risk of changes in value with changes in interest rates. Our cash equivalents are solely investments with an original or remaining maturity of three months or less at the date of purchase. We regularly maintain cash amounts exceeding federally insured limits at financial institutions.
Investments
Our investments comprise fixed income securities, including U.S. government securities, corporate notes and bonds, commercial paper and asset-backed securities. The contractual maturities of some of our available-for-sale, or AFS, debt securities exceed a year and are classified as long-term investments on our balance sheet. We carry AFS debt securities at fair value with unrealized gains and losses reported as a component of other comprehensive income (loss). Our investments are subject to a periodic impairment review. We recognize an impairment charge when a decline in fair value of an investment below the cost basis is determined to be other-than-temporary. Factors we consider in determining whether a loss is temporary include the extent and length of time the investment's fair value has been lower than its cost basis, the financial condition and near-term prospects of the investee, our intent to sell the security and whether or not we will be required to sell the security prior to the expected recovery of the investment's amortized cost basis. No such impairment changes were recorded during the years ended December 31, 2024, 2023 and 2022. See Note 3 tables for the cost or amortized cost, gross unrealized gains, gross unrealized losses and total estimated fair value of our financial assets as of December 31, 2024 and 2023.
Fair Value Measurement
Accounting standards define fair value as the price that would be received to sell an asset or paid to transfer a liability (an exit price) in the principal or most advantageous market in an orderly transaction between market participants on the measurement date. The standards also establish a fair value hierarchy, which requires an entity to maximize the use of observable inputs and minimize the use of unobservable inputs when measuring fair value. There are three levels of inputs that may be used to measure fair value:
•Level 1 — Quoted prices in active markets for identical assets or liabilities.
•Level 2 — Assets and liabilities valued based on observable market data for similar instruments, such as quoted prices for similar assets or liabilities.
•Level 3 — Unobservable inputs that are supported by little or no market activity; instruments valued based on the best available data, some of which are internally developed, and considers risk premiums that a market participant would require.
We do not have any financial assets or liabilities in Level 3 as of December 31, 2024, and only had the liability for the earnout consideration related to the Voyantic Oy acquisition as of December 31, 2023. We classified this liability as such because we determined the fair value using significant unobservable inputs. See Note 3: Fair Value Measurements and Note 6: Goodwill and Intangible Assets.
We applied the following methods and assumptions in estimating our fair value measurements:
Cash Equivalents — Cash equivalents comprise highly liquid investments, including money market funds with original maturities of less than three months at the acquisition date. We record the fair value measurement of these assets based on quoted market prices in active markets.
Investments — Our investments comprise fixed income securities, which include U.S. government agency securities, corporate notes and bonds, commercial paper, treasury bills and asset-backed securities. The fair value measurement of these assets is based on observable market-based inputs or inputs that are derived principally from, or corroborated by, observable market data by correlation or other means.
Long-term Debt —See Note 8 for the carrying amount and estimated fair value of the Notes.
Contingent Consideration — The contingent consideration liability is related to our acquisition of Voyantic Oy (see Note 6: Goodwill and Intangible Assets). We paid the contingent consideration amount of $7.2 million in second-quarter 2024.
Accounts Receivable and Allowances
Accounts receivable comprises amounts billed and currently due from customers, net of allowances for doubtful accounts, sales returns and price exceptions.
The allowance for doubtful accounts is our best estimate of the amount of probable lifetime-expected credit losses in existing accounts receivable and is determined based on our historical collections experience, age of the receivable, knowledge of the customer and the condition of the general economy and industry as a whole. We record changes in our estimate of the allowance for doubtful accounts through bad debt expense and write off the receivable and corresponding allowance when accounts are ultimately determined to be uncollectible. We include bad debt expense in general and administrative expenses. For the periods presented in this report, bad debt expense and the allowance for doubtful accounts were not material.
We derive most of our accounts receivable from sales to original equipment manufacturers, or OEMs, original design manufacturers, ODMs, solution providers and distributors who are large, well-established companies. We do not have customers that represent a significant credit risk based on current economic conditions and past collection experience. Also, we have not had material past-due balances on our accounts receivable as of December 31, 2024 or 2023.
The allowance for sales returns and price exceptions is our best estimate based on our historical experience and currently available evidence. We record changes in our estimate of the allowance for sales returns and price exceptions through revenue, and relieve the allowance when we receive product returns or process claims for price exceptions. The following table summarizes our allowance for sales returns (in thousands):
| | | | | | | | | | | | | | | | |
| | Balance at Beginning of Year | | | Additional Reserve | | | Applied Sales Return | | | Balance at End of Year | |
Allowance for sales returns and price exceptions: | |
| | |
| | |
| | |
| |
During year ended December 31, 2024 | | $ | 677 | | | $ | 2,248 | | | $ | (2,155 | ) | | $ | 770 | |
During year ended December 31, 2023 | | | 605 | | | | 2,912 | | | | (2,840 | ) | | | 677 | |
During year ended December 31, 2022 | | | 947 | | | | 1,899 | | | | (2,241 | ) | | | 605 | |
We state inventories at the lower of cost or estimated net realizable value using the average costing method, which approximates a first-in, first-out method. Inventories comprise raw materials, work-in-process and finished goods. We continuously assess our inventory value and write down its value for estimated excess and obsolete inventory. This evaluation includes an analysis of inventory on hand, current and forecasted demand, product development plans and market conditions. If future demand or market conditions are less favorable than our projections, or our product development plans change from current expectations, then a write-down of excess or obsolete inventory may be required and is reflected in cost of goods sold in the period the updated information is known.
Excess and obsolescence charges had an immaterial impact on our 2024, 2023 and 2022 gross margin.
Property and Equipment
We record property and equipment at cost and depreciate it using the straight-line method over the estimated useful lives of the related assets. The useful lives are as follows:
| | | | |
Category | | Useful Life | | |
Machinery and equipment | | 1 to 10 years | | |
Computer equipment and software | | 3 to 5 years | | |
Furniture and fixtures | | 3 to 7 years | | |
Equipment acquired under finance leases | | 3 to 7 years | | |
Leasehold improvements | | Shorter of remaining lease term or expected useful life |
We charge maintenance and repair costs to expense when incurred. We capitalize major improvements, which extend the useful life of the related asset. Upon disposal of a fixed asset, we record a gain or loss based on the differences between the proceeds received and the net book value of the disposed asset.
Other Assets
Other assets comprise primarily capitalized implementation costs from cloud computing arrangements and security deposits. We capitalize eligible costs associated with cloud computing arrangements over the term of the arrangement, plus reasonably certain renewals, and recognize those costs on a straight-line basis in the same line item in the consolidated statement of operations as the expense for fees associated with the cloud computing arrangement. Cloud computing arrangement costs, included in prepaid expenses and other current assets, were $0.4 million and $0.4 million, and other non-current assets were $1.0 million and $1.4 million, as of December 31, 2024 and 2023, respectively. Amortization expense associated with the cloud computing arrangements was $0.4 million for 2024, $0.5 million for 2023, and $0.4 million for 2022. We present cash flows related to capitalized implementation costs in cash flows used in operating activities.
Business Combinations and Intangible Assets Including Goodwill
We account for business combinations using the acquisition method which involves allocating the purchase price paid to assets acquired and liabilities assumed at their acquisition-date fair values. The excess of the fair value of purchase consideration over the fair value of the identifiable assets and liabilities is recorded as goodwill. While we use our best estimates and assumptions to accurately estimate the fair value of assets acquired, liabilities assumed and the contingent consideration liability, our estimates are inherently uncertain. These estimates include, but are not limited to, estimates of future revenue, revenue growth rates, discount rates, underlying product or technology life cycles and expenses necessary to support the acquired technology, and estimated sales cycle for customer relationships. During the measurement period, which may be up to one year from the acquisition date, we may record adjustments to the assets acquired and liabilities assumed with the corresponding offset to goodwill.
We review assumptions related to the fair value of the contingent consideration each reporting period until the contingency is satisfied. We recognize the change in fair value of the contingent
consideration liability in “General and administrative” expense on the consolidated statements of operations for the period in which the fair value changes.
We assess the impairment of goodwill on an annual basis, during the fourth quarter, or otherwise when events or changes in circumstances indicate that goodwill may be impaired.
We amortize identifiable intangible assets with finite lives over their useful lives on a straight-line basis.
We expense acquisition-related costs, including advisory, legal, accounting, valuation and other similar costs in the periods in which the costs are incurred.
Revenue Recognition
We generate revenue primarily from sales of hardware products. We also generate revenue from software, extended warranties, enhanced maintenance, support services and nonrecurring engineering, or NRE, development services, none of which are material.
We recognize revenue when we transfer control of the promised goods or services to our customers, which for hardware sales is generally at the time of product shipment as determined by agreed-upon shipping terms. We measure revenue based on the amount of consideration we expect to be entitled-to in exchange for those goods or services. We expect the period between when we transfer control of promised goods or services and when we receive payment to be one year or less, and that expectation is consistent with our historical experience. As such, we do not adjust our revenue for the effects of a significant financing component. We recognize any variable consideration, which comprises primarily sales incentives, as revenue reduction at the time of revenue recognition. We estimate sales incentives based on our historical experience and current expectations at the time of revenue recognition and update them at the end of each reporting period as additional information becomes available.
Our reader and gateway products are highly dependent on embedded software and cannot function without this embedded software. We account for the hardware and embedded software as a single performance obligation and recognize revenue when control is transferred.
Our customer contracts with multiple performance obligations generally include a combination of hardware products, extended warranty, enhanced maintenance and support services. For these contracts, we account for individual performance obligations separately if they are distinct. We allocate the transaction price to the separate performance obligations on a relative standalone selling-price basis. In instances where the standalone selling price is not directly observable, such as when we do not sell the product or service separately, we determine the standalone selling price using one, or a combination of, the adjusted market assessment or expected cost-plus margin. We defer amounts allocated to extended warranty and enhanced maintenance sold with our reader and gateway products and recognize them on a straight-line basis over the term of the arrangement, which is typically from one to three years. We defer amounts allocated to support services sold with our reader and gateway products and recognize them when we transfer control of the promised services to our customers.
Revenue generated from licensing our intellectual property is governed by licensing agreements. We recognize revenue from licensing the right to use functional intellectual property at the point in time the control of the license transfers to the customer, which is generally upon delivery, or as usage occurs.
If a customer pays consideration before we transfer a good or service under the contract, then we classify those amounts as contract liabilities or deferred revenue. We recognize contract liabilities as revenue when we transfer control of the promised goods or services to our customers.
Payment terms typically range from 30 to 120 days. We present revenue net of sales tax in our consolidated statements of operations. We include shipping charges billed to customers in revenue and the related shipping costs in cost of revenue.
Practical Expedients and Exemptions: We expense sales commissions when incurred because we expect the amortization period to be one year or less. We record these costs within sales and marketing expenses. We do not disclose the value of unsatisfied performance obligations for (1) contracts with an
original expected length of one year or less and (2) contracts for which we recognize revenue at the amount to which we have the right to invoice for services performed.
Product Warranties
We provide limited warranty coverage for most products, generally ranging from a period of 90 days to one year from the date of shipment. We record a liability for the estimated cost of these warranties based on historical claims, product failure rates and other factors when we recognize the related revenue. We review these estimates periodically and adjust our warranty reserves when actual experience differs from historical estimates or when other information becomes available. The warranty liability primarily includes the anticipated cost of materials, labor and shipping necessary to repair or replace the product. Accrued warranty costs in 2024, 2023 and 2022 were not material.
Leases
We determine, at inception, whether an arrangement is or contains a lease. Right-of-use, or ROU, assets represent our right to use an identified asset for the lease term. Lease liabilities represent our obligation to make lease payments arising from the lease. We recognize operating lease ROU assets and liabilities at commencement date based on the present value of future lease payments over the lease term. We use an incremental borrowing rate in determining the present value of future lease payments because our operating leases do not provide an implicit rate. Our incremental borrowing rate is based on a credit-adjusted risk-free rate, which best approximates a secured rate over a similar term of lease. We recognize lease expense for lease payments on a straight-line basis over the lease term. Our lease agreements may contain variable costs such as common area maintenance, insurance, real estate taxes or other costs. We expense variable lease costs on the consolidated statements of operations as incurred. Our lease agreements generally do not contain any residual value guarantees or restrictive covenants.
We have various noncancellable operating lease agreements for office, warehouse and research and development space in the United States, China and Finland, with expiration dates from 2025 to 2029. Certain of these arrangements have free or escalating rent payment provisions and optional renewal and termination clauses that we factor into the classification and measurement of the lease when appropriate. These lease agreements typically include lease and non-lease components and are generally accounted for as a single lease component. We consider variable CAM expenses for real estate leases as non-lease components.
We do not record leases with an initial term of 12 months or less on our consolidated balance sheet; we instead recognize lease expense for these leases on a straight-line basis over the lease term.
Research and Development Costs
Research and development expense comprises primarily personnel expenses (salaries, benefits and other employee related costs) and stock-based compensation expense for our product-development personnel; external consulting and service costs; prototype materials; other new-product development costs; and an allocated portion of infrastructure costs which include occupancy, depreciation and software costs.
Foreign Currency
We translate the assets and liabilities of our non-U.S. dollar functional currency subsidiary into U.S. dollars using exchange rates in effect at the end of each period. Revenue and expenses for this subsidiary are translated using rates that approximate those in effect during the period. We recognize gains and losses from these translations as a component of accumulated other comprehensive income (loss) in stockholders' equity. Our subsidiaries that use the U.S. dollar as their functional currency remeasure monetary assets and liabilities at exchange rates in effect at the end of each period, and non-monetary assets and liabilities at historical rates. We have included the gains or losses from foreign currency remeasurement in earnings.
Income Taxes
We use the asset and liability approach for accounting, which requires recognizing deferred tax assets and liabilities for the expected future tax consequences of temporary differences between the financial statement and tax bases. We measure deferred tax assets and liabilities using enacted tax rates expected to be in effect when the assets and liabilities are recovered or settled. We recognize the effects of a change in tax rates on deferred tax assets and liabilities in the year of the enactment date. We determine deferred tax assets, including historical net operating losses and deferred tax liabilities, based on temporary differences between the book and tax bases of the assets and liabilities. We believe that it is currently more likely than not that our deferred tax assets will not be realized and, as such, we have recorded a full valuation allowance for these assets. We evaluate the likelihood of our ability to realize deferred tax assets in future periods on a quarterly basis, and if evidence indicates we will be able to realize some or all of our deferred tax assets then we will revise our valuation allowance accordingly.
We use a two-step approach for evaluating uncertain tax positions. First, we evaluate recognition, which requires us to determine if the weight of available evidence indicates that a tax position is more likely than not to be sustained upon audit, including resolution of related appeals or litigation processes. If we consider a tax position more likely than not to be unsustained, then no benefits of the position are recognized. Second, we measure the uncertain tax position based on the largest amount of benefit which is more likely than not to be realized on effective settlement. This process involves estimating our actual current tax exposure, including assessing the risks associated with tax audits, together with assessing temporary differences resulting from the different treatment of items for tax and financial reporting purposes. If actual results differ from our estimates, then our net operating loss and credit carryforwards could be materially impacted.
Us realizing the benefits of the NOLs and credit carryforwards depends on sufficient taxable income in future years. We have established a valuation allowance against the carrying value of our deferred tax assets, as it is currently more likely than not we will be unable to realize these deferred tax assets. In addition, using NOLs and credits to offset future income subject to taxes may be subject to substantial annual limitations due to the “change in ownership” provisions of the Code and similar state provisions. Events that cause limitations in the amount of NOLs that we may use in any one year include, but are not limited to, a cumulative ownership change of more than 50%, as defined by Code Sections 382 and 383, over a three-year period. Using our NOLs and tax credit carryforwards could be significantly reduced if a cumulative ownership change of more than 50% has occurred in our past or occurs in our future.
Stock-Based Compensation
We have various equity award plans or Plans for granting share-based awards to employees, consultants and non-employee Company directors. The Plans provide for granting several available forms of stock compensation such as restricted stock units, or RSUs, RSUs with performance conditions, or PSUs, and RSUs with market and service conditions, or MSUs and an employee stock purchase plan, or ESPP.
We measure stock-based compensation costs for all share-based awards at fair value on the measurement date, which is typically the grant date. We determine the fair value of RSUs and PSUs based on the closing price of our common stock at grant date. Additionally, for awards with a market condition, we use a Monte Carlo simulation model to estimate grant date fair value, which takes into consideration the range of possible stock price of total stockholder return outcomes.
Net Earnings (Loss) per Share
We compute net earnings (loss) per share by dividing net income (loss) by the weighted-average number of shares of common stock outstanding. We have outstanding stock options, RSUs, PSUs, MSUs and an ESPP, each of which we include in our calculation of diluted net loss per share if their effect would be dilutive. We compute diluted net loss per share by considering all potential dilutive common stock equivalents outstanding for the period.
Recently Adopted Accounting Standards
In November 2023, the FASB released ASU 2023-07, Segment Reporting (Topic 280): Improvements to Reportable Segment Disclosures, which amends reportable segment requirements, primarily through enhanced disclosures about significant segment expenses, including for public entities that have a single reportable segment. The standard is effective for fiscal years beginning after December 31, 2023 and interim periods within fiscal years beginning after December 31, 2024. We adopted ASU 2023-07 on January 1, 2024 and have made the necessary reportable segment disclosures (See Note 14—Segment Disclosures).
Recently Issued Accounting Standards Not Yet Adopted
In December 2023, the FASB released ASU 2023-09, Income Taxes (Topic 740): Improvements to Income Tax Disclosures, which amends income tax disclosure requirements to enhance the transparency and decision usefulness for users of the financial statements. The standard is effective for fiscal years beginning after December 31, 2024. We are currently evaluating any impact of this standard on our financial statement disclosures.
In November 2024, the FASB released ASU 2024-03, Income Statement - Reporting Comprehensive Income - Expense Disaggregation Disclosures (Subtopic 220-40): Disaggregation of Income Statement Expenses, which amends disclosure requirements related to the disaggregation of income statement expenses in the notes to financial statements. The standard is effective for fiscal years beginning after December 31, 2026. We are currently evaluating any impact of this standard on our financial statement disclosures.
In November 2024, the FASB released ASU 2024-04, Debt - Debt with Conversion and Other Options (Subtopic 470-20), which improves the relevance and consistency in application of the induced conversion guidance in Subtopic 470-20, Debt - Debt with Conversion and Other Options. The standard is effective for fiscal years beginning after December 31, 2025. We are currently evaluating any impact of this standard on our financial statement disclosures.
Note 3. Fair Value Measurements
The following table presents the balances of assets measured at fair value on a recurring basis, by level within the fair value hierarchy, as of the dates presented (in thousands):
| | | | | | | | | | | | | | | | | | | | | | | | | | | | | | | | |
| | December 31, 2024 | | | December 31, 2023 | |
| | Level 1 | | | Level 2 | | | Level 3 | | | Total | | | Level 1 | | | Level 2 | | | Level 3 | | | Total | |
Cash equivalents: | | | | | | | | | | | | | | | | | | | | | | | | |
Money market funds | | $ | 1,097 | | | $ | — | | | $ | — | | | $ | 1,097 | | | $ | 78,661 | | | $ | — | | | $ | — | | | $ | 78,661 | |
Total cash equivalents | | | 1,097 | | | | — | | | | — | | | | 1,097 | | | | 78,661 | | | | — | | | | — | | | | 78,661 | |
Short-term investments: | | | | | | | | | | | | | | | | | | | | | | | | |
U.S. Government agency securities | | | — | | | | 3,929 | | | | — | | | | 3,929 | | | | — | | | | 11,893 | | | | — | | | | 11,893 | |
U.S. Treasury securities | | | — | | | | 63,634 | | | | — | | | | 63,634 | | | | — | | | | — | | | | — | | | | — | |
Yankee bonds | | | — | | | | — | | | | — | | | | — | | | | — | | | | 1,951 | | | | — | | | | 1,951 | |
Agency bonds | | | — | | | | — | | | | — | | | | — | | | | — | | | | 2,994 | | | | — | | | | 2,994 | |
Asset-backed securities | | | — | | | | — | | | | — | | | | — | | | | — | | | | 1,602 | | | | — | | | | 1,602 | |
Corporate notes and bonds | | | — | | | | 32,305 | | | | — | | | | 32,305 | | | | — | | | | — | | | | — | | | | — | |
Commercial paper | | | — | | | | 18,793 | | | | — | | | | 18,793 | | | | — | | | | — | | | | — | | | | — | |
Total short-term investments | | | — | | | | 118,661 | | | | — | | | | 118,661 | | | | — | | | | 18,440 | | | | — | | | | 18,440 | |
Long-term investments: | | | | | | | | | | | | | | | | | | | | | | | | |
U.S. Government agency securities | | | — | | | | 5,989 | | | | — | | | | 5,989 | | | | — | | | | — | | | | — | | | | — | |
U.S. Treasury securities | | | — | | | | 2,492 | | | | — | | | | 2,492 | | | | — | | | | — | | | | — | | | | — | |
Corporate notes and bonds | | | — | | | | 66,390 | | | | — | | | | 66,390 | | | | — | | | | — | | | | — | | | | — | |
Total long-term investments | | | — | | | | 74,871 | | | | — | | | | 74,871 | | | | — | | | | — | | | | — | | | | — | |
Total | | $ | 1,097 | | | $ | 193,532 | | | $ | — | | | $ | 194,629 | | | $ | 78,661 | | | $ | 18,440 | | | $ | — | | | $ | 97,101 | |
| | | | | | | | | | | | | | | | | | | | | | | | |
Acquisition related contingent consideration liability | | | — | | | | — | | | | — | | | | — | | | | — | | | | — | | | | 6,180 | | | | 6,180 | |
Total liabilities at fair value | | $ | — | | | $ | — | | | $ | — | | | $ | — | | | $ | — | | | $ | — | | | $ | 6,180 | | | $ | 6,180 | |
The following table presents additional information about liabilities measured at fair value for which the Company utilizes Level 3 inputs to determine fair value as of December 31, 2023 and during fiscal year 2024:
| | | | | | | | |
| | Year Ended December 31, | |
| | 2024 | | | 2023 | |
Balance as of January 1 | | $ | 6,180 | | | $ | — | |
Addition of contingent consideration liability due to acquisition | | | 986 | | | | 4,602 | |
Change in fair value of contingent consideration liability due to remeasurement | | | — | | | | 1,578 | |
Contingent consideration payment made | | | (7,166 | ) | | | — | |
Balance as of December 31 | | $ | — | | | $ | 6,180 | |
We recorded the contingent consideration related to the Voyantic Oy acquisition at its fair value using unobservable inputs and used the Monte Carlo simulation option pricing framework, incorporating contractual terms and assumptions regarding financial forecasts, discount rates and volatility of forecasted revenue and gross margins. A decrease in estimated revenue and gross margins or an increase in the discount rate would decrease the fair value of the contingent consideration liability. The estimated revenue and gross margins are not interrelated inputs. The development and determination of the unobservable inputs for Level 3 fair value measurements and fair value calculations is management's responsibility with the assistance of a third-party valuation specialist. During the year ended December
31, 2023, and 2024 we remeasured the fair value of the contingent consideration liability based on updated inputs related to actual performance results and recorded an additional expense of $1.6 million and $1.0 million, respectively, in general and administrative expense on the consolidated statement of operations. During second-quarter 2024, we paid the contingent consideration and as of December 31, 2024, the contingent consideration is $0. As of December 31, 2023, the contingent consideration liability of $6.2 million is included in "Accrued expenses and other current liabilities" on the consolidated balance sheet.
We expect short-term investments to mature within 1 year of the reporting date. We expect long-term investments to mature between 1 and 2 years from the reporting date. See Note 8 for the carrying amount and estimated fair value of our convertible senior notes due 2027.
The following tables present the cost or amortized cost, gross unrealized gains, gross unrealized losses and total estimated fair value of our financial assets as of the dates presented (in thousands):
| | | | | | | | | | | | | | | |
| December 31, 2024 | |
| Cost or | | | Gross | | | Gross | | | Total Estimated | |
| Amortized Cost | | | Unrealized Gains | | | Unrealized Losses | | | Fair Value | |
Description: | | | | | | | | | | | |
Money market funds | $ | 1,097 | | | $ | — | | | $ | — | | | $ | 1,097 | |
U.S. Government agency securities | | 9,933 | | | | 1 | | | | (16 | ) | | | 9,918 | |
U.S. Treasury securities | | 66,146 | | | | 17 | | | | (37 | ) | | | 66,126 | |
Corporate notes and bonds | | 99,215 | | | | — | | | | (520 | ) | | | 98,695 | |
Commercial paper | | 18,805 | | | | — | | | | (12 | ) | | | 18,793 | |
Total | $ | 195,196 | | | $ | 18 | | | $ | (585 | ) | | $ | 194,629 | |
| | | | | | | | | | | | | | | |
| December 31, 2023 | |
| Cost or | | | Gross | | | Gross | | | Total Estimated | |
| Amortized Cost | | | Unrealized Gains | | | Unrealized Losses | | | Fair Value | |
Description: | | | | | | | | | | | |
Money market funds | $ | 78,661 | | | $ | — | | | $ | — | | | $ | 78,661 | |
U.S. Government agency securities | | 11,932 | | | | — | | | | (39 | ) | | | 11,893 | |
Yankee bonds | | 1,956 | | | | — | | | | (5 | ) | | | 1,951 | |
Agency bond | | 2,998 | | | | — | | | | (4 | ) | | | 2,994 | |
Asset-backed securities | | 1,604 | | | | — | | | | (2 | ) | | | 1,602 | |
Total | $ | 97,151 | | | $ | — | | | $ | (50 | ) | | $ | 97,101 | |
Marketable securities in a continuous loss position for less than 12 months had an estimated fair value of $142.8 million and unrealized losses of $0.6 million as of December 31, 2024. Marketable securities in a continuous loss position for less than 12 months had an estimated fair value of $10.2 million and unrealized losses of $0.02 million as of December 31, 2023. We did not have any marketable securities in a continuous loss position for greater than 12 months as of December 31, 2024. Marketable securities in a continuous loss position for greater than 12 months had an estimated fair value of $8.2 million and unrealized losses of $0.03 million as of December 31, 2023.
Unrealized losses from our fixed-income securities are primarily attributable to changes in interest rates and not to lower credit ratings of the issuers. In determining whether an unrealized loss is
other-than-temporary, for the periods presented, we determined we do not have plans to sell the securities nor is it more likely than not that we would be required to sell the securities before their anticipated recovery.
Note 4. Inventory
The following table presents the detail of inventories as of the dates presented (in thousands):
| | | | | | | | |
| | | | | | |
| | December 31, 2024 | | | December 31, 2023 | |
Raw materials | | $ | 14,040 | | | $ | 21,773 | |
Work-in-process | | | 52,028 | | | | 42,217 | |
Finished goods | | | 33,278 | | | | 33,182 | |
Total inventory | | $ | 99,346 | | | $ | 97,172 | |
Note 5. Property and Equipment
The following table presents property and equipment details as of the dates presented (in thousands):
| | | | | | | | |
| | | | | | |
| | December 31, 2024 | | | December 31, 2023 | |
Machinery and equipment | | $ | 72,439 | | | $ | 57,511 | |
Computer equipment and software | | | 3,335 | | | | 3,012 | |
Furniture and fixtures | | | 1,369 | | | | 1,333 | |
Equipment acquired under finance leases | | | 1,727 | | | | 1,728 | |
Leasehold improvements | | | 13,690 | | | | 12,966 | |
Total property and equipment, gross | | | 92,560 | | | | 76,550 | |
Less: Accumulated depreciation | | | (41,950 | ) | | | (31,659 | ) |
Total property and equipment, net | | $ | 50,610 | | | $ | 44,891 | |
Depreciation expense, which includes amortization of finance lease assets, was $10.7 million, $8.7 million and $6.0 million for the years ended December 31, 2024, 2023 and 2022, respectively. We did not acquire any property and equipment under finance leases for the years ended December 31, 2024 or 2023.
Note 6. Goodwill and Intangible Assets
On April 3, 2023, we acquired all of the outstanding equity of Voyantic Oy for an aggregate purchase price of $32.7 million. Our acquisition of Voyantic Oy adds label design, manufacturing and testing to our systems offerings, to advance the quality, reliability and readability of partner inlays. The consideration comprised (i) $3.6 million in shares of our common stock valued using the market price on the date of the acquisition, (ii) $4.6 million in deferred payments contingent upon revenue and gross margin performance over a one-year period from the acquisition date, and (iii) the remainder in cash paid at closing.
We recorded the assets acquired and liabilities assumed at their estimated fair values as of the acquisition date. We recorded the excess of the purchase price over the assets acquired and liabilities assumed as goodwill. The fair value of net assets acquired, goodwill, intangible assets and deferred tax liability were $2.4 million, $15.6 million, $18.4 million and $3.7 million, respectively. The goodwill amount represents synergies we expect to realize from the business combination and assembled
workforce. We allocated the goodwill to our one reporting unit and reportable segment. The acquired goodwill and intangible assets were not deductible for tax purposes.
The transaction-related costs for the acquisition were $1.0 million and $1.7 million for the years ended December 31, 2024 and 2023, respectively. Transaction expenses and contingent consideration expense are included in general and administrative expense in the consolidated statements of operations.
This acquisition did not have a material impact on our reported revenue or net loss amounts for any period presented; therefore, we have not presented historical and pro forma disclosures.
Goodwill represents the excess of the purchase price over the fair value of the net assets acquired in business combinations accounted for under the purchase method of accounting. The following table presents goodwill as of December 31, 2024 and 2023 (in thousands):
| | | | | | | | |
| | Year Ended December 31, | |
| | 2024 | | | 2023 | |
Balance at beginning of period | | $ | 19,696 | | | $ | 3,881 | |
Additions from acquisition | | | — | | | | 15,590 | |
Foreign currency translation adjustment | | | (973 | ) | | | 225 | |
Total | | $ | 18,723 | | | $ | 19,696 | |
As of December 31, 2024, intangible assets comprised of the following (in thousands):
| | | | | | | | | | | | | | |
| | Estimated Useful Life in Years | | Gross Carrying Amount | | | Accumulated Amortization | | | Net | |
Definite-lived intangible assets: | | | | | | | | | | | |
Backlog | | 0.25 | | $ | 725 | | | $ | (725 | ) | | $ | — | |
Customer Relationships | | 1 | | | 3,470 | | | | (3,470 | ) | | | — | |
Developed Technology | | 7.25 | | | 12,223 | | | | (2,950 | ) | | | 9,273 | |
Patent | | 3 | | | 250 | | | | (122 | ) | | | 128 | |
Tradename | | 8 | | | 1,139 | | | | (249 | ) | | | 890 | |
Total definite-lived intangible assets (1) | | | | $ | 17,807 | | | $ | (7,516 | ) | | $ | 10,291 | |
(1) Foreign intangible asset carrying amounts are affected by foreign currency translation | |
We amortize identifiable intangible assets with finite lives over their useful lives on a straight-line basis. The weighted-average life of our intangible assets is approximately six years. Amortization expense of intangible assets was $2.9 million and $5.0 million for the years ended December 31, 2024 and 2023, respectively.
As of December 31, 2024, the estimated intangible asset amortization expense for the next five years and thereafter is as follows:
| | | | |
| | Estimated Amortization | |
| | (in thousands) | |
2025 | | | 1,912 | |
2026 | | | 1,873 | |
2027 | | | 1,828 | |
2028 | | | 1,828 | |
2028 | | | 1,828 | |
Thereafter | | | 1,022 | |
Total | | $ | 10,291 | |
Note 7. Income Taxes
We are subject to federal and state income taxes in the United States and foreign jurisdictions.
The following table presents U.S. and foreign components of income (loss) before income taxes (in thousands):
| | | | | | | | | | | | |
| | Year Ended December 31, | |
| | 2024 | | | 2023 | | | 2022 | |
U.S. | | $ | 41,729 | | | $ | (40,349 | ) | | $ | (24,508 | ) |
Foreign | | | (734 | ) | | | (3,339 | ) | | | 391 | |
Loss before income taxes | | $ | 40,995 | | | $ | (43,688 | ) | | $ | (24,117 | ) |
The following table presents the detail of income tax benefit (expense) for the periods presented (in thousands):
| | | | | | | | | | | | |
| | Year Ended December 31, | |
| | 2024 | | | 2023 | | | 2022 | |
Current: | |
| | |
| | |
| |
U.S. - Federal | | $ | — | | | $ | — | | | $ | — | |
U.S. - State | | | (212 | ) | | | (163 | ) | | | (68 | ) |
Foreign | | | (512 | ) | | | (446 | ) | | | (110 | ) |
| | | (724 | ) | | | (609 | ) | | | (178 | ) |
Deferred: | | | | | | | | | |
U.S. - Federal | | | — | | | | (53 | ) | | | 5 | |
U.S. - State | | | 3 | | | | — | | | | (11 | ) |
Foreign | | | 564 | | | | 984 | | | | — | |
| | | 567 | | | | 931 | | | | (6 | ) |
Total income tax expense | | $ | (157 | ) | | $ | 322 | | | $ | (184 | ) |
We have not recorded a liability for U.S. income taxes and foreign withholding taxes on the undistributed earnings of foreign subsidiaries as of December 31, 2024 because we intend to permanently reinvest the earnings outside the United States. We expect the amount of the unrecognized deferred tax liability, if incurred, to be immaterial.
The following table presents a reconciliation of the federal statutory rate and our effective tax rate for the periods presented:
| | | | | | | | | | | | |
| | Year Ended December 31, | |
| | 2024 | | | 2023 | | | 2022 | |
U.S. Statutory Rate | | | 21.0 | % | | | 21.0 | % | | | 21.0 | % |
Change in valuation allowance | | | 29.4 | | | | (42.0 | ) | | | (54.7 | ) |
State taxes (net of federal benefit) | | | 0.2 | | | | 0.1 | | | | 0.4 | |
Federal research and development credit | | | (20.1 | ) | | | 18.6 | | | | 16.5 | |
Stock-based compensation | | | (37.8 | ) | | | 10.4 | | | | 16.1 | |
Inducement premium | | | — | | | | — | | | | 5.0 | |
Unrecognized tax benefits | | | 5.0 | | | | (4.7 | ) | | | (4.1 | ) |
Other, net | | | 2.7 | | | | (2.8 | ) | | | (1.0 | ) |
Effective income tax rate | | | 0.4 | % | | | 0.7 | % | | | (0.8 | %) |
We continue to maintain a full valuation allowance against our net deferred tax assets in the U.S. but recognize deferred income tax expense (benefit) due to the change in the indefinite deferred tax liability related to goodwill, which is partially offset by indefinite tax attributes.
Deferred federal, state and foreign income taxes reflect the net tax impact of temporary differences between the carrying amounts of assets and liabilities for financial reporting purposes and for tax
purposes. The following table presents the significant components of our deferred tax assets and liabilities as of the dates presented (in thousands):
| | | | | | | | |
| | | | | | |
| | December 31, 2024 | | | December 31, 2023 | |
Net operating loss carryforwards | | $ | 40,760 | | | $ | 49,228 | |
Credit carryforwards | | | 29,123 | | | | 22,971 | |
Capitalized research and development | | | 46,318 | | | | 32,988 | |
Operating lease liabilities | | | 1,873 | | | | 2,569 | |
Allowances | | | 4,323 | | | | 1,624 | |
Deferred revenue | | | 15 | | | | 48 | |
Stock-based compensation | | | 5,753 | | | | 6,351 | |
Disallowed interest expense | | | — | | | | — | |
Inventory cost capitalization | | | 1,655 | | | | 1,433 | |
Deferred tax assets | | | 129,820 | | | | 117,211 | |
Less: Valuation allowance | | | (126,102 | ) | | | (114,040 | ) |
Net deferred tax assets | | | 3,718 | | | | 3,171 | |
Deferred tax liability: | | | | | | |
Goodwill | | | (820 | ) | | | (823 | ) |
Depreciation and amortization | | | (3,683 | ) | | | (3,326 | ) |
Operating lease ROU assets | | | (1,415 | ) | | | (1,933 | ) |
Deferred tax liabilities | | | (5,918 | ) | | | (6,082 | ) |
Net deferred tax liability | | $ | (2,200 | ) | | $ | (2,911 | ) |
Realizing deferred tax assets depends on us generating future taxable income, the timing and amount of which are uncertain. We have provided a full valuation allowance against the net deferred tax assets as of December 31, 2024 and 2023 because, based on the weight of available evidence, it is more likely than not we will be unable to realize the deferred tax assets.
We acquired Voyantic Oy, a Finnish company on April 3, 2023. As a result of the transaction, we recorded a $3.7 million deferred tax liability associated with intangibles, with an offset to goodwill.
We have accumulated federal tax losses of approximately $190.3 million and $230.5 million, respectively, as of December 31, 2024 and 2023, which are available to reduce future taxable income. The Tax Cuts and Jobs Act, or TCJA, enacted on December 22, 2017 altered the carryforward period for federal net operating losses and as a result, all net operating losses generated in 2018 and forward have an indefinite life. Of the net operating losses reported, we have accumulated $141.8 million with an indefinite life as of December 31, 2024. We have accumulated state tax losses of approximately $18.8 million and $21.3 million as of December 31, 2024 and 2023, respectively. We also have net research and development credit carryforwards of $38.7 million and $30.5 million as of December 31, 2024 and 2023, respectively, which are available to reduce future tax liabilities. We began to capitalize research and development expenses in the year ended December 31, 2022 under Section 174. The net impact of this provision resulted in a deferred tax asset of approximately $46.3 million and $32.9 million as of December 31, 2024 and 2023, respectively.
The pre-2018 federal and state tax losses and federal research and development credit carryforwards began expiring in 2020. Under Sections 382 and 383 of the Internal Revenue Code, if a corporation undergoes an ownership change, the corporation’s ability to use its pre-change net operating loss carryforwards and other pre-change tax attributes, such as research tax credits, to offset its post-change income or income tax liability may be limited. We have completed a formal IRC Section 382 study through December 31, 2024 and the attributes disclosed in this footnote reflect the conclusion of that study. However, subsequent ownership changes may affect the limitation in future years.
We are currently not under audit in any tax jurisdiction. Tax years from 2005 through 2024 are currently open for audit by federal and state taxing authorities.
We establish reserves for tax positions based on estimates of whether, and the extent to which, additional taxes will be due. We establish the reserves when we believe that our tax-return positions
might be challenged by taxing authorities, despite our belief that our tax return positions are fully supportable.
The following table presents the total balance of unrecognized tax benefits as of the dates presented (in thousands):
| | | | | | | | | | | | |
| | Year Ended December 31, | |
| | 2024 | | | 2023 | | | 2022 | |
Balance at beginning of period | | $ | 7,640 | | | $ | 5,606 | | | $ | 4,609 | |
Gross increase to tax positions in current periods | | | 2,056 | | | | 2,034 | | | | 997 | |
Balance at end of period | | $ | 9,696 | | | $ | 7,640 | | | $ | 5,606 | |
As of December 31, 2024, we recorded a total amount of unrecognized tax benefit of $9.7 million as a reduction to the deferred tax asset. If recognized, this tax benefit would have no impact to our effective tax rate because we have a full valuation allowance. We do not anticipate that the amount of existing unrecognized tax benefit will significantly increase or decrease within the next 12 months. We record accrued interest and penalties related to unrecognized tax benefits as income tax expense and their value is zero.
Note 8. Long-term debt
In December 2019, we issued $86.3 million aggregate principal amount of the 2019 Notes and in November 2021, we issued $287.5 million aggregate principal amount of convertible promissory notes due May 15, 2027, referred to as the 2021 Notes (collectively, the Notes). The 2019 Notes were repurchased in 2021 and 2022. See further information on the 2019 Note Repurchase under "Repurchase of the Convertible Senior Notes - 2019" section below.
The following table presents the outstanding principal amount and carrying value of the 2021 Notes as of the dates indicated (in thousands):
| | | | | | | | | | | | | | | | | | | | | | | | |
| December 31, 2024 | | | December 31, 2023 | | |
| Principal Amount | | | Unamortized debt issuance costs | | | Net Carrying Amount | | | Principal Amount | | | Unamortized debt issuance costs | | | Net Carrying Amount | | |
2021 Notes | | 287,500 | | | | (4,007 | ) | | | 283,493 | | | | 287,500 | | | | (5,645 | ) | | | 281,855 | | |
Further details of the 2021 Notes are as follows:
| | | | | | | | | | | | | | | | | | |
Issuance | | Maturity Date | | Interest Rate | | First Interest Payment Date | | Effective Interest Rate | | Semi-Annual Interest Payment Dates | | Initial Conversion Rate per $1,000 Principal | | Initial Conversion Price | | | Number of Shares (in millions) |
2021 Notes | | May 15, 2027 | | 1.125% | | May 15, 2022 | | 1.72% | | May 15; November 15 | | 9.0061 | | $ | 111.04 | | | 2.6 |
|
The 2021 Notes are senior unsecured obligations, do not contain any financial covenants and are governed by indentures (the Indentures). The total net proceeds from the 2021 Notes, after deducting initial debt issuance costs, fees and expenses, was $278.4 million. We used approximately $183.6 million of the 2021 Notes net proceeds, excluding accrued interest, to repurchase approximately $76.4 million aggregate principal amount of the 2019 Notes through individual privately negotiated transactions concurrent with us offering the 2021 Notes. We used approximately $17.6 million, excluding accrued interest, to repurchase the remaining $9.9 million aggregate principal amount of the 2019 Notes in June 2022. We will use the remainder of the net proceeds from the 2021 Notes for general corporate purposes.
Terms of the 2021 Notes
The holders of the 2021 Notes may convert their respective 2021 Notes at their option at any time prior to the close of business on the business day immediately preceding the respective conversion dates under the following circumstances:
•during any fiscal quarter commencing after the fiscal quarter ending on March 31, 2022 (and only during such fiscal quarter), if the last reported sale price of our common stock, for at least 20 trading days (whether or not consecutive) during a period of 30 consecutive trading days ending on, and including, the last trading day of the immediately preceding fiscal quarter is greater than or equal to 130% of the conversion price on each applicable trading day;
•during the five business day period after any five consecutive trading day period in which the trading price per $1,000 principal amount of the 2021 Notes for each trading day was less than 98% of the product of the last reported sale price of our common stock and the conversion rate on each such trading day;
•prior to the close of business on the second scheduled trading day immediately preceding the redemption date if we call the 2021 Notes for redemption; or
•upon the occurrence of specified corporate events, as described in the indenture.
Regardless of the foregoing circumstances, holders may convert all or any portion of the 2021 Notes, in increments of $1,000 principal amount, on or after February 15, 2027, until the close of business on the second scheduled trading day immediately preceding the maturity date.
We may redeem all or a portion of the 2021 Notes for cash, at our option, on or after November 20, 2024, if the last reported sale price of our common stock has been at least 130% of the conversion price at least 20 trading days (whether or not consecutive) during any 30 consecutive trading day period at a redemption price equal to 100% of the principal amount of the 2021 Notes being redeemed, plus any accrued and unpaid interest to, but excluding, the redemption date.
Holders who convert their 2021 Notes in connection with certain corporate events that constitute a make-whole fundamental change (as defined in the indenture) are, under certain circumstances, entitled to an increase in the conversion rate. Additionally in the event of a corporate event constituting a fundamental change (as defined in the indenture), holders of the 2021 Notes may require us to repurchase all or a portion of their 2021 Notes at a repurchase price equal to 100% of the principal amount of the 2021 Notes being repurchased, plus any accrued and unpaid interest to, but excluding, the repurchase date.
Our common stock exceeded 130% of the conversion price of the 2021 Notes for more than 20 trading days during the 30 consecutive trading days ended December 31, 2024. Accordingly, the 2021 Notes are convertible at the option of the holders as of December 31, 2024 and therefore, are classified as current portion of long-term debt on the consolidated balance sheet as of December 31, 2024. The “if-converted value” exceeded the principal amounts by $88.6 million based on the closing price of our common stock of $145.26 as of December 31, 2024.
Accounting for the Notes
Effective January 1, 2021, we early adopted ASU 2020-06, Debt with Conversion and Other Options (Subtopic 470-20), using the modified retrospective approach. We accounted for the 2021 Notes issuance as a single liability measured at its amortized cost, as no other embedded features require bifurcation and recognition as derivatives. We presented the 2021 Notes total issuance costs of $9.1 million as a direct deduction from the face amount of the 2021 Notes. We amortized the issuance costs to interest expense over the respective term of the 2021 Notes using the effective interest rate method.
Interest expense related to the Notes was as follows (in thousands):
| | | | | | | | | | | | | | | | | | | |
| Year Ended December 31, | | | Year Ended December 31, | | | Year Ended December 31, | |
| 2024 | | | 2023 | | | 2022 | |
| 2021 Notes | | | 2021 Notes | | | 2021 Notes | | | 2019 Notes | | | Total | |
Amortization of debt issuance costs | | 1,639 | | | | 1,612 | | | | 19 | | | | 1,583 | | | | 1,602 | |
Cash interest expense | | 3,234 | | | | 3,236 | | | | 87 | | | | 3,234 | | | | 3,321 | |
Total interest expense | $ | 4,873 | | | $ | 4,848 | | | $ | 106 | | | $ | 4,817 | | | $ | 4,923 | |
Accrued interest related to the 2021 Notes as of December 31, 2024 and 2023 was $0.4 million and $0.4 million, respectively. We record accrued interest in accrued liabilities in our consolidated balance sheet.
Our estimated fair value of the 2021 Notes was $408.7 million and $314.0 million as of December 31, 2024 and 2023, respectively, which we determined through consideration of quoted market prices. The fair value for the 2021 Notes is classified as Level 2, as defined in Note 2.
Capped Calls
In connection with the issuance of the 2019 Notes, we entered into privately negotiated capped-call transactions with certain financial counterparties. The capped call transactions are generally designed to reduce the potential dilution to our common stock upon any conversion or settlement of the 2019 Notes, or to offset any cash payments we are required to make in excess of the principal amount upon conversion of the 2019 Notes, as the case may be, with the reduction or offset subject to a cap based on the cap price. If, however, the market price per share of our common stock exceeds the cap price of the capped-call transactions, then our stock would experience some dilution and/or the capped call would not fully offset the potential cash payments, in each case, to the extent then-market price per share of our common stock exceeds the cap price. The capped call remains outstanding even though we have repurchased the 2019 Notes, to reduce the potential dilution of the 2021 Notes. The initial cap price of the capped call transactions is $54.20 per share, subject to certain adjustments under the terms of the capped call transactions. The capped call transactions expire over 40 consecutive scheduled trading days ending on December 11, 2026. The capped call transactions meet the criteria for classification in equity, are not accounted for as derivatives and are not remeasured each reporting period.
Repurchase of the Convertible Senior Notes – 2019
In November 2021 and June 2022, we completed a privately negotiated induced conversion of $76.4 million and $9.9 million principal amount, respectively of the 2019 Notes. We accounted for the 2019 Notes Repurchase transactions as induced conversions in accordance with Accounting Standards Codification 470-20, Debt with Conversion and Other Options (ASC 470-20). In connection with the induced conversions, we paid approximately $183.6 million in cash in November 2021 and $17.6 million in cash in June 2022, and also paid accrued and unpaid interest thereon. As a result of the induced conversion, we recorded $11.3 million in November 2021 and $2.2 million in June 2022 in induced conversion expense which is included in the Consolidated Statements of Operations. The induced conversion expense represents the fair value of the consideration issued upon conversion in excess of the fair value of the securities issuable under the original terms of the 2019 Notes. We accounted for the remaining cash consideration under the original terms of the 2019 Notes under the general conversion accounting guidance, where the difference between the carrying amount of the 2019 Notes retired, including unamortized debt issuance costs of $1.8 million in November 2021 and $0.2 million in June 2022, and the cash consideration paid, was recorded in additional paid-in capital.
Note 9. Stockholders’ Equity
Preferred Stock
Our board of directors has the authority to fix the designations, powers, preferences and rights and the qualifications, limitations or restrictions thereof, of any wholly unissued series of preferred stock, and to increase or decrease the number of shares in any series of preferred stock, subject to limitations prescribed by law and by our certificate of incorporation. We had no preferred stock issued and outstanding as of December 31, 2024 or 2023.
Common Stock
As of December 31, 2024, we had authorized 495,000,000 shares of voting $0.001 par value common stock. Each holder of the common stock is entitled to one vote per common share. At its discretion, the board of directors may declare dividends on shares of common stock, subject to the prior rights of our preferred stockholders, if any. Upon liquidation or dissolution, holders of common stock will receive distributions only after preferred stock preferences have been satisfied.
Note 10. Stock-Based Awards
Stock-Based Compensation Expense
The following table presents the detail of stock-based compensation expense amounts included in our consolidated statements of operations for the periods presented (in thousands):
| | | | | | | | | | | |
| Year Ended December 31, | |
| 2024 | | | 2023 | | | 2022 | |
Cost of revenue | $ | 2,034 | | | $ | 1,869 | | | $ | 1,522 | |
Research and development expense | | 25,666 | | | | 21,307 | | | | 17,961 | |
Sales and marketing expense | | 10,774 | | | | 10,240 | | | | 9,447 | |
General and administrative expense | | 18,072 | | | | 14,570 | | | | 13,513 | |
Total stock-based compensation expense | $ | 56,546 | | | $ | 47,986 | | | $ | 42,443 | |
2016 Equity Incentive Plan
In June 2016, our board of directors adopted and our stockholders approved our 2016 Equity Incentive Plan, or the 2016 Plan, which became effective in July 2016 at which time the 2010 Equity Incentive Plan, or the 2010 Plan, was terminated. The number of shares of common stock reserved for issuance under the 2016 Plan may increase on January 1 of each year, beginning on January 1, 2017 and ending on and including January 1, 2026, by the lesser of (1) 1,825,000 shares; (2) 5% of the total number of shares of common stock outstanding on December 31 of the preceding calendar year; and (3) a lesser number of shares determined by our board of directors. The 2016 Plan provides for granting incentive or non-qualified stock options, restricted stock, restricted stock units, stock appreciation rights and performance shares or performance units to employees, non-employee directors and consultants. We have not issued options under the 2016 Plan since the year ended December 31, 2021.
All options historically granted under the 2010 Plan and the 2016 Plan have a maximum 10-year term and generally vest and become exercisable over four years of continued employment or service as defined in each option agreement. As allowed under the 2016 Plan, there are a few exceptions to this vesting schedule, which permit vesting at different rates or based on achieving performance targets. We use newly issued shares to satisfy option exercises. As of December 31, 2024, we had approximately 3.6 million shares of common stock available for future grants.
Stock Options
The following table summarizes option award activity for the year ended December 31, 2024 (in thousands, except per share data and years):
| | | | | | | | | | | | | | | | |
| | Number of
Underlying Shares | | | Weighted-Average
Exercise Price
Per Share | | | Weighted-Average
Remaining
Contractual
Life (Years) | | | Total Intrinsic
Value | |
Outstanding at December 31, 2023 | | | 1,466 | | | $ | 25.48 | | | | 4.97 | | | $ | 94,650 | |
Granted | | | — | | | | — | | | | | | | |
Exercised | | | (677 | ) | | | 24.52 | | | | | | | |
Forfeited or expired | | | (2 | ) | | | 29.98 | | | | | | | |
Outstanding at December 31, 2024 | | | 787 | | | | 26.28 | | | | 4.24 | | | | 93,654 | |
Vested and exercisable at December 31, 2024 | | | 787 | | | $ | 26.27 | | | | 4.24 | | | $ | 93,622 | |
The total intrinsic value of options exercised during 2024, 2023 and 2022 was $85.1 million, $19.1 million and $31.9 million, respectively. The total grant date fair value of options vested was $1.0 million, $3.3 million and $7.0 million during 2024, 2023 and 2022, respectively.
As of December 31, 2024, our unrecognized stock-based compensation cost related to unvested stock options was immaterial.
Restricted Stock Units
The following table summarizes activity for restricted stock units, or RSUs and MSUs for the year ended December 31, 2024 (in thousands, except per share data):
| | | | | | | | | | | | | | | | | |
| | | Number of Underlying Shares | Weighted-Average Grant Date Fair Value | |
| | | RSUs | | | MSUs | | | RSUs | | | MSUs | |
Outstanding at December 31, 2023 | | | | 1,078 | | | | 174 | | | $ | 84.18 | | | $ | 138.77 | |
Granted | | | | 461 | | | | 165 | | | | 134.76 | | | | 160.32 | |
Vested | | | | (502 | ) | | | (98 | ) | | | 79.15 | | | | 44.32 | |
Forfeited | | | | (117 | ) | | | (2 | ) | | | 90.01 | | | | 185.49 | |
Outstanding at December 31, 2024 | | | | 920 | | | | 239 | | | $ | 111.50 | | | $ | 192.06 | |
We record stock-based compensation expense for RSUs and MSUs on a straight-line basis over the requisite service period, which is generally the vesting period. Forfeitures are recognized as they occur.
In 2022, we granted PSUs under our annual bonus program to our senior executives and other bonus-eligible employees. The number of annual PSUs that ultimately vest depends on us attaining certain financial metrics for the fiscal year as well as on the employee’s continued employment through the vesting date. In fiscal year 2022, we transitioned to a bonus plan that was half cash and half PSUs. In fiscal years 2023 and 2024, we transitioned to an all cash bonus plan.
The following table summarizes information related to granted and vested RSUs, PSUs and MSUs (in thousands, except per share data):
| | | | | | | | | | | |
| Year Ended December 31, | |
| 2024 | | | 2023 | | | 2022 | |
RSU weighted-average grant date fair value | $ | 134.76 | | | $ | 119.12 | | | $ | 65.81 | |
MSU weighted-average grant date fair value | | 160.32 | | | | 145.51 | | | | 81.22 | |
PSU weighted-average grant date fair value | $ | — | | | $ | — | | | $ | 64.07 | |
| | | | | | | | |
Fair market value of RSUs vested | $ | 74,358 | | | $ | 64,417 | | | $ | 32,871 | |
Fair market value of MSUs vested | | 9,829 | | | | 7,219 | | | | — | |
Fair market value of PSUs vested | $ | — | | | $ | 7,261 | | | $ | 18,873 | |
As of December 31, 2024, our total unrecognized stock-based compensation cost related to unvested MSUs was $25.8 million, which we will recognize over the weighted-average period of 1.5
years. As of December 31, 2024, there was $89.4 million of total unrecognized compensation cost related to unvested RSUs, which we expect to recognize over a weighted-average period of 2.4 years.
Employee Stock Purchase Plan
Effective July 2016, we adopted the 2016 Employee Stock Purchase Plan, or the ESPP, allowing eligible employees to authorize payroll deductions of up to 15% of their eligible compensation. An ESPP participant may purchase a maximum of 4,000 shares, or a lesser number as determined by the IRS rules, each six-month period. The offering periods generally start on the first trading day on or after February 20 and August 20 of each year. Participants in an offering period are granted the right to purchase common shares at a price per share that is 85% of the lesser of the fair market value of the shares on (1) the first day of the offering period or (2) the end of the purchase period. The number of shares reserved for the ESPP may increase each year, beginning on January 1, 2017 and continuing through and including January 1, 2036, by the lesser of: (1) 1% of the total number of shares of common stock outstanding on the first day of each year; (2) 365,411 shares of common stock; and (3) an amount determined by our board of directors.
As of December 31, 2024, the total unrecognized stock-based compensation from the ESPP was $0.2 million, which we will recognize on a straight-line basis over the weighted-average remaining service period of less than one year.
We estimate the fair value of the ESPP grant at the start of the offering period using the Black-Scholes option-pricing model with the following assumptions for the periods presented:
| | | | | | |
| | Year Ended December 31, |
| | 2024 | | 2023 | | 2022 |
Risk-free interest rate | | 5.0% - 5.3% | | 5.1% - 5.6% | | 0.7% - 3.2% |
Expected term | | 0.5 Years | | 0.5 Years | | 0.5 Years |
Expected volatility | | 59.9% - 61.6% | | 64.7% - 85.9% | | 71.9% - 76.3% |
Note 11. Leases
The following table presents the components of lease expense in our consolidated statements of operations for the periods presented (in thousands):
| | | | | | | | | | | |
| Year Ended December 31, | |
| 2024 | | | 2023 | | | 2022 | |
Operating lease costs(1) | | | | | | | | |
Single lease costs | $ | 3,394 | | | $ | 3,486 | | | $ | 4,299 | |
Variable lease costs | | 1,367 | | | | 1,280 | | | | 2,159 | |
Sublease income(2) | | — | | | | (165 | ) | | | (1,976 | ) |
Total operating lease costs | $ | 4,761 | | | $ | 4,601 | | | $ | 4,482 | |
(1) Includes short-term lease costs, which are immaterial. | |
(2) Sublease income is related to unused office space that we sublet as part of the fiscal 2018 restructuring where we continue to have the primary obligations. | |
The following table presents supplemental cash flow information related to operating leases for the periods presented (in thousands):
| | | | | | | | | | | |
| Year Ended December 31, | |
| 2024 | | | 2023 | | | 2022 | |
Cash paid for amounts included in the measurement of lease liabilities | | | | | | | | |
Operating cash flows used | $ | 4,060 | | | $ | 4,233 | | | $ | 5,097 | |
Lease liabilities arising from remeasurement of right-of-use assets | | | | | | | | |
Operating leases | $ | — | | | $ | 159 | | | $ | — | |
Lease liabilities arising from obtaining ROU assets | | | | | | | | |
Operating leases | $ | — | | | $ | 1,690 | | | $ | 2,237 | |
The following table presents weighted-average remaining lease term and weighted-average discount rate related to operating leases as of:
| | | | | | | |
| 2024 | | | 2023 | |
Weighted-average remaining lease term (years) | | 2.8 | | | | 3.7 | |
Weighted-average discount rate | | 6.9 | % | | | 6.9 | % |
The following table presents future lease payments under operating leases as of December 31, 2024 (in thousands):
| | | | |
| | Operating Leases | |
| | Lease Payments | |
2025 | | $ | 4,101 | |
2026 | | | 4,190 | |
2027 | | | 766 | |
2028 | | | 642 | |
2029 | | | 549 | |
Thereafter | | | — | |
Total lease payments | | $ | 10,248 | |
Less: Imputed interest | | | (940 | ) |
Present value of lease liabilities | | | 9,308 | |
Less: Current portion of lease liabilities | | | 3,589 | |
Lease liabilities, net of current portion | | $ | 5,719 | |
Note 12. Commitments and Contingencies
Indemnification
In the normal course of business, we may enter into agreements that require us to indemnify either customers or suppliers for certain risks. Although we cannot estimate our maximum exposure under these agreements, to date indemnification claims have not had a material impact on our consolidated results of operations or financial condition.
Litigation
From time to time, we are subject to various legal proceedings or claims that arise in the ordinary course of business. We accrue a liability when management believes that it is both probable that we have incurred a liability and we can reasonably estimate the amount of loss. As of December 31, 2024 and 2023, we did not have accrued contingency liabilities. The following is a description of our significant legal proceedings. Although we believe that resolving these claims, individually or in aggregate, will not have a material adverse impact on our financial statements, these matters are subject to inherent uncertainties.
Patent Infringement Claims and Counterclaims
Impinj Patent Infringement Claims Against NXP
From 2019 to 2023, we engaged in active patent litigation against our primary endpoint IC competitor, NXP Semiconductors N.V., or NXP. During this time, we filed three patent infringement lawsuits against subsidiaries of NXP in federal courts in California and Texas. Our complaints alleged that certain NXP endpoint ICs infringed a number of our U.S. patents. In response, NXP filed a suit against us in federal court in Delaware, later transferred to Washington, countersued us in Texas, and filed three lawsuits against our subsidiary in China. NXP’s complaints alleged that certain of our endpoint ICs infringed a number of their own U.S. or Chinese patents or U.S. patents that they exclusively licensed from a third-party to assert against us.
Through 2023, we prevailed in these lawsuits. In three U.S. trials held in 2023, juries in California and Texas returned verdicts that NXP endpoint ICs infringed five of our patents that made it to trial, and juries in Washington and Texas ruled that we did not infringe any of the three patents NXP accused us in court of infringing. Also in 2023, NXP withdrew all three cases it filed against us in China.
On March 13, 2024, while additional trials were pending in China and Texas, and post-trial motions and appeals were pending in China and the U.S., we and NXP entered into the Settlement Agreement. Under the agreement we and NXP agreed to terminate and withdraw all pending proceedings and release one another for all patent infringement claims preceding March 31, 2024 and grant to each other non-exclusive, worldwide patent licenses to make, have made, import, use, offer for sale and sell their respective products and services, subject to the terms of the agreement. The Settlement Agreement will remain in force until all the valid claims of a specified set of Impinj patents, or the Indicator Patents, expire in about ten years. Either party can terminate the Settlement Agreement if the other party materially breaches the terms of the Agreement and NXP can terminate the Settlement Agreement if it successfully designs out all valid claims of the Indicator Patents.
Under the Settlement Agreement, NXP paid us a one-time amount of $45 million and agreed to make annual license fee payments, if the specified set of Indicator Patents are still in use, on April 1 of each year, effective April 1, 2024. The annual license fee will increase by a fixed percentage each year after 2024 for the remaining term of the Settlement Agreement. We have no obligation to pay NXP under the Settlement Agreement.
We allocated the consideration from the Settlement Agreement to the components of the Settlement Agreement. We recorded the $45 million payment in income from settlement of litigation in the condensed consolidated statements of operations in first-quarter 2024, upon receipt. Licensing of our intellectual property is part of our ongoing operations and therefore, we will recognize the license fee, which relates to annual usage of the license from April 1 to March 31 of each applicable year, as revenue in the second quarter of each year until the Settlement Agreement terminates. We recognized the first annual license fee of $15 million in revenue in second-quarter 2024.
Obligations with Third-Party Manufacturers
We manufacture products with third-party manufacturers. We are committed to purchase $24.6 million of inventory as of December 31, 2024.
Note 13. Deferred Revenue
Deferred revenue, comprising individually immaterial amounts for extended warranties, enhanced product maintenance and advance payments on NRE services contracts, represents contracted revenue that we have not yet recognized.
The following table presents the changes in deferred revenue for the indicated periods (in thousands):
| | | | | | | |
| Year Ended December 31, | |
| 2024 | | | 2023 | |
Balance at beginning of period | $ | 1,985 | | | $ | 2,599 | |
Opening balance from Voyantic acquisition | | — | | | | 1,233 | |
Deferral of revenue | | 2,930 | | | | 2,920 | |
Recognition of deferred revenue | | (2,947 | ) | | | (4,767 | ) |
Balance at end of period | $ | 1,968 | | | $ | 1,985 | |
During 2024, we recognized $1.4 million revenue which we included in deferred revenue as of December 31, 2023. During 2023, we recognized $2.2 million revenue which we included in deferred revenue as of December 31, 2022.
Note 14. Segment Reporting
We have one reportable and operating segment: the development and sale of our products and services. We identified our reportable segment based on how our chief operating decision-maker, or CODM, manages our business, makes operating decisions and evaluates our operating performance. Our chief executive officer acts as the CODM and reviews financial and operational information on an entity-wide basis. We have one business activity and there are no segment managers who are held accountable for operations, operating results or plans for levels or components. Accordingly, we have determined that we have a single reporting segment and operating unit structure.
Information by Revenue Categories
Our chief executive officer reviews information about our revenue categories, endpoint ICs and systems, the latter defined as reader ICs, readers, gateways, test and measurement systems and software. The following table presents our revenue categories for the indicated periods (in thousands):
| | | | | | | | | | | | |
| | Year Ended December 31, | |
| | 2024 | | | 2023 | | | 2022 | |
Endpoint ICs | | $ | 305,915 | | | $ | 234,426 | | | $ | 191,532 | |
Systems | | | 60,172 | | | | 73,113 | | | | 66,268 | |
Total revenue | | $ | 366,087 | | | $ | 307,539 | | | $ | 257,800 | |
Information by Geography
The following table summarizes our long-lived assets, comprising property and equipment, less accumulated depreciation (in thousands):
| | | | | | | | |
| | December 31, 2024 | | | December 31, 2023 | |
United States | | $ | 13,255 | | | $ | 14,110 | |
Malaysia | | | 9,221 | | | | 11,749 | |
Taiwan | | | 20,541 | | | | 13,396 | |
Others | | | 7,593 | | | | 5,636 | |
Total | | $ | 50,610 | | | $ | 44,891 | |
Our geographic revenue in the following table is based on the location of the VARs, inlay manufacturers, reader OEMs, distributors or end users who purchased products and services directly from us. For sales to our resellers and distributors, their location may be different from the locations of the ultimate end users. The following table presents our sales by geography for the indicated periods (in thousands):
| | | | | | | | | | | | |
| | Year Ended December 31, | |
| | 2024 | | | 2023 | | | 2022 | |
Americas | | $ | 110,155 | | | $ | 96,418 | | | $ | 57,129 | |
Asia Pacific | | | 209,538 | | | | 176,409 | | | | 168,249 | |
Europe, Middle East and Africa | | | 46,394 | | | | 34,712 | | | | 32,422 | |
Total revenue | | $ | 366,087 | | | $ | 307,539 | | | $ | 257,800 | |
Total revenue in the United States, which is included in the Americas, was $82.9 million, $86.2 million and $43.0 million for the years ended December 31, 2024, 2023 and 2022, respectively. Total revenue in China (and Hong Kong), which is included in Asia Pacific, was $162.7 million, $128.3 million and $109.6 million for the years ended December 31, 2024, 2023 and 2022, respectively. While total revenue in Malaysia, which is included in Asia Pacific, was less than 10% of revenue for the years ended December 31, 2024 and 2023, it was $41.0 million for the year ended December 31, 2022. No sales to
countries other than the United States, China and Malaysia accounted for more than 10% of revenue for the years ended December 31, 2024, 2023 and 2022.
Significant Segment Expenses
We adopted ASU 2023-07, Segment Reporting (Topic 280): Improvements to Reportable Segment Disclosures on December 31, 2024. As our CODM manages operations on a consolidated basis, consolidated net income as reported in our Statement of Operations is the US GAAP measure that is used to make operating decisions and evaluate operating performance. The significant expense categories which are used to manage operations are those reflected in our consolidated Statement of Operations.
Note 15. Net Earnings (Loss) per Share
For the periods presented, the following table provides a reconciliation of the numerator and denominator used in computing basic and diluted net loss per share (in thousands, except for per-share amounts):
| | | | | | | | | | | | |
| | Year Ended December 31, | |
| | 2024 | | | 2023 | | | 2022 | |
Numerator: | | | | | | | | | |
Net income (loss) | | $ | 40,838 | | | $ | (43,366 | ) | | $ | (24,301 | ) |
Interest add back | | | — | | | | — | | | | — | |
Net income (loss) attributable to common stock holders | | $ | 40,838 | | | $ | (43,366 | ) | | $ | (24,301 | ) |
Denominator: | | | | | | | | | |
Weighted average common shares outstanding, basic | | | 27,953 | | | | 26,752 | | | | 25,539 | |
Dilutive effect of: | | | | | | | | | |
Stock plans | | | 1,518 | | | | — | | | | — | |
2021 Notes | | | — | | | | — | | | | — | |
Weighted average common shares outstanding, diluted | | | 29,471 | | | | 26,752 | | | | 25,539 | |
| | | | | | | | | |
Net earnings (loss) per share — basic | | $ | 1.46 | | | $ | (1.62 | ) | | $ | (0.95 | ) |
Net earnings (loss) per share — diluted | | $ | 1.39 | | | $ | (1.62 | ) | | $ | (0.95 | ) |
The following table presents the outstanding shares of our common stock equivalents excluded from the computation of diluted net loss per share as of the dates presented because their effect would have been antidilutive (in thousands):
| | | | | | | | | | | | |
| | Year Ended December 31, | |
| | 2024 | | | 2023 | | | 2022 | |
Stock options | | | — | | | | 1,466 | | | | 1,712 | |
RSUs, MSUs and PSUs | | | 349 | | | | 1,252 | | | | 1,494 | |
Employee stock purchase plan shares | | | — | | | | 51 | | | | 26 | |
2021 Notes | | | 2,589 | | | | 2,589 | | | | 2,589 | |
Note 16. Related-Party Transactions
We have been party to a consulting agreement with a limited liability company owned by Cathal Phelan, a member of our board of directors, pursuant to which Mr. Phelan provided advisory and consulting services to us. We recognized and paid $0.5 million in consulting fees to the limited liability company owned by Mr. Phelan for the year ended December 31, 2022. No consulting fees were recognized and paid in the years ended December 31, 2024 or 2023y. Additionally, we granted 60,000 shares of stock options to Mr. Phelan on September 21, 2020 in connection with these consulting services, with 1/24th of the shares subject to the option vesting on October 21, 2020 and 1/24th of the shares subject to the option vesting on each month thereafter, subject to Mr. Phelan remaining a service provider. Further, in connection with these consulting services, we granted 8,000 RSUs to Mr. Phelan on October 1, 2022 with ¼th of the RSUs vesting on January 1, April 1, July 1 and October 1, 2023, subject to Mr. Phelan remaining a service provider. On January 1, 2023, Mr. Phelan joined our company as Chief Innovation Officer and ceased to provide us with consulting services. Mr. Phelan remains on our board of directors as a non-independent director.
On June 23, 2023, we acquired a patent from a related party in which a member of our board of directors holds an executive leadership position. The patent pertains to our endpoint IC products and the acquisition price was $0.3 million. The patent expires on July 17, 2026 and does not have renewal rights. This patent is included in our intangible assets on our consolidated balance sheet as of December 31, 2024.
Note 17. Retirement Plans
In 2001, we adopted a salary deferral 401(k) plan for our employees. The plan allows employees to contribute a percentage of their pretax earnings annually, subject to limitations imposed by the Internal Revenue Service, and allows a matching contribution, subject to certain limitations. We contributed $1.7 million and $1.8 million as matching contributions for the years ended December 31, 2024 and 2023, respectively.
Note 18. Restructuring
On February 7, 2024, we initiated a strategic restructuring to align financial, business and research and development objectives for long-term growth, including a reduction-in-force affecting approximately 10% of our employees. We incurred restructuring charges of $1.8 million for employee terminations benefits, including equity modification expense in first-quarter 2024. Restructuring payments were complete in second-quarter 2024.
A summary of accrued restructuring costs as of December 31, 2024 is shown in the table below (in thousands):
| | | | |
| | Year Ended December 31, 2024 | |
Restructuring costs | | $ | 1,812 | |
Non cash payments | | | (366 | ) |
Cash payments | | | (1,446 | ) |
Accrued restructuring costs as of December 31, 2024 | | $ | — | |
Item 9. Changes in and Disagreements with Accountants on Accounting and Financial Disclosure
None.
Item 9A. Controls and Procedures
Evaluation of Disclosure Controls and Procedures
Our management, including our chief executive officer and principal financial officer, evaluated the effectiveness of our disclosure controls and procedures as of December 31, 2024. Disclosure controls and procedures, as defined in Rules 13a-15(e) and 15d-15(e) under the Exchange Act, are designed to ensure that information required to be disclosed by a company in the reports that it files or submits under the Exchange Act is (1) recorded, processed, summarized and reported within the time periods specified in the SEC’s rules and forms and (2) accumulated and communicated to management, including its principal executive officer and principal financial officer, as appropriate to allow timely decisions regarding required disclosure. Based on the evaluation of our disclosure controls and procedures, our chief executive officer and principal financial officer concluded that our disclosure controls and procedures were effective at a reasonable assurance level as of December 31, 2024.
Management’s Report on Internal Control Over Financial Reporting
Our management is responsible for establishing and maintaining adequate internal control over financial reporting as defined under Rule 13a-15(f) and 15d-15(f) under the Exchange Act. We evaluated the effectiveness of our internal control over financial reporting based on the framework in Internal Control – Integrated Framework issued by the Committee of Sponsoring Organizations of the Treadway Commission (2013 framework). Based on our evaluation, our management concluded that our internal control over financial reporting was effective as of December 31, 2024.
The effectiveness of our internal control over financial reporting as of December 31, 2024 has been audited by Ernst & Young LLP, an independent registered public accounting firm, as stated in their report included herein.
Changes in Internal Control over Financial Reporting
There were no changes that have materially affected, or are reasonably likely to materially affect, our internal control over financial reporting during the three months ended December 31, 2024.
Limitations on Controls
Our disclosure controls and procedures and internal control over financial reporting are designed to provide reasonable assurance of achieving the desired control objectives. Our management recognizes that any control system, no matter how well designed and operated, is based upon certain judgments and assumptions and cannot provide absolute assurance that its objectives will be met. Similarly, an evaluation of controls cannot provide absolute assurance that misstatements due to error or fraud will not occur or that all control issues and instances of fraud, if any, have been detected.
Item 9B. Other Information
Securities Trading Plans of Directors and Executive Officers
During our last fiscal quarter, no director or officer, as defined in Rule 16a-1(f), adopted or terminated a “Rule 10b5-1 trading arrangement” or a “non-Rule 10b5-1 trading arrangement,” each as defined in Item 408 of Regulation S-K, except as follows:
| | | | | | | | | | |
Name and Title | | Character of Trading Arrangement (1) | | Date Adopted | | Date Terminated | | Duration (2) | | Aggregate Number of Shares of Common Stock to be Purchased or Sold Pursuant to Trading Arrangement |
Jeff Dossett, Chief Revenue Officer | | Rule 10b5-1 Trading Arrangement | | November 19, 2024 | | - | | August 28, 2025 | | Up to 15,000 |
(1) Except as indicated by footnote, each trading arrangement marked as a “Rule 10b5-1 Trading Arrangement” is intended to satisfy the affirmative defense of Rule 10b5-1(c), as amended, or the “Rule”.
(2) Except as indicated by footnote, each trading arrangement permits transactions through and including the earlier of (a) the execution or expiration of all trades specified under the trading arrangement or (b) the date listed in the table. Each trading arrangement marked as a “Rule 10b5-1 Trading Arrangement” only permits transactions upon expiration of the applicable mandatory cooling-off period under the Rule.
Item 9C. Disclosure Regarding Foreign Jurisdictions that Prevent Inspections.
None.
PART III
Item 10. Directors, Executive Officers and Corporate Governance
The information required by this item is incorporated by reference to our definitive proxy statement relating to the 2025 annual meeting of stockholders. The definitive proxy statement will be filed with the SEC within 120 days after the end of the 2024 fiscal year.
We have adopted a Code of Ethics that applies to our Chief Executive Officer, Chief Financial Officer, principal accounting officer and controller and persons performing similar functions. The Code of Ethics is posted on our website at http://corporate-governance.impinj.com. We intend to satisfy the disclosure requirements under Item 5.05 of Form 8-K regarding an amendment to, or waiver from, a provision of the Code of Ethics by posting the information on our website at the address specified above.
We have adopted an insider trading policy governing, among other things, the purchase, sale and/or other dispositions of our common stock by our directors, officers, employees, consultants, contractors and agents. A copy of our insider trading policy is filed as Exhibit 19.1 to this Annual Report on Form 10-K.
Item 11. Executive Compensation
The information required by this item is incorporated by reference to our definitive proxy statement relating to the 2025 annual meeting of stockholders. The definitive proxy statement will be filed with the SEC within 120 days after the end of the 2024 fiscal year.
Item 12. Security Ownership of Certain Beneficial Owners and Management and Related Stockholder Matters
The information required by this item is incorporated by reference to our definitive proxy statement relating to the 2025 annual meeting of stockholders. The definitive proxy statement will be filed with the SEC within 120 days after the end of the 2024 fiscal year.
Item 13. Certain Relationships and Related Transactions, and Director Independence
The information required by this item is incorporated by reference to our definitive proxy statement relating to the 2025 annual meeting of stockholders. The definitive proxy statement will be filed with the SEC within 120 days after the end of the 2024 fiscal year.
Item 14. Principal Accountant Fees and Services
The information required by this item is incorporated by reference to our definitive proxy statement relating to the 2025 annual meeting of stockholders. The definitive proxy statement will be filed with the SEC within 120 days after the end of the 2024 fiscal year.
PART IV
Item 15. Exhibits and Financial Statement Schedules
(a)(1) Financial Statements
We have filed the financial statements listed in the Index to Consolidated Financial Statements as a part of this report.
(a)(2) Financial Statement Schedules
All financial statement schedules have been omitted because they are not applicable, not material or the required information is presented in the financial statements or the notes thereto.
(a)(3) Exhibits
The list of exhibits included in the Exhibit Index to this report is incorporated herein by reference.
| | | | | | | | |
| | | | INCORPORATION BY REFERENCE |
NUMBER | | DESCRIPTION | | Form | | Date | | Number |
| | | | | | | | |
3.1(a) | | Amended and Restated Certificate of Incorporation of Impinj, Inc., as filed with the Secretary of State of the State of Delaware on June 10, 2020 | | 8-K | | 6/12/2020 | | 3.1 |
| | | | | | | | |
3.1(b) | | Certificate of Amendment to the Amended and Restated Certificate of Incorporation of Impinj, Inc., as filed with the Secretary of State of the State of Delaware on June 6, 2024 | | 8-K | | 6/7/2024 | | 3.1 |
| | | | | | | | |
3.2 | | Amended and Restated Bylaws of Impinj, Inc., adopted as of February 23, 2023 | | 8-K | | 2/28/2023 | | 3.1 |
| | | | | | | | |
4.1 | | Description of Impinj, Inc.’s Common Stock | | | | | | |
| | | | | | | | |
4.2 | | Specimen Common Stock Certificate of the registrant | | S-1/A | | 7/11/2016 | | 4.1 |
| | | | | | | | |
4.3 | | Amended and Restated Investors’ Rights Agreement, dated July 13, 2012, by and among the registrant and the investors and founders named therein | | S-1 | | 6/2/2016 | | 4.2 |
| | | | | | | | |
4.4 | | Indenture, dated as of November 5, 2021, between Impinj, Inc., and U.S. Bank National Association, as trustee | | 8-K | | 11/5/2021 | | 4.6 |
| | | | | | | | |
4.5 | | Form of 1.125% Convertible Senior Notes due 2027 (included in Exhibit 4.4) | | 8-K | | 11/5/2021 | | 4.6 |
| | | | | | | | |
10.1+ | | Form of Director and Executive Officer Indemnification Agreement | | S-1/A | | 7/11/2016 | | 10.1 |
| | | | | | | | |
10.2+ | | 2000 Stock Plan, as amended | | S-1 | | 6/2/2016 | | 10.2 |
| | | | | | | | |
10.3+ | | Form of Notice of Stock Option Grant and Stock Option Agreement permitting early exercise under the 2000 Stock Plan | | S-1 | | 6/2/2016 | | 10.3 |
| | | | | | | | |
| | | | | | | | |
10.4+ | | 2010 Equity Incentive Plan, as amended | | S-1 | | 6/2/2016 | | 10.4 |
| | | | | | | | |
10.5+ | | Form of Notice of Stock Option Grant and Stock Option Agreement under the 2010 Equity Incentive Plan | | S-1 | | 6/2/2016 | | 10.5 |
| | | | | | | | |
10.6+ | | Form of Notice of Stock Option Grant and Stock Option Agreement permitting early exercise under the 2010 Equity Incentive Plan | | S-1 | | 6/2/2016 | | 10.6 |
| | | | | | | | |
10.7+ | | 2016 Equity Incentive Plan | | S-1/A | | 7/11/2016 | | 10.7 |
| | | | | | | | |
10.8+ | | Form of Notice of Stock Option Grant and Stock Option Agreement under the 2016 Equity Incentive Plan | | S-1/A | | 7/11/2016 | | 10.8 |
| | | | | | | | |
10.9+ | | 2016 Employee Stock Purchase Plan | | S-1/A | | 7/11/2016 | | 10.9 |
| | | | | | | | |
10.10+ | | Amended and Restated Diorio Employment Agreement, dated December 19, 2008, between the registrant and Chris Diorio, Ph.D. | | S-1 | | 6/2/2016 | | 10.12 |
| | | | | | | | |
10.11+ | | First Amendment to Diorio Employment Agreement, dated February 20, 2009, between the registrant and Chris Diorio, Ph.D. | | S-1 | | 6/2/2016 | | 10.13 |
| | | | | | | | |
10.12+ | | Offer Letter, dated January 6, 2020, between the registrant and Cary Baker | | 10-K | | 3/2/2020 | | 10.14 |
| | | | | | | | |
10.13 | | Office Lease, dated December 10, 2014, by and between the registrant and 400 Fairview LLC | | S-1 | | 6/2/2016 | | 10.21 |
| | | | | | | | |
10.14A | | First Amendment to Lease, dated July 31, 2015, between the registrant and 400 Fairview LLC | | S-1 | | 6/2/2016 | | 10.21A |
| | | | | | | | |
10.14B | | Second Amendment to Lease, dated March 4, 2016, between the registrant and 400 Fairview LLC | | S-1 | | 6/2/2016 | | 10.21B |
| | | | | | | | |
10.14C | | Third Amendment to Lease, dated March 28, 2016, between the registrant and 400 Fairview LLC | | S-1 | | 6/2/2016 | | 10.21C |
| | | | | | | | |
10.15 | | Office Lease, dated November 17, 2004, between the registrant and Bedford Property Investors, Inc., as amended by the First Amendment to Lease, dated July 21, 2006, by and between the registrant and Fremont Lake Union Center LLC and the Second Amendment to Lease, dated December 11, 2009, by and between the registrant and Fremont Lake Union Center LLC | | S-1 | | 6/2/2016 | | 10.22 |
| | | | | | | | |
10.16† | | License Agreement, dated July 3, 2008, between the registrant and Intel Corporation | | 10-Q | | 10/28/2020 | | 10.1 |
| | | | | | | | |
10.17† | | Purchase Agreement—Services Phase 2, dated December 23, 2009, by and between the registrant and Intel Corporation | | 10-Q | | 10/28/2020 | | 10.2 |
| | | | | | | | |
| | | | | | | | |
10.18† | | Amendment No. 1 to Purchase Agreement—Services Phase 2, dated March 26, 2010, between the registrant and Intel Corporation | | 10-Q | | 10/28/2020 | | 10.3 |
| | | | | | | | |
10.19† | | Amendment No. 2 to Purchase Agreement—Services Phase 2, dated April 20, 2011, between the registrant and Intel Corporation | | 10-Q | | 10/28/2020 | | 10.4 |
| | | | | | | | |
10.20† | | Amendment No. 3 to Purchase Agreement—Services Phase 2, dated November 15, 2011, between the registrant and Intel Corporation | | 10-Q | | 10/28/2020 | | 10.5 |
| | | | | | | | |
10.21† | | Amendment No. 4 to Purchase Agreement—Services Phase 2, dated April 25, 2013, between the registrant and Intel Corporation | | 10-Q | | 10/28/2020 | | 10.6 |
| | | | | | | | |
10.22† | | Amendment No. 5 to Purchase Agreement—Services Phase 2, dated June 12, 2013, between the registrant and Intel Corporation | | 10-Q | | 10/28/2020 | | 10.7 |
| | | | | | | | |
10.23+ | | Form of Notice of Restricted Stock Unit Grant and Restricted Stock Unit Agreement under the 2016 Equity Incentive Plan | | 10-Q | | 8/14/2017 | | 10.1 |
10.24 | | Letter Agreement, dated as of June 20, 2018, among Impinj, Inc., Sylebra HK Company Limited, Sylebra Capital Management and Daniel P. Gibson | | 8-K | | 6/26/2018 | | 10.1 |
10.25+ | | Executive Employment Agreement, dated April 28, 2017, between the registrant and Jeff Dossett | | 10-K | | 2/28/2020 | | 10.32 |
10.26 | | Form of Capped Call Transaction Confirmation | | 8-K | | 12/16/2019 | | 10.1 |
10.27+ | | Impinj, Inc. Amended and Restated Outside Director Compensation Policy, as amended May 26, 2022 | | 10-Q | | 7/27/2022 | | 10.1 |
10.28+ | | Executive Employment Agreement, dated November 13, 2018 between the registrant and Hussein Mecklai | | 10-K | | 2/13/2023 | | 10.28 |
10.29+ †† | | Executive Employment and Arbitration Agreement dated December 29, 2022 between the registrant and Cathal Phelan | | 10-K | | 2/13/2023 | | 10.29 |
| | | | | | | | |
10.30† | | Settlement and Patent Cross-License Agreement, dated as of March 13, 2024, by and among Impinj, Inc., NXP Semiconductors N.V. and NXP USA, Inc. | | 10-Q | | 4/24/2024 | | 10.1 |
| | | | | | | | |
19.1 | | Impinj, Inc. Insider Trading Policy | | | | | | |
| | | | | | | | |
21.1 | | Subsidiaries of the registrant | | S-1 | | 6/2/2016 | | 21.1 |
| | | | | | | | |
23.1 | | Consent of Ernst & Young LLP, Independent Registered Public Accounting Firm | | | | | | |
| | | | | | | | |
24.1 | | Powers of Attorney (contained on signature page) | | | | | | |
| | | | | | | | |
| | | | | | | | |
31.1 | | Certification of Principal Executive Officer Required Under Rule 13a-14(a) and 15d-14(a) of the Securities Exchange Act of 1934, as amended | | | | | | |
| | | | | | | | |
31.2 | | Certification of Principal Financial Officer Required Under Rule 13a-14(a) and 15d-14(a) of the Securities Exchange Act of 1934, as amended | | | | | | |
| | | | | | | | |
32.1* | | Certification of Principal Executive Officer Required Under Rule 13a-14(b) of the Securities Exchange Act of 1934, as amended, and 18 U.S.C. §1350 | | | | | | |
| | | | | | | | |
32.2* | | Certification of Principal Financial Officer Required Under Rule 13a-14(b) of the Securities Exchange Act of 1934, as amended, and 18 U.S.C. §1350 | | | | | | |
| | | | | | | | |
97.1 | | Impinj, Inc. Amended and Restated Compensation Recovery Policy | | 10-K | | 2/12/2024 | | 97.1 |
| | | | | | | | |
101.INS | | Inline XBRL Instance Document | | | | | | |
| | | | | | | | |
101.SCH | | Inline XBRL Taxonomy Extension Schema with embedded Linkbase Documents | | | | | | |
| | | | | | | | |
104 | | Inline XBRL for the cover page of this Annual Report on Form 10-K, included in the Exhibit 101 Inline XBRL Document Set | | | | | | |
| | | | | | | | |
+ | | Indicates management contract or compensatory plan, contract or arrangement. |
| | |
* | | The certifications attached as Exhibits 32.1 and 32.2 that accompany this Annual Report on Form 10-K are not deemed filed with the Securities and Exchange Commission and are not to be incorporated by reference into any filing of Impinj, Inc. under the Securities Act of 1933, as amended, or the Securities Exchange Act of 1934, as amended, whether made before or after the date of this Form 10-K, irrespective of any general incorporation language contained in such filing. |
| | |
† | | Certain portions of this exhibit have been omitted because they are not material and would likely cause competitive harm to the registrant if disclosed. |
| | |
†† | | Certain portions of this exhibit have been omitted because they are not material and are of the type that the registrant treats as private or confidential. |
Item 16. Form 10-K Summary
None.
SIGNATURES
Pursuant to the requirements of Section 13 or 15(d) of the Securities Exchange Act of 1934, the registrant has duly caused this report to be signed on its behalf by the undersigned, thereunto duly authorized.
| | | | |
|
| Impinj, Inc. |
|
|
| |
|
Date: February 10, 2025 |
| By: | | /s/ Cary Baker |
|
|
| | Cary Baker |
|
|
| | Chief Financial Officer (Principal Financial and Accounting Officer) |
POWER OF ATTORNEY
KNOW ALL PERSONS BY THESE PRESENTS, that each person whose signature appears below constitutes and appoints Chris Diorio, Ph.D. and Cary Baker, and each of them, with full power of substitution and resubstitution and full power to act without the other, as his or her true and lawful attorney-in-fact and agent to act in his or her name, place and stead and to execute in the name and on behalf of each person, individually and in each capacity stated below, and to file, any and all documents in connection therewith, with the Securities and Exchange Commission, granting unto said attorneys-in-fact and agents, and each of them, full power and authority to do and perform each and every act and thing, ratifying and confirming all that said attorneys-in-fact and agents or any of them or their and his or her substitute or substitutes, may lawfully do or cause to be done by virtue thereof.
Pursuant to the requirements of the Securities Exchange Act of 1934, this report has been signed below by the following persons on behalf of the registrant and in the capacities and on the dates indicated.
| | | | |
Name |
| Title | | Date |
|
|
| | |
/s/Chris Diorio |
| Chief Executive Officer and Vice Chair (Principal Executive Officer) | | February 10, 2025 |
Chris Diorio, Ph.D. |
| | | |
|
| | | |
/s/ Cary Baker |
| Chief Financial Officer | | February 10, 2025 |
Cary Baker |
| (Principal Financial and Accounting Officer) | | |
| | | | |
/s/ Steve Sanghi |
| Chair | | February 10, 2025 |
Steve Sanghi |
| | | |
| | | | |
/s/ Daniel Gibson |
| Director | | February 10, 2025 |
Daniel Gibson |
| | | |
| | | | |
/s/ Umesh Padval |
| Director | | February 10, 2025 |
Umesh Padval | | | | |
| | | | |
/s/ Cathal Phelan |
| Director | | February 10, 2025 |
Cathal Phelan | | | | |
/s/ Meera Rao |
| Director | | February 10, 2025 |
Meera Rao | | | | |
| | | | |
/s/ Miron Washington | | Director | | February 10, 2025 |
Miron Washington | | | | |