     Wunderlich Securities Bank Forum Terry Turner, President and CEO Harold Carpenter, EVP and CFO Memphis, Tennessee May 17, 2012 Exhibit 99.1 |
     Forward-looking statements Certain of the statements in this presentation may constitute forward-looking statements within the meaning of Section 27A of the Securities Act of 1933, as amended, and Section 21E of the Securities Exchange Act of 1934, as amended. The words “expect,” “anticipate,” “goal,” “objective,” “intend,” “plan,” “believe,” ”should,” “seek,” “estimate” and similar expressions are intended to identify such forward-looking statements, but other statements not based on historical information may also be considered forward-looking. All forward-looking statements are subject to risks, uncertainties and other factors that may cause the actual results, performance or achievements of Pinnacle Financial to differ materially from any results expressed or implied by such forward-looking statements. Such risks include, without limitation, (i) deterioration in the financial condition of borrowers resulting in significant increases in loan losses and provisions for those losses; (ii) continuation of the historically low, short-term interest rate environment; (iii) the inability of Pinnacle Financial to grow its loan portfolio in the Nashville-Davidson-Murfreesboro-Franklin MSA (“the Nashville MSA”) and the Knoxville MSA; (iv) changes in loan underwriting, credit review or loss reserve policies associated with economic conditions, examination conclusions, or regulatory developments; (v) effectiveness of Pinnacle Financial’s asset management activities in improving, resolving or liquidating lower-quality assets; (vi) increased competition with other financial institutions; (vii) greater than anticipated adverse conditions in the national or local economies including the Nashville MSA and the Knoxville MSA, particularly in commercial and residential real estate markets; (viii) rapid fluctuations or unanticipated changes in interest rates; (ix) the results of regulatory examinations; (x) the development of any new market other than Nashville or Knoxville; (xi) a merger or acquisition; (xii) any matter that would cause Pinnacle Financial to conclude that there was impairment of any asset, including intangible assets; (xiii) the ability to attract additional financial advisors or to attract customers from other financial institutions and conversely, the inability to realize the economic benefits of newly hired financial advisors; (xiv) the impact of governmental restrictions on and discretionary regulatory authority over entities participating in the Capital Purchase Program (the “CPP”) of the U.S. Department of the Treasury (the “U.S. Treasury”); (xv) further deterioration in the valuation of other real estate owned and increased expenses associated therewith; (xvi) inability to comply with regulatory capital requirements or to secure any required regulatory approvals for capital actions, including redemption of the remaining preferred shares sold to the U.S. Treasury that are outstanding; and, (xvii) changes in state and federal legislation, regulations or policies applicable to banks and other financial service providers, including regulatory or legislative developments arising out of current unsettled conditions in the economy, including implementation of the Dodd-Frank Wall Street Reform and Consumer Protection Act (the “Dodd-Frank Act”). A more detailed description of these and other risks is contained in “Item 1A. Risk Factors” of the Company’s Annual Report on Form 10-K filed with the Securities and Exchange Commission on March 2, 2012 and most recent quarterly reports on Form 10-Q filed with the Securities and Exchange commission on May 4, 2012. Many of such factors are beyond Pinnacle Financial’s ability to control or predict, and readers are cautioned not to put undue reliance on such forward-looking statements. Pinnacle Financial disclaims any obligation to update or revise any forward-looking statements contained in this release, whether as a result of new information, future events or otherwise. Safe Harbor Statements 2 |
     • High-growth, one bank holding company • Headquartered in Nashville, TN • Denovo in Nashville in October 2000 • Purely organic growth thru March 2006 • Two in-market acquisitions in March 2006 and November 2007 • Denovo in Knoxville in April 2007 Company Profile – Chapter 1 (2000-2008) |
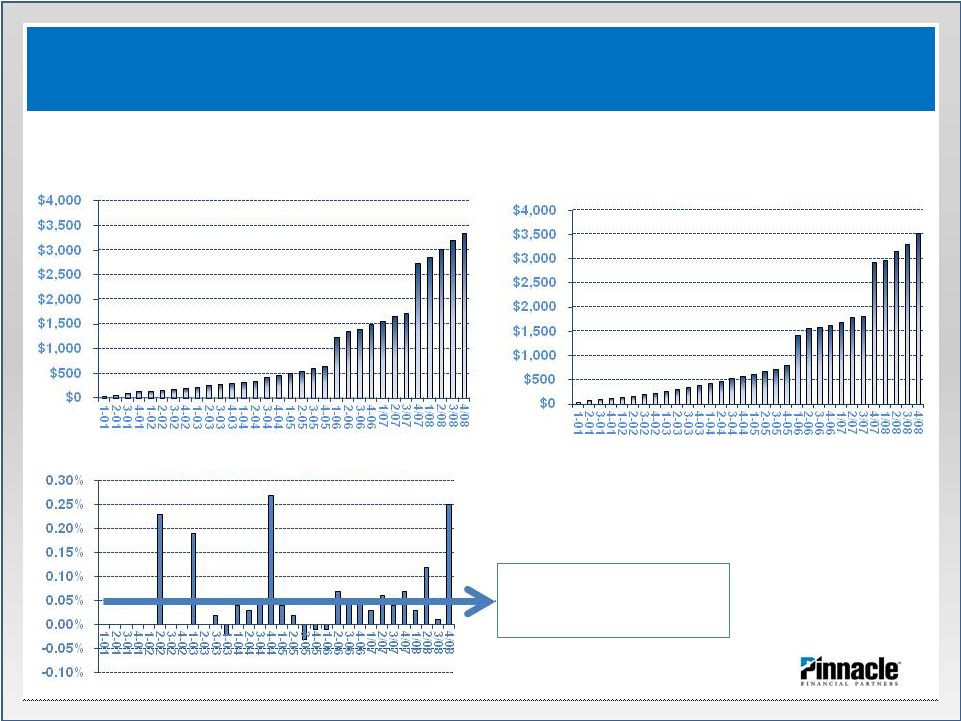   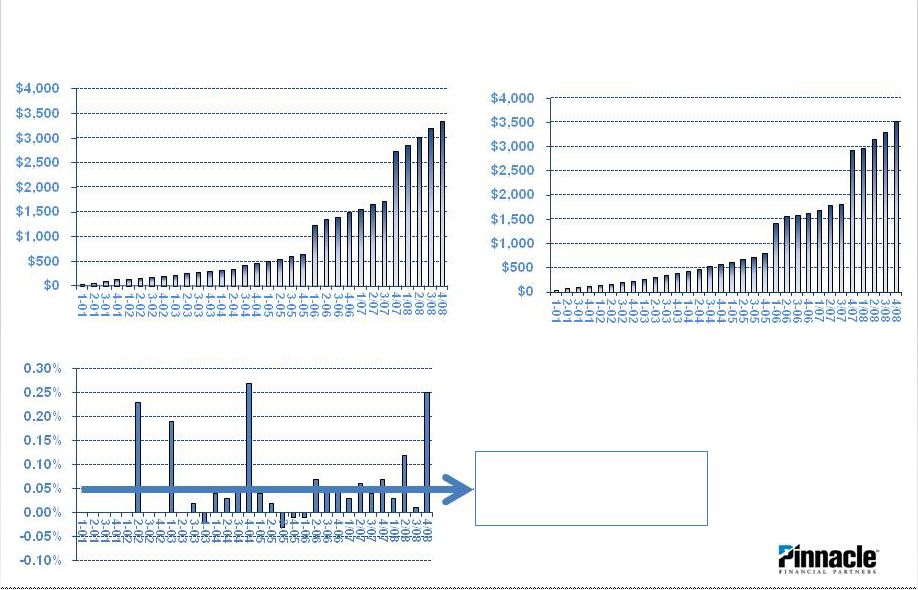  PNFP Successfully Moved Quality Share from Large Regionals Company Profile – Chapter 1 (2000-2008) Loans Deposits Net Charge-off’s Avg. net charge- off rate of 0.05% |
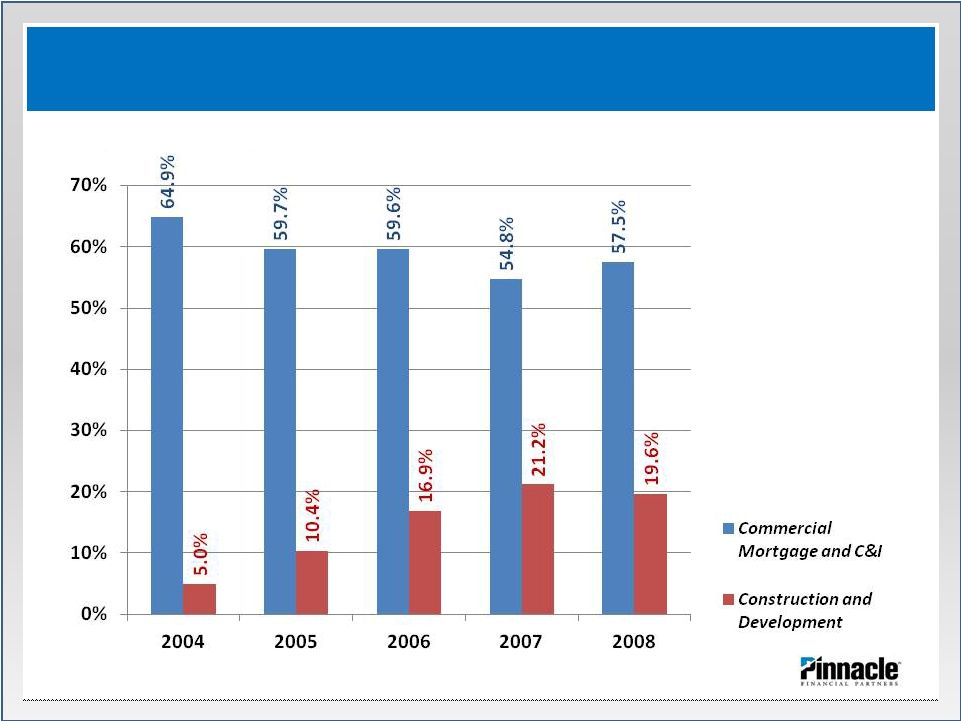   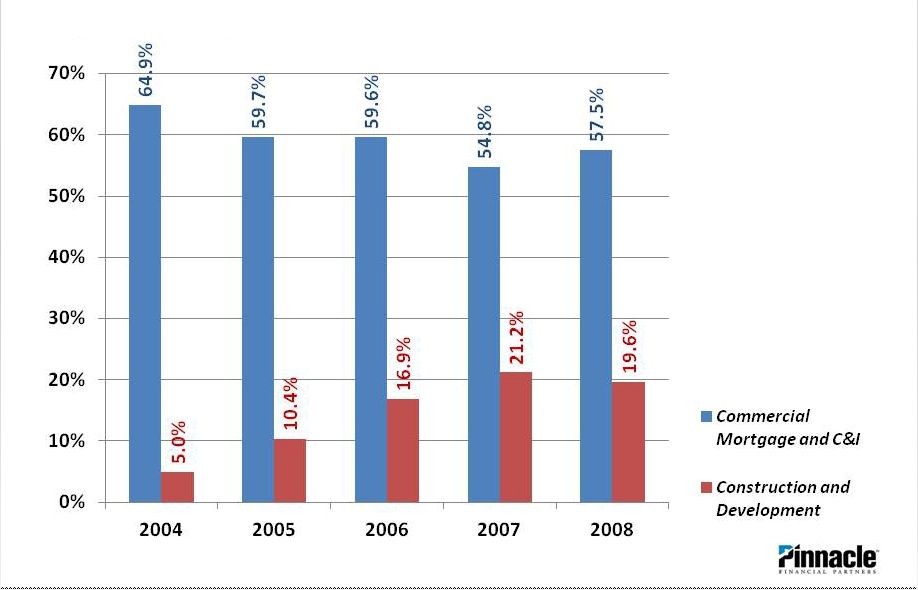  Acquisitions Significantly Altered Loan Mix to C&D Company Profile – Chapter 1 (2000-2008) |
     • Aggressively dealing with credit issues • Building core earnings capacity Company Profile – Chapter 2 (2009-2011) Primary Priorities |
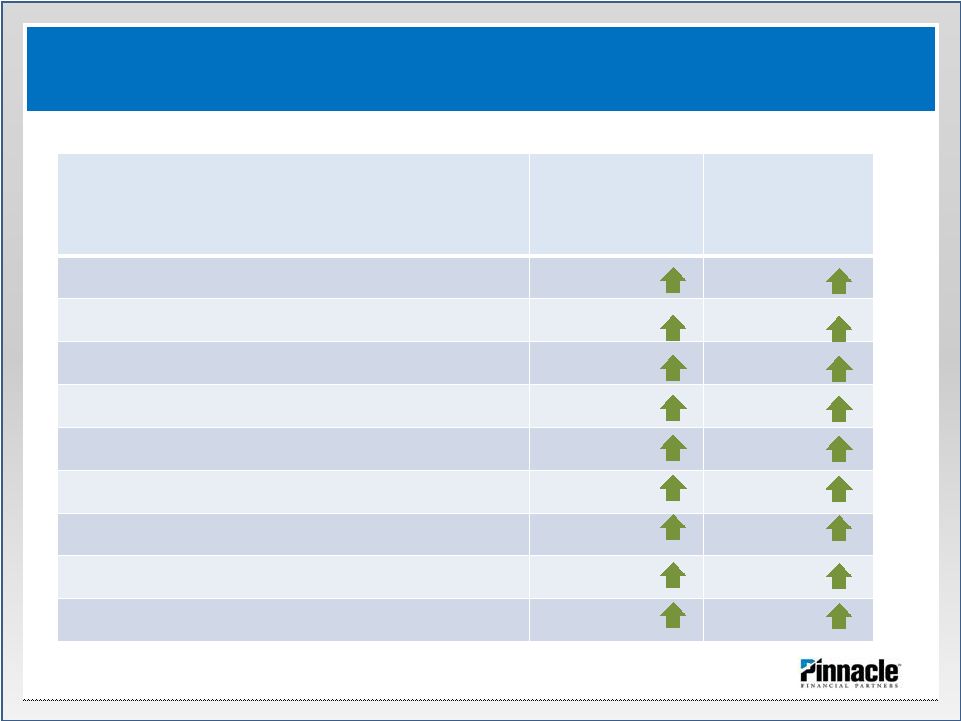    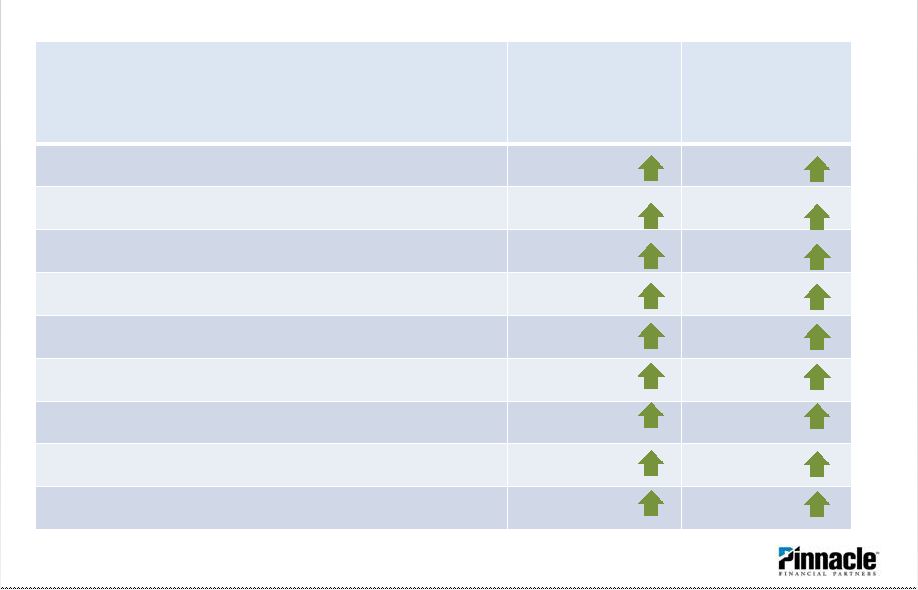 Linked Qtr Change Quarterly Year over Year Change Total loans 1.4% 3.7% C&I and owner occupied CRE loans 2.5% 11.1% Noninterest bearing deposits 5.5% 24.4% Net interest income 28.7% 13.6% Net interest margin 2.2% 9.7% Noninterest income excl. securities gains 2.5% 15.9% Gain on mortgage loan sales, net 2.2% 145.2% Wealth management revenues 20.6% 13.5% Total revenue excl. securities gains 0.9% 10.9% Priority: Build the Core Earnings Capacity of the Firm 7 First Quarter 2012 Highlights |
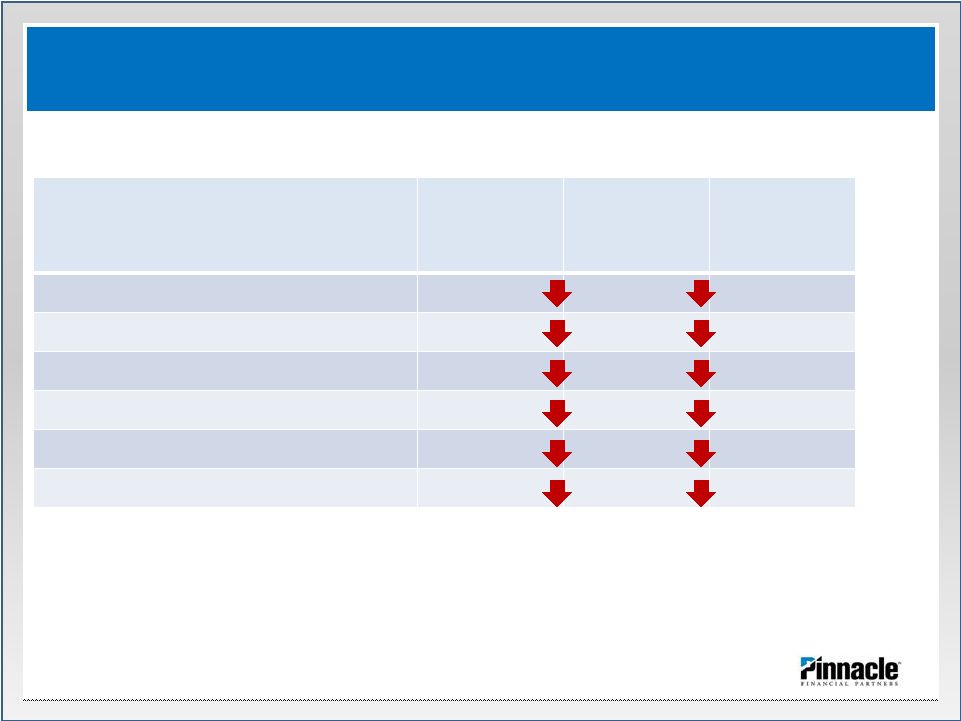    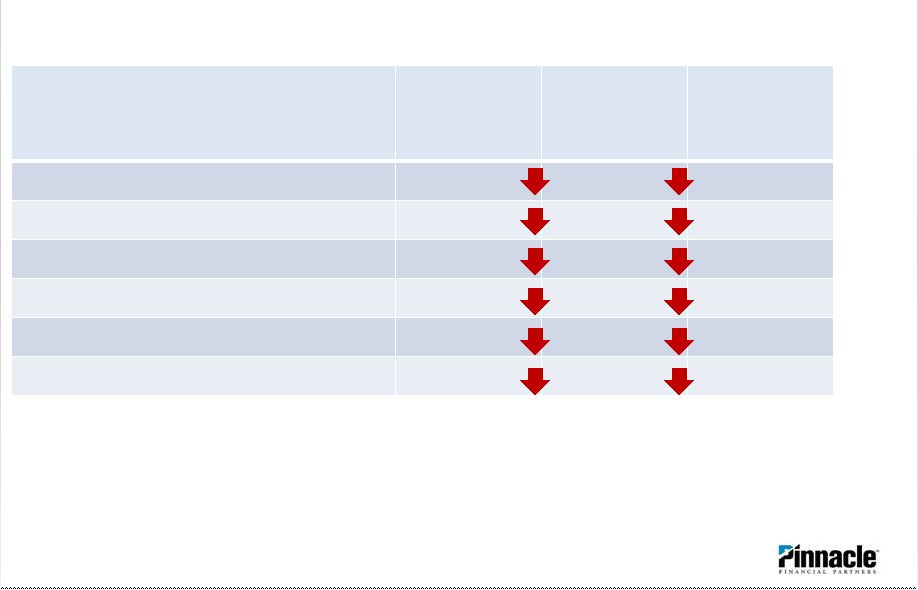 Linked Qtr Decrease Year over Year Decrease Consecutive Qtrs. of Progress Credit losses (NCO’s + ORE expense) (21.1%) (40.9%) 7 NPLs (10.5%) (43.9%) 8 NPAs (12.2%) (41.9%) 7 Classified Loans (9.6%) (30.7%) 7 Potential problem loans (3.1%) (27.3%) 7 C&D exposure (2.7%) (6.3%) 12 Priority: Aggressively Deal with Credit Issues 8 First Quarter 2012 Highlights |
     9 Past Due Loans are Low and Continue to Decline Aggressively Dealing with Credit Issues (*) > 30 days past due (000’s) March 31, 2012 As a % of total loans December 31, 2011 As a % of total loans Past Due Loans (*) Managed by special assets: Nonaccrual loans $21,443 0.64% $22,339 0.68% Accruing loans 7,599 0.23% 7,437 0.23% Managed by relationship managers: Accruing loans 3,663 0.11% 4,505 0.14% Total past due $32,705 0.98% $34,281 1.05% |
    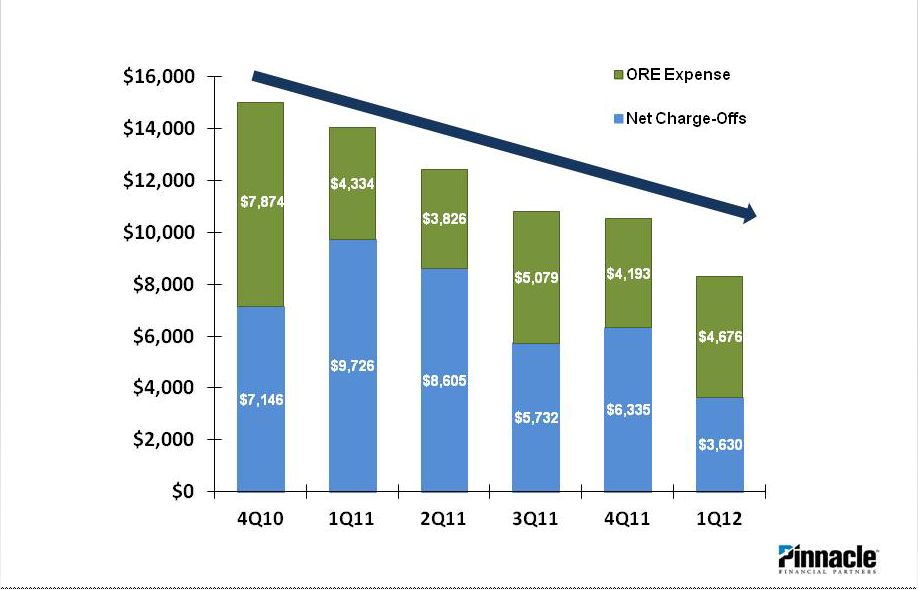 10 Aggressively Dealing with Credit Issues Credit Losses Continue to Decline |
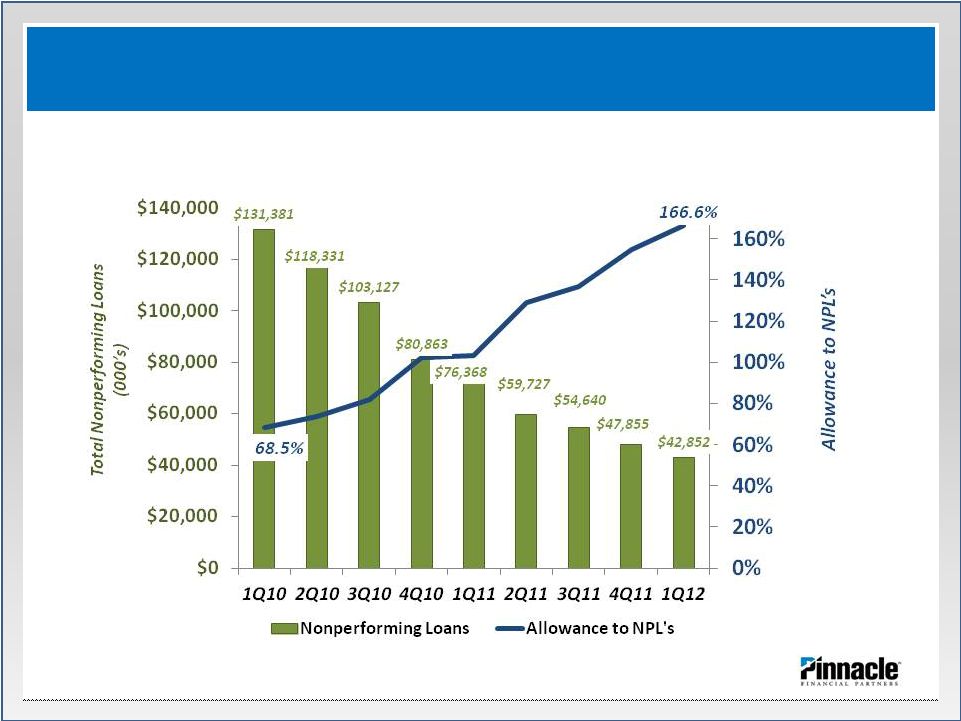    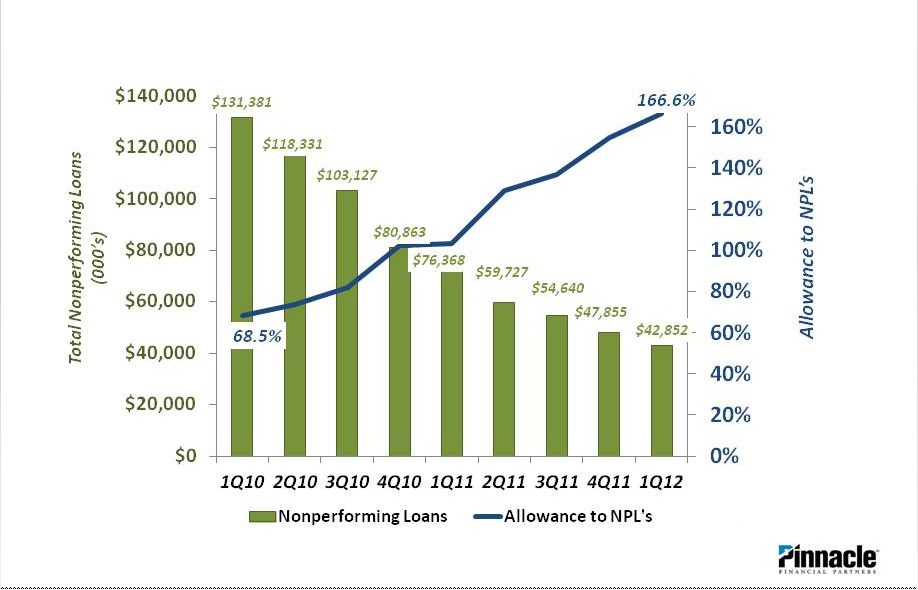 Allowance Coverage Increases as NPLs Decline 11 Aggressively Dealing with Credit Issues |
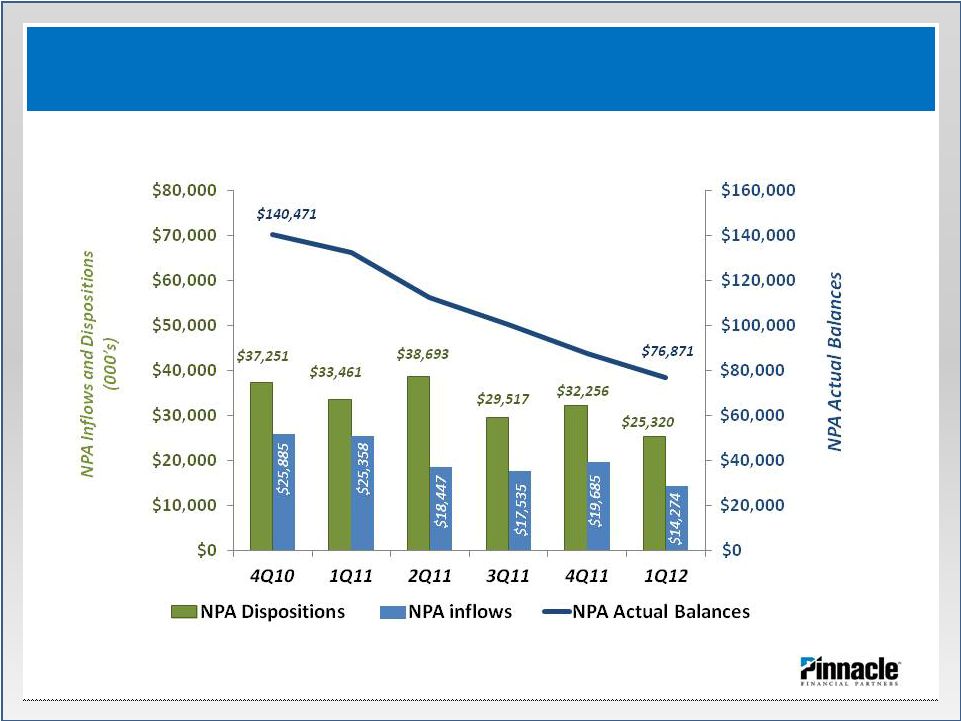    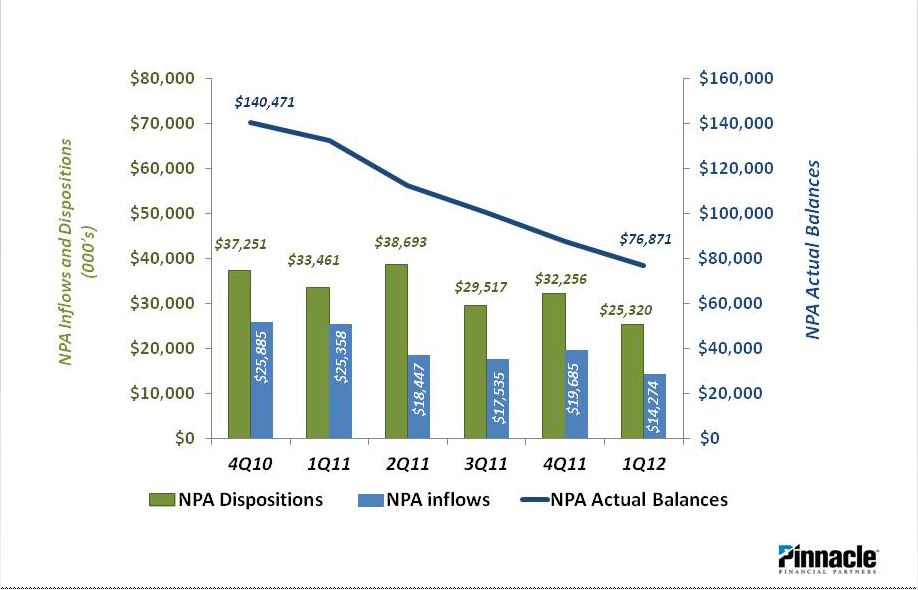 NPA inflows decrease consistent with NPAs 12 Aggressively Dealing with Credit Issues |
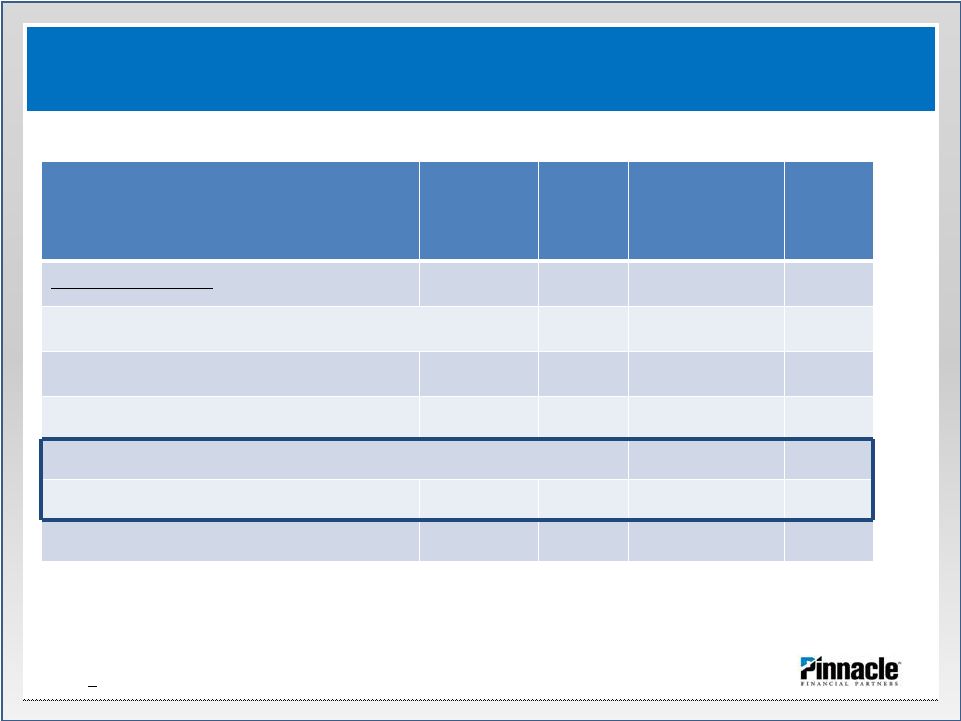
     (*) ORE dispositions > $250,000 from 4/1/11 thru 3/31/12 excluding partial sales 13 ORE Dispositions (*) thru March 31, 2012 ORE Balance at March 31, 2012 Loan balances prior to charge offs 100.0% 100.0% Charge off’s prior to foreclosure 22.3% 21.7% Balance @ foreclosure 77.7% 78.3% Valuation losses while in ORE 10.7% 22.6% Balance in ORE 67.0% 55.7% Loss on disposition 5.5% Net realized 61.5% Aggressively Dealing with Credit Issues OREO Valuations Remain Below Actual Results |
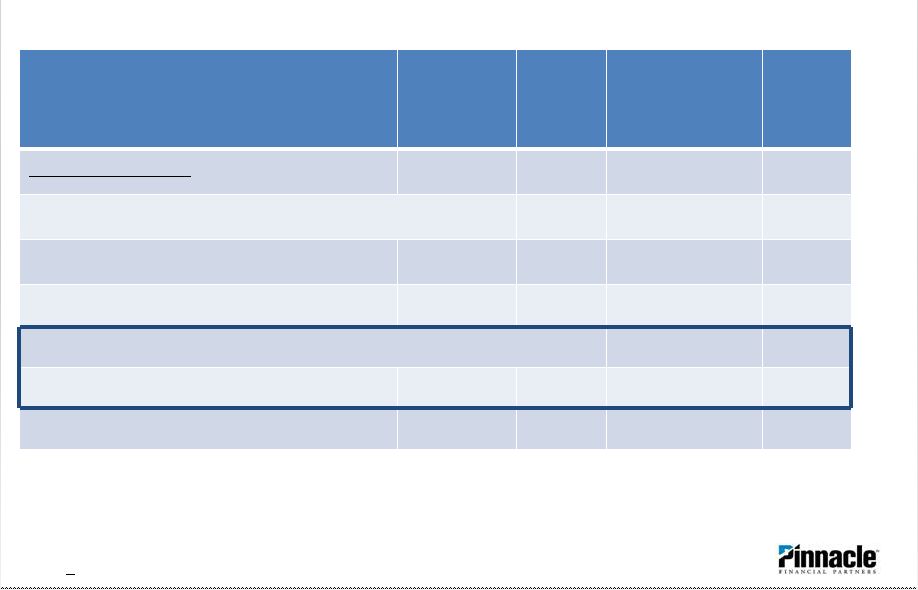
     (1) Market indications are that property will liquidate within 6 months (2) Various properties with reasonable activity or anticipated absorption such that liquidation should be realized within 24 months (3) Other properties likely requiring a speculative investor with longer-term workout potential 14 Aggressively Dealing with Credit Issues OREO Disposition Plans Suggest Limited Unresolved Issues (dollars in thousands) Balances March 31, 2012 Near-term liquidation (1) Active Projects (2) Other Properties (3) ORE categories: New home construction/condo’s $ 371 159 212 - Developed lots 6,419 1,310 3,741 1,368 Undeveloped land 20,527 1,078 15,075 4,374 Other 6,701 5,152 1,483 66 Total ORE $ 34,018 7,699 20,511 5,808 |
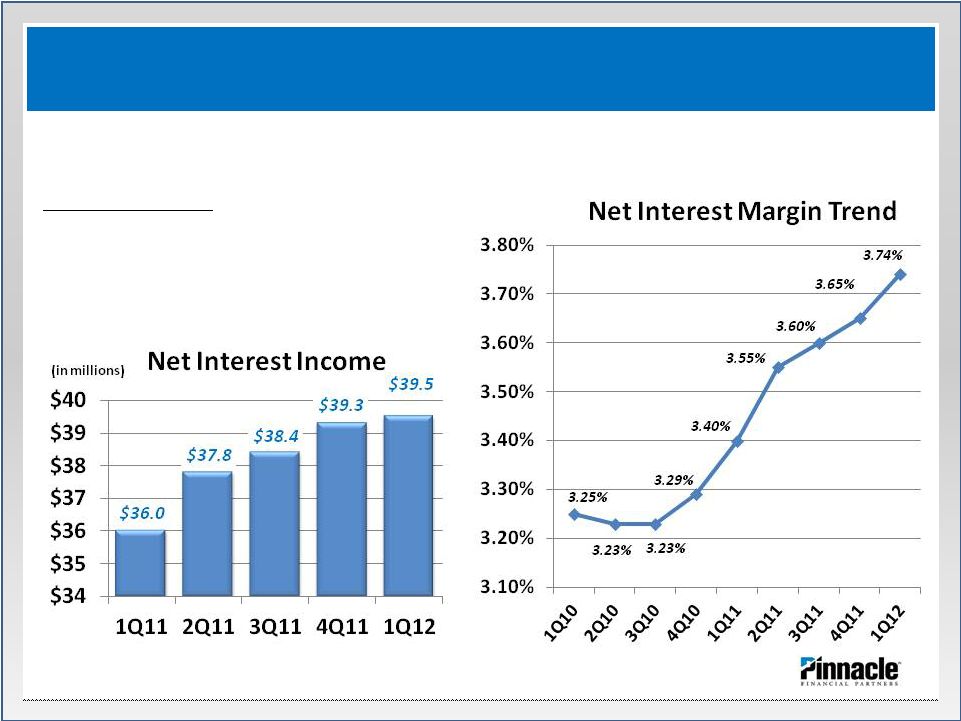   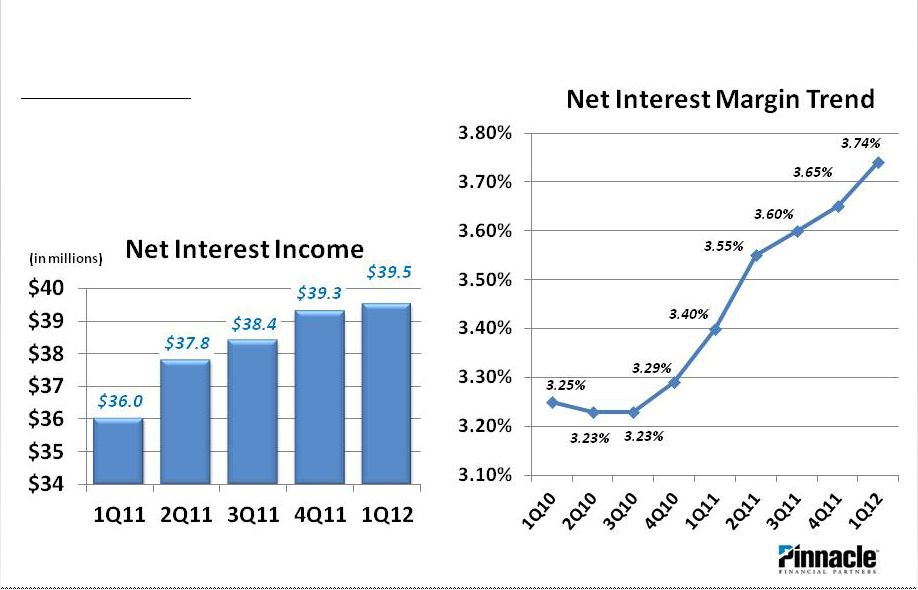  15 Building Core Earnings Capacity Net Interest Margin Continues Significant Expansion Key Margin Drivers: • Higher loan volumes • Reduced funding costs • NPA resolutions |
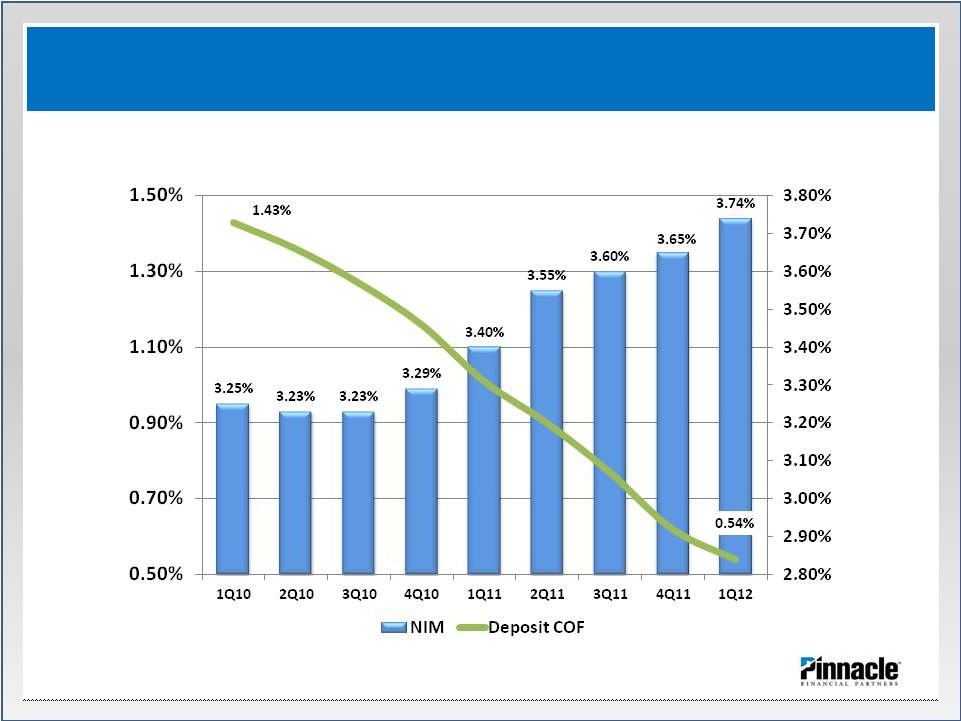    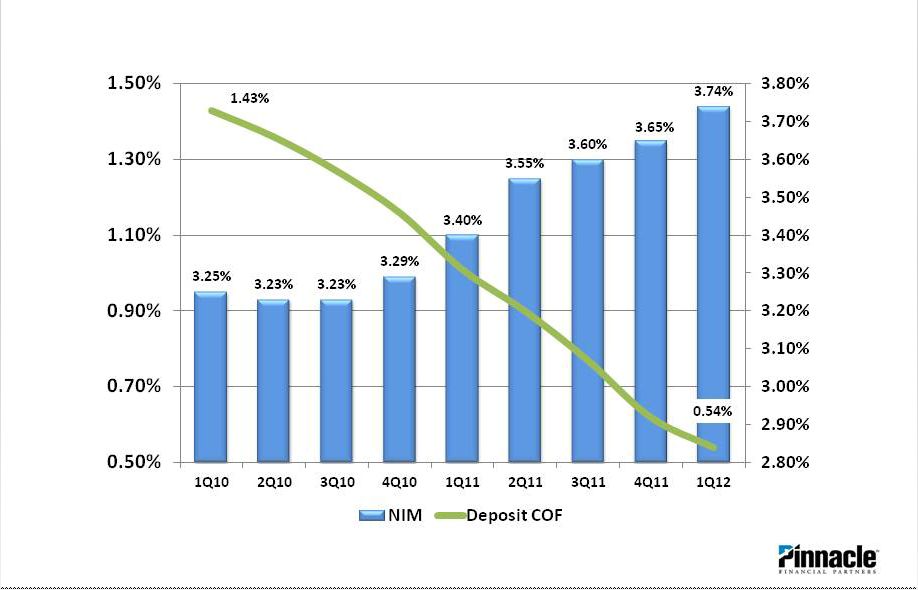 16 Building Core Earnings Capacity Reduction in Cost of Deposits is Driving Margin Expansion |
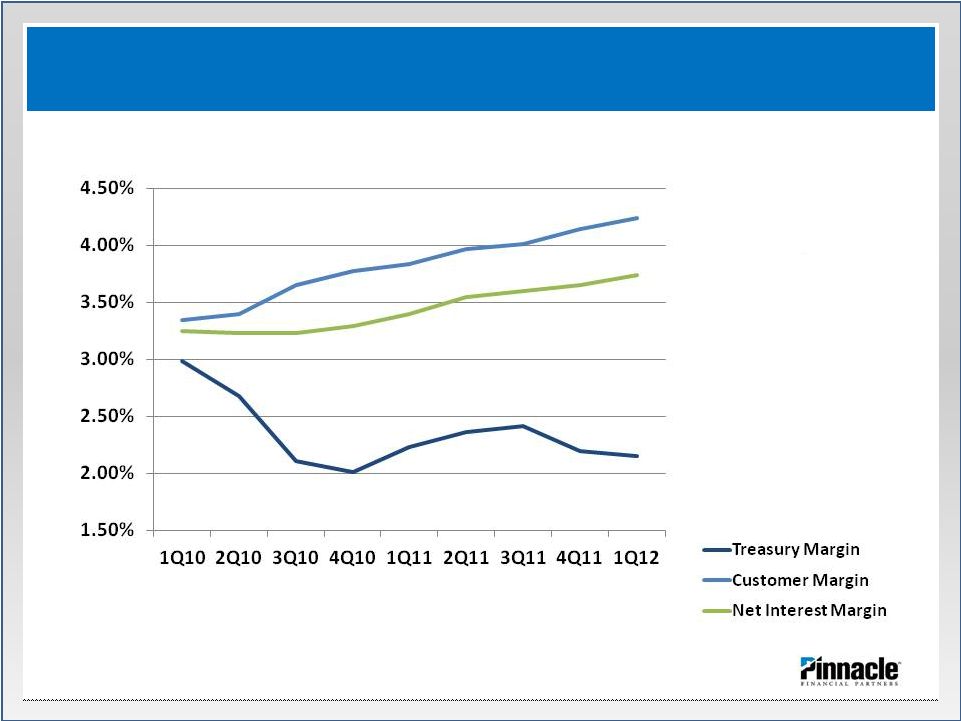   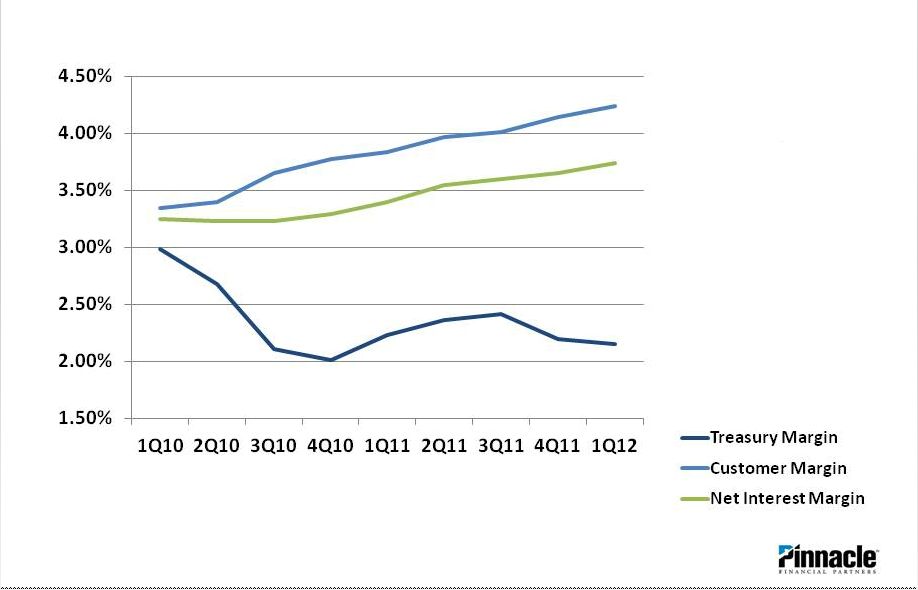  17 • Continued decline in our cost of funds help to drive up customer and overall margins • Loan volume growth key to deployment of low- cost funding resulting in margin expansion • Treasury margin down slightly due to mix changes and modest rise in LIBOR indexed funding Margin Improvement is Built on Success with Clients Building Core Earnings Capacity |
     • CD repricing opportunities - $148mm in Client CD’s maturing over next three months. Goal at renewal should be below or near average first quarter renewal rate (0.57%). 18 Average Renewal Rates Client CD’s – Avg. Rate (%) 4 th Quarter 2010 1.18% 1 st Quarter 2011 1.08% 2 nd Quarter 2011 1.02% 3 rd Quarter 2011 0.73% 4 th Quarter 2011 0.65% 1 st Quarter 2012 0.57% 2 nd Quarter 2012 Avg Maturing CD Rates 1.04% Building Core Earnings Capacity COF Reduction Opportunities Remain in Maturing CDs |
     • MMDA pricing opportunities - $228mm in MMDA accounts with current rates above 1.00%. Target rate should approximate 0.40% - 0.60%. 19 Avg Quarterly MMDA Rates Quarterly Reduction 4 th Quarter 2010 1.21% 0.15% 1 st Quarter 2011 1.04% 0.17% 2 nd Quarter 2011 0.95% 0.09% 3 rd Quarter 2011 0.81% 0.14% 4 th Quarter 2011 0.65% 0.16% 1 st Quarter 2012 0.53% 0.12% Continuing MMDA Rate Reduction Opportunity 5 – 10bp Building Core Earnings Capacity COF Reduction Opportunities Remain in MMDAs |
     Building Core Earnings Capacity Adjusted PTPP Expands 28.7% in 1Q12 over the same period prior year (000’s) 1Q12 4Q11 3Q11 2Q11 1Q11 4Q10 Net interest income $39,504 $39,293 $38,356 $37,795 $36,020 $36,056 Total noninterest income 9,949 9,727 10,080 9,809 8,324 8,666 Total revenue 49,453 49,020 48,436 47,604 44,344 44,722 Total noninterest expense 35,820 34,374 35,676 34,357 34,701 36,452 Pre-tax, pre-provision income 13,633 14,646 12,761 13,247 9,643 8,270 Adjustments to PTPP: (Gains) losses on sale of securities (114) (133) (377) (610) 159 - Other real estate expenses 4,676 4,193 5,079 3,826 4,334 7,874 Adjusted PTPP $18,195 $18,706 $17,462 $16,463 $14,136 $16,145 20 |
     Company Profile – Chapter 3 (2011 forward) • Growing balance sheet volumes • Continuing trends • Expanding capacity • Healthy markets • Expanding the margin • Redeeming the remainder of TARP |
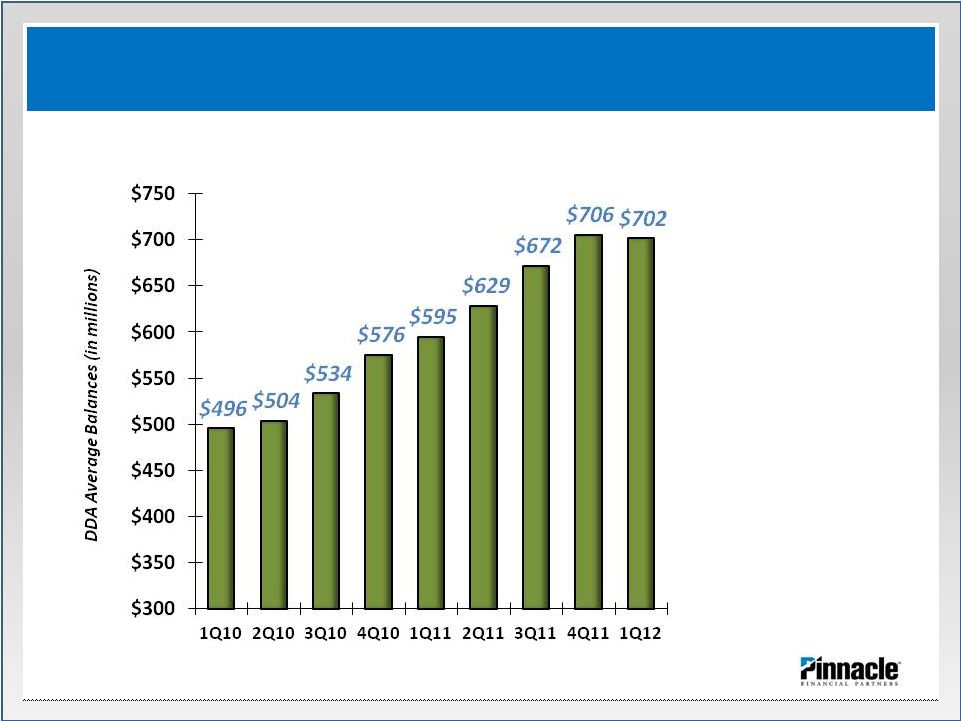   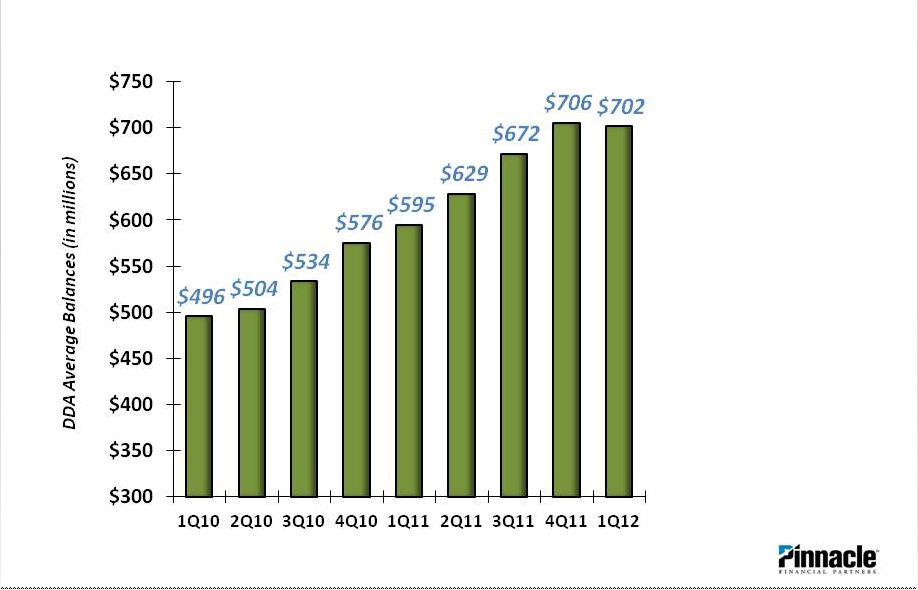  22 Growing Balance Sheet Volumes Positive DDA Trends Reflect an Ability to Gain Clients • Avg. account balances of DDAs are $17k per account compared to $17k last 3/31 • Number of accts up by 17% since March 31, 2011. |
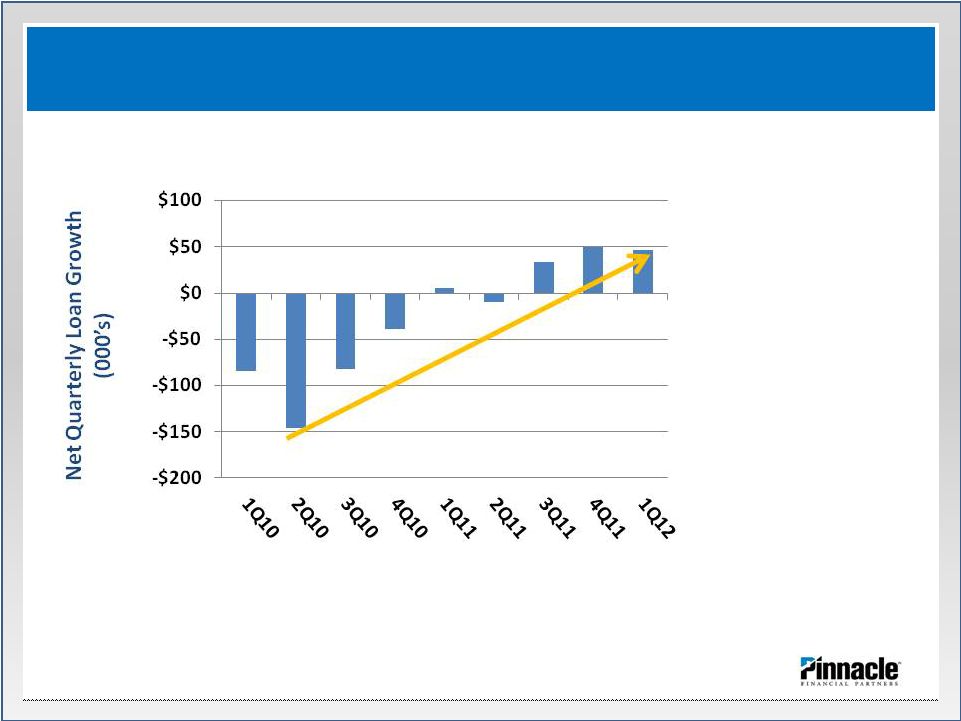    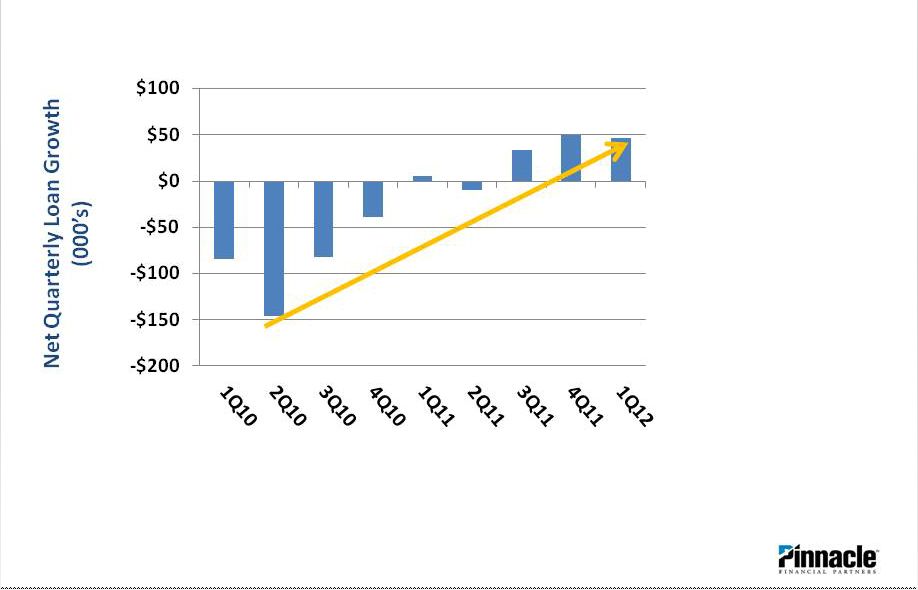 23 Growing Balance Sheet Volumes Growth Continues in Net Loan Volumes |
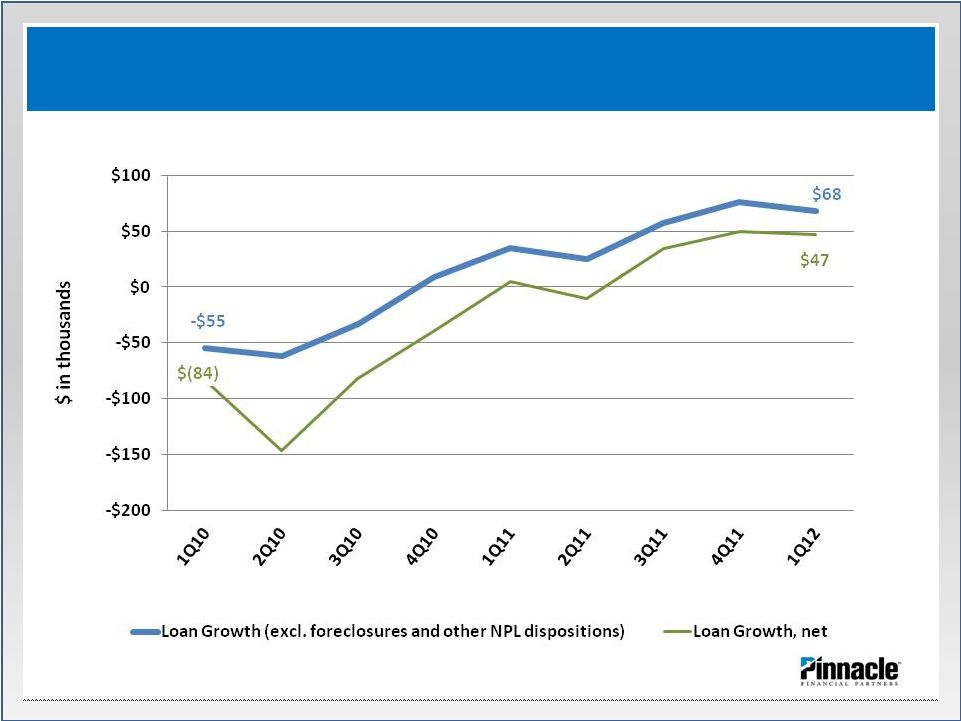    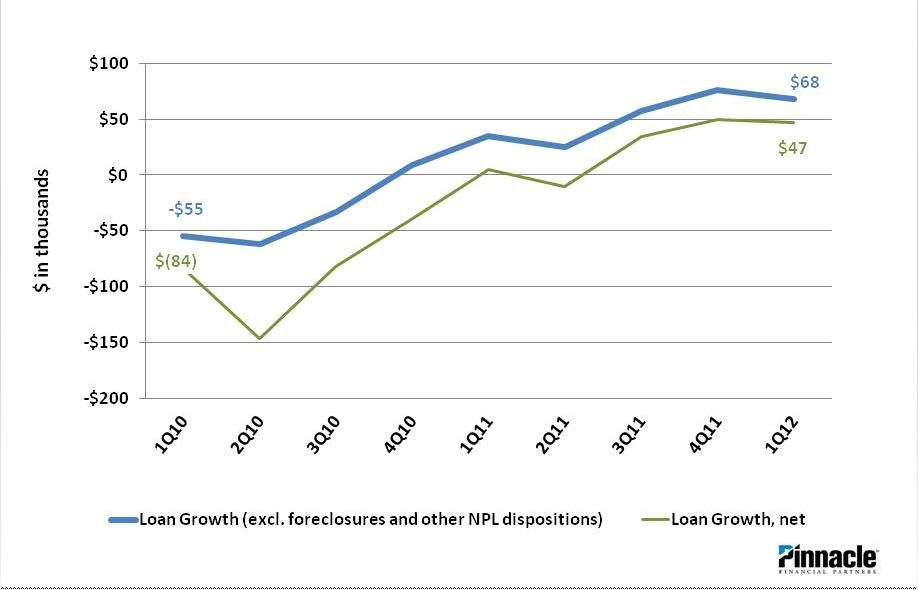 Growing Balance Sheet Volumes 24 NPL disposition impact on net loan growth decreasing |
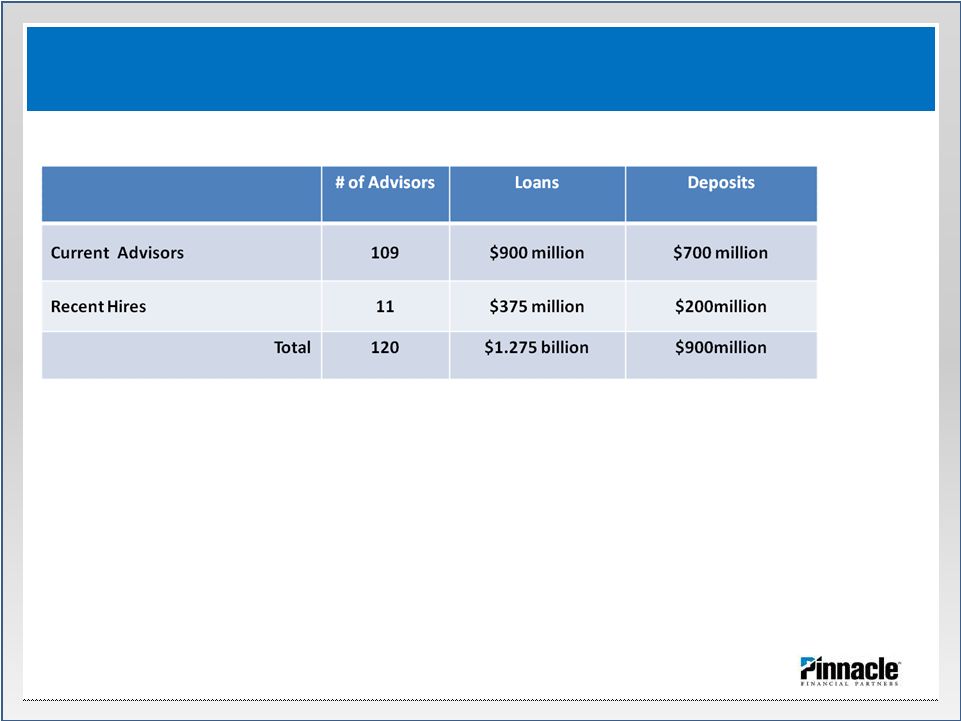   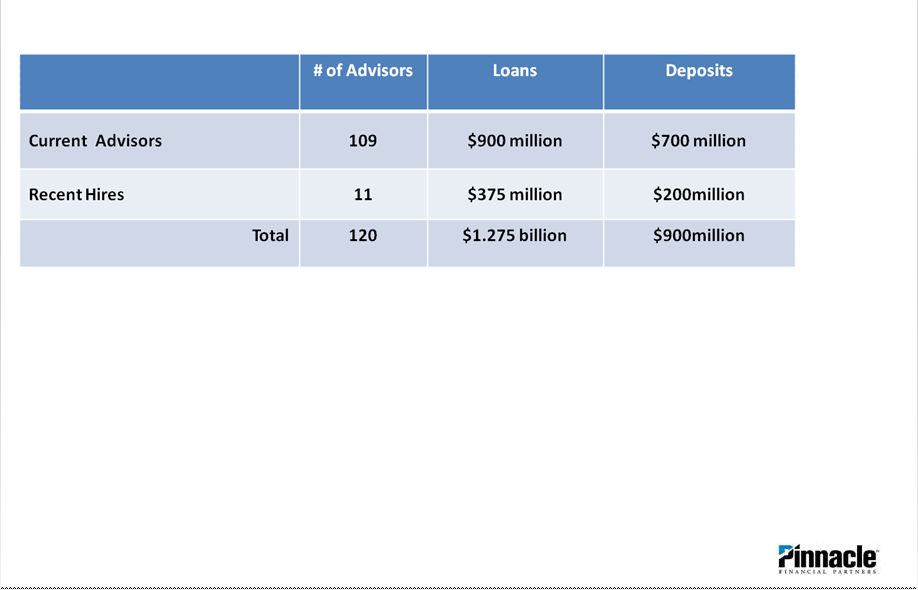  Enhancing our Capacity for Growth • Existing advisors should consolidate owners and employees of current business clients totaling $100 million in loans and $150 million in deposits. • Existing advisors are now in a position to continue the consolidation of previous clients approximating $800 million in loans and $550 million in deposits. • Recent hires should: – Consolidate previous clients totaling $100 million in loans and $100 million in deposits. – Build an indirect lending portfolio totaling $100 million in loans. (*) As of May, 2012. Originally disclosed on January 17, 2012. 25 Existing and New Advisors Have Capacity to Take Share (*) |
     Enhancing our Capacity for Growth “Pinnacle Financial Partners has recruited another experienced local lender, this one from Bank of America, as part of a big talent push launched last spring. His hiring comes a few weeks after Pinnacle scooped up a former SunTrust executive to market to law firms. The $5 billion downtown-based bank also has since the summer recruited senior lenders from JPMorgan, First Tennessee and others as part of a market-share push reminiscent of its early growth days.” Nashville Post April 16, 2012 26 |
     Expanding the margin 27 Longer Term Potential Margin Expansion Opportunities Exist 1Q 2012 Net Interest Margin 3.74% Opportunities: 1. Loan growth 0.01% to 0.02% 2. Continued reduction in COF 0.03% to 0.05% 3. NPA resolution 0.01% to 0.03% Potential Margin Range 3.79% to 3.84% Notes: 1. $200-$300 million increase in loan volumes at current market loan yields. 2. Considers a COF to a range of 0.55% to 0.60%. 3. Excluding impact of reversed interest, considers reduction in NPA levels to 1.50% of loans and ORE at spread of 2.50% to 4.00% on performing assets. |
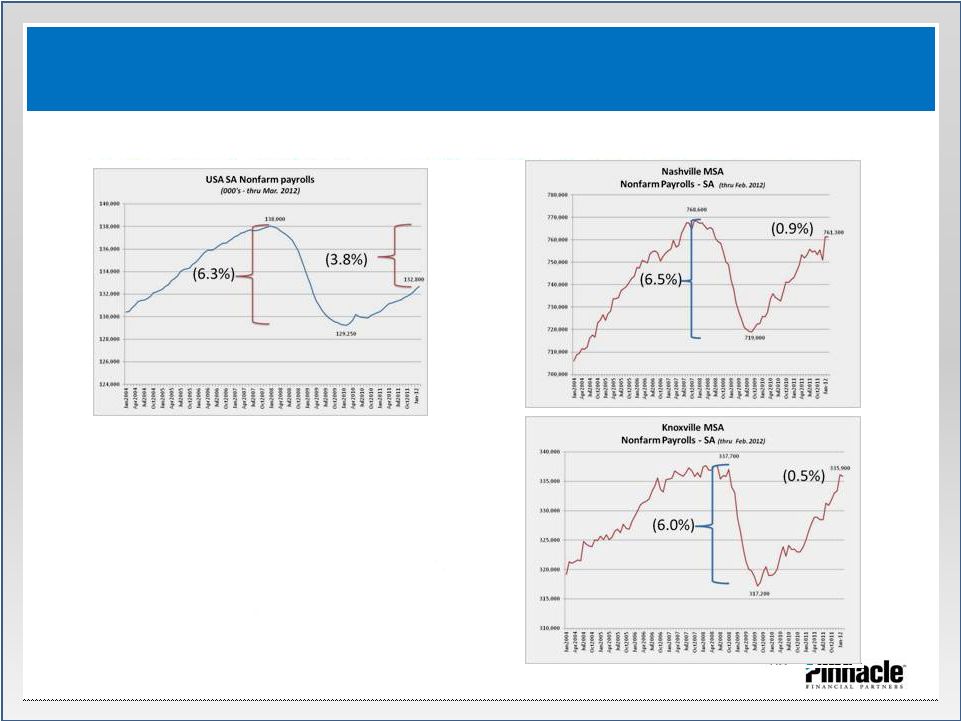    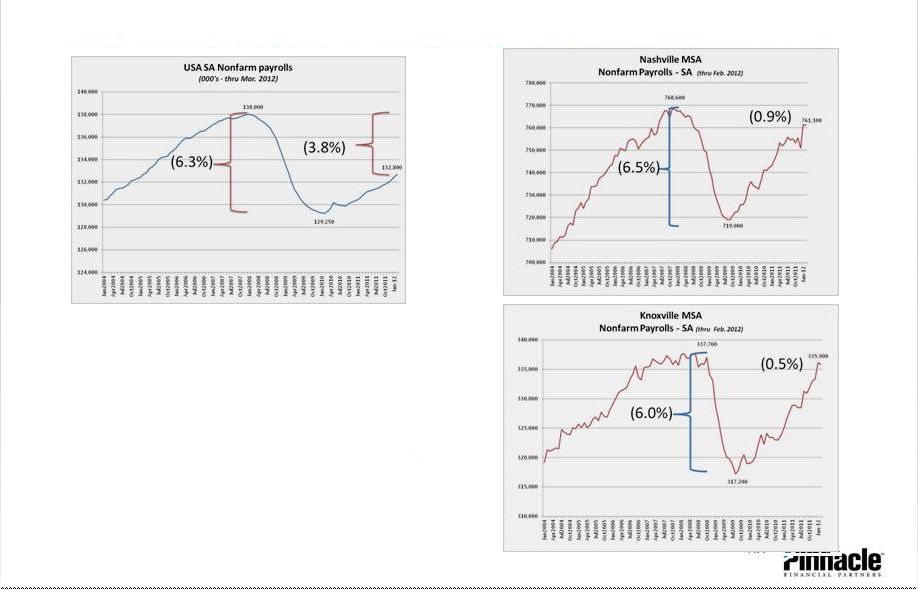 • USA job recovery of jobs lost since peak in early 2008 has amounted to almost 40.5%. • Nashville and Knoxville have almost replaced jobs lost. Healthy Markets 28 Source: BERC – MTSU & Bureau of Labor Statistics Nashville’s and Knoxville’s Job Recovery Outpaces the Nation |
     Strong Capital Should Eliminate or Limit Common Dilution 29 Redeeming the Remainder of TARP March 31, 2012 December 31, 2011 Tangible common equity 8.8% 8.4% Tangible common to risk weighted assets 10.3% 10.3% Tier 1 leverage 11.7% 11.4% Tier 1 risk based capital 14.0% 13.8% Total risk based capital 15.5% 15.3% Tangible Common Book Value per Common Share $11.50 $11.33 • PNFP maintains $41.3 million in cash at the bank holding company as of year end. • The Bank’s dividend capacity based on the last two years of results is $30.0 million. • The Bank’s dividend capacity in order to maintain 8% leverage and 12% total risk based capital is $81 million. |
     Redeeming the Remainder of TARP 30 At March 31 Tier 1 Capital $’s Tier 1 Leverage % Total Risk Based-Capital $’s Total RBC % PNFP capital $533,859 11.68% $590,859 15.45% Less: TARP (71,250) (71,250) Pro Forma capital 462,609 10.12% 519,609 13.55% (#) Per SNL, Publicly held TARP redeemers reporting leverage and/or total RBC ratio as of December 31, 2011 includes SBLF refinance transactions Strong Capital Should Eliminate or Limit Common Dilution Peer Comparisons (as of December 31, 2011) (#) Leverage Ratio Total RBC Median of approx. 160 TARP redeemers 10.1% 15.7% PNFP pro forma ratio per above 10.1% 13.5% - PNFP pro forma rank in peer group 50th Percentile 18th Percentile |
     Looking Forward 31 Management’s focus for 2Q12: Against the headwinds • Increasing lending opportunities • Core funding growth and reduced funding costs • Continued expansion of margin and net interest income • Continued improvement in asset quality metrics |
     Supplemental Information Wunderlich Securities Bank Forum Terry Turner, President and CEO Harold Carpenter, EVP and CFO Memphis, Tennessee May 17, 2012 |
 Supplemental Information 33 • Asset Quality 34 • Balance Sheet 48 • Income Statement 52 • Economic Conditions 57 Chart |
     Supplemental Information Asset Quality 34 |
     Comparison of 1Q12 to 4Q11, 1Q11 and 1Q10 Loan Categories 35 Amts. 1Q12 %’s 1Q12 Amts. 4Q11 %’s 4Q11 Amts. 1Q11 %’s 1Q11 Amts. 1Q10 %’s 1Q10 C&D and Land $281.6 8.4% $274.2 8.3% $300.7 9.3% $486.3 14.0% Consumer RE 688.8 20.6% 695.8 21.1% 698.7 21.7% 730.2 21.0% CRE – Owner Occ. 590.4 17.7% 582.0 17.7% 546.4 17.0% 545.6 15.7% CRE – Investment 491.7 14.7% 481.2 14.6% 509.7 15.8% 547.3 15.7% Other RE loans 41.6 1.3% 47.8 1.5% 46.4 1.5% 51.4 1.4% Total real estate 2,094.1 62.7% 2,081.0 63.2% 2,101.9 65.3% 2,360.8 67.8% C&I 1,180.6 35.4% 1,145.7 34.8% 1,047.7 32.6% 1,033.0 29.7% Other loans 63.2 1.9% 64.7 2.0% 67.8 2.1% 87.2 2.5% Total loans $3,337.9 100.0% $3,291.4 100.0% $3,217.4 100.0% $3,481.0 100.0% |
     (*) as a percentage of total loans Construction and Land Categories 36 Comparison of 1Q12 to 4Q11, 1Q11 and 1Q10 Amts. 1Q12 %’s(*) 1Q12 Amts. 4Q11 %’s(*) 4Q11 Amts. 1Q11 %’s(*) 1Q11 Amts. 1Q10 %’s(*) 1Q10 Residential – Spec $ 13.5 0.4% $ 12.4 0.4% $ 17.0 0.5% $ 39.0 1.1% Residential – Custom 9.7 0.3% 8.5 0.3% 11.0 0.4% 18.8 0.5% Residential – Condo 5.9 0.2% 5.8 0.2% 19.9 0.6% 37.9 1.1% Commercial Construct. 85.7 2.6% 74.6 2.3% 39.7 1.2% 57.5 1.6% Land Dev– Residential 64.0 1.9% 71.1 2.1% 97.5 3.0% 173.1 5.1% Land Dev – Commercial 83.1 2.5% 83.5 2.5% 99.8 3.1% 124.9 3.6% Land – Unspecified 19.7 0.5% 18.3 0.5% 15.8 0.5% 35.1 1.0% Total C&D $ 281.6 8.4% $ 274.2 8.3% $ 300.7 9.3% $ 486.3 14.0% |
     Construction and Land Categories 37 • At March 31, 2012 almost 22.4% of C&D book managed by Special Asset Group personnel, compared to 40.0% at March 31, 2011. • Almost 36.5% and 44.8% at March 31, 2012 and 2011, respectively, of land categories managed by SAG. Total Portfolio 1Q12 Total Portfolio 4Q11 Total Portfolio 1Q11 NPLs 1Q12 NPLs 4Q11 NPLs 1Q11 Performing Criticized 1Q12 Performing Criticized 4Q11 Performing Criticized 1Q11 Residential – Spec $ 13.5 $ 12.4 $ 17.0 $ 0.0 $ 0.0 $ 0.7 $1.7 $2.3 $6.6 Residential – Custom 9.7 8.5 11.0 0.0 0.0 0.0 0.0 0.0 0.2 Residential – Condo 5.9 5.8 19.9 0.0 0.0 7.7 0.5 0.5 1.2 Commercial Construct. 85.7 74.6 39.7 0.0 0.6 0.0 0.0 0.0 8.4 Land Dev– Residential 64.0 71.1 97.5 2.2 8.9 14.5 22.4 20.3 34.2 Land Dev – Commercial 83.1 83.5 99.8 3.4 3.0 13.7 30.9 31.6 30.5 Land – Unspecified 19.7 18.3 15.8 1.4 0.5 0.4 0.7 1.8 2.1 Total C&D $ 281.6 $ 274.2 $ 300.7 $ 7.0 $ 13.0 $ 37.0 $ 56.2 $ 56.5 $ 83.2 As a percentage of total C&D loans 2.5% 4.7% 12.3% 19.9% 20.6% 27.7% |
     Construction and Land Categories Analysis of Pass-rated AC&D loans • Pass rated credits have minimal past dues. Avg. ticket size of about $445,000. 38 Pass rated 1Q12 (*) Pass rated 4Q11 (*) Pass rated 1Q11 (*) Past due 1Q12 Past due 4Q11 Past due 1Q11 Pass to Fail During 1Q12 Pass to Fail During 4Q11 Pass to Fail During 1Q11 Residential – Spec $ 11.8 87.41% $ 10.0 80.65% $ 9.6 56.47% $ - $ - $ - $ - $ - $ - Resi. – Custom 9.7 100.00% 8.5 100.00% 10.9 99.09% - - - - - - Resi. – Condo 5.4 91.53% 5.3 91.38% 11.0 55.28% - - - - - - Commercial Constr. 85.7 100.00% 74.1 99.33% 31.3 78.84% - - - - - - Land Dev– Resi. 39.4 61.56% 42.0 59.07% 48.9 50.15% - - 0.3 - 0.2 0.8 Land Dev – Comm. 48.9 58.84% 49.0 58.68% 55.6 55.71% - - 0.1 - 7.6 0.9 Land – Unspecified 17.7 89.85% 16.1 87.98% 13.3 84.18% 0.1 - 0.1 - - - Total C&D $218.6 77.62% $205.0 74.76% $180.6 60.06% $ 0.1 $ - $ 0.5 $ - $ 7.8 $ 1.7 (*) Percentages represent pass rated to total balances for each category |
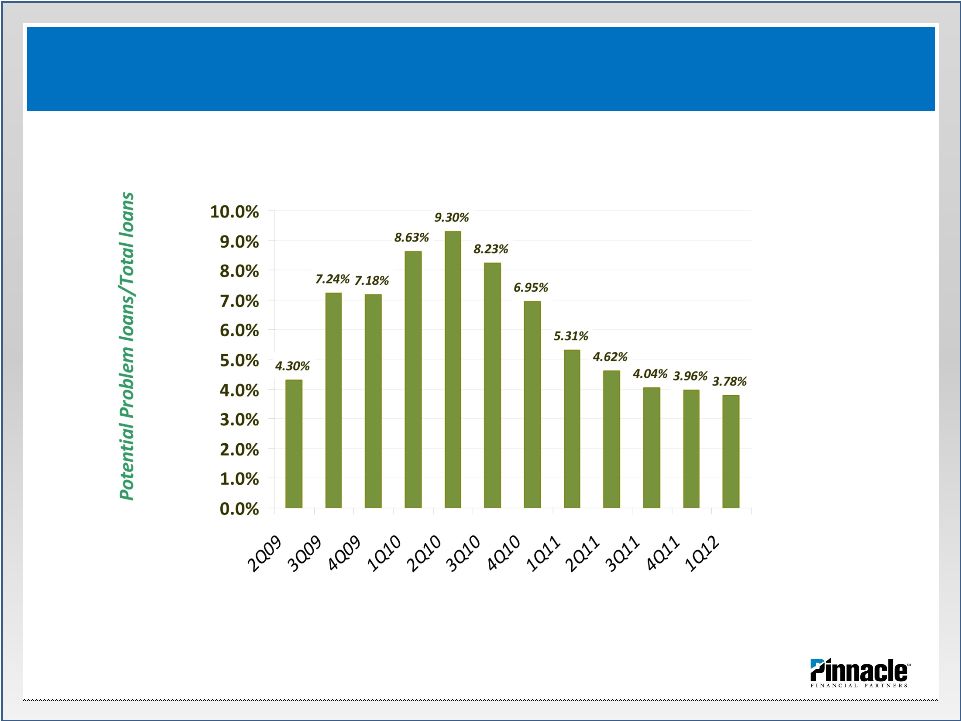   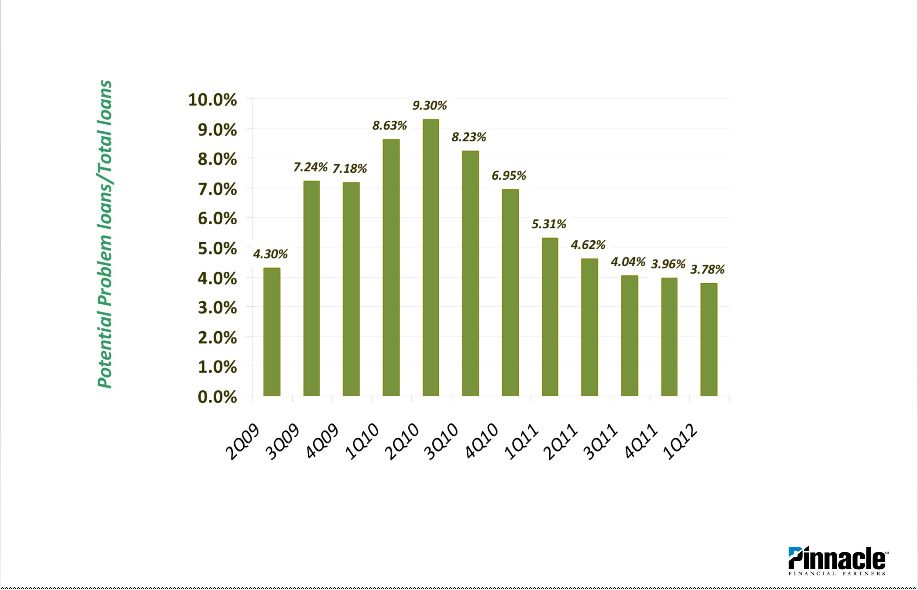  Potential Problem Loans Continue to Decline 39 Aggressively Dealing with Credit Issues Note: Classified loans (or loans with a credit weakness) that continue to accrue interest are considered potential problem loans. |
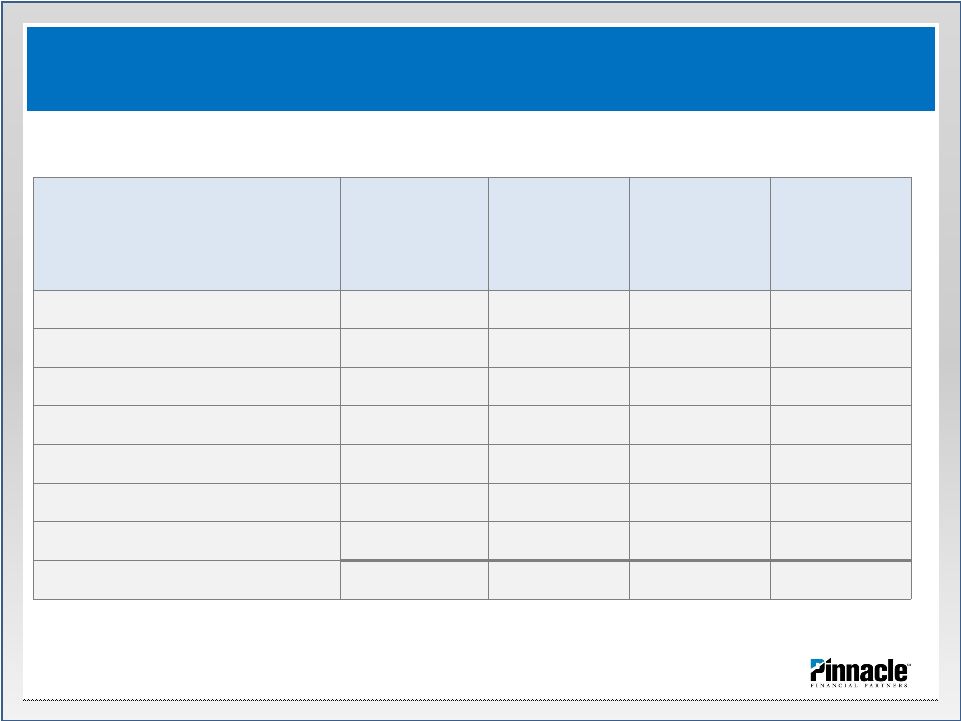     40 Aggressively Dealing with Credit Issues Classified Assets Decrease in 1Q12 Balances March 31, 2012 (dollars in thousands) Balances Dec. 31, 2011 (dollars in thousands) Balances March 31, 2011 (dollars in thousands) Balances March 31, 2009 (dollars in thousands) Classified loans and ORE: - Substandard commercial loans $ 179,040 $ 197,581 $ 255,990 $ 122,227 - Doubtful commercial loans 587 1,193 3,171 256 - Other impaired loans 3,185 2,875 3,090 - - 90 days past due and accruing (*) 821 858 1,151 3,871 - Other real estate 34,019 39,714 56,000 19,817 - Other repossessed assets 3 26 788 150 Total $ 217,655 $ 242,247 $ 320,190 $ 146,321 (*) Includes loans 90 days past due and accruing not included elsewhere |
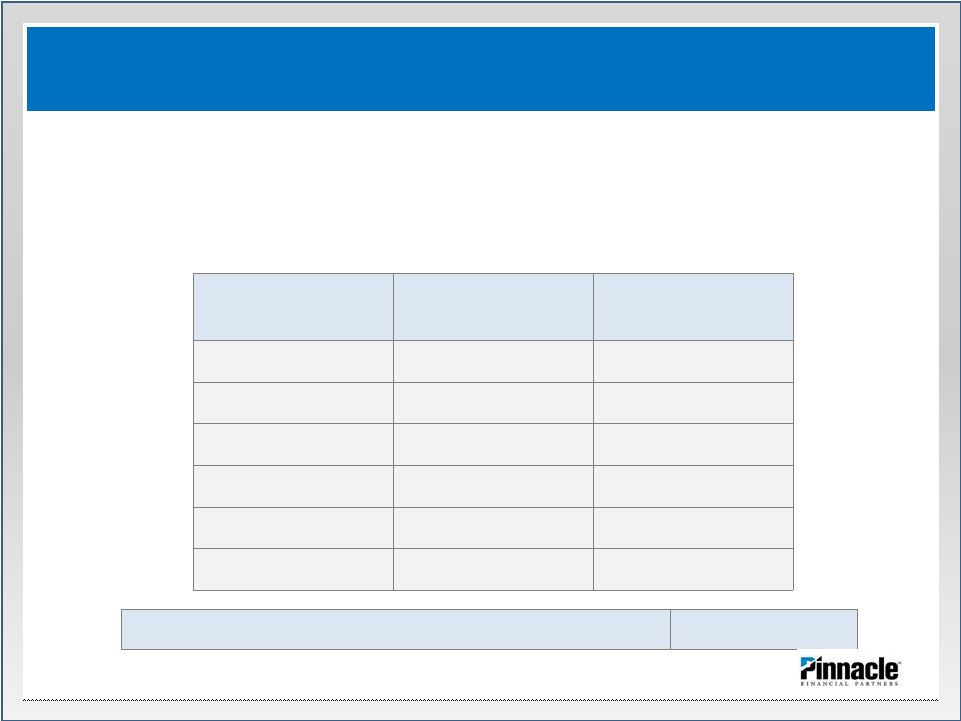
     (*) Uniform Bank Performance Report (Insured Commercial Banks with assets above $3 billion) NPLs Continue to Decline Ahead of Peers 41 Nonperforming Loan Trends NPLs Expressed as a % of Total Loans within Category PNFP NPLs and > 90 days 1Q12 PNFP NPLs and > 90 days 4Q11 PNFP NPLs and > 90 days 1Q2011 Peer NPLs and > 90 days (*) 4Q11 Const. and land development 2.48% 4.73% 12.30% 8.42% CRE – Owner Occupied 2.02% 1.16% 1.76% 2.26% CRE – Investment 1.04% 0.55% 0.04% 2.31% Total real estate 1.72% 1.71% 2.90% 3.04% C&I 0.61% 1.09% 1.51% 1.29% Total loans 1.31% 1.48% 2.41% 2.23% |
     Nonperforming Loans 42 • Largest NPLs • #1 - $3.8 million owner occupied commercial real estate • #2 - $3.4 million consumer real estate • #3 - $2.9 million commercial land development • #4 - $2.2 million consumer real estate • #5 - $1.7 million C&I • Top five represent 32.9% of NPL balances at March 31, 2012 • Approximately 90 accounts make up remaining NPLs |
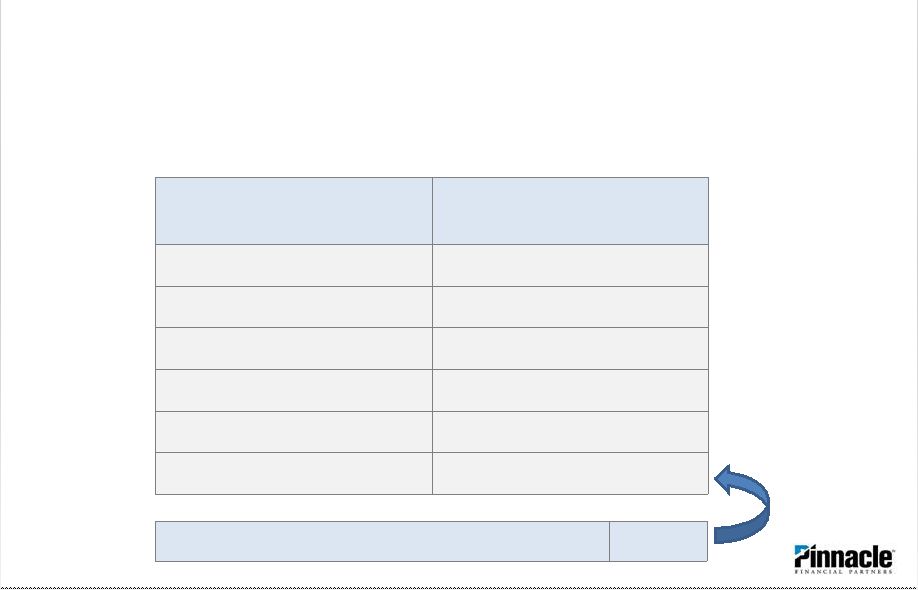
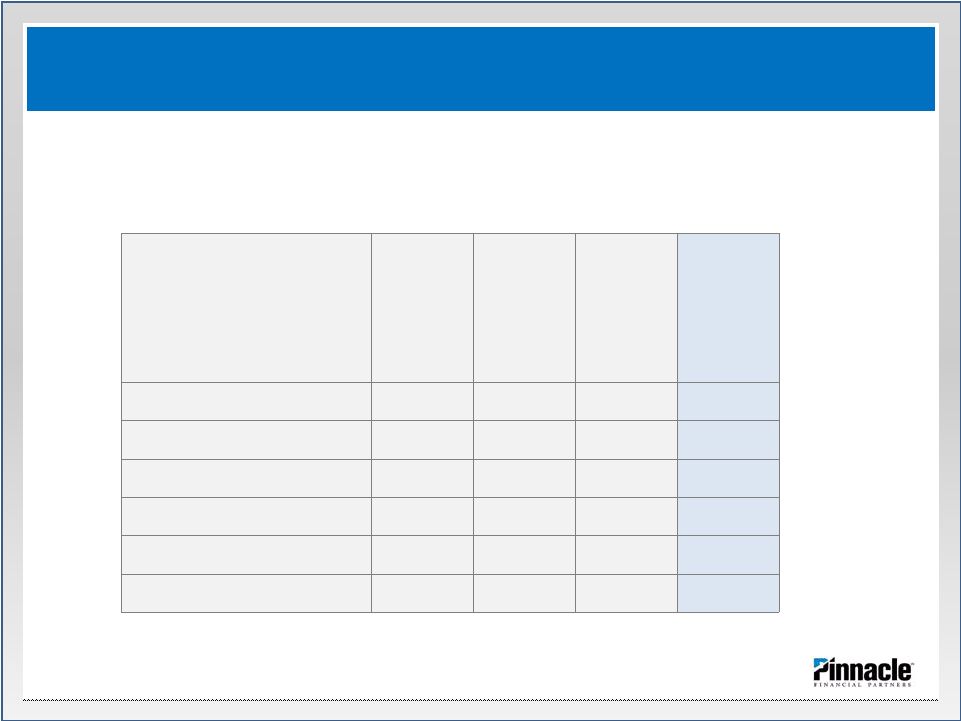
     43 Aggressively Dealing with Credit Issues ORE is 44.3% of NPAs with Resolution in Bank’s Control Balances March 31, 2012 (dollars in thousands) Fair value as a % of book value* Average Appraisal Age in Months ORE categories: New home construction/condo’s $ 371 140.1% 6.98 Developed lots 6,419 138.2% 4.27 Undeveloped land 20,527 133.2% 3.95 Other 6,701 116.6% 4.10 Total ORE $ 34,018 131.0% 4.25 Average age of ORE remains low at 11.6 months Largest ORE balance - $3.9M $4.4 million in contracts at April 17, 2012 * Excludes costs to sell |
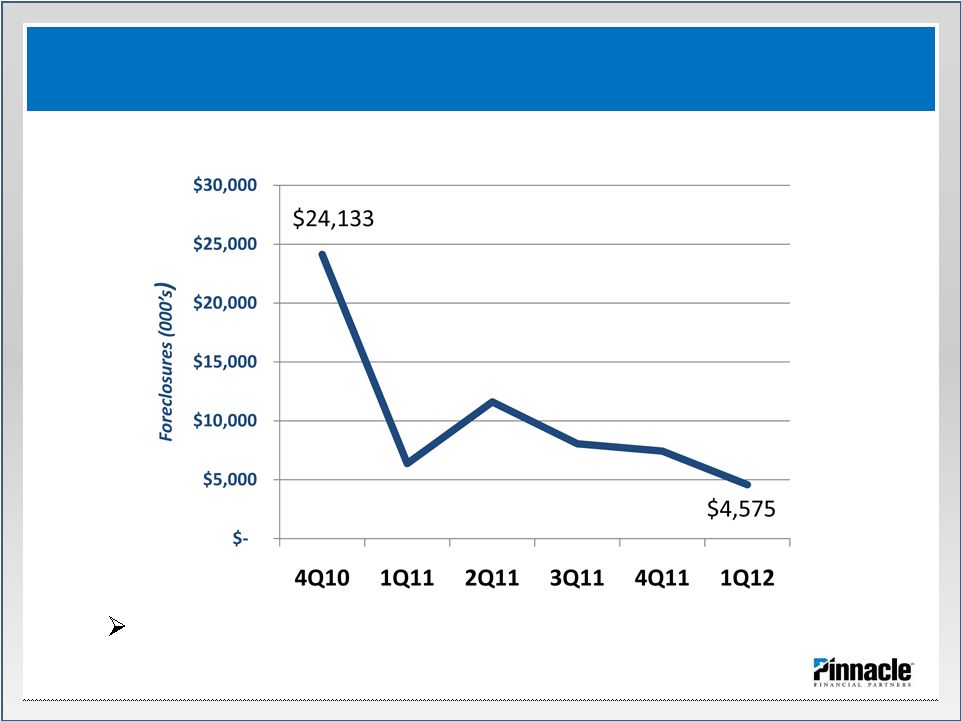    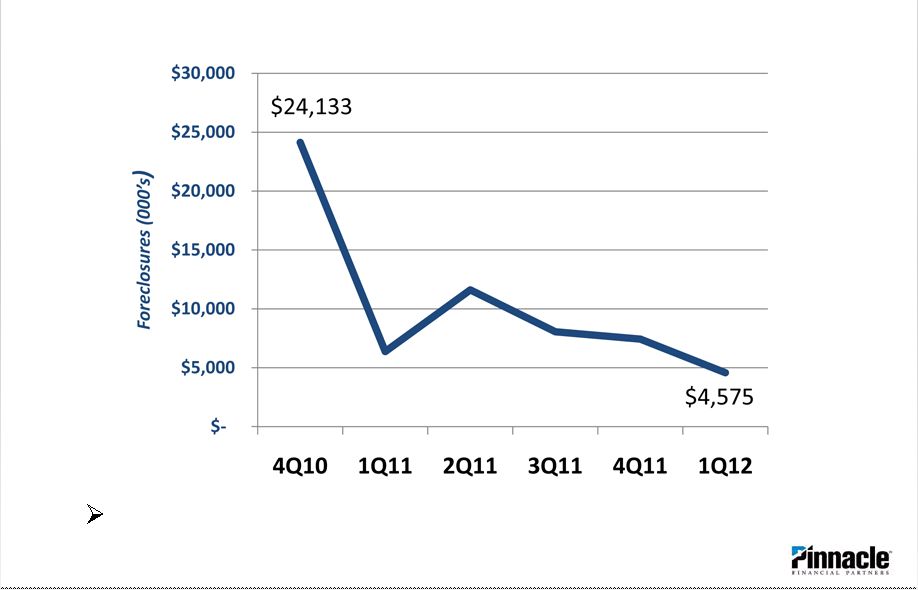 Aggressively Dealing with Credit Issues Q2 2012 foreclosures estimated at $6.0M 44 Foreclosure pace slowing significantly |
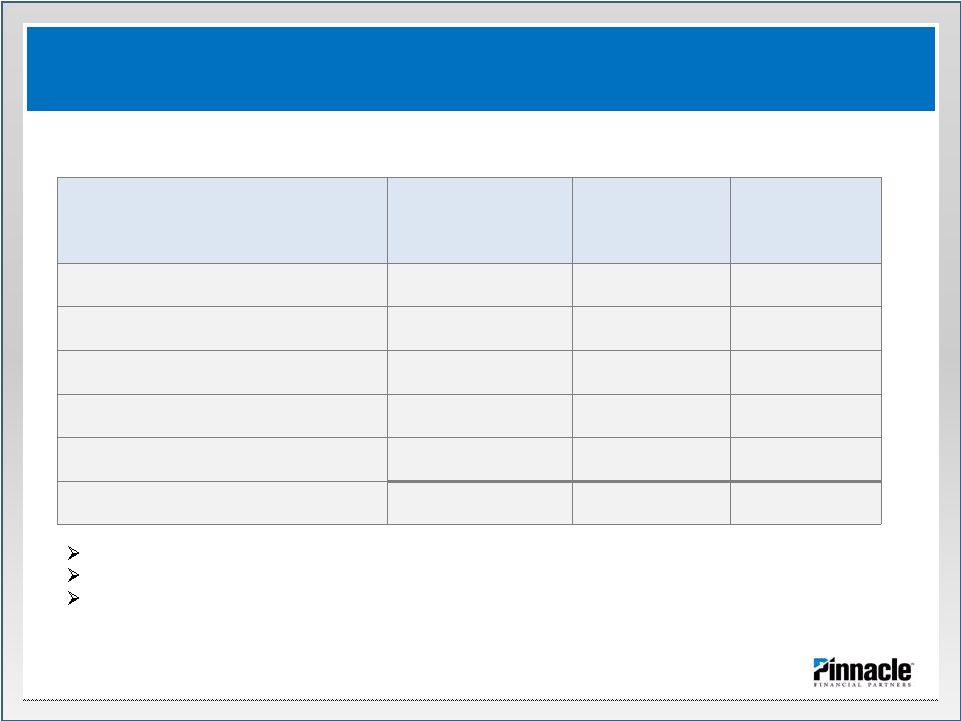
     OREO Properties 45 • Largest OREO Properties: • #1 - $3.9 million mixed-use development • #2 - $3.2 million residential development • #3 - $2.2 million residential development • #4 - $1.8 million residential development • #5 - $1.8 million residential developments • These balances make up 38% of the total OREO book at March 31, 2012 |
 Land Loan and Land Related ORE Locations > $250,000 properties, approx. $177.9 mm balances 46 86.2% 9.4% 4.4% Middle TN East TN Other |
     Net Charge-off’s 47 • Largest Charge-offs During 1Q12 • #1 - $0.9 million construction & land development • #2 - $0.5 million C&I • #3 - $0.3 million commercial real estate • #4 - $0.3 million C&I • #5 - $0.3 million C&I • These credits make up 62% of net charge offs for 1Q12 |
     Balance Sheet Supplemental Information 48 |
        Building Core Earnings Capacity 49 Funding is Almost Exclusively Relationship Based 3/31/2012 Percent 12/31/2011 Percent Core Funding: Non-interest bearing deposit accounts 756,909 18.70% 717,379 17.46% Interest-bearing deposit accounts 694,755 17.17% 637,203 15.51% Money Market accounts 1,497,843 37.01% 1,585,260 38.58% Time deposits less than $250,000 464,994 11.49% 501,705 12.21% Total Core Funding 3,414,501 84.37% 3,441,547 83.75% Non-core funding: Relationship based non-core funding: Time deposits greater than $250,000 Reciprocating time deposits 95,028 2.35% 108,507 2.64% Other time deposits 95,802 2.37% 104,284 2.54% Securities sold under agreements to repurchase 118,089 2.92% 131,591 3.20% Total relationship based non-core funding 308,919 7.63% 344,382 8.38% Wholesale funding: Time deposits greater than $250,000 Public funds - 0.00% - 0.00% Brokered deposits - 0.00% - 0.00% FHLB advances 226,032 5.59% 226,069 5.50% Federal funds purchased - 0.00% - 0.00% Subordinated debt 97,476 2.41% 97,476 2.37% Total wholesale funding 323,508 7.99% 323,545 7.87% Total non-core funding 632,427 15.63% 667,927 16.25% Totals 4,046,928 100.00% 4,109,474 100.00% |
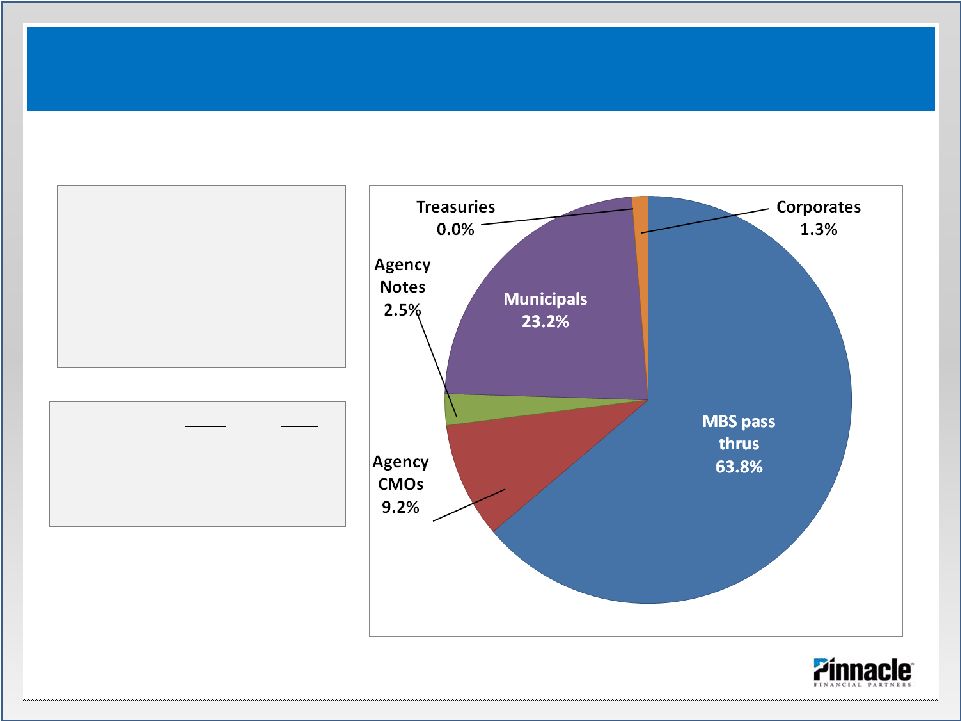    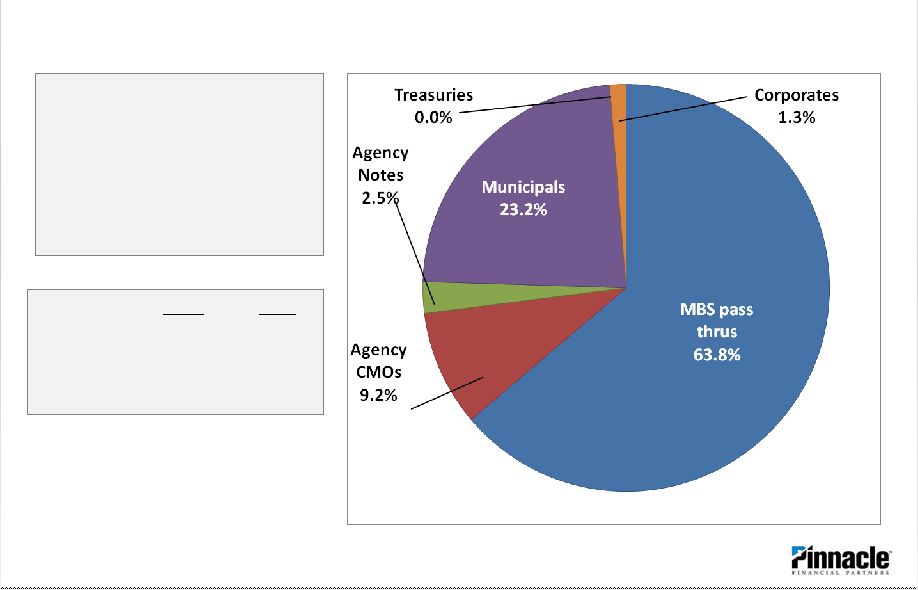 Conservative bond portfolio Investment Portfolio As of March 31, 2012 50 Average yield on bond portfolio = 3.30% (TEY) Average life = 4.34 years Effective Duration = 2.70% (millions) MTD QTD Purchases $ 15.0 $ 18.0 Sales ($ 14.4) ($ 14.4) Mat/Calls ($ 7.7) ($ 13.0) Pre-pays ($ 14.5) ($ 44.6) |
     Municipal portfolio Investment Portfolio 51 Location # of Issuances Balances % Tennessee 82 $43,939 22.4% Florida - - 0.0% California 4 1,544 0.8% Nevada - - 0.0% Michigan 14 6,236 3.2% Illinois 18 14,446 7.4% Other – 30 states 197 130,100 66.2% Totals 315 $196,265 100.0% As of March 31, 2012 Municipal Bond Portfolio Statistics 1Q12 1Q11 Weighted Average Life 5.9 years 7.7 years % State Agency Holdings 4.80% 5.80% Tax equivalent yield 4.90% 4.89% FMV as % of Cost 107.10% 102.30% All municipals are “A” rated or better. |
     Income Statement Supplemental Information 52 |
     53 Building Core Earnings Capacity Noninterest Income 1Q12 4Q11 3Q11 2Q11 1Q11 Service charges $ 2,324 $ 2,291 $ 2,362 $ 2,330 $ 2,261 Investment services 1,581 1,402 1,699 1,637 1,508 Insurance commissions 1,288 944 1,002 1,004 1,049 Net gains on mortgage loan sales 1,494 1,461 1,295 789 610 Trust fees 767 746 754 770 730 Other: Securities gains (losses) 114 133 377 610 (159) Other 2,323 2,750 2,591 2,668 2,325 Total noninterest income $ 9,890 $ 9,727 $10,080 $ 9,809 $ 8,324 Less: Securities (gains) losses (113) (133) (377) (610) 159 Core noninterest income $ 9,777 $ 9,594 $ 9,703 $ 9,199 $ 8,483 |
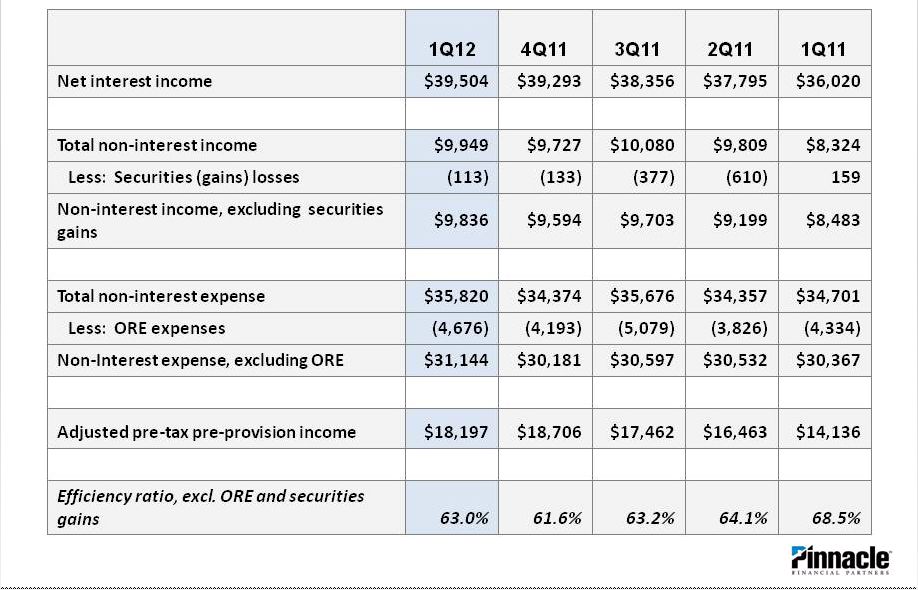
     54 Building Core Earnings Capacity First quarter expenses in line with expectations 1Q12 4Q11 3Q11 2Q11 1Q11 Salaries and benefits $17,762 $16,230 $15,951 $15,870 $16,985 Incentive expense 2,031 2,733 3,065 2,654 938 Equipment and occupancy 4,374 4,977 4,943 5,060 5,007 Other real estate owned 4,676 4,193 5,079 3,826 4,334 Marketing and BD 785 1,032 751 766 754 Supplies and postage 563 576 509 545 490 Intangible amortization 686 716 715 716 716 Other expenses 4,943 3,917 4,663 4,921 5,477 Total noninterest expense $35,820 $34,374 $35,675 $34,357 $34,701 Efficiency ratio 72.4% 70.1% 73.7% 72.2% 78.3% Total noninterest expense – excluding other real estate $31,144 $30,181 $30,597 $30,532 $30,367 Efficiency ratio, excl. ORE and securities gains 63.0% 61.6% 63.2% 64.1% 68.5% |
     Non-GAAP Financial Measures – Net Interest Margin – 55 1Q12 4Q11 3Q11 2Q11 1Q11 Avg. net earning assets $4,316,973 $4,347,352 $4,308,710 $4,347,552 $4,387,331 Net interest income $39,504 $39,293 $38,356 $37,795 $36,020 Impact of tax exempt instruments 0.06% 0.06% 0.07% 0.06% 0.07% Net interest margin 3.74% 3.65% 3.60% 3.55% 3.40% Impact from reduced NPL’s ** $318 $591 $814 $850 $1,031 Quarterly interest reversals from new NPLs ** $155 $271 $279 $225 $481 Net interest margin with negative impact of NPL’s $39,977 $40,155 $39,449 $38,869 $37,533 NIM excluding NPL Impact 3.79% 3.73% 3.70% 3.65% 3.54% ** Assumes a 1.50% limitation for NPL’s and ORE to Total loans and ORE, that resulting earning assets earn at the average earning asset yield for each quarter and considers aggregate amount of interest reversals for loans placed on nonaccrual during quarter are reversed. |
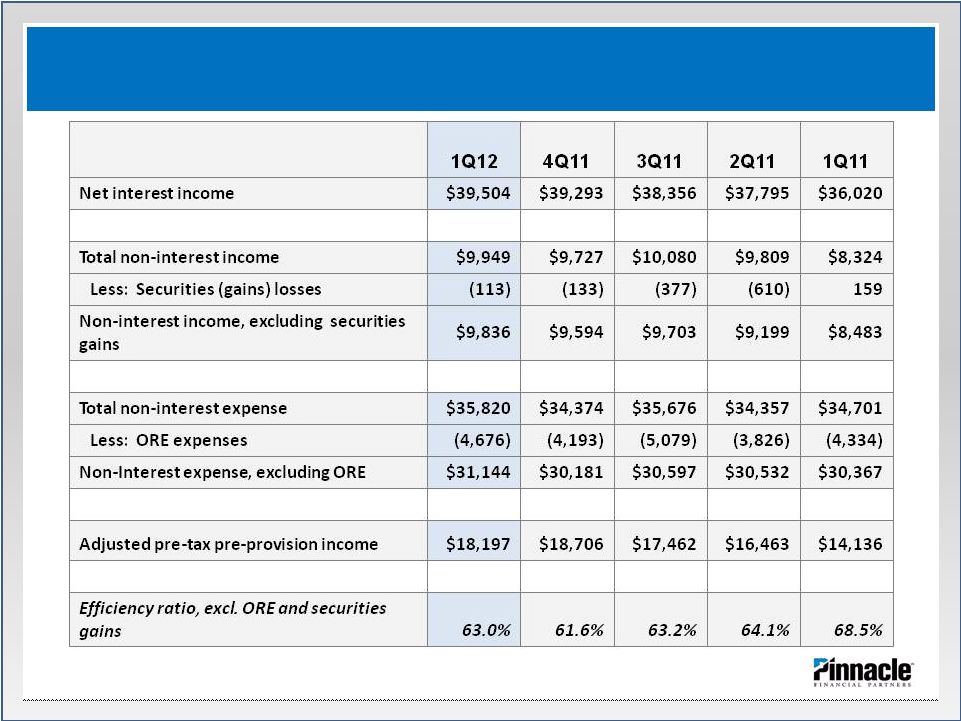     Non-GAAP Financial Measures – Efficiency Ratio 56 |
     Economic Conditions Supplemental Information 57 |
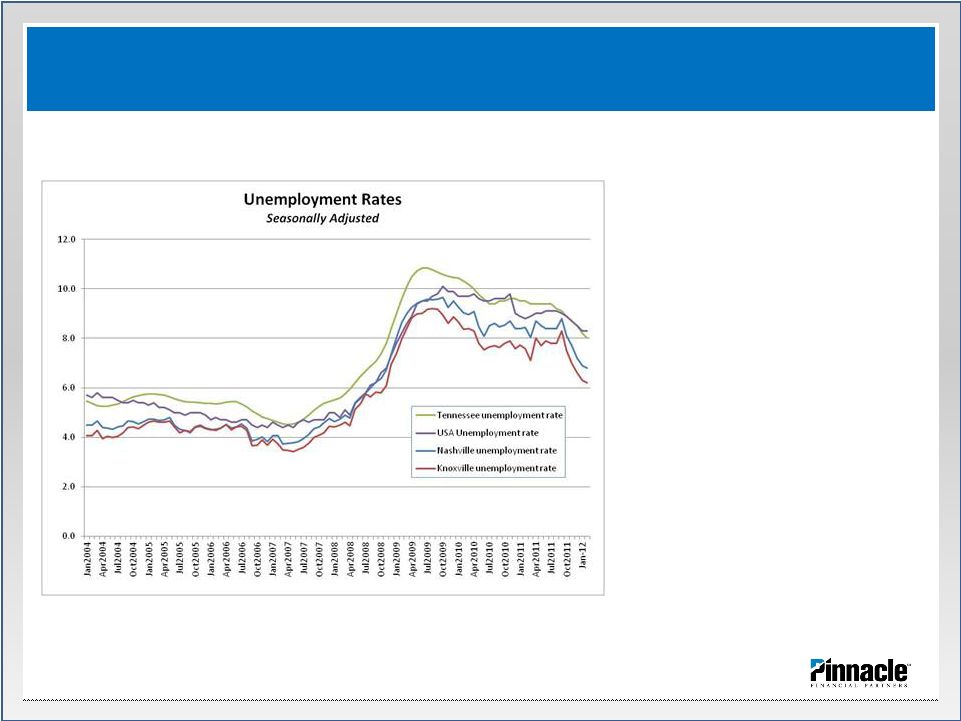   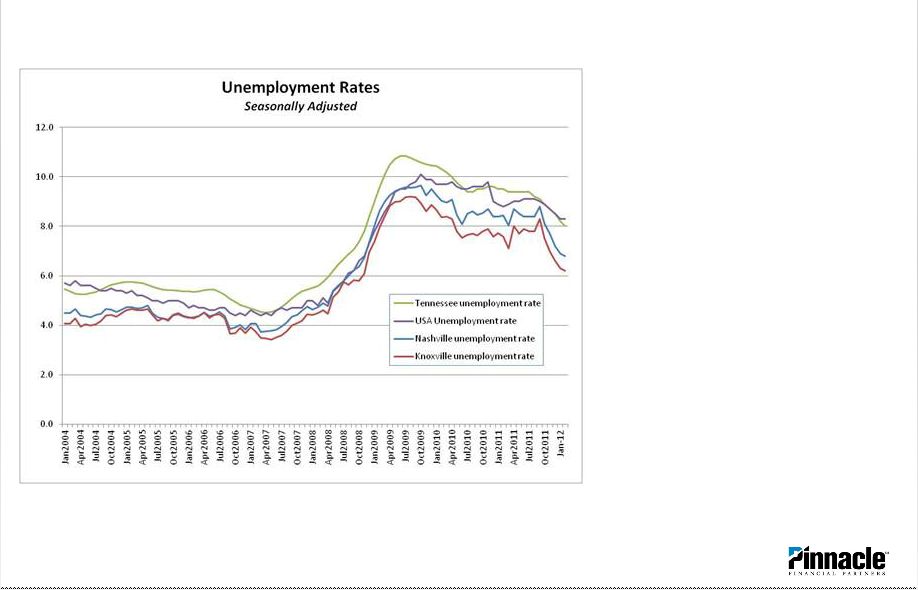  • Both Nashville and Knoxville continue to outperform at 6.8% and 6.2%, respectively. • State of Tennessee unemployment approximates USA unemployment. Unemployment Trends 58 Source: BERC – Middle Tennessee State University & Bureau of Labor Statistics |
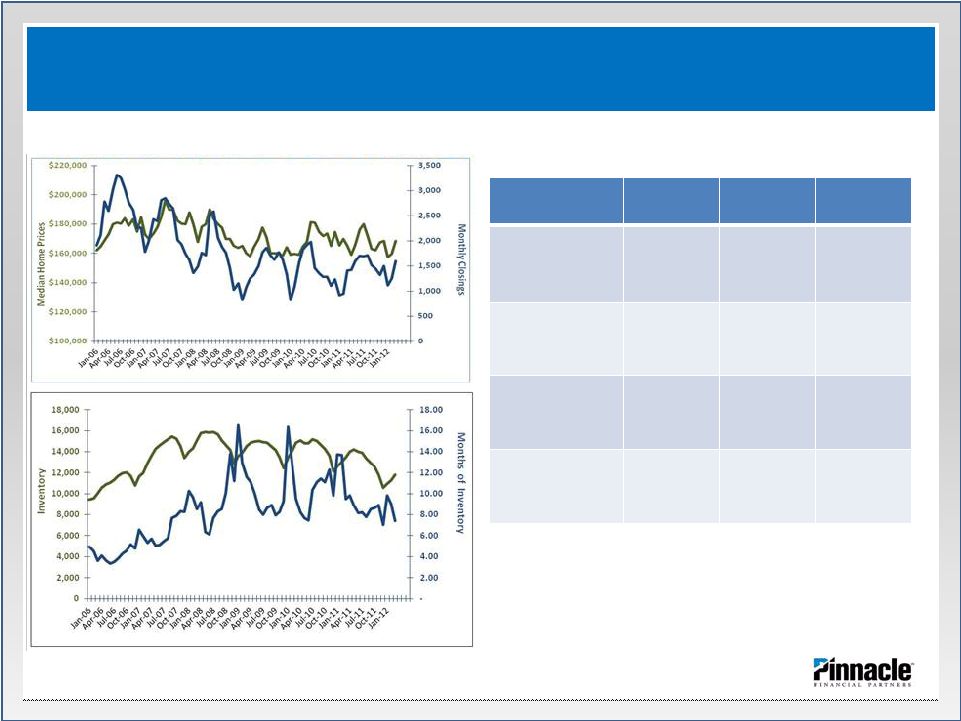    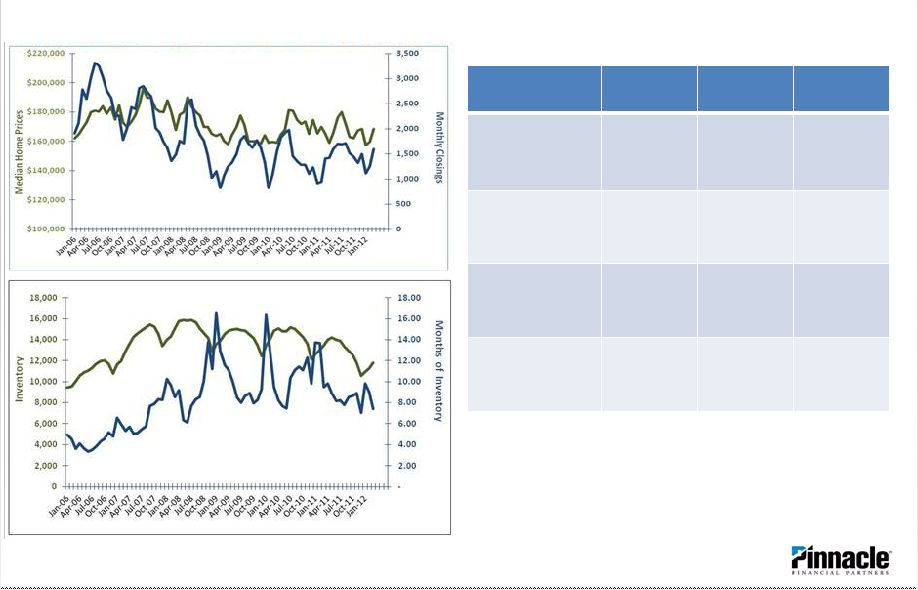 Nashville Residential Real Estate Market 59 Source: GNAR.org – Residential home activity through 3/12 (*) Months of Inventory calculated by dividing month end inventory by monthly closings Nashville’s Real Estate Market Continues to Improve 1Q 2012 1Q 2011 % Change Avg. Qtrly. Median Home Price $161,967 $166,800 (2.9%) Quarterly Closings 3,959 3,283 20.6% Quarter end Inventory 11,787 13,465 (12.5%) Months of Inventory (*) 7.4 9.5 (22.3%) |
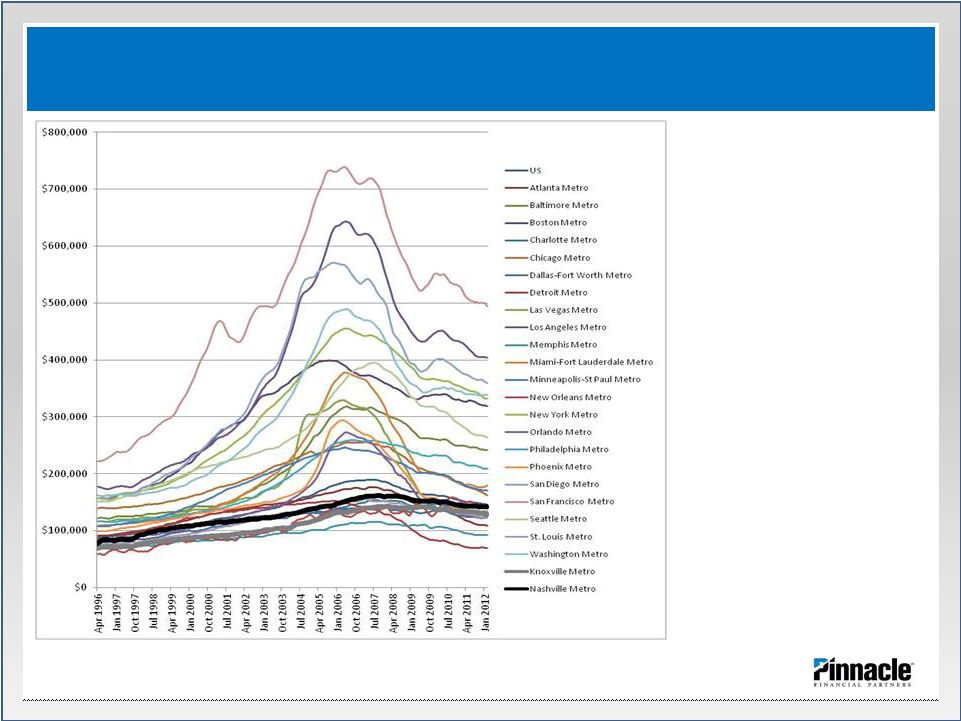    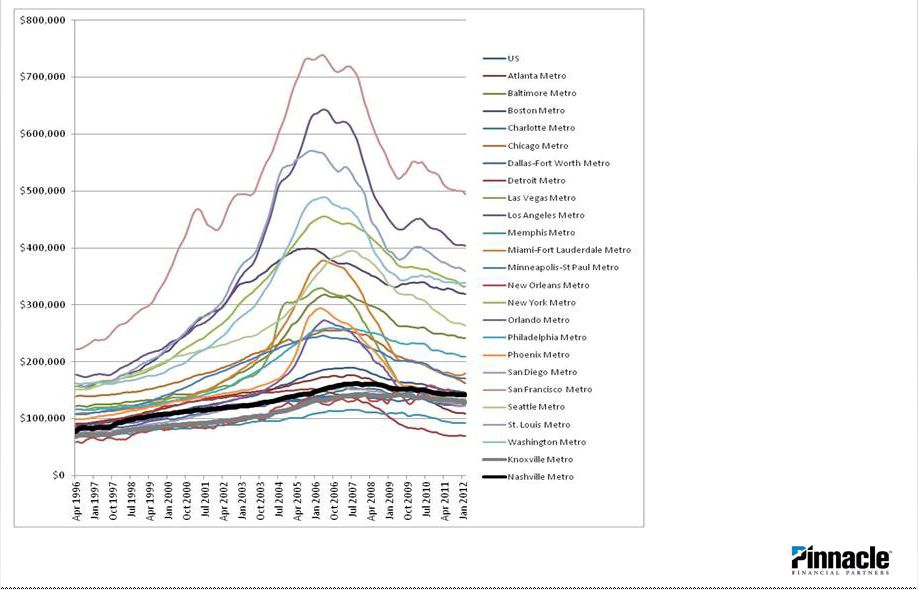 • Zillow.com Home Value Index (i.e., “Zestimate”) trends 1/2000 thru 2/2012 for single family homes. • Chart compares volatility in home prices in Nashville and Knoxville to select other US markets. • As we have mentioned numerous times, similar to many other smaller markets, Nashville and Knoxville did not experience the volatility in home prices that other larger markets experienced. Residential Real Estate Trends 60 Source: Zillow.com – Zestimate - a calculation from Zillow.com representing median home prices for various markets. |
     Vacancy Rates *Costar **REIS *** 12/31/11 Commercial Real Estate 61 Nashville CRE Vacancy Rates National CRE Vacancy Rates Q1 2012(*) YE 2011 (*) YE 2010 (*) YE 2009 (**) YE 2008 (**) YE 2007 (**) Q1 2012 (*) Industrial / Warehouse 10.0% 10.1% 10.2% 10.6% 9.6% 8.9% 9.4% Multifamily 7.2(***) 6.6% 6.7% 9.6% 7.6% 5.2% 6.6%(***) Retail 7.1% 7.3% 6.7% 8.1% 6.3% 7.0% 6.9% Office 9.6% 9.7% 10.6% 12.7% 10.5% 10.5% 12.3% |
     Wunderlich Securities Bank Forum Terry Turner, President and CEO Harold Carpenter, EVP and CFO Memphis, Tennessee May 17, 2012 |