Exhibit 99.2
|
Expansion into Chattanooga, TN
Acquisition of CapitalMark Bank & Trust
M. Terry Turner, President and CEO Harold R. Carpenter, EVP and CFO
April 8, 2015
|
Safe Harbor Statement
All statements, other than statements of historical fact included in this presentation, are forward?looking statements within the meaning of Section 27A of the Securities Act of 1933, as amended, and Section 21E of the Securities Exchange Act of 1934, as amended. The words “expect,” “anticipate,” “intend,” “plan,” “believe,” “seek,” “estimate” and similar expressions are intended to identify such forward?looking statements, but other statements not basedonhistorical information mayalsobe considered forward?looking including statements about the benefits to Pinnacle Financial Partners, Inc. (“Pinnacle”) of the proposed merger transaction, Pinnacle’s future financial and operating results (including the anticipated impact of the merger on Pinnacle’s earnings and tangible book value) and Pinnacle’s plans, objectives and intentions. All forward?looking statements are subject to risks, uncertainties and other facts that may cause the actual results, performance or achievements of Pinnacle to differ materially from any results expressed or implied by such forward?looking statements. Such factors include, among others, (1) the risk that the cost savings and any revenue synergies from the merger may not be realized or take longer than anticipated to be realized, (2) disruption from the merger with customers, suppliers or employee relationships, (3) the occurrence of any event, change or other circumstances that could give rise to the termination of the merger agreement, (4) the risk of successful integration of the two companies’ businesses, (5) the failure of CapitalMark’s shareholders to approve the merger, (6) the amount of the costs, fees, expenses and charges related to the merger, (7) the ability to obtain required governmental approvals of the proposed terms of the merger, (8) reputational riskand thereaction of the parties’ customers to the proposed merger, (9) the failure of the closing conditions to be satisfied, (10) the risk that the integration of CapitalMark’s operations with Pinnacle’s will be materially delayed or will be more costly or difficult than expected, (11) the possibility that the merger may be more expensive to complete than anticipated, including as a result of unexpected factors or events, (12) the dilution caused by Pinnacle’s issuance of additional shares of its common stock in the merger and (13) general competitive, economic, politics of and market conditions. Additional factors which could affect the forward looking statements can be found in Pinnacle’s Annual Report on Form 10?K, Quarterly Reports on Form 10?Q, and Current Reports on Form 8?K filed with or furnished to the Securities and Exchange Commission (the “SEC”) and available on the SEC’s website at http://www.sec.gov. Pinnacle and CapitalMark Bank &Trust (“CapitalMark”) disclaim any obligation to update or revise any forward?looking statements contained in this presentation which speak only as of the date hereof, whether as a result of new information, future events or otherwise.
Additional Information and Where to Find It
In connection with the proposed merger, Pinnacle intends to file a registration statement on Form S?4 with the SEC to register the shares of Pinnacle common stock that will be issued to CapitalMark’s shareholders in connection with the transaction. The registration statement will include a proxy statement/prospectus (that will be delivered to CapitalMark’s shareholders in connection with their required approval of the proposedmerger) andother relevant materialsinconnectionwiththe proposed merger transaction involving Pinnacle Bank and CapitalMark.
INVESTORS AND SECURITY HOLDERS ARE ENCOURAGED TO READ THE PROXY STATEMENT/PROSPECTUS WHEN IT BECOMES AVAILABLE AND ANY OTHER RELEVANT DOCUMENTS TO BE FILED WITH THE SEC IN CONNECTION WITH THE PROPOSED TRANSACTION BECAUSE THEY WILL CONTAIN IMPORTANT INFORMATION ABOUT PINNACLE, CAPITALMARK AND THE PROPOSED TRANSACTION.
Investors and security holders may obtain free copies of these documents once they are available through the website maintained by the SEC at http://www.sec.gov. Free copies of the proxy statement/prospectus also may be obtained by directing a request by telephone or mail to Pinnacle Financial Partners Inc., 150 3rd Avenue South, Suite 980, Nashville, TN 37201, Attention: Investor Relations (615) 744?3742 or CapitalMark, 801 Broad St., Chattanooga, TN 37402, Attention: Investor Relations (423) 386?2828.
This communication shall not constitute an offer to sell or the solicitation of an offer to buy securities, nor shall there be any sale of securities in any jurisdictioninwhich such offer, solicitation or sale would be unlawful prior to registration or qualification under the securities laws of such jurisdiction.
2
|
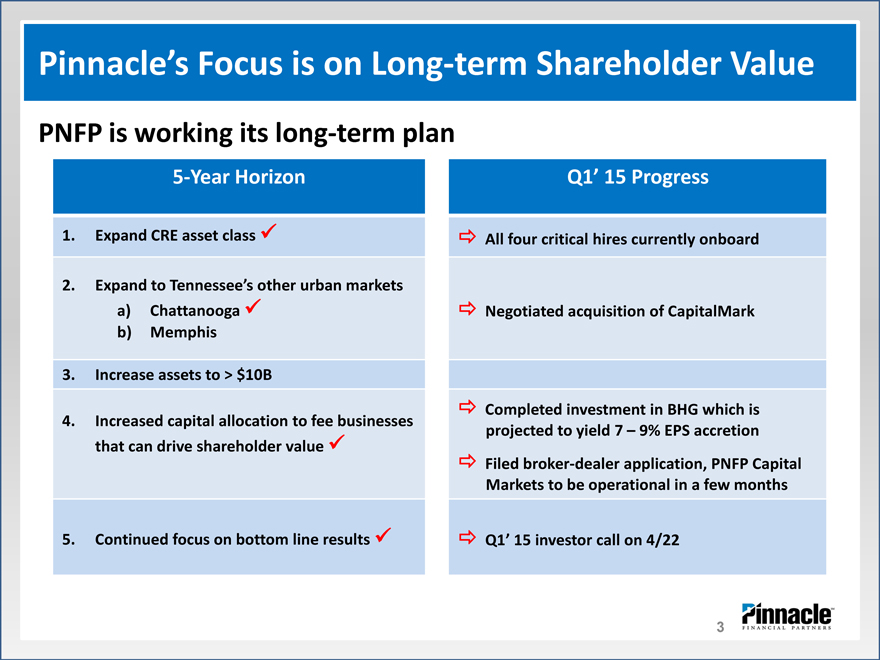
Pinnacle’s Focus is on Longterm Shareholder Value
PNFP is working its longterm plan
5Year Horizon Q1’ 15 Progress
1. Expand CRE asset class All four critical hires currently onboard
2. Expand to Tennessee’s other urban markets a) Chattanooga Negotiated acquisition of CapitalMark b) Memphis
3. Increase assets to > $10B
Completed investment in BHG which is
4. Increased capital allocation to fee businesses projected to yield 7 – 9% EPS accretion that can drive shareholder valueFiled broker?dealer application, PNFP Capital Markets to be operational in a few months
5. Continued focus on bottom line resultsQ1’ 15 investor call on 4/22
3 |
|
|
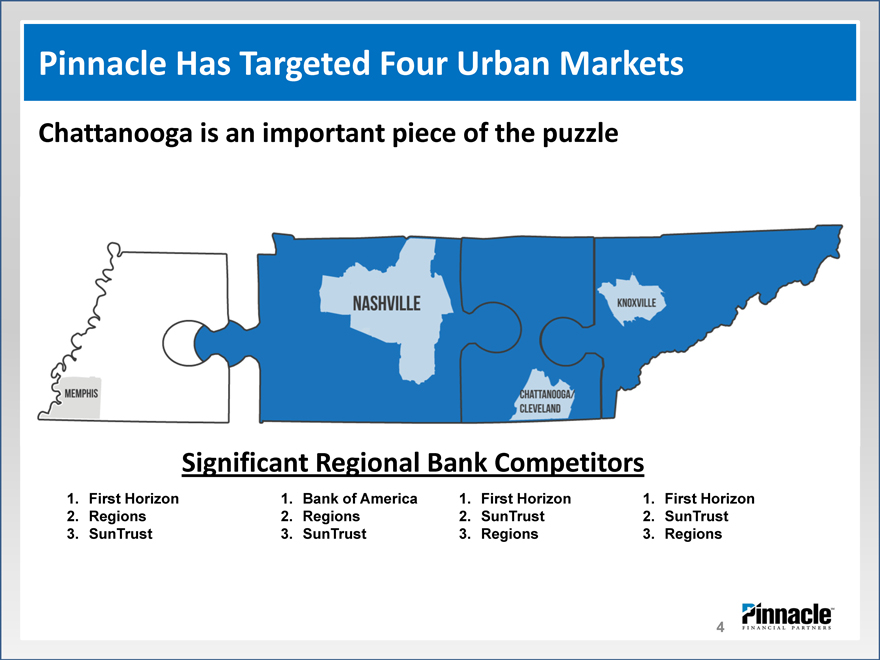
Pinnacle Has Targeted Four Urban Markets
Chattanooga is an important piece of the puzzle
Significant Regional Bank Competitors
1. First Horizon 1. Bank of America 1. First Horizon 1. First Horizon
2. Regions 2. Regions 2. SunTrust 2. SunTrust
3. SunTrust 3. SunTrust 3. Regions 3. Regions
4 |
|
|
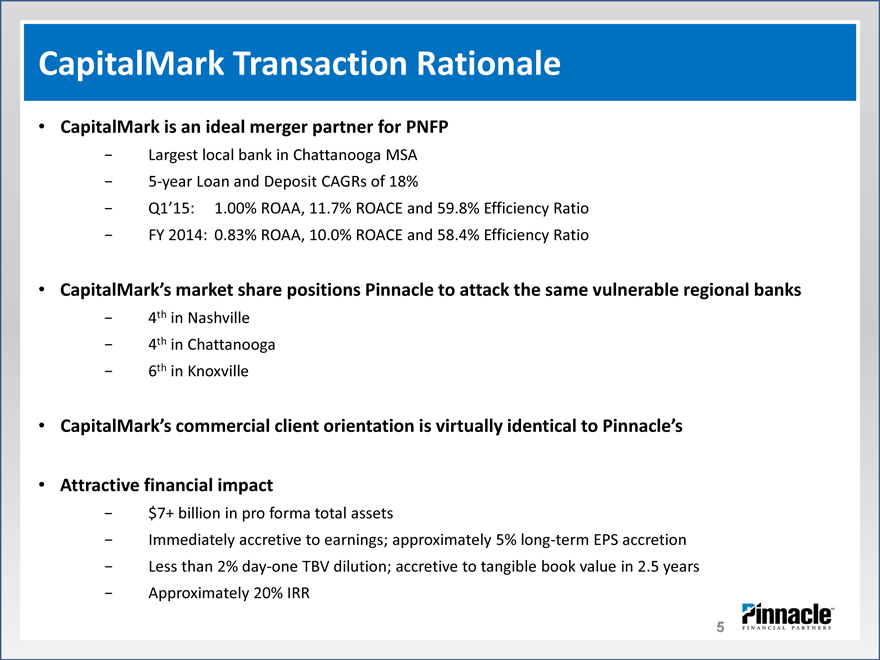
CapitalMark Transaction Rationale
CapitalMark is an ideal merger partner for PNFP
- Largest local bank in Chattanooga MSA
- 5year Loan and Deposit CAGRs of 18%
- Q1’15: 1.00% ROAA, 11.7% ROACE and 59.8% Efficiency Ratio
- FY 2014: 0.83% ROAA, 10.0% ROACE and 58.4% Efficiency Ratio
CapitalMark’s market share positions Pinnacle to attack the same vulnerable regional banks
- 4th in Nashville
- 4th in Chattanooga
- 6th in Knoxville
CapitalMark’s commercial client orientation is virtually identical to Pinnacle’s
Attractive financial impact
- $7+ billion in pro forma total assets
- Immediately accretive to earnings; approximately 5% long?term EPS accretion
- Less than 2% dayone TBV dilution; accretive to tangible book value in 2.5 years
- Approximately 20% IRR
5
|
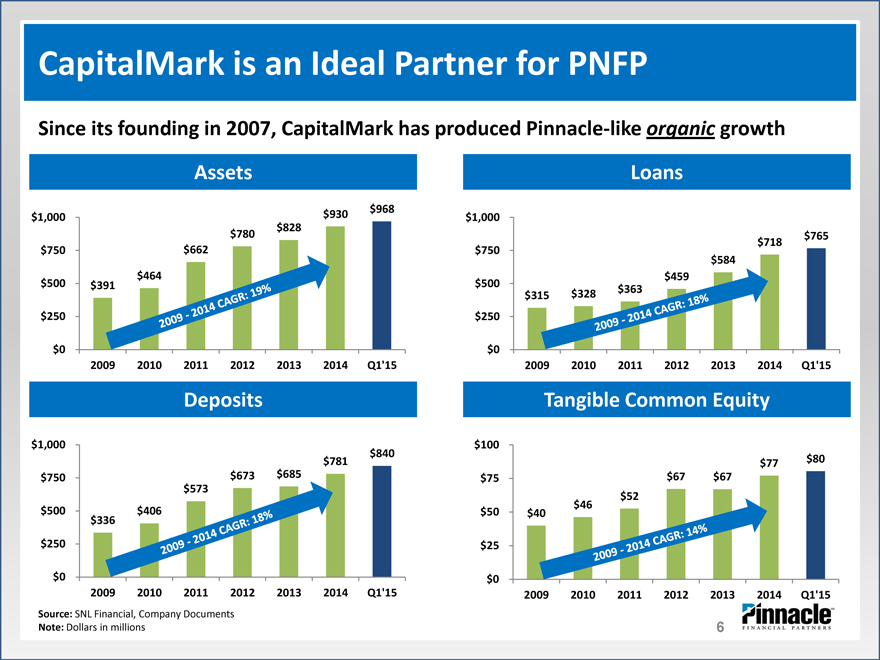
CapitalMark is an Ideal Partner for PNFP
Since its founding in 2007, CapitalMark has produced Pinnacle?like organic growth
Assets Loans
$968
$1,000 $930 $1,000
$828
$780 $765
$718
$750 $662 $750
$584
$464 $459
$500 $391 $500 $363
$315 $328
$250 $250
$0 $0
2009 2010 2011 2012 2013 2014 Q1’15 2009 2010 2011 2012 2013 2014 Q1’15
Deposits Tangible Common Equity
$1,000 $100
$840
$781 $77 $80
$750 $673 $685 $75 $67 $67
$573
$52
$500 $406 $50 $40 $46
$336
$250 $25
$0 $0
2009 2010 2011 2012 2013 2014 Q1’15 2009 2010 2011 2012 2013 2014 Q1’15
Source: SNL Financial, Company Documents Note: Dollars in millions
6
|
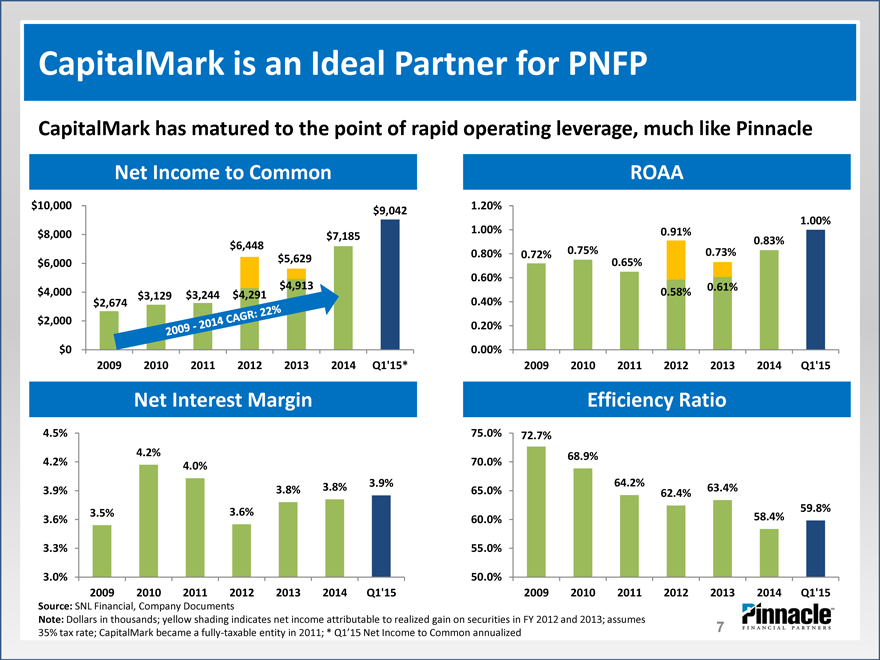
CapitalMark is an Ideal Partner for PNFP
CapitalMark has matured to the point of rapid operating leverage, much like Pinnacle
Net Income to Common ROAA
$10,000 1.20%
$9,042
1.00%
$8,000 $7,185 1.00% 0.91%
0.83%
$6,448 0.80% 0.72% 0.75% 0.73%
$6,000 $5,629 0.65%
0.60%
$4,913 0.61%
$4,000 $3,129 $3,244 $4,291 0.58%
$2,674 0.40%
$2,000 0.20%
$0 0.00%
2009 2010 2011 2012 2013 2014 Q1’15* 2009 2010 2011 2012 2013 2014 Q1’15
Net Interest Margin Efficiency Ratio
4.5% 75.0% 72.7%
4.2% 68.9%
4.2% 4.0% 70.0%
3.9% 3.8% 3.8% 3.9% 65.0% 64.2% 62.4% 63.4%
3.5% 3.6% 59.8%
3.6% 60.0% 58.4%
3.3% 55.0%
3.0% 50.0%
2009 2010 2011 2012 2013 2014 Q1’15 2009 2010 2011 2012 2013 2014 Q1’15
Source: SNL Financial, Company Documents
Note: Dollars in thousands; yellow shading indicates net income attributable to realized gain on securities in
FY 2012 and 2013; assumes 35% tax rate; CapitalMark became a fully?taxable entity in 2011; * Q1’15 Net Income
to Common annualized
7
|
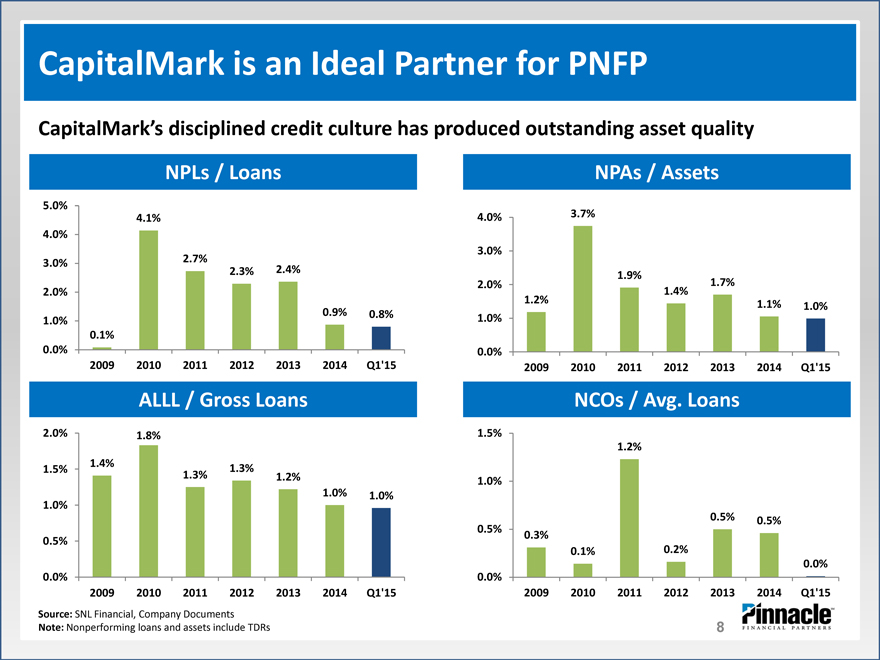
CapitalMark is an Ideal Partner for PNFP
CapitalMark’s disciplined credit culture has produced outstanding asset quality
NPLs / Loans NPAs / Assets
5.0%
4.1% 4.0% 3.7%
4.0%
3.0%
3.0% 2.7%
2.3% 2.4% 1.9%
2.0% 1.7%
2.0% 1.4%
1.2% 1.1% 1.0%
0.9% 0.8%
1.0% 1.0%
0.1%
0.0% 0.0%
2009 2010 2011 2012 2013 2014 Q1’15 2009 2010 2011 2012 2013 2014 Q1’15
ALLL / Gross Loans NCOs / Avg. Loans
2.0% 1.8% 1.5%
1.2%
1.4%
1.5% 1.3%
1.3% 1.2% 1.0%
1.0% 1.0%
1.0%
0.5% 0.5%
0.5% 0.3%
0.5%
0.1% 0.2%
0.0%
0.0% 0.0%
2009 2010 2011 2012 2013 2014 Q1’15 2009 2010 2011 2012 2013 2014 Q1’15
Source: SNL Financial, Company Documents Note: Nonperforming loans and assets include TDRs
8
|
CapitalMark is an Ideal Partner for PNFP
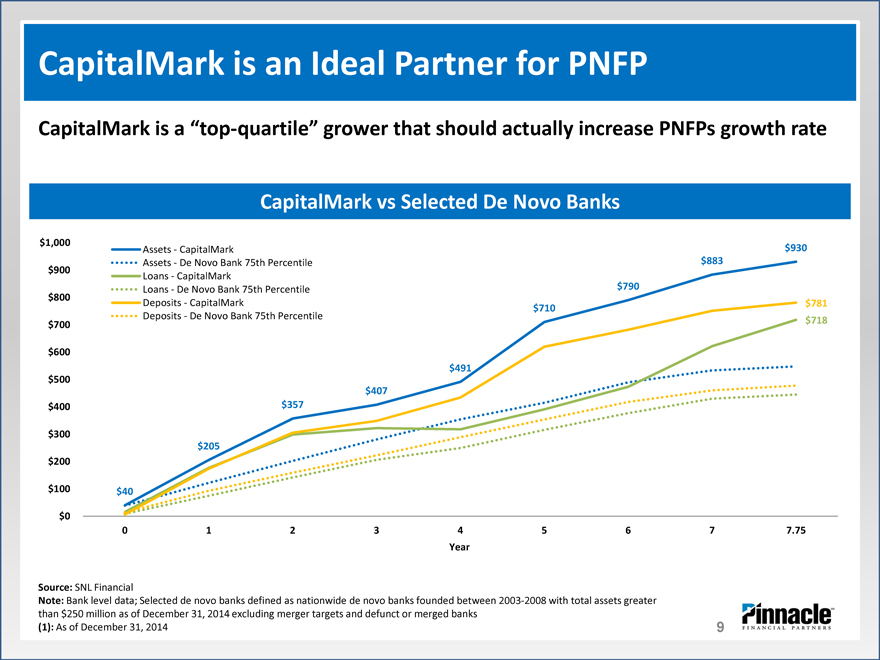
CapitalMark is a “topquartile” grower that should actually increase PNFPs growth rate
CapitalMark vs Selected De Novo Banks
$1,000 Assets CapitalMark $930
Assets De Novo Bank 75th Percentile $883
$900 Loans CapitalMark
Loans De Novo Bank 75th Percentile $790
$800 Deposits ? CapitalMark $781
$710
Deposits ? De Novo Bank 75th Percentile
$700 $718
$600
$491
$500
$407
$400 $357
$300
$205
$200
$100 $40
$0
0 1 2 3 4 5 6 7 7.75
Year
Source: SNL Financial
Note: Bank level data; Selected de novo banks defined as nationwide de novo banks founded between 2003
2008 with total assets greater than $250 million as of December 31, 2014 excluding merger targets and defunct
or merged banks (1): As of December 31, 2014
9
|
CapitalMark is an Ideal Partner for PNFP
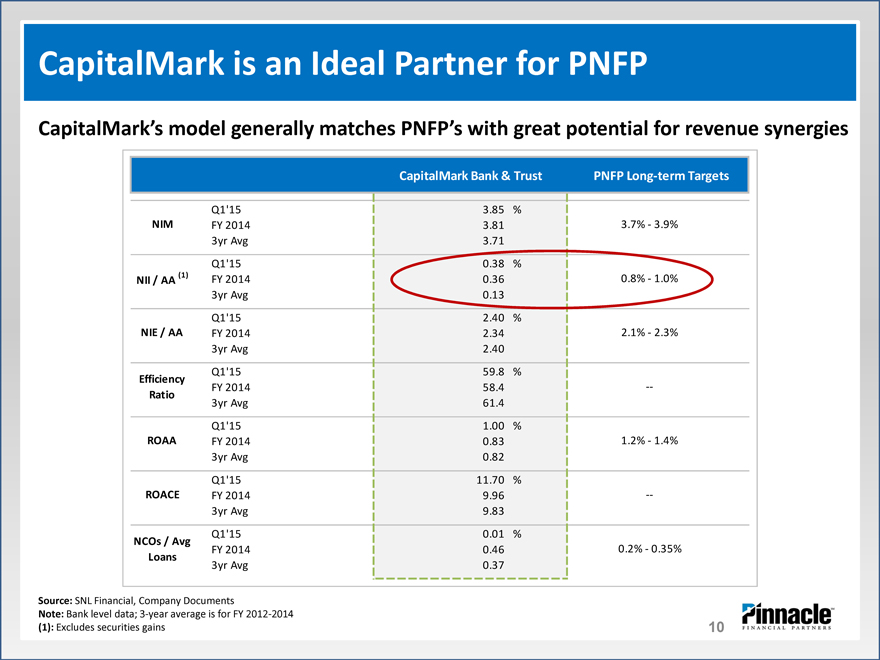
CapitalMark’s model generally matches PNFP’s with great potential for revenue synergies
CapitalMark Bank & Trust PNFP Long?term Targets
Q1’15 3.85 %
NIM FY 2014 3.81 3.7% ? 3.9%
3yr Avg 3.71
Q1’15 0.38 %
NII / AA (1) FY 2014 0.36 0.8% ? 1.0%
3yr Avg 0.13
Q1’15 2.40 %
NIE / AA FY 2014 2.34 2.1% ? 2.3%
3yr Avg 2.40
Q1’15 59.8 %
Efficiency
FY 2014 58.4 ??
Ratio
3yr Avg 61.4
Q1’15 1.00 %
ROAA FY 2014 0.83 1.2% ? 1.4%
3yr Avg 0.82
Q1’15 11.70 %
ROACE FY 2014 9.96 ??
3yr Avg 9.83
Q1’15 0.01 %
NCOs / Avg
FY 2014 0.46 0.2% ? 0.35%
Loans
3yr Avg 0.37
Source: SNL Financial, Company Documents
Note: Bank level data; 3?year average is for FY 2012?2014 (1): Excludes securities gains
10
|
CapitalMark Positions PNFP to Attack Regionals
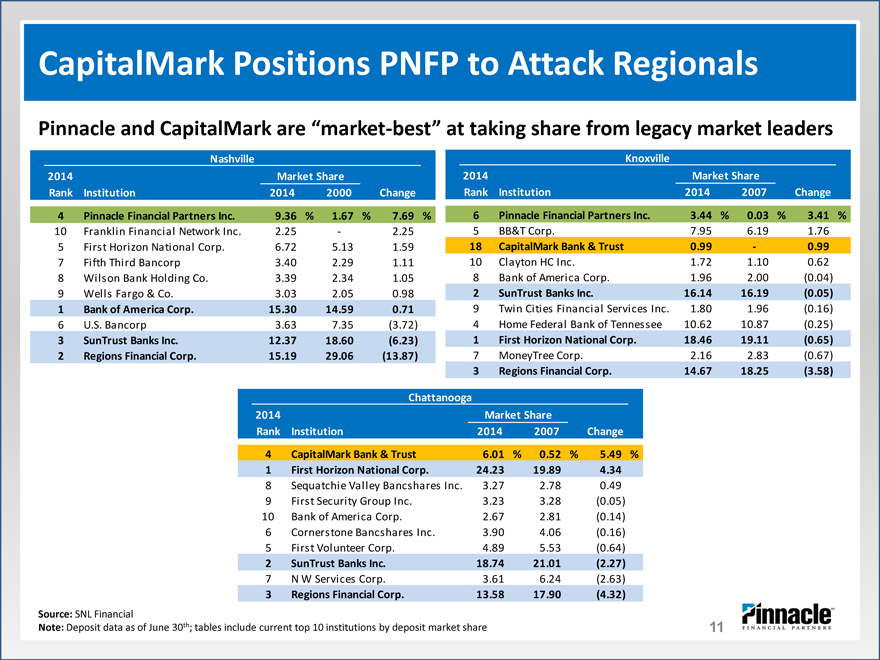
Pinnacle and CapitalMark are “market?best” at taking share from legacy market leaders
Nashville Knoxville
2014 Market Share 2014 Market Share
Rank Institution 2014 2000 Change Rank Institution 2014 2007 Change
4 Pinnacle Financial Partners Inc. 9.36 % 1.67 % 7.69 % 6 Pinnacle Financial Partners Inc. 3.44 % 0.03 % 3.41 %
10 |
| Franklin Financial Network Inc. 2.25 ? 2.25 5 BB&T Corp. 7.95 6.19 1.76 |
5 |
| First Horizon National Corp. 6.72 5.13 1.59 18 CapitalMark Bank & Trust 0.99 ? 0.99 |
7 |
| Fifth Third Bancorp 3.40 2.29 1.11 10 Clayton HC Inc. 1.72 1.10 0.62 |
8 |
| Wilson Bank Holding Co. 3.39 2.34 1.05 8 Bank of America Corp. 1.96 2.00 (0.04) |
9 Wells Fargo & Co. 3.03 2.05 0.98 2 SunTrust Banks Inc. 16.14 16.19 (0.05)
1 |
| Bank of America Corp. 15.30 14.59 0.71 9 Twin Cities Financial Services Inc. 1.80 1.96 (0.16) |
6 |
| U.S. Bancorp 3.63 7.35 (3.72) 4 Home Federal Bank of Tennessee 10.62 10.87 (0.25) |
3 |
| SunTrust Banks Inc. 12.37 18.60 (6.23) 1 First Horizon National Corp. 18.46 19.11 (0.65) |
2 |
| Regions Financial Corp. 15.19 29.06 (13.87) 7 MoneyTree Corp. 2.16 2.83 (0.67) |
3 |
| Regions Financial Corp. 14.67 18.25 (3.58) |
Chattanooga
2014 Market Share
Rank Institution 2014 2007 Change
4 |
| CapitalMark Bank & Trust 6.01 % 0.52 % 5.49 % |
1 |
| First Horizon National Corp. 24.23 19.89 4.34 |
8 |
| Sequatchie Valley Bancshares Inc. 3.27 2.78 0.49 |
9 First Security Group Inc. 3.23 3.28 (0.05)
10 |
| Bank of America Corp. 2.67 2.81 (0.14) |
6 |
| Cornerstone Bancshares Inc. 3.90 4.06 (0.16) |
5 |
| First Volunteer Corp. 4.89 5.53 (0.64) |
2 |
| SunTrust Banks Inc. 18.74 21.01 (2.27) |
7 |
| N W Services Corp. 3.61 6.24 (2.63) |
3 |
| Regions Financial Corp. 13.58 17.90 (4.32) |
Source: SNL Financial
Note: Deposit data as of June 30th; tables include current top 10 institutions by deposit market share
11
|
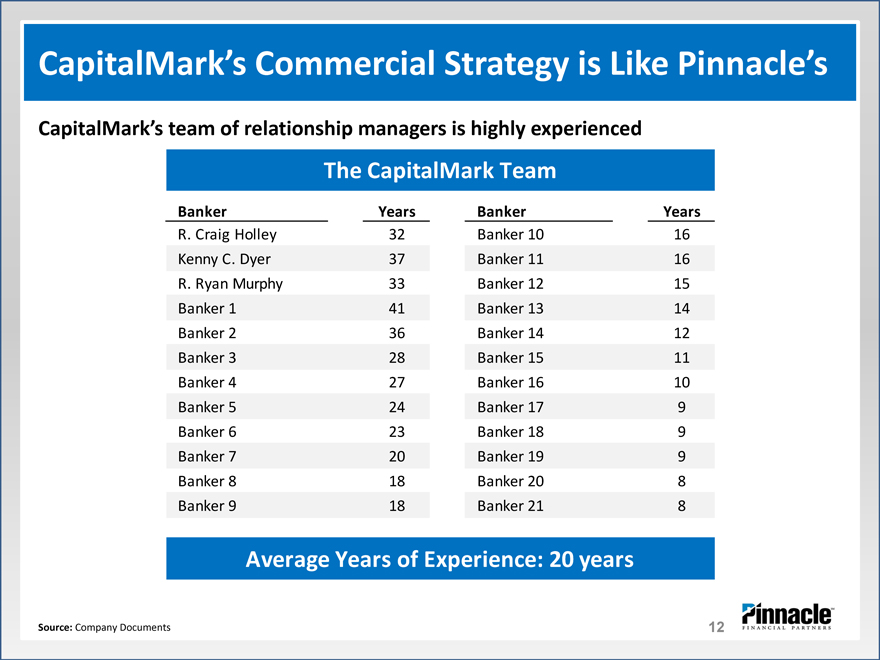
CapitalMark’s Commercial Strategy is Like Pinnacle’s
CapitalMark’s team of relationship managers is highly experienced
The CapitalMark Team
Banker Years Banker Years
R. Craig Holley 32 Banker 10 16
Kenny C. Dyer 37 Banker 11 16
R. Ryan Murphy 33 Banker 12 15
Banker 1 41 Banker 13 14
Banker 2 36 Banker 14 12
Banker 3 28 Banker 15 11
Banker 4 27 Banker 16 10
Banker 5 24 Banker 17 9
Banker 6 23 Banker 18 9
Banker 7 20 Banker 19 9
Banker 8 18 Banker 20 8
Banker 9 18 Banker 21 8
Average Years of Experience: 20 years
Source: Company Documents
12
|
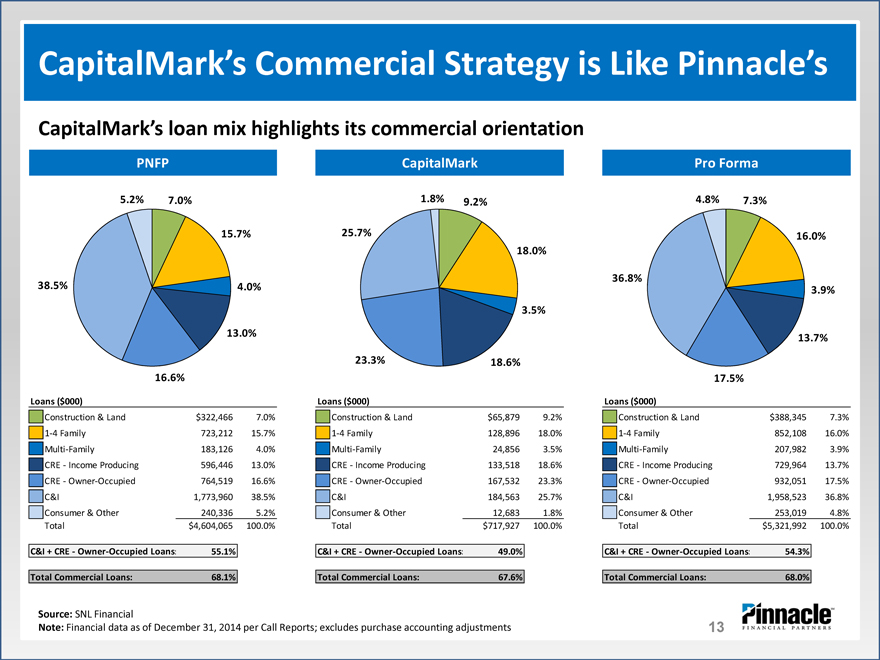
CapitalMark’s Commercial Strategy is Like Pinnacle’s
CapitalMark’s loan mix highlights its commercial orientation
PNFP CapitalMark Pro Forma
5.2% |
| 7.0% 1.8% 9.2% 4.8% 7.3% |
15.7% |
| 25.7% 16.0% |
18.0%
36.8%
38.5% |
| 4.0% 3.9% |
3.5%
13.0% |
| 13.7% |
23.3% |
| 18.6% |
16.6% |
| 17.5% |
Loans ($000) Loans ($000) Loans ($000)
Construction & Land $322,466 7.0% Construction & Land $65,879 9.2% Construction & Land $388,345 7.3%
1?4 Family 723,212 15.7% 1?4 Family 128,896 18.0% 1?4 Family 852,108 16.0%
Multi?Family 183,126 4.0% Multi?Family 24,856 3.5% Multi?Family 207,982 3.9%
CRE ? Income Producing 596,446 13.0% CRE ? Income Producing 133,518 18.6% CRE ? Income Producing 729,964 13.7%
CRE ? Owner?Occupied 764,519 16.6% CRE ? Owner?Occupied 167,532 23.3% CRE ? Owner?Occupied 932,051 17.5%
C&I 1,773,960 38.5% C&I 184,563 25.7% C&I 1,958,523 36.8%
Consumer & Other 240,336 5.2% Consumer & Other 12,683 1.8% Consumer & Other 253,019 4.8%
Total $4,604,065 100.0% Total $717,927 100.0% Total $5,321,992 100.0%
C&I + CRE ? Owner?Occupied Loans: 55.1% C&I + CRE ? Owner?Occupied Loans: 49.0% C&I + CRE ? Owner?Occupied Loans: 54.3%
Total Commercial Loans: 68.1% Total Commercial Loans: 67.6% Total Commercial Loans: 68.0%
Source: SNL Financial
Note: Financial data as of December 31, 2014 per Call Reports; excludes purchase accounting adjustments
13
|
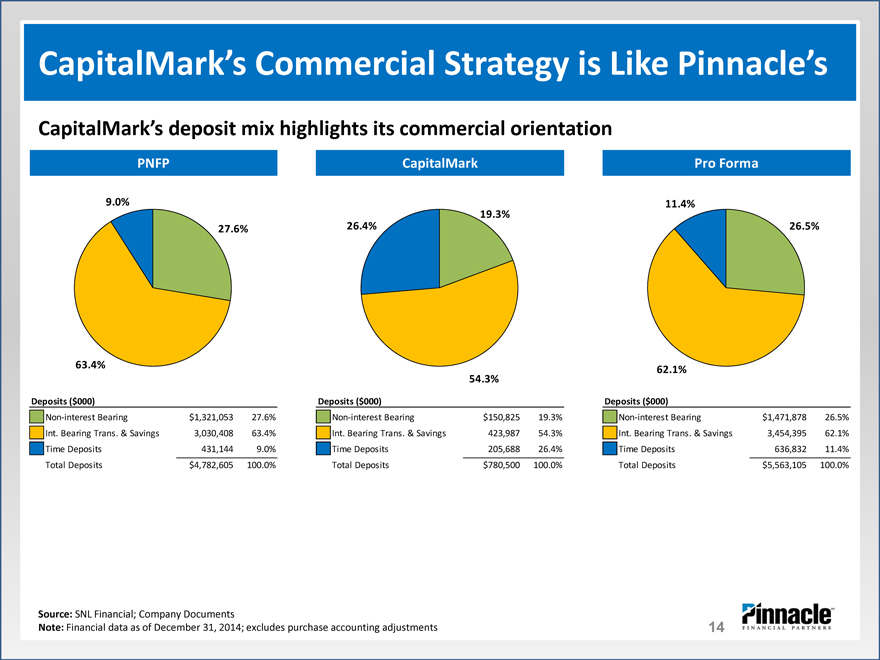
CapitalMark’s Commercial Strategy is Like Pinnacle’s
CapitalMark’s deposit mix highlights its commercial orientation
PNFP CapitalMark Pro Forma
9.0% |
| 11.4% |
19.3%
27.6% |
| 26.4% 26.5% |
63.4% |
| 62.1% |
54.3%
Deposits ($000) Deposits ($000) Deposits ($000)
Non?interest Bearing $1,321,053 27.6% Non?interest Bearing $ 150,825 19.3% Non?interest Bearing $1,471,878 26.5%
Int. Bearing Trans. & Savings 3,030,408 63.4% Int. Bearing Trans. & Savings 423,987 54.3% Int. Bearing Trans. & Savings 3,454,395 62.1%
Time Deposits 431,144 9.0% Time Deposits 205,688 26.4% Time Deposits 636,832 11.4%
Total Deposits $4,782,605 100.0% Total Deposits $ 780,500 100.0% Total Deposits $5,563,105 100.0%
Source: SNL Financial; Company Documents
Note: Financial data as of December 31, 2014; excludes purchase accounting adjustments
14
|
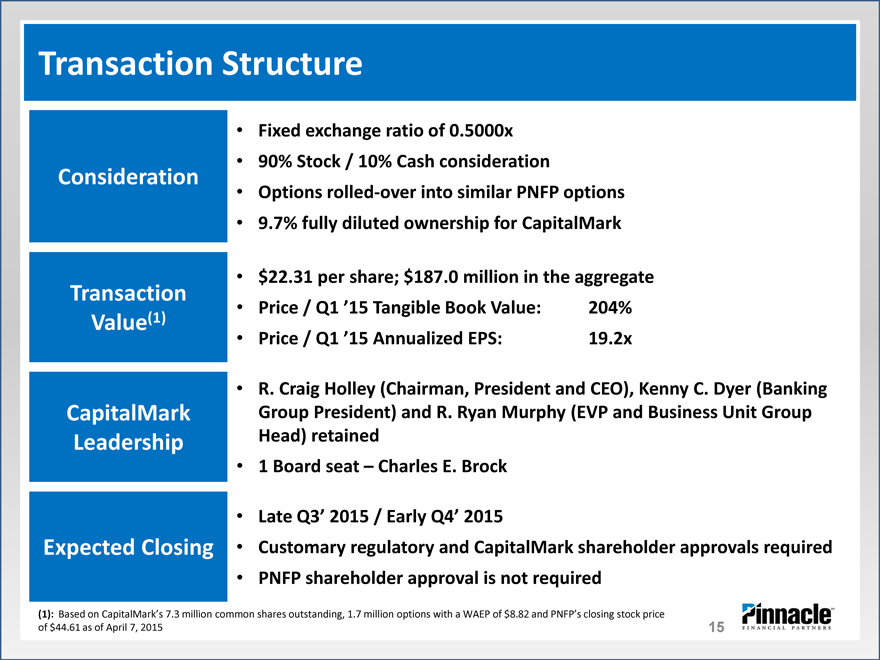
Transaction Structure
• Fixed exchange ratio of 0.5000x
• 90% Stock / 10% Cash consideration
Consideration
• Options rolled?over into similar PNFP options
• 9.7% fully diluted ownership for CapitalMark
• $22.31 per share; $187.0 million in the aggregate
Transaction • Price / Q1 ’15 Tangible Book Value: 204%
Value(1)
• Price / Q1 ’15 Annualized EPS: 19.2x
• R. Craig Holley (Chairman, President and CEO), Kenny C. Dyer (Banking
CapitalMark Group President) and R. Ryan Murphy (EVP and Business Unit Group
Leadership Head) retained
• 1 Board seat – Charles E. Brock
• Late Q3’ 2015 / Early Q4’ 2015
Expected Closing • Customary regulatory and CapitalMark shareholder approvals required
• PNFP shareholder approval is not required
(1): Based on CapitalMark’s 7.3 million common shares outstanding, 1.7 million options with a WAEP of $8.82 and PNFP’s closing stock price of $44.61 as of April 7, 2015
15
|
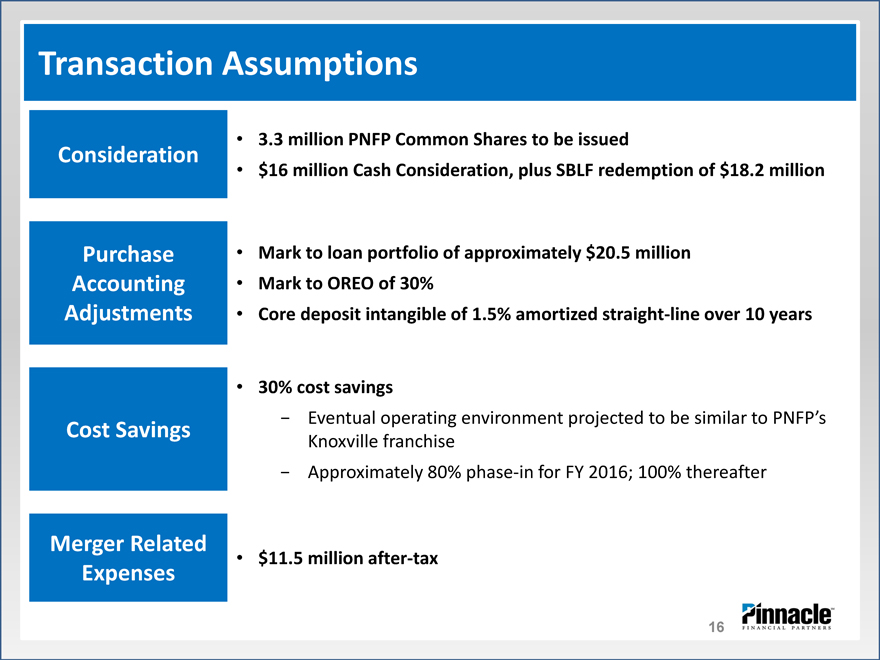
Transaction Assumptions
• 3.3 million PNFP Common Shares to be issued
Consideration
• $16 million Cash Consideration, plus SBLF redemption of $18.2 million
Purchase • Mark to loan portfolio of approximately $20.5 million
Accounting • Mark to OREO of 30%
Adjustments • Core deposit intangible of 1.5% amortized straight?line over 10 years
• 30% cost savings
Cost Savings—Eventual operating environment projected to be similar to PNFP’s
Knoxville franchise
—Approximately 80% phase?in for FY 2016; 100% thereafter
Merger Related • $11.5 million after?tax
Expenses
16
|
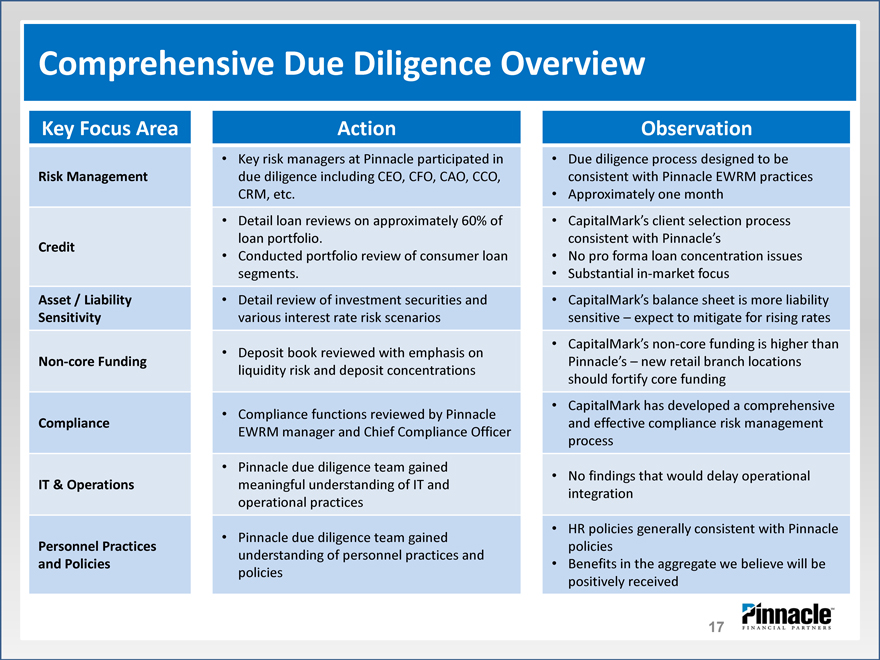
Comprehensive Due Diligence Overview
Key Focus Area Action Observation
• Key risk managers at Pinnacle participated in • Due diligence process designed to be
Risk Management due diligence including CEO, CFO, CAO, CCO, consistent with Pinnacle EWRM practices
CRM, etc. • Approximately one month
• Detail loan reviews on approximately 60% of • CapitalMark’s client selection process
loan portfolio. consistent with Pinnacle’s
Credit • Conducted portfolio review of consumer loan • No pro forma loan concentration issues
segments. • Substantial in?market focus
Asset / Liability • Detail review of investment securities and • CapitalMark’s balance sheet is more liability
Sensitivity various interest rate risk scenarios sensitive – expect to mitigate for rising rates
• Deposit book reviewed with emphasis on • CapitalMark’s non?core funding is higher than
Non?core Funding Pinnacle’s – new retail branch locations
liquidity risk and deposit concentrations
should fortify core funding
• Compliance functions reviewed by Pinnacle • CapitalMark has developed a comprehensive
Compliance and effective compliance risk management
EWRM manager and Chief Compliance Officer
process
• Pinnacle due diligence team gained • No findings that would delay operational
IT & Operations meaningful understanding of IT and
integration
operational practices
• Pinnacle due diligence team gained • HR policies generally consistent with Pinnacle
Personnel Practices policies
understanding of personnel practices and
and Policies • Benefits in the aggregate we believe will be
policies
positively received
17
|
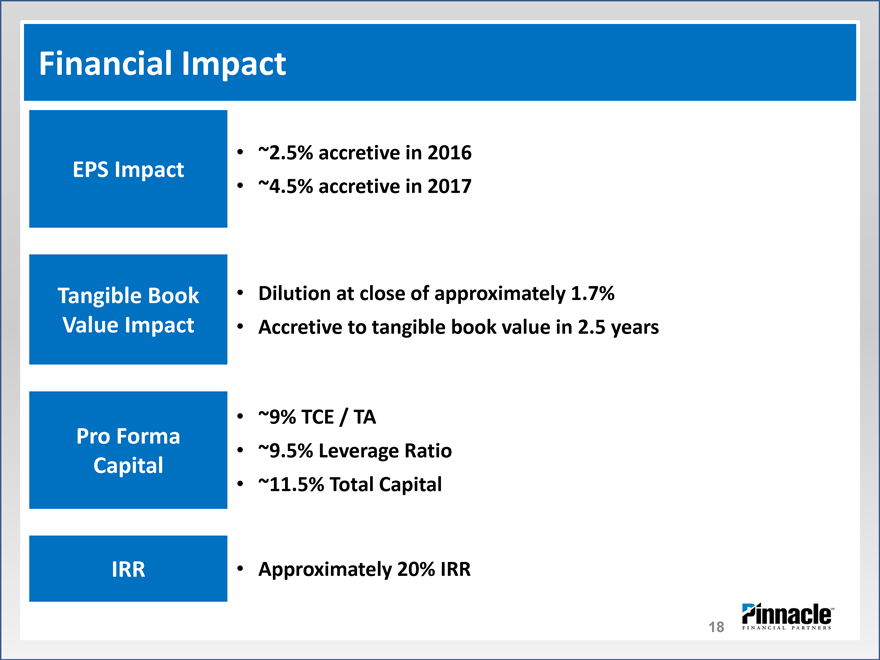
Financial Impact
• ~2.5% accretive in 2016
EPS Impact
• ~4.5% accretive in 2017
Tangible Book • Dilution at close of approximately 1.7%
Value Impact • Accretive to tangible book value in 2.5 years
• ~9% TCE / TA
Pro Forma • ~9.5% Leverage Ratio
Capital
• ~11.5% Total Capital
IRR • Approximately 20% IRR
18 |
|
|
Appendix
• |
| Overview of CapitalMark Bank & Trust |
• |
| 5?year Financial Summary |
• |
| CapitalMark Management Biographies |
• |
| Addition to PNFP Board of Directors |
• |
| Chattanooga and Tennessee Market Demographics |
• |
| Deposit Market Share – Tennessee |
• |
| Deposit Market Share – MSAs |
19
|
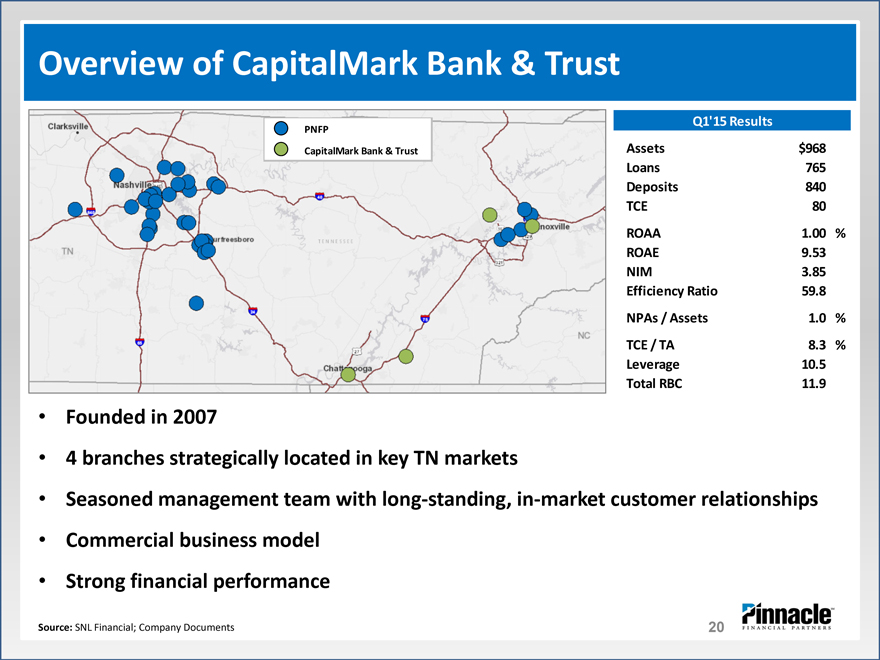
Overview of CapitalMark Bank & Trust
PNFP
CapitalMark Bank & Trust
Q1’15 Results
Assets $968 Loans 765 Deposits 840 TCE 80
ROAA 1.00 % ROAE 9.53 NIM 3.85 Efficiency Ratio 59.8
NPAs / Assets 1.0 %
TCE / TA 8.3 % Leverage 10.5 Total RBC 11.9
• |
| Founded in 2007 |
• |
| 4 branches strategically located in key TN markets |
• |
| Seasoned management team with long?standing, in?market customer relationships |
• |
| Commercial business model |
• |
| Strong financial performance |
Source: SNL Financial; Company Documents
20
|
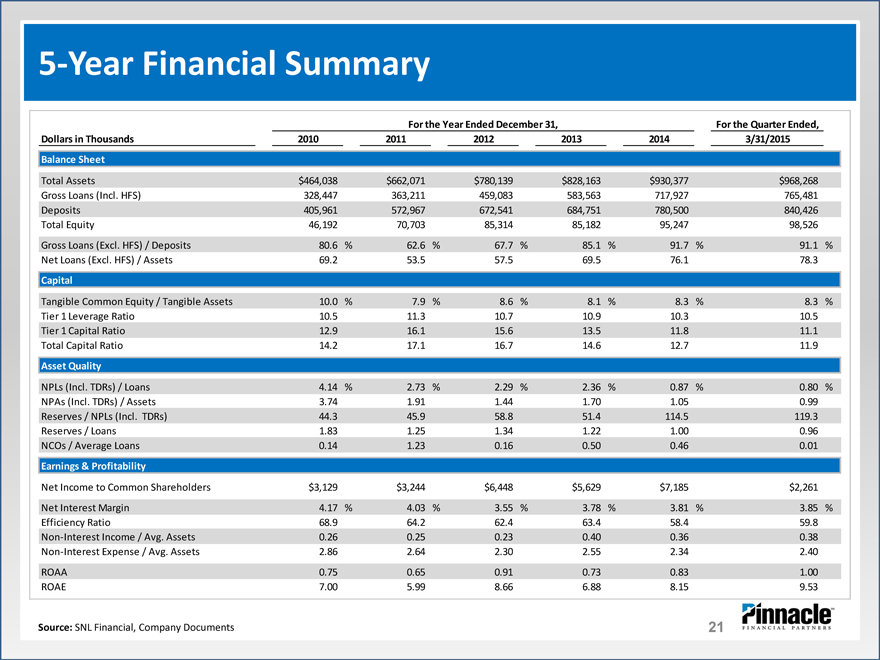
5?Year Financial Summary
For the Year Ended December 31, For the Quarter Ended,
Dollars in Thousands 2010 2011 2012 2013 2014 3/31/2015
Balance Sheet
Total Assets $464,038 $662,071 $780,139 $828,163 $930,377 $968,268
Gross Loans (Incl. HFS) 328,447 363,211 459,083 583,563 717,927 765,481
Deposits 405,961 572,967 672,541 684,751 780,500 840,426
Total Equity 46,192 70,703 85,314 85,182 95,247 98,526
Gross Loans (Excl. HFS) / Deposits 80.6% 62.6% 67.7% 85.1% 91.7% 91.1%
Net Loans (Excl. HFS) / Assets 69.2 53.5 57.5 69.5 76.1 78.3
Capital
Tangible Common Equity / Tangible Assets 10.0% 7.9% 8.6% 8.1% 8.3% 8.3%
Tier 1 Leverage Ratio 10.5 11.3 10.7 10.9 10.3 10.5
Tier 1 Capital Ratio 12.9 16.1 15.6 13.5 11.8 11.1
Total Capital Ratio 14.2 17.1 16.7 14.6 12.7 11.9
Asset Quality
NPLs (Incl. TDRs) / Loans 4.14% 2.73% 2.29% 2.36% 0.87% 0.80%
NPAs (Incl. TDRs) / Assets 3.74 1.91 1.44 1.70 1.05 0.99
Reserves / NPLs (Incl. TDRs) 44.3 45.9 58.8 51.4 114.5 119.3
Reserves / Loans 1.83 1.25 1.34 1.22 1.00 0.96
NCOs / Average Loans 0.14 1.23 0.16 0.50 0.46 0.01
Earnings & Profitability
Net Income to Common Shareholders $3,129 $3,244 $6,448 $5,629 $7,185 $2,261
Net Interest Margin 4.17% 4.03% 3.55% 3.78% 3.81% 3.85%
Efficiency Ratio 68.9 64.2 62.4 63.4 58.4 59.8
Non?Interest Income / Avg. Assets 0.26 0.25 0.23 0.40 0.36 0.38
Non?Interest Expense / Avg. Assets 2.86 2.64 2.30 2.55 2.34 2.40
ROAA 0.75 0.65 0.91 0.73 0.83 1.00
ROAE 7.00 5.99 8.66 6.88 8.15 9.53
Source: SNL Financial, Company Documents
21
|
CapitalMark Management Biographies
Mr. Holley is Chairman, President and Chief Executive Officer of CapitalMark Bank & Trust. Mr. Holley earned his Bachelor of Science
degree in Economics at Auburn University in Auburn, Alabama in 1979, and is a 1987 graduate of the School of Banking of the South
at Louisiana State University. In 1998, he successfully completed Georgia State University’s Management Development Program at
the Center for Executive Education in Atlanta, Georgia; and is a 2002 graduate of the Center of Creative Leadership in Greensboro,
North Carolina. Prior to founding CapitalMark, Mr. Holley worked for over 25 years with AmSouth Bank, serving as regional president
for the bank’s southeast Tennessee/North Georgia area. He is a member of the boards of directors of the Nashville Branch of the
Federal Reserve Bank of Atlanta and Siskin Children’s Institute. He is vice chairman of the Hunter Museum of American Art and past
chair of the Chattanooga Economic Development Council . In addition, Mr. Holley serves on the FIS national CEO Strategic Planning
Advisory Council.
R. Craig Holley Mr. Holley is a past member of the University of Tennessee at Chattanooga College of Business Advisory Board and of the Chancellor’s
Chairman, President Roundtable. He has served on the boards of directors of the Chattanooga Area Chamber of Commerce, United Way of Greater
and Chief Executive Chattanooga, ArtsBuild, Girls Preparatory School, Ochs Center for Metropolitan Studies, Chattanooga Neighborhood Enterprise, T.C.
Officer Thompson Children’s Hospital Foundation, Tennessee River Gorge Trust, Cherokee Area Council of the Boy Scouts of America, First
Things First, and the YMCA of Metropolitan Chattanooga.
Mr. Dyer serves as the Banking Group President. He graduated from the McCallie School and earned his Bachelor of Science Degree
from the University of Tennessee at Chattanooga, where he was co?captain of the baseball team and a recipient of the Leadership
Award during his tenure. Mr. Dyer graduated from the Stonier Graduate School of Banking, the Tennessee Bankers Association
Advanced Commercial Lending School, and Regions Leadership University. A 33?year banking veteran, he was the former Chattanooga
City President for Regions Bank. While at Regions, Mr. Dyer was named the 2005 Commercial Banking Executive of the Year for the
MidSouth Region. He previously served as the Regional President of Frontier Bank. In 1978, he began his banking career as a
management trainee with Pioneer Bank holding several management positions and eventually ascended to the position of President
in 1998. Mr. Dyer has served on several civic boards including the Advisory Board of the University of Tennessee at Chattanooga
Department of Finance, the United Way of Chattanooga, the Chattanooga Community Development Financial Institution,
Chattanooga Neighborhood Enterprises, and Better Business Bureau of Chattanooga. Additionally, he was president of McCallie
School Alumni Association and was an active member the UTC Alumni Council.
Kenneth C. Dyer III
Banking Group
President
Source: Company Documents
22
|
CapitalMark Management Biographies
Mr. Murphy serves as Business Unit Group Head. He graduated from the Baylor School in Chattanooga and earned a degree in
Corporate Finance and Investment Management from the University of Alabama. In 1992, he earned his degree from The Graduate
School of Banking of the South at LSU. In 1997, he earned the Certified Cash Manager designation. He began his banking career in
1982 with First Tennessee Bank where he held posts varying from branch assistant manager, correspondent banking officer, and
corporate banking officer. He went on to work for AmSouth Bank in Chattanooga as commercial banking officer and later,
department head of Commercial Banking for the Southeast Tennessee and North Georgia region. He served as the Chattanooga
Regional President for FSG Bank in Chattanooga. He serves on the board of Teen Challenge of the Mid?South, Chattanooga
Metropolitan YMCA and is a member of Rotary of Chattanooga. He has served on the boards of The Heart Association, Senior
Neighbors of Chattanooga and Chattanooga Prison Ministries. In addition, Mr. Murphy has workedinvarious capacities as avolunteer
for the Boy Scouts, the Chattanooga Chamber of Commerce and the United Way of Chattanooga.
Ryan Murphy
Business Unit Group
Head
Source: Company Documents
23
|
Addition to PNFP Board of Directors
Charles E. Brock is President and Chief Executive Officer of Launch Tennessee, a state?wide initiative to harness innovation, capital
and the entrepreneurial spirit to make Tennessee the best place in the Southeast to start a business. He was formerly the Managing
Partner of FourBridges Capital Advisors, a middle?market investment bank based in Chattanooga that serves clients throughout the
Southeast. He has also served as the Executive Entrepreneur of CoLab, whose mission is to support entrepreneurs in the SE TN region.
Additionally, Charlie is a founding partner of Chattanooga Renaissance Fund, Chattanooga’s first angel capital group committed to
helping fund and mentor startup companies in the region.
In 1998, he helped start Foxmark Media, growing it into one of the nation’s leading mall advertising companies, operating in over 35
markets. As the company’s CEO and largest shareholder, he structured three rounds of private financing before selling the company
in 2006 to Australian based EYE Corp, one of the world’s leading out?of?home media companies. Prior to starting Foxmark, he held
marketing and sales positions with Brock Candy Company and its successor, Brach and Brock Confections. Mr. Brock has commercial
banking experience as a loan officer with SunTrust Bank. Mr. Brock is an active member of the Nashville chapter of the Entrepreneurs
Charlie Brock Organization, a worldwide network of over 9,000 business owners. Charlie serves on the board of the Boys & Girls Club, Outreach
Director Haiti, and as Endowment Chair at Good Shepherd Church. Mr. Brock has a B.A. from the University of the South, where he is a former
member of the Board of Trustees. Charlie holds a Series 7 and Series 63 license, and is also a Series 24 Registered Securities Principal.
Source: Company Documents
24
|
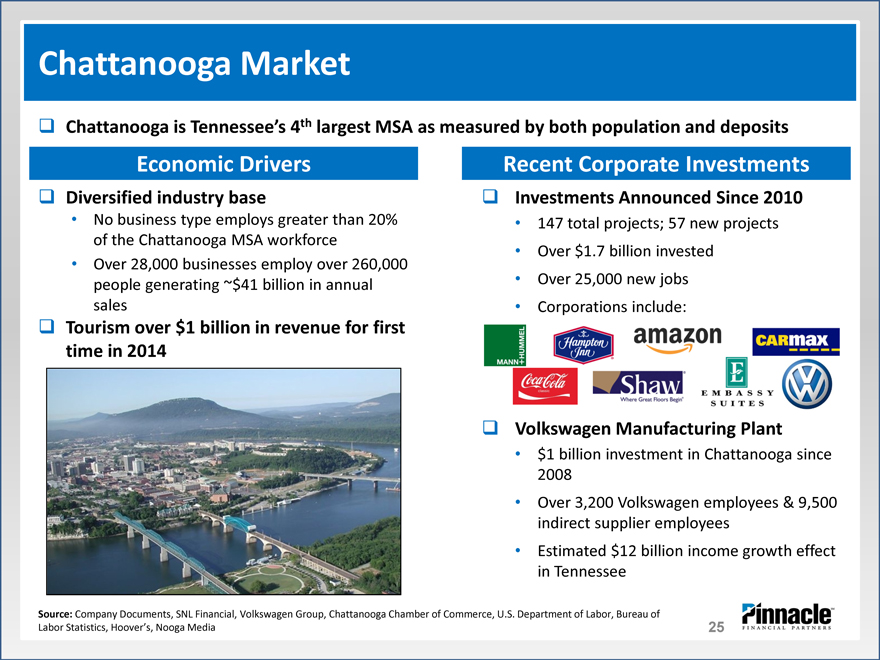
Chattanooga Market
Chattanooga is Tennessee’s 4th largest MSA as measured by both population and deposits
Economic Drivers Recent Corporate Investments
Diversified industry base Investments Announced Since 2010
• |
| No business type employs greater than 20% 147 total projects; 57 new projects |
of the Chattanooga MSA workforce • Over $1.7 billion invested
• |
| Over 28,000 businesses employ over 260,000 |
people generating ~$41 billion in annual • Over 25,000 new jobs
sales • Corporations include:
Tourism over $1 billion in revenue for first
time in 2014
Volkswagen Manufacturing Plant
• $1 billion investment in Chattanooga since
2008
• Over 3,200 Volkswagen employees & 9,500
indirect supplier employees
• Estimated $12 billion income growth effect
in Tennessee
Source: Company Documents, SNL Financial, Volkswagen Group, Chattanooga Chamber of Commerce, U.S. Department of Labor, Bureau of
Labor Statistics, Hoover’s, Nooga Media
25
|
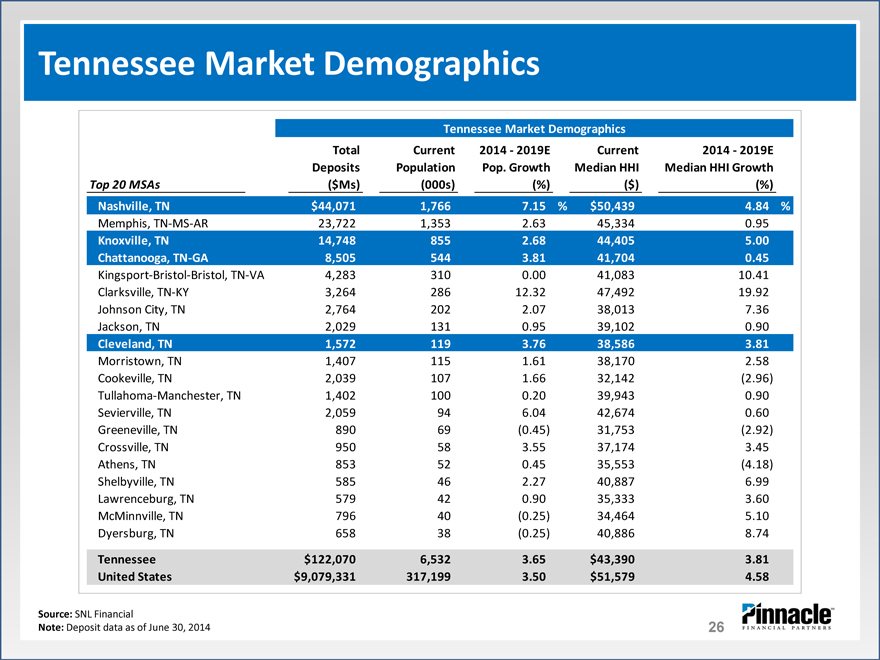
Tennessee Market Demographics
Tennessee Market Demographics
Total Current 2014 ? 2019E Current 2014 ? 2019E
Deposits Population Pop. Growth Median HHI Median HHI Growth
Top 20 MSAs($Ms)(000s)(%)($)(%)
Nashville, TN $44,071 1,766 7.15% $ 50,439 4.84%
Memphis, TN?MS?AR 23,722 1,353 2.63 45,334 0.95
Knoxville, TN 14,748 855 2.68 44,405 5.00
Chattanooga, TN?GA 8,505 544 3.81 41,704 0.45
Kingsport?Bristol?Bristol, TN?VA 4,283 310 0.00 41,083 10.41
Clarksville, TN?KY 3,264 286 12.32 47,492 19.92
Johnson City, TN 2,764 202 2.07 38,013 7.36
Jackson, TN 2,029 131 0.95 39,102 0.90
Cleveland, TN 1,572 119 3.76 38,586 3.81
Morristown, TN 1,407 115 1.61 38,170 2.58
Cookeville, TN 2,039 107 1.66 32,142(2.96)
Tullahoma?Manchester, TN 1,402 100 0.20 39,943 0.90
Sevierville, TN 2,059 94 6.04 42,674 0.60
Greeneville, TN 890 69(0.45) 31,753(2.92)
Crossville, TN 950 58 3.55 37,174 3.45
Athens, TN 853 52 0.45 35,553(4.18)
Shelbyville, TN 585 46 2.27 40,887 6.99
Lawrenceburg, TN 579 42 0.90 35,333 3.60
McMinnville, TN 796 40(0.25) 34,464 5.10
Dyersburg, TN 658 38(0.25) 40,886 8.74
Tennessee $122,070 6,532 3.65 $ 43,390 3.81
United States $9,079,331 317,199 3.50 $ 51,579 4.58
Source: SNL Financial
Note: Deposit data as of June 30, 2014
26
|
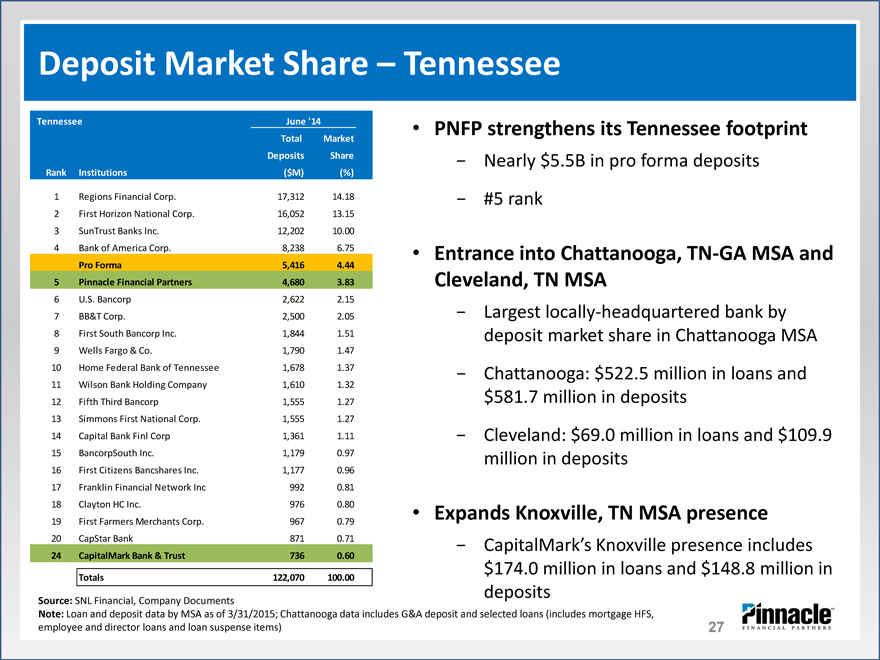
Deposit Market Share – Tennessee
Tennessee June ‘14 •
Total Market
Deposits Share
Rank Institutions($M)(%)
1 |
| Regions Financial Corp. 17,312 14.18 |
2 |
| First Horizon National Corp. 16,052 13.15 |
3 |
| SunTrust Banks Inc. 12,202 10.00 |
4 |
| Bank of America Corp. 8,238 6.75 • |
Pro Forma 5,416 4.44
5 |
| Pinnacle Financial Partners 4,680 3.83 |
6 |
| U.S. Bancorp 2,622 2.15 |
7 |
| BB&T Corp. 2,500 2.05 |
8 |
| First South Bancorp Inc. 1,844 1.51 |
9 Wells Fargo & Co. 1,790 1.47
10 |
| Home Federal Bank of Tennessee 1,678 1.37 |
11 |
| Wilson Bank Holding Company 1,610 1.32 |
12 |
| Fifth Third Bancorp 1,555 1.27 |
13 |
| Simmons First National Corp. 1,555 1.27 |
14 |
| Capital Bank Finl Corp 1,361 1.11 |
15 |
| BancorpSouth Inc. 1,179 0.97 |
16 |
| First Citizens Bancshares Inc. 1,177 0.96 |
17 |
| Franklin Financial Network Inc 992 0.81 |
18 |
| Clayton HC Inc. 976 0.80 • |
19 |
| First Farmers Merchants Corp. 967 0.79 |
20 |
| CapStar Bank 871 0.71 |
24 |
| CapitalMark Bank & Trust 736 0.60 |
Totals 122,070 100.00
PNFP strengthens its Tennessee footprint
- Nearly $5.5B in pro forma deposits
- #5 rank
Entrance into Chattanooga, TN?GA MSA and Cleveland, TN MSA
- Largest locally?headquartered bank by deposit market share in Chattanooga MSA
- Chattanooga: $522.5 million in loans and $581.7 million in deposits
- Cleveland: $69.0 million in loans and $109.9 million in deposits
Expands Knoxville, TN MSA presence
- CapitalMark’s Knoxville presence includes $174.0 million in loans and $148.8 million in deposits
Source: SNL Financial, Company Documents
Note: Loan and deposit data by MSA as of 3/31/2015; Chattanooga data includes G&A deposit and selected loans (includes mortgage HFS, employee and director loans and loan suspense items)
27
|
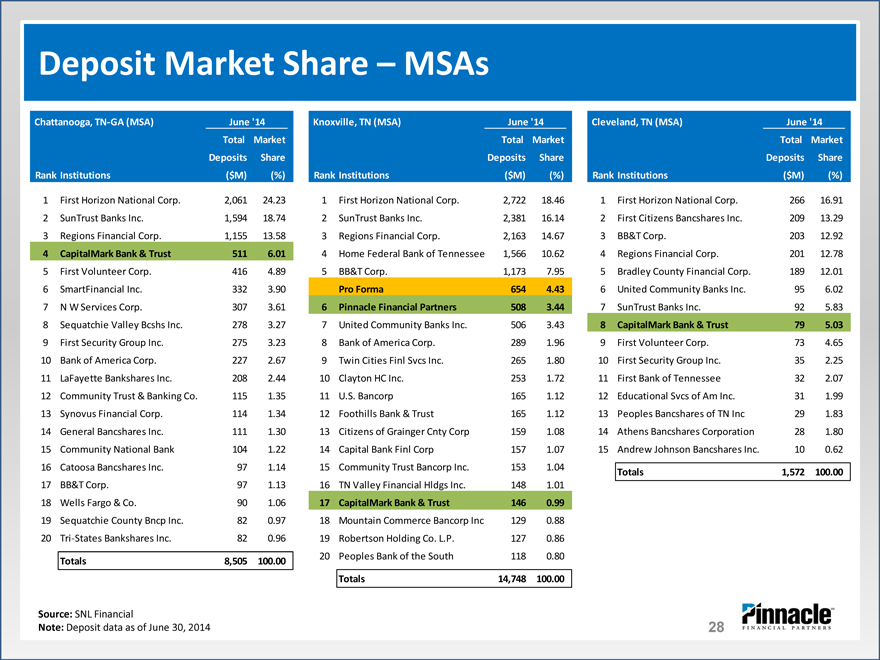
Deposit Market Share – MSAs
Chattanooga, TN?GA (MSA) June ‘14 Knoxville, TN (MSA) June ‘14 Cleveland, TN (MSA) June ‘14
Total Market Total Market Total Market
Deposits Share Deposits Share Deposits Share
Rank Institutions($M)(%) Rank Institutions($M)(%) Rank Institutions($M)(%)
1 First Horizon National Corp. 2,061 24.23 1 First Horizon National Corp. 2,722 18.46 1 First Horizon National Corp. 266 16.91
2 |
| SunTrust Banks Inc. 1,594 18.74 2 SunTrust Banks Inc. 2,381 16.14 2 First Citizens Bancshares Inc. 209 13.29 |
3 |
| Regions Financial Corp. 1,155 13.58 3 Regions Financial Corp. 2,163 14.67 3 BB&T Corp. 203 12.92 |
4 CapitalMark Bank & Trust 511 6.01 4 Home Federal Bank of Tennessee 1,566 10.62 4 Regions Financial Corp. 201 12.78
5 |
| First Volunteer Corp. 416 4.89 5 BB&T Corp. 1,173 7.95 5 Bradley County Financial Corp. 189 12.01 |
6 |
| SmartFinancial Inc. 332 3.90 Pro Forma 654 4.43 6 United Community Banks Inc. 95 6.02 |
7 |
| N W Services Corp. 307 3.61 6 Pinnacle Financial Partners 508 3.44 7 SunTrust Banks Inc. 92 5.83 |
8 |
| Sequatchie Valley Bcshs Inc. 278 3.27 7 United Community Banks Inc. 506 3.43 8 CapitalMark Bank & Trust 79 5.03 |
9 First Security Group Inc. 275 3.23 8 Bank of America Corp. 289 1.96 9 First Volunteer Corp. 73 4.65
10 |
| Bank of America Corp. 227 2.67 9 Twin Cities Finl Svcs Inc. 265 1.80 10 First Security Group Inc. 35 2.25 |
11 |
| LaFayette Bankshares Inc. 208 2.44 10 Clayton HC Inc. 253 1.72 11 First Bank of Tennessee 32 2.07 |
12 |
| Community Trust & Banking Co. 115 1.35 11 U.S. Bancorp 165 1.12 12 Educational Svcs of Am Inc. 31 1.99 |
13 |
| Synovus Financial Corp. 114 1.34 12 Foothills Bank & Trust 165 1.12 13 Peoples Bancshares of TN Inc 29 1.83 |
14 |
| General Bancshares Inc. 111 1.30 13 Citizens of Grainger Cnty Corp 159 1.08 14 Athens Bancshares Corporation 28 1.80 |
15 |
| Community National Bank 104 1.22 14 Capital Bank Finl Corp 157 1.07 15 Andrew Johnson Bancshares Inc. 10 0.62 |
16 |
| Catoosa Bancshares Inc. 97 1.14 15 Community Trust Bancorp Inc. 153 1.04 Totals 1,572 100.00 |
17 |
| BB&T Corp. 97 1.13 16 TN Valley Financial Hldgs Inc. 148 1.01 |
18 |
| Wells Fargo & Co. 90 1.06 17 CapitalMark Bank & Trust 146 0.99 |
19 |
| Sequatchie County Bncp Inc. 82 0.97 18 Mountain Commerce Bancorp Inc 129 0.88 |
20 |
| Tri?States Bankshares Inc. 82 0.96 19 Robertson Holding Co. L.P. 127 0.86 |
Totals 8,505 100.00 20 Peoples Bank of the South 118 0.80
Totals 14,748 100.00
Source: SNL Financial
Note: Deposit data as of June 30, 2014
28