Exhibit 99.1
D and B 2013 Investor Update Poised for Growth and Sustainable TSR July 26, 2013 |  |
Forward-looking statements and non-GAAP measures This presentation contains estimates and projections of future results and other forward - looking statements that are subject to a number of trends, risks and uncertainties and are made pursuant to the safe harbor provisions of the Private Securities Litigation Reform Act of 1995. For example, throughout this presentation we discuss our business strategy and certain short and long term financial and operational expectations that we believe would be achieved based upon our planned business strategy for the next several years. These expectations can only be achieved if the assumptions underlying our business strategy are fully realized - some of which we cannot control (e.g., market growth rates, macroeconomic conditions and customer preferences). As part of our annual planning process, we will review these assumptions and we intend to update these expectations from time to time as appropriate. We will continue to provide financial guidance to shareholders on an annual basis. The trends, risks and uncertainties that may cause actual results to vary materially from those anticipated, estimated or projected are more fully described in our filings with the SEC, including our most recent Annual Report on Form 10-K and Quarterly Reports on Form 10-Q and the notes to the financial statements included therewith (copies of which are available on our Web site at www.dnb.com and on the SEC's web site at www.sec.gov). Except as otherwise required by federal securities laws, we do not undertake to update any forward-looking statement we may make from time to time. This presentation also includes non-GAAP financial measures, as that is how we manage our business. For example, when we discuss "core revenue growth" and "revenue growth" we are referring to the non-GAAP measure "core revenue growth before the effect of foreign exchange," unless otherwise noted. And when we discuss "EPS," our discussion is on a non-GAAP basis, before non-core gains and charges, unless otherwise noted. Reconciliations between the non-GAAP financial measures used in this presentation and the most directly comparable GAAP measures can be found in the Appendix and on the D and B Investor Relations website located at http://investor.dnb.com. DNB Investor Day Presentation 2 |  |
D and B 2013 Investor Update Poised for Growth and Sustainable TSR July 26, 2013 |  |
Our preliminary Q2 results were slightly ahead of expectations and we remain confident in our guidance for 2013 Q2 2013 Preliminary Total Company Results ($M, except EPS) Core Revenue $ %vs PY North America 279 0% International 108 6% Core Revenue 387 1% Op. Income* 100 (13%) EPS* 1.53 2% Free Cash Flow (YTD) 208 o Improvement over Q1 and in line with expectations o Above expectations due to timing benefits o Similar to Q1 and in line with expectations o Slightly ahead of expectations o In line with expectations *Before Non-Core Gains and Charges DNB Investor Day Presentation 4 | 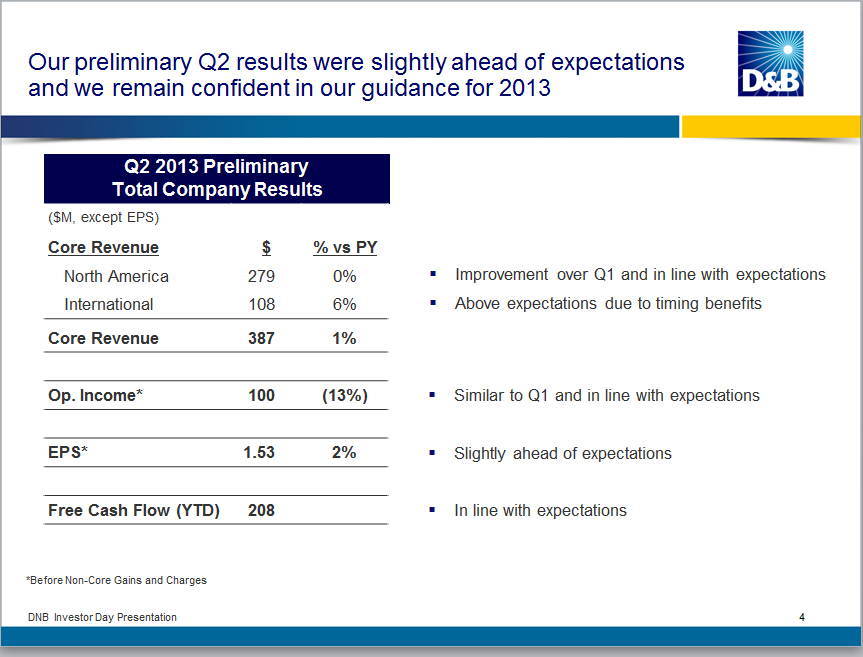 |
D and B has a 172 year legacy that is shared with a very short list of distinguished public companies CP COLGATE-PALMOLIVE Lorillard Trust 200 Years The Hartford Dupont Citibank Cigna The miracles of science McKesson Empowering Healthcare P and G John Deere JPMorgan Chase and Co. Tiffany and Co. Valspar if it matters, we're on it. Berkshire Hathaway Inc. People's United Bank DNB Investor Day Presentation 5 |  |
We are a global provider of commercial information delivered
through two primary solution sets


Core Revenue
$1.6B

International
25%

North America
75%

Operating Income
$520M

North America 83%

International 17%


                     Risk Management   Sales and Marketing
                     Solutions (RMS)   Solutions (S and MS)
                     $1.0B             $0.6B
Revenue Mix

North America 57%     43%

International 83%     17%


Key Needs
Addressed

o Make credit decisions
o Increase cash flow
o Manage risk and improve controls
o Acquire prospects
o Retain/grow customers
o Develop a 360 view of customer base


Note: 2012 Core Figures

DNB Investor Day Presentation 6
|  |
We are the leader in commercial data with a large footprint
within the markets we compete

90% of Fortune 500 companies are D and B customers


5M updates per day

230M records within the global database, more than 2X
     larger than the nearest competitor

238  countries covered - only company that does
     this in a globally consistent fashion

DNB Investor Day Presentation 7
|  |
Since becoming a standalone public company in late 2000, we have gone through several transformations 2000-2004 2005-2008 Financial/cultural Top line acceleration, transformation primarily driven by DNBi/Optimizer Average Core Organic 3% 6% Revenue Growth Margin Expansion 550bp 360bp Total Shareholder 246% 33% Return (TSR) Note: Start date for TSR is 9/18/2000. DNB Investor Day Presentation 8 | 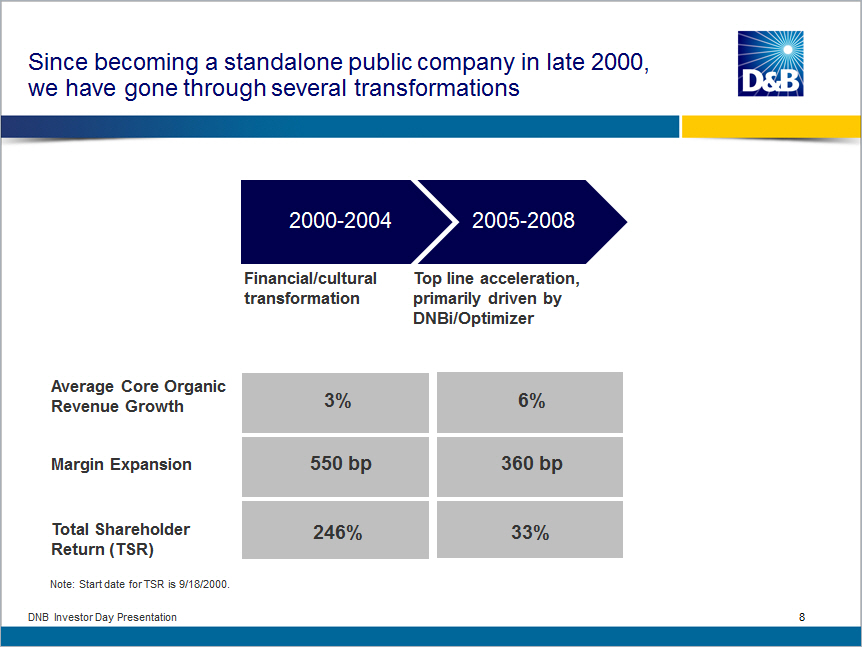 |
By 2009, we faced an increasingly demanding customer and a more competitive market 2000-2004 2005-2008 2009-Today o Global financial crisis reduced demand for credit reports o Explosion of information online created opportunities to bring new value to customers o Competition narrowing the gap o Our data and technology infrastructure made innovation time consuming and costly DNB Investor Day Presentation 9 | 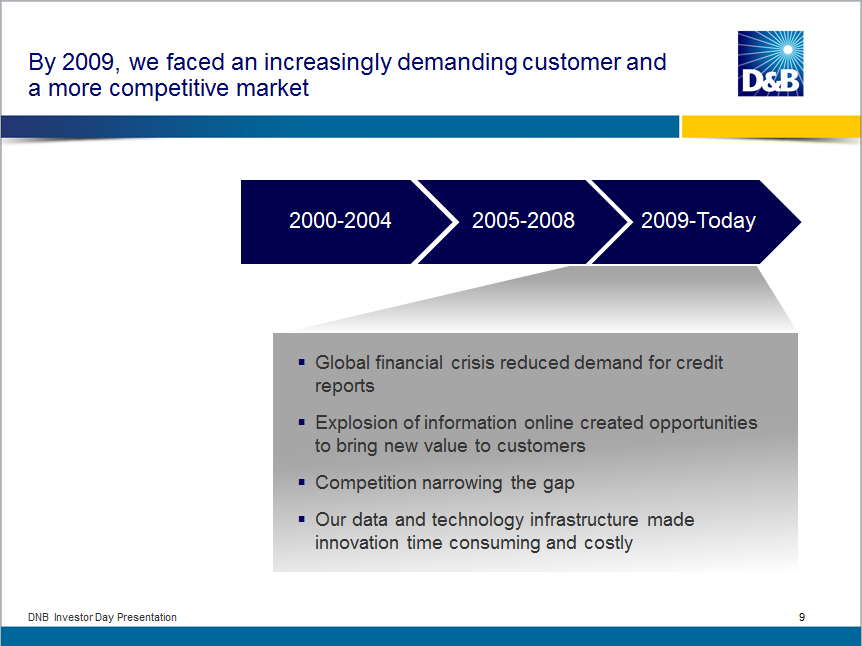 |
As a result, we recognized the need to evolve beyond just commercial decisions ... To be the most trusted source of Commercial Insight so our customers can Decide with Confidence o Largest global commercial database o Proprietary IP o Industry standard credit risk scores o Platforms to enable process efficiency DNB Investor Day Presentation 10 | 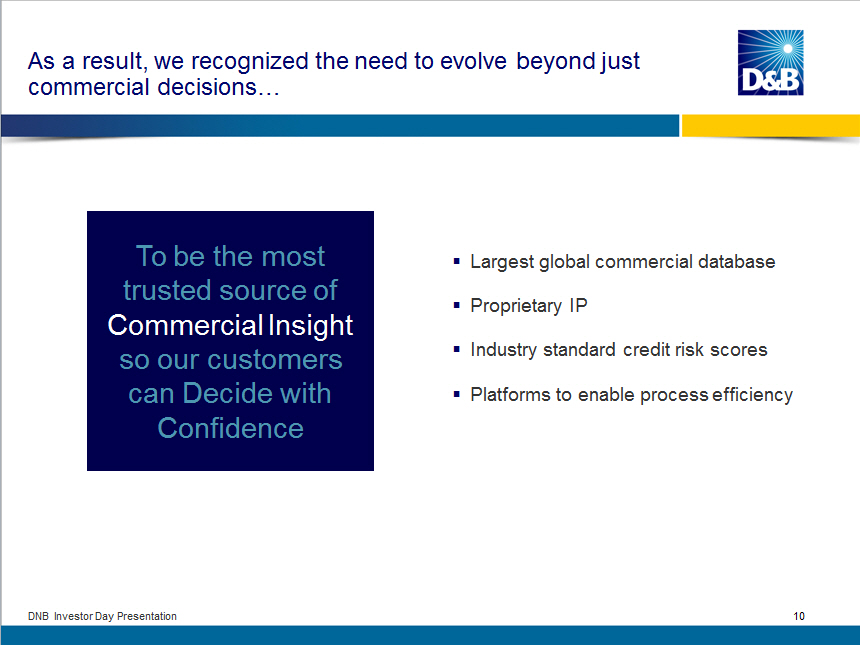 |
....to an Informed Perspective that is pervasive in the marketplace To be the most trusted source of Commercial Insight so our customers can Decide with Confidence To deliver an Informed Perspective that is Pervasive in the marketplace DNB Investor Day Presentation 11 | 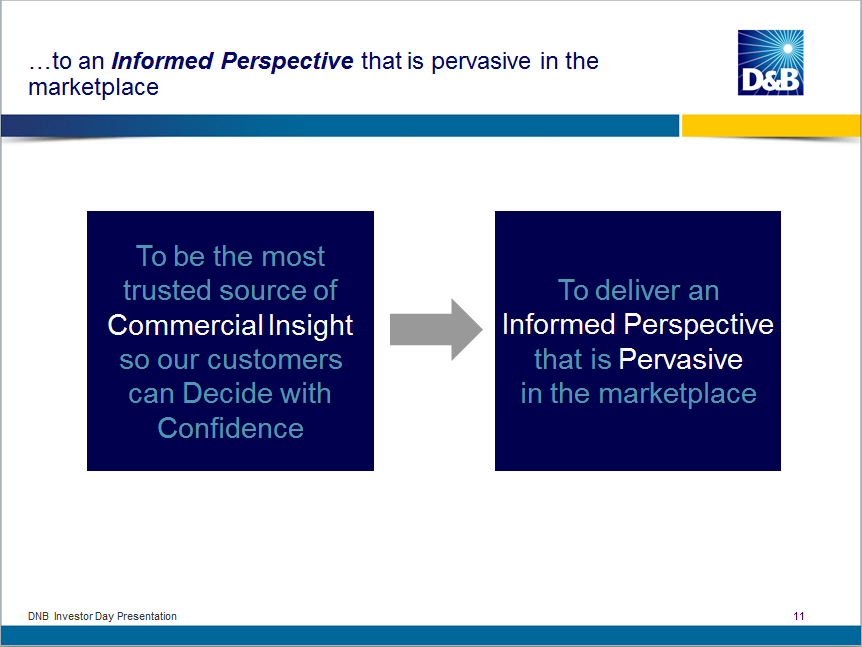 |
Over the past few years, we delivered a flat top line and suboptimal TSR as we focused on building the foundation for growth 2009-2012 Financial crisis and infrastructure rebuild Average Core Organic 0% Revenue Growth Margin Expansion 230 bp TSR 10% Key Accomplishments o Infrastructure rebuild - Services layer built - Data supply chain running in 1 market o Portfolio pruning/consolidation - Traditional S and MS consolidation - Divested Purisma/AllBusiness/SAS - Japan/Italy partnerships o Initiated $1B share repurchase program DNB Investor Day Presentation 12 |  |
With the heavy lifting behind us, we believe we are poised to return to growth and sustainable TSR Revenue Growth Scalable Business Model Total Shareholder Return Strong Capital Stewardship DNB Investor Day Presentation 13 | 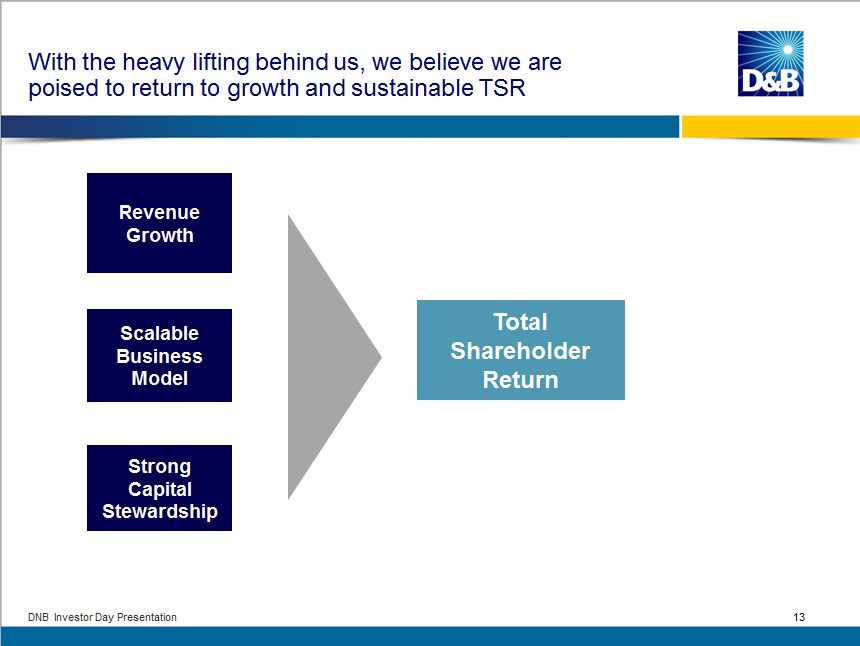 |
Today, key leaders on my team will discuss the progress we have made to drive sustainable TSR Josh Peirez President, Global Product, Marketing, and Innovation Paul Ballew Senior Vice President, Chief Data and Analytics Officer and Chief Economist Emanuele Conti President, North America Byron Vielehr President, International and Global Operations Rich Veldran Senior Vice President and Chief Financial Officer DNB Investor Day Presentation 14 |  |
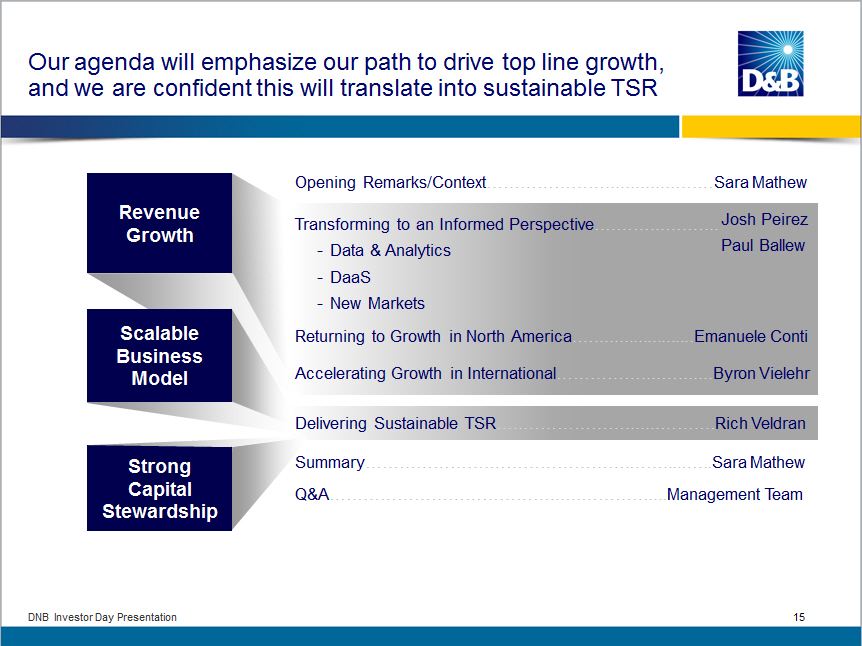
Our agenda will emphasize our path to drive top line growth,
and we are confident this will translate into sustainable
TSR


Revenue
Growth

Scalable Business Model

Strong Capital Stewardship


Opening Remarks/Context........................Sara Mathew

Transforming to an Informed Perspective....... Josh Peirez
                                               Paul Ballew
- Data and Analytics

- DaaS

- New Markets

Returning to Growth in North America........Emanuele Conti

Accelerating Growth in International.........Byron Vielehr

Delivering Sustainable TSR....................Rich Veldran

Summary........................................Sara Mathew

Q and A....................................Management Team


DNB Investor Day Presentation 15
|  |
Transforming to an Informed Perspective Revenue Growth Opening Remarks/Context........................Sara Mathew Transforming to an Informed Perspective .......Josh Peirez - Data and Analytics - DaaS - New Markets DNB Investor Day Presentation 16 |  |
We are on a journey to transform D and B and redefine what we stand for in the market Informed Perspective that is Pervasive Decide with Confidence Level of Predictiveness Level of Integration in Delivery of Information/Insight An Informed Perspective... ....puts the future in focus ....delivers indispensable guidance so customers can see what's next ....is available where and when customers need it DNB Investor Day Presentation 17 |  |
An Informed Perspective helps customers take their businesses where they want to go Where do you want to take your business? DNB Investor Day Presentation 18 | 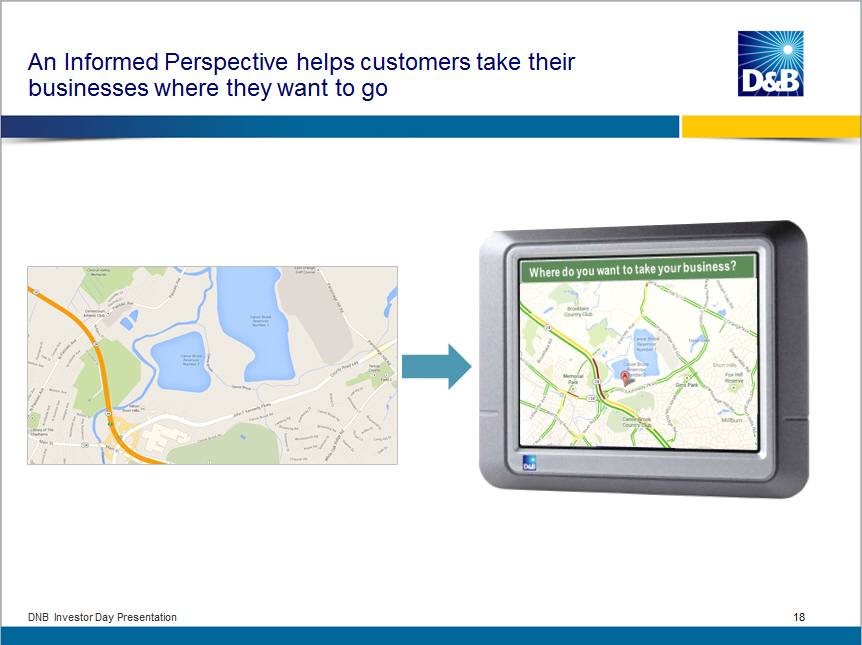 |
At the core of our transformation, we are focused on shifting from tactical decision support to indispensable guidance Informed Perspective that is Pervasive Decide with Confidence o Data and insights that are unparalleled o Available on demand, when and where the customer needs it Level of Predictiveness Level of Integration in Delivery of Information/Insight DNB Investor Day Presentation 19 | 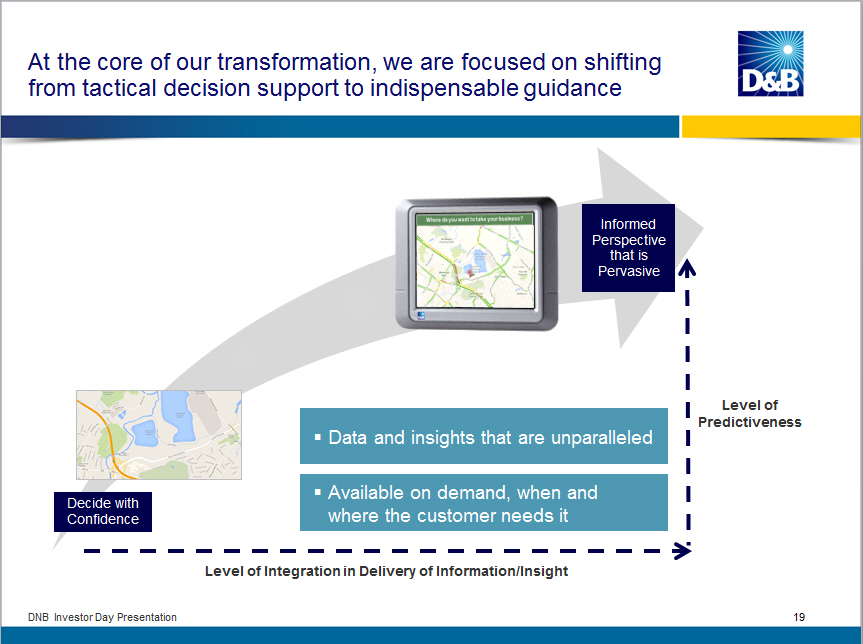 |
Delivering an Informed Perspective creates new value for our customers To deliver an Informed Perspective that is Pervasive in the marketplace Predictive Data and Analytics Insights that drive action for the customer DaaS Delivery mechanism for D and B data and insight where and when customers want through the cloud New Markets New customer value by solving unmet needs in adjacent markets with new products DNB Investor Day Presentation 20 | 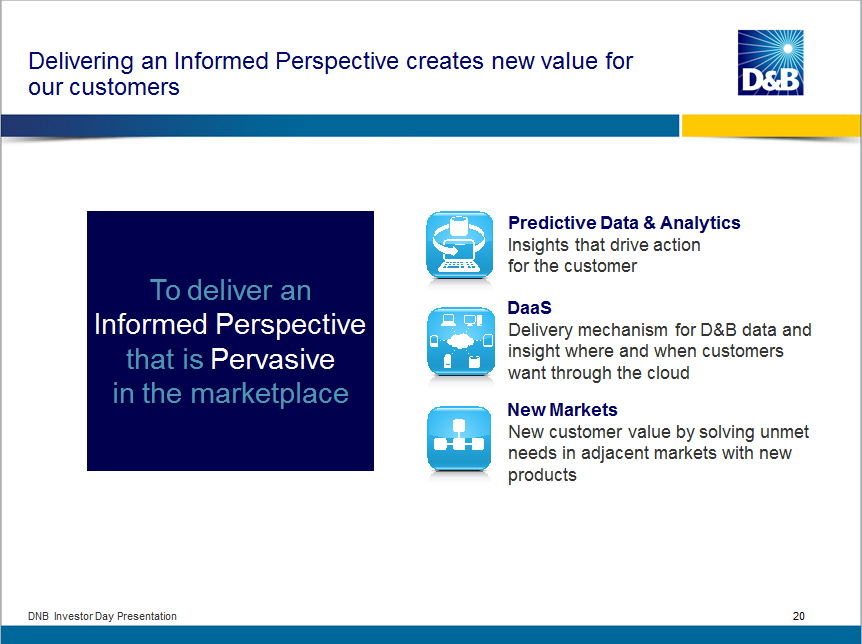 |
We are significantly expanding our target market Global Market Size ~$2B High Single to Double Digit Growth New Markets >$3B High Single Digit Growth DaaS TBD Mobile ~$12B+ ~$3B Mid Single Digit Growth ~$7B Sales and Marketing Information ~$4B Low Single Digit Growth Commercial Credit Traditional Target Market Definition New Target Market Definition Source: Outsell, D and B Analysis DNB Investor Day Presentation 21 |  |
Our predictive data and analytics deliver insights that drive action for the customer Informed Perspective that is Pervasive Transform insights into action that is pervasive across platforms and devices Paul Ballew Leverage predictive elements to deliver insight on demand Integrate assets with customer data Deepen standalone foundational knowledge Decide with Confidence Level of Predictiveness Level of Integration in Delivery of Information/Insight DNB Investor Day Presentation 22 | 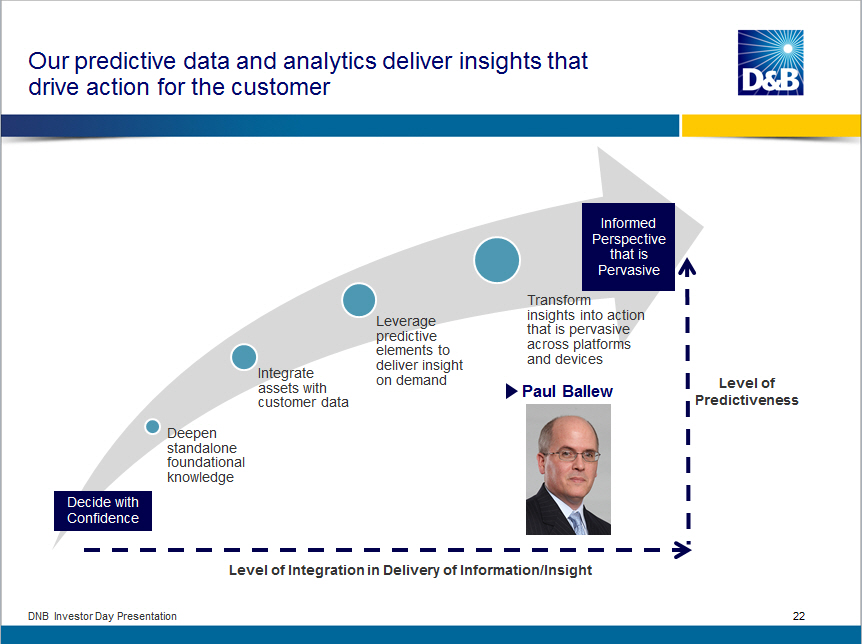 |
Forces shaping the business environment are creating greater complexity for customers SLOW ECONOMIC GROWTH: Companies are forced into new behaviors and facing vastly different competition BIG DATA: Changes in the availability and nature of information GLOBALIZATION: Information is massively connected, created and consumed everywhere ONGOING TECHNOLOGICAL CHANGE DNB Investor Day Presentation 23 | 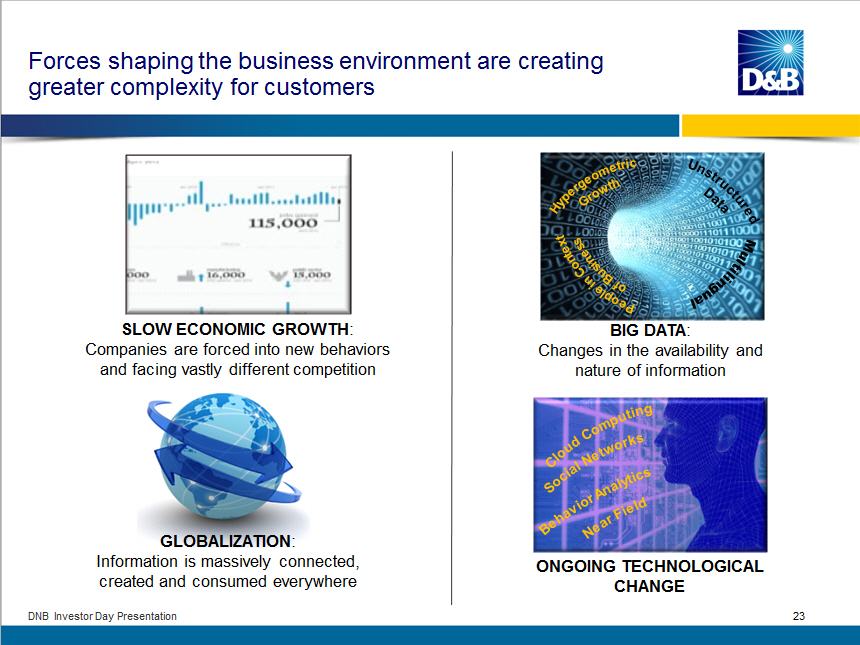 |
We generate big insight by first deepening our foundational knowledge on commercial entities Predictive Data and Analytics Level of Predictiveness Informed Perspective that is Pervasive Global Data Completeness Deepen standalone foundational knowledge Decide with Confidence Level of Integration in Delivery of Information/Insight DNB Investor Day Presentation 24 |  |
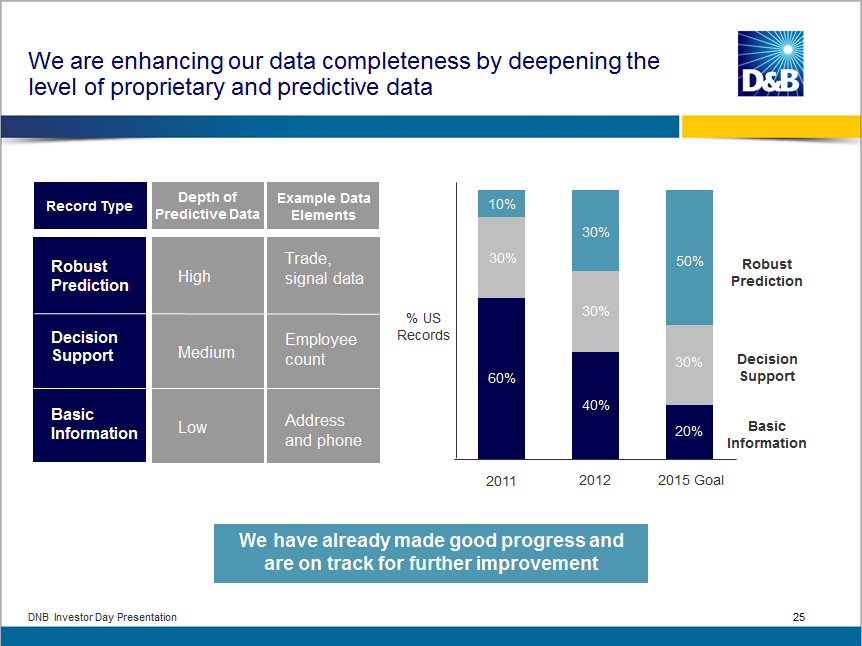
We are enhancing our data completeness by deepening the
level of proprietary and predictive data


Record Type     Depth of         Example Data
                Predictive Data  Elements

Robust          High             Trade, signal data
Prediction

Decision        Medium           Employee count
Support

Basic           Low              Address and phone
Information

% US Records

10%   30%   50% Robust Prediction

30%   30%   30% Decision Support

60%   40%   20% Basic Information

2011  2012  2015 Goal


We have already made good progress and are on track for
further improvement


DNB Investor Day Presentation 25
|  |
Next, we integrate our foundational knowledge through a process called identity resolution Predictive Data and Analytics Informed Perspective that is Pervasive Identity Resolution Integrate assets with customer data Deepen standalone foundational knowledge Decide with Confidence Level of Predictiveness Level of Integration in Delivery of Information/Insight DNB Investor Day Presentation 26 |  |
D and B has unmatched capability to accurately connect disparate information to create a 360 view of a business D and B's entity matching: o Brings together disparate pieces of data o Finds what's related and pulls it together in context o Combines all data into a single view of business Our competitive advantage: o Proprietary matching technology o Highly tuned to D and B's global data o Works across multiple languages o Allows customers to connect otherwise disconnected pieces of insight Locations Executives Industry Financial Business contacts One Business Ownership History Competitors Suits, liens, judgments DNB Investor Day Presentation 27 | 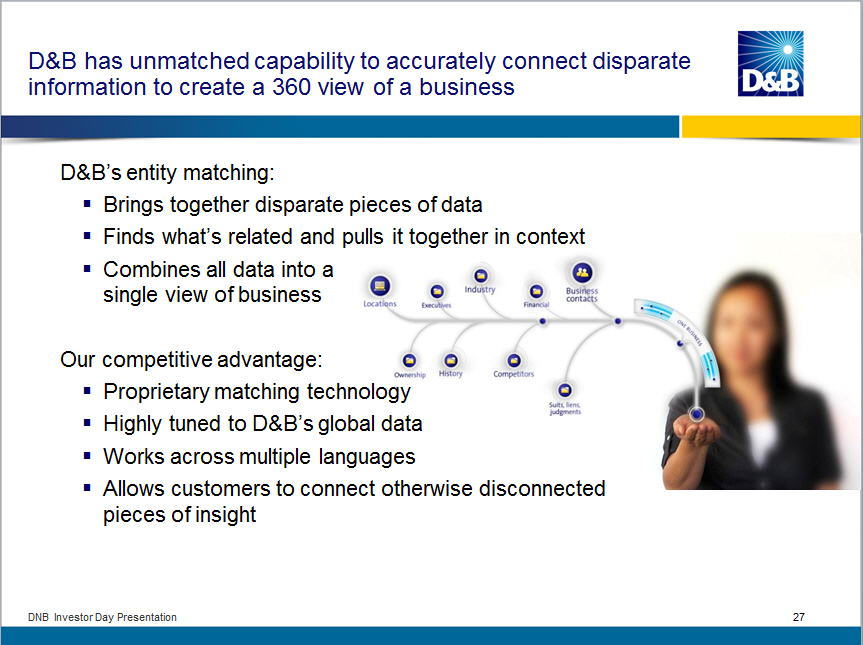 |
Connecting two pieces of disparate information can go far beyond simple character recognition D and B Global, US HQ Est. 1841 "Dun and Bradstreet" DNB Investor Day Presentation 28 | 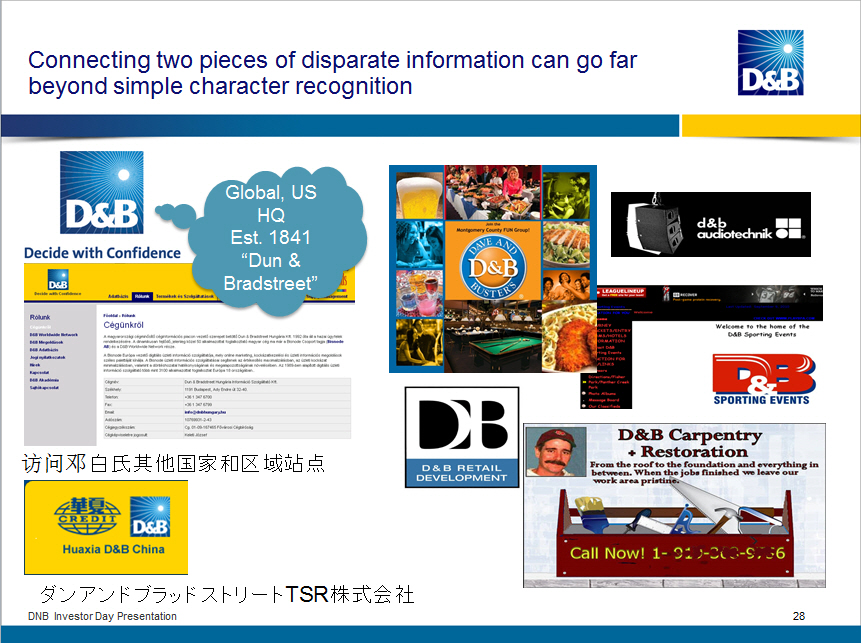 |
Finally, the challenge of identity resolution is increasing as the nature of business is changing Virtual Businesses Boxpark Translation Challenges "If not with experienced people, do not pass this warning sign". Unstructured Data DNB Investor Day Presentation 29 | 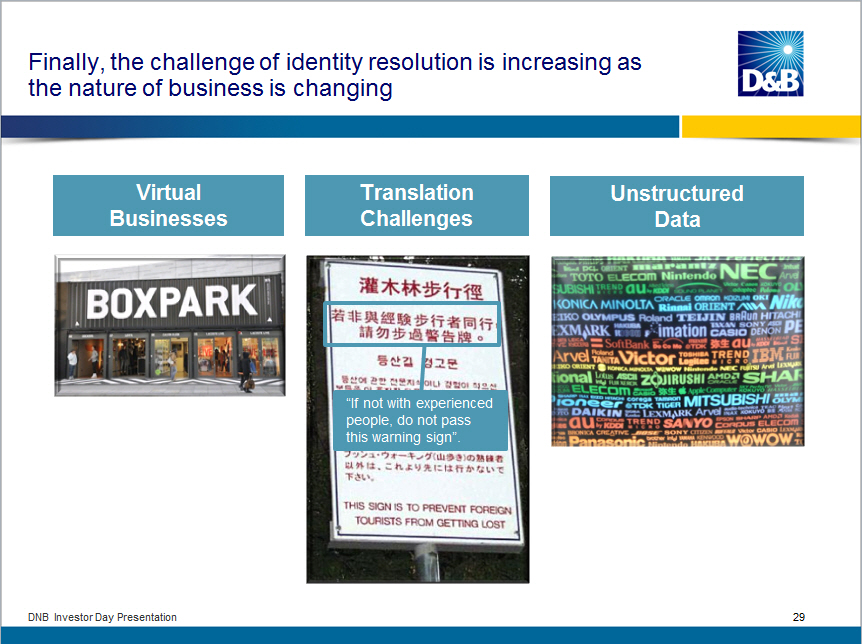 |
In Asian scripts, the complexities increase significantly Xiamen Suo Fei Te Hotel [NAME] Xiamen Lake Side (Hu Bing Bei Lu) North Road #19 [LOCATION] Same hotel (Fujian province added at beginning [LOCATION] Xiamen Sofitel Hotel Western Business In Asia Note: "Sofitel" is a registered trademark of SOLUXURY HMC Societe a Responsabilite Limitee. Use of the "Sofitel" name is for illustrative purposes only and does not suggest any endorsement or affiliation with Sofitel. DNB Investor Day Presentation 30 | 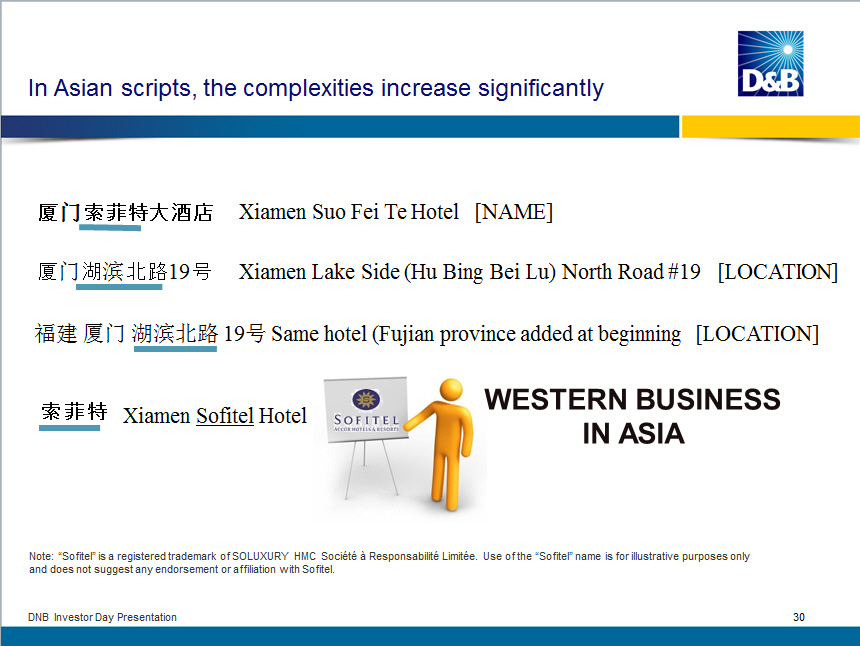 |
With knowledge and identity resolution as the foundation, we are adding predictive analytics to create an Informed Perspective Predictive Data and Analytics Informed Perspective that is Pervasive Transform insights into action that is pervasive across platforms and devices More predictive analytics Leverage predictive elements to deliver insight on demand Integrate assets with customer data Deepen standalone foundational knowledge Decide with Confidence Level of Predictiveness Level of Integration in Delivery of Information/Insight DNB Investor Day Presentation 31 | 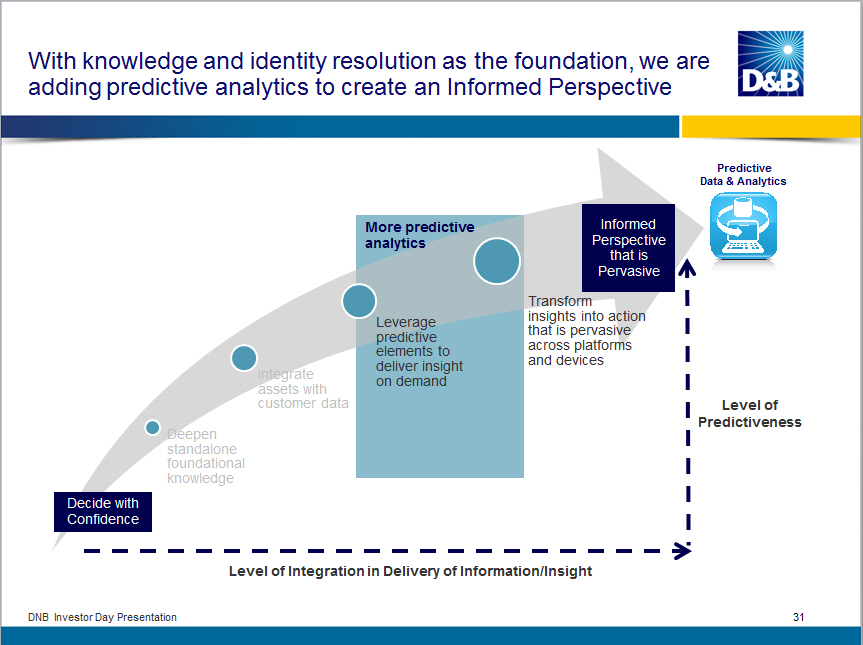 |
Our proprietary and predictive data, world class talent and IP allow us to deliver an Informed Perspective to our customers Better leverage existing data e.g. Trade Add new proprietary and predictive data sources o Behavior Data o Sentiment Data o "Signals" o Etc. World Class Predictive Analytics Shop o Talent o Proprietary IP Flexible Infrastructure Informed Perspective DNB Investor Day Presentation 32 | 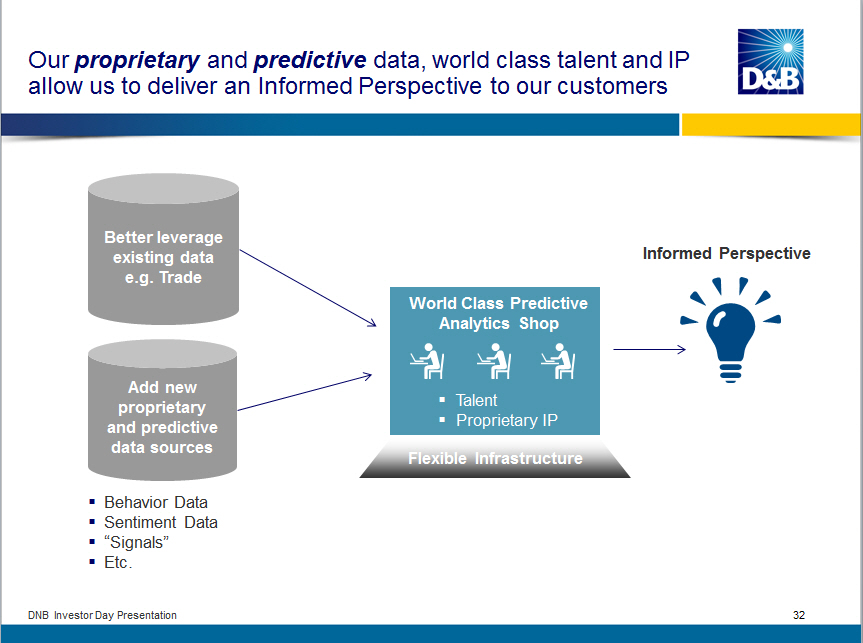 |
These efforts underpin the launch of several new predictive solutions in 2013 D and B Delinquency Predictor D and B Total Loss Predictor D and B Viability Rating Supplier Evaluation Risk Rating Custom Analytics Customer Benefit +20% average lift in predictiveness on late payments First of its kind score used as a knockout and likelihood of never paying Multi-dimensional score which allows for improved targeting Identifies operational risk in the supply chain Addresses areas of unmet customer need DNB Investor Day Presentation 33 | 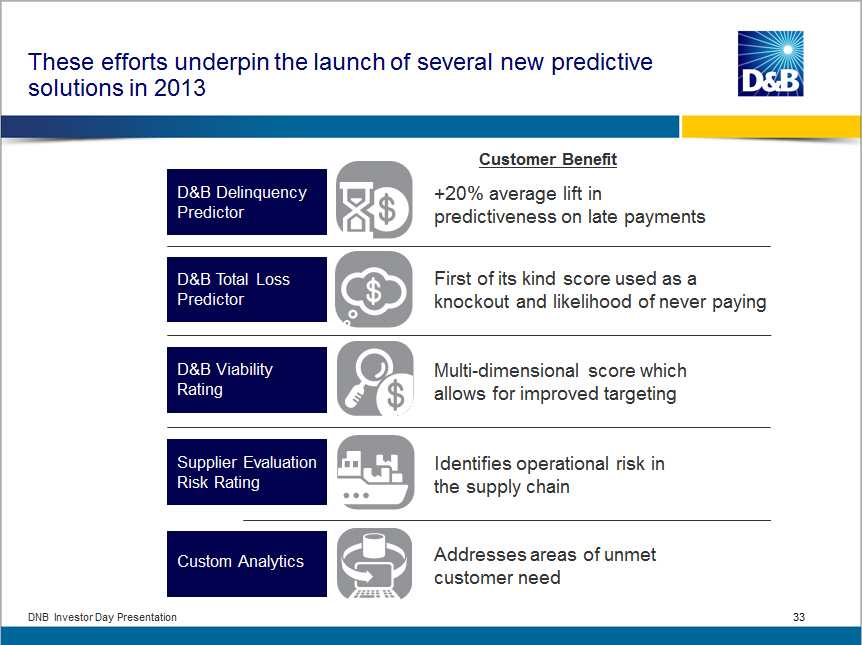 |
The new D and B Viability Rating is just one example of how we intend to differentiate in the market 5 Viability Score 8 Portfolio Comparison C Data Depth Indicator J Company Profile Customer Value o Provides customer with full transparency of both what D and B believes and why we believe it o Allows for custom modeling by largest customers o Nothing else like it in the market DNB Investor Day Presentation 34 |  |
Looking ahead, you can expect predictive insights and analytics to become the key differentiator in the market relative to competition US o Marketing Analytics o Supply Chain Analytics o Addition of country risk to Viability Rating Developed Global Markets o New Standard Scores o Viability Rating Emerging Global Markets o New Standard Scores o Severe Risk Analytics DNB Investor Day Presentation 35 | 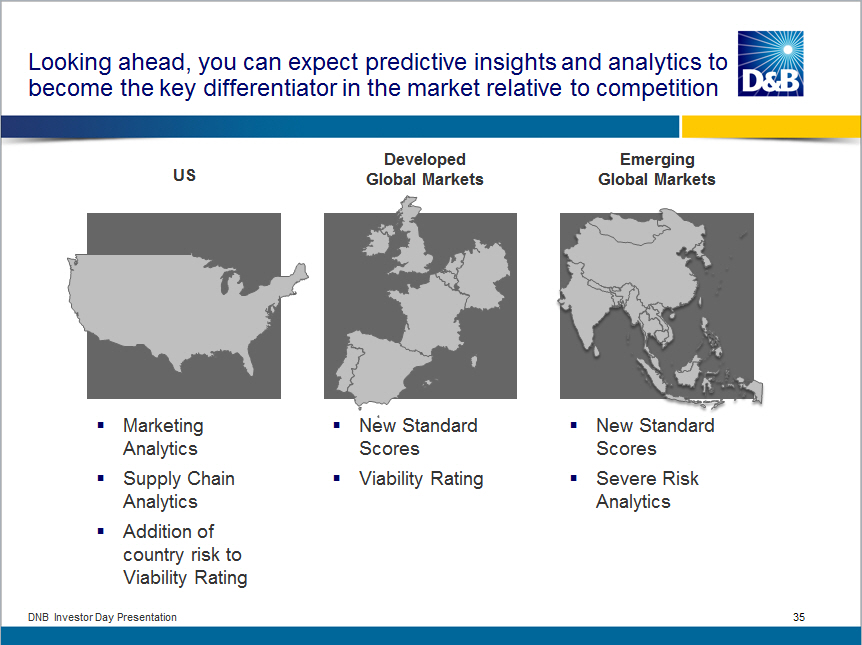 |
Customer Video - Xerox |  |
We will become pervasive through DaaS Predictive Data and Analytics DaaS Informed Perspective that is Pervasive Deepen standalone foundational knowledge Integrate assets with customer data Leverage predictive elements to deliver insight on demand Transform insights into action that is pervasive across platforms and devices Decide with Confidence Level of Predictiveness Level of Integration in Delivery of Information/Insight DNB Investor Day Presentation 37 | 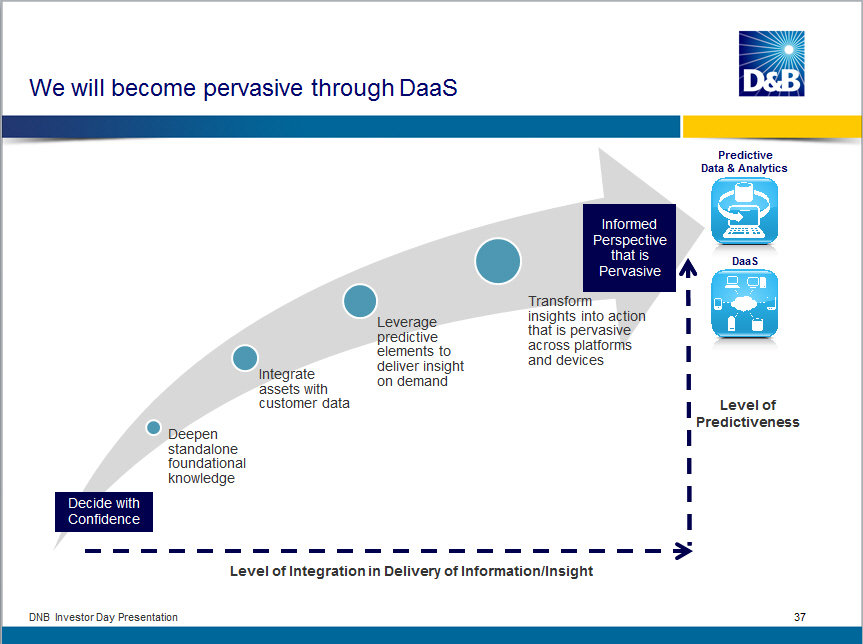 |
What is DaaS? D and B's Informed Perspective in the cloud, embedded into applications and customer workflows DNB Investor Day Presentation 38 | 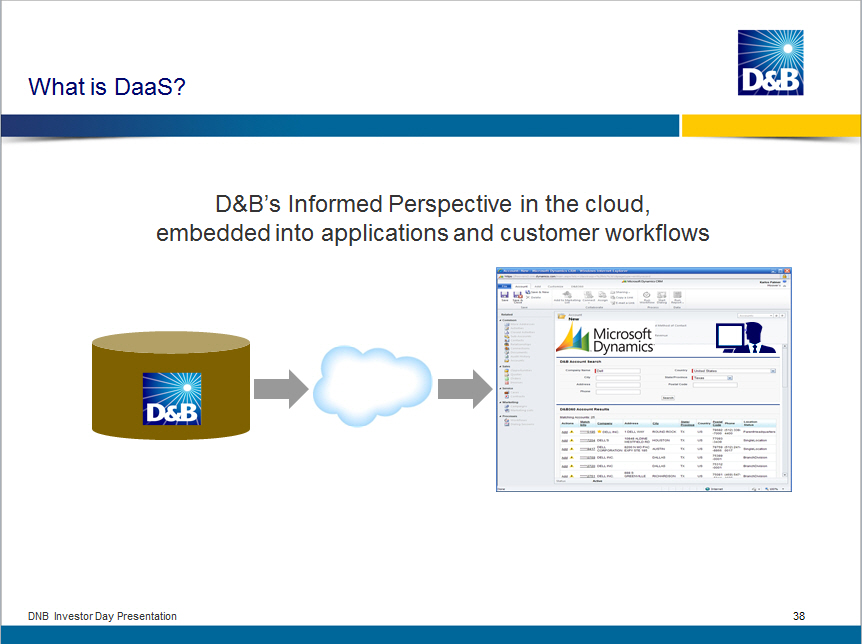 |
DaaS creates significant value for customers Reduces the need for internal spending on data management and integration Improves the quality of data within workflows Eliminates the need for users to source information through multiple applications Measurable customer ROI o Fewer staff o Faster decision making DNB Investor Day Presentation 39 | 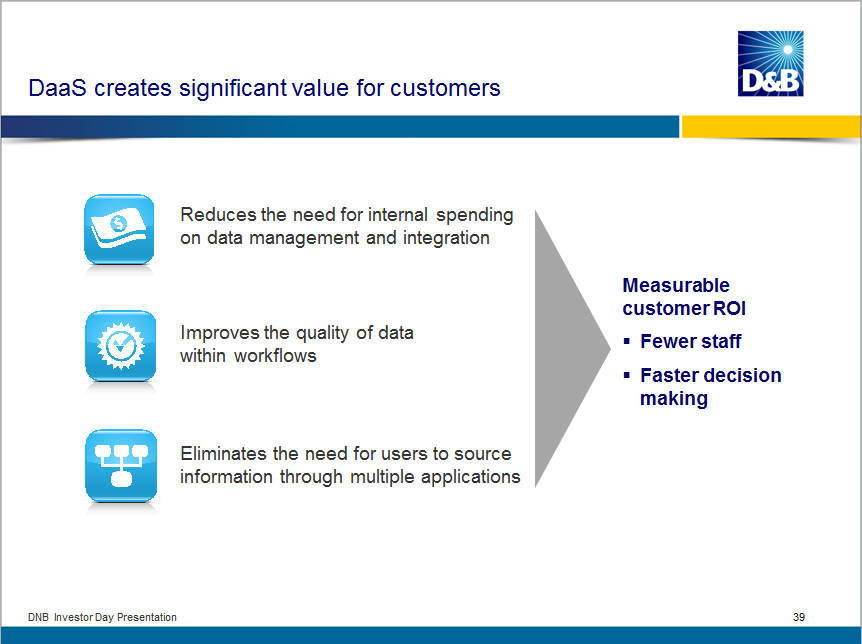 |
DaaS delivers our information where it needs to be for us to be relevant in helping answer customer questions o Should I do business with this entity, and if so, on what terms? o Where are my biggest growth opportunities? o How do I make more money? DNB Investor Day Presentation 40 | 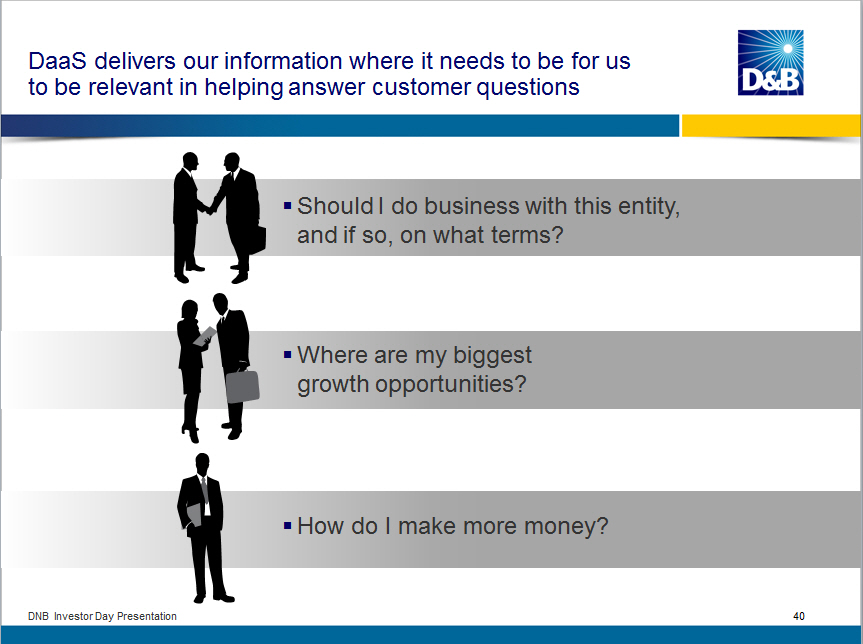 |
DaaS enables our Informed Perspective to be available on demand, where and when customers need it Operations Marketing Sales and Service Finance/Business Intelligence Workflow Applications MDM Procurement CRM Marketing Automation CRM ERP Business Intelligence Example Use Cases Supplier and Distributor Performance Order Management Predictive Segmentation and Targeting Social/Digital Intelligence Territory Management Sales Rep Preparation Collections Prioritization Integrated Decisioning and Monitoring Initial Focus Areas DNB Investor Day Presentation 41 | 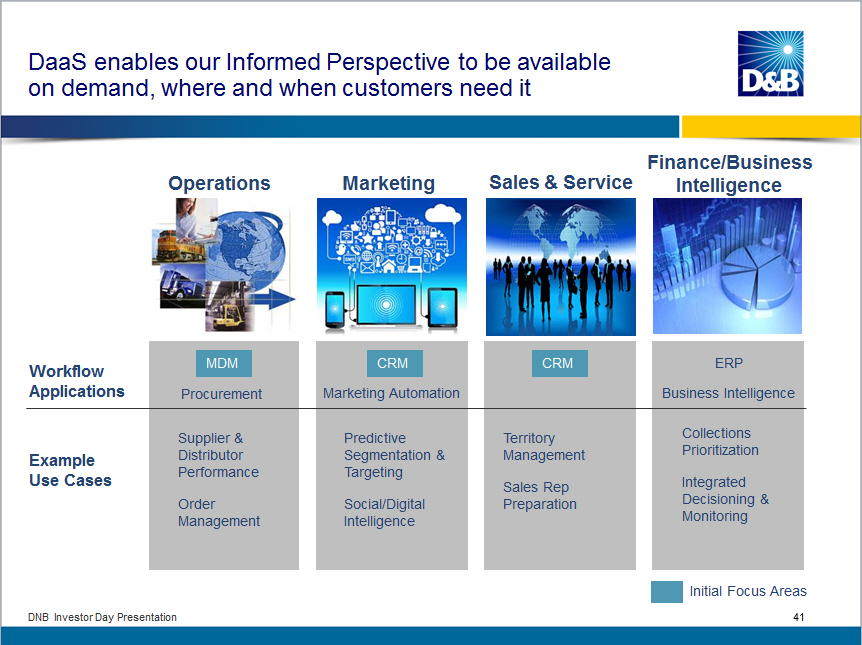 |
We are driving DaaS both directly and through strategic alliances, and see alliances as the larger long term opportunity D and B DaaS o D and B Direct o D and B360 for CRM and MDM o Mobile More from existing large customers ~$1B market opportunity Alliance DaaS o Salesforce.com o Microsoft VARS o Mobile developers New small/mid-sized customers >$2B market opportunity DNB Investor Day Presentation 42 | 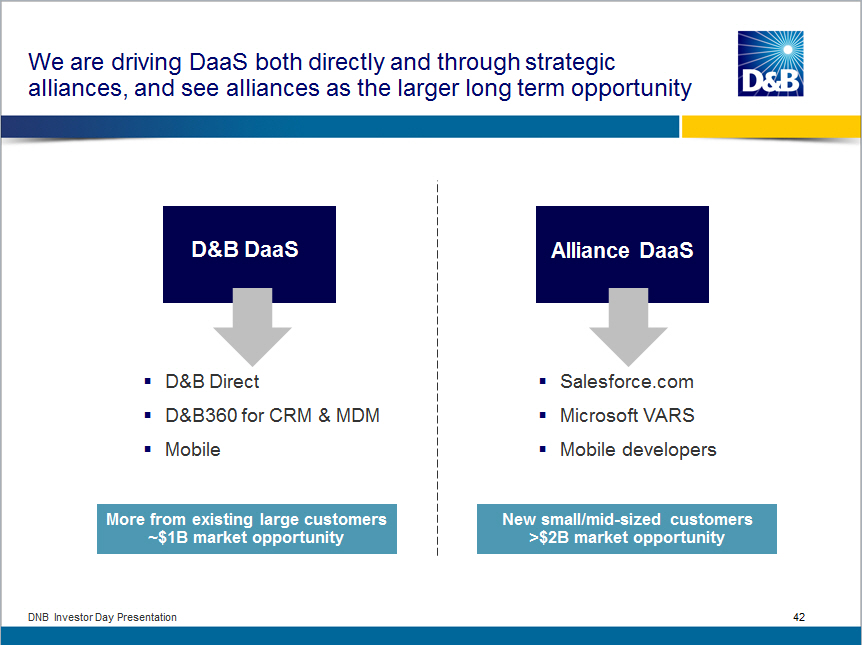 |
Alliance DaaS Video - Salesforce.com |  |
Our new capabilities in data and analytics and DaaS also enable us to enter new markets Predictive Data and Analytics Informed Perspective that is Pervasive DaaS Integrate assets with customer data Leverage predictive elements to deliver insight on demand Transform insights into action that is pervasive across platforms and devices New Markets Decide with Confidence Deepen standalone foundational knowledge Level of Predictiveness Level of Integration in Delivery of Information/Insight DNB Investor Day Presentation 44 | 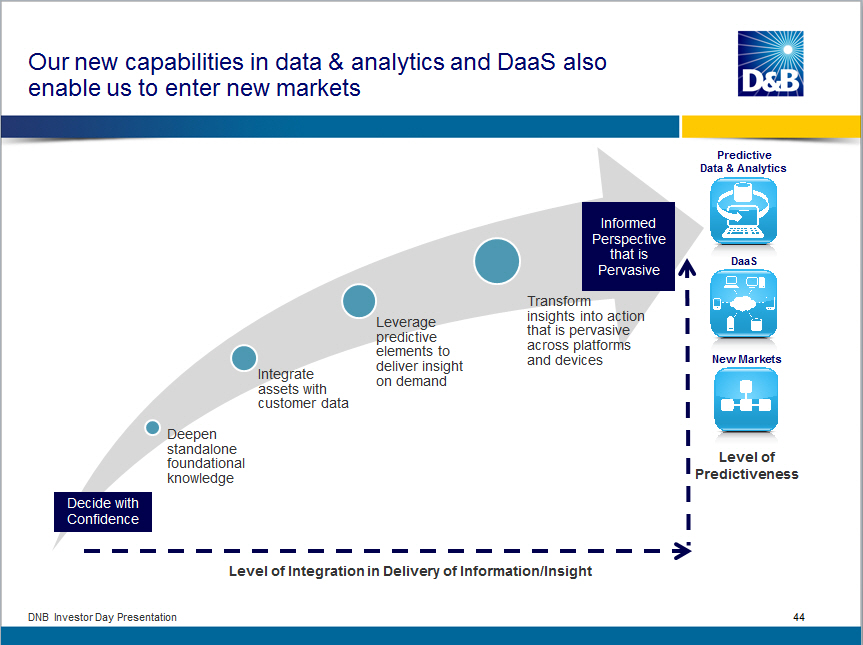 |
Compliance screening is focused on helping customers manage regulatory exposure from third parties Third-Party Compliance Screening Regulatory Exposure Segment Ethics / Anti- Corruption FCPA UK Bribery Act Sanctions and Export Controls OFAC CISADA Anti-Money Laundering, KYC Bank Secrecy Act USA Patriot Act Financial Institutions Non-Financial Institutions DNB Investor Day Presentation 45 | 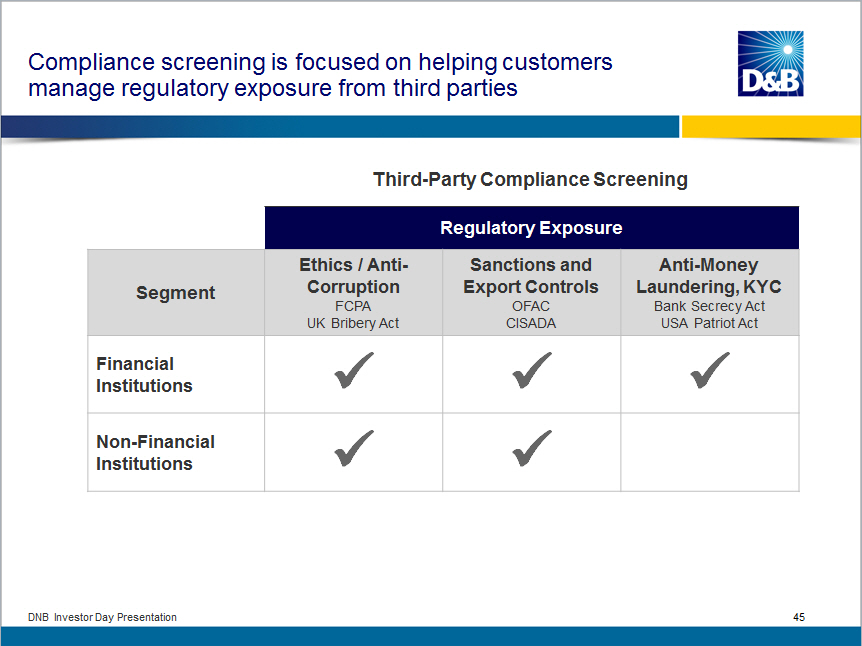 |
We are leveraging our improved data and analytics capabilities to solve customer pain points in compliance D and B Value Proposition Customer Pain Points Addressed Capabilities Leveraged o Better protection against regulatory exposure from more comprehensive data o Lower internal costs to use from superior matching o Lower cost to buy due to targeted use of audits on highest risk entities o Incomplete solutions that leave customers exposed o High incidence of false positives which require manual work o Expensive audits on all third parties Global Data Completeness Identity Resolution Predictive Analytics DNB Investor Day Presentation 46 | 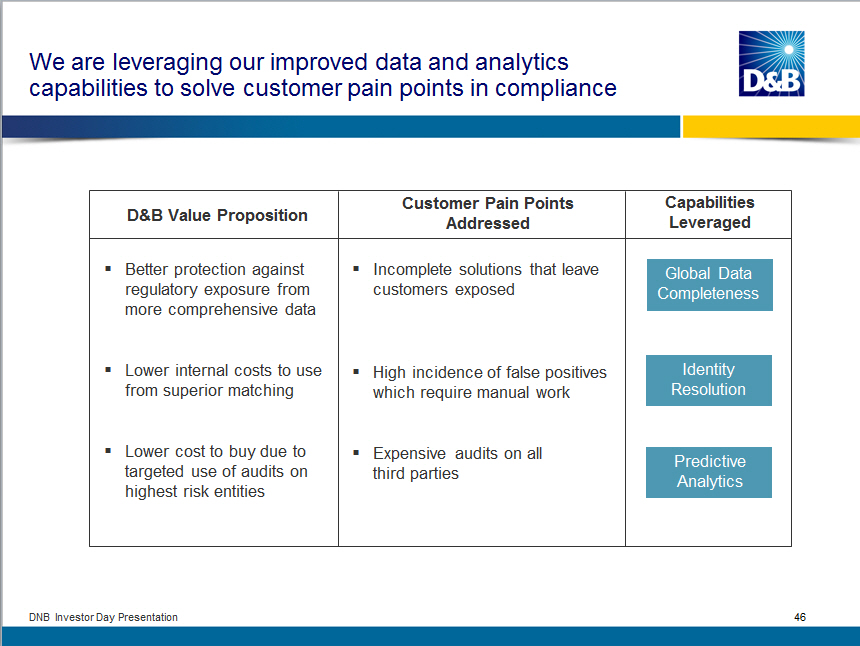 |
Beyond compliance, customer needs in supply chain risk management are being shaped by extended supply chains Challenge Global supply chains, resulting from - Low cost sourcing - Specialization in engineered parts - Subcontracting ....with no margin for error Extended Supply Chains Risk of disruption and brand damage DNB Investor Day Presentation 47 | 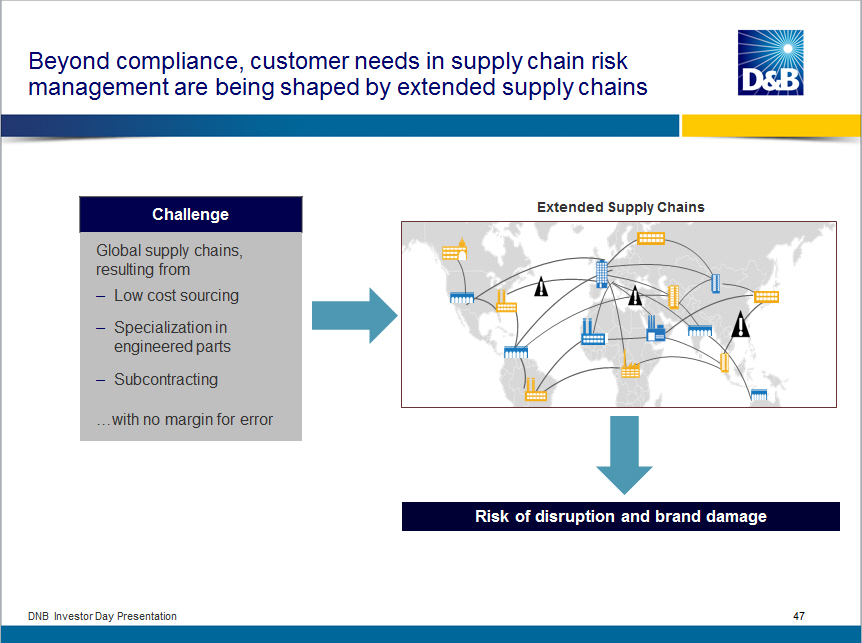 |
To address these needs, we are developing insight on risk across the extended supply chain Multi-tier Supply Chain Visibility Customer Supplier Supplier Supplier Supplier Supplier Supplier Supplier Supplier Supplier Supplier Supplier Supplier Supplier Supplier D and B Value Proposition Customer Pain Points Addressed Capabilities Leveraged o Visibility into tier 2 through n suppliers and insight into their viability o Easier to use through integration with procurement workflow o Limited knowledge of supplier base beyond tier 1 o Difficulty in judging the riskiness of suppliers o Standalone solutions that do not integrate with other applications Identity Resolution Linkage Global Data Predictive Analytics DaaS DNB Investor Day Presentation 48 | 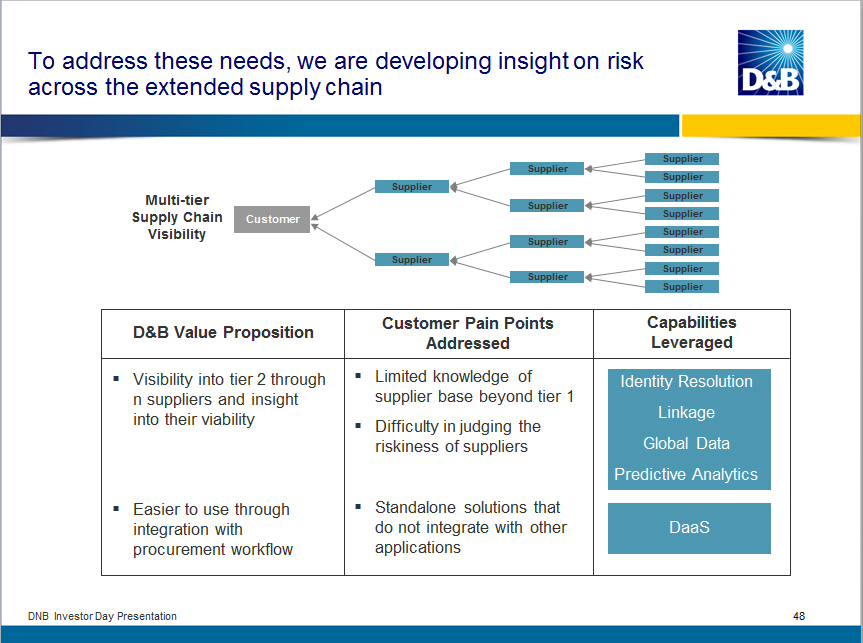 |
Finally, we see a large future opportunity to deliver an Informed Perspective through mobile apps and solutions We have a variety of mobile initiatives in test ... Mobile Reporter Mobile Prospector DNB Investor Day Presentation 49 |  |
We are significantly expanding the definition of our target market through DaaS and new markets Global Market Size >$3B High Single Digit Growth DaaS New Customers $2B Existing Customers ~$1B ~$2B High Single to Double Digit Growth New Markets TBD Mobile ~$12B+ New Target Market Definition ~$3B Mid Single Digit Growth ~%7B Sales and Marketing Information ~$4B Low Single Digit Growth Commercial Credit Traditional Target Market Definition Source: Outsell, D and B Analysis DNB Investor Day Presentation 50 | 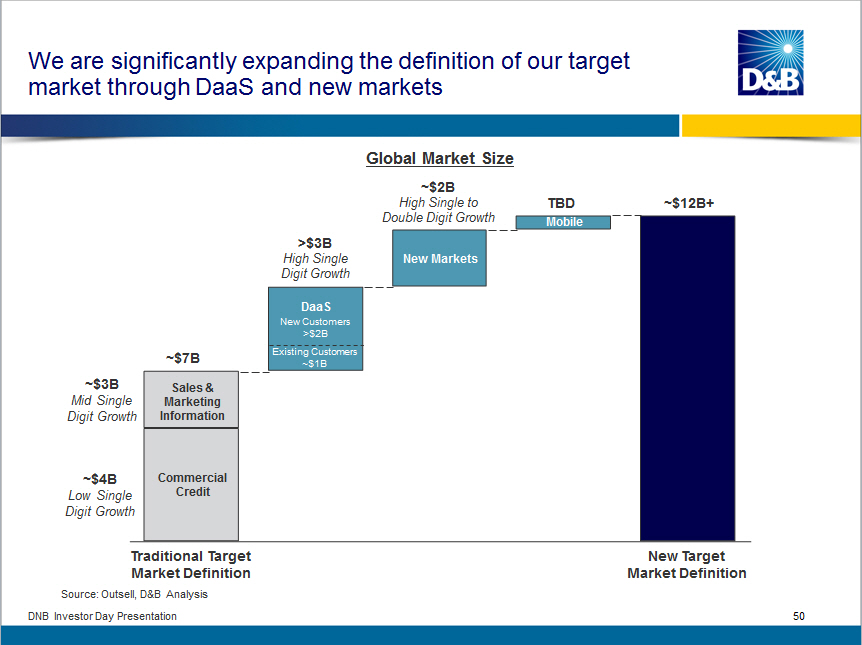 |
In summary, we are transforming to deliver an Informed Perspective for customers o We are increasing the depth of our data and creating new predictive analytics o We are leveraging our greater predictiveness and integrated delivery to enter new markets o As a result, we are significantly expanding the size of our addressable market o We are delivering these insights on-demand, and making them pervasive through DaaS DNB Investor Day Presentation 51 |  |
Returning to Growth in North America

Revenue
Growth

Opening Remarks/Context........................Sara Mathew

                                               Josh Peirez
Transforming to an Informed Perspective........Paul Ballew
- Data and Analytics

- DaaS

- New Markets

Returning to Growth in North America .......Emanuele Conti


DNB Investor Day Presentation 52
|  |
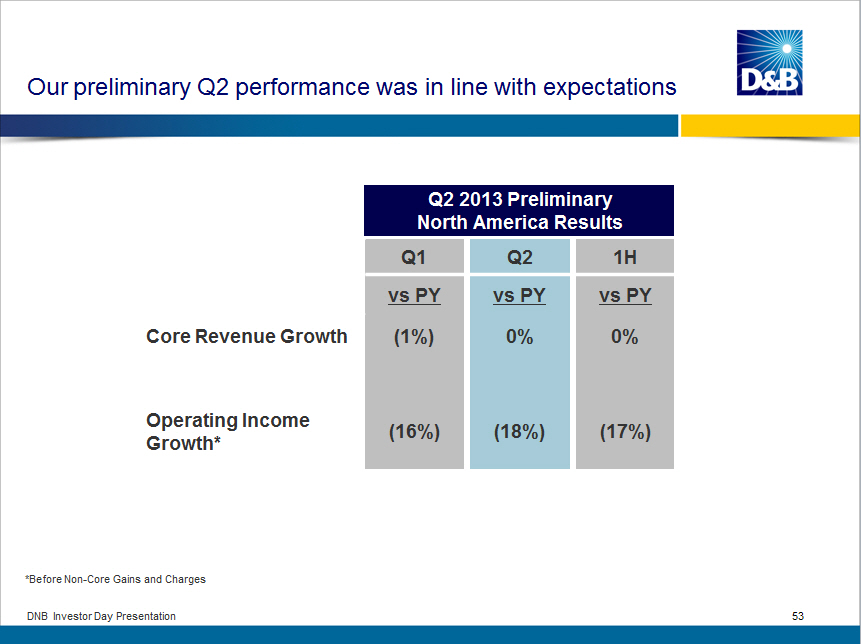
Our preliminary Q2 performance was in line with expectations


Q2 2013 Preliminary
North America Results

                     Q1      Q2      1H

                  vs PY   vs PY   vs PY

Core Revenue
Growth              (1%)    0%      0%

Operating Income
Growth*            (16%)   (18%)   (17%)


*Before Non-Core Gains and Charges


DNB Investor Day Presentation 53
|  |
Since the financial crisis, we have struggled to deliver sustained growth in North America North America Core Revenue Growth 2% 0% -1% -1% -3% 2009 2010 2011 2012 2013 1H DNB Investor Day Presentation 54 | 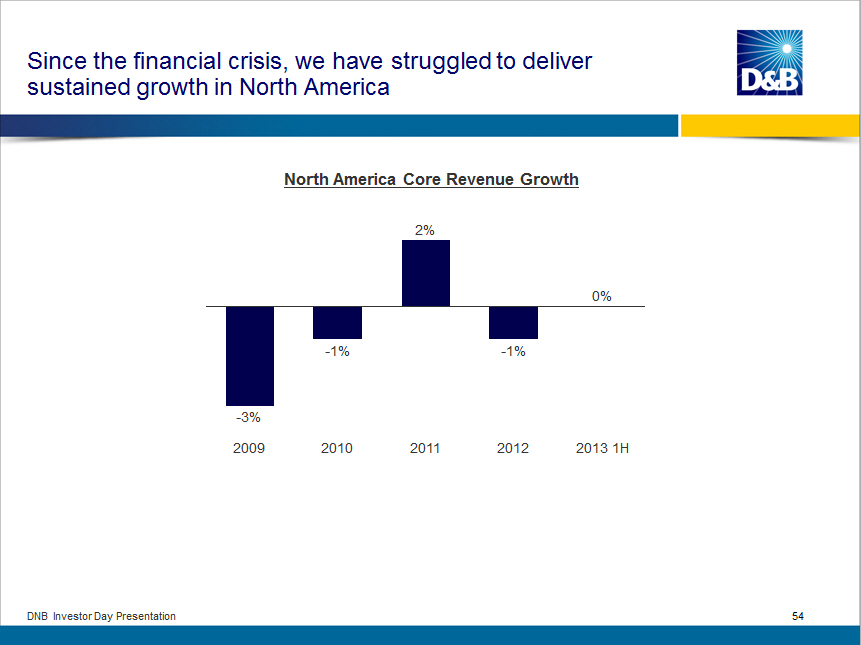 |
Our performance in North America has been challenged primarily due to a decline in RMS North America Core Revenue Growth RMS 0% -2% 0% -4% 2009 2010 2011 2012 S and MS -8% -1% 4% 3% 2009 2010 2011 2012 DNB Investor Day Presentation 55 | 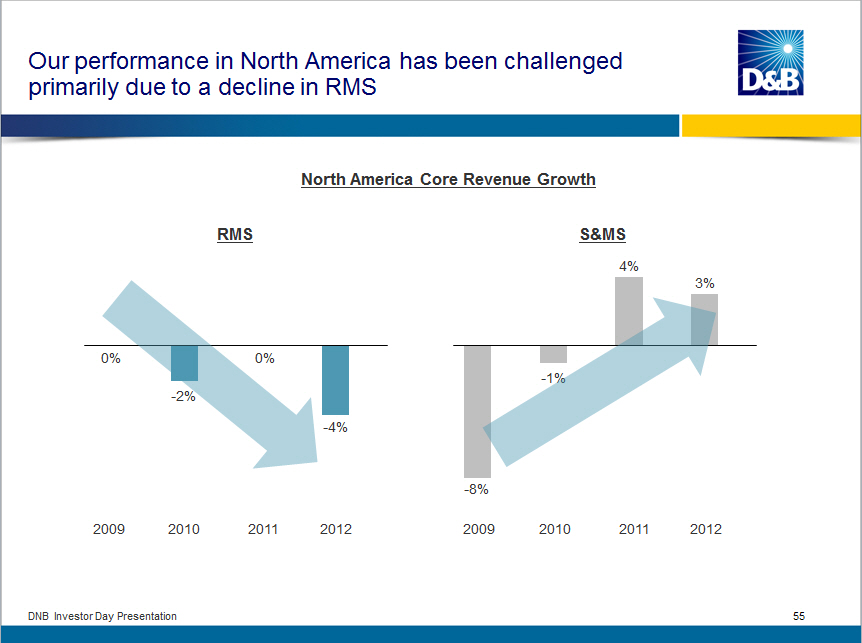 |
Our objective is to return the North America business to sustainable mid single digit growth in 3 years North America Core Revenue Growth -3% 2009 -1% 2010 2% 2011 -1% 2012 Flat to up 2013 Mid Single Digits Target 3 Years Drivers o Stabilize and grow DNBi o Grow large customers o Expand DaaS alliances to reach new customers DNB Investor Day Presentation 56 | 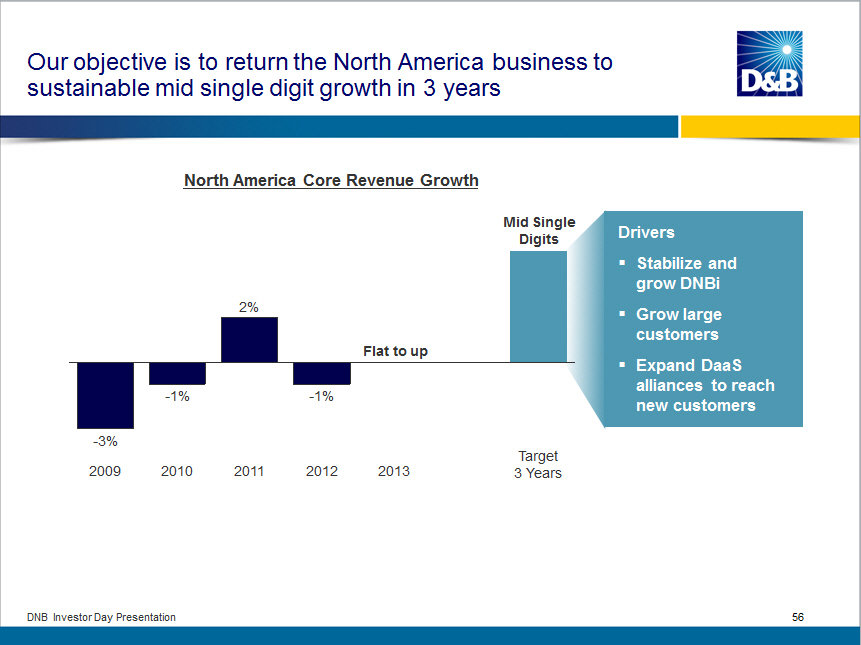 |
As context, the RMS and S and MS businesses are each comprised of two main solutions Risk Management Solutions $701M 70% 30% Sales and Marketing Solutions $525M 41% 59% Subscriptions/DNBi Projects/ Traditional VAPS o DNBi (~88%) Other o Hoover's o Optimizer/Other o Non-DNBi ? Data o MDR o DaaS Note: 2012 Core Revenue Figures DNB Investor Day Presentation 57 |  |
Our solutions address the needs of different sized customers Risk Management Solutions Sales and Marketing Solutions Customer Size Customer Size Small Mid-sized Large Small Mid-sized Large Subscriptions/DNBi Projects/ Other Grow Large Customers Traditional VAPS Stabilize and grow DNBi Grow Large Customers Reach new customers via DaaS Illustrative Informed Perspective that is Pervasive DNB Investor Day Presentation 58 |  |
To stabilize and modestly grow DNBi, we will deliver additional value to customers Stabilize and grow DNBi o Informed Perspective - Improved data quality (e.g., financial statements, global data) - More and better predictive analytics o Improved Execution - Bundling of new features to create more value (e.g., Portfolio Risk Manager) - Targeted and proactive offers We are beginning to gain traction and expect to gradually improve to low single digit growth DNB Investor Day Presentation 59 | 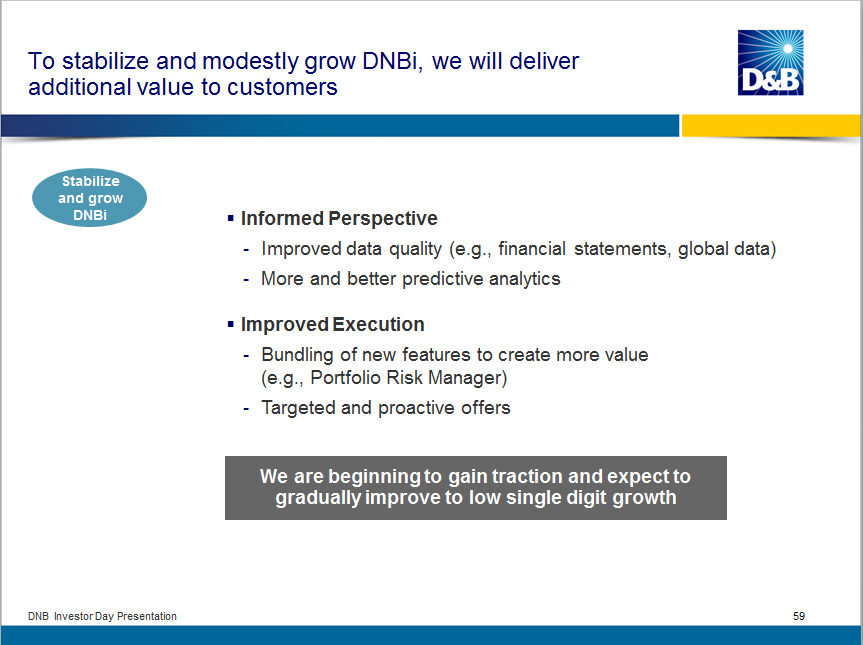 |
We have significant opportunity to grow with our large customers Grow Large Customers North America Large Customer Market ~$1B High Single Digit Growth $500 - 750M Low Single Digit Growth Improve predictive analytics D and B Expand offerings o D and B Direct o Compliance o Supply chain risk D and B Commercial Credit New Risk Use Cases DNB Investor Day Presentation 60 | 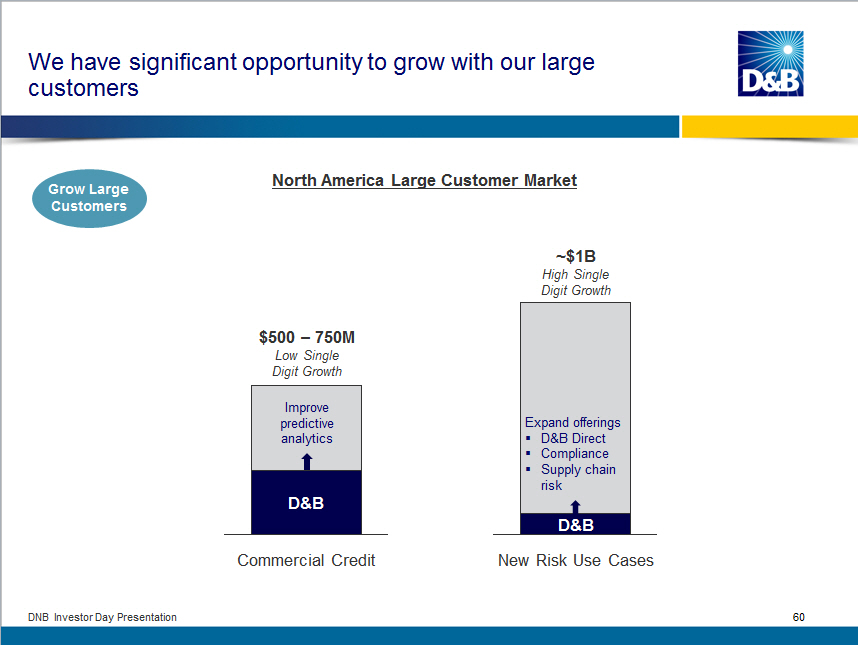 |
To capture more share, we are improving our predictive analytics Grow Large Customers Increasing Basis of Differentiation o More predictive records o New scores and ratings + Demonstrating Value to Customers o Tailor to verticals o Active pilots = Increase Share of Wallet DNB Investor Day Presentation 61 | 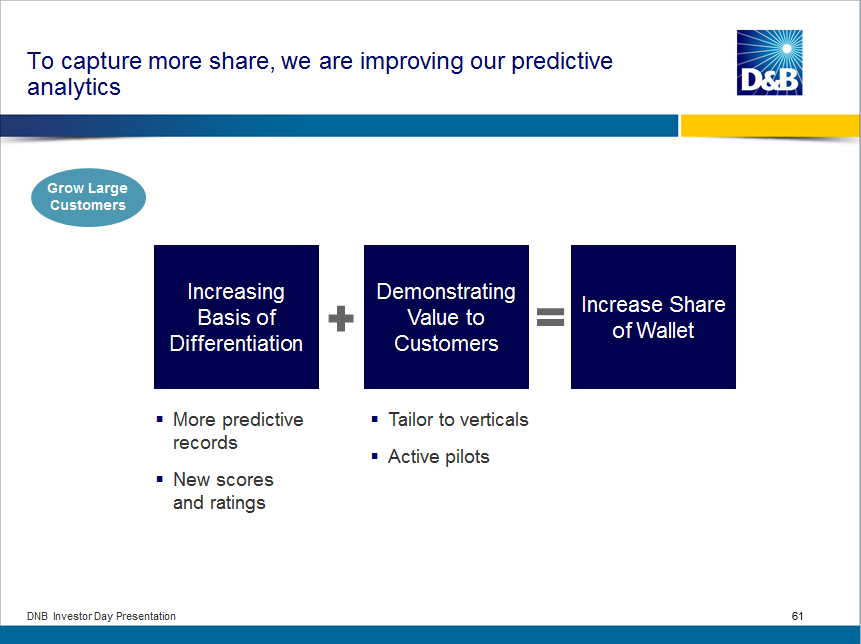 |
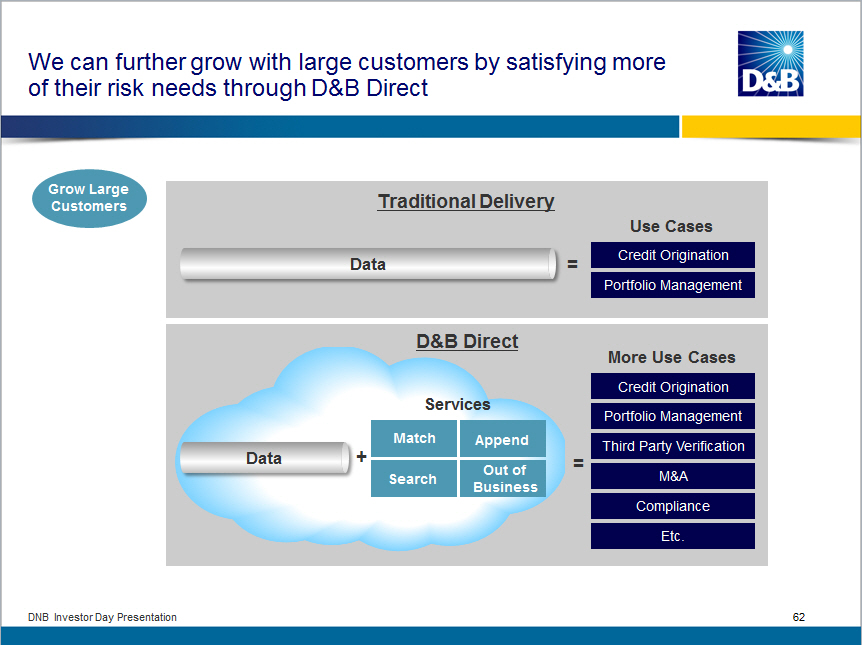
We can further grow with large customers by satisfying more
of their risk needs through D and B Direct

Grow Large
Customers

Traditional Delivery

Data = Use Cases

Credit Origination

Portfolio Management

D and B Direct

Services

Data  +  Match   Append  =
         Search  Out of
                 Business

More Use Cases

Credit Origination
Portfolio Management
Third Party Verification
M and A
Compliance
Etc.


DNB Investor Day Presentation 62
|  |
Turning to S and MS, we will accelerate growth by growing large customers and reaching new customers through DaaS Risk Management Solutions Customer Size Small Mid-sized Large Sales and Marketing Solutions Customer Size Small Mid-sized Large Subscriptions/DNBi Stabilize and grow DNBi Projects/ Other Grow Large Customers Traditional Grow Large Customers VAPS Reach new customers via DaaS Informed Perspective that is Pervasive DNB Investor Day Presentation 63 | 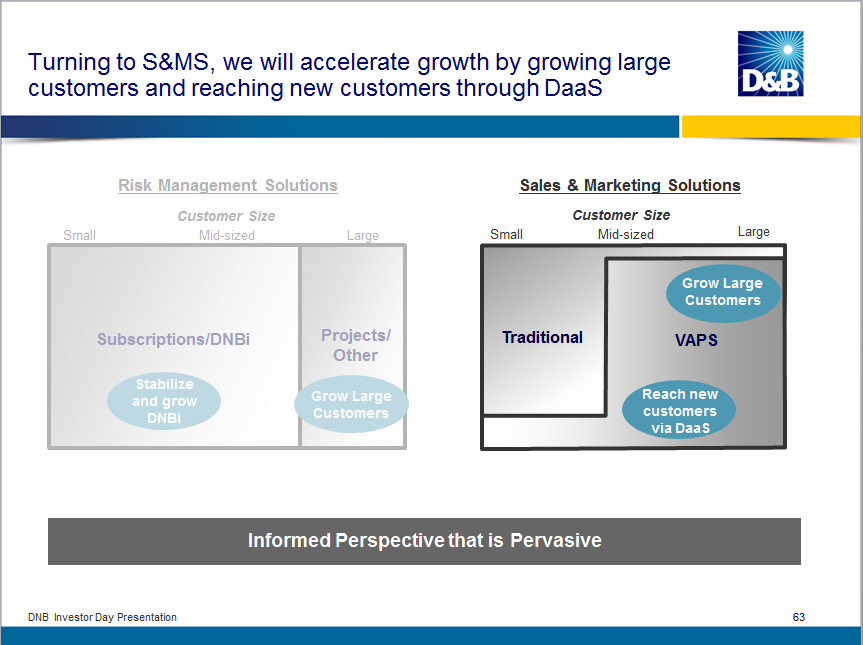 |
We will continue to grow VAPS through Optimizer with our large customers Grow Large Customers Optimizer Revenue $M 200 150 100 50 0 2009 2010 2011 2012 Increased customer value through: o Higher match rate from growth in overall database o Additional data to append through new sources DNB Investor Day Presentation 64 |  |
pervasive Reach New Customers via DaaS DaaS Revenue Revenue Illustrative New Alliance Partners Salesforce.com Direct Distribution o Established dedicated team o Large and growing customer and user base o Scale D and B 360 Time DNB Investor Day Presentation 65 |  |
In summary, we expect to return to sustainable mid single digit growth in North America in 3 years North America Core Revenue Growth -1% 2010 2% 2011 -1% 2012 Flat to up 2013 Mid Single Digits S and MS RMS Target 3 Years Drivers o Stabilize and grow DNBi o Grow large customers o Expand DaaS alliances to reach new customers DNB Investor Day Presentation 66 | 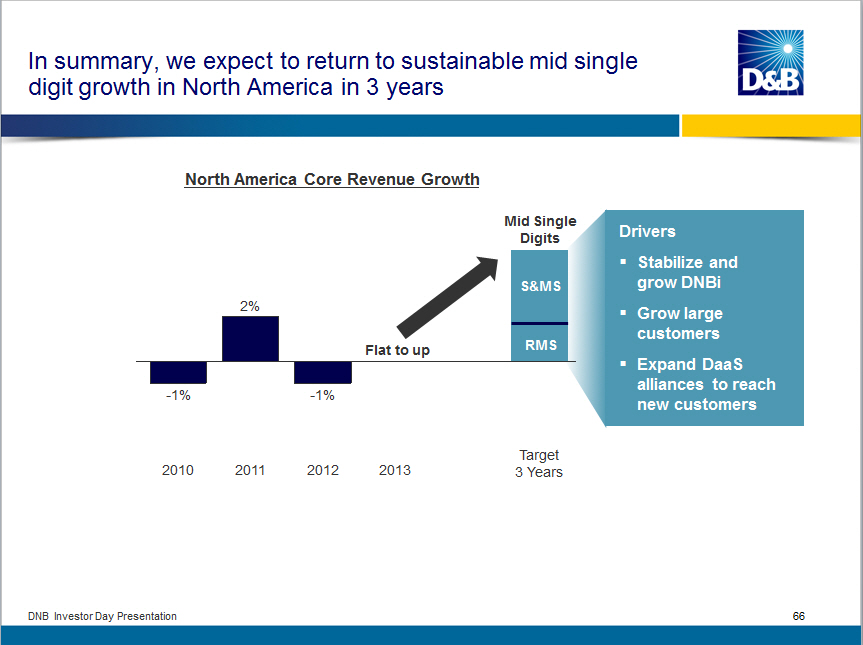 |
Accelerating Growth in International

Revenue
Growth

Opening Remarks/Context........................Sara Mathew

                                               Josh Peirez
Transforming to an Informed Perspective........Paul Ballew
- Data and Analytics

- DaaS

- New Markets

Returning to Growth in North America........Emanuele Conti

Accelerating Growth in International........ Byron Vielehr


DNB Investor Day Presentation   67
|  |
Preliminary Q2 results showed significant improvement over Q1 and we expect 2H results to be consistent with 1H Q2 2013 Preliminary International Results Q1 Q2 1H Core Revenue Growth vs PY vs PY vs PY Europe and Other (2%) 3% 1% Asia Pacific 0% 8% 5% Total International (1%) 6% 2% Operating Income Growth* 4% 15% 10% *Before Non-Core Gains and Charges DNB Investor Day Presentation 68 | 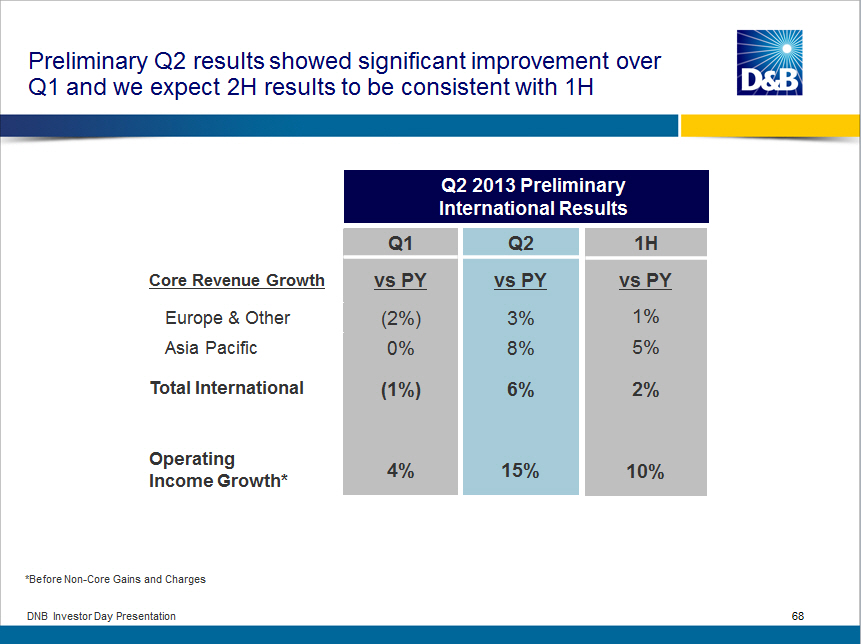 |
We transformed our International business with the creation of partnerships Pre 2000 D and B 238 countries Today D and B 102 countries Note: Country count includes territories DNB Investor Day Presentation 69 |  |
As a result of our International model transformation, we now have a growing and profitable business Pre 2000 o Declining revenue o Operating losses Today o Low single digit organic growth o ~20% operating margin DNB Investor Day Presentation 70 |  |
Additionally, we have significantly enhanced our global value proposition Pre 2000 o 40M records within International database o 100M International trade experience updates per annum o 8 International markets with predictive scores Today o 200M records within 5x increase International database o 600M International 6x increase trade experience updates per annum o 29 International 3 1/2x increase markets with predictive scores DNB Investor Day Presentation 71 | 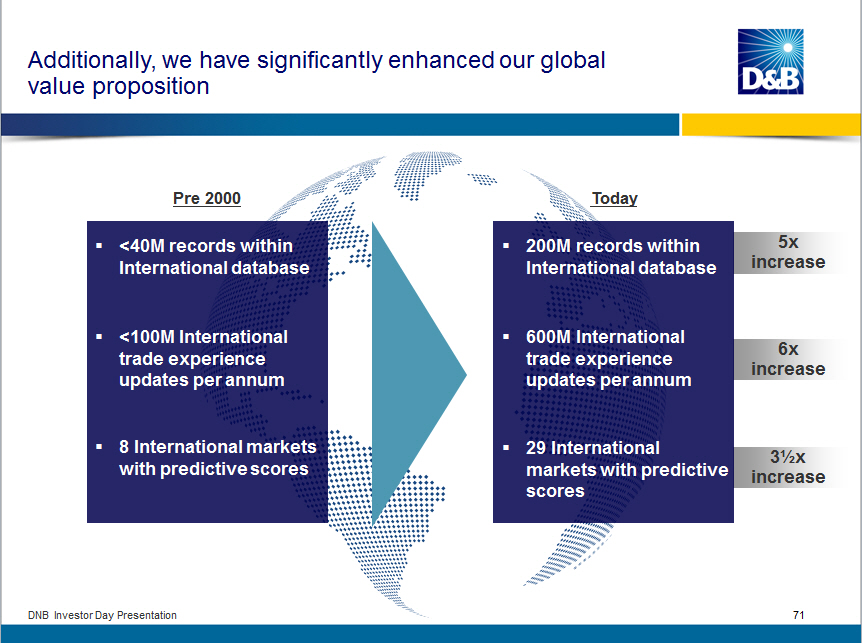 |
Our objective is to accelerate growth in International to the mid to high single digit range in 3 years International Core Organic Revenue Growth 4% 2009 4% 2010 1% 2011 3% 2012 Low Single Digit 2013 Mid to High Single Digits Target 3 Years DNB Investor Day Presentation 72 | 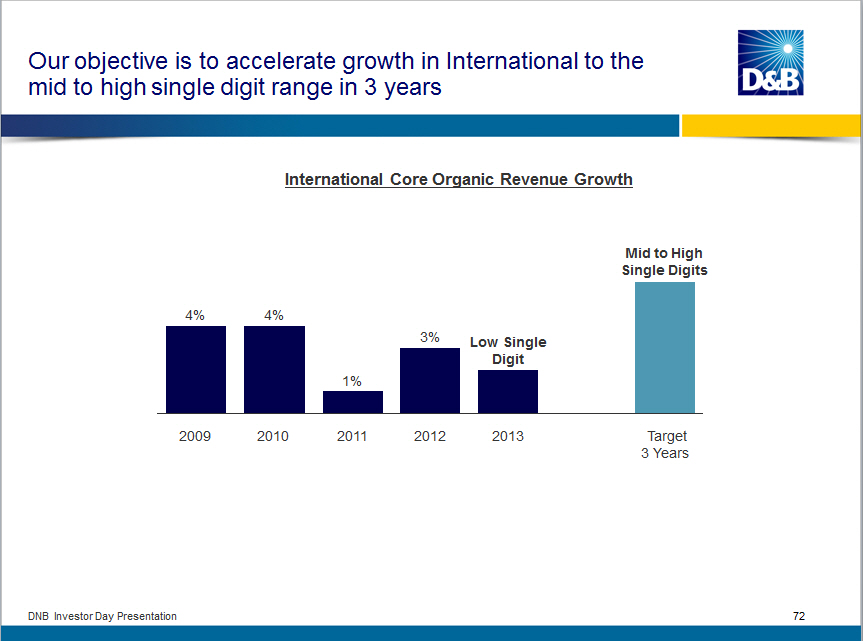 |
We have 3 strategic priorities that will deliver an Informed Perspective to customers and accelerate our growth in International International Growth Drivers Informed Perspective that is Pervasive Predictive Data and Analytics Enhance our value proposition for global customers DNBi Continue to drive penetration Decide with Confidence DaaS Expand use cases for D and B data and analytics Level of Integration in Delivery of Information/Insight DNB Investor Day Presentation 73 | 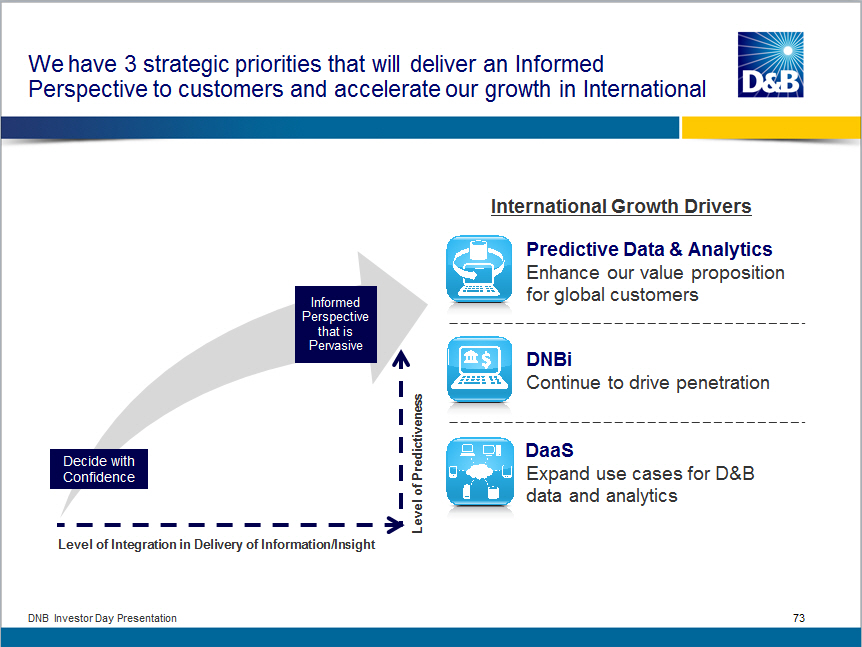 |
Our investment in data and analytics will enable us to increase our share of wallet with global customers Predictive Data and Analytics o Majority of International revenue is from global customers with a need for cross-border data - Only company with global coverage and consistency o Enhancing our value proposition for these customers - Expanding size of global database - Launching new predictive scores o Leveraging the power of the Worldwide Network - Increasing global trade from 1.2B to 2B trade lines - Building linkage data for minority ownership o We expect to benefit from these enhancements through higher share of our global customer spend DNB Investor Day Presentation 74 |  |
We have prioritized our top 20 countries based on the needs of global customers o Priority Countries DNB Investor Day Presentation | 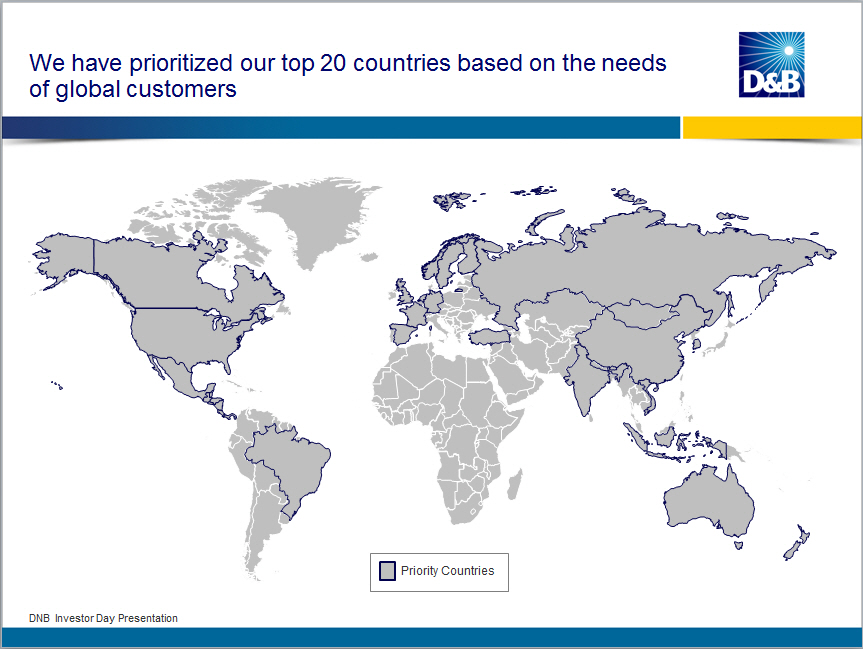 |
In 2012, only 4 of these countries were approaching an Informed Perspective level 2012 View Countries at/near an Informed Perspective DNB Investor Day Presentation |  |
By 2015, all priority markets will be at or near an Informed Perspective 2015 Goal State o Countries at/near an Informed Perspective DNB Investor Day Presentation | 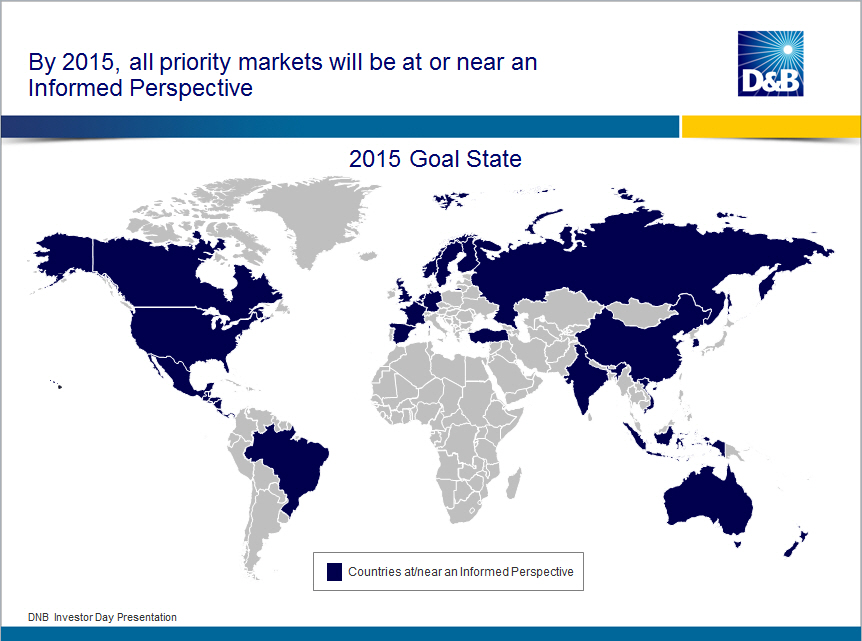 |
These data and analytics enhancements have already begun to pay off with global customers Customer Example 2012 o Global 50 Financial Services customer o Significant spend with D and B in home market, but little in other markets o Primarily buying data, limited use of D and B predictive analytics o Engaged customer in global data and analytics roadmap o Tested D and B vs. current providers in top 19 markets 2013 o 30% increase in spend by displacing local data providers in 18 of 19 markets o Significant opportunity for future growth DNB Investor Day Presentation 78 | 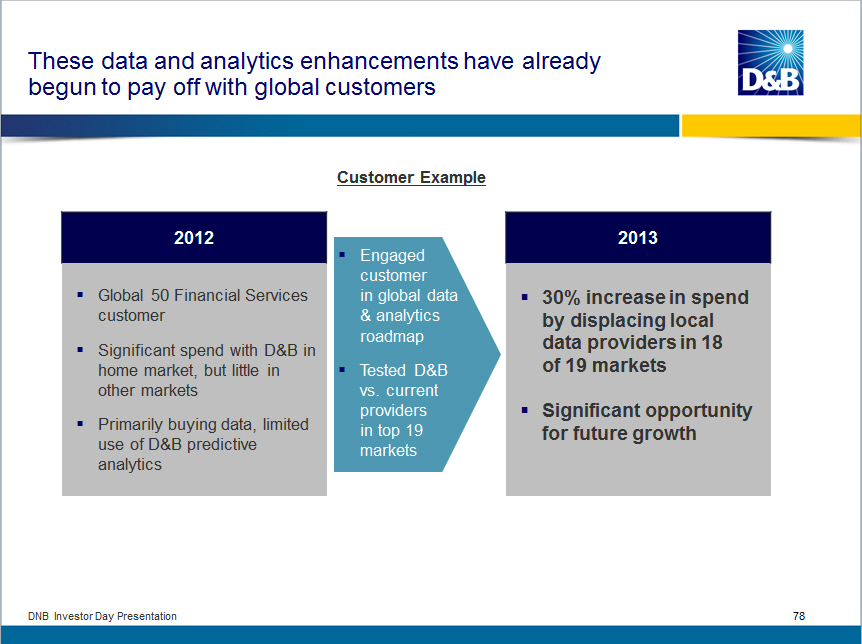 |
We will leverage our improvements in predictive data and analytics to drive DNBi penetration across International DNBi DNBi Penetration of Total RMS Europe 7% 2011 13% 2012 19% 2013 Significant further penetration opportunity Target 40-50% North America 60% 2013 In Asia Pacific, we have just begun to take our best thinking on DNBi from North America and Europe to these markets DNB Investor Day Presentation 79 | 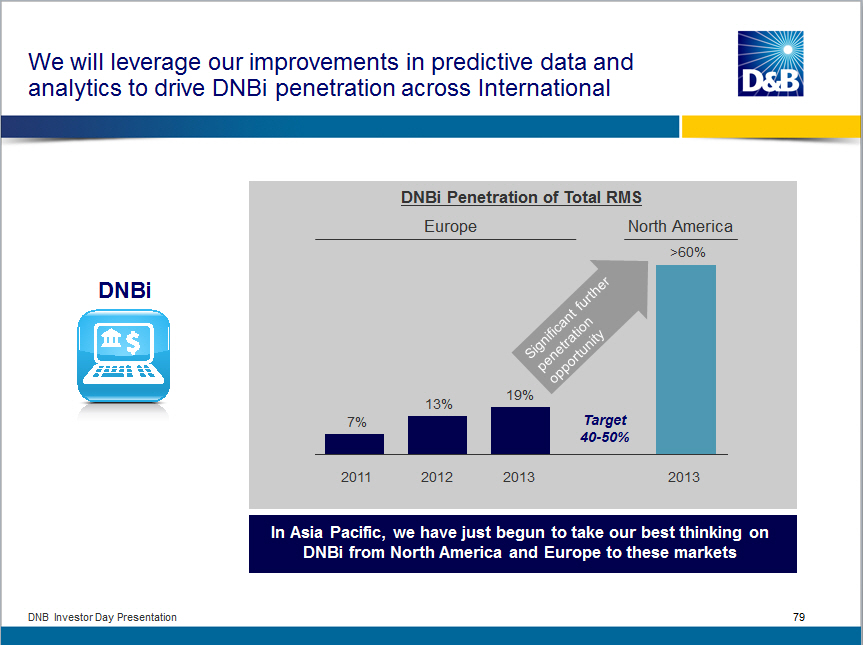 |
We are early in the introduction of DaaS within International and see significant growth potential over time DaaS o Recently introduced DaaS within Europe, and are starting to get traction and close deals o As in North America, CRM is a strong use case and our initial target area o Potential to extend existing alliances to International, as well as create new alliances o Engaging WWN partners to expand distribution of DaaS beyond our owned markets DNB Investor Day Presentation 80 | 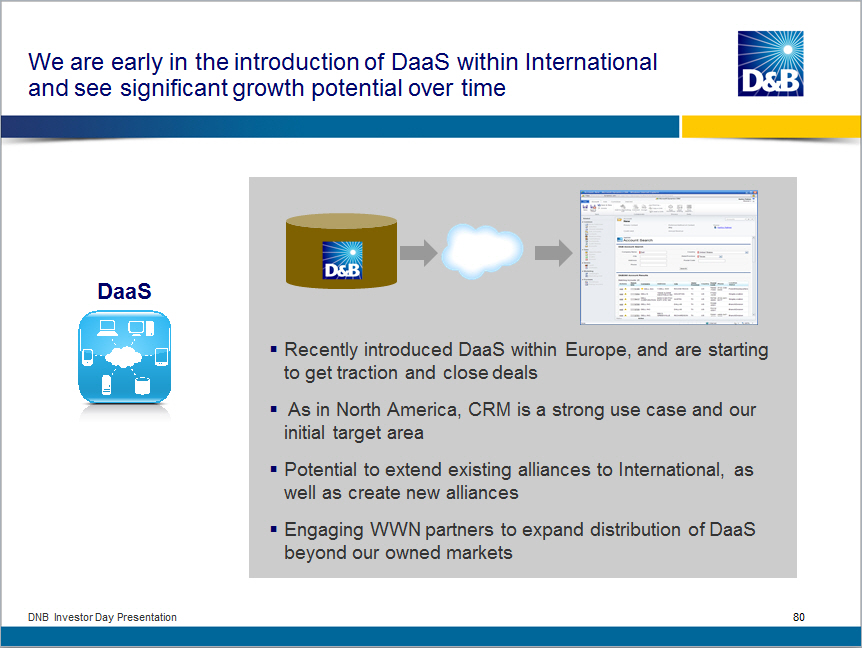 |
Finally, there are several new opportunities we are testing that could be additional drivers of growth in the future Opportunities being tested that leverage our core data asset China Trade Portal Matching Chinese suppliers with US buyers Data Manager Providing Optimizer-like solution to WWN partners Compliance Solutions Offering improved global customer due diligence process for FIs subject to KYC requirements DNB Investor Day Presentation 81 | 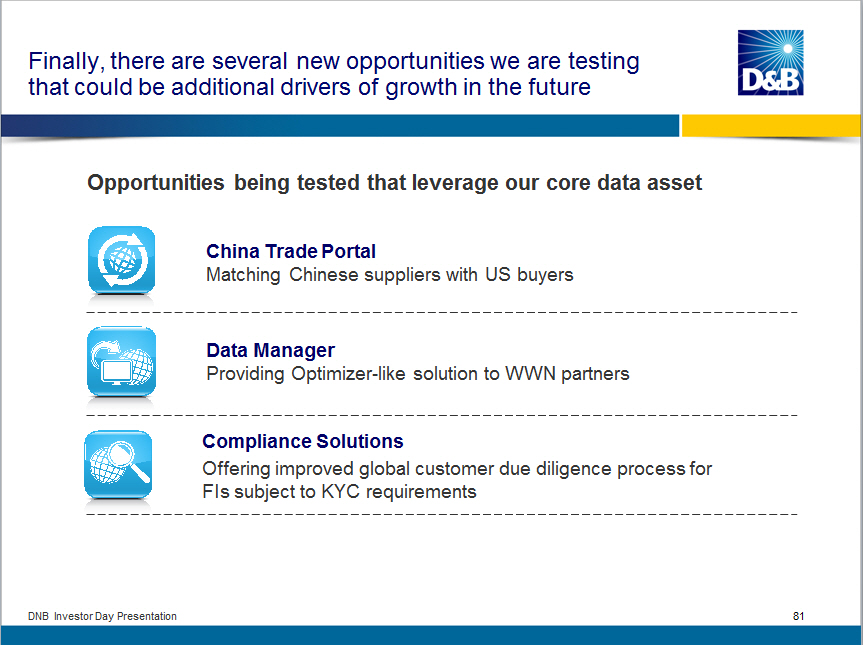 |
In summary, we believe this strategy enables our International business to achieve sustainable mid to high single digit growth International Core Organic Revenue Growth 4% 2010 1% 2011 3% 2012 Low Single Digit 2013 Mid to High Single Digits Target 3 Years DNB Investor Day Presentation 82 | 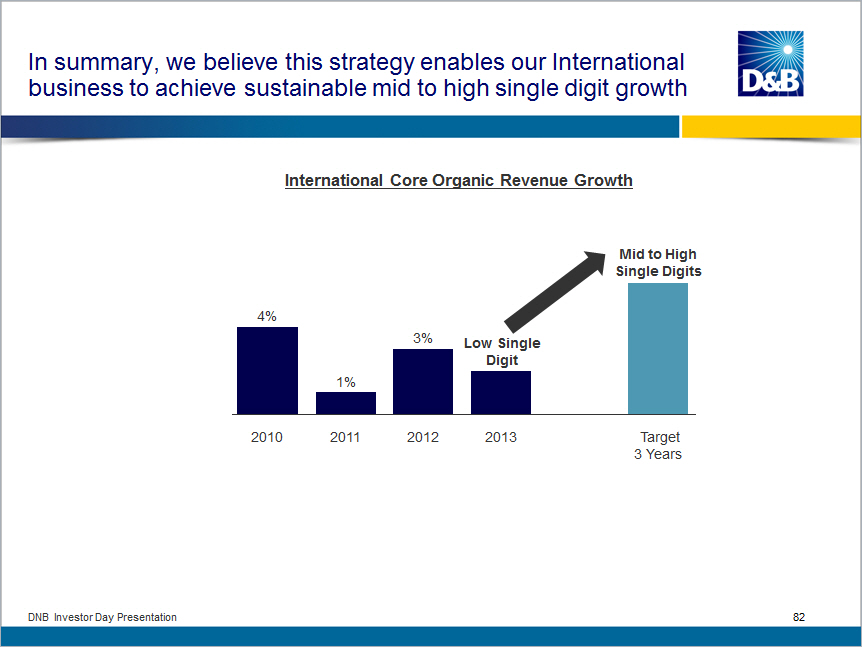 |
Delivering Sustainable TSR


Revenue Growth

Scalable Business Model

Strong Capital Stewardship


Opening Remarks/Context........................Sara Mathew

                                               Josh Peirez
Transforming to an Informed Perspective........Paul Ballew

- Data and Analytics

- DaaS

- New Markets

Returning to Growth in North America........Emanuele Conti

Accelerating Growth in International ........Byron Vielehr

Delivering Sustainable TSR..............     Rich Veldran


DNB Investor Day Presentation 83
|  |
We believe our revenue growth initiatives will allow us to return to sustainable mid single digit top line performance Revenue Growth Scalable Business Model Strong Capital Stewardship Predictive Data and Analytics DaaS New Markets Sustainable mid single digit revenue growth in 3 years DNB Investor Day Presentation 84 | 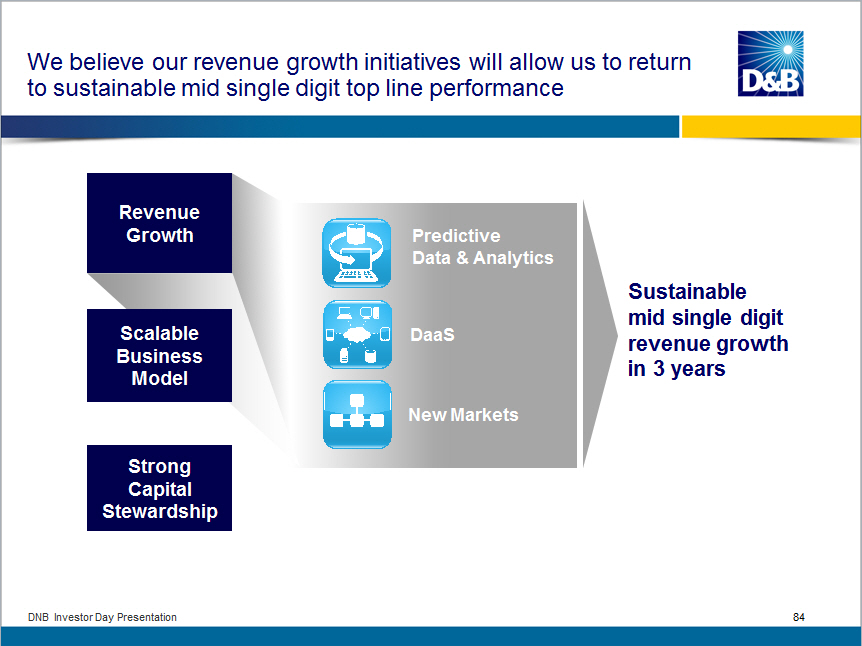 |
There are two important drivers of TSR in addition to revenue Revenue Growth Scalable Business Model Strong Capital Stewardship Total Shareholder Return DNB Investor Day Presentation 85 |  |
We have a proven track record of consistently delivering strong profitability, in good times and bad Core Organic Revenue Growth and Operating Margin 25% 6% 2004 29% 6% 2005 28% 6% 2006 28% 6% 2007 29% 5% 2008 29% -3% 2009 29% 0% 2010 28% 2% 2011 31% 0% 2012 ~30% 0-3% 2013 Guidance ~30% Mid Single Digit Target 3 Years Key Drivers o Scalable business model o Culture of cost discipline and continuous reengineering Core Organic Revenue Growth Operating Margin Before Non-Core Gains and Charges DNB Investor Day Presentation 86 | 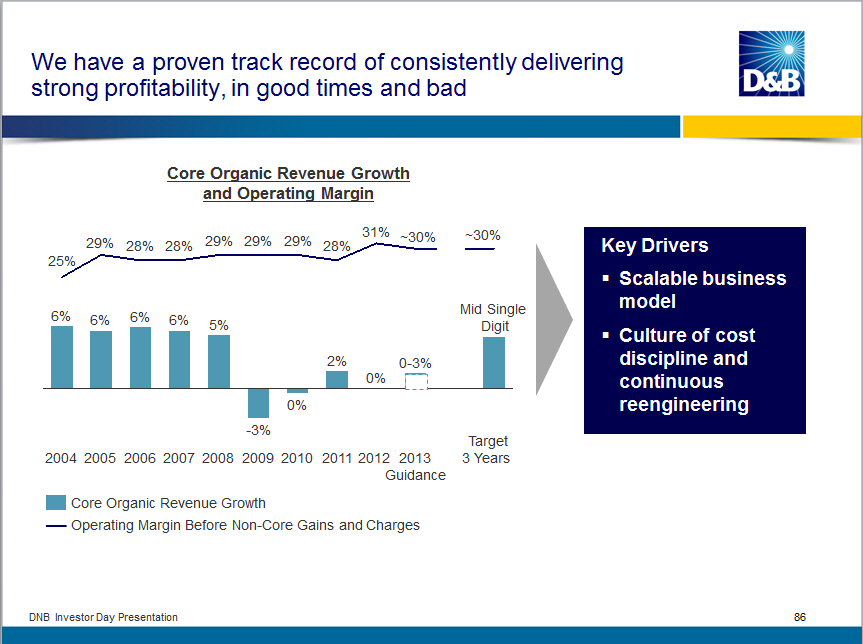 |
It starts with our scalable model Data, Analytics and Insight Deliver through D and B applications and DaaS Leverageable Core Customers Low Incremental Cost to Serve DNB Investor Day Presentation 87 | 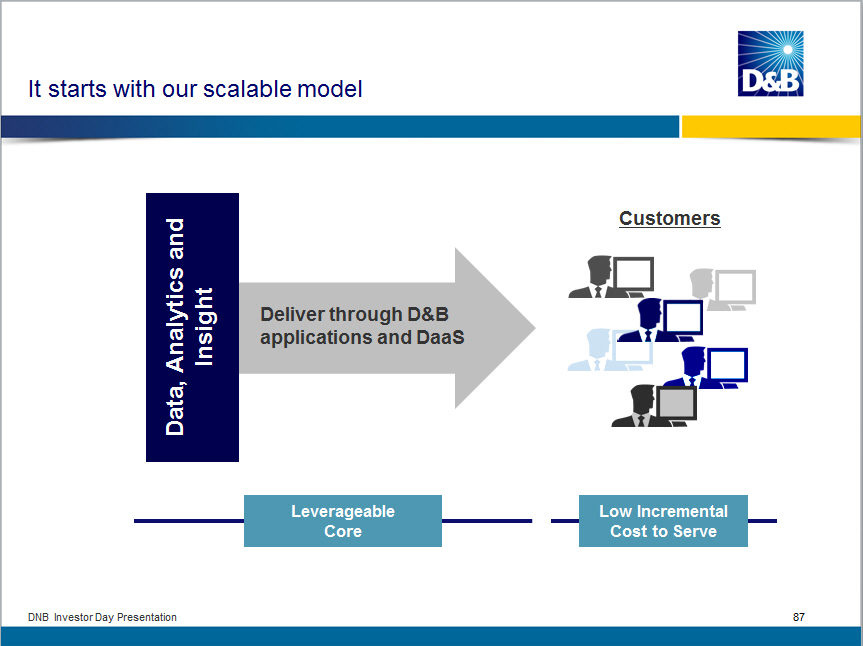 |
In addition, we have a culture of cost discipline and continuous reengineering which we use to fuel investment Philosophy o Continuous process o Treat every dollar of expense as if it were an investment o Reallocate spending from low growth or low value to higher growth activities o Drive process improvements to both reduce costs and improve customer experience Approach o Standardize and streamline processes o Consolidate globally / regionally o Automate manual processes o Outsource / Insource o Ongoing portfolio review We have generated significant savings annually - vast majority reinvested back into the business DNB Investor Day Presentation 88 | 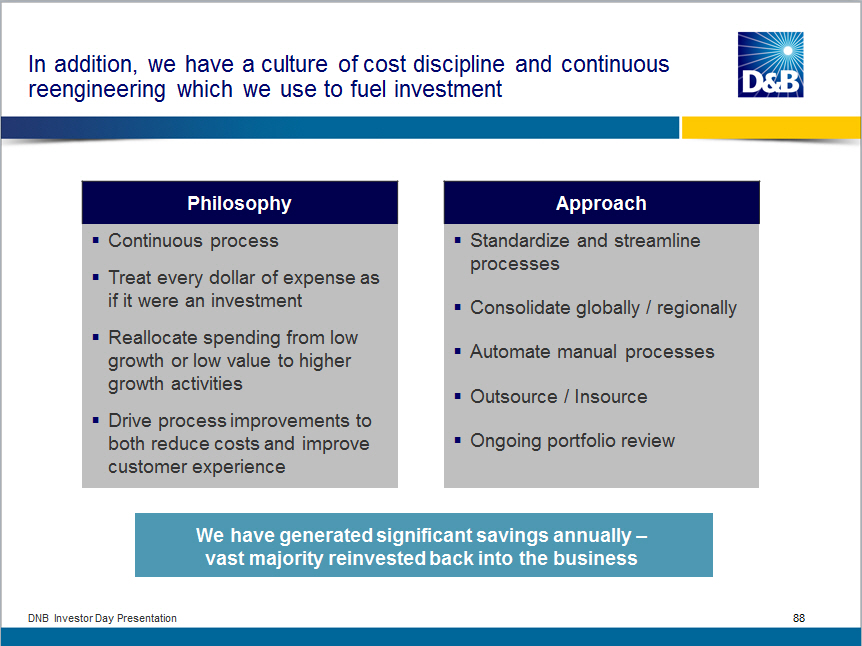 |
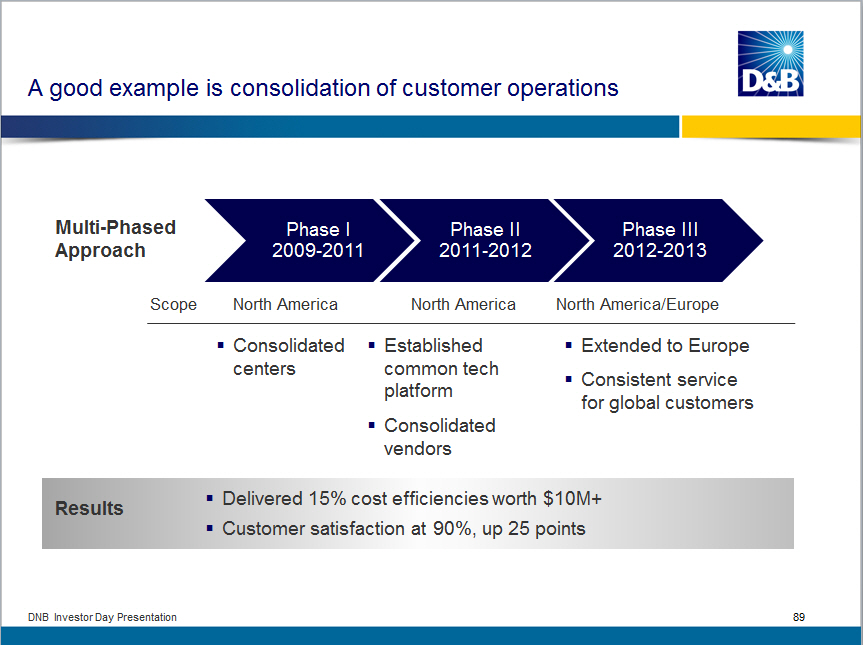
A good example is consolidation of customer operations

Multi-Phased
Approach

Phase I 2009-2011

Phase II 2011-2012

Phase III 2012-2013

Scope

North America

North America

North America/Europe
o Consolidated centers

o Established common tech platform

o Consolidated vendors

o Extended to Europe

o Consistent service for global customers

Results o Delivered 15% cost efficiencies worth $10M+
        o Customer satisfaction at 90%, up 25 points


DNB Investor Day Presentation 89
|  |
We also reengineer our portfolio as in the case of our Japan business Before o Declining revenue o Low profitability o High fixed cost After o Growing revenue after domestic divestiture o Higher guaranteed minimum profit o Access to cross border data without local infrastructure cost DNB Investor Day Presentation 90 | 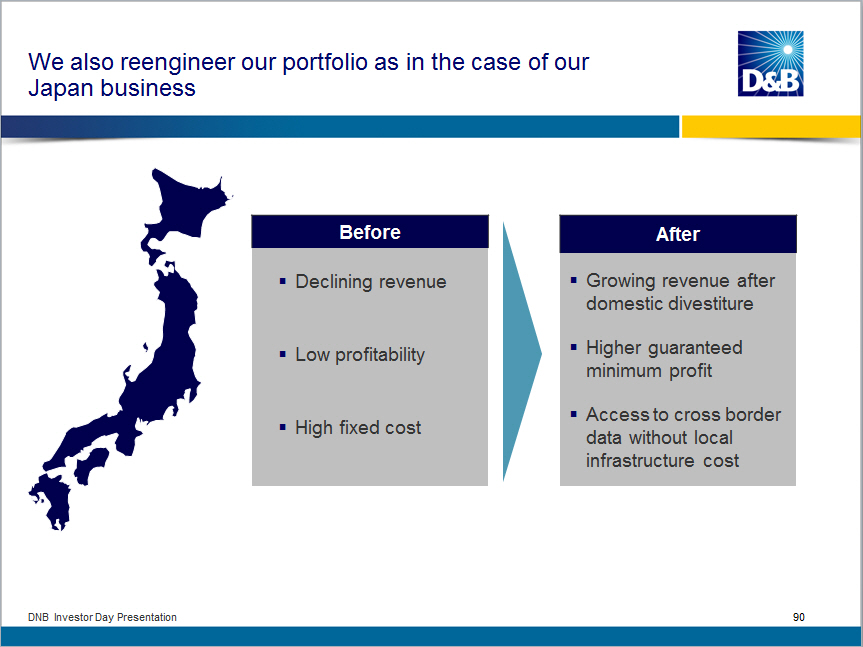 |
Our business is capital efficient with CapEx at 5% of revenue or lower CapEx as % of Total Revenue 2% 2005 3% 2006 5% 2007 3% 2008 4% 2009 4% 2010 3% 2011 4% 2012 5% 2013 DNB Investor Day Presentation 91 | 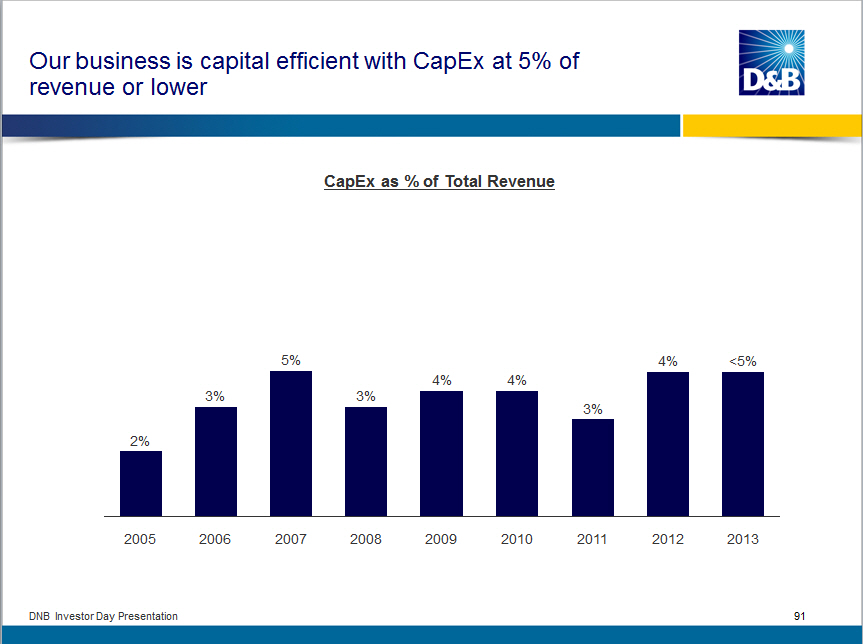 |
All of which results in significant free cash flow Free Cash Flow (in millions) $284 2005 $284 2006 $305 2007 $352 2008 $296 2009 $249 2010 $252 2011 $283 2012 $270-300 2013 Guidance MaxCV DNB Investor Day Presentation 92 | 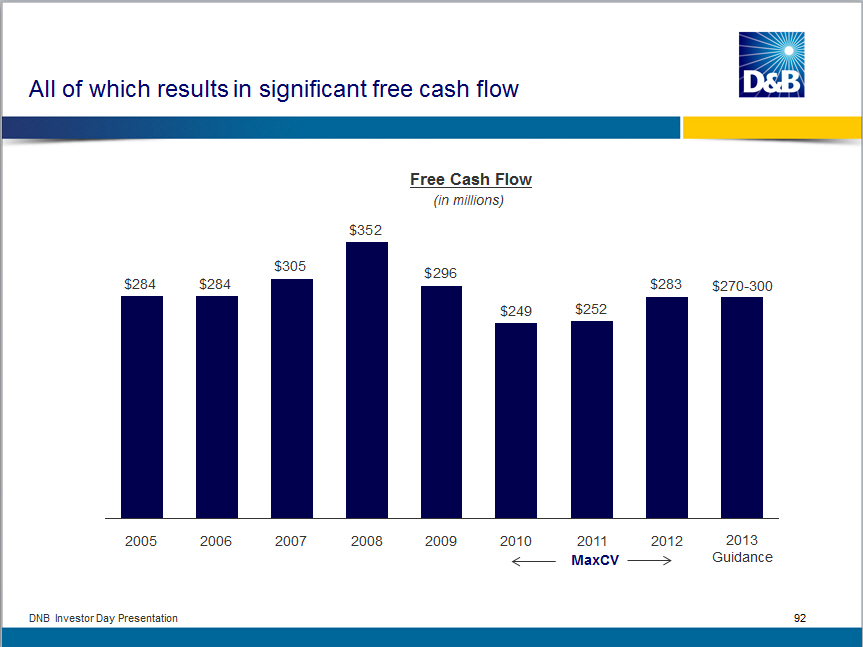 |
Finally, and importantly, we are good stewards of the cash we generate ... Our priorities regarding cash have not changed o Ongoing investments in the business to drive organic growth o Disciplined approach to tuck-in acquisitions o Return excess cash to shareholders DNB Investor Day Presentation 93 |  |
....As demonstrated by the recent acceleration in share repurchase to take advantage of unique market conditions Cumulative Cash Returned to Shareholders 2005-2013 1H Total $2.6 B $0.4 B Dividends $1.5 B share repurchases 2005-2011 $0.7 B shares repurchased to date of $1B program $1B share repurchase driven by: o Historically low valuation o Poised for future growth o Low interest rates DNB Investor Day Presentation 94 | 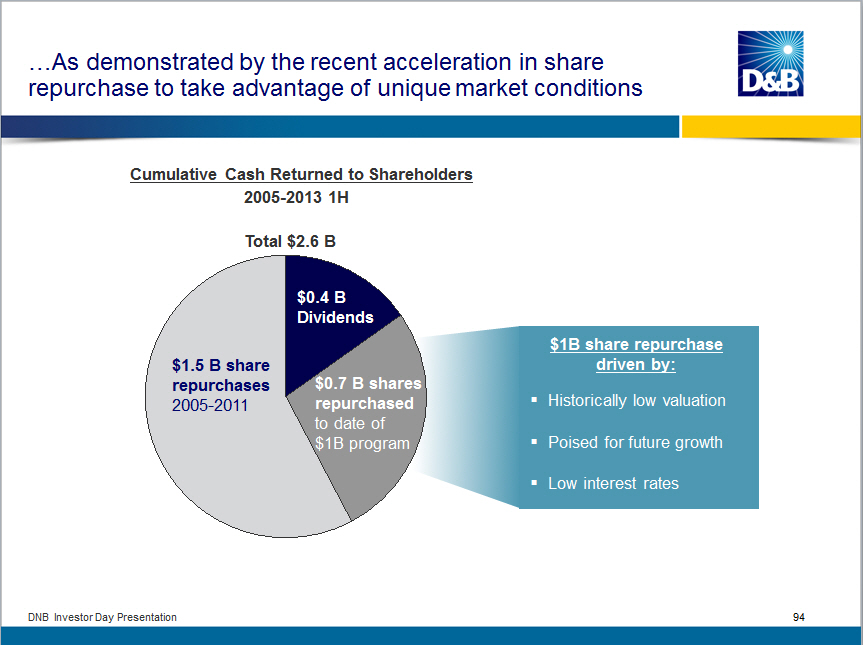 |
In summary, we believe our strategy will create significant value for shareholders over time Target 3 Years Revenue Growth Sustainable mid single digit Scalable Business Model ~30% margin Strong Capital Stewardship Ongoing share repurchase/ dividends Total Shareholder Return DNB Investor Day Presentation 95 | 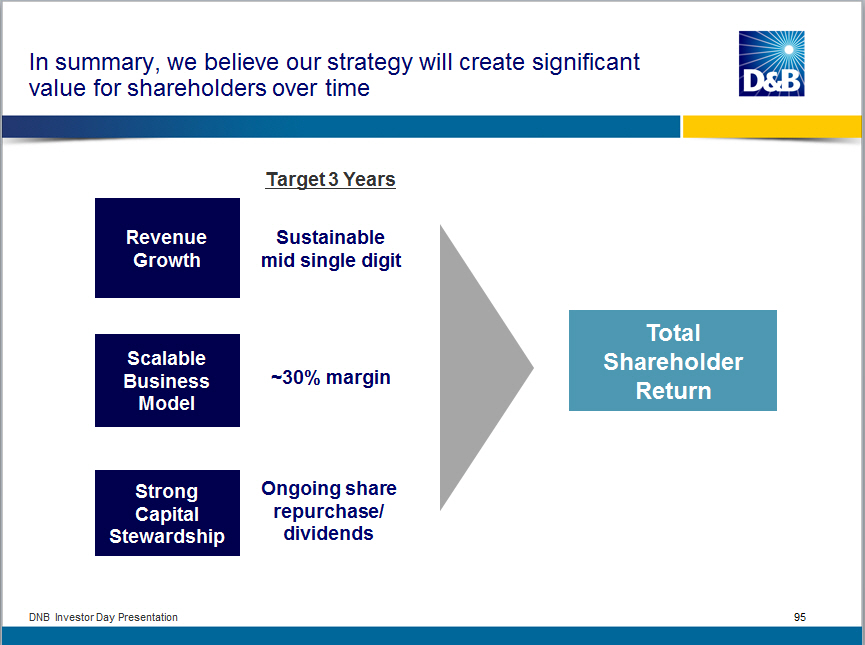 |
Summary


Revenue Growth

Scalable Business Model

Strong Capital Stewardship


Opening Remarks/Context.......................Sara Mathew

                                             Josh Peirez
Transforming to an Informed Perspective......Paul Ballew

- Data and Analytics

- DaaS

- New Markets

Returning to Growth in North America..... Emanuele Conti

Accelerating Growth
in International ......................... Byron Vielehr

Delivering Sustainable TSR................ Rich Veldran

Summary.................................    Sara Mathew

Q and A.................................Management Team


DNB Investor Day Presentation 96
|  |
In closing, we believe we are poised for growth and sustainable TSR o Our transformation to an "Informed Perspective that is pervasive in the marketplace" resonates with customers o The heavy lifting on the infrastructure build is mostly behind us o Core competitive advantages in areas like the DUNS number, identity resolution and predictive analytics ensures we deliver on our promise o Significant market opportunity - large customers/DaaS alliances o Scalable business model, financial discipline and capital stewardship o Strong leadership team provides continuity and ensures delivery DNB Investor Day Presentation 97 |  |
Summary

Revenue Growth

Scalable Business Model

Strong Capital Stewardship


Opening Remarks/Context........................Sara Mathew

                                               Josh Peirez
Transforming to an Informed Perspective........Paul Ballew

- Data and Analytics

- DaaS

- New Markets

Returning to Growth in North America....... Emanuele Conti

Accelerating Growth
in International ........................... Byron Vielehr

Delivering Sustainable TSR.................. Rich Veldran

Summary.......................................Sara Mathew

Q and A................................   Management Team


DNB Investor Day Presentation   98
|  |
Appendix |  |
Reconciliation of Q2 2013 Preliminary Results (GAAP to Non-GAAP) (Amount in Millions, Q2 % except EPS) 2013 vs PY ------------------------------------------------------ Revenue North America $279 0% International 108 6% Total Core Revenue $387 1% Divested and Other Business - N/M Total Revenue $387 1% Operating Income Operating Income - GAAP Results $94 5% Legal and Other Professional Fees and Shut-Down (Costs) Recoveries Related to Matters In China (4) N/M Restructuring Charges (2) N/M Operating Income - Before Non-Core Gains and (Charges) $100 (13%) Earnings Per Share Earnings Per Share - GAAP Results $1.44 20% Legal and Other Professional Fees and Shut-Down (Costs) Recoveries Related to Matters In China (0.05) N/M Restructuring Charges (0.04) N/M Earnings Per Share - Before Non-Core Gains and (Charges) 1.53 2% Free Cash Flow Net Cash Provided by Operating Activities from Continuing Operations (As Reported) $235 Less Capital Expenditures (As Reported) 5 Additions to Computer Software and Other Intangibles (As Reported) 22 Free Cash Flow $208 Legacy Tax Matters (Refund) Payment - Free Cash Flow Excluding Legacy Tax Matters $208 DNB Investor Day Presentation 100 | 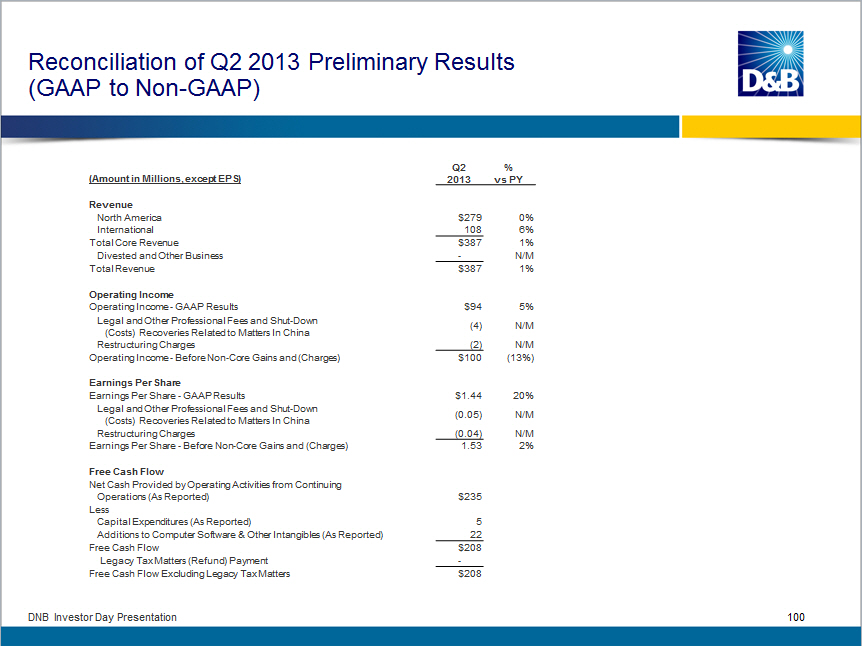 |
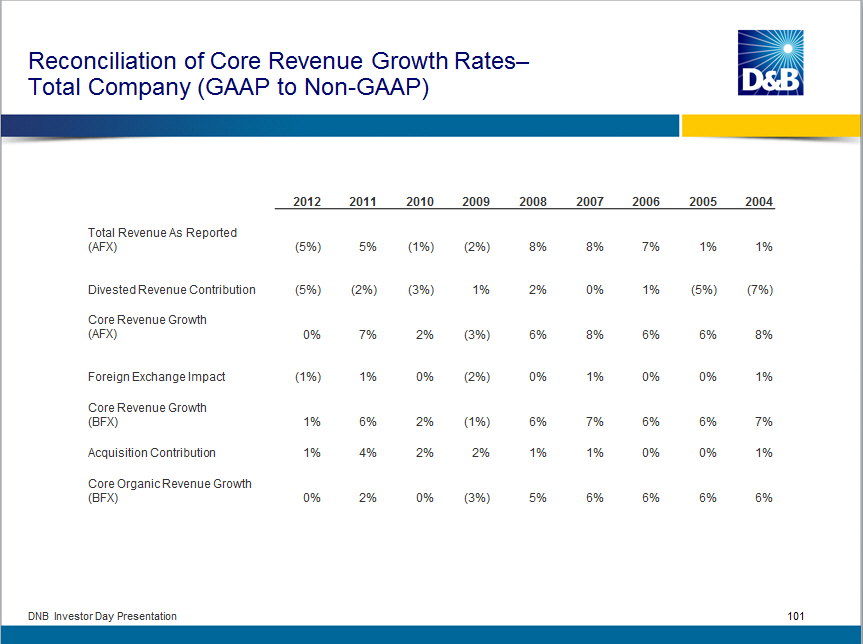
Reconciliation of Core Revenue Growth Rates- Total Company
(GAAP to Non-GAAP)


                                  2012    2011  2010    2009

Total Revenue As Reported
(AFX)                             (5%)    5%    (1%)   (2%)

Divested Revenue Contribution     (5%)   (2%)   (3%)    1%

Core Revenue Growth
(AFX)                              0%     7%     2%    (3%)

Foreign Exchange Impact           (1%)    1%     0%    (2%)

Core Revenue Growth
(BFX)                             1%      6%     2%    (1%)

Acquisition Contribution          1%      4%     2%     2%

Core Organic Revenue Growth
(BFX)                             0%      2%     0%    (3%)


                       2008    2007    2006    2005    2004


                       8%      8%      7%      1%      1%

                       2%      0%      1%     (5%)    (7%)


                       6%      8%      6%      6%      8%

                       0%      1%      0%      0%      1%


                       6%      7%      6%      6%      7%

                       1%      1%      0%      0%      1%


                       5%      6%      6%      6%      6%


DNB Investor Day Presentation    101
|  |
Reconciliation of Core Revenue Growth Rates- North America
(GAAP to Non-GAAP)

                               2012    2011    2010    2009

Total Revenue As Reported
(AFX)                          (2%)    (1%)    (4%)    (4%)

Divested Revenue
Contribution                   (1%)    (3%)    (3%)     0%

Core Revenue Growth
(AFX)                          (1%)     2%    (1%)     (4%)

Foreign Exchange Impact         0%      0%     0%      (1%)

Core Revenue Growth
(BFX)                          (1%)     2%    (1%)     (3%)


DNB Investor Day Presentation    102
|  |
Reconciliation of Core Revenue Growth Rates- International
(GAAP to Non-GAAP)

                               2012    2011    2010    2009
Total Revenue As Reported
(AFX)                          (15%)   24%      10%     4%

Divested Revenue
Contribution                   (18%)  (2%)     (6%)     2%

Core Revenue Growth
(AFX)                           3%    26%      16%      2%

Foreign Exchange Impact        (2%)   5%        0%    (13%)

Core Revenue Growth
(BFX)                           5%    21%       16%    15%

Acquisition Contribution        2%    20%      12%     11%

Core Organic Revenue Growth
(BFX)                           3%    1%       4%      4%


DNB Investor Day Presentation       103
|  |
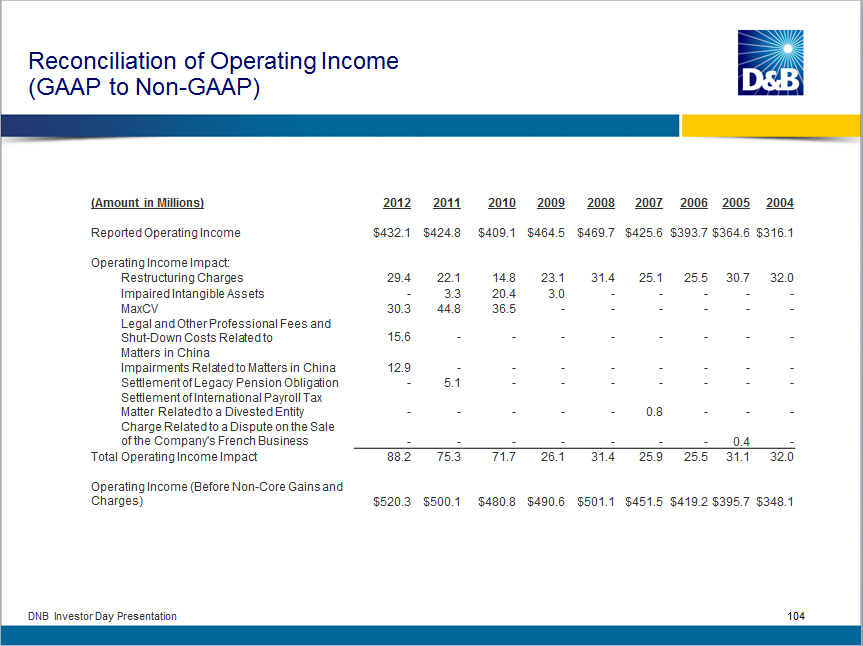
Reconciliation of Operating Income
(GAAP to Non-GAAP)

(Amount in Millions)            2012    2011    2010

Reported Operating Income       $432.1  $424.8  $409.1

Operating Income Impact:
Restructuring Charges             29.4    22.1    14.8
Impaired Intangible Assets        -        3.3    20.4
MaxCV                             30.3    44.8    36.5
Legal and Other Professional
Fees and Shut-Down Costs
Related to Matters in China       15.6      -       -
Impairments Related to Matters in
China                             12.9      -       -
Settlement of Legacy Pension
Obligation                          -      5.1      -
Settlement of International
Payroll Tax
Matter Related to a Divested Entity -        -      -
Charge Related to a Dispute on the Sale
of the Company's French Business    -        -      -
Total Operating Income Impact     88.2    75.3    71.7  0

Operating Income (Before
Non-Core Gains and
Charges)                        $520.3  $500.1  $480.8


2009    2008    2007    2006    2005    2004

$464.5  $469.7  $425.6  $393.7 $364.6  $316.1


  23.1    31.4    25.1    25.5   30.7    32.0
   3.0       -       -       -      -    -
     -       -       -       -      -    -


     -       -       -       -      -    -

     -       -       -       -      -    -

     -       -       -       -      -    -


     -       -      0.8      -      -     -

     -       -       -       -     0.4    -
  26.1    31.4    25.9    25.5    31.1    32.


$490.6  $501.1  $451.5  $419.2 $395.7  $348.1


DNB Investor Day Presentation         104
|  |
Reconciliation of Free Cash Flow (GAAP to Non-GAAP) (Amount in Millions) 2012 2011 2010 Free Cash Flow Net Cash Provided by Operating Activities from Continuing Operations (As Reported) $357.8 $312.9 $319.4 Less Capital Expenditures (As Reported) 7.0 6.2 9.5 Additions to Computer Software and Other Intangibles (As Reported) 67.4 47.2 56.4 Free Cash Flow $283.4 $259.5 $253.5 Legacy Tax Matters (Refund) Payment - (7.6) (4.3) Free Cash Flow Excluding Legacy Tax Matters $283.4 $251.9 $249.2 2009 2008 2007 2006 2005 $369.5 $433.9 $384.6 $290.8 $261.4 9.2 11.8 13.7 11.6 5.7 56.1 47.7 58.4 40.6 22.2 $304.2 $374.4 $312.5 $238.6 $233.5 (8.0) (22.5) (8.0) 45.6 50.3 $296.2 $351.9 $304.5 $284.2 $283.8 DNB Investor Day Presentation 105 | 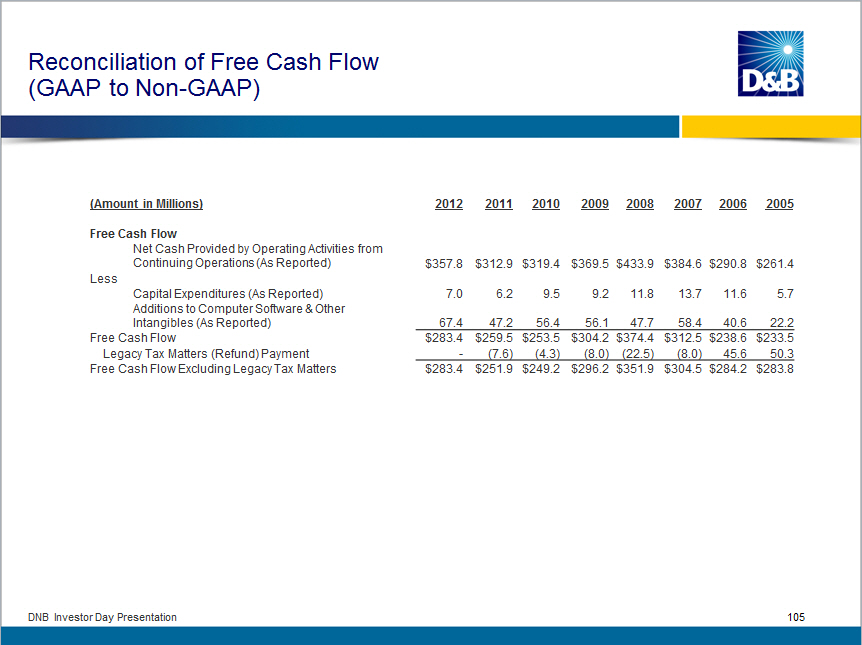 |