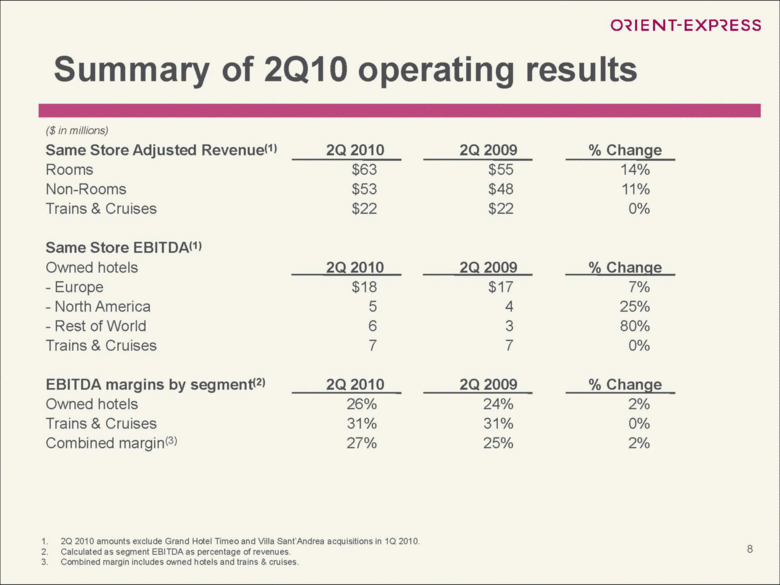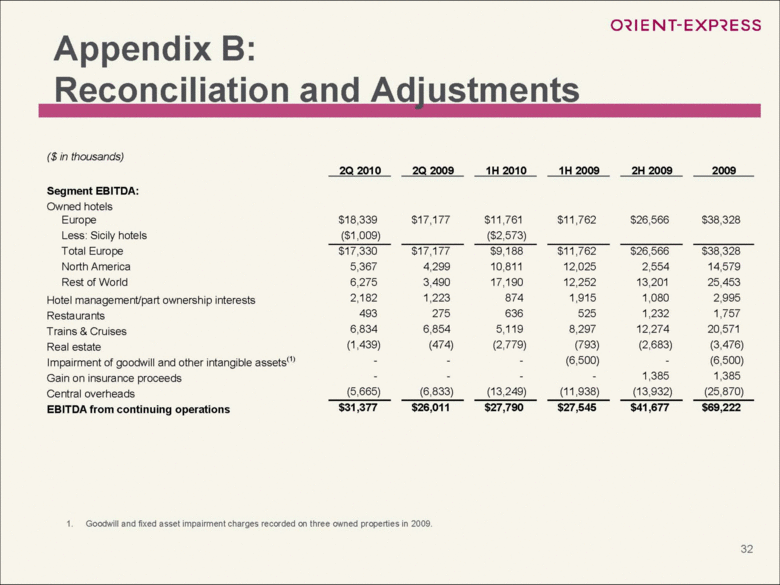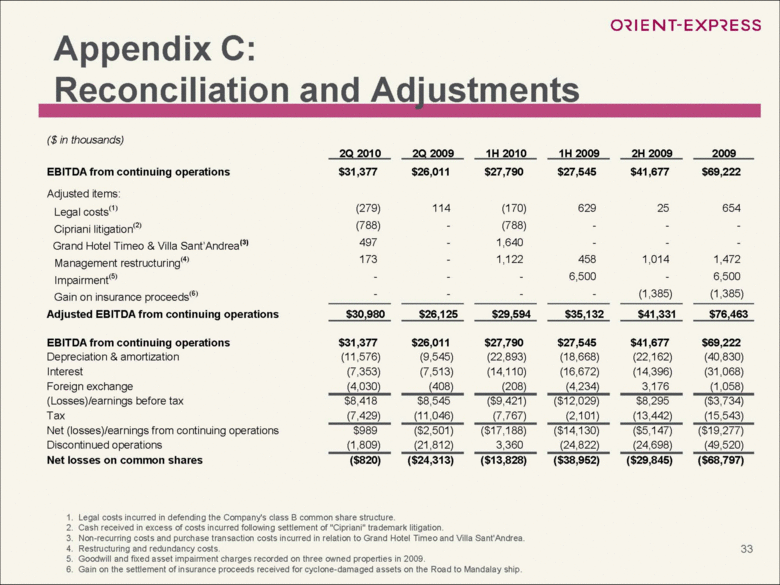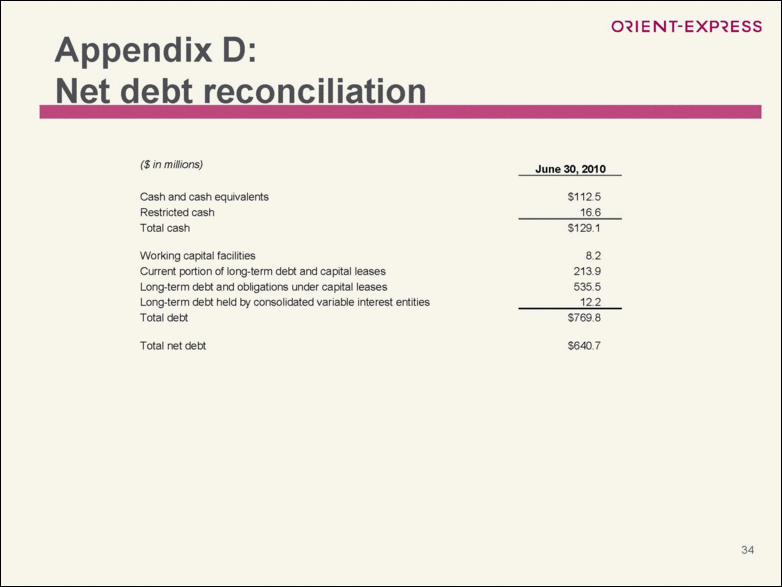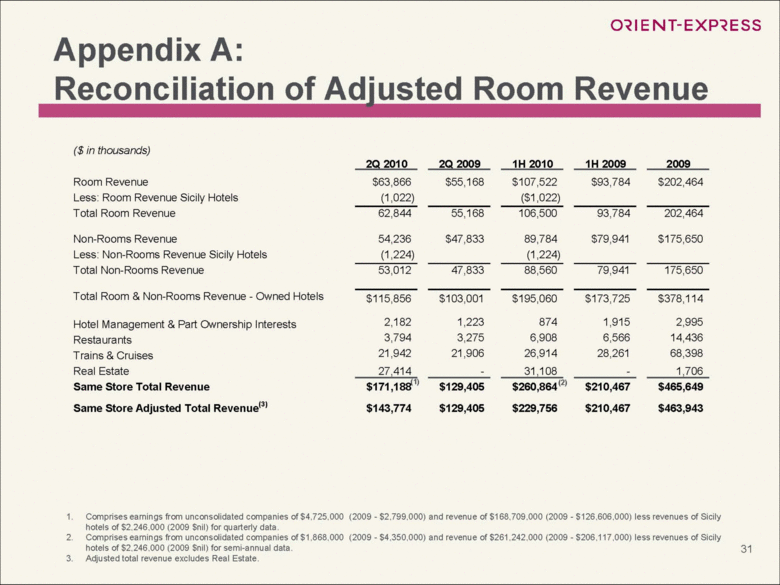
| Appendix A: Reconciliation of Adjusted Room Revenue 31 1. Comprises earnings from unconsolidated companies of $4,725,000 (2009 - $2,799,000) and revenue of $168,709,000 (2009 - $126,606,000) less revenues of Sicily hotels of $2,246,000 (2009 $nil) for quarterly data. 2. Comprises earnings from unconsolidated companies of $1,868,000 (2009 - $4,350,000) and revenue of $261,242,000 (2009 - $206,117,000) less revenues of Sicily hotels of $2,246,000 (2009 $nil) for semi-annual data. 3. Adjusted total revenue excludes Real Estate. ($ in thousands) 2Q 2010 2Q 2009 1H 2010 1H 2009 2009 Room Revenue $63,866 $55,168 $107,522 $93,784 $202,464 Less: Room Revenue Sicily Hotels (1,022) ($1,022) Total Room Revenue 62,844 55,168 106,500 93,784 202,464 Non-Rooms Revenue 54,236 $47,833 89,784 $79,941 $175,650 Less: Non-Rooms Revenue Sicily Hotels (1,224) (1,224) Total Non-Rooms Revenue 53,012 47,833 88,560 79,941 175,650 Total Room & Non-Rooms Revenue - Owned Hotels $115,856 $103,001 $195,060 $173,725 $378,114 Hotel Management & Part Ownership Interests 2,182 1,223 874 1,915 2,995 Restaurants 3,794 3,275 6,908 6,566 14,436 Trains & Cruises 21,942 21,906 26,914 28,261 68,398 Real Estate 27,414 - 31,108 - 1,706 Same Store Total Revenue $171,188(1) $129,405 $260,864(2) $210,467 $465,649 Same Store Adjusted Total Revenue(3) $143,774 $129,405 $229,756 $210,467 $463,943 (1) (2) |
