FORM 6-K
UNITED STATES
SECURITIES AND EXCHANGE COMMISSION
Washington, D.C. 20549
Report of Foreign Issuer
August 19th, 2020
Pursuant to Rule 13a-16 or 15d-16 of
the Securities Exchange Act of 1934
Commission file number: 001-15094
Mobile TeleSystems PJSC
(Exact name of Registrant as specified in its charter)
Russian Federation
(Jurisdiction of incorporation or organization)
4, Marksistskaya Street
Moscow 109147
Russian Federation
(Address of principal executive offices)
Indicate by check mark whether the registrant files or will file annual reports under cover Form 20-F or Form 40-F.
Form 20-F x Form 40-F o
Indicate by check mark whether the registrant by furnishing the information contained in this Form is also thereby furnishing the information to the Commission pursuant to Rule 12g3-2(b) under the Securities Exchange Act of 1934.
Yes o No x
Some of the information in this press release may contain projections or other forward-looking statements regarding future events or the future financial performance of MTS, as defined in the safe harbor provisions of the U.S. Private Securities Litigation Reform Act of 1995. You can identify forward looking statements by terms such as “expect,” “believe,” “anticipate,” “estimate,” “intend,” “will,” “could,” “may” or “might,” and the negative of such terms or other similar expressions. We wish to caution you that these statements are only predictions and that actual events or results may differ materially. We do not undertake or intend to update these statements to reflect events and circumstances occurring after the date hereof or to reflect the occurrence of unanticipated events. We refer you to the documents MTS files from time to time with the U.S. Securities and Exchange Commission, specifically the Company’s most recent Form 20-F. These documents contain and identify important factors, including those contained in the section captioned “Risk Factors” that could cause the actual results to differ materially from those contained in our projections or forward-looking statements, including, among others, the severity and duration of current economic and financial conditions, including volatility in interest and exchange rates, commodity and equity prices and the value of financial assets; the impact of Russian, U.S. and other foreign government programs to restore liquidity and stimulate national and global economies, our ability to maintain our current credit rating and the impact on our funding costs and competitive position if we do not do so, strategic actions, including acquisitions and dispositions and our success in integrating acquired businesses, potential fluctuations in quarterly results, our competitive environment, dependence on new service development and tariff structures, rapid technological and market change, acquisition strategy, risks associated with telecommunications infrastructure, governmental regulation of the telecommunications industries and other risks associated with operating in Russia and the CIS, volatility of stock price, financial risk management and future growth subject to risks.
Q2 2020 HIGHLIGHTS
in RUB bn unless indicated otherwise
MTS Group — Key figures* |
| Q2 2020 |
| Q2 2019 |
| Change,% |
|
Revenue |
| 117.7 |
| 116.2 |
| 1.3 | % |
o/w Russia |
| 116.3 |
| 115.3 |
| 0.8 | % |
Adjusted OIBDA(1) |
| 51.6 |
| 51.3 |
| 0.6 | % |
o/w Russia |
| 50.4 |
| 50.3 |
| 0.3 | % |
Operating profit |
| 26.0 |
| 27.1 |
| -4.2 | % |
Profit attributable to owners of the Company |
| 11.8 |
| 12.7 |
| -7.5 | % |
Cash CAPEX(2) |
| 20.6 |
| 22.7 |
| -9.1 | % |
Net debt(3) |
| 282.5 |
| 310.1 |
| -8.9 | % |
Net debt / LTM Adjusted OIBDA(4) |
| 1.3x |
| 1.4x |
| n/a |
|
H1 2020 highlights |
| H1 2020 |
| H1 2019 |
| Change, % |
|
Operating cash flow |
| 64.6 |
| 4.9 |
| 13x |
|
Free cash flow |
| 24.8 |
| -32.9 |
| n/a |
|
Free cash flow excl. SEC/DOJ payment |
| 24.8 |
| 22.7 |
| 9.2 | % |
*All profit & loss figures for 2019 have been restated to reflect the deconsolidation of MTS’s former Ukraine operations
Alexey Kornya, President & CEO, commented on the results:
« | As the world navigates 2020, two things have become crystal clear: connectivity has never been so essential, and digital transformation is accelerating like never before. These trends only further reaffirm MTS’s long-term strategy to maintain a leading network while moving forward to capture new opportunities in segments beyond connectivity.
Despite facing some challenges as a result of the COVID-19 pandemic, I am happy to report that MTS delivered positive top-line growth in Q2 2020. Group revenue increased 1.3% to reach 117.7 billion rubles, with major positive contributions from MTS Bank as well as core connectivity. In addition, we saw Group adj. OIBDA notch upward 0.6% to 51.6 billion rubles, with negative COVID-19 impacts in roaming and banking more than offset by positive contributions from core services, OPEX savings in retail, and other factors.
While some uncertainty and headwinds remain — in particular lower levels of international roaming as we enter peak summer travel season — we now have some additional clarity as we head further into the second half of the year. Given our proven record of core resilience, continued operational agility, and sustained demand for connectivity services, we are reaffirming our earlier full-year 2020 guidance of flat to 3% growth in revenue, -2% to flat in Adjusted OIBDA, and cash CAPEX of around RUB 90 bn.
| » |
in millions unless indicated otherwise
Mobile subscribers |
| Q2 2020 |
| Q1 2020 |
| Q-o-Q Change, % |
| Q2 2019 |
| Y-o-Y Change,% |
|
Total |
| 84.9 |
| 86.4 |
| -1.7 | % | 85.8 |
| -1.1 | % |
Russia |
| 77.2 |
| 78.5 |
| -1.7 | % | 78.1 |
| -1.2 | % |
Armenia |
| 2.1 |
| 2.2 |
| -4.9 | % | 2.1 |
| -4.3 | % |
Belarus (5) |
| 5.6 |
| 5.7 |
| -0.4 | % | 5.6 |
| 1.3 | % |
(1) Adjusted OIBDA doesn’t include a loss from impairment of non-current assets of RUB 0.9 bn for Q2 2020
(2) Excluding costs of RUB 0.02 bn related to the purchase of 4G licenses in Armenia in H1 2019
(3) Excluding lease obligations
(4) Including the effects of IFRS 15 and 16
(5) MTS owns a 49% stake in Mobile TeleSystems LLC, a mobile operator in Belarus, which is not consolidated
COVID-19
MTS continues to closely monitor the COVID-19 situation. The Company’s highest priority is protecting the health and safety of our employees—whether in the office, in the store, or in the field—as well as supporting our customers by providing robust connectivity and world-class digital services.
In Q2 2020, MTS saw a number of impacts from travel restrictions and other public health measures adopted in response to the COVID-19 pandemic, as well as macroeconomic volatility and changes in consumer behavior. These impacts included, but were not limited to: a steep drop in international roaming revenue, higher fixed-line traffic, temporary store closures, and changes to the risk profile of some financial services clients.
The global COVID-19 situation remains fluid and could further affect the economies and financial markets of many regions, including the countries in which we operate, which in turn could impact consumer and business spending patterns and our operating results. Additional information about potential business risks posed by the coronavirus pandemic is provided in our 2019 Form 20-F filed with the U.S. Securities & Exchange Commission and available on our website at: http://ir.mts.ru/investors/financial-center/annual-reports-and-form-20-f/.
KEY CORPORATE DEVELOPMENTS
CORPORATE NEWS
In April, MTS filed its annual report on Form 20-F for the fiscal year ended December 31, 2019 with the United States Securities and Exchange Commission. The document is also available on the MTS Investor Relations website at: http://ir.mts.ru/investors/financial-center/annual-reports-and-form-20-f/
***
In June, MTS held its Annual General Meeting of Shareholders (“AGM” or “the AGM”) in absentia. Shareholders voted to approve the Board’s recommendation of final annual 2019 dividends of RUB 20.57 per ordinary MTS share (RUB 41.14 per ADR), or in total RUB 41.1 bn (RUB 41,106,345,649.27), based on the Company’s full-year 2019 financial results with a record date of July 9, 2020 and payout to be completed on or before August 13, 2020.
In addition, shareholders elected nine members to the MTS Board of Directors, six of whom have been designated independent.
***
In July, the MTS Board of Directors called for and set September 30, 2020 as the date of an Extraordinary General Meeting of shareholders (“the EGM”) to be held in absentia, with a record date for shareholders entitled to participate in the EGM set for September 7, 2020. In addition, the Board recommended that the EGM approves semi-annual dividends of RUB 8.93 per ordinary MTS share (RUB 17.86 per ADR), or a total of RUB 17.8 billion (RUB 17,841,927,716.04), based on H1 2020 financial results, with a recommended record date to receive of October 12, 2020.
BONDS & LOANS
In April, MTS issued RUB 9.92 bn in exchange-traded Series BO-01 bonds on the Moscow Exchange (MOEX) through a secondary offering. The coupon rate for the bonds, which were placed on April 16 and mature in March 2023, was set at 6.50%.
***
In Q2 2020, MTS issued RUB 22 bn in exchange-traded bonds on MOEX under the company’s 001P program:
Placement date |
| Series |
| Amount |
| Maturity |
| Coupon |
|
May 14 |
| 001P-15 |
| 5 bn |
| 6.5 years |
| 6.60 | % |
May 14 |
| 001P-16 |
| 7 bn |
| 7 years |
| 6.60 | % |
June 5 |
| 001P-17 |
| 10bn |
| 2 years |
| 5.50 | % |
***
In May, MTS fully repaid a RUB 20 bn loan with VTB Bank. In addition, the Company’s RTK retail subsidiary concluded an agreement in June with VTB for a RUB 1.7 bn loan. Funds under this agreement will be disbursed in Q3 2020.
***
In June, MTS fully repaid a 10-year USD 750 m Eurobond issued by the company in 2010. At maturity, the total loan participation notes outstanding amounted to USD 300.9 m, with the remainder (USD 449.1 m) having earlier been repurchased during 2014-2018 through a tender process as well as on the open market. The USD-denominated Eurobond was originally issued in June 2010 via MTS International Funding Limited with a maturity of 10 years and coupon of 8.625%.
5G
In July, MTS announced it had received the first license in Russia for 5G operations in the 24.25—24.65 GHz mmWave band under the 5G/IMT-2020 standard. The license, which was granted by the Russian Federal Service for Supervision of Communications, Information Technology, and Mass Media (Roskomnadzor), covers 83 Russian regions and expires July 16, 2025. The company plans to market innovative new solutions that leverage cutting-edge high-bandwidth, low-latency connectivity, with an initial focus on enterprise and industrial applications.
***
In July, MTS announced the successful completion of pre-sales testing of the flagship motorola edge+ smartphone together with partners Motorola and Qualcomm Technologies, Inc. The device supports the specific mmWave frequencies that have been allocated for 5G in Russia.
DIGITAL INNOVATION
In April, MTS hosted a public virtual StartUp Hub Demo Day, during which fourteen teams of StartUp Hub’s fourth cohort successfully pitched their pilot projects in front of a panel of senior business leaders from across MTS. The presentations were the culmination of the intake process that earlier began with proposal submission and selection, followed by rapid joint development through the MTS accelerator program. Having successfully passed these
milestones, the projects have now been invited to launch real-world pilots with MTS and—if successful—may be eligible for full-scale roll-out in the future. Among the 14 finalists were 6 developers of customer service solutions, 5 focused on event ticketing, 2 on ecommerce, and 1 on cloud platforms.
***
In June, MTS announced that 12 startups from 6 countries will become new residents of the MTS 5G Center in Moscow. The 12 projects — selected from more than 150 submissions — cover a full spectrum of applications, ranging from drone automation and machine translation to video content generation and urban traffic optimization.
***
In June, MTS announced the formation of MTS Automotive, a new MTS business line aimed at providing technologies and services for the smart car market. The new division will include two Russian developers of onboard multimedia head units and infotainment systems recently acquired by MTS: STOPOL AVTO, LLC and KOAGENT Rus, LLC.
AWARDS & RECOGNITION
In April, MTS was recognized as the second-strongest telecoms brand anywhere in the world in the 2020 Brand Strength Index (BSI) by Brand Finance, a leading independent brand valuation and strategy consultancy. The BSI aims to assess the relative strength of company’s brands in their respective markets, taking into consideration a variety of factors, including “marketing investment, familiarity, loyalty, staff satisfaction, and corporate reputation.”
CEO INTERVIEW
In July, leading Russian business newspaper Kommersant published an in-depth interview with MTS President & CEO Alexey Kornya. Topics discussed included how COVID-19 has accelerated digitalization, as well as the progress MTS is making on moving forward into adjacent segments beyond connectivity. An adapted English translation of the interview is available on the MTS IR Blog at http://ir.mts.ru/ir-blog.
GROUP PERFORMANCE
in RUB bn unless indicated otherwise
MTS Group – Key figures |
| Q2 2020 |
| Q2 2019 |
| Change, % |
|
Revenue |
| 117.7 |
| 116.2 |
| 1.3 | % |
Adjusted OIBDA |
| 51.6 |
| 51.3 |
| 0.6 | % |
margin |
| 43.8 | % | 44.1 | % | -0.3 p.p. |
|
Profit attributable to owners of the Company |
| 11.8 |
| 12.7 |
| -7.5 | % |
margin |
| 10.0 | % | 10.9 | % | -0.9 p.p. |
|
Despite headwinds arising from the COVID-19 situation, MTS saw Group revenue increase in Q2 by 1.3% year-over-year to reach RUB 117.7 bn. Top line growth saw significant positive contributions from both MTS Bank and core telecom services.
Group Adjusted OIBDA in Q2 increased 0.6% year-over-year to RUB 51.6 bn supported by core services, OPEX savings from reduced retail activity, and a positive one-off impact due to the revaluation of a provision related to a regulatory case regarding bulk SMS rates. At the same time, Group Adjusted OIBDA was negatively impacted by other COVID-19-related factors, including loan impairment provisions at MTS Bank, as well as a steep decline in international roaming given sharply reduced international travel.
Group net profit for the quarter decreased 7.5% year-over-year to RUB 11.8 bn. Net profit was supported by solid underlying performance in core connectivity, as well as lower net interest expenses versus the year-ago period. Also, additional income was recorded related to the Company’s former operations in Ukraine that were divested in Q4 2019. At the same time, these positive impacts were more than offset by negative factors, including impairment provisions at MTS Bank as well as the impact of currency dynamics on FX and operations with derivative instruments.
Group Adjusted OIBDA Factor Analysis (RUB bn) (6)
+0.6% YoY
* Retail - RTC, wholly-owned subsidiary of MTS, handling all functions relating to MTS retail operations, including the purchase and sale of handsets and accessories and subscriber enrollment at MTS retail outlets.
** Revaluation of provision related to FAS penalty for violation of antimonopoly laws in respect to establishing distinguished terms and conditions for bulk SMS pricing for banks.
Group Net Profit Factor Analysis (RUB bn) (6)
-7.5% YoY

(6) Totals may add up differently due to rounding
LIQUIDITY AND CASH FLOW
|
| in RUB bn unless indicated otherwise |
| ||
Debt & Liquidity(7) |
| As of June 30, |
| As of March 31, 2020 |
|
Current portion of LT debt |
| 12.1 |
| 35.3 |
|
LT debt |
| 396.7 |
| 388.0 |
|
Total debt |
| 408.9 |
| 423.4 |
|
less: |
|
|
|
|
|
Cash and cash equivalents |
| 98.3 |
| 101.2 |
|
ST investments |
| 26.0 |
| 27.9 |
|
LT deposits |
| — |
| — |
|
Swaps |
| — |
| 4.9 |
|
Effects of hedging of non-ruble denominated debt |
| 2.1 |
| 4.6 |
|
Net debt |
| 282.5 |
| 284.8 |
|
At the end of Q2 2020, MTS’s total debt amounted to RUB 408.9 bn (excluding debt issuance costs). The current portion of long-term debt stood at RUB 12.1 bn, down significantly from Q1, which reflected the company active steps in Q2 to further optimize its debt portfolio.
In the reporting period, MTS issued RUB 31.8 bn in exchange-traded bonds on MOEX with coupon rates of 6.60% or lower, including RUB 22 bn in three series under the Company’s 001P program (001P-15, 001P-16, 001P-17), as well as reissued RUB 9.92 bn (RUB 9.76 bn after discount) of series BO-01 bonds through a secondary offering.
Net debt ex-LL(7) to LTM Adjusted OIBDA(8) ratio
The Group’s Net debt ex-LL(7) to LTM Adjusted OIBDA ratio held roughly steady at 1.3x.
Weighted average interest rates (as of June 30, 2020)
As a result of the Company’s ongoing efforts to optimize its overall debt profile, MTS’s gross debt weighted average interest stood at 6.7% as of June 30, 2020, a decline of over 140 bps year-over-year.
Gross debt structure by currency(9)
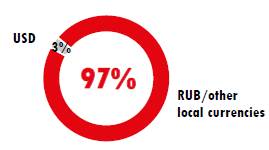
In line with the Company’s strategy to maintain a predominantly local debt position, non-ruble debt stood at just 3% of gross debt at the end of Q2. The Group’s net debt position remained 100% ruble-denominated.
(7) Excluding lease obligations
(8) Including the effects of IFRS 15 and 16 standards
(9) Including FOREX hedging in the amount of USD 300.0m as of June 30, 2020
SHAREHOLDER REMUNERATION*
RUB bn
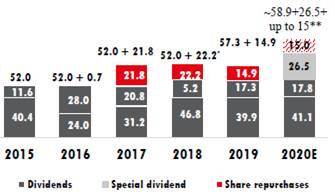
* Totals may add up differently due to rounding
** New share repurchase plan announced on March 31, 2020
At the MTS AGM in June, shareholders voted to approve the Board of Director’s recommendation of final annual 2019 dividends of RUB 20.57 per ordinary MTS share (RUB 41.14 per ADR), or in total RUB 41.1 bn (RUB 41,106,345,649.27), based on the Company’s full-year 2019 financial results with a record date of July 9, 2020 and payout to be completed on or before August 13, 2020.
In July, the Board recommended that an EGM on September 30 approve semi-annual dividends of RUB 8.93 per ordinary MTS share (RUB 17.86 per ADR), or a total of RUB 17.8 billion (RUB 17,841,927,716.04), based on H1 2020 financial results, with a recommended record date to receive of October 12, 2020.
Share Repurchase |
| # of shares, |
| % of share |
| Avg price per share |
| Total amount |
|
Shares acquired in Q2 2020 under the Repurchase Plan |
| 1,555,644 |
| 0.08 | % | 308.50 |
| 479,915,520 |
|
Total shares acquired under the Repurchase Plan (as of August 14) |
| 8,228,503 |
| 0.41 | % | 321.39 |
| 2,644,544,832 |
|
On March 31, 2020, MTS launched a program to repurchase up to RUB 15 bn of shares of common stock and ADSs, including repurchases from Sistema Finance, through the end of calendar year 2020. The Repurchase Plan is executed under Rule 10b5-1 of the Securities Exchange Act of 1934, as amended, and carried out by the Company’s wholly-owned subsidiary Bastion LLC. Repurchases under the plan began in Q2 2020. As of August 14, 2020, Bastion had acquired 8,228,503 shares of Common Stock under the plan (including shares of Common Stock represented by ADSs) representing 0.41% of share capital issued by MTS. This amount includes repurchases from Sistema Finance as provided for in the plan.
(10) The actual average price and total amount spent may differ from the settlement price, due to commissions, fees and other related expenses
|
| in RUB bn unless indicated otherwise |
| ||
Cash CAPEX |
| For 6 months |
| For 6 months |
|
Russia |
| 40.1 |
| 35.1 |
|
as % of revenue |
| 17.1 | % | 15.6 | % |
Armenia(11) |
| 0.7 |
| 0.3 |
|
as % of revenue |
| 19.6 | % | 9.2 | % |
Group(11) |
| 40.8 |
| 39.3 |
|
as % of revenue |
| 17.2 | % | n/a |
|
Cash capital expenditures in H1 2020 amounted to RUB 40.8 bn, with a Group Cash CAPEX / Sales ratio of 17.2%. MTS continued to heavily invest in core network infrastructure, with a focus on enhancing network capacity and quality for customers.
In Q2, over 3,698 additional MTS base stations were brought online across 68 Russian regions, including more than 3,434 new 4G base stations. As a result, MTS’s LTE network coverage increased to an estimated 84% of the Russian population.
|
| in RUB bn unless indicated otherwise |
| ||
Cash Flow |
| For 6 months |
| For 6 months |
|
Net cash provided by operating activities |
| 64.6 |
| 4.9 |
|
adjusted for: |
|
|
|
|
|
Purchases of property, plant and equipment |
| -28.1 |
| -27.5 |
|
Purchases of intangible assets |
| -12.8 |
| -11.8 |
|
Cost to obtain and fulfill contracts, paid |
| -2.3 |
| -2.3 |
|
Purchase of Avantage |
| -0.2 |
| — |
|
Proceeds from sale of property, plant and equipment |
| 2.5 |
| 2.9 |
|
Investments in associates |
| -1.4 |
| — |
|
Acquisition of subsidiaries |
| 0.1 |
| -2.0 |
|
Proceeds from sale of associates |
| 2.5 |
| 3.0 |
|
Free cash flow |
| 24.8 |
| -32.9 |
|
Free cash flow excluding SEC/DOJ payment |
| 24.8 |
| 22.7 |
|
For the six months ended June 30, free cash flow amounted to RUB 24.8 bn, up from RUB -32.9 bn in the year-ago period, which saw a one-time RUB 55.6 bn payment under the resolution with the DOJ and settlement with the SEC.
On a comparable basis excluding this payment, Group free cash flow increased RUB 2.1 bn year-over-year in H1 2020, reflecting a low base from relatively higher tax payments in H1 2019, which was partially offset by negative WC dynamics in H1 2020 in comparison with H1 2019.
(11) Excluding costs of RUB 0.02 bn related to the purchase of 4G licenses in Armenia in H1 2019
RUSSIA
|
| in RUB bn unless indicated otherwise |
| ||||
Russia highlights |
| Q2 2020 |
| Q2 2019 |
| Change, % |
|
Revenue |
| 116.3 |
| 115.3 |
| 0.8 | % |
mobile |
| 81.2 |
| 79.7 |
| 1.9 | % |
fixed |
| 15.8 |
| 15.0 |
| 5.2 | % |
bank |
| 8.0 |
| 6.9 |
| 17.0 | % |
integration services |
| 3.2 |
| 2.7 |
| 20.1 | % |
other services |
| 0.1 |
| 0.2 |
| -60.0 | % |
sales of goods |
| 14.4 |
| 15.6 |
| -7.9 | % |
Adjusted OIBDA(12),(13) |
| 50.4 |
| 50.3 |
| 0.3 | % |
margin |
| 43.4 | % | 43.6 | % | -0.2 p.p. |
|
Net profit(13) |
| 11.2 |
| 11.0 |
| 1.7 | % |
margin |
| 9.6 | % | 9.5 | % | 0.1 p.p. |
|
In Q2 2020, MTS saw positive top-line growth in its core market, with revenue in Russia growing 0.8% year-over-year to reach RUB 116.3 bn. Growth was primarily driven by mobile service revenue, MTS Bank, fixed-line connectivity, and integration services. At the same time, year-over-year revenue growth was constrained by negative dynamics in sales of goods, reflecting the impact of COVID-19.
Russia Adjusted OIBDA notched upwards by 0.3% year-over-year in Q2 to reach RUB 50.4 bn supported by core service revenue as well as OPEX savings in retail given temporary store closures amid COVID-19 as well as ongoing long-term optimization measures. At the same time, Russia Adjusted OIBDA was negatively impacted by the loss of relatively higher margin international roaming revenue, as well as loan impairment provisions at MTS Bank reflecting increased portfolio risk.
For the quarter, MTS saw mobile service revenue grow 1.9% year-over-year to reach RUB 81.2 bn. The number of active mobile subscribers on the Company’s network notched slightly downward by 1.7% quarter-on-quarter to 77.2 m.
Revenue from MTS’s fixed business increased 5.2% year-over-year to RUB 15.8 bn against the background of the increased importance of broadband connectivity for remote work, study, and entertainment during the COVID-19 pandemic.
Revenue |
| Q2 2020 |
| Q2 2019 |
| Change, % |
|
Total |
| 15.8 |
| 15.0 |
| 5.2 | % |
B2C |
| 7.8 |
| 7.8 |
| 0.7 | % |
B2B+B2G+B2O |
| 8.0 |
| 7.2 |
| 10.1 | % |
According to MTS’s analysis, in Q2 2020 the Company’s share of the Moscow B2C broadband market share grew to 43.1% and its pay-TV market share to 46.2%. MTS continued to see additional market penetration of its ultra-fast FTTH GPON connectivity, reaching over 2.1 m subscribers in Moscow across B2C and B2B segments.
MTS Bank continued to see solid top-line growth in Q2 2020, with the Bank’s revenue up 17.0% year-over-year to RUB 8.0 bn. At the same time, the bank saw impacts from COVID-19, including additional provisions for loan impairments, as well in some cases temporary suspension of retail operations.
MTS’s integration business saw double-digit top-line growth, with revenue increasing 20.1% year-over-year to reach RUB 3.2 bn. Revenue from other services, including event ticketing and Esports, saw a steep 60% decline year-over-year due to the impact of COVID-19.
Revenue from sales of goods decreased 7.9% year-over-year to RUB 14.4 bn, reflecting the pandemic’s impact on retail operations, as well as relatively lower software sales versus the year-ago period.
As in many other regions around the world, the Russian retail market saw a significant impact from social distancing measures introduced in response to the COVID-19 pandemic. Following an initial steep decline in April, the Russian smart device market began a recovery in May that continued in June, with exceptionally high sales toward the end of the quarter. MTS analysts assess the latter development likely reflected delayed demand as
(12) Adjusted OIBDA doesn’t include a loss from impairment of non-current assets of RUB 0.9 bn for Q2 2020
(13) Adjusted OIBDA and net income for 2019 has been restated to reflect greater allocation of corporate HQ costs onto MTS’s Russia business following divestment of the Company’s Ukrainian operations in Q4 2019
consumers put off in-store purchases until social distancing guidelines eased. On a full-quarter basis, MTS estimates nationwide smartphone unit sales declined 2.9% year-over-year in Q2 2020.
In Q2 2020, smartphone penetration on MTS’s network reached 77.1%, with 63.7% of overall monthly active subscribers also being consumers of mobile data.
MTS Retail (# of stores at the end of the period)(14)
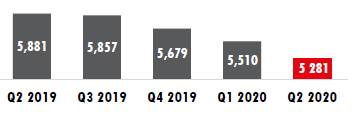
In Q2 2020, the Company continued to make progress toward its long-term goal of optimizing its retail network, with the total count of owned and franchised stores decreasing by 600 year-over-year. At the same time, the Company saw surging sales through online channels, with ecommerce revenue more than doubling year-over-year to reach RUB 3.6 bn.
1-month active users of MyMTS app (m)
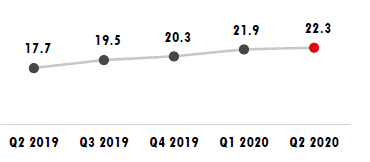
In Q2, MTS continued to see increasing adoption of its MyMTS integrated customer care app, with monthly active users reaching 22.3 million.
(14) Including franchises
FOREIGN MARKETS: ARMENIA AND BELARUS
|
| in AMD bn unless indicated otherwise |
| ||||
Armenia highlights |
| Q2 2020 |
| Q2 2019 |
| Change, % |
|
Revenue |
| 11.8 |
| 13.8 |
| -14.3 | % |
OIBDA |
| 6.0 |
| 6.8 |
| -12.1 | % |
margin |
| 50.5 | % | 49.2 | % | 1.3p.p. |
|
Net profit |
| 1.0 |
| 0.5 |
| 108.6 | % |
margin |
| 8.4 | % | 3.5 | % | 4.9 p.p. |
|
In Armenia, overall revenue decreased 14.3% year-over-year to AMD 11.8bn, primarily driven by lower sales of goods due to retail closures amid the COVID-19 pandemic, regulatory headwinds, and lower mobile service revenue, including from roaming and visitors.
OIBDA decreased 12.1% to reach AMD 6.0 bn, reflecting top-line dynamics.
|
| in BYN m unless indicated otherwise |
| ||||
Belarus highlights |
| Q2 2020 |
| Q2 2019 |
| Change, % |
|
Revenue |
| 287.7 |
| 251.4 |
| 14.5 | % |
OIBDA |
| 156.4 |
| 135.8 |
| 15.2 | % |
margin |
| 54.4 | % | 54.0 | % | 0.4 p.p. |
|
Net profit |
| 79.5 |
| 77.3 |
| 2.7 | % |
margin |
| 27.6 | % | 30.8 | % | -3.2 p.p. |
|
In Belarus, which is not consolidated, MTS’s operations continued to see solid double-digit top-line growth. In Q2 2020, revenue increased 14.5% year-over-year to reach BYN 287.7 m, primarily driven by mobile service revenue amid surging data consumption, as well as sales of goods.
OIBDA likewise saw a double-digit increase, up 15.2% year-over-year to reach BYN 156.4 m.
2020 OUTLOOK
Group Revenue:
For 2020, MTS forecasts Group Revenue to remain flat or grow slightly (flat to 3%), based on the following factors:
· A rational competitive environment in Russia;
· The impact from mobile tariff adjustments in Q1 2020;
· Rising data consumption and weaker voice usage;
· The impact from temporary store closures in line with public health guidelines;
· A drop off in roaming due to declining travel;
· Broader macroeconomic impacts on businesses and consumers; and
· Potential further macroeconomic and regulatory developments.
Group adj. OIBDA:
MTS forecasts Group adj. OIBDA in 2020 to slightly decline or remain stable (-2% to flat), taking into consideration the following factors:
· A drop off in roaming due to declining travel;
· Impairment of retail loans at MTS Bank amid the COVID-19 pandemic;
· Mobile tariff adjustments in Q1 2020;
· A high base from a positive one-off in Q1 2019;
· Market sentiment and prospective growth in usage of high-value products;
· Reducing SIM sales and lower subscriber churn;
· Ongoing steps to optimize the Group’s retail footprint and associated costs;
· Higher labor costs in new business segments; and
· Potential further macroeconomic and regulatory developments.
Group cash CAPEX:
FY2020 cash CAPEX spending is estimated to be around RUB 90 bn, including required investments under the Yarovaya Law (see below), due to a number of factors:
· Further incremental improvements and enhancements to LTE networks;
· Continued investment in digital products and services;
· Broader macroeconomic developments including FX volatility;
· Development of commercial 5G solutions and their introduction into Russian market; and
· Implementation of infrastructure and spectrum sharing projects within Russia.
Yarovaya Law
Under Russian Federal Law No 374-FZ enacted July 6, 2016 (also known as the “Yarovaya Law”), which governs data storage requirements, telecom operators are required to store voice and SMS communications, as well as Internet traffic for a period of up to six months. MTS forecasts the additional investment in data storage systems necessary to comply with the Yarovaya law at approximately RUB 50 bn over the five-year period H2 2018 through H1 2023 inclusive.
CONFERENCE CALL DETAILS
The management of Mobile TeleSystems (MTS) will be holding a conference call to discuss the Company’s Q2 2020 Financial & Operating Results on August 19, 2020.
The conference call will start at:
Moscow: 6:00 p.m.
London: 4:00 p.m.
New York: 11:00 a.m.
To take part in the conference call, please dial one of the following telephone numbers and enter confirmation code: 57888959#
From Russia:
+7 495 646 93 15 (Local access)
8 800 500 98 63 (Toll free)
From the UK:
+44 207 194 37 59 (Local access)
0800 376 61 83 (Toll free)
From the US:
+1 646 722 49 16 (Local access)
1 844 286 06 43 (Toll free)
A live webcast will also be available at: https://webcasts.eqs.com/mts20200819
A replay of the conference call will be available for 10 days at the following telephone numbers:
From Russia: +7 495 249 16 71 (Local access)
From the UK: +44 203 364 51 47 (Local access)
From the US: +1 646 722 49 69 (Local access)
Replay pass code: 418947526#
This press release provides a summary of the key financial and operating indicators for the period ended June 30, 2020. For full disclosure materials, please visit http://ir.mts.ru/investors/financial-center/financial-results/
CONTACT INFORMATION
Investor Relations Department
Mobile TeleSystems PJSC
Tel: +7 495 223 2025
E-mail: ir@mts.ru
Learn more about MTS. Visit the official blog of the Investor Relations Department at http://ir.mts.ru/ir-blog/ and follow us on Twitter: @MTS_IR
ATTACHMENTS
Attachment A
Non-IFRS financial measures.
This presentation includes financial information prepared in accordance with International Financial Reporting Standards, or IFRS, as well as other financial measures referred to as non-IFRS. The non-IFRS financial measures should be considered in addition to, but not as a substitute for, the information prepared in accordance with IFRS. Due to the rounding and translation practices, Russian ruble and functional currency margins, as well as other non-IFRS financial measures, may differ.
Operating Income Before Depreciation and Amortization (OIBDA) and OIBDA margin. OIBDA represents operating income before depreciation and amortization. OIBDA margin is defined as OIBDA as a percentage of our net revenues. OIBDA may not be similar to OIBDA measures of other companies, is not a measurement under IFRS and should be considered in addition to, but not as a substitute for, the information contained in our consolidated statement of profit or loss. We believe that OIBDA provides useful information to investors because it is an indicator of the strength and performance of our ongoing business operations, including our ability to fund discretionary spending such as capital expenditures, acquisitions of mobile operators and other investments and our ability to incur and service debt. While depreciation and amortization are considered operating costs under IFRS, these expenses primarily represent the non-cash current period allocation of costs associated with long-lived assets acquired or constructed in prior periods. Our OIBDA calculation is commonly used as one of the bases for investors, analysts and credit rating agencies to evaluate and compare the periodic and future operating performance and value of companies within the wireless telecommunications industry. We use the term Adjusted for OIBDA and operating profit where there were items that do not reflect underlying operations that were excluded.
OIBDA and Adjusted OIBDA can be reconciled to our consolidated statements of profit or loss as follows:
Group (RUB bn) |
| Q2’19 |
| Q3’19 |
| Q4’19 |
| Q1’20 |
| Q2’20 |
|
Operating profit |
| 27.1 |
| 32.6 |
| 27.3 |
| 26.5 |
| 26.0 |
|
Add: D&A |
| 24.2 |
| 24.1 |
| 24.5 |
| 24.7 |
| 24.7 |
|
Loss from impairment of non-current assets |
| — |
| — |
| -0.1 |
| 0.3 |
| 0.9 |
|
Adjusted OIBDA |
| 51.3 |
| 56.7 |
| 51.6 |
| 51.5 |
| 51.6 |
|
Russia (RUB bn) |
| Q2’19 |
| Q3’19 |
| Q4’19 |
| Q1’20 |
| Q2’20 |
|
Operating profit |
| 26.7 |
| 32.0 |
| 27.1 |
| 26.1 |
| 25.3 |
|
Add: D&A |
| 23.5 |
| 23.4 |
| 24.0 |
| 24.3 |
| 24.2 |
|
Loss from impairment of non-current assets |
| — |
| — |
| — |
| 0.3 |
| 0.9 |
|
Adjusted OIBDA |
| 50.3 |
| 55.4 |
| 51.1 |
| 50.7 |
| 50.4 |
|
Armenia (RUB m) |
| Q2’19 |
| Q3’19 |
| Q4’19 |
| Q1’20 |
| Q2’20 |
|
Operating profit |
| 255 |
| 374 |
| 396 |
| 411 |
| 407 |
|
Add: D&A |
| 657 |
| 649 |
| 510 |
| 433 |
| 483 |
|
OIBDA |
| 911 |
| 1 023 |
| 906 |
| 844 |
| 890 |
|
Adjusted OIBDA margin can be reconciled to our operating margin as follows:
Group |
| Q2’19 |
| Q3’19 |
| Q4’19 |
| Q1’20 |
| Q2’20 |
|
Operating margin |
| 23.3 | % | 26.5 | % | 21.5 | % | 22.2 | % | 22.1 | % |
Add: D&A |
| 20.8 | % | 19.6 | % | 19.3 | % | 20.7 | % | 20.9 | % |
Loss from impairment of non-current assets |
| — |
| — |
| -0.1 | % | 0.3 | % | 0.8 | % |
Adjusted OIBDA margin |
| 44.1 | % | 46.1 | % | 40.6 | % | 43.1 | % | 43.8 | % |
Russia |
| Q2’19 |
| Q3’19 |
| Q4’19 |
| Q1’20 |
| Q2’20 |
|
Operating margin |
| 23.2 | % | 26.3 | % | 21.5 | % | 22.1 | % | 21.8 | % |
Add: D&A |
| 20.4 | % | 19.2 | % | 19.0 | % | 20.5 | % | 20.8 | % |
Loss from impairment of non-current assets |
| — |
| — |
| — |
| 0.3 | % | 0.8 | % |
Adjusted OIBDA margin |
| 43.6 | % | 45.5 | % | 40.5 | % | 42.9 | % | 43.4 | % |
Armenia |
| Q2’19 |
| Q3’19 |
| Q4’19 |
| Q1’20 |
| Q2’20 |
|
Operating margin |
| 13.8 | % | 18.8 | % | 20.1 | % | 23.3 | % | 23.1 | % |
Add: D&A |
| 35.5 | % | 32.5 | % | 25.9 | % | 24.5 | % | 27.4 | % |
OIBDA margin |
| 49.2 | % | 51.3 | % | 46.0 | % | 47.7 | % | 50.5 | % |
Definitions
Total debt. Total debt represents short-term and long-term debt excluding lease obligations and debt issuance costs.
Net debt. Net debt represents total debt less cash and cash equivalents, short-term investments, long-term deposits, swap and currency hedging. Our net debt calculation is commonly used as one of the bases for investors, analysts and credit rating agencies to evaluate and compare our periodic and future liquidity within the wireless telecommunications industry. Our net debt calculation may not be similar to the net debt calculation of other companies. The non-IFRS financial measures should be considered in addition to, but not as a substitute for, the information prepared in accordance with IFRS.
Free Cash Flow. Free cash flow is represented by net cash from operating activities less cash used for certain investing activities. Free cash flow is commonly used by investors, analysts and credit rating agencies to assess and evaluate our performance over time and within the wireless telecommunications industry. Our free cash flow calculation may not be similar to the free cash flow calculation of other companies. Because free cash flow is not based in IFRS and excludes certain sources and uses of cash, the calculation should not be looked upon as an alternative to our consolidated statement of cash flows or other information prepared in accordance with IFRS.
Subscriber. We define a “subscriber” as an organization or individual, whose SIM-card:
· shows traffic-generating activity or
· accrues a balance for services rendered or
· is replenished or topped off
over the course of any three-month period, inclusive within the reporting period, and was not blocked at the end of the period.
MOBILE TELESYSTEMS
CONSOLIDATED STATEMENTS OF COMPREHENSIVE INCOME
FOR THE THREE AND SIX MONTHS ENDED JUNE 30, 2020 AND 2019
(Amounts in millions of RUB except per share amount)
|
| Six months |
| Six months |
| Three months |
| Three months |
|
|
| June 30, 2020 |
| June 30, 2019 |
| June 30, 2020 |
| June 30, 2019 |
|
Service revenue |
| 206 269 |
| 196 600 |
| 103 321 |
| 100 606 |
|
Sales of goods |
| 31 069 |
| 29 398 |
| 14 409 |
| 15 559 |
|
Revenue |
| 237 338 |
| 225 998 |
| 117 730 |
| 116 165 |
|
|
|
|
|
|
|
|
|
|
|
Cost of services |
| (60 256 | ) | (56 660 | ) | (30 712 | ) | (29 104 | ) |
Cost of goods |
| (28 548 | ) | (27 543 | ) | (13 383 | ) | (14 879 | ) |
|
|
|
|
|
|
|
|
|
|
Selling, general and administrative expenses |
| (42 714 | ) | (43 095 | ) | (20 267 | ) | (22 203 | ) |
Depreciation and amortization |
| (49 352 | ) | (47 753 | ) | (24 651 | ) | (24 155 | ) |
Other operating (expenses) / income |
| (4 971 | ) | 1 090 |
| (2 971 | ) | 118 |
|
Operating share of the profit of associates and joint ventures |
| 2 259 |
| 2 202 |
| 1 167 |
| 1 169 |
|
Impairment of non-current assets |
| (1 248 | ) | — |
| (929 | ) | — |
|
Operating profit |
| 52 508 |
| 54 239 |
| 25 984 |
| 27 111 |
|
|
|
|
|
|
|
|
|
|
|
Other expenses: |
|
|
|
|
|
|
|
|
|
Finance income |
| 1 967 |
| 2 701 |
| 1 189 |
| 1 110 |
|
Finance costs |
| (21 244 | ) | (23 022 | ) | (10 935 | ) | (12 072 | ) |
Other income / (expenses) |
| 3 581 |
| (2 348 | ) | (1 573 | ) | (1 512 | ) |
Total other expenses, net |
| (15 696 | ) | (22 669 | ) | (11 319 | ) | (12 474 | ) |
|
|
|
|
|
|
|
|
|
|
Profit before tax from continuing operations |
| 36 812 |
| 31 570 |
| 14 665 |
| 14 637 |
|
Income tax expense |
| (9 233 | ) | (6 890 | ) | (4 604 | ) | (3 146 | ) |
Profit for the period from continuing operations |
| 27 579 |
| 24 680 |
| 10 061 |
| 11 491 |
|
Discontinued operation: |
|
|
|
|
|
|
|
|
|
Profit after tax for the period from discontinued operation |
| 2 236 |
| 6 014 |
| 1 838 |
| 1 380 |
|
Profit for the period |
| 29 815 |
| 30 693 |
| 11 899 |
| 12 871 |
|
Profit for the period attributable to non-controlling interests |
| (322 | ) | (392 | ) | (146 | ) | (165 | ) |
|
|
|
|
|
|
|
|
|
|
Profit for the period attributable to owners of the Company |
| 29 493 |
| 30 301 |
| 11 753 |
| 12 706 |
|
|
|
|
|
|
|
|
|
|
|
Other comprehensive income / (loss) |
|
|
|
|
|
|
|
|
|
Items that may be reclassified subsequently to profit or loss |
|
|
|
|
|
|
|
|
|
Exchange differences on translating foreign operations |
| 1 911 |
| (2 790 | ) | (1 252 | ) | 480 |
|
Net fair value loss on financial instruments |
| — |
| (228 | ) | — |
| (445 | ) |
Other comprehensive income / (loss) for the period |
| 1 911 |
| (3 018 | ) | (1 252 | ) | 35 |
|
Total comprehensive income for the period |
| 31 726 |
| 27 675 |
| 10 647 |
| 12 906 |
|
Less comprehensive income for the period attributable to the noncontrolling interests |
| (322 | ) | (392 | ) | (147 | ) | (165 | ) |
Comprehensive income for the period attributable to owners of the Company |
| 31 404 |
| 27 283 |
| 10 500 |
| 12 741 |
|
|
|
|
|
|
|
|
|
|
|
Weighted average number of common shares outstanding, in thousands - basic |
| 1 774 372 |
| 1 789 145 |
| 1 775 872 |
| 1 775 144 |
|
Earnings per share attributable to the Group - basic: |
|
|
|
|
|
|
|
|
|
EPS from continuing operations |
| 15.36 |
| 13.58 |
| 5.58 |
| 6.38 |
|
EPS from discontinued operation |
| 1.26 |
| 3.36 |
| 1.04 |
| 0.78 |
|
Total EPS - basic |
| 16.62 |
| 16.94 |
| 6.62 |
| 7.16 |
|
Weighted average number of common shares outstanding, in thousands - diluted |
| 1 776 161 |
| 1 792 913 |
| 1 776 964 |
| 1 777 557 |
|
Earnings per share attributable to the Group - diluted: |
|
|
|
|
|
|
|
|
|
EPS from continuing operations |
| 15.34 |
| 13.55 |
| 5.58 |
| 6.37 |
|
EPS from discontinued operation |
| 1.26 |
| 3.35 |
| 1.03 |
| 0.78 |
|
Total EPS - diluted |
| 16.60 |
| 16.90 |
| 6.61 |
| 7.15 |
|
MOBILE TELESYSTEMS
CONSOLIDATED STATEMENTS OF FINANCIAL POSITION
As of June 30, 2020 and As of December 31, 2019
(Amounts in millions of RUB)
|
| As of June 30, |
| As of December 31, |
|
|
| 2020 |
| 2019 |
|
NON-CURRENT ASSETS: |
|
|
|
|
|
Property, plant and equipment |
| 267 873 |
| 265 479 |
|
Investment property |
| 2 596 |
| 2 986 |
|
Right-of-use assets |
| 133 872 |
| 138 817 |
|
Intangible assets |
| 120 306 |
| 118 404 |
|
Investments in associates and joint ventures |
| 8 432 |
| 6 450 |
|
Deferred tax assets |
| 9 985 |
| 9 975 |
|
Other non-current non-financial assets |
| 5 338 |
| 4 981 |
|
Bank deposits and loans |
| 53 390 |
| 53 472 |
|
Other investments |
| 11 007 |
| 11 195 |
|
Accounts receivable (related parties) |
| 11 064 |
| 10 787 |
|
Other non-current financial assets |
| 9 452 |
| 6 776 |
|
Total non-current assets |
| 633 315 |
| 629 322 |
|
|
|
|
|
|
|
CURRENT ASSETS: |
|
|
|
|
|
Inventories |
| 18 067 |
| 15 515 |
|
Trade and other receivables |
| 36 591 |
| 35 595 |
|
Accounts receivable (related parties) |
| 5 308 |
| 5 872 |
|
Bank deposits and loans |
| 44 371 |
| 39 370 |
|
Short-term investments |
| 25 994 |
| 25 618 |
|
VAT receivable |
| 10 504 |
| 9 350 |
|
Income tax assets |
| 3 371 |
| 4 301 |
|
Assets held for sale |
| 493 |
| 497 |
|
|
|
|
|
|
|
Advances paid and prepaid expenses and other non financial current assets |
| 5 149 |
| 5 842 |
|
Other financial current assets |
| 21 028 |
| 14 558 |
|
Cash and cash equivalents |
| 98 253 |
| 38 070 |
|
Total current assets |
| 269 129 |
| 194 588 |
|
|
|
|
|
|
|
Total assets |
| 902 444 |
| 823 910 |
|
|
|
|
|
|
|
EQUITY: |
|
|
|
|
|
Equity attributable to owners of the Company |
| 27 137 |
| 33 068 |
|
Non-controlling interests |
| 3 641 |
| 3 326 |
|
Total equity |
| 30 778 |
| 36 394 |
|
|
|
|
|
|
|
NON-CURRENT LIABILITIES: |
|
|
|
|
|
Borrowings |
| 396 560 |
| 271 573 |
|
Lease obligations |
| 137 099 |
| 140 080 |
|
Deferred tax liabilities |
| 20 129 |
| 17 866 |
|
Provisions |
| 5 213 |
| 4 761 |
|
Bank deposits and liabilities |
| 1 514 |
| 1 805 |
|
Other non-current financial liabilities |
| 9 |
| 955 |
|
Other non-current non-financial and contract liabilities |
| 1 887 |
| 2 019 |
|
Total non-current liabilities |
| 562 411 |
| 439 059 |
|
|
|
|
|
|
|
CURRENT LIABILITIES: |
|
|
|
|
|
Borrowings |
| 12 022 |
| 71 746 |
|
Lease obligations |
| 16 592 |
| 15 228 |
|
Provisions |
| 8 750 |
| 11 526 |
|
Trade and other payables |
| 87 463 |
| 71 808 |
|
Accounts payable (related parties) |
| 499 |
| 558 |
|
Bank deposits and liabilities |
| 139 271 |
| 136 147 |
|
Income tax liabilities |
| 2 075 |
| 784 |
|
Other current financial liabilities |
| 1 284 |
| 1 424 |
|
Other current non-financial and contract liabilities |
| 41 299 |
| 39 236 |
|
Total current liabilities |
| 309 255 |
| 348 457 |
|
|
|
|
|
|
|
Total equity and liabilities |
| 902 444 |
| 823 910 |
|
MOBILE TELESYSTEMS
CONSOLIDATED STATEMENTS OF CASH FLOWS
FOR THE SIX MONTHS ENDED JUNE 30, 2020 AND 2019
(Amounts in millions of RUB)
|
| Six months ended |
| Six months ended |
|
|
| June 30, 2020 |
| June 30, 2019 |
|
|
|
|
|
|
|
Profit for the period |
| 29 815 |
| 30 693 |
|
|
|
|
|
|
|
Adjustments for: |
|
|
|
|
|
Depreciation and amortization |
| 49 352 |
| 53 393 |
|
Finance income |
| (1 967 | ) | (2 923 | ) |
Finance costs |
| 21 244 |
| 23 736 |
|
Income tax expense |
| 9 233 |
| 7 615 |
|
Net foreign exchange loss/gain and change in fair value of financial instruments |
| (3 951 | ) | 233 |
|
Share of the profit of associates |
| (2 370 | ) | (5 557 | ) |
Inventory obsolescence expense |
| 658 |
| 944 |
|
Allowance for doubtful accounts |
| 1 392 |
| 1 313 |
|
Bank reserves |
| 5 347 |
| 1 555 |
|
Change in provisions |
| (2 540 | ) | (3 174 | ) |
Gain from sale of Ukraine operations |
| (1 967 | ) | — |
|
Impairment of non-current assets |
| 1 248 |
| — |
|
Other non-cash items |
| (1 903 | ) | (3 426 | ) |
|
|
|
|
|
|
Movements in operating assets and liabilities: |
|
|
|
|
|
|
|
|
|
|
|
Decrease / (Increase) in trade and other receivables and contract assets |
| 1 567 |
| (4 859 | ) |
Increase in bank deposits and loans |
| (9 919 | ) | (14 444 | ) |
(Increase) / Decrease in inventory |
| (2 960 | ) | 3 017 |
|
Increase in VAT receivable |
| (1 141 | ) | (1 942 | ) |
(Increase) / Decrease in advances paid and prepaid expenses |
| (5 265 | ) | 1 975 |
|
|
|
|
|
|
|
Increase in trade and other payables, contract liabilities and other liabilities |
| 2 274 |
| 2 349 |
|
Increase in bank deposits and liabilities |
| 1 141 |
| 3 160 |
|
|
|
|
|
|
|
Payment of fines and penalties related to SEC investigation into former operations in Uzbekistan |
| — |
| (55 607 | ) |
Dividends received |
| 651 |
| 2 250 |
|
Income taxes paid |
| (4 753 | ) | (14 727 | ) |
Interest received |
| 1 276 |
| 3 351 |
|
Interest paid, net of interest capitalised |
| (21 895 | ) | (24 066 | ) |
Net cash provided by operating activities |
| 64 567 |
| 4 859 |
|
|
|
|
|
|
|
CASH FLOWS FROM INVESTING ACTIVITIES: |
|
|
|
|
|
Acquisition of subsidiary, net of cash acquired |
| 69 |
| (2 030 | ) |
Purchases of property, plant and equipment |
| (28 053 | ) | (27 513 | ) |
Purchases of other intangible assets |
| (12 757 | ) | (11 781 | ) |
Cost to obtain and fulfill contracts |
| (2 337 | ) | (2 307 | ) |
Purchases of 4G licenses in Armenia |
| — |
| (23 | ) |
Purchase of Avantage |
| (196 | ) | — |
|
Proceeds from sale of property, plant and equipment and assets held for sale |
| 2 504 |
| 2 903 |
|
Purchases of short-term and other investments |
| (5 350 | ) | (11 812 | ) |
Proceeds from sale of short-term and other investments |
| 7 297 |
| 37 959 |
|
Investments in associates |
| (1 415 | ) | — |
|
Cash proceeds / (payments) related to SWAP contracts |
| 7 325 |
| (740 | ) |
Proceeds from sale / liquidation of associates |
| 2 450 |
| 3 000 |
|
Other investing activities |
| — |
| 5 |
|
Net cash used in investing activities |
| (30 463 | ) | (12 339 | ) |
|
|
|
|
|
|
CASH FLOWS FROM FINANCING ACTIVITIES: |
|
|
|
|
|
Acquisition of entities under common control, net of cash acquired |
| — |
| (13 520 | ) |
Repayment of loans |
| (63 585 | ) | (10 525 | ) |
Proceeds from loans |
| 106 047 |
| 1 013 |
|
Repayment of notes |
| (30 210 | ) | — |
|
Proceeds from issuance of notes |
| 46 757 |
| 22 500 |
|
Notes and debt issuance cost paid |
| (106 | ) | (51 | ) |
Lease obligation principal paid |
| (7 506 | ) | (7 348 | ) |
Dividends paid |
| (22 918 | ) | (2 | ) |
Repurchase of own shares |
| (1 088 | ) | (15 899 | ) |
Net cash provided by / (used in) financing activities |
| 27 391 |
| (23 832 | ) |
|
|
|
|
|
|
Effect of exchange rate changes on cash and cash equivalents |
| (1 312 | ) | (1 520 | ) |
|
|
|
|
|
|
NET INCREASE / (DECREASE) IN CASH AND CASH EQUIVALENTS: |
| 60 183 |
| (32 832 | ) |
|
|
|
|
|
|
CASH AND CASH EQUIVALENTS, at beginning of the period |
| 38 070 |
| 84 075 |
|
|
|
|
|
|
|
CASH AND CASH EQUIVALENTS, at end of the period |
| 98 253 |
| 51 243 |
|
SIGNATURES
Pursuant to the requirements of the Securities Exchange Act of 1934, the registrant has duly caused this report to be signed on its behalf by the undersigned, thereunto duly authorized.
| MOBILE TELESYSTEMS PJSC | ||
|
|
| |
|
|
| |
| By: | /s/ Alexey Kornya | |
|
| Name: | Alexey Kornya |
|
| Title: | CEO |
|
|
|
|
Date: August 19th, 2020 | |||