QuickLinks -- Click here to rapidly navigate through this document
SECURITIES AND EXCHANGE COMMISSION
Washington, D.C. 20549
FORM 6-K
Report of Foreign Issuer
Pursuant to Rule 13a-16 or 15d-16 of
the Securities Exchange Act of 1934
For the Month of January, 2004
Commission File Number 0-30860
Axcan Pharma Inc.
(Exact Name of Registrant)
597, boul, Laurier, Mont-Saint-Hilaire (Québec), Canada J3H 6C4
(Address of principal executive offices)
Indicate by check mark whether the registrant files or will file annual reports under cover Form 20-F or Form 40-F.
Form 20-F o Form 40-F ý
Indicate by check mark whether the registrant by furnishing the information contained in this Form is also hereby furnishing the information to the Commission pursuant to Rule 12g3-2(b) under the Securities Exchange Act of 1934.
Yes o No ý
This Form 6-K consists of: Axcan's 2003 Annual Report
| | | |
|---|---|---|
| 2003 AXCAN PHARMA | ANNUAL REPORT |

Weare gastroenterology
ABOUT AXCAN PHARMA
Axcan Pharma Inc. ("Axcan") is a leading specialty pharmaceutical company that develops, manufactures, markets and distributes gastroenterology products and therapeutic treatments primarily in North America and the European Union. Through internal product development and synergistic acquisitions of products and companies, Axcan has built a leadership position in the North American gastroenterology market and is currently building a leadership position in the European Union.
VISION
Axcan's vision is to become a multinational leader in providing innovative therapies for gastrointestinal diseases and disorders that will provide continued benefit to patients and to generate sales growth while exercising financial responsibility and increasing shareholder value.
MISSION
Axcan's mission is to improve the quality of care and treatment of patients suffering from gastrointestinal diseases and related disorders by providing effective therapies, products and specialized programs that meet the needs of these patients and their caregivers.
FORWARD-LOOKING STATEMENTS
This Annual Report contains forward-looking statements with respect to either the Company or certain of its subsidiaries. These forward-looking statements, by their nature, necessarily involve risks and uncertainties that could cause actual results to differ materially from those contemplated by the forward-looking statements. The Company considers the assumptions on which these forward-looking statements are based to be reasonable at the time they were prepared, but cautious the reader that these assumptions regarding future vents, many of which are beyond the control of the Company and its subsidiaries, may ultimately prove to be incorrect. Factors which could cause actual results or events to differ materially from current expectations are discussed on page 26 of this Annual Repot as well as in the Company's Annual Information Form for the year ended September 30, 2003. The Company disclaims any intention or obligation to update or revise any forward-looking statements whether as a result of new information, future events or otherwise.
THE GASTROENTEROLOGY SYSTEM
Gastroenterology
Gastroenterology can be defined as the diagnosis and treatment of diseases affecting the entire digestive system including the esophagus, the stomach, the small and large intestines, the colon, the liver, the pancreas, and the gall bladder. Gastrointestinal disorders affect 60 to 70 million men, women, and children of all ages in North America. Mortality, including deaths from cancer, amounts to 191,000 people per year and approximately 10 million people are hospitalized every year (13% of all hospitalizations) due to gastrointestinal afflictions.
Irritable bowel syndrome ("IBS") and dyspepsia are the most common functional gastrointestinal disorders. IBS alone affects 10% to 20% of adults. A functional disorder does not show any evidence of an organic or physical disease, and the cause of a functional gastrointestinal disorder is not detected in blood tests or X-rays. Such disorders are diagnosed based on symptoms, and life-long treatments are often required to alleviate these symptoms. The symptoms due to such disorders can cause discomfort, ranging from inconvenience to deep personal distress. For those who experience severe symptoms, the disorders can be debilitating, thus compromising their ability to take an active part in their personal and professional lives.
Beyond IBS, other conditions like pancreatic insufficiency, inflammatory bowel disease and cholestatic liver disease all fall within gastrointestinal diseases and disorders. The cost related to such diseases represents a tremendous economic and social burden.
Much remains unknown about gastrointestinal diseases and disorders. As a consequence, there is a pressing need to support more research, which Axcan has been constantly doing for the past few years through its research efforts designed to add to scientific knowledge and lead to advanced therapies in the field of gastroenterology.
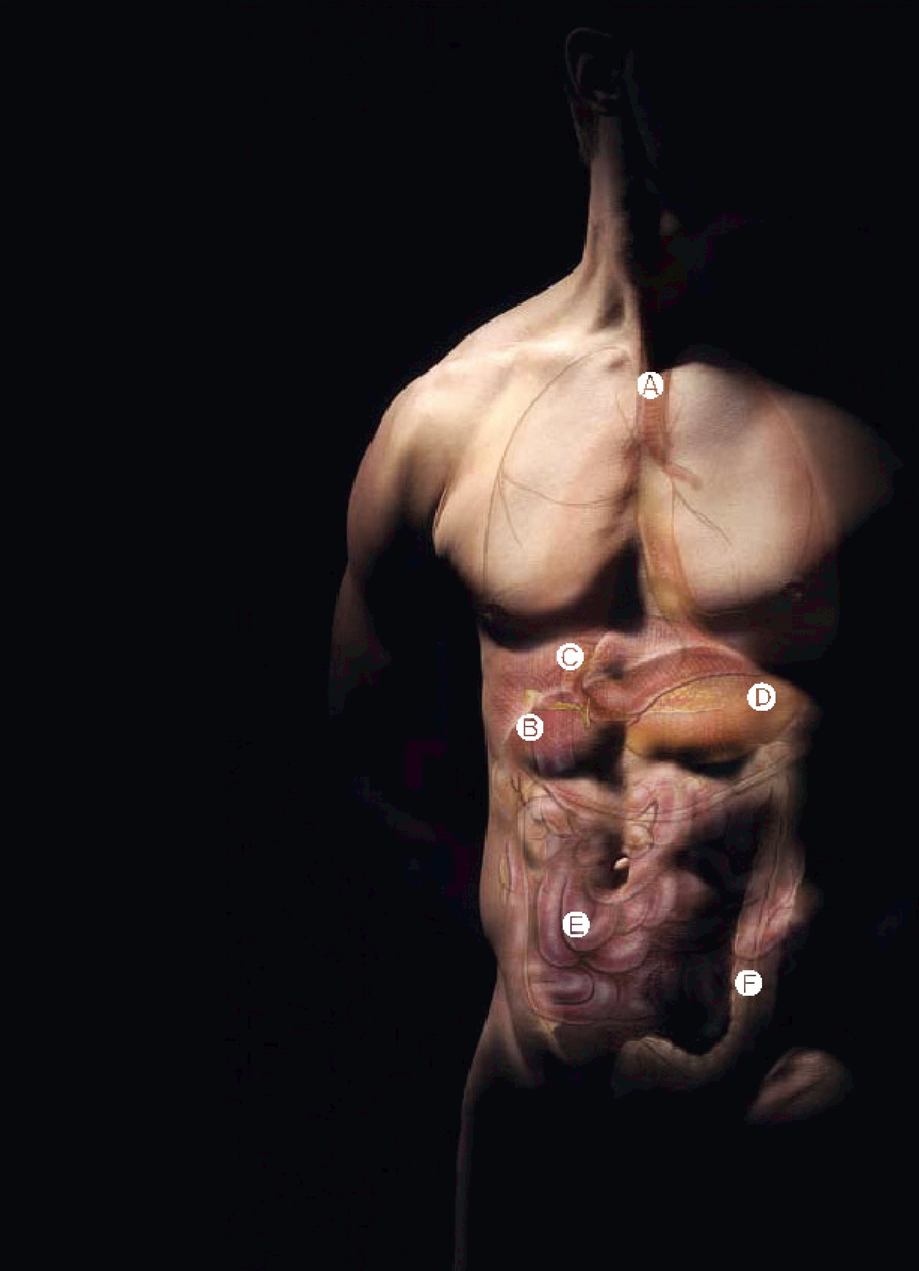
A Esophagus
Muscular tube that transports food by peristalsis from the pharynx to the stomach. Both ends are closed off by sphincters (muscular constrictions), which relax to let food through and close to keep it from backing up.
B Liver and biliary system
The liver is the body's largest internal organ, weighing about 1.5 kg, or 2.5% of body weight. The liver and biliary system produce bile and transport it to the small intestine, where it breaks up fats and other components of diet, and aids the digestion and absorption of nutrients. About a liter of bile is produced daily and enters the small intestine.
C Pancreas
The pancreas is a digestive and endocrine organ located behind the stomach in the upper abdomen. The pancreas secretes digestive juices containing enzymes into the duodenum to help break down food into smaller molecules that can be absorbed. It also secretes insulin into the bloodstream to maintain the appropriate concentrations of glucose in the blood.
D Stomach
The stomach is a digestive sac in the left upper abdominal cavity, which expands or contracts with the amount of food in it. It has four regions: the cardia leads down from the esophagus; the fundus curves above it; the body is the largest part; and the antrum narrows to join the duodenum at the pyloric valve. Iron and very fat-soluble substances (e.g., alcohol and some drugs) are absorbed in the stomach. Peristalsis mixes food with enzymes and hydrochloric acid from glands in its lining and moves the resulting chyme toward the small intestine. The vagus nerve and sympathetic nervous system control the stomach's secretions and movements.
E Small intestine
The small intestine is the longest section of the digestive tract, with an average length of about 6 meters. Although only 2.5 cm in diameter — which is why it is called the small intestine — its surface area for absorption covers the size of a tennis court. Large quantities of nutrients and water can be absorbed in the small intestine. Daily, it is capable of absorbing: several kilograms of carbohydrate; up to 1 kg of fat; 500 g of protein; and 20 liters of water.
The surface cells of the small intestine are highly specialized for digestion and absorption of nutrients. Almost all the body's nutrient absorption occurs in the small intestine, along its three sub-divisions: the duodenum, the jejunum and the ileum.
F Colon
The colon — also known as the large intestine — is the final organ of the digestive process. It is responsible for drying out indigestible food residues by absorbing fluid and producing solid waste (feces) for elimination. Approximately 1.5 meters long, the colon has six distinct regions leading from the junction with the small intestine: caecum, ascending colon, transverse colon, descending colon, sigmoid colon and rectum.

Léon F. Gosselin François Painchaud Jacques Gauthier Daniel Labrecque Louis P. Lacasse
Colin R. Mallet David W. Mims Dr. Claude Sauriol Jean Sauriol Michael M. Tarnow
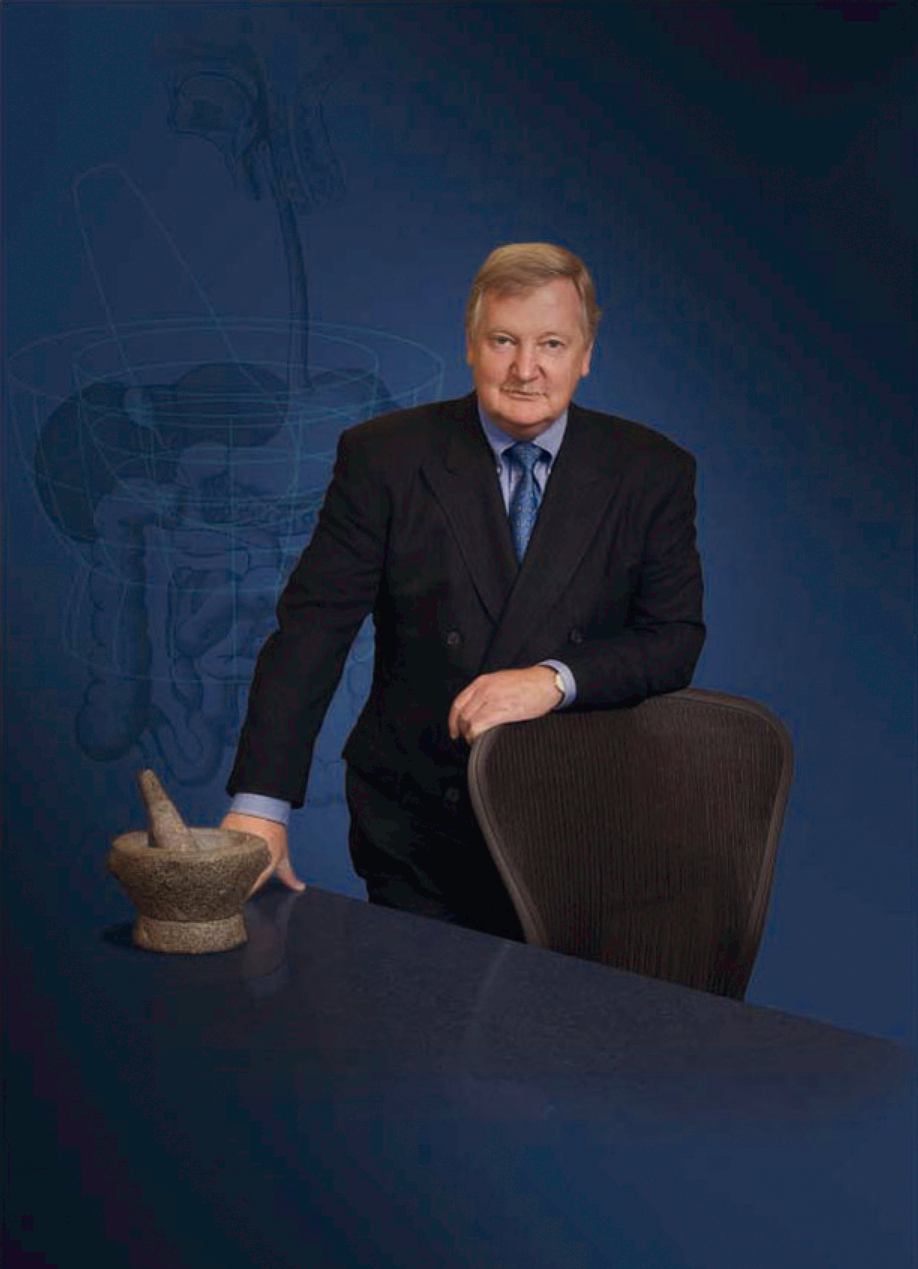
Léon F. Gosselin
Chairman of the Board,
President and Chief Executive Officer,
Axcan Pharma Inc.
Léon F. Gosselin, 58, of Mont-Saint-Hilaire, Quebec, has served as Chairman of the Board, President, and Chief Executive Officer of Axcan Pharma Inc. since 1993.
He is the co-founder of Interfalk Canada Inc., the predecessor of Axcan Pharma, and has held various positions within the pharmaceutical industry including Assistant General Manager at Nordic Laboratories Inc. which is now part of Aventis S.A. He has also acted as a consultant in the pharmaceutical industry. Mr. Gosselin holds a Bachelor's degree in Biochemistry and an M.B.A. from the University of Sherbrooke.
| | | |
|---|---|---|
| 2,825,000 | Common Shares | |
| 196,683 | Options |
François Painchaud
Corporate Secretary
Partner, Léger, Robic, Richard g.p., Law firm
and Robic, Patent and Trademark Agents
François Painchaud, 40, of St-Lambert, Quebec, has served on the Board of Directors of Axcan Pharma Inc. as Secretary and Director since December 1995.
He is a partner of the law firm of Léger Robic Richard, a general partnership, and of the patent and trademark agent firm of Robic, a general partnership. These Montreal professional services firms are specialized in business law and intellectual property, including patent law, and Mr. Painchaud has oriented his practice towards the field of commercial law with particular emphasis on licensing of intellectual property and technology transfers.
| | | |
|---|---|---|
| 1,700 | Common Shares | |
| 47,500 | Options |
Jacques Gauthier
Consultant and
Corporate Administrator
Jacques Gauthier, 76, of Town Mount-Royal, Quebec, has served on the Board of Directors of Axcan Pharma Inc. since December 1995.
He has held various senior management positions, both in Canada and abroad, with Upjohn Laboratories Inc. and Upjohn International Inc., predecessor corporations to Pharmacia Corporation. In 1984, Mr. Gauthier joined Bio-Méga/Boehringer Ingelheim Research Inc. and served as President and General Manager until 1996.
Mr. Gauthier is currently an advisor to management of the Montreal Clinical Research Institute and serves on the Board of Directors of a variety of medical and pharmaceutical companies and associations.
Chairman of Compensation Committee
Member of Corporate Governance and Nomination Committee
| | | |
|---|---|---|
| 1,000 | Common Shares | |
| 47,500 | Options |
Daniel Labrecque
President and Chief Executive Officer,
NM Rothschild & Sons Canada Limited
Daniel Labrecque, 48, of Montreal, Quebec, has served on the Board of Directors of Axcan Pharma Inc. since August 2003.
He began his career in 1977 as Auditor at Raymond, Chabot, Martin, Paré, then held various positions at the Royal Bank of Canada, the Mercantile Bank of Canada, the National Bank of Canada, Lévesque Beaubien Geoffrion, Schroder Canada and Lazard Canada. In April 2002, Mr. Labrecque joined Rothschild where he now acts as President and Chief Executive Officer of its Canadian operations.
Mr. Labrecque is also Chairman of the Canadian INSEAD Foundation and member of the International Council of INSEAD, as well as Director of the C.D. Howe Institute and Director of La Fondation de l'Ecole Nationale de Cirque.
| | | |
|---|---|---|
| 20,000 | Options |
Louis P. Lacasse
President,
GeneChem Venture Fund, l.p.
Louis P. Lacasse, 47, of Laval, Quebec, has served on the Board of Directors of Axcan Pharma Inc. since December 1995.
He is President of GeneChem Management Inc., an organization that manages Biotechnology Venture Capital funds. Prior to joining GeneChem in April 1997, Mr. Lacasse was Vice-President of Healthcare and Biotechnology of SOFINOV, the venture capital subsidiary of Caisse de depôt et placement du Québec. During his ten years with SOFINOV and the Caisse de depôt et placement du Québec, Mr. Lacasse was involved in numerous investments in small and medium-sized businesses in high technology industries such as biotechnology, software and telecommunications. He was also responsible for setting up a network of regional venture capital funds throughout Quebec and for investments in funds both in Canada and the US. He has been a member of the board of directors of many private and public companies including BioChem Pharma Inc. He is presently a director of four publicly traded companies and four privately held companies.
Chairman of Audit Committee
Member of Compensation Committee
| | | |
|---|---|---|
| 1,000 | Common Shares | |
| 47,500 | Options |
Colin R. Mallet
Corporate Director
Colin R. Mallet, 59, of Vancouver, British Columbia, has served on the Board of Directors of Axcan Pharma Inc. since December 1995.
He has worked in senior executive positions in the pharmaceutical industry in Canada, the United Kingdom, Switzerland, Sweden and Southeast Asia. He was President and Chief Executive Officer of Sandoz Canada Inc. (now Novartis) for seven years and is a past Chair of the Canadian Association of Research-Based Pharmaceutical Companies. He is currently a Director of four other pharmaceutical companies, AnorMED Inc., Methylgene Inc., Micrologix Biotech Inc., and Phytogen Inc., and is Chair of the Corporate Governance Committees for three of these companies.
Chairman of Corporate Governance and Nomination Committee
Member of Audit Committee
| | | |
|---|---|---|
| 5,000 | Common Shares | |
| 47,500 | Options |
David W. Mims
Executive Vice President and
Chief Operating Officer,
Axcan Pharma Inc.
David W. Mims, 41, of Birmingham, Alabama, USA, has served on the Board of Directors of Axcan Pharma Inc. since March 2000.
He has served as senior accountant at a major accounting firm before joining Russ Pharmaceuticals, Inc. in 1987 as Accounting Services Manager. In 1991, Mr. Mims helped found Scandipharm, Inc. and served the company as Vice President, Chief Operating Officer, and Chief Financial Officer. He resigned from Scandipharm, Inc. in March 1998 to join Cebert Pharmaceuticals, Inc. as Executive Vice President and Chief Operating Officer. Mr. Mims joined Axcan in 2000, shortly after the Company acquired Scandipharm, and presently serves as Executive Vice President and Chief Operating Officer. He is a Director of the University of Alabama, Birmingham (UAB) Research Foundation and a member of the American Institute of Certified Public Accountants and the Alabama Society of Certified Public Accountants.
| | | |
|---|---|---|
| 1,000 | Common Shares | |
| 267,800 | Options |
Dr. Claude Sauriol
Business Consultant
Dr. Claude Sauriol, 62, of Laval, Quebec, has served on the Board of Directors of Axcan Pharma Inc. since 1993.
He is a founder of Biopharm Laboratory where he was President and Chief Executive Officer for more than 25 years. He also served Axcan Pharma as Vice President of Research and Development where, for three years, he was responsible for regulatory affairs and clinical research. He is currently a Director of Angiogene Inc. and Algorithme Pharma Inc. and is a member of the audit and compensation committees of these companies.
Member of Audit Committee
| | | |
|---|---|---|
| 1,102,030 | Common Shares | |
| 46,000 | Options |
Jean Sauriol
Business Consultant
Jean Sauriol, 57, of Laval, Quebec, has served on the Board of Directors of Axcan Pharma Inc. since 1993.
He is a co-founder of Biopharm Laboratory where he worked for more than 25 years and was Vice President of Manufacturing at Axcan Pharma until 1996. He also served as President and Chief Executive Officer of Althin-Biopharm Inc. for six years (an Althin-Axcan joint venture, sold in 2001).
| | | |
|---|---|---|
| 1,104,530 | Common Shares | |
| 43,250 | Options |
Michael M. Tarnow
Business Consultant
Michael M. Tarnow, 59, of Boston, Massachusetts, USA, has served on the Board of Directors of Axcan Pharma Inc. since August 2000.
He has held various positions with Merck & Company, Inc. including President and Chief Executive Officer of Merck Frosst Canada from 1990 to 1994. From 1995 to 2000, he was President and Chief Executive Officer of Creative BioMolecules, a biotechnology company. Currently, he serves on the board of directors of several private and public healthcare and biotechnology companies.
Member of Corporate Governance and Nomination Committee
Member of Compensation Committee
| | | |
|---|---|---|
| 2,000 | Common Shares | |
| 45,300 | Options |

John R. (Bob) Booth Patrick L. McLean Dr. François Martin Dr. Patrick Colin Martha D. Donze
Jocelyn Pelchat Richard Tarte Michael E. Thiel Jean Vézina
Léon F. Gosselin, B. Sc., M.B.A.
President and Chief Executive Officer
Mr. Gosselin is the co-founder of Interfalk Canada Inc., the predecessor of Axcan Pharma. He has held various positions within the pharmaceutical industry including Assistant General Manager at Nordic Laboratories Inc. which is now part of Aventis S.A. He has also acted as a consultant in the pharmaceutical industry. Mr. Gosselin holds a Bachelor's degree in Biochemistry and an M.B.A. from the University of Sherbrooke.
| | | |
|---|---|---|
| 2,825,000 | Common Shares | |
| 196,683 | Options |
David W. Mims, C.P.A.
Executive Vice President and
Chief Operating Officer
Mr. Mims has served as senior accountant at a major accounting firm before joining Russ Pharmaceuticals, Inc. in 1987 as Accounting Services Manager. In 1991, he helped found Scandipharm, Inc. and served the company as Vice President, Chief Operating Officer, and Chief Financial Officer. He resigned from Scandipharm, Inc. in March 1998 to join Cebert Pharmaceuticals, Inc. as Executive Vice President and Chief Operating Officer. Mr. Mims joined Axcan in 2000, shortly after the Company acquired Scandipharm, and presently serves as Executive Vice President and Chief Operating Officer. He is a Director of the University of Alabama, Birming-ham (UAB) Research Foundation and a member of the American Institute of Certified Public Accountants and the Alabama Society of Certified Public Accountants.
| | | |
|---|---|---|
| 1,000 | Common Shares | |
| 267,800 | Options |
John R. (Bob) Booth, R. Ph.
Senior Vice President,
North American Commercial Operations
Mr. Booth is a licensed Registered Pharmacist (R. Ph.) in the states of Alabama, Mississippi and North Carolina and a member of the Alabama and Mississippi Pharmacy Associations. Prior to joining Scandipharm, he was Vice President of Sales and Marketing for the United States at Medicopharma N.V. and Director of Marketing at D.M. Graham Laboratories. He joined Axcan Scandipharm, Axcan's U.S. subsidiary, in 1992 as Director of Product Development and Quality Control.
| | | |
|---|---|---|
| 57,810 | Options |
Patrick L. McLean, B. Sc.
Senior Vice President,
European Commercial Operations
Mr. McLean has more than 20 years of marketing experience, most recently with the Health Group of Cossette Communications Marketing Inc. as Managing Director. He has designed and implemented innovative strategies for numerous pharmaceutical products on behalf of clients such as Roche Diagnostics, Schering Canada Inc. and Janssen-Ortho Inc., a company with gastrointestinal drug products. Mr. McLean joined Axcan in 1999.
| | | |
|---|---|---|
| 1,133 | Common Shares | |
| 94,506 | Options |
Dr. François Martin, Ph.D., M.D.
Senior Vice President,
Scientific Affairs
When he joined Axcan in 1997 Dr. Martin had been teaching Medicine at the University of Montreal, and practicing gastroenterology at St-Luc Hospital in Montreal, since 1970. He has published more than 50 research articles and received the Academic and Scientific Excellence Award from the Québec Association of Gastroenterologists in 1995. While working at Axcan, he has continued to hold the position of Honorary Professor of Medicine at the University of Montreal, and he practices gastroenterology one day per week at the Downtown Gastroenterology Clinic.
| | | |
|---|---|---|
| 5,367 | Common Shares | |
| 82,803 | Options |
Dr. Patrick Colin, Ph.D.
Vice President,
Research and Development
Dr. Colin began his career at Bristol-Myers Squibb in 1987 where he worked in various clinical research positions. He is a member of several scientific organizations and an active member of the Order of Pharmacists of Quebec. Dr. Colin joined Axcan in 1994.
| | | |
|---|---|---|
| 1,972 | Common Shares | |
| 50,288 | Options |
Martha D. Donze, B.A.
Vice President,
Corporate Administration
Ms. Donze has more than 25 years of experience in human resources and communications, serving with Alabama Power Company, Avondale Mills, and Employers Insurance. She is a member of the U.S. Society of Human Resource Management and the Society of Human Resource Global Forum, an international human resources organization. Ms. Donze joined Axcan Scandipharm, Axcan's U.S. subsidiary, in 1993.
| | | |
|---|---|---|
| 1,000 | Common Shares | |
| 70,560 | Options |
Jocelyn Pelchat, B. Sc., M.B.A.
Vice President,
Business Development and Export Operations
Mr. Pelchat began his career at Roussel Canada as medical research associate. He held various positions of increasing responsibility in clinical research, sales and marketing as well as portfolio and project management with the Canadian subsidiaries of Jouveinal Canada Inc., Rhône Poulenc Rorer Inc., Sandoz Canada Inc. as well as Hoechst Marion Roussel Canada Inc., now known as Aventis. Most recently, in 1999, Mr. Pelchat was the Director of Business Development at the Société Générale de Financement du Québec, a diversified investment fund, prior to joining Axcan in 2000.
| | | |
|---|---|---|
| 1,606 | Common Shares | |
| 110,000 | Options |
Richard Tarte, LL.B., M.B.A.
General Counsel
Mr. Tarte was admitted to the Quebec Bar in 1988. Before joining Axcan in June 2001, he was in-house counsel at the Société générale de financement du Québec, a diversified investment fund. He was also previously a partner with Coudert Frères, an international law firm where he practiced business law for 10 years. Mr. Tarte joined Axcan in 2001.
| | | |
|---|---|---|
| 53,000 | Options |
Michael E. Thiel, B.A., M.B.A.
Vice President of Marketing,
North American Operations
Before entering the healthcare industry, Mr. Thiel served in the United States Army for five years as an officer and pilot. With an extensive professional background in management, marketing and sales, he was based in Munich, Germany while serving as Director of Marketing and Clinical Services for Bausch and Lomb – Europe. He also worked as a Senior Product Manager at Medeva Pharmaceuticals and held several sales and marketing positions at Bristol-Myers Squibb in the therapeutic areas of cardiovascular, anti-infective, central nervous system, women's healthcare, and pediatrics. Mr. Thiel joined Axcan in 2000.
| | | |
|---|---|---|
| 13,500 | Options |
Jean Vézina, C.G.A.
Vice President,
Finance and Chief Financial Officer
Mr. Vézina started his career with a major Montreal-based accounting firm in 1977 and has served in various financial capacities with several different companies prior to joining Axcan in 1992. He is a member of the Quebec Order of Certified General Accountants.
| | | |
|---|---|---|
| 3,594 | Common Shares | |
| 66,067 | Options |
INVESTORINFORMATION
STOCK EXCHANGE LISTINGS
Axcan Pharma Inc. is listed on the Toronto Stock Exchange under the symbol AXP and on the NASDAQ National Market under the symbol AXCA.
NUMBER OF SHARES
At September 30, 2003, there were 45,004,320 Axcan common shares outstanding.
DIVIDEND POLICY
The Company currently does not pay dividends on its common shares, and has no plans to do so in the foreseeable future, preferring to reinvest its cash to enhance the Company's growth.
TRANSFER AGENT AND REGISTRAR
Our transfer agent, Computershare Trust Company of Canada, can assist you with a variety of shareholder related services, including changes of address and lost share certificates.
COMPUTERSHARE TRUST COMPANY OF CANADA
1500 University Street
Suite 700
Montreal, Quebec
H3A 3S8 Canada
Tel: 1 (800) 332-0095
www.computershare.com
ANNUAL MEETING
The Annual General Meeting of Axcan Pharma Inc. will be held at 9:00 A.M. on February 19, 2004, at:
Omni Hotel
1050 Sherbrooke Street West
Montreal, Quebec
H3A 2R6 Canada
Tel: (514) 284-1110
ADDITIONAL INFORMATION MAY BE OBTAINED FROM
Isabelle Adjahi
Director, Investor Relations
Axcan Pharma Inc.
597 Laurier Blvd.
Mont Saint-Hilaire, Quebec
J3H 6C4 Canada
Telephone: (450) 467-5138 or 1 (800) 565-3255
Fax: (450) 464-9979
E-mail: iadjahi@axcan.com
Axcan files all mandatory information with Canadian securities commissions and the U.S. Securities and Exchange Commission. This information is available from the Company upon request.
CORPORATE OFFICE
Axcan Pharma Inc.
597 Laurier Blvd.
Mont Saint-Hilaire, Quebec
J3H 6C4 Canada
Telephone: (450) 467-5138 or (800) 565-3255
Fax: (450) 464-9979
www.axcan.com
Additional copies of the following documents can also be obtained at the above address:
Annual Report
Quarterly reports
Annual Information Form
Information circular
Investor information
Press kit
An archived version of the webcast will be available on Axcan's website after the Annual Meeting.
Pour obtenir une version française du rapport annuel, veuillez communiquer avec le service des relations avec les investisseurs.
Design: Spirale Communication Marketing Inc.
Corporate section: Mohawk Options Bright White Smooth
Financial section: Mohawk Opaque White Vellum
AXCAN PHARMA INC.
©2004-All rights reserved
Printed in Canada
The names BENTYL, BENTYLOL, CANASA, CARAFATE, DELURSAN, FLUTTER, HELIZIDE, HEPENAX, ITAX, LACTÉOL, LANSOYL, MODULON, PANZYTRAT, PHOTOFRIN, PROCTOSEDYL, SALOFALK, SCANDICAL, SCANDISHAKE, SULCRATE, TAGAMET, TRANSULOSE, TRANSITOL, URSO, ULTRASE and VIOKASE appearing in this annual report are trademarks of Axcan and its subsidiaries; the name ADEKs is a registered trademark of Carlsson-Rensselaer Corporation; AMPHOJEL is a registered trademark of Wyeth; COPTIN is a registered trademark of Pfizer Inc.; CORTENEMA is a registered trademark of Reid Rowell Inc.; MUCAINE is a registered trademark of American Home Products.
Gastroenterology
THE MEDICAL SPECIALTY CONCERNED
WITH THE FUNCTION AND DISORDERS
OF THE GASTROINTESTINAL TRACT
INCLUDING THE INTESTINES, LIVER,
PANCREAS, STOMACH, AND OTHER
ASSOCIATED ORGANS.
Wearegastroenterology
AXCAN PROUDLY PRESENTS ITS 8TH ANNUAL REPORT
TABLE OF CONTENTS
| FINANCIAL HIGHLIGHTS | 4 | |
| MESSAGE TO OUR SHAREHOLDERS | 7 | |
| OUR PRODUCTS | 12 | |
| A GROWING PRODUCT PIPELINE | 14 | |
| MANAGEMENT'S DISCUSSION AND ANALYSIS OF FINANCIAL CONDITION AND RESULTS OF OPERATIONS | 16 | |
| CONSOLIDATED FINANCIAL STATEMENTS — U.S. GAAP | 29 | |
| CONSOLIDATED FINANCIAL STATEMENTS — CANADIAN GAAP | 59 | |
| ADDITIONAL INFORMATION | 87 |
2
3
FINANCIAL HIGHLIGHTS
Years Ended September 30
(All amounts stated in thousands of U.S. dollars,
except share related data, percentages and ratios)
| | 2003 | 2002 | 2001 | |||||
|---|---|---|---|---|---|---|---|---|
| | $ | $ | $ | |||||
| OPERATING DATA | ||||||||
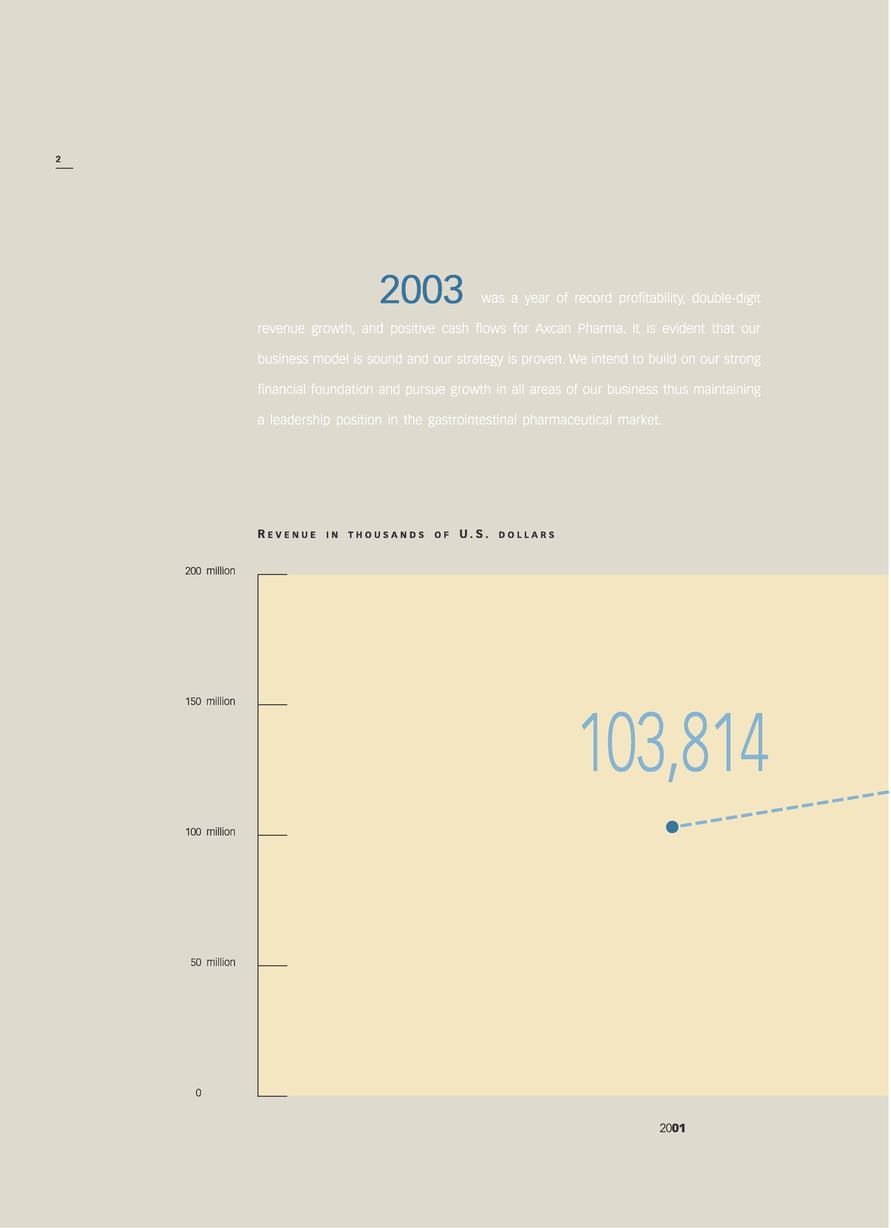
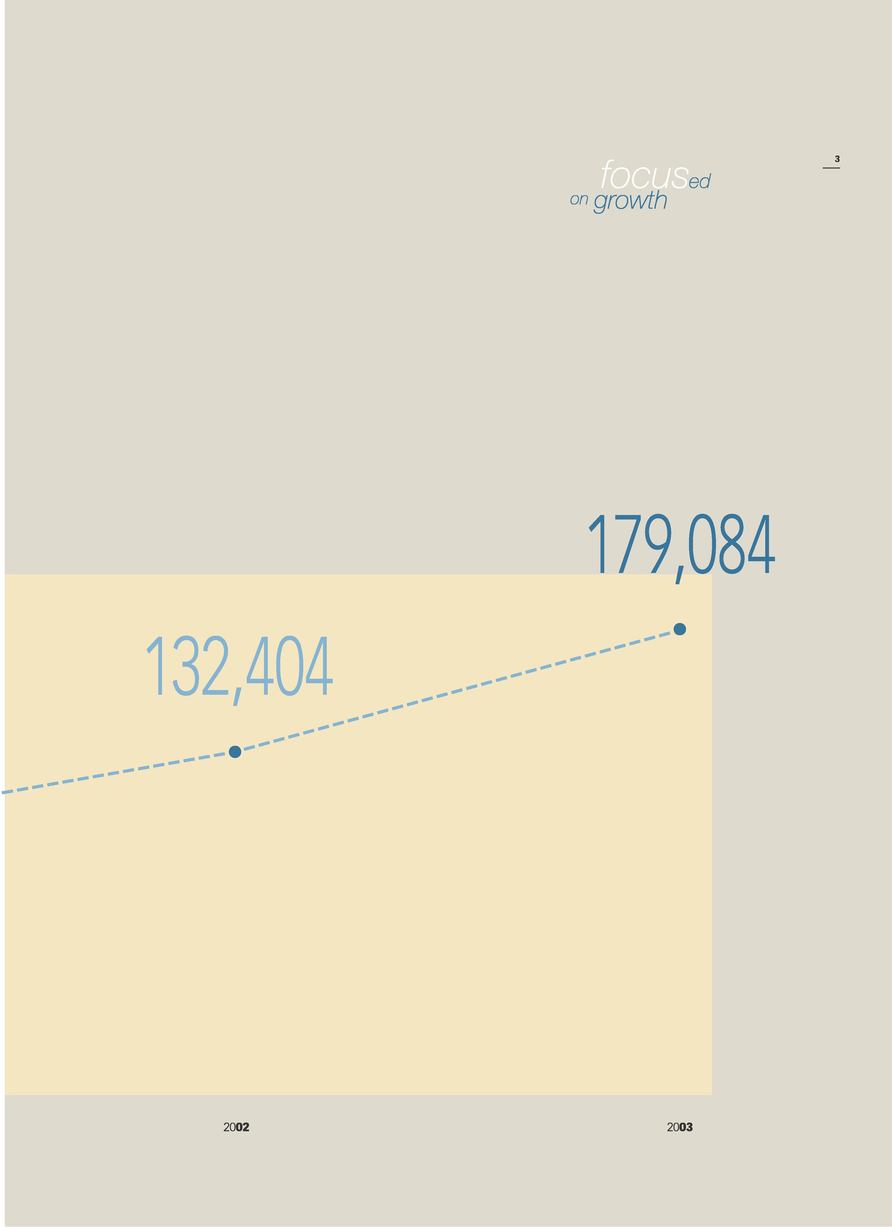
| Revenue | 179,084 | 132,404 | 103,814 | |||||
| Expenses | ||||||||
| Cost of goods sold | 44,459 | 34,039 | 26,381 | |||||
| Research and development | 12,098 | 8,855 | 7,243 | |||||
| Selling and administrative | 63,084 | 49,392 | 38,185 | |||||
| Depreciation and amortization | 8,063 | 7,546 | 11,829 | |||||
| Operating income | 39,380 | 32,572 | 20,176 | |||||
| Net income | 19,925 | 21,188 | 11,825 | |||||
| Net income, excluding one-time charges1 | 33,350 | 21,188 | 11,825 | |||||
| Per share data, excluding one-time charges1 | ||||||||
| Basic net income2 | 0.74 | 0.51 | 0.32 | |||||
| Diluted net income2 | 0.73 | 0.50 | 0.32 | |||||
| Weighted average number of common shares outstanding ('000s) (diluted) | 45,608 | 42,528 | 36,531 | |||||
| FINANCIAL POSITION | ||||||||
| Cash, cash equivalents and short-term investments | 170,885 | 80,717 | 16,531 | |||||
| Total assets | 545,349 | 367,006 | 246,484 | |||||
| Long-term debt (including convertible subordinated notes) | 131,002 | 8,603 | 2,919 | |||||
| Shareholders' equity | 331,011 | 294,787 | 200,431 | |||||
4
| | 2003 | 2002 | 2001 | ||||
|---|---|---|---|---|---|---|---|
| | $ | $ | $ | ||||
| COMMON SHARE PERFORMANCE | |||||||
| Market capitalization3 ('000s) | 612,059 | 430,238 | 411,010 | ||||
| Closing share price on NASDAQ National Market | 13.60 | 9.59 | 10.70 | ||||
| Closing share price on Toronto Stock Exchange (CDN$) | 18.28 | 15.11 | 16.95 | ||||
| Closing number of common shares issued and outstanding ('000s) | 45,004 | 44,863 | 38,412 | ||||
| CASH FLOWS | |||||||
| Operating activities | 51,496 | 35,331 | 16,390 | ||||
| Acquisition of intangible assets | 76,093 | 1,561 | 1,892 | ||||
| Net issuance of common shares | 1,103 | 65,039 | 30,969 | ||||
| Issuance of long-term debt | 126,064 | 1,506 | — | ||||
| Net increase in cash and cash equivalents | 17,796 | 3,462 | 5,391 | ||||
| RATIOS | |||||||
| Gross margin | 75.2% | 74.3% | 74.6% | ||||
| Operating margin | 22.0% | 24.6% | 19.4% | ||||
| Net margin | 11.1% | 16.0% | 11.4% | ||||
| Return on equity | 6.4% | 8.6% | 6.6% | ||||
| Revenue growth | 35.3% | 27.5% | 19.6% | ||||
- 1.
- One-time charges consist of takeover-bid expenses and acquired in-process research expenses.
- 2.
- A non-GAAP measure (see page 22)
- 3.
- As of September 30
5
6
focused on gastroenterology
MESSAGE TO OURSHAREHOLDERS
"Fiscal 2003 marked another year of record achievements: not only record revenue, income and investment in research and development, but also a record number of product acquisitions and in-licensing agreements. More than any other time in our history, we were able to set the stage for even stronger mid to long-term growth. We have strengthened our resolve to make a difference in the lives of patients afflicted with liver diseases, significant motility disorders, and other gastrointestinal diseases and disorders. And we have done so without compromising short-term profitability and balance sheet strength.
I am pleased to provide you with the Axcan Pharma 2003 Annual Report. This report illustrates how the Company's activities during 2003 formed part of a broader strategic program for growth. This report also reveals a glimpse of the future. As we provide an overview of our Company's performance during the year, I will illustrate how 2003 points the way to the future of gastrointestinal therapies and that of Axcan."
7
As in the past, 2003 brought both challenge and opportunity. Throughout the numerous events that unfolded, we remained focused on our core business: gastroenterology — the identification of unmet needs, and the search for solutions that will contribute to healthier lives for patients suffering from gastrointestinal diseases and related disorders. Major problems such as the absence of adequate gastroprokinetic drugs, and the need to treat portal hypertension did not escape our attention. In the future, we will also focus our attention on less frequent disease states such as pouchitis, or biliary atresia.
In order to remain focused, we established key objectives. These included completing the acquisition and integration of Laboratoires Entéris S.A.S. ("Entéris") and Laboratoire du Lactéol du Dr Boucard S.A. ("Lactéol"), both located in France. Our goals also consisted of continuing sales growth by broadening our proprietary activities, expanding our research and development portfolio, and preparing for the approval and launch of new products. Most importantly, we set out to acquire and in-license products and technologies to lay the foundations for long-term growth.
I am pleased to report that, overall, we reached significant milestones and met or exceeded most of our operational and other goals for 2003.
In-license agreements with Abbott Laboratories and Merz AG have considerably increased the value of our product development pipeline which bodes extremely well for the next five years.
Unfortunately, in 2003, we were again challenged by manufacturing issues related to one of our active ingredient suppliers for HELIZIDE triple therapy for the eradication ofHelicobacter pylori. We are resolved to settle this issue in 2004, paving the way for an anticipated 2005 launch. SuccessfulHelicobacter pylori eradication affected by microbial resistance is too important a goal for Axcan not to accomplish it.
FINANCIALRESULTS
From a financial perspective, 2003 was also a stellar year for Axcan. We achieved the highest revenues, net income*, and investment in research and development levels in our 21-year history. Our goals included operating and net margin improvement, growth of total revenue and income per share, as well as stock price stability in a difficult market climate. We used proceeds from our convertible debenture offering to invest in product acquisitions, technology in-licensing and other key strategic partnership areas such as our joint-venture with Nordmark AG, for the development of the next generation of pancreatic enzymes.
For the fiscal year ended September 30, 2003, the Company reported revenue growth of 35% to $179.1 million. Operating margin* rose to 29% of revenue in 2003, compared with 25% in 2002. We expect to meet our overall 30% operating margin goal in fiscal 2004. Income prior to net one-time costs associated with the takeover bid for Salix Pharmaceuticals Inc. and before acquired in-process research expenses of $12 million was $33.4 million or $0.73 per share on a fully-diluted basis for the year. Net income for the year was $19.9 million (or $0.44 of fully-diluted income per share) after such costs were considered.
- *
- Before one-time charges consisting of takeover-bid expenses, acquired in-process research and related income taxes, a non-GAAP measure (see page 22).
8
focused on therapeutic advances
Through continued growth and therapeutic innovation, Axcan seeks to build shareholder value at a rate that will provide a better return to shareholders than they could gain otherwise by investing in peer companies.
ORGANICGROWTH
In North America, we continued to raise product sales by increasing prescriptions and unit growth in our major product lines of ursodiols and pancreatic enzymes. Our revenue reached an all-time high of $134.5 million, due to the dedication of all our employees, including our sales and marketing teams, our field sales teams and our managed care teams. We have also deployed a small photodynamic therapy sales force alongside our gastrointestinal specialty sales force that is paving the way for the launch of PHOTOFRIN in the treatment of High-Grade Dysplasia associated with Barrett's Esophagus. Sales of gastrointestinal prescription drugs in North America are fast approaching $200 million as we continue to position ourselves as the leading specialty pharmaceutical company in gastroenterology.
A major goal set a few years ago was to successfully establish European operations. We acquired Lactéol and Entéris and they now operate under the name Axcan Pharma S.A. This has led to an aggressive expansion program in Western Europe where we met or exceeded all of the operational goals that have been established. We further leveraged our European presence through the acquisition of products in Western Europe: DELURSAN (ursodiol 250 mg tablets) from Aventis Pharmaceuticals, and PANZYTRAT (pancreatic enzyme line of products) from Abbott Laboratories. For the year, product revenue from France, including domestic and foreign sales, was $44.2 million, representing a 199% increase over the previous year. European sales now account for 25% of Axcan's total sales.
Our focused sales forces continue to gain market share in the gastrointestinal therapeutic arena. The Company has established an excellent base of experience from which to launch new products, including PHOTOFRIN, approved in North America for the ablation of High-Grade Dysplasia associated with Barrett's Esophagus.
We are also further developing an infrastructure in North America as well as Europe that will serve as a platform to build accretive business in all related geographical core areas of interest. In the next several years, we will continue to leverage our infrastructure by targeting and launching new products focused on specific gastrointestinal diseases and geographical markets.
9
BUSINESSDEVELOPMENT
New product development remains a priority. We strengthened our research and development pipeline by pursuing an aggressive late stage product and technology in-licensing strategy. At year-end, Axcan had a portfolio of 16 products in development either on our own or through collaborative efforts. Through developed partnerships, Axcan is reducing risks associated with new projects as well as leveraging its limited research and development capacities.
The overall potential of our pipeline increased dramatically in September when Axcan acquired the rights to ITAX (itopride hydrochloride), a novel gastroprokinetic drug with the potential to become the leading therapy for the treatment of impaired upper gastrointestinal motility. The launch of this and other products will further leverage Axcan's sales and marketing infrastructure. As an example, if approved, ITAX could generate annual revenue of approximately $200-300 million, resulting in a significant impact on net income.
The in-licensing of North American and European rights to HEPENAX for the treatment of hepatic encephalopathy also bolstered our mid-term liver disease product portfolio. Axcan will start the development of this product in 2004 and expects to launch it in 2006.
Acquisitions have and will continue to play a key role in complementing our new product development efforts and accelerating Axcan's organic growth. We will continue to seek acquisitions, strategic partnerships and alliances that will further expand and strengthen our product portfolio. With little debt and strong cash flows, we have considerable financial flexibility for sizeable acquisitions. All such transactions must, however, be income accretive and complement our product portfolio.
RESEARCH ANDDEVELOPMENT
We obtained two important product approvals during the year: PHOTOFRIN was approved in North America for the ablation of High-Grade Dysplasia associated with Barrett's Esophagus, and HELIZIDE was approved in Canada for the eradication ofHelicobacter pylori, a bacterium recognized as the main cause of gastric and duodenal ulcers.
We have positioned Axcan to launch internally developed products into the North American and Western European markets. Next year, we will launch PHOTOFRIN for a new indication. We also plan to launch CANASA 1 gram suppositories and URSO DS in the United States, as well as SALOFALK 750 milligram tablets in Canada. HELIZIDE will be ready to launch as soon as the issue related to the manufacturing of bismuth subcitrate is resolved. And, thanks to the recent transaction with Aventis, CARAFATE/SULCRATE, BENTYL/BENTYLOL and PROCTOSEDYL will add more than $40 million in revenues next year.
We have been very successful in achieving our strategic goal of providing quality products to address the needs of patients suffering from gastrointestinal diseases and related disorders. Our product pipeline is filled with new and exciting projects, which I believe we will bring to fruition to add to the arsenal of drugs treating gastrointestinal diseases. As long as there are unmet medical needs, Axcan will strive to fill them.
10
focused on the future
LOOKINGAHEAD
During the past five years, Axcan's growth has accelerated. Our consistent focus increases our ability to compete successfully with other companies. Our goals for fiscal 2004 remain aggressive and will serve to build long-term sustainable shareholder value. Throughout the next year, we will further develop our leadership position as a specialty pharmaceutical company in the field of gastroenterology. We hope to produce revenue of over $240 million and income per share of $0.92 next year, which would result in an increase in income per share of more than 25%. This will be driven by new product introductions and the re-launch of acquired products. Furthermore, we hope to pave the way to introduce new products through an expanded distribution network.
I ask that you join me in thanking all of our more than 400 loyal employees in North America and Europe for their dedication and outstanding achievements during the year. The commitment of our personnel, and their resolve, will ensure that your interests are cared for during the coming years. We consistently set objectives that demand the best efforts of all employees, and they have responded in exemplary fashion. I am confident that this will continue to be the case in the future, as we strive together to make 2004 even more profitable.
I would also like to thank the Board of Directors for the sound strategic guidance and insight that helped Axcan position itself so well in a challenging environment, and I want to express my gratitude to you, our shareholders, for your ongoing support.
In conclusion, I want to assure all current and potential investors that Axcan is commited to the highest ethical standards of conduct in all areas of its business. Investor confidence in public companies has been shaken during the past few years, and the reforms that resulted will ultimately shape the way companies operate. We, at Axcan, support efforts that strengthen accounting policies and practices and that ensure complete and open disclosure of financial results. We are also committed to the preservation of our excellent reputation and believe that our credibility is critical to the positive success and future of the Company.
| signed Léon F. Gosselin Chairman of the Board, President and Chief Executive Officer |  |
11
Within the field of gastroenterology there is a relatively high number of diseases with each requiring specialized treatments and medications. And, since the causes of most gastrointestinal diseases are unknown, most treatments currently available provide relief from symptoms rather than a cure. Patients that use Axcan's products tend to have chronic diseases and remain under the care of their physicians for prolonged periods of time.
Axcan markets its products through its infrastructures in North America and Europe.
To date, Axcan's accelerating revenue and income have been driven by products for diseases of the bowel such as Irritable Bowel Syndrome and Inflammatory Bowel Diseases (Crohn's Disease and ulcerative colitis); diseases of the liver (cholestatic liver diseases, including primary biliary cirrhosis); diseases of the pancreas (acute pancreatitis, chronic small duct pancreatitis, cystic fibrosis, infections, tumors and cysts of the pancreas); and other gastrointestinal diseases and disorders such as gastric hyperacidity, heartburn, constipation, diarrhea, gastric and duodenal ulcers, esophagitis and photodynamic therapy for the palliative and curative treatments of various forms of cancer.
12

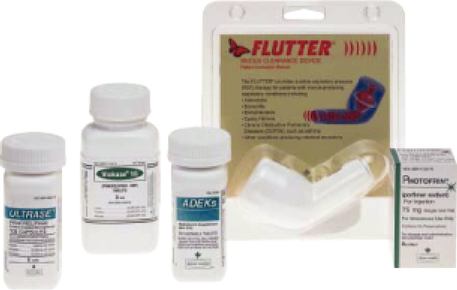
UNITED STATES
 | ||||||||
|---|---|---|---|---|---|---|---|---|
| ULTRASE | VIOKASE | ADEKs | FLUTTER | PHOTOFRIN | ||||
| Partial or complete exocrine pancreatic insufficiency | Partial or complete exocrine pancreatic insufficiency | Multivitamin supplement for malabsorption | Improvement of pulmonary ventilation and expectoration of mucus | Ablation of HGD associated with Barrett's Esophagus | ||||
| Palliative and curative treatment of esophageal and non small cell lung cancers | ||||||||
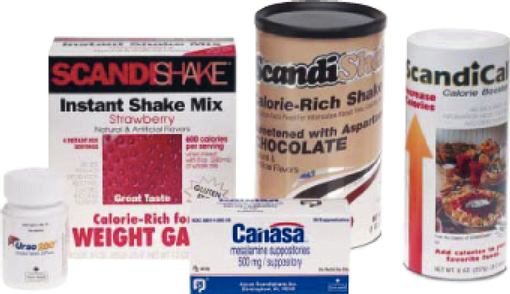 | ||||||
|---|---|---|---|---|---|---|
| URSO 250 | SCANDISHAKE | CANASA | SCANDICAL | |||
| Primary biliary cirrhosis | Caloric supplement for cystic fibrosis patients | Active ulcerative proctitis | Caloric supplement for cystic fibrosis patients | |||
CANADA
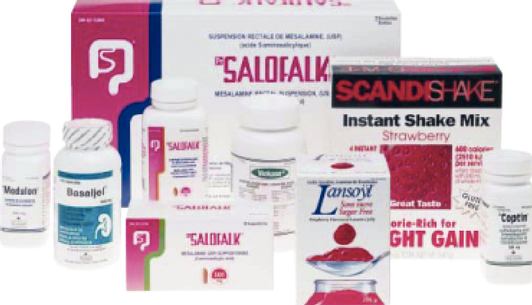 | ||||||
|---|---|---|---|---|---|---|
| MODULON | BASALJEL | SALOFALK | SCANDISHAKE | |||
| Relief of symptoms associated with irritable bowel syndrome | Treatment of hyperphosphatemia | Inflammatory bowel diseases | Caloric supplement for cystic fibrosis patients | |||
| | VIOKASE | LANSOYL | COPTIN | |||
|---|---|---|---|---|---|---|
| Partial or complete exocrine pancreatic insufficiency | Laxative | Antibiotic for the treatment of certain infections |
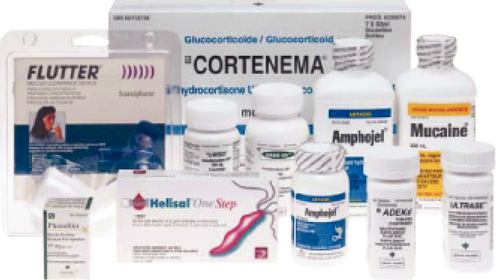 | ||||||||
|---|---|---|---|---|---|---|---|---|
| PHOTOFRIN | HELISAL One STEP | AMPHOJEL | ADEKs | ULTRASE | ||||
| Ablation of HGD related to Barrett's Esophagus | Detection ofHelicobacter pylori | Antacid | Multivitamin supplement for malabsorption | Partial or complete exocrine pancreatic insufficiency | ||||
| Palliative and curative treatment of esophageal and non small cell lung cancers | ||||||||
| | FLUTTER | URSO | URSO DS | CORTENEMA | ||||
|---|---|---|---|---|---|---|---|---|
| Improvement of pulmonary ventilation and expectoration of mucus | Cholestatic liver diseases | Cholestatic liver diseases | Treatment of non-specific inflammatory diseases | |||||
| | | | MUCAINE | | ||||
| Antacid |
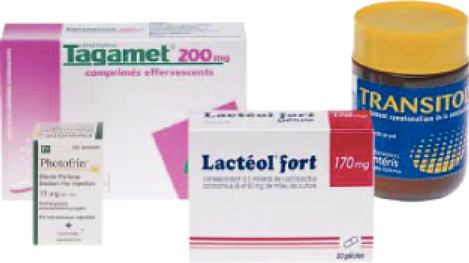
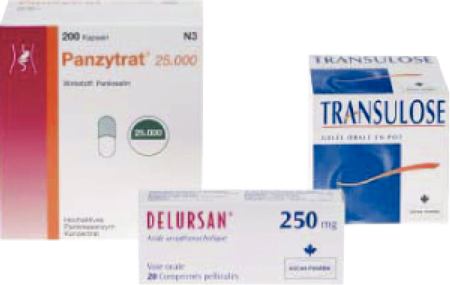
EUROPE
 | ||||||
|---|---|---|---|---|---|---|
| PHOTOFRIN | LACTÉOL FORT | TAGAMET | TRANSITOL | |||
| Palliative and curative treatment of esophageal and non small cell lung cancers | Diarrhea | Gastric and duodenal ulcers, esophagitis | Constipation | |||
 | ||||
|---|---|---|---|---|
| PANZYTRAT | DELURSAN | TRANSULOSE | ||
| Partial or complete exocrine pancreatic insufficiency | Cholestatic liver diseases | Constipation | ||
A GROWINGPRODUCT PIPELINE
Axcan's research and development team concentrates on two main areas:
- •
- Development of existing products, including testing the efficacy of such products in other indications; and
- •
- Further development of acquired products and technologies.
Management believes Axcan's strategy will enable the Company to minimize the risks associated with new drug development and reduce the amount of time typically required to develop and obtain new product approvals. Since Axcan approaches the development process from both scientific and business perspectives, management chooses to pursue product candidates that will deliver both therapeutic promise and unique market opportunities.
Product
ITAX
(itopride hydrochloride)
PHOTOBARR
(porfimer sodium)
PHOBAR 2
(porfimer sodium)
PHOTOFRIN
(porfimer sodium)
HELIZIDE
(bismuth, metronidazole, tetracycline)
HELIZIDE
(bismuth, metronidazole, tetracycline)
CANASA 1 g suppositories
(mesalamine)
CANASA 500 mg suppositories
(mesalamine)
CANASA rectal gel
(mesalamine)
SALOFALK 750 mg tablets
(mesalamine)
HEPENAX
(L-ornithine and L-aspartate)
URSO DS
(ursodiol)
Ursodiol disulfate
(ursodiol)
NCX-1000
(ursodiol)
NMK 150
(pancreatic enzyme)
NMK 250
(pancreatic enzyme)
14
| Indication | Market | Stage of Development | 2004 Milestone | Estimated Launch | ||||
|---|---|---|---|---|---|---|---|---|
| Non Ulcer Dyspepsia | United States Canada Europe | Phase III study planned | Initiation of Phase III study | 2006-2007 | ||||
| HGD associated with Barrett's Esophagus | Europe | Submitted for approval | Approval | 2004 | ||||
| HGD associated with Barrett's Esophagus (follow-up study) | United States Canada | Phase IV study | Phase IV study ongoing | |||||
| Cholangiocarcinoma | United States Canada Europe | Phase III study | Initiation of Phase III study | 2008 | ||||
| Eradication of Helicobacter pylori | United States | Submitted for approval | Approval | 2005 | ||||
| Eradication of Helicobacter pylori | Europe | Phase III study completed | Filing | 2006 | ||||
| Ulcerative proctitis | United States | Submitted for approval | Approval | 2004 | ||||
| Ulcerative proctitis (pediatric use) | United States | Phase IV | Phase IV study ongoing | 2006 | ||||
| Ulcerative colitis | United States Canada | Phase III study | Completion of Phase III study | 2005 | ||||
| Ulcerative colitis | Canada | Submitted for approval | Review | 2005 | ||||
| Hepatic encephalopathy | United States Canada Europe | Phase III study planned | Initiation of Phase III study | 2006 | ||||
| Primary Biliary Cirrhosis | United States | Submitted for approval | Approval | 2004 | ||||
| Prevention of the recurrence of colorectal polyps | United States Canada Europe | Proof of concept study | Toxicity and Phase I studies | 2008 | ||||
| Portal hypertension | United States Canada Europe | Phase I study | Initiation of Phase II study | 2008 | ||||
| Pancreatitis | United States Canada Europe | Phase II study planned | Phase II study | 2006-2007 | ||||
| Steatorrhea | United States Canada Europe | Phase II study planned | Phase II study | 2008 |
15
MANAGEMENT'S DISCUSSION AND
ANALYSIS OF FINANCIAL CONDITION AND RESULTS OF OPERATIONS
This discussion should be read in conjunction with the information contained in Axcan's consolidated financial statements and the related notes thereto. All amounts are in U.S. dollars.
OVERVIEW
Axcan is a leading specialty pharmaceutical company concentrating in the field of gastroenterology, with operations primarily in North America and Europe. Axcan markets and sells pharmaceutical products used in the treatment of a variety of gastrointestinal diseases and disorders. The Company seeks to expand its gastrointestinal franchise by in-licensing products and acquiring products or companies, as well as developing additional products and expanding indications for existing products.
Axcan's current products include ULTRASE, VIOKASE and PANZYTRAT for the treatment of certain gastrointestinal symptoms related to cystic fibrosis in the case of ULTRASE; URSO 250 for the treatment of certain cholestatic liver diseases; SALOFALK and CANASA for the treatment of certain inflammatory bowel diseases; and PHOTOFRIN for the treatment of certain types of gastrointestinal cancers and other conditions. In addition, Axcan currently has three products pending approval — one an additional indication in Europe for a currently marketed product, one a new formulation for a product currently marketed in the United States and the last one, an indication for a new product in the United States. Axcan also has a number of pharmaceutical projects in all phases of development.
Axcan reported revenue of $179.1 million and operating income of $39.4 million for the year ended September 30, 2003. During the fourth quarter of the year, Axcan acquired an exclusive license to develop, manufacture and market ITAX. Under the terms of this license agreement, Axcan paid $10.0 million and assumed $2.0 million in research contract liabilities. Because ITAX, a product in development, has not reached technological feasibility and has no known alternative uses, it is considered to be acquired in-process research and therefore, for accounting purposes, was expensed in the period of acquisition.
Much of Axcan's recent sales growth is derived from sales in the United States and from sales from its French subsidiary, following recent acquisitions in Europe. During the first quarter of this fiscal year, Axcan acquired the worldwide rights to the PANZYTRAT enzyme product line from Abbott Laboratories ("Abbott") and the rights to DELURSAN, an ursodiol 250 mg tablet, from Aventis Pharma S.A. ("Aventis") for the French market. Revenue from sales of Axcan's products in the United States was $113.9 million (63.6% of total revenue) for the year ended September 30, 2003, compared to $100.1 million (75.6% of total revenue) for fiscal year 2002 and $84.6 million for fiscal year 2001. Revenue from Canada was $20.6 million (11.5% of total revenue) for the year ended September 30, 2003, compared to $17.4 million (13.1% of total revenue) for fiscal year 2002 and $18.5 million for fiscal year 2001. Revenue from France, including domestic and foreign sales, amounted to $44.2 million, (24.7% of total revenue) for the year ended September 30, 2003, compared to $14.8 million (11.2% of total revenue) for fiscal year 2002.
Axcan's revenue has historically been, and continues to be, principally derived from sales of pharmaceutical products to large pharmaceutical wholesalers and large chain pharmacies. Axcan utilizes a "pull-through" marketing approach that is typical of pharmaceutical companies. Under this approach, Axcan's sales representatives demonstrate the features and benefits of its products to gastroenterologists who may write their patients prescriptions for Axcan's products. The patients, in turn, take the prescriptions to pharmacies to be filled. The pharmacies then place orders with the wholesalers or, in the case of large chain pharmacies, their distribution centres, to whom Axcan sells its products.
Axcan's expenses are comprised primarily of selling and administrative expenses (including marketing expenses), cost of goods sold (including royalty payments to those companies from whom Axcan licenses its products) and research and development expenses.
16
Axcan's annual and quarterly operating results are primarily affected by three factors: wholesaler buying patterns; the level of acceptance of Axcan's products by gastroenterologistsand their patients; and the extent of Axcan's control over the marketing of its products. Wholesaler buying patterns, including a tendency to increase inventory levels prior to an anticipated or announced price increase, affect Axcan's operating results by shifting revenue between quarters. To maintain good relations with wholesalers, Axcan typically gives prior notice of price increases. The level of patient and physician acceptance of Axcan's products, as well as the availability of similar therapies which may be less effective but also less expensive than some of Axcan's products, impact Axcan's revenues by driving the level and timing of prescriptions for its products.
SUBSEQUENTEVENT
On November 18, 2003, the Company announced the closing of an agreement, to acquire the rights to a group of products from Aventis. Under the terms of this agreement, the Company acquired CARAFATE and BENTYL for the U.S. market and SULCRATE, BENTYLOL and PROCTOSEDYL for the Canadian market. The $145 million purchase price was paid out of Axcan's cash on hand. Axcan believes this acquisition will be immediately accretive. During the last 12 months, Aventis' combined net sales of acquired products in these territories were approximately $42 million.
CRITICAL ACCOUNTINGPOLICIES
The Company decided, for the year beginning October 1, 2002, to switch from Canadian Generally Accepted Accounting Principles ("GAAP") to United States of America ("U.S.") GAAP as its primary reporting convention. The change in GAAP was influenced by the Company's desire to better meet the needs of its shareholders by applying accounting rules that are consistent with the majority of its customers and peer companies.
Axcan's consolidated financial statements are prepared in accordance with U.S. GAAP, applied on a consistent basis. Axcan's critical accounting policies include the use of estimates, revenue recognition, the recording of research and development expenses and the useful lives or fair value of goodwill and intangible assets. Some of our critical accounting policies require the use of judgment in their application or require estimates of inherently uncertain matters. Although our accounting policies are in compliance with U.S. GAAP, a change in the facts and circumstances of the underlying transaction could significantly change the application of the accounting policies and the resulting financial statement impact. Discussed below are those policies that we believe are critical and require the use of complex judgment in their application.
USE OF ESTIMATES
The preparation of financial statements in accordance with U.S. GAAP requires management to make estimates and assumptions that affect the recorded amounts of assets and liabilities, the disclosure of contingent assets and liabilities as of the date of the financial statements and the disclosure of recognized amounts of revenues and expenses during the year. Significant estimates and assumptions made by management include the allowance for accounts receivable and inventories, reserves for product returns, rebates and chargebacks, the classification of intangible assets between finite and indefinite life, useful lives of long-lived assets, expected cash flows used in evaluating long-lived assets for impairment, contingency provisions and other accrued charges. These estimates were made using the historical information available. Actual results could differ from these estimates.
17
REVENUE RECOGNITION
Revenue is recognized when the product is shipped to the Company's customer, provided the Company has not retained any significant risks of ownership or future obligations with respect to the product shipped. Revenue from product sales is recognized net of sales discounts, allowances, returns, rebates and chargebacks. In certain circumstances, returns or exchanges of products are allowed under the Company's policy and provisions are maintained accordingly. Amounts received from customers as prepayments for products to be shipped in the future are reported as deferred revenue.
GOODWILL AND INTANGIBLE ASSETS
Axcan's goodwill and intangible assets are stated at cost, less accumulated amortization. Prior to October 1, 2001, goodwill and intangible assets were amortized using the straight-line method based on their estimated useful lives which ranged from 7 to 25 years. Since October 1, 2001, the Company no longer amortizes goodwill and intangible assets with an indefinite life. Management evaluates the value of the unamortized portion of goodwill and intangible assets annually, by comparing the carrying value to the future benefits of the Company's activities or the expected sale of pharmaceutical products. Should there be a permanent impairment in value or if the unamortized balance exceeds recoverable amounts, a write-down is recognized for the current year. To date, Axcan has not recognized any permanent impairment in value. Intangible assets with finite life are still amortized over their estimated useful lives.
RESEARCH AND DEVELOPMENT EXPENSES
Research and development expenses are charged to operations in the year they are incurred. Acquired in-process research and development having no alternative future uses is written off at the time of acquisition. The cost of intangibles purchased from others for a particular research and development project, with no alternative use, is written off at the time of acquisition.
ACQUISITIONOF COMPANIES
On November 7, 2001, Axcan acquired all the outstanding shares of Laboratoires Entéris S.A.S. ("Entéris"), a company specializing in the distribution of gastrointestinal products in France. The acquisition cost, including transaction expenses, amounted to $23.0 million and was paid in cash.
On April 17, 2002, Axcan acquired all the outstanding shares and certain related assets of Laboratoire du Lactéol du Docteur Boucard S.A. ("Lactéol"). Lactéol specializes in the manufacturing and distribution of gastrointestinal products in France. The acquisition cost, including transaction expenses, amounted to $13.1 million and was paid through the issuance of 365,532 common shares of the Company and the payment of $8.4 million in cash.
The acquisition costs for both transactions have been allocated to assets and liabilities according to their estimated fair value at acquisition dates. The operating results relating to these acquisitions have been included in the consolidated financial statements from acquisition dates.
ACQUISITIONOF PRODUCTS
On August 29, 2003, the Company acquired an exclusive license for North America, the European Union and Latin America, from Abbott Laboratories ("Abbott") to develop, manufacture and market ITAX, a patented gastroprokinetic drug. Under the terms of this license agreement, the Company paid $10 million and assumed $2 million in research contract liabilities. Because ITAX, a product in development, has not reached technological feasibility and has no known alternative uses, it is considered to be acquired in-process research. Therefore, its acquisition was expensed in the fourth quarter of the year ended September 30, 2003, the period of acquisition.
On December 10, 2002, the Company acquired the rights to DELURSAN (ursodiol 250 mg tablets) for the French market, for a cash purchase price of $22.8 million from Aventis Pharma S.A.
18
On December 3, 2002, the Company acquired the worldwide rights to the PANZYTRAT enzyme product line from Abbott for a cash purchase price of $45 million. During the period of marketing authorizations transfer, which may extend to May 2004, Abbott acts as an agent for the management of the product line sales. During the interim period, Axcan includes in its revenue the net sales from PANZYTRAT less corresponding cost of goods sold and other Abbott related expenses. Consequently, although net sales of the PANZYTRAT enzyme product line for the year ended September 30, 2003, were $14,255,979, the Company included in its revenues an amount of $9,463,645 representing the net sales from the product line less cost of goods sold and other related expenses.
RESULTSOF OPERATION
The following table sets forth, for the years indicated, the percentage of revenue represented by items in Axcan's consolidated statements of operations:
| For the years ended September 30 | 2003 | 2002 | 2001 | ||||
|---|---|---|---|---|---|---|---|
| Revenue | 100% | 100% | 100% | ||||
| Cost of goods sold | 24.8 | 25.7 | 25.4 | ||||
| Selling and administrative expenses | 35.2 | 37.3 | 36.8 | ||||
| Research and development expenses | 6.8 | 6.7 | 7.0 | ||||
| Acquired in-process research | 6.7 | — | — | ||||
| Depreciation and amortization | 4.5 | 5.7 | 11.4 | ||||
| 78.0 | 75.4 | 80.6 | |||||
| Operating income | 22.0 | 24.6 | 19.4 | ||||
| Financial expenses | 2.4 | 0.7 | 2.7 | ||||
| Interest income | (0.9 | ) | (0.7 | ) | (0.9 | ) | |
| Loss on foreign currency | — | 0.2 | 0.6 | ||||
| Takeover-bid expenses | 2.1 | — | — | ||||
| 3.6 | 0.2 | 2.4 | |||||
| Income before income taxes | 18.4 | 24.4 | 17.0 | ||||
| Income taxes | 7.3 | 8.4 | 5.6 | ||||
| Net income | 11.1 | 16.0 | 11.4 | ||||
Quarterly results
(amounts in thousands of dollars,
except share related data)
| | | | Net Income (loss) per share | ||||||
|---|---|---|---|---|---|---|---|---|---|
| Quarter | Revenue $ | Net Income (loss) $ | Basic $ | Diluted $ | |||||
2003 | |||||||||
| First | 37,846 | 6,557 | 0.15 | 0.14 | |||||
| Second | 45,621 | 8,933 | 0.20 | 0.20 | |||||
| Third | 46,877 | 6,339 | 0.14 | 0.14 | |||||
| Fourth | 48,740 | (1,904 | ) | (0.04 | ) | (0.04 | ) | ||
2002 | |||||||||
| First | 28,522 | 3,597 | 0.09 | 0.09 | |||||
| Second | 30,489 | 4,751 | 0.12 | 0.12 | |||||
| Third | 35,493 | 5,848 | 0.13 | 0.13 | |||||
| Fourth | 37,900 | 6,992 | 0.16 | 0.15 | |||||
YEAR ENDED SEPTEMBER 30, 2003
COMPARED TO YEAR ENDED SEPTEMBER 30, 2002
REVENUE
Revenue increased $46.7 million (35.3%) to $179.1 million for the year ended September 30, 2003, from $132.4 million for the preceding fiscal year. This increase in revenue resulted primarily from sales generated by Axcan's French subsidiary, following the acquisitions of Entéris and Lactéol and the PANZYTRAT and DELURSAN product lines. Strong sales of URSO 250 in North America also contributed to the increase. Revenue from the French subsidiary, including domestic and foreign sales, amounted to $44.2 million for the year ended September 30, 2003, compared to $14.8 million for the year ended September 30, 2002.
Key sales figures for fiscal 2003 are as follows:
- •
- Worldwide sales of pancreatic enzymes (ULTRASE, VIOKASE and PANZYTRAT) amounted to $57.9 million, an increase of 47% over fiscal 2002 sales of pancreatic enzymes. PANZYTRAT, acquired in the first quarter of fiscal 2003, accounted for $10.2 million of sales;
19
- •
- Worldwide sales of ursodiol (URSO 250, URSO DS and DELURSAN) increased 79% to $53.9 million. DELURSAN, which was acquired in the second quarter of fiscal 2003, accounted for $6.9 million of sales;
- •
- Sales of mesalamine (CANASA and SALOFALK) amounted to $26.2 million, a 24% decrease from the prior year. This decrease was mainly due to the resolution of short product supply, that occurred in fiscal 2002, for a product competing with CANASA in an associated indication.
- •
- Sales of PHOTOFRIN and other products in North America amounted to $14.1 million, an increase of 3%. The Company expects growth in PHOTOFRIN sales in fiscal 2004 with the launch of PHOTOFRIN for the treatment of High-Grade Dysplasia associated with Barrett's Esophagus.
- •
- Sales of other products in Europe, mainly LACTÉOL and TAGAMET, amounted to $27.6 million, a 76% increase over such sales in the prior year.
COST OF GOODS SOLD
Cost of goods sold consists principally of costs of raw materials, royalties and manufacturing costs. Axcan outsources most of its manufacturing requirements. Cost of goods sold increased $10.5 million (28.3%) to $44.5 million for the year ended September 30, 2003, from $34.0 million for the preceding fiscal year. As a percentage of revenue, cost of goods sold for the year ended September 30, 2003, decreased as compared to the preceding fiscal year, from 25.7% to 24.8% of revenue. This decrease in cost of goods sold, expressed as a percentage of revenue, is due in part to the accounting treatment of the PANZYTRAT revenue during the transition period. Since the acquisition of the PANZYTRAT rights in December 2002, Abbott is acting as an agent for sales of this product line, until marketing authorization transfers are completed. During the transition period, Axcan includes in its revenue the net sales from PANZYTRAT less corresponding cost of goods sold and other Abbott related expenses. Thus, Axcan's cost of goods sold does not include costs related to these PANZYTRAT sales.
SELLING AND ADMINISTRATIVE EXPENSES
Selling and administrative expenses consist principally of salaries and other costs associated with Axcan's sales force and marketing activities. Selling and administrative expenses increased $13.7 million (27.7%) to $63.1 million for the year ended September 30, 2003, from $49.4 million for the preceding fiscal year. This increase is mainly due to the inclusion of $15.0 million of selling and administrative expenses from Entéris and Lactéol for the year ended September 30, 2003, compared to $7.8 million for the preceding year which represented five months of operations for Lactéol and eleven months of operations for Entéris.
RESEARCH AND DEVELOPMENT EXPENSES
Research and development expenses consist principally of fees paid to outside parties that Axcan uses to conduct clinical studies and to submit governmental approval applications on its behalf, and of salaries and benefits paid to its personnel involved in research and development projects. Excluding acquired in-process research and development, research and development expenses increased $3.2 million (36.0%) to $12.1 million for the year ended September 30, 2003, from $8.9 million for the preceding fiscal year. The increase is primarily due to the fact that Axcan is currently conducting two additional clinical studies on its new CANASA rectal gel formulation in order to meet regulatory requirements. Also, additional costs were incurred to address manufacturing issues at one of the five manufacturing sites involved in the production of HELIZIDE.
20
ACQUIRED IN-PROCESS RESEARCH
The acquired in-process research of $12.0 million results from the acquisition from Abbott of an exclusive license for North America, the European Union and Latin America, to develop, manufacture and market ITAX, a patented gastroprokinetic drug. Under the terms of this license agreement, Axcan paid $10.0 million and assumed $2.0 million in research contract liabilities. Because ITAX, a product in development, has not reached technological feasibility and has no known alternative uses, it is considered to be acquired in-process research. Therefore, its acquisition was expensed in the fourth quarter of the year ended September 30, 2003, the period of acquisition.
DEPRECIATION AND AMORTIZATION
Depreciation and amortization consists principally of intangible assets with finite life. Intangible assets include trademarks, trademark licenses and manufacturing rights. Depreciation and amortization increased $0.5 million (6.6%) to $8.1 million for the year ended September 30, 2003, from $7.6 million for the preceding fiscal year. The increase resulted mainly from depreciation and amortization of capital assets acquired in the November 2001 acquisition of Entéris and the April 2002 acquisition of Lactéol.
FINANCIAL EXPENSES
Financial expenses consist principally of interest and fees paid in connection with money borrowed for acquisitions. Financial expenses increased $3.4 million to $4.3 million for the year ended September 30, 2003, from $0.9 million for the preceding fiscal year. This increase is mainly due to interest expense on the $125.0 million aggregate principal amount of 41/4% convertible subordinated notes due 2008 which were issued on March 5, 2003.
TAKEOVER-BID EXPENSES
On April 10, 2003, Axcan made an unsolicited cash tender offer of $8.75 per share for all of the outstanding shares of common stock of Salix Pharmaceuticals Inc. ("Salix"), which was subsequently increased to $10.50 per share. On June 27, 2003, the offer for all outstanding shares of Salix expired without acceptance or extension. Total costs related to the offer were $3.7 million and were expensed during the quarter ended June 30, 2003, thus reducing net income by approximately $2.4 million, or $0.05 per share for the year ended September 30, 2003.
INCOME TAXES
Income taxes amounted to $13.0 million for the year ended September 30, 2003, compared to $11.1 million for the preceding fiscal year. The effective tax rates were 39.5% for the year ended September 30, 2003, and 34.4% for the year ended September 30, 2002. The increase in our effective tax rate was due to acquired in-process research which is deductible at a lower rate than most operating expenses. As shown later under net income, excluding acquired in-process research and takeover-bid expenses, the effective tax rate was 31.4% for the year ended September 30, 2003.
NET INCOME
Net income (in thousands of dollars), basic income per share and diluted income per share according to U.S. GAAP for the years ended September 30, 2003, and 2002, were as follows:
| | For the year ended September 30 | ||||
|---|---|---|---|---|---|
| | 2003 $ | 2002 $ | |||
| Net income in accordance with U.S. GAAP | 19,925 | 21,188 | |||
| Income per common share | |||||
| Basic | 0.44 | 0.51 | |||
| Diluted | 0.44 | 0.50 | |||
21
Net income (in thousands of dollars), basic income per share and diluted income per share excluding takeover bid expenses, acquired in-process research and related income taxes for the year ended September 30, 2003, were as follows:
| | | | | | Income per share | |||||||
|---|---|---|---|---|---|---|---|---|---|---|---|---|
| | | Income taxes | | |||||||||
| | Income before income taxes $ | | ||||||||||
| For the year ended September 30, 2003 | Net income $ | Basic $ | Diluted $ | |||||||||
| $ | % | |||||||||||
| According to U.S. GAAP | 32,917 | 12,992 | 39.5 | 19,925 | 0.44 | |||||||
| Acquired in-process research | 12,000 | 982 | 8.2 | 11,018 | 0.25 | |||||||
| Takeover-bid expenses | 3,697 | 1,290 | 34.9 | 2,407 | 0.05 | |||||||
| Excluding acquired in-process research and takeover-bid expenses | 48,614 | 15,264 | 31.4 | 33,350 | 0.74 | 0.73 | ||||||
This measure of net income, basic income per share and diluted income per share excluding certain items is a non-GAAP measure that does not have a standardized meaning and, as such, is not necessarily comparable to similarly titled measures presented by other companies. This measure is provided to assist investors in assessing Axcan's operating performance. We believe the presentation of this non-GAAP measure provides useful information because it eliminates certain unusual expenses and because it provides similar information for period-to-period comparisons of operations. Investors should consider this non-GAAP measure in the context of Axcan's U.S. GAAP results of operations.
For the year ended September 30, 2003, net income was $19.9 million or $0.44 of both basic and diluted income per share, compared to $21.2 million or $0.51 of basic income per share and $0.50 of diluted income per share for the preceding year. Excluding takeover-bid expenses, acquired in-process research and related income taxes, net income for the year ended September 30, 2003 was $33.4 million or $0.74 of basic income per share and $0.73 of diluted income per share, compared to $21.2 million of net income or $0.51 of basic income per share and $0.50 of diluted income per share for the year ended September 30, 2002.
The basic weighted average number of common shares outstanding used to establish the per share amounts increased from 41.7 million for the year ended September 30, 2002, to 44.9 million for the year ended September 30, 2003, as a result of the exercise of options previously granted pursuant to Axcan's stock option plan in fiscal 2003 and the completion of equity public offerings, the subscription of investors through private placements, the exercise of options and the issuance of shares for the acquisition of assets in fiscal 2002.
The adjusted weighted average number of common shares outstanding, used to establish the diluted per share amounts, increased from 42.5 million for the year ended September 30, 2002, to 45.6 million for the year ended September 30, 2003.
22
YEAR ENDED SEPTEMBER 30, 2002,
COMPARED TO YEAR ENDED SEPTEMBER 30, 2001
REVENUE
Revenue increased $28.6 million (27.6%) to $132.4 million for the year ended September 30, 2002, from $103.8 million for the preceding fiscal year. This increase in revenue came almost equally from increased sales in the United States and France. Fiscal 2002 revenue from Europe in the amount of $15.7 million included sales from Entéris for 11 months, and sales from Lactéol for 5 months. In the United States, CANASA rectal suppositories, marketed since April 2001, also contributed to the increase.
Key sales figures for fiscal 2002 are as follows:
- •
- Sales of ULTRASE/VIOKASE amounted to $39.5 million, an increase of 4%;
- •
- Sales of URSO 250 amounted to $30.2 million, an increase of 15%;
- •
- Sales of CANASA/SALOFALK amounted to $34.2 million, an increase of 53%;
- •
- Sales of PHOTOFRIN and other products in North America amounted to $13.6 million;
- •
- Sales of all products in Europe amounted to $15.7 million.
COST OF GOODS SOLD
Cost of goods sold increased $7.6 million (28.8%) to $34.0 million for the year ended September 30, 2002, from $26.4 million for the preceding fiscal year. As a percentage of revenue, cost of goods sold for the year ended September 30, 2002, increased marginally as compared to the preceding fiscal year, at 25.7% and 25.4%, respectively. This increase was due primarily to increased sales in Europe where margins are lower than in the United States.
SELLING AND ADMINISTRATIVE EXPENSES
Selling and administrative expenses increased $11.2 million (29.3%) to $49.4 million for the year ended September 30, 2002, from $38.2 million for the preceding fiscal year. This increase is mainly due to the inclusion of $7.8 million of selling and administrative expenses from Entéris and Lactéol. Additions to the sales force in the United States, and increased marketing efforts for URSO 250 and CANASA suppositories in the United States, also contributed to the increase.
RESEARCH AND DEVELOPMENT EXPENSES
Research and development expenses increased $1.7 million (23.6%) to $8.9 million for the year ended September 30, 2002, from $7.2 million for the preceding fiscal year. During the fiscal year ended September 30, 2002, the Company completed the filing of new drug submissions for the use of PHOTOFRIN for the treatment of High-Grade Dysplasia associated with Barrett's Esophagus.
FINANCIAL EXPENSES
Financial expenses decreased $2.0 million (69.0%) to $0.9 million for the year ended September 30, 2002, from $2.9 million for the preceding fiscal year. Financial expenses for the year ended September 30, 2001, were primarily attributable to interest paid on a loan of approximately $52.0 million used to acquire the 50% interest of Schwarz in the Axcan URSO joint venture. This loan was repaid in fiscal 2001.
DEPRECIATION AND AMORTIZATION
Depreciation and amortization decreased $4.3 million (36.7%) to $7.5 million for the year ended September 30, 2002, from $11.8 million for the preceding fiscal year.
23
This decrease resulted from a reduction of $6.4 million due to a change in accounting policies described above regarding goodwill and other intangible assets, offset in part by an increase of $2.0 million due to amortization of newly-acquired capital assets. Depreciation and amortization of assets acquired include $0.8 million for lasers used with PHOTOFRIN in the United States and $0.6 million for capital assets in France, for Entéris since November 2001 and Lactéol since April 2002.
INCOME TAXES
Income taxes amounted to $11.1 million for the year ended September 30, 2002, compared to $5.8 million for the year ended September 30, 2001. The effective tax rates were 34.4% in 2002 and 32.9% in 2001.
NET INCOME
Net income was $21.2 million or $0.51 of basic income per share and $0.50 of diluted income per share, for the year ended September 30, 2002, compared to $11.8 million or $0.32 per share on both a basic and diluted basis, for the preceding year. The basic weighted average number of common shares outstanding used to establish the per share amounts increased from 35.8 million for the year ended September 30, 2001, to 41.7 million for the year ended September 30, 2002, following the completion of public equity offerings, the subscription of investors through private placements, the exercise of options previously granted pursuant to Axcan's stock option plan, the issuance of shares for the acquisition of assets and for the redemption of preferred shares previously issued in connection with the acquisition of PHOTOFRIN, both in fiscal years 2001 and 2002.
CANADIAN GAAP
The differences (in thousands of dollars) between U.S. and Canadian GAAP which affect net income for the years ended September 30, 2003, and 2002, are summarized in the following table:
| | For the year ended September 30 | ||||
|---|---|---|---|---|---|
| | 2003 $ | 2002 $ | |||
| Net income in accordance with U.S. GAAP | 19,925 | 21,188 | |||
| Prepaid advertising costs | — | (457 | ) | ||
| Implicit interest on convertible debt | (2,292 | ) | — | ||
| Acquired in-process research | 12,000 | — | |||
| Amortization of new product acquisition costs | (54 | ) | (54 | ) | |
| Income tax impact of the above adjustments | (962 | ) | 191 | ||
| Net earnings in accordance with Canadian GAAP | 28,617 | 20,868 | |||
On March 5, 2003, the Company closed an offering of $125,000,000 aggregate principal amount of 41/4% convertible subordinated notes due April 15, 2008. As a result of the terms of the notes, under Canadian GAAP, an amount of $24,238,899 was included in shareholders' equity as the equity component of the convertible debt and an amount of $100,761,101 was included in long-term debt, as the liability component of the convertible notes. As at September 30, 2003, implicit interest in the amount of $2,292,478 was accrued for and added to the liability component.
Until September 30, 2001, prepaid advertising costs were deferred and amortized over a two-year period under Canadian GAAP. In 2002, the Company elected to charge its scientific symposium costs to earnings in the fiscal year when they were incurred. Under U.S. GAAP, these costs are deducted from earnings.
Under Canadian GAAP, research and development expenses are stated net of related tax credits which generally constitute between 10% and 15% of the aggregate amount of such expenses. Under U.S. GAAP, these tax credits are applied against income taxes.
24
Under U.S. GAAP, acquired in-process research is included in operations as at the date of acquisition if no alternative use is established. Under Canadian GAAP, the acquired in-process research, including the new product acquisition costs, is deferred and amortized from the date of commencement of commercial production.
LIQUIDITY AND CAPITAL RESOURCES
Axcan's cash, cash equivalents and short-term investments increased $90.2 million to $170.9 million at September 30, 2003, from $80.7 million at September 30, 2002. As of September 30, 2003, working capital was $174.8 million, compared to $103.5 million at September 30, 2002. These increases are mainly due to the issuance of convertible subordinated notes which provided net proceeds of $120.5 million and were partially offset by the acquisition of the rights to the PANZYTRAT product line and DELURSAN for a total cash purchase price of $67.8 million plus transaction expenses. On October 8, 2003, Axcan signed an agreement to acquire the rights to a group of products from Aventis Holding Inc. The purchase price of $145 million was, in November 2003, paid out of Axcan's cash, cash equivalents and short-term investments.
Total assets increased $178.3 million (48.6%) to $545.3 million as of September 30, 2003, from $367.0 million as of September 30, 2002. Shareholders' equity increased $36.2 million (12.3%) to $331.0 million as of September 30, 2003, from $294.8 million as of September 30, 2002.
Historically, Axcan financed research and development, oper-ations, acquisitions, milestone payments and investments out of the proceeds of public and private sales of its equity, cash flow from operations, and loans from joint venture partners and financial institutions. Since going public in Canada in December 1995, Axcan has raised approximately $243.0 millionfrom sales of its equity and has borrowed from financial institutions to finance the acquisition of Axcan Scandipharm Inc. and from Schwarz Pharma, Inc., a former joint venture partner, to finance the acquisition of Axcan URSO (these amounts have since been repaid).
Axcan has credit facilities totaling $55.0 million with two Canadian chartered banks. The facilities consist of a $15.0 million revolving operating facility renewable annually and a $40.0 million 364-day, extendible revolving facility with a three-year term-out option maturing October 12, 2007.
The credit facilities are secured by a first priority security interest on all present and future acquired assets of the Company and its material subsidiaries, and provide for the maintenance of certain financial ratios. Cash dividends, repurchase of shares (other than redeemable shares issued in connection with a permitted acquisition) and similar distributions to shareholders are limited to 10% of the Company's net income for the preceding fiscal year. As of September 30, 2003, Axcan was in compliance with all credit facilities' covenants.
The interest rate varies, depending on the Company's leverage, between 25 basis points and 125 basis points over Canadian prime rate or U.S. base rate, and between 125 basis points and 225 basis points over the LIBOR rate or bankers' acceptances. The credit facilities may be drawn in U.S. dollar or Canadian dollar equivalents. As at September 30, 2003, there was no amount outstanding under these credit facilities.
CASH FLOWS AND FINANCIAL RESOURCES
Cash flows from operating activities increased $16.2 million (45.9%) to $51.5 million for the year ended September 30, 2003, from $35.3 million for the year ended September 30, 2002. Cash flows from financing activities for the year ended September 30, 2003, were $117.9 million mainly due to the issuance of the convertible subordinated notes, which provided net proceeds of $120.5 million. Cash flows used for
25
investment activities for the year ended September 30, 2003, were $152.1 million mainly due to the net cash used for the acquisition of short-term investments and the acquisition of intangible assets with the proceeds from the disposal of short-term investments.
Axcan's research and development spending totaled $12.1 million for fiscal 2003 and $8.9 million for fiscal 2002. Axcan believes that its cash and operating cash flows will be adequate to support its existing ongoing operational requirements for at least 12 months. However, Axcan regularly reviews product and other acquisition opportunities and may therefore require additional debt or equity financing. Axcan cannot be certain that such additional financing, if required, will be available on acceptable terms, or at all.
Axcan believes that cash, cash equivalents and short-term investments, together with funds provided by operations, will be sufficient to meet operating cash requirements, including development of products through research and development activities, capital expenditures and repayment of its debt. Assuming regulatory approvals of future products and indications stemming from its research and development efforts, Axcan believes that these will also significantly contribute to the increase in funds provided by operations.
EARNINGS COVERAGE
The earnings coverage ratios are as follows:
Under U.S. GAAP, for the year ended September 30, 2003, interest requirements amounted to $5.9 million on a pro-forma basis and earnings coverage ratio, defined as the ratio of earnings before interest and income taxes to pro-forma interest requirements, was 6.1 to one.
Under Canadian GAAP, for the year ended September 30, 2003, interest requirements amounted to $10.2 million on a pro-forma basis and earnings coverage ratio was 4.8 to one.
The principal difference between the earnings coverage ratios under Canadian GAAP and U.S. GAAP is attributable to the inclusion of implicit interest of $4.2 million as required by Canadian GAAP.
RISK FACTORS
Axcan is exposed to financial market risks, including changes in foreign currency exchange rates and interest rates. Axcan does not use derivative financial instruments for speculative or trading purposes. Axcan does not use off-balance sheet financing or similar special purpose entities. Inflation has not had a significant impact on Axcan's results of operations.
FOREIGN CURRENCY RISK
Axcan operates internationally; however, a substantial portion of the revenue and expense activities and capital expenditures are transacted in U.S. dollars. Axcan's exposure to exchange rate fluctuation is reduced because, in general, Axcan's revenues denominated in currencies other than the U.S. dollar are matched by a corresponding amount of costs denominated in the same currency. Axcan expects this matching to continue.
INTEREST RATE RISK
The primary objective of Axcan's investment policy is the protection of principal. Accordingly, investments are made in high-grade government and corporate securities with varying maturities, but typically, less than 180 days. Therefore, Axcan does not have a material exposure to interest rate risk and a 100 basis-point adverse change in interest rates would not have a material effect on Axcan's consolidated results of operations, financial position or cash flows. Axcan is exposed to interest rate risk on borrowings under the credit facilities. The credit facilities bear interest based on LIBOR, U.S. dollar base rate, Canadian dollar prime rate, or Canadian dollar bankers' acceptances. Based on projected advances under the credit facilities, a 100 basis-point adverse change in interest rates would not have a material effect on Axcan's consolidated results of operations, financial position, or cash flows.
26
SUPPLY AND MANUFACTURE
Axcan depends on third parties for the supply of active ingredients and for the manufacture of the majority of its products. Although Axcan looks to secure alternate suppliers, Axcan may not be able to obtain the active ingredients or products from such third parties, the active ingredients or products may not comply with specifications, or the prices at which Axcan purchases them may increase and Axcan may not be able to locate alternative sources of supply in a reasonable time period, or at all. If any of these events occur, Axcan may not be able to continue to market certain of its products, and its sales and profitability would be adversely affected.
VOLATILITY OF SHARE PRICES
The market price of Axcan's shares is subject to volatility. Deviations in actual financial or scientific results, as compared to expectations of securities analysts who follow our activities can have a significant effect on the trading price of Axcan's shares. Changes in accounting standards could have an impact on the financial statements' presentation.
FORWARD-LOOKING STATEMENTS
This document contains forward-looking statements, which reflect the Company's current expectations regarding future events. These forward-looking statements include targets for income per share and the expected sales growth of the Company's products. The forward-looking statements involve risks and uncertainties. Actual events could differ materially from those projected herein and depend on a number of factors, including successful and timely completion of clinical studies, uncertainties related to the regulatory process, commercialization of the drug or therapy thereafter, difficulty of predicting acceptance and demand for pharmaceutical products, impact of competitive products and pricing, new product development and launch, availability of raw materials, and fluctuations in operating results. Investors should consult the Company's ongoing quarterly filings, annual reports and 40-F filings for additional information on risks and uncertainties relating to these forward-looking statements. The reader is cautioned not to rely on these forward-looking statements. The Company disclaims any obligation to update these forward-looking statements.
On behalf of Management,
| signed |
Jean Vézina
Vice President, Finance
and Chief Financial Officer
27
CONSOLIDATEDFINANCIAL STATEMENTS
U.S. GAAP
| MANAGEMENT'S REPORT | 30 | ||
| AUDITORS' REPORT | 31 | ||
| FINANCIAL STATEMENTS | |||
| CONSOLIDATED BALANCE SHEETS | 32 | ||
| CONSOLIDATED OPERATIONS | 33 | ||
| CONSOLIDATED SHAREHOLDERS' EQUITY | 34 | ||
| CONSOLIDATED CASH FLOWS | 35 | ||
| NOTES TO CONSOLIDATED FINANCIAL STATEMENTS | 36 | ||
The consolidated financial statements of Axcan Pharma Inc. and the other financial information included in this annual report are the responsibility of the Company's management.
These consolidated financial statements and the other financial information have been prepared by management in accordance with accounting principles generally accepted in the United States of America. This responsibility includes the selection of appropriate accounting principles and methods in the circumstances and the use of careful judgement in establishing reasonable accounting estimates.
Management maintains internal control systems designed, among other things, to provide reasonable assurance that the Company's assets are adequately safeguarded and that the accounting records are a reasonable basis to prepare relevant and reliable financial information.
The Audit Committee is composed solely of external directors. This Committee meets with the external auditors and management to discuss matters relating to the audit, internal control and financial information. The Committee also reviews the consolidated quarterly and annual financial statements.
These consolidated financial statements have been audited by Raymond Chabot Grant Thornton, Chartered Accountants, whose report indicating the scope of their audit and their opinion on the consolidated financial statements is presented on the right.
The Board of Directors has approved the Company's financial statements on the recommendation of the Audit Committee.
The Company decided, for the year beginning October 1, 2002, to switch from Canadian generally accepted accounting principles to generally accepted accounting principles in the United States of America as its primary reporting convention. Consolidated financial statements in accordance with Canadian generally accepted accounting principles have also been prepared.
| signed | signed | signed | ||
| Léon F. Gosselin | David W. Mims | Jean Vézina | ||
| President and Chief Executive Officer | Executive Vice President and Chief Operating Officer | Vice President, Finance and Chief Financial Officer | ||
| Mont-Saint-Hilaire, Quebec, Canada November 11, 2003 |
30 U.S. GAAP
To the Shareholders of Axcan Pharma Inc.
We have audited the consolidated balance sheets of Axcan Pharma Inc. as at September 30, 2003, and 2002, and the consolidated statements of operations, shareholders' equity and cash flows for each of the years in the three-year period ended September 30, 2003. These financial statements are the responsibility of the Company's management. Our responsibility is to express an opinion on these financial statements based on our audits.
We conducted our audits in accordance with generally accepted auditing standards in Canada and with auditing standards generally accepted in the United States of America. Those standards require that we plan and perform an audit to obtain reasonable assurance whether the financial statements are free of material misstatement. An audit includes examining, on a test basis, evidence supporting the amounts and disclosures in the financial statements. An audit also includes assessing the accounting principles used and significant estimates made by management, as well as evaluating the overall financial statement presentation. We believe that our audits provide a reasonable basis for our opinion.
In our opinion, these consolidated financial statements present fairly, in all material respects, the financial position of the Company as at September 30, 2003 and 2002 and the results of its operations and cash flows for each of the years in the three-year period ended September 30, 2003, in accordance with accounting principles generally accepted in the United Sates of America.
On November 11, 2003, we reported separately to the shareholders of Axcan Pharma Inc., on the consolidated financial statements for the same periods, prepared in accordance with generally accepted accounting principles in Canada.
As disclosed in Note 2b) to the consolidated financial statements, the Company changed its method of accounting for goodwill and intangible assets as at October 1, 2001.
signed
General Partnership
Chartered Accountants
Montreal, Quebec, Canada
November 11, 2003
U.S. GAAP 31
| | September 30 | |||||
|---|---|---|---|---|---|---|
| | 2003 | 2002 | ||||
| | $ | $ | ||||
| | (in thousands of U.S. dollars) | |||||
| Assets | ||||||
| Current assets | ||||||
| Cash and cash equivalents | 37,773 | 19,977 | ||||
| Short-term investments available for sale (Note 5) | 133,112 | 60,740 | ||||
| Accounts receivable (Note 6) | 19,685 | 24,369 | ||||
| Income taxes receivable | 5,294 | 805 | ||||
| Inventories (Note 7) | 20,163 | 19,741 | ||||
| Prepaid expenses and deposits | 2,794 | 1,891 | ||||
| Deferred income taxes (Note 8) | 6,214 | 6,335 | ||||
| Total current assets | 225,035 | 133,858 | ||||
| Investments (Note 9) | 1,002 | 2,681 | ||||
| Property, plant and equipment, net (Note 10) | 20,331 | 20,086 | ||||
| Intangible assets, net (Note 11) | 265,423 | 180,085 | ||||
| Goodwill, net (Note 12) | 27,550 | 27,550 | ||||
| Deferred debt issue expenses, at amortized cost | 4,233 | 290 | ||||
| Deferred income taxes (Note 8) | 1,775 | 2,456 | ||||
| Total assets | 545,349 | 367,006 | ||||
Liabilities | ||||||
| Current liabilities | ||||||
| Accounts payable and accrued liabilities (Note 14) | 43,418 | 27,198 | ||||
| Income taxes payable | 4,821 | 1,605 | ||||
| Instalments on long-term debt | 1,528 | 1,336 | ||||
| Deferred income taxes (Note 8) | 494 | 269 | ||||
| Total current liabilities | 50,261 | 30,408 | ||||
| Long-term debt (Note 15) | 129,474 | 7,267 | ||||
| Deferred income taxes (Note 8) | 34,603 | 34,212 | ||||
| Non-controlling interest | — | 332 | ||||
| Total liabilities | 214,338 | 72,219 | ||||
| Commitments and contingencies (Note 22) | ||||||
Shareholders' Equity | ||||||
| Capital stock (Note 16) | ||||||
| Series A preferred shares, without par value; shares authorized: 14,175,000; no shares issued | — | — | ||||
| Series B preferred shares, without par value; shares authorized: 12,000,000; no shares issued | — | — | ||||
| Common shares, without par value; unlimited shares authorized; issued and outstanding: 45,004,320 and 44,863,198 as at September 30, 2003 and 2002, respectively | 255,743 | 254,640 | ||||
| Retained earnings | 63,634 | 43,709 | ||||
| Accumulated other comprehensive income (loss) | 11,634 | (3,562 | ) | |||
| Total shareholders' equity | 331,011 | 294,787 | ||||
| Total liabilities and shareholders' equity | 545,349 | 367,006 | ||||
The accompanying notes are an integral part of the consolidated financial statements.
On behalf of the Board,
| signed | signed | |
| Léon F. Gosselin | Dr. Claude Sauriol | |
| Director | Director |
32 U.S. GAAP
| | Years Ended September 30 | |||||||
|---|---|---|---|---|---|---|---|---|
| | 2003 | 2002 | 2001 | |||||
| | $ | $ | $ | |||||
| | (in thousands of U.S. dollars, except share related data) | |||||||
| Revenue | 179,084 | 132,404 | 103,814 | |||||
| Cost of goods sold | 44,459 | 34,039 | 26,381 | |||||
| Selling and administrative expenses | 63,084 | 49,392 | 38,185 | |||||
| Research and development expenses | 12,098 | 8,855 | 7,243 | |||||
| Acquired in-process research | 12,000 | — | — | |||||
| Depreciation and amortization | 8,063 | 7,546 | 11,829 | |||||
| 139,704 | 99,832 | 83,638 | ||||||
| Operating income | 39,380 | 32,572 | 20,176 | |||||
| Financial expenses | 4,283 | 898 | 2,870 | |||||
| Interest income | (1,639 | ) | (912 | ) | (981 | ) | ||
| Loss on foreign currency | 122 | 266 | 653 | |||||
| Takeover-bid expenses | 3,697 | — | — | |||||
| 6,463 | 252 | 2,542 | ||||||
| Income before income taxes | 32,917 | 32,320 | 17,634 | |||||
| Income taxes (Note 8) | 12,992 | 11,132 | 5,809 | |||||
| Net income | 19,925 | 21,188 | 11,825 | |||||
| Income per common share | ||||||||
| Basic | 0.44 | 0.51 | 0.32 | |||||
| Diluted | 0.44 | 0.50 | 0.32 | |||||
| Weighted average number of common shares | ||||||||
| Basic | 44,914,944 | 41,664,510 | 35,832,198 | |||||
| Diluted | 45,607,992 | 42,527,500 | 36,531,052 | |||||
The accompanying notes are an integral part of the consolidated financial statements.
U.S. GAAP 33
CONSOLIDATEDSHAREHOLDERS' EQUITY
| | Years Ended September 30 | ||||||
|---|---|---|---|---|---|---|---|
| | 2003 | 2002 | 2001 | ||||
| | (in thousands of U.S. dollars) | ||||||
| Common shares (number) | |||||||
| Balance, beginning of year | 44,863,198 | 38,412,133 | 34,506,254 | ||||
| Shares issued following public offerings for cash | — | 5,000,000 | 3,000,000 | ||||
| Shares issued following private investors' subscription for cash | — | 208,044 | — | ||||
| Shares issued following the exercise of the underwriters' option for cash | — | 750,000 | — | ||||
| Shares issued pursuant to the stock option plan for cash | 141,122 | 127,489 | 69,597 | ||||
| Shares issued for the acquisition of assets | — | 365,532 | — | ||||
| Shares issued for the redemption of preferred shares and cumulative dividends | — | — | 836,282 | ||||
| Balance, end of year | 45,004,320 | 44,863,198 | 38,412,133 | ||||
Series A preferred shares (number) | |||||||
| Balance, beginning of year | — | — | 13,500,000 | ||||
| Shares redeemed by the issuance of common shares | — | — | (13,500,000 | ) | |||
| Balance, end of year | — | — | — | ||||
$ | $ | $ | |||||
| Common shares | |||||||
| Balance, beginning of year | 254,640 | 183,193 | 141,782 | ||||
| Shares issued following public offerings for cash | — | 54,312 | 31,515 | ||||
| Shares issued following private investors' subscription for cash | — | 3,000 | — | ||||
| Shares issued following the exercise of the underwriters' option for cash | — | 8,625 | — | ||||
| Shares issued pursuant to the stock option plan for cash | 1,103 | 751 | 335 | ||||
| Shares issued for the acquisition of assets | — | 4,759 | — | ||||
| Shares issued for the redemption of preferred shares and cumulative dividends | — | — | 9,561 | ||||
| Balance, end of year | 255,743 | 254,640 | 183,193 | ||||
Series A preferred shares | |||||||
| Balance, beginning of year | — | — | 9,118 | ||||
| Shares redeemed by the issuance of common shares | — | — | (9,118 | ) | |||
| Balance, end of year | — | — | — | ||||
Retained earnings | |||||||
| Balance, beginning of year | 43,709 | 22,521 | 10,997 | ||||
| Net income | 19,925 | 21,188 | 11,825 | ||||
| Cumulative dividends on preferred shares | — | — | (301 | ) | |||
| Balance, end of year | 63,634 | 43,709 | 22,521 | ||||
Accumulated other comprehensive income (loss) | |||||||
| Balance, beginning of year | (3,562 | ) | (5,283 | ) | (5,230 | ) | |
| Other comprehensive income (loss) | 15,196 | 1,721 | (53 | ) | |||
| Balance, end of year | 11,634 | (3,562 | ) | (5,283 | ) | ||
| Total shareholders' equity | 331,011 | 294,787 | 200,431 | ||||
Comprehensive income | |||||||
| Foreign currency translation adjustments | 15,196 | 1,721 | (53 | ) | |||
| Net income | 19,925 | 21,188 | 11,825 | ||||
| Total comprehensive income | 35,121 | 22,909 | 11,772 | ||||
The accompanying notes are an integral part of the consolidated financial statements.
34 U.S. GAAP
| | Years Ended September 30 | |||||||
|---|---|---|---|---|---|---|---|---|
| | 2003 | 2002 | 2001 | |||||
| | $ | $ | $ | |||||
| | (in thousands of U.S. dollars) | |||||||
| Operations | ||||||||
| Net income | 19,925 | 21,188 | 11,825 | |||||
| Non-cash items | ||||||||
| Non-controlling interest | (103 | ) | (363 | ) | (249 | ) | ||
| Amortization of deferred debt issue expenses | 646 | 247 | — | |||||
| Other depreciation and amortization | 8,063 | 7,546 | 11,829 | |||||
| Loss (gain) on disposal of assets | 1,130 | — | (141 | ) | ||||
| Foreign currency fluctuation | 305 | 507 | 102 | |||||
| Deferred income taxes | 1,848 | 2,378 | 1,974 | |||||
| Share in net loss of joint ventures | 106 | 46 | 39 | |||||
| Changes in working capital items (Note 18) | 19,576 | 3,782 | (8,989 | ) | ||||
| Cash flows from operating activities | 51,496 | 35,331 | 16,390 | |||||
Financing | ||||||||
| Long-term debt | 126,064 | 1,506 | — | |||||
| Repayment of long-term debt | (4,687 | ) | (3,267 | ) | (47,075 | ) | ||
| Deferred debt issue expenses | (4,589 | ) | (537 | ) | — | |||
| Non-controlling interest | — | — | 388 | |||||
| Issue of shares | 1,103 | 65,039 | 30,969 | |||||
| Cash flows from financing activities | 117,891 | 62,741 | (15,718 | ) | ||||
Investment | ||||||||
| Acquisition of short-term investments | (133,112 | ) | (60,740 | ) | (48,552 | ) | ||
| Disposal of short-term investments | 60,740 | — | 58,339 | |||||
| Acquisition of investments | — | (16 | ) | (961 | ) | |||
| Disposal of investments | 637 | 385 | 186 | |||||
| Acquisition of property, plant and equipment | (4,291 | ) | (2,881 | ) | (2,391 | ) | ||
| Acquisition of intangible assets | (76,093 | ) | (1,561 | ) | (1,892 | ) | ||
| Other | — | 1,363 | — | |||||
| Net cash used for business acquisitions (Note 4) | — | (31,302 | ) | — | ||||
| Cash flows from investment activities | (152,119 | ) | (94,752 | ) | 4,729 | |||
| Foreign exchange gain (loss) on cash held in foreign currencies | 528 | 142 | (10 | ) | ||||
| Net increase in cash and cash equivalents | 17,796 | 3,462 | 5,391 | |||||
| Cash and cash equivalents, beginning of year | 19,977 | 16,515 | 11,124 | |||||
| Cash and cash equivalents, end of year | 37,773 | 19,977 | 16,515 | |||||
The accompanying notes are an integral part of the consolidated financial statements.
U.S. GAAP 35
NOTES TO CONSOLIDATED FINANCIAL STATEMENTS
U.S. GAAP
September 30
Amounts in the tables are stated in thousands of U.S. dollars, except share related data.
1. GOVERNING STATUTES AND NATURE OF OPERATIONS
The Company, incorporated under the Canada Business Corporations Act, is involved in the research, development, production and distribution of pharmaceutical products, mainly in the field of gastroenterology.
2. CHANGES IN ACCOUNTING POLICIES
- a)
- Year ended September 30, 2003
- b)
- Year ended September 30, 2002
Basis of presentation
The Company decided, for the year beginning October 1, 2002, to switch from Canadian generally accepted accounting principles ("GAAP") to the United States of America ("U.S.") GAAP as its primary reporting convention. The change in GAAP was influenced by the Company's desire to better meet the needs of its shareholders by applying accounting rules that are consistent with the majority of its customers and peer companies. Consolidated financial statements prepared in U.S. dollars and in accordance with Canadian GAAP are available to shareholders and filed with regulatory authorities.
Guarantor's Accounting and Disclosure Requirements for Guarantees
In November 2002, the Financial Accounting Standards Board ("FASB") issued Interpretation ("FIN") No. 45, "Guarantor's Accounting and Disclosure Requirements for Guarantees." FIN No. 45 requires a guarantor to recognize, at the inception of a guarantee, a liability for the fair value of the obligation it has undertaken in issuing the guarantee. FIN No. 45 also requires guarantors to disclose certain information for guarantees, including product warranties, outstanding at the end of the reporting period. At adoption, FIN No. 45 did not have any impact on the Company's consolidated statements of income or financial position.
Impairment or Disposal of Long-lived Assets
Statement of Financial Accounting Standards ("SFAS") No. 144, "Accounting for the Impairment or Disposal of Long-lived Assets" provides guidance on how assets are grouped when testing for and measuring impairment and proposes a two-step process for first determining when an impairment loss is recognized and then measuring that loss. The adoption of this new standard had no impact on the consolidated financial statements.
Stock-based Compensation
In December 2002, the FASB issued SFAS No. 148, "Accounting for Stock-based Compensation — Transition and Disclosure". SFAS No. 148 amends SFAS No. 123, "Accounting for Stock-based Compensation", to provide alternative methods of transition to SFAS No. 123's fair value method of accounting for stock-based employee compensation. SFAS No. 148 also amends the disclosure provisions of SFAS No. 123 and Accounting Principles Board Opinion ("APB") No. 28, "Interim Financial Reporting", to require disclosure in the summary of significant accounting policies of the effects of an entity's accounting policy with respect to stock-based employee compensation on reported net income and income per share in annual and interim financial statements. While SFAS No. 148 does not amend SFAS No. 123 to require companies to account for employee stock options using the fair value method, the disclosure provisions of SFAS No. 148 are applicable to all companies with stock-based employee compensation, regardless of whether they account for that compensation using the fair value method of SFAS No. 123 or the intrinsic value method of APB No. 25. As allowed by SFAS No. 123, the Company elected to continue to utilize the accounting method prescribed by APB No. 25 and will adopt the disclosure requirements of SFAS No. 123.
Business combinations, goodwill and other intangible assets
In June 2001, the FASB has approved for issuance SFAS No. 141, "Business Combinations," and No. 142, "Goodwill and Other Intangible Assets." SFAS No. 141 requires that the purchase method of accounting be used for all business combinations initiated after June 30, 2001, and that the use of the pooling-of-interest method is no longer allowed. SFAS No. 142 requires that upon adoption, amortization of goodwill and intangible assets with indefinite life will cease and instead, their carrying value will be evaluated for impairment on an annual basis. Intangible assets with finite life will continue to be amortized over their useful lives and reviewed for impairment. SFAS No. 142 is effective for fiscal years beginning after December 15, 2001. The Company has elected to early adopt and, since October 1, 2001, it no longer amortizes its goodwill and trademarks with indefinite life, but rather, evaluates goodwill and trademarks with indefinite life for impairment annually. Intangible assets with finite life will continue to be amortized over their estimated useful lives. As required by the standards, the Company completed the impairment tests and did not record any impairments.
36 U.S. GAAP
The following table presents the matching of net income and basic income per share as reported for the prior years and corresponding information recalculated as a result of applying the new standards on intangible assets and goodwill:
| | 2003 $ | 2002 $ | 2001 $ | |||||
|---|---|---|---|---|---|---|---|---|
| Net income | 19,925 | 21,188 | 11,825 | |||||
| Add: | ||||||||
| Amortization of goodwill | — | — | 1,400 | |||||
| Amortization of intangible assets with indefinite life | — | — | 3,048 | |||||
| Adjusted net income | 19,925 | 21,188 | 16,273 | |||||
| Basic income per share | ||||||||
| Net income | 0.44 | 0.51 | 0.32 | |||||
| Add: | ||||||||
| Amortization of goodwill | — | — | 0.04 | |||||
| Amortization of intangible assets with indefinite life | — | — | 0.09 | |||||
| Adjusted net income | 0.44 | 0.51 | 0.45 | |||||
- c)
- Standards applicable for the year 2004
In May 2003, the FASB issued SFAS No. 150,"Accounting for Certain Financial Instruments with Characteristics of Both Liabilities and Equity." This statement requires that certain instruments that were previously classified as equity on a company's statement of financial position now be classified as liabilities. The statement is effective for financial instruments entered into or modified after May 31, 2003, and otherwise is effective at the beginning of the first interim period beginning after June 15, 2003. The Company currently has no instruments impacted by the adoption of this statement and therefore the adoption did not have an effect on the Company's consolidated balance sheets or statements of operations, shareholders' equity and cash flows.
In January 2003, the FASB issued FIN No. 46, "Consolidation of Variable Interest Entities, an interpretation for Accounting Research Bulletin No. 51." FIN No. 46 requires certain variable interest entities, or VIEs, to be consolidated by the primary beneficiary of the entity if the equity investors in the entity do not have the characteristics of a controlling financial interest or do not have sufficient equity at risk for the entity to finance its activities without additional subordinated financial support from other parties. FIN No. 46 is effective for all VIEs created or acquired after January 31, 2003. For VIEs created or acquired prior to February 1, 2003, the provisions of FIN No. 46 must be applied for the first interim or annual period beginning after December 15, 2003. The Company currently has no contractual relationship or other business relationship with a variable interest entity and therefore the adoption of FIN No. 46 is not expected to have any effect on the Company's consolidated balance sheets or statements of operations, shareholders' equity and cash flows.
U.S. GAAP 37
3. ACCOUNTING POLICIES
Basis of presentation
The Company has prepared these consolidated financial statements in U.S. dollars and in accordance with U.S. GAAP. Consolidated financial statements prepared in U.S. dollars and in accordance with Canadian GAAP are available to shareholders and filed with various regulatory authorities.
Accounting estimates
The preparation of financial statements in accordance with generally accepted accounting principles requires management to make estimates and assumptions that affect the recorded amounts of assets and liabilities and disclosure of contingent assets and liabilities as of the date of the financial statements and recognized amounts of revenues and expenses during the year. Significant estimates and assumptions made by management include allowances for accounts receivable and inventories, reserves for product returns, rebates and chargebacks, the classification of intangible assets between finite life and indefinite life, the useful lives of long-lived assets, the expected cash flows used in evaluating long-lived assets, goodwill and investments for impairment, contingency provisions, the realizability of deferred tax assets and the allocation of the purchase price of acquired assets and businesses. Actual results could differ from those estimates.
Principles of consolidation
These financial statements include the accounts of the Company and its subsidiaries, the most important being Axcan Scandipharm Inc., Axcan Pharma U.S. Inc., and Axcan Pharma S.A. (the result of the merger of Laboratoires Entéris S.A.S. with Laboratoire du Lactéol du Docteur Boucard S.A.). The Company's interest in the joint ventures is accounted for by the equity method. Significant intercompany transactions have been eliminated in consolidation.
Revenue recognition
Revenue is recognized when the product is shipped to the Company's customers, provided the Company has not retained any significant risks of ownership or future obligations with respect to the product shipped. Revenue from product sales is recognized net of sales discounts, allowances, returns, rebates and chargebacks. In certain circumstances, returns or exchange of products are allowed under the Company's policy and provisions are maintained accordingly. Amounts received from customers as prepayments for products to be shipped in the future are reported as deferred revenue.
Cash and cash equivalents
The Company includes in cash and cash equivalents cash and all highly liquid short-term investments with initial maturities of three months or less.
Short-term investments
The Company classifies its short-term investments as available for sale. These investments are recorded at their fair value; unrealized gains or losses are recorded as a component in shareholders' equity. As at September 30, 2003, there is no material unrealized gain or loss.
Accounts receivable
The majority of the Company's accounts receivable are due from companies in the pharmaceutical industry. Credit is extended based on evaluation of a customers' financial condition and, generally, collateral is not required. Accounts receivable are due within 30 days and are stated at amounts due from customers net of an allowance for doubtful accounts. Accounts outstanding longer than the contractual payment terms are considered past due. The Company determines its allowance by considering a number of factors, including the length of time trade accounts receivable are past due, the Company's previous loss history, the customer's current ability to pay its obligation to the Company, and the condition of the general economy and the industry as a whole. The Company writes off accounts receivable when they become uncollectible, and payments subsequently received on such receivables are credited to the bad debt expenses.
Inventory valuation
Inventories of raw materials and packaging material are valued at the lower of cost and replacement cost. Inventories of work in progress and finished goods are valued at the lower of cost and net realizable value. Cost is determined by the first-in, first-out method.
Research and development
Research and development expenses are charged to operations in the year they are incurred. Acquired in-process research and development having no alternative future use is written off at the time of acquisition. The cost of intangibles that are purchased from others for a particular research and development project that have no alternative future use are written off at the time of acquisition.
38 U.S. GAAP
Depreciation and amortization
Property, plant and equipment and intangible assets with a finite life are reported at cost, less accumulated depreciation and are depreciated or amortized over their estimated useful lives according to the following methods and annual rates:
| | Methods | Rates | ||
|---|---|---|---|---|
| Buildings | Diminishing balance and straight-line | 4 to 10% | ||
| Furniture and equipment | Diminishing balance and straight-line | 10 to 20% | ||
| Computer equipment | Diminishing balance and straight-line | 20 to 50% | ||
| Automotive equipment | Diminishing balance and straight-line | 20 to 25% | ||
| Leasehold and building improvements | Straight-line | 10 to 20% | ||
| Trademarks, trademark licenses and manufacturing rights | Straight-line | 4 to 15% |
Beginning October 1, 2001, goodwill is no longer amortized, but instead tested for impairment at least annually. Prior to October 1, 2001, goodwill was amortized on a straight-line basis over periods of 15 or 20 years.
Beginning October 1, 2001, intangible assets with indefinite life are no longer amortized, but instead tested for impairment at least annually. Prior to October 1, 2001, intangible assets with indefinite life were amortized on a straight-line basis over periods of 15 to 25 years.
Management evaluates the value of the unamortized portion of goodwill and intangible assets annually. Should there be a permanent impairment in value or if the unamortized balance exceeds recoverable amounts, a write-down will be recognized for the current year to reflect the assets at fair value. To date, the Company has not recognized any permanent impairment in value.
Deferred debt issue expenses are amortized on a straight-line basis over the terms of the debts, until 2008.
Income taxes
Income taxes are calculated based on the liability method. Under this method, deferred income tax assets and liabilities are recognized as estimated taxes for recovery or settlement arising from the recovery or settlement of assets and liabilities recorded at their financial statement carrying amounts. Deferred income tax assets and liabilities are measured based on enacted tax rates and laws at the date of the financial statements for the years in which the temporary differences are expected to reverse. Adjustments to the deferred income tax asset and liability balances are recognized in net income as they occur.
Stock-based compensation
Under the provision of SFAS No. 123, "Accounting for Stock-based Compensation", companies can either measure the compensation cost of equity instruments issued under employee compensation plans using a fair value-based method or can continue to recognize compensation cost using the intrinsic value method under the provisions of APB No. 25, "Accounting for Stock Issued to Employees". However, if the provisions of APB No. 25 are applied, pro-forma disclosure of net income and income per share must be presented in the financial statements as if the fair value method had been applied. For all periods presented, the Company recognized compensation costs under the provisions of APB No. 25, and the Company has provided the expanded disclosure required by SFAS No. 123. The Company has elected to continue to measure compensation costs related to awards of stock options using the intrinsic value-based method of accounting. No stock-based employee compensation cost is reflected in net income.
U.S. GAAP 39
The following table illustrates the effect on net income and income per share if the Company had applied the fair value recognition provisions of SFAS No. 123 to stock-based compensation.
| | 2003 $ | 2002 $ | 2001 $ | |||||
|---|---|---|---|---|---|---|---|---|
| Net income as reported | 19,925 | 21,188 | 11,825 | |||||
| Total stock-based compensation expenses determined under fair value-based method | (3,369 | ) | (2,489 | ) | (1,415 | ) | ||
| Pro-forma net income | 16,556 | 18,699 | 10,410 | |||||
| Basic income per share | ||||||||
| As reported | 0.44 | 0.51 | 0.32 | |||||
| Pro-forma | 0.37 | 0.45 | 0.28 | |||||
| Diluted income per share | ||||||||
| As reported | 0.44 | 0.50 | 0.32 | |||||
| Pro-forma | 0.36 | 0.44 | 0.28 | |||||
Foreign currency translation
The current rate method of translation of foreign currencies is followed for subsidiaries, or joint ventures considered financially and operationally self-sustaining. Therefore, all gains and losses arising from the translation of the financial statements of subsidiaries or joint ventures are deferred in a cumulative foreign currency translation adjustments account reported as a component of accumulated other comprehensive income in shareholders' equity.
For the operations in Canada and the United States of America, monetary assets and liabilities in currency other than U.S. dollars are translated into U.S. dollars, the functional currency of the Company, at the exchange rate in effect at the balance sheet date whereas other assets and liabilities are translated at exchange rates in effect at transaction dates. Revenue and operating expenses in foreign currency are translated at the average rates in effect during the year, except for depreciation and amortization, translated at historical rates. Gains and losses are included in net income for the year.
Income per share
Basic income per share is calculated using the weighted average number of common shares outstanding during the year. The treasury stock method is to be used for determining the dilution effect of options. The dilutive effect of convertible subordinated notes, balance of purchase price payable in shares and convertible preferred shares is determined using the "if-converted" method.
40 U.S. GAAP
- a)
- Business acquisitions
September 30, 2002
On November 7, 2001, the Company acquired all the outstanding shares of Laboratoires Entéris S.A.S., a company specializing in the distribution of gastrointestinal products in France. The acquisition cost, including transaction expenses, amounting to $23,000,840, was paid in cash.
On April 17, 2002, the Company acquired all the outstanding shares of Laboratoire du Lactéol du Docteur Boucard S.A. and certain related assets. This company is specialized in the manufacturing and distribution of gastrointestinal products in France. The acquisition cost, including transaction expenses, amounting to $13,137,613, was paid with the issuance of 365,532 common shares of the Company and $8,378,728 in cash. The price of the common shares issued was determined on the basis of a twenty-day trading average closing price.
These two acquisitions will allow the Company to establish operations in France for the development of markets in all of Western Europe and add two products to the Company's product line.
The following table shows the breakdown of these acquisitions:
| | $ | |||
|---|---|---|---|---|
| Net assets acquired at the attributed values | ||||
| Assets | ||||
| Cash and cash equivalents | 77 | |||
| Other working capital items | 7,323 | |||
| Property, plant and equipment | 9,433 | |||
| Intangible assets with indefinite life | 29,175 | |||
| Goodwill | 9,632 | |||
| Deferred income taxes | 656 | |||
| Other assets | 1,363 | |||
| 57,659 | ||||
| Liabilities | ||||
| Accounts payable | 8,215 | |||
| Long-term debt | 6,922 | |||
| Deferred income taxes | 6,384 | |||
| 21,521 | ||||
| 36,138 | ||||
| Consideration | ||||
| Cash | 31,379 | |||
| Common shares issued | 4,759 | |||
| 36,138 | ||||
| Net cash used for the acquisitions | 31,302 | |||
U.S. GAAP 41
The acquisition cost has been allocated to the assets and liabilities according to their estimated fair value at the acquisition dates. The operating results relating to these acquisitions have been included in the consolidated financial statements from the acquisition dates.
Using the assumption that the effective date of the business acquisitions is October 1, 2000, the consolidated pro-forma results of operations of the Company would have been as follows for the years ended September 30:
| | 2002 (unaudited) $ | 2001 (unaudited) $ | ||
|---|---|---|---|---|
| Revenue | 140,983 | 125,524 | ||
| Net income | 20,802 | 11,136 | ||
| Net income per share | 0.50 | 0.30 | ||
- b)
- Product acquisitions
On August 29, 2003, the Company acquired an exclusive license for North America, the European Union and Latin America, from Abbott Laboratories ("Abbott") to develop, manufacture and market ITAX, a patented gastroprokinetic drug. Under the terms of this license agreement, the Company paid $10,000,000 and assumed $2,000,000 in research contract liabilities. This product in development has not reached technological feasibility and has no known alternative uses; it is therefore considered to be acquired in-process research and was expensed in the period of acquisition.
On December 10, 2002, the Company acquired the rights to the ursodiol 250 mg tablets DELURSAN for the French market, for a cash purchase price of 22,300,000 Euros ($22,800,000) from Aventis Pharma S.A.
On December 3, 2002, the Company acquired the worldwide rights to the PANZYTRAT enzyme product line from Abbott for a cash purchase price of $45,000,000. During the period of marketing authorizations transfer ("the interim period"), Abbott acts as an agent for the management of the product line sales. The interim period is for a maximum of 18 months. For the year ended September 30, 2003, the Company included in its revenues an amount of $9,463,645 representing the net sales from the product line less cost of goods sold and other related expenses. Net sales of the PANZYTRAT enzyme product line for the year ended September 30, 2003, were $14,255,979.
5. SHORT-TERM INVESTMENTS
As at September 30, 2003, short-term investments include short-term notes, mutual funds and debt securities. Four short-term notes (two in 2002) represent approximately 60% (47% in 2002) of the Company's total short-term investments. Interest rates on most of the short-term investments vary from 0.81% to 1.08% (1.52% to 1.66% in 2002).
6. ACCOUNTS RECEIVABLE
| | 2003 $ | 2002 $ | ||
|---|---|---|---|---|
| Trade accounts, net of allowance for doubtful accounts of $613,000 ($403,000 in 2002)(a) | 16,696 | 23,707 | ||
| Investments receivable within one year | 1,102 | 142 | ||
| Taxes receivable | 1,479 | 329 | ||
| Other | 408 | 191 | ||
| 19,685 | 24,369 | |||
- (a)
- As at September 30, 2003, the accounts receivable include amounts receivable from two customers and one agent which represent approximately 44% (four customers for 60% in 2002) of the Company's total accounts receivable.
42 U.S. GAAP
7. INVENTORIES
| | 2003 $ | 2002 $ | ||
|---|---|---|---|---|
| Raw materials and packaging material | 8,441 | 3,841 | ||
| Work in progress | 1,466 | 4,516 | ||
| Finished goods | 10,256 | 11,384 | ||
| 20,163 | 19,741 | |||
8. INCOME TAXES
The deferred income tax assets and liabilities result from differences between the tax value and book value of the following items:
| | 2003 $ | 2002 $ | ||||
|---|---|---|---|---|---|---|
| Short-term deferred income tax assets | ||||||
| Inventories | 2,554 | 2,590 | ||||
| Accounts payable and accrued liabilities | 2,558 | 2,586 | ||||
| Contingency provisions | 1,102 | 1,159 | ||||
| 6,214 | 6,335 | |||||
| Long-term deferred income tax assets | ||||||
| Investments | 16 | 14 | ||||
| Property, plant and equipment | — | 51 | ||||
| Share issue expenses | 1,746 | 2,380 | ||||
| Unused operating losses | 13 | 11 | ||||
| 1,775 | 2,456 | |||||
| Short-term deferred income tax liabilities | ||||||
| Accounts receivable | 318 | — | ||||
| Prepaid expenses | 163 | 135 | ||||
| Investments | 13 | 12 | ||||
| Deferred gain | — | 122 | ||||
| 494 | 269 | |||||
| Long-term deferred income tax liabilities | ||||||
| Investments | — | 13 | ||||
| Property, plant and equipment | 1,993 | 1,625 | ||||
| Intangible assets | 31,801 | 31,275 | ||||
| Goodwill | 682 | 682 | ||||
| Research and development expenses | 127 | 617 | ||||
| 34,603 | 34,212 | |||||
U.S. GAAP 43
Income taxes included in the statement of operations are as follows:
| | 2003 $ | 2002 $ | 2001 $ | ||||||
|---|---|---|---|---|---|---|---|---|---|
| Current | 11,144 | 8,754 | 3,835 | ||||||
| Deferred | |||||||||
| Creation and reversal of temporary differences | 2,678 | 2,234 | 205 | ||||||
| Operating losses | — | — | 1,724 | ||||||
| Change in promulgated rates | (830 | ) | 144 | 45 | |||||
| 1,848 | 2,378 | 1,974 | |||||||
| 12,992 | 11,132 | 5,809 | |||||||
| Domestic | |||||||||
| Current | (1,763 | ) | 2,152 | (972 | ) | ||||
| Deferred | 574 | 1,704 | 3,536 | ||||||
| (1,189 | ) | 3,856 | 2,564 | ||||||
| Foreign | |||||||||
| Current | 12,907 | 6,602 | 4,807 | ||||||
| Deferred | 1,274 | 674 | (1,562 | ) | |||||
| 14,181 | 7,276 | 3,245 | |||||||
| 12,992 | 11,132 | 5,809 | |||||||
The Company's effective income tax rate differs from the combined statutory federal and provincial income tax rate in Canada (33.59% for 2003, 35.66% for 2002 and 37.41% for 2001). This difference arises from the following:
| | 2003 $ | 2002 $ | 2001 $ | |||||
|---|---|---|---|---|---|---|---|---|
| Combined basic rate applied to pre-tax income | 11,057 | 11,525 | 6,597 | |||||
| Increase (decrease) in taxes resulting from: | ||||||||
| Large corporations tax | — | — | 59 | |||||
| Change in promulgated rates | (830 | ) | 144 | 45 | ||||
| Difference with foreign tax rates | 1,495 | 1,189 | (548 | ) | ||||
| Non-deductible items | 953 | 257 | 559 | |||||
| Use of unrecorded prior years' losses | — | (231 | ) | — | ||||
| Non-taxable items and other | (445 | ) | (1,713 | ) | (460 | ) | ||
| Foreign withholding taxes | 1,250 | 791 | 671 | |||||
| Investment tax credits | (488 | ) | (830 | ) | (1,114 | ) | ||
| 12,992 | 11,132 | 5,809 | ||||||
No provision has been made for income taxes on the undistributed earnings of the Company's foreign subsidiaries as at September 30, 2003, that the Company intends to indefinitely reinvest.
44 U.S. GAAP
| | 2003 | 2002 | ||
|---|---|---|---|---|
| | $ | $ | ||
| Investments in preferred shares of a private company, at estimated net realizable value | 578 | 1,156 | ||
| Note receivable, 8.5% beginning on January 1, 2002, maturing on January 1, 2004 | 936 | 936 | ||
| Investments in joint ventures accounted for using equity method | 227 | 333 | ||
| Other | 363 | 398 | ||
| 2,104 | 2,823 | |||
| Investments receivable within one year | 1,102 | 142 | ||
| 1,002 | 2,681 | |||
10. PROPERTY, PLANT AND EQUIPMENT
| | 2003 | |||||
|---|---|---|---|---|---|---|
| | Cost | Accumulated depreciation | Net | |||
| | $ | $ | $ | |||
| Land | 940 | — | 940 | |||
| Buildings | 12,431 | 2,484 | 9,947 | |||
| Furniture and equipment | 13,761 | 6,417 | 7,344 | |||
| Automotive equipment | 54 | 1 | 53 | |||
| Computer equipment | 3,822 | 2,085 | 1,737 | |||
| Leasehold and building improvements | 522 | 212 | 310 | |||
| 31,530 | 11,199 | 20,331 | ||||
| | 2003 | |||||
|---|---|---|---|---|---|---|
| | Cost | Accumulated depreciation | Net | |||
| | $ | $ | $ | |||
| Land | 848 | — | 848 | |||
| Buildings | 10,679 | 1,334 | 9,345 | |||
| Furniture and equipment | 12,566 | 4,280 | 8,286 | |||
| Automotive equipment | 53 | 25 | 28 | |||
| Computer equipment | 2,253 | 1,573 | 680 | |||
| Leasehold and building improvements | 1,139 | 240 | 899 | |||
| 27,538 | 7,452 | 20,086 | ||||
Acquisitions of property, plant and equipment amount to $4,291,768 ($14,071,633 in 2002 and $2,415,136 in 2001).
The cost and accumulated depreciation of equipment under capital leases amount to $5,019,440 and $891,445 ($3,154,207 and $204,000 in 2002).
U.S. GAAP 45
11. INTANGIBLE ASSETS
| | 2003 | ||||||
|---|---|---|---|---|---|---|---|
| | Cost | Accumulated depreciation | Net | ||||
| | $ | $ | $ | ||||
| Trademarks, trademark licenses and manufacturing rights with a: | |||||||
| Finite life | 111,327 | 19,998 | 91,329 | ||||
| Indefinite life | 186,512 | 12,418 | 174,094 | ||||
| 297,839 | 32,416 | 265,423 | |||||
| | 2002 | ||||||
|---|---|---|---|---|---|---|---|
| | Cost | Accumulated depreciation | Net | ||||
| | $ | $ | $ | ||||
| Trademarks, trademark licenses and manufacturing rights with a: | |||||||
| Finite life | 105,545 | 15,317 | 90,228 | ||||
| Indefinite life | 102,275 | 12,418 | 89,857 | ||||
| 207,820 | 27,735 | 180,085 | |||||
Acquisitions of intangible assets amount to $76,092,927 ($30,036,118 in 2002 and $2,592,054 in 2001).
The annual amortization expenses without taking into account any future acquisitions expected for the years 2004 through 2008 are as follows:
| | $ | |
|---|---|---|
| 2004 | 5,926 | |
| 2005 | 6,120 | |
| 2006 | 6,313 | |
| 2007 | 6,313 | |
| 2008 | 6,313 |
12. GOODWILL
| | 2003 | 2002 | ||
|---|---|---|---|---|
| | $ | $ | ||
| Cost | 31,161 | 31,161 | ||
| Accumulated amortization | 3,611 | 3,611 | ||
| Net | 27,550 | 27,550 | ||
46 U.S. GAAP
13. AUTHORIZED LINE OF CREDIT
The Company has a credit agreement with two Canadian chartered banks relative to a $55,000,000 financing. The financing comprises a $15,000,000 revolving operating facility renewable annually and a $40,000,000 364-day, extendible revolving facility with a three-year term-out option maturing on October 12, 2007. The term-out option provides for quarterly instalments equal to 6.81% of the amount then outstanding on the extendible revolving facility with a final instalment of 25%.
The credit facilities are secured by a first security interest on all present and future acquired assets of the Company and its material subsidiaries, and provide for the maintenance of certain financial ratios. Cash dividends, repurchase of shares (other than redeemable shares issued in connection with a permitted acquisition) and similar distributions to shareholders are limited to 10% of the Company's net income for the preceding fiscal year.
The interest rate varies depending on the Company's leverage between 25 basis points and 125 basis points over prime rate and between 125 basis points and 225 basis points over the LIBOR rate or bankers' acceptances. The credit facilities may be drawn in U.S. dollar or in Canadian dollar equivalents. As at September 30, 2003, there was no amount outstanding under this line of credit.
14. ACCOUNTS PAYABLE AND ACCRUED LIABILITIES
| | 2003 | 2002 | ||
|---|---|---|---|---|
| | $ | $ | ||
| Accounts payable | 9,232 | 5,373 | ||
| Contract rebates, product returns and accrued chargebacks | 7,248 | 4,828 | ||
| Accrued interest on subordinated notes | 3,038 | — | ||
| Accrued royalty fees | 4,820 | 2,881 | ||
| Accrued bonuses | 2,883 | 1,670 | ||
| Acquired in-process research payable | 7,000 | — | ||
| Other accrued liabilities | 6,297 | 9,546 | ||
| Contingency provisions | 2,900 | 2,900 | ||
| 43,418 | 27,198 | |||
15. LONG-TERM DEBT
| | 2003 | 2002 | ||
|---|---|---|---|---|
| | $ | $ | ||
| Convertible subordinated notes, 4.25%, interest payable semi-annually starting October 15, 2003, convertible into 8,924,113 common shares, maturing April 15, 2008. | 125,000 | — | ||
| Bank loans, interest rates varying between 4.84% and 7.15%, secured by immovable hypothecs on land and buildings having a net book value of $4,213,164 in 2003, payable in monthly instalments of $52,911, principal and interest, maturing in 2005 and 2013. | 2,576 | 2,565 | ||
| Obligations under capital leases, interest rates varying between 3.81% and 6.20%, (2.70% and 19.84% in 2002) payable in monthly instalments, principal and interest, maturing on different dates until 2008. | 3,426 | 2,852 | ||
| Bank loans, prime rate plus 1.50% and 2.50% (6.00% and 7.00% as at September 30, 2002), secured by movable hypothecs on assets of a subsidiary. | — | 482 | ||
| Balance of the purchase price of PHOTOFRIN of CDN$4,000,000 without interest, payable at the earliest of April 2004 or upon the receipt of a specific approval from a regulatory authority, in cash or in common shares, at Axcan's sole discretion | — | 2,704 | ||
| 131,002 | 8,603 | |||
| Instalments due within one year | 1,528 | 1,336 | ||
| 129,474 | 7,267 | |||
U.S. GAAP 47
As at September 30, 2003, minimum instalments on long-term debt for the next years are as follows:
| | Obligations under capital leases $ | Other long-term loans $ | ||
|---|---|---|---|---|
| 2004 | 1,178 | 508 | ||
| 2005 | 1,021 | 465 | ||
| 2006 | 786 | 408 | ||
| 2007 | 453 | 423 | ||
| 2008 | 248 | 125,440 | ||
| 2009 and thereafter | 86 | 332 | ||
| 3,772 | ||||
| Interest included in the minimum lease payments | 346 | |||
| 3,426 | ||||
16. CAPITAL STOCK
Preferred shares
The Company has an unlimited number of authorized preferred shares without par value, issuable in series, rights, privileges and restrictions determined at the creation date.
During the year 2000, the Company created two series of preferred shares as follows:
| 14,175,000 | Series A, non-voting, annual preferential cumulative dividend of 5%, redeemable on or prior to June 8,2001 at CDN$1.00 per share payable at the option of the Company in cash or by the issuance of common shares or in any combination of cash and common shares. | |
12,000,000 | Series B, non-voting, redeemable on the fifth anniversary of their issuance at CDN$1.00 per share payable in cash or by the issuance of common shares at the option of the Company, convertible into common shares at the holder's option on the basis of one common share for each 15 Series B preferred shares. |
Common stock option plan
The common stock option plan is intended for eligible directors, principal senior executives and employees. The number of stock options that can be granted under this plan cannot exceed 4,500,000, 4,500,000 and 2,590,000 as at September 30, 2003, 2002 and 2001, respectively. Options may be exercised at a rate of 20% per year and expire ten years after the granting date except for the annual options granted to outside directors which may be exercised one year after the granting date.
48 U.S. GAAP
The changes to the number of stock options outstanding are as follows:
| | 2003 | 2002 | 2001 | |||||||||
|---|---|---|---|---|---|---|---|---|---|---|---|---|
| | Number of options | Weighted average exercise price $ | Number of options | Weighted average exercise price $ | Number of options | Weighted average exercise price $ | ||||||
| Balance, beginning of year | 2,429,078 | 9.67 | 1,956,441 | 7.75 | 1,364,348 | 6.56 | ||||||
| Granted | 531,850 | 11.36 | 684,050 | 13.38 | 772,433 | 10.30 | ||||||
| Exercised | (141,122 | ) | 7.82 | (127,489 | ) | 5.89 | (69,597 | ) | 4.77 | |||
| Cancelled | (137,966 | ) | 10.73 | (83,924 | ) | 9.58 | (110,743 | ) | 7.54 | |||
| Balance, end of year | 2,681,840 | 10.12 | 2,429,078 | 9.67 | 1,956,441 | 7.75 | ||||||
| Options exercisable at end of year | 965,909 | 9.00 | 614,716 | 7.79 | 337,708 | 6.11 | ||||||
Stock options outstanding at September 30, 2003, are as follows:
| | Options outstanding | Options exercisable | ||||||||
|---|---|---|---|---|---|---|---|---|---|---|
| Exercise price | Number | Weighted average remaining contractual life | Weighted average exercise price $ | Number | Weighted average exercise price $ | |||||
| $4.04 – $5.50 | 46,400 | 4.9 | 4.35 | 27,400 | 4.71 | |||||
| $5.51 – $7.00 | 71,400 | 5.5 | 5.88 | 53,800 | 5.81 | |||||
| $7.01 – $8.50 | 779,096 | 6.5 | 7.28 | 434,316 | 7.31 | |||||
| $8.51 – $10.00 | 472,744 | 7.2 | 9.93 | 216,433 | 9.92 | |||||
| $10.01 – $11.50 | 448,350 | 8.6 | 10.88 | 43,300 | 10.90 | |||||
| $11.51 – $13.00 | 487,050 | 8.5 | 12.30 | 119,000 | 12.21 | |||||
| $13.01 – $14.03 | 376,800 | 8.4 | 13.99 | 71,660 | 14.01 | |||||
| 2,681,840 | 7.6 | 10.12 | 965,909 | 9.00 | ||||||
The average weighted fair value of granted stock options was $5.41, $6.96 and $5.69 as at September 30, 2003, 2002 and 2001, respectively.
U.S. GAAP 49
The fair values of all stock options granted during 2003, 2002 and 2001 were estimated as of the date of grant using the Black-Scholes option pricing model with the following weighted average assumptions:
| | 2003 | 2002 | 2001 | |||
|---|---|---|---|---|---|---|
| Expected option life (years) | 6 | 6 | 6 | |||
| Volatility | 46% | 47% | 50% | |||
| Risk-free interest rate | 4.43% | 4.93% | 5.64% | |||
| Expected dividend | — | — | — |
The Black-Scholes model, used by the Company to calculate option values, as well as other currently accepted option valuation models, were developed to estimate the fair value of freely tradable, fully transferable options without vesting restrictions, which significantly differ from the Company's stock option awards. These models also require highly subjective assumptions, including future stock price volatility and expected time until exercise, which greatly affect the calculated values. Accordingly, management believes that these models do not necessarily provide a reliable single measure of the fair value of the Company's stock option awards.
Equity line agreement
On July 4, 2002, the Solidarity Fund QFL (the "Solidarity Fund") committed to invest up to $14,100,000 in the Company's capital stock. The Solidarity Fund has initially purchased 208,044 common shares for total proceeds of $3,000,000. As a result of the Solidarity Fund subscription in the Company's convertible subordinated notes issued on March 5, 2003, the Company agreed to waive its rights under this equity line agreement.
17. FINANCIAL INFORMATION INCLUDED IN THE CONSOLIDATED STATEMENT OF OPERATIONS
- a)
- Financial expenses
| | 2003 $ | 2002 $ | 2001 $ | |||
|---|---|---|---|---|---|---|
| Interest on long-term debt | 3,340 | 159 | 2,820 | |||
| Bank charges | 297 | 210 | 50 | |||
| Financing fees | — | 282 | — | |||
| Amortization of deferred debt issue expenses | 646 | 247 | — | |||
| 4,283 | 898 | 2,870 | ||||
- b)
- Other information
| | 2003 $ | 2002 $ | 2001 $ | ||||
|---|---|---|---|---|---|---|---|
| Non-controlling interest | (103 | ) | (363 | ) | (249 | ) | |
| Rental expenses | 1,228 | 1,148 | 994 | ||||
| Depreciation of property, plant and equipment | 3,467 | 2,486 | 755 | ||||
| Amortization of intangible assets | 4,596 | 5,060 | 9,674 | ||||
| Amortization of goodwill | — | — | 1,400 | ||||
| Share in net loss of joint ventures | 106 | 46 | 39 |
50 U.S. GAAP
- c)
- Income per common share
The Company incurred professional fees with a law firm, in which a Company's director is a partner, totalling $385,862 for the year ended September 30, 2003 ($466,056 in 2002 and $468,124 in 2001). These transactions were concluded in the normal course of operations, at the exchange amount.
The following table reconciles the numerators and denominators of the basic and diluted income per share computations.
| | 2003 | 2002 | 2001 | ||||||||
|---|---|---|---|---|---|---|---|---|---|---|---|
| Basic | |||||||||||
| Net income | $ | 19,925 | $ | 21,188 | $ | 11,825 | |||||
| Dividends on preferred shares | — | — | (301 | ) | |||||||
| Income available to common shareholders | $ | 19,925 | $ | 21,188 | $ | 11,524 | |||||
| Weighted average number of common shares outstanding | 44,914,944 | 41,664,510 | 35,832,198 | ||||||||
| Basic income per share | $ | 0.44 | $ | 0.51 | $ | 0.32 | |||||
| Diluted | |||||||||||
| Net income available to common shareholders on a diluted basis | $ | 19,925 | $ | 21,188 | $ | 11,524 | |||||
| Weighted average number of common shares outstanding | 44,914,944 | 41,664,510 | 35,832,198 | ||||||||
| Effect of dilutive stock options | 472,599 | 660,970 | 449,478 | ||||||||
| Effect of dilutive purchase price | 220,449 | 202,020 | 249,376 | ||||||||
| Adjusted weighted average number of common shares outstanding | 45,607,992 | 42,527,500 | 36,531,052 | ||||||||
| Diluted income per share | $ | 0.44 | $ | 0.50 | $ | 0.32 | |||||
Options to purchase 754,100 common shares (553,350 for 2002 and 206,250 for 2001) were outstanding but were not included in the computation of diluted income per share as the exercise price of the options was greater than the average market price of the common shares. As of September 30, 2003, the convertible subordinated notes have no effect on the diluted income per share.
U.S. GAAP 51
18. FINANCIAL INFORMATION INCLUDED IN THE CONSOLIDATED STATEMENT OF CASH FLOWS
- a)
- Changes in working capital items
| | 2003 $ | 2002 $ | 2001 $ | ||||
|---|---|---|---|---|---|---|---|
| Accounts receivable | 5,569 | 2,155 | (7,243 | ) | |||
| Income taxes receivable | (4,438 | ) | (406 | ) | 2,902 | ||
| Inventories | (417 | ) | (2,546 | ) | (3,384 | ) | |
| Prepaid expenses | (892 | ) | (58 | ) | (195 | ) | |
| Accounts payable and accrued liabilities | 16,547 | 3,814 | (65 | ) | |||
| Income taxes payable | 3,207 | 823 | (1,004 | ) | |||
| 19,576 | 3,782 | (8,989 | ) | ||||
- b)
- Cash flows relating to interest and income taxes of operating activities are as follows:
| | 2003 $ | 2002 $ | 2001 $ | |||
|---|---|---|---|---|---|---|
| Interest received | 1,427 | 787 | 1,010 | |||
| Interest paid | 342 | 242 | 2,875 | |||
| Income taxes paid | 12,417 | 7,672 | 2,028 |
19. JOINT VENTURES
The following accounts represent the share of the Company in the joint ventures:
| | 2003 $ | 2002 $ | 2001 $ | |||||
|---|---|---|---|---|---|---|---|---|
| Current assets | 217 | 190 | 186 | |||||
| Total assets | 649 | 606 | 623 | |||||
| Current liabilities | 393 | 248 | 220 | |||||
| Total liabilities | 422 | 273 | 245 | |||||
| Revenue | 659 | 725 | 696 | |||||
| Expenses | 765 | 771 | 735 | |||||
| Net loss | (106 | ) | (46 | ) | (39 | ) | ||
| Cash flows from: | ||||||||
| Operations | 92 | (8 | ) | (10 | ) | |||
| Financing | 4 | — | 25 | |||||
| Investment | (11 | ) | 10 | — | ||||
52 U.S. GAAP
20. SEGMENTED INFORMATION
The Company considers that it operates in a single field of activity, the pharmaceutical industry, since its other activities do not account for a significant portion of segment assets.
No customer represents more than 10% of the Company's revenue except for three customers (four in 2001) for which the sales represented 49.6% of revenue for the year ended September 30, 2003, (52.3% and 66.3% in 2002 and 2001, respectively).
Purchases from one supplier represent approximately 26% of the cost of goods sold for the year ended September 30, 2003 (30% in 2002 and 38% in 2001).
The Company operates in the following geographic segments:
| | 2003 $ | 2002 $ | 2001 $ | ||||||
|---|---|---|---|---|---|---|---|---|---|
| Revenue | |||||||||
| Canada | |||||||||
| Domestic sales | 20,555 | 17,413 | 18,485 | ||||||
| Foreign sales | 9,943 | 22,623 | 11,950 | ||||||
| United States | |||||||||
| Domestic sales | 113,875 | 100,088 | 79,289 | ||||||
| Foreign sales | 421 | 520 | 481 | ||||||
| France | |||||||||
| Domestic sales | 26,975 | 11,409 | — | ||||||
| Foreign sales | 17,213 | 3,362 | — | ||||||
| Other | 2,649 | 1,188 | 6,374 | ||||||
| Inter-segment | (12,547 | ) | (24,199 | ) | (12,765 | ) | |||
| 179,084 | 132,404 | 103,814 | |||||||
| Operating income (loss) | |||||||||
| Canada | (6,086 | ) | 5,413 | 3,563 | |||||
| United States | 40,879 | 27,750 | 16,382 | ||||||
| France | 14,917 | 1,279 | — | ||||||
| Other | (10,330 | ) | (1,870 | ) | 231 | ||||
| 39,380 | 32,572 | 20,176 | |||||||
| Depreciation and amortization | |||||||||
| Canada | 1,380 | 1,516 | 938 | ||||||
| United States | 3,729 | 3,890 | 9,479 | ||||||
| France | 1,376 | 443 | — | ||||||
| Other | 1,578 | 1,697 | 1,412 | ||||||
| 8,063 | 7,546 | 11,829 | |||||||
| Property, plant, equipment, intangible assets and goodwill | |||||||||
| Canada | 14,622 | 13,782 | 14,237 | ||||||
| United States | 133,695 | 135,839 | 136,920 | ||||||
| France | 135,377 | 50,488 | — | ||||||
| Other | 29,610 | 27,612 | 28,783 | ||||||
| 313,304 | 227,721 | 179,940 | |||||||
| Total assets | |||||||||
| Canada | 432,353 | 296,870 | 205,466 | ||||||
| United States | 214,854 | 184,573 | 181,849 | ||||||
| France | 156,700 | 58,938 | — | ||||||
| Other | 125,131 | 32,131 | 33,378 | ||||||
| Inter-segment | (383,689 | ) | (205,506 | ) | (174,209 | ) | |||
| 545,349 | 367,006 | 246,484 | |||||||
U.S. GAAP 53
21. FINANCIAL INSTRUMENTS
Currency risk
The Company is exposed to financial risk arising from fluctuations in foreign exchange rates and the degree of volatility of the rates. The Company does not use derivative instruments to reduce its exposure to foreign currency risk.
Fair value of the financial instruments on the balance sheet:
The estimated fair value of the financial instruments is as follows:
| | 2003 | 2002 | |||||||
|---|---|---|---|---|---|---|---|---|---|
| | Fair value $ | Carrying amount $ | Fair value $ | Carrying amount $ | |||||
| Assets | |||||||||
| Cash and cash equivalents | 37,773 | 37,773 | 19,977 | 19,977 | |||||
| Short-term investments | 133,112 | 133,112 | 60,740 | 60,740 | |||||
| Accounts receivable | 17,104 | 17,104 | 23,898 | 23,898 | |||||
| Investments in a private company | b | ) | 578 | b | ) | 1,156 | |||
| Note receivable | b | ) | 936 | b | ) | 936 | |||
| Other investments | 363 | 363 | 398 | 398 | |||||
| Liabilities | |||||||||
| Accounts payable and accrued liabilities | 43,418 | 43,418 | 27,198 | 27,198 | |||||
| Long-term debt | 131,002 | 131,002 | 8,295 | 8,603 | |||||
- a)
- Financial instruments valued at carrying amount
The following methods and assumptions were used to calculate the estimated fair value of the financial instruments on the balance sheet.
- b)
- Investments in a private company and note receivable
The estimated fair value of certain financial instruments shown on the balance sheet is equivalent to their carrying amount because they are realizable in the short-term or because their carrying amount approximates the fair value. These financial instruments include cash and cash equivalents, short-term investments, accounts receivable, other investments and accounts payable and accrued liabilities.
- c)
- Long-term debt
The fair value of investments in a private company and note receivable was not readily determinable.
Since a significant portion of the long-term debt was issued during the year at current market rates and there has been little change in market rates, the fair value of long-term debt approximates its carrying value. In 2002, the fair value of long-term debt has been established by discounting the future cash flows at interest rates corresponding to those the Company would have obtained at that date for loans with similar maturity dates and terms.
54 U.S. GAAP
22. COMMITMENTS AND CONTINGENCIES
- a)
- Commitments
The Company has entered into non-cancelable operating leases expiring on different dates until September 30, 2008, for the rental of office space, automotive equipment and equipment. One of the office space leases contains an escalation clause providing for additional rent.
Minimum future lease payments under these operating leases are as follows:
| | $ | |
|---|---|---|
| 2004 | 1,094 | |
| 2005 | 727 | |
| 2006 | 222 | |
| 2007 | 44 | |
| 2008 | 44 | |
| 2,131 |
- b)
- Contingencies
The Company entered into an agreement with Nordmark Arzneimittel GmbH & Co to create a joint venture to develop patent-protected novel enzyme preparations. Under the terms of this agreement, the Company agreed to contribute up to a cumulative amount of $1,500,000 to the joint venture. As at September 30, 2003, a total amount of $100,000 has been contributed.
- c)
- Milestone payments
The subsidiary Axcan Scandipharm is a party to several legal proceedings related to the product line it markets under the name ULTRASE. Lawsuits have been filed and claims have been asserted against Axcan Scandipharm and certain other companies, including the enzyme manufacturer, stemming from allegations that, among other things, Axcan Scandipharm's enzyme products caused colonic strictures. Axcan Scandipharm has been named as a defendant in 12 product liability lawsuits. Of the 12 lawsuits to date, Axcan Scandipharm was dismissed from one, nonsuited in another and settled ten. At this time, it is difficult to predict the number of potential cases and because of the young age of the patients involved, Axcan Scandipharm's product liability exposure for this issue in the United States will remain for a number of years. Axcan Scandipharm's insurance carriers have defended the lawsuits to date and Axcan expects them to continue to defend Axcan Scandipharm (to the extent of its product liability insurance) should lawsuits be filed in the future.
In addition, the enzyme manufacturer and certain other companies have claimed a right to recover amounts paid defending and settling these claims as well as a declaration that Axcan Scandipharm must provide indemnification against future claims. This lawsuit is based on contractual and common law indemnity issues and the parties have agreed to settle their dispute through binding arbitration. The arbitration has commenced and the plaintiffs allege that the amount at issue may be in excess of $10,000,000. Axcan Scandipharm denies that such reimbursement is owed and has also responded with counterclaims against the plaintiffs.
As at September 30, 2003 and 2002, the Company has recorded reserves in the amount of approximately $2,900,000 to cover any future liabilities in connection with the indemnification claims and the lawsuits discussed above that may not be covered by, or exceed, applicable insurance proceeds. While the Company believes that the insurance coverage and provisions taken to date are adequate, an adverse determination of any such claims or of any future claims could exceed insurance coverage and amounts currently accrued.
- d)
- Royalties
The agreements with QLT PhotoTherapeutics Inc. ("QLT") relating to the purchase of PHOTOFRIN provided for milestone payments to be made by Axcan to QLT that could reach a maximum of CDN$20,000,000 upon receipt of certain regulatory approvals for specific or additional indications for PHOTOFRIN or other conditions. Each milestone payment shall be made at the option of the Company either in cash or in Series B preferred shares or in a combination of cash and preferred shares provided that at least one-half of the milestone payable shall be paid in cash. During the years 2003 and 2000, CDN$5,000,000 and CDN$5,000,000 (U.S. $3,646,973 and U.S. $3,378,378) was paid by Axcan in cash upon receipt of regulatory approval.
The agreement to acquire the exclusive licence for North America, the European Union and Latin America to develop, manufacture and market ITAX provided for milestone payments for an amount of $20,000,000 upon regulatory submission and an amount of $45,000,000 upon regulatory approval. The Company will also pay royalties of 9% of net sales from the date of first commercial sale until the expiration of the patent and 6% for ten years thereafter.
Nets sales of certain products of the Company are subject to royalties payable to unrelated third parties.
U.S. GAAP 55
- e)
- Licensing
In particular, the Company must pay a 5% royalty on net sales of products covered under two agreements for the exclusive rights to market ULTRASE and ADEKs through August 5, 2005, in the case of ADEKs.
Axcan has to pay 5% of worldwide sales of PHOTOFRIN with a maximum of $500,000 per year and a maximum total aggregate of $3,108,245 until December 2007. Until September 30, 2003, an amount of $1,263,091 has been accounted for ($983,448 in 2002 and $522,820 in 2001). Axcan also has to pay 5% of net sales of PHOTOFRIN for use in the therapeutic treatment of cancer and 2% of net sales for other uses until December 2009.
Royalties amounting to $4,387,092, $3,731,113 and $3,711,561 respectively for years ended September 30, 2003, 2002 and 2001 were charged to operations.
- f)
- Employee benefit plan
During the year 2000, Axcan entered into a new licensing agreement to market a new generation of pancrelipase minitablets. As at September 30, 2003, the Company paid $3,500,000 in development fees, which is the total amount of development fees the Company agreed to pay. Axcan will pay royalties of 6% on the first $30,000,000 of annual sales and 5% on annual sales in excess of $30,000,000 subject to minimum royalty payments of $750,000, $1,000,000 and $1,500,000 in the first three years of the agreement, respectively.
Axcan also entered into a licensing agreement with the Children's Hospital Research Foundation ("CHRF") for a series of sulfated derivatives of ursodeoxycholic acid compounds ("SUDCA"). Axcan had paid $589,000 in cash; the Company will also pay milestones for a maximum amount of $425,000 when SUDCA will be validated and a bonus when certain conditions are met; finally, Axcan will pay royalties based on sales.
In May 2002, the Company signed a co-development and licensing agreement with NicOx S.A. ("NicOx") for NCX-1000, a nitric oxide-donating ursodiol derivative, for the treatment of chronic liver diseases including portal hypertension and Hepatitis "C". Under the terms of this agreement, the Company has obtained from NicOx an exclusive license to commercialize NCX-1000 in Canada and Poland as well as an option to acquire the same exclusive rights for the United States market. The Company and NicOx will share the cost of the future development of NCX-1000 jointly through the completion of Phase II clinical studies. The Company will thereafter conduct the required Phase III clinical studies and be responsible for regulatory filings in the exclusively licensed territories. The Company will pay NicOx options or milestone payments totalling $17,000,000 at various stages of development. As at September 30, 2003, an amount of $2,000,000 has been paid. The Company also agreed to pay royalties of up to 12% on net sales of the product.
On October 10, 2002, the Company acquired from Gentium S.p.A., an Italian company, exclusive rights to develop and market in North America, a patented 4-gram rectal gel formulation of mesalamine (5-ASA) for the treatment of active distal ulcerative colitis. In return the Company will make milestone payments totalling approximately $1,500,000, the majority of which will be paid upon approval in the United States. As at September 30, 2003, an amount of approximately $200,000 has been paid. The Company will also pay a royalty of 4% on net sales for a ten-year period from product's launch.
On July 22, 2003, the Company acquired from Merz Pharmaceutical GmbH ("Merz") an exclusive license to use, develop and submit for approval injectable and oral granule formulations containing L-ornithine and L-aspartate. In consideration of the rights and licenses granted by Merz under this agreement, the Company shall pay a royalty of 6% of net sales or 4% of net sales if the Company develops any patentable invention or improvement and Merz incorporates such invention or improvement into its products.
A subsidiary of the Company has a defined contribution plan (the "Plan") for its U.S. employees. Participation is available to substantially all U.S. employees. Employees may contribute up to 15% of their gross pay and up to limits set by the U.S. Internal Revenue Service. During the year, the Board of Directors approved and the Company charged to operations a contribution to the Plan totalling $319,871 ($224,275 in 2002 and $231,629 in 2001).
56 U.S. GAAP
23. SUMMARY OF DIFFERENCES BETWEEN GENERALLY ACCEPTED ACCOUNTING PRINCIPLES IN THE UNITED STATES AND IN CANADA
The consolidated financial statements have been prepared in accordance with U.S. GAAP which, in the case of the Company, conform in all material respects with Canadian GAAP, except as set forth below:
| | 2003 $ | 2002 $ | 2001 $ | |||||
|---|---|---|---|---|---|---|---|---|
| Earnings adjustments: | ||||||||
| Net earnings in accordance with U.S. GAAP | 19,925 | 21,188 | 11,825 | |||||
| Prepaid advertising costs(1) | — | (457 | ) | (404 | ) | |||
| Acquired in-process research(2) | 12,000 | — | — | |||||
| Amortization of goodwill(3) | — | — | (100 | ) | ||||
| Amortization of new product acquisition costs(2) | (54 | ) | (54 | ) | (54 | ) | ||
| Implicit interest on convertible debt(4) | (2,292 | ) | — | — | ||||
| Income tax impact of the above adjustments | (962 | ) | 191 | 205 | ||||
| Net earnings in accordance with Canadian GAAP | 28,617 | 20,868 | 11,472 | |||||
Earnings per share in accordance with Canadian GAAP | ||||||||
| Basic | 0.64 | 0.50 | 0.31 | |||||
| Diluted | 0.63 | 0.49 | 0.31 | |||||
2003 | 2002 | |||||||||
|---|---|---|---|---|---|---|---|---|---|---|
| | U.S. GAAP $ | Canadian GAAP $ | U.S. GAAP $ | Canadian GAAP $ | ||||||
| Balance sheet adjustments: | ||||||||||
| Current assets (6) | 225,035 | 225,203 | 133,858 | 134,048 | ||||||
| Investments (6) | 1,002 | 775 | 2,681 | 2,348 | ||||||
| Property, plant and equipment (6) | 20,331 | 20,351 | 20,086 | 20,105 | ||||||
| Intangible assets (2) | 265,423 | 277,837 | 180,085 | 180,553 | ||||||
| Goodwill (3)(6) | 27,550 | 29,342 | 27,550 | 29,342 | ||||||
| Deferred debt issue expenses | 4,233 | 4,233 | 290 | 290 | ||||||
| Deferred income tax asset | 1,775 | 1,775 | 2,456 | 2,456 | ||||||
| Current liabilities (6) | 50,261 | 50,634 | 30,408 | 30,681 | ||||||
| Long-term debt (4)(7) | 129,474 | 107,527 | 7,267 | 4,563 | ||||||
| Deferred income tax liability (2)(3) | 34,603 | 35,742 | 34,212 | 34,389 | ||||||
| Non-controlling interest | — | — | 332 | 332 | ||||||
| Shareholders' equity | ||||||||||
| Equity component of purchase price (7) | — | — | — | 2,704 | ||||||
| Equity component of convertible debt (4) | — | 24,239 | — | — | ||||||
| Capital stock (5)(8) | 255,743 | 262,388 | 254,640 | 261,285 | ||||||
| Retained earnings (2)(3)(4)(5)(8) | 63,634 | 63,211 | 43,709 | 34,594 | ||||||
| Accumulated foreign currency translation adjustments (8) | 11,634 | 15,775 | (3,562 | ) | 594 | |||||
U.S. GAAP 57
- (1)
- Under U.S. GAAP, scientific symposium costs are included in operations in the year when they are incurred. Under Canadian GAAP, these costs were deferred and amortized over a two-year period until September 30, 2001.
- (2)
- Under U.S. GAAP, acquired in-process research are included in operations as at the date of acquisition as no alternative future use is established. Under Canadian GAAP, the acquired in-process research is deferred and amortized from the date of commencement of commercial production.
- (3)
- Under U.S. GAAP, some financial expenses were recorded when the minority interest in Axcan Scandipharm was purchased. Under Canadian GAAP, these financial expenses were included in goodwill and amortized until the new standard was adopted on October 1, 2001.
- (4)
- Under U.S. GAAP, the entire convertible subordinated notes are included in long-term debt. Under Canadian GAAP, the estimated value of the right of conversion is included in the shareholders' equity as equity component of convertible debt and implicit interest is charged to income each year and accounted for in the balance sheet as an accretion to the liability component.
- (5)
- Under U.S. GAAP, share issuance expenses are deducted from the consideration received. The net amount is applied against the capital stock account. Under Canadian GAAP, these expenses are charged directly to retained earnings.
- (6)
- Under U.S. GAAP, the investments in joint ventures are accounted for by the equity method. Under Canadian GAAP, these investments are accounted for using the proportionate consolidation method. This difference does not impact operations or shareholders' equity.
- (7)
- Under U.S. GAAP, the balance of purchase price payable in cash or in common shares, at Axcan's sole discretion, is presented as a long-term debt. Under Canadian GAAP, this amount is presented in the shareholders' equity.
- (8)
- Effective October 1, 1999, the Company changed its measurement and reporting currency from the Canadian dollar to the U.S. dollar. Under U.S. GAAP, comparative figures must be restated as if the change in measurement and reporting currency had been applied retroactively. Under Canadian GAAP, comparative figures are presented using the translation of convenience method. At October 1, 1999, the change in measurement and reporting currency presented in accordance with Canadian GAAP resulted in an increase in cumulative translation adjustment balance of $4,156,000, and a decrease in capital stock balance of $3,584,000 and retained earnings balance of $572,000.
- (9)
- Under U.S. GAAP, the research and development tax credits are applied against income taxes. Under Canadian GAAP, these tax credits would be applied against research and development expenses. This difference had no impact on the consolidated net income.
- (10)
- Under U.S. GAAP, securities available for sale are recorded at their fair market value; unrealized gains or losses are recorded separately in shareholders' equity. Under Canadian GAAP, short-term investments are recorded at cost. As at September 30, 2003, there is no material unrealized gain or loss.
24. SUBSEQUENT EVENT
On October 8, 2003, the Company signed an agreement to acquire the rights to a group of products from Aventis Holding Inc. Under the terms of this agreement, the Company will acquire CARAFATE and BENTYL for the U.S. market and SULCRATE, BENTYLOL and PROCTOSEDYL for the Canadian market for a cash purchase price of $145,000,000. These products will be classified as an intangible asset with finite life and will be amortized on a straight-line basis.
58 U.S. GAAP
CONSOLIDATEDFINANCIAL STATEMENTS
Canadian GAAP
| MANAGEMENT'S REPORT | 60 | |
| AUDITORS' REPORT | 61 | |
| FINANCIAL STATEMENTS | ||
| CONSOLIDATED BALANCE SHEETS | 62 | |
| CONSOLIDATED EARNINGS | 63 | |
| CONSOLIDATED RETAINED EARNINGS | 63 | |
| CONSOLIDATED CASH FLOWS | 64 | |
| NOTES TO CONSOLIDATED FINANCIAL STATEMENTS | 65 |
The consolidated financial statements of Axcan Pharma Inc. and the other financial information included in this annual report are the responsibility of the Company's management.
These consolidated financial statements and the other financial information have been prepared by management in accordance with Canadian generally accepted accounting principles. This responsibility includes the selection of appropriate accounting principles and methods in the circumstances and the use of careful judgement in establishing reasonable accounting estimates.
Management maintains internal control systems designed among other things, to provide reasonable assurance that the Company's assets are adequately safeguarded and that the accounting records are a reasonable basis to prepare relevant and reliable financial information.
The Audit Committee is composed solely of external directors. This Committee meets with the external auditors and management to discuss matters relating to the audit, internal control and financial information. The Committee also reviews the consolidated quarterly and annual financial statements.
These consolidated financial statements have been audited by Raymond Chabot Grant Thornton, Chartered Accountants, whose report indicating the scope of their audit and their opinion on the consolidated financial statements is presented on the right.
The Board of Directors has approved the Company's financial statements on the recommendation of the Audit Committee.
The Company decided, for the year beginning October 1, 2002, to switch from Canadian generally accepted accounting principles to generally accepted accounting principles in the United States of America as its primary reporting convention. Consolidated financial statements in accordance with generally accepted accounting principles in the United States of America have been also prepared.
| signed | signed | signed | ||
| Léon F. Gosselin | David W. Mims | Jean Vézina | ||
| President and Chief Executive Officer | Executive Vice President and Chief Operating Officer | Vice President, Finance and Chief Financial Officer | ||
| Mont-Saint-Hilaire, Quebec, Canada November 11, 2003 |
60 Canadian GAAP
To the Shareholders of Axcan Pharma Inc.
We have audited the consolidated balance sheets of Axcan Pharma Inc. as at September 30, 2003, and 2002, and the consolidated statements of earnings, retained earnings and cash flows for each of the years in the three-year period ended September 30, 2003. These financial statements are the responsibility of the Company's management. Our responsibility is to express an opinion on these financial statements based on our audits.
We conducted our audits in accordance with generally accepted auditing standards in Canada and with auditing standards generally accepted in the United States of America. Those standards require that we plan and perform an audit to obtain reasonable assurance whether the financial statements are free of material misstatement. An audit includes examining, on a test basis, evidence supporting the amounts and disclosures in the financial statements. An audit also includes assessing the accounting principles used and significant estimates made by management, as well as evaluating the overall financial statement presentation.
In our opinion, these consolidated financial statements present fairly, in all material respects, the financial position of the Company as at September 30, 2003, and 2002, and the results of its operations and its cash flows for each of the years in the three-year period ended September 30, 2003, in accordance with generally accepted accounting principles in Canada.
On November 11, 2003, we reported separately to the shareholders of Axcan Pharma Inc. on the consolidated financial statements for the same periods, prepared in accordance with generally accepted accounting principles in the United States of America.
signed
General Partnership
Chartered Accountants
Montreal, Quebec, Canada
November 11, 2003
Canadian GAAP 61
| | September 30 | ||||
|---|---|---|---|---|---|
| | 2003 | 2002 | |||
| | $ | $ | |||
| | (in thousands of U.S. dollars) | ||||
| Assets | |||||
| Current assets | |||||
| Cash and cash equivalents | 37,886 | 20,005 | |||
| Short-term investments, at cost (Note 5) | 133,112 | 60,740 | |||
| Accounts receivable (Note 6) | 19,665 | 24,521 | |||
| Income taxes receivable | 5,315 | 805 | |||
| Inventories (Note 7) | 20,163 | 19,747 | |||
| Prepaid expenses and deposits | 2,848 | 1,895 | |||
| Future income taxes (Note 8) | 6,214 | 6,335 | |||
| Total current assets | 225,203 | 134,048 | |||
| Investments (Note 9) | 775 | 2,348 | |||
| Property, plant and equipment (Note 10) | 20,351 | 20,105 | |||
| Intangible assets (Note 11) | 277,837 | 180,553 | |||
| Goodwill (Note 12) | 29,342 | 29,342 | |||
| Deferred debt issue expenses, at amortized cost | 4,233 | 290 | |||
| Future income taxes (Note 8) | 1,775 | 2,456 | |||
| 559,516 | 369,142 | ||||
Liabilities | |||||
| Current liabilities | |||||
| Accounts payable and accrued liabilities (Note 14) | 43,791 | 27,499 | |||
| Income taxes payable | 4,821 | 1,577 | |||
| Instalments on long-term debt | 1,528 | 1,336 | |||
| Future income taxes (Note 8) | 494 | 269 | |||
| Total current liabilities | 50,634 | 30,681 | |||
| Long-term debt (Note 15) | 107,527 | 4,563 | |||
| Future income taxes (Note 8) | 35,742 | 34,389 | |||
| Non-controlling interest | — | 332 | |||
| 193,903 | 69,965 | ||||
Shareholders' Equity | |||||
| Equity component of convertible debt (Note 16) | 24,239 | — | |||
| Equity component of purchase price (Note 17) | — | 2,704 | |||
| Capital stock (Note 18) | 262,388 | 261,285 | |||
| Retained earnings | 63,211 | 34,594 | |||
| Accumulated foreign currency translation adjustments | 15,775 | 594 | |||
| 365,613 | 299,177 | ||||
| 559,516 | 369,142 | ||||
The accompanying notes are an integral part of the consolidated financial statements.
On behalf of the Board,
| signed | signed | |
| Léon F. Gosselin | Dr. Claude Sauriol | |
| Director | Director |
62 Canadian GAAP
| | Years Ended September 30 | |||||||
|---|---|---|---|---|---|---|---|---|
| | 2003 | 2002 | 2001 | |||||
| | $ | $ | $ | |||||
| | (in thousands of U.S. dollars, except share related data) | |||||||
| Revenue | 179,542 | 133,175 | 104,549 | |||||
| Cost of goods sold | 44,474 | 34,145 | 26,540 | |||||
| Selling and administrative expenses | 63,461 | 50,522 | 39,101 | |||||
| Research and development expenses | 11,638 | 8,025 | 6,129 | |||||
| Depreciation and amortization | 8,127 | 7,613 | 12,032 | |||||
| 127,700 | 100,305 | 83,802 | ||||||
| Operating income | 51,842 | 32,870 | 20,747 | |||||
| Financial expenses | 6,590 | 906 | 2,875 | |||||
| Interest income | (1,642 | ) | (912 | ) | (981 | ) | ||
| Loss on foreign currency | 128 | 266 | 653 | |||||
| Takeover-bid expenses | 3,697 | — | — | |||||
| 8,773 | 260 | 2,547 | ||||||
| Earnings before income taxes | 43,069 | 32,610 | 18,200 | |||||
| Income taxes (Note 8) | 14,452 | 11,742 | 6,728 | |||||
| Net earnings | 28,617 | 20,868 | 11,472 | |||||
| Earnings per common share | ||||||||
| Basic | 0.64 | 0.50 | 0.31 | |||||
| Diluted | 0.63 | 0.49 | 0.31 | |||||
| Weighted average number of common shares | ||||||||
| Basic | 44,914,944 | 41,664,510 | 35,832,198 | |||||
| Diluted | 45,607,992 | 42,527,500 | 36,531,052 | |||||
The accompanying notes are an integral part of the consolidated financial statements.
| | Years Ended September 30 | ||||||
|---|---|---|---|---|---|---|---|
| | 2003 | 2002 | 2001 | ||||
| | $ | $ | $ | ||||
| | (in thousands of U.S. dollars) | ||||||
| Balance, beginning of year | 34,594 | 16,914 | 7,195 | ||||
| Net earnings | 28,617 | 20,868 | 11,472 | ||||
| Common share issue expenses, net of future income taxes in the amount of $1,649 for 2002 ($881 for 2001) | — | (3,188 | ) | (1,452 | ) | ||
| Cumulative dividends on preferred shares | — | — | (301 | ) | |||
| Balance, end of year | 63,211 | 34,594 | 16,914 | ||||
The accompanying notes are an integral part of the consolidated financial statements.
Canadian GAAP 63
| | Years Ended September 30 | |||||||
|---|---|---|---|---|---|---|---|---|
| | 2003 | 2002 | 2001 | |||||
| | $ | $ | $ | |||||
| | (in thousands of U.S. dollars) | |||||||
| Operations | ||||||||
| Net earnings | 28,617 | 20,868 | 11,472 | |||||
| Non-cash items | ||||||||
| Implicit interest on convertible debt | 2,292 | — | — | |||||
| Non-controlling interest | (103 | ) | (363 | ) | (249 | ) | ||
| Amortization of deferred debt issue expenses | 646 | 247 | — | |||||
| Other depreciation and amortization | 8,127 | 7,613 | 12,032 | |||||
| Loss (gain) on disposal of assets | 1,130 | — | (141 | ) | ||||
| Foreign currency fluctuation | 305 | 507 | 102 | |||||
| Future income taxes | 2,810 | 2,187 | 2,515 | |||||
| Investment tax credits | — | — | (746 | ) | ||||
| Changes in working capital items (Note 20) | 12,764 | 4,266 | (8,580 | ) | ||||
| Cash flows from operating activities | 56,588 | 35,325 | 16,405 | |||||
Financing | ||||||||
| Long-term debt | 101,825 | 1,506 | — | |||||
| Repayment of long-term debt | (1,979 | ) | (3,267 | ) | (47,075 | ) | ||
| Non-controlling interest | — | — | 388 | |||||
| Equity component of convertible debt | 24,239 | — | — | |||||
| Repayment of balance of purchase price | (2,704 | ) | — | — | ||||
| Deferred debt issue expenses | (4,589 | ) | (537 | ) | — | |||
| Issue of shares | 1,103 | 69,876 | 33,302 | |||||
| Share issue expenses | — | (4,837 | ) | (2,333 | ) | |||
| Cash flows from financing activities | 117,895 | 62,741 | (15,718 | ) | ||||
Investment | ||||||||
| Acquisition of short-term investments | (133,112 | ) | (60,740 | ) | (48,552 | ) | ||
| Disposal of short-term investments | 60,740 | — | 58,339 | |||||
| Acquisition of investments | — | (16 | ) | (961 | ) | |||
| Disposal of investments | 637 | 385 | 186 | |||||
| Acquisition of property, plant and equipment | (4,302 | ) | (2,873 | ) | (2,391 | ) | ||
| Acquisition of intangible assets | (81,093 | ) | (1,561 | ) | (1,892 | ) | ||
| Other | — | 1,363 | — | |||||
| Net cash used for business acquisitions (Note 4) | — | (31,302 | ) | — | ||||
| Cash flows from investment activities | (157,130 | ) | (94,744 | ) | 4,729 | |||
| Foreign exchange gain (loss) on cash held in foreign currencies | 528 | 142 | (10 | ) | ||||
| Net increase in cash and cash equivalents | 17,881 | 3,464 | 5,406 | |||||
| Cash and cash equivalents, beginning of year | 20,005 | 16,541 | 11,135 | |||||
| Cash and cash equivalents, end of year | 37,886 | 20,005 | 16,541 | |||||
The accompanying notes are an integral part of the consolidated financial statements.
64 Canadian GAAP
NOTES TO CONSOLIDATEDFINANCIAL STATEMENTS
CANADIAN GAAP
September 30
Amounts in the tables are stated in thousands of U.S. dollars, except share related data.
1. GOVERNING STATUTES AND NATURE OF OPERATIONS
The Company, incorporated under the Canada Business Corporations Act, is involved in the research, development, production and distribution of pharmaceutical products, mainly in the field of gastroenterology.
2. CHANGES IN ACCOUNTING POLICIES
a) Year ended September 30, 2003
Basis of presentation
The Company decided, for the year beginning October 1, 2002, to switch from Canadian generally accepted accounting principles ("GAAP") to the United States of America ("U.S.") GAAP as its primary reporting convention. The change in GAAP was influenced by the Company's desire to better meet the needs of its shareholders by applying accounting rules that are consistent with the majority of its customers and peer companies. For regulatory authorities purposes, the Company continued to prepare and to file the present consolidated financial statements prepared in U.S. dollars and in accordance with Canadian GAAP.
Guarantor's Accounting and Disclosure Requirements for Guarantees
In February 2003, the Canadian Institute of Chartered Accountants ("CICA") issued Accounting Guidelines ("AcG") 14 "Guarantor's Accounting and Disclosure Requirements for Guarantees." AcG-14 requires guarantors to disclose certain information for guarantees outstanding at the end of the reporting period. At adoption, AcG-14 did not have any impact on the Company's consolidated financial statements.
Impairment or Disposal of Long-lived Assets
The CICA issued new Handbook Section 3063 "Impairment of Long-lived Assets" and revised Section 3475 "Disposal of Long-lived Assets and Discontinued Operations". These two sections provide guidance on how assets are grouped when testing for and measuring impairment and propose a two-step process for first determining when an impairment loss is recognized and then measuring that loss. The adoption of these new standards had no impact on the consolidated financial statements.
Stock-based compensation
On October 1, 2002, the Company adopted retroactively the recommendations of the CICA Handbook, Section 3870, "Stock-based Compensation and Other Stock-based Payments." This Section defines notably recognition, measurement and disclosure standards for stock-based compensation to employees. These standards define a fair value-based method of accounting for stock-based employee compensation plans. Under this method, compensation cost should be measured at the grant date based on the fair value of the award and should be recognized over the related service period. An entity that does not adopt the fair value method of accounting for its awards granted to employees is required to include in its financial statements pro-forma disclosures of net earnings and earnings per share as if the fair value method of accounting had been applied. The supplementary information required by this new Section is presented in note 25.
b) Year ended September 30, 2002
Business combination, intangible assets and goodwill
In 2001, the CICA approved new standards modifying the method of accounting for business combinations entered into after June 30, 2001, and addressed the accounting for goodwill and other intangible assets. The new standards on goodwill and other intangible assets should be applied for fiscal years beginning on or after January 1, 2002. The Company has elected to early adopt and, since October 1, 2001, it no longer amortizes its goodwill and trademarks with indefinite life, but rather, evaluates goodwill and trademarks with indefinite life for impairment annually. Intangible assets with finite life will continue to be amortized over their estimated useful lives. As required by the standards, the Company completed the impairment tests and did not record any impairments.
Canadian GAAP 65
The following table presents the matching of net earnings and basic earnings per share as reported for the prior years and corresponding information recalculated as a result of applying the new standards on intangible assets and goodwill:
| | 2003 | 2002 | 2001 | |||||
|---|---|---|---|---|---|---|---|---|
| | $ | $ | $ | |||||
| Net earnings | 28,617 | 20,868 | 11,472 | |||||
| Add: | ||||||||
| Amortization of goodwill | — | — | 1,400 | |||||
| Amortization of intangible assets with indefinite life | — | — | 3,048 | |||||
| Adjusted net earnings | 28,617 | 20,868 | 15,920 | |||||
| Basic earnings per share | ||||||||
| Net earnings per share | 0.64 | 0.50 | 0.31 | |||||
| Add: | ||||||||
| Amortization of goodwill | — | — | 0.04 | |||||
| Amortization of intangible assets with indefinite life | — | — | 0.09 | |||||
| Adjusted net earnings per share | 0.64 | 0.50 | 0.44 | |||||
Scientific symposium costs
In 2002, the Company elected to expense its scientific symposium costs in the fiscal year they are incurred. In the previous years, these costs were deferred and amortized over a two-year period. This change in accounting policy has led to an increase in selling and administrative expenses of $457,000 during the year 2002.
c) Standards applicable for the year 2004
In January 2003, the CICA issued AcG-15,"Consolidation of Variable Interest Entities". AcG-15 requires certain variable interest entities, or VIEs, to be consolidated by the primary beneficiary of the entity if the equity investors in the entity do not have the characteristics of a controlling financial interest or do not have sufficient equity at risk for the entity to finance its activities without additional subordinated financial support from other parties. The Company currently has no contractual relationship or other business relationship with a variable interest entity and therefore the adoption of AcG-15 is not expected to have any effect on the Company's consolidated balance sheets or statements of earnings, retained earnings and cash flows.
66 Canadian GAAP
3. ACCOUNTING POLICIES
Basis of presentation
The consolidated financial statements are expressed in U.S. dollars and were prepared in accordance with Canadian GAAP. Consolidated financial statements prepared in U.S. dollars and in accordance with U.S. GAAP are available to the shareholders and filed with various regulatory authorities.
Accounting estimates
The preparation of financial statements in accordance with generally accepted accounting principles requires management to make estimates and assumptions that affect the recorded amounts of assets and liabilities and disclosure of contingent assets and liabilities as of the date of the financial statements and recognized amounts of revenues and expenses during the year. Significant estimates and assumptions made by management include allowances for accounts receivable and inventories, reserves for product returns, rebates and chargebacks, the classification of intangible assets between finite life and indefinite life, the useful lives of long-lived assets, the expected cash flows used in evaluating long-lived assets, goodwill and investments for impairment, contingency provisions, the realizability of future income tax assets and the allocation of the purchase price of acquired assets and businesses. Actual results could differ from those estimates.
Principles of consolidation
These financial statements include the accounts of the Company and its subsidiaries, the most important being Axcan Scandipharm Inc., Axcan Pharma U.S. Inc. and Axcan Pharma S.A. (the result of the merger of Laboratoires Entéris S.A.S. with Laboratoire du Lactéol du Docteur Boucard S.A.). The Company's interest in the joint ventures is accounted for by the proportionate consolidation method.
Revenue recognition
Revenue is recognized when the product is shipped to the Company's customers, provided the Company has not retained any significant risks of ownership or future obligations with respect to the product shipped. Revenue from product sales is recognized net of sales discounts, allowances, returns, rebates and chargebacks. In certain circumstances, returns or exchange of products are allowed under the Company's policy and provisions are maintained accordingly. Amounts received from customers as prepayments for products to be shipped in the future are reported as deferred revenue.
Cash and cash equivalents
The Company includes in cash and cash equivalents cash and all highly liquid short-term investments with initial maturities of three months or less.
Accounts receivable
The majority of the Company's accounts receivable are due from companies in the pharmaceutical industry. Credit is extended based on evaluation of a customers' financial condition and, generally, collateral is not required. Accounts receivable are due within 30 days and are stated at amounts due from customers net of an allowance for doubtful accounts. Accounts outstanding longer than the contractual payment terms are considered past due. The Company determines its allowance by considering a number of factors, including the length of time trade accounts receivable are past due, the Company's previous loss history, the customer's current ability to pay its obligation to the Company, and the condition of the general economy and the industry as a whole. The Company writes off accounts receivable when they become uncollectible, and payments subsequently received on such receivables are credited to bad debt expenses.
Inventory valuation
Inventories of raw materials and packaging material are valued at the lower of cost and replacement cost. Inventories of work in progress and finished goods are valued at the lower of cost and net realizable value. Cost is determined by the first in, first out method.
Research and development
Research and development expenses are charged to earnings in the year they are incurred, net of related tax credits.
Canadian GAAP 67
Depreciation and amortization
Property, plant and equipment and intangible assets with a finite life are depreciated or amortized over their estimated useful lives according to the following methods and annual rates:
| | Methods | Rates | ||
|---|---|---|---|---|
| Buildings | Diminishing balance and straight-line | 4 to 10% | ||
| Furniture and equipment | Diminishing balance and straight-line | 10 to 20% | ||
| Computer equipment | Diminishing balance and straight-line | 20 to 50% | ||
| Automotive equipment | Diminishing balance and straight-line | 20 to 25% | ||
| Leasehold and building improvements | Straight-line | 10 to 20% | ||
| Trademarks, trademark licenses and manufacturing rights | Straight-line | 4 to 15% |
Beginning October 1, 2001, goodwill is no longer amortized, but instead tested for impairment at least annually. Prior to October 1, 2001, goodwill was amortized on a straight-line basis over periods of 15 or 20 years.
Beginning October 1, 2001, intangible assets with indefinite life are no longer amortized, but instead tested for impairment at least annually. Prior to October 1, 2001, intangible assets with indefinite life were amortized on a straight-line basis over periods of 15 to 25 years.
Management evaluates the value of the unamortized portion of goodwill and intangible assets annually. Should there be a permanent impairment in value or if the unamortized balance exceeds recoverable amounts, a write-down will be recognized for the current year to reflect the assets at fair value. To date, the Company has not recognized any permanent impairment in value.
Deferred debt issue expenses are amortized on a straight-line basis over the term of the debts until 2008.
Income taxes
Income taxes are calculated based on the liability method. Under this method, future income tax assets and liabilities are recognized as estimated taxes for recovery or settlement arising from the recovery or settlement of assets and liabilities recorded at their financial statement carrying amounts. Future income tax assets and liabilities are measured based on enacted or substantively enacted tax rates and laws at the date of the financial statements for the years in which the temporary differences are expected to reverse. Adjustments to the future income tax asset and liability balances are recognized in earnings as they occur.
Stock options
The Company has granted stock options as described in Note 18. Canadian GAAP establish a fair value-based method of accounting for stock-based compensation plans, but also permit an election to use an intrinsic value-based method with disclosure on a pro-forma basis for net earnings and earnings per share. The Company elected to provide such pro-forma disclosure. Any consideration paid by employees on the exercise of stock options is credited to capital stock.
Foreign currency translation
The current rate method of translation of foreign currencies is followed for subsidiaries, or joint ventures considered financially and operationally self-sustaining. Therefore, all gains and losses arising from the translation of the financial statements of subsidiaries or joint ventures are deferred in an "Accumulated foreign currency translation adjustments"account under "Shareholders' equity".
For the operations in Canada and the United States of America, monetary assets and liabilities in currency other than U.S. dollars are translated into U.S. dollars, the functional currency of the Company, at the exchange rate in effect at the balance sheet date whereas other assets and liabilities are translated at exchange rates in effect at transaction dates. Revenue and operating expenses in foreign currency are translated at the average rates in effect during the year, except for depreciation and amortization, translated at historical rates. Gains and losses are included in earnings for the year.
Earnings per share
Basic earnings per share is calculated using the weighted average number of common shares outstanding during the year. The treasury stock method is to be used for determining the dilution effect of options. The dilutive effect of convertible subordinated notes, balance of purchase price payable in shares and convertible preferred shares is determined using the "if-converted"method.
68 Canadian GAAP
4. ACQUISITIONS
a) Business acquisitions
September 30, 2002
On November 7, 2001, the Company acquired all the outstanding shares of Laboratoires Entéris S.A.S., a company specializing in the distribution of gastrointestinal products in France. The acquisition cost, including transaction expenses, amounting to $23,000,840, was paid in cash.
On April 17, 2002, the Company acquired all the outstanding shares of Laboratoire du Lactéol du Docteur Boucard S.A. and certain related assets. This company is specialized in the manufacturing and distribution of gastrointestinal products in France. The acquisition cost, including transaction expenses, amounting to $13,137,613, was paid with the issuance of 365,532 common shares of the Company and $8,378,728 in cash. The price of the common shares issued was determined on the basis of a twenty-day trading average closing price.
These two acquisitions will allow the Company to establish operations in France for the development of markets in all of Western Europe and add two products to the Company's product line.
The following table shows the breakdown of these acquisitions:
| | $ | |||
|---|---|---|---|---|
| Net assets acquired at the attributed values | ||||
| Assets | ||||
| Cash and cash equivalents | 77 | |||
| Other working capital items | 7,323 | |||
| Property, plant and equipment | 9,433 | |||
| Intangible assets with indefinite life | 29,175 | |||
| Goodwill | 9,632 | |||
| Future income taxes | 656 | |||
| Other assets | 1,363 | |||
| 57,659 | ||||
| Liabilities | ||||
| Accounts payable | 8,215 | |||
| Long-term debt | 6,922 | |||
| Future income taxes | 6,384 | |||
| 21,521 | ||||
| 36,138 | ||||
| Consideration | ||||
| Cash | 31,379 | |||
| Common shares issued | 4,759 | |||
| 36,138 | ||||
| Net cash used for the acquisitions | 31,302 | |||
Canadian GAAP 69
The acquisition cost has been allocated to the assets and liabilities according to their estimated fair value at the acquisition dates. The operating results relating to these acquisitions have been included in the consolidated financial statements from the acquisition dates.
Using the assumption that the effective date of the business acquisitions is October 1, 2000, the consolidated pro-forma results of operations of the Company would have been as follows for the years ended September 30:
| | 2002 | 2001 | ||
|---|---|---|---|---|
| | (unaudited) $ | (unaudited) $ | ||
| Revenue | 140,983 | 125,524 | ||
| Net earnings | 20,802 | 11,136 | ||
| Net earnings per share | 0.50 | 0.30 |
b) Product acquisitions
On August 29,2003, the Company acquired an exclusive license for North America, the European Union and Latin America, from Abbott Laboratories ("Abbott") to develop, manufacture and market ITAX, a patented gastroprokinetic drug. Under the terms of this license agreement, the Company paid $10,000,000 and assumed $2,000,000 in research contract liabilities.
On December 10, 2002, the Company acquired the rights to the Ursodiol 250 mg tablets DELURSAN for the French market, for a cash purchase price of 22,300,000 Euros ($22,800,000) from Aventis Pharma S.A.
On December 3, 2002, the Company acquired the worldwide rights to the PANZYTRAT enzyme product line from Abbott for a cash purchase price of $45,000,000. During the period of marketing authorizations transfer ("the interim period"), Abbott acts as an agent for the management of the product line sales. The interim period is for a maximum of 18 months. For the year ended September 30, 2003, the Company included in its revenues an amount of $9,463,645 representing the net sales from the product line less cost of goods sold and other related expenses. Net sales of the PANZYTRAT enzyme product line for the year ended September 30, 2003 were $14,255,979.
5. SHORT-TERM INVESTMENTS
As at September 30, 2003, short-term investments include short-term notes, mutual funds and debt securities. Four short-term notes (two in 2002) represent approximately 60% (47% in 2002) of the Company's total short-term investments. Interest rates on most of the short-term investments vary from 0.81% to 1.08% (1.52% to 1.66% in 2002).
6. ACCOUNTS RECEIVABLE
| | 2003 | 2002 | ||
|---|---|---|---|---|
| | $ | $ | ||
| Trade accounts, net of allowance for doubtful accounts of $613,000 ($403,000 in 2002) (a) | 16,676 | 23,859 | ||
| Investments receivable within one year | 1,102 | 142 | ||
| Taxes receivable | 1,479 | 329 | ||
| Other | 408 | 191 | ||
| 19,665 | 24,521 | |||
- (a)
- As at September 30, 2003, the accounts receivable include amounts receivable from two customers and one agent which represent approximately 44% (four customers for 60% in 2002) of the Company's total accounts receivable.
70 Canadian GAAP
7. INVENTORIES
| | 2003 | 2002 | ||
|---|---|---|---|---|
| | $ | $ | ||
| Raw materials and packaging material | 8,441 | 3,841 | ||
| Work in progress | 1,466 | 4,516 | ||
| Finished goods | 10,256 | 11,390 | ||
| 20,163 | 19,747 | |||
8. INCOME TAXES
The future income tax assets and liabilities result from differences between the tax value and book value of the following items:
| | 2003 | 2002 | |||
|---|---|---|---|---|---|
| | $ | $ | |||
| Short-term future income tax assets | |||||
| Inventories | 2,554 | 2,590 | |||
| Accounts payable and accrued liabilities | 2,558 | 2,586 | |||
| Contingency provisions | 1,102 | 1,159 | |||
| 6,214 | 6,335 | ||||
| Long-term future income tax assets | |||||
| Investments | 16 | 14 | |||
| Property, plant and equipment | — | 51 | |||
| Share issue expenses | 1,746 | 2,380 | |||
| Unused operating losses | 13 | 11 | |||
| 1,775 | 2,456 | ||||
| Short-term future income tax liabilities | |||||
| Accounts receivable | 318 | — | |||
| Prepaid expenses | 163 | 135 | |||
| Investments | 13 | 12 | |||
| Deferred gain | — | 122 | |||
| 494 | 269 | ||||
| Long-term future income tax liabilities | |||||
| Investments | — | 13 | |||
| Property, plant and equipment | 1,993 | 1,625 | |||
| Intangible assets | 32,940 | 31,452 | |||
| Goodwill | 682 | 682 | |||
| Research and development expenses | 127 | 617 | |||
| 35,742 | 34,389 | ||||
Canadian GAAP 71
Income taxes included in the statement of earnings are as follows:
| | 2003 | 2002 | 2001 | |||||
|---|---|---|---|---|---|---|---|---|
| | $ | $ | $ | |||||
| Current | 11,642 | 9,555 | 4,213 | |||||
| Future | ||||||||
| Creation and reversal of temporary differences | 3,640 | 2,043 | 746 | |||||
| Operating losses | — | — | 1,724 | |||||
| Change in promulgated rates | (830 | ) | 144 | 45 | ||||
| 2,810 | 2,187 | 2,515 | ||||||
| 14,452 | 11,742 | 6,728 | ||||||
| Domestic | ||||||||
| Current | (1,265 | ) | 2,953 | 142 | ||||
| Future | 1,328 | 1,530 | 3,395 | |||||
| 63 | 4,483 | 3,537 | ||||||
| Foreign | ||||||||
| Current | 12,907 | 6,602 | 4,071 | |||||
| Future | 1,482 | 657 | (880 | ) | ||||
| 14,389 | 7,259 | 3,191 | ||||||
| 14,452 | 11,742 | 6,728 | ||||||
The Company's effective income tax rate differs from the combined statutory federal and provincial income tax rate in Canada (33.59% for 2003, 35.66% for 2002 and 37.41% for 2001). This difference arises from the following:
| | 2003 | 2002 | 2001 | |||||
|---|---|---|---|---|---|---|---|---|
| | $ | $ | $ | |||||
| Combined basic rate applied to pre-tax income | 14,467 | 11,629 | 6,828 | |||||
| Increase (decrease) in taxes resulting from: | ||||||||
| Large corporations tax | — | — | 59 | |||||
| Change in promulgated rates | (830 | ) | 144 | 45 | ||||
| Difference with foreign tax rates | (1,312 | ) | 1,189 | (548 | ) | |||
| Non-deductible items | 1,481 | 228 | 569 | |||||
| Use of unrecorded prior years' losses | — | (231 | ) | — | ||||
| Non-taxable items and other | (604 | ) | (2,008 | ) | (896 | ) | ||
| Foreign withholding taxes | 1,250 | 791 | 671 | |||||
| 14,452 | 11,742 | 6,728 | ||||||
No provision has been made for income taxes on the undistributed earnings of the Company's foreign subsidiaries as at September 30, 2003 that the Company intends to indefinitely reinvest.
72 Canadian GAAP
9. INVESTMENTS
| | 2003 | 2002 | ||
|---|---|---|---|---|
| | $ | $ | ||
| Investments in preferred shares of a private company, at estimated net realizable value | 578 | 1,156 | ||
| Note receivable, 8.5% beginning on January 1, 2002, maturing on January 1, 2004 | 936 | 936 | ||
| Other | 363 | 398 | ||
| 1,877 | 2,490 | |||
| Investments receivable within one year | 1,102 | 142 | ||
| 775 | 2,348 | |||
10. PROPERTY, PLANT AND EQUIPMENT
| | 2003 | |||||
|---|---|---|---|---|---|---|
| | Cost | Accumulated depreciation | Net | |||
| | $ | $ | $ | |||
| Land | 940 | — | 940 | |||
| Buildings | 12,431 | 2,484 | 9,947 | |||
| Furniture and equipment | 13,761 | 6,417 | 7,344 | |||
| Automotive equipment | 86 | 13 | 73 | |||
| Computer equipment | 3,822 | 2,085 | 1,737 | |||
| Leasehold and building improvements | 522 | 212 | 310 | |||
| 31,562 | 11,211 | 20,351 | ||||
| | 2002 | |||||
|---|---|---|---|---|---|---|
| | Cost | Accumulated depreciation | Net | |||
| | $ | $ | $ | |||
| Land | 848 | — | 848 | |||
| Buildings | 10,679 | 1,334 | 9,345 | |||
| Furniture and equipment | 12,566 | 4,280 | 8,286 | |||
| Automotive equipment | 82 | 35 | 47 | |||
| Computer equipment | 2,253 | 1,573 | 680 | |||
| Leasehold and building improvements | 1,139 | 240 | 899 | |||
| 27,567 | 7,462 | 20,105 | ||||
Acquisitions of property, plant and equipment amount to $4,301,768 ($14,071,633 in 2002 and $2,415,136 in 2001).
The cost and accumulated depreciation of equipment under capital leases amount to $5,019,440 and $891,445 ($3,154,207 and $204,000 in 2002).
Canadian GAAP 73
11. INTANGIBLE ASSETS
| | 2003 | ||||||
|---|---|---|---|---|---|---|---|
| | Cost | Accumulated amortization | Net | ||||
| | $ | $ | $ | ||||
| Trademarks, trademark licenses and manufacturing rights with a: | |||||||
| Finite life | 124,157 | 20,414 | 103,743 | ||||
| Indefinite life | 186,512 | 12,418 | 174,094 | ||||
| 310,669 | 32,832 | 277,837 | |||||
| | 2002 | ||||||
|---|---|---|---|---|---|---|---|
| | Cost | Accumulated amortization | Net | ||||
| | $ | $ | $ | ||||
| Trademarks, trademark licenses and manufacturing rights with a: | |||||||
| Finite life | 106,375 | 15,679 | 90,696 | ||||
| Indefinite life | 102,275 | 12,418 | 89,857 | ||||
| 208,650 | 28,097 | 180,553 | |||||
Acquisitions of intangible assets amount to $88,092,927 ($30,036,118 in 2002 and $2,592,054 in 2001).
The annual amortization expenses without taking into account any future acquisitions expected for the years 2004 through 2008 is as follows:
| | $ | |
|---|---|---|
| 2004 | 5,980 | |
| 2005 | 6,174 | |
| 2006 | 6,367 | |
| 2007 | 7,167 | |
| 2008 | 7,167 |
12. GOODWILL
| | 2003 | 2002 | ||
|---|---|---|---|---|
| | $ | $ | ||
| Cost | 33,200 | 33,200 | ||
| Accumulated amortization | 3,858 | 3,858 | ||
| Net | 29,342 | 29,342 | ||
74 Canadian GAAP
13. AUTHORIZED LINE OF CREDIT
The Company has a credit agreement with two Canadian chartered banks relative to a $55,000,000 financing. The financing comprises a $15,000,000 revolving operating facility renewable annually and a $40,000,000 364-day, extendible revolving facility with a three-year term-out option maturing on October 12, 2007. The term-out option provides for quarterly instalments equal to 6.81% of the amount then outstanding on the extendible revolving facility with a final instalment of 25%.
The facilities are secured by a first security interest on all present and future acquired assets of the Company and its material subsidiaries, and provide for the maintenance of certain financial ratios.
Cash dividends, repurchase of shares (other than redeemable shares issued in connection with a permitted acquisition) and similar distributions to shareholders are limited to 10% of the Company's net earnings for the preceding fiscal year.
The interest rate varies depending on the Company's leverage between 25 basis points and 125 basis points over prime rate and between 125 basis points and 225 basis points over the LIBOR rate or bankers' acceptances. The credit facilities may be drawn in U.S. dollars or in Canadian dollars equivalent. As at September 30, 2003, there was no amount outstanding under this line of credit.
14. ACCOUNTS PAYABLE AND ACCRUED LIABILITIES
| | 2003 | 2002 | ||
|---|---|---|---|---|
| | $ | $ | ||
| Accounts payable | 9,605 | 5,674 | ||
| Contract rebates, product returns and accrued chargebacks | 7,248 | 4,828 | ||
| Accrued interest on subordinated notes | 3,038 | — | ||
| Accrued royalty fees | 4,820 | 2,881 | ||
| Accrued bonuses | 2,883 | 1,670 | ||
| Accounts payable on intangible assets | 7,000 | — | ||
| Other accrued liabilities | 6,297 | 9,546 | ||
| Contingency provisions | 2,900 | 2,900 | ||
| 43,791 | 27,499 | |||
15. LONG-TERM DEBT
| | 2003 | 2002 | ||
|---|---|---|---|---|
| | $ | $ | ||
| Convertible subordinated notes, 4.25%, interest payable semi-annually starting October 15, 2003, convertible into 8,924,113 common shares, maturing April 15, 2008. (Note 16) | 103,053 | — | ||
| Bank loans, interest rates varying between 4.84% and 7.15%, secured by immovable hypothecs on land and buildings having a net book value of $4,213,164 in 2003, payable in monthly instalments of $52,911, principal and interest, maturing in 2005 and 2013. | 2,576 | 2,565 | ||
| Obligations under capital leases, interest rates varying between 3.81% and 6.20% (2.70% and 19.84% in 2002) payable in monthly instalments, principal and interest, maturing on different dates until 2008. | 3,426 | 2,852 | ||
| Bank loans, prime rate plus 1.50% and 2.50% (6.00% and 7.00% as at September 30, 2002), secured by movable hypothecs on assets of a subsidiary. | — | 482 | ||
| 109,055 | 5,899 | |||
| Instalments due within one year | 1,528 | 1,336 | ||
| 107,527 | 4,563 | |||
Canadian GAAP 75
As at September 30, 2003, minimum instalments on long-term debt for the next years are as follows:
| | Obligations under capital leases | Other long-term loans | ||
|---|---|---|---|---|
| | $ | $ | ||
| 2004 | 1,178 | 508 | ||
| 2005 | 1,021 | 465 | ||
| 2006 | 786 | 408 | ||
| 2007 | 453 | 423 | ||
| 2008 | 248 | 103,493 | ||
| 2009 and thereafter | 86 | 332 | ||
| 3,772 | ||||
| Interest included in the minimum lease payments | 346 | |||
| 3,426 | ||||
16. EQUITY COMPONENT OF CONVERTIBLE DEBT
The Company issued convertible subordinated notes for $125,000,000 on March 5, 2003. According to the features of this debt, an amount of $24,238,899, representing the estimated value of the right of conversion, was included in the shareholders' equity as equity component of convertible debt and an amount of $100,761,101 was included in the long-term debt as liability component of convertible debt. As of September 30, 2003, implicit interest of 9.17% and totalling $2,292,478 was accounted for and added to the liability component.
17. EQUITY COMPONENT OF PURCHASE PRICE
In April 2000, Axcan entered into a series of agreements with QLT PhotoTherapeutics Inc. ("QLT"). These agreements provided for the purchase by Axcan of PHOTOFRIN, a light sensitive compound administered to patients and activated by a laser, and the purchase by QLT of 1,283,333 common shares of Axcan for a total cash consideration of CDN$19,250,000 (U.S. $13,007,000). These transactions closed on June 8, 2000.
A balance of CDN$4,000,000 (U.S. $2,704,000) which was payable, at the earliest of four years after the closing or upon the receipt of a specific approval from a regulatory authority, in cash or in common shares, at Axcan's sole discretion, was presented as equity component. During the year 2003, the Company decided and paid in cash the balance of purchase price.
76 Canadian GAAP
18. CAPITAL STOCK
Authorized
Unlimited number of shares without par value
Common shares
Preferred shares, issuable in series, rights, privileges and restrictions determined at the creation date
During the year 2000, the Company created two series of preferred shares as follows:
14,175,000 | Series A, non-voting, annual preferential cumulative dividend of 5%, redeemable on or prior to June 8, 2001 at CDN$1.00 per share payable at the option of the Company in cash or by the issuance of common shares or in any combination of cash and common shares. | |
12,000,000 | Series B, non-voting, redeemable on the fifth anniversary of their issuance at CDN$1.00 per share payable in cash or by the issuance of common shares at the option of the Company, convertible into common shares at the holder's option on the basis of one common share for each 15 Series B preferred shares. |
The issued and fully paid capital stock is as follows:
| | 2003 | 2002 | 2001 | ||||||||||
|---|---|---|---|---|---|---|---|---|---|---|---|---|---|
| | Number | Amount | Number | Amount | Number | Amount | |||||||
| | | $ | | $ | | $ | |||||||
| Common shares | |||||||||||||
| Balance, beginning of year | 44,863,198 | 261,285 | 38,412,133 | 186,650 | 34,506,254 | 143,787 | |||||||
| Shares issued following public offerings (a) | — | — | 5,000,000 | 57,500 | 3,000,000 | 32,967 | |||||||
| Shares issued following private investors' subscription (a) | — | — | 208,044 | 3,000 | — | — | |||||||
| Shares issued following the exercise of the underwriters' option (a) | — | — | 750,000 | 8,625 | — | — | |||||||
| Shares issued pursuant to the stock option plan (a) | 141,122 | 1,103 | 127,489 | 751 | 69,597 | 335 | |||||||
| Shares issued for the acquisition of assets | — | — | 365,532 | 4,759 | — | — | |||||||
| Shares issued for the redemption of preferred shares and cumulative dividends | — | — | — | — | 836,282 | 9,561 | |||||||
| Balance, end of year | 45,004,320 | 262,388 | 44,863,198 | 261,285 | 38,412,133 | 186,650 | |||||||
Series A preferred shares | |||||||||||||
| Balance, beginning of year | — | — | — | — | 13,500,000 | 9,118 | |||||||
| Shares redeemed by the issuance of common shares | — | — | — | — | (13,500,000 | ) | (9,118 | ) | |||||
| Balance, end of year | — | — | — | — | — | — | |||||||
| Total | 262,388 | 261,285 | 186,650 | ||||||||||
- (a)
- Issued for cash
Canadian GAAP 77
Common stock option plan
The common stock option plan is intended for eligible directors, principal senior executives and employees. The number of stock options that can be granted under this plan cannot exceed 4,500,000, 4,500,000 and 2,590,000 as at September 30, 2003, 2002, and 2001, respectively. Options may be exercised at a rate of 20% per year and expire ten years after the granting date except for the annual options granted to outside directors which may be exercised one year after the granting date.
The changes to the number of stock options outstanding are as follows:
| | 2003 | 2002 | 2001 | |||||||||
|---|---|---|---|---|---|---|---|---|---|---|---|---|
| | Number of options | Weighted average exercise price | Number of options | Weighted average exercise price | Number of options | Weighted average exercise price | ||||||
| | | $ | | $ | | $ | ||||||
| Balance, beginning of year | 2,429,078 | 9.67 | 1,956,441 | 7.75 | 1,364,348 | 6.56 | ||||||
| Granted | 531,850 | 11.36 | 684,050 | 13.38 | 772,433 | 10.30 | ||||||
| Exercised | (141,122 | ) | 7.82 | (127,489 | ) | 5.89 | (69,597 | ) | 4.77 | |||
| Cancelled | (137,966 | ) | 10.73 | (83,924 | ) | 9.58 | (110,743 | ) | 7.54 | |||
| Balance, end of year | 2,681,840 | 10.12 | 2,429,078 | 9.67 | 1,956,441 | 7.75 | ||||||
| Options exercisable at end of year | 965,909 | 9.00 | 614,716 | 7.79 | 337,708 | 6.11 | ||||||
Stock options outstanding at September 30, 2003 are as follows:
| | Options outstanding | Options exercisable | ||||||||
|---|---|---|---|---|---|---|---|---|---|---|
| Exercise price | Number | Weighted average remaining contractual life | Weighted average exercise price | Number | Weighted average exercise price | |||||
| | | | $ | | $ | |||||
| $4.04 – $5.50 | 46,400 | 4.9 | 4.35 | 27,400 | 4.71 | |||||
| $5.51 – $7.00 | 71,400 | 5.5 | 5.88 | 53,800 | 5.81 | |||||
| $7.01 – $8.50 | 779,096 | 6.5 | 7.28 | 434,316 | 7.31 | |||||
| $8.51 – $10.00 | 472,744 | 7.2 | 9.93 | 216,433 | 9.92 | |||||
| $10.01 – $11.50 | 448,350 | 8.6 | 10.88 | 43,300 | 10.90 | |||||
| $11.51 – $13.00 | 487,050 | 8.5 | 12.30 | 119,000 | 12.21 | |||||
| $13.01 – $14.03 | 376,800 | 8.4 | 13.99 | 71,660 | 14.01 | |||||
| 2,681,840 | 7.6 | 10.12 | 965,909 | 9.00 | ||||||
Equity line agreement
On July 4, 2002, the Solidarity Fund QFL (the "Solidarity Fund") committed to invest up to $14,100,000 in the Company's capital stock. The Solidarity Fund has initially purchased 208,044 common shares for total proceeds of $3,000,000. As a result of the Solidarity Fund subscription in the Company's convertible subordinated notes issued on March 5, 2003, the Company agreed to waive its rights under this equity line agreement.
78 Canadian GAAP
19. FINANCIAL INFORMATION INCLUDED IN THE CONSOLIDATED STATEMENT OF EARNINGS
a) Financial expenses
| | 2003 | 2002 | 2001 | |||
|---|---|---|---|---|---|---|
| | $ | $ | $ | |||
| Interest on long-term debt | 5,647 | 159 | 2,820 | |||
| Bank charges | 297 | 218 | 55 | |||
| Financing fees | — | 282 | — | |||
| Amortization of deferred debt issue expenses | 646 | 247 | — | |||
| 6,590 | 906 | 2,875 | ||||
b) Other information
| | 2003 | 2002 | 2001 | ||||
|---|---|---|---|---|---|---|---|
| | $ | $ | $ | ||||
| Non-controlling interest | (103 | ) | (363 | ) | (249 | ) | |
| Rental expenses | 1,228 | 1,148 | 994 | ||||
| Depreciation of property, plant and equipment | 3,477 | 2,499 | 774 | ||||
| Amortization of intangible assets | 4,650 | 5,114 | 9,728 | ||||
| Amortization of goodwill | — | — | 1,530 | ||||
| Investment tax credits applied against research and development expenses | 488 | 830 | 1,114 |
The Company incurred professional fees with a law firm, in which a Company's director is a partner, totaling $385,862 for the year ended September 30, 2003 ($466,056 in 2002 and $468,124 in 2001). These transactions were concluded in the normal course of operations, at the exchange amount.
c) Earnings per common share
The following table reconciles the numerators and denominators of the basic and diluted earnings per share computations.
| | 2003 | 2002 | 2001 | ||||||||
|---|---|---|---|---|---|---|---|---|---|---|---|
| | $ | $ | $ | ||||||||
| Basic | |||||||||||
| Net earnings | $ | 28,617 | $ | 20,868 | $ | 11,472 | |||||
| Dividends on preferred shares | — | — | (301 | ) | |||||||
| Net earnings available to common shareholders | $ | 28,617 | $ | 20,868 | $ | 11,171 | |||||
| Weighted average number of common shares outstanding | 44,914,944 | 41,664,510 | 35,832,198 | ||||||||
| Basic earnings per share | $ | 0.64 | $ | 0.50 | $ | 0.31 | |||||
| Diluted | |||||||||||
| Net earnings available to common shareholders on a diluted basis | $ | 28,617 | $ | 20,868 | $ | 11,171 | |||||
| Weighted average number of common shares outstanding | 44,914,944 | 41,664,510 | 35,832,198 | ||||||||
| Effect of dilutive stock options | 472,599 | 660,970 | 449,478 | ||||||||
| Effect of dilutive equity component of purchase price | 220,449 | 202,020 | 249,376 | ||||||||
| Adjusted weighted average number of common shares outstanding | 45,607,992 | 42,527,500 | 36,531,052 | ||||||||
| Diluted earnings per share | $ | 0.63 | $ | 0.49 | $ | 0.31 | |||||
Options to purchase 754,100 common shares (553,350 for 2002 and 206,250 for 2001) were outstanding but were not included in the computation of diluted earnings per share as the exercise price of the options was greater than the average market price of the common shares. As of September 30, 2003, the convertible subordinated notes have no effect on the diluted earnings per share.
Canadian GAAP 79
20. FINANCIAL INFORMATION INCLUDED IN THE CONSOLIDATED STATEMENT OF CASH FLOWS
a) Changes in working capital items
| | 2003 | 2002 | 2001 | ||||
|---|---|---|---|---|---|---|---|
| | $ | $ | $ | ||||
| Accounts receivable | 5,750 | 2,120 | (7,270 | ) | |||
| Income taxes receivable | (4,459 | ) | (388 | ) | 2,884 | ||
| Inventories | (411 | ) | (2,532 | ) | (3,400 | ) | |
| Prepaid expenses | (942 | ) | 401 | 211 | |||
| Accounts payable and accrued liabilities | 9,619 | 3,870 | (65 | ) | |||
| Income taxes payable | 3,207 | 795 | (940 | ) | |||
| 12,764 | 4,266 | (8,580 | ) | ||||
b) Cash flows relating to interest and income taxes of operating activities are as follows:
| | 2003 | 2002 | 2001 | |||
|---|---|---|---|---|---|---|
| | $ | $ | $ | |||
| Interest received | 1,427 | 787 | 1,010 | |||
| Interest paid | 342 | 242 | 2,875 | |||
| Income taxes paid | 12,417 | 7,672 | 2,028 |
21. JOINT VENTURES
The following accounts represent the share of the Company in the joint ventures:
| | 2003 | 2002 | 2001 | |||||
|---|---|---|---|---|---|---|---|---|
| | $ | $ | $ | |||||
| Current assets | 217 | 190 | 186 | |||||
| Total assets | 649 | 606 | 623 | |||||
| Current liabilities | 393 | 248 | 220 | |||||
| Total liabilities | 422 | 273 | 245 | |||||
| Revenue | 659 | 725 | 696 | |||||
| Expenses | 765 | 771 | 735 | |||||
| Net loss | (106 | ) | (46 | ) | (39 | ) | ||
| Cash flows from: | ||||||||
| Operations | 92 | (8 | ) | (10 | ) | |||
| Financing | 4 | — | 25 | |||||
| Investment | (11 | ) | 10 | — | ||||
80 Canadian GAAP
22. SEGMENTED INFORMATION
The Company considers that it operates in a single field of activity, the pharmaceutical industry, since its other activities do not account for a significant portion of segment assets.
No customer represents more than 10% of the Company's revenue except for three customers (four in 2001), for which the sales represented 49.6% of revenue for the year ended September 30, 2003 (52.3% and 66.3% in 2002 and 2001).
Purchases from one supplier represent approximately 26% of the cost of goods sold for the year ended September 30, 2003 (30% in 2002 and 38% in 2001).
The Company operates in the following geographic segments:
| | 2003 | 2002 | 2001 | ||||||
|---|---|---|---|---|---|---|---|---|---|
| | $ | $ | $ | ||||||
| Revenue | |||||||||
| Canada | |||||||||
| Domestic sales | 20,555 | 17,413 | 18,485 | ||||||
| Foreign sales | 9,943 | 22,623 | 11,950 | ||||||
| United States | |||||||||
| Domestic sales | 113,875 | 100,088 | 79,289 | ||||||
| Foreign sales | 421 | 520 | 481 | ||||||
| France | |||||||||
| Domestic sales | 26,975 | 11,409 | — | ||||||
| Foreign sales | 17,213 | 3,362 | — | ||||||
| Other | 3,107 | 1,959 | 7,109 | ||||||
| Inter-segment | (12,547 | ) | (24,199 | ) | (12,765 | ) | |||
| 179,542 | 133,175 | 104,549 | |||||||
| Operating income (loss) | |||||||||
| Canada | (2,772 | ) | 5,732 | 4,119 | |||||
| United States | 40,879 | 27,750 | 16,382 | ||||||
| France | 14,917 | 1,279 | — | ||||||
| Other | (1,182 | ) | (1,891 | ) | 246 | ||||
| 51,842 | 32,870 | 20,747 | |||||||
| Depreciation and amortization | |||||||||
| Canada | 1,434 | 1,570 | 1,092 | ||||||
| United States | 3,729 | 3,890 | 9,479 | ||||||
| France | 1,376 | 443 | — | ||||||
| Other | 1,588 | 1,710 | 1,461 | ||||||
| 8,127 | 7,613 | 12,032 | |||||||
| Property, plant, equipment, intangible assets and goodwill | |||||||||
| Canada | 19,311 | 15,645 | 16,154 | ||||||
| United States | 133,695 | 135,839 | 136,920 | ||||||
| France | 135,377 | 50,488 | — | ||||||
| Other | 39,147 | 28,028 | 29,220 | ||||||
| 327,530 | 230,000 | 182,294 | |||||||
| Total assets | |||||||||
| Canada | 437,042 | 298,733 | 207,840 | ||||||
| United States | 214,854 | 184,573 | 181,849 | ||||||
| France | 156,700 | 58,938 | — | ||||||
| Other | 134,609 | 32,404 | 33,623 | ||||||
| Inter-segment | (383,689 | ) | (205,506 | ) | (174,209 | ) | |||
| 559,516 | 369,142 | 249,103 | |||||||
Canadian GAAP 81
23. FINANCIAL INSTRUMENTS
Currency risk
The Company is exposed to financial risk arising from fluctuation in foreign exchange rates and the degree of volatility of the rates. The Company does not use derivative instruments to reduce its exposure to foreign currency risk.
Fair value of the financial instruments on the balance sheet:
The estimated fair value of the financial instruments is as follows:
| | 2003 | 2002 | |||||||
|---|---|---|---|---|---|---|---|---|---|
| | Fair value | Carrying amount | Fair value | Carrying amount | |||||
| | $ | $ | $ | $ | |||||
| Assets | |||||||||
| Cash and cash equivalents | 37,886 | 37,886 | 20,005 | 20,005 | |||||
| Short-term investments | 133,112 | 133,112 | 60,740 | 60,740 | |||||
| Accounts receivable | 17,894 | 17,894 | 24,050 | 24,050 | |||||
| Investments in a private company | b | ) | 578 | b | ) | 1,156 | |||
| Note receivable | b | ) | 936 | b | ) | 936 | |||
| Other investments | 363 | 363 | 398 | 398 | |||||
| Liabilities | |||||||||
| Accounts payable and accrued liabilities | 43,791 | 43,791 | 27,499 | 27,499 | |||||
| Long-term debt | 109,055 | 109,055 | 5,838 | 5,899 | |||||
The following methods and assumptions were used to calculate the estimated fair value of the financial instruments on the balance sheet.
a) Financial instruments valued at carrying amount
The estimated fair value of certain financial instruments shown on the balance sheet is equivalent to their carrying amount because they are realizable in the short-term or items whose carrying amount approximates the fair value. These financial instruments include cash and cash equivalents, short-term investments, accounts receivable, other investments and accounts payable and accrued liabilities.
b) Investments in a private company and note receivable
The fair value of investments in a private company and note receivable was not readily determinable.
c) Long-term debt
Since a significant portion of the long-term debt was issued during the year at current market rates and there has been little change in market rates, the fair value of long-term debt approximates its carrying value. In 2002, the fair value of long-term debt has been established by discounting the future cash flows at interest rates corresponding to those the Company would have obtained at that date for loans with similar maturity dates and terms.
82 Canadian GAAP
24. COMMITMENTS AND CONTINGENCIES
a) Commitments
The Company has entered into non-cancelable operating leases expiring on different dates until September 30, 2008 for the rental of office space, automotive equipment and equipment. One of the office space leases contains an escalation clause providing for additional rent.
Minimum future lease payments under these operating leases are as follows:
| | $ | |
|---|---|---|
| 2004 | 1,094 | |
| 2005 | 727 | |
| 2006 | 222 | |
| 2007 | 44 | |
| 2008 | 44 | |
| 2,131 | ||
The Company entered into an agreement with Nordmark Arzneimittel GmbH & Co to create a joint venture to develop patent-protected novel enzyme preparations. Under the terms of this agreement, the Company agreed to contribute up to a cumulative amount of $1,500,000 to the joint venture. As at September 30, 2003, a total amount of $100,000 has been contributed.
b) Contingencies
The subsidiary Axcan Scandipharm is a party to several legal proceedings related to the product line it markets under the name ULTRASE. Lawsuits have been filed and claims have been asserted against Axcan Scandipharm and certain other companies, including the enzyme manufacturer, stemming from allegations that, among other things, Axcan Scandipharm's enzyme products caused colonic strictures. Axcan Scandipharm has been named as a defendant in 12 product liability lawsuits. Of the 12 lawsuits to date, Axcan Scandipharm was dismissed from one, nonsuited in another and settled ten. At this time, it is difficult to predict the number of potential cases and because of the young age of the patients involved, Axcan Scandipharm's product liability exposure for this issue in the United States will remain for a number of years. Axcan Scandipharm's insurance carriers have defended the lawsuits to date and Axcan expects them to continue to defend Axcan Scandipharm (to the extent of its product liability insurance) should lawsuits be filed in the future.
In addition, the enzyme manufacturer and certain other companies have claimed a right to recover amounts paid defending and settling these claims as well as a declaration that Scandipharm must provide indemnification against future claims. This lawsuit is based on contractual and common law indemnity issues and the parties have agreed to settle their dispute through binding arbitration. The arbitration has commenced and the plaintiffs allege that the amount at issue may be in excess of $10,000,000. Axcan Scandipharm denies that such reimbursement is owed and has also responded with counterclaims against the plaintiffs.
As at September 30, 2003 and 2002, the Company has recorded reserves in the amount of approximately $2,900,000 to cover any future liabilities in connection with the indemnification claims and the lawsuits discussed above that may not be covered by, or exceed, applicable insurance proceeds. While the Company believes that the insurance coverage and provisions taken to date are adequate, an adverse determination of any such claims or of any future claims could exceed insurance coverage and amounts currently accrued.
c) Milestone payments
The agreements with QLT Phototherapeutics Inc. ("QLT") relating to the purchase of PHOTOFRIN provided for milestone payments to be made by Axcan to QLT that could reach a maximum of CDN$20,000,000 upon receipt of certain regulatory approvals for specific or additional indication for PHOTOFRIN or other conditions. Each milestone payment shall be made at the option of the Company either in cash or in Series B preferred shares or in a combination of cash and preferred shares provided that at least one-half of the milestone payable shall be paid in cash. During the year 2003 and 2000, CDN$5,000,000 and CDN$5,000,000 (U.S. $3,646,973 and U.S. $3,378,378) was paid by Axcan in cash upon receipt of regulatory approval.
The agreement to acquire the exclusive licence for North America, the European Union and Latin America to develop, manufacture and market ITAX provided for milestone payments for an amount of $20,000,000 upon regulatory submission and an amount of $45,000,000 upon regulatory approval. The Company will also pay royalties of 9% of net sales from the date of first commercial sale until the expiration of the patent and 6% for ten years then after.
d) Royalties
Nets sales of certain products of the Company are subject to royalties payable to unrelated third parties.
Canadian GAAP 83
In particular, the Company must pay a 5% royalty on net sales of products covered under two agreements for the exclusive rights to market ULTRASE and ADEKs through August 5, 2005 in the case of ADEKs.
Axcan has to pay 5% of worldwide sales of PHOTOFRIN with a maximum of $500,000 per year and a maximum total aggregate of $3,108,245 until December 2007. Until September 30, 2003, an amount of $1,263,091 has been accounted for ($983,448 in 2002 and $522,820 in 2001). Axcan also has to pay 5% of net sales of PHOTOFRIN for use in the therapeutic treatment of cancer and 2% of net sales for other uses until December 2009.
Royalties amounting to $4,387,092, $3,731,113 and $3,711,561 respectively for years ended September 30, 2003, 2002 and 2001 were charged to earnings.
e) Licensing
During the year 2000, Axcan entered into a new licensing agreement to market a new generation of pancrelipase minitablets. As at September 30, 2003, the Company paid $3,500,000 in development fees, which is the total amount of development fees the Company agreed to pay. Axcan will pay royalties of 6% on the first $30,000,000 of annual sales and 5% on annual sales in excess of $30,000,000 subject to minimum royalty payments of respectively $750,000, $1,000,000 and $1,500,000 in the first three years of the agreement.
Axcan also entered into a licensing agreement with the Children's Hospital Research Foundation ("CHRF") for a series of sulfated derivatives of ursodeoxycholic acid compounds ("SUDCA"). Axcan had paid $589,000 in cash; the Company will also pay milestones for a maximum amount of $425,000 when SUDCA will be validated and a bonus when certain conditions will be meet; finally, Axcan will pay royalties based on sales.
In May 2002, the Company signed a co-development and license agreement with NicOx S.A. ("NicOx") for NCX-1000, a nitric oxide-donating ursodiol derivative, for the treatment of chronic liver diseases including portal hypertension and Hepatitis "C". Under the terms of this agreement, the Company has obtained from NicOx an exclusive license to commercialize NCX-1000 in Canada and Poland as well as an option to acquire the same exclusive rights for the United States market. The Company and NicOx will share the cost of the future development of NCX-1000 jointly through the completion of Phase II clinical studies. The Company will thereafter conduct the required Phase III clinical studies and be responsible for regulatory filings in the exclusively licensed territories. The Company will pay NicOx options or milestone payments totaling $17,000,000 at various stages of development. As at September 30, 2003, an amount of $2,000,000 has been paid. The Company also agreed to pay royalties of up to 12% on net sales of the product.
On October 10, 2002, the Company acquired from Gentium S.p.A., an Italian company, exclusive rights to develop and market in North America, a patented 4-gram rectal gel formulation of mesalamine (5-ASA) for the treatment of active distal ulcerative colitis. In return the Company will make milestone payments totaling approximately $1,500,000, the majority of which will be paid upon approval in the United States. As at September 30, 2003, an amount of approximately $200,000 has been paid. The Company will also pay a royalty of 4% on net sales for a ten-year period from product's launch.
On July 22, 2003, the Company acquired from Merz Pharmaceutical GmbH ("Merz") an exclusive license to use, develop and submit for approval injectable and oral granule formulations containing L-ornithine and L-aspartate. In consideration of the rights and licenses granted by Merz under this agreement, the Company shall pay a royalty of 6% of net sales or 4% of net sales if the Company develops any patentable invention or improvement and Merz incorporates such invention or improvement into its products.
f) Employee benefit plan
A subsidiary of the Company has a defined contribution plan (the "Plan") for its U.S. employees. Participation is available to substantially all U.S. employees. Employees may contribute up to 15% of their gross pay and up to limits set by the U.S. Internal Revenue Service. During the year, the Board of Directors approved and the Company charged to earnings a contribution to the Plan totaling $319,871 ($224,275 in 2002 and $231,629 in 2001).
84 Canadian GAAP
25. STOCK-BASED COMPENSATION
The Company has elected to measure compensation costs related to awards of stock options using the intrinsic value-based method of accounting. No stock-based employee compensation cost is reflected in net earnings. The Company is also required to make pro-forma disclosures of net earnings, basic earnings per share and diluted earnings per share as if the fair value-based method of accounting had been applied.
The average weighted fair value of granted stock options was as at September 30, 2003, 2002 and 2001, $5.41, $6.96 and $5.69.
The fair value of granted stock options was estimated with the Black-Scholes model of evaluation of the price of options using an expected life of six years, a risk-free interest rate of 4.43%, 4.93% and 5.64% for the years ended September 30, 2003, 2002 and 2001, a volatility of 46% in 2003, 47% in 2002 and 50% in 2001 and no expected dividends.
The Black-Scholes model, used by the Company to calculate option values, as well as other currently accepted option valuation models, were developed to estimate the fair value of freely tradable, fully transferable options without vesting restrictions, which significantly differ from the Company's stock option awards. These models also require highly subjective assumptions, including future stock price volatility and expected time until exercise, which greatly affect the calculated values. Accordingly, management believes that these models do not necessarily provide a reliable single measure of the fair value of the Company's stock option awards.
Accordingly, the Company's net earnings, basic earnings per share and diluted earnings per share would have been reduced for the years ended September 30, 2003, 2002 and 2001, on a pro-forma basis, as follows:
| | 2003 | 2002 | 2001 | |||||||||
|---|---|---|---|---|---|---|---|---|---|---|---|---|
| | Actual | Pro-forma | Actual | Pro-forma | Actual | Pro-forma | ||||||
| | | | $ | $ | $ | $ | ||||||
| Net earnings | 28,617 | 25,248 | 21,188 | 18,699 | 11,825 | 10,410 | ||||||
| Basic earnings per share | 0.64 | 0.56 | 0.51 | 0.45 | 0.32 | 0.28 | ||||||
| Diluted earnings per share | 0.63 | 0.55 | 0.50 | 0.44 | 0.32 | 0.28 | ||||||
26. SUBSEQUENT EVENT
On October 8, 2003, the Company signed an agreement to acquire the rights to a group of products from Aventis Holding Inc. Under the terms of this agreement, the Company will acquire CARAFATE and BENTYL for the U.S. market and SULCRATE, BENTYLOL and PROTOSEDYL for the Canadian market for a cash purchase price of $145,000,000. These products will be classified as an intangible asset with finite life and will be amortized on a straight-line basis.
Canadian GAAP 85
| QUARTERLY RESULTS U.S. GAAP | 88 | |
QUARTERLY RESULTS CANADIAN GAAP | 89 | |
QUARTERLY COMMON SHARE PRICE | 90 | |
HISTORY | 91 | |
CORPORATE GOVERNANCE | 92 |
87
Fiscal year ended September 30, 2003
In thousands of U.S. dollars, except per share amounts
| | Quarter ended | |||||||||
|---|---|---|---|---|---|---|---|---|---|---|
| | Dec. 31, 2002 | March 31, 2003 | June 30, 2003 | Sept. 30, 2003 | Fiscal 2003 | |||||
| | (unaudited) | |||||||||
| | $ | $ | $ | $ | $ | |||||
| Revenue | 37,846 | 45,621 | 46,877 | 48,740 | 179,084 | |||||
| Net income (loss) | 6,557 | 8,933 | 6,339 | (1,904 | ) | 19,925 | ||||
| Diluted income (loss) per common share | 0.14 | 0.20 | 0.14 | (0.04 | ) | 0.44 | ||||
Fiscal year ended September 30, 2002
In thousands of U.S. dollars, except per share amounts
| | Quarter ended | |||||||||
|---|---|---|---|---|---|---|---|---|---|---|
| | Dec. 31, 2001 | March 31, 2002 | June 30, 2002 | Sept. 30, 2002 | Fiscal 2002 | |||||
| | (unaudited) | |||||||||
| | $ | $ | $ | $ | $ | |||||
| Revenue | 28,522 | 30,489 | 35,493 | 37,900 | 132,404 | |||||
| Net income | 3,597 | 4,751 | 5,848 | 6,992 | 21,188 | |||||
| Diluted income per common share | 0.09 | 0.12 | 0.13 | 0.15 | 0.50 | |||||
88 U.S. GAAP
Fiscal year ended September 30, 2003
In thousands of U.S. dollars, except per share amounts
| | Quarter ended | |||||||||
|---|---|---|---|---|---|---|---|---|---|---|
| | Dec. 31, 2002 | March 31, 2003 | June 30, 2003 | Sept. 30, 2003 | Fiscal 2003 | |||||
| | (unaudited) | |||||||||
| | $ | $ | $ | $ | $ | |||||
| Revenue | 38,030 | 45,892 | 46,908 | 48,712 | 179,542 | |||||
| Net earnings | 6,549 | 8,631 | 5,340 | 8,097 | 28,617 | |||||
| Diluted earnings per common share | 0.14 | 0.19 | 0.12 | 0.18 | 0.63 | |||||
Fiscal year ended September 30, 2002
In thousands of U.S. dollars, except per share amounts
| | Quarter ended | |||||||||
|---|---|---|---|---|---|---|---|---|---|---|
| | Dec. 31, 2001 | March 31, 2002 | June 30, 2002 | Sept. 30, 2002 | Fiscal 2002 | |||||
| | (unaudited) | |||||||||
| | $ | $ | $ | $ | $ | |||||
| Revenue | 28,729 | 30,532 | 35,632 | 38,282 | 133,175 | |||||
| Net earnings | 3,518 | 4,672 | 5,768 | 6,910 | 20,868 | |||||
| Diluted earnings per common share | 0.09 | 0.12 | 0.12 | 0.15 | 0.49 | |||||
Canadian GAAP 89
Fiscal years ended September 30, 2003 and 2002
| | 1ST QUARTER | |||||||
|---|---|---|---|---|---|---|---|---|
| | 2003 (TSX - CDN $) | 2003 (NASDAQ - U.S. $) | 2002 (TSX - CDN $) | 2002 (NASDAQ - U.S. $) | ||||
| High | 19.05 | 12.20 | 23.00 | 14.54 | ||||
| Low | 12.33 | 7.80 | 15.86 | 10.00 | ||||
| Volume | 3,610,800 | 2,591,715 | 4,204,900 | 4,679,060 | ||||
| | 2ND QUARTER | |||||||
|---|---|---|---|---|---|---|---|---|
| | 2003 (TSX - CDN $) | 2003 (NASDAQ - U.S. $) | 2002 (TSX - CDN $) | 2002 (NASDAQ - U.S. $) | ||||
| High | 18.75 | 12.35 | 23.40 | 14.58 | ||||
| Low | 14.11 | 9.58 | 18.25 | 11.40 | ||||
| Volume | 5,274,239 | 11,058,881 | 3,766,700 | 7,785,174 | ||||
| | 3RD QUARTER | |||||||
|---|---|---|---|---|---|---|---|---|
| | 2003 (TSX - CDN $) | 2003 (NASDAQ - U.S. $) | 2002 (TSX - CDN $) | 2002 (NASDAQ - U.S. $) | ||||
| High | 20.25 | 14.76 | 24.23 | 15.82 | ||||
| Low | 14.50 | 9.91 | 18.59 | 12.19 | ||||
| Volume | 5,021,600 | 9,119,491 | 3,475,800 | 6,172,041 | ||||
| | 4TH QUARTER | |||||||
|---|---|---|---|---|---|---|---|---|
| | 2003 (TSX - CDN $) | 2003 (NASDAQ - U.S. $) | 2002 (TSX - CDN $) | 2002 (NASDAQ - U.S. $) | ||||
| High | 20.00 | 14.70 | 21.60 | 14.56 | ||||
| Low | 16.80 | 12.05 | 14.50 | 9.12 | ||||
| Volume | 3,816,512 | 8,528,149 | 3,509,900 | 3,854,441 | ||||
90 Canadian GAAP
| 1982 | Axcan founded in Mont Saint-Hilaire, Canada. | |
| 1986 | Approval and launch of first product, SALOFALK. | |
| 1987 | Initiation of key liver disease clinical trials with ursodiol. | |
| 1989 | Canadian approval of URSOFALK (now URSO), which is out-licensed to Jouveinal Canada. | |
| 1995 | Axcan completes initial public offering and lists shares in Canada (AXP). | |
| 1996 | Revenue reaches U.S. $10 million. | |
| 1997 | Axcan acquires number of products including MODULON and reacquires rights for URSOFALK, which is renamed URSO, in Canada. | |
| Axcan launches first product in the United States (VIOKASE, acquired from American Home Products) and becomes Scandipharm's Canadian distributor. | ||
| URSO 250 is first of Axcan's drugs approved by U.S. Food and Drug Administration ("FDA"). | ||
| 1998 | Launch of URSO 250 in the United States. | |
| 1999 | Axcan acquires Scandipharm, Inc., expands into the U.S. and becomes first public Canadian pharmaceutical company with its own sales and marketing organization in the U.S. | |
| 2000 | Axcan acquires PHOTOFRIN and enters growing field of photodynamic therapy. Axcan lists common shares on NASDAQ National Market (AXCA). | |
| 2001 | CANASA suppositories approved by FDA and launched in the U.S. | |
| Filing of New Drug Submission/Application for HELIZIDE (Helicobacter pylori eradication therapy) in Canada and the United States. | ||
| Filing of Supplemental New Drug Submission for PHOTOFRIN (High-Grade Dysplasia associated with Barrett's Esophagus) in Canada. | ||
| Revenue exceeds U.S. $100 million. | ||
| 2002 | Axcan acquires Entéris and Lactéol in France. | |
| Filing of Supplemental New Drug Application for PHOTOFRIN/PHOTOBARR in the U.S. and Europe. | ||
| 2003 | Acquisition of PANZYTRAT (pancreatic enzyme) from Abbott, for Europe. | |
| Acquisition of DELURSAN (Ursodiol tablets) from Aventis, for France. | ||
| Signature of strategic alliance with Nordmark for development of novel enzyme preparations. | ||
| Canadian approval for HELIZIDE, a single capsule, triple therapy for the eradication ofHelicobacter pylori. | ||
| Canadian and US approvals for PHOTOFRIN for ablation of High-Grade Dysplasia associated with Barrett's Esophagus. | ||
| Licensing of HEPENAX for the treatment of hepatic encephalopathy. | ||
| Acquisition of ITAX from Abbott. | ||
| Acquisition of group of gastrointestinal products (CARAFATE and BENTYL for U.S. market and SULCRATE, BENTYLOL and PROCTOSEDYL for Canadian market) from Aventis. |
91
In addition to meeting the new standards of the Securities and Exchange Commission and the NASDAQ National Market, Axcan adheres to guidelines set by the Toronto Stock Exchange aimed at strengthening the performance and independence of boards of directors.
Our Board of Directors includes a Corporate Governance and Nomination Committee that supports the Board's effectiveness through performance evaluations, continuing education and ongoing reviews of the Board's committee structure.
Related committees of the Board are entirely composed of independent directors to deal with audit and risk, executive compensation, and nominations of new directors.
By adopting high standards of corporate governance, the Company demonstrates its commitment to ethical behavior and best practices in corporate governance.
Board of Directors
The Directors bring a range of relevant expertise and experience to the Board. At present, the Board of Directors consists of three related Directors and six independent Directors. The board met 15 times during fiscal year 2003. The Board of Directors monitors the economic, financial and technical strategies of the Company. The active involvement of the management group allows the Board to continually monitor and assess significant business, operational, financial, compliance and other risks. The Executive Officers provide the Board with detailed documentation on a regular basis relating to research and development, clinical development, business development, financial performance and intellectual property management. As appropriate, the Board has created committees that operate within specific terms of reference.
Audit Committee
The Audit Committee is composed of three independent board members and assists the Board of Directors in fulfilling its responsibilities for the Company's accounting and financial reporting practices. Quarterly and annual reviews of consolidated financial statements, the adequacy of the system of internal controls, relevant accounting, financial and security matters, and the management of financial and system risks insure compliance with standards. The Audit Committee also recommends the appointments of external auditors who report to and meet with the Committee on a quarterly basis, with and without the presence of Company management.
Compensation Committee
The primary responsibility of the Compensation Committee is to evaluate the performance of the CEO and other senior officers and review their respective objectives and compensation. The Compensation Committee is also responsible for the compensation policies and benefits granted to employees of the Company and recommends company guidelines including the establishment of executive pay scales, performance bonus guidelines, benefits and standardized option grants.
Corporate Governance and Nomination Committee
Through the Corporate Governance and Nomination Committee, the Board of Directors reviews the quality of the relationship between the management team and the Board of Directors in order to recommend ways to improve that relationship. This committee ensures that an effective and efficient approach to corporate governance is developed, and makes recommendations to the Board for implementation.
Communication
Axcan attaches a high priority to communications with shareholders. The Company believes that it maintains good relations with its shareholders through the provision of interim and annual reports, press releases, conference calls, presentations at conferences, through its website (www.axcan.com) and through regular one-on-one meetings with institutional shareholders. The information contained on Axcan's website is not incorporated by reference in this Annual Report and should not be considered as part of this Annual Report.
92
Pursuant to the requirements of the Securities Exchange Act of 1934, the registrant has duly caused this report to be signed on its behalf by the undersigned, thereunto duly authorized.
| AXCAN PHARMA INC. | |||
Date: January 23, 2003 | By: | /s/ JEAN VÉZINA Name: Jean Vézina Title: Vice-President, Finance and Chief Financial Officer | |
BOARD OF DIRECTORS
OFFICERS
MANAGEMENT'S DISCUSSION AND ANALYSIS OF FINANCIAL CONDITION AND RESULTS OF OPERATIONS
CONSOLIDATED FINANCIAL STATEMENTS
MANAGEMENT'S REPORT
AUDITORS' REPORT
CONSOLIDATED BALANCE SHEETS
CONSOLIDATED OPERATIONS
CONSOLIDATED SHAREHOLDERS' EQUITY
CONSOLIDATED CASH FLOWS
CONSOLIDATED FINANCIAL STATEMENTS Canadian GAAP
MANAGEMENT'S REPORT
AUDITORS' REPORT
CONSOLIDATED BALANCE SHEETS
CONSOLIDATED EARNINGS
CONSOLIDATED RETAINED EARNINGS
CONSOLIDATED CASH FLOWS
NOTES TO CONSOLIDATED FINANCIAL STATEMENTS CANADIAN GAAP September 30 Amounts in the tables are stated in thousands of U.S. dollars, except share related data.
ADDITIONAL INFORMATION
QUARTERLY RESULTS U.S. GAAP
Fiscal year ended September 30, 2003 In thousands of U.S. dollars, except per share amounts
Fiscal year ended September 30, 2002 In thousands of U.S. dollars, except per share amounts
QUARTERLY RESULTS CANADIAN GAAP
Fiscal year ended September 30, 2003 In thousands of U.S. dollars, except per share amounts
Fiscal year ended September 30, 2002 In thousands of U.S. dollars, except per share amounts
QUARTERLY COMMON SHARE PRICE
Fiscal years ended September 30, 2003 and 2002
HISTORY
CORPORATE GOVERNANCE
SIGNATURES