QuickLinks -- Click here to rapidly navigate through this document
SECURITIES AND EXCHANGE COMMISSION
Washington, D.C. 20549
FORM 6-K/A
Report of Foreign Issuer
PURSUANT to Rule 13a-16 or 15d-16 of the Securities Exchange Act of 1934
For the Month of December, 2005
Commission File Number 0-30860
Axcan Pharma Inc.
(Exact Name of Registrant)
597, boul. Laurier, Mont-Saint-Hilaire (Québec), Canada J3H 6C4
(Address of principal executive offices)
Indicate by check mark whether the registrant files or will file annual reports under cover Form 20-F or Form 40-F.
| Form 20-F | o | Form 40-F | ý |
Indicate by check mark whether the registrant by furnishing the information contained in this Form is also hereby furnishing the information to the Commission pursuant to Rule 12g3-2(b) under the Securities Exchange Act of 1934.
| Yes | o | No | ý |
EXPLANATORY NOTE
This Form 6-K/A amends the Form 6-K filed by Axcan Pharma Inc. on December 28, 2005 (the "Original Filing") to correct the list of the Board of Directors and the list of the Management Team on pages 71 and 72, respectively, of Axcan Pharma Inc.'s Annual Report for the fiscal year ended September 30, 2005. There are no other additions, deletions or changes to the Original Filing.
AXCAN PHARMA
Annual Report
 | 05 |
OUR EXPERTISE
Focus on gastroenterology, our core area of knowledge
OUR PEOPLE
Foundation of our future success
OUR PIPELINE
Promise for better treatments
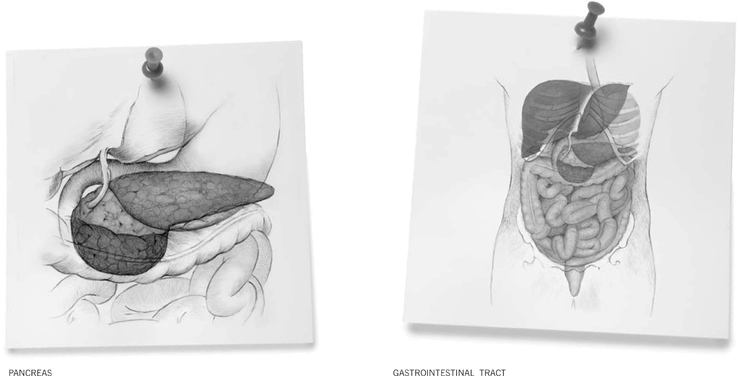
Gastroenterology is the study of the normal function and diseases of the esophagus, stomach, small intestine, colon and rectum, pancreas, gallbladder, bile ducts and liver.
It involves a detailed understanding of the normal action of the gastrointestinal organs, including the movement of material through the stomach and intestine, the digestion and absorption of nutrients into the body, and the function of the liver as a digestive organ.
Gastroenterology includes the study of common and widespread conditions, such as Inflammatory Bowel Diseases (Crohn's Disease and colitis), biliary tract disease, pancreatitis, Irritable Bowel Syndrome, colon polyps and cancer, hepatitis, gastroesophageal reflux (heartburn), peptic ulcer disease and nutritional problems.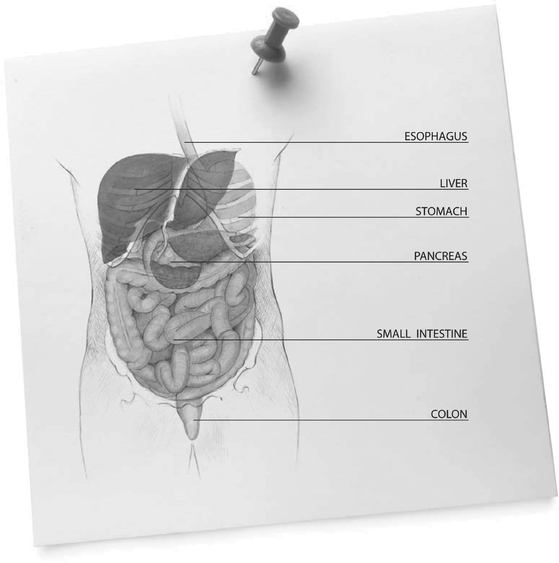
FORWARD-LOOKING STATEMENTS
This Annual Report contains forward-looking statements for either the Company or certain of its subsidiaries. These forward-looking statements, by their nature, necessarily involve risks and uncertainties that could cause actual results to differ materially from those contemplated by the forward-looking statements. The Company considers the assumptions on which these forward-looking statements are based to be reasonable at the time they were prepared, but cautions the reader that these assumptions regarding future events, many of which are beyond the control of the Company and its subsidiaries, may ultimately prove to be incorrect.
Factors and risks, which could cause actual results to differ materially from current expectations, are discussed on page * of this Annual Report as well as in the Company's Annual Information Form for the year ended September 30, 2005. The Company disclaims any intention or obligation to update or revise any forward-looking statements whether as a result of new information, future events, or otherwise, except as required by law.
ESOPHAGUS
Muscular tube that transports food by peristalsis from the pharynx to the stomach. Both ends are closed off by sphincters (muscular constrictions), which relax to let food through and close to keep it from backing up.
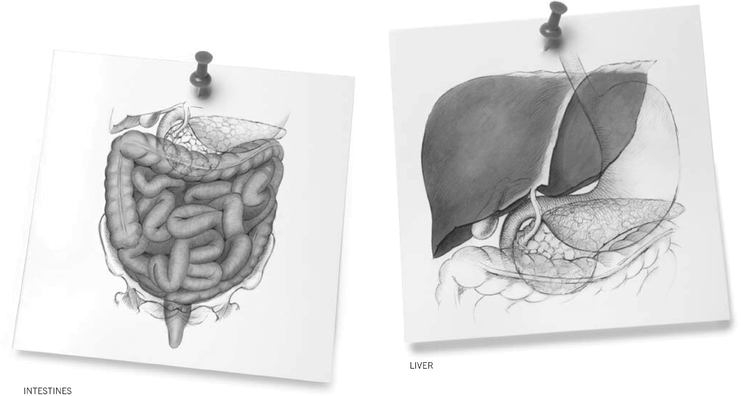
LIVER AND BILIARY SYSTEM
The liver is the body's largest internal organ, weighing about 1.5 kilogram, or 2.5 percent of body weight. The liver and biliary system produce bile and transport it to the small intestine, where it breaks up fats and other components of diet, and aids the digestion and absorption of nutrients. About a liter of bile is produced daily and enters the small intestine.
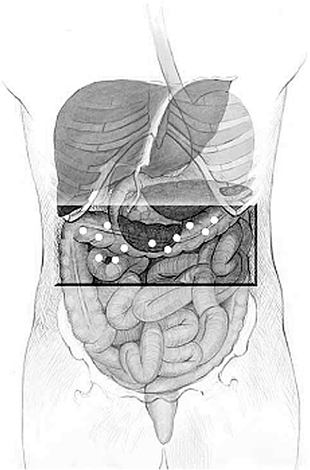
PANCREAS
The pancreas is a digestive and endocrine organ located behind the stomach in the upper abdomen. The pancreas secretes digestive juices containing enzymes into the duodenum, to help break down food into smaller molecule that can be absorbed. It also secretes insulin into the bloodstream to maintain the appropriate concentrations of glucose in the blood.
STOMACH
The stomach is a digestive sac in the left upper abdominal cavity, which expands or contracts with the amount of food in it. It has four regions: the cardia leads down from the esophagus; the fundus curves above it; the body is the largest part; and the antrum narrows to join the duodenum at the pyloric valve. Iron and very fat-soluble substances (e.g., alcohol and some drugs) are absorbed in the stomach. Peristalsis mixes food with enzymes and hydrochloric acid from glands in its lining and moves the resulting chyme toward the small intestine. The vagus nerve and sympathetic nervous system control the stomach's secretions and movements.
SMALL INTESTINE
The small intestine is the longest section of the digestive tract, with an average length of about 6 meters. Although only 2.5 centimeters in diameter—which is why it is called the small intestine—its surface area for absorption covers the size of a tennis court. Large quantities of nutrients and water can be absorbed in the small intestine. Daily, it is capable of absorbing: several kilograms of carbohydrate; up to 1 kilogram of fat; 500 grams of protein; and 20 liters of water.
The surface cells of the small intestine are highly specialized for digestion and absorption of nutrients. Almost all the body's nutrient absorption occurs in the small intestine, along its three sub-divisions: the duodenum, the jejunum and the ileum.
COLON
The colon—also known as the large intestine—is the final organ of the digestive process. It is responsible for drying out indigestible food residues by absorbing fluid and producing solid waste (feces) for elimination. Approximately 1.5 meter long, the colon has six distinct regions leading from the junction with the small intestine: caecum, ascending colon, transverse colon, descending colon, sigmoid colon and rectum.
AXCAN IS A LEADING SPECIALTY PHARMACEUTICAL COMPANY FOCUSED ON GASTROENTEROLOGY
The Company markets a broad line of prescription products sold for the treatment of symptoms in a number of gastrointestinal diseases and disorders such as Inflammatory Bowel Disease, Irritable Bowel Syndrome, cholestatic liver diseases, and complications related to Cystic Fibrosis.
Axcan's products are marketed by its own sales force in North America and Europe. Today, the Company has approximately 450 employees worldwide.
Headquartered in Mont-Saint-Hilaire, Quebec, Canada, Axcan's common shares are traded on the Toronto Stock Exchange under the symbol "AXP" and on the NASDAQ National Market under the symbol "AXCA".
Axcan's Mission is toimprove the quality of care and health of patients suffering from gastrointestinal diseases and disorders by providing effective therapies for patients and specialized caregivers.
Axcan's Vision is to becomethe reference gastroenterology specialty pharmaceutical Company.
Our goal is to achieve these objectives by:
- •
- Providing value-added therapeutics for a broad spectrum of unmet needs in gastroenterology
- •
- Achieving a leadership position in our targeted gastroenterology segments
- •
- Delivering a competitive shareholder return
- •
- Offering stimulating and rewarding opportunities for our employees
| TABLE OF CONTENTS | PAGES | |
|---|---|---|
| Sales Highlights | 2 | |
| Financial Highlights | 3 | |
| Message to Our Shareholders | 6-13 | |
| Our Core Therapeutic Areas | 16-17 | |
| Our Products | 18-19 | |
| Our Research and Development Portfolio | 22-27 | |
| Management's Discussion and Analysis of Financial Condition and Results of Operations | 29-42 | |
| Consolidated Financial Statements | 43-69 | |
| Corporate Governance | 70 | |
| Board of Directors | 71 | |
| Management Team | 72 | |
| Corporate Information | 73 |
1
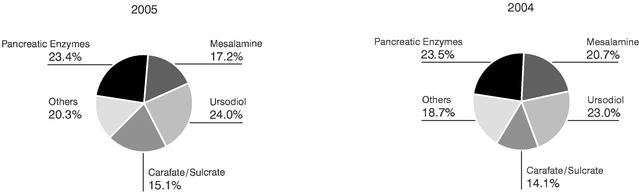
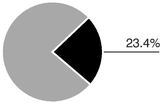
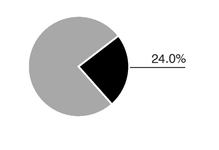
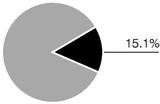
Breakdown by
Product Category
Our diverse product portfolio enables us to minimize the risks often associated with companies that have a limited number of products on the market.
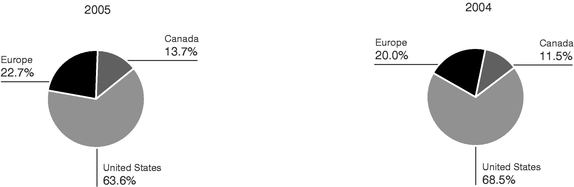
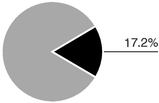
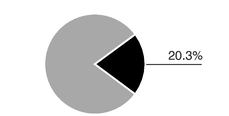
Breakdown by
Geographic Area
We have been able to successfully integrate acquisitions in both North America and Europe. Our goal now is to transform Axcan from a North American company with international operations to a truly multinational company.
2
Years ended September 30
(All amounts are stated in thousands of U.S. dollars, except share related data, percentages and ratios)
| | 2005 | 2004 | 2003 | 2002 | 2001 | ||||||
|---|---|---|---|---|---|---|---|---|---|---|---|
| | $ | $ | $ | $ | $ | ||||||
| Operating Data | |||||||||||
| Revenue | 251,343 | 243,634 | 179,084 | 132,404 | 103,814 | ||||||
Expenses | |||||||||||
| Cost of goods sold | 71,534 | 54,247 | 44,459 | 34,039 | 26,381 | ||||||
| Research and development | 31,855 | 19,866 | 12,098 | 8,855 | 7,243 | ||||||
| Selling and administrative | 85,997 | 76,365 | 63,084 | 49,392 | 38,185 | ||||||
| Depreciation and amortization | 21,532 | 16,359 | 8,063 | 7,546 | 11,829 | ||||||
Operating income | 40,425 | 76,797 | 39,380 | 32,572 | 20,176 | ||||||
| Net income | 26,425 | 48,728 | 19,925 | 21,188 | 11,825 | ||||||
| Net income, excluding one-time charges(1) | 26,425 | 48,728 | 33,350 | 21,188 | 11,825 | ||||||
Per share data, excluding one-time charges(1) | |||||||||||
| Basic net income | 0.58 | 1.08 | 0.74 | 0.51 | 0.32 | ||||||
| Diluted net income | 0.56 | 0.96 | 0.70 | 0.50 | 0.32 | ||||||
| Weighted average number of common shares outstanding (000s) (diluted) | 55,219 | 55,031 | 50,814 | 42,528 | 36,531 | ||||||
Financial Position | |||||||||||
Cash, cash equivalents and short-term investments | 97,588 | 37,901 | 170,885 | 80,717 | 16,515 | ||||||
| Total assets | 641,407 | 609,644 | 545,349 | 367,006 | 246,484 | ||||||
| Long-term debt (including convertible subordinated notes) | 127,829 | 129,694 | 131,002 | 8,603 | 2,919 | ||||||
| Shareholders' equity | 417,604 | 392,076 | 331,011 | 294,787 | 200,431 | ||||||
Common Share Performance(2) | |||||||||||
Market capitalization | 590,214 | 708,494 | 612,059 | 430,238 | 411,010 | ||||||
| Closing share price on NASDAQ National Market | 12.92 | 15.55 | 13.60 | 9.59 | 10.70 | ||||||
| Closing share price on Toronto Stock Exchange (CDN$) | 14.95 | 19.62 | 18.28 | 15.11 | 16.95 | ||||||
| Closing number of common shares issued and outstanding (000s) | 45,682 | 45,562 | 45,004 | 44,863 | 38,412 | ||||||
Cash Flows | |||||||||||
Cash flows from operating activities | 67,745 | 23,360 | 51,496 | 35,331 | 16,390 | ||||||
| Acquisition of intangible assets | 51 | 149,628 | 76,093 | 1,561 | 1,892 | ||||||
| Net issuance of common shares | 1,071 | 4,900 | 1,103 | 65,039 | 30,969 | ||||||
| Issuance of long-term debt | — | 2,212 | 126,064 | 1,506 | — | ||||||
| Net increase (decrease) in cash and cash equivalents | 57,990 | (15,794 | ) | 17,796 | 3,462 | 5,391 | |||||
Ratios | |||||||||||
Gross margin | 71.5% | 77.7% | 75.2% | 74.3% | 74.6% | ||||||
| Operating margin | 16.1% | 31.5% | 22.0% | 24.6% | 19.4% | ||||||
| Net margin | 10.5% | 20.0% | 11.1% | 16.0% | 11.4% | ||||||
| Revenue growth | 3.2% | 36.0% | 35.3% | 27.5% | 19.5% | ||||||
- (1)
- One-time charges consisting of take-over bid expenses, acquired in-process research and related income taxes, a non-GAAP measure (see page 36).
- (2)
- As of September 30
3
OUR EXPERTISE
Focus on gastroenterology, our core of area of knowledge
4

In May 2005, Léon F. Gosselin, who founded Axcan in 1982, announced the separation of the roles of Chairman of the Board from that of President and Chief Executive Officer, and the appointment of Frank A.G.M. Verwiel, M.D., to the latter role. Mr. Gosselin will continue to serve Axcan as Chairman of the Board.
5
DEAR FELLOW SHAREHOLDERS:
As we look back at fiscal 2005, we would like to highlight the accomplishments of what, in many ways, was our best year ever. Not only did we achieve record sales of $251.3 million for the year, we also established Axcan's place in the gastroenterology community more solidly than ever. We have a core group of products, an enviable product pipeline, and a team of people dedicated to patients, physicians, and stakeholders.
When Axcan was created in 1982, we never dreamed of being as successful as we have been these past 23 years. Initially, our goal was to register a handful of products in Canada and create a company to sell them. Thanks to years of hard work, careful planning and a number of bold strategic moves, Axcan has greatly surpassed these objectives. Throughout the process, no resource was more important to us than the many people who worked so hard and cared so much for the patients we strived to help. From the original few to the now almost 450 employees who espouse the values of Axcan and dedicate their efforts to all patients who suffer from gastrointestinal diseases and disorders around the globe, we would like to extend a sincere "thank you".
In addition to our people, our success is also due to the decision to focus strictly within the therapeutic area where we excel—gastroenterology. In fact, the increasingly competitive environment in which the pharmaceutical industry has evolved has proven to be an asset for Axcan. Our strategy has been to enhance a growing pipeline by accessing products through selective strategic acquisitions that fueled both our business base and our research and development pipeline. In the pharmaceutical industry, a company must have the financial resources, internal capabilities, and a robust pipeline to drive sustainable growth. Today, as a fully integrated specialty pharmaceutical company in the field of gastroenterology, Axcan has internal capabilities that span research, development, manufacturing, sales and marketing. We also have the necessary elements in place, as well as a determined work ethic, that will enable us to create and maximize opportunities to drive the Company to the next level of success for the good of our patients and their physicians.
We celebrated the 20th anniversary of Axcan three years ago by entering the U.S. pharmaceutical and financial marketplace. With many opportunities ahead of us now, there could be no better 25th anniversary gift than the launch of ITAX (itopride), Axcan's drug for the treatment of functional dyspepsia. Once more we would be privileged to serve patients and physicians by addressing an unmet medical need of huge proportions. A series of important steps brought us closer to this goal during fiscal 2005. Success now depends on the ongoing efforts of our dedicated team throughout fiscal 2006; we strongly believe that 2006 will be another year of great progress with many achievements and significant milestones.
On the financial front in 2005, Axcan, as well as many of its peer companies, faced a new challenge. Several major drug wholesalers chose to change their business models by adopting a fee-for-service approach. This led the wholesalers to lower their inventory levels, resulting in a revenue decline for the Company during the first three quarters of the fiscal year. Fortunately inventories stabilized during the fourth quarter of fiscal 2005. During the last three months of the fiscal year, less than $1 million in sales were estimated to be related to inventory level adjustments and we are now confident that sales should move more closely in line with prescription trends. This bodes well for the future as we are firmly convinced that the strength of a pharmaceutical company is reflected in solid prescription trends.
In spite of this inventory challenge, the Company completed fiscal 2005 reporting record results.
Revenue from all operations rose 3.2% to $251.3 million in fiscal 2005, versus $243.6 million a year earlier, continuing the constant increase experienced by Axcan since it was founded in 1982.
Cash flows from operating activities increased by 189% this fiscal year, to $67.7 million.
6
At the completion of fiscal 2005, long-term debt, except for the convertible subordinated notes, was negligible. Our strong balance sheet and healthy core business will now allow us to move forward to meet exciting new challenges in the future.
By continuing to advance our research and development pipeline and execute on the acquisition front, both in North America and in the rest of the world, we are taking steps that will drive future growth for many years.
We take pride in the fact that we have managed our business well on behalf of all our stakeholders, and most importantly, those of you who are shareholders. A $1,000 investment on the Toronto Stock Exchange at the time of our initial public offering in December 1995, increased to more than $3,241 at our stock's highest level in fiscal 2005, an increase of 224%. Shareholders who invested in Axcan in our June 2000 issue on the NASDAQ National Market saw the value of those shares more than double. We are confident that our value-enhancing strategies will lead to continued strong performance in the future.
We conclude by expressing our appreciation to our employees. Their contributions have been invaluable and have led to the extraordinary results we have achieved since our Company began in 1982. Our performance reflects the capabilities, energy, determination and dedication that exist throughout the Company. Compassion and commitment continue to be important core values at Axcan, yielding a wide range of benefits to patients and caregivers. Our employees subscribe to these values and have contributed significantly in our efforts to improve the quality of life of patients suffering from debilitating gastrointestinal diseases and disorders. As a strong team, we have proven we can build a winning Company. We are confident that as we reach the next level of our growth, we will realize our primary goal of becoming the world's reference gastroenterology specialty pharmaceutical company.
We would also like to note that our success could not have been possible without the encouragement of our loyal customers and the worldwide gastroenterology community. Their constant support and growing recognition have been vitally important to us as we maintains leading-edge services and promote the development of new products to help those who need them live a better life.
Finally, we would like to extend a special word of appreciation to our Board of Directors and shareholders for their continued support and confidence in our Company and its future.
 Léon F. Gosselin Chairman of the Board |
Frank A.G.M. Verwiel, M.D. President and Chief Executive Officer |
7

Frank A.G.M. Verwiel, M.D.
President and Chief Executive Officer
"All the ingredients like our expertise, our people, and our pipeline are there to accelerate Axcan's growth and take it to the next level of success—becoming the reference gastrointestinal specialty pharmaceutical company."
8
OUR INVESTMENT
IN AXCAN'S FUTURE
Axcan's 2005 performance was strong and will serve as a springboard for continued success. We made significant progress toward meeting our goal of becoming the world's reference gastroenterology specialty pharmaceutical company. Because of our heavy investment in the Company in 2005, we believe we are well positioned to maximize future opportunities.
Revenue grew3.2%.
Prescriptions for products that we promote and for which prescription data is available, revealed overall prescription growth of approximately8%.
Cash flows from operating activities grew189%.
As proud as we are of these past achievements, we know that our stakeholders care most about our future. Given Axcan's consistent record of growth in a difficult market environment, I am pleased to address questions on how we intend to expand on Axcan's success as one of the world's leading gastroenterology specialty pharmaceutical companies.
9
A QUESTION AND ANSWER SESSION
WITH FRANK A.G.M. VERWIEL, M.D.
- Q:
- What attracted you to Axcan Pharma?
My attraction to Axcan grew from an understanding that the Company consists of an outstanding group of people. I was also impressed by the business model that Axcan had developed as a specialty pharmaceutical company focused on gastroenterology and by the research and development pipeline that was and continues to be one of the best in our industry. This, coupled with the opportunity to develop a product like itopride, convinced me that Axcan has all the elements it needs for outstanding growth.
- Q:
- What is your main challenge?
The main challenge we will all face as a team will be to maintain the entrepreneurial spirit that has made Axcan successful, and at the same time, develop the focus and structure necessary to take the Company to the next level.
- Q:
- What are your objectives?
My first objective is to focus on itopride in all its dimensions, including clinical development, partnerships, regulatory, and marketing programs. We will need all these assets to introduce this very important drug to the marketplace. The second point of focus is Axcan's product portfolio, both current and future. We have a tremendous opportunity with our current portfolio, and we need to make sure we make the right choices to leverage our portfolio for future growth. The third is the international dimension of the organization. It is vitally important that we build a European structure that is as solid as the one we have in North America. Our long-term goal is to essentially transform Axcan from a North American company with international operations to a truly multinational company.
- Q:
- Most of Axcan's products are mature. How will you sustain growth?
We will sustain the Company's growth by focusing on our competitive strengths, particularly our intricate knowledge of the gastroenterology market and our strong physician relationships. We intend to utilize these quality attributes to create long-term value through a solid core business and a deep development pipeline. When we invest in these core strengths with dollars generated from top-line growth, we will sustain a value cycle for our shareholders. In essence, using capital to invest in products like itopride that will drive top-line growth.
10

- Q:
- How much longer will you be able to maintain your focus on the gastroenterology market before you run out of products or the ability to expand?
We believe that we still have many opportunities in the gastroenterology area. Sales from the worldwide gastroenterology market total approximately $30 billion. We are active in a select segment of that market. Our growth strategy is based on the strength of our core business, on a robust research and development portfolio that includes itopride and other products, on acquisitions of products and/or companies, and on international expansion. We believe we still have many opportunities to grow in the field of gastroenterology.
- Q:
- How much do you intend to invest in research and development in fiscal 2006 and beyond?
As we complete the itopride program, it is reasonable to expect that research and development expenses will remain significant. We consider research and development to be a strategic investment and vital in taking Axcan to its next level of growth.
- Q:
- What are your thoughts on the gaps in the portfolio? Do you feel you can diversify the Axcan portfolio? Are there any significant opportunities beyond itopride?
As a specialty pharmaceutical company, we are always looking for opportunities to add to or enhance our pipeline. Our growth strategy is based on a robust research and development portfolio. As I mentioned, our growth strategy is also based on the growth of our current core business, as well as acquisitions of products and/or companies, and international expansion. We are confident that we have many opportunities to grow the portfolio, as well as and the Company, beyond where we are today.
11
Q: Historically, Axcan has focused on North America. How important is the international market?
Our international business is vitally important to us and a major part of our growth strategy. For the moment, U.S. revenues comprise the largest portion of our top-line growth. However, for the long-term, we believe we can grow our international business by leveraging our current international operations and by completing new acquisitions of products and/or companies in North America and abroad. We have been able to successfully integrate past acquisitions in France and to launch products in other European markets, and we are confident that we have the capability to take our international operations to the next level, thus transforming Axcan into a multinational company.
Q: What are your priorities for 2006?
- •
- First, we mustgrow our current solid business base. The products that we promote, and for which prescription data is available, show overall prescription growth of approximately 8 percent in 2005. We want to continue to focus on this core business because it represents the stability and the foundation of the Company.
- •
- Second, we want to continue to move forward on an aggressive timeline toward thecommercialization of itopride, our lead product, for the treatment of Functional Dyspepsia. We are advancing the two Phase III pivotal clinical trials for itopride and we anticipate finalizing this program in the first half of calendar 2006 in order to submit a New Drug Application to the U.S. Food and Drug Administration in Summer 2006.
- •
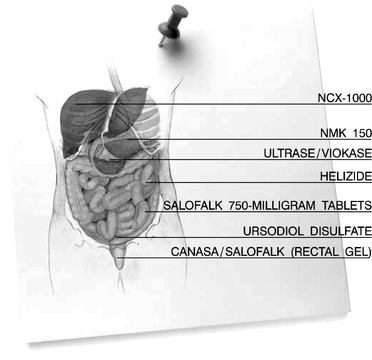
- Third, we plan toenhance our product pipeline. We are pursuing an aggressive timeline with respect to the rest of our pipeline and are encouraged by the potential of several products, such as HELIZIDE for the eradication of theHelicobacter pylori bacterium and CANASA rectal gel for distal ulcerative colitis, which should both be on the market in fiscal 2007. Another potential product is ursodiol disulfate, a drug formulation for the prevention of the recurrence of colorectal adenomateous polyps, which we believe will be the Company's next potentially significant drug, after itopride.
- •
- Last, but certainly not least, we willcontinue to build our infrastructure in North America, Europe, and the rest of the world, by targeting product or company acquisitions in the field of gastroenterology that offer a competitive advantage, growth potential, and an accretive impact on earnings.
Since my appointment in July 2005, we have completed a thorough review of our business plan and growth strategy in order to clearly focus on the opportunities ahead. We are now focused on the following four priorities:
12

Q: Does Axcan have the ability to achieve its goals?
I think Axcan has the vision, the products, the pipeline, the leadership, the commitment and the capability to become the world's reference gastroenterology specialty pharmaceutical company. I feel confident that we will meet this goal because we have the people needed to help us get where we want to be. People are, in fact, our most important asset. One of our strengths has been our ability to grow and attract a talented workforce. We want to invest in our people and that is why we will continue to provide the training tools and support necessary for developing tomorrow's leaders.
Q: Where will Axcan be in five years?
Our goal is to improve the quality of care and the health of individuals who suffer from gastrointestinal diseases and disorders by providing effective therapies to patients and their specialized caregivers. Over the next five years, we will work towards becoming the world's reference gastroenterology specialty pharmaceutical company. We plan to achieve this as we provide value-added therapeutics for a broad spectrum of unmet needs in gastroenterology. We expect this to result in enhanced shareholder investment in our Company and provide our employees with a stimulating place to work with opportunities for personal and career growth.
Q: Is there anything you would like to add before we conclude?
As I look to the future, I see not only a great gastroenterology company, but a leading specialty pharmaceutical company. Our vision is clear. We want to become the world's reference gastroenterology specialty pharmaceutical company. Reaching this milestone will, over the long term, result in an excellent return on investment for our shareholders.
13
OUR PEOPLE
Foundation for our future success
14

The people of Axcan are the driving force behind our success. Through their unwavering commitment and talent, we are able to better serve and help patients and physicians.
Our highly specialized sales force, both in North America and Europe, focuses on building relationships with physicians, opinion leaders, and leading patient organizations in gastroenterology, our core area of focus.
15
Through relationships with physicians and patients, we succeed in delivering care and therapies for the following conditions:
Inflammatory Bowel Disease, such as Crohn's Disease or Ulcerative Colitis, are believed to be caused by an immune-system-induced inflammation.
Crohn's Disease can affect any part of the alimentary canal, from the mouth to the anus, but commonly affects the small and large intestines. The wall of the intestine becomes inflamed, irritated, and ulcerated. This disease most commonly involves the lower part of the small intestine called the ileum.
In Ulcerative Colitis, the inner lining of the large intestine (colon or bowel) and rectum becomes inflamed. The inflammation may involve the rectum alone (proctitis), the rectum and sigmoid colon (distal colitis), the rectum and a large part of the colon (sub-total colitis), or the rectum and the entire colon (total or universal colitis).
Irritable Bowel Syndrome is characterized by functional irritability of the intestine. It reveals abnormalities including constipation, diarrhea, bloating, abdominal pain and similar symptoms in the digestive tract caused by excessive intestinal motion, stress, and enhancement of secretory functions.
Diseases of the liver are often congenital, although some can be prevented. Whatever their origin, these diseases can be devastating to one's health and may require professional care.
Primary Biliary Cirrhosis is a chronic, cholestatic liver disease. Such liver conditions also include Primary Sclerosing Cholangitis and pediatric cholestatic disorders. Primary Biliary Cirrhosis can eventually lead to cirrhosis, liver failure, and other life-threatening complications.
16
Pancreatic diseases and disorders include inflammation (pancreatitis), infections, tumors, and cysts. If more than 80 percent to 90 percent of the pancreas must be removed (pancreatectomy) or if normal activity of the pancreas is impaired, patients will need to take insulin and pancreatic extracts. Patients often endure pain and malnutrition, and are most likely left with a higher risk for pancreatic cancer.
Cystic Fibrosis is, by far, the most commonly inherited pancreatic disease of childhood. It accounts for about 90 percent of childhood pancreatic disorders. The small tubes inside the pancreas, which allow digestive enzymes to reach the intestine, become blocked with mucus and protein and the pancreas becomes badly scarred and shrinks. Many children with Cystic Fibrosis show evidence of severe pancreatic failure immediately following birth, and by two years of age 90 percent of Cystic Fibrosis patients are diagnosed, usually with severe malnutrition. Approximately 85 percent of all people with Cystic Fibrosis have pancreatic insufficiency and need to take pancreatic enzymes with meals.
Duodenal ulcer is caused by the way the lining of the duodenum copes with acid. The duodenum makes chemicals and mucus that cover the surface and protect the tissues from acid. An ulcer occurs if acid breaks through the protective lining. The causes of duodenal ulcers includeHelicobacter pylori infection or the intake of anti-inflammatory medicines.
Other gastrointestinal diseases and disorders. Axcan also markets other products for the treatment of gastrointestinal diseases and disorders including gastric hyperacidity, heartburn, constipation, diarrhea, gastric ulcer, oesophagitis, and palliative and curative treatments for various forms of cancer.
17
Through acquisitions of products and/or companies, we have a diversified product portfolio, thus minimizing the risks often associated with smaller companies.
For fiscal 2005, revenue totalled $251.3 million. Sales for our main products, as a percentage of revenue, were divided as follows:
MESALAMINE
In the United States, Axcan markets 1000-milligram CANASA suppositories as indicated for Ulcerative Proctitis. This new dosage form launched in the United States in February 2005, complements the CANASA 500-milligram suppositories already on the market and provides convenient, once-per-day dosing. For fiscal 2005, sales of CANASA totalled $28.7 million.
In Canada, Axcan markets the SALOFALK product line (tablets, suspensions and suppositories) for the treatment of certain Inflammatory Bowel Diseases, including Ulcerative Colitis and Crohn's Disease. For fiscal 2005, sales of SALOFALK totalled $14.5 million.
PANCREATIC ENZYMES
In the United States and Canada, Axcan markets ULTRASE to help patients with exocrine pancreatic insufficiency, as associated with but not limited to Cystic Fibrosis, to better digest food. The Company also markets VIOKASE as a digestive aid for the treatment of exocrine pancreatic insufficiency and pancreatic enzyme deficiency as associated with, but not limited to, chronic pancreatitis and surgical ablation of the pancreas. For fiscal 2005, sales of ULTRASE in North America amounted to $36.0 million and sales of VIOKASE were $7.9 million.
In Europe, Axcan markets PANZYTRAT for the treatment of exocrine pancreatic insufficiency and pancreatic enzyme deficiency. For fiscal 2005, PANZYTRAT generated sales of $14.8 million.
18

We have made continued progress in building relationships and increasing recognition in our targeted markets.
URSODIOL
In the United States, Axcan markets URSO 250 and URSO Forte for the treatment of Primary Biliary Cirrhosis. Sales of URSO 250 and URSO Forte amounted to $36.0 million for fiscal 2005.
In Canada, Axcan markets URSO and URSO DS for the treatment of cholestatic liver diseases and disorders, including Primary Biliary Cirrhosis. Sales of URSO and URSO DS were $11.1 million for fiscal 2005.
In France, Axcan markets DELURSAN for the treatment of cholestatic liver diseases, including Primary Biliary Cirrhosis, Primary Sclerosing Cholangitis, and liver disorders related to Cystic Fibrosis. Sales of DELURSAN totalled $13.1 million for fiscal 2005.
CARAFATE-SULCRATE
CARAFATE and SULCRATE are indicated for the treatment of gastric duodenal ulcers. CARAFATE is sold in the United States and SULCRATE is sold in Canada. For fiscal 2005, combined sales of CARAFATE and SULCRATE were $38.1 million.
OTHER GASTROINTESTINAL PRODUCTS
Axcan markets other products such as MODULON, LACTÉOL, TAGAMET, PROCTOSEDYL, BENTYL/BENTYLOL, ADEKs, SCANDISHAKE, SCANDICAL, FLUTTER and CORTENEMA for the treatment of various gastrointestinal diseases and disorders. For fiscal 2005, combined sales of these products reached $51.1 million.
19
OUR PIPELINE
Promise for better treatments
20

We aspire to make Axcan the world's reference gastroenterology specialty pharmaceutical company. One way to achieve this is to offer value-added therapeutics for a broad spectrum of unmet needs in gastroenterology for patients and physicians. Our goal is within reach because we have a robust pipeline and a commitment to excellence in the development of gastrointestinal products that will have a profoundly positive impact on patients with debilitating diseases.
21
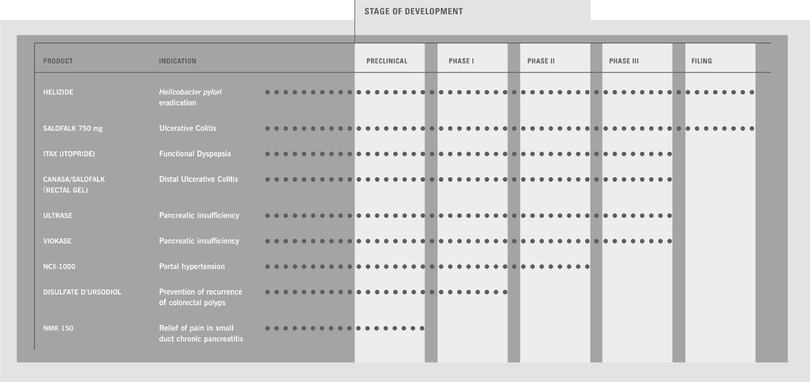
OUR RESEARCH
AND DEVELOPMENT PORTFOLIO
By combining the successes of our internal research and development efforts with our product-licensing strategy, we have built a strong research and development pipeline filled with promising products. Our diverse pipeline mitigates the risks of drug development because we have a balanced mix of both short-and long-term opportunities in the development of products for various functions of the gastrointestinal system.

The management team at Axcan recently conducted a thorough review of the Company's product pipeline to reprioritize projects and focus resources on highest-value opportunities. An update on Axcan's most important projects follows:
22

ITAX (ITOPRIDE)
Functional Dyspepsia, a disorder of the upper gastrointestinal tract, affects up to 25 percent of the North American population annually and accounts for up to 5 percent of all visits to primary care physicians. Dyspepsia can be defined as pain or discomfort centered in the upper abdomen, characterized by abdominal fullness, early satiety, bloating, or nausea. The term functional or non-ulcer dyspepsia refers to relapsing or chronic dyspepsia in patients without evidence of organic disease to explain the symptoms.
Currently, there is no approved product in North America for the treatment of Functional Dyspepsia. To date, patients living with these distressing symptoms have no satisfying therapeutic option available to them.
Itopride is a gastroprokinetic drug effective through a dual mechanism of action. First, it acts as a dopamine antagonist on D2-receptors thereby increasing the secretion of acetylcholine; and secondly, it prevents hydrolysis of the released acetylcholine by the acetylcholinesterase enzyme in the smooth muscles. Acetylcholine is an important endegenois substance involved in the motor activity of the gastrointestinal tract. Itopride has also been shown to have anti-emetic properties.
23
Axcan is conducting two pivotal Phase III trials, one in North America and the other internationally, aimed at demonstrating the efficacy of itopride in the treatment of Functional Dyspepsia. At the end of calendar 2005, all patients required in both the International and North American trials had been randomized. In addition, all patients required for the supplementary 6-month and 1-year safety studies had been enrolled.
Axcan expects to release the overall outcome of the international Phase III trial during the first half of calendar 2006, followed shortly by that of the North American Phase III trial. Assuming a positive outcome of the trials, the Company intends to submit this product candidate for Food and Drug Admnistration approval in Summer 2006.
In addition to Phase III trials, a cardiac safety study to examine itopride in doses of up to four times the proposed therapeutic dose was completed, and results showed no cardiac adverse drug reaction.
Finally, the clinical work on most of the additional Phase I studies required to complement the New Drug Application for submission to the Food and Drug Admnistration is now complete. Data are currently being analyzed.
We also implemented a core team responsible for planning, directing and coordinating the development and commercialization of itopride, to ensure that we effectively and successfully bring this product to market. This team will also manage and coordinate the complete life cycle of itopride, from Phase III to launch and immediate post-launch activities.
24
HELIZIDE
The discovery in 1983 of theHelicobacter pylori organism was one of the major advances in gastroenterology in recent decades, as it has revolutionized the approach to many upper gastrointestinal disorders.Helicobacter pylori is believed to cause a spectrum of diseases in humans, including gastritis, ulcer disease (gastric and duodenal), gastric cancer, and gastric lymphoma.
Axcan conducted a 275-patient Phase III trial comparing the HELIZIDE regimen (three single-triple capsules given four times per day, plus omeprazole 20-milligram twice per day) to the widely used OAC (omeprazole, amoxicillin and clarithromycin) combination. Results confirmed that HELIZIDE is statistically and clinically comparable to OAC and that HELIZIDE has the potential as a first-line therapy for the eradication ofHelicobacter pylori.
A New Drug Application has been filed in the United States. The Food and Drug Administration has raised bismuth-related manufacturing issues in connection with the approval of HELIZIDE, which must be resolved before approval is granted. Axcan has successfully qualified a manufacturer of bismuth salt, a component of the HELIZIDE combination therapy for the eradication of theHelicobacter pylori bacterium. Final results of stability tests on the bismuth salt should be available during the first quarter of fiscal 2006, which should allow Axcan to file an amendment to the New Drug Application during the second quarter of fiscal 2006.
SALOFALK 750-MILLIGRAM TABLETS
Axcan completed a 114-patient Phase III trial, for the Canadian market, on the efficacy and safety of a new 750-milligram mesalamine tablet for the oral treatment of ulcerative colitis. Axcan submitted a Supplemental New Drug Submission in Canada during the first quarter of fiscal 2004. The Company received, and responded to, questions in a non-approvable letter from Health Canada and anticipates a response in the first half of fiscal 2006.
CANASA/SALOFALK (RECTAL GEL)
Axcan in-licensed from Gentium SpA, an Italian company, exclusive rights to develop and market in North America a new mesalamine rectal gel to be developed for the treatment of distal ulcerative colitis. Axcan completed an open-label, randomized 180-patient Phase III study to assess the evolution of the clinical symptoms of the disease during the induction of remission by this new formulation. The data from this study are currently being analyzed. The Company plans to submit regulatory filings for approvals in the United States and Canada in the first half of calendar 2006.
25
ULTRASE AND VIOKASE
Axcan already markets in the United States ULTRASE and VIOKASE for the treatment of pancreatic insufficiency. In April 2004, the Food and Drug Administration formally notified manufacturers of pancreatic insufficiency products that these drugs must receive approval before 2008 in order to remain on the market. The Food and Drug Administration decided to require New Drug Applications for all pancreatic extract drug products after reviewing data that showed substantial variation among currently marketed products. Axcan has completed a Phase III study of VIOKASE that will serve as the basis of the New Drug Application it expects to submit by Spring 2007. The data from this study are currently being analyzed. The study on ULTRASE is in process and is anticipated to be completed and submitted by Spring 2007.
NCX-1000
NCX-1000, a nitric oxide-releasing derivative of ursodiol, is in preclinical development for the treatment of portal hypertension, a complication of chronic liver diseases. Several animal studies have already shown the pharmacological effects of NCX-1000 on portal hypertension. Experimental models of cirrhosis demonstrated that this compound reduces portal pressure by decreasing intrahepatic resistance, rather than through direct effects on the portal vasculature. A Phase I clinical study involving 16 subjects was successfully completed, demonstrating tolerability and safety. The protocol of a pilot, therapeutic, proof-of-concept Phase II a study was approved by the relevant Ethical Review Board. The center where the study will be conducted has started the identification of potential patients. The study should be completed by the end of fiscal 2006.
URSODIOL DISULFATE
Axcan is currently studying the use of a new ursodiol derivative, ursodiol disulfate, in the prevention of the recurrence of colorectal adenomateous polyps. Preliminary results of studies conducted with ursodiol disulfate showed that ursodiol disulfate reduces the number of aberrant crypts in a rat model of colon cancer. Aberrant crypts are considered early abnormal changes in the intestinal lining that are precursors to colon cancer. In a small pilot study, where rats were injected with the carcinogen azoxymethane, a 56 percent reduction in the total number of aberrant crypts in the colon was observed after four weeks in those animals treated with this new ursodiol formulation compared with control models. URSODIOL DISULFATE alone fed to rats had no adverse effects on the appearance of the lining of the colon. Long-term animal studies are ongoing to determine the effect of ursodiol disulfate on the time of appearance, the number, and the size of colonic tumors in the azoxymethane rat model of chemically-induced colon cancer. Positive results of this proof-of-concept study were announced during the first half of fiscal 2004 and animal toxicity studies were then initiated. Both acute and subchronic toxicity studies have been completed and confirmed that the compound is safe and has no toxicity effect. Clinical Phase I studies should be initiated in the first half of fiscal 2006.
NMK 150
Axcan and Nordmark GmbH, a German pharmaceutical firm, are collaborating in the development of NMK 150, a new high-protease pancrelipase preparation for the relief of pain in small duct chronic pancreatitis. NMK 150 is expected to enter dose-ranging preclinical studies in the first quarter of fiscal 2006 to confirm the absence of mucosal irritation associated with the use of high doses of the drug. Phase I clinical trials should begin in the second quarter of fiscal 2006.
26
COMMUNITY INVOLVEMENT
We have managed to grow without ever losing our fundamental quality of being a Company with a human face by remaining true to our core values and by keeping our doors wide open, both inside the organization and outwards to the community.
Axcan takes its role as a corporate citizen very seriously. Every year, we support a variety of social and charitable causes. Throughout our history, we have shown a commitment to promoting the human, economic and cultural development of the municipalities and regions where we operate.
SOCIAL RESPONSIBILITY
We are committed to offering our employees a high quality working environment with opportunities for satisfaction and personal development. Our management philosophy is based on respect for the individual; each employee is important, and we make every effort to ensure that employee contributions are identified and acknowledged. As a result, Axcan is able to rely on a motivated team of individuals who are dedicated to our success. Our flat and flexible organizational structure has always kept us close to our employees, and through various programs, they become real partners in the Company, which enhances their feelings of belonging and accountability. Equally important, Axcan offers employees opportunities to grow within the Company through professional development and training programs.
ENVIRONMENTAL PROTECTION
Because environmental protection is important, we at Axcan are constantly working to improve environmental friendliness and sustainable development.
Axcan generates a small amount of hazardous waste that is disposed of by certified third-party carriers. We believe that compliance with environmental regulations has no material impact on capital expenditures, earnings, or Axcan's competitive position. We periodically require reviews of our compliance with environmental laws and regulations to ensure continued cooperation with applicable norms.
We want environmental protection to become a way of life, a way of thinking, a way of managing our Company, and an everyday concern that involves more than simply achieving the main objectives of our environmental policy. We want to do everything possible to improve the environment.
27
MANAGEMENT'S DISCUSSION
and analysis of financial condition and
results of operations
28
MANAGEMENT'S DISCUSSION AND ANALYSIS OF FINANCIAL CONDITION AND
RESULTS OF OPERATIONS
This discussion should be read in conjunction with the information contained in Axcan's consolidated financial statements and the related notes thereto. All amounts are in U.S. dollars.
OVERVIEW
Axcan is a leading speciality pharmaceutical company concentrating in the field of gastroenterology, with operations in North America and Europe. Axcan markets and sells pharmaceutical products used in the treatment of a variety of gastrointestinal diseases and disorders. The Company seeks to expand its gastrointestinal franchise by in-licensing products and acquiring products or companies, as well as developing additional products and expanding indications for existing products. Axcan's current products include ULTRASE, PANZYTRAT and VIOKASE for the treatment of certain gastrointestinal symptoms related to cystic fibrosis in the case of ULTRASE and PANZYTRAT; URSO / URSO 250, URSO FORTE / URSO DS and DELURSAN for the treatment of certain cholestatic liver diseases; SALOFALK and CANASA for the treatment of certain inflammatory bowel diseases; and CARAFATE / SULCRATE for the treatment of gastric duodenal ulcers. Axcan has a number of pharmaceutical projects in all phases of development, including ITAX for the treatment of functional dyspepsia. In the first quarter of fiscal 2004, Axcan filed a supplemental New Drug Submission for a new 750-milligram mesalamine (5-ASA) tablet for the oral treatment of ulcerative colitis. On March 24, 2005, Axcan received a non-approval letter from the Therapeutic Products Directorate of Health Canada containing a list of questions and comments for both the clinical and Chemistry, Manufacturing and Controls aspects of the original New Drug Submission. Axcan responded to all questions in the nonapprovable letter during the third quarter of fiscal 2005 and expects to obtain a final response in the first half of fiscal 2006.
For the year ended September 30, 2005, revenue was $251.3 million, operating income was $40.4 million and net income was $26.4 million. Revenue from sales of Axcan's products in the United States was $159.7 million (63.5% of total revenue) for the year ended September 30, 2005, compared to $166.7 million (68.4% of total revenue) for fiscal 2004 and $113.9 million for fiscal 2003. In Canada, revenue was $34.4 million (13.7% of total revenue) for the year ended September 30, 2005, compared to $28.0 million (11.5% of total revenue) for fiscal 2004 and $20.6 million for fiscal 2003. In Europe, revenue was $57.1 million (22.7% of total revenue) for the year ended September 30, 2005, compared to $48.7 million (20.0% of total revenue) for fiscal 2004 and $44.5 million for fiscal 2003.
Axcan's revenue historically has been and continues to be principally derived from sales of pharmaceutical products to large pharmaceutical wholesalers and large chain pharmacies. Axcan utilizes a "pull-through" marketing approach that is typical of pharmaceutical companies. Under this approach, Axcan's sales representatives demonstrate the features and benefits of its products to gastroenterologists who may write their patients' prescriptions for Axcan's products. The patients, in turn, take the prescriptions to pharmacies to be filled. The pharmacies then place orders with the wholesalers or, in the case of large chain pharmacies, their distribution centers, to whom Axcan sells its products.
Axcan's expenses are comprised primarily of selling and administrative expenses (including marketing expenses), cost of goods sold (including royalty payments to those companies from whom Axcan licenses some of its products), research and development expenses as well as depreciation and amortization.
Axcan's annual and quarterly operating results are primarily affected by three factors: wholesaler buying patterns; the level of acceptance of Axcan's products by gastroenterologists and their patients; and the extent of Axcan's control over the marketing of its products.
Historically, wholesalers' business models in the U.S. were dependent on drug price inflation. Their profitability and gross margins were directly tied to purchasing several months of inventory at pre-price increase prices and selling the inventory to the trade at the new higher price. This inventory price arbitrage was predominantly how wholesalers were compensated for the distribution services they provided and had a dramatic effect on wholesaler buying patterns as they invested in inventories in anticipation of generating higher gross margins from price increases from manufacturers. More recently, for a number of reasons, pharmaceutical manufacturers have not been increasing drug prices as frequently and the increases, as a percentage, have been lower. For these and other reasons, some wholesalers moved to a fee-for-service type arrangement where fees are now typically expressed as a percentage of the wholesaler's purchases from the manufacturer or as an amount per piece per unit. For wholesalers, fee-for-service means their compensation will be periodic and volume activity based as opposed to price increase based.
As a result of the move to a fee-for-service business model, wholesalers are no longer investing in inventory ahead of anticipated price increases and are reducing their carrying levels of inventory from their historical norms. Under the new model, manufacturers will now realize the benefit of price increase more rapidly and pay wholesalers for the services they provide on a fee for service basis. This change in wholesaler's business model affected Axcan's revenue in fiscal 2005.
29
The level of patient and physician acceptance of Axcan's products, as well as the availability of similar therapies, which may be less effective but also less expensive than some of Axcan's products, impact Axcan's revenues by driving the level and timing of prescriptions for its products.
CRITICAL ACCOUNTING POLICIES
Axcan's consolidated financial statements are prepared in accordance with generally accepted accounting principles in the United States of America ("U.S. GAAP"), applied on a consistent basis. Axcan's critical accounting policies include the use of estimates, revenue recognition, the recording of research and development expenses and the determination of the useful lives or fair value of goodwill and intangible assets. Some of our critical accounting policies require the use of judgment in their application or require estimates of inherently uncertain matters. Although our accounting policies are in compliance with U.S. GAAP, a change in the facts and circumstances of an underlying transaction could significantly change the application of our accounting policies to that transaction, which could have an effect on our financial statements. Discussed below are those policies that we believe are critical and require the use of complex judgment in their application.
USE OF ESTIMATES
The preparation of financial statements in accordance with U.S. GAAP requires management to make estimates and assumptions that affect the recorded amounts of assets and liabilities and disclosure of contingent assets and liabilities as of the date of financial statements and the disclosure of recognized amounts of revenues and expenses during the year. Significant estimates and assumptions made by management include the allowance for accounts receivable and inventories, reserves for product returns, rebates and chargebacks, the classification of intangible assets between finite and indefinite life, useful lives of long-lived assets, the expected cash flows used in evaluating long-lived assets, goodwill and investments for impairment, contingency provisions and other accrued charges. These estimates were made using the historical information and various other factors related to each circumstance available to management. The Company reviews all significant estimates affecting the financial statements on a recurring basis and records the effect of any adjustments when necessary. Actual results could differ from those estimates based upon future events, which could include, among other risks, changes in regulations governing the manner in which we sell our products, changes in health care environment and managed care consumption patterns.
REVENUE RECOGNITION
Revenue is recognized when the product is shipped to the Company's customer, provided the Company has not retained any significant risks of ownership or future obligations with respect to the product shipped. Provisions for sales discounts and estimates for chargebacks, managed care and Medicaid rebates and product returns are established as a reduction of product sales revenues at the time such revenues are recognized. These revenue reductions are established by us as our best estimate at the time of sale based on historical experience adjusted to reflect known changes in the factors that impact such reserves. These revenue reductions are generally reflected as an addition to accrued expenses.
We do not provide any forms of price protection to our wholesale customers and permit product returns only if the product is returned within 12 months of expiration. Credit for returns is issued to the original purchaser at current net pricing less 10%. Accrued liabilities include reserves of $7.5 million and $6.1 million as of September 30, 2005, and September 30, 2004, respectively for estimated product returns.
In the United States, we establish and maintain reserves for amounts payable by us to managed care organizations and state Medicaid programs for the reimbursement of portions of the retail price of prescriptions filled that are covered by the respective programs. We also establish and maintain reserves for amounts payable by us to wholesale distributors for the difference between their regular sale price and the contract price for the products sold to our contract customers. The amounts estimated to be paid relating to products sold are recognized as revenue reductions and as additions to accrued expenses at the time of sale based on our best estimate of the product's utilization by these managed care and state Medicaid patients and sales to our contract customers, using historical experience adjusted to reflect known changes in the factors that impact such reserves. Accrued liabilities include reserves of $4.8 million and $2.8 million as of September 30, 2005, and September 30, 2004, respectively, for estimated rebates and chargebacks.
30
If the levels of chargebacks, managed care and Medicaid rebates, product returns and discounts fluctuate significantly and / or if our estimates do not adequately reserve for these reductions of net product revenues, our reported revenue could be negatively affected.
GOODWILL AND INTANGIBLE ASSETS
We have in the past acquired products and businesses that include goodwill, trademarks, license agreements and other identifiable intangible assets. Axcan's goodwill and intangible assets are stated at cost, less accumulated amortization. Since October 1, 2001, the Company does not amortize goodwill and intangible assets with an indefinite life. However, management assesses the impairment of goodwill and intangible assets at least annually and whenever events or changes in circumstances indicate that the carrying amounts of these assets may not be recoverable, by comparing the carrying value of the unamortized portion of goodwill and intangible assets to the future benefits of the Company's activities or expected sales of pharmaceutical products. Should there be a permanent impairment in value or if the unamortized balance exceeds recoverable amounts, a write-down will be recognized, for the current year. To date, Axcan has not recognized any significant impairment in value.
Intangible assets with finite life are amortized over their estimated useful lives according to the straight-line method at annual rates varying from 4 to 15%. The straight-line method of amortization is used because it reflects, in the opinion of management, the pattern in which the intangible assets with finite life are used. In determining the useful life of intangible assets, the Company considers many factors including the intention of management to support the asset on a long-term basis by maintaining the level of expenditure necessary, the use of the asset, the existence and expiration date of a patent, the existence of a generic or competitor and any legal or regulatory provisions that could limit the use of the asset.
As a result of acquisitions, we included $27.5 million of goodwill on our consolidated balance sheets as of September 30, 2005, and September 30, 2004.
Also as a result of acquisitions of product rights and other identifiable intangible assets, we included $388.9 million and $407.9 million as net intangible assets on our consolidated balance sheets as of September 30, 2005, and September 30, 2004. Estimated annual amortization expense for intangible assets with a finite life, which have a weighted-average remaining amortization period of approximately 17 years, for the next five fiscal years, is approximately $16.6 million.
RESEARCH AND DEVELOPMENT EXPENSES
Research and development expenses are charged to operations in the year they are incurred. Acquired in-process research and development having no alternative future use is written off at the time of acquisition. The cost of intangibles that are acquired from others for a particular research and development project, with no alternative use, is written off at the time of acquisition.
ACQUISITION OF PRODUCTS
On November 18, 2003, the Company acquired the rights to a group of products from Aventis Pharma S.A. ("Aventis"). The $145.0 million purchase price was paid out of Axcan's cash on hand. These products are CARAFATE and BENTYL for the U.S. market and SULCRATE, BENTYLOL and PROCTOSEDYL for the Canadian market (collectively, "AVAX" product line).
On August 29, 2003, the Company acquired an exclusive license for North America, the European Union and Latin America, from Abbott Laboratories ("Abbott") to develop, manufacture and market ITAX, a patented gastroprokinetic drug. Under the terms of this license agreement, the Company paid $10.0 million in cash and assumed $2.0 million in research contract liability.
On December 10, 2002, the Company acquired the rights to the Ursodiol 250 mg tablets DELURSAN for the French market from Aventis, for a cash purchase price of $22.8 million.
On December 3, 2002, the Company acquired the worldwide rights to the PANZYTRAT enzyme product line from Abbott for a cash purchase price of $45.0 million.
31
During a transition period ended during the 2005 fiscal year, the seller in certain of these acquisition transactions acted as selling agent for the management of these products. For the year ended September 30, 2005, sales of some of these products were still managed in part by the sellers. Axcan included in its revenue the net sales from such products less corresponding cost of goods sold and other seller related expenses. Consequently, although net sales of such products for the year ended September 30, 2005, were $2,431,789 ($7,667,940 in 2004 and $14,255,979 in 2003), the Company only included in its revenue an amount of $949,866 ($4,685,673 in 2004 and $9,463,645 in 2003) representing the net sales less cost of goods sold and other seller related expenses.
RESULTS OF OPERATIONS
The following table sets forth, for the years indicated, the percentage of revenue represented by items in Axcan's consolidated statements of operations:
| For the years ended September 30 | 2005 | 2004 | 2003 | ||||
|---|---|---|---|---|---|---|---|
| | % | % | % | ||||
| Revenue | 100.0 | 100.0 | 100.0 | ||||
| Cost of goods sold | 28.5 | 22.2 | 24.8 | ||||
| Selling and administrative expenses | 34.2 | 31.4 | 35.2 | ||||
| Research and development expenses | 12.7 | 8.2 | 6.8 | ||||
| Acquired in-process research | — | — | 6.7 | ||||
| Depreciation and amortization | 8.6 | 6.7 | 4.5 | ||||
| 84.0 | 68.5 | 78.0 | |||||
| Operating income | 16.0 | 31.5 | 22.0 | ||||
| Financial expenses | 2.8 | 2.8 | 2.4 | ||||
| Interest income | (0.5 | ) | (0.3 | ) | (0.9 | ) | |
| Loss (gain) on foreign exchange | (0.1 | ) | (0.1 | ) | — | ||
| Takeover-bid expenses | — | — | 2.1 | ||||
| 2.2 | 2.4 | 3.6 | |||||
| Income before income taxes | 13.8 | 29.1 | 18.4 | ||||
| Income taxes | 3.3 | 9.1 | 7.3 | ||||
| Net income | 10.5 | 20.0 | 11.1 | ||||
QUARTERLY RESULTS
(amounts in thousands of dollars, except share related data)
YEAR ENDED SEPTEMBER 30, 2005, COMPARED TO YEAR ENDED
SEPTEMBER 30, 2004
| | | | Net income per share | |||||
|---|---|---|---|---|---|---|---|---|
| Quarter | | Net income | ||||||
| Revenue | Basic | Diluted | ||||||
| | $ | $ | $ | $ | ||||
| 2005 | ||||||||
| First | 61,583 | 7,754 | 0.17 | 0.16 | ||||
| Second | 63,364 | 5,425 | 0.12 | 0.12 | ||||
| Third | 59,409 | 4,097 | 0.09 | 0.09 | ||||
| Fourth | 66,987 | 9,149 | 0.20 | 0.19 | ||||
2004 | ||||||||
| First | 57,565 | 10,435 | 0.23 | 0.21 | ||||
| Second | 63,192 | 12,421 | 0.27 | 0.24 | ||||
| Third | 62,005 | 12,552 | 0.28 | 0.25 | ||||
| Fourth | 60,872 | 13,320 | 0.29 | 0.26 | ||||
REVENUE
For the year ended September 30, 2005, revenue was $251.3 million compared to $243.6 million for the preceding fiscal year, an increase of 3.2%.This increase in revenue primarily resulted from higher sales in Canada and Europe partly offset by lower sales in the United States following an announced intention from major wholesalers to reduce their inventory levels. The end-customer prescription demand continues to show positive growth for most of our products sold in the United States which leads us to believe that this reduction in revenue is only temporary and that sales should increase when our major wholesalers reach their targeted inventory levels.
32
Revenue is stated net of deductions for product returns, chargebacks, contract rebates, discounts and other allowances of $39.4 million (13.6% of gross revenue) in fiscal 2005, and $28.8 million (10.6% of gross revenue) in fiscal 2004. This increase of total deductions as a percentage of gross revenue is primarily due to an increase in returns and chargebacks in fiscal 2005.
PRODUCT SALES
Key sales figures for fiscal 2005 are as follows:
- •
- Sales of pancreatic enzymes (ULTRASE, PANZYTRAT and VIOKASE) amounted to $58.7 million, an increase of 2.5% over fiscal 2004 sales of pancreatic enzymes.
- •
- Sales of ursodiol (URSO / URSO 250, URSO FORTE / URSO DS and DELURSAN) increased 7.3% to $60.2 million.
- •
- Sales of mesalamine (CANASA and SALOFALK) amounted to $43.2 million, a 14.1% decrease from the prior year. This decrease was caused by larger than usual wholesaler orders in the last quarter of fiscal 2004, which resulted in a 92% increase in sales of fiscal 2004 compared to the prior fiscal year. Often, customers will buy in advance of pre-announced price increases or in anticipation of a price increase, thus shifting revenue from one period to another.
- •
- Sales of the AVAX product line amounted to $44.6 million, an increase of 6.7% over the previous fiscal year.
- •
- Sales of PHOTOFRIN and other products in North America amounted to $14.0 million, a 6.9% increase from the prior year.
- •
- Sales of other products in Europe, mainly LACTÉOL and TAGAMET, amounted to $29.4 million, a 19.0% increase over the prior year. This increase is mainly due to higher sales of LACTEOL.
COST OF GOODS SOLD
Cost of goods sold consists principally of costs of raw materials, royalties and manufacturing costs. Axcan outsources most of its manufacturing requirements. For the year ended September 30, 2005, cost of goods sold increased $17.3 million (31.9%) to $71.5 million from $54.2 million for the preceding fiscal year. As a percentage of revenue, cost of goods sold for the year ended September 30, 2005, increased as compared to the preceding fiscal year from 22.2% to 28.5%. This increase in the cost of goods sold as a percentage of revenue was due mainly to the write-down of inventory of finished goods with less than twelve months of shelf life, an increase in sales of products with a lower margin and a reduction in sales of products with a higher margin. Cost of goods sold for the year ended September 30, 2005, includes $4.7 million related to the write-down of inventory of finished goods for one product line sold in the United States.
SELLING AND ADMINISTRATIVE EXPENSES
Selling and administrative expenses consist principally of salaries and other costs associated with Axcan's sales force and marketing activities. Selling and administrative expenses increased $9.6 million (12.6%) to $86.0 million for the year ended September 30, 2005, from $76.4 million for the preceding fiscal year. This increase is mainly due to an increase in our sales force in preparation for additional products to be marketed, including ITAX, additional marketing efforts on our current products, increased distribution cost following the signing of a new agreement with a major wholesaler and consulting fees for Information Technology implementation and regulatory compliance.
RESEARCH AND DEVELOPMENT EXPENSES
Research and development expenses consist principally of fees paid to outside parties that Axcan uses to conduct clinical studies and to submit governmental approval applications on its behalf as well as the salaries and benefits paid to its personnel involved in research and development projects. Research and development expenses increased $12.0 million (60.3%) to $31.9 million for the year ended September 30, 2005, from $19.9 million for the preceding fiscal year. This increase is mainly due to the Phase III development of ITAX, acquired in August 2003, for the treatment of functional dyspepsia. Phase III is the most expensive stage of clinical development.
DEPRECIATION AND AMORTIZATION
Depreciation and amortization consists principally of the amortization of intangible assets with a finite life. Intangible assets include trademarks, trademark licenses and manufacturing rights. Depreciation and amortization increased $5.1 million (31.1%) to $21.5 million for the year ended September 30, 2005, from $16.4 million for the preceding fiscal year. The increase is mainly due to the amortization of the AVAX product line acquired from Aventis on November 18, 2003, and of PANZYTRAT which was reclassified from intangible assets with an indefinite life to intangible assets with a finite life on October 1, 2004.
33
FINANCIAL EXPENSES
Financial expenses consist principally of interest and fees paid in connection with money borrowed for acquisitions. Financial expenses increased $0.2 million (2.9%) to $7.1 million for the year ended September 30, 2005, from $6.9 million for the preceding fiscal year.
INCOME TAXES
Income taxes amounted to $8.4 million for the year ended September 30, 2005, compared to $22.3 million for the preceding fiscal year. The effective tax rates were 24.1% for the year ended September 30, 2005, and 31.4% for the year ended September 30, 2004. The decrease in effective tax rate is mainly due to research and development tax credits, deducted from the income tax expense, of $2.6 million for the year ended September 30, 2005, compared to $1.2 million for the preceding fiscal year.
The income tax expense and corresponding tax rate are summarized in the following tables:
| For the years ended September 30 | 2005 | 2004 | |||
|---|---|---|---|---|---|
| | $ | $ | |||
| Income tax expense | |||||
| Income tax | 11,032 | 23,416 | |||
| Research and development tax credits | (2,619 | ) | (1,163 | ) | |
| Income tax expense | 8,413 | 22,253 | |||
| For the years ended September 30 | 2005 | 2004 | |||
|---|---|---|---|---|---|
| | % | % | |||
| Income tax rate | |||||
| Income tax | 31.7 | 33.0 | |||
| Research and development tax credits | (7.6 | ) | (1.6 | ) | |
| Effective tax rate | 24.1 | 31.4 | |||
NET INCOME
Net income was $26.4 million or $0.58 of basic income per share and $0.56 of diluted income per share, for the year ended September 30, 2005, compared to $48.7 million or $1.08 of basic income per share and $0.96 of diluted income per share for the preceding year. The reduction in net income for the year ended September 30, 2005, resulted mainly from an increase in revenue of $7.7 million, an increase in operating expenses totalling $44.1 million and a decrease in income taxes of $13.8 million. The weighted average number of common shares outstanding used to establish the basic per share amounts increased from 45.3 million for the year ended September 30, 2004, to 45.6 million for the year ended September 30, 2005, following the exercise of options previously granted pursuant to Axcan's stock option plan. The weighted average number of common shares used to establish the diluted per share amounts increased from 55.0 million for the year ended September 30, 2004 to 55.2 million for the year ended September 30, 2005.
YEAR ENDED SEPTEMBER 30, 2004, COMPARED TO YEAR ENDED
SEPTEMBER 30, 2003
REVENUE
For the year ended September 30, 2004, revenue was $243.6 million compared to $179.1 million for the preceding fiscal year, an increase of 36.0%. This increase in revenue primarily resulted from $41.8 million in U.S. and Canadian sales of the AVAX product line which was acquired in November 2003 and strong sales of CANASA in the U.S. Revenues from sales made by the French subsidiary, following the acquisition of DELURSAN as well as the PANZYTRAT product line, also contributed to the increase.
34
PRODUCT SALES
Key sales figures for fiscal 2004 are as follows:
- •
- Sales of pancreatic enzymes (ULTRASE, PANZYTRAT and VIOKASE) amounted to $57.3 million, a decrease of 1.0% over fiscal 2003 sales of pancreatic enzymes. PANZYTRAT acquired in the first quarter of fiscal 2003, accounted for $10.2 million of these sales in fiscal 2003 and $13.5 million in fiscal 2004;
- •
- Sales of ursodiol (URSO 250, URSO DS and DELURSAN) increased 4.0% to $56.1 million. DELURSAN acquired in the second quarter of fiscal 2003, accounted for $6.9 million of these sales in fiscal 2003, and $10.8 million in fiscal 2004;
- •
- Sales of mesalamine (CANASA and SALOFALK) amounted to $50.3 million, a 92.0% increase from the prior year. The increase offsets the 24% decrease announced in fiscal 2003 and reflects not only the increase in prescriptions but also the fluctuations in wholesalers buying patterns. Often, customers will buy in advance of pre-announced price increases or in anticipation of a price increase, thus shifting revenue from one period to another.
- •
- Sales of the AVAX product line amounted to $41.8 million. The AVAX product line was acquired in November 2003.
- •
- Sales of PHOTOFRIN and other products in North America amounted to $14.1 million, the same total as for the prior year.
- •
- Sales of other products in Europe, mainly LACTÉOL and TAGAMET, amounted to $23.7 million, a 14% decrease over the prior year. This decrease is mainly due to lower sales of TAGAMET following changes in the regulatory rules applicable to this product.
COST OF GOODS SOLD
Cost of goods sold increased $9.7 million (21.8%) to $54.2 million for the year ended September 30, 2004, from $44.5 million for the preceding fiscal year. As a percentage of revenue, cost of goods sold for the year ended September 30, 2004, decreased as compared to the preceding fiscal year from 24.8% to 22.2%. This decrease in the cost of goods sold as a percentage of revenue was due to the increase in sales of products with a higher margin in the United States and an improved margin in Europe.
SELLING AND ADMINISTRATIVE EXPENSES
Selling and administrative expenses increased $13.3 million (21.1%) to $76.4 million for the year ended September 30, 2004, from $63.1 million for the preceding fiscal year. This increase is mainly due to an increase in our sales force as a result of the recent acquisition of additional products.
RESEARCH AND DEVELOPMENT EXPENSES
Excluding acquired in-process research, research and development expenses increased $7.8 million (64.5%) to $19.9 million for the year ended September 30, 2004, from $12.1 million for the preceding fiscal year. This increase is mainly due to the development of ITAX, acquired in August 2003, for the treatment of functional dyspepsia.
ACQUIRED IN-PROCESS RESEARCH
The acquired in-process research of $12.0 million for the year ended September 30, 2003, was a result of the acquisition of an exclusive license for North America, the European Union and Latin America from Abbott to develop, manufacture and market ITAX, a patented gastroprokinetic drug. Under the terms of this license agreement, Axcan paid $10.0 million and assumed $2.0 million in research liability. As this product had not reached technological feasibility and had no known alternative use, it was considered to be acquired in-process research and was expensed in the fourth quarter of the year ended September 30, 2003, the period of acquisition.
DEPRECIATION AND AMORTIZATION
Depreciation and amortization increased $8.3 million (102.5%) to $16.4 million for the year ended September 30, 2004, from $8.1 million for the preceding fiscal year. The increase is mainly due to the amortization of the AVAX product line acquired from Aventis on November 18, 2003, and of TAGAMET which was reclassified from intangible assets with an indefinite life to intangible assets with a finite life on October 1, 2003.
35
FINANCIAL EXPENSES
Financial expenses increased $2.6 million (60.5%) to $6.9 million for the year ended September 30, 2004, from $4.3 million for the preceding fiscal year. This increase is mainly due to the Company recognizing a full year's worth of interest expense on the $125.0 million aggregate principal amount of 4.25% convertible subordinated notes due 2008 which were issued on March 5, 2003, and the amortization of deferred debt issue expenses.
TAKEOVER-BID EXPENSES
On April 10, 2003, Axcan made an unsolicited cash tender offer of $8.75 per share for all of the outstanding shares of common stock of Salix Pharmaceuticals Inc. ("Salix"), which was subsequently increased to $10.50 per share. On June 27, 2003, the offer for all outstanding shares of Salix expired without acceptance or extension. Total costs related to the offer were $3.7 million and were expensed during the quarter ended June 30, 2003, thus reducing net income by approximately $2.4 million, or $0.05 per share for the year ended September 30, 2003.
INCOME TAXES
Income taxes amounted to $22.3 million for the year ended September 30, 2004, compared to $13.0 million for the year ended September 30, 2003. The effective tax rates were 31.4% for the year ended September 30, 2004, and 39.5% for the year ended September 30, 2003. Acquired in-process research is deductible at a lower rate than most operating expenses. As discussed below under "net income", excluding acquired in-process research and takeoverbid expenses, the effective tax rate was 31.4% for the year ended September 30, 2003.
NET INCOME
Net income was $48.7 million or $1.08 of basic income per share and $0.96 of diluted income per share, for the year ended September 30, 2004, compared to $19.9 million or $0.44 of both basic and diluted income per share for the preceding year. The weighted average number of common shares outstanding used to establish the basic per share amounts increased from 44.9 million for the year ended September 30, 2003, to 45.3 million for the year ended September 30, 2004, following the exercise of options previously granted pursuant to Axcan's stock option plan. The weighted average number of common shares used to establish the diluted per share amounts increased from 45.6 million for the year ended September 30, 2003, to 55.0 million for the year ended September 30, 2004, because the shares issuable under the convertible subordinated notes were included.
Net income (in thousands of dollars), basic income per share and diluted income per share excluding takeover-bid expenses, acquired in-process research and related income taxes for the years ended September 30, 2004, and 2003, were as follows:
| For the years ended September 30 | 2004 | 2003 | ||||
|---|---|---|---|---|---|---|
| | $ | $ | ||||
| Net income in accordance with U.S. GAAP | 48,728 | 19,925 | ||||
| Plus: Takeover-bid expenses | — | 3,697 | ||||
| Acquired in-process research | — | 12,000 | ||||
| Less: Related income taxes | — | (2,272 | ) | |||
| Net income excluding takeover-bid expenses, acquired in-process research and related income taxes | 48,728 | 33,350 | ||||
| Income per share excluding takeover-bid expenses, acquired in-process research and related income taxes | ||||||
| Basic | 1.08 | 0.74 | ||||
| Diluted | 0.96 | 0.70 | ||||
36
This measure of net income, basic income per share and diluted income per share excluding certain items is a non-GAAP measure that does not have a standardized meaning and, as such, is not necessarily comparable to similarly titled measures presented by other companies. This measure is provided to assist our investors in assessing Axcan's operating performance. We believe the presentation of this non-GAAP measure provides useful information because it eliminates certain expenses unrelated to our operations and because it provides similar information for period-to-period comparisons. Investors should consider this non-GAAP measure in the context of Axcan's U.S. and Canadian GAAP results of operations. Excluding takeover-bid expenses, acquired in-process research and related income taxes, net income for the year ended September 30, 2004, was $48.7 million or $1.08 of basic income per share and $0.96 of diluted income per share compared to $33.4 million of net income or $0.74 of basic income per share and $0.70 of diluted income per share for the year ended September 30, 2003.
CANADIAN GAAP
The differences (in thousands of dollars) between U.S. and Canadian GAAP which affect net income for the years ended September 30, 2005, and 2004, are summarized in the following table:
| For the years ended September 30 | 2005 | 2004 | |||
|---|---|---|---|---|---|
| | $ | $ | |||
| Net income in accordance with U.S. GAAP | 26,425 | 48,728 | |||
Implicit interest on convertible debt | (4,631 | ) | (4,234 | ) | |
| Stock-based compensation expense | (4,589 | ) | — | ||
| Amortization of new product acquisition costs | (54 | ) | (54 | ) | |
| Income tax impact of the above adjustments | 337 | 20 | |||
| Net earnings in accordance with Canadian GAAP | 17,488 | 44,460 | |||
On March 5, 2003, the Company closed an offering of $125.0 million aggregate principal amount of 4.25% convertible subordinated notes due April 15, 2008. As a result of the terms of the notes, under Canadian GAAP, an amount of $24,238,899 was included in shareholders' equity as equity component of the convertible debt and an amount of $100,761,101 was included in long-term debt, as the liability component of the convertible notes. For the year ended September 30, 2005, implicit interest in the amount of $4,630,987 ($4,233,768 in 2004) was accounted for and added to the liability component.
Since October 1, 2004, under Canadian GAAP, the effect of stockbased compensation has to be accounted for using the fair value method.
Under Canadian GAAP, research and development expenses are stated net of related tax credits which generally constitute between 5% and 10% of the aggregate amount of such expenses. Under U.S. GAAP, these tax credits are applied against income taxes.
LIQUIDITY AND CAPITAL RESOURCES
Axcan's cash, cash equivalents and short-term investments increased $59.7 million (157.5%) to $97.6 million at September 30, 2005, from $37.9 million at September 30, 2004. As of September 30, 2005, working capital was $132.0 million, compared to $87.7 million at September 30, 2004. These increases are mainly due to the cash flows from operating activities of the year ended September 30, 2005.
Total assets increased $31.8 million (5.2%) to $641.4 million as of September 30, 2005, from $609.6 million as of September 30, 2004. Shareholders' equity increased $25.5 million (6.5%) to $417.6 million as of September 30, 2005, from $392.1 million as of September 30, 2004.
37
Historically, Axcan has financed research and development, operations, acquisitions, milestone payments and investments out of the proceeds of public and private sales of its equity and convertible debt, cash flows from operating activities, and loans from joint venture partners and financial institutions. Since it went public in Canada in December 1995, Axcan has raised approximately $243.0 million from sales of its equity and $125.0 million from sales of convertible notes. Furthermore, Axcan has borrowed and since repaid funds from financial institutions to finance the acquisition of Axcan Scandipharm Inc. and from Schwarz Pharma Inc., a former joint venture partner, to finance the acquisition of Axcan URSO. Axcan's research and development expenses totalled $19.9 million for fiscal 2004 and $31.9 million for fiscal 2005. Axcan believes that cash, cash equivalents and short-term investments, together with funds provided by operations, will be sufficient to meet its operating cash requirements, including the development of products through research and development activities, capital expenditures and repayment of its debt. Assuming regulatory approvals of future products and indications stemming from its research and development efforts, Axcan believes that these will also significantly contribute to an increase in funds provided by operations. However, Axcan regularly reviews product and other acquisition opportunities and may therefore require additional debt or equity financing. Axcan cannot be certain that such additional financing, if required, will be available on acceptable terms, or at all.
LINE OF CREDIT
Effective September 22, 2004, the Company amended its existing credit facility with a banking syndicate. The amended credit facility consists of a $125.0 million 364-day extendible revolving facility with a two-year term-out option maturing on September 21, 2008.
The credit facility is secured by a first priority security interest on all present and future acquired assets of the Company and its material subsidiaries, and provides for the maintenance of certain financial ratios. Among the restrictions imposed by the credit facility is a covenant limiting cash dividends, share repurchases (other than redeemable shares issued in connection with a permitted acquisition) and similar distributions to shareholders to 10% of the Company's net income for the preceding fiscal year. As of September 30, 2005, Axcan was in compliance with all covenants under the credit facility.
The interest rate varies, depending on the Company's leverage, between 25 basis points and 100 basis points over Canadian prime rate or U.S. base rate, and between 125 basis points and 200 basis points over the LIBOR rate or bankers acceptances. The line of credit also provides for a stand-by fee of between 25 and 37.5 basis points. The credit facility may be drawn in U.S. dollars, in Canadian dollar or Euros equivalents. As of September 30, 2005, there was no amount outstanding under this credit facility.
38
CONVERTIBLE SUBORDINATED NOTES AND OTHER LONG-TERM DEBT
Long-term debt, including instalments due within one year, totaled $127.8 million as of September 30, 2005, compared to $129.7 million as of September 30, 2004. As of September 30, 2005, the long-term debt included $1.3 million of bank loans, $1.5 million of obligations under capital leases contracted by Axcan's French subsidiary and the $125.0 million 4.25% convertible subordinated notes due 2008, which were issued on March 5, 2003.
The notes are convertible into 8,924,113 common shares during any quarterly conversion period if the closing price per share for at least 20 consecutive trading days during the 30 consecutive tradingday period ending on the first day of the conversion period exceeds 110% of the conversion price in effect on that thirtieth trading day. The notes are also convertible during the five business-day period following any 10 consecutive trading-day period in which the daily average of the trading prices for the notes was less than 95% of the average conversion value for the notes during that period. The noteholders may also convert their notes upon the occurrence of specified corporate transactions or if the Company has called the notes for redemption. On or after April 20, 2006, the Company may at its option, redeem the notes, in whole or in part at redemption prices varying from 101.70% to 100.85% of the principal amount plus any accrued and unpaid interest to the redemption date. The notes also include provisions for the redemption of all the notes for cash at the option of the Company following certain changes in tax treatment.
CASH FLOWS
Cash flows from operating activities increased $44.3 million from $23.4 million of cash provided by operating activities for the year ended September 30, 2004, to $67.7 million for the year ended September 30, 2005. This increase is mainly due to the fact that inventories remained relatively stable and accounts receivable decreased by $8.6 million during the year ended September 30, 2005, compared to the previous fiscal year when they increased by $45.0 million following the increase in sales and the acquisition of new products. Cash flows used by financing activities were $1.4 million for the year ended September 30, 2005. Cash flows used by investment activities for the year ended September 30, 2005, were $8.1 million mainly due to the net acquisition of short-term investments of $1.7 million and the cash used for the acquisition of property, plant and equipment for $6.3 million. Cash flows used for investment activities for the year ended September 30, 2004, were $42.7 million mainly due to the net cash used for the acquisition of intangible assets for $149.6 million and property, plant and equipment for $13.4 million with the net proceeds from the disposal of short-term investments.
39
OFF-BALANCE SHEET ARRANGEMENTS
Axcan does not have any transactions, arrangements and other relationships with unconsolidated entities that are likely to affect its operating results, its liquidity or capital resources. Axcan has no special purpose or limited purpose entities that provide off-balance sheet financing, liquidity or market or credit risk support, engage in leasing, hedging, research and development services, or other relationships that expose the Company to liability that is not reflected on the face of the consolidated financial statements.
CONTRACTUAL OBLIGATIONS
The following table summarizes Axcan's significant contractual obligations (in thousands of dollars) as of September 30, 2005, and the effect such obligations are expected to have on our liquidity and cash flows in future years. This table excludes amounts already recorded on the balance sheet as current liabilities at September 30, 2005, or certain other purchase obligations as discussed below:
| For the years ending September 30 | 2006 | 2007 | 2008 | 2009 | 2010 and thereafter | |||||
|---|---|---|---|---|---|---|---|---|---|---|
| | $ | $ | $ | $ | $ | |||||
| Long-term debt | 1,497 | 1,021 | 125,239 | 72 | — | |||||
| Operating leases | 1,314 | 416 | 196 | 41 | 6 | |||||
| Other commitments | 595 | 475 | 716 | 250 | — | |||||
| 3,406 | 1,912 | 126,151 | 363 | 6 | ||||||
Purchase orders for raw materials, finished goods and other goods and services are not included in the above table. Management is not able to determine the aggregate amount of such purchase orders that represent contractual obligations, as purchase orders may represent authorizations to purchase rather than binding agreements. For the purpose of this table, contractual obligations for purchase of goods or services are defined as agreements that are enforceable and legally binding on the Company and that specify all significant terms, including: fixed or minimum quantities to be purchased; fixed, minimum or variable price provisions; and the approximate timing of the transaction. Axcan's purchase orders are based on current needs and are fulfilled by our vendors with relatively short timetables. The Company does not have significant agreements for the purchase of raw materials or finished goods specifying minimum quantities or set prices that exceed its short-term expected requirements. Axcan also enters into contracts for outsourced services; however, the obligations under these contracts are not significant and the contracts generally contain clauses allowing for cancellation without significant penalty except for a sales management services contract included in the above table. As milestone payments are primarily contingent on receiving regulatory approval for products under development, they do not have defined maturities.
The expected timing of payment of the obligations discussed above is estimated based on current information. Timing of payments and actual amounts paid may be different depending on the time of receipt of goods or services, or for some obligations, changes to agreed-upon amounts.
EFFECT OF RECENTLY ISSUED U.S. ACCOUNTING PRONOUNCEMENTS
In December 2002, the Financial Accounting Standards Board ("FASB") issued Statement of Financial Accounting Standards ("SFAS") No. 148, "Accounting for Stock-Based Compensation—Transition and Disclosure". SFAS No. 148 amends SFAS No. 123, "Accounting for Stock-Based Compensation", to provide alternative methods of transition to SFAS No. 123's fair value method of accounting for stock-based employee compensation. SFAS No. 148 also amends the disclosure provisions of SFAS No. 123 and Accounting Principles Board Opinion ("APB") No. 28, "Interim Financial Reporting", to require disclosure in the summary of significant accounting policies of the effects of an entity's accounting policy with respect to stock-based employee compensation on reported net income and earnings per share in annual and interim financial statements. While SFAS No. 148 does not amend SFAS No. 123 to require companies to account for employee stock options using the fair value method, the disclosure provisions of SFAS No. 148 are applicable to all companies with stock-based employee compensation, regardless of whether they account for that compensation using the fair value method of SFAS No. 123 or the intrinsic value method of APB No. 25. As allowed by SFAS No. 123, the Company elected to continue to utilize the accounting method prescribed by APB No. 25 and applies the disclosure requirements of SFAS No. 123.
40
In December 2004, the FASB issued SFAS No. 123R, "Share-Based Payment". SFAS No. 123R requires all entities to recognize compensation cost for share-based awards, including options, granted to employees. The Statement eliminates the ability to account for share-based compensation transactions using APB No. 25, "Accounting for Stock Issued to Employees", and generally require instead that such transactions be accounted for using a fair-value based method. Public companies are required to measure stockbased compensation classified as equity by valuing the instrument the employee receives at its grant-date fair value. Currently such awards are measured at intrinsic value under both APB No. 25 and SFAS 123, "Accounting for Stock-Based Compensation". The Company will apply the Statement beginning in fiscal 2006 using the modified prospective transition approach and expects the implementation to have a material impact on the Company's consolidated balance sheets and results of operations. For the historical impact of Stock-based compensation expense using the fair-value based method, see note 3 of the September 30, 2005, consolidated financial statements.
During the September 2004 meeting of the Emerging Issues Task Force ("EITF") a consensus was reached on EITF Issue 04-8, "The Effect of Contingently Convertible Debt on Diluted Earnings per Share". The EITF 04-8 requires companies to include certain convertible debt and equity instruments, that were previously excluded, into their calculations of diluted earnings per share. The EITF concluded that Issue 04-8 will be effective for periods ending after December 15, 2004, and must be applied by restating all periods during which time the applicable convertible instruments were outstanding. The common shares issuable under the 4.25% convertible subordinated notes, issued in 2003 are therefore included in the Company's diluted income per share calculation. For the year ended September 30, 2004, the weighted number of common shares used in the calculation of the diluted income per share has been increased from 52,787,967 to 55,031,184 and the diluted income per share has been reduced from $0.98 to $0.96. This change in accounting policies did not have an impact on the diluted income per share for the year ended September 30, 2003.
EARNINGS COVERAGE
Under U.S. GAAP, for the twelve months ended September 30, 2005, our interest requirements amounted to $6.2 million on a pro-forma basis and our earnings coverage ratio, defined as the ratio of earnings before interest and income taxes to pro-forma interest requirements, was 6.2 to one.
Under Canadian GAAP, for the twelve months ended September 30, 2005, our interest requirements amounted to $11.3 million on a pro-forma basis, and our earnings coverage ratio was 3.6 to one. The principal difference between the earnings coverage ratios under Canadian GAAP and U.S. GAAP is attributable to the inclusion of implicit interest of $5.1 million as required by Canadian GAAP.
RISK FACTORS
Axcan is exposed to financial market risks, including changes in foreign currency exchange rates and interest rates. Axcan does not use derivative financial instruments for speculative or trading purposes. Axcan does not use off-balance sheet financing or similar special purpose entities. Inflation has not had a significant impact on Axcan's results of operations.
FOREIGN CURRENCY RISK
Axcan operates internationally; however, a substantial portion of the revenue and expense activities and capital expenditures are transacted in U.S. dollars. Axcan's exposure to exchange rate fluctuation is reduced because, in general, Axcan's revenues denominated in currencies other than the U.S. dollar are matched by a corresponding amount of costs denominated in the same currency. Axcan expects this matching to continue.
INTEREST RATE RISK
The primary objective of Axcan's investment policy is the protection of capital. Accordingly, investments are made in high-grade government and corporate securities with varying maturities, but typically, less than 180 days. Therefore, Axcan does not have a material exposure to interest rate risk, and a 100 basis-point adverse change in interest rates would not have a material effect on Axcan's consolidated results of operations, financial position or cash flows. Axcan is exposed to interest rate risk on borrowings under the credit facility. The credit facility bears interest based on LIBOR, U.S. dollar base rate, Canadian dollar prime rate, or Canadian dollar Bankers' Acceptances. Based on projected advances under the credit facility, a 100 basis-point adverse change in interest rates would not have a material effect on Axcan's consolidated results of operations, financial position, or cash flows.
41
SUPPLY AND MANUFACTURE
Axcan depends on third parties for the supply of active ingredients and for the manufacture of the majority of its products. Although Axcan looks to secure alternative suppliers, Axcan may not be able to obtain the active ingredients or products from such third parties, the active ingredients or products may not comply with specifications, or the prices at which Axcan purchases them may increase and Axcan may not be able to locate alternative sources of supply in a reasonable time period, or at all. If any of these events occur, Axcan may not be able to continue to market certain of its products, and its sales and profitability would be adversely affected.
VOLATILITY OF SHARE PRICES
The market price of Axcan's shares is subject to volatility. Deviations in actual financial or scientific results, as compared to expectations of securities analysts who follow our activities can have a significant effect on the trading price of Axcan's shares.
FORWARD-LOOKING STATEMENTS
This document contains forward-looking statements, which reflect the Company's current expectations regarding future events. To the extent that any statements in this document contain information that is not historical, the statements are essentially forward-looking and are often identified by words such as "anticipate", "expect", "estimate", "intend", "project", "plan" and "believe". These forwardlooking statements include, but are not limited to, the expected sales growth of the Company's products and the expected increase in funds from operations resulting from the Company's research and development expenditures. The forward-looking statements involve risks and uncertainties. Actual events could differ materially from those projected herein and depend on a number of factors, including but not limited to the successful and timely completion of clinical studies, the difficulty of predicting FDA or other regulatory approvals, the commercialization of a drug or therapy after regulatory approval is received, the difficulty of predicting acceptance and demand for pharmaceutical products, the impact of competitive products and pricing, costs associated with new product development and launch, the availability of raw materials, the protection of our intellectual property, fluctuations in our operating results and other risks detailed from time to time in the Company's filings with the Securities and Exchange Commission and the Canadian Securities Commissions. The reader is cautioned not to rely on these forward looking statements. The Company disclaims any obligation to update these forward-looking statements.
This MD&A has been prepared as of November 8, 2005. Additional information on the Company is available through regular filing of press releases, quarterly financial statements and the Annual Information Form on the SEDAR website.
On behalf of Management,
 Jean Vézina Vice President, Finance and Chief Financial Officer |
42
CONSOLIDATED
FINANCIAL STATEMENTS
TABLE OF CONTENTS
| Management Report | 44 | ||
| Report of Independent Registered Public Accounting Firm | 45 | ||
| Financial Statements | |||
| Consolidated Balance Sheets | 46 | ||
| Consolidated Operations | 47 | ||
| Consolidated Shareholders' Equity | 48 | ||
| Consolidated Cash Flows | 49 | ||
| Notes to Consolidated Financial Statements | 50 | ||
43
The consolidated financial statements of Axcan Pharma Inc. and the other financial information included in this annual report are the responsibility of the Company's management.
These consolidated financial statements and the other financial information have been prepared by management in accordance with accounting principles generally accepted in the United States of America. This responsibility includes the selection of appropriate accounting principles and methods in the circumstances and the use of careful judgement in establishing reasonable accounting estimates.
Management maintains internal control systems designed among other things, to provide reasonable assurance that the Company's assets are adequately safeguarded and that the accounting records are a reasonable basis to prepare relevant and reliable financial information.
The Audit Committee is composed solely of external directors. This Committee meets with the external auditors and management to discuss matters relating to the audit, internal control and financial information. The Committee also reviews the consolidated quarterly and annual financial statements.
These consolidated financial statements have been audited by Raymond Chabot Grant Thornton LLP, whose report indicating the scope of their audits and their opinion on the consolidated financial statements is presented below.
The Board of Directors has approved the Company's financial statements on the recommendation of the Audit Committee.
Frank A.G.M. Verwiel, M.D. President and Chief Executive Officer | David W. Mims Executive Vice President and Chief Operating Officer |  Jean Vézina Vice President, Finance and Chief Financial Officer |
Mont-Saint-Hilaire, Quebec, Canada
November 10, 2005
44
REPORT OF INDEPENDENT REGISTERED
PUBLIC ACCOUNTING FIRM
To the Board of Directors and Shareholders of Axcan Pharma Inc.
We have audited the consolidated balance sheets of Axcan Pharma Inc. and subsidiaries ("Company") as at September 30, 2005 and 2004 and the consolidated statements of operations, shareholders' equity and cash flows for each of the years in the three-year period ended September 30, 2005. These financial statements are the responsibility of the Company's management. Our responsibility is to express an opinion on these financial statements based on our audits.
We conducted our audits in accordance with the standards of the Public Company Accounting Oversight Board (United States) and with generally accepted auditing standards in Canada. Those standards require that we plan and perform an audit to obtain reasonable assurance whether the financial statements are free of material misstatement. An audit includes examining, on a test basis, evidence supporting the amounts and disclosures in the financial statements. An audit also includes assessing the accounting principles used and significant estimates made by management, as well as evaluating the overall financial statement presentation. We believe that our audits provide a reasonable basis for our opinion.
In our opinion, these consolidated financial statements present fairly, in all material respects, the financial position of the Company as at September 30, 2005 and 2004 and the results of its operations and its cash flows for each of the years in the three-year period ended September 30, 2005 in accordance with accounting principles generally accepted in the United Sates of America.
Raymond Chabot Grant Thornton LLP Chartered Accountants |
Montreal, Quebec, Canada
November 10, 2005
45
| September 30 | 2005 | 2004 | |||
|---|---|---|---|---|---|
| in thousands of U.S. dollars, except share related data | $ | $ | |||
| Assets | |||||
| Current assets | |||||
| Cash and cash equivalents | 79,969 | 21,979 | |||
| Short-term investments available for sale (Note 5) | 17,619 | 15,922 | |||
| Accounts receivable, net (Note 6) | 37,587 | 46,585 | |||
| Income taxes receivable | 8,351 | 9,196 | |||
| Inventories (Note 7) | 36,016 | 37,270 | |||
| Prepaid expenses and deposits | 1,771 | 3,494 | |||
| Deferred income taxes (Note 8) | 9,044 | 4,586 | |||
| Total current assets | 190,357 | 139,032 | |||
| Property, plant and equipment, net (Note 9) | 31,673 | 31,252 | |||
| Intangible assets, net (Note 10) | 388,921 | 407,875 | |||
| Goodwill, net (Note 11) | 27,467 | 27,467 | |||
| Deferred debt issue expenses, net | 2,577 | 3,088 | |||
| Deferred income taxes (Note 8) | 412 | 930 | |||
| Total assets | 641,407 | 609,644 | |||
| Liabilities | |||||
| Current liabilities | |||||
| Accounts payable and accrued liabilities (Note 13) | 52,990 | 47,917 | |||
| Income taxes payable | 3,247 | 731 | |||
| Instalments on long-term debt | 1,497 | 1,778 | |||
| Deferred income taxes (Note 8) | 602 | 936 | |||
| Total current liabilities | 58,336 | 51,362 | |||
| Long-term debt (Note 14) | 126,332 | 127,916 | |||
| Deferred income taxes (Note 8) | 39,135 | 38,290 | |||
| Total liabilities | 223,803 | 217,568 | |||
| Commitments and contingencies (Note 21) | |||||
Shareholders' Equity | |||||
| Capital stock (Note 15) | |||||
| Preferred shares, without par value; unlimited shares authorized; no shares issued | — | — | |||
| Series A preferred shares, without par value; shares authorized: 14,175,000; no shares issued | — | — | |||
| Series B preferred shares, without par value; shares authorized: 12,000,000; no shares issued | — | — | |||
| Common shares, without par value; unlimited shares authorized; issued and outstanding: 45,682,175 and 45,562,336 as at September 30, 2005 and 2004, respectively | 261,714 | 260,643 | |||
| Retained earnings | 138,787 | 112,362 | |||
| Additional paid-in capital | 1,329 | — | |||
| Accumulated other comprehensive income | 15,774 | 19,071 | |||
| Total shareholders' equity | 417,604 | 392,076 | |||
| Total liabilities and shareholders' equity | 641,407 | 609,644 | |||
The accompanying notes are an integral part of the consolidated financial statements.
On behalf of the Board,
Léon F. Gosselin Director | Dr. Claude Sauriol Director |
46
| Years ended September 30 | 2005 | 2004 | 2003 | |||||
|---|---|---|---|---|---|---|---|---|
| in thousands of U.S. dollars, except share related data | $ | $ | $ | |||||
| Revenue | 251,343 | 243,634 | 179,084 | |||||
| Cost of goods sold excluding depreciation and amortization | 71,534 | 54,247 | 44,459 | |||||
| Selling and administrative expenses | 85,997 | 76,365 | 63,084 | |||||
| Research and development expenses | 31,855 | 19,866 | 12,098 | |||||
| Acquired in-process research | — | — | 12,000 | |||||
| Depreciation and amortization | 21,532 | 16,359 | 8,063 | |||||
| 210,918 | 166,837 | 139,704 | ||||||
| Operating income | 40,425 | 76,797 | 39,380 | |||||
| Financial expenses | 7,140 | 6,885 | 4,283 | |||||
| Interest income | (1,340 | ) | (756 | ) | (1,639 | ) | ||
| Loss (gain) on foreign currency | (213 | ) | (313 | ) | 122 | |||
| Takeover-bid expenses | — | — | 3,697 | |||||
| 5,587 | 5,816 | 6,463 | ||||||
| Income before income taxes | 34,838 | 70,981 | 32,917 | |||||
| Income taxes (Note 8) | 8,413 | 22,253 | 12,992 | |||||
| Net income | 26,425 | 48,728 | 19,925 | |||||
| Income per common share | ||||||||
| Basic | 0.58 | 1.08 | 0.44 | |||||
| Diluted | 0.56 | 0.96 | 0.44 | |||||
| Weighted average number of common shares | ||||||||
| Basic | 45,617,703 | 45,286,199 | 44,914,944 | |||||
| Diluted | 55,219,202 | 55,031,184 | 45,607,992 | |||||
The accompanying notes are an integral part of the consolidated financial statements and note 16 presents additional information on consolidated operations.
47
CONSOLIDATED SHAREHOLDERS' EQUITY
| Years ended September 30 | 2005 | 2004 | 2003 | ||||
|---|---|---|---|---|---|---|---|
| in thousands of U.S. dollars, except share related data | | | | ||||
| Common shares (number) | |||||||
| Balance, beginning of year | 45,562,336 | 45,004,320 | 44,863,198 | ||||
| Shares issued pursuant to the stock option plan for cash | 119,839 | 558,016 | 141,122 | ||||
| Balance, end of year | 45,682,175 | 45,562,336 | 45,004,320 | ||||
$ | $ | $ | |||||
| Common shares | |||||||
| Balance, beginning of year | 260,643 | 255,743 | 254,640 | ||||
| Shares issued pursuant to the stock option plan for cash | 1,071 | 4,900 | 1,103 | ||||
| Balance, end of year | 261,714 | 260,643 | 255,743 | ||||
| Retained earnings | |||||||
| Balance, beginning of year | 112,362 | 63,634 | 43,709 | ||||
| Net income | 26,425 | 48,728 | 19,925 | ||||
| Balance, end of year | 138,787 | 112,362 | 63,634 | ||||
| Additional paid-in capital | |||||||
| Balance, beginning of year | — | — | — | ||||
| Income tax deductions on stock options exercise | 1,329 | — | — | ||||
| Balance, end of year | 1,329 | — | — | ||||
| Accumulated other comprehensive income (loss) | |||||||
| Balance, beginning of year | 19,071 | 11,634 | (3,562 | ) | |||
| Foreign currency translation adjustments | (3,297 | ) | 7,437 | 15,196 | |||
| Balance, end of year | 15,774 | 19,071 | 11,634 | ||||
| Total shareholders' equity | 417,604 | 392,076 | 331,011 | ||||
| Comprehensive income | |||||||
| Foreign currency translation adjustments | (3,297 | ) | 7,437 | 15,196 | |||
| Net income | 26,425 | 48,728 | 19,925 | ||||
| Total comprehensive income | 23,128 | 56,165 | 35,121 | ||||
The accompanying notes are an integral part of the consolidated financial statements.
48
| Years ended September 30 | 2005 | 2004 | 2003 | |||||
|---|---|---|---|---|---|---|---|---|
| in thousands of U.S. dollars | $ | $ | $ | |||||
| Operations | ||||||||
| Net income | 26,425 | 48,728 | 19,925 | |||||
| Non-cash items | ||||||||
| Non-controlling interest | — | — | (103 | ) | ||||
| Amortization of deferred debt issue expenses | 1,100 | 1,144 | 646 | |||||
| Other depreciation and amortization | 21,532 | 16,359 | 8,063 | |||||
| Loss (gain) on disposal of assets | — | (5 | ) | 1,130 | ||||
| Foreign currency fluctuation | (84 | ) | 342 | 305 | ||||
| Deferred income taxes | (3,261 | ) | 6,625 | 1,848 | ||||
| Share in net loss of joint ventures | — | 455 | 106 | |||||
| Changes in working capital items (Note 17) | 22,033 | (50,288 | ) | 19,576 | ||||
| Cash flows from operating activities | 67,745 | 23,360 | 51,496 | |||||
| Financing | ||||||||
| Long-term debt | — | 2,212 | 126,064 | |||||
| Repayment of long-term debt | (1,857 | ) | (3,842 | ) | (4,687 | ) | ||
| Deferred debt issue expenses | (589 | ) | — | (4,589 | ) | |||
| Issue of shares | 1,071 | 4,900 | 1,103 | |||||
| Cash flows from financing activities | (1,375 | ) | 3,270 | 117,891 | ||||
Investment | ||||||||
| Acquisition of short-term investments | (14,519 | ) | (20,936 | ) | (133,112 | ) | ||
| Disposal of short-term investments | 12,822 | 138,074 | 60,740 | |||||
| Disposal of investments | — | 1,876 | 637 | |||||
| Acquisition of property, plant and equipment | (6,330 | ) | (13,409 | ) | (4,291 | ) | ||
| Disposal of property, plant and equipment | — | 405 | — | |||||
| Acquisition of intangible assets | (51 | ) | (149,628 | ) | (76,093 | ) | ||
| Disposal of intangible assets | — | 917 | — | |||||
| Cash flows from investment activities | (8,078 | ) | (42,701 | ) | (152,119 | ) | ||
| Foreign exchange gain (loss) on cash held in foreign currencies | (302 | ) | 277 | 528 | ||||
| Net increase (decrease) in cash and cash equivalents | 57,990 | (15,794 | ) | 17,796 | ||||
| Cash and cash equivalents, beginning of year | 21,979 | 37,773 | 19,977 | |||||
| Cash and cash equivalents, end of year | 79,969 | 21,979 | 37,773 | |||||
The accompanying notes are an integral part of the consolidated financial statements.
49
NOTES TO CONSOLIDATED FINANCIAL STATEMENTS
September 30
Amounts in the tables are stated in thousands of U.S. dollars, except share related data.
1. GOVERNING STATUTES AND NATURE OF OPERATIONS
The Company, incorporated under the Canada Business Corporations Act, is involved in the research, development, production and distribution of pharmaceutical products, mainly in the field of gastroenterology.
2. CHANGES IN ACCOUNTING POLICIES
a) Year ended September 30, 2005
Effect of contingently convertible instruments on diluted earnings per share
During the September 2004 meeting of the Emerging Issues Task Force ("EITF") a consensus was reached on EITF Issue 04-8,"The Effect of Contingently Convertible Instruments on Diluted Earnings per Share". The EITF 04-8 requires companies to include certain convertible instruments, that were previously excluded, into their calculations of diluted earnings per share. The EITF concluded that Issue 04-8 is effective for periods ending after December 15, 2004, and must be applied by restating all periods during which time the applicable convertible instruments were outstanding. The common shares issuable under the 4.25% convertible subordinated notes issued in 2003, are therefore included in the Company's diluted income per share calculation. For the year ended September 30, 2004, the weighted number of common shares used in the calculation of the diluted income per share has been increased from 52,787,964 to 55,031,184 and the diluted income per share has been reduced from $0.98 to $0.96. This change in accounting policies did not have an impact on the diluted income per share for the year ended September 30, 2003.
b) Year ended September 30, 2004
Disclosure of information about capital structure
In April 2004, the Financial Accounting Standards Board ("FASB") issued FASB Staff Position ("FSP") to Statement of Financial Accounting Standards ("SFAS") No. 129-1,"Disclosure Requirements under FASB Statement No. 129, Disclosure of Information about Capital Structure, Relating to Contingently Convertible Securities" to provide disclosure guidance for contingently convertible securities, including those instruments with contingent conversion requirements that have not been met and otherwise are not required to be included in the computation of diluted earnings per share. The FSP addresses concerns that disclosures relating to contingently convertible securities are inconsistent between companies or may be inadequate. FSP SFAS No. 129-1 states that to comply with the requirements of SFAS No. 129, the significant terms of the conversion features of the contingently convertible security should be disclosed to enable users of financial statements to understand the circumstances of the contingency and the potential impact of conversion. The Company evaluated the impact of this pronouncement and has enhanced its disclosures as required.
Consolidation of variable interest entities
In January 2003, the FASB issued Interpretation ("FIN") No. 46,"Consolidation of Variable Interest Entities, an interpretation for Accounting Research Bulletin No. 51." FIN No. 46 requires certain variable interest entities, or VIEs, to be consolidated by the primary beneficiary of the entity if the equity investors in the entity do not have the characteristics of a controlling financial interest or do not have sufficient equity at risk for the entity to finance its activities without additional subordinated financial support from other parties. FIN No. 46 is effective for all VIEs created or acquired after January 31, 2003. For VIEs created or acquired prior to February 1, 2003, the provisions of FIN No. 46 must be applied for the first interim or annual period beginning after December 15, 2003.
The Company currently has no contractual relationship or other business relationship with a variable interest entity and therefore the adoption of FIN No. 46 did not have an effect on the Company's consolidated balance sheets or statements of operations, shareholders' equity and cash flows.
c) Year ended September 30, 2003
Basis of presentation
The Company decided, for the year beginning October 1, 2002, to switch from Canadian generally accepted accounting principles ("GAAP") to the United States of America ("U.S.") GAAP as its primary reporting convention. The change in GAAP was influenced by the Company's desire to better meet the needs of its shareholders by applying accounting rules that are consistent with the majority of its customers and peer companies.
Guarantor's accounting and disclosure requirements for guarantees
In November 2002, the FASB issued FIN No. 45,"Guarantor's Accounting and Disclosure Requirements for Guarantees." FIN No. 45 requires a guarantor to recognize, at the inception of a guarantee, a liability for the fair value of the obligation it has undertaken in issuing the guarantee. FIN No. 45 also requires guarantors to disclose certain information for guarantees, including product warranties, outstanding at the end of the reporting period. At adoption, FIN No. 45 did not have any impact on the Company's consolidated statements of income or financial position.
Impairment or disposal of long-lived assets
SFAS No. 144,"Accounting for the Impairment or Disposal of Long-lived Assets" provides guidance on how assets are grouped when testing for and measuring impairment and proposes a two-step process for first determining when an impairment loss is recognized and then measuring that loss. The adoption of this new standard had no impact on the consolidated financial statements.
50
Stock-based compensation
In December 2002, the FASB issued SFAS No. 148,"Accounting for Stock-Based Compensation—Transition and Disclosure". SFAS No. 148 amends SFAS No. 123,"Accounting for Stock-Based Compensation", to provide alternative methods of transition to SFAS No. 123's fair value method of accounting for stock-based employee compensation. SFAS No. 148 also amends the disclosure provisions of SFAS No. 123 and Accounting Principles Board Opinion ("APB") No. 28,"Interim Financial Reporting", to require disclosure in the summary of significant accounting policies of the effects of an entity's accounting policy with respect to stock-based employee compensation on reported net income and earnings per share in annual and interim financial statements. While SFAS No. 148 does not amend SFAS No. 123 to require companies to account for employee stock options using the fair value method, the disclosure provisions of SFAS No. 148 are applicable to all companies with stock-based employee compensation, regardless of whether they account for that compensation using the fair value method of SFAS No. 123 or the intrinsic value method of APB No. 25. As allowed by SFAS No. 123, the Company elected to continue to utilize the accounting method prescribed by APB No. 25 and applies the disclosure requirements of SFAS No. 123.
d) Standards applicable for the year 2006
Share-based payment
In December 2004, the FASB issued SFAS No. 123R,"Share-Based Payment". SFAS No. 123R requires all entities to recognize compensation cost for share-based awards, including options, granted to employees. The Statement eliminates the ability to account for share-based compensation transactions using APB No. 25,"Accounting for Stock Issued to Employees", and generally requires instead that such transactions be accounted for using a fair-value based method. Public companies are required to measure stock-based compensation classified as equity by valuing the instrument the employee receives at its grant-date fair value. Currently such awards are measured at intrinsic value under both APB No. 25 and SFAS 123,"Accounting for Stock-Based Compensation". The Company will apply the Statement beginning in fiscal 2006 using the modified prospective transition approach and expects the implementation to have a material impact on the Company's consolidated balance sheets and results of operations. For the historical impact of stock-based compensation expense measured using the fair-value based method, see Note 3.
Inventory costs
In November 2004, the FASB issued SFAS No. 151 "Inventory Costs, an Amendment of ARB No. 43, Chapter 4." SFAS No. 151 clarifies the accounting for abnormal amounts of idle facility expense, freight, handling costs and wasted material and requires that such items be recognized as current-period charges regardless of whether they meet the criterion of "so abnormal". In addition, SFAS No. 151 requires that allocation of fixed production overheads to the costs of conversion be based on the normal capacity of the production facilities. The Company is required to adopt the provisions of SFAS No. 151 beginning October 1, 2005 and does not anticipate a material effect.
Accounting changes and error corrections
In May 2005, the FASB issued SFAS No. 154 "Accounting Changes and Error Corrections" which provides guidance on the accounting for and reporting of accounting changes and correction of error. This statement changes the requirements for the accounting for and reporting of a change in accounting principle and applies to all voluntary changes in accounting principle. It also applies to changes required by an accounting pronouncement in the unusual instance that the pronouncement does not include specific transition provisions. This statement is effective for accounting changes and corrections of errors made in fiscal years beginning after December 15, 2005. The Company does not anticipate a material effect upon the adoption of this statement.
3. ACCOUNTING POLICIES
Basis of presentation
The Company has prepared these consolidated financial statements in U.S. dollars and in accordance with U.S. GAAP. The Company has disclosed in note 22 the summary of differences between generally accepted accounting principles in the United States and in Canada.
Accounting estimates
The preparation of financial statements in accordance with generally accepted accounting principles requires management to make estimates and assumptions that affect the recorded amounts of assets and liabilities and disclosure of contingent assets and liabilities as of the date of the financial statements and recognized amounts of revenues and expenses during the year. Significant estimates and assumptions made by management include allowances for accounts receivable and inventories, reserves for product returns, rebates and chargebacks, the classification of intangible assets between finite life and indefinite life, the useful lives of long-lived assets, the expected cash flows used in evaluating long-lived assets, goodwill and investments for impairment, pending legal settlements, the realizability of deferred tax assets and the allocation of the purchase price of acquired assets and businesses. The estimates are made using the historical information and various other expected factors related to each circumstances, available to management. The Company reviews all significant estimates affecting the financial statements on a recurring basis and records the effect of any adjustments when necessary. Actual results could differ from those estimates based upon future events, which could include, among other risks, changes in regulations governing the manner in which the Company sells its products, changes in health care environment and managed care consumptions patterns.
Principles of consolidation
These financial statements include the accounts of the Company and its subsidiaries, the most important being Axcan Scandipharm Inc., Axcan Pharma U.S. Inc., and Axcan Pharma S.A. (the result of the merger of Laboratoires Entéris S.A.S. with Laboratoires du Lactéol du Docteur Boucard S.A.). Significant intercompany transactions have been eliminated in consolidation.
51
Revenue recognition
Revenue is recognized when the product is shipped to the Company's customers, provided the Company has not retained any significant risks of ownership or future obligations with respect to the product shipped. Provisions for sales discounts and estimates for chargebacks, managed care and Medicaid rebates and products returns are established as a reduction of product sales revenues at the time such revenues are recognized. These revenue reductions are established by the Company at the time of sale based on historical experience adjusted to reflect known changes in the factors that impact such reserves. In certain circumstances, returns or exchange of products are allowed under the Company's policy and provisions are maintained accordingly. Amounts received from customers as prepayments for products to be shipped in the future are reported as deferred revenue.
Cash and cash equivalents
The Company includes in cash and cash equivalents cash and all highly liquid short-term investments with initial maturities of three months or less.
Short-term investments
The Company classifies its short-term investments as available for sale. These investments are recorded at their fair value, unrealized gains or losses are recorded as comprehensive income (loss). As at September 30, 2005, 2004 and 2003 there is no material unrealized gain or loss.
Accounts receivable
The majority of the Company's accounts receivable are due from companies in the pharmaceutical industry. Credit is extended based on evaluation of a customers' financial condition and, generally, collateral is not required. Accounts receivable are due within 30 days and are stated at amounts due from customers net of an allowance for doubtful accounts. Accounts outstanding longer than the contractual payment terms are considered past due. The Company determines its allowance by considering a number of factors, including the length of time trade accounts receivable are past due, the Company's previous loss history, the customer's current ability to pay its obligation to the Company, and the condition of the general economy and the industry as a whole. The Company writes off accounts receivable when they become uncollectible, and payments subsequently received on such receivables are credited to the bad debts expenses.
Inventory valuation
Inventories of raw materials and packaging material are valued at the lower of cost and replacement cost. Inventories of work in progress and finished goods are valued at the lower of cost and net realizable value. Cost is determined by the first-in, first-out method. Cost for work in progress and finished goods includes raw materials, direct labour, subcontracts and an allocation for overhead. Allowances are maintained for slow-moving inventories based on the remaining shelf life of and estimated time required to sell such inventories. Obsolete inventory and rejected products are written off to cost of goods sold.
Research and development
Research and development expenses are charged to operations in the year they are incurred. Acquired in-process research and development having no alternative future use is written off at the time of acquisition. The cost of intangibles that are purchased from others for a particular research and development project that have no alternative future use are written off at the time of acquisition.
Depreciation and amortization
Property, plant and equipment and intangible assets with a finite life are reported at cost, less accumulated depreciation and are depreciated or amortized over their estimated useful lives according to the straight-line method at the following annual rates:
| Buildings | 4 to 10% | |
| Furniture and equipment | 10 to 20% | |
| Computer equipment | 20 to 50% | |
| Automotive equipment | 20 to 25% | |
| Leasehold and building improvements | 10 to 20% | |
| Trademarks, trademark licenses and manufacturing rights | 4 to 15% |
Depreciation or amortization commences when an asset is substantially completed and becomes available for productive commercial use.
Goodwill and intangible assets with indefinite life are not amortized since October 1, 2001.
Deferred debt issue expenses are amortized on a straight-line basis over the terms of the debts, until 2008.
Impairment of long lived-assets
The value of goodwill and intangible assets with indefinite life are subject to an annual impairment test and the intangible assets with definite life and property plant, and equipment are subject to an impairment test whenever events or changes in circumstances indicate that the carrying amounts of these assets may not be recoverable. The Company compares the carrying value of the unamortized portion of property, plant and equipment and intangible assets with definite life to the future benefits of the Company's activities or expected sales of pharmaceutical products. For goodwill and intangible assets with indefinite life, the test is based on the comparison of the fair value of the asset with its carrying amount. Should there be a permanent impairment in value, a write-down will be recognized for the current year to reflect the assets at fair value. To date, the Company has not recognized any material permanent impairment in value.
52
Income taxes
Income taxes are calculated based on the liability method. Under this method, deferred income tax assets and liabilities are recognized as estimated taxes for recovery or settlement arising from the recovery or settlement of assets and liabilities recorded at their financial statement carrying amounts. Deferred income tax assets and liabilities are measured based on enacted tax rates and laws at the date of the financial statements for the years in which the temporary differences are expected to reverse. A valuation allowance is provided for the portion of deferred tax assets that is more likely than not to remain unrealized. Adjustments to the deferred income tax asset and liability balances are recognized in net income as they occur.
Stock-based compensation
Under the provision of SFAS No. 123,"Accounting for Stock- Based Compensation", companies can either measure the compensation cost of equity instruments issued under employee compensation plans using a fair value-based method or can continue to recognize compensation cost using the intrinsic value method under the provisions of APB No. 25,"Accounting for Stock Issued to Employees". However, if the provisions of APB No. 25 are applied, pro-forma disclosure of net income and income per share must be presented in the financial statements as if the fair value method had been applied. For all periods presented, the Company recognized compensation costs under the provisions of APB No. 25, and the Company has provided the expanded disclosure required by SFAS No. 123. The Company has elected to continue to measure compensation costs related to awards of stock options using the intrinsic value-based method of accounting. No stock-based employee compensation cost is reflected in net income.
The following table illustrates the effect on net income and income per share if the Company had applied the fair value recognition provisions of SFAS No. 123 to stock-based compensation.
| | 2005 | 2004 | 2003 | ||||
|---|---|---|---|---|---|---|---|
| | $ | $ | $ | ||||
| Net income as reported | 26,425 | 48,728 | 19,925 | ||||
| Less: Total stock-based compensation expenses determined under fair value-based method, net of income taxes | 4,274 | 4,286 | 3,369 | ||||
| Pro-forma net income | 22,151 | 44,442 | 16,556 | ||||
| Basic income per share | |||||||
| As reported | 0.58 | 1.08 | 0.44 | ||||
| Pro-forma | 0.49 | 0.98 | 0.37 | ||||
Diluted income per share | |||||||
| As reported | 0.56 | 0.96 | 0.44 | ||||
| Pro-forma | 0.48 | 0.88 | 0.36 | ||||
Selling and administrative expenses
Selling and administrative expenses include shipping and handling expenses and advertising expenses.
Foreign currency translation
The current rate method of translation of foreign currencies is followed for subsidiaries, or joint ventures considered financially and operationally self-sustaining. Therefore, all gains and losses arising from the translation of the financial statements of subsidiaries or joint ventures are deferred in a cumulative foreign currency translation adjustments account reported as a component of accumulated other comprehensive income in shareholders' equity.
For the operations in Canada and the United States of America, monetary assets and liabilities in currency other than U.S. dollars are translated into U.S. dollars, the functional currency of the Company, at the exchange rates in effect at the balance sheet date whereas other assets and liabilities are translated at exchange rates in effect at transaction dates. Revenue and operating expenses in foreign currency are translated at the average rates in effect during the year, except for depreciation and amortization, translated at historical rates. Gains and losses are included in net income for the year.
Income per share
Basic income per share is calculated using the weighted average number of common shares outstanding during the year. The treasury stock method is to be used for determining the dilution effect of options. The dilutive effect of convertible subordinated notes, balance of purchase price payable in shares and convertible preferred shares is determined using the "if-converted" method.
53
4. ACQUISITIONS
Product acquisitions
On November 18, 2003, the Company acquired the rights to a group of products from Aventis Pharma S.A. ("Aventis") for a cash purchase price of $145,000,000. The acquired products are CARAFATE and BENTYL for the U.S. market and SULCRATE, BENTYLOL and PROCTOSEDYL for the Canadian market.
On August 29, 2003, the Company acquired an exclusive license for North America, the European Union and Latin America, from Abbott Laboratories ("Abbott") to develop, manufacture and market ITAX, a patented gastroprokinitic drug. Under the terms of this license agreement, the Company paid $10,000,000 and assumed $2,000,000 in research contract liability. This product in development had not reached technological feasibility and had no known alternative uses, it was therefore considered to be acquired in-process research and was expensed in the period of acquisition. The agreement also provides for milestone payments upon certain events.
On December 10, 2002, the Company acquired the rights to the Ursodiol 250 mg tablets DELURSAN for the French market, for a cash purchase price of 22,300,000 Euros ($22,800,000) from Aventis. On December 3, 2002, the Company acquired the worldwide rights to the PANZYTRAT enzyme product line from Abbott for a cash purchase price of $45,000,000.
During a transition period ended during the year, the sellers may act as Axcan's agents for the management of sales of some of these products. For the year ended September 30, 2005, a portion of the sales of these products is still managed by the sellers. Axcan includes in its revenue the net sales from such products less corresponding cost of goods sold and other seller related expenses. Consequently, although net sales of such products of the year ended September 30, 2005 were $2,431,789 ($7,667,940 in 2004 and $14,255,979 in 2003), the Company only included in its revenue an amount of $949,866 ($4,685,673 in 2004 and $9,463,645 in 2003) representing the net sales less cost of goods sold and other seller related expenses.
5. SHORT-TERM INVESTMENTS
As at September 30, 2005, short-term investments include short-term notes, mutual funds and debt securities. Two short-term notes represent approximately 56% (one mutual fund for 64% in 2004) of the Company's total short-term investments. Interest rates on short-term notes and debt securities vary from 2.356% to 3.402% (0.975% to 3.315% in 2004).
6. ACCOUNTS RECEIVABLE
| | 2005 | 2004 | ||
|---|---|---|---|---|
| | $ | $ | ||
| Trade accounts, net of allowance for doubtful accounts of $575,000 ($876,000 in 2004)(a) | 37,186 | 44,320 | ||
| Taxes receivable | 45 | 1,978 | ||
| Other | 356 | 287 | ||
| 37,587 | 46,585 | |||
The Company believes that there is no unusual exposure associated with the collection of these accounts receivable.
- (a)
- As at September 30, 2005, the accounts receivable include amounts receivable from three major customers which represent approximately 48% (51% in 2004) of the Company's total accounts receivable (see Note 19).
54
7. INVENTORIES
| | 2005 | 2004 | ||
|---|---|---|---|---|
| | $ | $ | ||
| Raw materials and packaging material | 18,710 | 10,311 | ||
| Work in progress | 1,547 | 1,781 | ||
| Finished goods | 15,759 | 25,178 | ||
| 36,016 | 37,270 | |||
8. INCOME TAXES
The deferred income tax assets and liabilities result from differences between the tax value and book value of the following items:
| | 2005 | 2004 | |||
|---|---|---|---|---|---|
| | $ | $ | |||
| Short-term deferred income tax assets | |||||
| Inventories | 4,187 | 376 | |||
| Prepaid expenses and deposits | — | 167 | |||
| Accounts payable and accrued liabilities | 3,755 | 2,941 | |||
| Pending legal settlements | 1,102 | 1,102 | |||
| 9,044 | 4,586 | ||||
| Long-term deferred income tax assets | |||||
| Share issue expenses | 412 | 930 | |||
| 412 | 930 | ||||
| Short-term deferred income tax liabilities | |||||
| Accounts receivable | 409 | 379 | |||
| Inventories | — | 109 | |||
| Prepaid expenses and deposits | 193 | 434 | |||
| Investments | — | 14 | |||
| 602 | 936 | ||||
| Long-term deferred income tax liabilities | |||||
| Property, plant and equipment | 2,381 | 2,484 | |||
| Intangible assets | 34,341 | 34,619 | |||
| Goodwill | 682 | 682 | |||
| Long-term debt | 627 | — | |||
| Research and development expenses | 1,104 | 505 | |||
| 39,135 | 38,290 | ||||
55
Income taxes included in the statement of operations are as follows:
| | 2005 | 2004 | 2003 | |||||
|---|---|---|---|---|---|---|---|---|
| | $ | $ | $ | |||||
| Current | 11,674 | 15,628 | 11,144 | |||||
| Deferred | ||||||||
| Creation and reversal of temporary differences | (3,054 | ) | 6,625 | 2,678 | ||||
| Change in promulgated rates | (207 | ) | — | (830 | ) | |||
| (3,261 | ) | 6,625 | 1,848 | |||||
| 8,413 | 22,253 | 12,992 | ||||||
| Domestic | ||||||||
| Current | (2,734 | ) | (338 | ) | (1,763 | ) | ||
| Deferred | (941 | ) | 2,756 | 574 | ||||
| (3,675 | ) | 2,418 | (1,189 | ) | ||||
| Foreign | ||||||||
| Current | 14,408 | 15,966 | 12,907 | |||||
| Deferred | (2,320 | ) | 3,869 | 1,274 | ||||
| 12,088 | 19,835 | 14,181 | ||||||
| 8,413 | 22,253 | 12,992 | ||||||
The Company's effective income tax rate differs from the combined statutory federal and provincial income tax rate in Canada (31.02% for 2005, 31.52% for 2004 and 33.59% for 2003). This difference arises from the following:
| | 2005 | 2004 | 2003 | |||||||||||
|---|---|---|---|---|---|---|---|---|---|---|---|---|---|---|
| | % | $ | % | $ | % | $ | ||||||||
| Combined basic rate applied to pre-tax income | 31.02 | 10,807 | 31.52 | 22,373 | 33.59 | 11,057 | ||||||||
| Increase (decrease) in taxes resulting from: | ||||||||||||||
| Large corporations tax | 0.17 | 60 | 0.04 | 29 | — | — | ||||||||
| Change in promulgated rates | (0.59 | ) | (207 | ) | — | — | (2.52 | ) | (830 | ) | ||||
| Difference with foreign tax rates | (0.73 | ) | (255 | ) | (2.47 | ) | (1,752 | ) | 4.54 | 1,495 | ||||
| Non-deductible items | 4.51 | 1,570 | 1.79 | 1,268 | 2.90 | 953 | ||||||||
| Non-taxable items and other | (2.71 | ) | (943 | ) | (0.65 | ) | (460 | ) | (1.35 | ) | (445 | ) | ||
| Foreign withholding taxes | — | — | 2.76 | 1,958 | 3.80 | 1,250 | ||||||||
| Investment tax credits | (7.52 | ) | (2,619 | ) | (1.64 | ) | (1,163 | ) | (1.49 | ) | (488 | ) | ||
| 24.15 | 8,413 | 31.35 | 22,253 | 39.47 | 12,992 | |||||||||
No provision has been made for income taxes on the undistributed earnings of the Company's foreign subsidiaries as at September 30, 2005 which the Company intends to indefinitely reinvest.
56
9. PROPERTY, PLANT AND EQUIPMENT
| | 2005 | |||||
|---|---|---|---|---|---|---|
| | Cost | Accumulated depreciation | Net | |||
| | $ | $ | $ | |||
| Land | 2,097 | — | 2,097 | |||
| Buildings | 20,319 | 3,374 | 16,945 | |||
| Furniture and equipment | 15,612 | 8,599 | 7,013 | |||
| Automotive equipment | 65 | 34 | 31 | |||
| Computer equipment | 10,248 | 5,484 | 4,764 | |||
| Leasehold and building improvements | 1,039 | 216 | 823 | |||
| 49,380 | 17,707 | 31,673 | ||||
| | 2004 | |||||
|---|---|---|---|---|---|---|
| | Cost | Accumulated depreciation | Net | |||
| | $ | $ | $ | |||
| Land | 1,581 | — | 1,581 | |||
| Buildings | 20,311 | 3,413 | 16,898 | |||
| Furniture and equipment | 15,751 | 7,975 | 7,776 | |||
| Automotive equipment | 65 | 14 | 51 | |||
| Computer equipment | 7,542 | 3,126 | 4,416 | |||
| Leasehold and building improvements | 810 | 280 | 530 | |||
| 46,060 | 14,808 | 31,252 | ||||
Acquisitions of property, plant and equipment amount to $5,997,554 ($14,288,431 in 2004 and $4,291,768 in 2003).
The cost and accumulated depreciation of equipment under capital leases amount to $5,195,119 and $2,300,375, respectively ($5,351,295 and $1,659,955, respectively in 2004).
57
10. INTANGIBLE ASSETS
| | 2005 | ||||||
|---|---|---|---|---|---|---|---|
| | Cost | Accumulated amortization | Net | ||||
| | $ | $ | $ | ||||
| Trademarks, trademark licenses and manufacturing rights with a: | |||||||
| Finite life | 334,749 | 45,841 | 288,908 | ||||
| Indefinite life | 112,430 | 12,417 | 100,013 | ||||
| 447,179 | 58,258 | 388,921 | |||||
| | 2004 | ||||||
|---|---|---|---|---|---|---|---|
| | Cost | Accumulated amortization | Net | ||||
| | $ | $ | $ | ||||
| Trademarks, trademark licenses and manufacturing rights with a: | |||||||
| Finite life | 280,034 | 29,869 | 250,165 | ||||
| Indefinite life | 170,127 | 12,417 | 157,710 | ||||
| 450,161 | 42,286 | 407,875 | |||||
The cost of the product PANZYTRAT has been transferred on October 1, 2004 from intangible assets with an indefinite life to intangible assets with a finite life following changes in the regulatory rules applicable to this product and resulting in the modification of its useful life. The net cost of this product as of October 1, 2004, which amounted to $56,817,802, is therefore amortized over a 25-year period.
Acquisitions of intangible assets amount to $51,103 ($149,627,653 in 2004 and $76,092,927 in 2003). The current intangible assets with a finite life have a weighted-average remaining amortization period of approximately 17 years (18 years as of September 30, 2004).
The annual amortization expenses without taking into account any future acquisitions expected for the years 2006 through 2010 are as follows:
| | $ | |
|---|---|---|
| 2006 | 16,551 | |
| 2007 | 16,551 | |
| 2008 | 16,551 | |
| 2009 | 16,551 | |
| 2010 | 16,551 |
58
11. GOODWILL
| | 2005 | 2004 | ||
|---|---|---|---|---|
| | $ | $ | ||
| Cost | 31,073 | 31,073 | ||
| Accumulated amortization | 3,606 | 3,606 | ||
| Net | 27,467 | 27,467 | ||
12. AUTHORIZED LINE OF CREDIT
The Company has a credit agreement relative to a $125,000,000 financing. The credit agreement consists of a 364-day extendible revolving facility with a two-year term-out option maturing on September 21, 2008 (September 22, 2007 in 2004). The termout option provides for quarterly instalments equal to 8.57% of the amount then outstanding on the facility with a final instalment of 40%.
The Company's credit facility is secured by a first security interest on all present and future acquired assets of the Company and its material subsidiaries, and provides for the maintenance of certain financial ratios. Cash dividends, repurchase of shares (other than redeemable shares issued in connection with a permitted acquisition) and similar distributions to shareholders are limited to 10% of the Company's net income for the preceding fiscal year.
The interest rate varies depending on the Company's leverage between 25 basis points and 100 basis points over prime rate and between 125 basis points and 200 basis points over the LIBOR rate or bankers acceptances. The line of credit also provides for a stand-by fee of between 25 and 37.5 basis points. The credit facility may be drawn in U.S. dollars, in Canadian dollars or in Euros equivalent. As at September 30, 2005 and 2004 there was no amount outstanding under the line of credit.
13. ACCOUNTS PAYABLE AND ACCRUED LIABILITIES
| | 2005 | 2004 | ||
|---|---|---|---|---|
| | $ | $ | ||
| Accounts payable | 14,808 | 13,259 | ||
| Contract rebates, product returns and accrued chargebacks | 12,886 | 9,430 | ||
| Accrued interest on subordinated notes | 2,447 | 2,530 | ||
| Accrued royalty fees | 5,584 | 5,340 | ||
| Accrued salaries | 2,202 | 3,228 | ||
| Accrued bonuses | 2,637 | 2,804 | ||
| Accrued research and development expenses | 5,207 | 3,447 | ||
| Other accrued liabilities | 4,319 | 4,979 | ||
| Pending legal settlements | 2,900 | 2,900 | ||
| 52,990 | 47,917 | |||
59
14. LONG-TERM DEBT
| | 2005 | 2004 | ||
|---|---|---|---|---|
| | $ | $ | ||
| Convertible subordinated notes, 4.25%, interest payable semi-annually starting October 15, 2003, convertible into 8,924,113 common shares, maturing April 15, 2008.(a) | 125,000 | 125,000 | ||
| Bank loans 3.80% (secured by immovable hypothecs on land and buildings having a net book value of $6,826,494 in 2004), payable in quarterly instalments of $194,400, principal and interest, maturing in 2007. | 1,310 | 2,174 | ||
| Obligations under capital leases, interest rates varying between 3.81% and 6.2% payable in monthly instalments, principal and interest, maturing on different dates until 2009. | 1,519 | 2,520 | ||
| 127,829 | 129,694 | |||
| Instalments due within one year | 1,497 | 1,778 | ||
| 126,332 | 127,916 | |||
- (a)
- The noteholders may convert their notes during any quarterly conversion period if the closing price per share for at least 20 consecutive trading days during the 30 consecutive trading-day period ending on the first day of the conversion period exceeds 110% of the conversion price in effect on that thirtieth trading day. The noteholders may also convert their notes during the five business-day period following any 10 consecutive trading-day period in which the daily average of the trading prices for the notes was less than 95% of the average conversion value for the notes during that period. Finally, the noteholders may also convert their notes upon the occurrence of specified corporate transactions or, if the company has called the notes for redemption. On or after April 20, 2006, the Company may at its option, redeem the notes, in whole or in part at redemption prices varying from 101.70% to 100.85% of the principal amount plus any accrued and unpaid interest to the redemption date. The notes also include provisions for the redemption of all the notes for cash at the option of the Company following some changes in tax treatment.
As at September 30, 2005, minimum instalments on long-term debt for the next years are as follows:
| | Obligations under capital leases | Other long term loans | ||
|---|---|---|---|---|
| | $ | $ | ||
| 2006 | 814 | 738 | ||
| 2007 | 469 | 572 | ||
| 2008 | 257 | 125,000 | ||
| 2009 | 89 | — | ||
| 1,629 | ||||
| Interest included in the minimum lease payments | 110 | |||
| 1,519 | ||||
60
15. CAPITAL STOCK
Preferred shares
The Company has an unlimited number of authorized preferred shares without par value, issuable in series, rights, privileges and restrictions determined at the creation date.
Two series of preferred shares have been created as follows:
Series A, shares authorized:14,175,000 non-voting, annual preferential cumulative dividend of 5%, redeemable on or prior to June 8, 2001 at CDN$1.00 per share payable at the option of the Company in cash or by the issuance of common shares or in any combination of cash and common shares.
Series B, shares authorized 12,000,000 non-voting, redeemable on the fifth anniversary of their issuance at CDN$1.00 per share payable in cash or by the issuance of common shares at the option of the Company, convertible into common shares at the holder's option on the basis of one common share for each 15 Series B preferred shares.
Common stock option plan
The common stock option plan is intended for eligible directors, principal senior executives and employees. The number of stock options that can be granted under this plan cannot exceed 4,500,000. Options are granted at the fair market value of the common stock on the last trading day prior to the granting date. Options may be exercised at a rate of 20% per year and expire ten years after the granting date except for the annual options granted to outside directors which may be exercised one year after the granting date.
The changes to the number of stock options outstanding are as follows:
| | 2005 | 2004 | 2003 | |||||||||
|---|---|---|---|---|---|---|---|---|---|---|---|---|
| | Number of options | Weighted average exercise price | Number of options | Weighted average exercise price | Number of options | Weighted average exercise price | ||||||
| | | $ | | $ | | $ | ||||||
| Balance, beginning of year | 2,600,556 | 11.86 | 2,681,840 | 10.12 | 2,429,078 | 9.67 | ||||||
| Granted | 692,100 | 16.19 | 738,350 | 15.44 | 531,850 | 11.36 | ||||||
| Exercised | (119,839 | ) | 8.93 | (558,016 | ) | 8.78 | (141,122 | ) | 7.82 | |||
| Cancelled | (186,069 | ) | 13.96 | (261,618 | ) | 11.23 | (137,966 | ) | 10.73 | |||
| Balance, end of year | 2,986,748 | 12.87 | 2,600,556 | 11.86 | 2,681,840 | 10.12 | ||||||
| Options exercisable at end of year | 1,409,939 | 10.97 | 954,459 | 9.93 | 965,909 | 9.00 | ||||||
Stock options outstanding at September 30, 2005 are as follows:
| | Options outstanding | Options exercisable | ||||||||
|---|---|---|---|---|---|---|---|---|---|---|
| Exercise price | Number | Weighted average remaining contractual life | Weighted average exercise price | Number | Weighted average exercise price | |||||
| | | | $ | | $ | |||||
| $4.06 — $5.00 | 10,000 | 4.22 | 4.06 | 10,000 | 4.06 | |||||
| $5.01 — $7.00 | 23,100 | 3.87 | 6.51 | 23,100 | 6.51 | |||||
| $7.01 — $10.00 | 724,007 | 4.73 | 8.52 | 652,489 | 8.36 | |||||
| $10.01 — $13.00 | 656,981 | 6.62 | 11.62 | 384,980 | 11.76 | |||||
| $13.01 — $16.00 | 865,710 | 7.95 | 14.06 | 231,570 | 13.80 | |||||
| $16.01 — $19.00 | 619,450 | 8.98 | 16.98 | 36,300 | 18.30 | |||||
| $19.01 — $19.99 | 87,500 | 8.39 | 19.99 | 71,500 | 19.99 | |||||
| 2,986,748 | 7.06 | 12.87 | 1,409,939 | 10.97 | ||||||
61
The weighted average fair value of granted stock options was $7.01, $6.80 and $5.41 for the years ended September 30, 2005, 2004 and 2003.
The fair values of all stock options granted during 2005, 2004 and 2003 were estimated as of the date of grant using the Black-Scholes option pricing model with the following weighted average assumptions:
| | 2005 | 2004 | 2003 | |||
|---|---|---|---|---|---|---|
| Expected option life (years) | 6 | 6 | 6 | |||
| Volatility | 43% | 44% | 46% | |||
| Risk-free interest rate | 3.94% | 4.17% | 4.43% | |||
| Expected dividend | — | — | — |
The Black-Scholes model, used by the Company to calculate option values, as well as other currently accepted option valuation models, were developed to estimate the fair value of freely tradable, fully transferable options without vesting restrictions, which significantly differ from the Company's stock option awards. These models also require highly subjective assumptions, including future stock price volatility and expected time until exercise, which greatly affect the calculated values. Accordingly, management believes that these models do not necessarily provide a reliable single measure of the fair value of the Company's stock option awards.
16. FINANCIAL INFORMATION INCLUDED IN THE CONSOLIDATED STATEMENT OF OPERATIONS
a) Financial expenses
| | 2005 | 2004 | 2003 | |||
|---|---|---|---|---|---|---|
| | $ | $ | $ | |||
| Interest on long-term debt | 5,542 | 5,614 | 3,340 | |||
| Bank charges | 165 | 127 | 297 | |||
| Financing fees | 333 | — | — | |||
| Amortization of deferred debt issue expenses | 1,100 | 1,144 | 646 | |||
| 7,140 | 6,885 | 4,283 | ||||
b) Other information
| | 2005 | 2004 | 2003 | ||||
|---|---|---|---|---|---|---|---|
| | $ | $ | $ | ||||
| Non-controlling interest | — | — | (103 | ) | |||
| Rental expenses | 1,148 | 1,216 | 1,228 | ||||
| Shipping and handling expenses | 4,901 | 4,349 | 3,477 | ||||
| Advertising expenses | 16,592 | 15,155 | 10,524 | ||||
| Depreciation of property, plant and equipment | 5,339 | 3,720 | 3,467 | ||||
| Amortization of intangible assets | 16,193 | 12,639 | 4,596 | ||||
| Share in net loss of joint ventures | — | (455 | ) | (106 | ) |
The Company incurred professional fees with entities, in which directors of the Company are partner or shareholder, totalling $400,396 for the year ended September 30, 2005 ($556,724 in 2004 and $385,862 in 2003). These transactions were concluded in the normal course of operations, at the amount agreed to by related parties.
62
c) Income per common share
The following table reconciles the numerators and denominators of the basic and diluted income per share computations.
| | 2005 | 2004 | 2003 | ||||
|---|---|---|---|---|---|---|---|
| | $ | $ | $ | ||||
| Net income available to common shareholders | |||||||
| Basic | 26,425 | 48,728 | 19,925 | ||||
| Interest and amortization of deferred debt issue expenses relating to the convertible subordinated notes, net of income taxes | 4,257 | 4,200 | — | ||||
| Net income available to common shareholders on a diluted basis | 30,682 | 52,928 | 19,925 | ||||
2005 | 2004 | 2003 | |||||
| Weighted average number of common shares | |||||||
| Weighted average number of common shares outstanding | 45,617,703 | 45,286,199 | 44,914,944 | ||||
| Effect of dilutive stock options | 677,386 | 820,872 | 472,599 | ||||
| Effect of dilutive purchase price | — | — | 220,449 | ||||
| Effect of dilutive convertible subordinated notes | 8,924,113 | 8,924,113 | — | ||||
| Adjusted weighted average number of common shares outstanding | 55,219,202 | 55,031,184 | 45,607,992 | ||||
Number of common shares outstanding as at November 4, 2005 | 45,686,544 | ||||||
Options to purchase 706,950 common shares (283,000 for 2004 and 754,100 for 2003) were outstanding but were not included in the computation of diluted income per share as the exercise price of the options was greater than the average market price of the common shares. As of September 30, 2003, the subordinated notes convertible into 8,924,113 common shares had no effect on the diluted income per share.
17. FINANCIAL INFORMATION INCLUDED IN THE CONSOLIDATED STATEMENT OF CASH FLOWS
a) Changes in working capital items
| | 2005 | 2004 | 2003 | ||||
|---|---|---|---|---|---|---|---|
| | $ | $ | $ | ||||
| Accounts receivable | 8,648 | (27,795 | ) | 5,569 | |||
| Income taxes receivable | 1,610 | (3,773 | ) | (4,438 | ) | ||
| Inventories | 1,490 | (17,157 | ) | (417 | ) | ||
| Prepaid expenses and deposits | 1,861 | (703 | ) | (892 | ) | ||
| Accounts payable and accrued liabilities | 4,429 | 3,191 | 16,547 | ||||
| Income taxes payable | 3,995 | (4,051 | ) | 3,207 | |||
| 22,033 | (50,288 | ) | 19,576 | ||||
b) Cash flows relating to interest and income taxes of operating activities
| | 2005 | 2004 | 2003 | |||
|---|---|---|---|---|---|---|
| | $ | $ | $ | |||
| Interest received | 1,256 | 1,035 | 1,427 | |||
| Interest paid | 5,626 | 6,122 | 342 | |||
| Income taxes paid | 6,984 | 23,620 | 12,417 |
63
18. JOINT VENTURES
The Company's interest in the joint ventures is accounted for by the equity method. During fiscal 2004, the Company wrote off its investment in these joint ventures for an amount of $511,233.
19. SEGMENTED INFORMATION
The Company considers that it operates in a single field of activity, the pharmaceutical industry.
No customer represents more than 10% of the Company's revenue except for three major customers for which the sales represented 62.1% of revenue for the year ended September 30, 2005 (55.8% and 49.6% in 2004 and 2003) and are detailed as follows:
| | 2005 | 2004 | 2003 | |||
|---|---|---|---|---|---|---|
| | % | % | % | |||
| Customer A | 30.2 | 18.4 | 18.6 | |||
| Customer B | 20.9 | 24.3 | 15.6 | |||
| Customer C | 11.0 | 13.1 | 15.4 | |||
| 62.1 | 55.8 | 49.6 | ||||
Purchases from one supplier represent approximately 15% of the cost of goods sold for the year ended September 30, 2005 (15% in 2004 and 26% in 2003).
The Company purchases its inventory from third party manufacturers, many of whom are the sole source of products for the Company. The failure of such manufacturers to provide an uninterrupted supply of products could adversely impact the Company's ability to sell such products.
The Company operates in the following geographic segments:
| | 2005 | 2004 | 2003 | |||||
|---|---|---|---|---|---|---|---|---|
| | $ | $ | $ | |||||
| Revenue | ||||||||
| Canada | ||||||||
| Domestic sales | 34,412 | 28,002 | 20,555 | |||||
| Foreign sales | — | — | — | |||||
| United States | ||||||||
| Domestic sales | 155,261 | 162,810 | 113,875 | |||||
| Foreign sales | 4,394 | 3,921 | — | |||||
| Europe | ||||||||
| Domestic sales | 46,225 | 43,830 | 39,971 | |||||
| Foreign sales | 10,857 | 4,846 | 4,531 | |||||
| Other | 194 | 225 | 152 | |||||
| 251,343 | 243,634 | 179,084 | ||||||
| Property, plant, equipment, intangible assets and goodwill | ||||||||
| Canada | 39,506 | 40,401 | ||||||
| United States | 127,915 | 131,242 | ||||||
| Europe | 252,509 | 265,417 | ||||||
| Other | 28,131 | 29,534 | ||||||
| 448,061 | 466,594 | |||||||
Revenue is attributed to geographic segments based on the sales country of origin.
64
20. FINANCIAL INSTRUMENTS
Currency risk
The Company is exposed to financial risk arising from fluctuations in foreign exchange rates and the degree of volatility of the rates. The Company does not use derivative instruments to reduce its exposure to foreign currency risk. As of September 30, 2005, the financial assets totalling $135,130,000 include cash and cash equivalent and accounts receivable for CDN$4,294,426 and 13,834,975 Euros respectively (CDN$4,013,755 and 10,159,531 Euros in 2004). The financial liabilities totalling $180,819,000 include accounts payable and accrued liabilities and long-term debt for CDN$10,865,290 and 13,723,991 Euros respectively (CDN$9,468,703 and 14,194,159 Euros in 2004).
Fair value of the financial instruments on the balance sheet
The estimated fair value of the financial instruments is as follows:
| | 2005 | 2004 | |||||||
|---|---|---|---|---|---|---|---|---|---|
| | Fair value | Carrying amount | Fair value | Carrying amount | |||||
| | $ | $ | $ | $ | |||||
| Assets | |||||||||
| Cash and cash equivalents | 79,969 | 79,969 | 21,979 | 21,979 | |||||
| Short-term investments | 17,619 | 17,619 | 15,922 | 15,922 | |||||
| Accounts receivable | 37,542 | 37,542 | 44,607 | 44,607 | |||||
| Liabilities | |||||||||
| Accounts payable and accrued liabilities | 52,990 | 52,990 | 47,917 | 47,917 | |||||
| Long-term debt | 132,870 | 127,829 | 162,674 | 129,694 | |||||
The following methods and assumptions were used to calculate the estimated fair value of the financial instruments on the balance sheet.
a) Financial instruments valued at carrying amount
The estimated fair value of certain financial instruments shown on the balance sheet is equivalent to their carrying amount because they are realizable in the short-term or because their carrying amount approximates the fair value. These financial instruments include cash and cash equivalents, short-term investments, accounts receivable and accounts payable and accrued liabilities.
b) Long-term debt
The fair value of long-term debt has been established by discounting the future cash flows at interest rates corresponding to those the Company would have obtained at year end date for loans with similar maturity dates and terms. The fair value of the convertible subordinated notes is equivalent to the trading price at the end of the year.
21. COMMITMENTS AND CONTINGENCIES
a) Commitments
The Company has entered into non-cancelable operating leases and service agreements expiring on different dates until September 30, 2010 for the rental of office space, automotive equipment and other equipment and for sales management and research and development services. One of the office space leases contains an escalation clause providing for payment of additional rent.
Minimum future payments under these commitments are as follows:
| | $ | |
|---|---|---|
| 2006 | 1,908 | |
| 2007 | 891 | |
| 2008 | 912 | |
| 2009 | 291 | |
| 2010 | 6 | |
| 4,008 | ||
65
The Company entered into an agreement with Nordmark Arzneimittel GmbH & Co to create a joint venture to develop patentprotected novel enzyme preparations. Under the terms of this agreement, the Company agreed to contribute up to a cumulative amount of $1,500,000 to the joint venture. As at September 30, 2005, a total amount of $1,100,000 ($600,000 in 2004) has been contributed.
b) Contingencies
The subsidiary Axcan Scandipharm has been named as a defendant in several legal proceedings related to the products line it markets under the name ULTRASE. Of the 12 lawsuits to date, Axcan Scandipharm was dismissed from one, nonsuited in another and settled ten. These lawsuits were filed against Axcan Scandipharm and certain other named defendants, including the enzyme manufacturer, stemming from allegations that, among other things, Axcan Scandipharm's enzyme products caused colonic strictures. At this time, it is difficult to predict if there will be other claims or their number and because of the young age of the patients involved, Axcan Scandipharm's product liability exposure for this issue in the United States will remain for a number of years. Axcan Scandipharm's insurance carriers have defended the lawsuits to date and Axcan expects them to continue to defend Axcan Scandipharm (to the extent of its product liability insurance) should other lawsuits be filed in the future.
In addition, the enzyme manufacturer and certain other companies have claimed a right to recover amounts paid defending and settling these claims as well as a declaration that Axcan Scandipharm and another named defendant must provide indemnification against future claims. This lawsuit is based on contractual and indemnity issues and the parties have agreed to settle their dispute through binding arbitration. The arbitration was decided in part on September 19, 2005, in Axcan Scandipharm's favour and plaintiff's claims were rejected. On October 20, 2005, plaintiffs filed before the same arbitrator a motion in which they claim that the arbitrator failed to address the matter of the defense costs incurred by plaintiffs in defending the relevant product liability cases or in the alternative that the arbitrator failed to address this matter in his reasoned opinion. In this motion, the plaintiffs allege that the amount at issue may be in excess of $3,700,000. Axcan Scandipharm denies that such reimbursement is owed. The arbitrator has not yet ruled upon this new motion. Also, Axcan Scandipharm had brought counterclaims against the plaintiffs in the original proceedings, and the arbitrator has not yet ruled upon these counterclaims.
As at September 30, 2005 and 2004, the Company has accrued $2,900,000 to cover any future settlements in connection with the indemnification claim and the lawsuits discussed above that may not be covered by, or exceed, applicable insurance proceeds. While the Company believes that the insurance coverage and provisions taken to date are adequate, an adverse determination of present or future claims could exceed insurance coverage and amounts currently accrued.
c) Milestone payments
The agreements with QLT PhotoTherapeutics Inc. ("QLT") relating to the purchase of PHOTOFRIN provided for milestone payments to be made by Axcan to QLT that could reach a maximum of CDN$20,000,000 upon receipt of certain regulatory approvals for specific or additional indication for PHOTOFRIN or other conditions. Each milestone payment shall be made at the option of the Company either in cash or in Series B preferred shares or in a combination of cash and preferred shares provided that at least one-half of the milestone payable shall be paid in cash. During the years 2004, 2003 and 2000 CDN$5,000,000, CDN$5,000,000 and CDN$5,000,000 ($3,919,417, $3,646,973 and $3,378,378) was paid by Axcan in cash upon receipt of regulatory approvals and was recorded in intangible assets.
The agreement to acquire the exclusive license for North America, the European Union and Latin America to develop, manufacture and market ITAX provides for milestone payments for an amount of $20,000,000 upon regulatory submission and an amount of $45,000,000 upon regulatory approval. The Company will also pay royalties of 9% of net sales from the date of first commercial sale until the expiration of the patent and 6% for ten years then after.
d) Royalties
Net sales of certain products of the Company are subject to royalties payable to unrelated third parties.
In particular, the Company must pay, since October 2003, a 6% royalty on the first $30,000,000 of annual net sales of ULTRASE and 5% on annual net sales in excess of $30,000,000 subject to a minimum of $750,000, $1,000,000 and $1,500,000 in the first three years of the agreement and a 5% royalty on the net sales of ADEK's respectively covered under agreements for the exclusive rights to market these products.
Axcan has to pay 5% of worldwide sales of PHOTOFRIN with a maximum of $500,000 per year and a maximum total aggregate of $3,108,245 until December 2007. As of September 30, 2005, an amount of $1,828,636 has been accounted for ($1,420,419 in 2004 and $1,032,777 in 2003). Axcan also has to pay 5% of net sales of PHOTOFRIN for use in the therapeutic treatment of cancer and 2% of net sales for other uses until December 2009. Axcan also has to pay a 2% royalty on net sales of URSO in the United States.
Royalties amounting to $3,695,087, $3,760,945 and $4,387,092 respectively for years ended September 30, 2005, 2004 and 2003 were charged to operations.
66
e) Licensing
Axcan entered into a licensing agreement with the Children's Hospital Research Foundation for a serie of sulfated derivatives of ursodeoxycholigic acid compounds" ("SUDCA"). Axcan has, as at September 30, 2005, paid $814,000 in cash. The Company will also pay milestones for a maximum amount of $200,000 when SUDCA will be validated and a bonus when certain conditions are met; finally, Axcan will pay royalties based on sales.
In May 2002, the Company signed a co-development and licensing agreement with NicOx S.A. ("NicOx") for NCX-1000, a nitric oxide-donating ursodiol derivative, for the treatment of chronic liver diseases including portal hypertension and Hepatitis "C". Under the terms of this agreement, the Company has obtained from NicOx an exclusive license to commercialize NCX-1000 in Canada and Poland as well as an option to acquire the same exclusive rights for the United States market. The Company and NicOx will share the cost of the future development of NCX-1000 jointly through the completion of Phase II clinical studies. The Company will thereafter conduct the required Phase III clinical studies and be responsible for regulatory filings in the exclusively licensed territories. The Company will pay NicOx options or milestone payments totalling up to $17,000,000 at various stages of development. An amount of $2,000,000 has been paid in 2003. The Company also agreed to pay royalties of up to 12% on net sales of the product.
On October 10, 2002, the Company acquired from Gentium S.p.A., an Italian company, exclusive rights to develop and market in North America, a patented 4 gram rectal gel formulation of mesalamine (5-ASA) for the treatment of active distal ulcerative colitis. In return the Company will make milestone payments totalling approximately $1,500,000, the majority of which will be paid upon approval in the United States. An amount of approximately $200,000 has been paid in 2003. The Company will also pay a royalty of 4% on net sales for a ten-year period from product's launch.
On July 22, 2003, the Company acquired from Merz Pharmaceutical GmbH ("Merz") an exclusive licence to use, develop and submit for approval of injectable and oral granule formulations containing L-ornithine and L-aspartate. In consideration of the rights and licenses granted by Merz under this agreement, the Company shall pay a royalty of 6% of net sales or 4% of net sales if the Company develops any patentable invention or improvement and Merz incorporates such invention or improvement into its products.
On February 22, 2005, the Company signed a license agreement with Lisapharma S.p.A., an Italian company, to submit for approval and commercialize, in North America, products in gel sachet and tablet dosage forms that contain sucralfate as the main active ingredient. Under the agreement, the Company shall pay license fees of up to $2,000,000 over a period of a maximum of four years (as of September 30, 2005 an amount of $1,000,000 has been recorded as expense) and make milestone payments totalling up to $3,000,000 upon regulatory approvals. The Company also agreed to pay royalties of 6% of net sales of products enjoying patent protection and 3% of net sales of products not enjoying patent protection for up to five years from a first commercial sale.
On May 1, 2005, the Company signed a license and technology agreement with Howard J. Smith & Associates PTY LTD ("HSA") an Australian company, to develop and market products for the treatment of viral hepatitis. The Company will make milestone payments totalling up to $17,000,000 at various stages of development or commercialization. The Company also agreed to pay royalties of 4.5% of net sales in countries where an HSA patent is in force and 2.25% of net sales in countries where no HSA patent is in force for a maximum of ten years after the first commercial sale of a product in the relevant country.
f) Employee benefit plan
A subsidiary of the Company has a defined contribution plan (the "Plan") for its U.S. employees. Participation is available to substantially all U.S. employees. Employees may contribute up to 15% of their gross pay and up to limits set by the U.S. Internal Revenue Service. During the year, the Board of Directors approved and the Company charged to operations a contribution to the Plan totalling $495,195 ($268,757 in 2004 and $319,871 in 2003).
g) Other
The Company is also subject to the possibility of tax assessments for some years. The Company does not believe that unfavorable decisions in any pending procedure, or the threat of procedures related to any future assessment or any amount it might be required to pay will have a material adverse effect on the Company's financial condition.
67
22. SUMMARY OF DIFFERENCES BETWEEN GENERALLY ACCEPTED ACCOUNTING PRINCIPLES IN THE UNITED STATES AND IN CANADA
The consolidated financial statements have been prepared in accordance with U.S. GAAP which, in the case of the Company, conform in all material respects with Canadian GAAP, except as set forth below:
| | 2005 | 2004 | 2003 | |||||
|---|---|---|---|---|---|---|---|---|
| | $ | $ | $ | |||||
| Earnings adjustments | ||||||||
| Net income in accordance with U.S. GAAP | 26,425 | 48,728 | 19,925 | |||||
| Acquired in-process research | — | — | 12,000 | |||||
| Amortization of new product acquisition costs(2) | (54 | ) | (54 | ) | (54 | ) | ||
| Stock-based compensation expense(9) | (4,590 | ) | — | — | ||||
| Implicit interest on convertible debt(4) | (4,631 | ) | (4,234 | ) | (2,292 | ) | ||
| Income tax impact of the above adjustments | 338 | 20 | (962 | ) | ||||
| Net earnings in accordance with Canadian GAAP(8) | 17,488 | 44,460 | 28,617 | |||||
| Earnings per share in accordance with Canadian GAAP | ||||||||
| Basic | 0.38 | 0.98 | 0.64 | |||||
| Diluted | 0.38 | 0.96 | 0.63 | |||||
| | 2005 | 2004 | ||||||||
|---|---|---|---|---|---|---|---|---|---|---|
| | U.S GAAP | Canadian GAAP | U.S GAAP | Canadian GAAP | ||||||
| | $ | $ | $ | $ | ||||||
| Balance sheet adjustments | ||||||||||
| Current assets(6) | 190,357 | 190,357 | 139,032 | 139,054 | ||||||
| Property, plant and equipment(6) | 31,673 | 31,673 | 31,252 | 31,265 | ||||||
| Intangible assets(2) | 388,921 | 401,229 | 407,875 | 420,235 | ||||||
| Goodwill(3)(6) | 27,467 | 28,862 | 27,467 | 28,862 | ||||||
| Deferred debt issue expenses | 2,577 | 2,577 | 3,088 | 3,088 | ||||||
| Deferred income tax asset | 412 | 412 | 930 | 930 | ||||||
| Current liabilities(6) | 58,336 | 58,336 | 51,362 | 51,430 | ||||||
| Long-term debt(4) | 126,332 | 113,250 | 127,916 | 110,203 | ||||||
| Deferred income tax liability(2)(3) | 39,135 | 40,234 | 38,290 | 39,376 | ||||||
| Shareholders' equity | ||||||||||
| Equity component of convertible debt(4) | — | 24,239 | — | 24,239 | ||||||
| Capital stock(5)(7)(9) | 261,714 | 273,022 | 260,643 | 267,288 | ||||||
| Additional paid-in capital(9) | 1,329 | 13,293 | — | — | ||||||
| Retained earnings(2)(3)(4)(5)(7)(9) | 138,787 | 112,806 | 112,362 | 107,671 | ||||||
| Accumulated foreign currency translation adjustments(7) | 15,774 | 19,930 | 19,071 | 23,227 | ||||||
68
- (1)
- Under U.S. GAAP, securities available for sale are recorded at their fair market value, unrealized gains or losses are recorded separately in shareholders' equity. Under Canadian GAAP, shortterm investments are recorded at cost. As at September 30, 2005, there is no material unrealized gain or loss.
- (2)
- Under U.S. GAAP, acquired in-process research are included in operations as at the date of acquisition as no alternative future use is established. Under Canadian GAAP, the acquired in-process research is deferred and amortized from the date of commencement of commercial production.
- (3)
- Under U.S. GAAP, some financial expenses were recorded when the minority interest in Axcan Scandipharm was purchased. Under Canadian GAAP, these financial expenses were included in goodwill.
- (4)
- Under U.S. GAAP, the entire convertible subordinated notes are included in long-term debt. Under Canadian GAAP, the estimated value of the right of conversion is included in the shareholders' equity as equity component of convertible debt and implicit interest is charged to income each year and accounted for in the balance sheet as an accretion to the liability component.
- (5)
- Under U.S. GAAP, share issuance expenses are deducted from the consideration received. Under Canadian GAAP, these expenses are charged directly to retained earnings.
- (6)
- Under U.S. GAAP, the investments in joint ventures are accounted for by the equity method. Under Canadian GAAP, these investments are accounted for using the proportionate consolidation method. This difference does not impact operations or shareholders' equity.
- (7)
- Effective October 1, 1999, the Company changed its measurement and reporting currency from the Canadian dollar to the U.S. dollar. Under U.S. GAAP, comparative figures must be restated as if the change in measurement and reporting currency had been applied retroactively. Under Canadian GAAP, comparative figures were presented using the translation of convenience method. At October 1, 1999, the change in measurement and reporting currency presented in accordance with Canadian GAAP resulted in an increase in cumulative translation adjustment balance of $4,156,000, and a decrease in capital stock balance of $3,584,000 and retained earnings balance of $572,000.
- (8)
- Under U.S. GAAP, the research and development tax credits are applied against income taxes. Under Canadian GAAP, these tax credits would be applied against research and development expenses. This difference had no impact on the consolidated net income.
- (9)
- Under U.S. GAAP, stock-based compensation is measured at intrinsic value and the effect of using the fair value method is disclosed in the summary of significant accounting policies. Under Canadian GAAP, stock-based compensation is measured using the fair value method since October 1, 2004. As of October 1, 2004 the retained earnings have been reduced by $12,353,000, the capital stock has been increased by $4,100,233, the additional paid-in capital has been increased by $8,722,767 and the income taxes receivable have been increased by $470,000.
69
BOARD OF DIRECTORS
The Board of Directors of Axcan believes that sound corporate governance practices are essential to the best interests of the Company and its shareholders and that these practices should be reviewed regularly to ensure they are appropriate. The Board of Directors believes that the Company's practices are consistent with corporate governance rules and guidelines applicable in Canada and the United States, including the new Canadian Securities Administrators' Corporate Governance Guidelines, and the Board subscribes to the principles enunciated in these standards. The Company is committed to complying with the spirit as well as the letter of all Canadian financial control and reporting obligations. The Company's Business Ethics and Conduct Codeand Corporate Governance Principles are published on our web site, www.axcan.com. For further details please refer to the Company's Management Proxy Circular.
70
Léon F. Gosselin
Founder and outgoing President and Chief
Executive Officer, Axcan Pharma Inc.
Director since 1993
Chairman of the Board
Not Independent
Dr. E. Rolland Dickson
Emeritus Medical Director of Development
Mayo Foundation
Director since 2004
Member of the Corporate Governance
and Nominating Committee
Independent
Jacques Gauthier
Advisor to management
Montreal Clinical Research Institute
Director since 1995
Chairman of the Compensation Committee
Independent
Louis P. Lacasse
President, GeneChem Management Inc.
Director since 1995
Chairman of the Audit Committee and
Member of the Compensation Committee
Independent
Colin R. Mallet
Consultant
Director since 1995
Chairman of the Corporate Governance
and Nominating Committee
Member of the Compensation Committee
Independent
David W. Mims
Executive Vice President and
Chief Operating Officer
Axcan Pharma Inc.
Director since 2000
Not Independent
François Painchaud
Partner, Léger Robic Richard, lawyers,
patent and trademark agents
Director since 1995
Secretary
Not Independent
Dr. Claude Sauriol
Consultant
Director since 1993
Member of the Audit Committee
Independent
Michael M. Tarnow
Consultant
Director since 2000
Member of the Corporate Governance
and Nominating Committee
Member of the Audit Committee
Independent
Frank A.G.M. Verwiel, M.D.
President and Chief Executive Officer
Axcan Pharma Inc.
Director since 2005
Not Independent
71
Frank A.G.M. Verwiel, M.D.
President and
Chief Executive Officer
David W. Mims
Executive Vice President
and Chief Operating Officer
Dr. Patrick Colin
Vice President
Research and Development
Martha Donze
Vice President
Corporate Administration
Jean-François Hébert
Vice President
Global Manufacturing Operations
Dr. François Martin
Senior Vice President
Scientific Affairs
Jocelyn Pelchat
Senior Vice President
International Commercial Operations
Richard Tarte
Vice President
Corporate Development and General Counsel
Michael E. Thiel
Vice President, Marketing and Global Leader, ITAX
Jean Vézina
Vice President
Finance and Chief Financial Officer
72
CORPORATE OFFICE
Axcan Pharma Inc.
597 Laurier Boulevard
Mont-Saint-Hilaire, Quebec
Canada J3H 6C4
Telephone: (450) 467-5138 or (800) 565-3255
Fax: (450) 464-9979
Web site: www.axcan.com
STOCK LISTINGS
Toronto Stock Exchange under the symbol AXP.
NASDAQ National Market under the symbol AXCA.
NUMBER OF SHARES
At December 7, 2005, there were 45,688,344 common shares outstanding.
DIVIDEND POLICY
The Company currently does not pay dividends on its common shares, and has no plans to do so in the foreseeable future, preferring to reinvest its cash to enhance the Company's growth.
TRANSFER AGENT AND REGISTRAR
Our transfer agent, Computershare Trust Company of Canada, can assist investors with a variety of shareholder-related services, including changes of address and lost share certificates
Computershare Trust Company of Canada
1500 University Street
Suite 700
Montreal, Quebec
Canada H3A 3S8
Telephone: (800) 332-0095
www.computershare.com
INDEPENDENT AUDITORS
Raymond Chabot Grant Thornton, LLP
Chartered Accountants
600 de la Gauchetière Street West
Suite 1900
Montreal, Quebec
Canada H3B 4L8
Telephone: (514) 878-2691
www.rcgt.com
ANNUAL MEETING OF SHAREHOLDERS
The Annual General Meeting of Axcan Pharma Inc. will be held at 9:00 A.M., Eastern Time, February 22, 2006, at:
Centre Mont-Royal
2200 Mansfield Street
Montreal, Quebec
Canada H3A 3R8
Telephone: (514) 844-2000
An archived version of the webcast will be available on Axcan's Web site after the Annual Meeting.
INVESTOR RELATIONS
Isabelle Adjahi
Director, Investor Relations
Axcan Pharma Inc.
597 Laurier Boulevard
Mont-Saint-Hilaire, Quebec
Canada J3H 6C4
Telephone: (450) 467-5138 or (800) 565-3255
Fax: (450) 464-9979
E-mail: iadjahi@axcan.com
Axcan files all mandatory information with Canadian securities commissions and the U.S. Securities and Exchange Commission. This information is available from the Company upon request.
Archives of financial and shareholder information are available on Axcan's Web site at www.axcan.com.
Pour obtenir une version française du rapport annuel, veuillez communiquer avec le service des relations avec les investisseurs.
Design: Spirale Communication Marketing Inc.
The names BENTYL, BENTYLOL, CANASA, CARAFATE, DELURSAN, FLUTTER, HELIZIDE, ITAX, LACTEOL, MODULON, PANZYTRAT, PHOTOFRIN,PHOTOBARR, PROCTOSEDYL, SALOFALK, SCANDICAL, SCANDISHAKE, SULCRATE, TAGAMET, ULTRASE, URSO and VIOKASE appearing in this annual report are trademarks and registered trademarks of Axcan and its subsidiaries; the name ADEKs is a registered trademark of Carlsson-Rensselaer Corporation and CORTENEMA is a registered trademark of Reid Rowell Inc.
73
BILE DUCTS
Channels that collect bile from the liver and deliver it to the intestine.
CHOLESTATIC DISEASES OF THE LIVER
Conditions in which the bile flow from the liver is impaired.
COLORECTAL ADENOMATEOUS POLYPS
Polyps that are considered precursors to colorectal cancer.
CROHN'S DISEASE
Inflammatory Bowel Disease that affects the wall of the gastrointestinal tract. Crohn's Disease can affect any part of the gastrointestinal tract but mostly affects the ileum, the last portion of the small bowel and the colon.
CYSTIC FIBROSIS
Congenital disease characterized by excessive secretions of certain glands, resulting in pancreatic insufficiency and pulmonary disorders. The average lifespan of a Cystic Fibrosis patient is approximately 32 years.
DUODENUM
Part of the small intestine attached to the end of the stomach.
EXOCRINE PANCREATIC INSUFFICIENCY
Decreased production and release of enzymes produced in the pancreas, which leads to digestive problems.
FIBROSIS
Formation of excess fibrous tissue characterized by increased collagen concentrations, which gives a rigid consistence to the affected tissue (scar tissue consists mainly of fibrosis).
GASTRIC CANCER
Cancer of the cell lining of the gastric mucosa.
HELICOBACTER PYLORI
Bacterium with a spiral tail, which lives under the gastric mucosa layer. The presence ofHelicobacter pylori is correlated with gastritis, as well as gastric and duodenal ulcers.Helicobacter pylori is considered to be the most important factor in the cause of peptic ulceration and is formally classified as a Category 1 human carcinogen by the World Health Organization.
HEPATITIS
Inflammation of the liver due to infection or toxins.
INFLAMMATORY BOWEL DISEASES
Chronic diseases of unknown cause characterized by inflammation of portions of the gastrointestinal tract. Ulcerative colitis, ulcerative proctitis (a distal form of ulcerative colitis) and Crohn's Disease constitute the group of illnesses referred to as idiopathic Inflammatory Bowel Diseases. The course of Inflammatory Bowel Diseases is a succession of acute attacks followed by periods of remission.
IRRITABLE BOWEL SYNDROME
Functional bowel disorder which primarily affects gastrointestinal motility.
LIVER
Organ located in the top right portion of the abdominal cavity connected to the digestive tract. It secretes bile that is excreted in the duodenum, thus facilitating digestion of food in the small intestine. The liver plays a key role in the processing and storage of various products of absorption.
MOTILITY
Ability of the gastrointestinal tract to undergo rhythmic muscular contractions.
MUCOSA
Thin sheets of tissue that cover or line various parts of the body such as the mouth or digestive tract.
PANCREAS
Abdominal gland located behind the stomach and connected to the gastrointestinal tract that secretes pancreatic juice to aid digestion (pancreatic enzymes) and insulin, an essential hormone for the metabolism of sugars.
PANCREATITIS
Inflammation of the pancreas.
POLYP
Small tumor-like growth that projects from a mucus membrane surface (i.e., colon or rectum).
PRIMARY BILIARY CIRRHOSIS
A chronic cholestatic liver disease that progresses slowly toward a terminal phase characterized by jaundice, signs of decompensated cirrhosis, ascites and variceal bleeding. The prognosis averages 7 to 12 years from diagnosis to death or liver transplant.
PRIMARY SCLEROSING CHOLANGITIS
A liver disorder characterized by an inflammatory and sclerosing process leading to a progressive reduction in the diameter of the bile ducts. Its progressive course generally leads to liver cirrhosis, portal hypertension and often death, as the bile that normally flows out of the liver instead accumulates there, resulting in an alteration of liver cells. The average survival is 4 to 10 years following diagnosis.
STEATORRHEA
Abnormally high fecal excretion of non-digestive fat.
ULCER
Necrotic lesion characterized by a crater-like erosion of the wall of the stomach (gastric ulcer) or the duodenum (duodenal ulcer), often associated with painful symptoms.
ULCERATIVE COLITIS/PROCTITIS
Chronic inflammatory disease which affects the inner mucus membrane of the colon and more often the distal portions of the colon (i.e., the rectum and sigmoid).
URSODIOL (URSODEOXYCHOLIC ACID)
Naturally occurring bile acid present as a minor fraction of the total human bile acids, and in greater concentrations, in the bile of certain animal species such as bears.

"The past years of growth and success have paved the way for a very exciting future for Axcan. I strongly believe that the Company is well positioned to pursue expansion and deliver continued results to patients, physicians, and stakeholders. I am confident that under Dr. Verwiel's leadership, we have the talent as well as the formula to take our Company to new heights. I am pleased that Frank Verwiel has joined Axcan and look forward to his leading our Company to the next level."
Léon F. Gosselin
Chairman of the Board
![]()
Pursuant to the requirements of the Securities Exchange Act of 1934, the registrant has duly caused this report to be signed on its behalf by the undersigned, thereunto duly authorized.
| AXCAN PHARMA INC. | |||
Date: January 6, 2006 | |||
By: | /s/ JEAN VEZINA Name: Jean Vezina Title: Vice-President, Finance and Chief Financial Officer | ||
GASTROENTEROLOGY
ABOUT AXCAN
SALES HIGHLIGHTS
FINANCIAL HIGHLIGHTS
MESSAGE TO OUR SHAREHOLDERS
OUR INVESTMENT IN AXCAN'S FUTURE
A QUESTION AND ANSWER SESSION WITH FRANK A.G.M. VERWIEL, M.D.
OUR CORE THERAPEUTIC AREAS
OUR PRODUCTS
OUR RESEARCH AND DEVELOPMENT PORTFOLIO
R&D ITOPRIDE
R&D
OUR COMMITMENT
MANAGEMENT'S DISCUSSION AND ANALYSIS OF FINANCIAL CONDITION AND RESULTS OF OPERATIONS
MANAGEMENT'S REPORT
REPORT OF INDEPENDENT REGISTERED PUBLIC ACCOUNTING FIRM
CONSOLIDATED SHAREHOLDERS' EQUITY
NOTES TO CONSOLIDATED FINANCIAL STATEMENTS September 30 Amounts in the tables are stated in thousands of U.S. dollars, except share related data.
CORPORATE GOVERNANCE
BOARD OF DIRECTORS
MANAGEMENT TEAM
CORPORATE INFORMATION
GLOSSARY
SIGNATURES