Exhibit 99.2

This presentation contains certain “forward-looking statements” based on management’s current expectations. Forward-looking statements include, but are not limited to, the information provided on the slide entitled “Fiscal 2019 Financial Outlook”, as well as statements which can be identified by the use of forward-looking terminology such as "may," "will," “can,” "should," "expect," "intend," "estimate," "continue," "project," "guidance," "forecast," “outlook,” "anticipate," “moving,” “leveraging,” “capitalizing,” “developing,” “drive,” “targeting,” “assume,” “plan,” “build,” “pursue,” “maintain,” “on track,” “well positioned to,” “look forward to,” “to acquire,” “achieve,” “strategic vision,” “growth opportunities” or comparable terms, and similar or other references to future periods. Statements herein regarding our business and transformation strategies; our plans, objectives, goals, beliefs, future events, business conditions, results of operations and financial position; and our business outlook and business trends are forward-looking statements.Forward-looking statements are neither historical facts nor assurances of future performance. Instead, they are based only on our current beliefs, expectations and assumptions regarding the future of our business, future plans and strategies, projections, anticipated events and trends, and other future conditions. Because forward-looking statements relate to the future, they are subject to inherent uncertainties, risks and changes in circumstances that are difficult to predict and many of which are outside of our control. Our actual results and financial condition may differ materially from those indicated in the forward-looking statements due to a number of important factors. Therefore, you should not rely on any of these forward-looking statements. Important factors that could cause our actual results and financial condition to differ materially from those indicated in the forward-looking statements include, among others, the following:risks and uncertainties such as expected economic trends;the ability to anticipate consumer preferences;the ability to control costs; the ability to successfully execute our operational efficiency initiatives and growth strategies;the ability to achieve intended benefits, cost savings and synergies from acquisitions; the risk of cybersecurity threats and privacy or data security breaches; andthe impact of tax legislation.Please refer to the Company’s latest Annual Report on Form 10-K and its other filings with the Securities and Exchange Commission for a complete list of risks and important factors.We assume no obligation to revise or update any such forward-looking statements for any reason, except as required by law. 2

highlights QUARTER from the
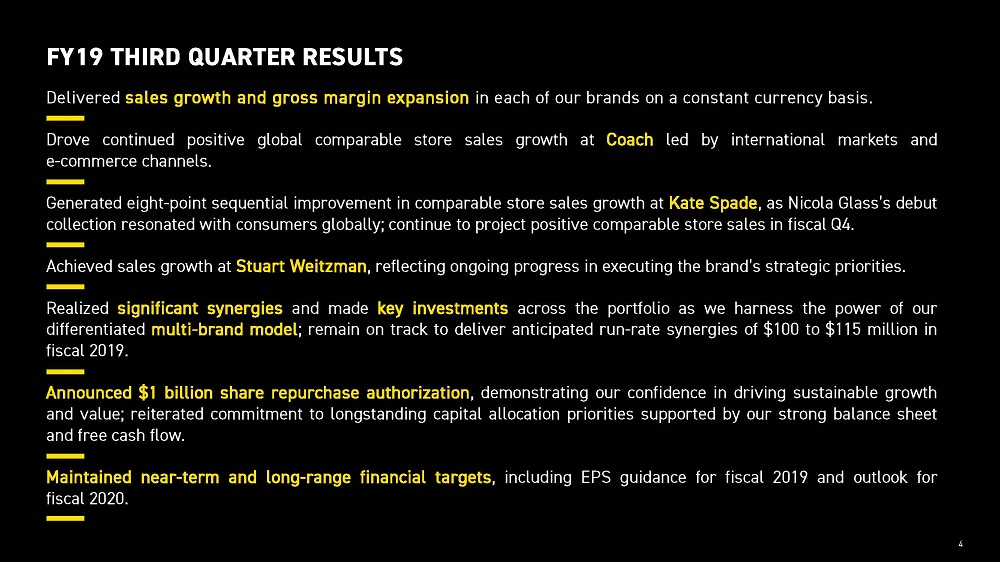
Delivered sales growth and gross margin expansion in each of our brands on a constant currency basis.Drove continued positive global comparable store sales growth at Coach led by international markets ande-commerce channels. Generated eight-point sequential improvement in comparable store sales growth at Kate Spade, as Nicola Glass’s debut collection resonated with consumers globally; continue to project positive comparable store sales in fiscal Q4.Achieved sales growth at Stuart Weitzman, reflecting ongoing progress in executing the brand’s strategic priorities.Realized significant synergies and made key investments across the portfolio as we harness the power of our differentiated multi-brand model; remain on track to deliver anticipated run-rate synergies of $100 to $115 million in fiscal 2019.Announced $1 billion share repurchase authorization, demonstrating our confidence in driving sustainable growth and value; reiterated commitment to longstanding capital allocation priorities supported by our strong balance sheet and free cash flow.Maintained near-term and long-range financial targets, including EPS guidance for fiscal 2019 and outlook forfiscal 2020. 4 FY19 THIRD QUARTER RESULTS
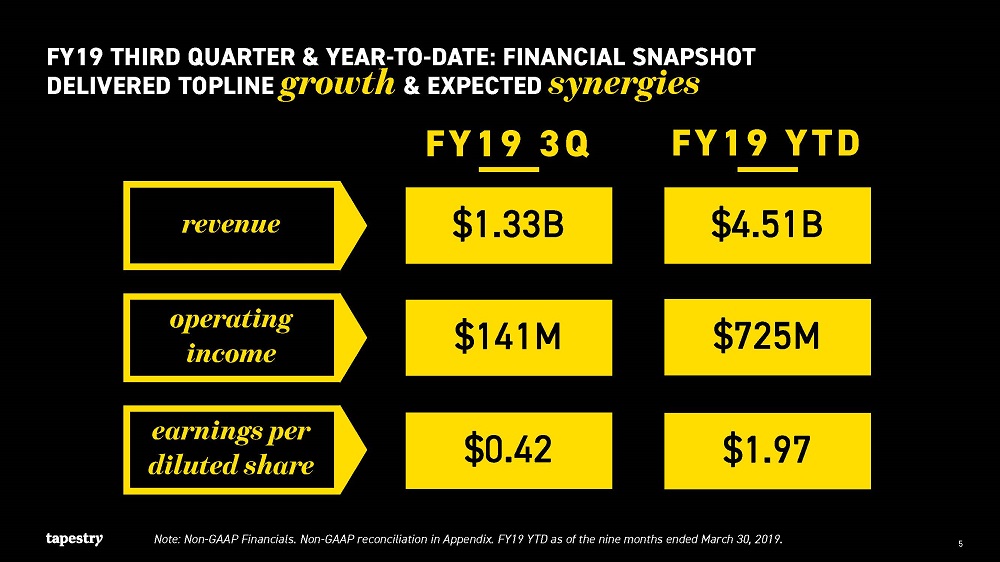
Note: Non-GAAP Financials. Non-GAAP reconciliation in Appendix. FY19 YTD as of the nine months ended March 30, 2019. DELIVERED TOPLINE growth & EXPECTED synergies FY19 THIRD QUARTER & YEAR-TO-DATE: FINANCIAL SNAPSHOT $0.42 FY19 3Q $1.33B $141M $0.42 $0.42 FY19 YTD $4.51B $725M $1.97 revenue operating income earnings per diluted share 5
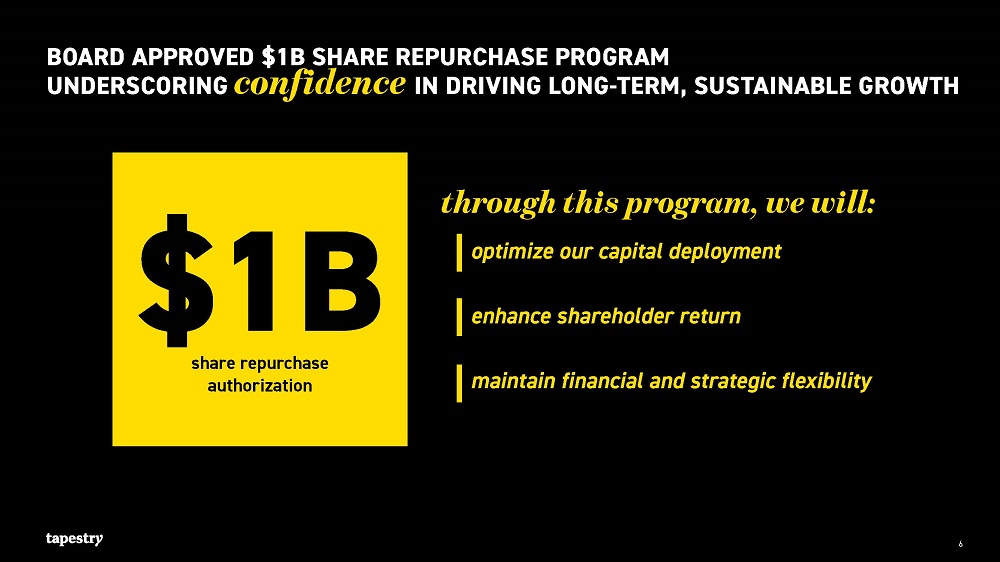
share repurchaseauthorization $1B UNDERSCORING confidence IN DRIVING LONG-TERM, SUSTAINABLE GROWTH BOARD APPROVED $1B SHARE REPURCHASE PROGRAM 6 through this program, we will: optimize our capital deployment enhance shareholder return maintain financial and strategic flexibility
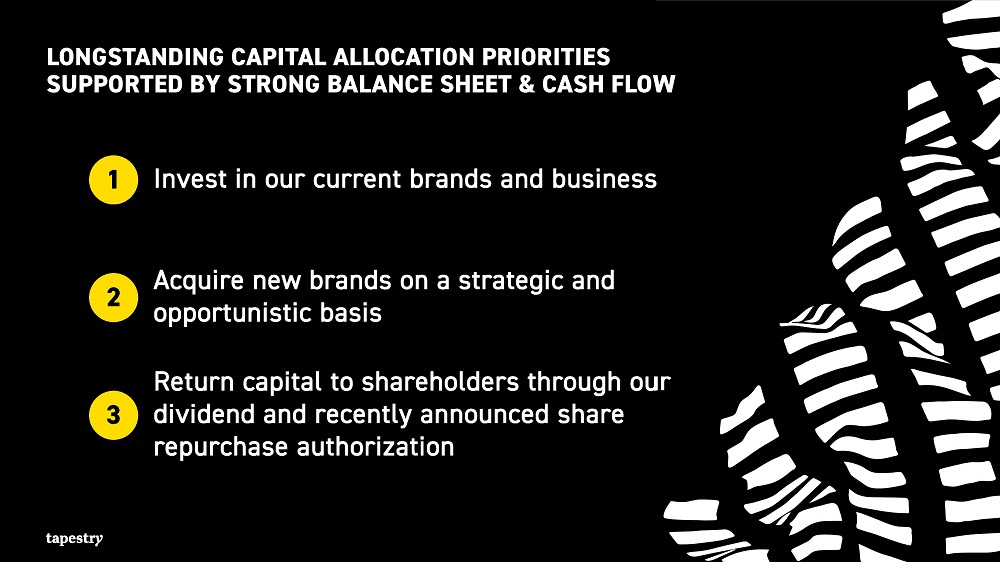
LONGSTANDING CAPITAL ALLOCATION PRIORITIES 7 Invest in our current brands and business Acquire new brands on a strategic and opportunistic basis Return capital to shareholders through our dividend and recently announced share repurchase authorization 3 2 1 SUPPORTED BY STRONG BALANCE SHEET & CASH FLOW
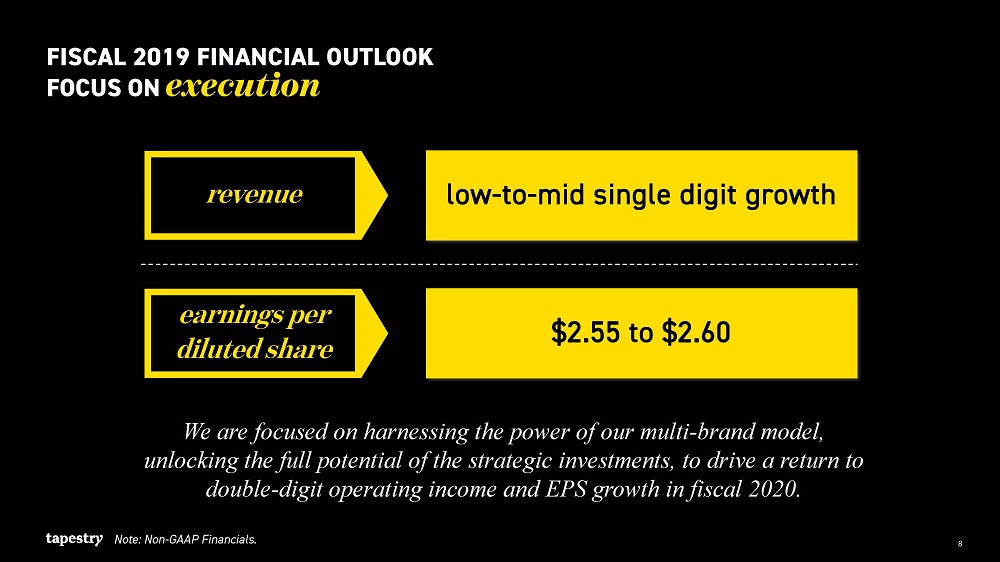
8 FOCUS ON execution FISCAL 2019 FINANCIAL OUTLOOK Note: Non-GAAP Financials. $2.55 to $2.60 low-to-mid single digit growth We are focused on harnessing the power of our multi-brand model, unlocking the full potential of the strategic investments, to drive a return to double-digit operating income and EPS growth in fiscal 2020. revenue earnings per diluted share
company OVERVIEW

DEFINED BY INCLUSIVITY RATHER THAN EXCLUSIVITY, we area global house of brands that embraces the exploration of individuality.We believe that true luxury is a freedom of expression that ignites confidence and authenticity.Approachable and inviting, we celebrate brands that create joy every day for people around the world. Our passion, detailed approach and genuine love of what we do enables us to develop and nurture brands so that they can reach their full potential.The value of our brands is not bestowed by previous generations or borrowed from tradition. It is determined by quality, craftsmanship, creativity and the opportunity for self-expression they provide. We believe anyone from anywhere can have the best idea, and with hard work and dedication anything is possible. 10
“We’re a different kind of company. We have a collection of brands that have very specific and unique identities. All of our brands are based on great design, quality and craftsmanship. At the end of the day, all of our teams are focused on providing tremendous value for customers.” VICTOR LUIS, ceo 11

values our OPTIMISTICINNOVATIVEINCLUSIVE

principles BRAND-LEDCONSUMER-CENTRIC MERITOCRACY our
brands our GLOBAL&UNIQUEDIFFERENTIATED

model our SHARED&SCALABLEDISCIPLINED
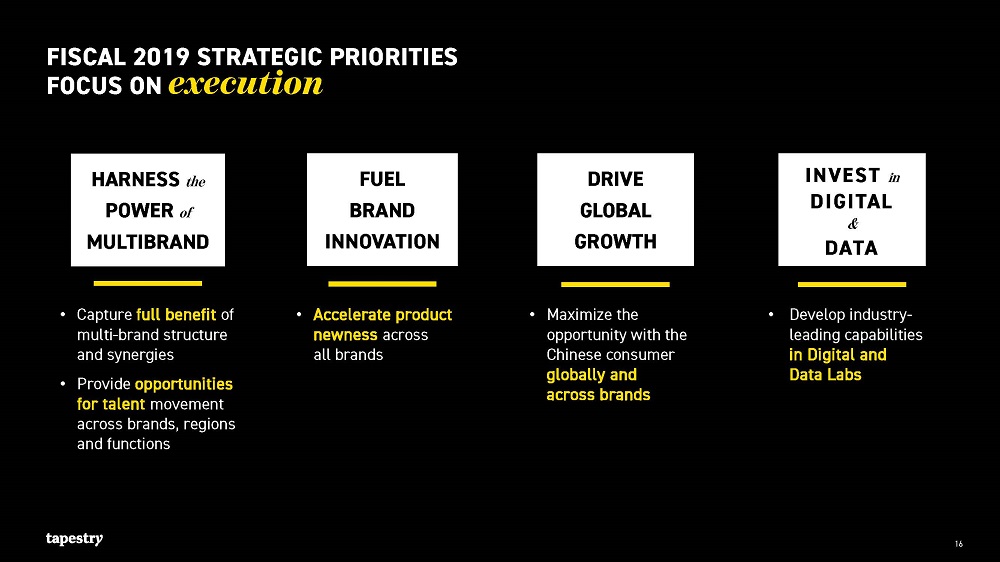
FOCUS ON execution HARNESS thePOWER ofMULTIBRAND FUELBRANDINNOVATION DRIVEGLOBALGROWTH INVEST inDIGITAL& DATA Capture full benefit of multi-brand structure and synergies Provide opportunities for talent movement across brands, regions and functions Accelerate product newness acrossall brands Maximize the opportunity with the Chinese consumer globally andacross brands Develop industry-leading capabilities in Digital andData Labs FISCAL 2019 STRATEGIC PRIORITIES 16

Leadership Team Andrea Shaw ResnickInterim CFO and Global Head of Investor Relations & Corporate Communications Peter CharlesGlobal Head of Supply Chain Adrianne KirsznerGlobal Head of Inventory Management & Merchandise Planning Michael BraineChief Information Officer Anna BakstCEO and Brand President,Kate Spade Noam ParanskyChief Digital Officer Sarah DunnGlobal Human Resources Officer Todd KahnPresident, Chief Administrative Officer and Chief Legal Officer Joshua SchulmanCEO and Brand President,Coach Victor LuisChief Executive Officer Zeynep SchoenwaelderGlobal Head of Strategy & Data Labs Eraldo PolettoCEO and Brand President,Stuart Weitzman

corporate RESPONSIBILITY

“Built on our values of Optimism, Innovation and Inclusivity, these goals solidify our commitment to responsible citizenship, as we recognize our role as a leader in our industry to effect real, measurable change. Addressing pressing global issues and contributing to a world that is inclusive, sustainable and safe is a responsibility that we all share.” VICTOR LUIS, ceo 2025 CORPORATE RESPONSIBILITY STRATEGY & GOALS OURPEOPLEOURPLANETOURCOMMUNITIES 19

CORPORATE SOCIAL RESPONSIBILITY OUR PROGRAM IS FOCUSED ON THREE strategic pillars OUR PEOPLE Having individuals from different backgrounds with different experiences around the table creates a diversity of perspectives that enrich our organization. 1 OURPLANET Tapestry is dedicated to reducing its environmental impact across the world through continuous innovation. 2 OURCOMMUNITIES Tapestry engages closely with the communities in which our employees live and work, helping to strengthen them. 3 20
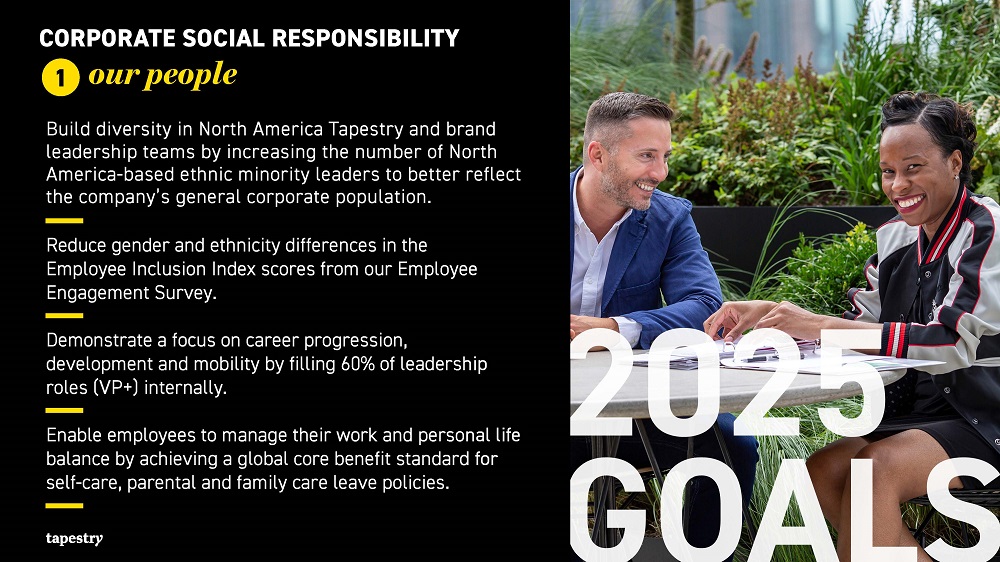
Build diversity in North America Tapestry and brand leadership teams by increasing the number of North America-based ethnic minority leaders to better reflect the company’s general corporate population.Reduce gender and ethnicity differences in the Employee Inclusion Index scores from our Employee Engagement Survey.Demonstrate a focus on career progression, development and mobility by filling 60% of leadership roles (VP+) internally.Enable employees to manage their work and personal life balance by achieving a global core benefit standard for self-care, parental and family care leave policies. 2025GOALS CORPORATE SOCIAL RESPONSIBILITY our people 1

RECENTMILESTONES Expanded our maternity leave in 2018 in the United States. Donated approximately $500,000 in fiscal 2018 to organizations that our employees are passionate about through our matching gift programs. Achieved a score of 100 for the fifth consecutive year on the Human Rights Campaign Corporate Equality Index, earningthe designation as a Best Place to Work for LGBTQ Equality.Recognized on the Forbes Diversity & Inclusion List in 2019 for the second consecutive year. Signed the CEO Action Pledge for Diversity & Inclusion in 2017. Maintained a Board of Directors with ethnic, gender and nationality diversity. Recognized by 2020 Women on Boards and Women’s Forumof New York for Board diversity in fiscal 2017. CORPORATE SOCIAL RESPONSIBILITY our people 1 22

CORPORATE SOCIAL RESPONSIBILITY our planet 2 Achieve a 20% reduction in absolute Scope 1 & Scope 2 CO2e emissions & 20% reduction in absolute Scope 3 emissions from freight shipping over a 2017 baseline.Attain a 95% traceability & mapping of our raw materials to ensure a transparent & responsible supply chain.Ensure that 90% of leather is sourced from Silver- and Gold-rated Leather Working Group tanneries.Achieve 75% recycled content in packaging and 25% reduction in North America corporate & distribution center waste.Achieve a 10% reduction in water usage across Tapestry and its supply chain. 2025GOALS Photo courtesy of Friends of the High Line.

RECENTMILESTONES CORPORATE SOCIAL RESPONSIBILITY our planet 2 Achieved a 4.4% reduction in absolute Scope 1 and 2CO2e emissions across Tapestry in fiscal 2018 over a2017 baseline. Provided in-person compliance and anti-corruption training to over 120 suppliers and manufacturers infiscal 2017 and early fiscal 2018.Signed the UN Global Compact in October 2018, reinforcing our commitment to sustainability.Implemented a Coach fur-free policy, beginning with the Fall 2019 collection. 24
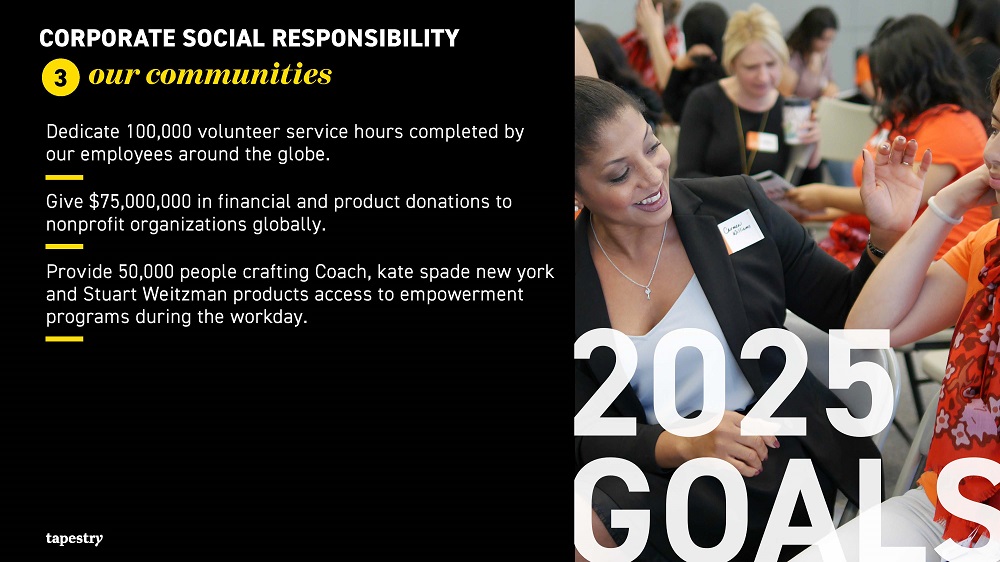
CORPORATE SOCIAL RESPONSIBILITY our communities 3 2025GOALS Dedicate 100,000 volunteer service hours completed by our employees around the globe.Give $75,000,000 in financial and product donations to nonprofit organizations globally.Provide 50,000 people crafting Coach, kate spade new york and Stuart Weitzman products access to empowerment programs during the workday.

RECENTMILESTONES CORPORATE SOCIAL RESPONSIBILITY our communities 3 Donated over $48 million through The Coach Foundation since its inception in 2008 and launched the “Dream It Real” initiative which supports young people as they pursue their dreams.Employed and empowered 162 women in Masoro, Rwanda through the Kate Spade on purpose program in 2017. Engaged 1,850 employees to volunteer a combined 6,000 hours across projects to support their local communities in fiscal 2018. Distributed numerous grants worldwide to nonprofit organizations through the Coach and Kate Spade Foundations. Provided humanitarian response to victims of hurricanes and other natural disasters in fiscal 2017. 26

fiscal2018
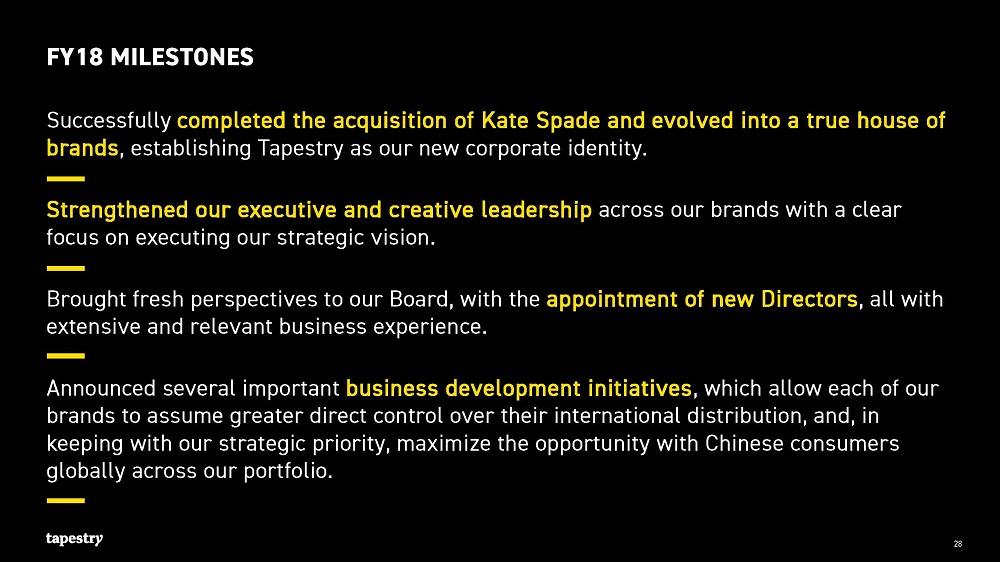
Successfully completed the acquisition of Kate Spade and evolved into a true house of brands, establishing Tapestry as our new corporate identity. Strengthened our executive and creative leadership across our brands with a clear focus on executing our strategic vision. Brought fresh perspectives to our Board, with the appointment of new Directors, all with extensive and relevant business experience. Announced several important business development initiatives, which allow each of our brands to assume greater direct control over their international distribution, and, in keeping with our strategic priority, maximize the opportunity with Chinese consumers globally across our portfolio. Fy18 MILESTONES 28
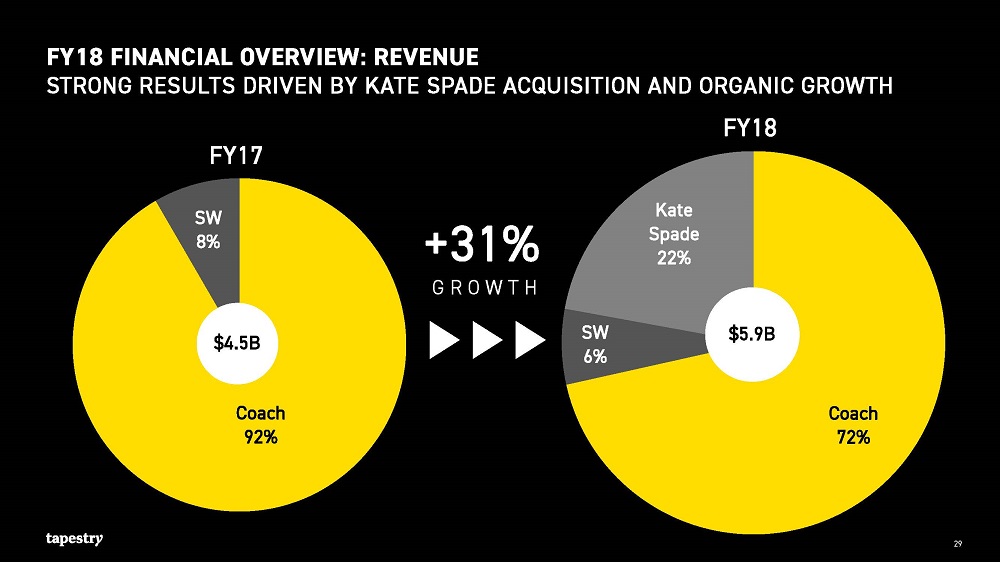
FY18 FINANCIAL OVERVIEW: REVENUE STRONG RESULTS DRIVEN BY KATE SPADE ACQUISITION AND ORGANIC GROWTH FY18 $5.9B FY17 $4.5B +31% GROWTH 29

FY18 FINANCIAL OVERVIEW: OPERATING INCOME STRONG RESULTS DRIVEN BY KATE SPADE ACQUISITION AND ORGANIC GROWTH $813M $992M FY17 FY18 +22% GROWTH Note: Non-GAAP Financials. Non-GAAP reconciliation in Appendix. 30

FY18 FINANCIAL OVERVIEW: EARNINGS PER DILUTED SHARESTRONG RESULTS DRIVEN BY KATE SPADE ACQUISITION AND ORGANIC GROWTH $2.15 $2.63 FY17 FY18 +22% GROWTH Note: Non-GAAP Financials. Non-GAAP reconciliation in Appendix. 31

OPPORTUNITY ACROSS BRANDS IN THE ATTRACTIVE AND GROWING GLOBAL PREMIUM HANDBAG AND ACCESSORIES, FOOTWEAR AND OUTERWEAR MARKET Handbag & Accessories Footwear Outerwear Source: Tapestry Global Market Sizing Model, Euromonitor, Public Filings, Analyst Reports, NPD and Yano.Note: Growth noted is constant currency. $91B FY18 Handbag & Accessories Footwear Outerwear $83B FY17 32 +7% GROWTH

~70 COUNTRIES6 CONTINENTS As of FY18.
OVERVIEWbyBRAND

C:\Users\Robert Feliciano\Documents\Coach\Coach Brand 2019\FINAL ASSSETS X PR\FINAL ASSSETS X PR\Composed JPEGS - RGB for digital only
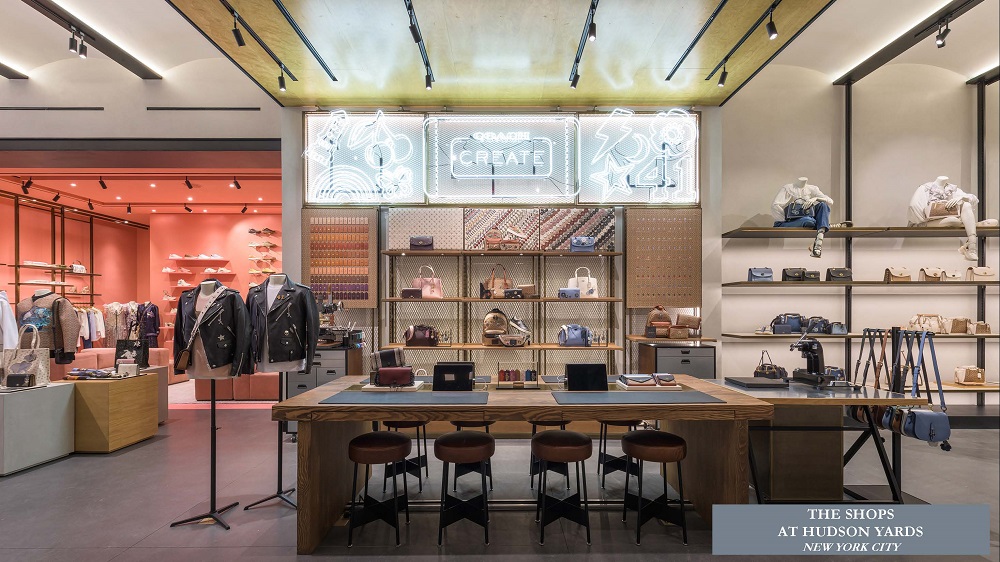
The shopsAt Hudson yardsNew York city
COACH CREATE POP-UPTHE stage at isetan ShinjukuTokyo, japan

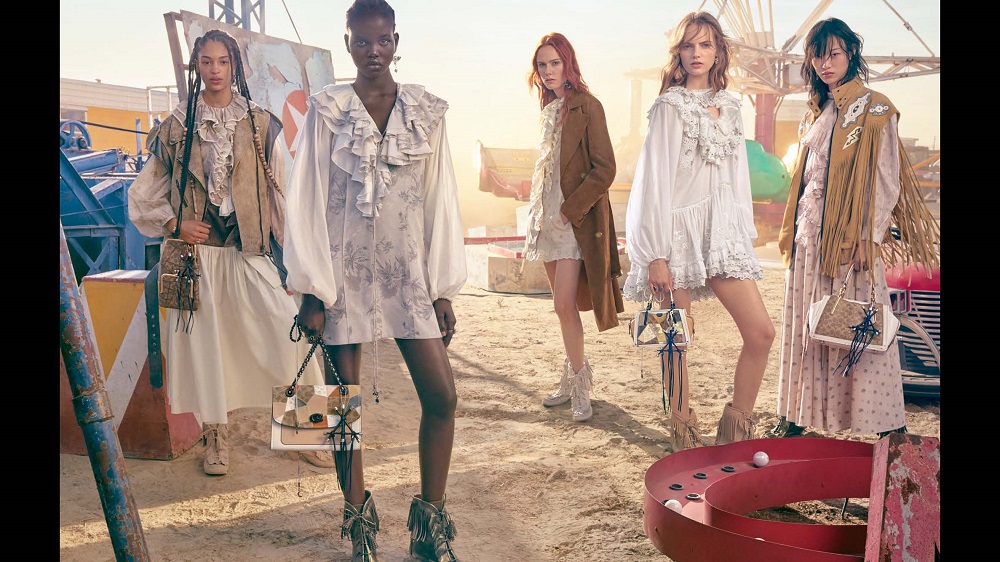
“For over 75 years, Coach has been part of the American landscape. As we write our next chapter, we’re building on our heritage of craftsmanship and confident New York style to deliver a complete lifestyle brand formodern lives.” Joshua Schulman, CEO & Brand President, Coach 40

Coach inspires the dreamer in all of us, connecting our modern lives with the spirit of the open road. our vision 41
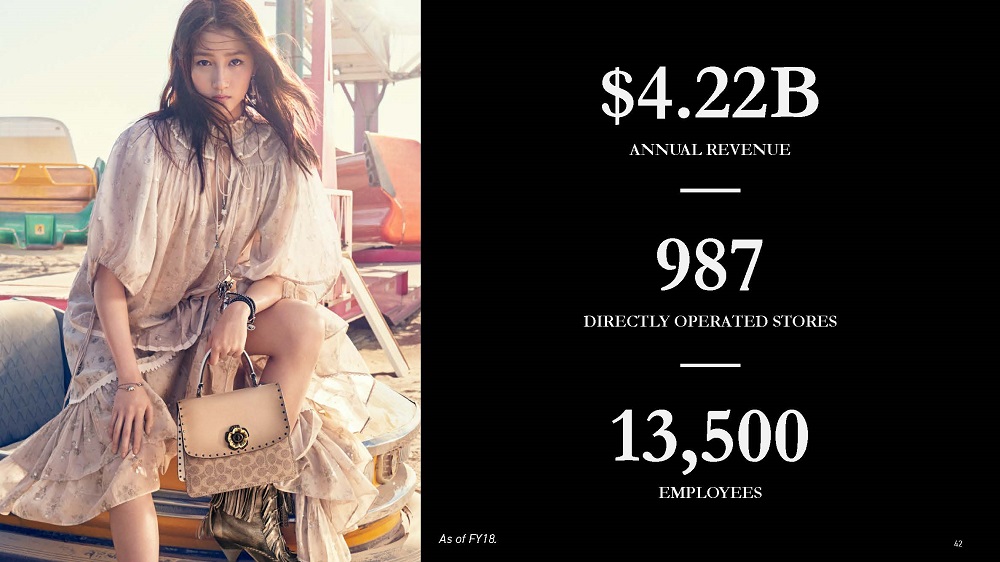
As of FY18. 13,500EMPLOYEES 987DIRECTLY OPERATED STORES $4.22BANNUAL REVENUE 42
COACH FISCAL 2018 MILESTONES Successfully reinvigorated the $300-$400 handbagprice segment.Stuart Vevers created new expression of Signature and the customer immediately embraced his iteration of thisbrand icon.Grew categories outside of Women’s bags and small leathergoods–notably footwear, ready-to-wear and Men’s. Drove fashion authority through well-received runway showsand broadened the brand reach through the collaboration with Selena Gomez.Improved brand momentum with the Broad Premium consumer, and specifically millennials, as evidenced in ourU.S. brand tracking survey. 43

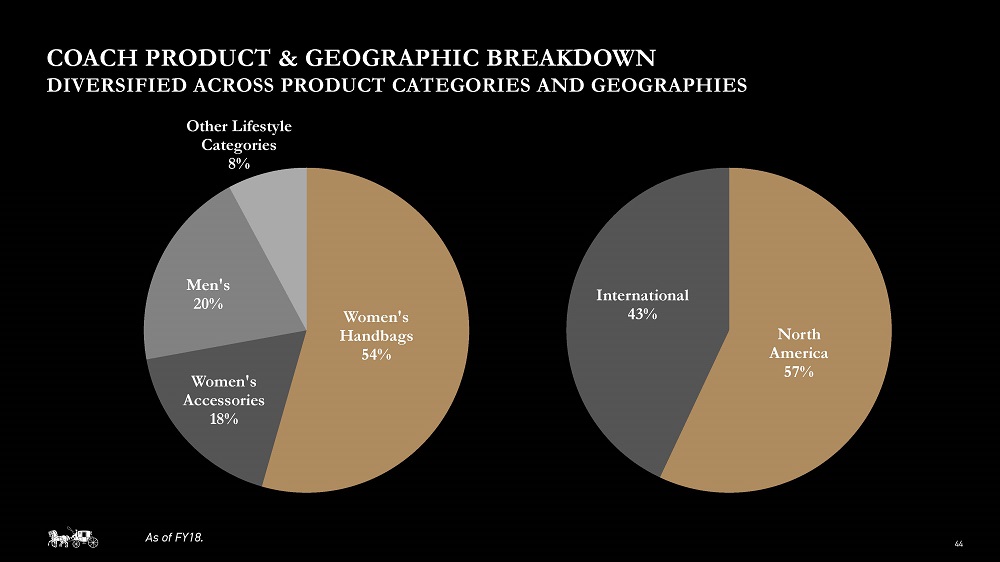
coach product & geographic breakdownDIVERSIFIED ACROSS PRODUCT CATEGORIES AND GEOGRAPHIES 44 As of FY18.
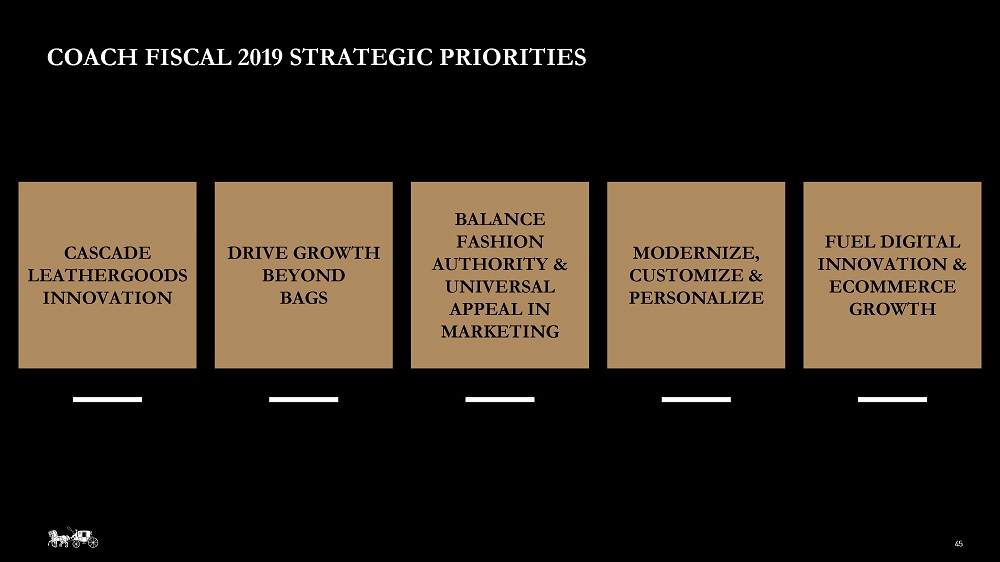
COACH FISCAL 2019 STRATEGIC PRIORITIES Cascade Leathergoods Innovation DRIVE GrowthBeyondbags Balance Fashion Authority & Universal Appeal in Marketing Modernize, Customize & Personalize Fuel Digital Innovation & Ecommerce Growth 45
THE SHOPSAT HUDSON YARDSNEW YORK CITY

“Kate Spade has tremendous opportunity across product categories, channels and geographies. We are leveraging the brand’s global potential, bringing its unique and empowering feminine positioning to women around the world.” Anna Bakst, CEO & Brand President, Kate Spade 49

OUR VISION A globally admired aspirational life & style brand, delivering brand-enhancing profitable growth,where people — our customers and teams — areat the center of everything we do.
As of FY18. 5,500EMPLOYEES 342DIRECTLY OPERATED STORES $1.28B ANNUAL REVENUE 51

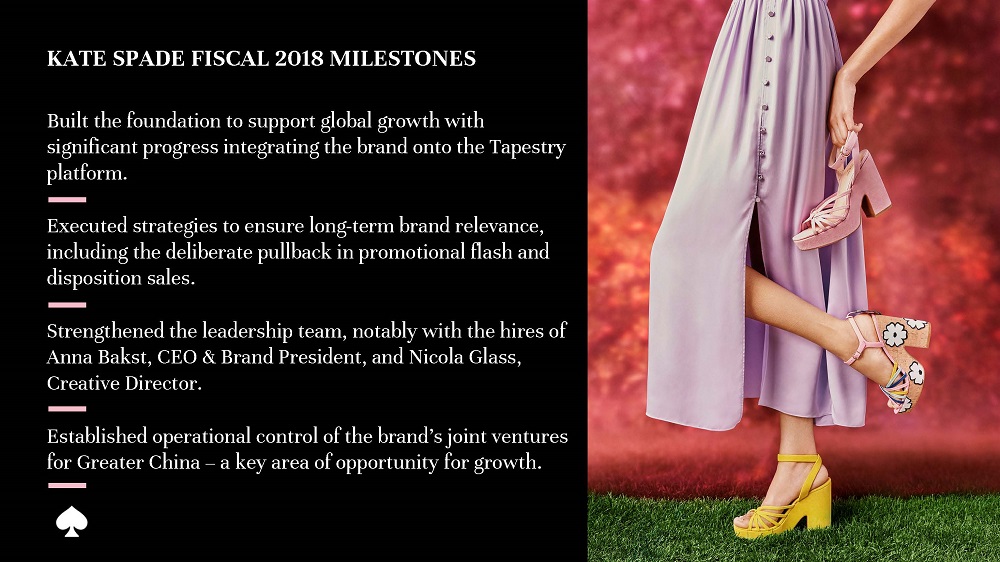
Kate spade FISCAL 2018 Milestones Built the foundation to support global growth with significant progress integrating the brand onto the Tapestry platform.Executed strategies to ensure long-term brand relevance, including the deliberate pullback in promotional flash and disposition sales.Strengthened the leadership team, notably with the hires of Anna Bakst, CEO & Brand President, and Nicola Glass, Creative Director.Established operational control of the brand’s joint ventures for Greater China – a key area of opportunity for growth.
KATE SPADE product & geographic breakdownOpportunity to expand internationally and develop clear global positioning 53 As of FY18.

KATE SPADE FISCAL 2019 STRATEGIC PRIORITIES 54 LAUNCH lifestyle-focused branding CREATE immersive channel experiences EXPAND globally:think global,act local INTRODUCE exceptional and inspiring products 54 LEVERAGE TAPESTRY PLATFORM


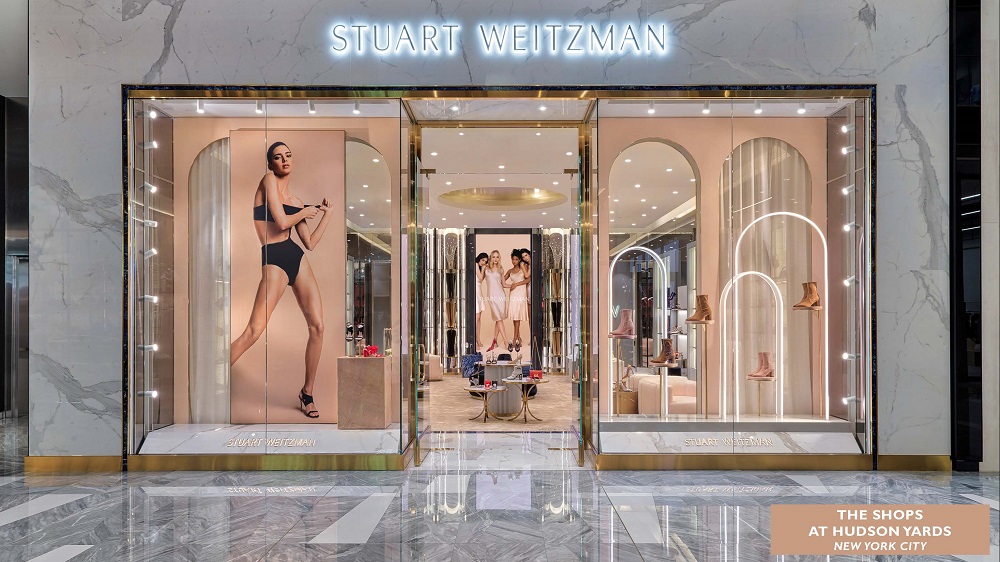
THE SHOPSAT HUDSON YARDSNEW YORK CITY
“Stuart Weitzman footwear has long represented quality, style and the beautiful combination of form and fit. We are building on this foundation as we evolve into a global, multi-channel and multi-category fashion brand.” ERALDO POLETTO, CEO & Brand President, Stuart Weitzman 58
Our vision STUART WEITZMAN IS ON A JOURNEY TO EVOLVE INTO A GLOBALMULTI-CATEGORY ACCESSORIES BRAND. LOOKING FORWARD, THE BRANDWILL PRODUCE INNOVATIVE ACCESSORIES BASED ON A FOUNDATION OF WARDROBE ESSENTIALS THAT FOSTER AN EMOTIONAL CONNECTION WITH WOMEN OF ALL AGES. THE GOAL IS TO ESTABLISH STUART WEITZMAN AS THE ACCESSORIES DESTINATION FOR EVERY WOMAN FOR EVERY OCCASION. 59

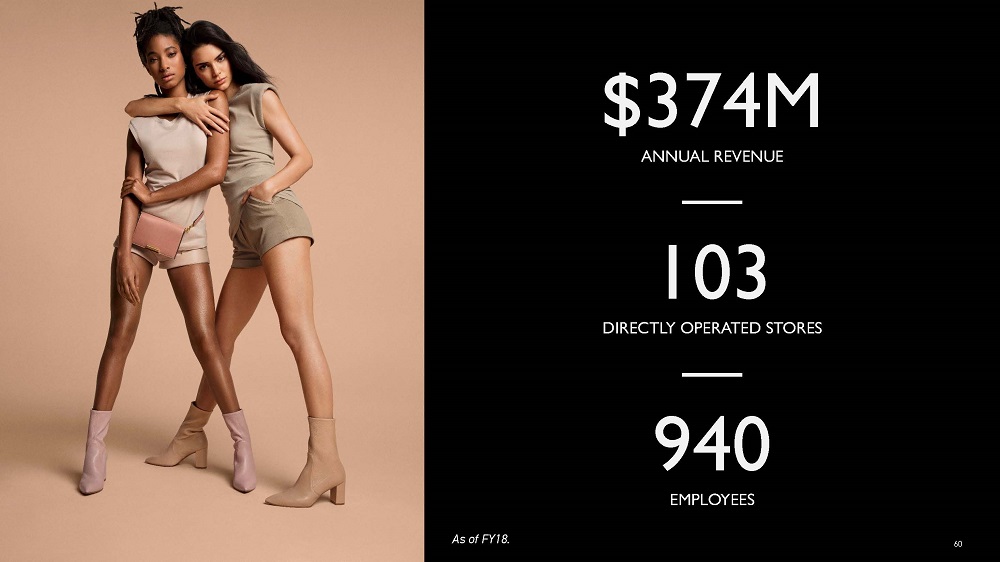
As of FY18. 940EMPLOYEES 103DIRECTLY OPERATED STORES $374MANNUAL REVENUE 60
Stuart Weitzman FISCAL 2018 Milestones ACQUIRED STUART WEITZMAN NORTHERN CHINA BUSINESS FROM DISTRIBUTOR PARTNER. APPOINTED ERALDO POLETTO, CEO & BRAND PRESIDENT, EDMUNDO CASTILLO, HEAD OF PRODUCT DESIGN, AND FRANCESCA BERTONCINI, HEAD MERCHANT, TO EXECUTE THE LONG-TERM VISION.GAINED TRACTION IN EVOLVING FROM A FOUNDER-LED BUSINESS TO A GLOBAL MULTI-CATEGORY BRAND THAT IS NIMBLE AND ENTREPRENEURIAL. STRENGTHENED THE BRAND’S SUPPLY CHAIN TO SUPPORT A HIGHER LEVEL OF INNOVATION, ADDRESSING THE NEAR-TERM CHALLENGES WHILE BUILDING THE FOUNDATION TO DRIVE SUSTAINABLE GROWTH. 61

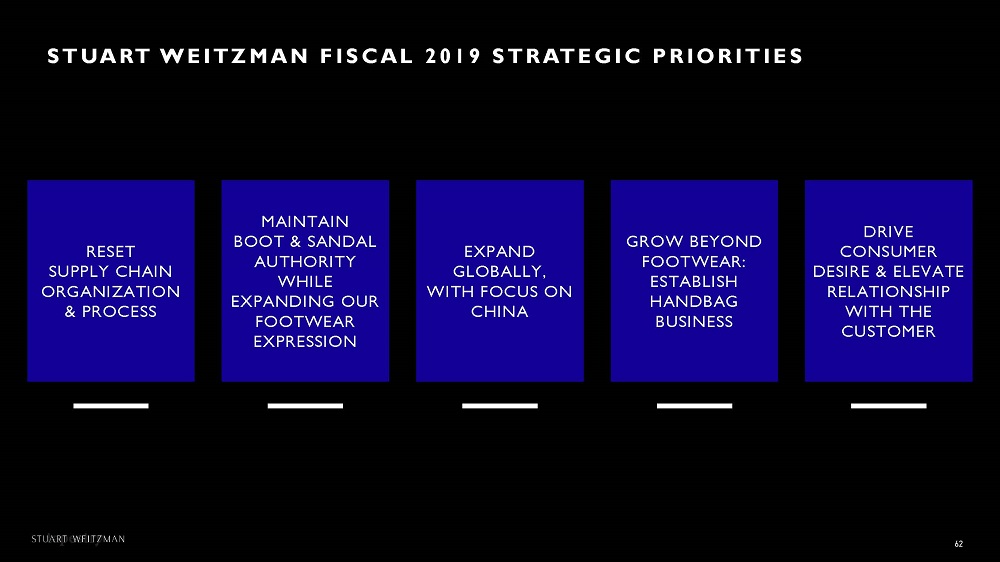
Stuart weitzman FISCAL 2019 STRATEGIC priorities Expand Globally,with Focus on China Grow Beyond Footwear: Establish Handbag Business Maintain Boot & Sandal Authority while Expanding our Footwear Expression Drive Consumer Desire & Elevate Relationship with the Customer ResetSupply Chain Organization & Process 62
STUART WEITZMAN product & geographic breakdownOpportunity to expand the brand internationally and across categories 63 As of FY18. Product breakdown penetration figures for Direct businesses (excluding China).


“We want Tapestry to be a company where employees love to work, great brands aspire to be part of and investors believe in.” VICTOR LUIS, ceo 65

APPENDIX

The Company reports information in accordance with U.S. Generally Accepted Accounting Principles ("GAAP"). The Company's management does not, nor does it suggest that investors should, consider non-GAAP financial measures in isolation from, or as a substitute for, financial information prepared in accordance with GAAP. Further, the non-GAAP measures utilized by the Company may be unique to the Company, as they may be different from non-GAAP measures used by other companies. The financial information presented has been presented both including and excluding the effect of certain items related to our Operational Efficiency Plan, Integration & Acquisition-Related Costs, ERP implementation efforts and the impact of tax legislation for Tapestry, Inc. Guidance for certain financial information for the fiscal year ending June 29, 2019 has also been presented on a non-GAAP basis. A reconciliation of our non-GAAP financial measure guidance to the corresponding GAAP measures is not available without unreasonable effort because certain material items that impact these measures, such as the timing and exact amount of charges related to Integration and Acquisition and the costs associated with the Company’s ERP implementation have not yet occurred.The Company operates on a global basis and reports financial results in U.S. dollars in accordance with GAAP. Sales and gross margin for each segment have been described excluding currency fluctuation effects from translating foreign-denominated sales into U.S. dollars. The Company calculates constant currency revenue results by translating current period revenue in local currency using the prior year period’s currency conversion rate.Management utilizes these non-GAAP measures to conduct and evaluate its business during its regular review of operating results for the periods affected and to make decisions about Company resources and performance. The Company believes presenting these non-GAAP measures, which exclude items that are not comparable from period to period, is useful to investors and others in evaluating the Company’s ongoing operating and financial results in a manner that is consistent with management’s evaluation of business performance and understanding how such results compare with the Company’s historical performance. 67
GAAP to non-GAAP ReconciliationFor the Quarters Ended MARCH 30, 2019 and march 31, 2018 Amounts as of March 30, 2019 represent technology implementation costs.Amounts as of March 30, 2019 and March 31, 2018 represent charges primarily attributable to acquisition and integration costs related to the purchase of Kate Spade & Company, certain distributors for the Coach and Stuart Weitzman brands and assumed operational control of Kate Spade joint ventures. These charges include:Organization-related costsLimited life purchase accounting adjustments Professional feesAmounts as of March 30, 2019 represent a tax benefit primarily due to the transition tax related to foreign earnings deemed to be repatriated.Amounts as of March 31, 2018 represent charges due to the transition tax related to foreign earnings deemed to be repatriated partially offset by the re-measurement of deferred tax assets and liabilities.Amounts as of March 31, 2018 represent technology infrastructure costs. (in millions, except per share data) GAAP BASIS(AS REPORTED) ERP IMPLEMENTATION(1) INTEGRATION & ACQUISITION(2) IMPACT OF TAX LEGISLATION(3) NON-GAAP BASIS(EXCLUDING ITEMS) Gross profit $915.9 $— $ (5.0) $— $920.9 Selling, general and administrative expenses 810.1 14.7 15.6 — 779.8 Operating income 105.8 (14.7) (20.6) — 141.1 Income before provision for income taxes 95.2 (14.7) (20.6) — 130.5 Provision for income taxes (22.2) (3.7) (2.4) (24.9) ��8.8 Net income 117.4 (11.0) (18.2) 24.9 121.7 Diluted net income per share 0.40 (0.05) (0.06) 0.09 0.42 GAAP BASIS(AS REPORTED) OPERATIONAL EFFICIENCY PLAN(4) INTEGRATION & ACQUISITION(2) IMPACT OF TAX LEGISLATION(3) NON-GAAP BASIS(EXCLUDING ITEMS) Gross profit $907.6 $— $(4.1) $— $911.7 Selling, general and administrative expenses 748.6 2.9 18.3 — 727.4 Operating income 159.0 (2.9) (22.4) — 184.3 Income before provision for income taxes 142.1 (2.9) (22.4) — 167.4 Provision for income taxes 1.8 (1.0) (12.1) 5.4 9.5 Net income 140.3 (1.9) (10.3) (5.4) 157.9 Diluted net income per share 0.48 — (0.04) (0.02) 0.54 MARCH 30, 2019 MARCH 31, 2018

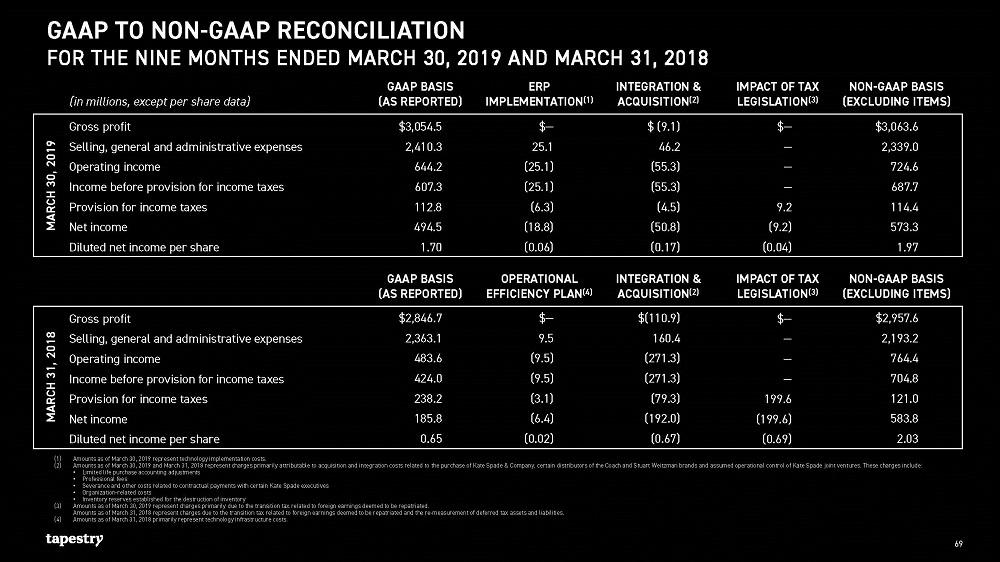
GAAP to non-GAAP ReconciliationFor the NINE Months Ended MARCH 30, 2019 and MARCH 31, 2018 Amounts as of March 30, 2019 represent technology implementation costs.Amounts as of March 30, 2019 and March 31, 2018 represent charges primarily attributable to acquisition and integration costs related to the purchase of Kate Spade & Company, certain distributors of the Coach and Stuart Weitzman brands and assumed operational control of Kate Spade joint ventures. These charges include:Limited life purchase accounting adjustmentsProfessional feesSeverance and other costs related to contractual payments with certain Kate Spade executivesOrganization-related costsInventory reserves established for the destruction of inventory Amounts as of March 30, 2019 represent charges primarily due to the transition tax related to foreign earnings deemed to be repatriated.Amounts as of March 31, 2018 represent charges due to the transition tax related to foreign earnings deemed to be repatriated and the re-measurement of deferred tax assets and liabilities.Amounts as of March 31, 2018 primarily represent technology infrastructure costs. (in millions, except per share data) GAAP BASIS(AS REPORTED) ERP IMPLEMENTATION(1) INTEGRATION & ACQUISITION(2) IMPACT OF TAX LEGISLATION(3) NON-GAAP BASIS(EXCLUDING ITEMS) Gross profit $3,054.5 $— $ (9.1) $— $3,063.6 Selling, general and administrative expenses 2,410.3 25.1 46.2 — 2,339.0 Operating income 644.2 (25.1) (55.3) — 724.6 Income before provision for income taxes 607.3 (25.1) (55.3) — 687.7 Provision for income taxes 112.8 (6.3) (4.5) 9.2 114.4 Net income 494.5 (18.8) (50.8) (9.2) 573.3 Diluted net income per share 1.70 (0.06) (0.17) (0.04) 1.97 GAAP BASIS(AS REPORTED) OPERATIONAL EFFICIENCY PLAN(4) INTEGRATION & ACQUISITION(2) IMPACT OF TAX LEGISLATION(3) NON-GAAP BASIS(EXCLUDING ITEMS) Gross profit $2,846.7 $— $(110.9) $— $2,957.6 Selling, general and administrative expenses 2,363.1 9.5 160.4 — 2,193.2 Operating income 483.6 (9.5) (271.3) — 764.4 Income before provision for income taxes 424.0 (9.5) (271.3) — 704.8 Provision for income taxes 238.2 (3.1) (79.3) 199.6 121.0 Net income 185.8 (6.4) (192.0) (199.6) 583.8 Diluted net income per share 0.65 (0.02) (0.67) (0.69) 2.03 MARCH 30, 2019 MARCH 31, 2018
GAAP to non-GAAP ReconciliationFor the Years Ended June 30, 2018 and July 1, 2017 (in millions, except per share data) GAAP BASIS(AS REPORTED) OPERATIONAL EFFICIENCY PLAN(1) INTEGRATION & ACQUISITION(2) IMPACT OF TAX LEGISLATION(3) NON-GAAP BASIS(EXCLUDING ITEMS) Gross profit $ 3,848.5 $— $ (116.4) $— $3,964.9 Selling, general and administrative expenses 3,177.7 19.5 185.2 — 2,973.0 Operating income 670.8 (19.5) (301.6) — 991.9 Income before provision for income taxes 596.8 (19.5) (301.6) — 917.9 Provision for income taxes 199.3 (6.2) (130.7) 178.2 158.0 Net income 397.5 (13.3) (170.9) (178.2) 759.9 Diluted net income per share 1.38 (0.05) (0.58) (0.62) 2.63 Gross profit $3,081.1 $— $(2.9) $— $3,084.0 Selling, general and administrative expenses 2,293.7 24.0 (1.7) — 2,271.4 Operating income 787.4 (24.0) (1.2) — 812.6 Income before provision for income taxes 759.0 (24.0) (10.7) — 793.7 Provision for income taxes 168.0 (8.3) (8.1) — 184.4 Net income 591.0 (15.7) (2.6) — 609.3 Diluted net income per share 2.09 (0.05) (0.01) — 2.15 Amounts as of June 30, 2018 primarily represent technology infrastructure costs. Amounts as of July 1, 2017 represent charges primarily related to organizational efficiency costs, technology infrastructure costs and to a lesser extent, network optimization costs.Amounts as of June 30, 2018 represent charges attributable to acquisition and integration costs related to the purchase of Kate Spade & Company, and to a lesser extent the acquisition of certain distributors for the Coach and Stuart Weitzman brands and assumed operational control of Kate Spade joint ventures. Provision for income taxes has been favorably impacted as a result of the reversal of certain valuation allowances that were established during purchase accounting. These charges include:Limited life purchase accounting adjustmentsProfessional feesSeverance and other costs related to contractual payments with certain Kate Spade executives Organizational costs as a result of integrationInventory reserves established for the destruction of inventoryAmounts as of July 1, 2017 represent acquisition costs and limited life purchase accounting impacts related to the acquisition of Stuart Weitzman Holdings LLC, more than offset by the reversal of an accrual related to estimated contingent purchase price payments which were not paid, and integration-related costs for the Kate Spade & Company acquisition.(3) Amounts as of June 30, 2018 represent charges due to the net impact of the transition tax and re-measurement of deferred tax balances. JUNE 30, 2018 JULY 1, 2017
