Exhibit 99.1

Link to searchable text of slide shown above
Link to searchable text of slide shown above
Link to searchable text of slide shown above
Link to searchable text of slide shown above
Link to searchable text of slide shown above
Link to searchable text of slide shown above

Link to searchable text of slide shown above
Link to searchable text of slide shown above
Link to searchable text of slide shown above
Link to searchable text of slide shown above
Link to searchable text of slide shown above
Link to searchable text of slide shown above
Link to searchable text of slide shown above
Link to searchable text of slide shown above
Link to searchable text of slide shown above
Link to searchable text of slide shown above
Searchable text section of graphics shown above
AVAYA
[GRAPHIC]
Fourth Annual JMP Securities
Research Conference
March 2, 2005
[LOGO]
Forward Looking Statement
The use of words such as “may,” “might,” “will,” “should,” “expects,” “plans,” “anticipates,” “believes,” “estimates,” “intends,” “future,” “potential,” or “continue,” the negative of these terms and other comparable terminology are intended to identify forward-looking statements.
These statements are only predictions based on our current expectations and projections about future events. Because these forward-looking statements involve risks and uncertainties, there are important factors that could cause our actual results, level of activity, performance or achievements to differ materially from the results, level of activity, performance or achievements expressed or implied by the forward-looking statements.
In this regard, you should specifically consider the numerous risks outlined in our SEC filings.
Presentation
Unless indicated otherwise, all results are presented in accordance with United States generally accepted accounting principles (GAAP).
2
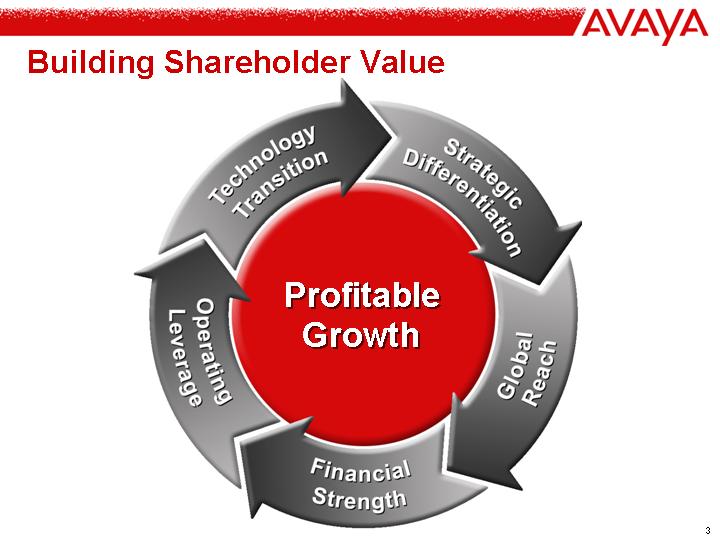
Building Shareholder Value
[GRAPHIC]
Technology Transition
Strategic Differentiation
Global Reach
Financial Strength
Operating Leverage
3
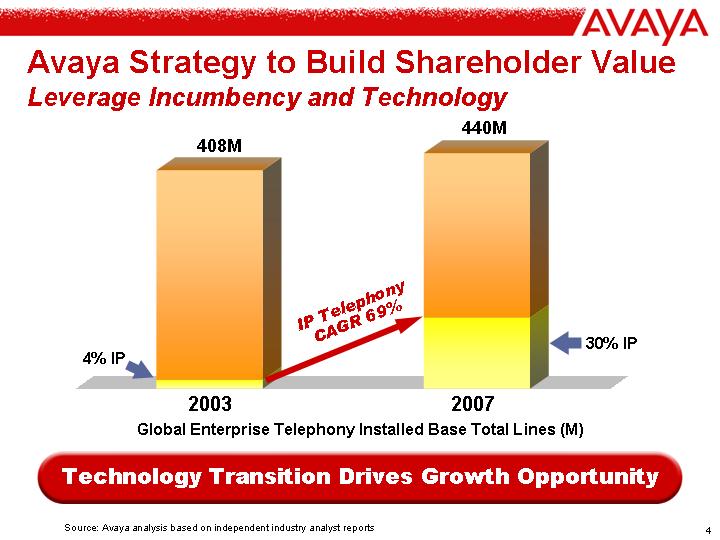
Avaya Strategy to Build Shareholder Value
Leverage Incumbency and Technology
[CHART]
Global Enterprise Telephony Installed Base Total Lines (M)
Technology Transition Drives Growth Opportunity
Source: Avaya analysis based on independent industry analyst reports
4
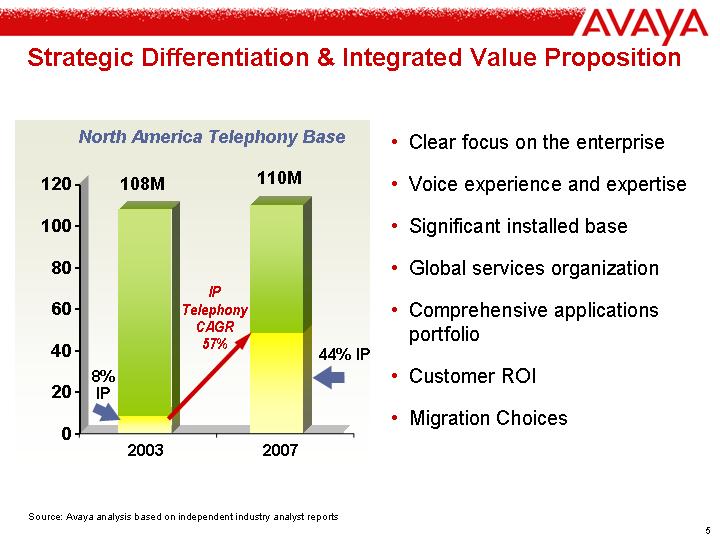
Strategic Differentiation & Integrated Value Proposition
North America Telephony Base
[CHART]
• Clear focus on the enterprise
• Voice experience and expertise
• Significant installed base
• Global services organization
• Comprehensive applications portfolio
• Customer ROI
• Migration Choices
Source: Avaya analysis based on independent industry analyst reports
5
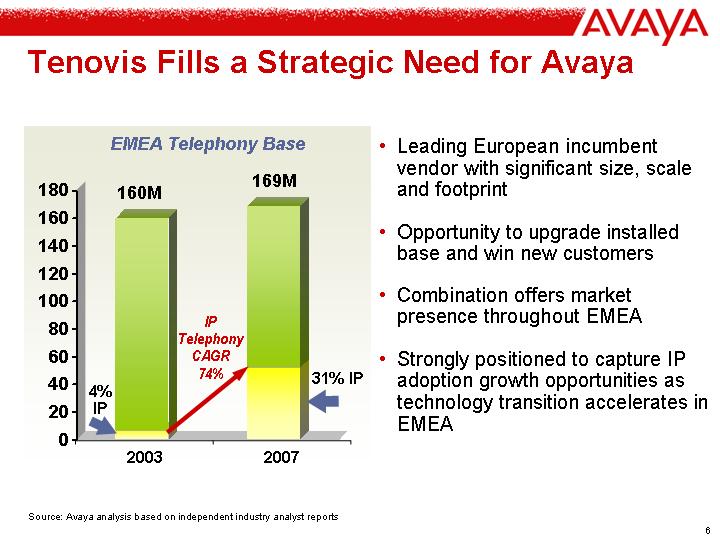
Tenovis Fills a Strategic Need for Avaya
EMEA Telephony Base
[CHART]
• Leading European incumbent vendor with significant size, scale and footprint
• Opportunity to upgrade installed base and win new customers
• Combination offers market presence throughout EMEA
• Strongly positioned to capture IP adoption growth opportunities as technology transition accelerates in EMEA
Source: Avaya analysis based on independent industry analyst reports
6
AVAYA
[GRAPHIC]
FY2005 Update
Q1 FY2005 Results
Market Summary
• Maintained #1 position in market share in IP Telephony for the fourth consecutive quarter at 25%*
• Total large enterprise telephony line shipments rose by 9% over the year ago quarter
• Large enterprise IP line shipments were up more than 50% over the year ago quarter
• During the quarter we shipped our 5 millionth IP line
• Recent wins:
– U.S. – Merrill Lynch |
| – Mexico – Prosa |
– U.K. – Honda |
| – Japan – Rakuten |
* Based on Q3 CY04 market share data
8
Q1 FY2005 Results
Financial Summary
• Revenues grew 18% quarter over quarter including the impact of acquisitions
• Product sales up 15%
• Rental and managed services up 60%
• Services up 15%
• Revenue from GCS segment up 23%
• International revenues were up 77.7% including acquisitions quarter over quarter
• Gross margin increased to 47.3% from 46.1%
• Operating income rose 70% from $52M to $88M
• Operating margin was 7.7% vs. 5.4%
• Strong cash position of $911M
• Debt decreased by $225M to $368M, which includes the $347M assumed from Tenovis at 11/18/04
9
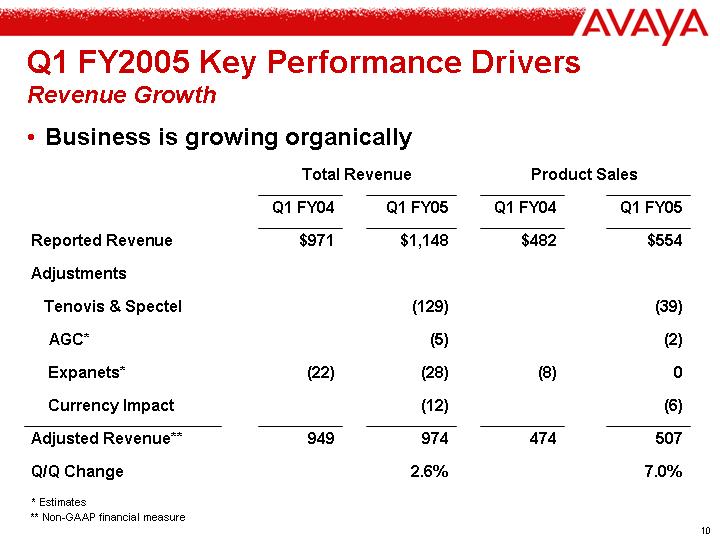
Q1 FY2005 Key Performance Drivers
Revenue Growth
• Business is growing organically
|
| Total Revenue |
| Product Sales |
| ||||||||
|
| Q1 FY04 |
| Q1 FY05 |
| Q1 FY04 |
| Q1 FY05 |
| ||||
Reported Revenue |
| $ | 971 |
| $ | 1,148 |
| $ | 482 |
| $ | 554 |
|
|
|
|
|
|
|
|
|
|
| ||||
Adjustments |
|
|
|
|
|
|
|
|
| ||||
|
|
|
|
|
|
|
|
|
| ||||
Tenovis & Spectel |
|
|
| (129 | ) |
|
| (39 | ) | ||||
|
|
|
|
|
|
|
|
|
| ||||
AGC* |
|
|
| (5 | ) |
|
| (2 | ) | ||||
|
|
|
|
|
|
|
|
|
| ||||
Expanets* |
| (28 | ) | (22 | ) | (8 | ) | (0 | ) | ||||
|
|
|
|
|
|
|
|
|
| ||||
Currency Impact |
|
|
| (12 | ) |
|
| (6 | ) | ||||
|
|
|
|
|
|
|
|
|
| ||||
Adjusted Revenue** |
| 949 |
| 974 |
| 474 |
| 507 |
| ||||
|
|
|
|
|
|
|
|
|
| ||||
Q/Q Change |
|
|
| 2.6 | % |
|
| 7.0 | % | ||||
* Estimates
** Non-GAAP financial measure
10
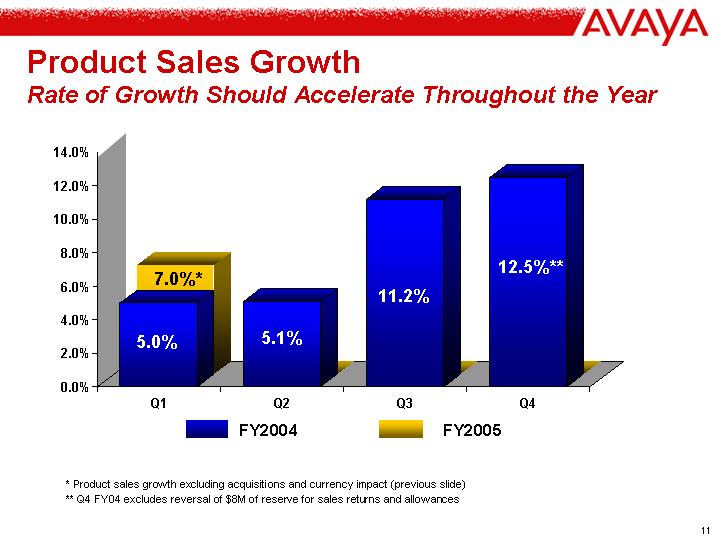
Product Sales Growth
Rate of Growth Should Accelerate Throughout the Year
[CHART]
* Product sales growth excluding acquisitions and currency impact (previous slide)
** Q4 FY04 excludes reversal of $8M of reserve for sales returns and allowances
11
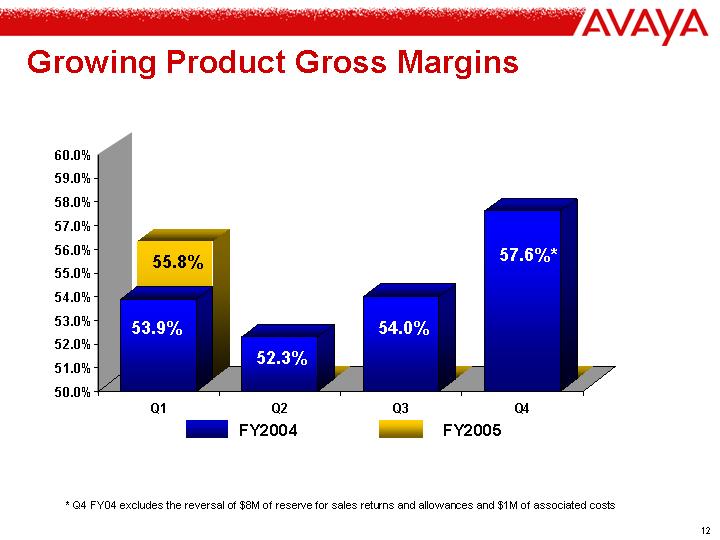
Growing Product Gross Margins
[CHART]
* Q4 FY04 excludes the reversal of $8M of reserve for sales returns and allowances and $1M of associated costs
12
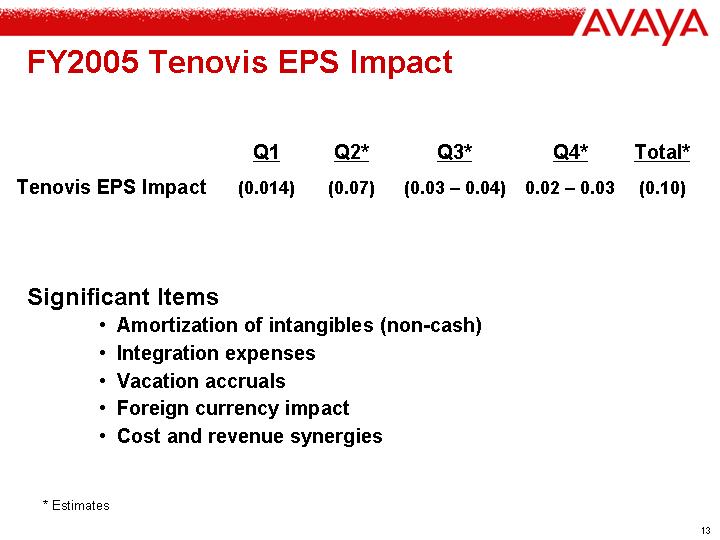
FY2005 Tenovis EPS Impact
|
| Q1 |
| Q2* |
| Q3* |
| Q4* |
| Total* |
|
Tenovis EPS Impact |
| (0.014 | ) | (0.07 | ) | (0.03 – 0.04 | ) | 0.02 – 0.03 |
| (0.10 | ) |
Significant Items
• Amortization of intangibles (non-cash)
• Integration expenses
• Vacation accruals
• Foreign currency impact
• Cost and revenue synergies
* Estimates
13
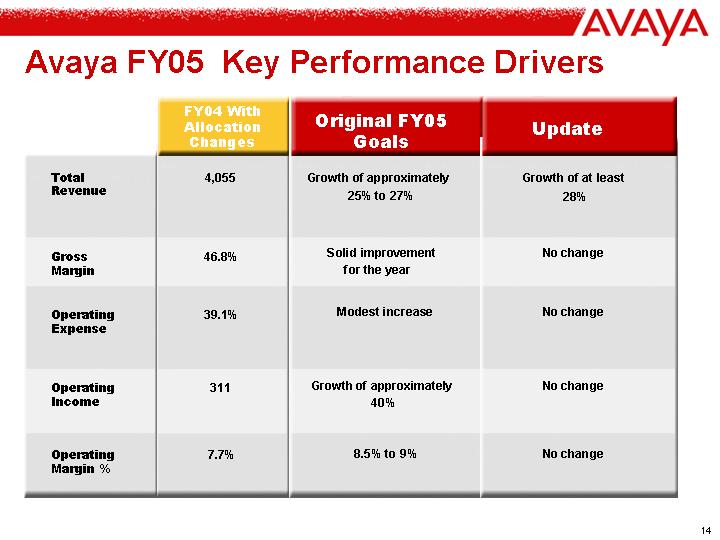
Avaya FY05 Key Performance Drivers
|
| FY04 With |
| Original FY05 |
| Update |
Total Revenue |
| 4,055 |
| Growth of approximately 25% to 27% |
| Growth of at least 28% |
|
|
|
|
|
|
|
Gross Margin |
| 46.8 | % | Solid improvement for the year |
| No change |
|
|
|
|
|
|
|
Operating Expense |
| 39.1 | % | Modest increase |
| No change |
|
|
|
|
|
|
|
Operating Income |
| 311 |
| Growth of approximately 40% |
| No change |
|
|
|
|
|
|
|
Operating Margin% |
| 7.7 | % | 8.5% to 9% |
| No change |
14
Focused on Achieving Our Annual Goals
• Building momentum in key areas that drive our performance and ability to build value…
• The transition in the enterprise telephony market is moving ahead and is broadening into other key geographic areas.
• We’re well positioned in our core market and now have the scope and scale to compete more effectively in all regions around the world.
• We’re moving forward quickly with our plans to integrate Tenovis and to capture the potential it offers.
• We’re maintaining our leadership and managing our business to generate profitable growth.
15
AVAYA
[GRAPHIC]
Fourth Annual JMP Securities
Research Conference
March 2, 2005