Exhibit 99.1
Link to searchable text of slide shown above
Link to searchable text of slide shown above
Link to searchable text of slide shown above

Link to searchable text of slide shown above
Link to searchable text of slide shown above
Link to searchable text of slide shown above
Link to searchable text of slide shown above
Link to searchable text of slide shown above
Link to searchable text of slide shown above
Link to searchable text of slide shown above
Link to searchable text of slide shown above
Link to searchable text of slide shown above
Link to searchable text of slide shown above
Link to searchable text of slide shown above
Link to searchable text of slide shown above
Link to searchable text of slide shown above

Link to searchable text of slide shown above
Searchable text section of graphics shown above
[LOGO]
Q2 FY2005
Earnings Conference Call
April 19, 2005
[LOGO]
Forward Looking Statement
The use of words such as “may,” “might,” “will,” “should,” “expects,” “plans,” “anticipates,” “believes,” “estimates,” “intends,” “future,” “potential,” or “continue,” the negative of these terms and other comparable terminology are intended to identify forward-looking statements.
These statements are only predictions based on our current expectations and projections about future events. Because these forward-looking statements involve risks and uncertainties, there are important factors that could cause our actual results, level of activity, performance or achievements to differ materially from the results, level of activity, performance or achievements expressed or implied by the forward-looking statements.
In this regard, you should specifically consider the numerous risks outlined in our SEC filings.
Presentation
Unless indicated otherwise, all results are presented in accordance with United States generally accepted accounting principles (GAAP).
2
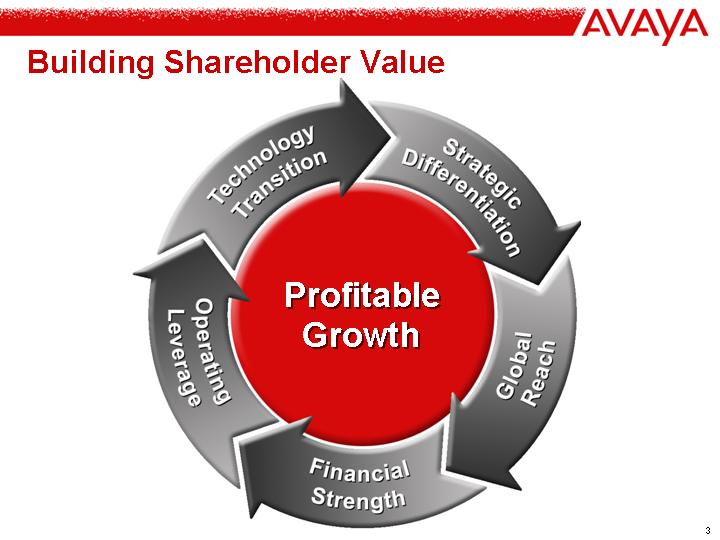
Building Shareholder Value
Profitable Growth
Strategic Differentiation
Global Reach
Financial Strength
Operating Leverage
Technology Transition
3
Q2 FY2005 Results
Financial Summary
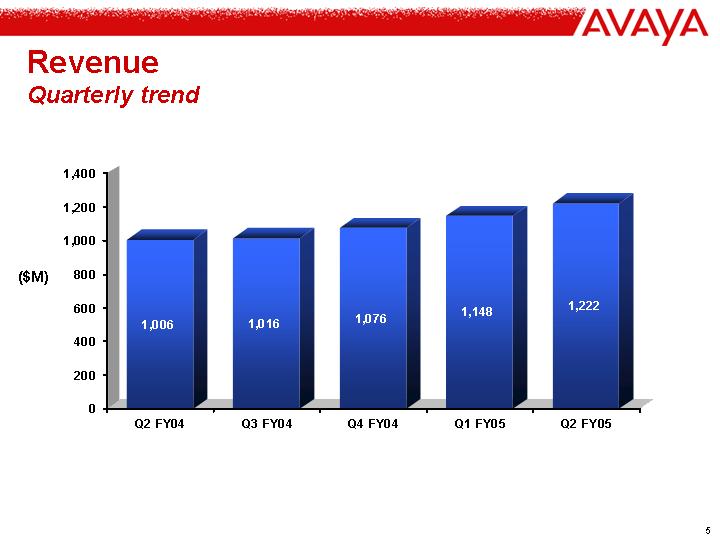
• Revenues grew 21% year over year including the impact of acquisitions
• Product sales up 9.7%
• Rental and managed services up $115M
• Services up 11.9%
• Tenovis revenue was $237M for the quarter
• Excluding Tenovis revenue was $985M, down 2% year over year
• Gross margin was 46.1%, down ..7 from a year ago and 1.2 sequentially
• Operating income declined from $60M to $52M including Tenovis dilution of $28M
• Operating margin was 4.3%
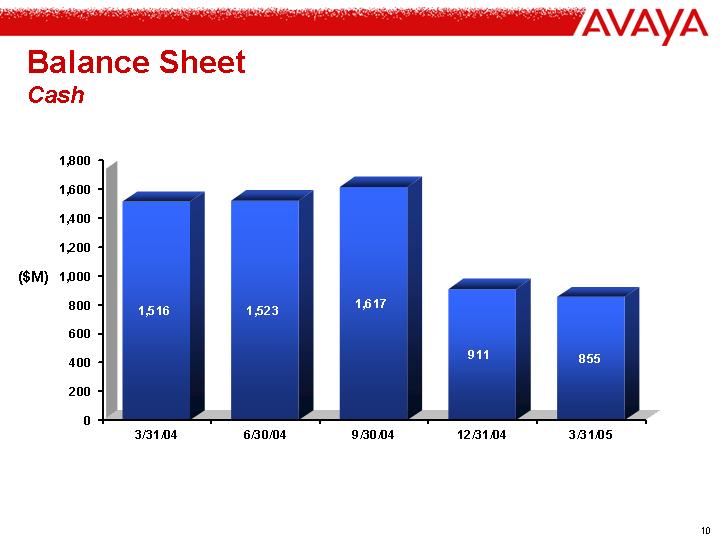
• Cash position remained strong at $855M
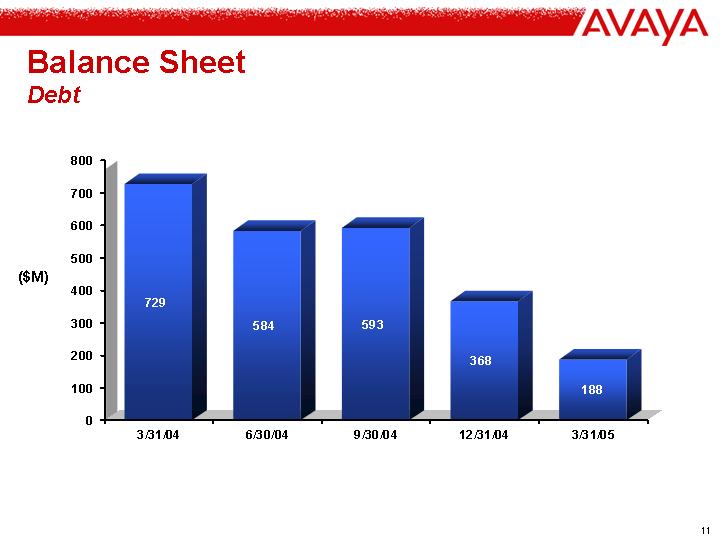
• Debt decreased by $180M to $188M
4
Revenue
Quarterly trend
[CHART]
5
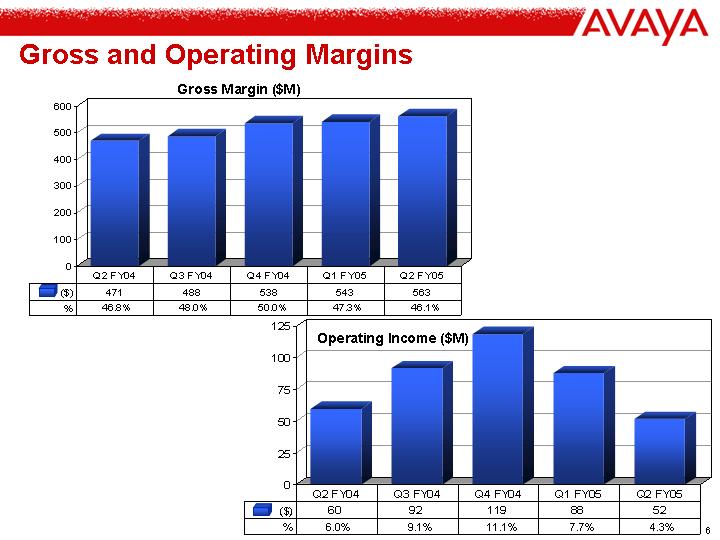
Gross and Operating Margins
Gross Margin ($M)
[CHART]
|
| Q2 FY04 |
| Q3 FY04 |
| Q4 FY04 |
| Q1 FY05 |
| Q2 FY05 |
| |
($) |
|
| 471 |
| 488 |
| 538 |
| 543 |
| 563 |
|
% |
|
| 46.8 | % | 48.0 | % | 50.0 | % | 47.3 | % | 46.1 | % |
Operating Income ($M)
[CHART]
|
| Q2 FY04 |
| Q3 FY04 |
| Q4 FY04 |
| Q1 FY05 |
| Q2 FY05 |
| |
($) |
|
| 60 |
| 92 |
| 119 |
| 88 |
| 52 |
|
% |
|
| 6.0 | % | 9.1 | % | 11.1 | % | 7.7 | % | 4.3 | % |
6
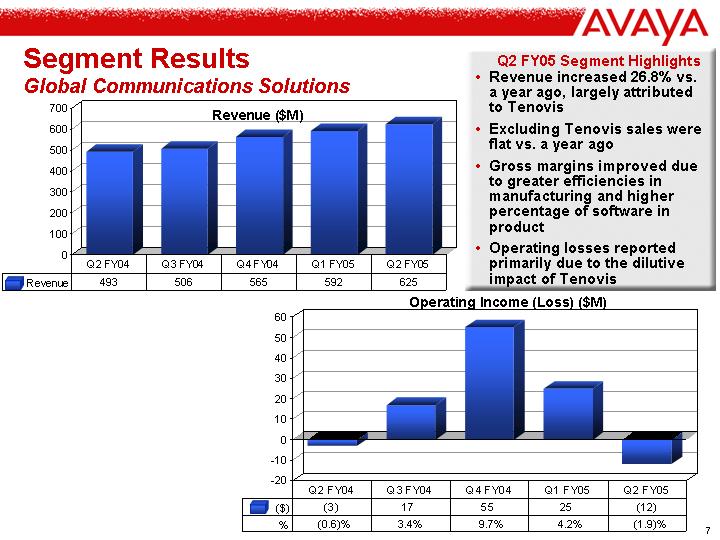
Segment Results
Global Communications Solutions
Revenue ($M)
[CHART]
|
| Q2 FY04 |
| Q3 FY04 |
| Q4 FY04 |
| Q1 FY05 |
| Q2 FY05 |
| |
Revenue |
|
| 493 |
| 506 |
| 565 |
| 592 |
| 625 |
|
Q2 FY05 Segment Highlights
• Revenue increased 26.8% vs. a year ago, largely attributed to Tenovis
• Excluding Tenovis sales were flat vs. a year ago
• Gross margins improved due to greater efficiencies in manufacturing and higher percentage of software in product
• Operating losses reported primarily due to the dilutive impact of Tenovis
Operating Income (Loss) ($M)
[CHART]
|
| Q2 FY04 |
| Q3 FY04 |
| Q4 FY04 |
| Q1 FY05 |
| Q2 FY05 |
| |
($) |
|
| (3 | ) | 17 |
| 55 |
| 25 |
| (12 | ) |
% |
|
| (0.6 | )% | 3.4 | % | 9.7 | % | 4.2 | % | (1.9 | )% |
7
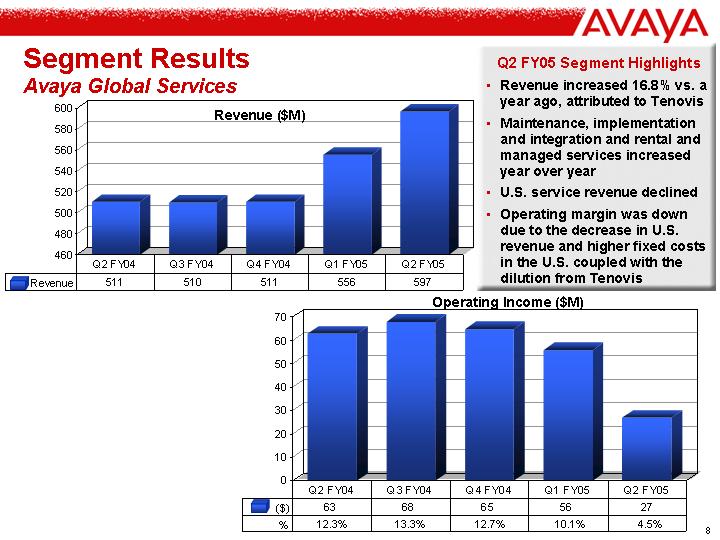
Revenue ($M)
[CHART]
|
| Q2 FY04 |
| Q3 FY04 |
| Q4 FY04 |
| Q1 FY05 |
| Q2 FY05 |
| |
Revenue |
|
| 511 |
| 510 |
| 511 |
| 556 |
| 597 |
|
Q2 FY05 Segment Highlights
• Revenue increased 16.8% vs. a year ago, attributed to Tenovis
• Maintenance, implementation and integration and rental and managed services increased year over year
• U.S. service revenue declined
• Operating margin was down due to the decrease in U.S. revenue and higher fixed costs in the U.S. coupled with the dilution from Tenovis
Operating Income ($M)
[CHART]
|
| Q2 FY04 |
| Q3 FY04 |
| Q4 FY04 |
| Q1 FY05 |
| Q2 FY05 |
| |
($) |
|
| 63 |
| 68 |
| 65 |
| 56 |
| 27 |
|
% |
|
| 12.3 | % | 13.3 | % | 12.7 | % | 10.1 | % | 4.5 | % |
8
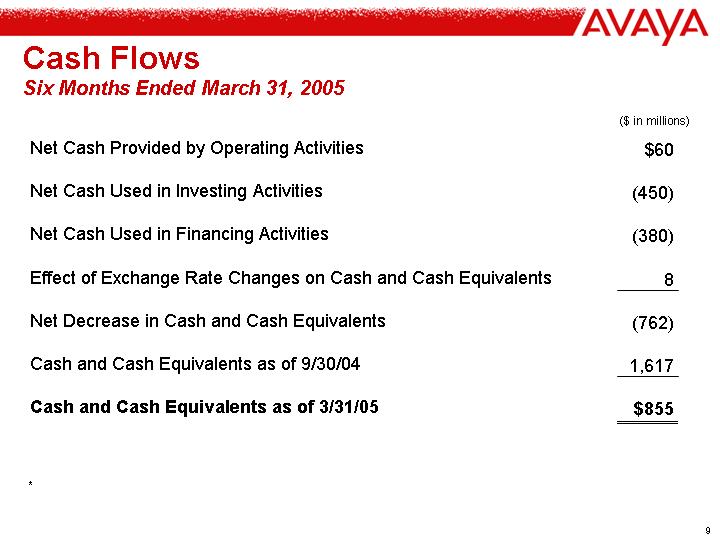
Cash Flows
Six Months Ended March 31, 2005
|
| ($ in millions) |
| |
|
|
|
| |
Net Cash Provided by Operating Activities |
| $ | 60 |
|
|
|
|
| |
Net Cash Used in Investing Activities |
| (450 | ) | |
|
|
|
| |
Net Cash Used in Financing Activities |
| (380 | ) | |
|
|
|
| |
Effect of Exchange Rate Changes on Cash and Cash Equivalents |
| 8 |
| |
|
|
|
| |
Net Decrease in Cash and Cash Equivalents |
| (762 | ) | |
|
|
|
| |
Cash and Cash Equivalents as of 9/30/04 |
| 1,617 |
| |
|
|
|
| |
Cash and Cash Equivalents as of 3/31/05 |
| $ | 855 |
|
9
Balance Sheet
Cash
[CHART]
10
[CHART]
11
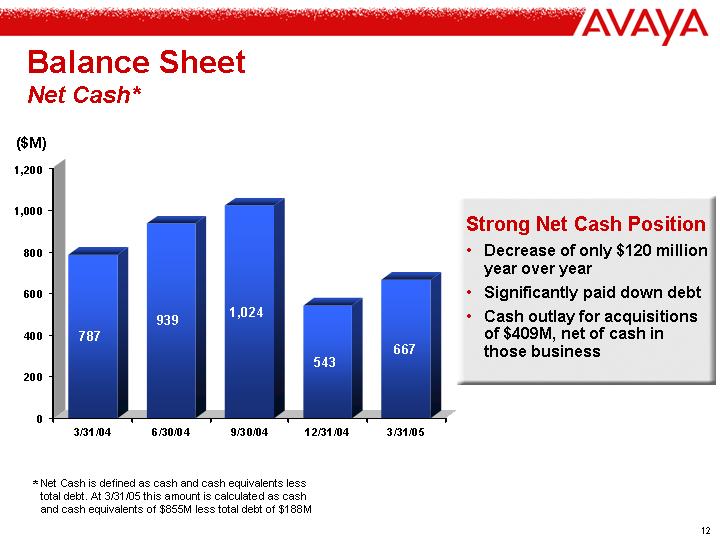
[CHART]
Strong Net Cash Position
• Decrease of only $120 million year over year
• Significantly paid down debt
• Cash outlay for acquisitions of $409M, net of cash in those business
* Net Cash is defined as cash and cash equivalents less total debt. At 3/31/05 this amount is calculated as cash and cash equivalents of $855M less total debt of $188M
12
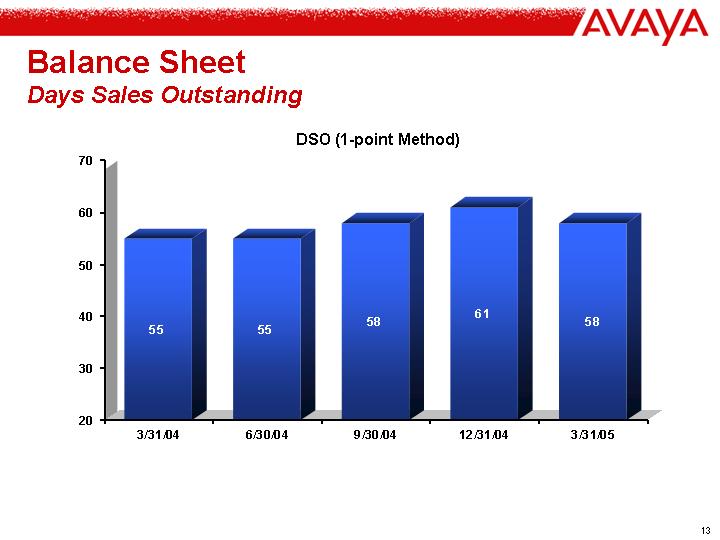
DSO (1-point Method)
[CHART]
13
[LOGO]
Q2 FY2005
Earnings Conference Call
April 19, 2005
[LOGO]
Supplemental
Information
[LOGO]
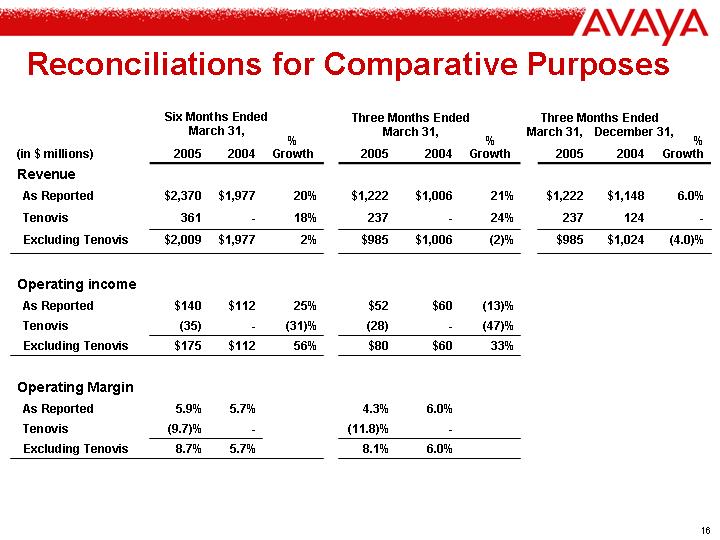
Reconciliations for Comparative Purposes
(in $ millions) |
| Six Months Ended |
|
|
| Three Months Ended |
|
|
| Three Months Ended |
|
|
| ||||||||||||
March 31, |
| % |
| March 31, |
| % |
| March 31, |
| December 31, |
| % | |||||||||||||
2005 |
| 2004 |
| Growth |
| 2005 |
| 2004 |
| Growth |
| 2005 |
| 2004 |
| Growth | |||||||||
Revenue |
|
|
|
|
|
|
|
|
|
|
|
|
|
|
|
|
|
|
| ||||||
As Reported |
| $ | 2,370 |
| $ | 1,977 |
| 20 | % | $ | 1,222 |
| $ | 1,006 |
| 21 | % | $ | 1,222 |
| $ | 1,148 |
| 6.0 | % |
Tenovis |
| 361 |
| — |
| 18 | % | 237 |
| — |
| 24 | % | 237 |
| 124 |
| — |
| ||||||
Excluding Tenovis |
| $ | 2,009 |
| $ | 1,977 |
| 2 | % | $ | 985 |
| $ | 1,006 |
| (2 | )% | $ | 985 |
| $ | 1,024 |
| (4.0 | )% |
|
|
|
|
|
|
|
|
|
|
|
|
|
|
|
|
|
|
|
| ||||||
Operating income |
|
|
|
|
|
|
|
|
|
|
|
|
|
|
|
|
|
|
| ||||||
As Reported |
| $ | 140 |
| $ | 112 |
| 25 | % | $ | 52 |
| $ | 60 |
| (13 | )% |
|
|
|
|
|
| ||
Tenovis |
| (35 | ) | — |
| (31 | )% | (28 | ) | — |
| (47 | )% |
|
|
|
|
|
| ||||||
Excluding Tenovis |
| $ | 175 |
| $ | 112 |
| 56 | % | $ | 80 |
| $ | 60 |
| 33 | % |
|
|
|
|
|
| ||
|
|
|
|
|
|
|
|
|
|
|
|
|
|
|
|
|
|
|
| ||||||
Operating Margin |
|
|
|
|
|
|
|
|
|
|
|
|
|
|
|
|
|
|
| ||||||
As Reported |
| 5.9 | % | 5.7 | % |
|
| 4.3 | % | 6.0 | % |
|
|
|
|
|
|
|
| ||||||
Tenovis |
| (9.7 | )% | — |
|
|
| (11.8 | )% | — |
|
|
|
|
|
|
|
|
| ||||||
Excluding Tenovis |
| 8.7 | % | 5.7 | % |
|
| 8.1 | % | 6.0 | % |
|
|
|
|
|
|
|
| ||||||
16
|
|
| |||||
|
| 2005 |
| 2004 |
| ||
Diluted Earnings Per Share |
|
|
|
|
| ||
|
|
|
|
|
| ||
As Reported |
| $ | 0.07 |
| $ | 0.22 |
|
|
|
|
|
|
| ||
Less: Results of Tenovis Operations |
| (0.06 | ) | — |
| ||
|
|
|
|
|
| ||
Favorable Settlement of Certain Tax Matters |
| — |
| 0.19 |
| ||
|
|
|
|
|
| ||
Loss on Senior Secured Notes Extinguishment |
| — |
| (0.05 | ) | ||
|
|
|
|
|
| ||
Loss on Sale of CommScope Common Shares |
| — |
| (0.01 | ) | ||
|
| $ | 0.13 |
| $ | 0.09 |
|
17