


Searchable text section of graphics shown above
Forward Looking Statements
This presentation contains forward-looking statements within the meaning of the safe harbor provisions of the Private Securities Litigation Reform Act of 1995. These statements regarding Avaya’s expected performance and outlook for operating results are based on current expectations, forecasts and assumptions that involve risks and uncertainties that could cause actual outcomes and results to differ materially. These risks and uncertainties include, but are not limited to: price and product competition; rapid or disruptive technological development; dependence on new product development; the mix of our products and services; customer demand for our products and services, including risks specifically associated with the services business and, in particular, the maintenance and rental and managed services lines of business, primarily due to renegotiations of customer contracts and changes in scope, pricing pressures and cancellations; general industry and market conditions and growth rates and general domestic and international economic conditions including interest rate and currency exchange rate fluctuations; disruption associated with the re-alignment of our sales and marketing efforts; risks related to inventory, including warranty costs, obsolescence charges, excess capacity, material and labor costs, and our distributors decisions regarding their own inventory levels; the economic, political and other risks associated with international sales and operations, including increased exposure to currency fluctuations as a result of our acquisition of Tenovis; the ability to successfully integrate acquired companies, including Tenovis, which has required significant management time and attention; the ability to attract and retain qualified employees; control of costs and expenses; U.S. and non-U.S. government regulation; and the ability to form and implement alliances.
For a further list and description of such risks and uncertainties, see the reports filed by Avaya with the SEC, which are available at www.sec.gov, particularly the information contained in Part II, Item 7, entitled “Forward Looking Statements”, of our fiscal 2004 Form 10-K and the information contained in Part I, Item 2, entitled “Forward Looking Statements”, of our Form 10-Q for the fiscal quarter ended March 31, 2005. Avaya disclaims any intention or obligation to update or revise any forward-looking statements, whether as a result of new information, future events or otherwise.
Presentation
Unless indicated otherwise, all results are presented in accordance with United States generally accepted accounting principles (GAAP).
2
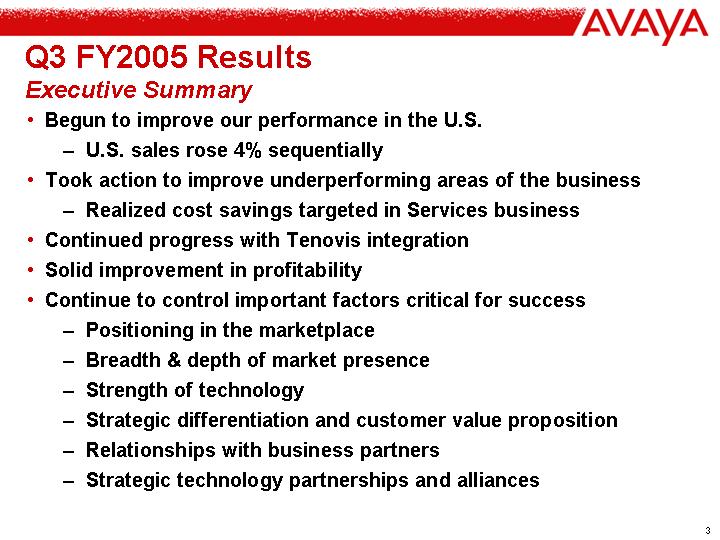
Q3 FY2005 Results
Executive Summary
• Begun to improve our performance in the U.S.
• U.S. sales rose 4% sequentially
• Took action to improve underperforming areas of the business
• Realized cost savings targeted in Services business
• Continued progress with Tenovis integration
• Solid improvement in profitability
• Continue to control important factors critical for success
• Positioning in the marketplace
• Breadth & depth of market presence
• Strength of technology
• Strategic differentiation and customer value proposition
• Relationships with business partners
• Strategic technology partnerships and alliances
3
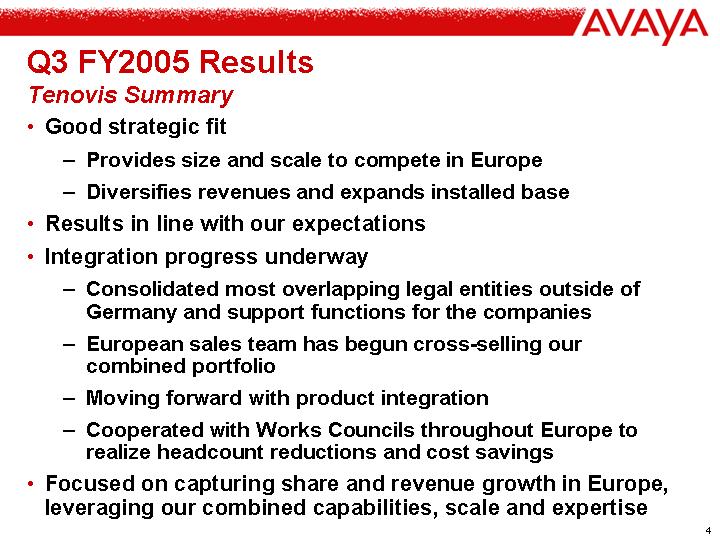
Q3 FY2005 Results
Tenovis Summary
• Good strategic fit
• Provides size and scale to compete in Europe
• Diversifies revenues and expands installed base
• Results in line with our expectations
• Integration progress underway
• Consolidated most overlapping legal entities outside of Germany and support functions for the companies
• European sales team has begun cross-selling our combined portfolio
• Moving forward with product integration
• Cooperated with Works Councils throughout Europe to realize headcount reductions and cost savings
• Focused on capturing share and revenue growth in Europe, leveraging our combined capabilities, scale and expertise
4
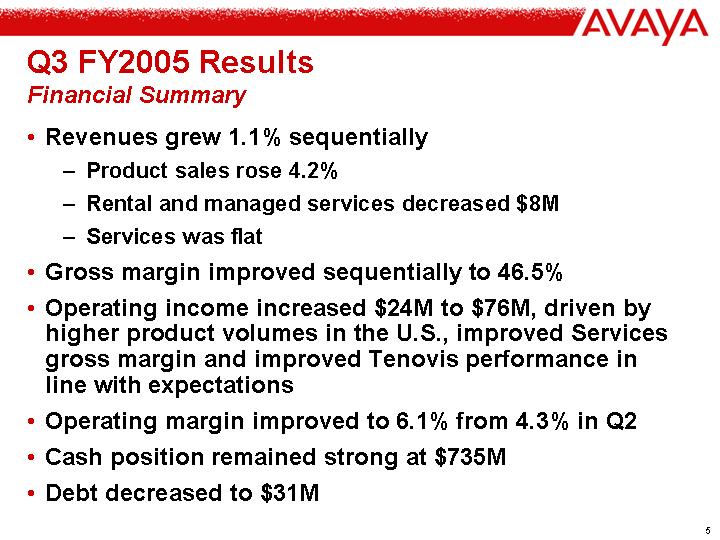
Q3 FY2005 Results
Financial Summary
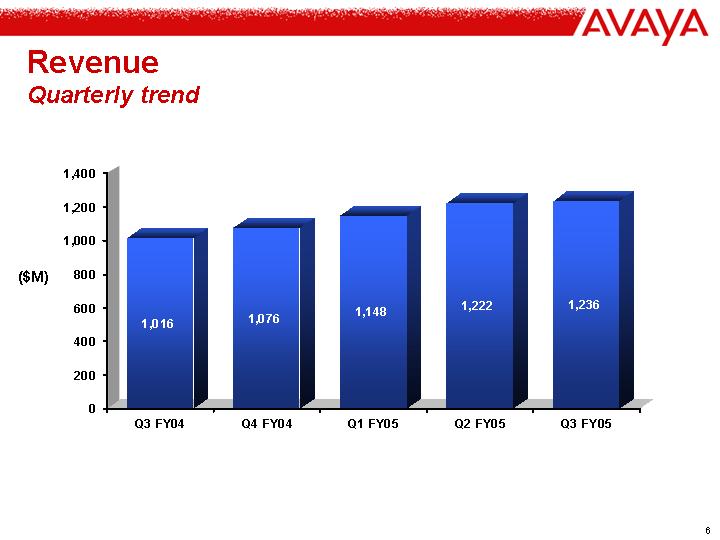
• Revenues grew 1.1% sequentially
• Product sales rose 4.2%
• Rental and managed services decreased $8M
• Services was flat
• Gross margin improved sequentially to 46.5%
• Operating income increased $24M to $76M, driven by higher product volumes in the U.S., improved Services gross margin and improved Tenovis performance in line with expectations
• Operating margin improved to 6.1% from 4.3% in Q2
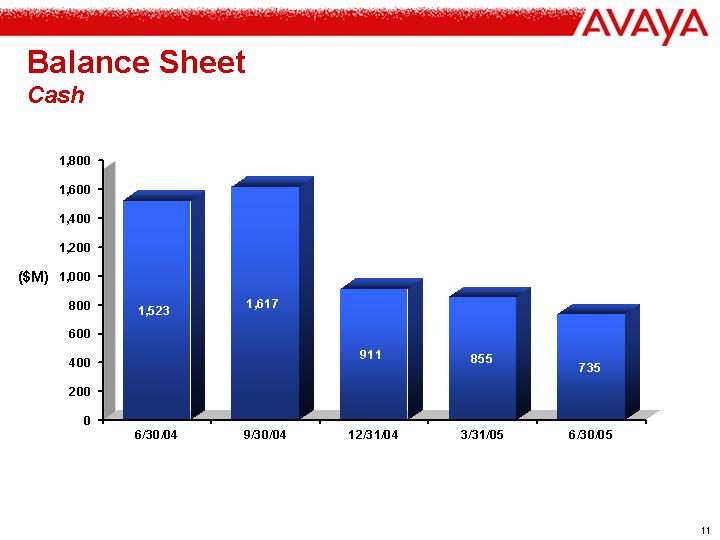
• Cash position remained strong at $735M
• Debt decreased to $31M
5
Gross and Operating Margins
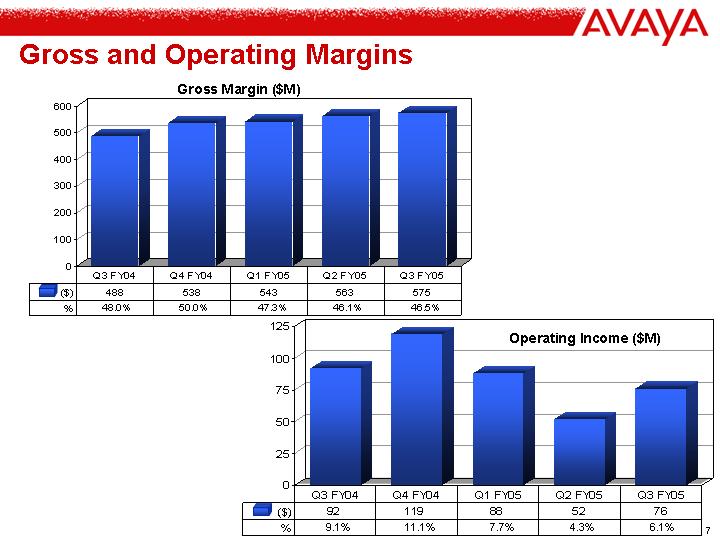
Gross Margin ($M)
[CHART]
|
| Q3 FY04 |
| Q4 FY04 |
| Q1 FY05 |
| Q2 FY05 |
| Q3 FY05 |
|
($) |
| 488 |
| 538 |
| 543 |
| 563 |
| 575 |
|
% |
| 48.0 | % | 50.0 | % | 47.3 | % | 46.1 | % | 46.5 | % |
Operating Income ($M)
[CHART]
|
| Q3 FY04 |
| Q4 FY04 |
| Q1 FY05 |
| Q2 FY05 |
| Q3 FY05 |
|
($) |
| 92 |
| 119 |
| 88 |
| 52 |
| 76 |
|
% |
| 9.1 | % | 11.1 | % | 7.7 | % | 4.3 | % | 6.1 | % |
7
Segment Results
Global Communications Solutions
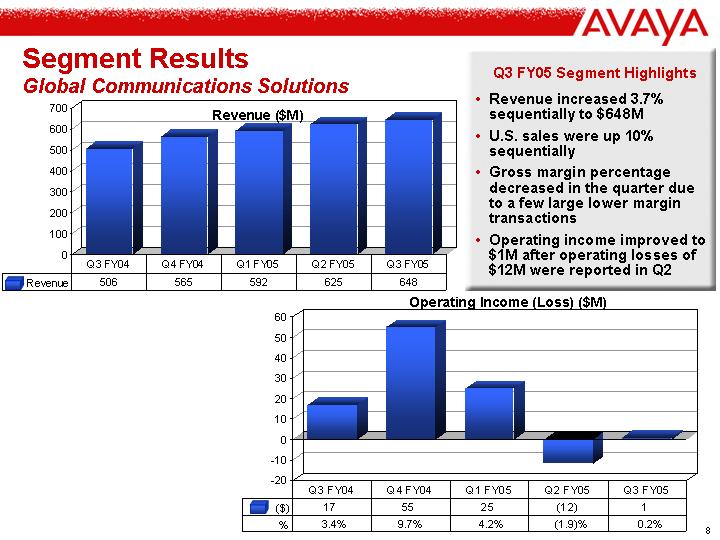
Revenue ($M)
[CHART]
|
| Q3 FY04 |
| Q4 FY04 |
| Q1 FY05 |
| Q2 FY05 |
| Q3 FY05 |
|
Revenue |
| 506 |
| 565 |
| 592 |
| 625 |
| 648 |
|
Q3 FY05 Segment Highlights
• Revenue increased 3.7% sequentially to $648M
• U.S. sales were up 10% sequentially
• Gross margin percentage decreased in the quarter due to a few large lower margin transactions
• Operating income improved to $1M after operating losses of $12M were reported in Q2
Operating Income (Loss) ($M)
[CHART]
|
| Q3 FY04 |
| Q4 FY04 |
| Q1 FY05 |
| Q2 FY05 |
| Q3 FY05 |
|
($) |
| 17 |
| 55 |
| 25 |
| (12 | ) | 1 |
|
% |
| 3.4 | % | 9.7 | % | 4.2 | % | (1.9 | )% | 0.2 | % |
8
Segment Results
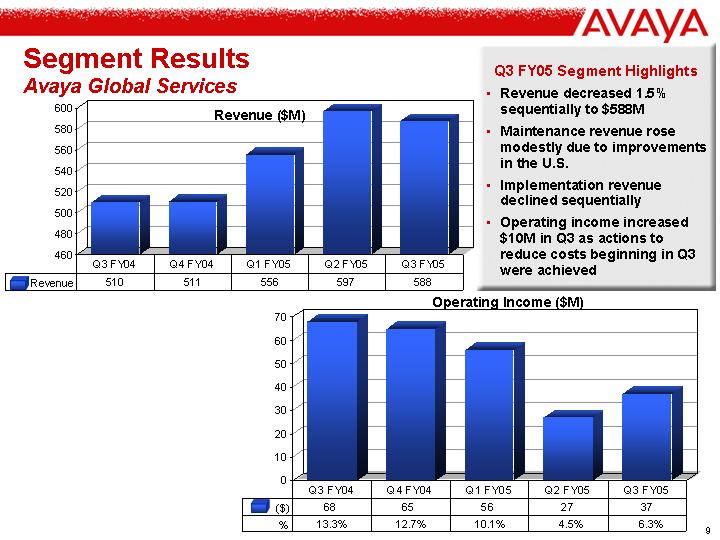
Avaya Global Services
Revenue ($M)
[CHART]
|
| Q3 FY04 |
| Q4 FY04 |
| Q1 FY05 |
| Q2 FY05 |
| Q3 FY05 |
|
Revenue |
| 510 |
| 511 |
| 556 |
| 597 |
| 588 |
|
Q3 FY05 Segment Highlights
• Revenue decreased 1.5% sequentially to $588M
• Maintenance revenue rose modestly due to improvements in the U.S.
• Implementation revenue declined sequentially
• Operating income increased $10M in Q3 as actions to reduce costs beginning in Q3 were achieved
Operating Income ($M)
[CHART]
|
| Q3 FY04 |
| Q4 FY04 |
| Q1 FY05 |
| Q2 FY05 |
| Q3 FY05 |
|
($) |
| 68 |
| 65 |
| 56 |
| 27 |
| 37 |
|
% |
| 13.3 | % | 12.7 | % | 10.1 | % | 4.5 | % | 6.3 | % |
9
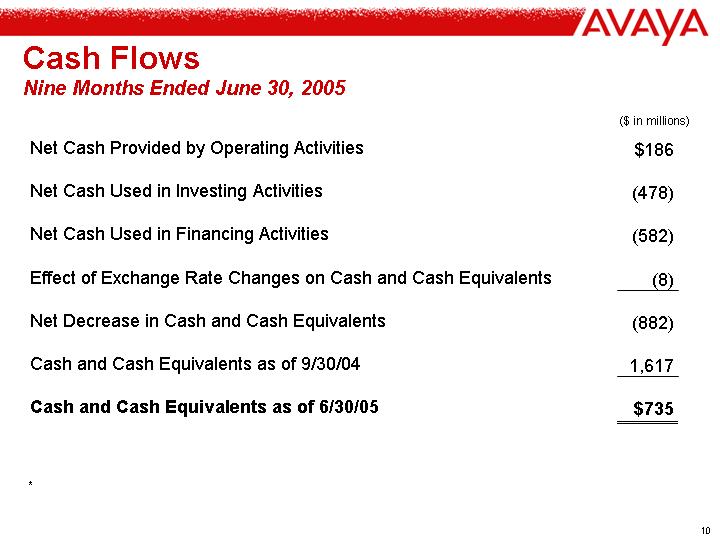
Cash Flows
Nine Months Ended June 30, 2005
|
| ($ in millions) |
| |
|
|
|
| |
Net Cash Provided by Operating Activities |
| $ | 186 |
|
|
|
|
| |
Net Cash Used in Investing Activities |
| (478 | ) | |
|
|
|
| |
Net Cash Used in Financing Activities |
| (582 | ) | |
|
|
|
| |
Effect of Exchange Rate Changes on Cash and Cash Equivalents |
| (8 | ) | |
|
|
|
| |
Net Decrease in Cash and Cash Equivalents |
| (882 | ) | |
|
|
|
| |
Cash and Cash Equivalents as of 9/30/04 |
| 1,617 |
| |
|
|
|
| |
Cash and Cash Equivalents as of 6/30/05 |
| $ | 735 |
|
10
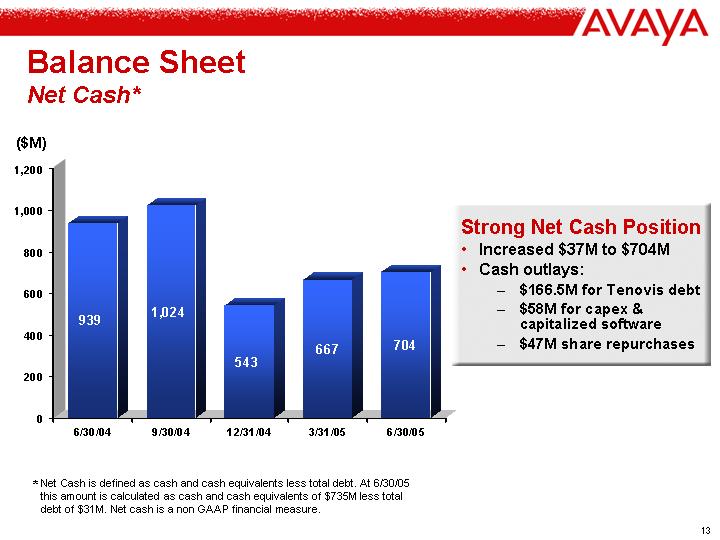
Balance Sheet
Net Cash*
[CHART]
Strong Net Cash Position
• Increased $37M to $704M
• Cash outlays:
• $166.5M for Tenovis debt
• $58M for capex & capitalized software
• $47M share repurchases
* Net Cash is defined as cash and cash equivalents less total debt. At 6/30/05 this amount is calculated as cash and cash equivalents of $735M less total debt of $31M. Net cash is a non GAAP financial measure.
13
Summary
• Build and increase our position in the marketplace, leveraging our strengths
• Robust portfolio of leading-edge solutions
• Broad customer base
• Clear marketing focus
• Compelling value proposition
• Made strides in Tenovis integration
• Financial performance on track
• Harvest combined strengths to capture revenue opportunities in Europe
• Continue to maintain financial discipline company wide
• Continue to invest internally and externally through partnerships and alliances to develop new offerings and further build competitive advantages
15
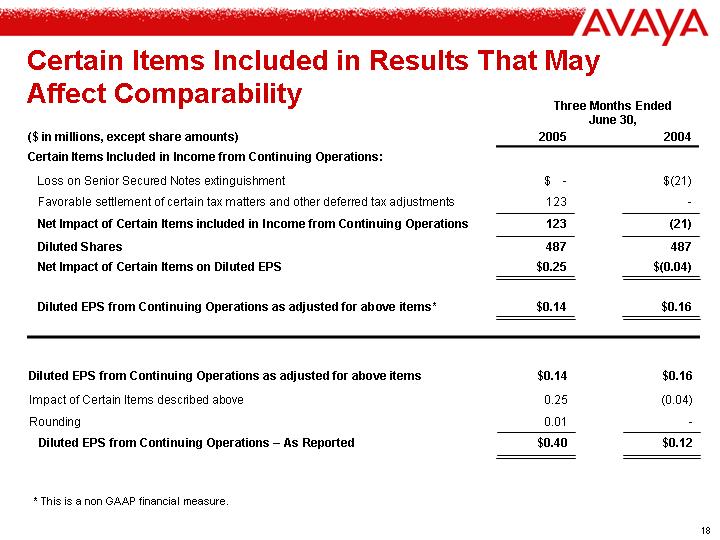
Certain Items Included in Results That May Affect Comparability
|
| Three Months Ended |
| ||||
($ in millions, except share amounts) |
| 2005 |
| 2004 |
| ||
Certain Items Included in Income from Continuing Operations: |
|
|
|
|
| ||
Loss on Senior Secured Notes extinguishment |
| $ | — |
| $ | (21 | ) |
Favorable settlement of certain tax matters and other deferred tax adjustments |
| 123 |
| — |
| ||
Net Impact of Certain Items included in Income from Continuing Operations |
| 123 |
| (21 | ) | ||
Diluted Shares |
| 487 |
| 487 |
| ||
Net Impact of Certain Items on Diluted EPS |
| $ | 0.25 |
| $ | (0.04 | ) |
|
|
|
|
|
| ||
Diluted EPS from Continuing Operations as adjusted for above items* |
| $ | 0.14 |
| $ | 0.16 |
|
|
|
|
|
|
| ||
Diluted EPS from Continuing Operations as adjusted for above items |
| $ | 0.14 |
| $ | 0.16 |
|
Impact of Certain Items described above |
| 0.25 |
| (0.04 | ) | ||
Rounding |
| 0.01 |
| — |
| ||
Diluted EPS from Continuing Operations – As Reported |
| $ | 0.40 |
| $ | 0.12 |
|
* This is a non GAAP financial measure.
18