

Searchable text section of graphics shown above
[LOGO]
Forward Looking Statements
This presentation contains forward-looking statements within the meaning of the safe harbor provisions of the Private Securities Litigation Reform Act of 1995. These statements regarding Avaya’s expected performance and outlook for operating results are based on current expectations, forecasts and assumptions that involve risks and uncertainties that could cause actual outcomes and results to differ materially. These risks and uncertainties include, but are not limited to: price and product competition; rapid or disruptive technological development; dependence on new product development; the mix of our products and services; customer demand for our products and services, including risks specifically associated with the services business and, in particular, the maintenance and rental and managed services lines of business, primarily due to renegotiations of customer contracts and changes in scope, pricing pressures and cancellations; general industry and market conditions and growth rates and general domestic and international economic conditions including interest rate and currency exchange rate fluctuations; disruption associated with the re-alignment of our sales and marketing efforts; risks related to inventory, including warranty costs, obsolescence charges, excess capacity, material and labor costs, and our distributors decisions regarding their own inventory levels; the economic, political and other risks associated with international sales and operations, including increased exposure to currency fluctuations as a result of our acquisition of Tenovis; the ability to successfully integrate acquired companies, including Tenovis, which has required significant management time and attention; the ability to attract and retain qualified employees; control of costs and expenses; U.S. and non-U.S. government regulation; and the ability to form and implement alliances.
For a further list and description of such risks and uncertainties, see the reports filed by Avaya with the SEC, which are available at www.sec.gov, particularly the information contained in Part II, Item 7, entitled “Forward Looking Statements”, of our fiscal 2004 Form 10-K and the information contained in Part I, Item 2, entitled “Forward Looking Statements”, of our Form 10-Q for the fiscal quarter ended June 30, 2005. Avaya disclaims any intention or obligation to update or revise any forward-looking statements, whether as a result of new information, future events or otherwise.
Presentation
Unless indicated otherwise, all results are presented in accordance with accounting principles generally accepted in the United States (GAAP).
2
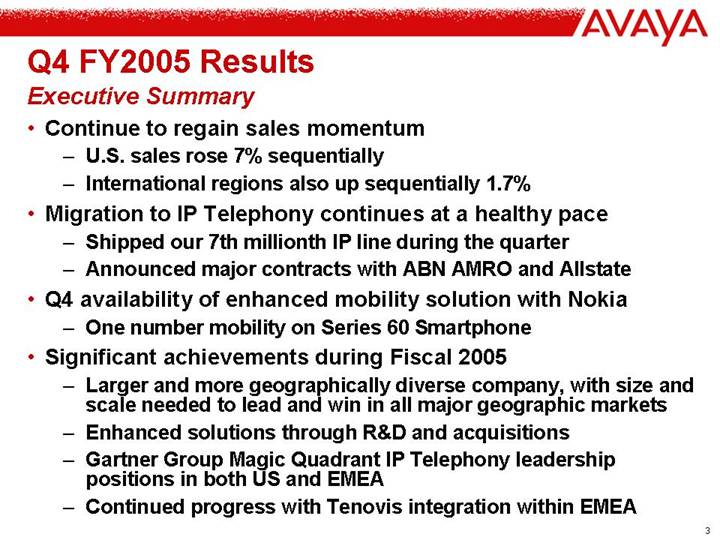
Q4 FY2005 Results
Executive Summary
• Continue to regain sales momentum
• U.S. sales rose 7% sequentially
• International regions also up sequentially 1.7%
• Migration to IP Telephony continues at a healthy pace
• Shipped our 7th millionth IP line during the quarter
• Announced major contracts with ABN AMRO and Allstate
• Q4 availability of enhanced mobility solution with Nokia
• One number mobility on Series 60 Smartphone
• Significant achievements during Fiscal 2005
• Larger and more geographically diverse company, with size and scale needed to lead and win in all major geographic markets
• Enhanced solutions through R&D and acquisitions
• Gartner Group Magic Quadrant IP Telephony leadership positions in both US and EMEA
• Continued progress with Tenovis integration within EMEA
3
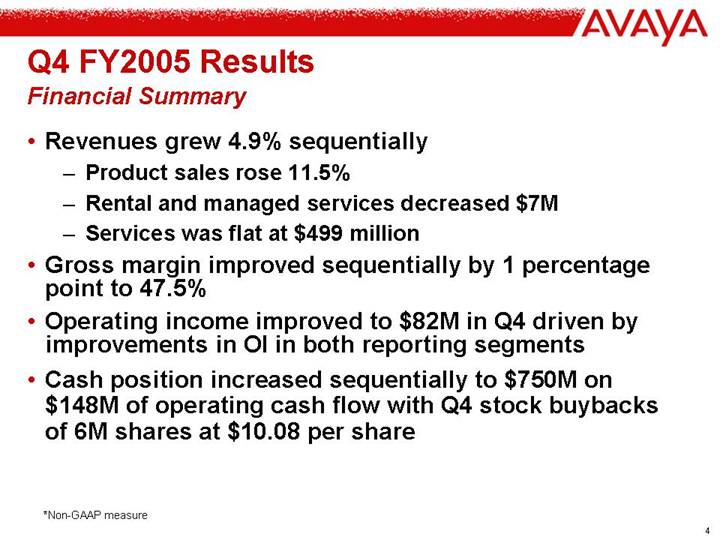
Q4 FY2005 Results
Financial Summary
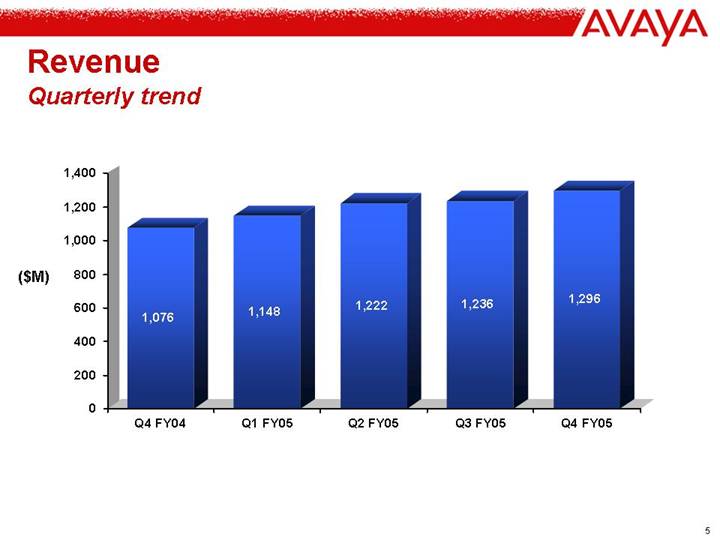
• Revenues grew 4.9% sequentially
• Product sales rose 11.5%
• Rental and managed services decreased $7M
• Services was flat at $499 million
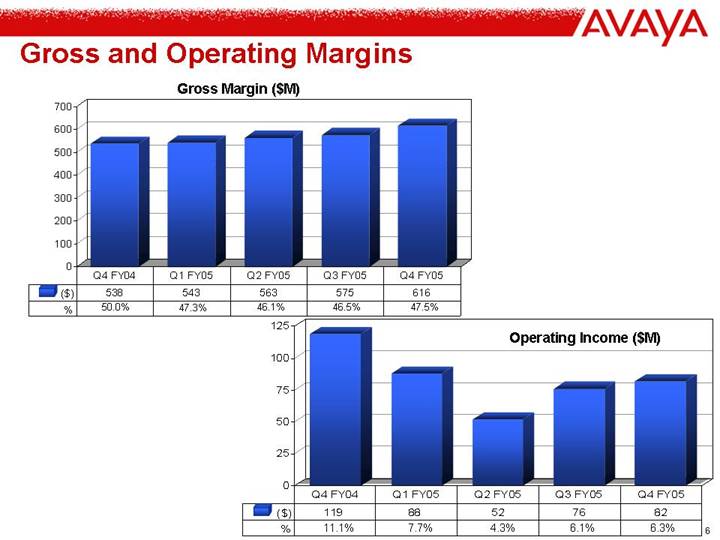
• Gross margin improved sequentially by 1 percentage point to 47.5%
• Operating income improved to $82M in Q4 driven by improvements in OI in both reporting segments
• Cash position increased sequentially to $750M on $148M of operating cash flow with Q4 stock buybacks of 6M shares at $10.08 per share
*Non-GAAP measure
4
Gross and Operating Margins
Gross Margin ($M)
[CHART]
|
| Q4 FY04 |
| Q1 FY05 |
| Q2 FY05 |
| Q3 FY05 |
| Q4 FY05 |
|
($) |
| 538 |
| 543 |
| 563 |
| 575 |
| 616 |
|
% |
| 50.0 | % | 47.3 | % | 46.1 | % | 46.5 | % | 47.5 | % |
Operating Income ($M)
[CHART]
|
| Q4 FY04 |
| Q1 FY05 |
| Q2 FY05 |
| Q3 FY05 |
| Q4 FY05 |
|
($) |
| 119 |
| 88 |
| 52 |
| 76 |
| 82 |
|
% |
| 11.1 | % | 7.7 | % | 4.3 | % | 6.1 | % | 6.3 | % |
6
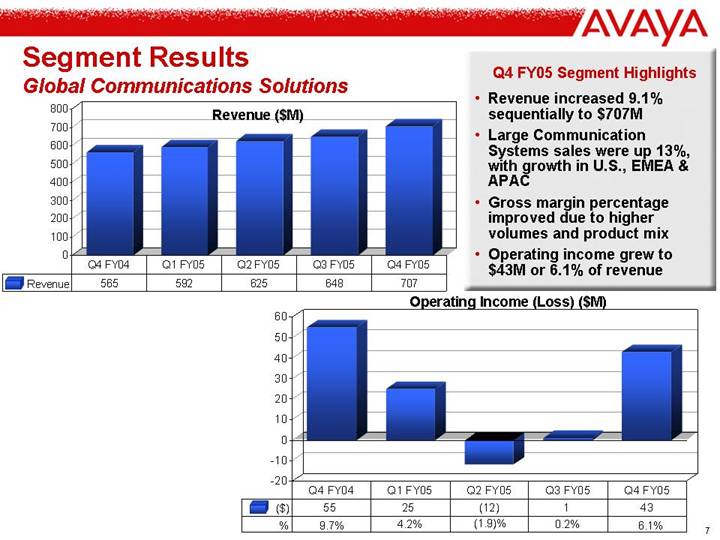
Segment Results
Global Communications Solutions
Revenue ($M)
[CHART]
|
| Q4 FY04 |
| Q1 FY05 |
| Q2 FY05 |
| Q3 FY05 |
| Q4 FY05 |
|
Revenue |
| 565 |
| 592 |
| 625 |
| 648 |
| 707 |
|
Q4 FY05 Segment Highlights
• Revenue increased 9.1% sequentially to $707M
• Large Communication Systems sales were up 13%, with growth in U.S., EMEA & APAC
• Gross margin percentage improved due to higher volumes and product mix
• Operating income grew to $43M or 6.1% of revenue
Operating Income (Loss) ($M)
[CHART]
|
| Q4 FY04 |
| Q1 FY05 |
| Q2 FY05 |
| Q3 FY05 |
| Q4 FY05 |
|
($) |
| 55 |
| 25 |
| (12 | ) | 1 |
| 43 |
|
% |
| 9.7 | % | 4.2 | % | (1.9 | )% | 0.2 | % | 6.1 | % |
7
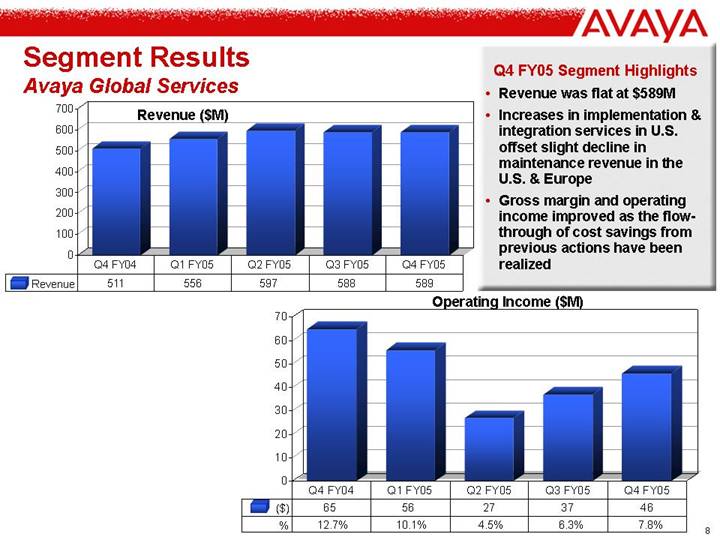
Segment Results
Avaya Global Services
Revenue ($M)
[CHART]
|
| Q4 FY04 |
| Q1 FY05 |
| Q2 FY05 |
| Q3 FY05 |
| Q4 FY05 |
|
Revenue |
| 511 |
| 556 |
| 597 |
| 588 |
| 589 |
|
Q4 FY05 Segment Highlights
• Revenue was flat at $589M
• Increases in implementation & integration services in U.S. offset slight decline in maintenance revenue in the U.S. & Europe
• Gross margin and operating income improved as the flow-through of cost savings from previous actions have been realized
Operating Income ($M)
[CHART]
|
| Q4 FY04 |
| Q1 FY05 |
| Q2 FY05 |
| Q3 FY05 |
| Q4 FY05 |
|
($) |
| 65 |
| 56 |
| 27 |
| 37 |
| 46 |
|
% |
| 12.7 | % | 10.1 | % | 4.5 | % | 6.3 | % | 7.8 | % |
8
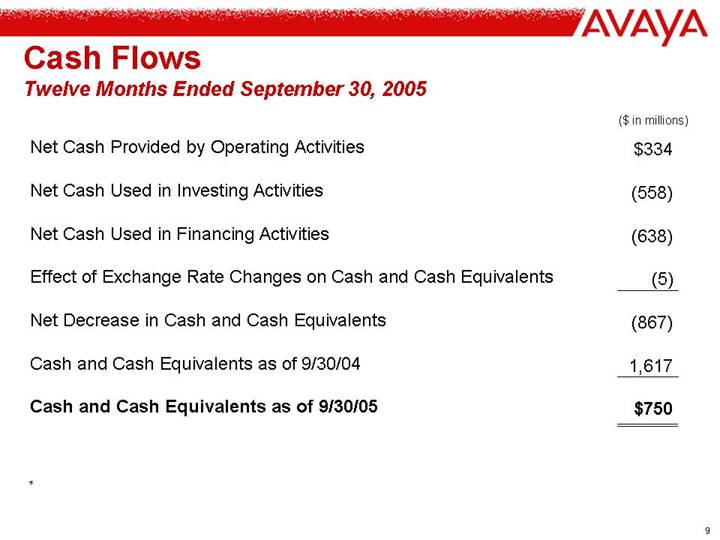
Cash Flows
Twelve Months Ended September 30, 2005
|
| ($ in millions) |
| |
|
|
|
| |
Net Cash Provided by Operating Activities |
| $ | 334 |
|
|
|
|
| |
Net Cash Used in Investing Activities |
| (558 | ) | |
|
|
|
| |
Net Cash Used in Financing Activities |
| (638 | ) | |
|
|
|
| |
Effect of Exchange Rate Changes on Cash and Cash Equivalents |
| (5 | ) | |
|
|
|
| |
Net Decrease in Cash and Cash Equivalents |
| (867 | ) | |
|
|
|
| |
Cash and Cash Equivalents as of 9/30/04 |
| 1,617 |
| |
|
|
|
| |
Cash and Cash Equivalents as of 9/30/05 |
| $ | 750 |
|
*
9
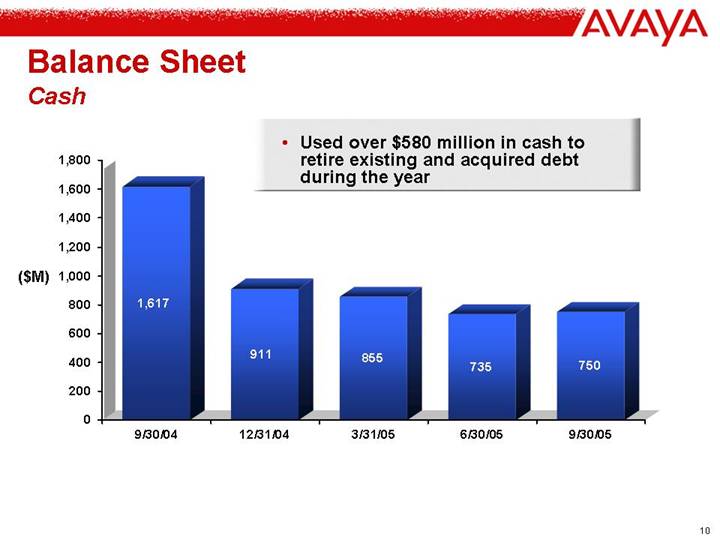
Balance Sheet
Cash
[CHART]
• Used over $580 million in cash to retire existing and acquired debt during the year
10
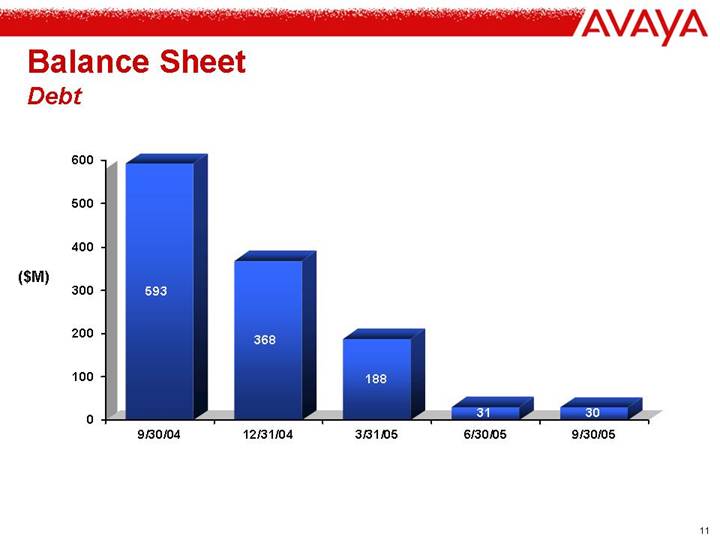
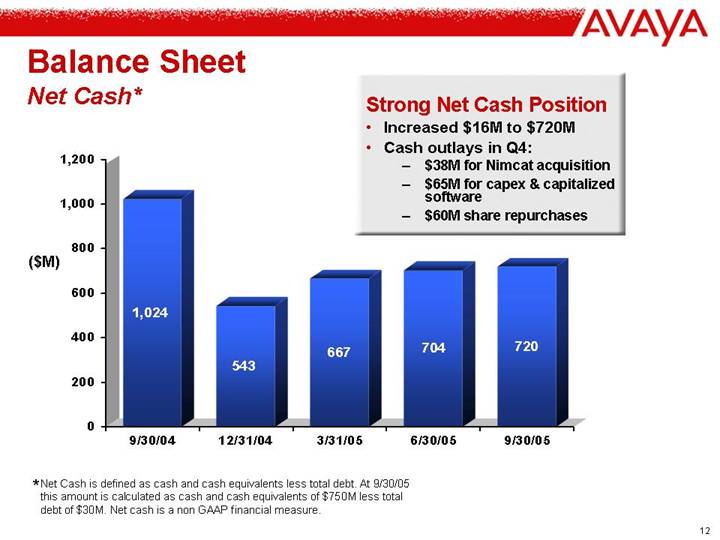
Balance Sheet
Net Cash*
[CHART]
Strong Net Cash Position
• Increased $16M to $720M
• Cash outlays in Q4:
• $38M for Nimcat acquisition
• $65M for capex & capitalized software
• $60M share repurchases
* Net Cash is defined as cash and cash equivalents less total debt. At 9/30/05 this amount is calculated as cash and cash equivalents of $750M less total debt of $30M. Net cash is a non GAAP financial measure.
12
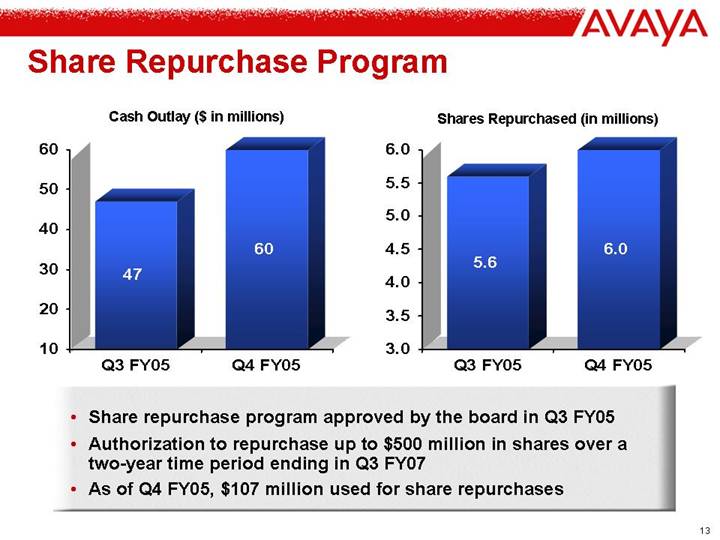
Share Repurchase Program
Cash Outlay ($ in millions)
[CHART]
Shares Repurchased (in millions)
[CHART]
• Share repurchase program approved by the board in Q3 FY05
• Authorization to repurchase up to $500 million in shares over a two-year time period ending in Q3 FY07
• As of Q4 FY05, $107 million used for share repurchases
13
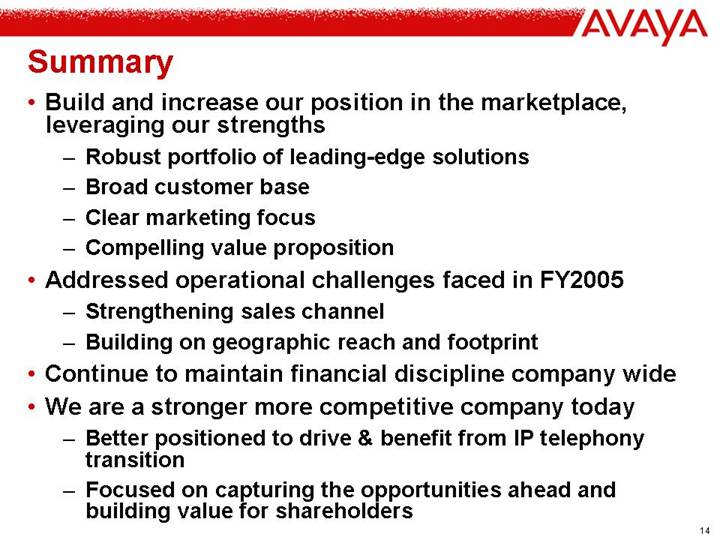
Summary
• Build and increase our position in the marketplace, leveraging our strengths
• Robust portfolio of leading-edge solutions
• Broad customer base
• Clear marketing focus
• Compelling value proposition
• Addressed operational challenges faced in FY2005
• Strengthening sales channel
• Building on geographic reach and footprint
• Continue to maintain financial discipline company wide
• We are a stronger more competitive company today
• Better positioned to drive & benefit from IP telephony transition
• Focused on capturing the opportunities ahead and building value for shareholders
14
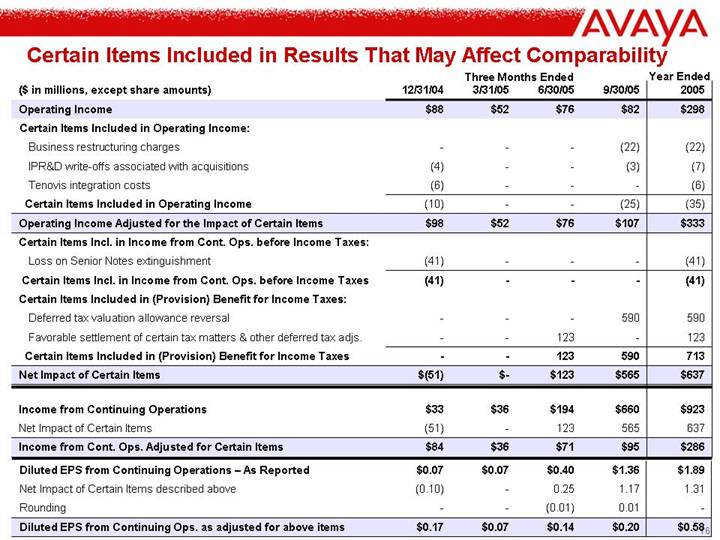
Certain Items Included in Results That May Affect Comparability
|
| Three Months Ended |
| Year Ended |
| |||||||||||
($ in millions, except share amounts) |
| 12/31/04 |
| 3/31/05 |
| 6/30/05 |
| 9/30/05 |
| 2005 |
| |||||
Operating Income |
| $ | 88 |
| $ | 52 |
| $ | 76 |
| $ | 82 |
| $ | 298 |
|
Certain Items Included in Operating Income: |
|
|
|
|
|
|
|
|
|
|
| |||||
Business restructuring charges |
| — |
| — |
| — |
| (22 | ) | (22 | ) | |||||
IPR&D write-offs associated with acquisitions |
| (4 | ) | — |
| — |
| (3 | ) | (7 | ) | |||||
Tenovis integration costs |
| (6 | ) | — |
| — |
| — |
| (6 | ) | |||||
Certain Items Included in Operating Income |
| (10 | ) | — |
| — |
| (25 | ) | (35 | ) | |||||
Operating Income Adjusted for the Impact of Certain Items |
| $ | 98 |
| $ | 52 |
| $ | 76 |
| $ | 107 |
| $ | 333 |
|
Certain Items Incl. in Income from Cont. Ops. before Income Taxes: |
|
|
|
|
|
|
|
|
|
|
| |||||
Loss on Senior Notes extinguishment |
| (41 | ) | — |
| — |
| — |
| (41 | ) | |||||
Certain Items Incl. in Income from Cont. Ops. before Income Taxes |
| (41 | ) | — |
| — |
| — |
| (41 | ) | |||||
Certain Items Included in (Provision) Benefit for Income Taxes: |
|
|
|
|
|
|
|
|
|
|
| |||||
Deferred tax valuation allowance reversal |
| — |
| — |
| — |
| 590 |
| 590 |
| |||||
Favorable settlement of certain tax matters & other deferred tax adjs. |
| — |
| — |
| 123 |
| — |
| 123 |
| |||||
Certain Items Included in (Provision) Benefit for Income Taxes |
| — |
| — |
| 123 |
| 590 |
| 713 |
| |||||
Net Impact of Certain Items |
| $ | (51 | ) | $ | — |
| $ | 123 |
| $ | 565 |
| $ | 637 |
|
|
|
|
|
|
|
|
|
|
|
|
| |||||
Income from Continuing Operations |
| $ | 33 |
| $ | 36 |
| $ | 194 |
| $ | 660 |
| $ | 923 |
|
Net Impact of Certain Items |
| (51 | ) | — |
| 123 |
| 565 |
| 637 |
| |||||
Income from Cont. Ops. Adjusted for Certain Items |
| $ | 84 |
| $ | 36 |
| $ | 71 |
| $ | 95 |
| $ | 286 |
|
Diluted EPS from Continuing Operations – As Reported |
| $ | 0.07 |
| $ | 0.07 |
| $ | 0.40 |
| $ | 1.36 |
| $ | 1.89 |
|
Net Impact of Certain Items described above |
| (0.10 | ) | — |
| 0.25 |
| 1.17 |
| 1.31 |
| |||||
Rounding |
| — |
| — |
| (0.01 | ) | 0.01 |
| — |
| |||||
Diluted EPS from Continuing Ops. as adjusted for above items |
| $ | 0.17 |
| $ | 0.07 |
| $ | 0.14 |
| $ | 0.20 |
| $ | 0.58 16 |
|
16
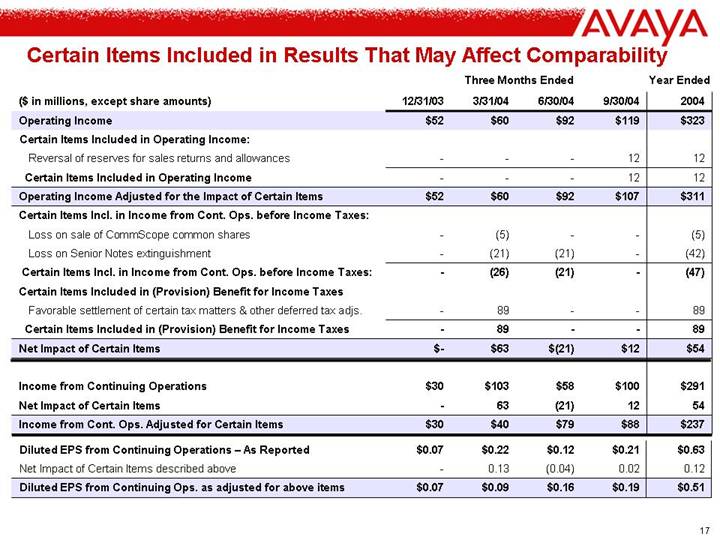
Certain Items Included in Results That May Affect Comparability
|
| Three Months Ended |
| Year Ended |
| |||||||||||
($ in millions, except share amounts) |
| 12/31/03 |
| 3/31/04 |
| 6/30/04 |
| 9/30/04 |
| 2004 |
| |||||
Operating Income |
| $ | 52 |
| $ | 60 |
| $ | 92 |
| $ | 119 |
| $ | 323 |
|
Certain Items Included in Operating Income: |
|
|
|
|
|
|
|
|
|
|
| |||||
Reversal of reserves for sales returns and allowances |
| — |
| — |
| — |
| 12 |
| 12 |
| |||||
Certain Items Included in Operating Income |
| — |
| — |
| — |
| 12 |
| 12 |
| |||||
Operating Income Adjusted for the Impact of Certain Items |
| $ | 52 |
| $ | 60 |
| $ | 92 |
| $ | 107 |
| $ | 311 |
|
Certain Items Incl. in Income from Cont. Ops. before Income Taxes: |
|
|
|
|
|
|
|
|
|
|
| |||||
Loss on sale of CommScope common shares |
| — |
| (5 | ) | — |
| — |
| (5 | ) | |||||
Loss on Senior Notes extinguishment |
| — |
| (21 | ) | (21 | ) | — |
| (42 | ) | |||||
Certain Items Incl. in Income from Cont. Ops. before Income Taxes: |
| — |
| (26 | ) | (21 | ) | — |
| (47 | ) | |||||
Certain Items Included in (Provision) Benefit for Income Taxes |
|
|
|
|
|
|
|
|
|
|
| |||||
Favorable settlement of certain tax matters & other deferred tax adjs. |
| — |
| 89 |
| — |
| — |
| 89 |
| |||||
Certain Items Included in (Provision) Benefit for Income Taxes |
| — |
| 89 |
| — |
| — |
| 89 |
| |||||
Net Impact of Certain Items |
| $ | — |
| $ | 63 |
| $ | (21 | ) | $ | 12 |
| $ | 54 |
|
|
|
|
|
|
|
|
|
|
|
|
| |||||
Income from Continuing Operations |
| $ | 30 |
| $ | 103 |
| $ | 58 |
| $ | 100 |
| $ | 291 |
|
Net Impact of Certain Items |
| — |
| 63 |
| (21 | ) | 12 |
| 54 |
| |||||
Income from Cont. Ops. Adjusted for Certain Items |
| $ | 30 |
| $ | 40 |
| $ | 79 |
| $ | 88 |
| $ | 237 |
|
|
|
|
|
|
|
|
|
|
|
|
| |||||
Diluted EPS from Continuing Operations – As Reported |
| $ | 0.07 |
| $ | 0.22 |
| $ | 0.12 |
| $ | 0.21 |
| $ | 0.63 |
|
Net Impact of Certain Items described above |
| — |
| 0.13 |
| (0.04 | ) | 0.02 |
| 0.12 |
| |||||
Diluted EPS from Continuing Ops. as adjusted for above items |
| $ | 0.07 |
| $ | 0.09 |
| $ | 0.16 |
| $ | 0.19 |
| $ | 0.51 |
|
17