


Searchable text section of graphics shown above
[LOGO]
[GRAPHIC]
Avaya Financial Analyst Conference
December 1, 2005
© 2005 Avaya Inc. All rights reserved.
1
Forward Looking Statements
This presentation contains forward-looking statements within the meaning of the safe harbor provisions of the Private Securities Litigation Reform Act of 1995. Forward-looking statements give our current expectations or forecasts of future events. Actual future results may vary materially. They can be affected by inaccurate assumptions we might make or by known or unknown risks and uncertainties. Consequently, no forward-looking statement can be guaranteed and you are cautioned not to place undue reliance on these forward-looking statements.
The risks and uncertainties referred to above include, but are not limited to: price and product competition; rapid or disruptive technological development, including the effects of the technology shift from traditional TDM to IP telephony; dependence on new product development; the mix of our products and services; customer demand for our products and services, including risks specifically associated with the services business and, in particular, the maintenance and rental and managed services lines of business, primarily due to renegotiations of customer contracts and changes in scope, pricing pressures and cancellations; general industry and market conditions and growth rates and general domestic and international economic conditions including interest rate and currency exchange rate fluctuations; disruption associated with the re-alignment of our sales and marketing efforts; risks related to inventory, including warranty costs, obsolescence charges, excess capacity, material and labor costs, and our distributors’ decisions regarding their own inventory level; the economic, political and other risks associated with international sales and operations, including increased exposure to currency fluctuations and to European economies as a result of our acquisition of Tenovis; the ability to successfully integrate acquired companies, including Tenovis, which has required significant management time and attention; the ability to attract and retain qualified employees; control of costs and expenses; U.S. and non-U.S. government regulation; and the ability to form and implement alliances.
For a further list and description of such risks and uncertainties, see the reports filed by Avaya with the SEC, which are available at www.sec.gov, particularly the information contained in Part II, Item 7, entitled “Forward Looking Statements”, of our fiscal 2004 Form 10-K and the information contained in Part I, Item 2, entitled “Forward Looking Statements”, of our Form 10-Q for the fiscal quarter ended June 30, 2005. Avaya disclaims any intention or obligation to update or revise any forward-looking statements, whether as a result of new information, future events or otherwise.
Presentation: Unless indicated otherwise, all results are presented in accordance with accounting principles generally accepted in the United States (GAAP).
2
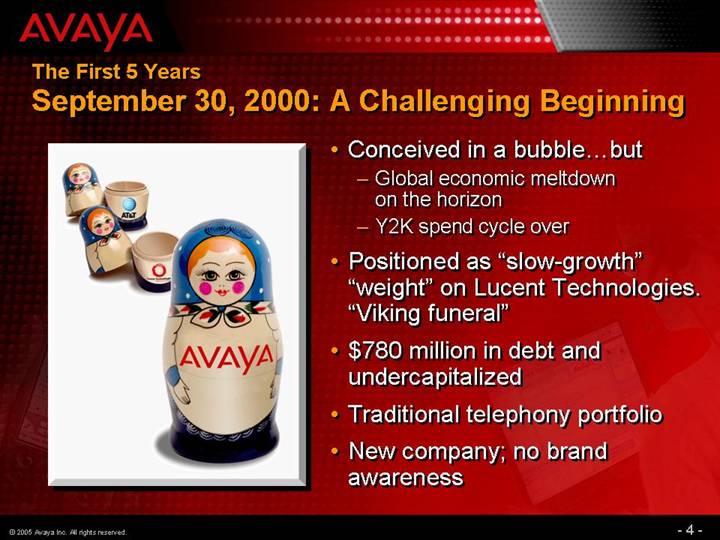
The First 5 Years
September 30, 2000: A Challenging Beginning
[GRAPHIC]
• Conceived in a bubble…but
• Global economic meltdown on the horizon
• Y2K spend cycle over
• Positioned as “slow-growth” “weight” on Lucent Technologies. “Viking funeral”
• $780 million in debt and undercapitalized
• Traditional telephony portfolio
• New company; no brand awareness
4
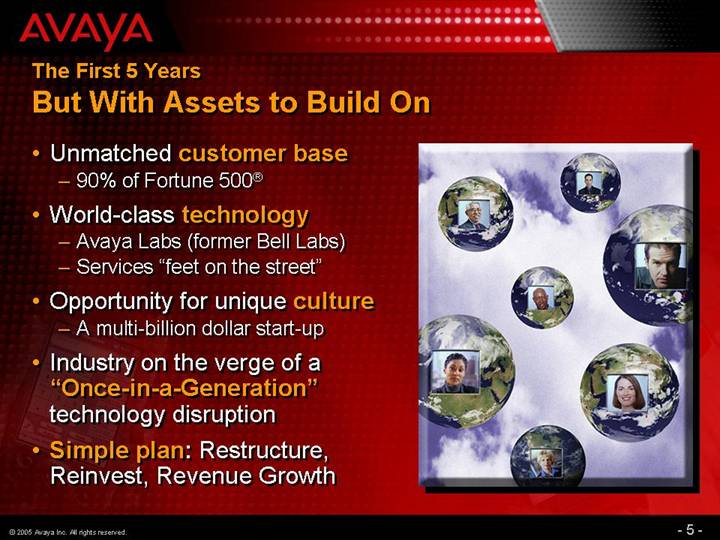
The First 5 Years
But With Assets to Build On
• Unmatched customer base
• 90% of Fortune 500®
• World-class technology
• Avaya Labs (former Bell Labs)
• Services “feet on the street”
• Opportunity for unique culture
• A multi-billion dollar start-up
• Industry on the verge of a “Once-in-a-Generation”technology disruption
• Simple plan: Restructure, Reinvest, Revenue Growth
[GRAPHIC]
5
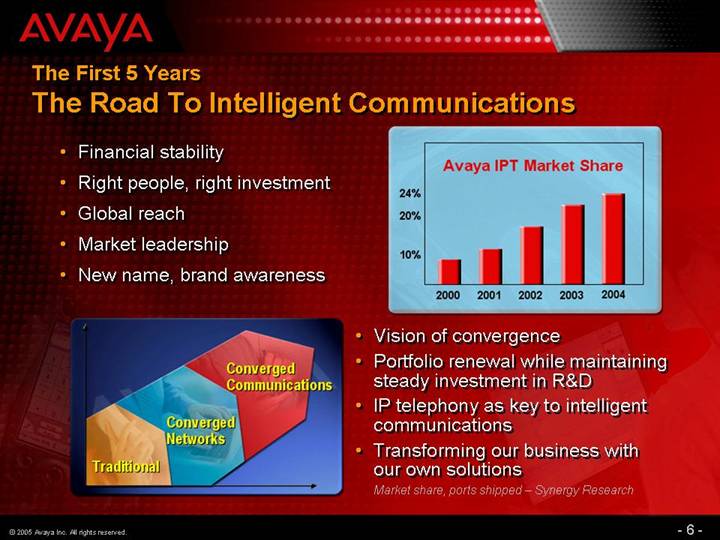
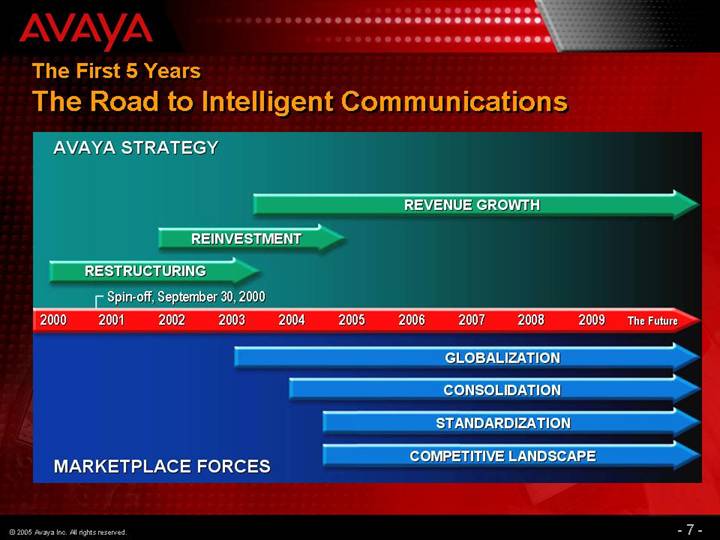
The First 5 Years
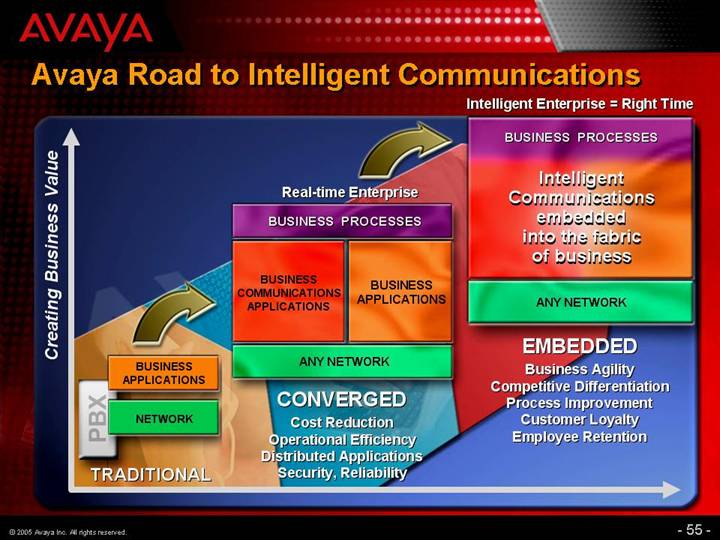
The Road To Intelligent Communications
• Financial stability
• Right people, right investment
• Global reach
• Market leadership
• New name, brand awareness
[CHART]
[GRAPHIC]
• Vision of convergence
• Portfolio renewal while maintaining steady investment in R&D
• IP telephony as key to intelligent communications
• Transforming our business with our own solutions
Market share, ports shipped – Synergy Research
6
The First 5 Years
Reinvested in Our Portfolio
• Early commitment to IP Telephony
• Software focus
• Open, flexible, interoperable, secure
• Avaya Labs – ongoing investment in R&D
• Portfolio renewal
• DEFINITY à MultiVantage solutions, Communication Manager
• Partner, Magix, INDeX à IP Office
• Audix, Serenade, Aria à Modular Messaging
• CRM Central à Customer Interaction Suite
• Break fix services focus à planning, design, integration, implementation, installation and maintenance, remote support, managed and hosted services
[GRAPHIC]
8
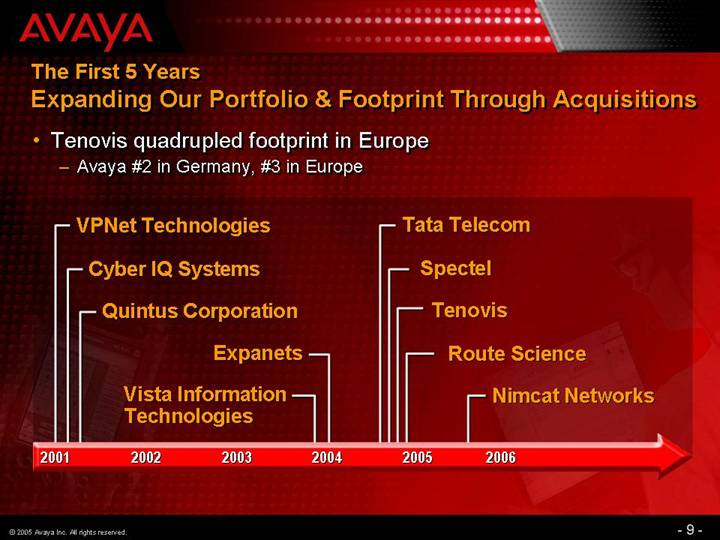
The First 5 Years
Expanding Our Portfolio & Footprint Through Acquisitions
• Tenovis quadrupled footprint in Europe
• Avaya #2 in Germany, #3 in Europe
[CHART]
9
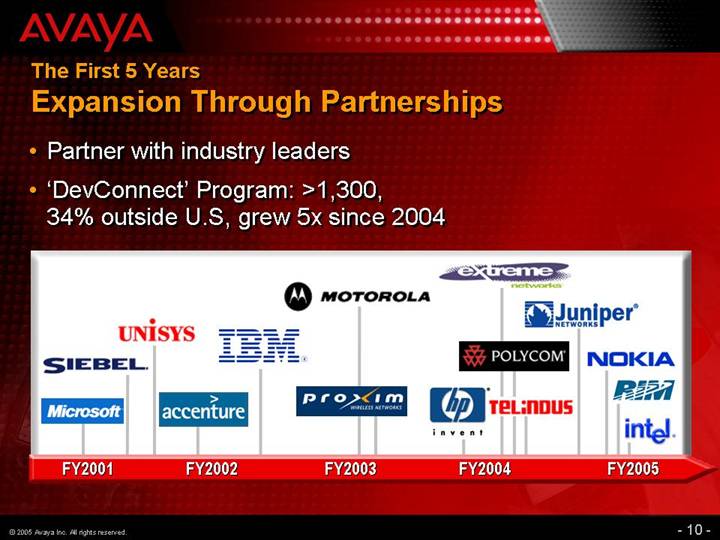
The First 5 Years
Expansion Through Partnerships
• Partner with industry leaders
• ‘DevConnect’ Program: >1,300, 34% outside U.S, grew 5x since 2004
[CHART]
10
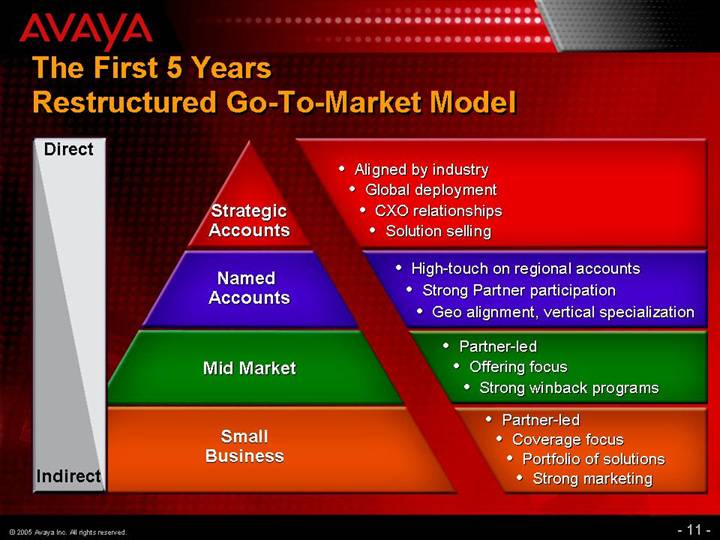
The First 5 Years
Restructured Go-To-Market Model
Direct |
|
|
| Strategic | • Aligned by industry |
| • Global deployment | |
| • CXO relationships | |
| • Solution selling | |
|
|
|
| Named | • High-touch on regional accounts |
| • Strong Partner participation | |
| • Geo alignment, vertical specialization | |
|
|
|
| Mid Market | • Partner-led |
| • Offering focus | |
| • Strong winback programs | |
|
|
|
| Small | • Partner-led |
| • Coverage focus | |
| • Portfolio of solutions | |
| • Strong marketing | |
Indirect |
|
|
11
The First 5 Years
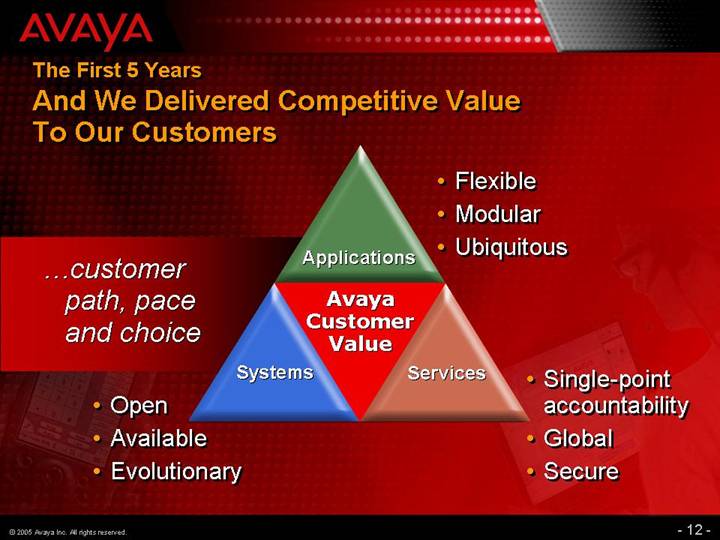
And We Delivered Competitive Value
To Our Customers
…customer path, pace and choice
Avaya Customer Value
Applications
• Flexible
• Modular
• Ubiquitous
Services
• Single-point accountability
• Global
• Secure
Systems
• Open
• Available
• Evolutionary
12
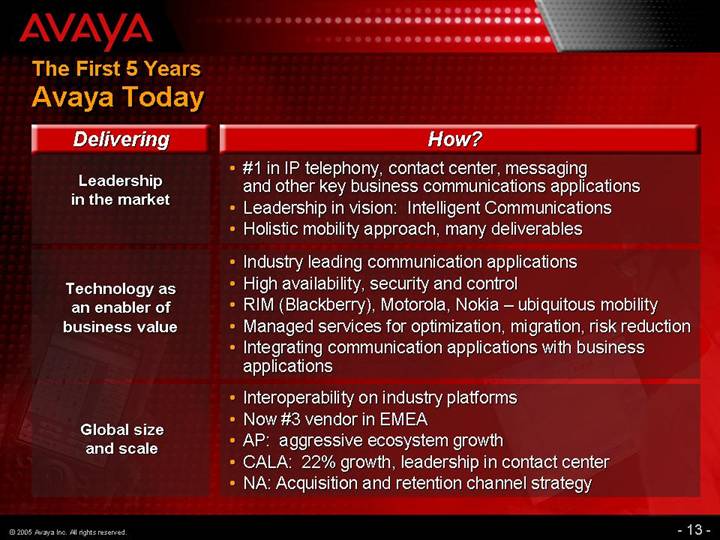
The First 5 Years
Avaya Today
Delivering |
| How? |
|
Leadership |
| • #1 in IP telephony, contact center, messaging |
|
| and other key business communications applications |
| |
| • Leadership in vision: Intelligent Communications |
| |
| • Holistic mobility approach, many deliverables |
| |
|
|
|
|
Technology as |
| • Industry leading communication applications |
|
| • High availability, security and control |
| |
| • RIM (Blackberry), Motorola, Nokia – ubiquitous mobility |
| |
| • Managed services for optimization, migration, risk reduction |
| |
| • Integrating communication applications with business applications |
| |
|
|
|
|
Global size |
| • Interoperability on industry platforms |
|
| • Now #3 vendor in EMEA |
| |
| • AP: aggressive ecosystem growth |
| |
| • CALA: 22% growth, leadership in contact center |
| |
| • NA: Acquisition and retention channel strategy |
|
13
A Leader in Business Communications
IP Telephony |
| Contact Centers |
[GRAPHIC] |
| [GRAPHIC] |
|
|
|
[GRAPHIC] | ||
Mobility |
| Services |
[GRAPHIC] |
| [GRAPHIC] |
14
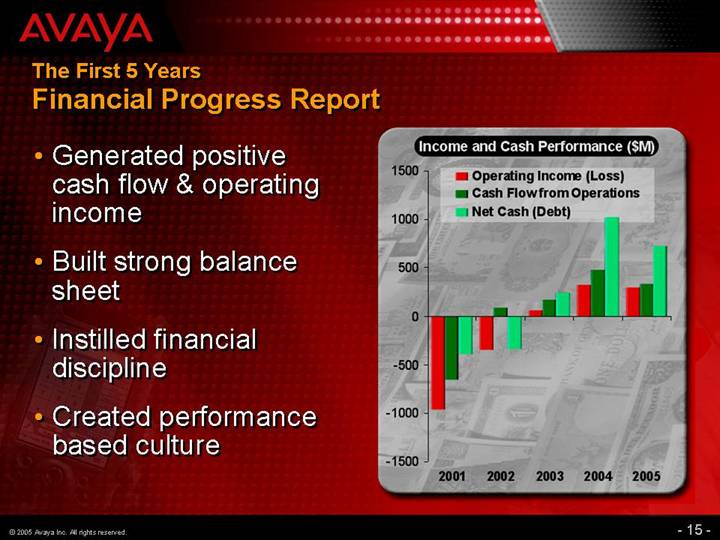
The First 5 Years
Financial Progress Report
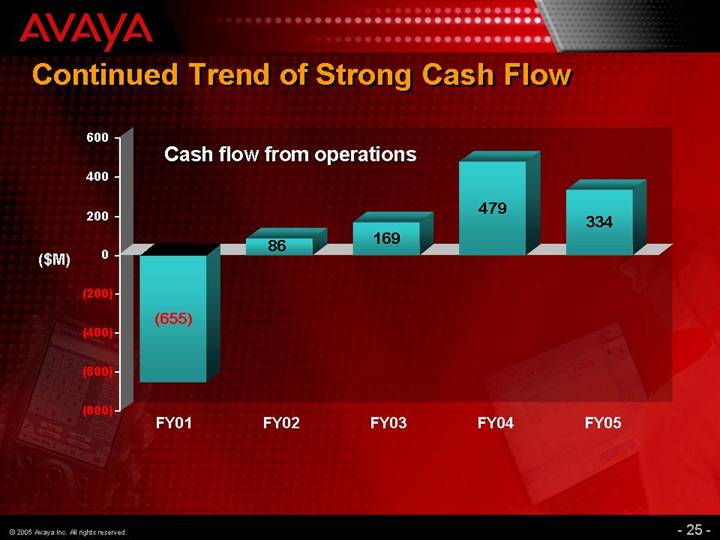
• Generated positive cash flow & operating income
• Built strong balance sheet
• Instilled financial discipline
• Created performance based culture
[CHART]
15
[GRAPHIC]
Avaya Financial Analyst Conference
Financial and Operational Review
Garry K. McGuire
CFO and SVP, Corporate Development
17
Discussion Points – FY 2005
• 2005 Year in Review
• Key Performance Drivers
• Asset Management and Liquidity
• Capital Structure
18
2005 Year in Review
• A year of challenges…
• Go-to-market model adjustments
• European integration
• Pressure in services maintenance revenues
• But also a year of progress in key areas:
• Larger, broader, more diversified global presence
• Strengthened technology & solutions portfolio
• Maintained IP market leadership
• Maintained financial discipline
• Stronger balance sheet
• Sustained profitability*
* Based on adjusted operating income, a non-GAAP financial measure. Reconciliation to reported results can be found in “Certain Items” chart in Appendix
19
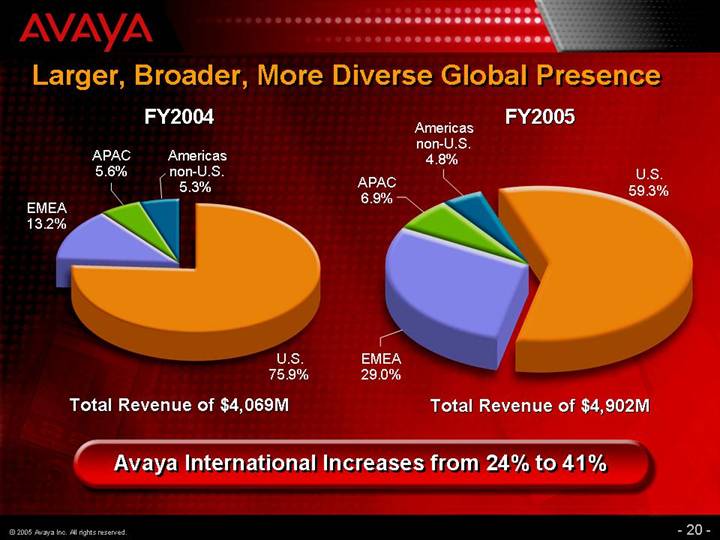
Larger, Broader, More Diverse Global Presence
FY2004
[CHART]
Total Revenue of $4,069M
FY2005
[CHART]
Total Revenue of $4,902M
Avaya International Increases from 24% to 41%
20
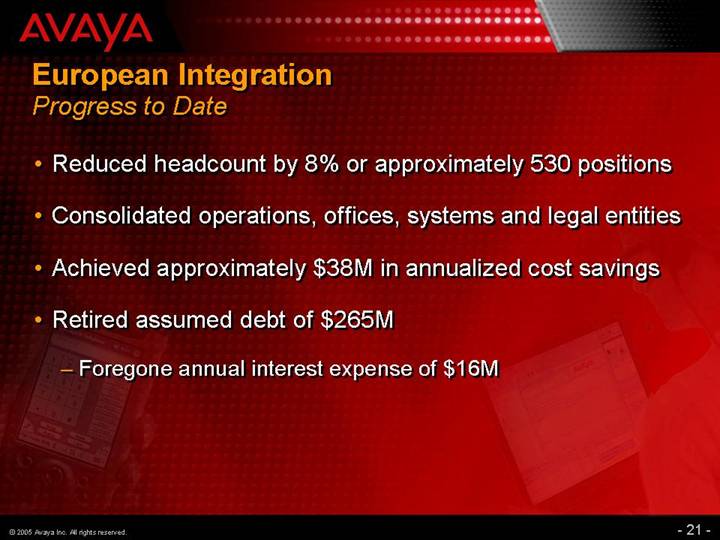
European Integration
Progress to Date
• Reduced headcount by 8% or approximately 530 positions
• Consolidated operations, offices, systems and legal entities
• Achieved approximately $38M in annualized cost savings
• Retired assumed debt of $265M
• Foregone annual interest expense of $16M
21
Strengthened Technology & Solutions Portfolio
[LOGO]
Software upgrades
• Communication Manager 3.0
• IP Office 3.0
22
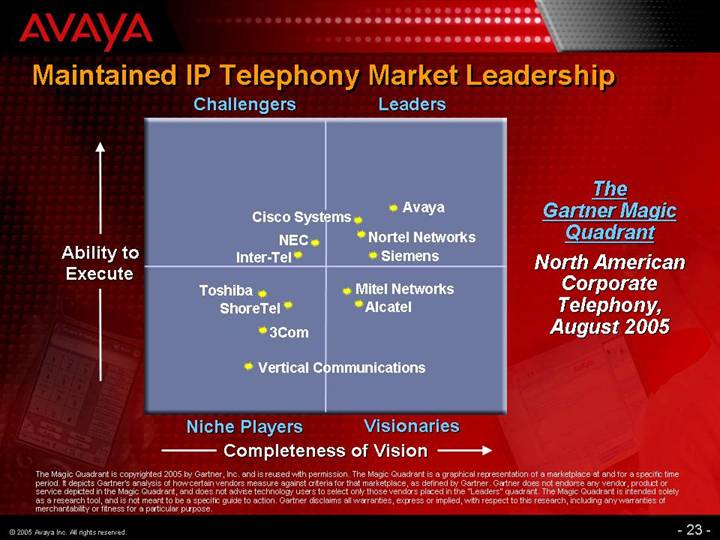
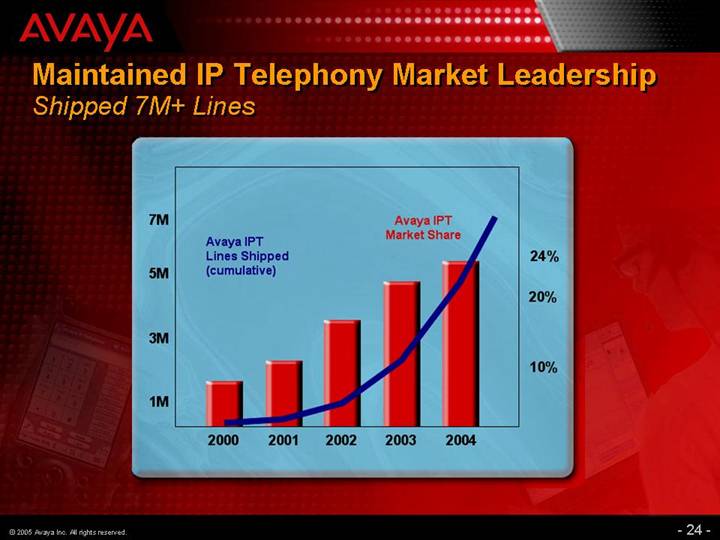
Maintained IP Telephony Market Leadership
The Gartner Magic Quadrant
North American Corporate Telephony, August 2005
[CHART]
The Magic Quadrant is copyrighted 2005 by Gartner, Inc. and is reused with permission. The Magic Quadrant is a graphical representation of a marketplace at and for a specific time period. It depicts Gartner’s analysis of how certain vendors measure against criteria for that marketplace, as defined by Gartner. Gartner does not endorse any vendor, product or service depicted in the Magic Quadrant, and does not advise technology users to select only those vendors placed in the “Leaders” quadrant. The Magic Quadrant is intended solely as a research tool, and is not meant to be a specific guide to action. Gartner disclaims all warranties, express or implied, with respect to this research, including any warranties of merchantability or fitness for a particular purpose.
23
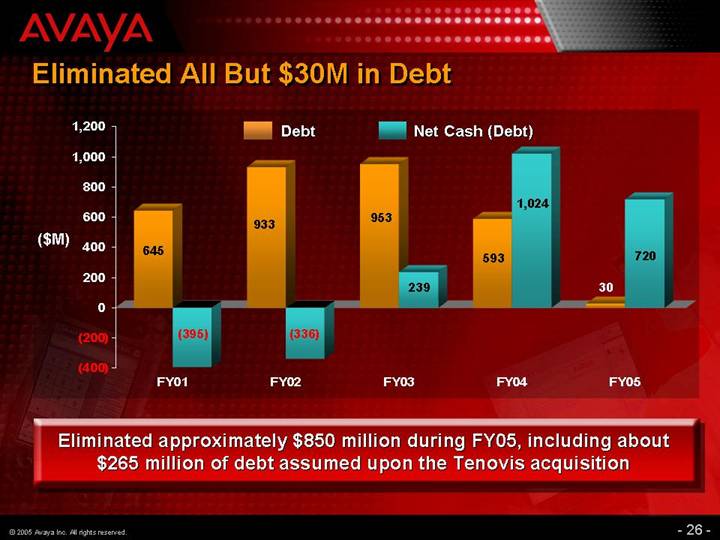
Eliminated All But $30M in Debt
[CHART]
Eliminated approximately $850 million during FY05, including about
$265 million of debt assumed upon the Tenovis acquisition
26
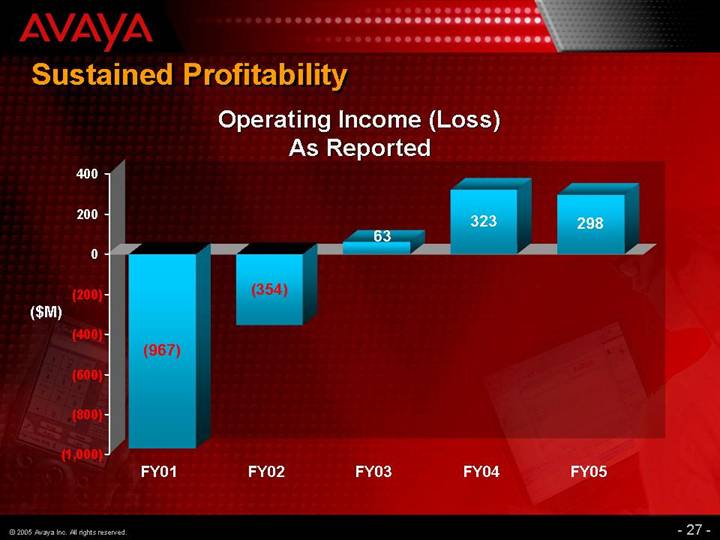
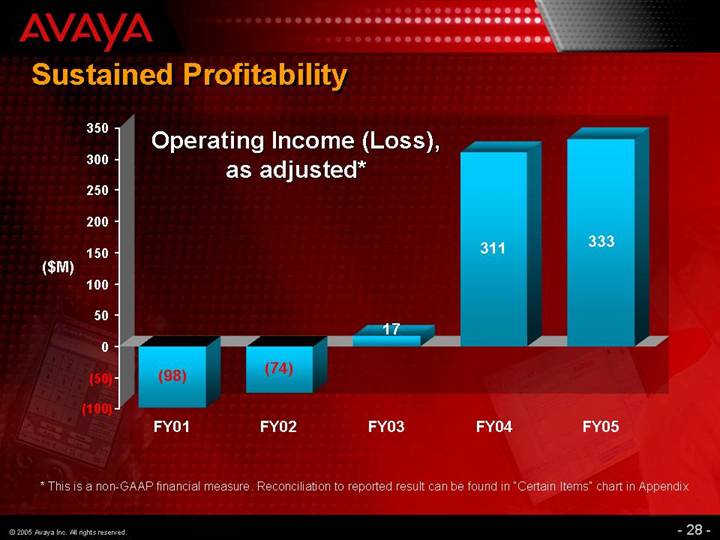
Sustained Profitability
Operating Income (Loss),
as adjusted*
[CHART]
* This is a non-GAAP financial measure. Reconciliation to reported result can be found in “Certain Items” chart in Appendix
28
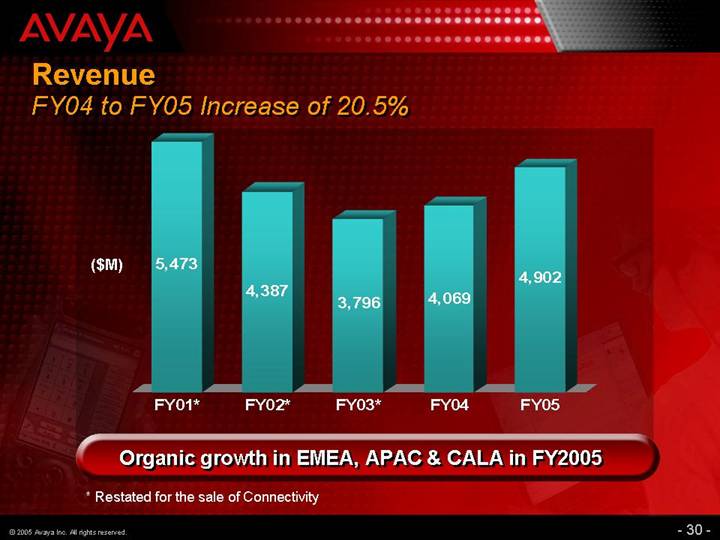
Revenue
FY04 to FY05 Increase of 20.5%
[CHART]
Organic growth in EMEA, APAC & CALA in FY2005
* Restated for the sale of Connectivity
30
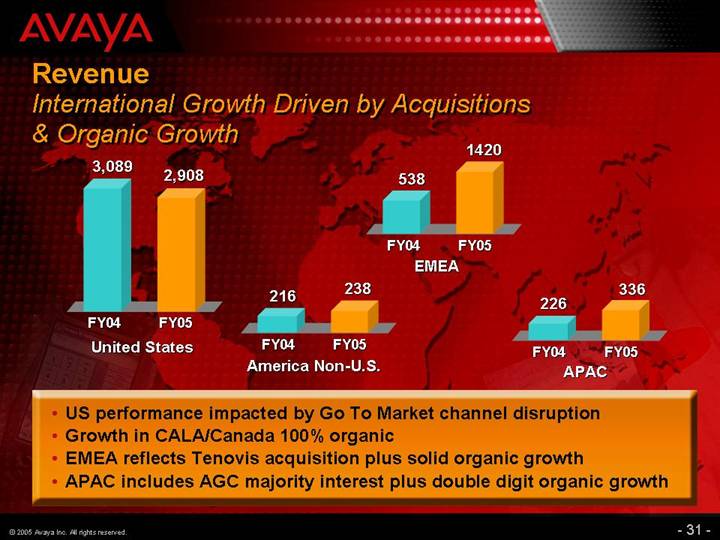
Revenue
International Growth Driven by Acquisitions
& Organic Growth
[CHART]
United States
[CHART]
America Non-U.S.
[CHART]
EMEA
[CHART]
APAC
• US performance impacted by Go To Market channel disruption
• Growth in CALA/Canada 100% organic
• EMEA reflects Tenovis acquisition plus solid organic growth
• APAC includes AGC majority interest plus double digit organic growth
31
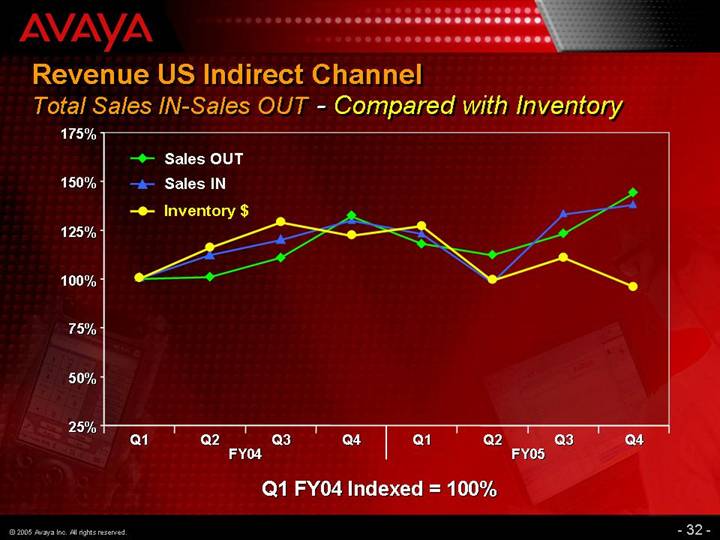
Revenue US Indirect Channel
Total Sales IN-Sales OUT - Compared with Inventory
[CHART]
Q1 FY04 Indexed = 100%
32
Sale of Products
Growth of 12%
[CHART]
Factors
• Positive impact from acquisitions
• Organic growth in EMEA, APAC and CALA
• Go-to-market changes caused disruption in U.S
34
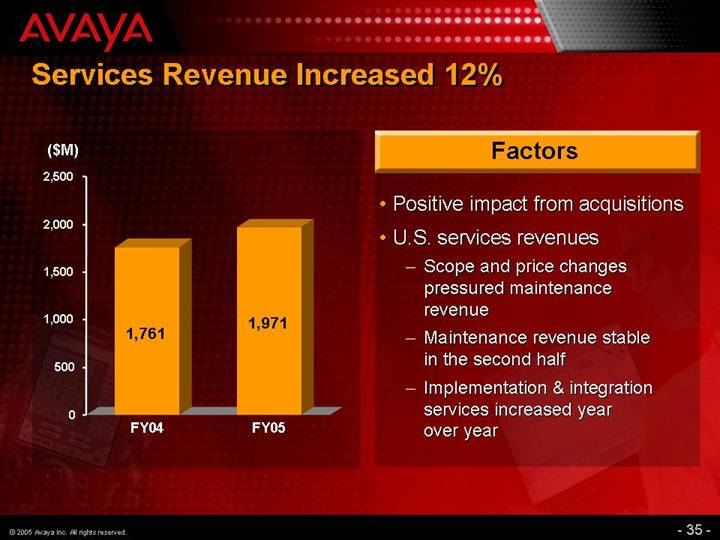
Services Revenue Increased 12%
[CHART]
Factors
• Positive impact from acquisitions
• U.S. services revenues
• Scope and price changes pressured maintenance revenue
• Maintenance revenue stable in the second half
• Implementation & integration services increased year over year
35
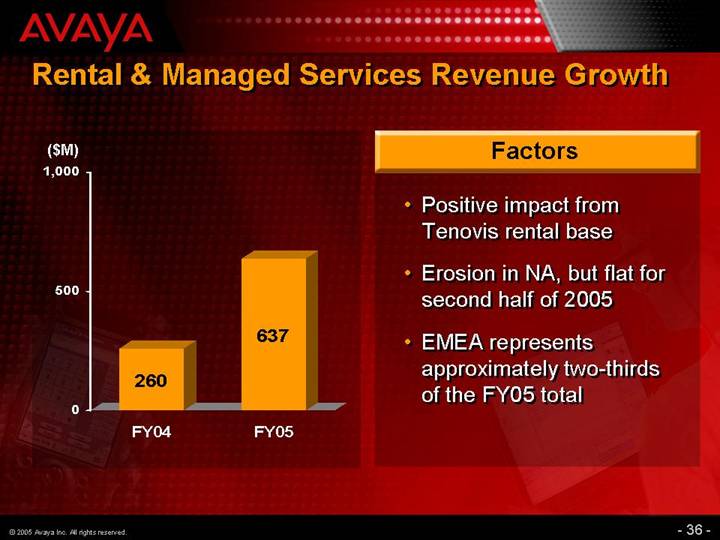
Rental & Managed Services Revenue Growth
[CHART]
Factors
• Positive impact from Tenovis rental base
• Erosion in NA, but flat for second half of 2005
• EMEA represents approximately two-thirds of the FY05 total
36
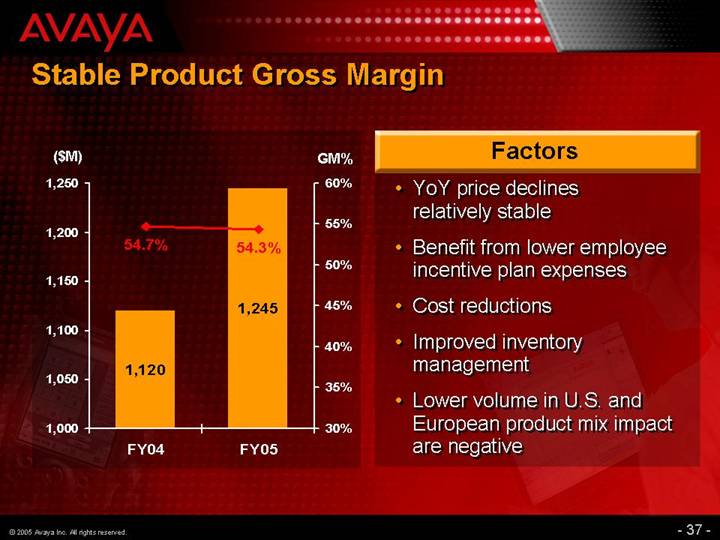
Stable Product Gross Margin
[CHART]
Factors
• YoY price declines relatively stable
• Benefit from lower employee incentive plan expenses
• Cost reductions
• Improved inventory management
• Lower volume in U.S. and European product mix impact are negative
37
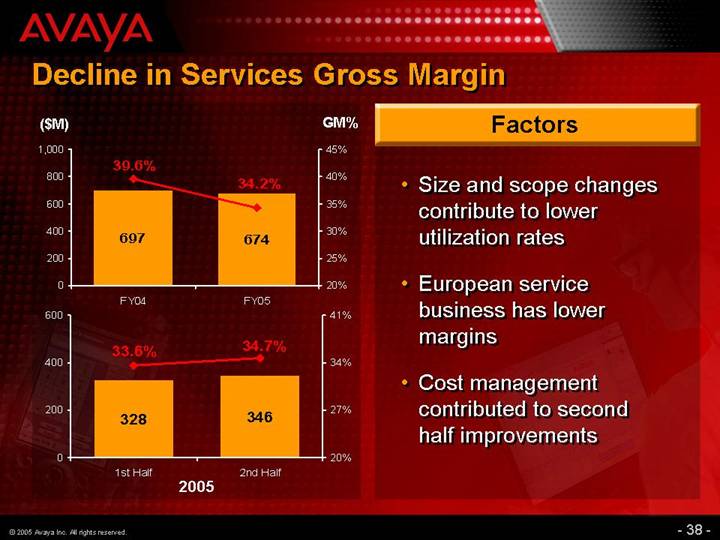
Decline in Services Gross Margin
[CHART]
Factors
• Size and scope changes contribute to lower utilization rates
• European service business has lower margins
• Cost management contributed to second half improvements
38
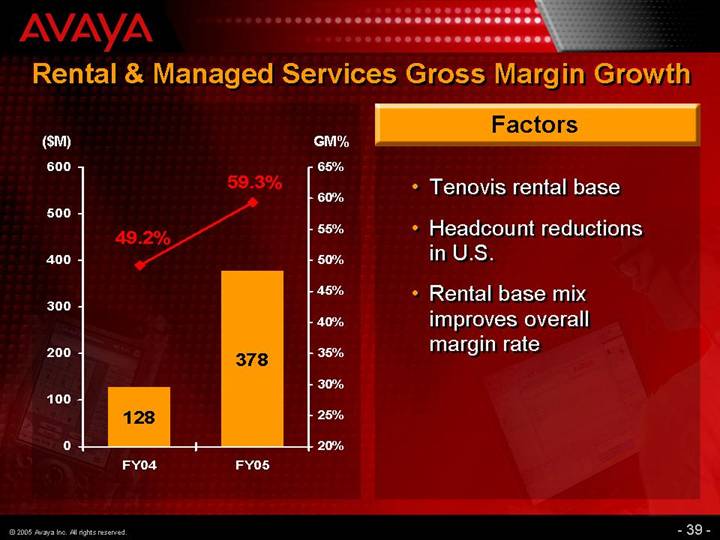
Rental & Managed Services Gross Margin Growth
[CHART]
Factors
• Tenovis rental base
• Headcount reductions in U.S.
• Rental base mix improves overall margin rate
39
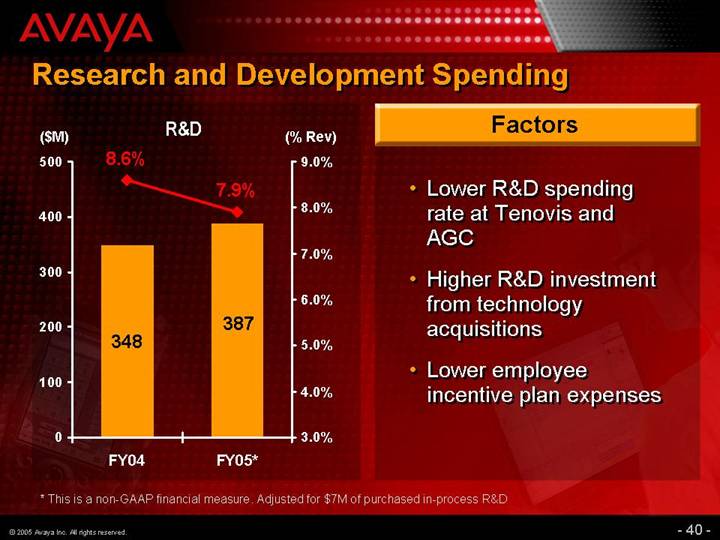
Research and Development Spending
[CHART]
Factors
• Lower R&D spending rate at Tenovis and AGC
• Higher R&D investment from technology acquisitions
• Lower employee incentive plan expenses
* This is a non-GAAP financial measure. Adjusted for $7M of purchased in-process R&D
40
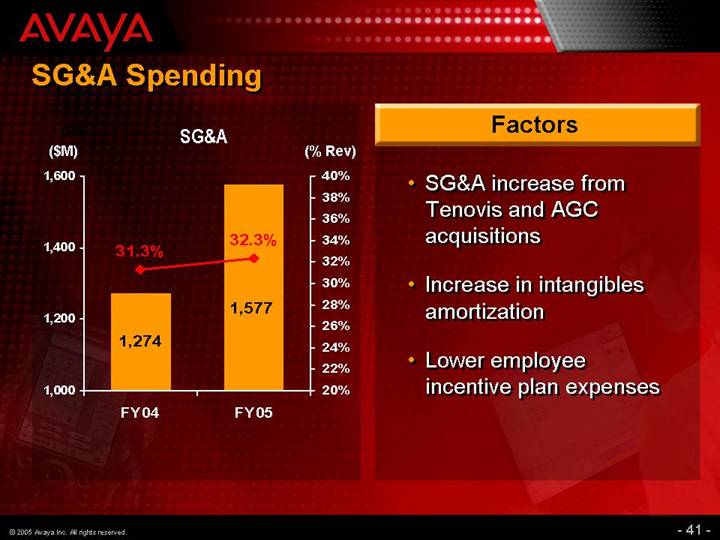
SG&A Spending
SG&A
[CHART]
Factors
• SG&A increase from Tenovis and AGC acquisitions
• Increase in intangibles amortization
• Lower employee incentive plan expenses
41
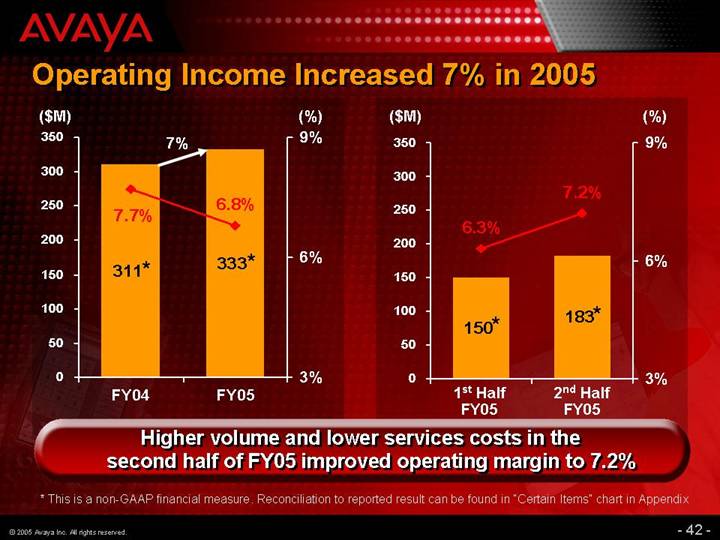
Operating Income Increased 7% in 2005
[CHART]
Higher volume and lower services costs in the
second half of FY05 improved operating margin to 7.2%
* This is a non-GAAP financial measure. Reconciliation to reported result can be found in “Certain Items” chart in Appendix
42
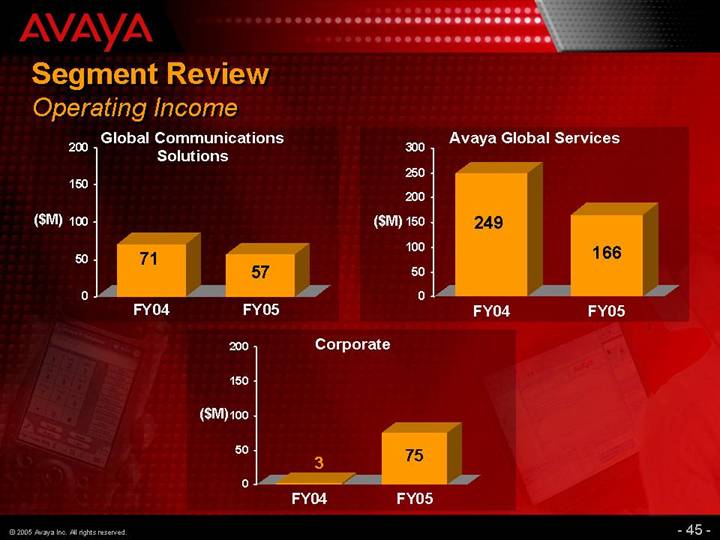
Segment Review
Operating Income
Global Communications
Solutions
[CHART]
Avaya Global Services
[CHART]
Corporate
[CHART]
45
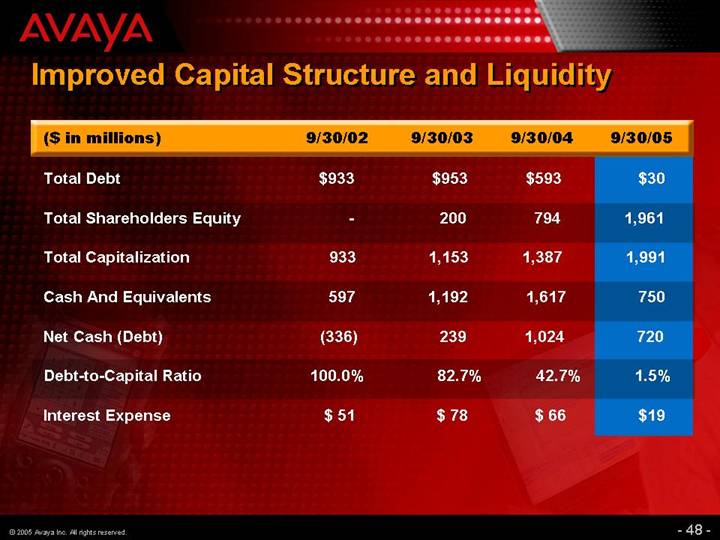
Improved Capital Structure and Liquidity
($ in millions) |
| 9/30/02 |
| 9/30/03 |
| 9/30/04 |
| 9/30/05 |
| ||||
Total Debt |
| $ | 933 |
| $ | 953 |
| $ | 593 |
| $ | 30 |
|
|
|
|
|
|
|
|
|
|
| ||||
Total Shareholders Equity |
| — |
| 200 |
| 794 |
| 1,961 |
| ||||
|
|
|
|
|
|
|
|
|
| ||||
Total Capitalization |
| 933 |
| 1,153 |
| 1,387 |
| 1,991 |
| ||||
|
|
|
|
|
|
|
|
|
| ||||
Cash And Equivalents |
| 597 |
| 1,192 |
| 1,617 |
| 750 |
| ||||
|
|
|
|
|
|
|
|
|
| ||||
Net Cash (Debt) |
| (336 | ) | 239 |
| 1,024 |
| 720 |
| ||||
|
|
|
|
|
|
|
|
|
| ||||
Debt-to-Capital Ratio |
| 100.0 | % | 82.7 | % | 42.7 | % | 1.5 | % | ||||
|
|
|
|
|
|
|
|
|
| ||||
Interest Expense |
| $ | 51 |
| $ | 78 |
| $ | 66 |
| $ | 19 |
|
48
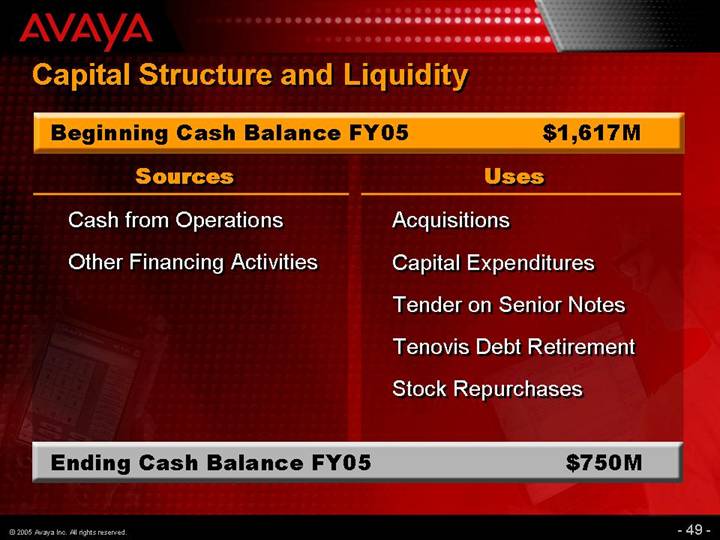
Capital Structure and Liquidity
Beginning Cash Balance FY05 |
| $ | 1,617M |
|
Sources |
| Uses |
|
Cash from Operations |
| Acquisitions |
|
|
|
|
|
Other Financing Activities |
| Capital Expenditures |
|
|
| Tender on Senior Notes |
|
|
| Tenovis Debt Retirement |
|
|
| Stock Repurchases |
|
Ending Cash Balance FY05 |
| $ | 750M |
|
49
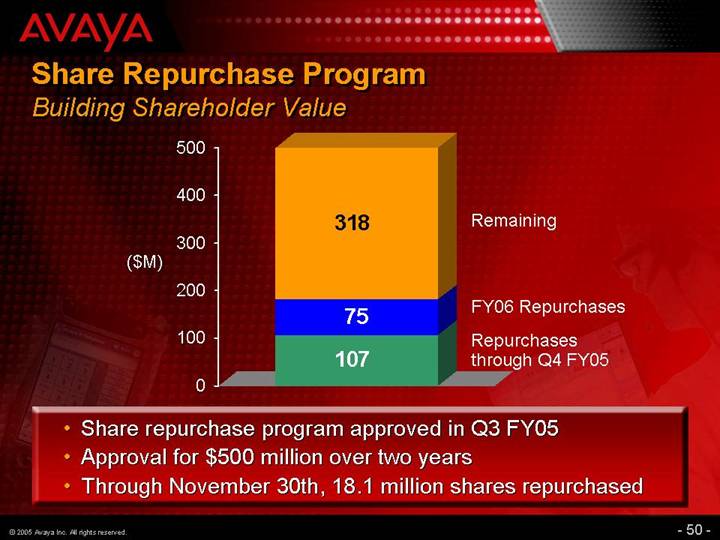
Share Repurchase Program
Building Shareholder Value
[CHART]
• Share repurchase program approved in Q3 FY05
• Approval for $500 million over two years
• Through November 30th, 18.1 million shares repurchased
50
[LOGO]
Summary
• Addressed operational challenges faced in FY2005
• Strengthened sales channels
• Continued to maintain financial discipline company wide
• Performance improved during the second half of the year
• Sustained profitability
• We are a stronger, more competitive company today
• �� Extended geographic reach and footprint
• Better positioned to drive & benefit from IP telephony transition
• Focused on capturing the opportunities ahead and building value for shareholders
© 2005 Avaya Inc. All rights reserved.
51
[GRAPHIC]
Avaya Financial Analyst Conference
Corporate Strategy
Donald K. Peterson
Chairman and CEO
52
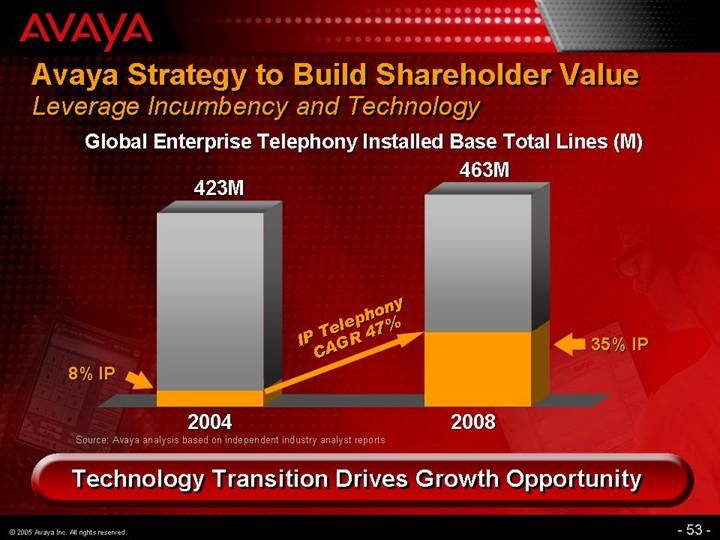
Avaya Strategy to Build Shareholder Value
Leverage Incumbency and Technology
Global Enterprise Telephony Installed Base Total Lines (M)
[CHART]
Source: Avaya analysis based on independent industry analyst reports
Technology Transition Drives Growth Opportunity
53
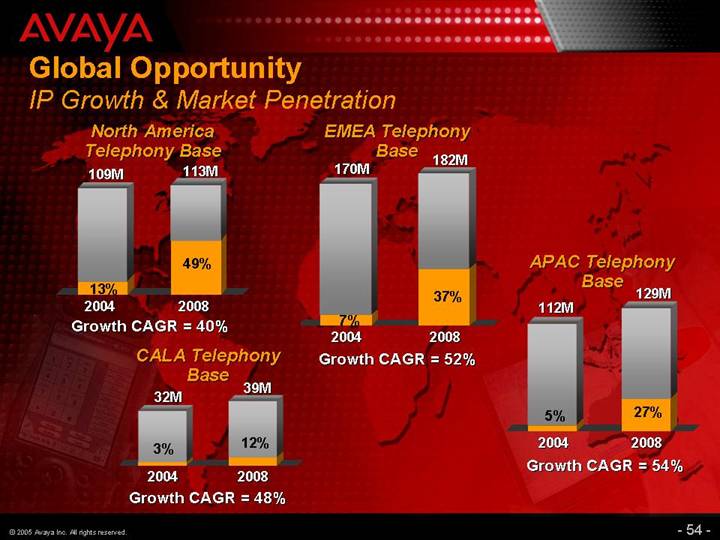
Global Opportunity
IP Growth & Market Penetration
North America Telephony Base
[CHART]
Growth CAGR = 40%
EMEA Telephony Base
[CHART]
Growth CAGR = 52%
CALA Telephony Base
[CHART]
Growth CAGR = 48%
APAC Telephony Base
[CHART]
Growth CAGR = 54%
54
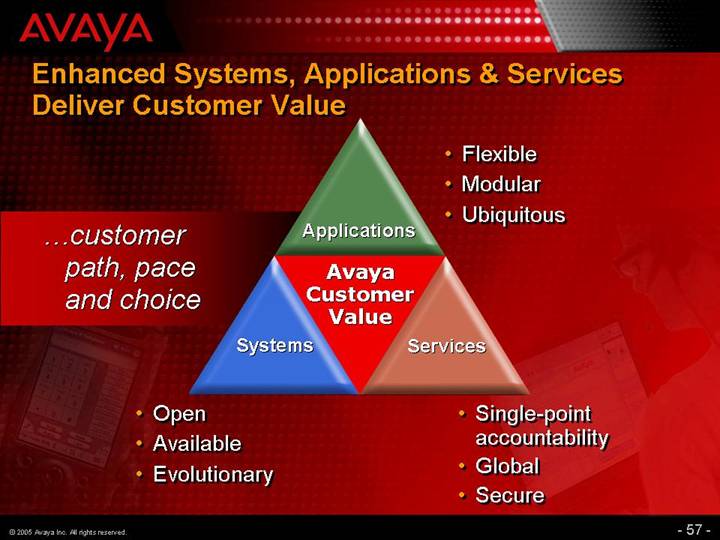
Enhanced Systems, Applications & Services
Deliver Customer Value
...customer path, pace and choice
Avaya Customer Value
Applications
• Flexible
• Modular
• Ubiquitous
Services
• Single-point accountability
• Global
• Secure
Systems
• Open
• Available
• Evolutionary
57
Competitive Advantages
• Global size and scale
• Technology and applications leadership
• Vision and roadmap for the future of enterprise telephony
• Current customers
• New customers
• Unmatched portfolio of products and services offerings
58
[GRAPHIC]
Avaya Financial Analyst Conference
Global Communications Solutions
Michael Thurk
SVP and President,
Global Communications Solutions
59
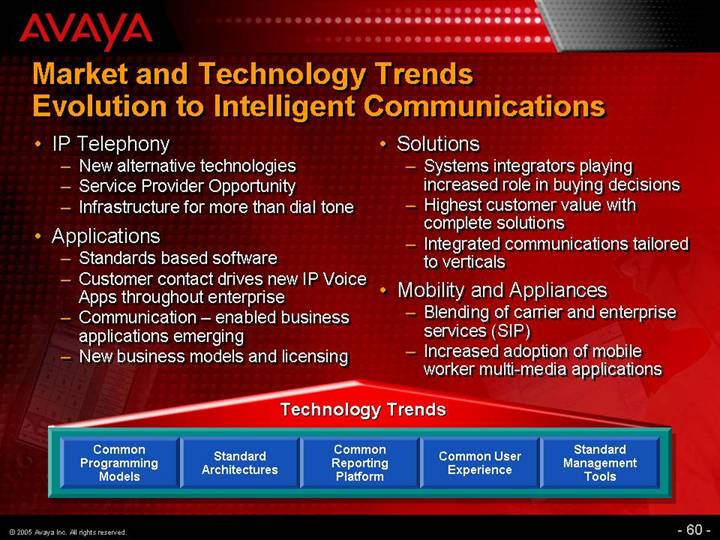
Market and Technology Trends
Evolution to Intelligent Communications
• IP Telephony
• New alternative technologies
• Service Provider Opportunity
• Infrastructure for more than dial tone
• Applications
• Standards based software
• Customer contact drives new IP Voice Apps throughout enterprise
• Communication – enabled business applications emerging
• New business models and licensing
• Solutions
• Systems integrators playing increased role in buying decisions
• Highest customer value with complete solutions
• Integrated communications tailored to verticals
• Mobility and Appliances
• Blending of carrier and enterprise services (SIP)
• Increased adoption of mobile worker multi-media applications
Technology Trends
Common |
| Standard |
| Common |
| Common User |
| Standard |
60
Avaya Product Directions
• Continue to enhance current offerings in IPtel, Applications, Appliances and Mobility
• Continue to invest in security and management
• Invest in low end offers for SMB, branch and peer to peer
• Services Oriented Architecture (SOA) to allow for easier integration of communications into business processes
• Open APIs and SIP at all levels of the architecture
• Partnerships to provide solutions and for the integration of communications into business processes (eg. SAP)
61
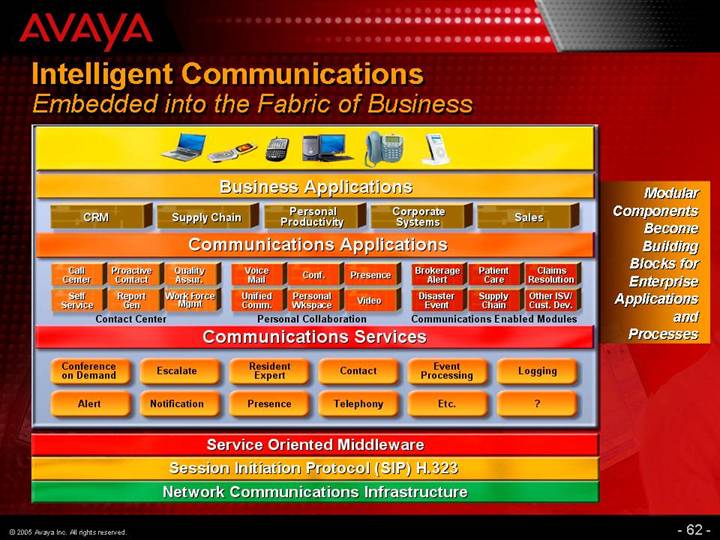
Intelligent Communications
Embedded into the Fabric of Business
[GRAPHIC]
Modular Components Become Building Blocks for Enterprise Applications and Processes
62
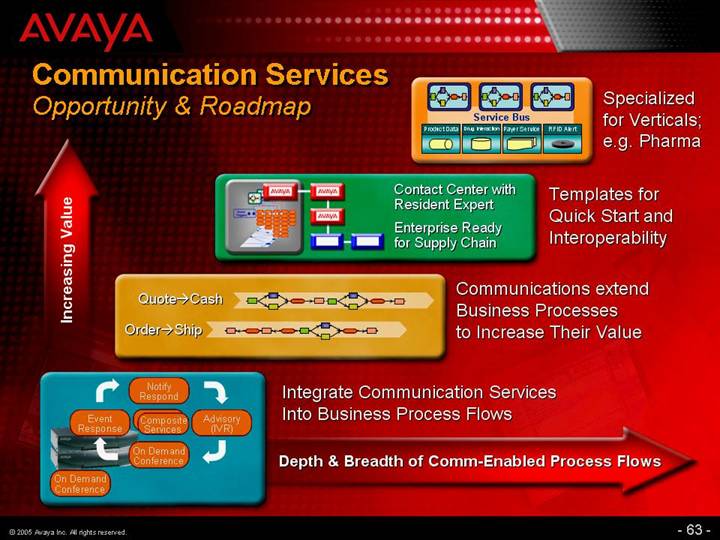
Communication Services
Opportunity & Roadmap
Increasing Value
[GRAPHIC] |
| Specialized |
|
|
|
[GRAPHIC] |
| Templates for |
|
|
|
[GRAPHIC] |
| Communications extend |
|
|
|
[GRAPHIC] |
| Integrate Communication Services |
Depth & Breadth of Comm-Enabled Process Flows
63
CY06 Roadmap Highlights
• Nimcat Networks (building peer-to-peer communications systems)
• Products in CY06
• Assured Networks (real time network performance)
• Applications Enhancements
• Voice Portal V3.0 shipping on Websphere
• New Releases in Messaging, Assisted Service and Proactive Contact
• SIP and VPN based services
• Tenovis Product Integration with Avaya Platforms
• SMB IP Office 3.1 shipping
• I55 Tenovis interoperability and migration
• New Releases of Communication Manager for branch offers, security, resiliency and scale
• Mobility and New End Point Releases
64
Partnerships
• DEVconnect Partners to enhance solutions offers
• Increasing number of strategic alliances
[LOGO]
65
Longer Term Directions
• Creation of Intelligent Enterprise
• Mobility
• Standards (SIP)
• Services Oriented Architecture
• Solutions Orientation
• Critical Ingredients
• Security
• Scalability
• Highest Reliability
• Value Added Applications and ISVs
• Partnerships
66
[GRAPHIC]
Avaya Financial Analyst Conference
Avaya Global Services
Fran Scricco
SVP and President,
Avaya Global Services
67
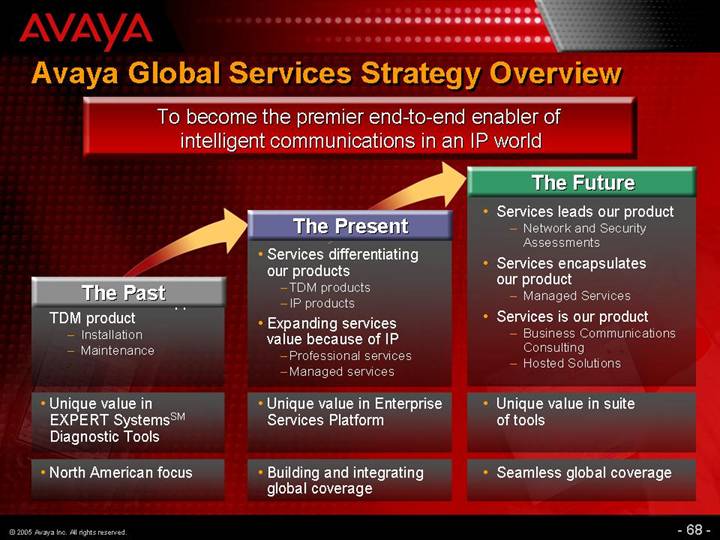
Avaya Global Services Strategy Overview
To become the premier end-to-end enabler of intelligent communications in an IP world
The Past
TDM product
• Installation
• Maintenance
• Unique value in EXPERT SystemsSM Diagnostic Tools
• North American focus
The Present
• Services differentiating our products
• TDM products
• IP products
• Expanding services value because of IP
• Professional services
• Managed services
• Unique value in Enterprise Services Platform
• Building and integrating global coverage
The Future
• Services leads our product
• Network and Security Assessments
• Services encapsulates our product
• Managed Services
• Services is our product
• Business Communications Consulting
• Hosted Solutions
• Unique value in suite of tools
• Seamless global coverage
68
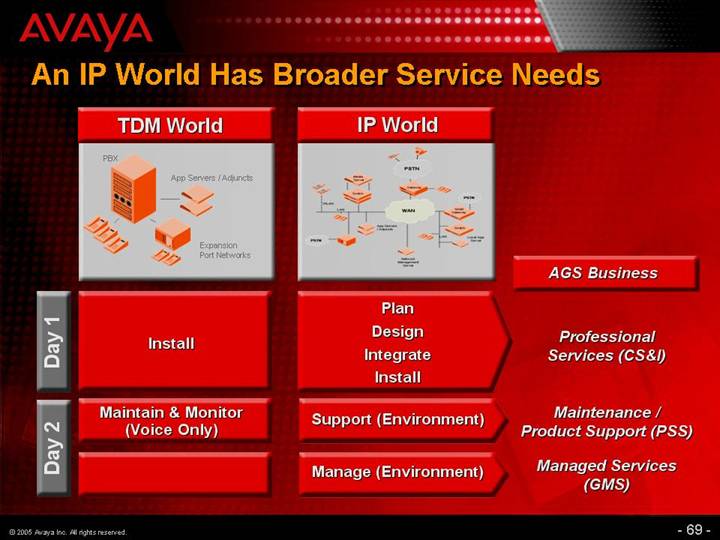
An IP World Has Broader Service Needs
|
| TDM World |
| IP World |
| AGS Business |
|
| [GRAPHIC] |
| [GRAPHIC] |
|
|
Day 1 |
| Install |
| Plan Design Integrate Install |
| Professional Services (CS&I) |
Day 2 |
| Maintain & Monitor (Voice Only) |
| Support (Environment) |
| Maintenance / Product Support (PSS) |
|
|
|
| Manage (Environment) |
| Managed Services (GMS) |
69
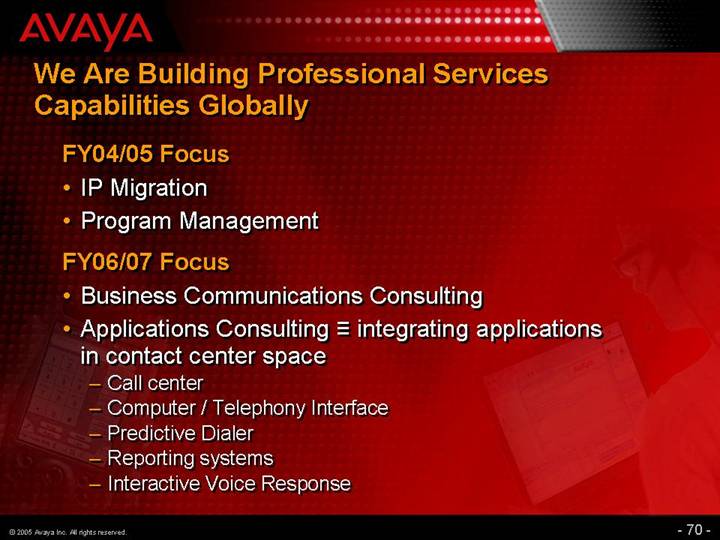
We Are Building Professional Services Capabilities Globally
FY04/05 Focus
• IP Migration
• Program Management
FY06/07 Focus
• Business Communications Consulting
• Applications Consulting = integrating applications in contact center space
• Call center
• Computer / Telephony Interface
• Predictive Dialer
• Reporting systems
• Interactive Voice Response
70
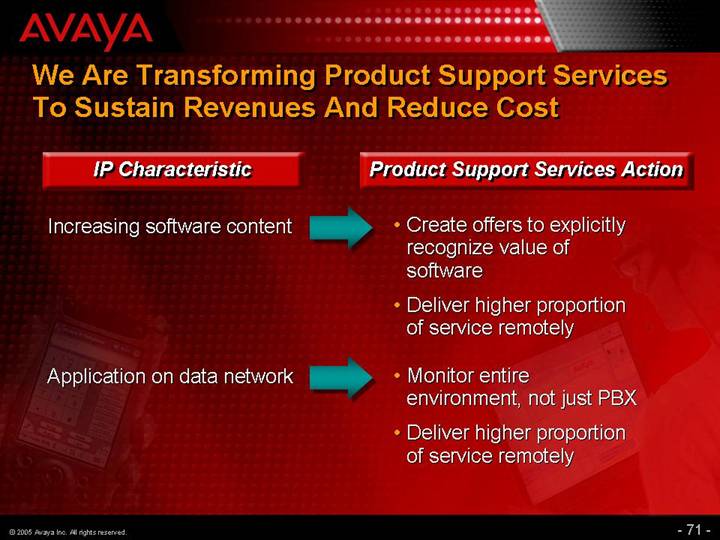
We Are Transforming Product Support Services To Sustain Revenues And Reduce Cost
IP Characteristic |
| Product Support Services Action |
|
|
|
Increasing software content |
| • Create offers to explicitly recognize value of software |
|
| • Deliver higher proportion of service remotely |
|
|
|
Application on data network |
| • Monitor entire environment, not just PBX |
|
| • Deliver higher proportion of service remotely |
71
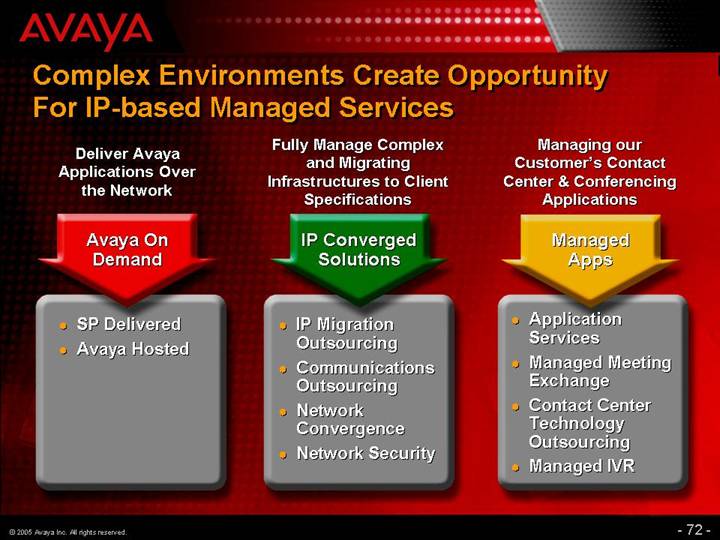
Complex Environments Create Opportunity For IP-based Managed Services
Deliver Avaya Applications Over the Network
Avaya On Demand
• SP Delivered
• Avaya Hosted
Fully Manage Complex and Migrating Infrastructures to Client Specifications
IP Converged Solutions
• IP Migration Outsourcing
• Communications Outsourcing
• Network Convergence
• Network Security
Managing our Customer’s Contact Center & Conferencing Applications
Managed Apps
• Application Services
• Managed Meeting Exchange
• Contact Center Technology Outsourcing
• Managed IVR
72
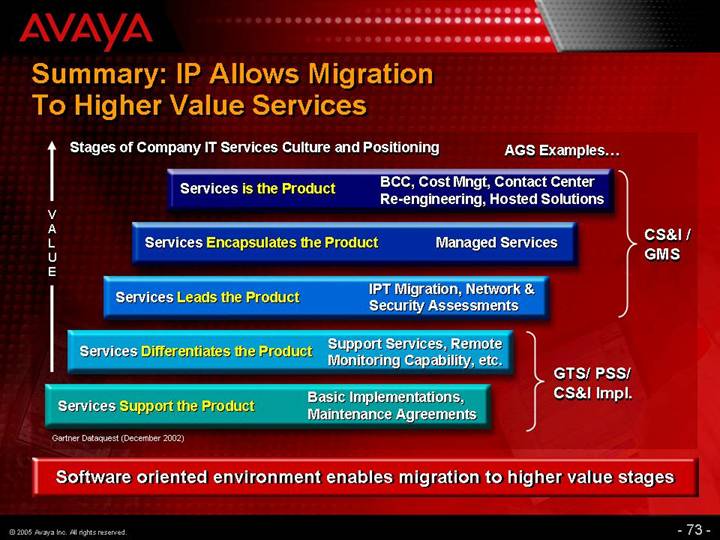
Summary: IP Allows Migration To Higher Value Services
V | Stages of Company IT Services Culture and Positioning | AGS Examples... | |||||
|
|
| |||||
Services is the Product | BCC, Cost Mngt, Contact Center | CS&I / | |||||
|
| ||||||
Services Encapsulates the Product | Managed Services | ||||||
|
| ||||||
Services Leads the Product | IPT Migration, Network & | ||||||
|
|
| |||||
Services Differentiates the Product | Support Services, Remote | GTS/ PSS/ | |||||
|
|
| |||||
Services Support the Product | Basic Implementations, | ||||||
Gartner Dataquest (December 2002)
Software oriented environment enables migration to higher value stages
73
[GRAPHIC]
Avaya Financial Analyst Conference
Global Sales and Marketing
Lou D’Ambrosio
SVP and President,
Global Sales and Marketing
74
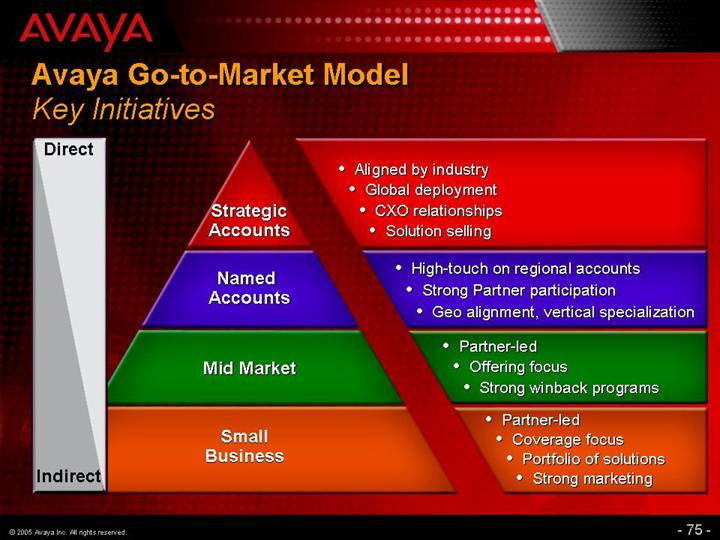
Avaya Go-to-Market Model
Key Initiatives
Direct |
|
|
| Strategic | • Aligned by industry |
| • Global deployment | |
| • CXO relationships | |
| • Solution selling | |
|
|
|
| Named | • High-touch on regional accounts |
| • Strong Partner participation | |
| • Geo alignment, vertical specialization | |
|
|
|
| Mid Market | • Partner-led |
| • Offering focus | |
| • Strong winback programs | |
|
|
|
| Small | • Partner-led |
| • Coverage focus | |
| • Portfolio of solutions | |
| • Strong marketing | |
Indirect |
|
|
75
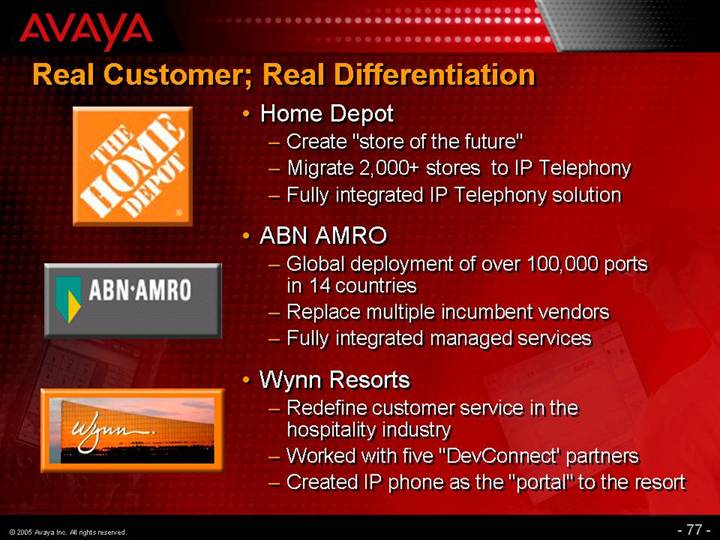
Real Customer; Real Differentiation
[LOGO]
• Home Depot
• Create “store of the future”
• Migrate 2,000+ stores to IP Telephony
• Fully integrated IP Telephony solution
[LOGO]
• ABN AMRO
• Global deployment of over 100,000 ports in 14 countries
• Replace multiple incumbent vendors
• Fully integrated managed services
[LOGO]
• Wynn Resorts
• Redefine customer service in the hospitality industry
• Worked with five “DevConnect’ partners
• Created IP phone as the “portal” to the resort
77
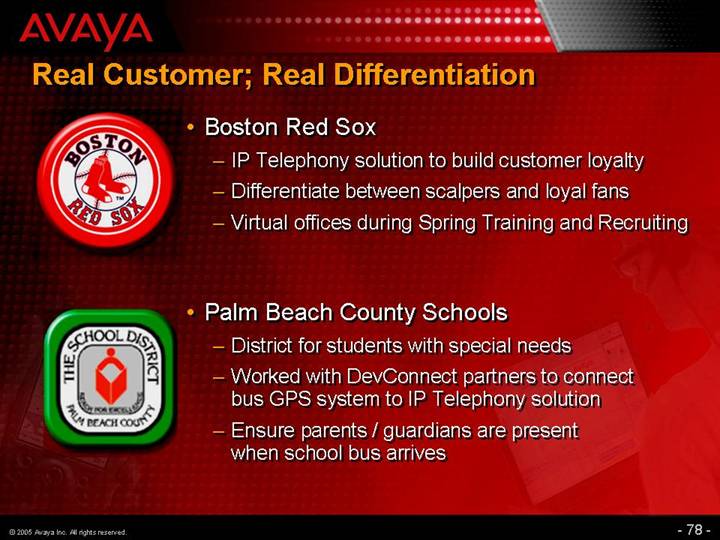
Real Customer; Real Differentiation
[LOGO]
• Boston Red Sox
• IP Telephony solution to build customer loyalty
• Differentiate between scalpers and loyal fans
• Virtual offices during Spring Training and Recruiting
[LOGO]
• Palm Beach County Schools
• District for students with special needs
• Worked with DevConnect partners to connect bus GPS system to IP Telephony solution
• Ensure parents / guardians are present when school bus arrives
78
[GRAPHIC]
Avaya Financial Analyst Conference
Financial Strategy and Goals
Garry K. McGuire
CFO and SVP, Corporate Development
80
Forward Looking Statements
This presentation contains forward-looking statements within the meaning of the safe harbor provisions of the Private Securities Litigation Reform Act of 1995. Forward-looking statements give our current expectations or forecasts of future events. Actual future results may vary materially. They can be affected by inaccurate assumptions we might make or by known or unknown risks and uncertainties. Consequently, no forward-looking statement can be guaranteed and you are cautioned not to place undue reliance on these forward-looking statements.
The risks and uncertainties referred to above include, but are not limited to: price and product competition; rapid or disruptive technological development, including the effects of the technology shift from traditional TDM to IP telephony; dependence on new product development; the mix of our products and services; customer demand for our products and services, including risks specifically associated with the services business and, in particular, the maintenance and rental and managed services lines of business, primarily due to renegotiations of customer contracts and changes in scope, pricing pressures and cancellations; general industry and market conditions and growth rates and general domestic and international economic conditions including interest rate and currency exchange rate fluctuations; disruption associated with the re-alignment of our sales and marketing efforts; risks related to inventory, including warranty costs, obsolescence charges, excess capacity, material and labor costs, and our distributors’ decisions regarding their own inventory level; the economic, political and other risks associated with international sales and operations, including increased exposure to currency fluctuations and to European economies as a result of our acquisition of Tenovis; the ability to successfully integrate acquired companies, including Tenovis, which has required significant management time and attention; the ability to attract and retain qualified employees; control of costs and expenses; U.S. and non-U.S. government regulation; and the ability to form and implement alliances.
For a further list and description of such risks and uncertainties, see the reports filed by Avaya with the SEC, which are available at www.sec.gov, particularly the information contained in Part II, Item 7, entitled “Forward Looking Statements”, of our fiscal 2004 Form 10-K and the information contained in Part I, Item 2, entitled “Forward Looking Statements”, of our Form 10-Q for the fiscal quarter ended June 30, 2005. Avaya disclaims any intention or obligation to update or revise any forward-looking statements, whether as a result of new information, future events or otherwise.
Presentation: Unless indicated otherwise, all results are presented in accordance with accounting principles generally accepted in the United States (GAAP).
81
Discussion Points
• Key Financial Themes for FY’06 and Beyond
• Economic and Market Environment
• Major Drivers of Performance in FY’06
• Balance Sheet Goals
• Corporate Development Framework
82
Key Financial Themes for FY’06 and Beyond
• Drive toward double-digit operating margins
• Generate significant operating cash flow
• Continued investment in software to strengthen applications leadership
• Maintain strong balance sheet
• Continue share repurchases to deliver shareholder value
83
CIO Priorities
• Out of more than 30 IT spending alternatives, VoIP ranked 6th, up from 9th, in a survey of CIOs
• 74% of enterprises in North America and 60% in Europe have deployed, are deploying or are evaluating plans to deploy IP Telephony
• Once IP Telephony deployed, companies expect to invest in applications, endpoints and services to maximize the value of IP Telephony infrastructure
Sources: Goldman Sachs survey, Forrester Research, internal Avaya research
87
FY06 Trends: Revenue
• Targeting increased product sales in all regions
• Resumption of growth in US
• Growth in Europe, even with the adjustment for the pre-acquisition stub period
• Higher growth rates in APAC and CALA
• Services revenue flat, with international maintenance growth partially offsetting decline in U.S.
• Focused on stabilizing U.S. maintenance revenue
• Rental and managed services
• Expand managed services offerings in Europe
• Mitigate erosion in European rental base
• Focus on reversing decline in U.S.
Note: Assumes constant currency
89
Items Impacting YoY Cost Structure
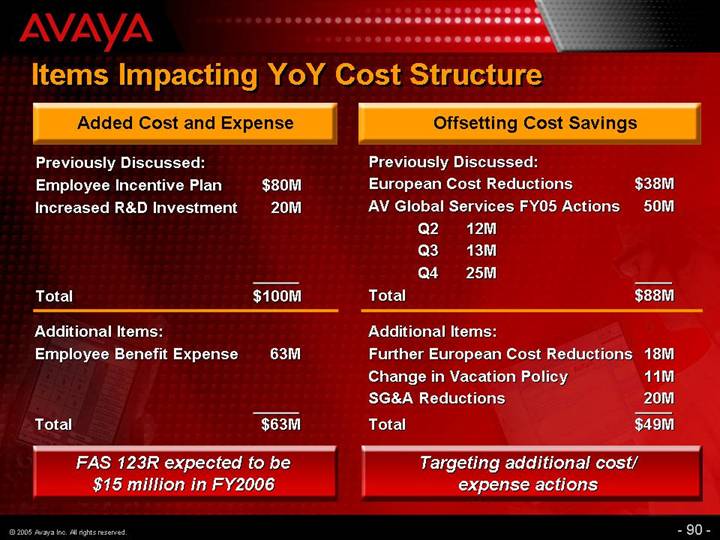
Added Cost and Expense
Previously Discussed: |
|
|
| |
Employee Incentive Plan |
| $ | 80 | M |
Increased R&D Investment |
| 20 | M | |
|
|
|
| |
Total |
| $ | 100 | M |
|
|
|
| |
Additional Items: |
|
|
| |
Employee Benefit Expense |
| 63 | M | |
|
|
|
| |
Total |
| $ | 63 | M |
FAS 123R expected to be $15 million in FY2006
Offsetting Cost Savings
Previously Discussed: |
|
|
| ||||
European Cost Reductions |
| $ | 38 | M | |||
AV Global Services FY05 Actions |
| 50 | M | ||||
| Q2 | 12 | M |
|
|
| |
| Q3 | 13 | M |
|
|
| |
| Q4 | 25 | M |
|
|
| |
Total |
| $ | 88 | M | |||
|
|
|
| ||||
Additional Items: |
|
|
| ||||
Further European Cost Reductions |
| 18 | M | ||||
Change in Vacation Policy |
| 11 | M | ||||
SG&A Reductions |
| 20 | M | ||||
Total |
| $ | 49 | M | |||
Targeting additional cost/expense actions
90
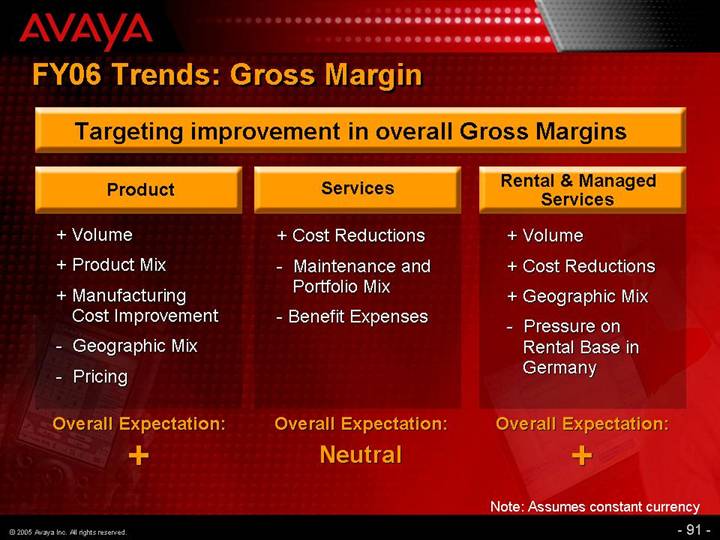
FY06 Trends: Gross Margin
Targeting improvement in overall Gross Margins
Product |
| Services |
| Rental & Managed Services |
|
|
|
|
|
+ Volume |
| + Cost Reductions |
| + Volume |
+ Product Mix |
| - Maintenance and Portfolio Mix |
| + Cost Reductions |
+ Manufacturing Cost Improvement |
| - Benefit Expenses |
| + Geographic Mix |
- Geographic Mix |
|
|
| - Pressure on Rental Base in Germany |
- Pricing |
|
|
|
|
|
|
|
|
|
Overall Expectation: |
| Overall Expectation: |
| Overall Expectation: |
+ |
| Neutral |
| + |
Note: Assumes constant currency
91
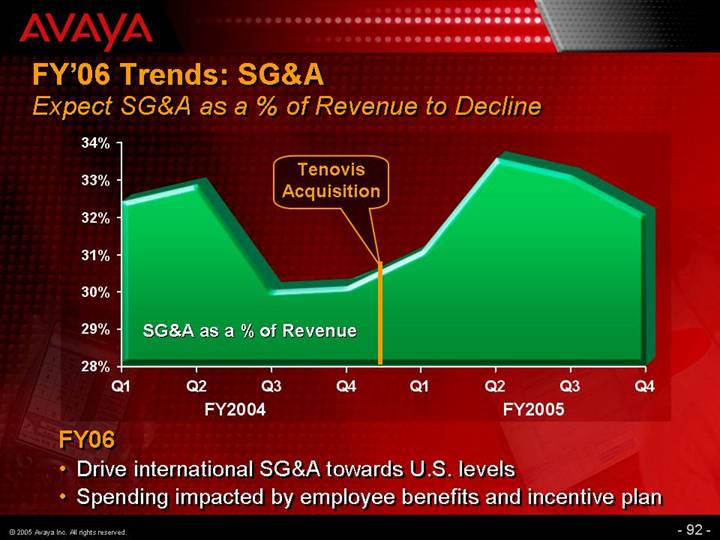
FY’06 Trends: SG&A
Expect SG&A as a % of Revenue to Decline
[CHART]
FY06
• Drive international SG&A towards U.S. levels
• Spending impacted by employee benefits and incentive plan
92
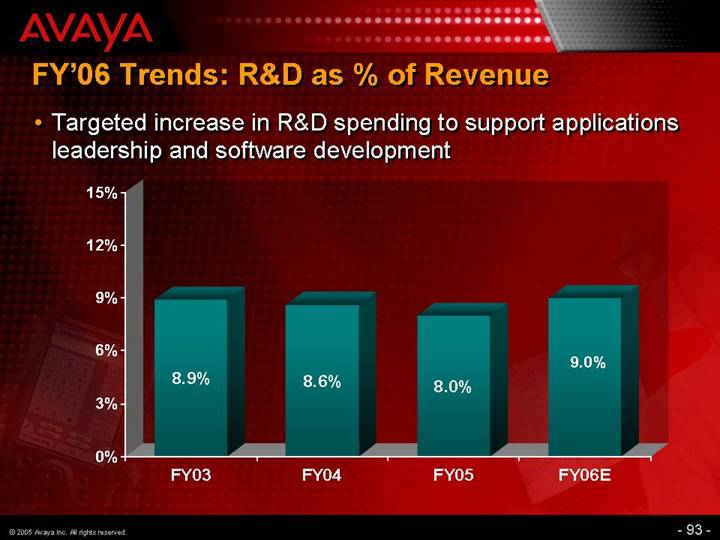
FY’06 Trends: R&D as % of Revenue
• Targeted increase in R&D spending to support applications leadership and software development
[CHART]
93
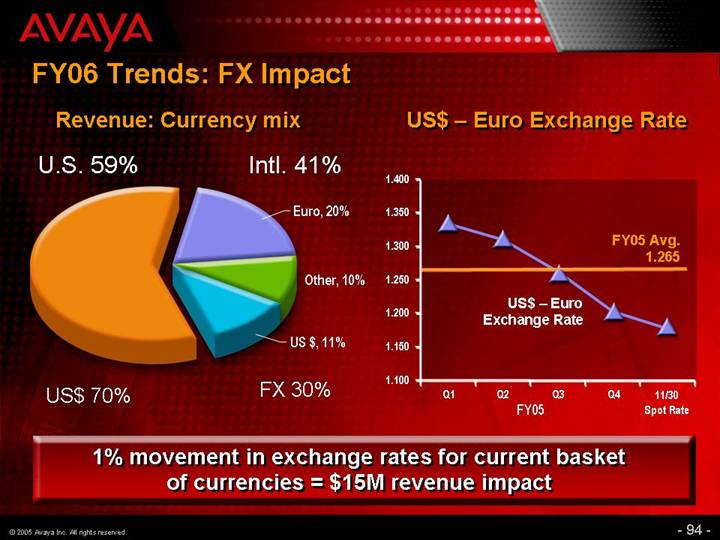
FY06 Trends: FX Impact
Revenue: Currency mix
[CHART]
US$ – Euro Exchange Rate
[CHART]
1% movement in exchange rates for current basket of currencies = $15M revenue impact
94
Balance Sheet Goals
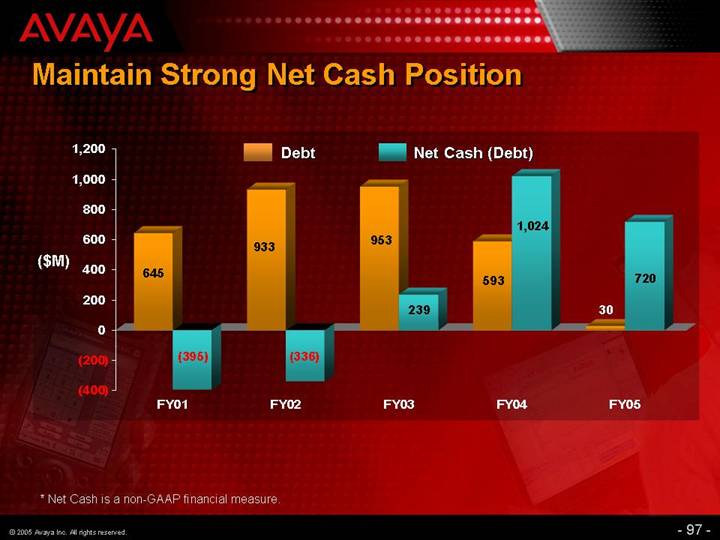
• Maintain a strong net cash position
• Improve credit rating – ultimate goal is investment grade
• Call remaining senior notes
• Improve DSO
• Improve inventory turnover
96
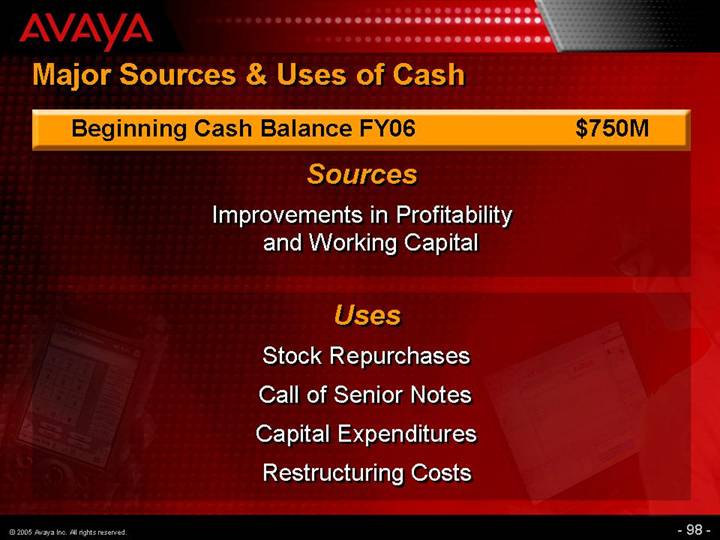
Major Sources & Uses of Cash
Beginning Cash Balance FY06 |
| $ | 750 | M |
Sources
Improvements in Profitability and Working Capital
Uses
Stock Repurchases
Call of Senior Notes
Capital Expenditures
Restructuring Costs
98
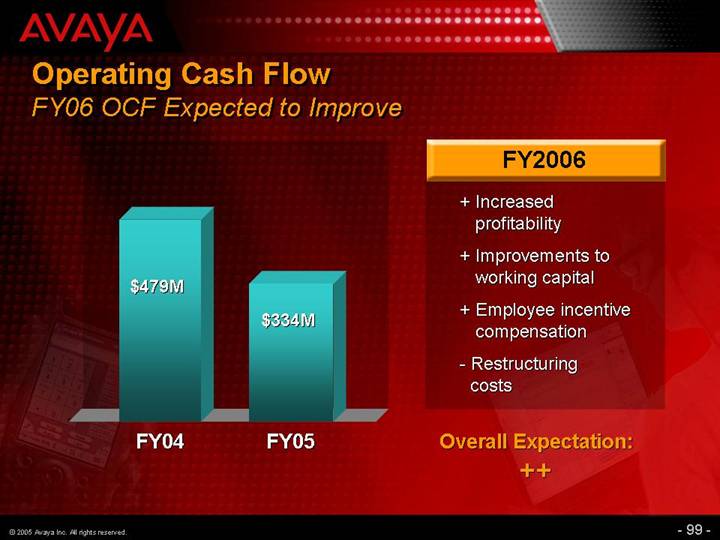
Operating Cash Flow
FY06 OCF Expected to Improve
[CHART]
FY2006
+ Increased profitability
+ Improvements to working capital
+ Employee incentive compensation
- Restructuring costs
Overall Expectation:
++
99
Tax
• Reversed valuation allowance in FY05 on a portion of deferred tax assets related U.S. Federal net operating losses. Tax provision for FY06 will be recorded on financial statements
• Effective tax rate for FY 06 in 36% to 38% range
• Higher rate in the first half, improving during the year
• As a result of our $1 billion in U.S. Federal net operating losses, Avaya will not pay cash taxes on U.S. taxable income until such tax net operating losses are fully utilized
• Cash will be paid for required alternative minimum tax and certain state, local and foreign taxes
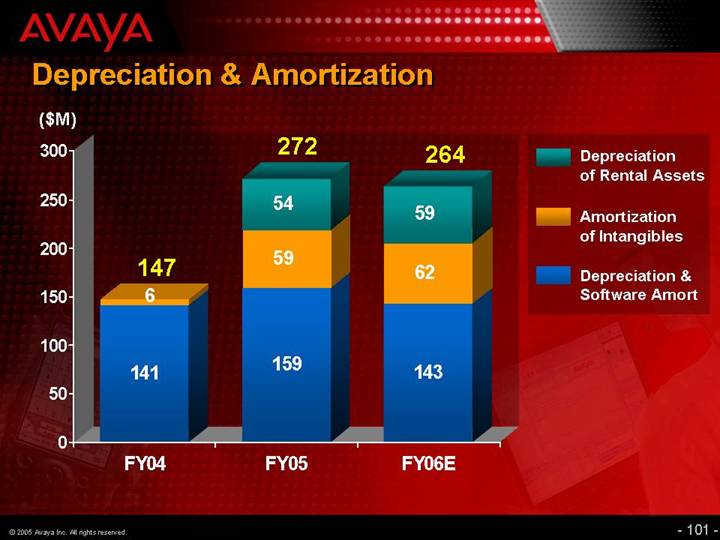
100
Corporate Development
• M&A Strategy to date
• Focus primarily on “tuck-in” acquisitions that can be quickly and seamlessly integrated
• Strengthen / complement applications portfolio
• Support development of professional services capabilities
• Extend / strengthen footprint
• Goal of minimal dilution in first year; neutral or positive to earnings beginning in second year
102
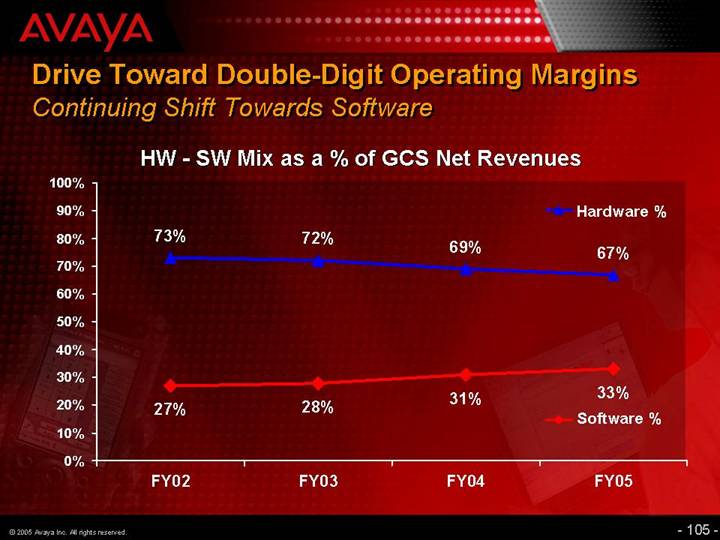
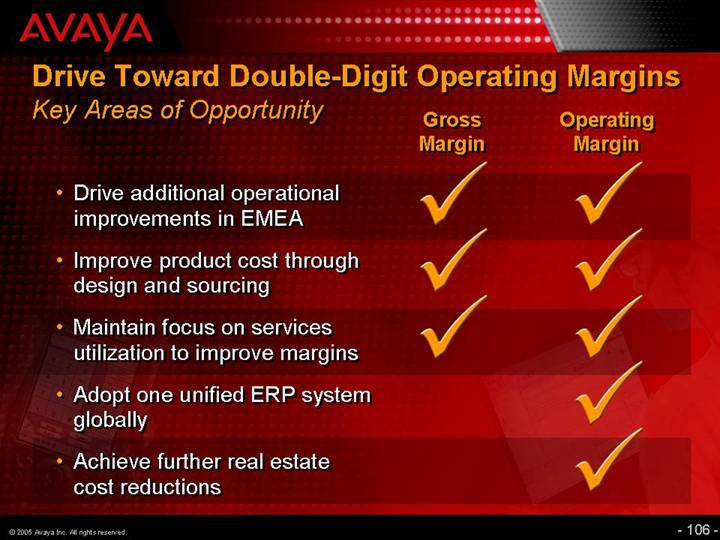
Drive Toward Double-Digit Operating Margins
Revenue Goals
• Solid growth in sales of products
• Continue to capitalize on technology transition
• Migrate Europe telephony base to IP
• Growth in applications software
• Accelerate SMB sales (IP Office, Nimcat)
• Growth in rental and managed services
• Migration of rental base to managed services
• Growth in managed services through partnerships & alliances
• Stabilize services revenue
104
Key Areas of Opportunity
|
| Gross |
| Operating |
|
|
|
|
|
|
|
• Drive additional operational improvements in EMEA |
| ý |
| ý |
|
|
|
|
|
|
|
• Improve product cost through design and sourcing |
| ý |
| ý |
|
|
|
|
|
|
|
• Maintain focus on services utilization to improve margins |
| ý |
| ý |
|
|
|
|
|
|
|
• Adopt one unified ERP system globally |
|
|
| ý |
|
|
|
|
|
|
|
• Achieve further real estate cost reductions |
|
|
| ý |
|
106
Summary
• Technology transition provides global market opportunity
• Clear strategy, strong positioning & competitive advantages
• Applications are a key driver & differentiator
• Drive toward double-digit operating margins
• Generate significant operating cash flow
• Maintain strong balance sheet
• Commitment to building shareholder value
107
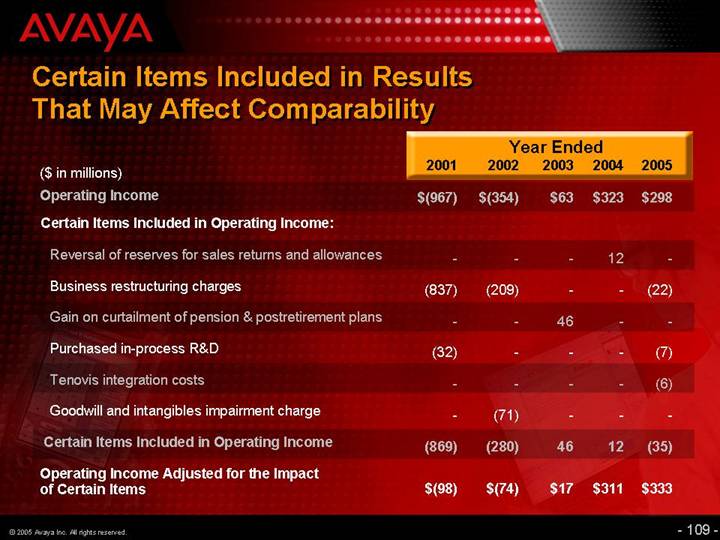
Certain Items Included in Results That May Affect Comparability
|
| Year Ended |
| |||||||||||||
($ in millions) |
| 2001 |
| 2002 |
| 2003 |
| 2004 |
| 2005 |
| |||||
Operating Income |
| $ | (967 | ) | $ | (354 | ) | $ | 63 |
| $ | 323 |
| $ | 298 |
|
Certain Items Included in Operating Income: |
|
|
|
|
|
|
|
|
|
|
| |||||
Reversal of reserves for sales returns and allowances |
| — |
| — |
| — |
| 12 |
| — |
| |||||
Business restructuring charges |
| (837 | ) | (209 | ) | — |
| — |
| (22 | ) | |||||
Gain on curtailment of pension & postretirement plans |
| — |
| — |
| 46 |
| — |
| — |
| |||||
Purchased in-process R&D |
| (32 | ) | — |
| — |
| — |
| (7 | ) | |||||
Tenovis integration costs |
| — |
| — |
| — |
| — |
| (6 | ) | |||||
Goodwill and intangibles impairment charge |
| — |
| (71 | ) | — |
| — |
| — |
| |||||
Certain Items Included in Operating Income |
| (869 | ) | (280 | ) | 46 |
| 12 |
| (35 | ) | |||||
Operating Income Adjusted for the Impact of Certain Items |
| $ | (98 | ) | $ | (74 | ) | $ | 17 |
| $ | 311 |
| $ | 333 |
|
109