

Searchable text section of graphics shown above
Forward Looking Statements
This presentation contains forward-looking statements within the meaning of the safe harbor provisions of the Private Securities Litigation Reform Act of 1995. Forward-looking statements give our current expectations or forecasts of future events. Actual future results may vary materially. They can be affected by inaccurate assumptions we might make or by known or unknown risks and uncertainties. Consequently, no forward-looking statement can be guaranteed and you are cautioned not to place undue reliance on these forward-looking statements.
The risks and uncertainties referred to above include, but are not limited to: price and product competition; rapid or disruptive technological development, including the effects of the technology shift from traditional TDM to IP telephony; dependence on new product development; the mix of our products and services; customer demand for our products and services, including risks specifically associated with the services business and, in particular, the maintenance and rental and managed services lines of business, primarily due to renegotiations of customer contracts and changes in scope, pricing pressures and cancellations; general industry and market conditions and growth rates and general domestic and international economic conditions including interest rate and currency exchange rate fluctuations; risks related to inventory, including warranty costs, obsolescence charges, excess capacity, material and labor costs, and our distributors’ decisions regarding their own inventory level; the economic, political and other risks associated with international sales and operations, including increased exposure to currency fluctuations and to European economies as a result of our acquisition of Tenovis; the ability to successfully integrate acquired companies, including Tenovis, which has required significant management time and attention; the ability to attract and retain qualified employees; control of costs and expenses; U.S. and non-U.S. government regulation; and the ability to form and implement alliances.
For a further list and description of such risks and uncertainties, see the reports filed by Avaya with the SEC, which are available at www.sec.gov, particularly the information contained in Part I, Item 1, entitled “Forward Looking Statements”, of our fiscal 2005 Form 10-K. Avaya disclaims any intention or obligation to update or revise any forward-looking statements, whether as a result of new information, future events or otherwise.
Presentation: Unless indicated otherwise, all results are presented in accordance with accounting principles generally accepted in the United States (GAAP).
2
Q1 FY2006 Results
Financial Summary
• Revenues grew 8.8% year over year
• Product sales rose 6.7%
• Rental and managed services increased 34%
• Services grew 5%
• On a constant currency basis the revenue growth was 10.8%
• Adjusted for the Tenovis pre-acquisition stub period last year, revenue increased 1.6%
• Gross margin was flat at 47.2% compared with 47.3% a year ago
• Operating income was $107 million
• Includes a $21 million benefit from vacation policy change
• Cash flow from operations was $106 million
• Cash position of $726 million remains strong
3
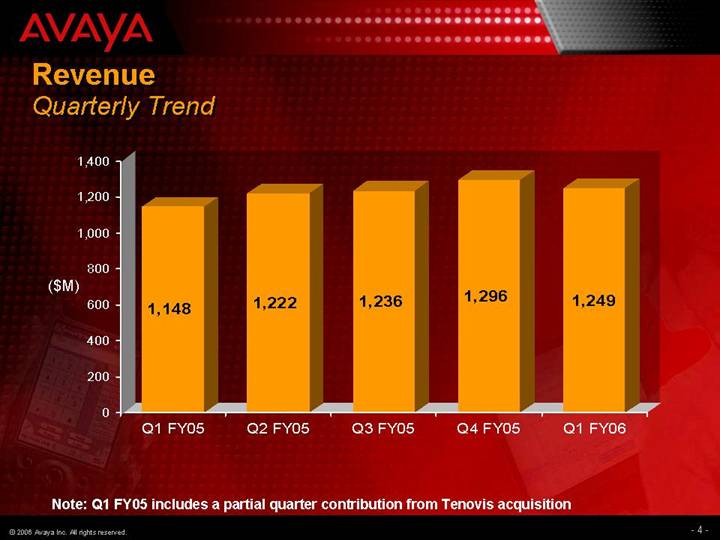
Revenue
Quarterly Trend
[CHART]
Note: Q1 FY05 includes a partial quarter contribution from Tenovis acquisition
4
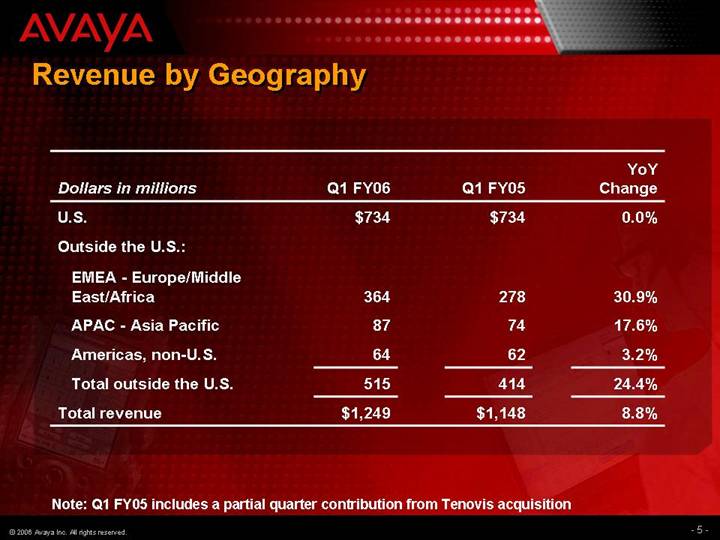
Revenue by Geography
|
|
|
|
|
| YoY |
| ||
Dollars in millions |
| Q1 FY06 |
| Q1 FY05 |
| Change |
| ||
U.S. |
| $ | 734 |
| $ | 734 |
| 0.0 | % |
Outside the U.S.: |
|
|
|
|
|
|
| ||
EMEA - Europe/Middle East/Africa |
| 364 |
| 278 |
| 30.9 | % | ||
APAC - Asia Pacific |
| 87 |
| 74 |
| 17.6 | % | ||
Americas, non-U.S. |
| 64 |
| 62 |
| 3.2 | % | ||
Total outside the U.S. |
| 515 |
| 414 |
| 24.4 | % | ||
Total revenue |
| $ | 1,249 |
| $ | 1,148 |
| 8.8 | % |
Note: Q1 FY05 includes a partial quarter contribution from Tenovis acquisition
5
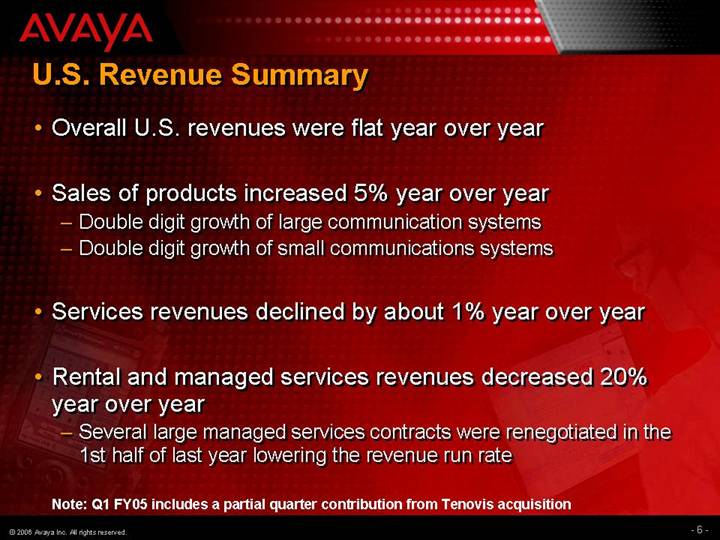
U.S. Revenue Summary
• Overall U.S. revenues were flat year over year
• Sales of products increased 5% year over year
• Double digit growth of large communication systems
• Double digit growth of small communications systems
• Services revenues declined by about 1% year over year
• Rental and managed services revenues decreased 20% year over year
• Several large managed services contracts were renegotiated in the 1st half of last year lowering the revenue run rate
Note: Q1 FY05 includes a partial quarter contribution from Tenovis acquisition
6
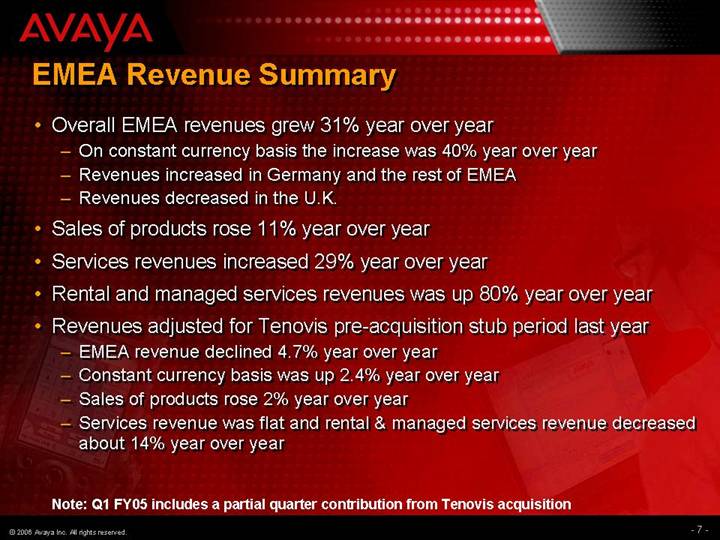
EMEA Revenue Summary
• Overall EMEA revenues grew 31% year over year
• On constant currency basis the increase was 40% year over year
• Revenues increased in Germany and the rest of EMEA
• Revenues decreased in the U.K.
• Sales of products rose 11% year over year
• Services revenues increased 29% year over year
• Rental and managed services revenues was up 80% year over year
• Revenues adjusted for Tenovis pre-acquisition stub period last year
• EMEA revenue declined 4.7% year over year
• Constant currency basis was up 2.4% year over year
• Sales of products rose 2% year over year
• Services revenue was flat and rental & managed services revenue decreased about 14% year over year
Note: Q1 FY05 includes a partial quarter contribution from Tenovis acquisition
7
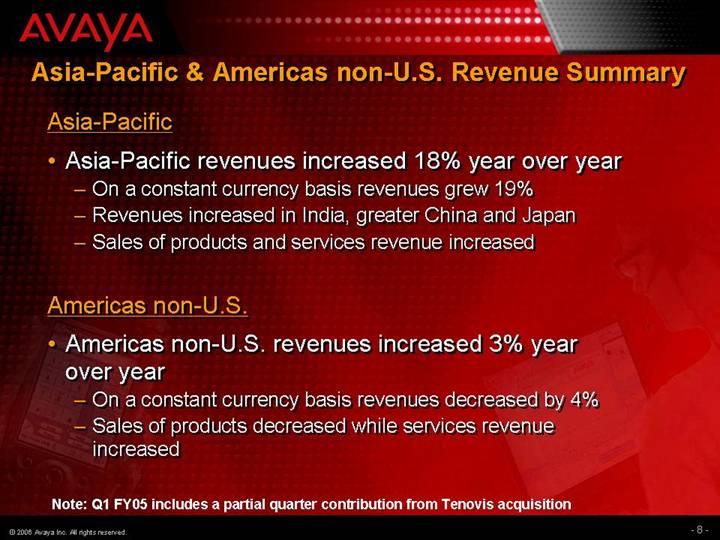
Asia-Pacific & Americas non-U.S. Revenue Summary
Asia-Pacific
• Asia-Pacific revenues increased 18% year over year
• On a constant currency basis revenues grew 19%
• Revenues increased in India, greater China and Japan
• Sales of products and services revenue increased
Americas non-U.S.
• Americas non-U.S. revenues increased 3% year over year
• On a constant currency basis revenues decreased by 4%
• Sales of products decreased while services revenue increased
Note: Q1 FY05 includes a partial quarter contribution from Tenovis acquisition
8
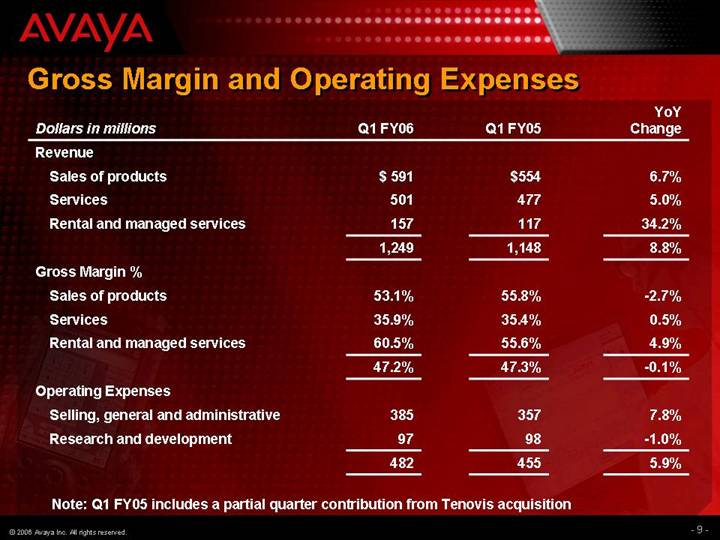
Gross Margin and Operating Expenses
|
|
|
|
|
| YoY |
| ||
Dollars in millions |
| Q1 FY06 |
| Q1 FY05 |
| Change |
| ||
Revenue |
|
|
|
|
|
|
| ||
Sales of products |
| $ | 591 |
| $ | 554 |
| 6.7 | % |
Services |
| 501 |
| 477 |
| 5.0 | % | ||
Rental and managed services |
| 157 |
| 117 |
| 34.2 | % | ||
|
| 1,249 |
| 1,148 |
| 8.8 | % | ||
Gross Margin % |
|
|
|
|
|
|
| ||
Sales of products |
| 53.1 | % | 55.8 | % | -2.7 | % | ||
Services |
| 35.9 | % | 35.4 | % | 0.5 | % | ||
Rental and managed services |
| 60.5 | % | 55.6 | % | 4.9 | % | ||
|
| 47.2 | % | 47.3 | % | -0.1 | % | ||
Operating Expenses |
|
|
|
|
|
|
| ||
Selling, general and administrative |
| 385 |
| 357 |
| 7.8 | % | ||
Research and development |
| 97 |
| 98 |
| -1.0 | % | ||
|
| 482 |
| 455 |
| 5.9 | % | ||
Note: Q1 FY05 includes a partial quarter contribution from Tenovis acquisition
9
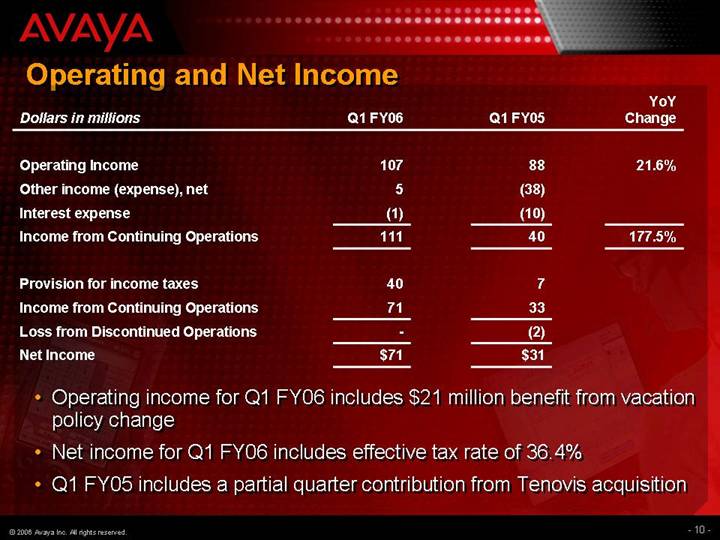
Operating and Net Income
|
|
|
|
|
| YoY |
| ||
Dollars in millions |
| Q1 FY06 |
| Q1 FY05 |
| Change |
| ||
|
|
|
|
|
|
|
| ||
Operating Income |
| 107 |
| 88 |
| 21.6 | % | ||
Other income (expense), net |
| 5 |
| (38 | ) |
|
| ||
Interest expense |
| (1 | ) | (10 | ) |
|
| ||
Income from Continuing Operations |
| 111 |
| 40 |
| 177.5 | % | ||
|
|
|
|
|
|
|
| ||
Provision for income taxes |
| 40 |
| 7 |
|
|
| ||
Income from Continuing Operations |
| 71 |
| 33 |
|
|
| ||
Loss from Discontinued Operations |
| — |
| (2 | ) |
|
| ||
Net Income |
| $ | 71 |
| $ | 31 |
|
|
|
• Operating income for Q1 FY06 includes $21 million benefit from vacation policy change
• Net income for Q1 FY06 includes effective tax rate of 36.4%
• Q1 FY05 includes a partial quarter contribution from Tenovis acquisition
10
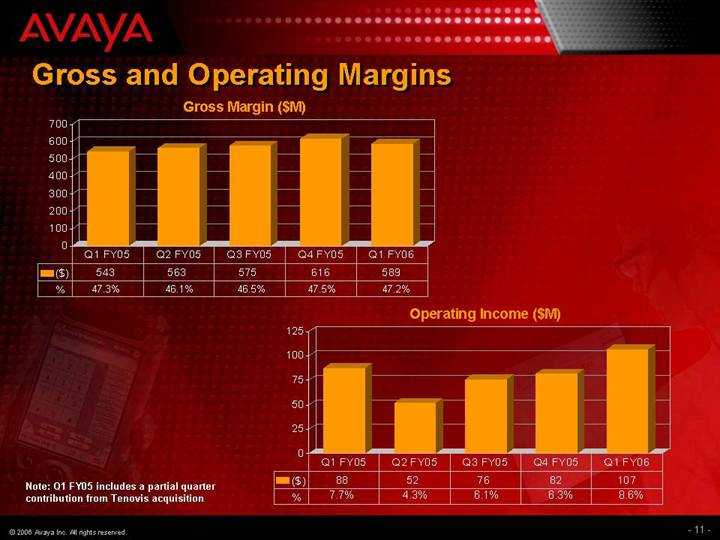
Gross and Operating Margins
Gross Margin ($M)
[CHART]
Operating Income ($M)
[CHART]
Note: Q1 FY05 includes a partial quarter contribution from Tenovis acquisition
11
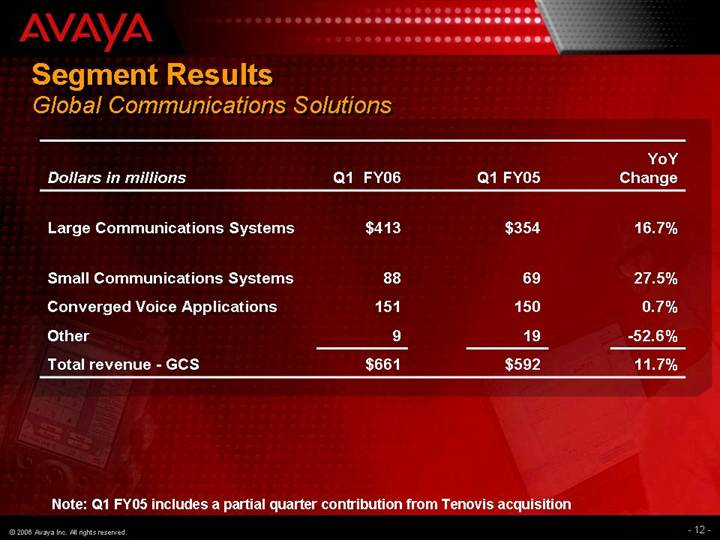
Segment Results
Global Communications Solutions
|
|
|
|
|
| YoY |
| ||
Dollars in millions |
| Q1 FY06 |
| Q1 FY05 |
| Change |
| ||
|
|
|
|
|
|
|
| ||
Large Communications Systems |
| $ | 413 |
| $ | 354 |
| 16.7 | % |
|
|
|
|
|
|
|
| ||
Small Communications Systems |
| 88 |
| 69 |
| 27.5 | % | ||
Converged Voice Applications |
| 151 |
| 150 |
| 0.7 | % | ||
Other |
| 9 |
| 19 |
| -52.6 | % | ||
Total revenue - GCS |
| $ | 661 |
| $ | 592 |
| 11.7 | % |
Note: Q1 FY05 includes a partial quarter contribution from Tenovis acquisition
12
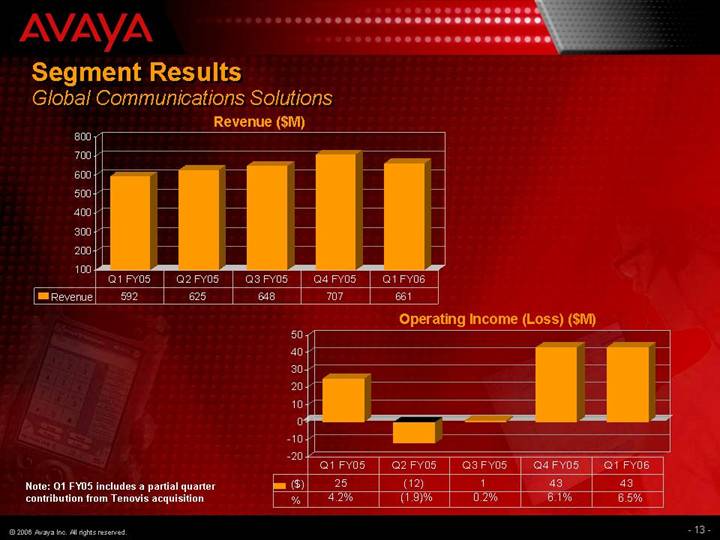
Revenue ($M)
[CHART]
Operating Income (Loss) ($M)
[CHART]
Note: Q1 FY05 includes a partial quarter contribution from Tenovis acquisition
13
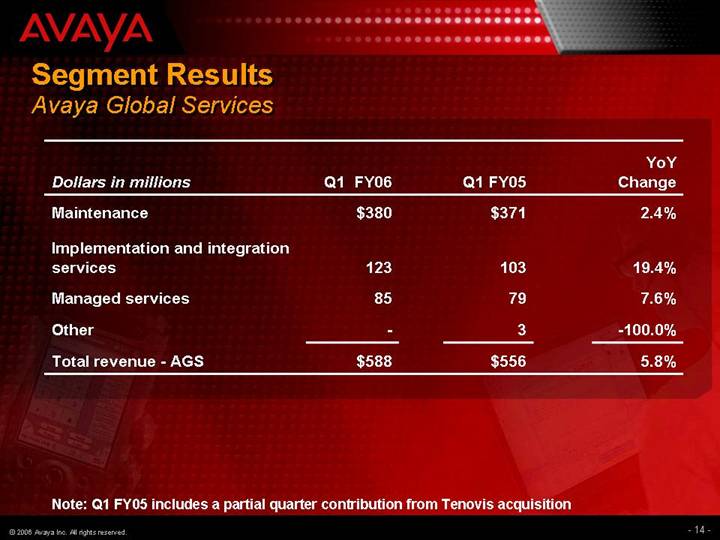
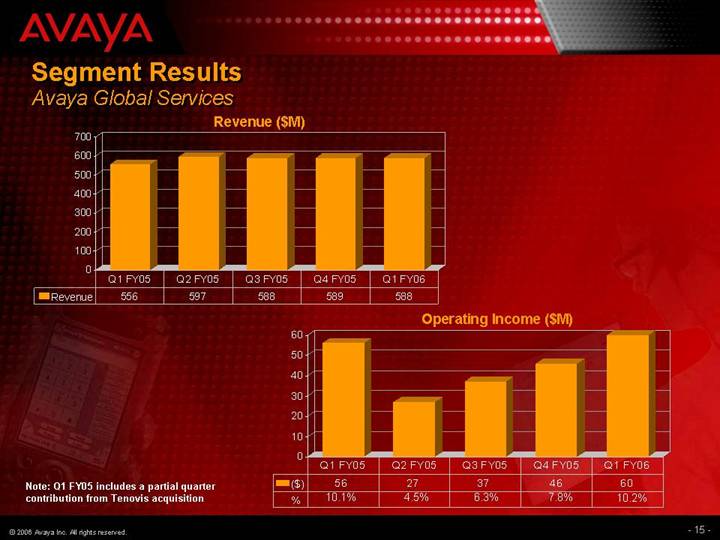
Segment Results
Avaya Global Services
|
|
|
|
|
| YoY |
| ||
Dollars in millions |
| Q1 FY06 |
| Q1 FY05 |
| Change |
| ||
Maintenance |
| $ | 380 |
| $ | 371 |
| 2.4 | % |
Implementation and integration services |
| 123 |
| 103 |
| 19.4 | % | ||
Managed services |
| 85 |
| 79 |
| 7.6 | % | ||
Other |
| — |
| 3 |
| -100.0 | % | ||
Total revenue - AGS |
| $ | 588 |
| $ | 556 |
| 5.8 | % |
Note: Q1 FY05 includes a partial quarter contribution from Tenovis acquisition
14
Revenue ($M)
[CHART]
Operating Income ($M)
[CHART]
Note: Q1 FY05 includes a partial quarter contribution from Tenovis acquisition
15
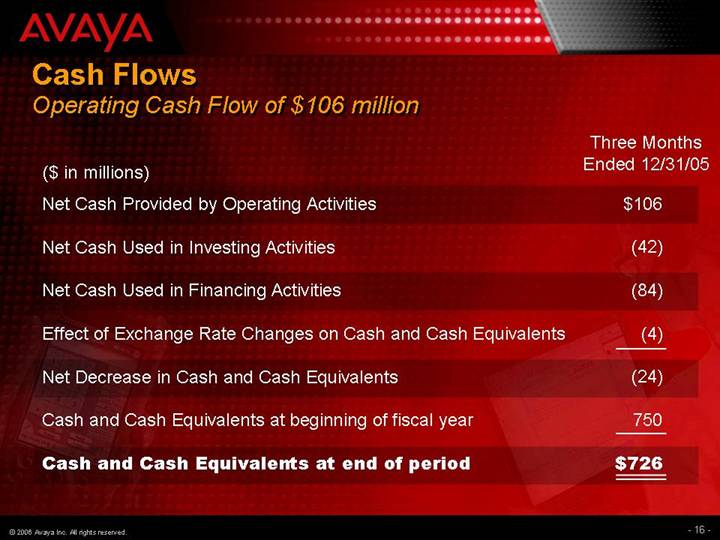
Cash Flows
Operating Cash Flow of $106 million
|
| Three Months |
| |
($ in millions) |
| Ended 12/31/05 |
| |
|
|
|
| |
Net Cash Provided by Operating Activities |
| $ | 106 |
|
|
|
|
| |
Net Cash Used in Investing Activities |
| (42 | ) | |
|
|
|
| |
Net Cash Used in Financing Activities |
| (84 | ) | |
|
|
|
| |
Effect of Exchange Rate Changes on Cash and Cash Equivalents |
| (4 | ) | |
|
|
|
| |
Net Decrease in Cash and Cash Equivalents |
| (24 | ) | |
|
|
|
| |
Cash and Cash Equivalents at beginning of fiscal year |
| 750 |
| |
|
|
|
| |
Cash and Cash Equivalents at end of period |
| $ | 726 |
|
16
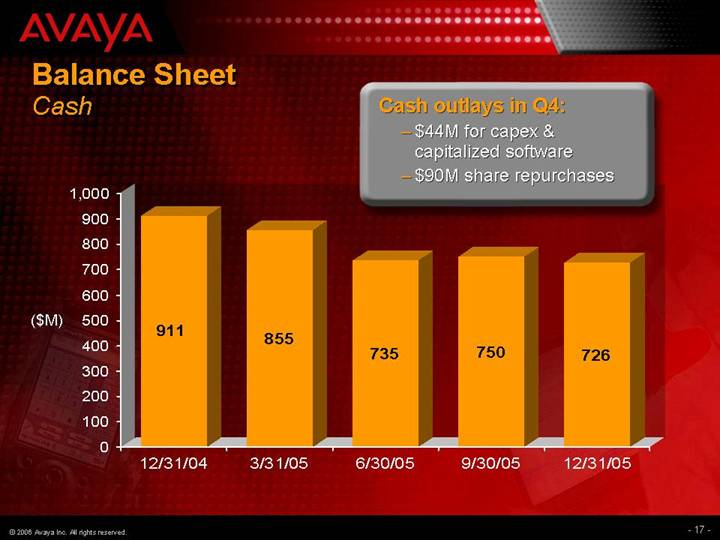
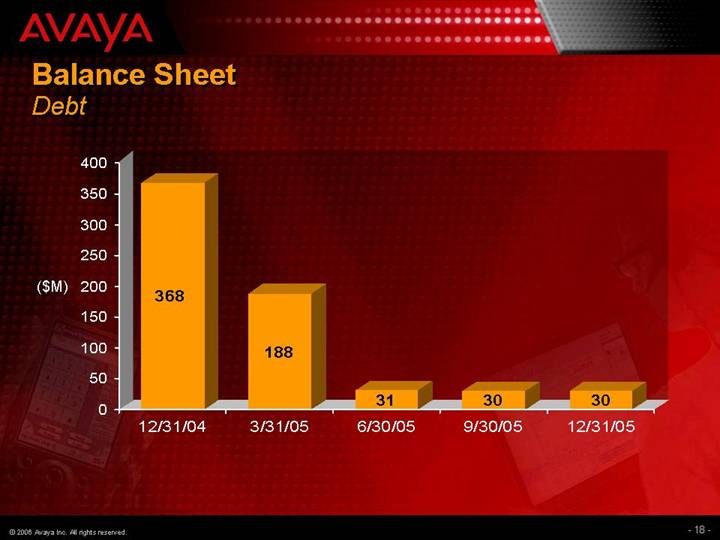
Balance Sheet
Cash
Cash outlays in Q4:
• $44M for capex & capitalized software
• $90M share repurchases
[CHART]
17
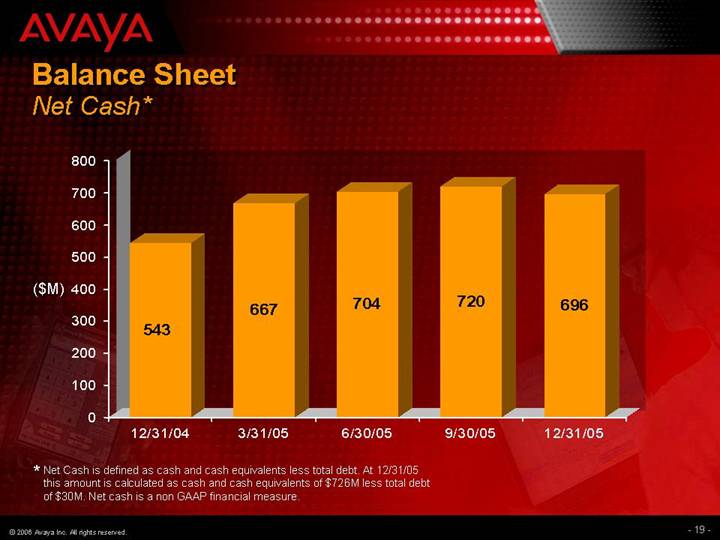
Balance Sheet
Net Cash*
[CHART]
* Net Cash is defined as cash and cash equivalents less total debt. At 12/31/05 this amount is calculated as cash and cash equivalents of $726M less total debt of $30M. Net cash is a non GAAP financial measure.
19
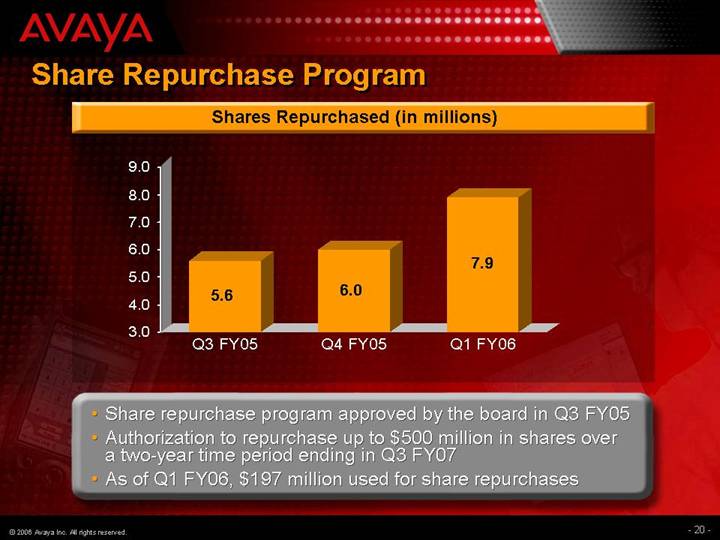
Share Repurchase Program
Shares Repurchased (in millions)
[CHART]
• Share repurchase program approved by the board in Q3 FY05
• Authorization to repurchase up to $500 million in shares over a two-year time period ending in Q3 FY07
• As of Q1 FY06, $197 million used for share repurchases
20
Summary
Key Areas of Focus
• Focused on product sales growth in the U.S. and other major regions
• Quarter saw a resumption of year over year product growth in the U.S.
• Maintain stability in maintenance base
• U.S. maintenance revenues roughly flat over the last 4 quarters on a sequential basis
• Rental and managed services remains a concern
• Working to improve closure rate by managed services business and address erosion in rental base
• Maintain significant level of operating cash flow over the remainder of the year
• Continue to manage our cost and expense structure
• Planning additional actions in Europe
21