Exhibit 99.1
| Q1 FY2007 Earnings Conference Call January 23, 2007 |

| Forward Looking Statements This presentation contains forward-looking statements within the meaning of the safe harbor provisions of the Private Securities Litigation Reform Act of 1995. Forward-looking statements give our current expectations or forecasts of future events. Actual future results may vary materially. They can be affected by inaccurate assumptions we might make or by known or unknown risks and uncertainties. Consequently, no forward-looking statement can be guaranteed and you are cautioned not to place undue reliance on these forward-looking statements. The risks and uncertainties referred to above include, but are not limited to: price and product competition, including from competitors who may offer products and applications similar to those we offer as part of another offering; rapid or disruptive technological development, including the effects of the technology shift from traditional TDM to IP telephony; dependence on new product development; customer demand for our products and services, including risks specifically associated with the services business and, in particular, the maintenance and rental and managed services lines of business, primarily due to renegotiations of customer contracts and changes in scope, pricing erosion and cancellations; supply issues related to our outsourced manufacturing operations, logistics, distribution or components; risks related to inventory, including warranty costs, obsolescence charges, excess capacity, material and labor costs, and our distributors’ decisions regarding their own inventory levels; general industry and market conditions and growth rates and general domestic and international economic conditions including interest rate and currency exchange rate fluctuations; the economic, political and other risks associated with international sales and operations, including increased exposure to currency fluctuations and to European economies as a result of a large percentage of our business being conducted in Europe; the ability to successfully integrate acquired companies, which may require significant management time and attention; the ability to attract and retain qualified employees; control of costs and expenses, including difficulties in completing restructuring actions in a timely and efficient manner due to labor laws and required approvals; U.S. and non-U.S. government regulation; and the ability to form and implement alliances. For a further list and description of such risks and uncertainties, see the reports filed by Avaya with the SEC, which are available at www.sec.gov, particularly the information contained in Part I, Item 1A, entitled “Risk Factors”, of our fiscal 2006 Form 10-K. Avaya disclaims any intention or obligation to update or revise any forward-looking statements, whether as a result of new information, future events or otherwise. Presentation: Unless indicated otherwise, all results are presented in accordance with accounting principles generally accepted in the United States (GAAP). |

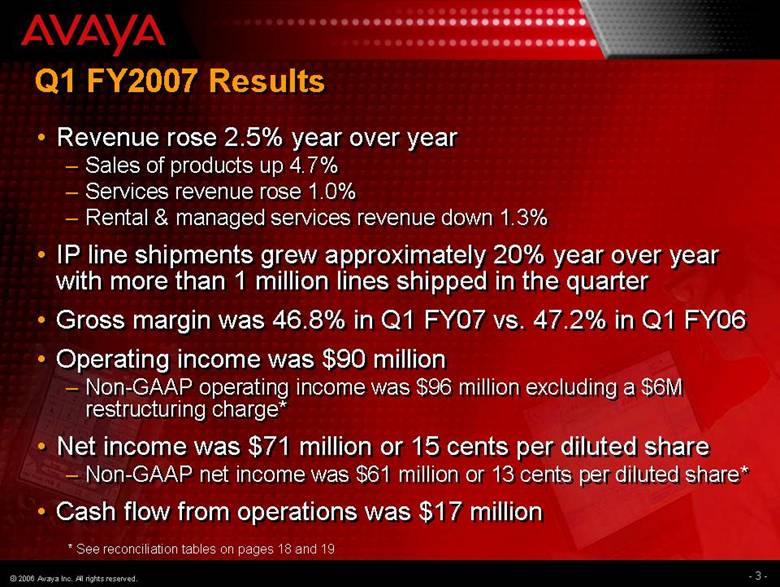
| Q1 FY2007 Results Revenue rose 2.5% year over year Sales of products up 4.7% Services revenue rose 1.0% Rental & managed services revenue down 1.3% IP line shipments grew approximately 20% year over year with more than 1 million lines shipped in the quarter Gross margin was 46.8% in Q1 FY07 vs. 47.2% in Q1 FY06 Operating income was $90 million Non-GAAP operating income was $96 million excluding a $6M restructuring charge* Net income was $71 million or 15 cents per diluted share Non-GAAP net income was $61 million or 13 cents per diluted share* Cash flow from operations was $17 million * See reconciliation tables on pages 18 and 19 |
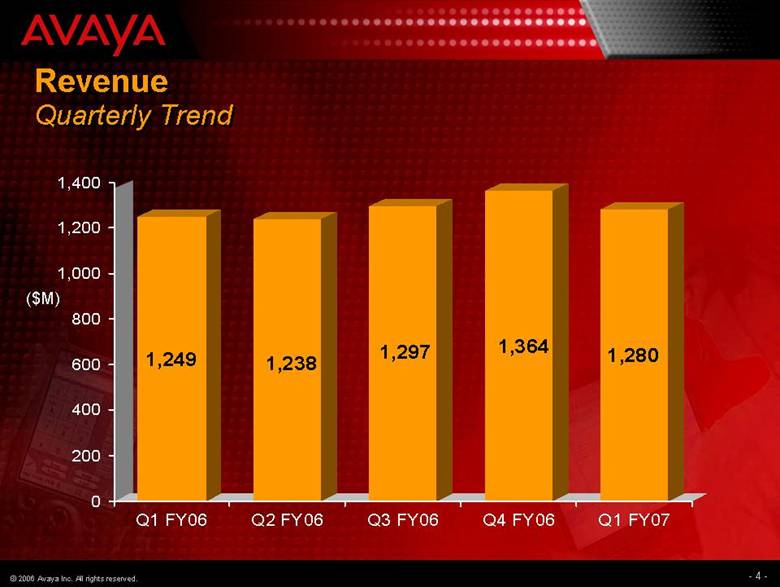
| Revenue Quarterly Trend ($M) 1,249 1,238 1,297 1,364 1,280 0 200 400 600 800 1,000 1,200 1,400 Q1 FY06 Q2 FY06 Q3 FY06 Q4 FY06 Q1 FY07 |
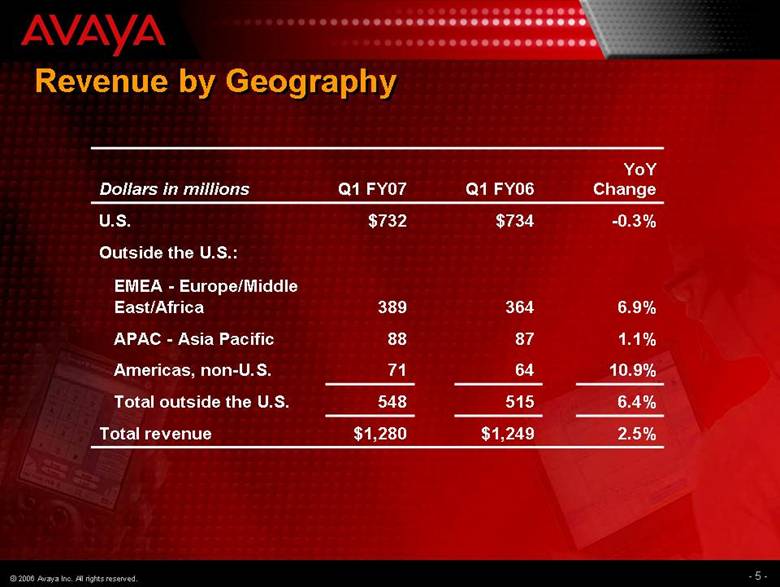
| Revenue by Geography 2.5% 6.4% 10.9% 1.1% 6.9% -0.3% YoY Change $1,249 $1,280 Total revenue 515 548 64 71 87 88 364 389 Outside the U.S.: $734 $732 U.S. Q1 FY06 Q1 FY07 Dollars in millions EMEA - Europe/Middle East/Africa APAC - Asia Pacific Americas, non-U.S. Total outside the U.S. |
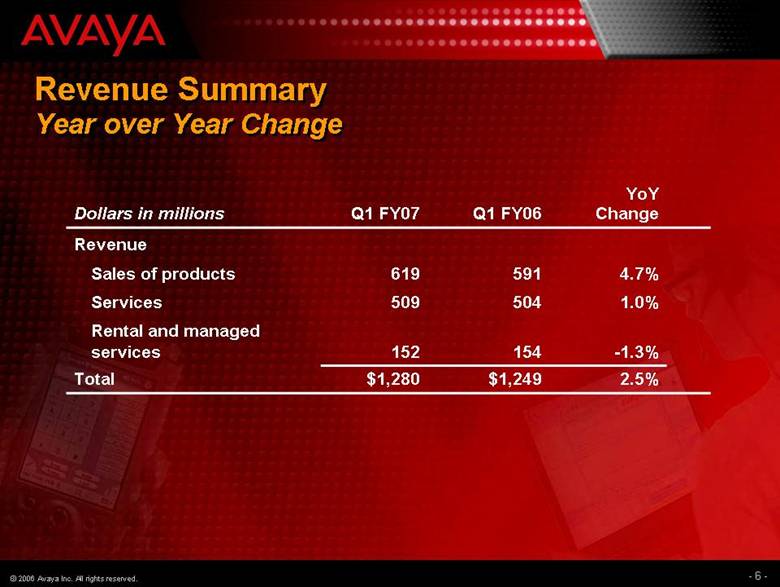
| Revenue Summary Year over Year Change $1,249 154 504 591 Q1 FY06 $1,280 152 509 619 Q1 FY07 2.5% Total -1.3% Rental and managed services 1.0% Services 4.7% Sales of products Revenue YoY Change Dollars in millions |
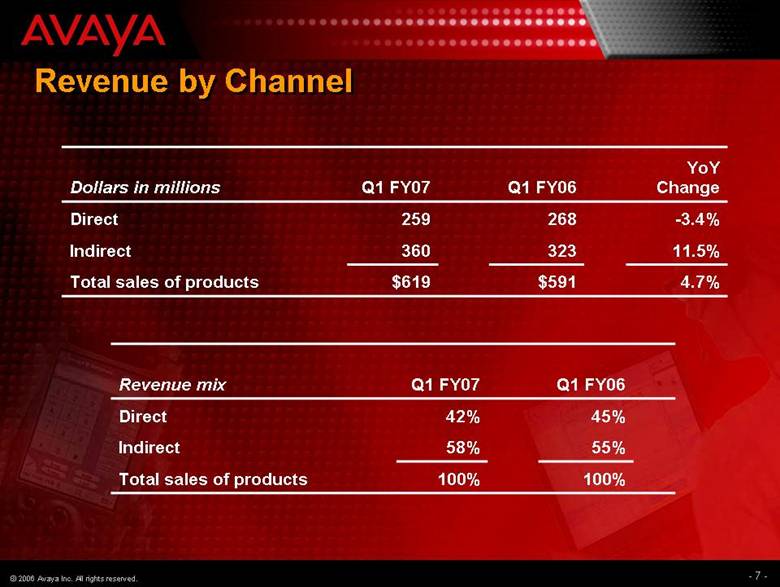
| Revenue by Channel 4.7% $591 $619 Total sales of products 11.5% 323 360 Indirect -3.4% 268 259 Direct YoY Change Q1 FY06 Q1 FY07 Dollars in millions 100% 100% Total sales of products 55% 58% Indirect 45% 42% Direct Q1 FY06 Q1 FY07 Revenue mix |
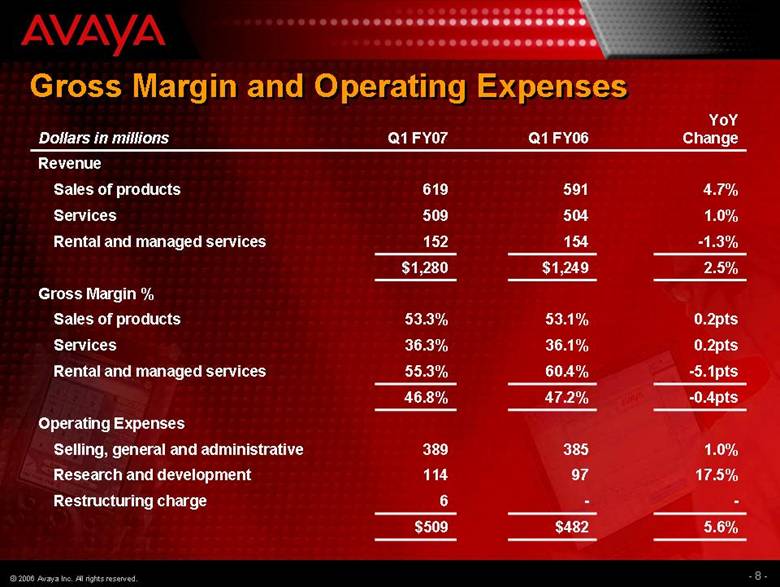
| Gross Margin and Operating Expenses 17.5% 97 114 Research and development Operating Expenses 1.0% 385 389 Selling, general and administrative - - 6 Restructuring charge 5.6% $482 $509 -0.4pts 47.2% 46.8% -5.1pts 60.4% 55.3% Rental and managed services 0.2pts 36.1% 36.3% Services 0.2pts 53.1% 53.3% Sales of products Gross Margin % 2.5% $1,249 $1,280 -1.3% 154 152 Rental and managed services 1.0% 504 509 Services 4.7% 591 619 Sales of products Revenue YoY Change Q1 FY06 Q1 FY07 Dollars in millions |
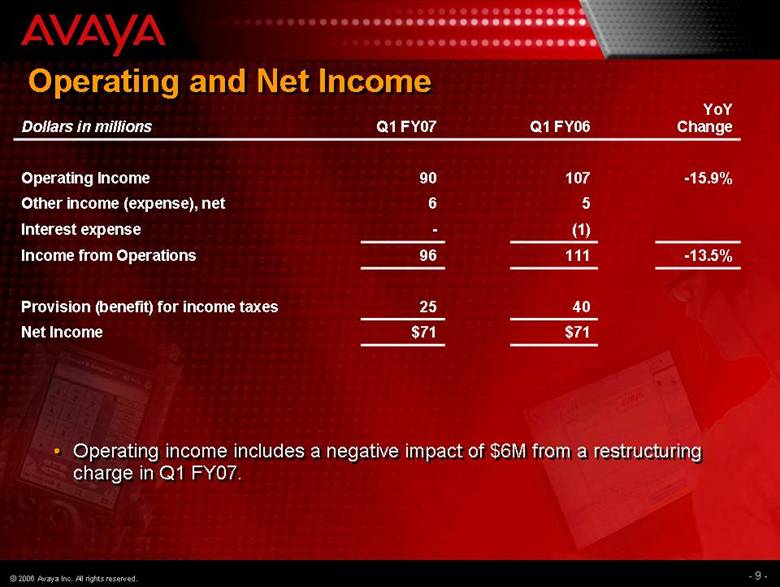
| Operating and Net Income $71 $71 Net Income 40 25 Provision (benefit) for income taxes -13.5% 111 96 Income from Operations (1) - Interest expense 5 6 Other income (expense), net -15.9% 107 90 Operating Income YoY Change Q1 FY06 Q1 FY07 Dollars in millions Operating income includes a negative impact of $6M from a restructuring charge in Q1 FY07. |
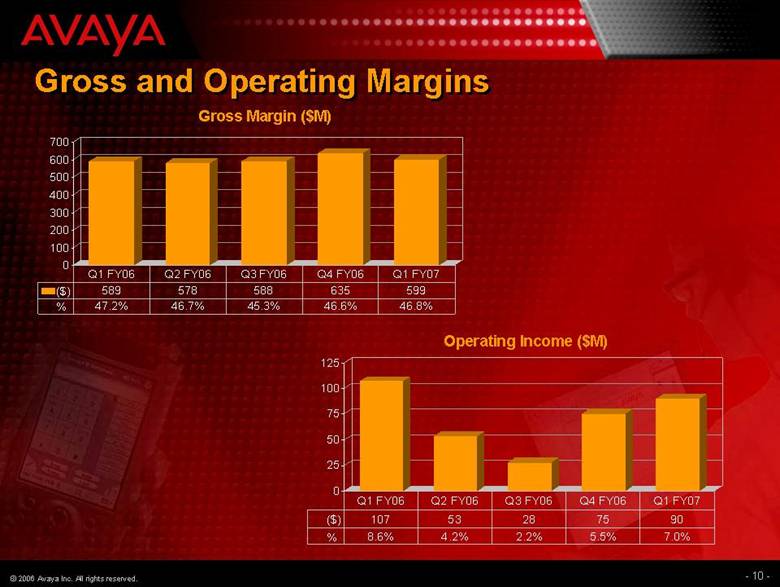
| Gross and Operating Margins Operating Income ($M) Gross Margin ($M) 0 25 50 75 100 125 107 53 28 75 90 8.6% 4.2% 2.2% 5.5% 7.0% Q1 FY06 Q2 FY06 Q3 FY06 Q4 FY06 Q1 FY07 0 100 200 300 400 500 600 700 589 578 588 635 599 47.2% 46.7% 45.3% 46.6% 46.8% Q1 FY06 Q2 FY06 Q3 FY06 Q4 FY06 Q1 FY07 % ($) % ($) |
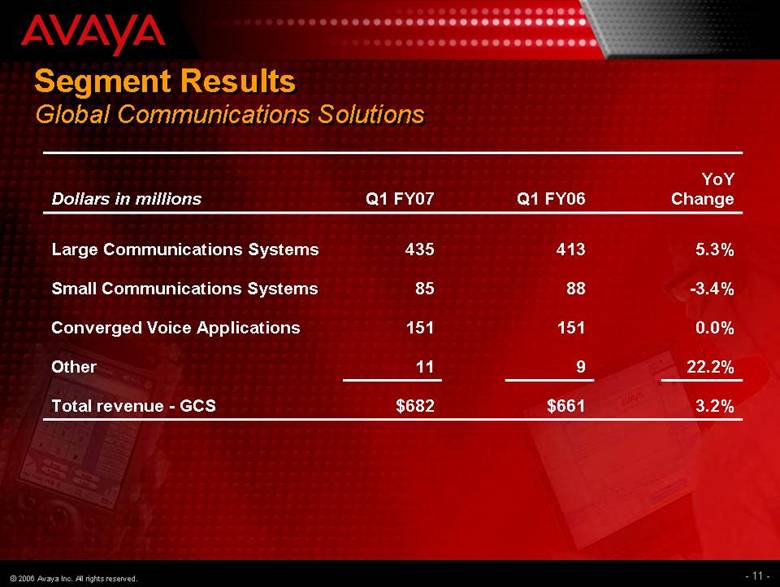
| Segment Results Global Communications Solutions 3.2% $661 $682 Total revenue - GCS 22.2% 9 11 Other 0.0% 151 151 Converged Voice Applications -3.4% 88 85 Small Communications Systems 5.3% 413 435 Large Communications Systems YoY Change Q1 FY06 Q1 FY07 Dollars in millions |
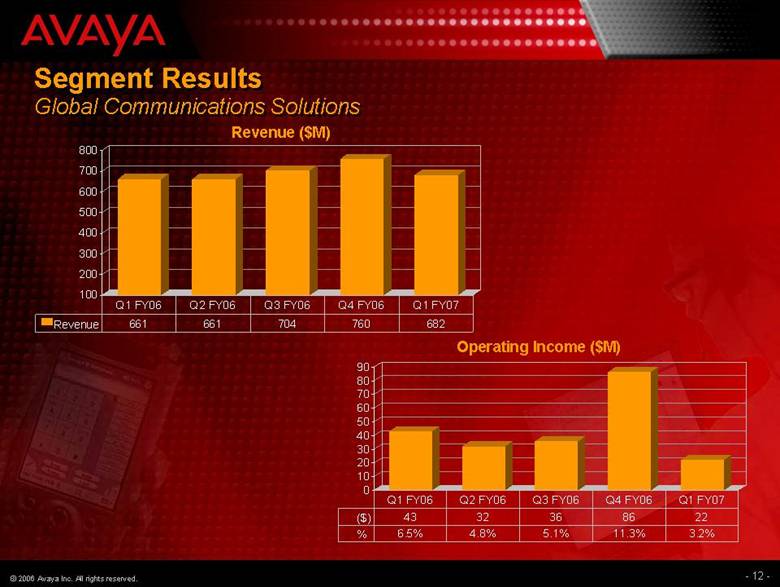
| Segment Results Global Communications Solutions Revenue ($M) Operating Income ($M) 100 200 300 400 500 600 700 800 661 661 704 760 682 Q1 FY06 Q2 FY06 Q3 FY06 Q4 FY06 Q1 FY07 0 10 20 30 40 50 60 70 80 90 43 32 36 86 22 6.5% 4.8% 5.1% 11.3% 3.2% Q1 FY06 Q2 FY06 Q3 FY06 Q4 FY06 Q1 FY07 % ($) Revenue |
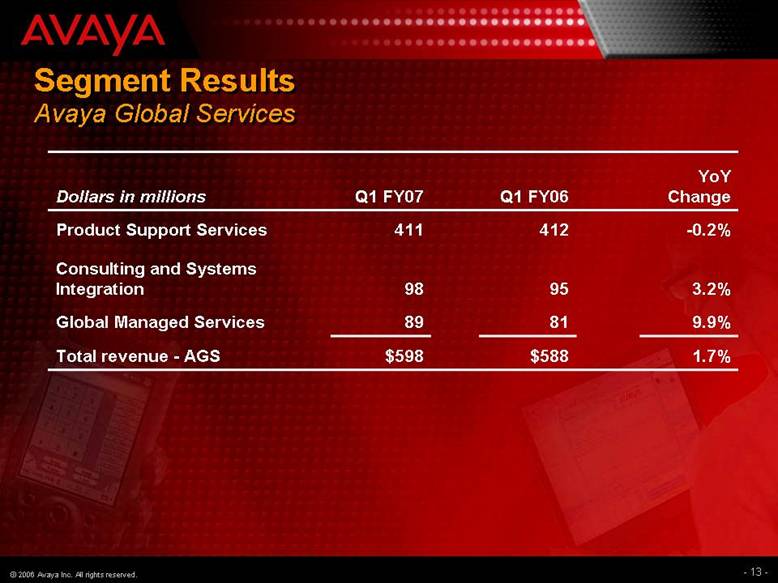
| Segment Results Avaya Global Services 1.7% $588 $598 Total revenue - AGS 9.9% 81 89 Global Managed Services 3.2% 95 98 Consulting and Systems Integration -0.2% 412 411 Product Support Services YoY Change Q1 FY06 Q1 FY07 Dollars in millions |
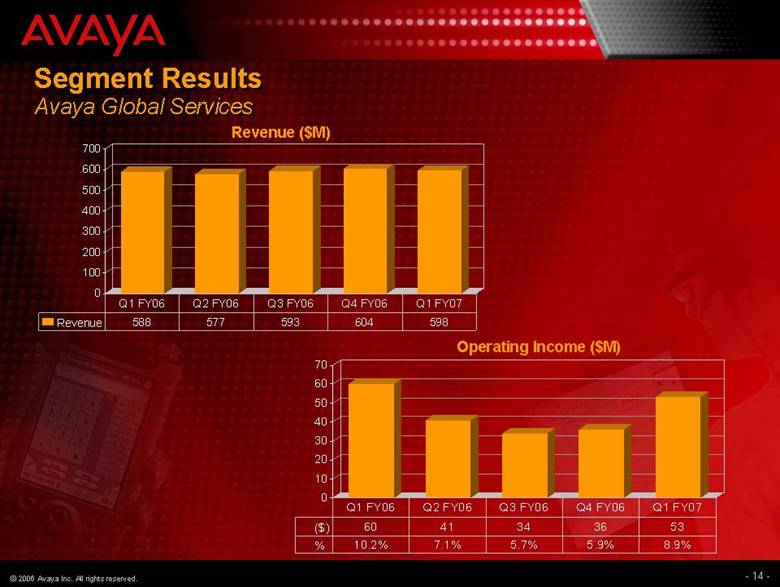
| Segment Results Avaya Global Services Revenue ($M) Operating Income ($M) 0 10 20 30 40 50 60 70 60 41 34 36 53 10.2% 7.1% 5.7% 5.9% 8.9% Q1 FY06 Q2 FY06 Q3 FY06 Q4 FY06 Q1 FY07 0 100 200 300 400 500 600 700 588 577 593 604 598 Q1 FY06 Q2 FY06 Q3 FY06 Q4 FY06 Q1 FY07 Revenue % ($) |
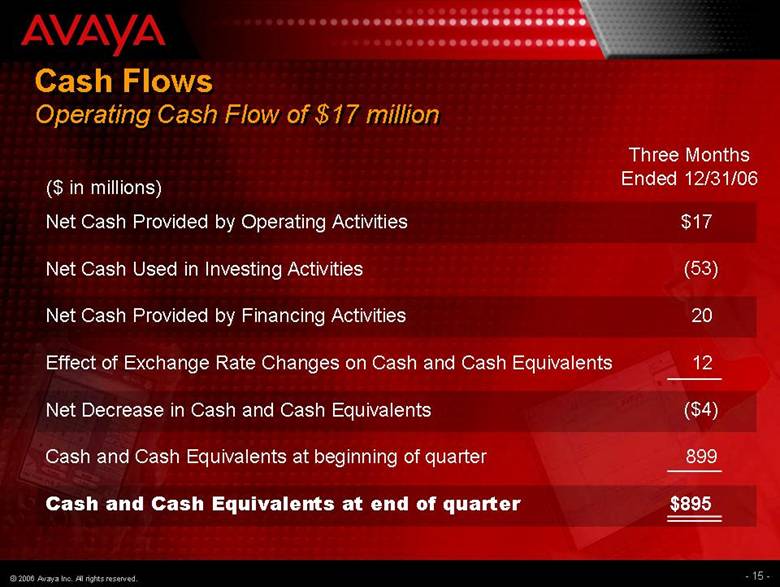
| Cash Flows Operating Cash Flow of $17 million Net Cash Provided by Operating Activities Net Cash Used in Investing Activities Net Cash Provided by Financing Activities Effect of Exchange Rate Changes on Cash and Cash Equivalents Net Decrease in Cash and Cash Equivalents Cash and Cash Equivalents at beginning of quarter Cash and Cash Equivalents at end of quarter $17 (53) 20 12 ($4) 899 $895 ($ in millions) Three Months Ended 12/31/06 |
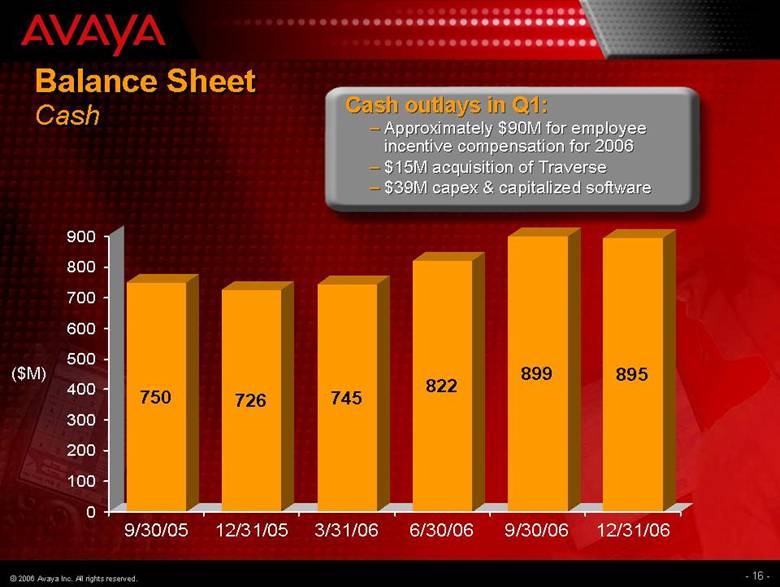
| Balance Sheet Cash ($M) Cash outlays in Q1: Approximately $90M for employee incentive compensation for 2006 $15M acquisition of Traverse $39M capex & capitalized software 750 726 745 822 899 895 0 100 200 300 400 500 600 700 800 900 9/30/05 12/31/05 3/31/06 6/30/06 9/30/06 12/31/06 |
| Key Focus Areas Strategy Execution Culture Build value for shareholders |

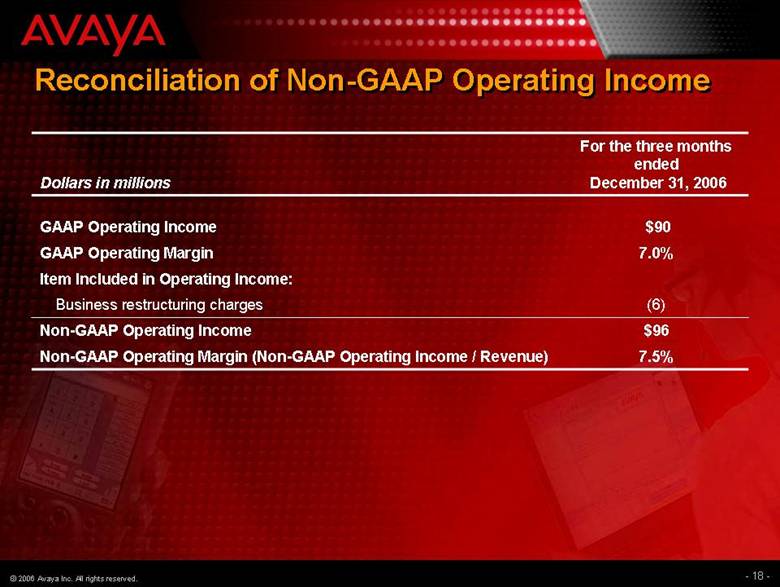
| Reconciliation of Non-GAAP Operating Income 7.5% Non-GAAP Operating Margin (Non-GAAP Operating Income / Revenue) $96 Non-GAAP Operating Income (6) Business restructuring charges Item Included in Operating Income: 7.0% GAAP Operating Margin $90 GAAP Operating Income For the three months ended December 31, 2006 Dollars in millions |
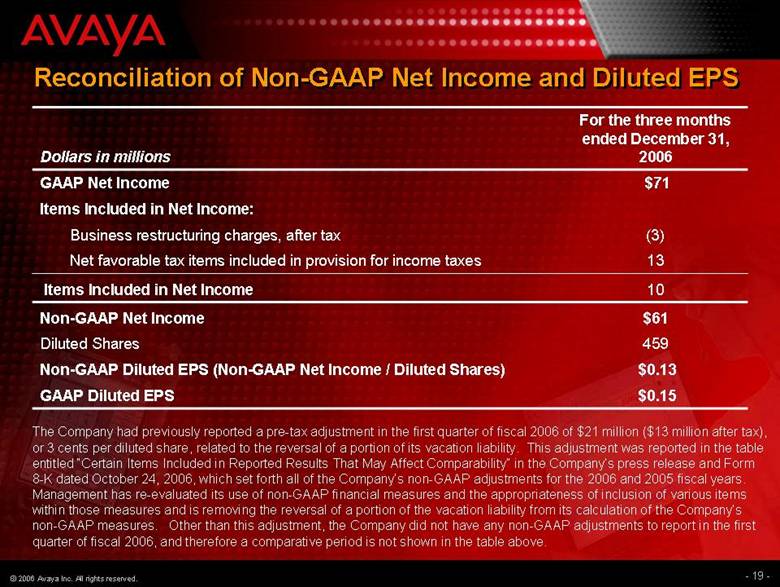
| Reconciliation of Non-GAAP Net Income and Diluted EPS $0.15 GAAP Diluted EPS $0.13 Non-GAAP Diluted EPS (Non-GAAP Net Income / Diluted Shares) 459 Diluted Shares $61 Non-GAAP Net Income 10 Items Included in Net Income 13 Net favorable tax items included in provision for income taxes (3) Business restructuring charges, after tax Items Included in Net Income: $71 GAAP Net Income For the three months ended December 31, 2006 Dollars in millions The Company had previously reported a pre-tax adjustment in the first quarter of fiscal 2006 of $21 million ($13 million after tax), or 3 cents per diluted share, related to the reversal of a portion of its vacation liability. This adjustment was reported in the table entitled “Certain Items Included in Reported Results That May Affect Comparability” in the Company’s press release and Form 8-K dated October 24, 2006, which set forth all of the Company’s non-GAAP adjustments for the 2006 and 2005 fiscal years. Management has re-evaluated its use of non-GAAP financial measures and the appropriateness of inclusion of various items within those measures and is removing the reversal of a portion of the vacation liability from its calculation of the Company’s non-GAAP measures. Other than this adjustment, the Company did not have any non-GAAP adjustments to report in the first quarter of fiscal 2006, and therefore a comparative period is not shown in the table above. |
| Q1 FY2007 Earnings Conference Call January 23, 2007 |