Exhibit 99.1
| Q2 FY2007 Earnings Conference Call April 25, 2007 |

| Forward Looking Statements This presentation contains forward-looking statements within the meaning of the safe harbor provisions of the Private Securities Litigation Reform Act of 1995. Forward-looking statements give our current expectations or forecasts of future events. Actual future results may vary materially. They can be affected by inaccurate assumptions we might make or by known or unknown risks and uncertainties. Consequently, no forward-looking statement can be guaranteed and you are cautioned not to place undue reliance on these forward-looking statements. The risks and uncertainties referred to above include, but are not limited to: price and product competition, including from competitors who may offer products and applications similar to those we offer as part of another offering; and from current leaders in information technology which benefit from the convergence of enterprise voice and data networks; rapid or disruptive technological development, including the effects of the technology shift from traditional TDM to IP telephony; dependence on new product development; customer demand for our products and services, including risks specifically associated with the services business and, in particular, the maintenance and rental and managed services lines of business, primarily due to renegotiations of customer contracts and changes in scope, pricing erosion and cancellations; supply issues related to our outsourced manufacturing operations, logistics, distribution or components; risks related to inventory, including warranty costs, obsolescence charges, excess capacity, material and labor costs, and our distributors’ decisions regarding their own inventory levels; general industry and market conditions and growth rates and general domestic and international economic conditions including interest rate and currency exchange rate fluctuations; the economic, political and other risks associated with international sales and operations, including increased exposure to currency fluctuations and to European economies as a result of a large percentage of our business being conducted in Europe; the ability to successfully integrate acquired companies, which may require significant management time and attention; the ability to attract and retain qualified employees; control of costs and expenses, including difficulties in completing restructuring actions in a timely and efficient manner due to labor laws and required approvals; U.S. and non-U.S. government regulation; and the ability to form and implement alliances. For a further list and description of such risks and uncertainties, see the reports filed by Avaya with the SEC, which are available at www.sec.gov, particularly the information contained in Part I, Item 1A, entitled “Risk Factors”, of our Form 10-Q for the quarter ended 12/31/06. Avaya disclaims any intention or obligation to update or revise any forward-looking statements, whether as a result of new information, future events or otherwise. Presentation: Unless indicated otherwise, all results are presented in accordance with accounting principles generally accepted in the United States (GAAP). |
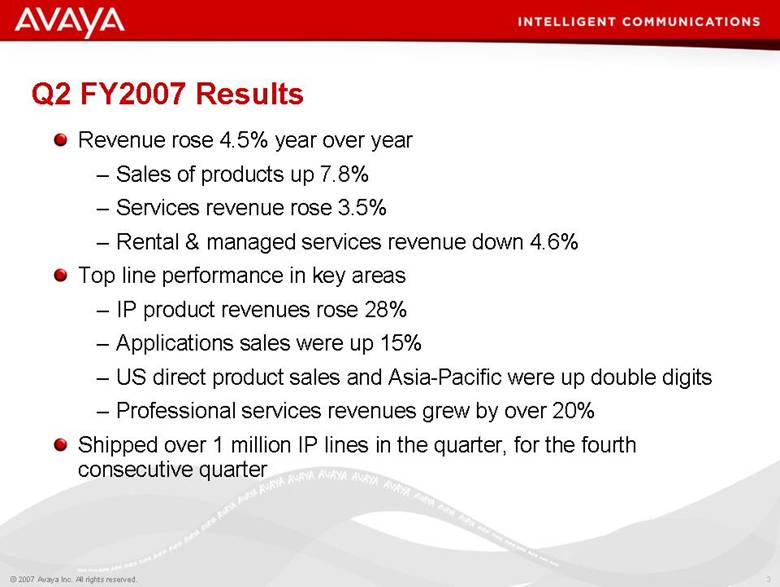
| Q2 FY2007 Results Revenue rose 4.5% year over year Sales of products up 7.8% Services revenue rose 3.5% Rental & managed services revenue down 4.6% Top line performance in key areas IP product revenues rose 28% Applications sales were up 15% US direct product sales and Asia-Pacific were up double digits Professional services revenues grew by over 20% Shipped over 1 million IP lines in the quarter, for the fourth consecutive quarter |
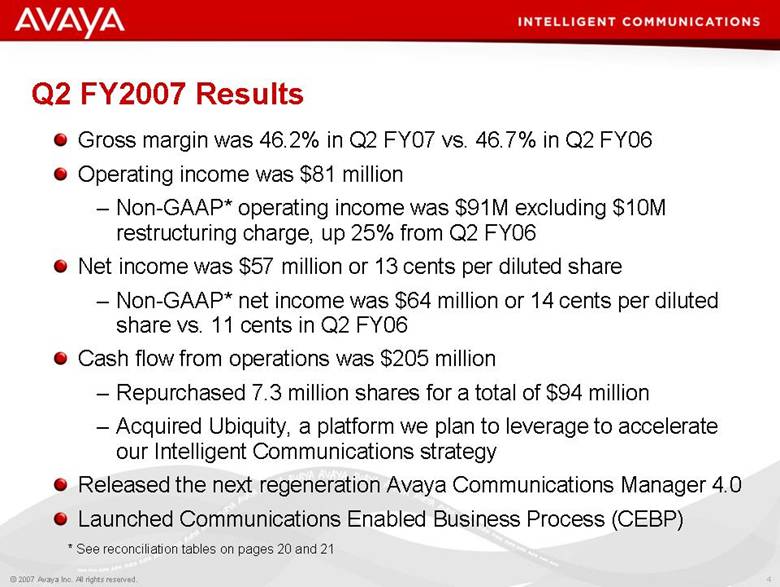
| Q2 FY2007 Results Gross margin was 46.2% in Q2 FY07 vs. 46.7% in Q2 FY06 Operating income was $81 million Non-GAAP* operating income was $91M excluding $10M restructuring charge, up 25% from Q2 FY06 Net income was $57 million or 13 cents per diluted share Non-GAAP* net income was $64 million or 14 cents per diluted share vs. 11 cents in Q2 FY06 Cash flow from operations was $205 million Repurchased 7.3 million shares for a total of $94 million Acquired Ubiquity, a platform we plan to leverage to accelerate our Intelligent Communications strategy Released the next regeneration Avaya Communications Manager 4.0 Launched Communications Enabled Business Process (CEBP) * See reconciliation tables on pages 20 and 21 |
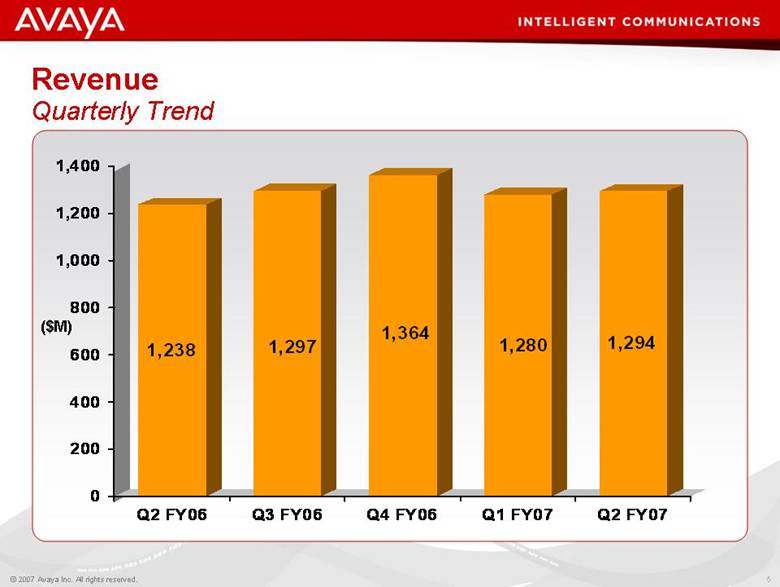
| Revenue Quarterly Trend ($M) 1,238 1,297 1,364 1,280 1,294 0 200 400 600 800 1,000 1,200 1,400 Q2 FY06 Q3 FY06 Q4 FY06 Q1 FY07 Q2 FY07 |
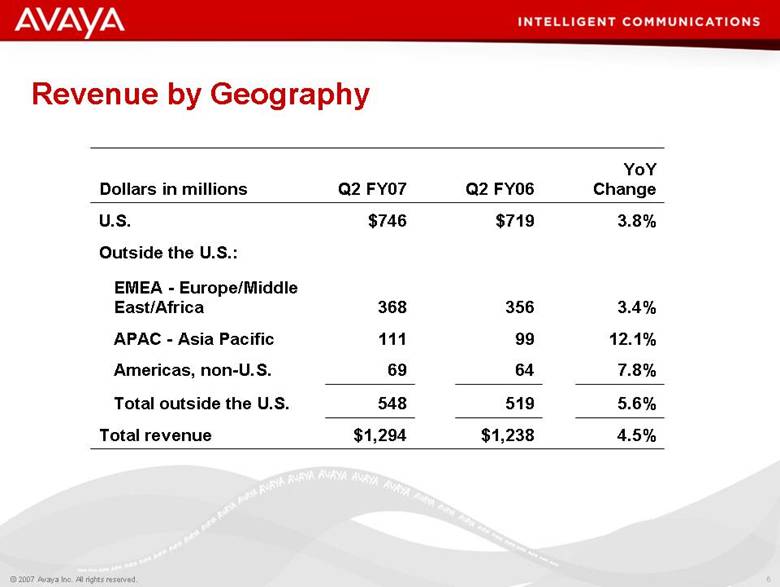
| Revenue by Geography 4.5% 5.6% 7.8% 12.1% 3.4% 3.8% YoY Change $1,238 $1,294 Total revenue 519 548 64 69 99 111 356 368 Outside the U.S.: $719 $746 U.S. Q2 FY06 Q2 FY07 Dollars in millions EMEA - Europe/Middle East/Africa APAC - Asia Pacific Americas, non-U.S. Total outside the U.S. |
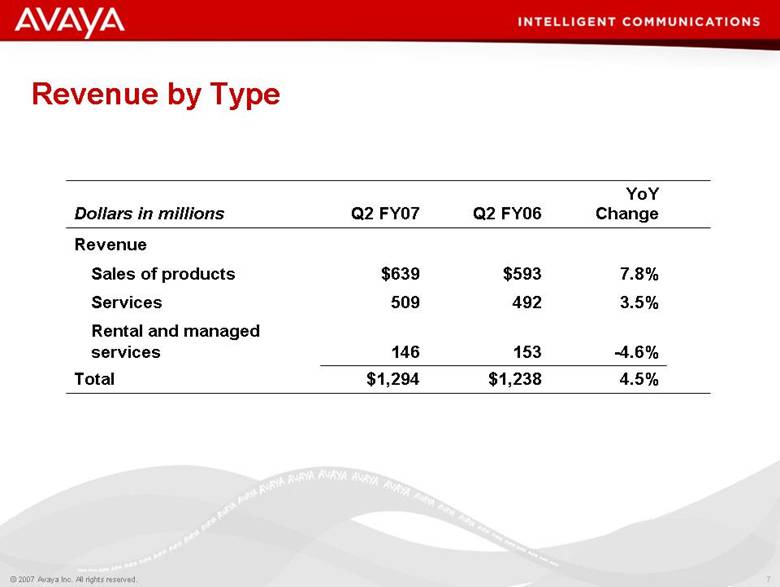
| $1,238 153 492 $593 Q2 FY06 $1,294 146 509 $639 Q2 FY07 4.5% Total -4.6% Rental and managed services 3.5% Services 7.8% Sales of products Revenue YoY Change Dollars in millions Revenue by Type |
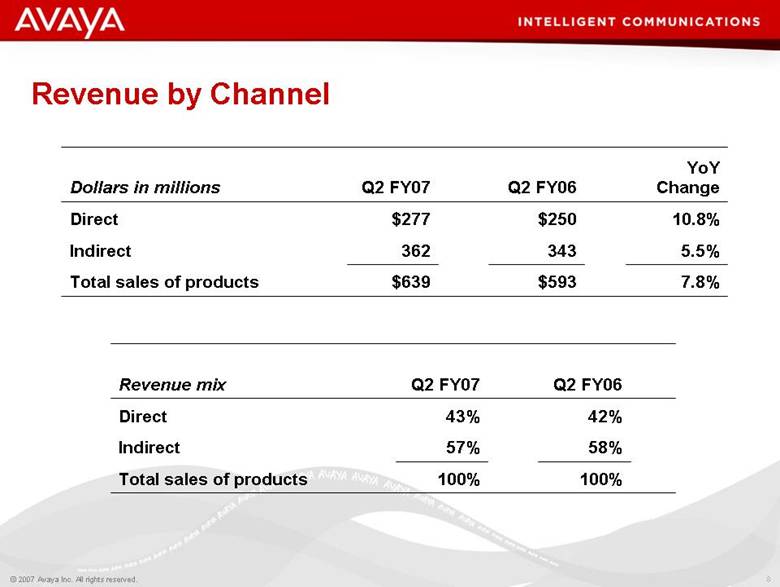
| Revenue by Channel 7.8% $593 $639 Total sales of products 5.5% 343 362 Indirect 10.8% $250 $277 Direct YoY Change Q2 FY06 Q2 FY07 Dollars in millions 100% 100% Total sales of products 58% 57% Indirect 42% 43% Direct Q2 FY06 Q2 FY07 Revenue mix |
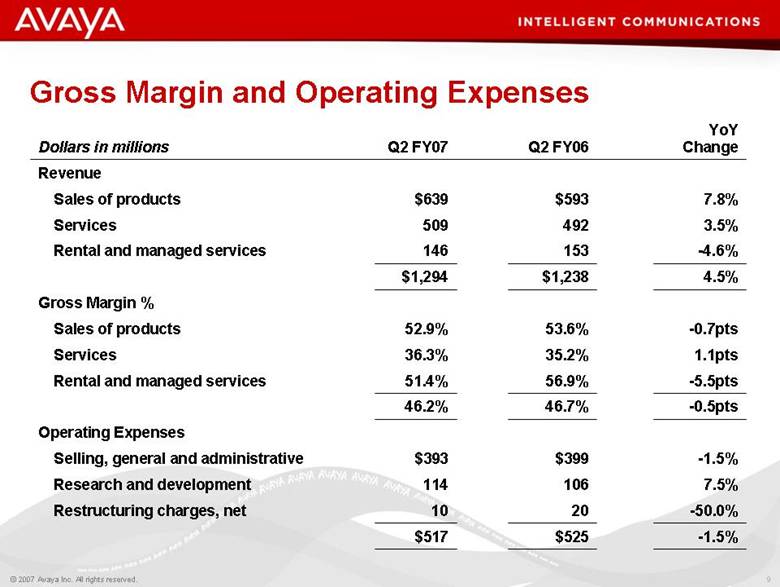
| Gross Margin and Operating Expenses 7.5% 106 114 Research and development Operating Expenses -1.5% $399 $393 Selling, general and administrative -50.0% 20 10 Restructuring charges, net -1.5% $525 $517 -0.5pts 46.7% 46.2% -5.5pts 56.9% 51.4% Rental and managed services 1.1pts 35.2% 36.3% Services -0.7pts 53.6% 52.9% Sales of products Gross Margin % 4.5% $1,238 $1,294 -4.6% 153 146 Rental and managed services 3.5% 492 509 Services 7.8% $593 $639 Sales of products Revenue YoY Change Q2 FY06 Q2 FY07 Dollars in millions |
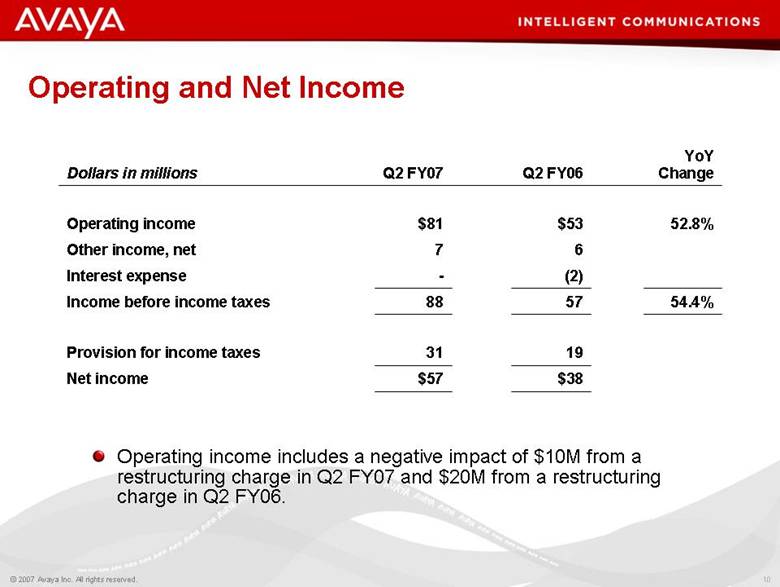
| Operating and Net Income $38 $57 Net income 19 31 Provision for income taxes 54.4% 57 88 Income before income taxes (2) Interest expense 6 7 Other income, net 52.8% $53 $81 Operating income YoY Change Q2 FY06 Q2 FY07 Dollars in millions Operating income includes a negative impact of $10M from a restructuring charge in Q2 FY07 and $20M from a restructuring charge in Q2 FY06. - |
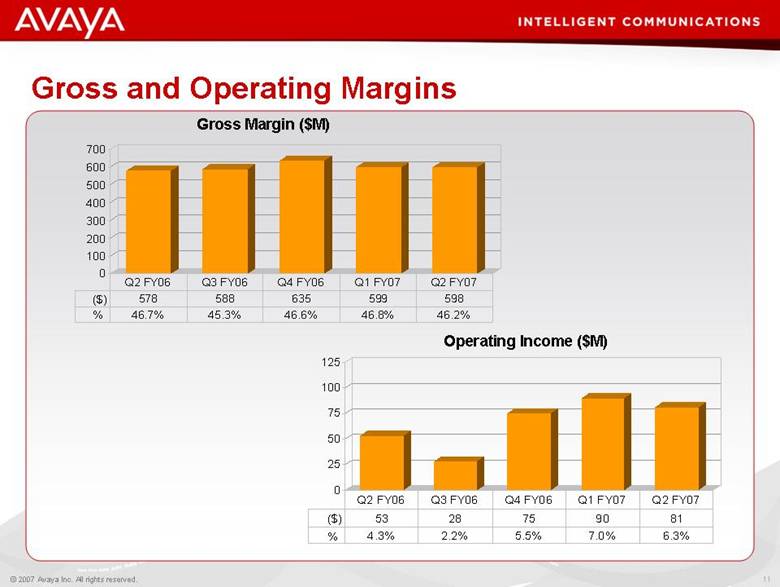
| Gross and Operating Margins Operating Income ($M) Gross Margin ($M) 0 25 50 75 100 125 53 28 75 90 81 4.3% 2.2% 5.5% 7.0% 6.3% Q2 FY06 Q3 FY06 Q4 FY06 Q1 FY07 Q2 FY07 0 100 200 300 400 500 600 700 578 588 635 599 598 46.7% 45.3% 46.6% 46.8% 46.2% Q2 FY06 Q3 FY06 Q4 FY06 Q1 FY07 Q2 FY07 % ($) % ($) |
| Segment Results Global Communications Solutions 5.6% $661 $698 Total revenue - GCS 0.0% 12 12 Other 14.9% 141 162 Converged Voice Applications -10.6% 94 84 Small Communications Systems 6.3% $414 $440 Large Communications Systems YoY Change Q2 FY06 Q2 FY07 Dollars in millions |

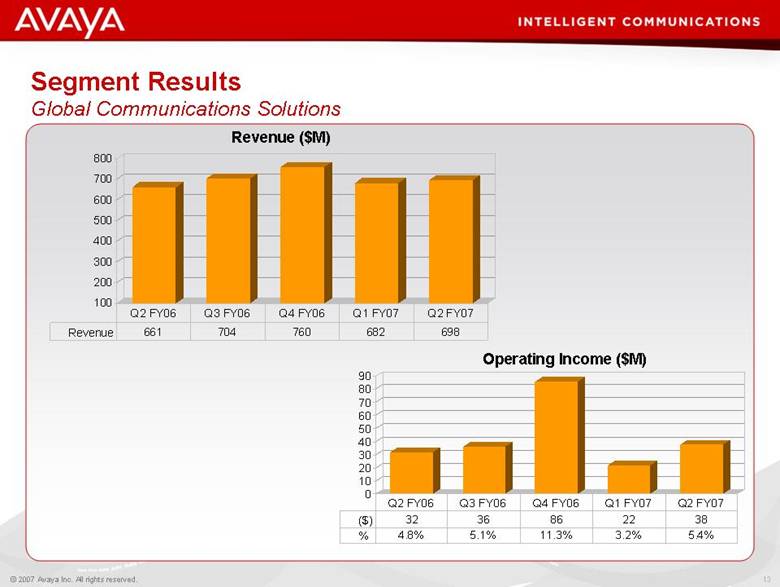
| Segment Results Global Communications Solutions Revenue ($M) Operating Income ($M) 100 200 300 400 500 600 700 800 661 704 760 682 698 Q2 FY06 Q3 FY06 Q4 FY06 Q1 FY07 Q2 FY07 0 10 20 30 40 50 60 70 80 90 32 36 86 22 38 4.8% 5.1% 11.3% 3.2% 5.4% Q2 FY06 Q3 FY06 Q4 FY06 Q1 FY07 Q2 FY07 % ($) Revenue |
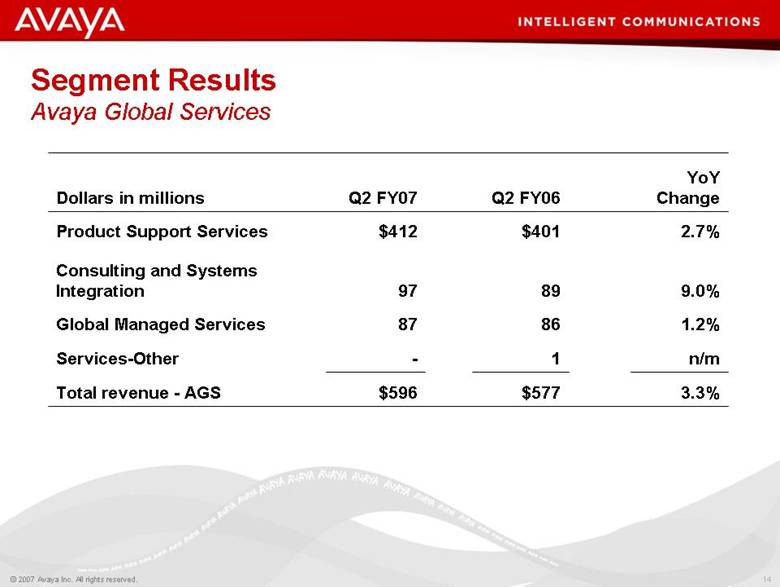
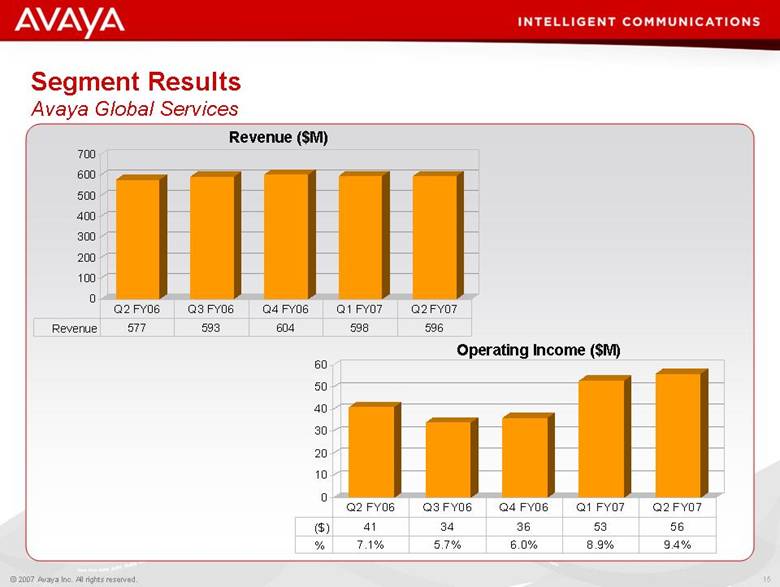
| Segment Results Avaya Global Services n/m 1 - Services-Other 3.3% $577 $596 Total revenue - AGS 1.2% 86 87 Global Managed Services 9.0% 89 97 Consulting and Systems Integration 2.7% $401 $412 Product Support Services YoY Change Q2 FY06 Q2 FY07 Dollars in millions |
| Segment Results Avaya Global Services Revenue ($M) Operating Income ($M) 0 10 20 30 40 50 60 41 34 36 53 56 7.1% 5.7% 6.0% 8.9% 9.4% Q2 FY06 Q3 FY06 Q4 FY06 Q1 FY07 Q2 FY07 0 100 200 300 400 500 600 700 577 593 604 598 596 Q2 FY06 Q3 FY06 Q4 FY06 Q1 FY07 Q2 FY07 Revenue % ($) |
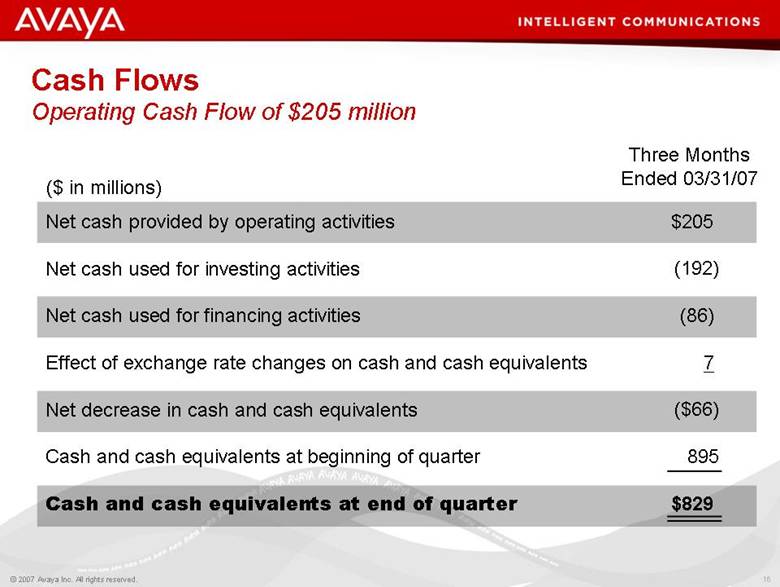
| Cash Flows Operating Cash Flow of $205 million Net cash provided by operating activities Net cash used for investing activities Net cash used for financing activities Effect of exchange rate changes on cash and cash equivalents Net decrease in cash and cash equivalents Cash and cash equivalents at beginning of quarter Cash and cash equivalents at end of quarter $205 (192) (86) 7 ($66) 895 $829 ($ in millions) Three Months Ended 03/31/07 |
| Balance Sheet Cash Cash outlays in Q2: Share repurchases of $94M Ubiquity acquisition of $146M ($M) 726 745 822 899 895 829 0 100 200 300 400 500 600 700 800 900 12/31/05 3/31/06 6/30/06 9/30/06 12/31/06 03/31/07 |

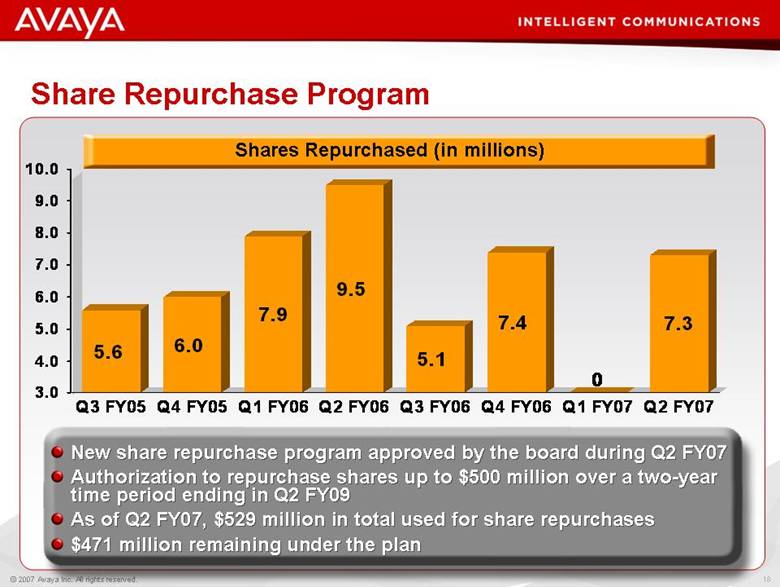
| Share Repurchase Program New share repurchase program approved by the board during Q2 FY07 Authorization to repurchase shares up to $500 million over a two-year time period ending in Q2 FY09 As of Q2 FY07, $529 million in total used for share repurchases $471 million remaining under the plan Shares Repurchased (in millions) 5.6 6.0 7.9 9.5 5.1 7.4 0 7.3 3.0 4.0 5.0 6.0 7.0 8.0 9.0 10.0 Q3 FY05 Q4 FY05 Q1 FY06 Q2 FY06 Q3 FY06 Q4 FY06 Q1 FY07 Q2 FY07 |
| Key Focus Areas Strategy Execution Culture Build value for shareholders |
| Reconciliation of Non-GAAP Operating Income $91 (10) $81 For the three months ended March 31, 2007 Non-GAAP Operating Margin (Non-GAAP Operating Income / Revenue) $73 Non-GAAP Operating Income (20) Restructuring charges, net Item Included in Operating Income: GAAP Operating Margin $53 GAAP Operating Income For the three months ended March 31, 2006 Dollars in millions Avaya defines non-GAAP operating income, non-GAAP operating margin, non-GAAP net income and non-GAAP earnings per share as excluding the impact of restructuring charges, acquisition-related charges and certain income tax items. 4.3% 5.9% 6.3% 7.0% |

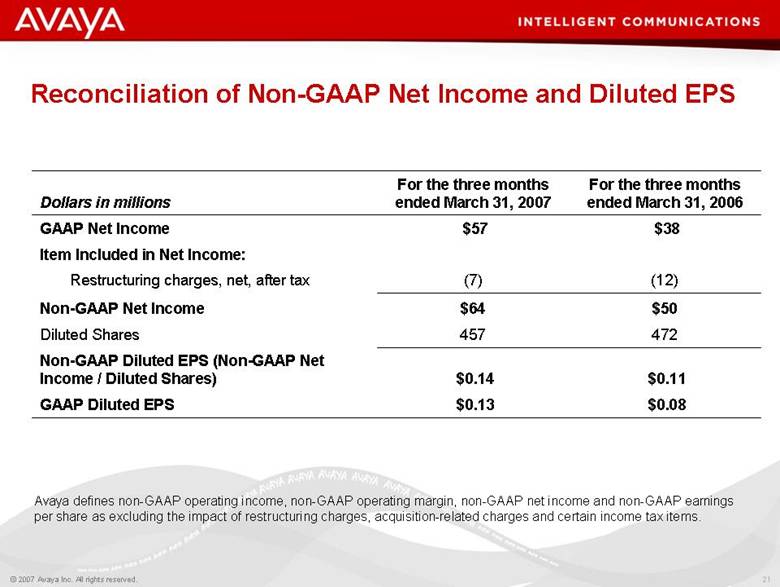
| Reconciliation of Non-GAAP Net Income and Diluted EPS $0.13 $0.14 457 $64 (7) $57 For the three months ended March 31, 2007 $0.08 GAAP Diluted EPS $0.11 Non-GAAP Diluted EPS (Non-GAAP Net Income / Diluted Shares) 472 Diluted Shares $50 Non-GAAP Net Income (12) Restructuring charges, net, after tax Item Included in Net Income: $38 GAAP Net Income For the three months ended March 31, 2006 Dollars in millions Avaya defines non-GAAP operating income, non-GAAP operating margin, non-GAAP net income and non-GAAP earnings per share as excluding the impact of restructuring charges, acquisition-related charges and certain income tax items. |
| Q2 FY2007 Earnings Conference Call April 25, 2007 |