 December 11, 2012 Avaya Q4 2012 Earnings Call Exhibit 99.2 |
 © 2012 Avaya – Proprietary. Use pursuant to your signed agreement or Avaya policy. 2 Forward - Looking Statements Certain statements contained in this presentation are forward-looking statements, including statements regarding our future financial and operating performance, as well as statements regarding our future growth plans and drivers. These statements may be identified by the use of forward-looking terminology such as "anticipate," "believe," "continue," "could," "estimate," "expect," "intend," "may," "might," "plan," "potential," "predict," "should" or "will" or other similar terminology. We have based these forward-looking statements on our current expectations, assumptions, estimates and projections. While we believe these expectations, assumptions, estimates and projections are reasonable, such forward looking statements are only predictions and involve known and unknown risks and uncertainties, many of which are beyond our control. These and other important factors may cause our actual results, performance or achievements to differ materially from any future results, performance or achievements expressed or implied by these forward-looking statements. For a list and description of such risks and uncertainties, please refer to our filings with the SEC that are available at www.sec.gov and in particular, our 2011 Form 10-K and our first, second, and third quarter 2012 Form 10-Q‘s. We disclaim any intention or obligation to update or revise any forward-looking statements, whether as a result of new information, future events or otherwise. This presentation should be read in conjunction with our Form 8-K filed with the SEC on December 11, 2012. Within this presentation, we refer to certain non-GAAP financial measures that involve adjustments to GAAP measures. A reconciliation between our non- GAAP financial measures and GAAP financial measures is included on the last two slides of this presentation, which will be available on our web site at www.avaya.com/investors. |
 © 2012 Avaya – Proprietary. Use pursuant to your signed agreement or Avaya policy. 3 Fiscal Q4 2012 Financial Highlights (Amounts other than Revenue and Cash Balance are non-GAAP unless specified) Revenue of $1.277 billion grew 2% over the prior quarter – Revenue increase comprised of a 3% increase in product revenue and slightly higher service revenue Gross margin of 54.7% continued to improve during the second half of the year just below the historic high in the prior year Operating income grew almost 30% from the prior quarter – Operating margin 16.1%, 3 plus percentage points higher than the prior quarter Adjusted EBITDA improved to $267 million from prior quarter – As a percentage of revenue of 20.9% Cash balance increased 24% from prior quarter |
 © 2012 Avaya – Proprietary. Use pursuant to your signed agreement or Avaya policy. 4 FY 2012 Financial Summary (Amounts in millions) FY 2012 FY 2011 Revenue $5,171 $5,547 Gross Margin 1 54.0% 52.7% Operating Margin 1 13.9% 13.1% Adjusted EBITDA 1 $971 $971 Cash from Operations $44 ($300) Cash and Cash Equivalents $337 $400 1. Non-GAAP - refer to supplemental financial Information accompanying this presentation for a reconciliation of GAAP to non-GAAP numbers. |
 © 2012 Avaya – Proprietary. Use pursuant to your signed agreement or Avaya policy. 5 Income Statement (Amounts non-GAAP (other than Revenue) and dollars in millions) FQ4 2012 FQ3 2012 FQ4 2011 Revenue $1,277 $1,250 $1,419 Gross Margin 54.7% 53.9% 55.0% Operating Margin 16.1% 12.7% 16.9% Adjusted EBITDA $267 $225 $293 |
 © 2012 Avaya – Proprietary. Use pursuant to your signed agreement or Avaya policy. 6 Revenue by Geographic Region (Amounts GAAP and dollars in millions) FQ4 2012 FQ3 2012 FQ4 2011 Revenue U.S. $694 $666 $767 EMEA $327 $330 $382 APAC $126 $128 $133 CALA $130 $126 $137 Total $1,277 $1,250 $1,419 % of Total Revenue U.S. 54.3% 53.3% 54.0% EMEA 25.6% 26.4% 26.9% APAC 9.9% 10.2% 9.4% CALA 10.2% 10.1% 9.7% Total 100.0% 100.0% 100.0% |
 © 2012 Avaya – Proprietary. Use pursuant to your signed agreement or Avaya policy. 7 Fiscal 2012 Balance Sheet and Operating Metrics (Dollars in millions) FY 2012 FY 2011 Total Cash and Cash Equivalents $337 $400 Cash from Operations $44 ($300) Capital Expenditures and Capitalized Software $127 $125 Days Sales Outstanding 55 48 Inventory Turns 10 10 Head Count (as of Sept 30 2012) 16,951 18,588 |
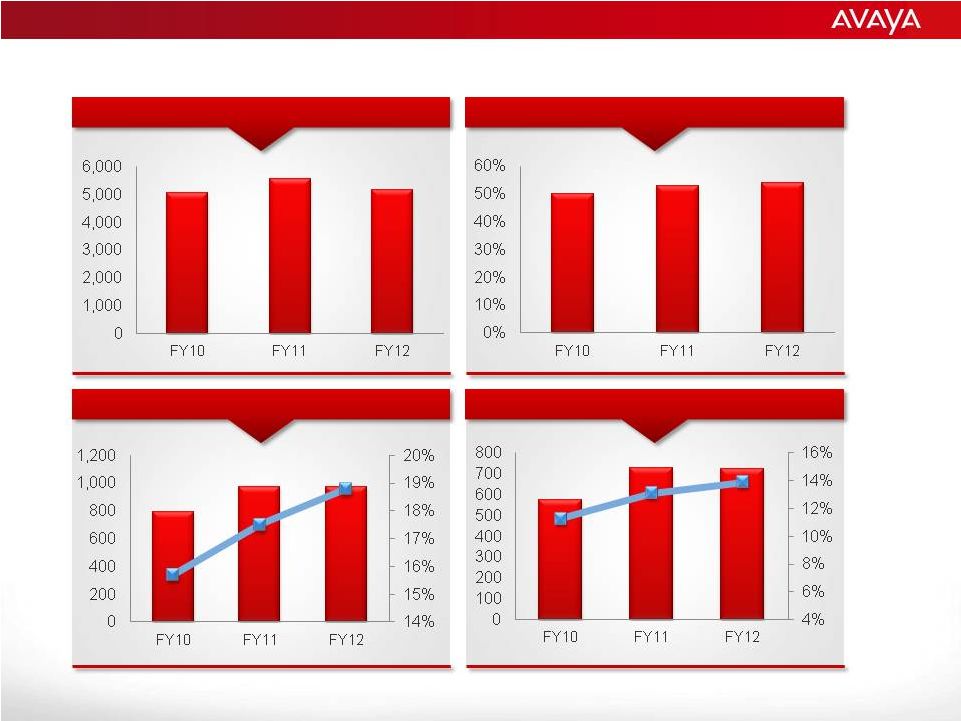 © 2012 Avaya – Proprietary. Use pursuant to your signed agreement or Avaya policy. 8 Gross Margin (1) (%) Operating Income (1) ($M) & Margin Total Revenue ($M) Adjusted EBITDA (1) ($M) & Margin Financial Metrics 1. Non-GAAP - refer to supplemental financial Information accompanying this presentation for a reconciliation of GAAP to non-GAAP numbers. 5,060 5,547 5,171 49.9% 52.7% 54.0% 795 971 971 15.7% 17.5% 18.8% 573 726 721 11.3% 13.1% 13.9% |
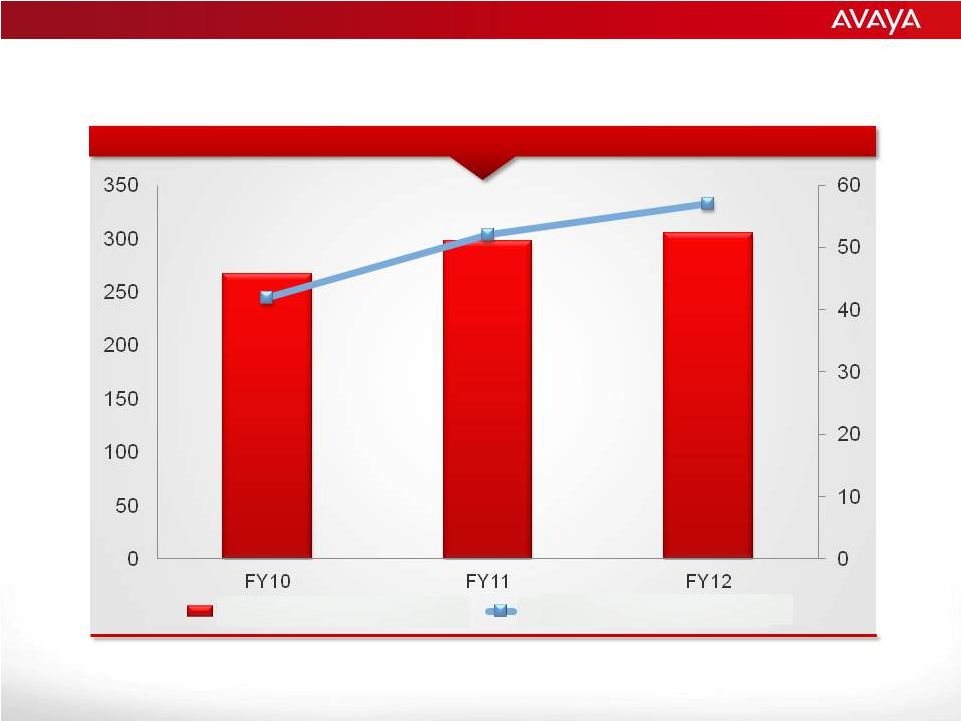 © 2012 Avaya – Proprietary. Use pursuant to your signed agreement or Avaya policy. 9 Avaya Productivity Trend Headcount data as of fiscal year end Revenue and Adjusted EBITDA per Headcount ($K) Revenue per Headcount Adj. EBITDA per Headcount 267 298 305 42 52 57 |
 © 2012 Avaya – Proprietary. Use pursuant to your signed agreement or Avaya policy. 10 Adjusted EBITDA Reconciliation 2012 2011 2012 2011 Net income (loss) 10 $ (99) $ (344) $ (863) $ Interest expense 107 109 431 460 Interest income - (2) (3) (5) Provision for income taxes (54) 79 8 68 Depreciation and amortization 138 155 564 653 201 242 656 313 Impact of purchase accounting adjustments 1 2 3 - Restructuring charges, net 14 23 142 189 Sponsors' fees 2 2 7 7 Acquisition-related costs - 1 4 5 Integration-related costs 5 10 19 132 Loss on extinguishment of debt - - - 246 Third-party fees expensed in connection with the debt modification - - - 9 Non-cash share-based compensation 1 3 8 12 Write-down of assets held for sale to net realizable value 1 - 5 1 Loss on investments and sale of long-lived assets, net - - 3 1 Impairment of long-lived assets 4 - 6 - Reversal of contingent liability related to acquisition (1) - (1) - Loss (gain) on foreign currency transactions 14 (5) 21 (12) Pension/OPEB/nonretirement postemployment benefits and long-term disability costs 25 15 98 68 Adjusted EBITDA 267 $ 293 $ 971 $ 971 $ Avaya Inc. Supplemental Schedule of Non-GAAP Adjusted EBITDA (Unaudited; in millions) EBITDA For the three months ended September 30, For the twelve months ended September 30, |
 © 2012 Avaya – Proprietary. Use pursuant to your signed agreement or Avaya policy. 11 Non-GAAP Reconciliation Sept. 30, Dec. 31 Mar. 31, June 30 Sept. 30, Sept. 30, Sept. 30, Sept. 30, 2011 2011 2012 2012 2012 2010 2011 2012 GAAP Gross Profit 718 $ 704 $ 613 $ 623 $ 646 $ 2,172 $ 2,632 $ 2,586 $ GAAP Gross Margin 50.6% 50.8% 48.8% 49.8% 50.6% 42.9% 47.4% 50.0% Items excluded: Amortization of technology intangible assets 59 50 49 47 46 291 257 192 TSA - - - - - 54 26 - Impairment of capitalized software development costs - - - 2 4 - - 6 Share-based compensation 1 1 1 1 1 5 6 4 Purchase accounting adjustments 2 - 1 1 1 5 - 3 Non-GAAP Gross Profit 780 $ 755 $ 664 $ 674 $ 698 $ 2,527 $ 2,921 $ 2,791 $ Non-GAAP Gross Margin 55.0% 54.4% 52.8% 53.9% 54.7% 49.9% 52.7% 54.0% Reconciliation of Non-GAAP Operating Income GAAP Operating Income (Loss) 84 $ 82 $ (66) $ 23 $ 76 $ (381) (94) $ 115 $ Percentage of Revenue 6% 6% -5% 2% 6% -8% -2% 2% Items excluded: Amortization of acquired assets 117 106 105 104 103 509 483 418 Restructuring and impairment charges, net 23 21 90 21 15 187 189 147 Acquisition/integration-related costs 11 6 6 6 6 228 136 24 Share-based compensation 3 3 2 2 1 19 12 8 Impairment of capitalized software development costs - - - 2 4 - - 6 Strategic initiative costs - - - - - 6 - - Purchase accounting adjustments 2 - 1 1 1 5 - 3 Non-GAAP Operating Income 240 $ 218 $ 138 $ 159 $ 206 $ 573 $ 726 $ 721 $ Percentage of Revenue 16.9% 15.7% 11.0% 12.7% 16.1% 11.3% 13.1% 13.9% Reconciliation of Non-GAAP Gross Profit and Non-GAAP Gross Margin Avaya Inc. Supplemental Schedules of Non-GAAP Reconciliations (Unaudited; in millions) For the Twelve Months Ended For the Three Months Ended |