SECURITIES AND EXCHANGE COMMISSION
Washington, D.C. 20549
FORM 6-K
REPORT OF FOREIGN PRIVATE ISSUER PURSUANT TO RULE 13a-16 OR 15d-16
OF THE SECURITIES EXCHANGE ACT OF 1934
For the month of December 2002
Enodis plc
Washington House, 40-41 Conduit Street
London, W1S 2YQ, United Kingdom
(Address of principal executive offices)
Indicate by check mark whether the registrant files or will file annual reports under cover of Form 20-F or Form 40-F.
Form 20–F: ![]() Form 40–F:
Form 40–F: ![]()
Indicate by check mark whether the registrant by furnishing the information contained in this form is also thereby furnishing the information to the Commission pursuant to Rule 12g3-2(b) under the Securities Exchange Act of 1934.
Yes: ![]() No:
No: ![]()
On or about December 18, 2002, Enodis plc sent to holders of its Ordinary Shares, nominal value 50p, its Annual Report and Accounts 2002, a circular and notice of meeting describing the items to be presented for approval by its stockholders at its Annual General Meeting to be held January 15, 2003 and a proxy card for the meeting.
All of these documents are included in this Form 6-K.
![]()
Back to Contents
| Selected financial and Company information | |||||||||
| Financial | |||||||||
| All £m except as otherwise stated | 2002 | 2001 | Change Nominal % | Change Like-for- like % | * | ||||
| Food Service Equipment sales | |||||||||
| North America | 469.9 | 498.7 | (6 | ) | 1 | ||||
| Europe/Asia | 144.4 | 185.4 | (22 | ) | (7 | ) | |||
| Global Food Service Equipment | 614.3 | 684.1 | (10 | ) | (1 | )*** | |||
| Food Service Equipment operating profit** | |||||||||
| North America | 60.8 | 62.6 | (3 | ) | 3 | ||||
| Europe/Asia | 9.7 | 17.7 | (45 | ) | (35 | ) | |||
| Global Food Service Equipment | 70.5 | 80.3 | (12 | ) | (4 | ) | |||
| Food Retail Equipment sales | 152.8 | 203.1 | (25 | ) | (17 | )*** | |||
| Food Retail Equipment operating profit** | (3.3 | ) | 10.4 | (132 | ) | (194 | ) | ||
| Group profit before tax, goodwill | |||||||||
| amortisation and exceptional items | 38.0 | 63.8 | (40 | ) | |||||
| Exceptional items | (104.8 | ) | (149.8 | ) | (30 | ) | |||
| Loss before tax | (85.8 | ) | (109.0 | ) | (21 | ) | |||
| Adjusted diluted earnings per share(p) | 10.4 | 16.3 | (36 | )*** | |||||
| Dividend per share (p) | – | 2.0 | |||||||
| Free cash flow | 64.4 | 61.7 | 4 | ||||||
| Cash conversion days at period end†(days)*** | 44.6 | 47.1 | |||||||
| Net debt | (186.1 | ) | (365.9 | ) | (49 | ) | |||
| Return on capital employed††(%)*** | 7.0 | 8.1 | |||||||
| EBITA margin (%)*** | 8.6 | 9.2 | |||||||
| *Continuing businesses only at consistent foreign exchange rates | |||||||||
| **Before goodwill amortisation and exceptional items | |||||||||
| ***Our key financial measures | |||||||||
| †A measure of working capital conversion based on inventory, debtor and payable days | |||||||||
| ††A 12 month average of post tax earnings divided by shareholders’ funds respectively adjusted for the effects of interest, net debt and goodwill | |||||||||
| Company information | |
| Employees | 6,300 |
| Factories | 28 factories in 8 countries |
| Enodis master distributors | In 5 countries |
| Third party master distributors | Over 900 in over 140 countries |
| Authorised service agencies | Over 1,500 worldwide |
| Enodis Technology Center | Florida |
| Stock exchange listings | London, New York |
| |||
| Vision and strategy | 01 Enodis annual report and accounts 2002 |
| OUR VISION | ||
| IS TO BECOME THE CLEAR WORLD LEADER IN FOOD SERVICE EQUIPMENT THROUGH PASSION FOR CUSTOMER SATISFACTION | ||
| OUR STRATEGY | ||
| – | PASSION FOR CUSTOMER SATISFACTION BEFORE, DURING AND AFTER THE SALE | |
| – | FOCUS ON MAJOR MARKETS, LEADING PRODUCTS AND BRANDS, KEY ACCOUNTS | |
| – | EXCELLENCE IN PRODUCT, DISTRIBUTION AND SERVICE | |
Back to Contents
| Chairman’s statement | 02 Enodis annual report and accounts 2002 |
| Repositioned for the future | |
Overview The year to 28 September 2002 has seen further significant progress with net debt substantially reduced, refinancing completed and improved operating performance in Food Service Equipment – North America on a like-for-like basis (i.e. after adjusting for the impact of disposals and foreign exchange rate movements).
Our new executive team has come together well and made real progress. We have developed a clear strategy for the future which has achieved a high level of buy-in from around the Group.
All of this has been achieved against a difficult trading background with a decline in markets in both North America and Europe. The level of Food Service Equipment purchases by our customers has declined, which we believe was due to economic uncertainty and reduced confidence.
At the same time as reflecting progress in repositioning the Group, our results show a substantial loss before tax of £85.8m including £114.0m of goodwill write-offs as a result of disposals and an impairment of Kysor Warren goodwill. We believe our strategy will result in significantly enhanced performance over time and the Board and our management team is committed to delivering improved results and thus re-building shareholder value.
The steps taken this year have been necessary to reposition the Company and to assist us to deliver on this commitment.
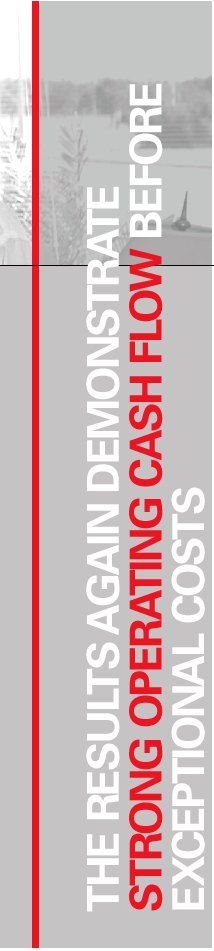
Financial Despite the difficult trading and economic background, we successfully restructured our debt and increased our capital base during the year.
The principal elements of the refinancing were a 3 for 5 Rights Issue that raised £70.3m (net), the issuance of £100m 10 3/8% Senior Subordinated Notes and the negotiation of new Senior Credit Facilities.
The entire refinancing programme required a significant amount of management input in the first half of the year but as a result Enodis has now emerged with an appropriate capital structure for the immediate future.
During the year a number of non-core businesses were sold. The disposal of these businesses – Sammic, Belshaw, Austral, Aladdin Temp-rite and Prolon – together with further receipts arising in connection with the sale last year of our Business and Consumer Products Division, raised £88.6m. These disposals resulted in a net loss of £38.1m but were an important step in the refocusing of our business and contributed to the reduction in debt.
Our closing net debt of £186.1m almost halved from the £365.9m at the previous year end – and is over £300m lower than the net debt at March 2001. This is an achievement in which we can take pride.
Back to Contents
| 03 Enodis annual report and accounts 2002 Chairman’s statement | |
 |  | THE YEAR HAS SEEN FURTHER SIGNIFICANT PROGRESS | ||||
|
|
| ||||
| Results Trading in our core Global Food Service Equipment business was generally robust given the difficult market conditions, although there were some disappointments – particularly at two UK units. Dividends No dividend is to be paid this year. People A number of Board and senior management changes were announced during the year. | Dave Odum, former President of the Food Retail Equipment business, resigned from the Board in May 2002. Our staff, throughout the organisation, have worked tirelessly, often in difficult circumstances, to deliver our goals and take the actions necessary to successfully implement our strategy. I would like to take this opportunity to thank all our employees for their hard work and support during the last year. Current trading and outlook Our expectations of the full year results for the current year are unchanged from the time of our third quarter results announcement. | We are confident that the current year will see Enodis delivering further market share gains and improved financial performance even if, as we expect, conditions in our key North American markets show no improvement. Year on year quarterly performance comparisons are expected to improve as the year progresses. Conclusion Our vision is to become the clear world leader in Food Service Equipment through passion for customer satisfaction.
Peter Brooks | |||

Back to Contents
| Chief Executive Officer’s review | 04 Enodis annual report and accounts 2002 |
| Establishing Enodis as the clear world leader in Food Service Equipment | |
| GAINING COMPETITIVE ADVANTAGE THROUGH LEVERAGING THE GROUP’S SCALE, PRODUCT RANGE AND LEADING BRANDS |  |  |
| |||
| ||||||
| Overview Overall we believe the year has seen substantial progress as we have restructured, refocused and repositioned the Group in order to achieveour objective of becoming the clear world leader in food service equipment. We have disposed of non-core businesses, refinanced our debt and refocused our organisation and strategy. As a result, we believe the Group is now well positioned to deliver on its strategy to create shareholder value. We have increased like-for-like operating profits in our Food Service Equipment – North American business despite a background of weak markets. Actions are well progressed to address weaker performance in Food Service Equipment – Europe/Asia, principally in two UK businesses, and losses at Kysor Warren which have adversely affected the results. During the second half of FY01 and the first quarter of FY02 we acted to reduce our cost base significantly in the light of declining markets. Cost savings have been delivered on plan benefiting margins in our important Food Service Equipment – North America businesses. We believe we have gained share in difficult North American markets. In addition, we have achieved share gains in certain product categories in Europe. | As the Chairman mentions in his statement, Kysor Panel Systems increased profits, with Kysor Warren incurring significant losses. Returning our Kysor Warren business to profitability is one of our key priorities. Vision Our vision is to establish Enodis as the clear world leader in Food Service Equipment through passion for customer satisfaction. Financial goals We have established a number of financial goals including organic sales growth of 5% pa, for Food Service Equipment operating margins of 15%, return on capital employed of greater than 10%, cash conversion days of less than 40, and growth in adjusted earnings per share of 15%. These goals represent targets to be achieved over the medium to long term assuming constant exchange rates and no changes in the composition of the Group. | Our markets Long-term trends in our markets are favourable, with lifestyle changes driving continued growth in the sales of food and beverages for consumption outside the home. The US food service market alone is forecast to grow by well over 40% by the end of this decade to more than $575bn. Though these long term trends are well established in North America, in the short term, equipment sales are impacted by general economic factors and customer confidence. Our strategy We believe that we continue to make good progress in implementing our strategy to establish Enodis as the clear world leader in Food Service Equipment. A wide range of actions is being developed to take customer satisfaction to a new level, focusing on actions required before, during and after the sale. | ||||
|
| |||||
Back to Contents
05 Enodis annual report and accounts 2002 Chief Executive Officer’s review |
BUSINESS FOCUSED ON THREE
KEY AREAS: MAJOR MARKETS,
LEADING PRODUCTS AND BRANDS
AND KEY ACCOUNTS

We have focused our business on three key areas:
– major markets where we are evolving our organisation to focus on profitable share gain with country specific strategies and working closely with our distribution channel partners.
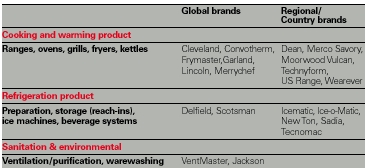
– leading products and brands where our objective is to establish more of our global and regional/country brands as leaders in their markets.
– key accounts where we are establishing single points of contact, nationally, regionally and globally to provide local and global coordination with a focus on solutions and innovation to gain share.
Our enablers We have identified a number of “enablers” which we must manage well to be successful.
People Bob Eimers, Executive Vice President Global Human Resources, has been appointed to the Board, demonstrating that we believe people are a source of competitive advantage. We have made a number of significant new senior managerial appointments, including the strengthening of our central operating resources in areas such as Group purchasing, operations, parts and service and marketing. We have introduced succession planning and performance management processes.
Many of our leadership team have attended leadership skills training, and we are carrying out key account and strategic selling training. Further details are included in Bob Eimers’ Human resources review.
IT systems Our operating companies work with a range of different systems, processes and procedures. Our objective is to establish common systems and processes in North America and common ways of doing business. Europe will follow later. New Enterprise Resource Planning (ERP) systems are currently being implemented at Garland, with best practice teams established to develop the model that will be introduced across the Group.
The recruitment of a Chief Information Officer is planned to drive progress in this area.
Technology Center Our Technology Center in Tampa, Florida, is a unique facility in the industry.
It provides an excellent resource for us to work with customers to find solutions to their cooking requirements. Current projects include a number of significant developments for major chains, and we continue to introduce a steady pipeline of new products, including 30 last year. We believe we are a leader in providing solutions in areas such as speed and flexibility, safety, energy, automation and environmental.
Global service and global distribution Service is a critical issue for our customers. In North America we have formed the Enodis Service Council so we can work in partnership with our independent service agents to improve service to our customers including a “no hassle warranty”. In the rest of the world we are planning to build on our existing Frymaster, Garland, Scotsman and other service networks to make better use of our resources.
We have now aligned our sales representatives in all but one territory in North America, and are exploring ways of leveraging our scale to improve our distribution capabilities. Additionally, we are considering how to improve parts availability and the profit generated by this business.
Operations – best practices and assured quality Some of our plants are world class: the Scotsman plant in Fairfax, South Carolina, for example, has received an award for being in the top 25 plants in the USA across all industries. Similarly, Frymaster consistently receives very high marks in customer audits. However, other plants require improvement.
Our objective is to introduce relevant best practices and assured quality across all of our 28 plants.
This is being achieved by groups establishing and spreading best practice, and by the introduction of task forces to develop plans and monitor progress for the companies where performance is below standard.
Leading products and brands
Enodis has an outstanding portfolio of leading products and brands, which we will continue to enhance through focus on quality, new product development and more effective marketing.
Our objective is to make more of our brands leaders in their own markets, whether global or local.
| 06 Enodis annual report and accounts 2002 Chief Executive Officer’s review |
| OUR VALUES ARE BUILT UPON SEVEN KEY AREAS: CUSTOMER FOCUS, INTEGRITY,TEAMWORK, PARTNERSHIP, RESULTS FOCUS, LEADERSHIP AND RESPECT |

Tight financial management
We have identified tight financial management as a critical enabler for success and are promoting a culture of discipline across the Group.
Our progress in successfully implementing our strategy reinforces our confidence that we will continue to make market share gains and improve financial performance even with North American markets remaining at current levels, as we expect, for 2003.
Results FY02 profit before tax, goodwill amortisation and exceptional items was £38.0m (2001: £63.8m). Compared to FY01 the impact of the loss of operating profits from businesses sold in 2002 and 2001 (including Magnet) was £15.9m with an offsetting interest benefit of approximately £7.0m.
FY02 operating profit* was £67.3m (£99.9m). The reduction is principally due to the effect of businesses sold in FY02 and FY01 (£15.9m), Food Service Equipment Europe/Asia (£4.7m) and Food Retail Equipment (£10.8m). Underlying performance at Food Service Equipment North America is up 3%. The weakening dollar has reduced operating profits in FY02 by £1.3m.
Food Service Equipment – North America margins increased from 12.6% to 12.9%. Food Service Europe/Asia margins declined from 9.5% to 6.7%. Food Retail Equipment margins were negative 2%.
Return on capital employed in FY02 was 7.0% (2001: 8.1%).
*Throughout this annual report, “operating profit” represents operating profit before goodwill amortisation and exceptional items.
Exceptional items Net cash inflow from exceptional items was £42.3m predominately due to disposal proceeds.
The exceptional losses in the year were £104.6m (including £114.0m of goodwill relating to disposals and the Kysor Warren impairment review undertaken in Q3).
More details are included at note 4 to the attached financial statements.
Operating cash flow, after capital expenditure, in the year was £91.0m (£104.5m) reflecting underlying operating performance, lower capital expenditure and improved working capital management.
Furthermore, exceptional cash inflows (see above) and the net proceeds of the Rights Issue contributed to a reduction in debt from £365.9m at 29 September 2001 to £186.1m at 28 September 2002.
Lower average debt balances during the year have led to a reduced pre-exceptional interest charge of £29.3m (£36.1m). We are targeting further reduction in debt, principally from operating cash generation and focus on cash conversion days.
Global Food Service Equipment
Global Food Service Equipment comprises our operations in North America, approximately 76% of Food Service Equipment sales, and our operations in Europe/Asia.
We offer a range of heavy kitchen equipment to the food service industry. We believe competitive advantage is achieved
through leveraging the Group’s scale, product range and leading brands, technology and relationships with distributors, dealers and service partners, end-users and suppliers.
We believe that, overall, there is continuing growth in food and beverage sales as lifestyle changes increase demand for prepared food, eaten out or ordered in. Available data indicates food and beverage sales in the USA are likely to grow by up to 4% in calendar 2002. Choice and variety are increasing as multi-cultural influences impact food and beverage offerings all over the world. Health trends are also impacting menu and beverage choices. Food safety and environmental concerns both inside and outside the restaurant have increased.
Despite this positive long-term backdrop for food service equipment suppliers, difficult economic conditions in the US and elsewhere have led our customers to defer capital expenditure.
The market for food service equipment in North America has been weak throughout the period. We believe the market overall is down some 2% compared to the prior year, reflecting mixed performance by customer segment, product category and significant pricing pressure.
In Europe, as we expected, the market has continued to decline and our assessment is that overall it is down by between 5% and 12%, with significant pricing pressure particularly in the UK.
FY02 like-for-like sales of our North American operations, including exports, were up by
1% with an increase of 3% in USA domestic turnover, a robust performance given the market conditions and reflecting share gains. Sales at £469.9m were down on the prior year; however this is principally due to the effect of disposals and adverse foreign exchange.
Operating profits in Food Service Equipment – North America of £60.8m were up 3% on a like-for-like basis. The decline over the prior year reflects the impact of disposals (£1.8m) and adverse foreign exchange effects. Operating margins increased to 12.9% from 12.6% in the prior year.
Encouragingly, in Europe our Convotherm, Merrychef and beverage businesses improved performance and our European Ice businesses continued to deliver a good return on sales. However, overall sales declined 22% to £144.4m, which is 7% down on a like-for-like basis – principally in the UK. Operating profits were down 45% (35% on a like-for-like basis) again predominantly due to performance of two UK businesses where problems associated with low volumes, product launches and increased fixed capacity costs have impacted profitability.
Total sales in Global Food Service Equipment at £614.3m were down 1% on a like-for-like basis, as the steady performance in North America offset the reduced European performance. Global Food Service Equipment operating profit is £70.5m, down 4% on a like-for-like basis.
07 Enodis annual report and accounts 2002 Chief Executive Officer’s review |
 |
|
| |
| |||
Food Retail Equipment Returning Kysor Warren, and thus Food Retail Equipment, to profitability is a key priority. A turnaround plan is well underway at Kysor Warren and further details are provided in the Chief Operating Officer’s review. The Sarbanes-Oxley Act | This is important legislation designed to re-establish the credibility of accounting, financial reporting and corporate governance in the USA. We have taken extensive legal and accountancy advice and carried out significant additional procedures to ensure that we are in compliance with the Act as it currently applies. Employee and channel partners
Andrew Allner |


| Chief Executive Officer’s review | 08 Enodis annual report and accounts 2002 |
| Good progress in difficult markets | |


Overview As part of our effort to reduce debt and to improve focus, the Group slimmed down its operations last year. The disposal of a number of non-core businesses, together with the closure of our Booth beverage business, and the relocation of the Dean fryer operation from Los Angeles to Shreveport, resulted in eight fewer plants.
Significant progress was made in rebalancing the Group. The objective is to create the benefit of a single Enodis Operating Company, with decentralised units working as a team to implement best practices and integrate sales and service efforts.
Internally, we are developing common approaches to purchasing, manufacturing processes, research and development, information technology, marketing and human resources. Externally we are focusing on channel partnerships and customer service before, during and after the sale, as well as developing stronger relationships with major end customers.
Our objective is to make every part of our business more efficient, and in turn to make Enodis an easy company to work with. We believe that this will assist us to move towards profitable market share gains around the world.
The market The markets in which we operate are changing quickly and moving in directions that play to our strengths.
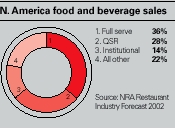
We manufacture and supply heavy kitchen equipment for customers who include full serve and quick serve restaurants, hotels, institutions and many smaller segments.
Despite widespread economic uncertainty, there is continued growth in the demand for prepared food that is to be eaten out or ordered in. This is a trend based upon enduring changes in lifestyle throughout the western world. While health trends, food safety concerns or new cultural/culinary influences might affect menus, they do not reduce the overall pattern of consumption.
The National Restaurant Association reported that food and beverage sales in the USA – the world’s largest market – had increased by 2.3% in calendar 2001 and are forecasting a further growth of 3.9% in calendar 2002. Nonetheless, though the overall trend continues to be upward, current worries in the global economy have resulted in the deferral of capital equipment purchases. We estimate the food service equipment market dropped by approximately 10% in North America in 2001. The market sharply declined early last fiscal year, partially recovering to end the period with a 2% fall over the prior year.
09 Enodis annual report and accounts 2002 Chief Operating Officer’s review | |

COMMITTED
TO INNOVATION
AND PRODUCT
DEVELOPMENT
The markets in Europe were, as expected, much more mixed and based on available data, we believe were down anywhere between 5% and 12%.
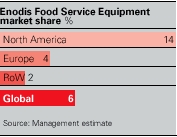
Worldwide, we estimate the food service equipment market to be worth around $14bn split thus: North America (33%), Europe (31%), AsiaPacific (20%), and the Rest of the World (16%).
Large chains are acquiring additional brands to diversify their portfolios. They are changing working methods and/or menus in response to health, safety and other trends in consumer choice. Global contract catering giants are emerging from a series of rapid acquisitions. More and more non-traditional outlets such as convenience stores and petrol stations are serving both cold and hot food. Premium coffee brands are expanding globally and increasing their food offering.
Already the majority of US chain new store builds are outside the USA, creating demand for global service, and global manufacturing.

10 Enodis annual report and accounts 2002 Chief Operating Officer’s review | |

WORKING IN
PARTNERSHIP
WITH OUR
CUSTOMERS
TO PROVIDE
FOOD SERVICE
SOLUTIONS
These are developments from which Enodis is in a particularly strong position to benefit. We have 28 manufacturing plants in eight countries, master distributors in more than 140 countries and an extensive global service network that supports both our dealer network and end customers.
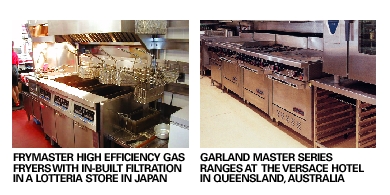
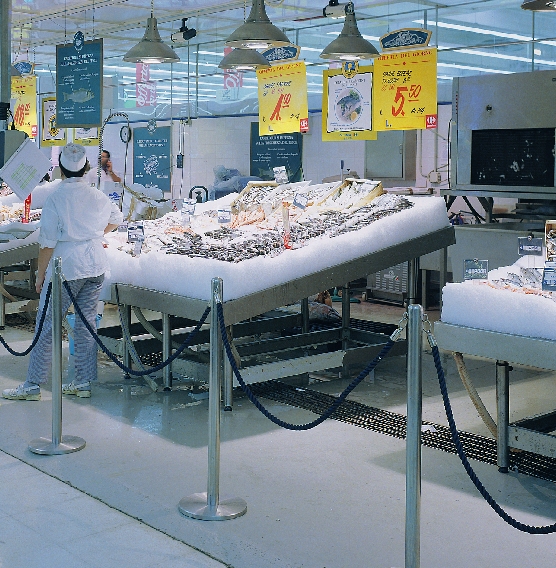
Our product portfolio aready covers the core of any commercial kitchen including cooking and warming equipment, preparation, refrigeration and ice machines, ware-washing and air purification/ventilation systems. In addition we have a Technology Center in Florida, which works with customers to develop innovative equipment to meet new requirements, or to increase the speed, flexibility, or efficiency of existing types of equipment
Meeting the requirements of global customers locally
Globalisation might mean seeing restaurant brands that we recognise wherever we travel. But behind the scenes there are many local requirements: electrical voltages, specific country or regional product approvals, metric/imperial measurements, space constraints, language, local menu items, and many more. Tariff barriers can also significantly increase the landed cost of equipment, in addition to freight costs.


| 11 Enodis annual report and accounts 2002 Chief Operating Officer’s review |
The expansion of global chains outside the USA has created a new demand for local manufacturing. Enodis is responding:
– our Scotsman ice group manufactures different styles of ice machine to fit different markets from six plants in North America, Europe and Asia. The company is thus ideally placed to meet the demands of global, regional, and local customers through an extensive distribution and service network.
– the need for European manufacturing of a Delfield display case to a global specification, was met by our Viscount plant in Sheffield, UK.
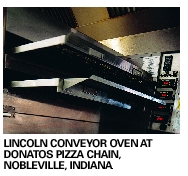
– Merrychef, based in the UK, worked in conjunction with Garland in North America and the Enodis Technology Center, to develop a specific oven for a major doughnut chain rollout which has just begun. When volumes increase, Garland will assume manufacturing for North America.
– we are expanding our joint venture plant in Thailand to accommodate manufacturing of Delfield refrigerators and Scotsman ice machines for the ASEAN region.
– our German-based, combi-oven business, Convotherm, has manufacturing partners in the USA and Australia/New Zealand to facilitate regional supply.
– VentMaster has plants in Canada, the USA and UK with licensed manufacturers in several other countries to support production
of a global air purification product.
– manufacture of certain products in Brazil, Japan and China are underway for a major hamburger chain to reduce costs.
By responding to specific customer needs, we will further develop local manufacturing and global products.
Leading products and brands Enodis introduced more than 30 new products over the course of the year. Among the most significant were:
– Garland’s Moisture Plus oven, which implements the latest technology of adding steam to the convection oven cooking process without the expense of a boiler, in order to increase cooking speed and improve food quality.
– Delfield’s safe chill/blast chiller can blast-freeze a rib roast, and soft-chill croissants simultaneously.
– The Scotsman “Eclipse” remote air-cooled cube ice machine mounts the condenser and compressor on the roof top for quiet operation and less heat build-up in the restaurant.
– Cleveland’s humidity controlled CombiCraft oven produces consistent results for maximum food quality and yield. Automatic fan reversing and controlled moisture gives more versatility and faster production.
| 12 Enodis annual report and accounts 2002 Chief Operating Officer’s review | |
– Ice-O-Matic’s AgION ice machines mould an antimicrobial compound into key components to help prevent the growth of bacteria. This compound works 24 hours a day, 7 days a week destroying and inhibiting the growth of unwanted microbes.
– Scotsman’s one-hand dispenser is ideal for hospitals, offices and cafeterias. It provides a compact, high tech, tabletop “TouchFree” ice and water dispenser with a unique infra-red sensor to control the dispensing of ice, water or both.
The pipeline of new projects at the Enodis Technology Center (ETC) and within our operating companies remains large, including an advanced fryer and a high speed oven for two global chains.
We have recently enhanced our capabilities at the ETC by hiring specialists in microwave electronics and refrigeration. Ice machine expertise will be added in 2003.
Global distribution Our dealer/distributor network is vital to the success of our Company and we remain absolutely committed to our channel partners.
In the USA, most of our operating companies ship directly to dealers. Ice machines, on the other hand, reach dealers from a network of territory distributors who hold local inventory and administer local service.
The alignment of our sales representatives was almost completed during the year, resulting in a very powerful field sales force selling our complete product line in each US territory. This was under scored by a 6% increase in sales through US representatives in fiscal 2002.
Enodis has also launched a Dealer Council as a forum for formal two-way communication. This has been extremely valuable in helping us to understand issues, and work together on solutions and strategy. Our goal is to develop stronger partnerships with dealers and buying groups who provide:
– exceptional support to Enodis, and
– value-added services to our end users.
Sales to the top 25 dealers in USA increased by 10% in fiscal 2002.
In Canada, the UK, Germany, France and Spain, Enodis has its own master distributors to
interface with the dealer community providing local warehousing, local currency price lists and administration of a country-wide service network.
Last year, we consolidated more Enodis products through these master distributors with particular success for Delfield, Merrychef and Jackson in Canada and Convotherm in France. Throughout the rest of the world we use third party master distributors.
Going forward, we will concentrate our efforts on major markets and intend to set up Enodis sales offices in those where we do not currently have a master distributor.
Global service Our service network is equally vital. Enodis has an extensive network of authorised third-party service agencies around the world, supported by parts and service specialists at each of our operating companies.
We provide training to these agencies and normally ship parts to them within 24 hours.
We have created a new position of Vice President – Global Service to provide executive level focus on parts and service. A Service Council was established in the USA, and meetings held with major global accounts to understand their issues and requirements.
| 13 Enodis annual report and accounts 2002 Chief Operating Officer’s review | |
 | IMPROVING OUR | |
 |  | |
| 14 Enodis annual report and accounts 2002 Chief Operating Officer’s review | |
OUR PRODUCT
PORTFOLIO
COVERS THE
CORE OF ANY
COMMERCIAL
KITCHEN
We are developing strategies to meet these needs and evolve a stronger, more consolidated network of service agency partners.
IT systems Many initiatives are underway to improve the flow of information to end users, foodservice consultants and industry partners.
Our US websites now have a common homepage layout, enabling users to move directly from one Group site to another.
Teams have been working all year on common identification codes to facilitate the development of Enodis sites for reps, dealers, buying groups, service agencies and end customers.
Regular Enodis University classes are held at the ETC to educate our industry partners on Enodis’ products and technological developments. These are supported by a commitment to training and demonstrations at our facilities worldwide.
Also during the year we began the implementation of a common ERP system. This began at Garland, and will be introduced into Scotsman and Lincoln during 2003. Further implementations will follow.

| 15 Enodis annual report and accounts 2002 Chief Operating Officer’s review |


Operating performance – Food Service Equipment Overall, the Global Food Service Equipment group achieved our expectations. In North America, we saw a robust performance. Underlying sales were up 1%, with a domestic sales increase of 3% partially offset by a 5% decline in export sales.
Underlying operating profit was up 3%, and margins improved from 12.6% to 12.9% in the face of aggressive price discounting. This was achieved through a combination of the tough cost actions taken in mid 2001 and again in early 2002, taking advantage of opportunities to leverage our purchasing effort, and the consolidation of Dean Fryers at our Shreveport facilities.
Operating cash flow in North America improved by £4.3m through an intense focus on cash conversion days. We were delighted to see six of our eight operating companies achieve our target of 40 days, and the Food Service Equipment North America group improve to 40.1 days from 44.8.
Performance in Europe and Asia was a mixed story. Underlying sales decreased by 7% in extremely tough markets. We believe we lost share in some businesses as they restructured. However, we were very pleased by growth in three companies particularly Merrychef’s growth of 28%.
Underlying profit decreased by 35% due to volume declines and price discounting which could not be fully offset by our cost reduction efforts. This was exacerbated by operating problems in two UK companies partially offset by significant improvement over prior years in four of our 10 business units. Actions have been taken to reposition the UK companies for fiscal 2003. In the European/Asia Ice group, margins were resilient in the face of market declines.
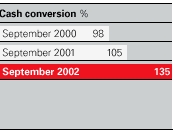
Operating cash flow was very healthy at a conversion rate of 143%.
While the overall Europe/Asia results were poor, we are encouraged by the robust performance at several units, and the commercial possibilities for growth by leveraging brands, technology and facilities.
Overall, the global Food Service Equipment group achieved an EBITA margin of 11.5% compared to 11.7% last year, and our long-term goal of 15%.
In the aggregate, we believe that this is a creditable result given a highly competitive and fractured market, which featured significant price discounting.
Clearly we are not satisfied with this level of profitability, and intend to improve under-performing units, and implement best practices across the Group to achieve 15% EBITA margin over time.
| 16 Enodis annual report and accounts 2002 Chief Operating Officer’s review |
| MEETING THE REQUIREMENTS OF GLOBAL CUSTOMERS LOCALLY |
Operating performance – Food Retail Equipment While Kysor Panel Systems performed very well, Kysor Warren's market share decline and operational problems resulted in the Group as a whole performing well below expectations.
Full year sales at £152.8m are 25% down on prior year, 17% on a like-for-like basis. We made operating losses of £3.3m (2001: profit £10.4m) with Kysor Panel Systems profits up 10% and lost contribution as a result of the disposal of Belshaw and Austral of £2.8m. Food Retail Equipment losses in FY02, excluding profits of businesses disposed of, amounted to £5.5m.
An entirely new executive team has been recruited at Kysor Warren, led by Ralph Schmitt who has considerable experience in business turnarounds.
David Frase, the experienced leader of Kysor Panel Systems, now heads the Kysor Group and is bringing to Kysor Warren a proven commitment to customer satisfaction.
Initiatives focusing on quality, productivity, and customer service are in their early stages with signs of progress apparent.
Cash inflow was £2.1m compared to £8.6m last year.
Implementation of best practices During the year, we recruited Bob Nerbonne as VP – Operations and Tom Tetlow as VP – Purchasing, joining Jerry Sank our VP – Technology, and stepped up our efforts to cross–fertilise best functional practices across the Group.
Achievements included substantial improvements in safety, cash conversion days and material costs.
We were also honoured that our Scotsman plant in Fairfax, South Carolina, was voted one of the top 25 best plants in the USA by Industry Week magazine.
Going forward, we are committed to a continuing drive for improvement – with customer satisfaction as the number one measure. In this respect, our companies will follow the best practices of Scotsman, Frymaster, Cleveland and Convotherm. We intend to develop standard performance metrics, supplemented by customer surveys.

17 Enodis annual report and accounts 2002 |


Summary Fiscal 2002 was a challenging year in the face of difficult markets. While Retail Equipment performance was disappointing, Food Service Equipment operations performed adequately overall, with particularly robust performance in North America.
We made good progress in the introduction of new products, in distribution and service strategies, and we expanded our global manufacturing activities. We improved the quality of our team and enhanced our teamwork to leverage Enodis' Group strength, while maintaining the individual strengths of our operating companies. Our functional leaders made progress in implementing best practices.
Conclusion We look forward to 2003, committed to increasing customer satisfaction and improving shareholder value.

| Human resources review | 18 Enodis annual report and accounts 2002 |
| People: the competitive advantage |
WE HAVE MADE SIGNIFICANT PROGRESS WITH A NUMBER OF PEOPLE-ORIENTED INITIATIVES


When competent and highly motivated people are lined up behind the business strategy of a focused organisation, the chances of success in the market place are much improved.
So, with a clear strategy now in place, Enodis is seeking to ensure that we have the right people in the right places with the intention of gaining real competitive advantage in the food service equipment industry. Additionally, we have made significant progress in this respect during the past year through a number of people-oriented initiatives.
Performance management For the first time, we have introduced a performance management system across most of our operating companies and staff functions. Managers are now equipped with an HR system designed to align people’s contributions with the Company’s values and requirements, through participative goal-setting, performance feedback and personal development planning. The intention is to improve overall results by providing greater clarity around personal objectives and performance levels.
Succession planning A number of business authors and researchers have directly related leadership ability to the successful execution of business strategies. For that reason we have introduced
| 19 Enodis annual report and accounts 2002 Human resources review |
OPPORTUNISTIC RECRUITMENT HAS BEEN SUCCESSFUL
MANAGERS ARE NOW EQUIPPED TO ALIGN PEOPLE’S CONTRIBUTIONS WITH THE COMPANY’S VALUES AND REQUIREMENTS
succession planning in order to systematically evaluate and upgrade executive strength and depth Group-wide. Succession planning is a way of anticipating important position vacancies and recognising opportunities for the development of our people.
Each Enodis business unit is now required to critically evaluate its organisational structure and management team for the purposes of improvement and development.
Effective succession planning not only helps in the replacement of key individuals who are nearing retirement, but is also a means of identifying individuals with high potential earlier in their careers.
Enodis operating companies are now encouraged to recruit individuals who will not only perform capably in today’s positions, but who also have the potential to assume more senior positions tomorrow.
Opportunistic recruitment Outstanding individuals occasionally become available in the marketplace, and Enodis opportunistically recruits these high-achievers, even if there is no specific position for them to fill. To date, this strategy has been successful, as these individuals have readily adapted to their new roles.
Cross-company transfers Enodis is composed of a number of separate operating companies spread across the globe. Many global companies engage in the practice of transferring high-potential executives between companies and/or across national boundaries for the purposes of achieving important business goals while, at the same time, further developing those executives. This is happening in Enodis with increasing frequency.
Sales/Marketing training Commercial executives are currently being given extensive, high-quality training in strategic selling techniques and key account management in order to better implement the food service chains strategies described elsewhere in this report. Management coaching and instruction regarding product support, brand management and customer/marketplace analysis will be made available.
Leadership skills During the past year, we have invested in our senior management team. Operating company presidents and managing directors have attended a strategic management development programme at one of the most highly regarded leadership institutes in the world. Participants benefited from the experience, in terms of self-awareness and leadership behaviour.
During fiscal 2003, our Chief Executive Officer has attended, and two other executive Directors are to attend, a more senior programme at the same institution, in order to bring together leadership philosophies and values throughout the executive team.
Next steps We believe that the commercial and management capability of Enodis has been increased during the past year. We also believe that the Enodis business strategies require capable leadership and teamwork. For that reason, our investment in people is one we find easy to justify.
![]()
Bob Eimers
Executive VP –
Global Human Resources
| Financial review | 20 Enodis annual report and accounts 2002 |
EXCELLENT PROGRESS IN DEBT
REDUCTION

We have made excellent progress in debt reduction during the year, with the closing net debt of £186.1m almost £180m lower than at the start of the year. Strong operating cash flow, after capital expenditure, of £91.0m was supplemented by a Rights Issue (£70.3m) and net proceeds from exceptional items of £42.3m.
Exceptional losses in the year of £104.6m included losses on disposals of non-core businesses of £38.1m (after the write-back of £65.1m of goodwill previously written-off) and the non-cash write down of goodwill in relation to Kysor Warren of £48.9m. The loss for the year is £87.0m compared to £120.7m last year.
Turnover Our turnover of £783m is £298m below last year, predominantly due to the full year effect of the disposal of our Building and Consumer Products business, Magnet, in June 2001 and other food equipment business disposals during 2002. Adverse foreign exchange movements lowered turnover by £12m, and on a like-for-like basis, Food Equipment sales were down 4% on last year predominantly due to poor performance at Kysor Warren.
Profits Operating profit before goodwill amortisation and exceptional items decreased by £32.6m to £67.3m. This reflects the prior year disposal of Building and Consumer Products of £9.1m and other disposals of £6.8m. The remaining decrease
predominantly relates to losses in Food Retail (due to Kysor Warren) and a worsening performance in Europe/Asia. The underlying performance at Food Service Equipment North America is up 3%. Previously announced cost saving initiatives have been implemented and the benefits achieved. The weakening dollar has reduced operating results by £1.3m.
Property During the year we sold a further tranche of the Felsted, Essex, property which, along with some smaller property disposals, gave rise to turnover of £16m and profits of £8.0m. Profits from property development are expected to be around £4m in 2003, with significantly lower levels in future years.
Interest The Group’s net interest cost in the period before exceptional items was £29.3m, down £6.8m on the prior year. Lower principal balances, along with lower LIBOR rates helped reduce the charge. However, borrowing under our £100m Senior Subordinated Notes at 10 3/8%, increased margins on our bank borrowings and increased amortisation of deferred finance fees arising from our refinancing have increased the charge.
Interest cover before exceptional items and goodwill amortisation was 2.3 times, a deterioration from the prior year figure of 2.8. The effective interest rate on the Group’s borrowings was 8.5%.
| Exceptional items Net cash inflow from exceptional items was £42.3m. The exceptional losses in the year can be analysed as: | ||||
| Profit/ (loss) before tax | Net cash inflow/ (outflow) | |||
| £m | £m | |||
| Restructuring and asset write downs | (9.4 | ) | (27.4 | ) |
| Impairment of Kysor Warren goodwill | (48.9 | ) | – | |
| Operating exceptional items | (58.3 | ) | (27.4 | ) |
| Refinancing fees | (8.4 | ) | (18.9 | ) |
| Disposals of businesses | (41.4 | ) | 64.2 | |
| Nobia receipts | 3.3 | 24.4 | ||
| Total | (104.8 | ) | 42.3 | |
| Total goodwill included above | 114.0 | |||
| The impairment of goodwill at Kysor Warren is a non-cash item, reflecting the significant deterioration in the business performance. | ||||
| More details of all exceptional items are shown in note 4 to the accounts. | ||||
Back to Contents
| 21 Enodis annual report and accounts 2002 Financial review |
HIGH CONVERSION OF OPERATING PROFIT TO CASH
Loss before tax The pre-tax loss for the period of £85.8m is £23.2m better than last year, with lower exceptional items and interest being offset by reduced operating profits.
Taxation During the year we implemented FRS19 “Deferred Tax” and accordingly have restated prior year results in relation to the recognition of deferred tax assets totalling £26.9m, primarily short-term warranty provisions and US tax losses.
Our tax charge for the year on pre-exceptional profit is £1.2m reflecting an underlying “cash” tax charge of £5.8m, approximately 15%. Our UK and US operations benefit from brought forward tax losses and the charge relates principally to tax on profits of our European businesses. Successful progress in a US tax audit has enabled £3.8m of brought forward accruals to be released. The tax benefit of exceptional items is £0.2m
We expect US tax losses not to be fully utilised before 2007.
Earnings per share Adjusted diluted earnings per share are 10.4p compared to 16.3p.
As a result of the Rights Issue, we have restated all earnings per share for prior periods to reflect the bonus element of the Rights Issue. The theoretical ex-rights price was 82.2p.
Dividend As a result of the refinancing, substantially all the assets of the parent company were transferred to another Group company. The effect of this, for statutory accounting purposes, is the recognition of losses in the parent company. This does not have an effect on Group results. However the recognition of these losses means that the parent company does not have sufficient distributable reserves to lawfully declare dividends.
As and when the Board determines to resume dividend payments, the Company will seek to take the steps necessary to increase distributable reserves so it will be able to pay dividends. Any such action is likely to require the approval of shareholders and the High Court.
No dividend is therefore proposed (2001: 2.0p).
| 22 Enodis annual report and accounts 2002 Financial review |
| Operating cash flow The Group continues to generate strong cash flow before exceptional items. | ||||
| 2002 | 2001 | |||
| £m | £m | |||
| Operating profit | 67.3 | 99.9 | ||
| Depreciation | 15.7 | 22.7 | ||
| Profit on disposal of assets | – | (1.7 | ) | |
| Spend against provisions | (2.2 | ) | (6.0 | ) |
| Working capital | 19.2 | 5.9 | ||
| Net capital expenditure | (9.0 | ) | (16.3 | ) |
| Operating cash inflow | 91.0 | 104.5 | ||
| Interest | (23.3 | ) | (36.8 | ) |
| Taxation | (3.3 | ) | (6.0 | ) |
| Free cash inflow | 64.4 | 61.7 | ||
Whilst operating profits before interest, tax, goodwill amortisation and exceptional items have fallen by £32.6m, operating cash flow is only £13.5m lower at £91.0m. This reflects lower capital expenditures (£7.3m lower at £9.0m) and improved working capital management (£13.3m better at £19.2m inflow). Cash flow is one of our key performance indicators – monitored regularly at all levels of the Group, with particular focus on cash conversion days. We have established a target of 40 cash conversion days. At year end ten of our businesses had achieved the target (three in 2001). Net debt Net debt at 28 September 2002 was £186.1m compared to £365.9m at the beginning of the year. The movement of £179.8m is analysed as follows: | ||||
| £m | ||
| Net debt at 29 September 2001 | 365.9 | |
| Free cash inflow | (64.4 | ) |
| Disposals | (88.6 | ) |
| Debt refinancing costs | 18.9 | |
| Other exceptional items | 27.4 | |
| Issue of share capital | (70.3 | ) |
| New finance leases | 1.5 | |
| Foreign exchange rate movement | (4.3 | ) |
| Net debt at 28 September 2002 | 186.1 | |
| 23 Enodis annual report and accounts 2002 Financial review |
PROGRAMME OF NON-CORE DISPOSALS COMPLETE

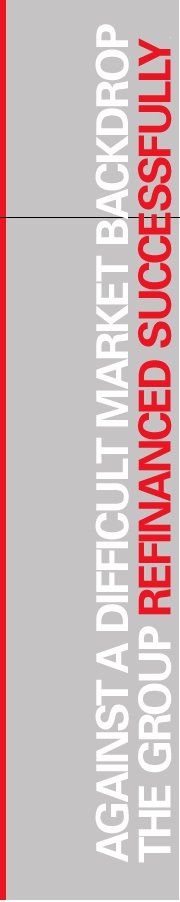
Financing Against a difficult market backdrop, we successfully refinanced the Group. We completed a three for five rights issue at 50p per share to raise gross proceeds of £75.1m, we issued £100m of 103/8% Senior Subordinated Notes repayable in 2012, and successfully syndicated our Senior Credit Facility.
We now have an appropriate capital structure for the immediate future.
The further reduction of debt remains a key priority for the Group. The Group’s businesses are highly cash generative with relatively low requirements for capital expenditure. Operating companies are firmly focused on cash conversion days for working capital where there is room for further improvement.
Treasury management The Group treasury function of Enodis is responsible for ensuring the availability and flexibility of funding arrangements in order to meet the ongoing requirements of the Group. In addition, it is responsible for managing the interest rate risks, liquidity risks and foreign exchange risks of the Group. Appropriate policies that regulate the activity of the Group treasury function are in place and have been approved by the Board.
The Group treasury function, in turn, has implemented policies and guidelines to regulate the activities of subsidiary companies.
Foreign exchange risk management Foreign exchange transaction exposures are generally managed directly by operating subsidiaries within policies and guidelines established by Group treasury. Group treasury also enters into foreign exchange hedging transactions on behalf of subsidiaries where this is beneficial to the Group. It is the Group’s policy not to hedge profit and loss account foreign exchange translation exposures. The Group’s US dollar denominated interest cost provides a partial hedge to the Group’s results.
Enodis has significant capital employed in overseas operations. As a result, the Group’s balance sheet can be affected by movements in foreign exchange rates. The Group has a policy to hedge at least 50% of this risk to limit the impact of currency movements. Accordingly we have loans in the same currencies as the capital employed in the Group’s main overseas operating units. Cross currency swaps are also used to convert the currency of the Group’s borrowings to such functional currencies.
Interest rate risk management The Group finances its operations through a mix of retained profits and borrowings. Borrowings are made at both fixed and floating rates of interest. The Group uses interest rate swaps to generate the desired interest profile and to manage the Group’s exposure to interest rate fluctuations.
As at 28 September 2002, the Group had gross borrowings of approximately £260m; £100m of these borrowings were fixed through the Senior Subordinated Notes and a further £90m was fixed for a period greater than one year using interest rate swaps. Together with other minor fixed rate borrowings these represent 75% of the Group’s total borrowings. The remaining £65m (25%) remains floating. The interest rate profile is in line with the Group’s objectives.
Investment We have completed our current programme of disposals of non-core businesses which realised net proceeds of £88.6m. Businesses disposed of include Sammic, Belshaw, Aladdin Temp-Rite, Austral and Prolon.
US GAAP Enodis is listed on the New York Stock Exchange under the ticker symbol ENO and accordingly is required to reconcile its accounts under US GAAP. The principal differences arise due to the treatment of goodwill, pensions costs and deferred tax.
The pre-tax loss (including discontinued operations) under US GAAP is £85.5m (2001: loss of £110.4m); the net loss after tax under US GAAP is £103.0m, (2001: loss of £113.7m).
Summary Losses for the year of £85.8m reflect a significant amount of corporate activity and asset write downs. However, we had good underlying performance in Food Service Equipment–North America. In addition significant progress in reducing debt, not only through transactions but also, importantly, though strong cash flow generation means we are well positioned for the future.

W David Wrench
Chief Financial Officer
| The Directors | 24 Enodis annual report and accounts 2002 |
 |
Peter Brooks, Chairman (55 years), joined the Enodis Board as a non-executive Director on 21 May 1998 and was appointed Chairman on 17 January 2000. He was formerly General Counsel to the Board of the Global and Corporate and Institutions Division at the Deutsche Bank Group, and more recently was Chairman European corporate coverage at City solicitors Clifford Chance. He is also Chairman of Chesterton International plc. He is Chairman of the Nomination Committee and a member of the Remuneration and Audit Committees.
Andrew Allner, Chief Executive Officer* (48 years), joined the Enodis Board as Chief Financial Officer on 30 October 2000. He was appointed Chief Executive Officer on 2 November 2001 having led the executive team since the former CEO resigned in March. He was formerly Group Finance Director of Dalgety plc and CFO and Senior Vice President of its successor company PIC International Group plc, based in California. He is a non-executive Director of Moss Bros Group plc. He is a member of the Nominations Committee.
Dave McCulloch, Chief Operating Officer* (55 years), joined the Group in 1986. Progressively he held the positions of President Garland Canada (1992), President Garland Group (1995), President Specification Group (1999), President NA Foodservice Group (March 2001), President Global Food Service Equipment Group (September 2001), before taking up his current appointment (May 2002). He was appointed to the Board on 2 November 2001. Prior to joining Enodis, he spent 17 years in the residential appliance business with Camco Inc, a subsidiary of General Electric.
Dave Wrench, Chief Financial Officer* (56 years), joined Enodis in 2000 as CFO for the Specification Group and was appointed a director and CFO on 23 May 2002. Before joining Enodis he held executive positions with three different companies that included responsibilities for operations in the USA, Canada and Mexico. He had previously worked for GE Canada for 23 years in both CFO and general management positions.
Bob Eimers, Executive Vice President– Global Human Resources* (54 years), joined Enodis in July 2001 as Vice President Human Resources and was appointed to the Board on 23 May 2002, having previously been employed with Scotsman. He has been the senior human resource executive in three major corporations; Household International, Sonoco Products Company, and Service Merchandise.
Robert Briggs, non-executive Director (55 years), joined the Enodis Board on 15 August 2000. He is currently Senior Vice President and Chief Financial Officer of Kaiser Permanente Health Plan & Hospitals Inc. He was Senior Vice President and Chief Financial Officer of Diageo’s US subsidiary, The Pillsbury Company. He was previously President of Arby’s International and Vice President and Chief Financial Officer of Kentucky Fried Chicken. He is a member of the Audit Committee.
| 25 Enodis annual report and accounts 2002 The Directors |
Eryl Morris, non-executive and Senior Independent Director (59 years), joined the Enodis Board as a non-executive Director on 27 July 1998. He was formerly Deputy Chief Executive of Courtaulds plc. He is Chairman of Airinmar Group Limited, HPI Group Limited and Mill Digital Media Limited. He is Chairman of the Audit Committee and a member of the Remuneration Committee.
Waldemar Schmidt, non-executive Director (62 years), joined the Enodis Board on 3 April 2000. He was Chief Executive of ISS Group from October 1995 until he left in September 2000. He is Chairman of Superfos A/S, Tholstrup Cheese Holding A/S, Energi E2 A/S, Thrane & Thrane A/S, JC Hempel’s-Skibsfarve Fabrïk A/S and Deputy Chairman of F Group A/S. He is also non-executive director of Viterra Energy Services AG, Ove Arkil Holding A/S, Group 4 Falck A/S and Alfa Laval International AB. He is Chairman of the Remuneration Committee.
*Denotes the members of the Executive Committee
Contact information
Enodis Group –
Corporate Head Office
Washington House
40–41 Conduit Street
London W1S 2YQ
Email: contact@enodis.com
Website: www.enodis.com
Andrew Allner, CEO
Email: andrew.allner@enodis.com
Tel:+44 (0)207 304 6006
Dave Wrench, CFO
Email: dwrench@enodis.com
Tel:+1 (727) 569 1108
Dave McCulloch, COO
Email: dmcculloch@enodis.com
Tel:+1 (727) 569 1108
Bob Eimers, Executive VP
– Global Human Resources
Email: beimers@enodis.com
Tel:+1 (727) 569 1183
| Directors’ report | 26 Enodis annual report and accounts 2002 |
1 Principal activities, business, operating and financial reviews
The principal activities of the Group consist of the manufacture and sale of commercial food equipment through its Global Food Service Equipment and Food Retail Equipment groups. The Group’s turnover, operating profit and total assets less current liabilities are shown by business sector in note 1 to the accounts. A review of the business and future development plans, together with operating and financial reviews, are contained on pages 2 to 23 which constitute an integral part of this report.
2 Results and dividends
Having adjusted for goodwill amortisation and exceptional items, profit before taxation was £38.0m (2001: £63.8m). The loss of the Group before taxation amounted to £85.8m (2001 loss: £109.0m). The Directors do not recommend the payment of a final dividend (2001: nil p net per ordinary share). No interim dividend (2001: 2.0p net) has been paid in respect of the period.
3 Research and development
During the period the Group incurred expenditure on research and development of £13.4m (2001: £13.8m).
| 4 Share capital |
| (a) Details of movements of the Company’s ordinary shares during the period are provided in note 21 to the accounts. |
| (b) During the period, the Company did not exercise the authority granted by shareholders at the Annual General Meeting held on16 January 2002 for the Company to purchase up to 25 million ordinary shares. |
5 Board of Directors
The current Directors of the Company, their ages and the dates of their appointment are shown on pages 24 and 25. Peter Brooks, Robert Briggs, Eryl Morris, Andrew Allner and Waldemar Schmidt held office throughout the period. David McCulloch, Robert Eimers and David Wrench, Directors at the end of the period were appointed on 2 November 2001, 23 May 2002 and 23 May 2002 respectively. Andrew Roake, a Director at the beginning of the period, left the Board on 31 December 2001.
David Odum was appointed on 2 November 2001 and left the Board on 31 May 2002.
Robert Briggs and Eryl Morris will retire at the next Annual General Meeting by rotation in accordance with Article 97 of the Articles of Association of the Company and, being eligible, offer themselves for reappointment in accordance with Article 98 of the Articles of Association of the Company.
Robert Eimers and David Wrench, having been appointed Directors since the last Annual General Meeting, will retire at the next Annual General Meeting and, being eligible offer themselves for reappointment in accordance with Article 95 of the Company’s Articles of Association.
The interests of the Directors in the share capital and other securities of the Company and its subsidiary undertakings are shown on pages 31 and 32.
6 Substantial shareholdings
The following shareholdings are disclosed as having been notified in accordance with Sections 198 to 208 of the Companies Act 1985 as at 20 November 2002.
| Shareholder | Ordinary shares of 50p each | Percentage of issued share capital | ||
| Harris Associates L.P. | 47,000,160 | 11.73 | % | |
| Putnam Investment Management LLC | 27,576,200 | 6.88 | % | |
| Deutsche Bank AG | 19,842,434 | 4.95 | % | |
| Arnhold & S. Bleichroeder Inc | 17,927,000 | 4.47 | % | |
| Aviva plc | 15,440,816 | 3.85 | % | |
| Legal & General Investment Management Ltd | 12,074,846 | 3.01 | % | |
| Barclays plc | 12,072,874 | 3.01 | % | |
7 Charitable and political donations
The Group made charitable donations of £105,000 during the period (2001: £88,000), £100,000 of which was donated in the USA (2001: £79,000). Neither the Company nor any of its subsidiaries made any donation for political purposes in either 2002 or 2001.
8 Close company status
The Company is not a close company within the provisions of the Income and Corporation Taxes Act 1988 nor was it a close company during the period.
9 Auditors
Resolutions to reappoint Deloitte & Touche as the Company’s auditors and to authorise the Directors to determine their remuneration will be proposed at the next Annual General Meeting.
10 Disabled employees
Applications for employment from disabled persons are considered on their merits and regard is paid only to the ability of an applicant to carry out satisfactorily the functions required. The same policy is adopted when considering career development and promotion, while in the field of training, a distinction would be made only in order to meet the particular requirements of the disabled person. If an employee became disabled while in employment, all due consideration would be given to continue employment whether in the same or in an alternative capacity and training would be given where necessary.
| 27 Enodis annual report and accounts 2002 Directors’ report |
11 Employee consultation
The Group places considerable value on the involvement of its employees and has continued its previous practice of keeping them informed on matters affecting them as employees and on the various factors affecting the performance of the Group. This is achieved in many Group companies through newsletters, formal and informal meetings.
12 Creditor payment policy
The terms of payment to most suppliers are agreed, and abided by, on an ongoing basis by each Group company. Trade creditors at 28 September 2002 represented, on average, nil days’ purchases (2001: 35 days) for the Company (as a result of the transfer of its assets and business more fully described in note 13(b) on page 48) and 61 days’ purchases (2001: 63 days) for the Group.
13 Environmental policies of the Company’s operating companies
Examples of progress in reducing environmental concerns in the year ended 28 September 2002 include:
Recycling/consumption/dry waste: As previously reported much recycling is being carried out of cardboard, lamps, oil, wood, copper and steel products as well as paper and toner cartridges from offices. At Lincoln Merco/Savory the process by which solvents and oils were drained off aluminium grindings was improved which led to the waste being upgraded from hazardous to recyclable.
Refrigeration: The Group continues to move to using only refrigerants that are considered ozone friendly and Scotsman Ice are undertaking research on the next generation of refrigerants to replace HFC’s that do not deplete the ozone layer.
Castelmac have new modular cubers where the refrigerant charge has been reduced by an average of 43% compared to the previous models.
Hazardous materials: Scotsman has eliminated a 2,500 gallon Vapour Degreaser which has effectively removed the last process that generated hazardous waste in the plant.
Delfield has identified that laser ash was a hazardous material and have put in place a disposal procedure through a licensed waste disposal company.
Kysor Panel Systems has introduced a different, less ozone depleting, blowing agent for its urethane injection processes.
Frimont has eliminated foam insulation and replaced it with a degradable polystyrene.
Liquid waste: Frymaster has implemented a three stage washer system and will save 11 gallons per minute of waste water.
Garland Commercial Industries has completed a project working with the Municipal Authority to have storm run-off removed from the sanitary system and are now working at improving surface run-off with local agencies.
Jackson has introduced a “constructed wetlands” waste water treatment system that uses natural plant and vegetation to treat waste water.
Energy conservation: Scotsman has introduced a new Eclipse unit that uses 10% less energy than standard technology.
Frymaster has purchased several new welders that are 40%–50% more efficient, as well as replacing several air conditioner compressors with a more high efficiency lighter weight unit.
Delfield has developed a new ‘reach-in’ product which consumes 45% less energy than its predecessor model.
14 Annual General Meeting
The Annual General Meeting of the Company will be held at Radisson SAS Portman Hotel, 22 Portman Square, London W1H 7BG on 15 January 2003 at 11.30 a.m.
A separate Circular to shareholders, containing the Notice of the Annual General Meeting and requisite information on the resolutions to be proposed as special business at the Meeting, accompanies this Report and Accounts.
15 Directors’ and Officers’ insurance
In the year, the Company continued to purchase insurance for its Directors and certain Officers, as permitted by Section 310(3) of the Companies Act 1985, against liability for negligence, default, breach of duty or breach of trust in relation to the Company.
By order of the Board

D R Hooper Secretary
20 November 2002
| Corporate governance | 28 Enodis annual report and accounts 2002 |
The Combined Code The Board is accountable to shareholders for the running of the Company and is committed to the principles of good corporate governance.
The Company has applied the principles set out in Section 1 of the Combined Code – Principles of Good Governance and Code of Best Practice (“the Code”) as detailed herein.
The Board
Board balance Composition of the Board is balanced, with an independent non-executive Chairman, three further independent non-executive Directors and four executive Directors. Their biographies, which are set out on pages 24 and 25, demonstrate a range of business backgrounds and international experience.
Re-election Non-executive Directors are appointed for a specific term of five years but all Directors are subject to election by shareholders at the first opportunity after their appointment, and to re-election thereafter by rotation and at least every three years in accordance with the Company’s Articles of Association. The names of the Directors submitted for re-election are detailed in the Directors’ report on page 26 and biographical details for each of them appear on pages 24 and 25.
Board procedures and support The Board considers that it provides effective leadership and control and has a formal schedule of matters reserved for its specific approval, including Group strategy and performance, acquisitions and disposals, major capital projects, Board appointments and dividend recommendation. It meets regularly and maintains a close dialogue between formal meetings. Briefing papers are circulated in advance of planned meetings and, during the year, the Board visited several Group sites. Newly appointed Directors receive an induction programme which includes a pack of Board papers from recent meetings, analysts’ reports on the Company, a description of the Board’s operations and the Memorandum and Articles of Association. A procedure exists for the Directors, in the furtherance of their duties, to take independent professional advice, if necessary, under the guidance of the Company Secretary and at the Company’s expense. All Directors have the opportunity to undertake relevant training, have full and timely access to relevant information and the advice and services of the Company Secretary.
Appointments Appointments to the Board are reviewed by the Board as a whole with a Nominations Committee established to undertake the search process and recommend candidates to the Board as necessary. That committee comprises Peter Brooks (Chairman), Waldemar Schmidt and Andrew Allner.
Relations with shareholders There is an agreed allocation of responsibilities for regular executive Director communication with institutional investors and analysts in both the UK and USA. Structured presentations or conference calls accompany the announcement of quarterly and final results. Furthermore, the Annual General Meeting provides an excellent opportunity for private shareholders to question the Board and discuss issues with executive management after the meeting.
Audit Committee The Committee’s Chairman is Eryl Morris, the Senior Independent Director, who sits together with Peter Brooks and Robert Briggs. At all times it shall comprise solely non-executive Directors and consist of not less than three members. Other Directors and executives may attend by invitation. It met four times during the period and has additionally met on one occasion after the end of the period specifically to review the compliance implications of the US Sarbanes-Oxley Act.
The Committee monitors accounting policies and financial reporting, and reviews the quarterly and annual accounts before they are presented to the Board. It also maintains a liaison with external auditors, keeps under review the scope and results of the audit and its cost-effectiveness, and the independence and objectivity of the auditors, taking into account where necessary any non-audit services provided to the Group by the auditors.
Remuneration Committee The Remuneration Committee is chaired by Waldemar Schmidt, an independent non-executive Director. Peter Brooks and Eryl Morris, also independent non-executive Directors, are members of the Committee. The Committee’s terms of reference include reviewing and advising upon the remuneration and benefits packages of the executive Directors. The fees of the non-executive Directors are determined by the full Board. The Committee is advised and assisted as required by independent consultants and the Vice President – Global Human Resources. It reports to the full Board, whose Remuneration Report is set out on pages 29 to 32.
Going concern The Directors believe that the Group has adequate resources to continue operating for the foreseeable future. For this reason, they continue to adopt the going concern basis in preparing the accounts.
Internal control Introduction The Board has established procedures to implement in full the Turnbull Guidance “Internal Control: Guidance for Directors on the Combined Code” and to assist the Company to comply with applicable provisions of the US Sarbanes-Oxley Act and regulations thereunder for the year under review and to the date of approval of the annual report and accounts. These procedures, which are subject to regular review, provide an ongoing process for identifying, evaluating and managing any significant risks faced by the Group.
Responsibility The Board has overall responsibility for the system of internal control. A sound system of internal control is designed to manage rather than eliminate the risk of failure to achieve business objectives and can only provide reasonable and not absolute assurance against material misstatement or loss.
Control structure There is a defined operating structure with lines of responsibility and delegated authority. This is managed on a day-to-day basis by the Executive Committee chaired by the Chief Executive Officer.
Written policies and procedures have been issued which define the limits of delegated authority and provide a framework for management to deal with areas of significant business risk. These policies and procedures are reviewed and where necessary updated. The Board formally approves the Group Treasury policy, which sets appropriate limits to mitigate treasury risk. The Board reviews the most significant risks facing the Group, their potential impact and likelihood of occurrence and the control procedures put in place to mitigate those risks.
| 29 Enodis annual report and accounts 2002 Corporate governance |
Control environment The Group’s operating procedures include a comprehensive system for reporting information to the Directors. This system is documented and regularly reviewed.
Budgets are prepared by operating company management and subject to review by both Group management and the Directors. Forecasts are revised during the year and compared against budget.
When setting budgets and forecasts management identifies, evaluates and reports on the potential significant business risks.
Monthly reports of operating performance, with commentary on variances against budget, forecasts and prior year, are prepared at operational and Group levels. Key performance indicators are monitored.
The acquisition of any business requires a rigorous analysis of the financial implications of the acquisition and key performance figures. A sensitivity analysis takes place of the key assumptions made in the acquisition case. Post investment appraisals of the Group’s investments are conducted on a periodic and timely basis.
A treasury report, with details of treasury borrowings and investments, is distributed to corporate management on a monthly basis.
The Audit Committee reviews a quarterly report detailing any significant legal actions faced by Group companies.
Monitoring and review activities There are clear processes for monitoring the system of internal control and reporting any significant control failings or weaknesses together with details of corrective action.
A formal annual self assessment is provided by the presidents and controllers of each Group company detailing the operation of their control systems and highlighting any weaknesses. Regional management, the Audit Committee and the Board review the results of this assessment taking action as appropriate.
Group risk management issues are reviewed by a Group Risk Management Committee, chaired by the Chief Financial Officer and comprising cross functional representatives from across the Group. The Committee reports to the Board, or in the case of internal financial controls, to the Audit Committee, on all risk management matters. Reports from management and the external auditors, Deloitte & Touche, on certain internal controls and relevant financial reporting matters are presented to the Audit Committee and management.
Where, as a result of these reviews, issues are identified in the internal control environment, prompt corrective actions are taken.
Review of effectiveness The Directors believe that the Group’s system of internal control provides reasonable but not absolute assurance that problems are identified on a timely basis and dealt with appropriately.
The Directors confirm that they have reviewed the effectiveness of the system of internal control through the monitoring process set out above for the year under review and to the date of approval of the annual report and accounts.
Compliance statement The Listing Rules require the Board to report on compliance with the Code throughout the accounting period. The Company has complied throughout the accounting period ended 28 September 2002 with the provisions set out in Section 1 of the Code save in respect of one provision in the employment contract of D S McCulloch. In certain particular circumstances, which are set out on page 30, he is entitled to 24 months’ compensation on termination of employment by the Company.
Board remuneration report Remuneration policy The remuneration arrangements for senior executives are designed to enable the Company to recruit and retain executives of the calibre needed to achieve Enodis’ goal to become the clear world leader in food service equipment. The Remuneration Committee has established an overall framework for the remuneration of executives throughout the Group, governed by seven principles that executive compensation should:-
| – | be determined by reference to external markets |
| – | be seen throughout the business to be fair and equitable |
| – | be based on total compensation |
| – | be supportive of key business strategies |
| – | be affordable |
| – | be aligned with shareholder value |
| – | be understandable. |
In forming its remuneration policy, the Remuneration Committee has given full consideration to the principles in Section B of the Code.
Elements of executive Directors’ remuneration Certain details of Directors’ contracts, remuneration and interests in the Company’s securities, including share options, are set out on pages 30 to 32.
| 30 Enodis annual report and accounts 2002 Corporate governance |
The remuneration arrangements for the executive Directors consist of:
– Base salary Base salaries are determined by reference to those of similar positions in international businesses of broadly comparable size and structure, taking account of turnover, market value, business sector, number of employees and international involvement. Independent consultants are used to provide comparative information for the Remuneration Committee.
– Annual bonus Annual cash bonuses are based on performance targets. The principal measures for senior executives for the period were Group operating profit and cash flow. The Remuneration Committee approved certain other incentive arrangements for executive Directors during the year in recognition of the particular circumstances prevailing during the period. These were primarily focused upon cash generation and net debt reduction, as well as personal objectives relating to implementation of strategically important initiatives. The Remuneration Committee may add other corporate or job-related measures as it considers appropriate.
– Long-term incentives: executive share option schemes Options are outstanding under the Enodis 1995 Executive Share Option Scheme, which uses new shares, and the Enodis 1993 Executive Share Option Scheme, which uses shares purchased by an employee share trust. Additionally, there is in existence the 1984 Executive Share Option Scheme. No further options can be granted under these schemes.
In the year ended 28 September 2002, options have been granted under the Enodis 2001 Executive Share Option Scheme. In normal circumstances, the value of shares under options which an executive may receive in any year may not exceed twice base salary using the “face value” method, i.e. number of shares multiplied by exercise price, in any financial year. Following his appointment as Chief Executive Officer, A J Allner was awarded a greater value of options reflecting the increase in his responsibilities and exceptional circumstances. Exercise of options by all executives will be subject to meeting challenging performance conditions. The performance condition attached to the grants during the period at 147p was that prevailing in the financial year ended 29 September 2001, as they were awarded pursuant to a promise to grant made that year. The performance condition requires that options will be exercisable in full only if the Company’s Total Shareholder Return (TSR) is ranked in the upper quartile relative both to other Mid 250 companies (excluding Investment Trusts) and to a group of about 20 other quoted companies in the UK and overseas with analogous businesses. Options will be exercisable on a sliding-scale basis if the Company’s TSR falls between the median and upper quartile levels, as compared with the two comparator groups. The performance conditions were changed for the year ended 28 September 2002.
The performance condition attached to the grants during the period at 85.5p is based on the Company’s TSR compared with the companies comprising the FTSE Mid 250 (excluding investments trusts) at the date of grant excluding companies that have ceased to be listed. Options granted over shares with a value of up to one times base salary will be exercisable in full if Enodis’ TSR is greater than that of the median ranked company. Options awarded in excess of one times base salary in any particular year will be exercisable as to 35% if Enodis’ TSR is greater than that of the median ranked company, and exercisable in full if Enodis’ TSR is at least as great as that of the upper quartile ranked company, with pro-rata exercisability between these two points.
– Long-term incentives: share matching scheme No awards have been made under the share matching scheme (under which executives may be awarded matching free shares linked to the deferral of their annual cash bonus) and the Board has decided not to operate it for the time being.
– Other benefits Executive Directors are provided with a fully expensed company car (or an allowance in lieu thereof), medical insurance, disability insurance and other benefits in line with practice in other listed companies of similar size.
– Pension Andrew Allner, the only UK resident executive Director, has opted not to belong to the Company’s pension arrangements and therefore instead receives a salary supplement of 27% of base salary.
Service contracts and compensation Service contracts will normally contain a notice period to the Director of one year with consideration being given to two years in exceptional circumstances.
The Company is entitled to terminate A J Allner’s employment on 12 months’ notice. If the termination is without cause or if he resigns within 12 months after a change of control, he is entitled to a payment equal to (a) 95% of his annual base salary, (b) 95% of his salary in lieu of membership of Company pension arrangements, (c) 95% of annual on target bonus (only if termination occurs before 31 May 2003 or on change of control) in addition to any pro rated bonus entitlement up to the date of termination of employment, (d) one year’s car allowance, and (e) continuation of other benefits for one year.
The service contract with D S McCulloch (a US executive) contains provisions, which were in place some time before his appointment to the Board, whereby the contract is terminable by a Group company without cause on payment of 24 months’ base salary in the event of termination on or before 31 March 2003, or in the event of a change of control. In the event of termination without cause after 31 March 2003, payment will be of an amount in accordance with the Company’s then severance policy for senior executives (currently 12 months’ base salary). The change of control amount remains unchanged at 24 months’, however.
| 31 Enodis annual report and accounts 2002 Corporate governance |
| Directors’ remuneration, period to 28 September 2002 The remuneration of the Directors (excluding pension costs), is shown below: | |||||||||||||||
| Director | Notice period from Company | Base salary £ | Fees £ | Bonuses £ | † | Benefits £ | †† | Compensation for loss of office £ | 2002 £ | 2001 £ | |||||
| A J Allner | 12 months | 347,918 | – | 245,000 | 115,550 | ** | – | 708,468 | 565,182 | ||||||
| R E Briggs | n/a | – | 27,500 | – | – | – | 27,500 | 27,500 | |||||||
| P M Brooks (Chairman) | n/a | – | 118,333 | – | – | – | 118,333 | 161,461 | |||||||
| R C Eimers (appointed 23 May 2002) | 12 months | 57,700 | – | 136,548 | 2,969 | *** | – | 197,217 | – | ||||||
| P L Hughes (prior year director) | n/a | – | – | – | – | – | – | 10,833 | |||||||
| D S McCulloch (appointed 2 November 2001) | 24 months | * | 223,605 | – | 294,951 | 7,725 | *** | – | 526,281 | – | |||||
| G E Morris | n/a | – | 32,500 | – | – | – | 32,500 | 32,500 | |||||||
| D W Odum (appointed 2 November 2001; resigned 31 May 2002) | n/a | 133,243 | – | 84,700 | 146,212 | § | 451,961 | 816,116 | – | ||||||
| A F Roake (resigned 31 December 2001) | n/a | 121,304 | – | – | 4,677 | *** | 278,859 | 404,840 | 372,715 | ||||||
| W Schmidt | n/a | – | 32,500 | – | – | – | 32,500 | 31,250 | |||||||
| D W Williams (prior year director) | n/a | – | – | – | – | – | – | 544,964 | |||||||
| W D Wrench (appointed 23 May 2002) | 12 months | 63,146 | – | 170,325 | 4,882 | *** | – | 238,353 | – | ||||||
| 946,916 | 210,833 | 931,524 | 282,015 | 730,820 | 3,102,108 | 1,746,405 | |||||||||
| † | Bonuses paid by reference to achievement by the Group of budgeted financial targets or as approved by the Remuneration Committee in respect of special circumstances. Bonuses are not included in pensionable salary. |
| †† | Benefits are not included in pensionable salary. |
| * | Also refer to summary description of service contract on page 30. |
| ** | Includes £93,937 in lieu of membership of Company pension arrangements and £13,333 car allowance. |
| *** | Includes car allowance: R C Eimers £1,762, D S McCulloch £6,877, A F Roake £2,033 and W D Wrench £1,725. |
| § | Includes £136,931 (grossed up for taxation) in relation to relocation and £4,745 car allowance. Directors’ base salaries have not been increased for the year commencing 29 September 2002. |
Directors’ pension information
– The Company pays a supplement of 27% of base salary to Mr Allner in lieu of his membership of Company pension arrangements. No Director is a member of a defined benefit pension scheme.
– Sums of £731, £24,854, £18,371 and £1,263 (2001: £22,002, nil, nil and nil) have been paid during the period by the Group to unapproved defined contribution pension arrangements for the benefit of A F Roake, D W Odum, D S McCulloch, and W D Wrench respectively.
Directors’ interests in contracts and other transactions with Group companies.No Director has a material interest in any contract with Group companies other than service contracts.
The beneficial interests of Directors in office at 28 September 2002 (or earlier resignations) in the ordinary shares and American depositary shares (“ADSs”) of the Company were as follows:
| 1 Ordinary shares and ADSs | |||||||
| 28 September 2002 (or earlier resignation) | 29 September 2001 (or subsequent appointment) | ||||||
| Director | ADSs | Ordinary shares | ADSs | Ordinary shares | |||
| A J Allner | Nil | 27,200 | Nil | 4,500 | |||
| R E Briggs | 2,000 | Nil | 2,000 | Nil | |||
| P M Brooks | Nil | 43,500 | Nil | 20,000 | |||
| R C Eimers (appointed 23 May 2002) | Nil | Nil | Nil | Nil | |||
| D S McCulloch (appointed 2 November 2001) | Nil | 67,000 | 5,000 | Nil | |||
| G E Morris | Nil | 32,000 | Nil | 20,000 | |||
| D W Odum (appointed 2 November 2001 and resigned 31 May 2002) | Nil | Nil | Nil | Nil | |||
| A F Roake (resigned 31 December 2001) | 10,000 | 100,000 | 10,000 | 100,000 | |||
| W Schmidt | Nil | 13,680 | Nil | 2,300 | |||
| W D Wrench (appointed 23 May 2002) | Nil | Nil | Nil | Nil | |||
i The above interests are in the ordinary share capital and the ADSs of the Company. No Director had any beneficial interest in any share capital of other Group companies or in any debenture of any Group company. As at 20 November 2002 there were no changes to the interests of the Directors in office at the period end as stated above and in paragraph 2 hereof.
ii Pursuant to the requirements of the Companies Act 1985, each UK executive Director, as well as all UK employees, is deemed to be interested in the Company’s shares held by the Trustees of the Company’s Employee Share Trust. As at 28 September 2002, that interest was in 1,269,341 ordinary shares (29 September 2001: 1,269,341).
| 32 Enodis annual report and accounts 2002 Corporate governance |
2 Share options Options to subscribe for shares of the Company were held by the following Directors during the period:
i The Berisford 1995 Executive Share Option Scheme (“Executive Scheme (1995)”) and the Enodis 2001 Executive Share Option Scheme (“Executive Scheme (2001)”).
| Director | At 29 September 2001 | Number of options during the period | At 28 September 2002 (or earlier resignation) | Exercise price | † | Date from which exercisable | †† | Latest expiry date | †† | |||||
Granted | Exercised | |||||||||||||
| A J Allner | Nil | 334,332 | * | Nil | 334,332 | 147.00 | p | 21/3/05 | 21/3/12 | |||||
| Nil | 1,481,977 | ** | Nil | 1,481,977 | 85.5 | p | 21/3/05 | 21/3/12 | ||||||
| R C Eimers | 24,699 | Nil | Nil | 24,699 | 260.73 | p | 3/7/03 | 3/7/10 | ||||||
| Nil | 102,013 | Nil | 102,013 | 85.50 | p | 21/3/05 | 21/3/12 | |||||||
| D S McCulloch | 49,399 | Nil | Nil | 49,399 | 116.60 | p | 1/7/00 | 1/7/07 | ||||||
| 43,233 | Nil | Nil | 43,233 | 212.88 | p | 28/7/02 | 28/7/09 | |||||||
| 444,063 | Nil | Nil | 444,063 | 81.78 | p | 10/9/04 | 10/9/11 | |||||||
| Nil | 302,401 | Nil | 302,401 | 85.50 | p | 21/3/05 | 21/3/12 | |||||||
| Nil | 271,218 | * | Nil | 271,218 | 147.00 | p | 21/3/05 | 21/3/12 | ||||||
| D W Odum | 149,515 | Nil | Nil | 149,515 | 170.04 | p | Lapsed | |||||||
| (resigned 31 May 2002) | 403,073 | Nil | Nil | 403,073 | 81.78 | p | Lapsed | |||||||
| Nil | 175,250 | * | Nil | 175,250 | 147.00 | p | Lapsed | |||||||
| A F Roake | 314,684 | Nil | Nil | 314,684 | 151.82 | p | 31/12/01 | 3/2/04 | ||||||
| (resigned 31 December 2001) | 170,348 | Nil | Nil | 170,348 | 145.75 | p | 31/12/01 | 3/2/04 | ||||||
| 111,393 | Nil | Nil | 111,393 | 254.25 | p | 31/12/01 | 3/2/04 | |||||||
| 95,884 | Nil | Nil | 95,884 | 260.73 | p | 31/12/01 | 3/2/04 | |||||||
| W D Wrench | 37,049 | Nil | Nil | 37,049 | 260.73 | p | 3/7/03 | 3/7/10 | ||||||
| 61,469 | Nil | Nil | 61,469 | 146.56 | p | 22/1/04 | 22/1/11 | |||||||
| Nil | 194,551 | Nil | 194,551 | 85.50 | p | 21/3/05 | 21/3/12 | |||||||
| † | The number of all options held at 29 September 2001 and related exercise prices have been restated to reflect the adjustment applied during the year pursuant to the rules of the schemes following the rights issue announced by the Company on 20 February 2002. |
| †† | Subject to performance conditions being achieved. |
| * | Options granted pursuant to a promise to grant made in prior financial year. |
| ** | On exercise of 469,829 options, pursuant to the rules of the Scheme, A J Allner is entitled to a payment of £51,681. |
During the year the shares have traded in the range 98.00p to 44.50p. On 28 September 2002, the closing mid market share price was 50.50p.
Gross gains on exercise of Inland Revenue approved options are normally subject to capital gains tax on disposal of the shares acquired. Gross gains on exercise of unapproved options are subject to income tax.
ii The Berisford 1992 Sharesave Scheme (“Sharesave Scheme (1992)”).
No Director holds options under the Sharesave Scheme (1992).
iii No benefit has been attached, in the remuneration table set out on page 32, to options granted under the Executive Share Option Schemes.
By order of the Board

D R Hooper Secretary
20 November 2002
| Statement of Directors’ responsibilities in respect of the financial statements | 33 Enodis annual report and accounts 2002 |
United Kingdom company law requires the Directors to prepare financial statements for each financial year which give a true and fair view of the state of affairs of the Company and the Group as at the end of the financial year and of the profit or loss of the Group for that period.
In preparing those financial statements, the Directors are required to:
| – | select suitable accounting policies and then apply them consistently; |
| – | make judgements and estimates that are reasonable and prudent; and |
| – | state whether applicable accounting standards have been followed, subject to any material departures disclosed and explained in the financial statements. |
The Directors are responsible for keeping proper accounting records which disclose with reasonable accuracy at any time the financial position of the Company and to enable them to ensure that the financial statements comply with the Companies Act 1985. They are also responsible for the Group’s system of internal control, for safeguarding the assets of the Group and hence for taking reasonable steps for the prevention and detection of fraud and other irregularities.

D R Hooper
Secretary 20 November 2002
Independent Auditors’ report to the Members of Enodis plc
We have audited the financial statements of Enodis plc for the year ended 28 September 2002 which comprise the profit and loss account, the balance sheets, the cash flow statement, the statement of total recognised gains and losses and the related notes 1 to 27. These financial statements have been prepared under the accounting policies set out therein.
Respective responsibilities of Directors and Auditors As described in the statement of Directors’ responsibilities, the Company’s Directors are responsible for the preparation of the financial statements in accordance with applicable United Kingdom law and accounting standards. Our responsibility is to audit the financial statements in accordance with relevant United Kingdom legal and regulatory requirements, auditing standards, and the Listing Rules of the Financial Services Authority.
We report to you our opinion as to whether the financial statements give a true and fair view and are properly prepared in accordance with the Companies Act 1985. We also report if, in our opinion, the Directors’ report is not consistent with the financial statements, if the Company has not kept proper accounting records, if we have not received all the information and explanations we require for our audit, or if information specified by law or the Listing Rules regarding directors’ remuneration and transactions with the Company and other members of the Group is not disclosed.
We review whether the corporate governance statement reflects the Company’s compliance with the seven provisions of the Combined Code specified for our review by the Listing Rules and we report if it does not. We are not required to consider whether the Board’s statements on internal control cover all risks and controls, or form an opinion on the effectiveness of the Group’s corporate governance procedures or its risk and control procedures.
We read the Directors’ report and the other information contained in the annual report for the above year as described in the contents section and consider the implications for our report if we become aware of any apparent misstatements or material inconsistencies with the financial statements.
Basis of audit opinion We conducted our audit in accordance with United Kingdom auditing standards issued by the Auditing Practices Board. An audit includes examination, on a test basis, of evidence relevant to the amounts and disclosures in the financial statements. It also includes an assessment of the significant estimates and judgements made by the Directors in the preparation of the financial statements and of whether the accounting policies are appropriate to the circumstances of the Company and the Group, consistently applied and adequately disclosed.
We planned and performed our audit so as to obtain all the information and explanations which we considered necessary in order to provide us with sufficient evidence to give reasonable assurance that the financial statements are free from material misstatement, whether caused by fraud or other irregularity or error. In forming our opinion, we also evaluated the overall adequacy of the presentation of information in the financial statements.
Opinion In our opinion the financial statements give a true and fair view of the state of affairs of the Company and the Group as at 28 September 2002 and of the loss of the Group for the year then ended and have been properly prepared in accordance with the Companies Act 1985.

Deloitte & Touche
Chartered Accountants and Registered Auditors
London
20 November 2002
| Group profit and loss account | 34 Enodis annual report and accounts 2002 |
52 weeks to 28 September 2002 | 52 weeks to 29 September 2001 | |||||||||||||
| Notes | Pre-exceptional | Exceptional items (see note 4) | Total | Pre-exceptional (restated) | Exceptional items (see note 4) (restated) | Total (restated) | ||||||||
| £m | £m | £m | £m | £m | £m | |||||||||
| Turnover | 1 | |||||||||||||
| Food equipment | 767.1 | – | 767.1 | 887.2 | – | 887.2 | ||||||||
| Property | 16.1 | – | 16.1 | 16.6 | 16.6 | |||||||||
| Continuing operations | 783.2 | – | 783.2 | 903.8 | 903.8 | |||||||||
| Discontinued operations | – | – | – | 177.3 | – | 177.3 | ||||||||
| 783.2 | – | 783.2 | 1,081.1 | – | 1,081.1 | |||||||||
| Profit from operations | ||||||||||||||
| Food equipment | 67.2 | (8.9 | ) | 58.3 | 90.7 | (43.4 | ) | 47.3 | ||||||
| Property | 8.0 | – | 8.0 | 9.0 | – | 9.0 | ||||||||
| Corporate costs | (7.9 | ) | (0.5 | ) | (8.4 | ) | (8.9 | ) | (24.1 | ) | (33.0 | ) | ||
| Continuing operations | 67.3 | (9.4 | ) | 57.9 | 90.8 | (67.5 | ) | 23.3 | ||||||
| Discontinued operations | – | – | – | 9.1 | – | 9.1 | ||||||||
| 67.3 | (9.4 | ) | 57.9 | 99.9 | (67.5 | ) | 32.4 | |||||||
| Goodwill amortisation/impairment | (19.0 | ) | (48.9 | ) | (67.9 | ) | (23.0 | ) | (100.0 | ) | (123.0 | ) | ||
| Operating profit/(loss) | 1,3 | |||||||||||||
| Continuing operations | 48.3 | (58.3 | ) | (10.0 | ) | 67.8 | (167.5 | ) | (99.7 | ) | ||||
| Discontinued operations | – | – | – | 9.1 | – | 9.1 | ||||||||
| 48.3 | (58.3 | ) | (10.0 | ) | 76.9 | (167.5 | ) | (90.6 | ) | |||||
| Profit/(loss) on disposal of businesses | 4 | – | (38.1 | ) | (38.1 | ) | – | 23.5 | 23.5 | |||||
| 48.3 | (96.4 | ) | (48.1 | ) | 76.9 | (144.0 | ) | (67.1 | ) | |||||
| Net interest payable and similar charges | 7 | (29.3 | ) | (8.4 | ) | (37.7 | ) | (36.1 | ) | (5.8 | ) | (41.9 | ) | |
| Profit/(loss) on ordinary activities before taxation | 19.0 | (104.8 | ) | (85.8 | ) | 40.8 | (149.8 | ) | (109.0 | ) | ||||
| Tax on (profit)/loss on ordinary activities | 8 | (1.2 | ) | 0.2 | (1.0 | ) | (13.4 | ) | 2.0 | (11.4 | ) | |||
| Profit/(loss) on ordinary activities after taxation | 17.8 | (104.6 | ) | (86.8 | ) | 27.4 | (147.8 | ) | (120.4 | ) | ||||
| Equity minority interest | (0.2 | ) | – | (0.2 | ) | (0.3 | ) | – | (0.3 | ) | ||||
| Profit/(loss) for the period | 17.6 | (104.6 | ) | (87.0 | ) | 27.1 | (147.8 | ) | (120.7 | ) | ||||
| Equity dividends | 9 | – | – | – | (4.8 | ) | – | (4.8 | ) | |||||
| Retained profit/(loss) | 17.6 | (104.6 | ) | (87.0 | ) | 22.3 | (147.8 | ) | (125.5 | ) | ||||
52 weeks to 28 September 2002 | 52 weeks to 29 September 2001 (restated) | |||||
| Notes | pence | pence | ||||
| Earnings/(loss) per share | 10 | |||||
| Basic loss per share | (24.8 | ) | (39.3 | ) | ||
| Adjusted basic earnings per share | 10.4 | 16.3 | ||||
| Diluted loss per share | (24.8 | ) | (39.3 | ) | ||
| Adjusted diluted earnings per share | 10.4 | 16.3 | ||||
Statement of total recognised gains and losses
52 weeks to 28 September 2002 | 52 weeks to 29 September 2001 (restated) | |||||
| Notes | £m | £m | ||||
| Loss for the period | (87.0 | ) | (120.7 | ) | ||
| Goodwill/(negative) goodwill written back on disposals, previously written off | 65.1 | (4.4 | ) | |||
| Currency translation differences on foreign currency net investments | (5.7 | ) | (1.7 | ) | ||
| Total recognised losses for the period | 23 | (27.6 | ) | (126.8 | ) | |
| Prior period adjustment | 26.9 | – | ||||
| Total recognised losses since last annual report | (0.7 | ) | (126.8 | ) | ||
Movements on reserves are set out in note 22.
The accompanying notes form an integral part of these accounts.
| Group and Company balance sheets | 35 Enodis annual report and accounts 2002 |
| Group 28 September 2002 | Group 29 September 2001 (restated) | Company 28 September 2002 | Company 29 September 2001 | |||||||
| Notes | £m | £m | £m | £m | ||||||
| Fixed assets | ||||||||||
| Intangible assets: goodwill | 11 | 235.4 | 310.2 | – | – | |||||
| Tangible assets | 12 | 88.0 | 111.4 | – | 0.5 | |||||
| Investments | 13 | 5.9 | 6.2 | 376.5 | 805.6 | |||||
| 329.3 | 427.8 | 376.5 | 806.1 | |||||||
| Current assets | ||||||||||
| Stocks | 14 | 77.7 | 105.6 | – | 3.6 | |||||
| Debtors | 15 | 127.4 | 200.7 | 104.7 | 948.6 | |||||
| Deferred tax asset | 8 | 25.3 | 26.9 | – | – | |||||
| Cash at bank and in hand | 72.7 | 39.4 | 0.1 | 5.3 | ||||||
| 303.1 | 372.6 | 104.8 | 957.5 | |||||||
| Creditors falling due within one year | ||||||||||
| Borrowings | 16 | (33.4 | ) | (2.4 | ) | – | – | |||
| Other creditors | 16 | (183.8 | ) | (225.1 | ) | (5.9 | ) | (933.4 | ) | |
| (217.2 | ) | (227.5 | ) | (5.9 | ) | (933.4 | ) | |||
| Net current assets | 85.9 | 145.1 | 98.9 | 24.1 | ||||||
| Total assets less current liabilities | 1 | 415.2 | 572.9 | 475.4 | 830.2 | |||||
| Financed by: | ||||||||||
| Creditors falling due after more than one year | 17 | 214.1 | 398.9 | 95.1 | 384.6 | |||||
| Provisions for liabilities and charges | 20 | 44.3 | 59.1 | – | 3.5 | |||||
| 258.4 | 458.0 | 95.1 | 388.1 | |||||||
| Capital and reserves | ||||||||||
| Called up share capital | 21 | 200.2 | 125.1 | 200.2 | 125.1 | |||||
| Share premium account | 22 | 234.2 | 239.0 | 234.2 | 239.0 | |||||
| Revaluation reserve | 22 | – | – | – | 120.0 | |||||
| Profit and loss account | 22 | (277.6 | ) | (250.0 | ) | (54.1 | ) | (42.0 | ) | |
| Equity shareholders’ funds | 23 | 156.8 | 114.1 | 380.3 | 442.1 | |||||
| Equity minority interests | – | 0.8 | – | – | ||||||
| 415.2 | 572.9 | 475.4 | 830.2 | |||||||
The accompanying notes form an integral part of these accounts.
Approved by the Board on 20 November 2002.
 |  |
| A J Allner Director | W D Wrench Director |
| Group cash flow statement | 36 Enodis annual report and accounts 2002 |
52 weeks to 28 September 2002 | 52 weeks to 29 September 2001 | |||||
| Notes | £m | £m | ||||
| Net cash inflow from operating activities before exceptional items | a | 100.0 | 120.8 | |||
| Net cash outflow from operating exceptional items | a | (27.4 | ) | (27.8 | ) | |
| Net cash inflow from operating activities | a | 72.6 | 93.0 | |||
| Return on investments and servicing of finance | ||||||
| Interest paid | (23.3 | ) | (36.8 | ) | ||
| Financing fees paid | (18.9 | ) | (4.1 | ) | ||
| (42.2 | ) | (40.9 | ) | |||
| Taxation | ||||||
| Overseas and UK tax paid | (3.3 | ) | (6.0 | ) | ||
| Capital expenditure and financial investment | ||||||
| Payments to acquire tangible fixed assets | (9.9 | ) | (23.7 | ) | ||
| Receipts from sale of tangible fixed assets | 0.9 | 7.4 | ||||
| (9.0 | ) | (16.3 | ) | |||
| Acquisitions and disposals | ||||||
| Purchase of subsidiary undertakings and minority interests | – | (25.8 | ) | |||
| Sale of subsidiary undertakings | 88.6 | 98.6 | ||||
| 88.6 | 72.8 | |||||
| Equity dividends paid | – | (28.2 | ) | |||
| Cash inflow before financing | 106.7 | 74.4 | ||||
| Financing | ||||||
| Issue of shares | 21 | 70.3 | 0.2 | |||
| Issue of 103 /8% senior subordinated notes | 100.0 | – | ||||
| Additional net borrowings | 160.8 | 398.3 | ||||
| Repayment of term loan and revolving multi-currency facility | (400.4 | ) | (385.7 | ) | ||
| Net decrease in other loans | (2.9 | ) | (72.8 | ) | ||
| Capital element of finance lease repayments | (0.5 | ) | (0.6 | ) | ||
| (72.7 | ) | (60.6 | ) | |||
| Increase in cash in the period | 34.0 | 13.8 | ||||
The accompanying notes form an integral part of these accounts.
| Notes to the Group cash flow statement | 37 Enodis annual report and accounts 2002 |
| 52 weeks to 28 September 2002 | 52 weeks to 29 September 2001 | |||||||||||
a) Reconciliation of operating profit/(loss) to net cash inflow from operating activities | Before exceptional items £m | Exceptional items £m | Total £m | Before exceptional items £m | Exceptional items £m | Total £m | ||||||
| Operating profit/(loss) | 48.3 | (58.3 | ) | (10.0 | ) | 76.9 | (167.5 | ) | (90.6 | ) | ||
| Depreciation | 15.7 | – | 15.7 | 22.7 | – | 22.7 | ||||||
| Amortisation/impairment of goodwill | 19.0 | 48.9 | 67.9 | 23.0 | 100.0 | 123.0 | ||||||
| Gain on sale of fixed assets | – | – | – | (1.7 | ) | – | (1.7 | ) | ||||
| Provisions (net) | (2.2 | ) | (5.6 | ) | (7.8 | ) | (6.0 | ) | 16.5 | 10.5 | ||
| Decrease in stock | 5.5 | 5.9 | 11.4 | 12.1 | 0.5 | 12.6 | ||||||
| Decrease in debtors | 19.7 | – | 19.7 | 10.7 | – | 10.7 | ||||||
| Increase/(decrease) in creditors | (6.0 | ) | (18.3 | ) | (24.3 | ) | (16.9 | ) | 22.7 | 5.8 | ||
| Net cash inflow/(outflow) from operating activities | 100.0 | (27.4 | ) | 72.6 | 120.8 | (27.8 | ) | 93.0 | ||||
Businesses disposed of during the year contributed £7.3m (2001: £20.3m) to the Group’s net cash inflow from operating activities.
b) Reconciliation of net cash flow to movement in net debt | 52 weeks to 28 September 2002 £m | 52 weeks to 29 September 2001 £m | ||
| Increase in net cash in the period | 34.0 | 13.8 | ||
| Loans and finance leases acquired with subsidiary undertakings | – | (0.7 | ) | |
| Cash outflow from capital element of finance lease payments | 0.5 | 0.6 | ||
| Repayment of other loans | 2.9 | 5.4 | ||
| New finance leases | (1.5 | ) | – | |
| Borrowings repaid | 400.4 | 54.8 | ||
| Net increase in new loans | (160.8 | ) | – | |
| Issue of 103/8% senior subordinated notes | (100.0 | ) | – | |
| Translation difference | 4.3 | (5.6 | ) | |
| Movement in net debt | 179.8 | 68.3 | ||
| Net debt at start of period | (365.9 | ) | (434.2 | ) |
| Net debt at end of period | (186.1 | ) | (365.9 | ) |
c) Reconciliation of net debt to balance sheet | 2002 £m | 2001 £m | ||
| Cash at bank and in hand | 72.7 | 39.4 | ||
| Current borrowing | (33.4 | ) | (2.4 | ) |
| Exclude current proportion of deferred financing costs | (2.8 | ) | (1.1 | ) |
| 36.5 | 35.9 | |||
| Long-term lease obligations | (1.6 | ) | (1.2 | ) |
| 103/8% senior subordinated notes | (100.0 | ) | – | |
| Long-term debt | (112.5 | ) | (397.7 | ) |
| Exclude long-term proportion of deferred financing costs | (8.5 | ) | (2.9 | ) |
| Net debt at end of period | (186.1 | ) | (365.9 | ) |
d) Analysis of movement in net debt | 2001 £m | Cash flow £m | Other non-cash changes £m | Translation adjustments £m | 2002 £m | |||||
| Cash | 39.4 | 34.0 | – | (0.7 | ) | 72.7 | ||||
| Borrowings due within one year | (3.5 | ) | (0.4 | ) | – | 0.4 | (3.5 | ) | ||
| Revolving multi-currency facilities | (387.5 | ) | 400.4 | – | (12.9 | ) | – | |||
| 103/8% senior subordinated notes | – | (100.0 | ) | – | – | (100.0 | ) | |||
| Term Loan | – | (160.8 | ) | – | 16.7 | (144.1 | ) | |||
| Other long-term debt | (14.3 | ) | 3.8 | (1.5 | ) | 0.8 | (11.2 | ) | ||
| Net debt | (365.9 | ) | 177.0 | (1.5 | ) | 4.3 | (186.1 | ) | ||
Accounting policies | 38 Enodis annual report and accounts 2002 |
Basis of accounting The accounts have been prepared under the historical cost convention modified to include the revaluation of certain assets and comply in all respects with applicable Accounting Standards in the UK.
The profit for the period on a historical cost basis, excluding the effect of the revaluation of certain assets, was not materially different from the profit reported on page 34.
Basis of consolidation These accounts consolidate the accounts of the Company and all its subsidiary companies and undertakings (“subsidiary entities”) made up to the period end.
The results of the subsidiary entities are included in the Group profit and loss account from the date of acquisition to the date of disposal.
Investments
(a) Subsidiary entities In the accounts of the Company, up to 2 October 1999, investments in subsidiary entities were valued at cost plus post-acquisition retained profits, unless there was evidence of an impairment in value in which case the lower value is adopted. The valuations have not been updated since 2 October 1999. Following the corporate restructuring described on page 48, investments are now held at cost less permanent diminution in value.
(b) Other fixed asset investments These are shown at cost less amounts written off. Income is recognised upon receipt.
Acquisitions and disposals On the acquisition of a business, including an interest in an associated undertaking, fair values are attributed to the Group’s share of net separable assets. Where the cost of the assets exceeds the fair values attributable to such net assets, the difference is treated as purchased goodwill. Following the implementation of FRS10, goodwill arising on the acquisition of subsidiaries is capitalised in the Group balance sheet in the year of acquisition. Goodwill arising on associates is included with the carrying value of the associate.
Goodwill and intangible fixed assets Goodwill arising on acquisitions has been capitalised and is amortised over a period of 20 years; the Directors regard 20 years as a reasonable maximum for the estimated useful life of goodwill since it is difficult to make projections exceeding this period. When it is apparent that the carrying value of goodwill exceeds the estimated net present value of future cash flows less operating assets, an impairment provision is charged against the profit for the period. FRS10 does not require reinstatement of goodwill previously eliminated against reserves; in accordance with FRS10 such goodwill has been offset against the profit and loss account reserves. Goodwill previously taken to reserves is charged in the profit and loss account when the related business is sold.
Tangible fixed assets Tangible fixed assets are stated at cost less depreciation. Depreciation is provided at rates calculated to write-off the cost or valuation of each asset, predominantly on a straight line basis, over its expected useful life as follows:
| – | Freehold land: nil. |
| – | Freehold and long leasehold buildings: 1%–2%. |
| – | Short leasehold properties: over the unexpired period of the lease. |
| – | Plant and equipment: 10%–331/3%. |
Leases Assets acquired under finance leases are capitalised and depreciated over the shorter of the lease term and the expected useful life of the asset. Operating lease rentals are charged to the profit and loss account as incurred.
Stocks Stocks are stated at the lower of cost and net realisable value. The cost of work-in-progress and finished goods includes an appropriate portion of manufacturing overheads.
Turnover Turnover is the invoiced value of sales excluding value added tax.
Research and development Research and development expenditure is written off as it is incurred.
Taxation Corporation tax payable is provided on taxable profits at the current rate. Credit is taken for Advance Corporation Tax written-off in previous years when it is recoverable against current corporation tax liabilities.
Deferred taxation is provided on timing differences that result in obligations at the balance sheet date to pay more tax, or a right to pay less tax, at a future date, at rates expected to apply when they crystallise based on current tax rates and law. Timing differences arise from the inclusion of items of income and expenditure in taxation computations in periods different from those in which they are included in financial statements. Deferred tax assets and liabilities are not discounted. Deferred tax liabilities are recognised in full. Deferred tax assets are recognised to the extent that it is considered more likely than not that the asset will be recovered.
No provision has been made for any potential taxation liability that would arise were the earnings of foreign subsidiary entities to be remitted to the UK
Pension costs It is the general policy of the Group to fund pension liabilities, on the advice of professionally qualified actuaries, by payments to independent trusts or to insurance companies. Independent actuaries’ valuations are carried out at regular intervals, on a projected unit funding or attained age basis. In addition, the impact of any significant related events, such as major changes in stock market values, are assessed through a formal review process.
Charges in respect of defined benefit schemes are made to the profit and loss account so as to spread the costs of pensions at a substantially level percentage of payroll costs over employees’ estimated service lives within the Group. Contributions to defined contribution schemes are charged to the profit and loss account on a payment basis.
Foreign currency translation Translation differences arising from exchange rate variations on trading transactions are included in operating profit. Overseas profits remitted to the United Kingdom during the period are dealt with at actual rates of exchange.
The balance sheets of overseas subsidiary entities are translated into sterling at rates of exchange ruling at the year end. Profit and loss accounts are translated at the average rate for the month in which the profits were earned. Differences arising from the restatement of opening foreign currency net investments and net overseas profits or losses are dealt with through reserves, as are differences on long-term foreign currency borrowings used to finance overseas investment. Other translation differences are dealt with in the profit and loss account.
| Notes to the accounts | 39 Enodis annual report and accounts 2002 |
| 1 Analyses of turnover, operating profit/(loss) and total assets less current liabilities | ||||
52 weeks to 28 September 2002 £m | 52 weeks to 29 September 2001 £m | |||
| a) Turnover | ||||
| Food Service Equipment – North America | 469.9 | 498.7 | ||
| Food Service Equipment – Europe and Asia | 144.4 | 185.4 | ||
| Food Retail Equipment | 152.8 | 203.1 | ||
| Food Equipment | 767.1 | 887.2 | ||
| Property | 16.1 | 16.6 | ||
| Continuing operations | 783.2 | 903.8 | ||
| Discontinued operations | – | 177.3 | ||
| 783.2 | 1,081.1 | |||
52 weeks to 28 September 2002 £m | 52 weeks to 29 September 2001 £m | |||
| b) Turnover by origin: geographical analysis | ||||
| United Kingdom | 67.4 | 262.0 | ||
| North America | 602.7 | 667.1 | ||
| Rest of Europe | 88.7 | 112.3 | ||
| Rest of the World | 24.4 | 39.7 | ||
| 783.2 | 1,081.1 | |||
| 52 weeks to 29 September 2002 £m | 52 weeks to 29 September 2001 £m | |||
| c) Turnover by destination: geographical analysis | ||||
| United Kingdom | 72.9 | 264.0 | ||
| North America | 564.1 | 622.7 | ||
| Rest of Europe | 80.5 | 99.7 | ||
| Rest of the World | 65.7 | 94.7 | ||
| 783.2 | 1,081.1 | |||
Turnover from discontinued operations represents the Building and Consumer Products businesses sold in June 2001. Turnover from continuing operations for the 52 weeks ended 28 September 2002 includes £60.0m (2001: £138.3m) in respect of Food Equipment businesses sold in the year. Current year turnover has been reduced by £11.5m in respect of foreign exchange movements compared to the prior year.
| 52 weeks to 28 September 2002 | 52 weeks to 29 September 2001 | |||||||||||
Pre- exceptional items £m | Exceptional items (see note 4) £m | Total £m | Pre- exceptional items £m | Exceptional items (see note 4) £m | Total £m | |||||||
| d) Operating profit/(loss) | ||||||||||||
| Food Service Equipment – North America | 60.8 | 0.2 | 61.0 | 62.6 | (25.6 | ) | 37.0 | |||||
| Food Service Equipment – Europe and Asia | 9.7 | (2.5 | ) | 7.2 | 17.7 | (5.2 | ) | 12.5 | ||||
| Food Retail Equipment | (3.3 | ) | (6.6 | ) | (9.9 | ) | 10.4 | (12.6 | ) | (2.2 | ) | |
| 67.2 | (8.9 | ) | 58.3 | 90.7 | (43.4 | ) | 47.3 | |||||
| Food Equipment goodwill amortisation and impairment | (19.0 | ) | (48.9 | ) | (67.9 | ) | (23.0 | ) | (100.0 | ) | (123.0 | ) |
| Food Equipment | 48.2 | (57.8 | ) | (9.6 | ) | 67.7 | (143.4 | ) | (75.7 | ) | ||
| Property | 8.0 | – | 8.0 | 9.0 | – | 9.0 | ||||||
| Corporate costs | (7.9 | ) | (0.5 | ) | (8.4 | ) | (8.9 | ) | (24.1 | ) | (33.0 | ) |
| Continuing operations | 48.3 | (58.3 | ) | (10.0 | ) | 67.8 | (167.5 | ) | (99.7 | ) | ||
| Discontinued operations | – | – | – | 9.1 | – | 9.1 | ||||||
| 48.3 | (58.3 | ) | (10.0 | ) | 76.9 | (167.5 | ) | (90.6 | ) | |||
| 40 Enodis annual report and accounts 2002 Notes to the accounts |
| 1 Analyses of turnover, operating profit/(loss) and total assets less current liabilities continued | ||||||||||||
| 52 weeks to 28 September 2002 | 52 weeks to 29 September 2001 | |||||||||||
| Pre- exceptional items £m | �� | Exceptional items (see note 4) £m | Total £m | Pre- exceptional items £m | Exceptional items (see note 4) £m | 2001 Total £m | ||||||
| e) Geographical analysis: operating profit | ||||||||||||
| United Kingdom | 1.4 | (1.8 | ) | (0.4 | ) | 11.9 | (13.7 | ) | (1.8 | ) | ||
| North America | 55.5 | (6.3 | ) | 49.2 | 72.0 | (49.0 | ) | 23.0 | ||||
| Rest of Europe | 9.5 | (1.1 | ) | 8.4 | 14.9 | (2.4 | ) | 12.5 | ||||
| Rest of the World | 0.9 | (0.2 | ) | 0.7 | 1.1 | (2.4 | ) | (1.3 | ) | |||
| Goodwill amortisation | (19.0 | ) | (48.9 | ) | (67.9 | ) | (23.0 | ) | (100.0 | ) | (123.0 | ) |
| 48.3 | (58.3 | ) | (10.0 | ) | 76.9 | (167.5 | ) | (90.6 | ) | |||
Operating profit for the 52 weeks ended 28 September 2002 includes £4.4m (2001: £11.2m) in respect of Food Equipment businesses sold in the year. Current year operating profit has been reduced by £1.3m in respect of foreign exchange movements.
| 2002 £m | 2001 (restated) £m | |||
| f) Total assets less current liabilities | ||||
| Food Service Equipment – North America | 97.4 | 111.6 | ||
| Food Service Equipment – Europe and Asia | 46.0 | 50.5 | ||
| Food Retail Equipment | 24.9 | 45.9 | ||
| Food Equipment goodwill | 235.4 | 310.2 | ||
| Food Equipment | 403.7 | 518.2 | ||
| Property | 9.4 | 10.9 | ||
| Investments | 5.9 | 4.8 | ||
| 419.0 | 533.9 | |||
| Corporate | (43.1 | ) | 2.0 | |
| Net cash | 39.3 | 37.0 | ||
| 415.2 | 572.9 | |||
| 2002 £m | 2001 (restated) £m | |||
| g) Total assets less current liabilities: geographical analysis | ||||
| United Kingdom | 21.8 | 58.7 | ||
| North America | 276.9 | 416.2 | ||
| Rest of Europe | 71.0 | 44.4 | ||
| Rest of the World | 6.2 | 16.6 | ||
| Net cash | 39.3 | 37.0 | ||
| 415.2 | 572.9 | |||
| 41 Enodis annual report and accounts 2002 Notes to the accounts |
| 2 Operating costs | ||||
52 weeks to 28 September 2002 | 52 weeks to 29 September 2001 | |||
£m | £m | |||
| Cost of sales | 643.8 | 888.2 | ||
| Net operating expenses: | ||||
| Distribution costs | 9.1 | 23.6 | ||
| Administration expenses | 80.0 | 90.8 | ||
| Other operating expenses | 2.0 | 1.6 | ||
| Operating costs before exceptional items | 734.9 | 1,004.2 | ||
| Operating exceptional items (see note 4) | 58.3 | 167.5 | ||
| Operating costs | 793.2 | 1,171.7 | ||
Gross profit for the period was £139.4m (2001: £192.9m).
The prior year figures include the following amounts relating to discontinued operations: cost of sales £145.3m, distribution costs £13.3m, administration expenses £9.5m and other operating expenses £0.1m.
| 3 Operating profit/(loss) | ||||
52 weeks to 28 September 2002 | 52 weeks to 29 September 2001 | |||
£m | £m | |||
| Operating profit/(loss) is stated after charging/(crediting): | ||||
| Depreciation of tangible fixed assets: | ||||
| – owned | 15.6 | 22.6 | ||
| – leased | 0.1 | 0.1 | ||
| Amortisation of intangible fixed assets – goodwill | 19.0 | 23.0 | ||
| Rental of plant and equipment under operating leases | 2.1 | 2.6 | ||
| Rental of land and buildings | 5.3 | 14.3 | ||
| Rental income | (0.5 | ) | (0.7 | ) |
| Research and development | 13.4 | 13.8 | ||
| Auditors’ remuneration: | ||||
| – audit fees (i) | 0.9 | 1.0 | ||
| – other fees in the UK and overseas (ii) | 1.8 | 2.2 | ||
| Profit on sale of tangible fixed assets | – | (1.7 | ) | |
| (i) | The audit fees for the period include £15,000 (2001: £14,000) in respect of the Company. |
| (ii) | A further £1.4m (2001: £1.2m) of fees not charged to operating profit have been paid in respect of refinancing, disposals and other projects. |
| 4 Exceptional items | ||||
52 weeks to 28 September 2002 | 52 weeks to 29 September 2001 | |||
£m | £m | |||
| a) Operating exceptional items | ||||
| Restructuring costs and inventory write downs | 9.4 | 33.1 | ||
| Revisions to working capital provisions and other exceptional warranty costs | – | 13.7 | ||
| Litigation costs | – | 12.2 | ||
| Costs associated with the Board’s review of strategic options | – | 8.5 | ||
| 9.4 | 67.5 | |||
| Goodwill impairment | 48.9 | 100.0 | ||
| Operating exceptional items | 58.3 | 167.5 | ||
2002: Restructuring costs in the 52 weeks to 28 September 2002 principally represent costs associated with the closure of excess operating capacity in our Food Retail Equipment group, including the write down of inventory at Kysor Warren reflecting the decline in the business. There has also been further rationalisation of administration functions and simplification of management structures in the European businesses within the Global Food Service equipment group. In 2001, restructuring costs of £33.1m comprise the costs associated with a number of rationalisation projects including headcount savings and manufacturing efficiency improvements.
The Group has reassessed the carrying value of goodwill in respect of the Scotsman acquisition. In accordance with the methodology presented in FRS11 “Impairment of Fixed Assets and Goodwill”, which requires consideration of the net present value of estimated future cash flows, the carrying value of the goodwill was written down by £100m in 2001 and by a further £48.9m in 2002, relating to Kysor Warren.
| 42 Enodis annual report and accounts 2002 Notes to the accounts |
4 Exceptional items continued
2001: the Group settled the long standing Bomar cases for a payment of $17.5m (£12.2m) in settlement of all claims. A payment of $10m was made in 2001 and the balance in 2002.
The Board undertook a review of the Group’s strategic options with the objective of maximising shareholder value. Costs of £8.5m, predominantly professional fees were incurred.
Following the publication of FRS 18 “Accounting Policies”, the Group reassessed its accounting estimates for warranty provisions and provided an additional £8.0m. Further exceptional warranty costs of £4.5m which arose in the period were written off and previously capitalised development costs of £1.2m were also written off.
52 weeks to 28 September 2002 | ||||||||||||||
Sammic SA(i) | Belshaw Bros, Inc(ii) | Austral Refrigeration Pty Limited(iii) | Aladdin Temp-Rite(iv) | Prolon LLC(v) | Building and Consumer Products(vi) | Total | ||||||||
£m | £m | £m | £m | £m | £m | £m | ||||||||
| b) Disposal of businesses | ||||||||||||||
| Proceeds – cash | 18.7 | 16.7 | 7.5 | 27.0 | 1.0 | 24.4 | 95.3 | |||||||
| Less: | ||||||||||||||
| Book value of net assets | (4.7 | ) | (4.7 | ) | (13.0 | ) | (12.3 | ) | (1.7 | ) | (20.9 | ) | (57.3 | ) |
| Costs | (0.9 | ) | (3.4 | ) | (2.0 | ) | (4.4 | ) | (0.1 | ) | (0.2 | ) | (11.0 | ) |
| Goodwill | (10.4 | ) | (25.0 | ) | – | (29.7 | ) | – | – | (65.1 | ) | |||
| Profit/(loss) on disposal | 2.7 | (16.4 | ) | (7.5 | ) | (19.4 | ) | (0.8 | ) | 3.3 | (38.1 | ) | ||
| 52 weeks to 29 September 2001 | ||||||
| Building and Consumer Products(vi) £m | Scotsman Response(vii) £m | Total £m | ||||
| Proceeds – cash | 114.0 | – | 114.0 | |||
| – vendor loan note (note 15) | 20.0 | – | 20.0 | |||
| 134.0 | – | 134.0 | ||||
| Less: | ||||||
| Book value of net assets | (85.7 | ) | (3.1 | ) | (88.8 | ) |
| Payment into pension fund | (10.0 | ) | – | (10.0 | ) | |
| Costs | (13.6 | ) | (0.2 | ) | (13.8 | ) |
| Goodwill | 4.4 | (2.3 | ) | 2.1 | ||
| Profit/(loss) on disposal | 29.1 | (5.6 | ) | 23.5 | ||
(i) On 13 December 2001, the Group disposed of Sammic SA and its subsidiary undertakings for net cash consideration of £18.7m realising a profit on disposal of £2.7m after writing off goodwill of £10.4m previously charged against reserves.
(ii) On 24 April 2002 the Group sold Belshaw Bros, Inc (“Belshaw”) for a cash consideration of £16.7m ($24.2m) payable in full upon completion. The Group realised a loss on disposal of £16.4m after writing off goodwill of £25.0m previously charged against reserves.
(iii) On 21 May 2002 the Group sold Austral Refrigeration Pty Limited (“Austral”) for a net cash consideration of £7.5m payable in full on completion. The Group realised a loss on disposal of £7.5m.
(iv) On 23 May 2002 the Group sold the Aladdin Temp-Rite (ATR) companies for a net cash consideration of £27.0m ($39.2m) payable in full on completion. The Group realised a loss on disposal of £19.4m after writing off goodwill of £29.7m previously charged against reserves.
(v) On 14 June 2002, the Group sold the assets of Prolon LLC (“Prolon”) for cash consideration of £1.0m ($1.5m) payable in full on completion. The Group realised a loss on disposal of £0.8m.
(vi) In June 2001, the Group disposed of its Building and Consumer Products business (“Magnet”) to Nobia AB generating a profit on disposal of £29.1m and a cash inflow of £98.6m. The Group also received a Vendor Loan Note for £20m and warrants over Nobia AB shares which were not valued.
In December 2001 £2.1m was paid to Nobia AB in respect of the value of net assets transferred following the sale.
In June 2002, Nobia AB’s shares were listed on the Stockholm Stock Exchange and the Group received £24.4m being £20.0m for the vendor loan note, £0.4m compensation for early repayment of the note and £4.0m for the sale of the shares arising from the exercise of the warrants. After writing off deferred finance fees arising from the early repayment of debt and other associated costs, the net profit on disposal was £3.3m.
The net cash consideration, after expenses, of all the above disposals has been used to repay debt.
(vii) On 14 September 2001, the Group disposed of Scotsman Response Limited for cash consideration of up to £45,000.
| 43 Enodis annual report and accounts 2002 Notes to the accounts |
| 4 Exceptional items continued | ||||
| 52 weeks to 28 September 2002 £m | 52 weeks to 29 September 2001 £m | |||
| c) Net interest payable and similar charges | ||||
| Deferred finance fees written off | 4.2 | 5.8 | ||
| Refinancing fees | 4.2 | – | ||
| 8.4 | 5.8 | |||
Deferred finance fees written off of £4.2m relate to amounts previously capitalised in respect of the multi-currency revolving credit facility that was replaced by the refinancing announced on 20 February 2002. In 2001 the amount written off of £5.8m related to the amount written off at the time of replacing the Scotsman acquisition financing in March 2001.
Refinancing fees represent amounts payable to banks in relation to the termination of our previous multi-currency revolving credit facility and costs associated with the bridging facility under the Group’s new arrangements (see note 18).
| 5 Staff costs | ||||
| 52 weeks to 28 September 2002 £m | 52 weeks to 29 September 2001 £m | |||
| a) Staff costs, including Directors, comprised: | ||||
| Wages and salaries | 157.2 | 217.6 | ||
| Social security costs | 18.9 | 26.5 | ||
| Pension and other post-retirement costs | 3.9 | 4.5 | ||
| 180.0 | 248.6 | |||
| 52 weeks to 28 September 2002 | 52 weeks to 29 September 2001 | |||
| b) The average monthly number of employees was: | ||||
| Food Service Equipment – North America | 3,871 | 4,138 | ||
| Food Service Equipment – Europe and Asia | 1,627 | 2,126 | ||
| Food Retail Equipment | 1,443 | 2,043 | ||
| Corporate and Property | 29 | 26 | ||
| 6,970 | 8,333 | |||
| Discontinued businesses | – | 1,557 | ||
| 6,970 | 9,890 | |||
| 6 Directors’ remuneration | ||||
| 52 weeks to 28 September 2002 £m | 52 weeks to 29 September 2001 £m | |||
| Fees as Directors | 0.21 | 0.26 | ||
| Salaries and benefits | 1.23 | 0.91 | ||
| Bonuses | 0.93 | 0.25 | ||
| 2.37 | 1.42 | |||
| Pension contributions | – | 0.05 | ||
| 2.37 | 1.47 | |||
| Compensation for loss of office | 0.73 | 0.33 | ||
| 3.10 | 1.80 | |||
Disclosure on Directors’ remuneration, share options, pension contributions and pension entitlements required by the Companies Act 1985 and those specified for audit by the UK Listing Authority is included in the Board remuneration report on pages 29 to 32 and forms part of these financial statements.
| 44 Enodis annual report and accounts 2002 Notes to the accounts |
| 7 Net interest payable and similar charges | ||||
| 52 weeks to 28 September 2002 | 52 weeks to 29 September 2001 | |||
| £m | £m | |||
| Interest payable and similar charges: | ||||
| Interest on 103 /8 % senior subordinated notes | (5.3 | ) | – | |
| Amortisation of deferred financing costs | (2.5 | ) | (1.2 | ) |
| Term loan and revolving multi-currency facility | (23.8 | ) | (36.7 | ) |
| Other loans | (0.4 | ) | (0.7 | ) |
| (32.0 | ) | (38.6 | ) | |
| Interest receivable: | ||||
| Bank balances | 1.5 | 1.8 | ||
| Other | 1.2 | 0.7 | ||
| 2.7 | 2.5 | |||
| Net interest payable and similar charges before exceptional finance costs | (29.3 | ) | (36.1 | ) |
| Exceptional finance costs (see note 4) | (8.4 | ) | (5.8 | ) |
| Net interest payable and similar charges | (37.7 | ) | (41.9 | ) |
| 8 Tax on profit/(loss) on ordinary activities | ||||
| a) Analysis of charge in the period | ||||
| 52 weeks to 28 September 2002 | 52 weeks to 29 September 2001 (restated) | |||
| £m | £m | |||
| The tax charge for the period comprised: | ||||
| UK taxation at 30% (2001: 30%) | ||||
| – current year | – | – | ||
| Foreign taxation: | ||||
| – current year | 5.8 | 8.6 | ||
| – prior year | (3.8 | ) | – | |
| 2.0 | 8.6 | |||
| Tax relief on exceptional items | (0.2 | ) | (2.0 | ) |
| 1.8 | 6.6 | |||
| Deferred taxation | (0.8 | ) | 4.8 | |
| 1.0 | 11.4 | |||
The difference between the Company’s effective tax rate and the statutory income tax rate is reconciled as follows:
| 52 weeks to 28 September 2002 | 52 weeks to 29 September 2001 | |||
| % | % | |||
| Statutory income tax rate in region where majority of profits earned | 35.0 | 35.0 | ||
| Increase/(decrease) in rate resulting from: | ||||
| Permanent differences | (1.9 | ) | (10.3 | ) |
| Effect of brought forward losses utilised (UK) | – | 3.8 | ||
| Effect of brought forward losses utilised (US) | 2.3 | 14.6 | ||
| US State and local taxes effect | (1.7 | ) | (3.6 | ) |
| Foreign tax effect | (0.9 | ) | (0.4 | ) |
| Exceptional items | (36.8 | ) | (49.9 | ) |
| Net other | (2.5 | ) | 4.7 | |
| Effect of adjustments in respect of prior years | 4.4 | – | ||
| Effective current tax rate | (2.1 | ) | (6.1 | ) |
The reconciliation is performed to the US Federal tax rate as the majority of the Group's profits are earned in that jurisdiction.
| 45 Enodis annual report and accounts 2002 Notes to the accounts |
8 Tax on profit/(loss) on ordinary activities continued
b) The benefit of brought forward tax losses predominately in the UK and the US reduce tax cash payments.
c) The adoption of FRS19 “Deferred tax” has required changes in the method of accounting for deferred tax assets and liabilities. As a result of these changes, the comparative period has been restated, principally in respect of tax losses and warranty reserves, as follows:
29 September 2001 (restated) | ||
| £m | ||
| Deferred tax provision as previously reported | – | |
| Adjustment to deferred tax in respect of timing differences | 26.9 | |
| Deferred tax asset restated | 26.9 | |
| d) Analysis of deferred tax asset | ||||
28 September 2002 | 29 September 2001 (restated) | |||
£m | £m | |||
| US revenue losses | 9.8 | 9.0 | ||
| Warranties | 11.5 | 11.9 | ||
| Other short-term timing differences | 11.7 | 14.0 | ||
| 33.0 | 34.9 | |||
| Accelerated capital allowances | (7.7 | ) | (8.0 | ) |
| 25.3 | 26.9 | |||
Deferred tax liabilities are recognised in full. Deferred tax assets are recognised to the extent that it is considered more likely than not that the asset will be recovered.
Deferred tax assets not recognised on the balance sheet are as follows:
28 September 2002 | 29 September 2001 (restated) | |||
£m | £m | |||
| Revenue losses | 78.8 | 79.0 | ||
| Other | 17.1 | 25.9 | ||
| Total potential deferred tax asset not recognised | 95.9 | 104.9 | ||
In addition the Group has surplus ACT carried forward of £12.6m (2001: £12.6m).
At the year end, the Directors expect that it will take some time for certain assets, principally the unrecognised US revenue losses, to be recovered and currently do not anticipate circumstances in which the Other unrecognised assets would be recovered.
At the year end no deferred tax asset was recognised by the Company (2001: nil).
The Group has the following losses available for offset against future profits:
28 September 2002 | 29 September 2001 (restated) | |||
£m | £m | |||
| United Kingdom losses | 72.3 | 85.0 | ||
| United States losses | 184.9 | 190.9 | ||
| Other territories | 6.2 | 8.9 | ||
| 263.4 | 284.8 | |||
| e) Analysis of movement in deferred tax asset | ||||
28 September 2002 | 29 September 2001 (restated) | |||
£m | £m | |||
| Balance at the beginning of the period (as restated) | 26.9 | 31.7 | ||
| Credited/(charged) to profit and loss account | 0.8 | (4.8 | ) | |
| Disposals | (1.0 | ) | – | |
| Currency realignment | (1.4 | ) | – | |
| Balance at the end of the period | 25.3 | 26.9 | ||
| 46 Enodis annual report and accounts 2002 Notes to the accounts |
| 9 Equity dividends | ||||
| 52 weeks to 28 September 2002 | 52 weeks to 29 September 2001 | |||
| £m | £m | |||
| Interim and final net per ordinary share (2001: 2.0p net) | – | 4.8 | ||
| – | 4.8 | |||
| 10 Earnings/(loss) per share | ||||
| 52 weeks to 28 September 2002 £m | 52 weeks to 29 September 2001(restated) £m | |||
| Basic and diluted loss attributable to shareholders | (87.0 | ) | (120.7 | ) |
| 52 weeks to 28 September 2002 m | 52 weeks to 29 September 2001 (restated) m | |||
| Basic weighted average number of shares | 351.0 | 307.3 | ||
| Dilution effect of: | ||||
| – executive share options | – | 0.2 | ||
| – share save options | – | 0.2 | ||
| Diluted weighted average number of shares | 351.0 | 307.7 | ||
| 52 weeks to 28 September 2002 pence | 52 weeks to 29 September 2001 (restated) pence | |||
| Basic and diluted loss per share | (24.8 | ) | (39.3 | ) |
| Effect per share of exceptional items | 15.9 | 15.5 | ||
| Effect per share of goodwill amortisation and impairment | 19.3 | 40.1 | ||
| Adjusted basic and diluted earnings per share | 10.4 | 16.3 | ||
Adjusted earnings per share before exceptional items (note 4) and goodwill amortisation (note 1d) are disclosed to reflect the underlying performance of the Group. The prior period has been restated for the bonus element of the rights issue. The theoretical ex-rights price was 82.2p.
| 11 Intangible fixed assets – goodwill | ||||
| Group | 2002 £m | 2001 £m | ||
| Cost: | ||||
| At the beginning of the period | 460.6 | 439.1 | ||
| Additions: | ||||
| – acquisitions in the period | – | 20.4 | ||
| – adjustments to prior period goodwill | 1.7 | – | ||
| Disposals of subsidiary entities | – | (2.7 | ) | |
| Currency realignment | (12.3 | ) | 3.8 | |
| At the end of the period | 450.0 | 460.6 | ||
| Amortisation: | ||||
| At the beginning of the period | 150.4 | 26.4 | ||
| Provided during the period | 19.0 | 23.0 | ||
| Provision for impairment (see note 4) | 48.9 | 100.0 | ||
| Disposals of subsidiary entities | – | (0.4 | ) | |
| Currency realignment | (3.7 | ) | 1.4 | |
| At the end of the period | 214.6 | 150.4 | ||
| Net book value at end of the period | 235.4 | 310.2 | ||
| 47 Enodis annual report and accounts 2002 Notes to the accounts |
| 12 Tangible fixed assets | ||||||||||
Land and buildings £m | Plant and equipment £m | Assets under construction £m | 2002 Total £m | 2001 Total £m | ||||||
| a) Group: | ||||||||||
| Cost: | ||||||||||
| At the beginning of the period | 77.1 | 171.6 | 2.8 | 251.5 | 345.5 | |||||
| Additions | 2.8 | 5.2 | 3.4 | 11.4 | 23.7 | |||||
| Acquisitions | – | – | – | – | 5.0 | |||||
| Disposals | (0.4 | ) | (6.7 | ) | (0.7 | ) | (7.8 | ) | (13.0 | ) |
| Disposals of subsidiary entities or businesses | (9.2 | ) | (32.7 | ) | (0.1 | ) | (42.0 | ) | (101.9 | ) |
| Reclassifications and transfers | – | 2.3 | (2.7 | ) | (0.4 | ) | (8.5 | ) | ||
| Currency realignment | (2.5 | ) | (5.7 | ) | (0.2 | ) | (8.4 | ) | 0.7 | |
| At the end of the period | 67.8 | 134.0 | 2.5 | 204.3 | 251.5 | |||||
| Depreciation: | ||||||||||
| At the beginning of the period | 22.7 | 117.4 | – | 140.1 | 173.7 | |||||
| Provided during the period | 3.2 | 12.5 | – | 15.7 | 22.7 | |||||
| Acquisitions | – | – | – | – | 2.6 | |||||
| Disposals | (0.2 | ) | (6.7 | ) | – | (6.9 | ) | (7.3 | ) | |
| Reclassifications and transfers | – | (0.3 | ) | – | (0.3 | ) | (2.1 | ) | ||
| Disposals of subsidiary entities or businesses | (2.3 | ) | (25.2 | ) | – | (27.5 | ) | (49.8 | ) | |
| Currency realignment | (0.8 | ) | (4.0 | ) | – | (4.8 | ) | 0.3 | ||
| At the end of the period | 22.6 | 93.7 | – | 116.3 | 140.1 | |||||
| Net book value at the end of the period | 45.2 | 40.3 | 2.5 | 88.0 | 111.4 | |||||
| Net book value at the beginning of the period | 54.4 | 54.2 | 2.8 | 111.4 | 171.8 | |||||
| The net book value of land and buildings comprises: | ||||||||||
| Freehold | 37.7 | 48.5 | ||||||||
| Short leasehold | 7.5 | 5.9 | ||||||||
| 45.2 | 54.4 | |||||||||
Plant and equipment net book value includes £0.3m (2001: £0.7m) of leased assets. Land and buildings net book value includes £1.5m (2001: £nil) of leased assets.
Plant and equipment owned 2002 £m | Plant and equipment owned 2001 £m | |||
| b) Company: | ||||
| Cost: | ||||
| At the beginning of the period | 1.2 | 1.6 | ||
| Additions | – | 0.5 | ||
| Disposals | (1.2 | ) | (0.9 | ) |
| At the end of the period | – | 1.2 | ||
| Depreciation: | ||||
| At the beginning of the period | 0.7 | 0.5 | ||
| Provided during the period | 0.1 | 0.2 | ||
| Disposals | (0.8 | ) | – | |
| At the end of the period | – | 0.7 | ||
| Net book value at the end of the period | – | 0.5 | ||
2002 Group £m | 2001 Group £m | 2002 Company £m | 2001 Company £m | |||||
| c) Capital commitments: | ||||||||
| Contracted commitments for future capital expenditure | 1.1 | 2.9 | – | – | ||||
| 48 Enodis annual report and accounts 2002 Notes to the accounts |
| 13 Fixed asset investments | ||||||||||||||
| Joint ventures and associated undertakings | ||||||||||||||
| Share of net assets £m | Goodwill £m | Total £m | Other unlisted investments £m | Own shares £m | 2002 Total £m | 2001 Total £m | ||||||||
| a) Group: | ||||||||||||||
| At the beginning of the period | 2.0 | 1.2 | 3.2 | 2.0 | 2.4 | 7.6 | 7.5 | |||||||
| Additions | 0.1 | – | 0.1 | – | – | 0.1 | 0.2 | |||||||
| Disposals | – | – | – | – | – | – | (0.1 | ) | ||||||
| At the end of the period | 2.1 | 1.2 | 3.3 | 2.0 | 2.4 | 7.7 | 7.6 | |||||||
| Amounts written off: | ||||||||||||||
| At the beginning of the period | – | – | – | 0.3 | 1.1 | 1.4 | 0.3 | |||||||
| Written off in the period | – | 0.1 | 0.1 | – | 0.3 | 0.4 | 1.1 | |||||||
| At the end of the period | – | 0.1 | 0.1 | 0.3 | 1.4 | 1.8 | 1.4 | |||||||
| Net book value at the end of the period | 2.1 | 1.1 | 3.2 | 1.7 | 1.0 | 5.9 | 6.2 | |||||||
Own shares comprise 1,269,341 ordinary shares of the Company (2001: 1,269,341), held in an ESOP trust. The market value of the shares held by the trust at 28 September 2002 was £0.6m, a value below cost value. The Directors do not consider this diminution in value to be permanent and therefore no further provision is deemed necessary.
| Group undertakings | ||||||||||
| Shares at valuation £m | Loans £m | Own shares £m | 2002 Total £m | 2001 Total £m | ||||||
| b) Company: | ||||||||||
| At the beginning of the period | 518.2 | 286.1 | 1.3 | 805.6 | 906.9 | |||||
| Additions | 376.5 | – | – | 376.5 | 10.0 | |||||
| Recoveries | – | (0.9 | ) | – | (0.9 | ) | (8.1 | ) | ||
| Reclassifications | – | – | – | – | (1.4 | ) | ||||
| Provisions | – | – | – | – | (1.1 | ) | ||||
| Disposals | (518.2 | ) | (285.2 | ) | (1.3 | ) | (804.7 | ) | (100.7 | ) |
| At the end of the period | 376.5 | – | – | 376.5 | 805.6 | |||||
Details of principal subsidiaries and significant investment and their activities are shown in note 27.
Pursuant to the financial restructuring of the Group which was announced on 20 February 2002, on 19 February 2002, the Company entered into a deed of agreement (“Transfer 1”) with its wholly owned subsidiary Enodis Holdings Limited (“EHL”) whereby it transferred substantially all of its assets and its business to EHL. Under the terms of Transfer 1, EHL also assumed all liabilities (except those which were stated to be excluded) of the Company and became the employer of the Company’s employees. The total consideration paid under Transfer 1 by EHL to the Company was £700,000,000 which was subsequently satisfied in part by the payment of cash and in part by the issue of shares in EHL. On the same day, EHL entered into a deed of agreement (“Transfer 2”) with its wholly owned subsidiary Enodis Group Limited (“EGL”) whereby it transferred all of its assets and its business to EGL. Under the terms of Transfer 2, EGL also assumed all liabilities (except those which were stated to be excluded) of EHL and became the employer of the EHL employees. The total consideration paid under Transfer 2 by EGL to EHL was £700,000,000, which was satisfied by the issue of shares in EGL.
The indebtedness under the senior credit facilities agreement dated 20 February 2002 (the “Facility Agreement”) is secured by fixed and floating charges over substantially all the assets of Enodis Holdings Limited and those Group companies which are guarantors under the Facility Agreement. The guarantors have unconditionally guaranteed all of the outstanding obligations under the Facility Agreement.
| 14 Stocks | ||||||||
| 2002 Group £m | 2001 Group £m | 2002 Company £m | 2001 Company £m | |||||
| Raw materials and consumables | 29.5 | 42.2 | – | – | ||||
| Work in progress | 8.0 | 15.7 | – | – | ||||
| Finished goods | 31.6 | 36.4 | – | – | ||||
| 69.1 | 94.3 | – | – | |||||
| Property | 8.6 | 11.3 | – | 3.6 | ||||
| 77.7 | 105.6 | – | 3.6 | |||||
At the period end the Directors are not aware of any significant difference between book value and replacement value of stocks.
| 49 Enodis annual report and accounts 2002 Notes to the accounts |
| 15 Debtors | ||||||||
2002 Group £m | 2001 Group £m | 2002 Company £m | 2001 Company £m | |||||
| Trade debtors | 108.1 | 149.6 | – | 0.2 | ||||
| Amounts due from subsidiary entities | – | – | 104.7 | 922.7 | ||||
| Other debtors | 14.5 | 23.6 | – | 2.3 | ||||
| Prepayments and accrued income | 4.8 | 4.3 | – | 0.2 | ||||
| Current tax | – | 3.2 | – | 3.2 | ||||
| 127.4 | 180.7 | 104.7 | 928.6 | |||||
| Vendor loan note | – | 20.0 | – | 20.0 | ||||
| 127.4 | 200.7 | 104.7 | 948.6 | |||||
| 16 Creditors falling due within one year | ||||||||
2002 Group £m | 2001 Group £m | 2002 Company £m | 2001 Company £m | |||||
| a) Borrowings: | ||||||||
| Term loan | 32.7 | – | – | – | ||||
| Deferred financing costs | (2.8 | ) | (1.1 | ) | – | – | ||
| Bank loans and overdrafts | 3.2 | 2.7 | – | – | ||||
| Other current borrowings | 0.1 | 0.7 | – | – | ||||
| Obligations under finance leases (note 26) | 0.2 | 0.1 | – | – | ||||
| Total (note 18) | 33.4 | 2.4 | – | – | ||||
2002 Group £m | 2001 Group £m | 2002 Company £m | 2001 Company £m | |||||
| b) Other creditors: | ||||||||
| Trade creditors | 55.8 | 81.8 | – | 3.2 | ||||
| Other creditors | 15.3 | 27.2 | 5.9 | 7.7 | ||||
| Amounts due to subsidiary entities | – | – | – | 919.7 | ||||
| Current tax | 12.3 | 21.5 | – | – | ||||
| Other taxes and social security | 2.6 | 2.9 | – | 0.6 | ||||
| Accruals and deferred income | 97.8 | 91.7 | – | 2.2 | ||||
| 183.8 | 225.1 | 5.9 | 933.4 | |||||
| 17 Creditors falling due after more than one year | ||||||||
2002 Group £m | 2001 Group £m | 2002 Company £m | 2001 Company £m | |||||
| Term loan | 111.4 | – | – | – | ||||
| 103 /8 % senior subordinated notes | 100.0 | – | 100.0 | – | ||||
| Revolving multi-currency credit facility | – | 387.5 | – | 387.5 | ||||
| Deferred financing costs | (8.5 | ) | (2.9 | ) | (4.9 | ) | (2.9 | ) |
| Other loans | 9.6 | 13.1 | – | – | ||||
| Obligations under finance leases (note 26) | 1.6 | 1.2 | – | – | ||||
| 214.1 | 398.9 | 95.1 | 384.6 | |||||
| 50 Enodis annual report and accounts 2002 | |
| Notes to the accounts |
| 18 Total borrowings | ||||||||
2002 Group | 2001 Group | 2002 Company | 2001 Company | |||||
£m | £m | £m | £m | |||||
| 103 /8 % senior subordinated notes | 100.0 | – | 100.0 | – | ||||
| Term loan | 144.1 | – | – | – | ||||
| Revolving multi-currency loan facility | – | 387.5 | – | 387.5 | ||||
| Deferred financing costs | (11.3 | ) | (4.0 | ) | (4.9 | ) | (4.0 | ) |
| Bank loans and overdrafts | 3.2 | 3.2 | – | – | ||||
| Other loans | 9.7 | 13.3 | – | – | ||||
| 245.7 | 400.0 | 95.1 | 383.5 | |||||
| Obligations under finance leases | 1.8 | 1.3 | – | – | ||||
| 247.5 | 401.3 | 95.1 | 383.5 | |||||
| Due within one year | 33.4 | 2.4 | – | – | ||||
| Due after more than one year | 214.1 | 398.9 | 95.1 | 383.5 | ||||
| 247.5 | 401.3 | 95.1 | 383.5 | |||||
An analysis of the maturity of debt is given in note 19.
On 20 February 2002 the Group announced new financing arrangements to replace the existing multi-currency revolving credit facility. This included a new committed senior credit facility consisting of a five year amortising $300m term loan, a six year $70m term loan, a five year $85m revolving multi-currency facility and a 10 year £150m bridge facility.
On 26 March 2002 the Company received the proceeds of a £100m senior subordinated note issue, priced at 103 /8 %, maturing in April 2012. The net proceeds were applied in part repayment of the bridge facility. On 9 April 2002, the Company completed a gross £75.1m three for five underwritten rights issue. The net proceeds were applied in part to repay in full the balance of the bridge facility and in part against the senior credit facility. Full syndication of the senior credit facilities was completed in July 2002.
During the year the $300m term loan has been reduced to $153.7m by applying $23m from the rights issue proceeds, $115.1m from the net proceeds of disposals and $8.2m from operating cash flow (in accordance with the schedule of repayments) against the facility.
The Group enters into interest rate swaps and forward rate agreements to change a portion of its floating rate debt into fixed rate debt and so reduce the impact of changes in interest rates on the Group’s interest charge. At 28 September 2002, the Group had interest rate swaps outstanding with an aggregate value of $183.0m of which $43.0m have not yet commenced.
The Group has also entered into cross-currency swaps to change the underlying currency profile of the debt. Two contracts have been entered into to exchange an aggregate of £60.0m for US dollars and Euros, such that the currency profile of the debt more closely matches the currency profile of the assets.
Other loans consist primarily of £10.7m of Industrial Revenue Bonds (IRBs) (2001: £11.3m) offset by a favourable revaluation of cross currency swaps used to hedge debt of £2.3m. The IRBs are at favourable rates of interest, set periodically by reference to market rates. These bonds incurred rates of interest between 1.9% and 6.1% during the period.
19 Financial instruments
An explanation of the Group’s treasury policy and controls is included in the Financial Review on pages 20 to 23. The Group does not trade in financial instruments.
| a) Maturity profile of financial liabilities | ||||||||||||
2002 | 2001 | |||||||||||
Bank borrowings and debentures | Other | Total | Bank borrowings and debentures | Other | Total | |||||||
£m | £m | £m | £m | £m | £m | |||||||
| Within one year or less or on demand | 35.9 | (2.5 | ) | 33.4 | 1.6 | 0.8 | 2.4 | |||||
| More than one year but not more than two years | 30.2 | (1.5 | ) | 28.7 | 384.6 | 1.1 | 385.7 | |||||
| More than two years but not more than five years | 36.1 | 1.1 | 37.2 | 0.5 | 2.3 | 2.8 | ||||||
| More than five years | 45.1 | 103.1 | 148.2 | – | 10.4 | 10.4 | ||||||
| Gross financial liabilities | 147.3 | 100.2 | 247.5 | 386.7 | 14.6 | 401.3 | ||||||
In the maturity analysis of the Group’s financial liabilities, “Other” includes liabilities shown as other creditors and obligations under finance leases offset by deferred financing assets of £11.3m analysed by maturity.
Debt more than five years of £148.2m (2001: £10.4m) principally comprises senior subordinated notes of £100.0m maturing in 2012 and term loans of £45.1m maturing in 2008.
| 51 Enodis annual report and accounts 2002 Notes to the accounts |
19 Financial instruments continued
The Group had the following undrawn borrowing facilities at the end of the period:
2002 £m | 2001 £m | |||
| Expiry date | ||||
| In more than two years but not more than five years | 42.7 | 106.9 | ||
b) Interest rate profile: financial liabilities
| Financial liabilities | Total £m | Floating rate £m | Fixed rate £m | Non-interest bearing £m | Fixed weighted average interest rate % | Weighted average period at fixed rate Years | ||||||
| Sterling | 29.2 | 0.4 | 40.1 | (11.3 | ) | 10.4 | 9.5 | |||||
| US$ | 192.0 | 62.9 | 129.1 | – | 7.6 | 3.9 | ||||||
| Euro | 26.3 | – | 26.3 | – | 10.2 | 9.4 | ||||||
| Other | – | – | – | – | – | – | ||||||
| At 28 September 2002 | 247.5 | 63.3 | 195.5 | (11.3 | ) | 8.5 | 5.8 | |||||
| Sterling | 11.2 | 11.2 | – | – | – | – | ||||||
| US$ | 349.6 | 280.7 | 68.9 | – | 6.3 | 1.2 | ||||||
| Euro | 39.4 | 39.4 | – | – | – | – | ||||||
| Other | 1.1 | 0.7 | 0.4 | – | 8.5 | 2.2 | ||||||
| At 29 September 2001 | 401.3 | 332.0 | 69.3 | – | 6.3 | 1.2 | ||||||
The floating rate financial liabilities comprised bank loans and overdrafts bearing interest at rates based on local money market rates. The fixed rate financial liabilities comprise the senior subordinated notes and interest rate swaps.
c) Interest rate profile: financial assets
| Financial assets | Total £m | Floating rate £m | Non-interest bearing £m | |||
| Sterling | 46.4 | 43.5 | 2.9 | |||
| US$ | 13.3 | 11.2 | 2.1 | |||
| Euro | 9.8 | 5.3 | 4.5 | |||
| Other | 4.9 | 4.7 | 0.2 | |||
| At 28 September 2002 | 74.4 | 64.7 | 9.7 | |||
| Sterling | 27.0 | 22.7 | 4.3 | |||
| US$ | 12.1 | 11.5 | 0.6 | |||
| Euro | 14.9 | 10.3 | 4.6 | |||
| Other | 7.4 | 7.3 | 0.1 | |||
| At 29 September 2001 | 61.4 | 51.8 | 9.6 | |||
The non-interest bearing financial assets mainly comprise equity return investments and uncleared receipts
| 52 Enodis annual report and accounts 2002 Notes to the accounts |
| 19 Financial instruments continued | ||||
| d) Fair values of financial assets and liabilities Set out below is a comparison by category of book values and fair values of all the Group’s financial assets and financial liabilities at the period end. | ||||
| Primary financial instruments held or issued to finance the Group’s operations | Book value £m | Fair value £m | ||
| Short-term borrowings and current portion of long-term borrowings | (33.4 | ) | (33.4 | ) |
| Long-term borrowings | (111.4 | ) | (111.4 | ) |
| Cash deposits | 72.7 | 72.7 | ||
| Investments (see note 13) | 1.7 | 1.7 | ||
| Other financial liabilities | (102.7 | ) | (102.7 | ) |
| Derivative financial instruments held or issued to manage the interest rate and currency profile | Book value £m | Fair value £m | ||
| Interest rate swaps and similar instruments | – | (5.0 | ) | |
| Interest rate caps and collars | – | – | ||
| Forward foreign currency contracts | 2.3 | 2.3 | ||
The fair value of the interest rate swaps and foreign exchange contracts have been estimated by reference to prices available from the markets on which the instruments are traded. All other fair values shown above have been calculated by discounting cash flows at prevailing interest rates.
The fair value of short-term deposits and borrowings approximates the carrying amount because of the short-term maturity of these instruments. The fair value of the long-term borrowings approximates the carrying value due to the debt being subject to floating rates or short-term fixed rates.
| e) Hedging As explained in the Financial Review on pages 20 to 23, the Group’s policy is to hedge the following exposures: | |
| – | Interest rate risk – using interest rate swaps, caps and collars and forward rate agreements. |
| – | Balance sheet translation risk – using cross currency swaps and borrowings in functional currencies. |
| Gains and losses on instruments used for hedging are not recognised until the exposure that is being hedged is likely to be recognised. | ||||||||
| Unrecognised gains and losses on instruments used for hedging are as follows: | ||||||||
| Gains | Losses | |||||||
| 2002 £m | 2001 £m | 2002 £m | 2001 £m | |||||
| Unrecognised gains and losses on hedges to the period end | 2.3 | 4.3 | (5.0) | (4.9 | ) | |||
f) Currency profile The main functional currencies of the Group are Sterling and US$. The following analysis of net monetary assets and liabilities shows the Group’s currency exposures after the effects of forward contracts used to manage currency exposure. The amounts shown represent the transactional exposures that give rise to the net currency gains and losses recognised in the profit and loss account. Such exposures comprise the monetary assets and liabilities of the Group that are not denominated in the operating (or “functional”) currency of the operating units involved.
| 2002 | 2001 | |||||||||||||||||||
| Functional currency of Group operations | Sterling £m | US$ £m | Other European currencies £m | Other £m | Total £m | Sterling £m | US$ £m | Other European currencies £m | Other £m | Total £m | ||||||||||
| Sterling | – | – | – | 0.1 | 0.1 | – | 0.1 | 1.2 | – | 1.3 | ||||||||||
| US$ | – | – | – | 0.5 | 0.5 | – | – | – | – | – | ||||||||||
| Other European | – | – | – | – | – | – | 0.2 | 0.7 | – | 0.9 | ||||||||||
| Other currencies | – | 1.4 | – | – | 1.4 | – | 1.6 | – | – | 1.6 | ||||||||||
| Other | – | 1.4 | – | 0.6 | 2.0 | – | 1.9 | 1.9 | – | 3.8 | ||||||||||
| 53 Enodis annual report and accounts 2002 Notes to the accounts |
| 20 Provisions for liabilities and charges | ||||||||||||
Property £m | Restructuring £m | Pensions and other deferred employee benefits £m | Warranty £m | Total Group £m | Company £m | |||||||
| a) Analysis of movement in provisions: | ||||||||||||
| At the beginning of the period | 4.6 | 7.9 | 24.1 | 22.5 | 59.1 | 3.5 | ||||||
| Charged to profit and loss account | – | – | 0.3 | – | 0.3 | – | ||||||
| Credited to profit and loss account exceptional items | – | (0.5 | ) | – | – | (0.5 | ) | – | ||||
| Utilised | (1.1 | ) | (5.1 | ) | (0.3 | ) | (0.3 | ) | (6.8 | ) | (0.4 | ) |
| Transfer (to)/from other balance sheet categories | – | – | (2.8 | ) | – | (2.8 | ) | – | ||||
| Disposals | – | (1.0 | ) | (0.3 | ) | (1.4 | ) | (2.7 | ) | (3.1 | ) | |
| Currency realignment | – | – | (0.9 | ) | (1.4 | ) | (2.3 | ) | – | |||
| At the end of the period | 3.5 | 1.3 | 20.1 | 19.4 | 44.3 | – | ||||||
Property provisions relate primarily to lease payments under onerous contracts.
Restructuring costs relate mainly to costs associated with the charges described in note 4 “Exceptional items”, and are expected to be utilised approximately within one year.
Pension scheme details are set out in note 24.
Deferred employee benefits relate primarily to deferred compensation plans, supplemental retirement plans and post retirement benefit plans. It is not possible to estimate, with certainty, the timing of payments.
Warranty provisions have been recognised for estimated claims under product guarantees. It is not possible to estimate, with certainty, the timing of payments.
| 21 Called up share capital | ||||||||
2002 Number | 2001 Number | 2002 £m | 2001 £m | |||||
| a) Number and value of shares: | ||||||||
| Ordinary shares of 50p each | ||||||||
| Authorised | 600,000,000 | 344,200,000 | 300.0 | 172.1 | ||||
| Allotted, called up and fully paid | 400,465,587 | 250,288,950 | 200.2 | 125.1 | ||||
1,269,341 ordinary shares of the Company (2001: 1,269,341) are held in an independently managed Executive Share Option Plan (“ESOP trust”).
The ESOP trust was established in 1994 when Mourant & Co. were appointed as trustees to purchase shares in the Company to meet some of the future obligations under employee option schemes. Shares are distributed to employees upon exercise of options held by them and payment by them of the exercise price. The Company finances the ESOP trust by way of an interest free loan (note 13) of £2.4m.
The ESOP trust has waived the right to receive dividends on all shares held. Costs are borne by the sponsoring company and written off in the period in which they are incurred.
Ordinary shares Number | ||
| b) Movement of ordinary shares during the period: | ||
| At the beginning of the period | 250,288,950 | |
| Exercise of share options under the Sharesave Scheme (1992) | 2,042 | |
| Three for five rights issue | 150,174,595 | |
| At the end of the period | 400,465,587 | |
The proceeds of the exercises of share options in the period amounted to £2,287.
| c) Option schemes During the period the Company has operated the following employee option schemes using new shares: | ||||||||||
| ***At | ||||||||||
| 29 September | Number of options | At | ||||||||
| (restated) | 28 September | |||||||||
| 2001 | Granted | Exercised | Lapsed | 2002 | ||||||
| Sharesave Share Scheme (1992)* | 1,527,102 | Nil | 2,042 | 1,402,179 | 122,881 | |||||
| Executive Share Scheme (1984)* | 144,333 | Nil | Nil | – | 144,333 | |||||
| Executive Share Scheme (1995)* | 3,679,645 | Nil | Nil | 1,142,593 | 2,537,052 | |||||
| Executive Share Scheme (2001) | 4,634,884 | 6,604,174 | Nil | 1,845,822 | 9,393,236 | |||||
| 54 Enodis annual report and accounts 2002 Notes to the accounts |
| 21 Called up share capital continued | ||||||||||
| The Company has outstanding at 28 September 2002 the following options to subscribe for ordinary shares: | ||||||||||
| Year | Price pence | **Date from which exercisable | **Last expiry date | ***Number | ||||||
| Sharesave Scheme (1992)* | 1996 | 128.58 | 01.09.03 | 01.03.04 | 16,681 | |||||
| 1997 | 90.69 | 01.09.02 | 01.03.03 | 7,607 | ||||||
| 1998 | 164.13 | 01.09.03 | 01.03.04 | 2,101 | ||||||
| 1998 | 164.13 | 01.09.05 | 01.03.06 | 17,106 | ||||||
| 1999 | 156.03 | 01.09.02 | 01.03.03 | 13,253 | ||||||
| 1999 | 156.03 | 01.09.04 | 01.03.05 | 25,950 | ||||||
| 1999 | 156.03 | 01.09.06 | 01.03.07 | 2,590 | ||||||
| 2000 | 209.64 | 01.09.03 | 01.03.04 | 8,478 | ||||||
| 2000 | 209.64 | 01.09.05 | 01.03.06 | 23,332 | ||||||
| 2000 | 209.64 | 01.09.07 | 01.03.08 | 5,783 | ||||||
| 122,881 | ||||||||||
| Price pence | **Date from which exercisable | **Last expiry date | ***Number | |||||
| Executive Share Scheme (1984)* | 77.0 | 03.02.96 | 03.02.03 | 76,556 | ||||
| 180.56 | 14.02.97 | 14.02.04 | 67,777 | |||||
| 144,333 | ||||||||
| Executive Share Scheme (1995)* | 186.64 | 31.03.98 | 31.03.05 | 22,328 | ||||
| 150.61 | 22.07.99 | 22.07.06 | 54,339 | |||||
| 116.60 | 01.07.00 | 01.07.07 | 314,914 | |||||
| 151.82 | 28.11.00 | 28.11.07 | 314,684 | |||||
| 145.75 | 17.11.01 | 17.11.08 | 170,348 | |||||
| 212.88 | 28.07.02 | 28.07.09 | 796,527 | |||||
| 254.25 | 24.11.02 | 24.11.09 | 111,393 | |||||
| 260.73 | 03.07.03 | 03.07.10 | 657,675 | |||||
| 260.89 | 03.07.03 | 03.07.10 | 45,445 | |||||
| 170.04 | 21.12.03 | 21.12.10 | 24,700 | |||||
| 175.13 | 21.12.03 | 21.12.10 | 24,699 | |||||
| 2,537,052 | ||||||||
| Executive Share Scheme (2001) | 146.56 | 21.01.04 | 21.01.11 | 2,405,015 | ||||
| 170.41 | 21.01.04 | 21.01.11 | 135,737 | |||||
| 146.56 | 12.06.04 | 12.06.11 | 50,507 | |||||
| 81.78 | 10.09.04 | 10.09.11 | 444,063 | |||||
| 147.00 | 21.03.05 | 21.03.12 | 1,004,018 | |||||
| 85.50 | 21.03.05 | 21.03.12 | 5,092,630 | |||||
| 50.00 | 09.08.05 | 09.08.12 | 261,266 | |||||
| 9,393,236 | ||||||||
| * | No further options can be granted under these schemes. |
| ** | Subject to performance conditions being achieved. |
| *** | The number of options as at 29 September 2001 have been restated to reflect the adjustment applied during the year pursuant to the rules of the schemes following the rights issue announced by the Company on 20 February 2002. |
| The maximum aggregate number of shares over which options may currently be granted under all schemes cannot exceed 10% of the nominal share capital of the Company on the date of grant. |
| 55 Enodis annual report and accounts 2002 Notes to the accounts |
| 22 Reserves | ||||||
| Movements on reserves during the period were as follows: | ||||||
Share premium account £m | Revaluation reserve £m | Profit and loss account (restated) £m | ||||
| Group: | ||||||
| At the beginning of the period | 239.0 | – | (250.0 | ) | ||
| Retained loss for the period | – | – | (87.0 | ) | ||
| Goodwill written back on disposal of subsidiaries | – | – | 65.1 | |||
| Costs relating to the issue of shares | (4.8 | ) | – | – | ||
| Currency realignment (note b) | – | – | (5.7 | ) | ||
| At the end of the period | 234.2 | – | (277.6 | ) | ||
| Company: | ||||||
| At the beginning of the period | 239.0 | 120.0 | (42.0 | ) | ||
| Retained loss for the period | – | – | (12.1 | ) | ||
| Costs relating to the issue of shares | (4.8 | ) | – | – | ||
| Disposals | – | (120.0 | ) | – | ||
| At the end of the period | 234.2 | – | (54.1 | ) | ||
a) As permitted by Section 230 of the Companies Act 1985, a separate profit and loss account for the parent company is not presented. The loss for the period in the accounts of the parent company before dividends is £12.1m (2001: £11.6m loss).
b) The currency realignment arises on the translation of interests in the opening net assets of overseas subsidiary entities and associated undertakings, long-term foreign borrowings used to finance overseas investments, and on the translation of the profit and loss account for the period to closing rate.
c) Goodwill written off directly against profit and loss reserve amounts to £270.8m (2001: £335.9m).
| 23 Equity shareholders’ funds | ||
| a) Following the implementation of FRS19 “Deferred tax” (note 8), equity shareholders’ funds at 29 September 2001 have been restated as follows: | ||
29 September 2001 (restated) £m | ||
| Equity shareholders’ funds as previously reported | 87.2 | |
| Cumulative effect on profit and loss account reserve of implementing FRS19 “Deferred tax” | 26.9 | |
| Equity shareholders’ funds as restated | 114.1 | |
| b) Reconciliation of movements in equity shareholders’ funds | ||||
2002 £m | 2001 (restated) £m | |||
| Loss for the period | (87.0 | ) | (120.7 | ) |
| Negative goodwill written back on disposals, previously written off | 65.1 | (4.4 | ) | |
| Currency translation differences on foreign currency net investments | (5.7 | ) | (1.7 | ) |
| Total recognised gains and losses | (27.6 | ) | (126.8 | ) |
| Dividends | – | (4.8 | ) | |
| Shares issued | 70.3 | 0.2 | ||
| Net increase/(decrease) in equity shareholders’ funds in the period | 42.7 | (131.4 | ) | |
| Opening equity shareholders’ funds | 114.1 | 245.5 | ||
| Closing equity shareholders’ funds | 156.8 | 114.1 | ||
| 56 Enodis annual report and accounts 2002 Notes to the accounts |
24 Group pension and other post retirement medical schemes
The Group operates a number of pension schemes of both the defined benefit and defined contribution type. The total pension cost for the period was £3.6m (2001: £4.5m). There is a provision for pension costs of £8.0m (2001: £9.7m) in the balance sheet as at 28 September 2002 arising from the accumulated difference between the contributions paid and the corresponding pension costs.
The total employer contributions payable to the Group’s defined contribution schemes over the period and included in the expense figure quoted above was £4.4m (2001: £3.1m). At 28 September 2002, there were no outstanding/prepaid contributions (2001: nil).
In addition, the total cost for the post retirement medical schemes in the US was £0.3m (2001: £0.3m). There is a provision for post retirement medical schemes in the balance sheet as at 28 September 2002 of £3.2m (2001: £3.2m).
The Group currently accounts for pensions and other post retirement benefits under SSAP24. Under the transitional arrangements for FRS17, the Group is required to provide additional disclosures relating to its pension and other post retirement medical schemes. These follow the SSAP24 disclosures below.
The pension costs and balance sheet entries included in the accounts and disclosed in the notes to the financial statements have been prepared by independent, qualified actuaries.
SSAP24
a) A number of the Group’s full time UK employees as at 28 September 2002 are members of defined benefit arrangements with assets held in separate trustee administered funds. The principal defined benefit scheme in the UK is the Berisford (1948) Pension Scheme (“the Berisford Scheme”). A valuation was carried out by a qualified independent actuary at 31 March 2001 using the attained age method. Following the valuation it was agreed that the employer would pay contributions at the rate of 0% of pensionable salaries. The main financial assumptions used in the valuation are set out below:
| Investment returns | 5.5% p.a. |
| Increase in: | |
| Salaries | 4.5% p.a. |
| Present and future pensions | 5.0% p.a. |
The total market value of the Berisford Scheme’s assets at the last valuation date was £86.4m. The funding level after allowing for future increases in earnings, and using a market value of assets, was 117.9%.
b) Enodis Corporation maintains a 401(k) plan which covers most of its employees. This is a defined contribution arrangement.
c) Scotsman Industries maintains a number of pension and 401(k) plans which cover substantially all of its employees. Benefits under defined benefit plans for hourly paid employees are based on a fixed multiple of the length of service and for salaried employees are based on a percentage of earnings during the period of their employment. All pension plans have been funded in accordance with the Employee Retirement Income Security Act of 1974.
The last valuation of the main defined benefit plan was as at 1 January 2001. No employer contributions are currently being paid to this arrangement.
The following main assumptions were used to develop net pension costs for pension plans in the USA in the 52 weeks ended 28 September 2002:
| Discount rate | 8.5% p.a. |
| Future salary increases | not applicable |
| Future pension increases | nil |
The total market value of the total US plan assets as at 28 September 2002 was £22.5m. The funding level of the funded US plans as a percentage of accrued benefits, after allowing for future increases in earnings, and using a market value of assets, was 88%.
d) Scotsman Industries also operates two post retirement medical plans. Pension expense for the year has been calculated using the FRS17 assumptions as at 29 September 2001 disclosed below.
FRS17
In the UK, the figures for the Berisford Scheme have been based on a full actuarial valuation as at 31 March 2001, and the figures for the Whitlenge Drink Equipment Limited Retirement Benefit Scheme have been based on a full actuarial valuation as at 28 June 2002. For the pension and post retirement medical plans in the US, the figures have been based on full actuarial valuations as at 1 January 2002, updated to the current year end. All valuations have been updated to the year end.
| 57 Enodis annual report and accounts 2002 Notes to the accounts |
24 Group pension and other post retirement medical schemes continued
The assets in the Group’s defined benefit schemes and the expected rate of return were:
| UK | Long-term rate of return expected at 30 September 2002 % p.a. | Value at 30 September 2002 £m | Long-term rate of return expected at 29 September 2001 % p.a. | Value at 29 September 2001 £m | ||||
| Equities | 6.4 – 8.5 | 46.6 | 6.9 – 10.2 | 62.5 | ||||
| Bonds | 4.9 – 6.4 | 41.2 | 5.6 – 6.1 | 35.4 | ||||
| Property | 6.4 – 7.3 | 2.7 | 6.5 – 6.9 | 9.8 | ||||
| Other | 4.2 – 4.3 | 0.9 | 4.9 – 6.5 | 5.0 | ||||
| Total | 91.4 | 112.7 | ||||||
The liabilities of the Group’s schemes were calculated using the key assumptions set out below.
28 September 2002 % p.a. | 29 September 2001 % p.a. | |||
| Discount rate | 5.4 – 6.8 | 6.1 – 7.5 | ||
| Rate of increase in salaries | 3.8 | 4.5 | ||
| Rate of increase in pensions in payment | 5.0 | 5.0 | ||
| Rate of increase in pensions in deferment | 2.3 | 3.0 | ||
| Medical cost inflation | 10.0 – 5.0 | 6.5 – 5.0 | ||
| Price inflation | 2.3 | 2.8 – 3.0 | ||
The balance sheet position for the Group’s schemes as calculated under FRS17 at the year end are as follows:
28 September 2002 £m | 29 September 2001 £m | |||
| Fair value of assets | 91.4 | 112.7 | ||
| Present value of scheme liabilities | (111.9 | ) | (113.0 | ) |
| Surplus or deficit in the scheme | (20.5 | ) | (0.3 | ) |
| Unrecognisable surplus in the scheme | – | (0.7 | ) | |
| Net pension asset/(liability) | (20.5 | ) | (1.0 | ) |
At 28 September 2002, the total net pension asset/(liability) for pension plans with assets in excess of liabilities was £nil (2001: £6.6m), and £16.4m (2001: (£4.8m)) for pension plans with liabilities in excess of assets.
If the above pension and other post retirement liabilities were recognised in the financial statements at 28 September 2002, the Group’s profit and loss reserve would be as follows:
28 September 2002 £m | 29 September 2001 £m | |||
| Profit and loss reserve excluding pension and post retirement benefit liability | (280.1 | ) | (250.0 | ) |
| Pension and post retirement benefit provision | (20.5 | ) | (1.0 | ) |
| Profit and loss reserve including pension and post retirement benefit liability | (300.6 | ) | (251.0 | ) |
Analysis of the amount that would have been charged/(credited) to operating profit over 2001/02
| £m | ||
| Current service cost | 0.7 | |
| Past service cost | 0.5 | |
| Previously unrecognised surplus deducted from above | (0.5 | ) |
| Total operating charge | 0.7 | |
| 58 Enodis annual report and accounts 2002 Notes to the accounts |
24 Group pension and other post retirement medical schemes continued
| Analysis of other amounts that would have been charged/(credited) to profit and loss account over 2001/02 | ||
| £m | ||
| Loss arising from settlements or curtailments | 1.3 | |
| Previously unrecognised surplus deducted from above | (0.2 | ) |
| Total loss arising from settlements and curtailments | 1.1 | |
| Analysis of the amount that would have been credited to other finance income over 2001/02 | ||
| £m | ||
| Expected return in pension plan assets | 7.6 | |
| Interest on pension plan liabilities | (6.9 | ) |
| Net return | 0.7 | |
| Net cost (operating charge plus other amounts less finance income) over 2001/02 | ||
| £m | ||
| Net cost | 2.5 | |
| Analysis of amount that would have been recognised in statement of total recognised gains and losses (STRGL) over 2001/02 | ||
| £m | ||
| Loss – actual return less expected return on pension assets | (14.0 | ) |
| Experience losses arising on the liabilities | (0.1 | ) |
| Loss arising from changes in assumptions underlying the present value of the liabilities | (4.9 | ) |
| Actual loss recognised in STRGL | (19.0 | ) |
| Movement in surplus over 2001/02 | ||
| £m | ||
| Deficit at the beginning of the year | (0.3 | ) |
| Unrecognisable surplus at the beginning of the year | (0.7 | ) |
| Recognisable deficit at the beginning of the year | (1.0 | ) |
| Movement in the year: | ||
| Current service cost | (0.7 | ) |
| Contributions and benefit payments | 0.5 | |
| Past service costs (after deducting from unrecognisable surplus) | – | |
| Settlement loss (after deducting from unrecognisable surplus) | (1.1 | ) |
| Other finance income | 0.7 | |
| Actuarial loss | (19.0 | ) |
| Foreign currency movements | 0.1 | |
| Unrecoverable surplus/(deficit) at the end of the year | 0.0 | |
| Total deficit at end of year | (20.5 | ) |
| Experience gains and losses over 2001/02 | ||
| Difference between expected and actual return on assets in £m | (14.0 | ) |
| Percentage of assets | (15% | ) |
| Experience gains and losses on liabilities in £m | (0.1 | ) |
| Percentage of the present value of the liabilities | 0% | |
| Total amount recognised in statement of total recognised gains and losses in £m | (19.0 | ) |
| Percentage of the present value of the liabilities | 17% | |
| 59 Enodis annual report and accounts 2002 Notes to the accounts |
25 Contingencies
(i) Enodis Corporation has been named in a number of law suits in the United States in which the plaintiffs seek to hold Enodis Corporation liable, as the “alter ego” of its former subsidiary, Consolidated Industries Corp. (“Consolidated”), for the debts and other liabilities of Consolidated. Consolidated designed and manufactured home furnaces. Enodis Corporation sold Consolidated to an unrelated party in 1998. Shortly after the sale, Consolidated commenced bankruptcy proceedings. The plaintiffs in these actions include Daniel L. Freeland, in his capacity as trustee of the bankruptcy estate of Consolidated, Amana, LLC, Bard Manufacturing Company, KB Home, Shapell Industries, Inc., and Shea. In addition to the alter ego claim Freeland asserts a variety of bankruptcy and equitable claims seeking to recover up to $30m paid by Consolidated to Enodis Corporation between 1988 and 1998 and an additional $30m representing the principal amount of a promissory note issued by Consolidated to Enodis which was never paid but which was contributed in full back to the capital of Consolidated. The actions brought by Bard and Amana are scheduled for mediation in December 2002 and for trial in April 2003. The actions by the Trustee are scheduled for two trials, one to commence in January 2003 and the other in February 2003. The parties recently filed cross motions for summary judgment on the claims to be tried in January 2003.
Enodis Corporation has thoroughly investigated all these claims and believes that they are without merit, and is defending them vigorously. On February 21, 2002, Consolidated entered into a Court monitored settlement of one of the lawsuits, a California class action relating to 153,000 furnaces. The settlement remains subject to termination until January 2003, but if it is implemented, the previous potential exposure of Consolidated of up to $600m in respect of these furnaces would be substantially eliminated.
The issue of whether Consolidated and/or Enodis Corporation has insurance coverage for some or all of these contingent liabilities is the subject of reservation of rights by a number of insurance carriers and is the subject of litigation, though the carriers are co-operating in attempts to resolve the lawsuits.
Based upon its current assessments of these lawsuits and claims, the Enodis Group believes that the defence and the ultimate resolution of these lawsuits and claims would not exceed, by a material amount, the aggregate of the amounts currently accrued in respect of them. Therefore, the defence and resolution of these lawsuits should not have a material effect on its financial condition. However, the damages alleged in the lawsuits substantially exceed the estimate of, and accruals for, the potential exposure.
(ii) There are customary tax and other warranties and indemnities in respect of companies and businesses sold in previous years.
| 26 Lease obligations | ||||
| 2002 Group £m | 2001 Group £m | |||
| a) The future minimum payments to which the Group is committed under finance leases are as follows: | ||||
| Within one year | 0.2 | 0.1 | ||
| Between one and two years | 0.2 | 1.2 | ||
| Between two and five years | 0.4 | 0.2 | ||
| After more than five years | 1.3 | – | ||
| 2.1 | 1.5 | |||
| Finance charges allocated to future periods | (0.3 | ) | (0.2 | ) |
| 1.8 | 1.3 | |||
| Disclosed in the accounts as: | ||||
| Creditors falling due within one year (note 16) | 0.2 | 0.1 | ||
| Creditors falling due after more than one year (note 17) | 1.6 | 1.2 | ||
| 1.8 | 1.3 | |||
| The Company had no commitments under finance leases (2001: £nil). | ||||
| 2002 Group £m | 2001 Group £m | |||
| b) Operating lease payments which the Group is committed to make during the next financial year are analysed as follows: | ||||
| Leases expiring: | ||||
| Within one year | 1.5 | 2.5 | ||
| Between one and two years | 0.9 | 3.4 | ||
| Between two and five years | 1.5 | 2.3 | ||
| Thereafter | 4.2 | 3.9 | ||
| 8.1 | 12.1 | |||
The Company had annual commitments under operating leases expiring after more than five years of £nil (2001: £2.7m).
| 60 Enodis annual report and accounts 2002 Notes to the accounts |
| 27 Principal subsidiaries and significant investment | |||
| Country of incorporation and operation | Percentage held at 28 September 2002 | Details of holding of share capital | |
| Food equipment | |||
| Castel MAC S.p.A. | Italy | 100 | 8,300,000 0.52 Euro shares |
| Cleveland Range, LLC | USA | 100 | 3,000 no par value common stock |
| Cleveland Range, Limited | Canada | 100 | 32,449 Class A no par value shares |
| Convotherm Elektrogerate GmbH | Germany | 91 | 1,394,044 Euro shares |
| Convotherm Limited | England | 91 | 6,000 £1 ordinary shares |
| Convotherm Singapore Pte Ltd | Singapore | 91 | 100,000 $1 shares |
| Enodis Corporation | USA | 100 | 10 US$.01 par value common stock |
| Enodis Deutschland GmbH | Germany | 100 | 50,000 0.52 Euro shares |
| Enodis France SA | France | 100 | 7,500 16 Euro shares |
| Enodis Group Limited | England | 100 | 700,000,001 £1 ordinary shares |
| Enodis Holdings Limited* | England | 100 | 364,885,489 £1 ordinary shares |
| Enodis Iberia SA | Spain | 100 | 200 300 Euro shares |
| Enodis UK Limited | England | 100 | 5,000 £1 ordinary shares |
| Frimont S.p.A. | Italy | 100 | 16,000 516.46 Euro shares |
| Frymaster LLC | USA | 100 | n/a |
| Garland Commercial Industries, Inc. | USA | 100 | 10 no par value common stock |
| Garland Commercial Ranges, Limited | Canada | 100 | 2,000 no par value common stock |
| Guyon Productions SA | France | 100 | 50,000 16 Euro shares |
| Hartek Awagem Vertriebsges m.b.H. | Austria | 100 | 1 share of 120,000 Euros |
| Hartek Beverage Handling GmbH | Germany | 100 | 1 share of 600,000 Euros |
| Jackson MSC Inc. | USA | 100 | 100 shares no par value common stock |
| Kysor Industrial Corporation | USA | 100 | 100 US$1 common stock |
| Lincoln Foodservice Products, Inc. | USA | 100 | 1,000 no par value common stock |
| Merco/Savory, Inc. | USA | 100 | 3,000 no par value common stock |
| Merrychef Holdings Limited | England | 100 | 295,000 Class A ordinary shares 205,000 £1 ordinary shares |
| Mile High Equipment Company | USA | 100 | 200 no par value common stock |
| New Ton Food Equipment Limited | Thailand | 99.9 | 1,959,995 Thai Baht ordinary shares |
| Scotsman Beverage Systems Ltd | England | 100 | 8,397,517 £1 preference shares |
| Scotsman Group, Inc. | USA | 100 | 1,000 US$1 common stock |
| Scotsman Ice Systems (Shanghai) Company Ltd | China | 100 | 1 share of 2,150,000 US$ shares |
| Technyform Productions SA | France | 100 | 2,500 15.24 Euro shares |
| The Delfield Company | USA | 100 | 100 US$0.01 par value common stock |
| Vent Master (Europe) Limited | England | 100 | 49,000 £1 ordinary shares |
| Viscount Catering Limited | England | 100 | 1,500,000 £1 ordinary shares |
| Welbilt Manufacturing (Thailand) Limited | Thailand | 50 | 9,333,333 10 Thai Baht Class A ordinary shares |
| Welbilt Walk-Ins, LP | USA | 100 | n/a |
| Whitlenge Drink Equipment | England | 100 | 406,500,000 1p ordinary shares |
| 100 | 500,000 £1 deferred shares | ||
| Property | |||
| Enodis Property Developments Limited | England | 100 | 38,343,713 £1 ordinary shares |
| Enodis Investments Limited | England | 100 | 65,775,400 50p ordinary shares |
| 100 | 145,805,094 50p preferred ordinary shares | ||
| Investment | |||
| C. Czarnikow Limited | England | 15 | 150,000 £1 ordinary shares |
The subsidiary marked with an asterisk is held directly by the Company. All other trading subsidiaries and the investment are held through subsidiaries. Consolidated subsidiaries not listed above are either dormant or used only as vehicles to hold the shares of certain non-operating companies. Certain subsidiaries of the Group have been excluded from the consolidation since, in aggregate, their inclusion is not material for the purpose of giving a true and fair view.
| US GAAP reconciliation | 61 Enodis annual report and accounts 2002 |
Reconciliation to Accounting Principles Generally Accepted in the United States
The consolidated financial statements have been prepared in accordance with accounting principles generally accepted in the United Kingdom (“UK GAAP”), which differ in certain significant respects from those generally accepted in the United States (“US GAAP”). The significant adjustments to loss for the period and equity shareholders’ funds required when reconciling such amounts recorded in the consolidated financial statements to the corresponding amounts in accordance with US GAAP, considering the significant differences between UK GAAP and US GAAP, relate to the following items and the necessary adjustments are shown in the tables that follow. This footnote does not include all disclosures required by US GAAP.
Goodwill amortisation and impairment Under UK GAAP, the policy followed prior to the introduction of FRS10 (which is effective for accounting periods ended on or after 23 December 1998 and was adopted on a prospective basis) was to write off goodwill against equity shareholders’ funds in the year of acquisition. On the subsequent disposal or termination of a previously acquired business, the profit or loss is calculated after charging the amount of related goodwill previously charged to reserves. FRS10 requires goodwill to be capitalised and amortised over its estimated useful economic life. Under US GAAP, goodwill arising on all acquisitions must be capitalised and amortised over the estimated period of benefit, but not in excess of 40 years. As a result, a difference between UK GAAP and US GAAP arises on goodwill balances on acquisitions pre-implementation of FRS10. The Group has adopted a 20 year estimated useful life with respect to goodwill established under both US GAAP and UK GAAP.
Under US GAAP and UK GAAP, goodwill (and other long-lived assets) are evaluated for impairment whenever events or changes in circumstances indicate that the carrying amount of such assets may not be recoverable. Under US GAAP, recoverability of such assets is measured by a comparison of the carrying amount of the asset (as adjusted for the UK GAAP to US GAAP adjustments) to future undiscounted net cash flows expected to be generated from the assets use at the lowest level at which identifiable cash flows are generated. When the cash flow analysis indicates an asset is impaired, the impairment loss to be recognised is measured by the amount by which the carrying amount of the asset exceeds the fair value of the asset. Fair value is determined by quoted market prices, discounted cash flows or other valuation techniques. In September 2001 and June 2002, the Group recognised goodwill impairments under UK GAAP of £100m and £48.9m, respectively, in respect of Scotsman. Under US GAAP, the aforementioned undiscounted net cash flow analysis was performed and it was determined that an impairment should also be recognised. Differences in the impairment loss recognised in September 2001 of £9.8m arise as a result of the differences in the carrying value of the underlying goodwill and net assets under UK GAAP and US GAAP.
Deferred taxation Under UK GAAP, FRS19 requires deferred tax to be provided in full on all liabilities. Deferred tax assets are recognised to the extent it is regarded as more likely than not that there will be suitable taxable profits from which the future reversal of the underlying timing differences can be deducted. In certain circumstances where it is expected to take some time for tax losses to be relieved, it may not be appropriate to recognise the deferred tax assets at all. FRS19 does not define or provide guidance relating to the phrases “some time” or “more likely than not.” Under US GAAP, deferred tax assets and liabilities are recognised for the estimated future tax consequences of events attributable to differences between the financial statement carrying amounts of existing assets and liabilities and their respective tax bases and operating and capital loss and tax credit carryforwards. Deferred tax assets and liabilities are reduced through the establishment of a valuation allowance at such time as, based on available evidence, it is more likely than not (a likelihood of more than 50%) that the deferred tax assets will not be realised. The resulting adjustment from UK GAAP to US GAAP relates to the recognition of certain deferred tax assets for US GAAP which do not comply with the UK GAAP criteria as well as the tax effect on the other reconciling items.
Pension costs In the Group’s consolidated financial statements, pension costs are accounted for in accordance with SSAP 24, with costs being charged to income over employees’ estimated working lives. Under US GAAP, pension costs are determined in accordance with the requirements of SFAS No. 87 “Employers’ Accounting for Pensions” and SFAS No. 88 “Employers’ Accounting for Settlements and Curtailments of Defined Benefit Pension Plans and forTermination Benefits”. Differences between the UK and US GAAP figures arise from the requirement to use different methods and assumptions for valuing scheme assets and a different method of amortising surpluses or deficits.
Sale/Leaseback transactions Under UK GAAP, a gain or loss on the sale of an asset that is leased back is deferred if the leaseback is a finance lease and is recognised immediately when the leaseback is an operating lease. Under US GAAP, a gain or loss on the sale of property which is leased back and does not meet certain criteria, is deferred and amortised over future periods. The resulting adjustment from UK GAAP to US GAAP relates to the deferral of gains recorded for UK GAAP which do not comply with US GAAP criteria, and the amortisation of such deferred gains over the life of the lease.
Gain on sale of businesses Differences in the carrying value of the net assets of business under US GAAP give rise to a different calculation of the gain on sale.
Share option plans and ESOP Trust Under UK GAAP, options issued under the Group’s 1995 Executive Share Option Scheme, which includes certain performance criteria, give rise to an accounting entry when the option is exercised. Shareholders’ funds are increased by the product of the number of options multiplied by the original option price. Under US GAAP, in situations in which it is probable that specified performance criteria will be met, estimates of compensation cost are recorded in the profit and loss account before the measurement date. The resulting adjustment between UK GAAP and US GAAP relates to the recognition of compensation cost related to the 1995 Executive share option plan, for US GAAP purposes, following a determination that the attainment of the related performance criteria is probable.
Under UK GAAP, ordinary shares of the Group held in an ESOP Trust for distribution on the exercise of share options by employees are accounted for as fixed asset investments. Under US GAAP, these shares are accounted for within equity shareholders’ funds.
Restructuring Under UK GAAP, the timing criteria for recording restructuring provisions are different to those under US GAAP. During 2001, certain accrued losses allowable for recognition under UK GAAP did not meet the definition of an accruable restructuring charge for US GAAP and a timing difference consequently arose. During 2002, these charges met the definition of an accruable charge for US GAAP and consequently the difference between UK GAAP and US GAAP no longer exist.
Derivative instruments Derivative financial instruments are utilised by the Group to reduce foreign currency and interest rate risks. The Group does not hold or issue financial instruments for trading purposes. The Group enters into forward exchange contracts to hedge certain firm purchase commitments and existing assets or liabilities. Under UK GAAP, gains and losses related to qualifying hedges of firm commitments are deferred, and are recognised in income or as adjustments of carrying amounts when the hedged transaction occurs. The Group also enters into agreements to manage certain exposures to fluctuations in interest rates. Interest rate contracts generally involve the exchange of fixed and floating rate interest payments without the exchange of the underlying principal. Under UK GAAP, net amounts paid or received are reflected as adjustments to interest rate expense.
| 62 Enodis annual report and accounts 2002 US GAAP reconciliation |
Reconciliation to Accounting Principles Generally Accepted in the United States continued
Under US GAAP in October 2000, the Group adopted SFAS 133, “Accounting for Derivative Instruments and Hedging Activities” (“SFAS 133”). This standard requires the fair values of derivative instruments to be recorded on the balance sheet, and any changes in such fair values which do not meet the criteria for hedge accounting under SFAS 133 to be recorded in the statement of profit and loss account. Therefore, differences between UK GAAP and US GAAP arise which are recorded in net loss for US GAAP. The Group adopted the provisions of these statements in October 2000 and recorded a gain of £0.2m as a cumulative effect of accounting change to reflect the fair value of those instruments which do not meet the hedging criteria under SFAS 133 as the standard does not permit retroactive restatement. This charge was immaterial to basic and diluted earnings per share for the year. Subsequent to the adoption of SFAS 133, the Group recorded a £4.0m and an £0.8m loss during 2002 and 2001, respectively, related to changes in the fair value of such derivative instruments.
Accrual of loss contingencies Under UK GAAP, a provision is recognised for contingencies when an entity has a present obligation (legal or constructive) as a result of a past event, it is probable that a transfer of economic benefits will be required to settle the obligation, and a reliable estimate can be made of the amount of the obligation. Under US GAAP, estimated losses from contingencies are accrued only if it is probable that the contingency will occur and the amount of loss can be reasonably estimated. Although the appropriate threshold of probability may vary depending on the situation, in practice a higher threshold is applied when recognising loss contingencies under US GAAP than under UK GAAP. The difference in practice has resulted in a reconciling difference between UK GAAP and US GAAP.
| The effects of the differences between UK GAAP and US GAAP on net loss and equity shareholders’ funds are as follows: | ||||
2002 £m | 2001 (restated) £m | |||
| Net loss | ||||
| Net loss in accordance with UK GAAP | (87.0 | ) | (120.7 | ) |
| Items (increasing)/decreasing operating loss in accordance with UK GAAP | ||||
| Goodwill amortisation | (13.5 | ) | (16.6 | ) |
| Goodwill impairment | – | 9.8 | ||
| Pension costs | (2.5 | ) | 5.9 | |
| Sale/leaseback transactions | 0.1 | (1.3 | ) | |
| Share option plans | 1.1 | – | ||
| Restructuring | (0.4 | ) | 0.4 | |
| Derivative instruments | (4.0 | ) | (0.6 | ) |
| Loss contingency | 2.4 | – | ||
| Other | (0.7 | ) | 0.5 | |
| Items increasing/(decreasing) other non-operating profit in accordance with UK GAAP | ||||
| Deferred taxation | (16.5 | ) | 8.1 | |
| Gain on sale of businesses | 18.0 | 0.8 | ||
| Net loss in accordance with US GAAP | (103.0 | ) | (113.7 | ) |
2002 £m | 2001 (restated) £m | |||
| Equity shareholders’ funds | ||||
| Equity shareholders’ funds as reported in accordance with UK GAAP | 156.8 | 114.1 | ||
| Items increasing/(decreasing) equity shareholders’ funds | ||||
| Goodwill | 242.3 | 318.3 | ||
| Amortisation of goodwill | (96.5 | ) | (99.5 | ) |
| Goodwill impairment | 9.8 | 9.8 | ||
| Deferred taxation | 70.5 | 72.3 | ||
| Gain on sale/leaseback | (1.3 | ) | (1.2 | ) |
| Pension costs | (9.9 | ) | 31.1 | |
| Share option plans | (1.1 | ) | (2.2 | ) |
| Derivative instruments | (4.8 | ) | (0.8 | ) |
| Loss contingency | 2.4 | – | ||
| Restructuring | – | 0.4 | ||
| Other | – | 0.7 | ||
| Equity shareholders’ funds in accordance with US GAAP | 368.2 | 443.0 | ||
| Five year summary | 63 Enodis annual report and accounts 2002 |
1998 (restated) £m | 1999 (restated) £m | 2000 (restated) £m | 2001 (restated) £m | 2002 £m | ||||||
| Group turnover | 591.2 | 756.3 | 1,180.1 | 1,081.1 | 783.2 | |||||
| Earnings and dividends: | ||||||||||
| Profit before interest, tax, depreciation, amortisation and exceptional items | 73.1 | 103.4 | 163.5 | 122.6 | 83.0 | |||||
| Profit/(loss) before interest and tax | 59.8 | 80.0 | 121.3 | (67.1 | ) | (56.5 | ) | |||
| Profit before tax, amortisation and exceptionals | 50.2 | 75.4 | 102.2 | 63.8 | 38.0 | |||||
| Profit/(loss) before taxation | 50.2 | 66.7 | 83.8 | (109.0 | ) | (85.8 | ) | |||
| Profit/(loss) after tax (note i) | 48.3 | 62.9 | 79.8 | (120.7 | ) | (86.8 | ) | |||
| Adjusted diluted earnings per share (note ii) | 19.5 | p | 24.6 | p | 31.6 | p | 16.3 | p | 10.4 | p |
| Dividends per share (net) | 9.5 | p | 12.5 | p | 13.75 | p | 2.0 | p | – | |
| Ratios: | ||||||||||
| Operating margin (excluding amortisation and exceptional items) | 10.1 | % | 11.2 | % | 11.8 | % | 9.2 | % | 8.6 | % |
| Interest cover (excluding amortisation and exceptional items) | 6.2 | x | 6.4 | x | 3.7 | x | 2.8 | x | 2.3 | x |
| Assets employed: | ||||||||||
| Intangible fixed assets | ||||||||||
| – goodwill | – | 371.0 | 412.7 | 310.2 | 235.4 | |||||
| Tangible fixed assets | 89.3 | 158.7 | 171.8 | 111.4 | 88.0 | |||||
| Investments | 4.9 | 7.6 | 7.2 | 6.2 | 5.9 | |||||
| Deferred tax | 19.4 | 21.5 | 31.7 | 26.9 | 25.3 | |||||
| Net current assets | 61.5 | 25.6 | 35.4 | 118.2 | 60.6 | |||||
| 175.1 | 584.4 | 658.8 | 572.9 | 415.2 | ||||||
| Financed by: | ||||||||||
| Share capital | 76.6 | 105.8 | 125.0 | 125.1 | 200.2 | |||||
| Reserves (note i) | (146.0 | ) | 0.6 | 120.5 | (11.0 | ) | (43.4 | ) | ||
| Shareholders’ funds | (69.4 | ) | 106.4 | 245.5 | 114.1 | 156.8 | ||||
| 5% convertible unsecured loan stock 2015 | 230.4 | 94.4 | – | – | – | |||||
| Other | 14.1 | 383.6 | 413.3 | 458.8 | 258.4 | |||||
| 175.1 | 584.4 | 658.8 | 572.9 | 415.2 | ||||||
| US Dollar rate | ||||||||||
| – Average | 1.66 | 1.62 | 1.55 | 1.44 | 1.47 | |||||
| – Year end | 1.70 | 1.66 | 1.48 | 1.47 | 1.55 | |||||
i Adjusted profit/loss after tax, diluted earnings per share and reserves have been restated for the implementation of FRS19.
ii Adjusted earnings per share have been restated for the effects of the rights issue.
| Other information | 64 Enodis annual report and accounts 2002 |
Reconciliation of like-for-like information
The effect of acquisitions and disposals is calculated by removing actual results of disposed food equipment businesses at actual rates and including proforma results for acquisitions in prior year results.
The effect of foreign exchange is calculated by retranslating current year ongoing food equipment results at rates used to translate prior year results
52 weeks to 28 September 2002 | Effect of disposals | Effect of foreign exchange | Proforma 2002 | 52 weeks to 29 September 2001 | Effect of acquisitions, disposals and reallocations | Proforma 2001 | Like-for-like | |||||||||
| £m | £m | £m | £m | £m | £m | £m | % | |||||||||
| a) Turnover | ||||||||||||||||
| Food Service Equipment | ||||||||||||||||
| – North America | 469.9 | (25.0 | ) | 10.2 | 455.1 | 498.7 | (47.0 | ) | 451.7 | 1% | ||||||
| Food Service Equipment | ||||||||||||||||
| – Europe and Asia | 144.4 | (8.0 | ) | (1.1 | ) | 135.3 | 185.4 | (39.3 | ) | 146.1 | (7% | ) | ||||
| Food Service Equipment | 614.3 | (33.0 | ) | 9.1 | 590.4 | 684.1 | (86.3 | ) | 597.8 | (1% | ) | |||||
| Food Retail Equipment | 152.8 | (27.0 | ) | 2.1 | 127.9 | 203.1 | (49.7 | ) | 153.4 | (17% | ) | |||||
| Food Equipment | 767.1 | (60.0 | ) | 11.2 | 718.3 | 887.2 | (136.0 | ) | 751.2 | (4% | ) | |||||
| b) Operating profit | ||||||||||||||||
| Food Service Equipment – | ||||||||||||||||
| North America | 60.8 | (1.6 | ) | 1.7 | 60.9 | 62.6 | (3.4 | ) | 59.2 | 3% | ||||||
| Food Service Equipment – | ||||||||||||||||
| Europe and Asia | 9.7 | (0.6 | ) | (0.1 | ) | 9.0 | 17.7 | (3.8 | ) | 13.9 | (35% | ) | ||||
| Food Service Equipment | 70.5 | (2.2 | ) | 1.6 | 69.9 | 80.3 | (7.2 | ) | 73.1 | (4% | ) | |||||
| Food Retail Equipment | (3.3 | ) | (2.2 | ) | (0.3 | ) | (5.8 | ) | 10.4 | (4.2 | ) | 6.2 | (194% | ) | ||
| Food Equipment | 67.2 | (4.4 | ) | 1.3 | 64.1 | 90.7 | (11.4 | ) | 79.3 | (19% | ) | |||||
Back to Contents
| Holders of Company securities | Designed and produced by RadleyYeldar (London) |
| Shareholders and analysis The issued ordinary share capital of Enodis plc at 28 September 2002 was £200,232,793.50 in 400,465,587 ordinary shares of 50p each, held by 7,162 members. | ||||||||
| Holders | Holders | Number | Percentage | |||||
| Number | % | of shares | of capital | |||||
| Bank/Nominee | 872 | 12.17 | 375,215,200 | 93.69 | ||||
| Insurance companies | 12 | 0.17 | 3,090,145 | 0.77 | ||||
| Investment trust | 12 | 0.17 | 100,120 | 0.03 | ||||
| Pension trust | 5 | 0.07 | 2,963,389 | 0.74 | ||||
| Other corporate bodies | 7 | 0.10 | 710,721 | 0.18 | ||||
| Other companies | 108 | 1.51 | 6,542,161 | 1.63 | ||||
| Individuals | 6,146 | 85.81 | 11,843,851 | 2.96 | ||||
| Totals | 7,162 | 100.00 | 400,465,587 | 100.00 | ||||
Year’s results – 2002
Announced 20 November 2002
Annual General Meeting
To be held on 15 January 2003
First quarter results – 2003
To be announced February 2003
Half year’s results – 2003
To be announced May 2003
Third quarter results – 2003
To be announced August 2003
Corporate information
D R Hooper Company Secretary
Registered Office
Washington House
40–41 Conduit Street
London W1S 2YQ
Registration details
Registered in England and Wales
No. 109849
Registrar
Computershare Investor Services
PLC, PO Box 82
The Pavilions, Bridgwater Road
Bristol BS99 7NH
0870 7020000, Website:
www.computershare.co.uk
ADR Depositary
The Bank of New York
101 Barclays Street, 20th Floor
New York, NY 10286, USA
1–888–BNY–ADRS (toll free)
Email via website at
www.adrbny.com
American Depositary Receipt facility
Enodis plc ordinary shares are traded on The New York Stock Exchange in the form of American Depositary Shares (ADSs) using the symbol ENO. Each ADS represents four Enodis plc ordinary shares. The ADS programme is administered by the Bank of New York and enquiries should be directed to them at the address shown. An annual report on Form 20–F is filed with the US Securities and Exchange Commission.
Internet
Information on Enodis plc is available on our website: www.enodis.com
| Enodis plc Washington House 40-41 Conduit Street London W1S 2YQ T +44(0)20 7304 6000 F +44(0)20 7304 6001 | |
Enodis plc
Washington House
40-41 Conduit Street
London
W1S 2YQ
T +44 (0)20 7304 6000
F +44 (0)20 7304 6001
www.enodis.com
e-mail to:
contact@enodis.com
THIS DOCUMENT IS IMPORTANT AND REQUIRES YOUR IMMEDIATE ATTENTION. If you are in any doubt about its contents or the action you should take, you are recommended to seek your own personal financial advice from your stockbroker, bank manager, solicitor, accountant or other independent financial adviser duly authorised under the Financial Services and Markets Act 2000 immediately. If you have sold or otherwise transferred all of your ordinary shares in Enodis plc you should pass this document and the other enclosures at once to the purchaser or transferee or to the person through whom the sale or transfer was effected for transmission to the purchaser or transferee.
![]()
18 December 2002
To shareholders
Dear Shareholder
Annual General Meeting
The 93rd Annual General Meeting of the Company is to be held at the Radisson SAS Portman Hotel, 22 Portman Square, London W1H 7BG on Wednesday, 15 January 2003 at 11.30 a.m. You will find the Notice of Meeting set out on pages 3 to 4 of this Circular. In addition to the regular items of ordinary business to be conducted at the Annual General Meeting, there are the following items of special business, which I would like to take this opportunity to explain to you:
| a. | Directors’ power to allot shares |
| b. | Disapplication of pre-emption rights |
| c. | Authority to purchase own shares |
These items are matters commonly dealt with at Annual General Meetings of public companies and an explanation of them is set out below.
1. Resolution 8 – Directors’ power to allot shares Under the Companies Act 1985 (the “Act”) the Board is not able to allot shares except with the general or specific authority of the shareholders. Resolution 8 is a renewal of an existing authority given on 16 January 2002. This resolution seeks general and unconditional authority for the Board to allot up to £66,744,264.50 in nominal value of relevant securities for the period of five years from the date of passing Resolution 8. This figure, which complies with institutional shareholder guidelines, represents one third of the Company’s issued ordinary share capital as at 20 November 2002. Such an authority enables the Board to take advantage without delay of any opportunity that occurs to issue shares either for cash (subject as mentioned in paragraph 2. below) or as consideration for an acquisition. Furthermore, additional securities may be allotted pursuant to the Company’s share option schemes without them counting towards the limit of the nominal value of £66,744,264.50. The Directors have no current intention to allot such relevant securities, but will keep the matter under review. The authority will be exercised only if the Directors believe that to do so would be in the best interests of shareholders generally.
2. Resolution 9 – Disapplication of pre-emption rights The Act provides that when equity securities are being issued for cash, such securities must first be offered pro-rata to existing ordinary shareholders, unless the Board is given the power to allot them without regard to this requirement. Resolution 9 therefore empowers the Board to allot for cash equity securities of a nominal amount not exceeding £10,011,639.50, representing 5% of the Company’s issued share capital as at 20 November 2002, without first offering such securities to existing ordinary shareholders. It also modifies the situation with regard to rights issues or other offers to ordinary shareholders with the result that the Company may sell for the benefit of shareholders resident in certain overseas countries the equity securities to which such shareholders would otherwise be entitled, and to deal with fractional entitlements. The authority extends until the earlier of the conclusion of the Annual General Meeting to be held in 2004 and the date 15 months from the date of passing Resolution 9.
Registered Office: Washington House, 40-41 Conduit Street, London W1S 2YQ. Registered in England and Wales No.109849 VAT Registered No. 243188561
Back to Contents
3. Resolution 10 – Authority to purchase own shares Subject to the approval of its shareholders, the Company is empowered by its Articles of Association to purchase its own ordinary shares. It has become customary for public companies to seek such shareholder approval at each Annual General Meeting. Approval was duly obtained by the Company on 16 January 2002 in respect of up to 10% of its then issued ordinary share capital and remains valid until 15 January 2003, although no purchases of shares have been made during the period. The Directors have no current plans for the Company to purchase its own ordinary shares; however they consider it prudent once more to seek the approval of shareholders for authority to purchase up to 40,046,558 ordinary shares, representing 10% of the issued ordinary share capital of the Company as at 20 November 2002, by way of market purchase.
In accordance with the Company’s Articles of Association, a Special Resolution (Resolution 10 set out in the Notice of Annual General Meeting) will be proposed to seek this authority.
The price at which ordinary shares may be purchased will be not less than their nominal value and not more than 5% above the average of the middle market quotations (as derived from the London Stock Exchange Daily Official List) for an ordinary share of the Company for the five business days immediately preceding the day of purchase. The authority will expire at the conclusion of the Annual General Meeting to be held in 2004 or 12 months after the date of the passing of Resolution 10, whichever is the earlier.
As at 20 November 2002, there were options outstanding over 12,197,502 ordinary shares in the Company which represent 3.05% of the Company’s issued share capital. If the authority to purchase the Company’s ordinary shares was exercised in full, these options would then represent 3.38%.
As stated above, the Board has no immediate intention of exercising the authority to purchase the Company’s ordinary shares but will keep the matter under review, taking into account other investment opportunities. The authority will be exercised only if the Directors believe that to do so would result in an increase in earnings per share and would be in the best interests of shareholders generally.
Whether or not you expect to come to the Meeting, please complete the accompanying Form of Proxy and return it to the Company’s Registrar at the address shown on the Form. Guidance as to how to fill in the Form is given on the Form itself. To be valid at the Annual General Meeting, the Form of Proxy must be received by the Company’s Registrar no later than 11.30 a.m. on Monday, 13 January 2003. Even if you return the Form of Proxy, you may still attend and vote in person at the Annual General Meeting as I encourage you to do.
Yours sincerely

Peter Brooks
Chairman
2 Enodis plc
Back to Contents
Enodis plc
Notice of the Annual General Meeting
| To holders of ordinary shares Notice is hereby given that the 93rd Annual General Meeting of the Company will be held at the Radisson SAS Portman Hotel, 22 Portman Square, London W1H 7BG on Wednesday, 15 January 2003 at 11.30 a.m. for the following purposes: |
| Ordinary business |
| 1. To receive and adopt the Financial Statements for the year ended 28 September 2002 together with the Directors’ Report and the Auditors’ Report thereon. |
| 2. To reappoint R C Eimers, Director, who, having been appointed since the last Annual General Meeting, retires and offers himself for reappointment in accordance with Article 95 of the Articles of Association of the Company. |
| 3. To reappoint W D Wrench, Director, who, having been appointed since the last Annual General Meeting, retires and offers himself for reappointment in accordance with Article 95 of the Articles of Association of the Company. |
| 4. To reappoint R E Briggs who, retiring as Director in accordance with Article 97 of the Articles of Association of the Company, offers himself for reappointment in accordance with Article 98 of the Articles of Association of the Company. |
| 5. To reappoint G E Morris who, retiring as Director in accordance with Article 97 of the Articles of Association of the Company, offers himself for reappointment in accordance with Article 98 of the Articles of Association of the Company. |
| 6. To reappoint Deloitte & Touche as Auditors of the Company to hold office until the conclusion of the next Annual General Meeting of the Company. |
| 7. To authorise the Directors to determine the remuneration of the Auditors. |
| Special Business |
| 8. To propose the following resolution as an Ordinary Resolution: |
| THAT, in substitution for the authority given to them at the Annual General Meeting on 16 January 2002 (but without prejudice to any previous allotments under such substituted authority), the Directors be and are hereby generally and unconditionally authorised in accordance with Section 80 of the Companies Act 1985 (the “Act”) to exercise all powers of the Company to allot relevant securities (within the meaning of that Section 80(2) of the Act) provided that: |
| a. the aggregate of the nominal amount of such securities shall not exceed £66,744,264.50, and |
| b. this authority shall expire on the date five years after the passing of this Resolution save that the Company may before such expiry make any offer or agreement which would or might require relevant securities to be allotted after such expiry and the Directors may allot relevant securities in pursuance of such offer or agreement as if the authority conferred hereby had not expired. |
| 9. To propose the following resolution as a Special Resolution: |
| Subject to the passing of Resolution 8, THAT the Directors be and are hereby generally empowered pursuant to Section 95 of the Act to allot equity securities (within the meaning of Section 94(2) of the Act) of the Company for cash pursuant to the general authority conferred by Resolution 8 as if Section 89(1) of the Act did not apply to such allotment, provided that the power conferred by this Resolution shall be limited: |
| a. to allotments of equity securities in connection with an offer of securities, open for acceptance for a fixed period, by the Directors to holders of ordinary shares on the register on a fixed record date in proportion (as nearly as may be) to their then holdings of such shares (but subject to such exclusions or other arrangements as the Directors may deem necessary or expedient to deal with legal or practical problems under the laws of, or the requirements of, any recognised regulatory body or any stock exchange in any territory or in connection with fractional entitlements); |
| b. to allotments (otherwise than pursuant to sub-paragraph a. above) of equity securities up to an aggregate nominal amount of £10,011,639.50, |
| and this power shall expire on the earlier of the conclusion of the next Annual General Meeting of the Company to be held in 2004 and the date 15 months after the passing of this Resolution, save that the Company may before such expiry make any offer or agreement which would or might require equity securities to be allotted after such expiry and the Directors may allot equity securities pursuant to any such offer or agreement as if the power conferred hereby had not expired. |
3 Enodis plc
Back to Contents
| 10. To propose the following resolution as a Special Resolution: |
| THAT the Company be and is hereby generally and unconditionally authorised to make one or more market purchases (within the meaning of Section 163(3) of the Act) of ordinary shares provided that: |
| a. the maximum aggregate number of ordinary shares authorised to be purchased is 40,046,558 (representing 10% of the issued ordinary share capital); |
| b. the minimum price which may be paid for an ordinary share is an amount equal to its nominal value; |
| c. the maximum price which may be paid for an ordinary share is an amount equal to 105% of the average of the middle market quotations for an ordinary share as derived from the London Stock Exchange Daily Official List for the five business days immediately preceding the day on which that ordinary share is purchased; |
| d. this authority expires at the conclusion of the next Annual General Meeting of the Company to be held in 2004 or within 12 months from the date of the passing of this Resolution, whichever is earlier; and |
| e. the Company may make a contract to purchase ordinary shares under this authority before the expiry of the authority which will or may be executed wholly or partly after the expiry of the authority, and may make purchases of ordinary shares in pursuance of any such contract. |
| By order of the Board |
| D R Hooper Secretary Enodis plc Washington House 40-41 Conduit Street London W1S 2YQ 18 December 2002 |
| Notes to Notice of the Annual General Meeting |
| Note 1 Only holders of ordinary shares are entitled to attend and vote at the Annual General Meeting. Shareholders so entitled may appoint one or more proxies to attend and, on a poll, vote instead of him/her. A proxy need not be a member. A Form of Proxy is enclosed. |
| Note 2 The Company, pursuant to Regulation 41 of the Uncertificated Securities Regulations 2001, specifies that only those shareholders registered in the register of members of the Company as at 11.30 a.m. on Monday, 13 January 2003 (being 48 hours before the time fixed for the meeting) shall be entitled to attend or vote at this Annual General Meeting in respect of the number of shares registered in their name at that time. Changes to entries on the register of members after 11.30 a.m. on Monday, 13 January 2003 shall be disregarded in determining the rights of any person to attend or vote at the Annual General Meeting. |
| Note 3 The instrument appointing a proxy, and (in the case of an instrument signed by an agent of a member or on behalf of a corporation) the authority under which such instrument is signed or an office copy or duly certified copy thereof, must be deposited at the office of the Company’s Registrar, Computershare Investor Services PLC, PO Box 1075, Bristol BS99 3FA by not later than 11.30 a.m. on Monday, 13 January 2003, being 48 hours before the time appointed for the above Meeting. |
| Note 4 The Register of Directors’ interests required to be kept pursuant to Section 325 of the Act and copies of contracts of service (unless expiring or determinable by the Company within one year without payment of compensation) of Directors with the Company or with any of its subsidiary companies, will be available for inspection at the registered office of the Company during usual working hours on any business day (Saturdays and public holidays excepted) from the date of this Notice up to and including the date of the Annual General Meeting (or any adjournment thereof) and at the Annual General Meeting itself (or any adjournment thereof) and for a period of 15 minutes before the commencement of the meeting. |
4 Enodis plc
Back to Contents
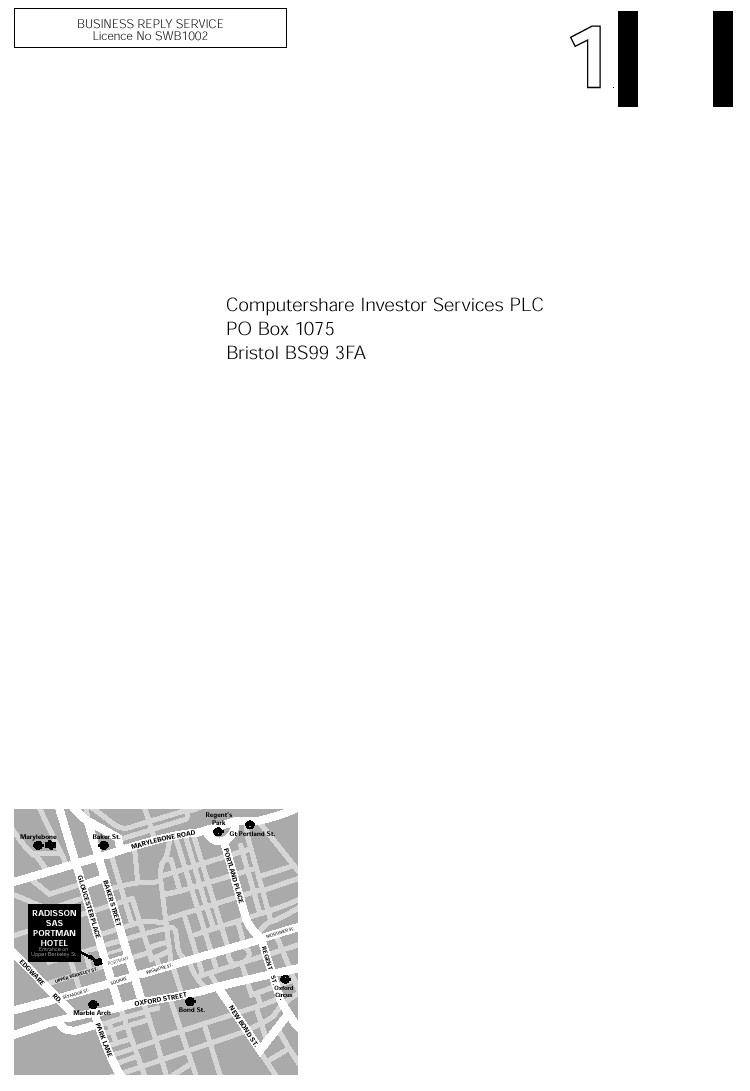
Back to Contents

SIGNATURES
Pursuant to the requirements of the Securities Exchange Act of 1934, the Registrant has duly caused this report to be signed on its behalf by the undersigned, thereunto duly authorized.
| ENODIS PLC | |||
| December 18, 2002 | By: | /s/ Andrew J. Allner | |
| Name: | Andrew J. Allner | ||
| Title: | Chief Executive Officer | ||