SECURITIES AND EXCHANGE COMMISSION
Washington, D.C. 20549
| o | | REGISTRATION STATEMENT PURSUANT TO SECTION 12(b) OR (g) OF THE SECURITIES EXCHANGE ACT OF 1934 |
| OR |
| x | | ANNUAL REPORT PURSUANT TO SECTION 13 OR 15(d) OF THE SECURITIES EXCHANGE ACT OF 1934 |
For fiscal year ended December 31, 2011 |
| OR |
| o | | TRANSITION REPORT PURSUANT TO SECTION 13 OR 15(d) OF THE SECURITIES EXCHANGE ACT OF 1934 |
| |
| OR |
| o | | SHELL COMPANY REPORT PURSUANT TO SECTION 13 OR 15(d) OF THE SECURITIES EXCHANGE ACT OF 1934 |
| Date of event requiring this shell company report: |
For the transition period from ____ to ______
| Commission file number: 000-30780 |
(Exact name of Registrant as specified in its charter)
Province of Alberta, Canada
(Jurisdiction of incorporation or organization)
2300 – 1066 West Hastings Street, Vancouver, British Columbia V6E 3X2 Canada
(Address of principal executive offices)
Stuart Rogers, President and CEO
Max Resource Corp.
2300 – 1066 West Hastings Street
Vancouver, British Columbia V6E 3X2 Canada
Tel: (604) 689-1749
Facsimile: (604) 648-8665
(Name, Telephone, E-mail and/or Facsimile number and Address of Company Contact Person)
Securities registered pursuant to Section 12(b) of the Act: None
(Title of Class)
Securities registered pursuant to Section 12(g) of the Act: Common Shares, no par value
Securities for which there is a reporting obligation pursuant to Section 15(d) of the Act: None
(Title of Class)
Indicate the number of outstanding shares of each of the Registrant’s classes of capital or common stock as of the close of the period covered by the annual report: 24,505,985 common shares as at December 31, 2011
Indicate by check mark if the registrant is a well-known seasoned issuer, as defined in Rule 405 of the Securities Act.
If this report is an annual or transition report, indicate by check mark if the Registrant is not required to file reports pursuant to Section 13 or 15(d) of the Securities Exchange Act of 1934. Yes o No x
Indicate by check mark whether the Registrant (1) has filed all reports required to be filed by Section 13 or 15(d) of the Securities Exchange Act of 1934 during the preceding 12 months (or for such shorter period that the registrant was required to file such reports), and (2) has been subject to such filing requirements for the past 90 days. Yes x No o
Indicate by check mark whether the registrant has submitted electronically and posted on its corporate Web site, if any, every Interactive Data File required to be submitted and posted pursuant to Rule 405 of Regulation S-T (§232.405 of this chapter) during the preceding 12 months (or for such shorter period that the registrant was required to submit and post such files).
Yes o No o
Indicate by check mark whether the Registrant is a large accelerated filer, an accelerated filer, or a non-accelerated filer. See definition of “accelerated filer and large accelerated filer” in Rule 12b-2 of the Exchange Act. (Check one)
Large accelerated filer o Accelerated filer o Non-accelerated filer x
Indicate by check mark which basis of accounting the registrant has used to prepare the financial statements included in this filing:
U.S. GAAP o International Reporting Standards as issued x Other o
by the International Accounting Standards Board
If “Other” has been checked in response to the previous question, indicate by check mark which financial statement item the registrant has elected to follow:
If this is an annual report, indicate by check mark whether the Registrant is a shell company (as defined in Rule 12b-2 of the Exchange Act).
Yes o No x
MAX Resource Corp.
Form 20-F Annual Report
Table of Contents
CONTENTS
| Table of Contents | 3 |
| SPECIAL NOTE REGARDING FORWARD LOOKING STATEMENTS | 5 |
| PART I | | 7 |
| ITEM 1. | Identity of Directors, Senior Management and Advisers | 7 |
| ITEM 2. | Offer Statistics and Expected Timetable | 7 |
| ITEM 3. | Key Information | 7 |
| 3.A | Selected Financial Data | 8 |
| 3.B | Capitalization and Indebtedness | 11 |
| 3.C | Reasons for the Offer and Use of Proceeds | 11 |
| 3.D | Risk Factors | 12 |
| Item 4. | Information on the Company | 16 |
| 4.A | History and Development of the Company | 16 |
| 4.B | Business Overview | 21 |
| 4.C | Organizational Structure | 22 |
| 4.D | Property, Plants and Equipment | 22 |
| Item 4.A | Unresolved Staff Comments | 49 |
| Item 5. | Operating and Financial Review and Prospects | 49 |
| 5.A | Operating Results | 51 |
| 5.B | Liquidity and Capital Resources | 52 |
| 5.C | Research and Development, Patents and Licenses, etc. | 53 |
| 5.D | Trend Information | 53 |
| 5.E | Off-balance Sheet Arrangements | 53 |
| 5.F | Tabular Disclosure of Contractual Obligations | 54 |
| Item 6. | Directors, Senior Management and Employees | 54 |
| 6.A | Directors and Senior Management | 54 |
| 6.B. | Compensation | 56 |
| 6.C | Board Practices | 57 |
| 6.D | Employees | 58 |
| 6.E | Share Ownership | 58 |
| Item 7. | Major Shareholders and Related Party Transactions | 59 |
| 7.A | Major Shareholders | 59 |
| 7.B | Related Party Transactions | 60 |
| 7.C | Interests of Experts and Counsel | 61 |
| Item 8. | Financial Information | 61 |
| 8.A | Consolidated Statements and other Financial Information | 61 |
| 8.B | Significant Changes | 62 |
| Item 9. | The Offer and Listing | 62 |
| 9.A | Offer and Listing Details | 62 |
| 9.B | Plan of Distribution | 63 |
| 9.C | Markets | 63 |
| 9.D | Selling Shareholders | 63 |
| 9.E | Dilution | 63 |
| 9.F | Expenses of the Issue | 63 |
| Item 10. | Additional Information | 63 |
| 10.A | Share Capital | 63 |
| 10.B | Memorandum and Articles of Association | 63 |
| 10.C | Material Contracts | 64 |
| 10.D | Exchange Controls | 64 |
| 10.E | Taxation | 65 |
| 10.F | Dividends and Paying Agents | 73 |
| 10.G | Statement by Experts | 73 |
| 10.H | Documents on Display | 73 |
| 10.I | Subsidiary Information | 73 |
| Item 11. | Quantitative and Qualitative Disclosures About Market Risk | 73 |
| Item 12. | Description of Securities Other than Equity Securities | 73 |
| PART II | 74 |
| Item 13. | Defaults, Dividend Arrearages and Delinquencies | 74 |
| Item 14. | Material Modifications to the Rights of Security Holders and Use of Proceeds | 74 |
| Item 15. | Controls and Procedures | 74 |
| Item 16. | Reserved | 75 |
| 16A. | Audit Committee Financial Expert | 75 |
| 16.B | Code of Ethics | 75 |
| 16.C | Principal Accountant Fees and Services | 75 |
| 16.D | Exemptions from the Listing Standards for Audit Committees | 76 |
| 16.E | Purchases of Equity Securities by the Issuer and Affiliated Purchasers | 76 |
| 16.F | Change in Registrant’s Certifying Accountant | 76 |
| 16.G | Corporate Governance | 76 |
| PART III | FINANCIAL STATEMENTS | 78 |
| Item 17. | Financial Statements | 78 |
| Item 18. | Financial Statements | 78 |
| Item 19. | Exhibits | 78 |
SPECIAL NOTE REGARDING FORWARD LOOKING STATEMENTS
This Annual Report on Form 20-F and the exhibits attached hereto contain “forward-looking statements” within the meaning of the Private Securities Litigation Reform Act of 1995. Such forward-looking statements concern the Company’s anticipated results and developments in the Company’s operations in future periods, planned exploration and development of its properties, plans related to its business and other matters that may occur in the future. These statements relate to analyses and other information that are based on forecasts of future results, estimates of amounts not yet determinable and assumptions of management. Statements concerning reserves and mineral resource estimates may also be deemed to constitute forward-looking statements to the extent that they involve estimates of the mineralization that will be encountered if the property is developed, and in the case of mineral reserves, such statements reflect the conclusion based on certain assumptions that the mineral deposit can be economically exploited. Any statements that express or involve discussions with respect to predictions, expectations, beliefs, plans, projections, objectives, assumptions or future events or performance (often, but not always, using words or phrases such as “expects” or “does not expect”, “is expected”, “anticipates” or “does not anticipate”, “plans”, “estimates” or “intends”, or stating that certain actions, events or results “may”, “could”, “would”, “might” or “will” (or the negative and grammatical variations of any of these terms and similar expressions) be taken, occur or be achieved,) are not statements of historical fact and may be forward-looking statements. Forward-looking statements are subject to a variety of known and unknown risks, uncertainties and other factors which could cause actual events or results to differ from those expressed or implied by the forward-looking statements, including, without limitation:
| | ● | risks related to our status as a passive foreign investment company for U.S. tax purposes; |
| | ● | risks related to our history of operating losses; |
| | ● | risks related to our lack of production history; |
| | ● | risks related to our limited financial resources; |
| | ● | risks related to our need for additional financing; |
| | ● | risks related to competition in the mining industry; |
| | ● | risks related to increased costs; |
| | ● | risks related to possible shortages in equipment; |
| | ● | risks related to mineral exploration activities; |
| | ● | risks related to our lack of insurance for certain activities; |
| | ● | risks related to all our properties being in the exploration stage; |
| | ● | risks related to uncertainty that our properties will ultimately be developed; |
| | ● | risks related to our management’s limited experience in mineral exploration; |
| | ● | risks related to fluctuations in precious and base metal prices; |
| | ● | risks related to the possible loss of key management personnel; |
| | ● | risks related to possible conflicts of interest; |
| | ● | risks related to our mineral properties being subject to prior unregistered agreements, transfers, or claims and other defects in title; |
| | ● | risks related to governmental and environmental regulations; |
| | ● | risks related to our ability to obtain necessary permits; |
| | ● | risks related our status as a foreign corporation; |
| | ● | risks related to current economic conditions; and |
| | ● | other risks related to our securities. |
This list is not exhaustive of the factors that may affect our forward-looking statements. Some of the important risks and uncertainties that could affect forward-looking statements are described further in the sections entitled “Risk Factors”, “Information on the Company” and “Operating and Financial Review and Prospects” and in the exhibits attached to this Annual Report on Form 20-F. Should one or more of these risks and uncertainties materialize, or should underlying assumptions prove incorrect, actual results may vary materially from those described in the forward-looking statements. The Company’s forward-looking statements are based on beliefs, expectations and opinions of management on the date the statements are made and the Company does not assume any obligation to update forward-looking statements if circumstances or management’s beliefs, expectations or opinions change, except as required by law. For the reasons set forth above, investors should not place undue reliance on forward-looking statements.
All references in this Report on Form 20-F to the terms “we”, “our”, “us”, “the Company” and “MAX” refer to MAX Resource Corp. and its subsidiary.
CAUTIONARY NOTE TO U.S. INVESTORS REGARDING RESOURCE AND RESERVE ESTIMATES
Certain disclosure in this Annual Report on Form 20-F has been prepared in accordance with the requirements of the securities laws in effect in Canada, which differ from the requirements of the United States securities laws. The terms “mineral reserve”, “proven mineral reserve” and “probable mineral reserve” are Canadian mining terms as defined in accordance with Canadian National Instrument 43-101 – Standards of Disclosure for Mineral Projects (“NI 43-101”) and the Canadian Institute of Mining, Metallurgy and Petroleum (the “CIM”) - CIM Definition Standards on Mineral Resources and Mineral Reserves, adopted by the CIM Council, as amended. These definitions differ from the definitions in United States Securities and Exchange Commission (“SEC”) Industry Guide 7 under the United States Securities Act of 1933, as amended (the “Securities Act”). Under SEC Industry Guide 7 standards, a “final” or “bankable” feasibility study is required to report reserves, the three-year historical average price is used in any reserve or cash flow analysis to designate reserves and the primary environmental analysis or report must be filed with the appropriate governmental authority.
In addition, the terms “mineral resource”, “measured mineral resource”, “indicated mineral resource” and “inferred mineral resource” are defined in and required to be disclosed by NI 43-101; however, these terms are not defined terms under SEC Industry Guide 7 and are normally not permitted to be used in reports and registration statements filed with the SEC. Investors are cautioned not to assume that any part or all of mineral deposits in these categories will ever be converted into reserves.
“Inferred mineral resources” have a great amount of uncertainty as to their existence, and great uncertainty as to their economic and legal feasibility. It cannot be assumed that all or any part of an inferred mineral resource will ever be upgraded to a higher category. Under Canadian rules, estimates of inferred mineral resources may not form the basis of feasibility or pre-feasibility studies, except in rare cases. Investors are cautioned not to assume that all or any part of an inferred mineral resource exists or is economically or legally mineable. Disclosure of “contained ounces” in a resource is permitted disclosure under Canadian regulations; however, the SEC normally only permits issuers to report mineralization that does not constitute “reserves” by SEC Industry Guide 7 standards as in place tonnage and grade without reference to unit measures.
Accordingly, information contained in this Annual Report on Form 20-F and the documents incorporated by reference herein contain descriptions of our mineral deposits that may not be comparable to similar information made public by U.S. companies subject to the reporting and disclosure requirements under the United States federal securities laws and the rules and regulations thereunder.
Conversion Table
In this Annual Report a combination of Imperial and metric measures are used. Conversions from Imperial measure to metric and from metric to Imperial are provided below:
| Imperial Measure = | Metric Unit | Metric Measure = | Imperial Unit |
| 2.47 acres | 1 hectare | 0.4047 hectares | 1 acre |
| 3.28 feet | 1 meter | 0.3048 meters | 1 foot |
| 0.62 miles | 1 kilometer | 1.609 kilometers | 1 mile |
| 0.032 ounces (troy) | 1 gram | 31.1 grams | 1 ounce (troy) |
| 1.102 tons (short) | 1 tonne | 0.907 tonnes | 1 ton |
| 0.029 ounces (troy)/ton | 1 gram/tonne | 34.28 grams/tonne | 1 ounce (troy/ton) |
CURRENCY AND EXCHANGE RATES
Canadian Dollars Per U.S. Dollar
Unless otherwise indicated, all references in this annual report are to Canadian dollars.
The following table sets out the exchange rates for one United States dollar (“US$”) expressed in terms of one Canadian dollar (“Cdn$”) in effect at the end of the following periods, and the average exchange rates (based on the average of the exchange rates on the last day of each month in such periods) and the range of high and low exchange rates for such periods.
| Canadian Dollars per U.S. dollar |
| | 2011 | 2010 | 2009 | 2008 | 2007 |
| Average for the period | 0.9927 | 1.0346 | 1.1486 | 1.0716 | 1.0782 |
| Low for the period | 1.0658 | 1.0848 | 1.3066 | 1.3008 | 1.1878 |
| Canadian Dollars per U.S. Dollar for the Month of |
| | April 2012 | March 2012 | February 2012 | January 2012 | December 2011 | November 2011 |
| High for the period | 0.9838 | 0.9870 | 0.9910 | 1.0022 | 1.0134 | 1.0167 |
| Low for the period | 1.0050 | 1.0035 | 1.0040 | 1.0296 | 1.0423 | 1.0522 |
The noon exchange rate on May 18, 2012 as reported by the Bank of Canada for the conversion of United States dollars into Canadian dollars was US$1.00 = Cdn $0.9794.
PART I
Item 1. Identity of Directors, Senior Management and Advisers
Not Applicable.
Item 2. Offer Statistics and Expected Timetable
Not Applicable.
Item 3. Key Information
We were incorporated as Proven Capital Corp. on April 25, 1994 under the Business Corporations Act of Alberta (the “BCA”). We changed our name to Cedar Capital Corp. on January 10, 1995 and subsequently to Vancan Capital Corp. on February 12, 2002. On May 14, 2004, we changed our name to Max Resource Corp. On June 27, 2007 we were registered as an extra-provincial company with the Registrar of Companies in British Columbia, pursuant to the Business Corporations Act of British Columbia (“BCABC”).
We are in the business of mineral property exploration and development. The recoverability of amounts recorded for mineral properties and related deferred costs is dependent upon the discovery of economically recoverable reserves, our ability to obtain necessary financing to complete the development, and future production or proceeds from the disposition thereof. We will depend almost exclusively on outside capital to complete the exploration and development of our mineral properties. Such outside capital will include the sale of additional stock. There can be no assurance that capital will be available as necessary to meet these continuing exploration and development costs or, if the capital is available, that it will be on terms acceptable to us. The issuances of additional stock by the Company may result in a significant dilution in the equity interests of our current stockholders. If we are unable to obtain financing in the amounts and on terms deemed acceptable, our business
and future success may be adversely affected. Our ability to continue operations as a going concern is dependent upon our ability to obtain necessary financing. To date, we have not generated any revenues from operations and will require additional funds to meet our obligations and the costs of our operations. As a result, significant losses are anticipated prior to the generation of any profits.
We are a reporting issuer in British Columbia and Alberta and trade in Canada on the TSX Venture Exchange under the symbol MXR. We are quoted in the United States on the OTC Bulletin Board under the symbol MXROF. We were listed on the Frankfurt Stock Exchange on March 2, 2006 under the symbol M1D.
3.A Selected Financial Data
The selected financial data of the Company and the information in the following table for the years ended December 31, 2011 and December 31, 2010, and as at January 1, 2010 was derived from the audited consolidated financial statements of the Company audited by DMCL CA, LLP, independent Registered Public Accountant, as indicated in their report which is included elsewhere in this annual report.
The information in the following tables should be read in conjunction with the information appearing under the heading “Item 5. Operating and Financial Review and Prospects” and the audited consolidated financial statements under the heading "Item 18. Financial Statements" and related notes thereto. Historical results from any prior period are not necessarily indicative of results to be expected for any future period.
The following table of selected financial data has been derived from audited financial statements prepared in accordance with International Financial Reporting Standards (“IFRS”).
International Financial Reporting Standards (Cdn$ in 000, except per share data)
| | | 2011 | | | 2010 | |
| Revenue | | Nil | | | Nil | |
| Net income (Loss) for the year | | $ | (1,197 | ) | | $ | (418 | ) |
| Earnings (Loss) per share | | $ | (0.05 | ) | | $ | (0.02 | ) |
| Dividends per Shares | | Nil | | | Nil | |
| | | | | | | | | |
| Working capital | | $ | 1,101 | | | $ | 2,258 | |
| Mineral Properties | | $ | 3,721 | | | $ | 2,592 | |
| Long Term Debt | | Nil | | | Nil | |
| Total assets | | $ | 5,019 | | | $ | 4,944 | |
| Shareholders’ equity | | $ | 4,892 | | | $ | 4,914 | |
Consolidated Statements of Cash Flows
| | | 2011 | | | 2010 | |
| Operating activities | | | | | | |
| Cash used per IFRS | | $ | 495 | | | $ | 498 | |
| Investing activities | | | | | | | | |
| Cash used per IFRS | | $ | 1,125 | | | $ | 533 | |
| Financing Activities | | | | | | | | |
| Cash provided per IFRS | | $ | 665 | | | Nil | |
The date set forth in the table below for the years ended December 31, 2009, December 31, 2008 and December 31, 2007 is data derived from consolidated financial statements of the Company audited by DMCL CA, LLP, independent Registered Public Accountant, as indicated in their report which is included elsewhere in this annual report.
The selected consolidated financial information set forth in the first table below for each of the three years ended December 31, 2009, 2008 and 2007, which is expressed in Canadian dollars (the Company prepares its financial statements in Canadian dollars), has been derived from the Company's audited consolidated financial statements as at and for the financial years ended December 31, 2009, 2008 and 2007. These consolidated financial statements were prepared in accordance with generally accepted accounting principles in Canada ("Canadian GAAP"), which differ in certain respects from the principles the Company would have followed had its consolidated financial statements been prepared in accordance with United States GAAP.
Selected Financial Data
| | | (In $000 except per share data) | |
| Canadian GAAP | | 2009 | | | 2008 | | | 2007 | |
| | | | | | | | | | |
| Revenue | | Nil | | | Nil | | | Nil | |
| Net income (Loss) for the year | | $ | (4,660 | ) | | $ | (1,149 | ) | | $ | (1,094 | ) |
| Earnings (Loss) per share | | $ | (0.22 | ) | | $ | (0.05 | ) | | $ | (0.06 | ) |
| Dividends per Shares | | Nil | | | Nil | | | Nil | |
| | | | | | | | | | | | | |
| Working capital | | $ | 3,093 | | | $ | 4,345 | | | $ | 7,852 | |
| Mineral Properties | | $ | 2,142 | | | $ | 5,463 | | | $ | 2,886 | |
| Long Term Debt | | Nil | | | Nil | | | Nil | |
| Total assets | | $ | 5,325 | | | $ | 9,983 | | | $ | 10,801 | |
| Shareholders’ equity | | $ | 5,268 | | | $ | 9,836 | | | $ | 10,767 | |
Consolidated Statements of Cash Flows
| | | 2009 | | | 2008 | | | 2007 |
| Operating activities | | | | | | | | |
| Cash used per Canadian GAAP | | $ | 621 | | | $ | 370 | | | $ | 600 |
| Investing activities | | | | | | | | | | | |
| Cash used per Canadian GAAP | | $ | 638 | | | $ | 2,914 | | | $ | 1,449 |
| Financing Activities | | | | | | | | | | | |
| Cash provided per Canadian GAAP | | Nil | | | Nil | | | $ | 8,830 |
| | | (In $000 except per share data) | |
| United States GAAP | | 2009 | | | 2008 | | | 2007 | |
| | | | | | | | | | |
| Revenue | | Nil | | | Nil | | | Nil | |
| Net income (Loss) for the year | | $ | (4,973 | ) | | $ | (3,490 | ) | | $ | (2,186 | ) |
| Earnings (Loss) per share | | $ | (0.23 | ) | | $ | (0.16 | ) | | $ | (0.13 | ) |
| Dividends per Shares | | | 0 | | | | 0 | | | | 0 | |
| | | | | | | | | | | | | |
| Working capital | | $ | 3,093 | | | $ | 4,345 | | | $ | 7,852 | |
| Mineral Properties | | $ | 644 | | | $ | 1,424 | | | $ | 1,187 | |
| Long Term Debt | | | 0 | | | | 0 | | | | 0 | |
| Total assets | | $ | 3,826 | | | $ | 5,943 | | | $ | 9,103 | |
| Shareholders’ equity | | $ | 3,762 | | | $ | 5,790 | | | $ | 9,061 | |
Consolidated Statements of Cash Flows
| | | 2009 | | | 2008 | | | 2007 |
| Operating activities | | | | | | | | |
| Cash used per US GAAP | | $ | 1,023 | | | $ | 2,710 | | | $ | 1,692 |
| Investing activities | | | | | | | | | | | |
| Cash used per US GAAP | | $ | 235 | | | $ | 574 | | | $ | 357 |
| Financing Activities | | | | | | | | | | | |
| Cash provided per US GAAP | | Nil | | | Nil | | | $ | 8,830 |
See the heading “Currency and Exchange Rates” above for disclosure of exchange rates between Canadian dollars and United States dollars. Unless indicated otherwise, all references to dollars in this annual report are to Canadian dollars.
Accounting Standards
International Financial Reporting Standards ("IFRS")
In February 2008, the Canadian Accounting Standards Board confirmed that publicly accountable enterprises are required to adopt IFRS for fiscal years beginning on or after January 1, 2011. Accordingly, the Company changed from Canadian
GAAP reporting and commenced reporting under IFRS effective January 1, 2010 with restatement of comparative information presented. The conversion to IFRS from Canadian GAAP affects the Company’s reported financial position and results of operations and comprehensive income (loss) and affects the Company’s accounting policies, internal control over financial reporting and disclosure controls and procedures.
Accounting Standards Issued– not yet in effect
Amendments to IFRS 7 “Financial Instruments: Disclosures”
This amendment increases the disclosure required regarding the transfer of financial assets, especially if there is a disproportionate amount of transfer transactions that take place around the end of a reporting period. This amendment is effective for annual periods beginning on or after July 1, 2011
New standard IFRS 9 “Financial Instruments”
This new standard is a partial replacement of IAS 39 “Financial Instruments: Recognition and Measurement”. IFRS 9 uses a single approach to determine whether a financial asset is measured at amortized cost or fair value, replacing the multiple rules in IAS 39. The approach in IFRS 9 is based on how an entity manages its financial instruments in the context of its business model and the contractual cash flow characteristics of the financial assets.
The new standard also requires a single impairment method to be used, replacing the multiple impairment methods in IAS 39. IFRS 9 is effective for annual periods beginning on or after January 1, 2013.
New standard IFRS 10 “Consolidated Financial Statements”
This new standard will replace IAS 27 “Consolidated and Separate Financial Statements”, and SIC-12 “Consolidation – Special Purpose Entities”. Concurrent with IFRS 10, the IASB issued IFRS 11 “Joint Ventures”; IFRS 12 “Disclosures of Involvement with Other Entities”; IAS 27 “Separate Financial Statements”, which has been amended for the issuance of IFRS 10 but retains the current guidance for separate financial statements; and IAS 28 “Investments in Associates and Joint Ventures”, which has been amended for conforming changes based on the issuance of IFRS 10 and IFRS 11.
IFRS 10 uses control as the single basis for consolidation, irrespective of the nature of the investee, eliminating the risks and rewards approach included in SIC-12, and requires continuous assessment of control over an investee. The above consolidation standards are effective for annual periods beginning on or after January 1, 2013.
New interpretation IFRIC 20 “Stripping Costs in the Production Phase of a Surface Mine”
This new IFRIC clarifies when production stripping should lead to the recognition of an asset and how that asset should be measured, both initially and in subsequent periods. IFRIC 20 is effective for annual periods beginning on or after January 1, 2013.
The Company has not early adopted these revised standards and is currently assessing the impact that these standards will have on its consolidated financial statements.
IFRS 11, Joint Arrangements
IFRS 11 requires a venturer to classify its interest in a joint arrangement as a joint venture or joint operation. Joint ventures will be accounted for using the equity method of accounting whereas for a joint operation the venture will recognize its share of the assets, liabilities, revenue and expenses of the joint operation. Under existing IFRS, entities have the choice to proportionately consolidate or equity account for interests in joint ventures. IFRS 11 supersedes lAS 31, Interests in Joint Ventures, and SIC-13, Jointly Controlled Entities-Non-monetary Contributions by Venturers.
IFRS 12, Disclosure of Interests in Other Entities
IFRS 12 establishes disclosure requirements for interests in other entities, such as joint arrangements, associates, special purpose vehicles and off balance sheet vehicles. The standard carries forward existing disclosures and also introduces significant additional disclosure requirements that address the nature of, and risks associated with, an entity's interests in other entities.
IFRS 13 Fair Value Measurement
IFRS 13 is a comprehensive standard for fair value measurement and disclosure requirements for use across all IFRS standards. The new standard clarifies that fair value is the price that would be received to sell an asset, or paid to transfer a
liability in an orderly transaction between market participants, at the measurement date. It also establishes disclosures about fair value measurement. Under existing IFRS, guidance on measuring and disclosing fair value is dispersed among the specific standards requiring fair value measurements and in many cases does not reflect a clear measurement basis or consistent disclosures.
Other accounting standards or amendments to existing accounting standards that have been issued but have future effective dates are either not applicable or are not expected to have a significant impact on the Company’s financial statements.
TRANSITION TO IFRS
The Company’s first audited consolidated financial statements prepared in accordance with IFRS were prepared for the year ended December 31, 2011 with comparative information for the year ended December 31, 2010 and at January 1, 2010 (the Company’s “Transition Date”).
An explanation of how the transition from previous Canadian GAAP to IFRS has affected the Company’s financial position and comprehensive loss is set out in the Note 16 to the audited consolidated financial statements for the year ended December 31, 2011.
The accounting policies set out in Note 2 to the audited consolidated financial statements for the year ended December 31, 2011 have been applied in preparing those statements and in the comparative information presented in those financial statements for the year ended December 31, 2010 and in the preparation of an opening IFRS statement of financial position at the Transition Date.
FIRST TIME ADOPTION OF IFRS
The Company adopted IFRS effective on the Transition Date. Under IFRS 1 - First Time Adoption of International Financial Reporting Standards (IFRS 1), the IFRS standards are applied retrospectively at the Transition Date with all adjustments to assets and liabilities as stated under Canadian GAAP taken to deficit, with IFRS 1 providing for certain optional and mandatory exemptions to this principle.
The Company has elected to apply the following optional exemptions:
Share-based payment transactions
IFRS 1 allows that full retrospective application may be avoided for certain share-based instruments depending on the grant date, vesting terms and settlement of any real liabilities. A first-time adopter can elect to not apply IFRS 2 to share-based payments granted after November 7, 2002 that vested before the Transition Date. The Company has elected this exemption and will apply IFRS 2 to only unvested share options as at the Transition Date.
Business Combinations
IFRS 1 allows that a first-time adopter may elect not to apply IFRS 3 Business Combinations (IFRS 3) retrospectively to business combinations prior to the Transition Date avoiding the requirement to restate prior business combinations. The Company has elected to apply IFRS 3 only to business combinations that occur on or after January 1, 2010.
Effects of Changes in Foreign Exchange Rates
IAS 21 “The Effects of Changes in Foreign Exchange Rates” has not been applied to cumulative translation differences that existed at the date of transition to IFRS. The Company has eliminated the cumulative translation difference and adjusted retained earnings by the same amount at the date of transition to IFRS. If, subsequent to adoption, a foreign operation is disposed of, the translation differences that arose before the date of transition to IFRS will not affect the gain or loss on disposal.
3.B. Capitalization and Indebtedness
Not Applicable.
3.C. Reasons for the Offer and Use of Proceeds
Not Applicable.
3.D. Risk Factors
Any investment in our common shares involves a high degree of risk. You should consider carefully the following information before you decide to buy our common shares. If any of the events discussed in the following risk factors actually occurs, our business, financial condition or results of operations would likely suffer. In this case, the market price of our common shares could decline, and you could lose all or part of your investment in our shares. In particular, you should consider carefully the following risk factors:
We have a history of losses.
We have historically incurred losses and have no revenue from operations. We incurred losses from operations of $1,112,646 for the fiscal year ended December 31, 2011 and losses of $502,315 and $4,660,805 and for the fiscal years ended December 31, 2010 and 2009, respectively. As of December 31, 2011, we had a cumulative deficit of $11,032,632 (December 31, 2010: $9,919,986). There can be no assurance that either the Company or our subsidiary will achieve profitability in the future or at all.
We have not identified any commercially viable mineral deposits. We have not commenced development or commercial production on any of our properties. We have no history of earnings or cash flow from operations. We do not have a line of credit and our only present source of funds available may be through the sale of our equity shares or assets. Even if the results of exploration are encouraging, we may not have the ability to raise sufficient funds to conduct further explorations to determine whether a commercially mineable deposit exists on any of our properties. While additional working capital may be generated through the issuance of equity or debt, the sale of properties or possible joint venturing of the properties, we cannot assure you that any such funds will be available for operations on acceptable terms, if at all.
Very few mineral properties are ultimately developed into producing mines.
At present, none of our properties have a known body of ore and all our proposed exploration programs are an exploratory search for ore. The business of exploration for minerals and mining involves a high degree of risk. Few properties that are explored are ultimately developed into producing mines. Most exploration projects do not result in the discovery of commercially mineable deposits of ore.
Substantial expenditures will be required for us to establish ore reserves through drilling, to develop metallurgical processes, to extract the metal from the ore and to develop the mining and processing facilities and infrastructure at any site chosen for mining.
Although substantial benefits may be derived from the discovery of a major mineral deposit, no assurance can be given that we will discover minerals in sufficient quantities to justify commercial operations or that we can obtain the funds required for development on a timely basis. The economics of developing precious and base metal mineral properties is affected by many factors including the cost of operations, variations in the grade of ore mined, fluctuations in metal markets, costs of processing equipment and other factors such as government regulations, including regulations relating to royalties, allowable production, importing and exporting of minerals and environmental protection.
Additional financing may be needed for our business operations.
As at December 31, 2011, we had cash and cash equivalents on hand of $1,131,358. We have sufficient working capital to fund our exploration activities on our mineral properties through fiscal 2012. Our business plan calls for significant expenses in connection with the acquisition and exploration of mineral claims. While we believe we have sufficient working capital to fund our activities through our 2012 fiscal year, we will require additional financing to sustain our business operations if we are not successful in earning revenues once we complete exploration on any mineral properties we acquire.
We do not currently have any arrangements for financing and we can provide no assurance to investors that we will be able to find such financing if required. We believe the only realistic source of future funds presently available to us is through the sale of equity capital. Any sale of share capital will result in dilution to existing shareholders.
Mineral exploration involves a high degree of risk against which we are not currently insured.
Unusual or unexpected rock formations, formation pressures, fires, power outages, labour disruptions, flooding, cave-ins, landslides and the inability to obtain suitable or adequate machinery, equipment or labour are risks involved in the operation of mines and the conduct of exploration programs. We have relied on and will continue to rely upon consultants and others for exploration expertise.
It is not always possible to fully insure against such risks and we may decide not to take out insurance against such risks as a result of high premiums or other reasons. Should such liabilities arise, they could reduce or eliminate any future profitability and result in increasing costs and a decline in the value of our common stock.
We may require permits and licenses that we may not be able to obtain.
Our operations may require licenses and permits from various governmental authorities. There can be no assurance that we will be able to obtain all necessary licenses and permits that may be required to conduct exploration, development and mining operations at any projects we acquire.
Our plan of operation for our properties is subject to unexpected delays.
Our exploration activities will be subject to the risk of unanticipated delays including permitting its contemplated projects. Such delays may be caused by fluctuations in commodity prices, mining risks, difficulty in arranging needed financing, unanticipated permitting requirements or legal obstruction in the permitting process by project opponents. In addition to adding to project capital costs (and possibly operating costs), such delays, if protracted, could result in a write-off of all or a portion of the carrying value of the delayed project.
Our properties may not have been examined in detail by a qualified mining engineer or geologist.
Our properties are in an exploratory stage. As a result, they may not have been examined in detail by a qualified mining engineer or geologist who could quantify exactly what their economic potential or value, if any, is.
Metal prices fluctuate widely.
Our business activities are significantly affected by the prices of precious metals and base metals on international markets. The price of minerals affects our ability to raise financing, the commercial feasibility of our properties, the future profitability of our properties should they be developed and our future business prospects. The prices of precious metals and base metals fluctuate widely and are affected by numerous factors beyond our control, including expectations with respect to the rate of inflation, the strength of the U.S. dollar and of other currencies, interest rates, and global or regional political or economic crisis. The demand for and supply of precious metals and base metals may affect precious metals and base metals prices but not necessarily in the same manner as supply and demand affect the prices of other commodities.
The resource industry is very competitive.
Significant competition exists for the limited number of property acquisition opportunities available. As a result of this competition, some of which is with large established mining companies with substantial capabilities and greater financial and technical resources than our Company, we may be unable to acquire attractive mining properties on terms we consider acceptable.
Competition in the precious and base metals mining industry is primarily for mineral rich properties which can be developed and exploited economically; the technical expertise to find, develop, and produce such properties; the labor to operate the properties; and the capital for the purpose of funding such properties. Many competitors not only explore for and mine precious and base metals and minerals but conduct refining and marketing operations on a worldwide basis. Such competition may result in our being unable to acquire desired properties, to recruit or retain qualified employees or to acquire the capital necessary to fund our operations and develop our properties. Our inability to compete with other mining companies for these resources may have a material adverse effect on our results of operation and business. There can be no assurance that our exploration and acquisition programs will yield any reserves or result in any commercial mining operation.
Our operations may be adversely affected by environmental regulations.
Our operations may be subject to environmental regulations promulgated by government agencies from time to time. Environmental legislation provides for restrictions and prohibitions on spills, release or emissions of various substances produced in association with certain mining industry operations, such as seepage from tailings disposal areas, which would
result in environmental pollution. A breach of such legislation may result in the imposition of fines and penalties. In addition, certain types of operations require the submission and approval of environmental impact assessments. Environmental legislation is evolving in a manner, which means that standards, enforcement, fines and penalties for non-compliance are more stringent. Environmental assessments of proposed projects carry a heightened degree of responsibility for us and our directors, officers and consultants. The cost of compliance with changes in governmental regulations has a potential to reduce the profitability of our operations. We do not maintain environmental liability insurance.
Differences in U.S. and Canadian reporting of reserves and resources
The Company’s reserve and resource estimates are not directly comparable to those made in filings subject to SEC reporting and disclosure requirements, as the Company generally reports reserves and resources in accordance with Canadian practices. These practices are different from those used to report reserve and resource estimates in reports and other materials filed with the SEC. It is Canadian practice to report measured, indicated and inferred resources, which are not permitted in disclosure filed with the SEC by United States issuers. In the United States, mineralization may not be classified as a "reserve" unless the determination has been made that the mineralization could be economically and legally produced or extracted at the time the reserve determination is made. United States investors are cautioned not to assume that all or any part of measured or indicated resources will ever be converted into reserves.
Further, "inferred resources" have a great amount of uncertainty as to their existence and as to whether they can be mined legally or economically. Disclosure of "contained ounces" is permitted disclosure under Canadian regulations; however, the SEC permits issuers to report "resources" only as in-place tonnage and grade without reference to unit of metal measures.
Accordingly, information concerning descriptions of mineralization, reserves and resources contained in this Annual Report, or in the documents incorporated herein by reference, may not be comparable to information made public by United States companies subject to the reporting and disclosure requirements of the SEC.
As a foreign private issuer, our shareholders may have less complete and timely data.
We are a “foreign private issuer” as defined in Rule 3b-4 under the United States Securities Exchange Act of 1934, as amended (the “Exchange Act”). We are accordingly exempt from Sections 14(a), 14(b), 14(c), 14(f) and 16 of the Exchange Act pursuant to Rule 3a12-3 of the Exchange Act. Therefore, we are not required to file a Schedule 14A proxy statement in relation to the annual meeting of shareholders. The submission of proxy and annual meeting of shareholder information on Form 6-K may result in shareholders having less complete and timely information in connection with shareholder actions. The exemption from Section 16 rules regarding reports of beneficial ownership and purchases and sales of common shares by insiders and restrictions on insider trading in our securities may result in shareholders having less data and there being fewer restrictions on insiders’ activities in our securities.
Recent market events and conditions
Throughout 2009, 2010 and 2011, the U.S. credit markets experienced serious disruption due to a deterioration in residential property values, defaults and delinquencies in the residential mortgage market (particularly, sub-prime and non-prime mortgages) and a decline in the credit quality of mortgage backed securities. These problems led to a slow-down in residential housing market transactions, declining housing prices, delinquencies in non-mortgage consumer credit and a general decline in consumer confidence. These conditions caused a loss of confidence in the broader U.S. and global credit and financial markets and resulting in the collapse of, and government intervention in, major banks, financial institutions and insurers and creating a climate of greater volatility, less liquidity, widening of credit spreads, a lack of price transparency, increased credit losses and tighter credit conditions. These unprecedented disruptions in the current credit and financial markets have had a significant material adverse impact on a number of financial institutions and have limited access to capital and credit for many smaller companies. These disruptions could, among other things, make it more difficult for us to obtain, or increase its cost of obtaining, capital and financing for its operations. The Company’s access to additional capital may not be available on terms acceptable to it or at all.
General economic conditions
The recent unprecedented events in global financial markets have had a profound impact on the global economy. Many industries, including the gold mining industry, are impacted by these market conditions. Some of the key impacts of the current financial market turmoil include contraction in credit markets resulting in a widening of credit risk, devaluations and high volatility in global equity, commodity, foreign exchange and precious metal markets, and a lack of market liquidity.
A continued or worsened slowdown in the financial markets or other economic conditions, including but not limited to,
| | ● | lack of available credit, |
| | ● | the state of the financial markets, |
| | ● | and tax rates may adversely affect our growth and profitability. |
Specifically:
The global credit/liquidity crisis could impact the cost and availability of financing and our overall liquidity; the volatility of gold prices may impact our potential revenues, profits and cash flow; volatile energy prices, commodity and consumables prices and currency exchange rates impact potential production costs; and the devaluation and volatility of global stock markets impacts the valuation of our equity securities
These factors could have a material adverse effect on our financial condition and results of operations.
The trading market for our shares is not always liquid.
Although our shares trade on the TSX Venture Exchange, the Frankfurt Stock Exchange and the FINRA OTC Bulletin Board, the volume of shares traded at any one time can be limited, and, as a result, there may not be a liquid trading market for our shares. In addition, trading volumes in our common shares can be volatile and if the trading volume of our common shares experiences significant changes, the price of our common shares could be adversely affected. The price of our common shares could also be significantly affected by factors, many of which are beyond our control.
Our securities may be subject to penny stock regulation.
Our stock is subject to “penny stock” rules as defined in 1934 Securities and Exchange Act Rules. The Commission has adopted rules that regulate broker-dealer practices in connection with transactions in penny stocks. Our common shares are subject to these penny stock rules. Transaction costs associated with purchases and sales of penny stocks are likely to be higher than those for other securities. Penny stocks generally are equity securities with a price of less than U.S. $5.00 (other than securities registered on certain national securities exchanges or quoted on the NASDAQ system, provided that current price and volume information with respect to transactions in such securities is provided by the exchange or system).
The penny stock rules require a broker-dealer, prior to a transaction in a penny stock not otherwise exempt from the rules, to deliver a standardized risk disclosure document that provides information about penny stocks and the nature and level of risks in the penny stock market. The broker-dealer also must provide the customer with current bid and offer quotations for the penny stock, the compensation of the broker-dealer and its salesperson in the transaction and monthly account statements showing the market value of each penny stock held in the customer’s account. The bid and offer quotations, and the broker-dealer and salesperson compensation information, must be given to the customer orally or in writing prior to effecting the transaction and must be given to the customer in writing before or with the customer’s confirmation.
In addition, the penny stock rules require that prior to a transaction in a penny stock not otherwise exempt from such rules, the broker-dealer must make a special written determination that the penny stock is a suitable investment for the purchaser and receive the purchaser’s written agreement to the transaction. These disclosure requirements may have the effect of reducing the level of trading activity in the secondary market for our common shares in the United States and shareholders may find it more difficult to sell their shares.
Our Passive Foreign Investor Company (“PFIC”) Status Has Possible Adverse Tax Consequences for U.S. Investors
Current holders of and potential investors in our common shares who are U.S. taxpayers should be aware that we believe we were a passive foreign investment company (“PFIC”) for the year ended December 31, 2011, and may continue to be a PFIC in future years. If we are a PFIC for any year during a U.S. taxpayer’s holding period, then such U.S. taxpayers generally will be required to treat any so-called “excess distribution” received on its common shares, or any gain realized
upon a disposition of common shares, as ordinary income and to pay an interest charge on a portion of such distributions or gain, unless the taxpayer makes a qualified electing fund (“QEF”) election or a mark-to-market election with respect to our shares. In certain circumstances, the sum of the tax and the interest charge may exceed the amount of the excess distribution received, or the amount of proceeds of disposition realized, by the taxpayer. A U.S. taxpayer who makes a QEF election generally must report on a current basis its share of our net capital gain and ordinary earnings for any year in which we are a PFIC, whether or not we distribute any amounts to its shareholders. However, U.S. taxpayers should be aware that there can be no assurance that we will satisfy record keeping requirements that apply to a QEF, or that we will supply U.S. taxpayers with information that such U.S. taxpayers require to report under the QEF rules, in event that we are a PFIC and a U.S. taxpayers wishes to make a QEF election. Thus, U.S. taxpayers may not be able to make a QEF election with respect to their common shares. Each U.S. taxpayer should consult its own financial advisor, legal counsel, or accountant regarding the availability of, and procedure for making, a QEF election. A U.S. taxpayer who makes the mark-to-market election generally must include as ordinary income each year the excess of the fair market value of the common shares over the taxpayer’s basis therein. U.S. taxpayers are advised to seek the counsel of their professional tax advisors. This paragraph is qualified in its entirety by the discussion below under the heading “Taxation—Certain U.S. Federal Income Tax Considerations.” Each U.S. taxpayer should consult his or her own tax advisor regarding the U.S. federal, U.S. state and local, and foreign tax consequences of the PFIC rules and the acquisition, ownership, and disposition of our common shares.
We are a foreign corporation and most of our directors and officers are outside of the United States, which may make enforcement of civil liabilities difficult.
We are incorporated under the laws of the Province of Alberta, Canada and registered extra-provincially in the Province of British Columbia, Canada. All of our directors and officers are residents of Canada, with the exception of Clancy Wendt (who resides in the United States), and part of our assets are located outside of the United States. Consequently, it may be difficult for United States investors to effect service of process within the United States upon those directors or officers who are not residents of the United States, or to realize in the United States upon judgments of United States courts predicated upon civil liabilities under the United States Securities Exchange Act of 1934, as amended. A judgment of a US court predicated solely upon such civil liabilities would probably be enforceable in Canada by a Canadian court if the US court in which the judgment was obtained had jurisdiction, as determined by the Canadian court, in the matter. There is substantial doubt whether an original action could be brought successfully in Canada against any of such persons or us predicated solely upon such civil liabilities.
Item 4. Information on the Company
4.A History and Development of the Company
We were incorporated as Proven Capital Corp. on April 25, 1994 under the Business Corporations Act of Alberta. We changed our name and consolidated our share capital as set forth below on the following dates:
| Date | Name | Consolidation (Old:New) |
| April 25, 1994 | Proven Capital Corp. | Not applicable |
| January 10, 1995 | Cedar Capital Corp. | Not applicable |
| February 12, 2002 | Vancan Capital Corp. | 4:1 |
| May 14, 2002 | MAX Resource Corp. | Not applicable |
On June 27, 2007 we were registered as an extra-provincial company with the Registrar of Companies in British Columbia, pursuant to the Business Corporations Act of British Columbia.
We have an authorized capital of an unlimited number of common shares and an unlimited number of preferred shares, none of which preferred shares are issued.
The trading symbol for the Company on the TSX Venture Exchange is “MXR” with the symbol on the OTC Bulletin Board being “MXROF”. The trading symbol on the Frankfurt Exchange is “M1D”.
We are a reporting issuer in the United States and our annual report and 6K filings can be found on the SEC’s EDGAR system at www.sec.gov . We are a reporting issuer in certain Canadian jurisdictions and our required disclosure filings for Canada can be found at www.sedar.com.
Our head office is located at 1066 West Hastings Street, Suite 2300, Vancouver, British Columbia, Canada, V6E 3X2. Our telephone number is (604) 689-1749.
We have not been involved in any bankruptcy, receivership or similar proceedings, nor have we been a party to any material reclassification, merger, consolidation or purchase or sale of a significant amount of assets.
We are engaged in the business of acquiring and exploring resource properties.
Principal Expenditures And Divestitures
Since the beginning of the last three financial years, our principal capital expenditures and divestitures have been comprised principally of the acquisition, exploration and abandonment or disposition of our mineral properties, as described below.
Mineral Properties Now Held
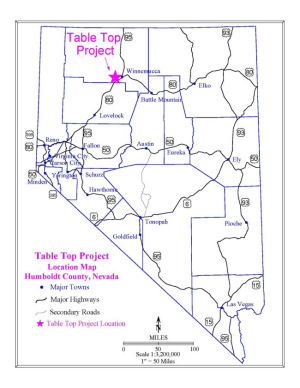
Table Top Gold Project (Nevada)
On September 1, 2009 we entered into an Option Agreement with Energex, LLC, a Nevada corporation wholly-owned by Clancy J. Wendt, our Vice President of Exploration, granting us an option (the “Table Top Option”) to acquire a 100% interest in the Table Top gold project claims (“Table Top Project”) in Humboldt County, Nevada for the sum of US$300,000 (the “Table Top Purchase Price”) and a 3% NSR Royalty, 1% of which can be repurchased for US$1 million. The Table Top Project consists of 58 claims and is located 10 miles west of the town of Winnemucca, Nevada. Under the terms of the agreement we are required to make the following rental payments (the “Table Top Rental Payments”) in order to maintain the Table Top Option in good standing:
| Date | Payment Amount (USD) |
| Upon execution of the Agreement (September 1, 2009) | $5,000 (paid) |
| On the First anniversary of the Agreement (September 1, 2010) | $25,000 (deferred) |
| On the Second anniversary of the Agreement (September 1, 2011) | $35,000 (deferred) |
| Each anniversary thereafter | $50,000 |
During 2011 we spent a total of $150,820 on exploration on the Table Top Project, including drilling. See “Special Notes regarding Forward Looking Statements”. See Item 4.D, “Property, Plant and Equipment – Table Top Project”.
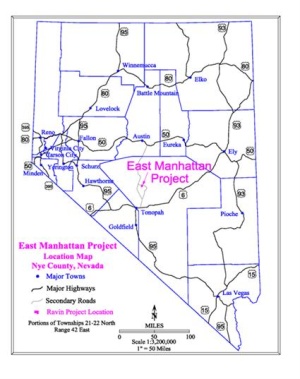
East Manhattan Wash gold project (Nye County, Nevada)
In December, 2007, we entered into an option agreement in conjunction with Max Resource, Inc., our wholly owned Nevada subsidiary, to acquire a 100 % interest in the East Manhattan Wash (“EMW”) claims in the Manhattan Mining District, Nye County, Nevada from MSM LLC, a Nevada corporation. The property is comprised of 78 claims and is located 40 miles north of the town of Tonopah, Nevada. We made a cash payment of US$28,000 to MSM LLC and, in accordance with the terms of the option agreement, are required to make the following option payments:
| Date | Payment Amount |
| Upon execution of the option agreement | $28,000 (US) (Paid) |
| First anniversary of effective date (December 4, 2008) | $20,000 (US) (Paid) |
| Second anniversary of effective date (December 4, 2009) | $25,000 (US) (Paid) |
| Third anniversary of effective date (December 4, 2010) | $40,000 (US) (Paid) |
| Fourth anniversary of effective date (December 4, 2011) | $50,000 (US) (deferred, subject to receipt of drill permit) |
| Fifth anniversary of effective date (December 4, 2012) | $100,000 (US) (subject to receipt of drill permit) |
The payments due on the fourth and fifth anniversary are both subject to securing a drill permit.
In addition we are required to make exploration expenditures totalling US$700,000 on the EMW claims in the second to fifth years (subject to receipt of the necessary drill permits),as follows:
● on or before December 4, 2009, US$50,000;
● on or before December 4, 2010, a further US$150,000
● on or before December 4, 2011, a further US$200,000
● on or before December 4, 2012, a further US$300,000
The EMW Property is subject to a 3% NSR royalty. The option may be exercised by making all of the above option payments and exploration expenditures. Upon full exercise of the option, we will own 100% of the project.
We made the following expenditures on this property during the fiscal years ending December 31, 2011, 2010 and 2009:
| | | 2011 | | | 2010 | | | 2009 |
| Drilling and assays | | $ | - | | | $ | 5,202 | | | $ | 12,763 |
| Geological consulting | | | 6,045 | | | | 29,923 | | | | 35,133 |
| Field expenses | | | 282 | | | | 3,632 | | | | 5,552 |
| | | $ | 6,327 | | | $ | 38,748 | | | $ | 53,448 |
See Item 4.D, “Property, Plant and Equipment – East Manhattan Wash Gold Project”.
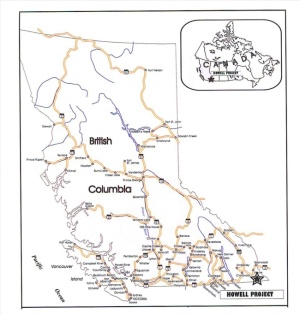
Howell/Crowsnest Gold Project (British Columbia)
Due to a change in policy by the Government of British Columbia resulting in a moratorium on exploration in the area, we ceased exploration on this property in 2010 and received compensation from the Province of British Columbia in March 2012 for our out-of-pocket expenditures totalling $655,306 in return for our relinquishing our interest in the property.
On June 9, 2008, we entered into an option agreement with Eastfield Resources Ltd. (“Eastfield”) whereby we can earn up to a 60% interest in the Howell Gold Project located one hour south of the town of Sparwood (by gravel road) in Southeast B.C. Eastfield has the right to earn a 100% interest in the Howell property through an amended 1999 option agreement with Teck Cominco Metals Limited (“TCML”) and Goldcorp Inc. (“GI”) whereby outstanding commitments include a final exploration expenditure totaling $423,759 and cash payments of $100,000 to each of TCML and GI due by August 31, 2010.
On July 24, 2009, we entered into an amending agreement with Eastfield, amending the June 9, 2008 Howell agreement to allow us to earn a 60% interest in the Howell Gold Project (“Howell Property”) and/or the Crowsnest Mineral Property (“Crowsnest Property”) projects over a four year period. The Crowsnest Property is comprised of 14 claims totaling 3,163 hectares and is located approximately 10 km southeast of the Howell property.
The terms of our option agreement (as amended) with Eastfield were as follows:
| Property | Date | Cash Payment
Amount | Issuance of Shares |
| | | | |
| Combined Howell Property & Crowsnest Property | On signing amending agreement (July 24, 2009) | $10,000 (paid) | |
| | On signing amending agreement (July 24, 2009) | | 50,000 common shares (Issued) |
| | On or before 1st anniversary date (June 30, 2010) | $20,000 | OR 50,000 common shares |
| | On or before June 30, 2011 | $30,000 | |
| Howell Property | On or before August 31, 2010 | $120,000* | |
| Howell Property | On or before June 30, 2012 | $40,000 | 200,000 Common shares |
| Crowsnest Property | On or before June 30, 2012 | $40,000 | 200,000 Common shares |
| Howell Property | On or before June 30, 2013 | $50,000 | 200,000 Common shares |
| Crowsnest Property | On or before June 30, 2013 | $50,000 | 200,000 Common shares |
| | | | |
*our portion of the $200,000 payment due to GI and TCML by August 31, 2010 pursuant to Eastfield’s underlying agreement with them.
In addition we are required under the agreement to make exploration expenditures as follows:
In the first and second years, $400,000 on the combined Howell and Crowsnest properties as follows:
| | ● | on or before June 30, 2010, $150,000; |
| | ● | on or before June 30, 2011, a further $250,000; |
In the third and fourth years, $701,000 on the Howell Property as follows:
| | ● | on or before June 30, 2012, $1.00 |
| | ● | on or before June 30, 2013, a further $700,000 |
In the third and fourth years, $1,050,000 on the Crowsnest Property as follows:
| | ● | on or before June 30, 2012 $350,000 |
| | ● | on or before June 30, 2013, a further $700,000. |
During the year ended December 31, 2009, we spent a total of $3,078 for geological consulting fees on the Howell property, and we claimed a BC Mining Tax recovery in the amount of $20,684. We also spent a total of $248,429 on exploration of the Crowsnest property, comprised of drilling and assays ($112,088), geological consulting ($52,524), and field expenses ($83,817) during 2009.
During the year ended December 31, 2010, we spent a total of $613 for geological consulting fees on the Crowsnest property, and we received a BC Mining Tax recovery in the amount of $77,670. We did not spend any money on the Howell property during 2010.
In February 2010 the Government of British Columbia announced that it intends to halt all ongoing mineral exploration work and prohibit any future mine development in the Flathead Valley in southeastern British Columbia where the Howell and Crowsnest properties are located. The Company was immediately contacted by the Ministry of Energy, Mines and Petroleum Resources and discussions were initiated with respect to compensation, which was subsequently received by the Company in March of 2012. See Item 4.D, “Property, Plant and Equipment – Howell/Crowsnest Gold Project”.
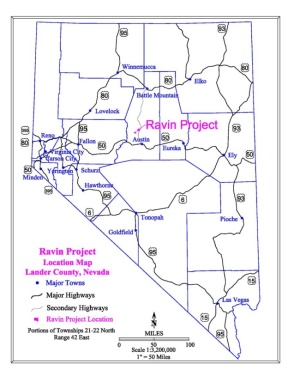
Ravin Molybdenum/ Tungsten Property (Lander County, Nevada):
On September 10, 2007, and as amended on November 9, 2010, we entered into an option agreement (the “Ravin Option”) to acquire a 100 % interest in the Ravin molybdenum/tungsten property in Lander County, Nevada (the “Ravin Property”) from Energex, LLC, a Nevada corporation wholly-owned by Clancy J. Wendt, our Vice President of Exploration for the sum of US$300,000 (the “Ravin Purchase Price”).
The following rental payments (the “Rental Payments”) are required in order to maintain the Ravin Option:
| Date | Payment Amount |
| Upon execution of the option agreement | $5,000 USD (paid) |
| First anniversary of effective date (September 10, 2008) | $25,000 USD (paid) |
| Second anniversary of effective date (September 10, 2009) | $35,000 USD (paid) |
| Each anniversary thereafter (subject to increase to $US50,000 on certain triggering events) | $10,000 USD (paid) |
The Ravin Option may be exercised at any time by payment of the Ravin Purchase Price and grant of a 3% NSR, 1% of which can be repurchased for US$1 million (the “Ravin Royalty”).
During the year ended December 31, 2009 we spent a total of $17,930 on exploration of the Ravin property comprised of drilling and assay costs ($3,939), geological consulting fees ($12,930), and field expenses ($1,071). During the year ended December 31, 2010 we spent $639 on geological consulting for the Ravin property, with no expenditures incurred during the year ended December 31, 2011. See Item 4.D, “Property, Plant and Equipment – Ravin Molybdenum/Tungsten Property”.
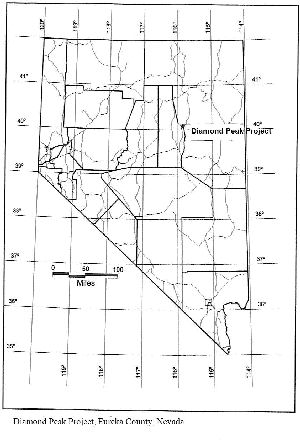
Diamond Peak Property (Nevada)
On May 9, 2006, we entered into an Option Agreement, as amended on June 30, 2010, to acquire an option (the “Diamond Peak Option”) to purchase a 100% interest in the FMC claims in Eureka County, Nevada, (the “Diamond Peak Property”) for the sum of US$300,000 (the “Diamond Peak Purchase Price”) plus a 3% NSR, 1% of which can be repurchased for US$1 million (the “Diamond Peak Royalty”), from The Wendt Family Trust of Reno, Nevada. The Wendt Family Trust is controlled by Clancy J. Wendt, our Vice President of Exploration.
Under the terms of the Diamond Peak Option Agreement, we issued 100,000 shares of the Company to the Wendt Family Trust and must make the following rental payments (the “Diamond Peak Rental Payments”) in order to maintain the Diamond Peak Option:
| Date | Payment Amount (U.S funds) |
| Upon execution of the option agreement (May 9, 2006) | $25,000 (paid) |
| First anniversary of effective date (May 9, 2007) | $35,000 (paid) |
| Second anniversary of effective date (May 9, 2008) | $45,000 (paid) |
| Third anniversary of effective date (May 9, 2009) | $50,000 (paid ) |
| On June 30, 2010 upon execution of the amending agreement | $25,000 (paid) |
| On May 9, 2011 (as amended) | $35,000 (deferred) |
| On May 9, 2012 (as amended) | $45,000 |
| Each anniversary thereafter for 4 years (as amended) | $50,000 |
The Diamond Peak Option may be exercised at any time by payment of the Diamond Peak Purchase Price and grant of the Diamond Peak Royalty. We are required to make minimum annual advance royalty payments of US$50,000 after exercise until commencement of sustained commercial production, with such payments being credited against the Diamond Peak Royalty. The Diamond Peak Rental Payments are not credited against the Royalty or the Purchase Price, but are not payable after the Option is exercised.
We entered into a mineral property option agreement on May 15, 2006, as amended effective September 30, 2009, with Kokanee Placer Ltd. (“Kokanee Placer”), a British Columbia company, whereby we granted to Kokanee the right to acquire up to a 51% interest in the Diamond Peak Property (the “Kokanee Option”) in consideration of a cash payment of US$25,000 (paid) and the issuance of 100,000 common shares of “Kokanee Minerals Inc.” (“Kokanee”) (received subsequent to December 31, 2009), a public company (TSX V : KOK) which exchanged its shares for Kokanee Placer in conjuction with its public listing (completed in January, 2010).
To maintain this agreement in good standing, Kokanee had agreed to make the following annual payments and share issuances to the Company:
| - | By May 15, 2007 pay US$35,000 to the Company (received); |
| - | within five days after listing of Kokanee’s common shares on the TSX Venture Exchange, pay US$95,000 and issue 500,000 Kokanee shares to the Company (received); and |
| - | On or before May 9, 2010 and on each anniversary thereof up to and including May 9, 2016, pay US$50,000 to the Company; and |
| - | On commencement of commercial production, issue 1,000,000 Kokanee shares to the Company; |
The Kokanee Option was also subject to Kokanee completing $1,000,000 in exploration on the Diamond Peak Property over a three year period.
In June 2010 Kokanee advised us that they would not be making the US$50,000 payment then due and would be abandoning their option. We have reviewed all work conducted by Kokanee and conducted soil sampling and constructed roads and drill pads at Diamond Peak in preparation for drilling. During the year ended December 31, 2011, we incurred $1,794 of drilling and assaying fees and $577 of field expenses on the Diamond Peak project. During 2010, we spent $21,248 on geological consulting, $9,220 on assays and $27,624 on field expenses at Diamond Peak. See Item 4.D, “Property, Plant and Equipment – Diamond Peak Property.”
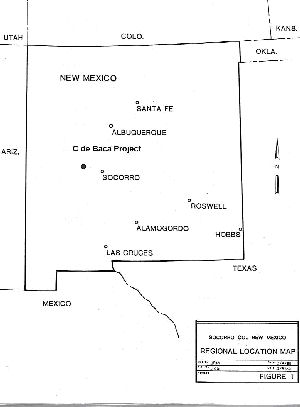
C de Baca Project (New Mexico):
In September 2005, we announced that we had entered into an agreement with Applied Geological Services, Inc. of Denver, Colorado for the acquisition of a total of 108 uranium exploration claims (the “Dat Claims”) in Socorro County, New Mexico. Consideration for the acquisition of the Dat Claims (known also as the “C de Baca Project”) is an immediate US$10,000 cash payment with annual payments of US$10,000 until production. After production, a royalty of 2% of revenues is payable until such time as a total of US$500,000 (including the initial cash payment and annual payments) has been paid. The obligation to make payments to Applied Geologic Services can be terminated at anytime by us by providing notice that we are abandoning the Dat Claims and agreeing to transfer them back to the vendor.
In 2007 we conducted a 14 hole drill program to follow up on historic Occidental Minerals drilling and we were successful in confirming historic uranium grades. In March 2008 we received a Technical Report prepared by Michael G. Bersch, Phd. PG, which recommends further exploration at C de Baca that will include diamond drilling, project and regional scale
geologic mapping. During the year ended December 31, 2008 we spent $16,360 for geological consulting and $2,001 permitting on the C de Baca project. No money was spent on the project during the years ended December 31, 2011, 2010 and 2009. See Item 4.D, “Property, Plant and Equipment – C de Baca Project”.
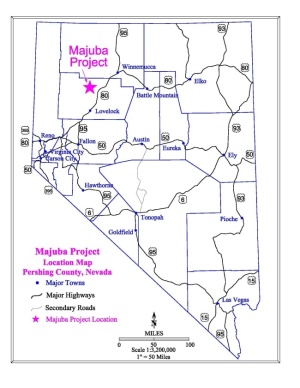
Majuba Hill Copper/Silver Project (Nevada):
On March 4, 2011 we entered into an option agreement to acquire up to a 75% interest in the Majuba Hill Copper/Gold/Silver property in Pershing County, Nevada (the “Majuba Hill Property”) from Claremont Nevada Mines LLC., Nevada. (the “Majuba Hill Option Agreement”). The Majuba Hill Project encompasses 2,568 acres consisting of patented and unpatented lode mining claims and private mineral rights.
The terms of the Majuba Hill Option Agreement with Claremont allow us to earn an initial 60% interest in the property over six years by spending US$6.5 Million on exploration of the property, as follows.
Performance Date | | Annual Amount | | | Cumulative
Amount | |
| By the first anniversary date | | $ | 500,000 | | | $ 500,000 | (completed) |
| By the second anniversary date | | $ | 750,000 | | | $ | 1,250,000 | |
| By the third anniversary date | | $ | 1,000,000 | | | $ | 2,250,000 | |
| By the fourth anniversary date | | $ | 1,250,000 | | | $ | 3,500,000 | |
| By the fifth anniversary date | | $ | 1,500,000 | | | $ | 5,000,000 | |
| By the sixth anniversary date | | $ | 1,500,000 | | | $ | 6,500,000 | |
We can increase our interest in the Majuba Hill Property to 75% by spending a further $3.5 Million on exploration over a subsequent two year period.
In addition, we are also required to make annual advance royalty payments of US$20,000 to a third party, JR Exploration LLC, a Nevada limited liability company, on the effective date of the Option Agreement and each anniversary thereafter. The Majuba Hill Property is also be subject to a 3% NSR payable to the vendor, 1.5% of which may be purchased at any time for US$1.5 Million. See Item 4.D, “Property, Plant and Equipment – Majuba Hill Copper/Silver Property”.
NUSTAR Uranium Project (Colorado Plateau, Arizona):
On April 4, 2007, we entered into an agreement with NUSTAR Exploration LLC, a private Arizona limited liability corporation, for the acquisition of a 100% interest in 427 mineral claims located in the Arizona Strip of the Colorado Plateau in northwest Arizona.
Under the terms of our agreement with NUSTAR, we purchased a 100% interest in the NUSTAR Claims by making a cash payment to NUSTAR of US$128,100 and issuing 200,000 shares of our common stock, subject to a gross royalty of 4% (the “NUSTAR Royalty”) of sales revenue from commercial production of uranium from the NUSTAR Claims. The agreement provided that we would have the right to purchase 3% of the 4% NUSTAR Royalty applicable to each breccia pipe identified on the NUSTAR Claims that went into commercial production, for the sum of $1,000,000.
During the year ended December 31, 2009, we incurred $1,392 of geological consulting expenses on the Nustar project.
In September 2009, we elected to abandon the Nustar project and wrote off $497,948 of acquisition costs and $5,488 of deferred exploration costs to operations during the period.
4.B Business Overview
During the fiscal year ended December 31, 2011, we
| | (i) | completed a 497 meter core drilling program at the Table Top Project; |
| | (ii) | entered into an agreement whereby we can earn up to a 75% interest in the Majuba Hill Property by spending US$10 Million over an eight year period; |
| | (iii) | completed a private placement of 2,016,755 units at $0.28 for gross proceeds of $564,691; |
| | (iv) | conducting extensive soil sampling at Majuba Hill, taking a total of 834 individual samples; and |
| | (v) | completed two core drill programs at Majuba Hill totaling 1,828 meters. |
See “Principal Expenditures and Divestitures”.
Management & Employees
We do not have any employees other than our directors and officers.
Our President and Chief Executive Officer, Stuart Rogers devotes approximately 80% of his business time to our affairs. Effective October 1, 2008, the Company entered into a Consulting Agreement between West Oak Consulting Group, Inc. (“West Oak) and us. Mr. Rogers is the sole shareholder and key employee of West Oak. Pursuant to the Agreement, West Oak, through its key employee who acts as our President and CEO, performs management services on our behalf, will receive $10,000 per month for a period of 24 months. The Agreement calls for an automatic renewal for a second 24 month period in the absence of either West Oak or us providing written notice of termination of the agreement.
Our Vice-President of Exploration, Mr. Clarence J. (Clancy) Wendt, entered into a Consulting Agreement with us effective October 1, 2008, which agreement is in force and effect for a period of 24 months, with a fee of US$10,000 per month being paid to him for his geological consulting services and the performance of duties associated with the position of Vice President, Exploration. The agreement calls for an automatic renewal for a second 24 month period in the absence of either Mr. Wendt or us providing written notice of termination of the agreement.
Office Space
We utilize about 167 square feet of office space in Vancouver, British Columbia. On September 1, 2010, we entered into a two year lease on these premises with a property management firm for $1,789 per month plus telephones.
Looking forward to 2012, we anticipate that we will be able to fund our ongoing general operations through the next year from funds on hand. However, due to the volatility in capital markets and continued depressed commodity prices for molybdenum and uranium, we took steps to reduce our general and administrative costs, primarily through reductions in advertising and promotional expenses. The resulting cost savings were evident during fiscal 2010 and 2009 and will continue in subsequent periods. We also plan to be selective in incurring exploration expenditures during the balance of fiscal 2012. Due to the recent increase in the price of precious metals, we will continue to focus our exploration efforts on those properties we consider highly prospective for gold or silver. Our initial focus will be Majuba Hill in Nevada, where we commenced a core drilling program in May, 2012.
While conditions in the resource sector have improved somewhat since 2009, recent events in Europe have resulted in access to capital once again being limited for early stage exploration companies and we will continue to review our project portfolio and may elect to reduce or eliminate exploration expenditures or abandon certain of our properties should we not deem it fiscally prudent to satisfy these obligations when they come due.
As of May 22, 2012, we have funds on hand of approximately $1.3 Million which is expected to provide sufficient working capital to fund our exploration activities on our remaining properties through fiscal 2011, as outlined in Item 4D below. See “Special Note Regarding Forward Looking Statements”.
4.C Organizational Structure
The Company has only one subsidiary, MAX Resource, Inc., a wholly owned Nevada corporation incorporated in the fiscal year ending December 31, 2005 for the purpose of holding the Company’s mineral interests in Arizona, New Mexico and Nevada and for the purpose of securing work permits on its properties in those jurisdictions. Throughout this report on Form 20-F, MAX Resource, Inc. and its parent company, MAX Resource Corp., are collectively referred to as the Company.
4.D Property, Plants and Equipment
WE ARE AN EXPLORATION STAGE COMPANY AND HAVE NO MINERAL PRODUCING PROPERTIES AT THIS TIME. ALL OF OUR PROPERTIES ARE EXPLORATION PROJECTS, AND WE RECEIVE NO REVENUES FROM PRODUCTION. ALL WORK PRESENTLY PLANNED BY US IS DIRECTED AT DEFINING MINERALIZATION AND INCREASING UNDERSTANDING OF THE CHARACTERISTICS AND ECONOMICS OF THAT MINERALIZATION. THERE IS NO ASSURANCE THAT A COMMERCIALLY VIABLE MINERAL DEPOSIT EXISTS IN ANY OF OUR PROPERTIES NOR DO WE ANTICIPATE SAME UNTIL AFTER COMPLETION OF FURTHER EXPLORATION WORK AND A COMPREHENSIVE
EVALUATION BASED UPON UNIT COST, GRADE, RECOVERIES AND OTHER FACTORS CONCLUDE ECONOMIC FEASIBILITY. THE INFORMATION CONTAINED HEREIN RESPECTING OUR MINERAL PROPERTIES IS BASED UPON INFORMATION PREPARED BY OR THE PREPARATION OF WHICH WAS SUPERVISED BY PROFESSIONAL GEOLOGIST, CLANCY J. WENDT, OUR VICE-PRESIDENT OF EXPLORATION. MR. WENDT IS A “QUALIFIED PERSON” PURSUANT TO CANADIAN SECURITIES NATIONAL INSTRUMENT 43-101 CONCERNING STANDARDS OF DISCLOSURE FOR MINERAL PROJECTS.
Mineral Properties
Table Top Gold Project (Nevada)
Nature of Interest and Terms of Acquisition
This property consists of 58 claims covering approximately 1,160 acres located in Humboldt County, Nevada 10 miles west of the town of Winnemucca (the “Table Top Project”).
We hold our interest in this Property under an Option Agreement dated for reference September 1, 2009 with Energex, LLC, a Nevada corporation wholly-owned by Clancy J. Wendt, our Vice President of Exploration. Under the terms of the agreement, we have an option (the “Table Top Option”) to acquire a 100% interest in the Table Top Gold Project for the sum of US$300,000 (the “Table Top Purchase Price”) and a 3% NSR Royalty, 1% of which can be repurchased for US$1 million. We are required to make the following rental payments (the “Table Top Rental Payments”) are required in order to maintain the Option in good standing:
| Date | Payment Amount
(USD) |
| Upon execution of the Agreement (September 1, 2009) | $5,000 (paid) |
| On the First anniversary of the Agreement (September 1, 2010) | $25,000 (deferred) |
| On the Second anniversary of the Agreement (September 1, 2011) | $35,000 (deferred) |
| Each anniversary thereafter | $50,000 |
The option may be exercised at any time by payment of the Table Top Purchase Price, whereupon we will own 100% of the Property, subject to a 3% NSR royalty, 1% of which can be repurchased for US$1 million (the “Table Top Royalty”). We are required to make minimum annual advance royalty payments of US$50,000 after exercise of the Table Top Option until commencement of sustained commercial production, with such payments being credited against the Table Top Royalty. Rental Payments are not credited against the Table Top Royalty or the Table Top Purchase Price, but cease to be payable after the Table Top Option is exercised.
Description, Location and Access:
Table Top consists of 58 claims covering 1,160 acres all of which are located in Humboldt County, Nevada 10 miles northwest of the town of Winnemucca.. The property was originally comprised of the CJN 1-10 unpatented lode mining claims in section 10, T. 35 N., R. 36 E. Humboldt County, Nevada, under Nevada Mining Claim BLM Numbers NMC 0998450-0998459 inclusive. We subsequently staked 48 additional claims and now hold the following claims:
| Name of Claims | BLM Serial Nos |
| | |
| CJN 1-10 | NMC 0998450-0998459 |
| CJN 19-26 | NMC 1009744-1009751 |
| CJN 28 | NMC 1009753 |
| CJN 30 | NMC 1009755 |
| CJN 32 | NMC 1009757 |
| CJN 34 | NMC 1009759 |
| CJN 36 | NMC 1009761 |
| MXR 1-6 | NMC 1017713-1017718 |
| MXR 19-24 | NMC 1017731-1017736 |
| MXR 116-138 | NMC 1017828-1017850 |
The property is accessible from Interstate Highway 80 to within 1 mile of the property and by gravel road to the property itself.
There is no water or electricity available at the property site, with no surface water available within the property boundaries.
The following map indicates the location of the Table Top Project in Nevada
History of Exploration and Status:
The Table Top Project is located along the Kings River Rift, a regional geologic feature that appears to control mineralization in the area and which hosts multiple high grade vein-related gold systems.
During the 1980’s Gold Fields, Meridian Minerals and Sante Fe Mining conducted exploration on and around the Table Top Project. A limited exploration program consisting of only ten reverse circulation drill holes was conducted to test anomalous, up to 1.1 g/t gold values in what was called jasperoid. Trenches containing gold values up to 4 g/t over 5 feet were tested by the first drill hole, which contained 55 feet of 0.84 g/t Au (0.027 opt) from the surface down. This hole was drilled vertically in a breccias zone. The remaining nine drill holes, which were wide spaced (75 – 300 meters apart), contained little of significance. A follow up analysis showed that the holes may have been drilled in the wrong direction and should have been drilled to the south instead of to the north.
The Table Top Project is located in the Triassic rocks of the Raspberry formation which can be split into two general types: a north-western belt of sandstone, siltstone, and slate, locally calcareous but devoid of limestone; and a south-eastern belt of calcareous sandstone, siltstone and slate with prominent massive limestone beds 5 to 100 feet thick. Bedding in these units trend northeast with steep dips to the southeast.
The mineralization in the Raspberry formation is generally in the form of silicification in veinlets and small pods in the limestone but in a few areas there is massive replacement of the limestone by silica. The silica, where sampled, usually contains gold with values as high as 15.5 g/t. Stibnite or stibnite casts can be found in the silica.
In April 2010 we conducted a 15 hole drill program at Table Top, drilling a total of 660 meters (2,156 feet). Of fifteen holes drilled, ten intersected the mineralized structure and contained gold mineralization, including 27.4 meters of 0.467 g/t Au and 3 meters of 1.79 g/t gold. The zone of mineralization continues for the entire length and is open to the northeast and southwest. Gold mineralization also appears to increase in value as deeper zones are intersected.
In addition to the 15 holes completed at The Table Top Project, three trenches were dug and sampled near the original drill hole reported by Gold Fields Mining Company that contained 50 feet of 0.027 opt Au. The current core holes were drilled to be perpendicular to the strike of the mineralized zone and across mineralization which is hosted in a silicified tectonic breccia.
All significant gold assays are listed below:
| Hole | Angle | From (m) | To (m) | Width (m) | Gold (g/t) |
| MT 1 | -45 degrees | 6.09 | 12.2 | 6.11 | 0.749 |
| Including | | 9.1 | 10.7 | 1.6 | 1.436 |
| MT 2 | -60 degrees | 12.2 | 39.6 | 27.4 | 0.467 |
| Including | | 27.4 | 35.0 | 7.6 | 0.760 |
| MT 4 | -45 degrees | 16.7 | 22.8 | 6.1 | 0.614 |
| Including | | 18.3 | 21.3 | 3.0 | 0.783 |
| MT 5 | -75 degrees | 21.3 | 25.9 | 4.6 | 0.396 |
| Including | | 24.4 | 25.9 | 1.5 | 0.794 |
| MT 6 | -60 degrees | 16.8 | 21.3 | 4.5 | 0.545 |
| Including | | 18.3 | 19.8 | 1.5 | 1.27 |
| MT 7 | - 75 degrees | 22.9 | 24.4 | 1.5 | 0.734 |
| MT 8 | -45 degrees | 10.7 | 18.3 | 7.6 | 0.664 |
| Including | | 15.3 | 16.8 | 1.5 | 1.290 |
| MT 9 | - 75 degrees | 28.9 | 30.4 | 1.5 | 0.451 |
| MT 11 | -45 degrees | 18.3 | 19.8 | 1.5 | 0.558 |
| MT 12 | - 75 degrees | 32.0 | 35.0 | 3.0 | 1.79 |
| Including | | 32.0 | 33.5 | 1.5 | 2.562 |
The drill results at the Table Top Project indicate that MAX may have found a potential mineralized feeder similar to a Carlin Type gold system. Multi-element geochemical values of arsenic, antimony and mercury are all extremely elevated with respect to background; numerous 1.5 m intercepts exceed 100 ppm arsenic and antimony, with thallium values in excess of 10 ppm. All of these elevated values are directly associated with elevated (in excess of 100 ppb and as high as 2,562 ppb) gold values. Silver, tellurium, selenium and base metal values are all low. Geologic interpretation indicates the zone is a 20 meter to 30 meter wide, northeast striking and southeast dipping structural zone. Gold and associated trace element mineralization is associated in and surrounding a silicified breccia (jasperoid). Low grade gold mineralization associated with high grade trace elements is often found to occur in Carlin style gold feeder systems, as have lamprophyre dikes that have also been identified in this zone. Lamprophyres are often found in Carlin systems and are indicative of deep seated structures where high grade gold deposits have been found in the recent past at Carlin systems (such as Meikle and Deep Star). These deep targets were tested during drilling conducted in September, 2010.
During the September program, two holes were drilled to test the down dip extension of the mineralized structure intersected in its earlier program to a new depth in the 250-1000 foot (76.2 – 304.8 meters) zone. The drilling intersected the previous mineralized structures in both drill holes and confirms that the mineralization extends to depth.
Hole | Angle | Total Depth
(m) | From (m) | To (m) | Width (m) | Gold (g/t) |
| | | | | | | |
| MT 14 | -70 degrees | 120.4 | 73.1 | 79.2 | 6.1 | 0.53 |
| | | | 100.6 | 108.2 | 7.6 | 0.13 |
| MT 15 | -85 degrees | 324.5 | 227.0 | 239.2 | 12.1 | 0.91 |
| | Including | | 230.1 | 239.2 | 9.1 | 1.09 |
Hole MT-15 was drilled to a final depth of 1064.5 feet (324.5 m). There is a very anomalous zone, greater than 97 ppb, from 630 feet to 740 feet in rocks that appear to be very permissive for mineralization. This zone has not been seen at the surface and opens an additional area for exploration. Drilling was resumed in March, 2011 targeting the mineralized system down dip and along strike, exploring for higher grade gold within the sedimentary (stibnite and calcite bearing carbonate rocks) package.
A total of six holes (497 meters) were drilled at Table Top during April 2011, with all holes intersecting gold mineralization in excess of 100 ppb Au Highlights included drill hole MT-18, which intersected 9.6 m of 1.04 g/t Au starting at a down hole depth of 42.7 m. Holes MT-16, 17 and 18 intersected multiple intervals of gold mineralization exceeding 100 ppb. These latter results indicate that gold mineralization is not confined to a single zone; MT-17 had four mineralized zones. Mineralization has now been identified over a 500 meter strike length and is still open in both directions. The only drill holes that missed the mineralized zone were found to have been drilled over the top of the system.
We drilled 5 holes to the northeast of the mineralized structure intersected during drilling in 2010 to test its extension and confirmed that the mineralized zone extends at least another 89.9 m northeast of previous drilling. Drilling intersected the previously identified mineralized structures in four of five drill holes, with thicknesses comparable to what was earlier recognized. The sixth hole was drilled 155.1 m southwest of last year’s drilling to follow-up on 1+ g/t Au surface samples.
Summary of gold intercepts in drill holes MT-16 through MT-21 (cutoff at 0.1 g/t).
| Hole | Angle | From (m) | To (m) | Thickness (m) | Grade (Au g/t) |
| | | | | | |
| MT-16 | -44 | 19.81 | 21.34 | 1.53 | 0.22 |
| MT-17 | -45 | 27.43 | 28.96 | 1.53 | 0.14 |
| MT-17 | -45 | 32.16 | 33.07 | 0.91 | 0.19 |
| MT-17 | -45 | 33.07 | 35.66 | 2.59 | 0.80 |
| MT-17 | -45 | 35.66 | 38.10 | 2.44 | 0.18 |
| MT-17 | -45 | 39.62 | 41.15 | 1.53 | 0.18 |
| MT-17 | -45 | 42.67 | 43.95 | 1.28 | 0.26 |
| MT-18 | -70 | 38.10 | 39.62 | 1.52 | 0.13 |
| MT-18 | -70 | 42.67 | 52.27 | 9.60 | 1.04 |
| MT-19 | -58 | 67.06 | 68.12 | 1.06 | 0.29 |
| MT-19 | -58 | 109.73 | 111.25 | 1.52 | 1.48 |
| MT-20 | -45 | 23.20 | 24.38 | 1.18 | 0.23 |
| MT-20 | -45 | 46.82 | 49.99 | 3.17 | 0.83 |
| MT-20 | -45 | 82.51 | 83.82 | 1.31 | 0.10 |
| MT-21 | -45 | 33.22 | 38.10 | 4.88 | 0.42 |
The 2011 drill program confirms that previous interpretations are still valid regarding the occurrence of gold mineralization at The Table Top Project. Gold mineralization continues both northeast and southwest of the previous drilling and remains roughly the same in grade and tenor. One of the best intersects thus far was found in hole MT-18, with 1.3 m grading 2.33 g/t at 44.20 meters down hole. It appears that grades, if not the thickness of mineralized zones, increase with depth.
MAX is currently reviewing the 2010 and 2011 exploration data along with data from prior operators with a view to better understanding the mineralized system at The Table Top Project prior to further drilling. We believe that a viable target still exists along strike to the northeast and southwest and down dip where the vertically standing outcrops bend, creating a zone of structural preparation.
During the year ended December 31, 2011, the Company incurred consulting fees of $27,139, field expenses of $13,999 and drilling and assay costs of $109,682 at the Table Top Project.
Maintaining the claims in good standing in Nevada:
Under Bureau of Land Management rules for the State of Nevada, all holders of State mining locations must pay an annual maintenance fee of US$140 per claim or site by August 31 in each calendar year. These amounts were paid when due prior to August 31, 2011
East Manhattan Wash Gold Project (Nye County, Nevada)
Nature of Interest and Terms of Acquisition
The East Manhattan Wash property (“EMW”) is comprised of 78 claims located 40 miles north of the town of Tonopah, Nevada in the Manhattan Mining District, Nye County, Nevada.
On November 11, 2007 as amended December 4, 2008 and December 21, 2010, we entered into an option agreement to acquire a 100 % interest in the EMW claims in the Manhattan Mining District, Nye County, Nevada from MSM LLC, a Nevada corporation.
Under the terms of the option agreement we are required to make payments to MSM LLC in order to maintain the option in good standing, as follows:
| DATE | PAYMENT AMOUNT |
| Upon execution of the Option Agreement | $28,000 USD (paid) |
| First anniversary of effective date (December 4, 2008) | $20,000 USD (paid) |
| Second anniversary of effective date (December 4, 2009) | $25,000 USD (paid) |
| Third anniversary of effective date (December 4, 2010) | $40,000 USD (paid) |
| Fourth anniversary of effective date (December 4, 2011) | $50,000 USD (deferred, subject to receipt of drill permit) |
| Fifth anniversary of effective date (December 4, 2012) | $100,000 USD |
The payments due on the fourth and fifth anniversary are subject to securing a drill permit.
In addition we are required to make exploration expenditures totalling US$700,000 on the EMW claims in the second to fifth years, subject to securing a drill permit, as follows:
| DATE | EXPENDITURE REQUIRED |
| On or before December 4, 2009 | $50,000 USD (fulfilled) |
| On or before December 4, 2010 | Further $150,000 USD (deferred, subject to receipt of drill permit) |
| On or before December 4, 2011 | Further $200,000 USD (deferred, subject to receipt of drill permit) |
| On or before December 4, 2012 | Further $300,000 USD |
EMW is subject to a 3% NSR royalty. Upon full exercise of the option, we will own 100% of the project.
Description, Location and Access:
The EMW property is comprised of 78 claims (1,560 acres) located 40 miles north of the town of Tonopah, Nevada. The EMW claims are accessible by paved road to within 1 mile of the property and by gravel road to the property itself.
There is no water or electricity available at the property site, with no surface water available within the property boundaries. The property is comprised of the following claims:
| Name of Claims | BLM Serial No’s |
| | |
| EMW 1-18 | NMC 958691-958708 |
| EMW 27 | NMC 958717 |
| EMW 29 | NMC 958719 |
| EMW 31-35 | NMC 958721-958725 |
| EMW 37 | NMC 977041 |
| EMW 39 | NMC 977042 |
| EMW 41 | NMC 977043 |
| EMW 43-68 | NMC 977044-977069 |
| EMW 75 | NMC 977070 |
| EMW 77 | NMC 977071 |
| EMW 79 | NMC 977072 |
| EMW 81-100 | NMC 977073-977092 |
| EMW 113 | NMC 977093 |
The following is a map of the location of EMW:
History of Exploration and Status:
Historically, there has been more than 1,000,000 ounces of gold produced in the Manhattan mining district. Production has included the nearby Manhattan mine (1974-1990), an open-pit operation that produced 236,000 ounces of gold at an average grade of 0.08 ounces per ton (“opt”). The Echo Bay East and West Pit deposits operated in the early 1990s, producing 260,000 ounces at an average grade of 0.06 opt. The Round Mountain Mine (Kinross/Barrick), situated eight miles north of EMW, is a conventional open pit operation that has produced more than 12 million ounces of gold to date. Recorded placer gold production from the district totals approximately 150,000 ounces from a major dredge operation and small-scale lode mines produced another 100,000 ounces.
The current exploration model suggests that deposits that will be found in the Manhattan District are related to the contact of the Manhattan Caldera Margin and structural intersections. Gold is also related to the Cambrian-Ordivician Age Sedimentary rocks along the five mile long by one mile wide zone of the Caldera. What is unique to this occurrence is that it is related to a lithic welded volcanic tuff. More work is planned to determine how this mineralization is related to the overall normal mineralized gold system in the Manhattan District. So far, it appears to be quite different and may be quite extensive.
In March 2009, we received the results of the first bulk sample taken from the EMW. The sample weighed 793 pounds and was crushed to particles of less than 1 mm in size, then processed on a Wilfley Table to concentrate the heavy minerals. A fired bead produced a gold/silver “button” which weighed 2.67 grams. This button was analyzed using x-ray analyzer and contained approximately 80% gold and 20% silver. This is equivalent to 6.1 grams per ton of gold/silver, or 4.9 g/t of gold and 1.2 g/t of silver.
In May of 2009, three large volume soil sampling grids were completed. The “”Gold Pit Grid”, consists of 30 soil samples of 25 meter spacing over an area of approximately 800 by 200 feet. The original bulk taken from an existing prospector’s pit on this grid graded at 4.9 g/t gold and 1.2 g/t silver. The geology of the Gold Pit area consists of lithic rhyolitic and lapilli tuffs. These tuffs are locally argillically altered with minor local silicification.
The “Old Drill Hole Grid” consists of 58 soil samples taken from an area covering approximately 900 feet by 400 feet which has been drilled by a previous operator. As with the Gold Pit Grid described above, this grid is located in a volcanic rhyolite lithic tuff hosting coarse gold.
The “Gold Shaft Grid” consists of 30 soil samples on 25 meter spacing over an area of approximately 500 feet by 400 feet, with a single line running west from the main part of the grid along a ridge. This grid is approximately 7,000 feet south of the Gold Pit grid with the geology of the area consisting of high angle, east striking altered inter-bedded phyllites,
quartzites and limestones, cut by high angle, northeast striking structures. The sediments are in contact with granite to the west.
The “Gold Pit” and The “Old Dill Hole” grids were sampled first by clearing a 1 meter by 1 meter area of surface debris, and then removing the organic (A) and root (B) soil horizon. The sample was collected and consisted of a mixture of soils directly above the bedrock (C horizon) and a portion of the bedrock below the soil. The sample was sieved to ¼ inch minus and bagged. The holes ranged from 12 inches to 48 inches in depth. The “Gold Shaft” holes ranged from 4 inches to 12 inches in depth. The sampling program was designed to delineate the geometry of the native gold mineralization in these areas.
Assay results from these samplings were received in July 2009.
In the Old Drill Hole grid, where 30 samples were taken, the values ranged from nil to 0.32 ppm Au. The mineralized zone is 1200 feet long and 600 feet wide and is open in all four directions. Further work is now planned to define the full areal extent of mineralization in this zone. At the Gold Pit grid the area of significant mineralization was 1000 feet long and 250 feet wide. Again values range from nil to 0.32 ppm Au. The zone is open to the north, east and west and further work is planned for this area, which contains the old prospector’s pit where samplings graded an equivalent of 4.9 g/t Au. The Gold Shaft grid samples did not indicate a mineralized structure or an area of concentrated gold. No real anomalous values of other trace elements were observed. Outcrop samples of silicified zones will be sampled at a later date.
In November 2009, additional assay results from a total of 138 samples were received from ALS Chemex Laboratory Group in Reno, Nevada relating to the two main areas of interest, the Gold Pit Grid and the Old Drill Hole Grid, which samples now indicate are joined. The sample holes ranged from 12 inches to 48 inches in depth. Significant values ranging from 0.05 ppm to 1.5 ppm Au were identified. Results of samples taken from historic prospector pits to the southeast of the Old Drill Hole grid returned high gold values (0.96 g/t) which indicates that the mineralized zone continues and may be linked to another mineralized zone sampled by us further south.
In September 2010 we completed additional soil sampling at EMW that was designed to further delineate the geometry of the native gold mineralization at EMW, which previously encompassed the “Gold Pit”, the “Old Drill Hole Grid” and now includes the “Southeast Extension”. This sampling has filled in the open areas within these grids, where 163 new samples were taken with significant values ranging from 0.05 ppm to 1.27 ppm (1.27 g/t) gold. While the total mineralized zone now exposed at surface encompasses an area in excess of 5,500 by 1,500 feet in size, the mineralized area is much larger but is covered by either overburden or alluvium.
The Gold Pit, Old Drill Hole Grid and Southeast Extension are located in a volcanic rhyolite lithic tuff hosting coarse gold. The sampling between the three pits has now enabled MAX to identify structural linear features seen in air photo images along with argillic alteration that appears to define where strong gold values may be found. Historic pits dug by earlier prospectors have helped to define the areas of mineralization and to confirm the presence of gold. Permitting is now underway for a core drilling program to determine the depth of the mineralization, extend the known mineralization below cover, and to see if it increases in grade. See “Special Note on Forward Looking Statements”.
During the year ended December 31, 2011, MAX spent $6,045 on geological consulting and $282 on field expenses at the EMW claims.
Maintaining the claims in good standing in Nevada:
Under Bureau of Land Management rules for the State of Nevada, all holders of State mining locations must pay an annual maintenance fee of US$140 per claim or site by August 31 in each calendar year. These amounts were paid when due prior to August 31, 2011
Howell /Crowsnest Gold Project (British Columbia):
Due to a change in policy by the Government of British Columbia resulting in a moratorium on exploration in the area, we ceased exploration on this property and were reimbursed our out-of-pocket exploration expenses totaling $655,306 by the Province of British Columbia in March 2012 and relinquished our interest in the property.
Nature of Interest and Terms of Acquisition
The Howell /Crowsnest Gold project is comprised of the Howell property, located one hour south of the town of Sparwood (by gravel road) in Southeast B.C., and the Crowsnest Property, which is located approximately 10 km southeast of the Howell property.
We acquired our interest in the Howell Gold/Crowsnest Project pursuant to an option agreement dated for reference June 9, 2008, as amended July 24, 2009. Under the terms of the agreement, as amended, we have the right to earn a 60% interest in the Howell Property and/or the Crowsnest Property projects over a four year period (the “Howell Crowsnest Options”). Eastfield has the right to earn a 100% interest in the Howell property through an amended 1999 option agreement with TCML and GI by completing outstanding commitments include a final exploration expenditure totaling $423,759 and cash payments of $100,000 to each of TCML and GI due by August 31, 2010. Eastfield holds the Crowsnest Property directly.
Under the terms of our option agreement (as amended), we were required to make the following payments and share issuances to Eastfield in order to keep the Howell/Crowsnest Option in good standing:
| Property | Date | Cash
Payment
Amount | Issuance of Shares |
| | | | |
| Combined Howell Property & Crowsnest Property | On signing amending agreement (July 24, 2009) | $10,000 (paid) | |
| | On signing amending agreement (July 24, 2009) | | 50,000 common shares (Issued) |
| | On or before 1st anniversary date (June 30, 2010) | $20,000 | OR 50,000 common shares |
| | On or before June 30, 2011 | $30,000 | |
| Howell Property | On or before August 31, 2010 | $120,000 | |
| Howell Property | On or before June 30, 2012 | $40,000 | 200,000 Common shares |
| Crowsnest Property | On or before June 30, 2012 | $40,000 | 200,000 Common shares |
| Howell Property | On or before June 30, 2013 | $50,000 | 200,000 Common shares |
| Crowsnest Property | On or before June 30, 2013 | $50,000 | 200,000 Common shares |
| | | | |
*our portion of the $200,000 payment due to GI and TCML by August 31, 2010 pursuant to Eastfield’s underlying agreement with them.
In addition we are required under the agreement to make exploration expenditures as follows:
In the first and second years, $400,000 on the combined Howell and Crowsnest properties as follows:
| | ● | on or before June 30, 2010, $150,000; (completed) |
| | ● | on or before June 30, 2011, a further $250,000; |
In the third and fourth years, $701,000 on the Howell Property as follows:
| | ● | on or before June 30, 2012, $1.00 |
| | ● | on or before June 30, 2013, a further $700,000 |
In the third and fourth years, $1,050,000 on the Crowsnest Property as follows:
| | ● | on or before June 30, 2012 $350,000 |
| | ● | on or before June 30, 2013, a further $700,000. |
Howell Property
The Howell Property is comprised of 4,760 hectares in Southeast B.C. located one hour by gravel road south of the town of Sparwood, straddling the drainages of Twenty-Nine Mile Creek and Howell Creek. The property is 40 kilometers south of the Elk Valley Coal Mine and can be accessed via all-weather logging haul roads and secondary logging roads that cut through the middle of the property.
There is no electricity available at the property site, with surface water abundant within the property boundaries.
The following map indicates the location of the Howell Property in Southeastern British Columbia:
All Howell claims are in the Fort Steele Mining Division of British Columbia. The claim numbers are as follows:
| Claim Name | Record # | Area (Hectares) | Expiry Month | Expiry Year |
| | | | | |
| Howell 1 | 209981 | 500 | 1-Nov | 2011 |
| Howell 2 | 209982 | 500 | 1-Nov | 2011 |
| Howell 3 | 209983 | 500 | 1-Nov | 2011 |
| Howell 4 | 210011 | 500 | 1-Nov | 2010 |
| Howell 5 | 210012 | 200 | 1-Nov | 2010 |
| Ysoo | 366755 | 450 | 1-Nov | 2010 |
| Ysoo 2 | 537475 | 528 | 20-Jul | 2010 |
| Ysoo 3 | 537488 | 127 | 20-Jul | 2010 |
| Howell 6 | 530467 | 527 | 24-Mar | 2010 |
| Howell 7 | 530473 | 527 | 24-Mar | 2010 |
| Howell 9 | 537493 | 401 | 20-Jul | 2010 |
| | | 4,760 | | |
Maintaining the claims in good standing in British Columbia:
The Province of British Columbia requires that exploration work in the amount of $4.00 per hectare per year be completed on a claim in the first three years of a claim’s existence. The amount of assessment work required to keep the claims in good stead increases to $8.00 per hectare per year after the third anniversary. An equal amount of cash may be paid in substitution to exploration expenditures (cash in lieu). Excess expenditures incurred in any year can be filed up to an amount that moves the expiry date ten years into the future. A filing fee of $0.40 per hectare per year is also required.
The majority of the Howell Property are now past their 3rd anniversary and the amount of exploration required to advance the expiry dates of all the Howell claims by one year is $38,080 plus a filing fee of $1,904. The Howell Property currently has assessment work credits filed on it which satisfies British Columbia requirements for varying expiry dates by claim during2010 and 2011 in accordance with the expiry dates listed in the preceding table.
History of Exploration and Status:
The Howell Project is underlain by a thick sequence of Paleozoic limestones and sedimentary rocks and older Proterozoic sediments. Mid-Cretaceous intrusions occurring as sills, dykes, plugs and diatremes intrude these units. Gold mineralization occurs disseminated in limestone and with quartz stockworks in syenite intrusives and Proterozoic sediments. Prior drilling has included 1.23 g/t gold over 58 metres, 0.95 g/t gold over 39 metres, 0.65 g/t gold over 82 metres, and 0.57 g/t gold over 149 metres. A diamond drill hole from 2006, collared to the west of the surface expression of the important Palaeozoic limestone, penetrated a near surface fault and intersected 43 metres grading 0.42 g/t gold to the bottom of the hole at 66 metres. Hole HW-606 effectively expands the prospective area for the target model. The last
sample in this hole graded 0.44 g/t gold indicating a need to drill deeper and test the target along strike; the first hole of the 2008 drill program will deepen this hole to approximately 200 metres.
Prior exploration at the Howell Property has included 6,197 metres of drilling in 49 holes. Several holes have also intersected significant “manto style” silver-lead-zinc intercepts in limestone. These include 15.3 g/t silver , 0.40% lead and 2.40% zinc over 7.5 metres and 51.5 g/t silver, 1.98% lead, 1.87% zinc, and 0.32 g/t gold over 7.6 metres. An important additional target which will be tested during the 2008 drill program is Carbonate Replacement Deposit (“CRD”) style mineralization in the general vicinity of hole HRC-15 (located 1,100 metres to the west of the first hole of the current program), drilled by Placer Dome Inc. in 1988, which intersected 7.6 metres grading 51.5 g/t silver, 1.98% lead, 1.87% zinc, and 0.32 g/t gold. This CRD style mineralization has not been actively explored at Howell during past exploration efforts.
Drilling commenced at the Howell Property on July 21, 2008. Twelve diamond drill holes were completed totaling 1,312 metres of NQ core and two new soil grids were established. Two distinct styles of mineralization were targeted; carbonate hosted gold and CRD.
The highlights of the 2008 drill program were as follows:
| Hole | From (m) | To (m) | Width (m) | Gold g/t |
| HW-08-06 ext | 23.7 | 204.0 | 180.7 | 0.26 |
| Including | 23.7 | 74.0 | 50.7 | 0.47 |
| HW-08-07 | 88.1 | 92.0 | 3.9 | 0.65 |
| And | 132.0 | 138.0 | 6.0 | 0.53 |
| HW-08-09 | 8.5 | 129.0 | 120.5 | 0.30 |
| Including | 8.5 | 30.5 | 22.0 | 0.78 |
| HW-08-10 | 8.0 | 10.0 | 2.0 | 0.79 |
| HW-08-15 | 23.3 | 68.0 | 44.7 | 0.41 |
| Including | 23.3 | 44.0 | 20.7 | 0.53 |
No CRD mineralization was identified in drill core during the 2008 drill program although one of the soil grids (the southeastern grid) is believed to indicate such mineralization with a number of samples collected in 2008 returning very anomalous values in gold, silver, zinc and lead including values to 130 g/t silver and 1.4% lead in soil. Holes HW-08-12 and HW-08-13 were drilled during the current program to test for CRD mineralization in the area where reverse circulation hole HRC-15, drilled by Placer Dome in 1988, had intersected 7.6 metres of apparent CRD mineralized dolomite grading 1.5% zinc, 1.4% lead, and 53.2 g/t silver. Holes HW-08-12 and HW-08-13 were lost at 35 and 86 metres respectively, which was well short of the target depth, due to drilling difficulties.
A number of additional targets exist at the Howell Property including a stockwork quartz system in limestone that has returned up to 3 grams gold in previous sampling and will be considered for further work in 2009. Of the 119 samples collected in 2008 on the southeastern grid, which is 1.5 kilometres to the south of the 2008 CRD drill targets, 16 exceeded 100 ppm gold (maximum 714 ppb), 27 exceeded 500 ppm zinc (maximum 9,527 ppm) and 9 exceeded 400 ppm lead (maximum 14,000 ppm). The southeastern grid was established in 2008 to fill in an area to the north of manto style zinc, lead, silver mineralization which was identified during reverse circulation drilling completed by Placer Dome in 1988 (HRC-2 with 7.5 metres grading 2.4% Zn, 0.40% Pb and 15.3 g/t Ag). Reconnaissance prospecting in this area, completed by Eastfield in 1999, sampled a 300 metre northeast trending syenite intrusive that returned a value of 2.75 grams gold from the single sample collected. Review of a subsequent airborne geophysical survey completed in 2004 highlighted this feature.
Crowsnest Property
The Crowsnest Property is comprised of 3,269 hectares in Southeast B.C. located one and one half hours by gravel road south of the town of Sparwood, and is located approximately 10 km southeast of the Howell Property. The property can be accessed via all-weather logging haul roads and secondary logging roads that cut through the middle of the property.
There is no electricity available at the property site, with surface water abundant within the property boundaries.
The following map indicates the location of the Crowsnest Property in Southeastern British Columbia:
All Crowsnest Property claims are in the Fort Steele Mining Division of British Columbia. The claim numbers are as follows:
| Claim Name | Record # | Area
(Hectares) | Expiry
Month | Expiry
Year |
| Aubyrd 4 | 406552 | 375 | October 31 | 2012 |
| Aubyrd 5 | 406551 | 500 | October 31 | 2012 |
| Aubyrd 6 | 406550 | 500 | October 31 | 2012 |
| Aubyrd 7 | 406553 | 250 | October 31 | 2012 |
| Aubyrd 8 | 406554 | 150 | October 31 | 2012 |
| Aubyrd 9 | 406555 | 500 | October 31 | 2012 |
| Crowsnest Lookout | 504310 | 317 | January 19 | 2012 |
| Crowsnest Revenge | 504297 | 85 | January 19 | 2012 |
| Connector | 517530 | 127 | July 12 | 2012 |
| Lower Connector | 520838 | 63 | October 6 | 2010 |
| Connector | 631166 | 275 | September 9 | 2012 |
| Crowhop | 596987 | 105.7 | January 5 | 2012 |
| Hole In One | 601795 | 21.1 | March 28 | 2012 |
| TOTAL AREA | | 3,269 hectares | | |
Maintaining the claims in good standing in British Columbia:
The Crowsnest Property consists of thirteen claims totaling 3,269 hectares. All claims have sufficient assessment work filed to cover the claims until 2012. The Province of British Columbia requires that exploration work in the amount of $4.00 per hectare per year be completed on a claim in the first three years of a claim’s existence. The amount of assessment work required to keep the claims in good stead increases to $8.00 per hectare per year after the third anniversary. An equal amount of cash may be paid in substitution to exploration expenditures (cash in lieu). Excess expenditures incurred in any year can be filed up to an amount that moves the expiry date ten years into the future. A filing fee of $0.40 per hectare per year is also required. Most of the Crowsnest claims are past their third year and consequently an exploration expenditure of $12,152 plus a filing fee of $1,307.60 is required to advance the dates for each year beyond 2012.
History of Exploration and Status:
Gold mineralization of the Crowsnest Property occurs in limestone, siltstone or syenite. The property is underlain by a thick sequence of Pennsylvanian and Mississippian carbonate and clastic rocks, of which the Mississippian Rundle Group shows the greatest exposure. Mid-Cretaceous syenite and trachyte intrusions as sills, dykes, plugs and possible diatremes intrude these units.
Prior exploration at the Crowsnest Property has included many samples of float and rubble on the “B” Grid which has returned extraordinarily high gold analysis. This includes a float sample collected in 1989 by Placer Dome Inc. in, which is described as an intrusive breccias that returned a gold assay of 524.41 g/t gold ≈ 15.2 ounces per ton. Other high grade float samples have returned assays to 620.0 g/t gold ≈ 18.0 ounces per ton.
We conducted a due diligence site visit at the Crowsnest Property to review previous field work and to assess the potential of the property in June 2009.
An exploration permit was issued in August 2009 which allowed us to move forward with our 2009 drill program at the Crowsnest Property. This drill program included a total of 26 reverse circulation drill holes and two new trenches. The trenches were sampled and drilled to the west of the original Discovery Trench area.
Significant gold assays returned from the 2009 drill program were as follows:
| Hole | Angle | From (m) | To (m) | Width (m) | Gold g/t |
| RC 09-2 | -60 | 0 | 3.0 | 3.0 | 3.52 |
| Including | | 0 | 1.5 | 1.5 | 6.67 |
| RC 09-5 | Vertical | 0 | 3.0 | 3.0 | 3.55 |
| Including | | 1.5 | 3.0 | 1.5 | 6.40 |
| Hole | Angle | From (m) | To (m) | Width (m) | Gold g/t |
| RC 09-6 | -60 | 0 | 6.5 | 6.5 | 6.34 |
| Including | | 1.5 | 3.0 | 1.5 | 16.52 |
| RC 09-7 | Vertical | 0 | 6.1 | 6.1 | 19.03 |
| Including | | 0 | 1.5 | 1.5 | 50.26 |
| Including | | 1.5 | 3.0 | 1.5 | 23.60 |
| RC 09-9 | Vertical | 0 | 1.5 | 1.5 | 2.49 |
| RC 09-14 | Vertical | 0 | 1.5 | 1.5 | 2.07 |
| RC 09-16 | Vertical | 0 | 3.0 | 3.0 | 5.42 |
| Including | | 0 | 1.5 | 1.5 | 6.65 |
| RC 09-21 | -60 | 16.8 | 18.3 | 1.5 | 3.42 |
| RC 09-25 | Vertical | 0 | 3.0 | 3.0 | 2.51 |
| Including | | 1.5 | 3.0 | 1.5 | 3.14 |
In December 2009 we received the results of the Metallic Screen assays conducted by Acme on all samples from our reverse circulation drill program at the Crowsnest Property. Our previously reported findings were verified by this assay, including those from hole RC 09-7 (19.03 g/t Au over 6.1 m., including 1.5 m. of 50.26 g/t Au). Significant gold assays (over 2 g/t Au) are listed below:
| Hole | Angle | From (m) | To (m) | Width (m) | Gold g/t |
| RC 09-2 | -60 degrees | 0 | 3.0 | 3.0 | 3.52 |
| Including | | 0 | 1.5 | 1.5 | 6.67 |
| RC 09-5 | vertical | 0 | 3.0 | 3.0 | 3.55 |
| Including | | 1.5 | 3.0 | 1.5 | 6.40 |
| RC 09-6 | -60 degrees | 0 | 6.5 | 6.5 | 6.34 |
| Including | | 1.5 | 3.0 | 1.5 | 16.52 |
| RC 09-7 | vertical | 0 | 6.1 | 6.1 | 19.03 |
| Including | | 0 | 1.5 | 1.5 | 50.26 |
| Including | | 1.5 | 3.0 | 1.5 | 23.60 |
| RC 09-9 | vertical | 0 | 1.5 | 1.5 | 2.49 |
| RC 09-14 | vertical | 0 | 1.5 | 1.5 | 2.07 |
| RC 09-16 | vertical | 0 | 3.0 | 3.0 | 5.42 |
| Including | | 0 | 1.5 | 1.5 | 6.65 |
| RC 09-21 | -60 degrees | 16.8 | 18.3 | 1.5 | 3.42 |
| RC 09-25 | vertical | 0 | 3.0 | 3.0 | 2.51 |
| Including | | 1.5 | 3.0 | 1.5 | 3.14 |
An additional 6 drill holes returned values ranging from 0.5 g/t to 1.86 g/t Au over minimum 1.5 meter intervals. In addition, we had planned to conduct an extensive exploration program during 2010, to extend the area of high grade mineralization at the Crowsnest Property with new targets identified and a review of historic data, however, on February 9, 2010 the Government of the Province of British Columbia announced that it intended to halt all ongoing exploration work and prohibit any future mine development in the Flathead Valley in southeastern British Columbia where the Howell and Crowsnest properties are located. Accordingly, we will not be able to conduct any further exploration or development work on the property nor will we be able to sell our interest in the property to third parties. As a result, in March, 2012 we relinquished our interest in the Howell and Crowsnest properties in exchange for re-imbursement of our out-of-pocket expenses totally $655,306 by the Province of British Columbia.
Ravin Molybdenum/ Tungsten Property (Lander County, Nevada)
Nature of Interest and Terms of Acquisition
The Ravin molybdenum/tungsten property in Lander County, Nevada (the “Ravin Property”) is comprised of 50 claims located 20 miles north of the town of Austin in Central Nevada. We acquired our interest in this property by agreement dated for reference September 10, 2007, as amended November 9, 2010, with Energex, LLC, a Nevada corporation wholly-owned by Clancy J. Wendt, our Vice President of Exploration granting us an option to acquire a 100 % interest in the Ravin Property for the sum of US$300,000 (the “Ravin Option”).
The following rental payments (the “Ravin Rental Payments”) are required in order to maintain the Ravin Option:
| Date | Payment Amount |
| Upon execution of the option agreement | $5,000 USD (paid) |
| First anniversary of effective date (September 10, 2008) | $25,000 USD (paid) |
| Second anniversary of effective date (September 10, 2009) | $35,000 USD (paid) |
| Each anniversary thereafter (subject to increase to $US50,000 on certain triggering events) | $10,000 USD (paid to September 2011) |
The Ravin Option may be exercised at any time by payment of the Ravin Purchase Price and grant of a 3% NSR, 1% of which can be repurchased for US$1 million (the “Ravin Royalty”). We are required to make minimum annual advance royalty payments of US$50,000 after exercise until commencement of sustained commercial production, with such payments being credited against the Ravin Royalty. The Ravin Rental Payments are not credited against the Ravin Royalty or the Ravin Purchase Price, but are not payable after the Ravin Option is exercised.
Description, Location and Access:
The Ravin Property is a historic Freeport/Huston Oil and Minerals Metal property that was explored during the late 1970’s and early 1980’s. The property is comprised of the following 50 claims:
| Name of Claims | BLM Serial Nos |
| | |
| MOLY 20 | NMC 964209 |
| MOLY 22 | NMC 964211 |
| MOLY 24 | NMC 964213 |
| MOLY 26 | NMC 964215 |
| MOLY 28 | NMC 964217 |
| MOLY 30 | NMC 964219 |
| MOLY 32 | NMC 964221 |
| MOLY 67-90 | NMC 964256-064279 |
| MOLY 115 | NMC 964304 |
| MOLY 117 | NMC 964306 |
| MOLY 119 | NMC 964308 |
| MOLY 121 | NMC 964310 |
| MOLY 123 | NMC 964312 |
| MOLY 125-138 | NMC 964314-964327 |
The Ravin Property is located 20 miles north of the town of Austin, Nevada and is accessible by paved road to within 5 miles of the property and by gravel road to the property itself.
The following is a map of the location of the Ravin Property:
There is no water or electricity available at the property site, with no surface water available within the property boundaries. See “Principal Expenditures and Divestitures”.
Our 2008/2009 drilling program at the Ravin Property commenced on July 10, 2009. Due to a serious lack of water in the area and a loss of circulation during drilling due to silicified and broken quartz breccia the core results for the first three diamond drill holes were poor, and we encountered drilling delays and additional costs. An additional 5 drill holes were completed at the Ravin Property using a reverse circulation drill. Assay results are broken into 2 separate tables. Those results from the diamond drill holes have been reported only for those intervals for which coherent core samples are available. Due to the ongoing water problems lost circulation and poor recoveries encountered, the high grade mineralization of Molybdenum reported at a depth of 790 feet by a previous operator was not tested, and we terminated drill hole DDH-08-04 early.
History of Exploration and Status:
Strong surface molybdenum and tungsten mineralization occurs within Cambrian sediments which have been intruded by two separate Cretaceous granitic to quartz monzonite plutons. The Raven Pluton is the largest and crops out over an area of about 2 square miles. The smaller Cadro Pluton crops out over a ½ square mile area in the northwest part of the project. The Cadro Pluton appears to be responsible for a majority of the hydrothermal alteration and molybdenum mineralization seen on the project.
Historically, the property had been explored by Union Carbide, Houston Oil and Minerals and Freeport Exploration. Union Carbide drilled three core holes with the deepest hole drilled to a depth of 500 feet. Houston Oil subsequently acquired the property in 1978 and drilled six core holes in the Reward tungsten pit. As part of a regional rock and soil geochemistry program, Houston Oil identified a coherent molybdenum soil anomaly. They drilled two diamond drill holes and the best intercept encountered was 40 feet of 0.66% Mo.
Freeport optioned the property in 1981 and drilled 17 rotary and core drill holes to test a molybdenum-copper-fluorine anomaly found within the Cambrian sedimentary units. The anomalous zone showed strong structural control and is thought to be associated with the contact zone of the Cadro Pluton. Some of the historic drill holes exist in the form of reports and summaries of the drilling, exploration, drill logs and assays but none of the original assay sheets are available.
All but 4 drill holes encountered molybdenum mineralization and highlights included:
| Drill Hole | Interval | Width | Grade |
| | | | |
| Rw 80-2, 81-2c | 600-650 feet | 50 feet | 0.053% MoS2 |
| | 800-900 feet | 100 feet | 0.047% MoS2 |
| Rw 80-7 | 100-350 feet | 250 feet | 0.105% MoS2 |
| Rw 81-11c | 150-350 feet | 200 feet | 0.052% MoS2 |
| Rw 81-13c | 550-800 feet | 250 feet | 0.052% MoS2 |
| | 1650-1700 feet | 50 feet | 0.055% MoS2 |
| Rw 81-14c | 600-650 feet | 50 feet | 0.051% MoS2 |
The above historic information provided is for reference only and the reader should not infer or assert that the information is correct, reliable, relevant or accurate and should not be relied upon.
Diamond drilling commenced in July, 2008 at the Ravin Property and was hampered by lack of water in the area and loss of circulation during drilling due to drilling through silicified and broken quartz breccia, resulting in poor core results for the first three diamond drill holes, drilling delays and additional costs. An additional 5 drill holes were completed at the Ravin Property in October 2008 using a reverse circulation drill. Assay results are broken into 2 separate tables. Those results from the diamond drill holes have been reported only for those intervals for which coherent core samples are available.
Results of 2008 Diamond Drill Holes
| | | | | | |
| DDH 08-04 | | 109.6 – 146.4 146.4-156.3 156.3-174.6 210.0-213.2 275.4-276.6 292.0-295.0 320.0-341.5 405.0-421.4 441.6-451.2 471.0-477.0 484.1-502.1 | | 36.8 9.9 18.3 3.2 1.2 3 21.5 16.4 9.6 6 18 | | 0.0983 0.0489 0.2133 0.1046 1.397 0.7368 0.0884 0.0832 0.0713 0.0616 0.0466 |
DDH 08-8 Includes | | 565-575.8 699.0-709.4 | | 10 10 | | 0.0945 0.1024 |
| DDH 08-11 | | 36.8-47.0 51.8-57.0 90.0-93.5 167.3-188.6 226.8-230.8 274.4-281.9 317.4-331.1 344.8-350.6 387.5-392.7 407.7-411,4 476.3-479.0 494.7-498.0 | | 10.2 5.2 3.5 21.3 4 7.5 13.7 5.8 5.2 4.3 3 3.3 | | 0.0476 0.0571 0.0653 0.0549 0.1848 0.0766 0.0336 0.0622 0.0850 0.1265 0.2059 0.1875 |
Results from Reverse Circulation Drilling
Drill Hole Number | | From/To (feet) | | Interval (feet) | | Mo% | | Cu% |
RC 08-02 Includes | | 0-500 10-20 0-50 400-450 0-100 350-500 375-385 | | 500 10 50 50 100 150 10 | | 0.022 0.09 0.045 0.066 0.031 0.034 0.14 | | 0.039 0.06 0.04 0.097 0.07 |
RC 08-03 Includes | | 0-200 50-100 250-300 | | 200 50 50 | | 0.055 0.061 0.026 | | 0.062 |
| RC 08-05 | | 0-540 | | | | 0.02 | | 0.03 |
RC 08-07 Includes | | 0-300 50-100 250-300 | | 300 | | 0.016 0.023 0.03 | | |
RC 08-09 Includes | | 0-350 0-50 50-150 | | 50 100 | | 0.025 0.032 0.042 | | 0.019 0.029 |
Our 2009 drilling program at the Ravin Property commenced on July 10, 2009. Due to a serious lack of water in the area and a loss of circulation during drilling due to silicified and broken quartz breccia the core results for the first three diamond drill holes were poor, and we encountered drilling delays and additional costs. An additional 5 drill holes were completed at the Ravin Property using a reverse circulation drill. Assay results are broken into 2 separate tables. Those results from the diamond drill holes have been reported only for those intervals for which coherent core samples are available. Due to the ongoing water problems lost circulation and poor recoveries encountered, the high grade mineralization of Molybdenum reported at a depth of 790 feet by a previous operator was not tested, and we terminated drill hole DDH-08-04 early.
The water problems encountered during the 2007 and 2008 drilling seasons have been resolved and with a program of loss circulation to increase recoveries, further work, which may include drilling, will be considered when the market price for molybdenum warrants. See “Special Note on Forward Looking Statements”.
Maintaining the claims in good standing in Nevada:
Under Bureau of Land Management rules for the State of Nevada, all holders of State mining locations must pay an annual maintenance fee of US$140 per claim or site by August 31 in each calendar year. These amounts were paid when due prior to August 31, 2011
Diamond Peak Property (Nevada)
Nature of Interest and Terms of Acquisition
We acquired our interest in this property pursuant to an option agreement (the “Diamond Peak Option Agreement”) dated for reference May 9, 2006 and amended September 30, 2009, with the Wendt Family Trust of Reno, Nevada granting us an option (the “Diamond Peak Option”) to purchase a 100% interest in the FMC claims in Eureka County, Nevada, (the “Diamond Peak Property”) for the sum of US$300,000 (the “Diamond Peak Purchase Price”) plus a 3% NSR, 1% of which can be repurchased for US$1 million (the “Diamond Peak Royalty”). The Wendt Family Trust is controlled by Clancy J. Wendt, our Vice President of Exploration.
Under the terms of the Diamond Peak Option Agreement, we issued 100,000 shares of the Company to the Wendt Family Trust and must make the following rental payments (the “Diamond Peak Rental Payments”) in order to maintain the Diamond Peak Option:
| Date | Payment Amount (U.S funds) |
| Upon execution of the option agreement (May 9, 2006) | $25,000 (paid) |
| First anniversary of effective date (May 9, 2007) | $35,000 (paid) |
| Second anniversary of effective date (May 9, 2008) | $45,000 (paid) |
| Third anniversary of effective date (May 9, 2009) | $50,000 (paid) |
| On June 30, 2010 upon execution of the amending agreement | $25,000 (paid) |
| On May 9, 2011 (as amended) | $35,000 (deferred) |
| On May 9, 2012 (as amended) | $45,000 (deferred |
| Each anniversary thereafter for 4 years (as amended) | $50,000 |
The Diamond Peak Option may be exercised at any time by payment of the Diamond Peak Purchase Price and grant of the Diamond Peak Royalty. We are required to make minimum annual advance royalty payments of US$50,000 after exercise until commencement of sustained commercial production, with such payments being credited against the Diamond Peak Royalty. The Diamond Peak Rental Payments are not credited against the Diamond Peak Royalty or the Diamond Peak Purchase Price, but are not payable after the Diamond Peak Option is exercised.
We entered into a mineral property option agreement on May 15, 2006, amended effective September 30, 2009, with Kokanee Placer (the “Kokanee Option”) whereby we granted to Kokanee the right to acquire up to a 51% interest in the Diamond Peak Property in consideration of a cash payment of US$25,000 (paid) and the issuance of 100,000 common shares of “Kokanee Minerals Inc.” (“Kokanee”) (received subsequent to December 31, 2009), a public company (TSX V Symbol KOK) which exchanged its shares for Kokanee Placer in conjunction with its public listing (completed in January, 2010).
To maintain this agreement in good standing, Kokanee had agreed to make the following annual payments and share issuances to the Company:
| - | By May 15, 2007 pay US$35,000 to the Company (received); |
| - | within five days after listing of Kokanee’s common shares on the TSX Venture Exchange, pay US$95,000 and issue 500,000 Kokanee shares to the Company (received); and |
| - | On or before May 9, 2010 and on each anniversary thereof up to and including May 9, 2016, pay US$50,000 to the Company; and |
| - | On commencement of commercial production, issue 1,000,000 Kokanee shares to the Company; |
The Kokanee Option was also subject to Kokanee completing $1,000,000 in exploration on the Diamond Peak Property over a three year period.
In June 2010 Kokanee advised us that they would not be making the US$50,000 payment then due and would be abandoning their option. We subsequently obtained a quit claim deed from Kokanee with respect to the property and their interest in the property has been extinguished, subject to Kokanee's continuing obligation for the cost of reclamation resulting from their work on the property. We have reviewed all work conducted by Kokanee and conducted soil sampling and constructed roads and drill pads at the Diamond Peak Property in preparation for drilling, subject to availability of sufficient working capital.
Description, Location and Access:
The Diamond Peak Property is comprised of 48 unpatented lode mining claims located 32 miles north of the town of Eureka, Nevada and the Archimedes gold deposit owned by Barrick Gold Corporation. It is accessible by 50 miles of improved dirt road and partial pavement north from Eureka, Nevada, and from Elko south by 40 miles of pavement and 22 miles of dirt road. The area supports a strong horse population; many trails crisscross the project area.
There is no water or electricity available at the site. Some surface water is available, as streams flow year round through canyons which traverse the property in the center and southern portions of the claim block.
The Diamond Peak Property is comprised of the FMC 31-49, and 57-75 unpatented lode mining claims represented by Bureau of Land Management Nevada Mining Claim numbers NMC 887137-887155 and NMC 887156-887174 inclusive as well as the LS86-95 unpatented lode mining claims represented by Bureau of Land Management Nevada Mining Claim numbers NMC 937603-937612. See “Principal Expenditures and Divestitures”.
The following map shows the location of the Diamond Peak Property:
History of Exploration and Status
The Diamond Peak Property is a historic MK Gold Gold/Base Metal property that was explored during the late 1990’s and is located at the southern end of the prolific Carlin trend, which contains numerous gold deposits. The property comprises 38 claims located 32 miles north of the town of Eureka, Nevada. Strong surface mineralization occurs in a 2 mile long band of silicified and intensely clay altered rocks, 200 to 300 feet wide, on the hanging wall side of a major north striking normal fault, called the West Fault.
During the work done by MK Gold in 1999, which included 17 holes and 10,085 feet of drilling, MK Gold encountered significant values of gold and base metals that included:
5 feet of 0.067 oz/st Au in hole DV 99-4 ; 5 feet of 0.062 oz/st Au in hole DV 99-5; and 11.6 % of Zinc over 5 feet within 60 feet of surface along the West Fault in the Chainman formation in hole DV 99-15.
The above historic information provided is for reference only and the reader should not infer or assert that the information is correct, reliable, relevant or accurate and should not be relied upon.
Although no extensive intervals of mineralization were encountered, the drilling did indicate that more work was needed to find an economic mineralized system. The recommendations by MK Gold were to continue exploration and drill deep (>2,000 foot) diamond drill holes to the Web and Joana formations.
At the time, the base metal values were not considered as important and were not part of further considerations. Current prices of zinc, silver, and lead make this a very important target for further exploration. There are three intrusives that contain significant base and precious metal signatures along their edges. These have not been drilled and could contain skarn mineralization that may be economic. Future exploration would include conducting geophysical surveys to better define the intrusive contacts and define drill targets for future work.
We entered into a mineral property option agreement on May 15, 2006, which was subsequently amended as of September 30, 2009 with Kokanee Placer Ltd. (“Kokanee”), particulars of which are described above under the heading “Nature of Interest and Terms of acquisition”, whereby we granted to Kokanee the right to acquire up to a 51% interest in the Diamond Peak Property.
Kokanee completed a program of exploration on the Diamond Peak Property in 2006 in order to satisfy their first year obligation of $100,000 in expenditures. This initial exploration program included an induced polarization survey over 4 kilometers of strike length. The results of this survey were used to identify drill targets for a drill program to be undertaken on completion of Kokanee’s listing on the TSX-Venture Exchange in January 2010. Kokanee drilled two holes at the Diamond Peak Property in May 2010 and subsequently advised us that they did not intend to make the US$50,000 option payment then due and would be abandoning their option on the property. They have provided us with all their data on the property as well as the drill core from the two holes they drilled but did not elect to assay. We subsequently assayed this drill and found that one of these holes, DP-02, contained an intercept of 0.588 g/t gold over 7.62 meters (25 feet) beginning at 155 feet, inclusive of a higher grade zone of 1.359 g/t gold over 1.52 meters (5 feet). Hole DP-02 was a vertical hole drilled at the same location as a 60 degree angle hole drilled by MK Gold in 1999 that reported 2.08 g/t Au over 5 feet.
In September 2010 we conducted an extensive soil sampling program at the Diamond Peak Property. A total of 375 samples were collected, with assay results as high as 5.8 g/t Ag, 4.3 g/t Ag and 3.2 g/t Ag in soils confirming the high silver zone in the southern part of the property and its continuation to the east. In addition, an outcrop sample recently taken from the silver zone in the southern portion of the property has returned an assay grade of 53.5 g/t silver. Gold values to 90 ppb Au were obtained that confirm many of the gold zones previously examined and have also identified a new zone on the west side of the northern part of the property that has not yet been drilled. Zinc values were returned as high as 648 ppm Zn that indicate that the mineralized system is far larger than originally thought, extending to the east of both the gold zone in the northern portion of the property and the silver zone in the south. Zinc geochemistry along the northeastern side of the property remains open and contains values greater than 200 ppm Zn along 600 feet of strike length.
Drill permits have been received and roads and drill pads have been cleared at the Diamond Peak Property. Drilling at Diamond Peak has been deferred until such time as we sufficient working capital to fund a comprehensive exploration program.
Maintaining the claims in good standing in Nevada:
Under Bureau of Land Management rules for the State of Nevada, all holders of State mining locations must pay an annual maintenance fee of US$140 per claim or site by August 31 in each calendar year. These amounts were paid when due on August 31, 2011.
C de Baca Project (New Mexico)
Nature of Interest and Terms of Acquisition
We acquired our initial interest in the C de Baca Project by agreement dated for reference September 2005 with Applied Geological Services, Inc. of Denver, Colorado for the acquisition of a total of 108 uranium exploration claims (the “Dat Claims”) in Socorro County, New Mexico. Consideration for the acquisition of the Dat Claims (known also as the “C de Baca Project”) was an immediate US$10,000 cash payment with annual payments of US$10,000 until production. After production, a royalty of 2% of revenues is payable until such time as a total of US$500,000 (including the initial cash payment and annual payments) has been paid. The obligation to make payments to Applied Geologic Services can be terminated at anytime by us by providing notice that we are abandoning the Dat Claims and agreeing to transfer them back to the vendor.
Description, Location and Access:
The C de Baca Project is located approximately 14 miles north of the town of Magdalena and 100 miles south of the town of Albuquerque, New Mexico. The claims have excellent road access by both gravel and cross county roads. All of the claims are located on U.S. Forest Service Lands. There is no water or electricity available at the property site, with no surface water available within the property boundaries.
The C de Baca Project was originally comprised of 108 unpatented lode mining claims, the DAT 1 to DAT 108 claims, represented by Bureau of Land Management New Mexico Mining Claim numbers NMMC 172161-172268 and NMMC 887156-887174 inclusive. These claims were recorded on October 6, 2005. The project size was expanded in 2008 through our staking of an additional 83 unpatented lode mining mineral claims along the northern and southern boundaries of our current claim block at C de Baca, bringing our total holdings to 191 claims. The additional 83 claims, the DAT 109 to 191, were recorded on March 18, 2008 and are represented by Bureau of Land Management New Mexico Mining Claim numbers NMMC184704 to NMMC184786 inclusive. In 2010, the number of claims was reduced to include only the following 48 claims:
| Name of Claims | BLM Serial Nos |
| DAT 15-46 | NMC 172174-172206 |
| DAT 69 | NMC 172229 |
| DAT 71 | NMC 172231 |
| DAT 73 | NMC 172233 |
| DAT 75 | NMC 172235 |
| DAT 77 | NMC 172237 |
| DAT 79 | NMC 172239 |
| DAT 81 | NMC 172241 |
| DAT 83 | NMC 172243 |
| DAT 85 | NMC 172245 |
| DAT 87 | NMC 172247 |
| DAT 89 | NMC 172249 |
| DAT 91 | NMC 172251 |
| DAT 93 | NMC 172253 |
| DAT 95 | NMC 172255 |
| DAT 97 | NMC 172257 |
| DAT 99 | NMC 172259 |
The following map shows the location of the C de Baca Project:
Maintaining the claims in good standing in New Mexico:
Under Bureau of Land Management rules for the State of New Mexico Office, all locators and holders of State mining locations must pay an annual maintenance fee of US$140 per claim or site by August 31 of each calendar year. This amount was paid in August, 2011.
History of Exploration and Status:
The C de Baca Project was explored during the early 1980’s by OxyMin, a wholly-owned subsidiary of Occidental Petroleum. The uranium host is a 3500+ foot wide south-trending sequence of strongly reduced braided stream deposits grading into a system of alluvial fan and flood plain sediments. This geochemically well-defined depositional trend favors uranium deposition along the margins of the system where the reduced (altered) sands range in thickness from 150-200 feet. During the exploration, 216 drill holes were drilled in specific areas of the claim block and roughly defined the eastern limits of the favourable system.
The best drill hole had 7.5 feet of 0.20 U3O8 at a depth of 291 feet. Due to the geological formations in the area, OxyMin felt that the property may be amenable to “in-situ leaching, subject to further exploration.
On May 21, 2007, we commenced a 14 hole rotary drill program at C de Baca Project and, on June 5, 2007, we announced the results from the first drill hole, CDB-1. These results confirmed a historic drill result achieved by Oxymin of 5.5 feet of 0.043% eU308 at 300 feet and a second mineralized zone of 4 feet of 0.024% eU3O8 at 317 feet down hole.
The results reported by us at CDB-1 were through gamma ray probe readings by Jet West Geophysical Services LLC of Farmington, New Mexico and include:
| Hole # | Total Depth | Interval | Mineralization |
| | | | |
| CDB-1 | 378.0 feet | 300-305.5 | 0.043% eU3O8 |
| Containing | | 301.0-301.5 | 0.06% eU3O8 |
| Containing | | 301.5-302.0 | 0.10% eU3O8 |
| Containing | | 302.0-302.5 | 0.09% eU3O8 |
| Containing | | 302.5-303.0 | 0.05% eU3O8 |
| Second Zone | | 317.5-321.5 | 0.024% eU3O8 |
On June 19, 2007, we announced the results from a further six drill holes, CDB-2 to CDB-7, of which Hole CDB-6 returned 6.5 feet of 0.136% eU3O8 beginning at a depth of 155.5 feet (including 0.368% eU3O8 from 157.5-159.0 feet) and 5 feet of 0.167% eU3O8 from 170 -175 feet. Results include the following:
| Hole # | Total Depth | Interval | Mineralization |
| | | | |
| CDB-2 | 347 feet | 270.0-282.0 | 0.0226 % eU308 |
| CDB-3 | 347 feet | 261.5-264.5 | 0.031 % eU308 |
| | | 293.0-297.0 | 0.014 % eU308 |
| CDB-4 | 181 feet | 160.5-164.0 | 0.036% eU308 |
| Including | | 162.0-162.5 | 0.07% eU308 |
| Hole # | Total Depth | Interval | Mineralization |
| | | | |
| CDB-5 | 210 feet | 180-182.0 | 0.019% eU308 |
| | | 184.5-190.0 | 0.074% eU308 |
| Including | | 186.5-189.0 | 0.173% eU308 |
| CDB-6 | 200 feet | 155.5-162.0 | 0.136% eU308 |
| | | 170.0-175.0 | 0.167% eU308 |
| Including | | 157.5-159.0 | 0.368% eU308 |
| Including | | 173.0-173.5 | 0.76% eU308 |
| CDB-7 | 235 feet | 201.0-208.0 | 0.052% eU308 |
| Including | | 205.0-207.0 | 0.094% eU308 |
On July 9, 2007, we announced the results from the final seven drill holes at the C de Baca Projects. Highlights included drill hole CDB-10A, which contained 2.0 feet of 0.065% eU308 at a depth of 295.5 feet.
Results from these drill holes at the C de Baca Project, CDB 8 to CDB-14, along with the first seven holes announced earlier, continue to confirm historic drill results reported by Oxymin in the early 1980’s. Results are tabulated as follows:
| Hole # | Total Depth | Interval | Mineralization |
| | | | |
| CDB-8 | 248 feet | 184.5 – 194.5 | 0.0159% eU308 |
| CDB-9 | 346 feet | 306.5-310.0 | 0.034 % eU308 |
| | | 328.5-330.0 | 0.015% eU308 |
| CDB-10 | 311 feet | | Anomalous |
| CDB-10A | 209 feet | 295.5-297.5 | 0.065% eU308 |
| CDB-11 | 319 feet | 286.5-294.0 | 0.037% eU308 |
| CDB-12 | 336 feet | 202.0 – 203.5 | 0.0.012% eU308 |
| CDB-13 | 229 feet | 176.5 – 180.5 | 0.0162% eU308 |
| | | | |
| CDB-14 | 238 feet | 199.5-200.0 | 0.026% eU308 |
| | | 217.0 – 217.5 | 0.025% eU308 |
This initial 14 hole mud rotary drill program was designed to confirm historic drill results reported by Oxymin during exploration of the C de Baca Project during the 1980’s. While the results of these drill holes were within expectations, the results from drill hole CDB-10 were affected by the intersection of an unknown basaltic dike. We drilled an offset hole, CDB-10a, to avoid intersecting the basaltic dike and to better test the main zone of uranium mineralization. This hole successfully encountered 2.0 feet of 0.065% eU308 at a depth of 295.5 feet.
Gamma, Spontaneous Potential (SP), and Resistivity values were logged by Jet West Geophysical Services LLC of Farmington, New Mexico. The Gamma portion of the down-hole logging tool was calibrated by uranium-industry standard values located in mines at Grants, New Mexico. In situ uranium grades, expressed as equivalent U3O8 (“eU3O8”) are calculated using the digital gamma ray values acquired by the down-hole logging tool and uranium industry standard techniques for gamma log interpretation. Down-hole gamma log interpretation has historically been found to be an accurate representation of in situ grades for uranium mineralization in the Magdalena District.
In 2008, Michael Bersch, PhD, PG, completed a National Instrument 43-101 Technical Report on the C de Baca Project. This report has been filed on SEDAR and is available on our website at www.maxresource.com. Dr. Bersch’s report recommends further exploration at the C de Baca Project that will include diamond drilling, project and regional scale geologic mapping and sampling.
Majuba Hill Project (Nevada)
Nature of Interest and Terms of Acquisition
On March 4, 2011 we entered into an option agreement to acquire up to a 75% interest in the Majuba Hill Copper/Gold/Silver property in Pershing County, Nevada (the “Majuba Hill Option”) from Claremont Nevada Mines LLC., Nevada. The Majuba Hill Property encompasses 2,568 acres consisting of patented and unpatented lode mining claims and private mineral rights.
The terms of the Majuba Hill Option Agreement with Claremont allow us to earn an initial 60% interest in the property over six years by spending US$6.5 Million on exploration of the property, as follows.
.
Performance Date | | Annual Amount | | | Cumulative
Amount | |
| By the first anniversary date | | $ | 500,000 | | | $ 500,000 | (completed) |
| By the second anniversary date | | $ | 750,000 | | | $ | 1,250,000 | |
| By the third anniversary date | | $ | 1,000,000 | | | $ | 2,250,000 | |
| By the fourth anniversary date | | $ | 1,250,000 | | | $ | 3,500,000 | |
| By the fifth anniversary date | | $ | 1,500,000 | | | $ | 5,000,000 | |
| By the sixth anniversary date | | $ | 1,500,000 | | | $ | 6,500,000 | |
We can increase our interest in the Majuba Hill Property to 75% by spending a further $3.5 Million on exploration over a subsequent two year period.
In addition, we are also required to make annual advance royalty payments of US$20,000 to a third party, JR Exploration LLC, a Nevada limited liability company, on the effective date of the Option Agreement and each anniversary thereafter. The Majuba Hill Property is also be subject to a 3% NSR payable to the vendor, 1.5% of which may be purchased at any time for US$1.5 Million.
Description, Location and Access:
The Majuba Hill Property is located approximately 54 miles west of Winnemucca, Nevada. It can be accessed by driving approximately 140 miles northeast from Reno on U.S. Interstate Highway 80 to the town of Imlay and then heading west from Interstate 80 on 23 miles of dirt roads maintained year round by Pershing County.
There is no water or electricity available at the property site, with no surface water available within the property boundaries.
The Majuba Hill Property is comprised of the following unpatented and patented mineral claims and mineral rights:
Unpatented Mining Claims.
| Claim Name | BLM NMC Nos. |
| AP-1 to AP-4 | 917098 to 917101 |
| MH-1 to MH -15 | 918603 to 918617 |
| MHA - 1 to MHA – 16 | 1042860 to 1042875 |
| MH - 17 to MH – 89 | 1042876 to 1042948 |
Fee Lands, Patented Mining Claims and Mineral Rights.
Majuba Hill, Majuba Hill No. 1 and Majuba Hill No. 3 patented mining claims, Patent No. 1033600, Mineral Survey No. 4610
Mineral rights in Section 35, T33N, R31E, MDB&M
The following map shows the location of the Majuba Hill Property:
History of Exploration and Status:
The Majuba Hill Property is centered on the mid-Tertiary age Majuba Hill intrusive complex which is about 4,700 feet in diameter. The lithologic assemblage is a cross-cutting series of intrusives ranging from rhyolite to latite with multiple stages of flow-banded units, intrusive breccias, and radial dikes. These are all emplaced into steeply dipping, northeast striking Triassic argillite.
Breccia textures are very diverse and typically include tourmaline as:
| | ● | Disseminated tourmaline in the mineralized areas |
Since 1907, production and exploration at Majuba Hill has produced significant copper results with associated silver and gold. Published production data show that prior to 1947 Mason Valley Mines Co. and Greenan-Kerr produced 4,000 tons @ 12 % Cu and slightly less than 23,000 tons @ 4% Cu respectively. Majuba also has the rare distinction of being one of the few tin producers (350 tons @ 2 to 4% tin) in the western United States. Historically, copper and tin were mined from underground workings at Majuba. Copper, silver, and tin ore was taken from stopes along the Majuba Fault, which cuts northwesterly across the nested series of intrusives, intrusive breccias, and dikes. Gold values are also reported from the historic record. The ore stopes and workings extended to about 500 feet below the surface and 250 feet along the fault.
The Last Chance (Frisco) mine in section 1, T32N, R31E was developed along a fault with a trend similar to the Majuba Fault. Last Chance operated intermittently and produced silver (up to 40 opt Ag), lead (up to 15%), and gold (up to 0.10 opt Au) from an 830 foot tunnel and a 117 foot deep shaft. No drilling or exploration appears to have ever been completed down dip or along the strike of the fault at the Last Chance.
Total production reported from historic underground mines in the project area (see Nevada Bureau of Mines and Geology Bulletin 86) included:
| | ● | 184,000 ounces of silver |
| | ● | 2.2 million lbs of copper |
The current land position at Majuba Hill was assembled by Minterra Resource Corp. and conducted a 14 hole reverse-circulation drill program totaling 8,590 feet on the property in 2007. Highlights of results from this drilling reported by Minterra in 2007-8 included:
| MH Hole # | Total Depth (ft) | Interval | Copper % | Silver (opt) |
| MH-2 | 160-390 | 230 ft | 0.37% | 0.426 opt |
| Including | 295-320 | 25 ft | 1.36% | |
| Including | 340-350 | 10 ft | | 3.50 opt |
| MH-3 | 220-355 | 135 ft | | 0.58 opt |
| Including | 220-290 | 70 ft | 0.59% | |
| MH-4 | 310-340 | 30 ft | | 1.12 opt |
| Including | 335-340 | 5 ft | | 2.90 opt |
| MH-5 | 0-290 | 290 ft | 0.28% | |
| Including | 0-15 | 15 ft | 1.18% | |
| Including | 0-100 | 100 ft | | 0.99 opt |
| Including | 5-20 | 15 ft | | 4.00 opt |
| MH-6 | 0-145 | 145 ft | 0.49% | 1.85 opt |
| Including | 110-125 | 15 ft | | 5.10 opt |
| MH-7 | 85-400 | 315 ft | 0.34% | 0.70 opt |
| Including | 225-245 | 20 ft | | 2.09 opt |
These copper and silver drill results were encouraging but were not followed up as Minterra ceased operations in 2009. All data collected by Minterra between March 2006 and May 2008, including geophysical data (a 14.4 line-km IP survey), assay certificates, interpretive maps, cross sections and digital data is available to MAX. The combination of geology, geochemistry and drill results still point to the patented lode claims around the historic Majuba Mine as a significant copper/silver target.
In September 2011 MAX received and mapped the results of an extensive soil sampling program at Majuba Hill during the summer of 2011. A total of 834 soil samples were taken across a surface area in excess of 5,000 by 2,500 meters (m) with assay results obtained as high as 1.53% Cu and 209 g/t Ag.
On the northwest side of the Majuba Hill property, on unpatented land, assay results in soils ranged from 1.8 ppm Cu to 15,300 ppm (1.53%) Cu and from nil to 209 g/t Ag at the “DeSoto” zone. Sampling undertaken on the newly identified “Ball Park” target area 1 km east of the Copper Stope target area (the site of MAX’s Phase I drill program completed in August 2011) returned values from 61.2 ppm to 132 ppm Cu and from 0.16 ppm to 2.5 g/t silver. Both of these areas are identified on the soil geochemistry maps available on our web site at www.maxresource.com, with the target areas outlined in black. MAX drilled both of these areas during a Phase II drill program that was completed in December 2011.
During the summer of 2011, MAX drilled eight core holes at the site of the past producing Majuba Hill mine on patented land. Five of the eight holes were drilled to test results reported by Minterra Resource Corp. from a reverse-circulation drill program conducted in 2007. This drilling confirms higher results for both copper and silver than previously reported by Minterra due to the improved sample recovery provided by core drilling. In addition, significant gold (Au) values were encountered in all drill holes; no gold assays had previously been reported by Minterra, nor finding native gold in the holes as we have.
The complete assay results from the eight hole Phase I drill program at Majuba Hill are as follows:
| Hole | Azimuth | Angle | Total
Depth | From
(m) | To (m) | Thickness
(m) | Cu (%) | Au (g/t) | Ag (g/t) |
| | | | | | | | | | |
| MM-07 | 290 | -45 | 146.4 m | 76.2 | 126.5 | 50.3 m | 0.31% | 0.31 | 50.8 |
| includes | | | | 106.7 | 126.5 | 19.8 m | 0.53% | 0.56 | 100.1 |
| | | | | | | | | | |
| MM-06 | - | 90 | 119.8 m | 1.5 | 97.5 | 96.0 m | 0.57% | 0.10 | 39.2 |
| includes | | | 119.8 m | 1.5 | 45.7 | 44.2 m | 1.14% | 0.15 | 71.0 |
| | | | | | | | | | |
| MM-02 | 243 | -70 | 122.8 m | 68.6 | 114.3 | 45.7 m | 0.56% | 0.07 | 15.4 |
| includes | | | | 105.2 | 114.3 | 9.1 m | 0.54% | 0.11 | 39.3 |
| | | | | | | | | | |
| MM-03 | 263 | -70 | 158.6 m | 91.5 | 134.1 | 42.7 m | 0.38% | | 37.5 |
| includes | | | | 102.1 | 112.8 | 10.7 m | 0.93% | | 90.2 |
| Hole | Azimuth | Angle | Total
Depth | From
(m) | To (m) | Thickness
(m) | Cu (%) | Au (g/t) | Ag (g/t) |
| | | | | | | | | | |
| MM-05 | 279 | -45 | 89.3 m | 0 | 89.3 | 89.3 m | 0.28% | | 16.5 |
| includes | | | | 1.5 | 15.2 | 13.7 m | 0.47% | | 30.0 |
| | | | | | | | | | |
| MM-13 | 298 | -56 | 135 m | 0 | 135.0 | 135 m | 0.02% | | 3.0 |
| | | | | | | | | | |
| MM-15 | 255 | -45 | 257 m | 0 | 257.0 | 257 m | 0.05% | | 4.3 |
| includes | | | | 137.2 | 161.6 | 24.4 m | 0.09% | | 12.3 |
| | | | | | | | | | |
| MM-16 | 042 | -45 | 111.2 m | 0 | 111.2 | 111.2 m | 0.06% | - | 3.08 |
In October 2011, MAX commenced a Phase II core drilling program at Majuba Hill. Four holes were drilled to test new target areas identified during mapping, data compilation and soil sampling conducted over a surface area in excess of 5,500 by 2,500 m during 2011. The first hole of the Phase II program, MM-17 was drilled 730 m southeast of Phase I drilling (see the listing of drill results in the table above) and intercepted 42.7 m of 16.8 g/t Ag, 13.7 m of 15.9 g/t Ag and 6.16 m of 51.0 g/t Ag, indicating that this target area may be the extension of the high grade supergene oxide mineralization identified during Phase I drilling.
Two drill holes, MM-18 and MM-19, were drilled 1.4 km to the northwest of Phase I drilling to follow up on a high grade copper/silver soil anomaly approximately 1.5 km long by 500 m wide identified near the past producing DeSoto silver mine that returned values as high as 1.53% Cu and 209 g/t Ag in soils. Hole MM-18 was drilled to a depth of 146 m and intercepted 29.2 meters of 30.5 g/t Ag and 0.69% Cu starting at 21.9 m from surface. Hole MM-19 was drilled at the same location as hole MM-18 at an angle of –45 to the southeast, whereas hole MM-18 was drilled at the same angle to the northwest, and intercepted 3.6 m of 14.3 g/t Ag and 0.45% Cu within ten feet of surface.
The final hole of the Phase II program, MM-20, intercepted 293 m of 5.49 g/t Ag, 0.10 g/t Au and 0.09% Cu in sulfide mineralization in a porphyry-style alteration zone below the high grade Ag/Cu/Au oxide zone identified during Phase I drilling. Gold mineralization grading 0.145 g/t Au, along with 6.3 g/t Ag and 0.13% Cu, was intercepted over the final 116 m of Hole MM-20, which was still in mineralization when terminated at the planned target depth. The increase in gold, copper and molybdenum mineralization at depth and the long intersections of mineralization add more evidence to support our belief that Majuba Hill is an extensive copper/silver/gold porphyry system that is highly prospective for the development of a bulk-tonnage open pit deposit.
Having discovered the primary zone of porphyry mineralization below Majuba Hill, MAX intends to concentrate its 2012 exploration activity on defining the high grade supergene (oxide) system located above this zone. The initial hole of the Phase III program, MM-21, was commenced in May 2012 and is located approximately 250 m southeast of the middle portal of the past-producing Majuba Hill mine and will test a ridge of high-grade oxide mineralization that was identified during geologic exploration in 2011. On completion of this hole, which was drilled to a depth of 335 meters, the drill rig was moved to the DeSoto discovery zone 1.4 kilometres to the northwest to initiate delineation drilling on that mineralized zone. Drilling is continuing as of the date of this report.
Maps showing the results of soil sampling and drilling conducted during 2011 can be viewed on our web site at www.maxresource.com.
Analysis was performed by Inspectorate American Corp. Laboratories, an ISO certified facility in Reno, Nevada, using fire assay and multi-element (ICP-ES) techniques producing assays for a 49 element suite of minerals. Standards, duplicates and blanks were used for quality control of the samples. After the core is logged for each drill hole, the location of each site is located using a GPS in UTM coordinates using NAD 27 datum. The core is then split and put into a sample bag which is labelled for each interval and a sample card tag put in each sample bag and taken from the core facility to the Inspectorate Laboratories.
In April 2012, MAX entered into a mineral lease with New Nevada Resources LLC (NNR) for 560 acres of mineral rights (Section 33) immediately adjacent the the DeSoto zone at the Majuba Hill project. Mineralization at this zone, centred around the past-producing DeSoto silver mine, remains open to the south and east, and appears to extend at least another one kilometre to the northwest on Section 33. MAX intends to conduct soil sampling on Section 33 to test this theory during 2012, to be followed by drilling should results warrant.
The mineral lease with NNR is for a term of 20 years and calls for annual lease payments of $15 per acre in the first year, increasing incrementally to $30 per acre in year four and subsequent years. NNR has the right to retain a 15-per-cent working interest in Section 33 or can convert it to a net smelter return of 0.5 per cent on base metals and 1 per cent on precious metals, in addition to retaining an overriding NSR of 1.75 per cent on base metals and 3 per cent on precious metals.
During the year ended December 31, 2011 the Company incurred geologic consulting fees of $213,081, field expenses of $134,034 and drilling and assay costs of $420,512 at Majuba Hill.
Item 4.A Unresolved Staff Comments
Not applicable.
Item 5. Operating and Financial Review and Prospects
The following discussion of our operating results explains material changes in our consolidated results of operations for the fiscal year ended December 31, 2011 compared to the prior fiscal years ended December 31, 2010 and 2009. The discussion should be read in conjunction with the consolidated financial statements to December 31, 2011 and the related notes included in Item 18 of this report. Management’s discussion and analysis of our operating results in this section is qualified in its entirety by, and should be read in conjunction with, the consolidated financial statements and notes thereto. This discussion contains forward-looking statements, the accuracy of which involves risks and uncertainties and our actual results could differ materially from those anticipated in the forward-looking statements for many reasons, including, but not limited to, those risk factors described elsewhere in this report. Our consolidated financial statements have been prepared in Canadian dollars and in accordance with IFRS which differs from United States generally accepted accounting principles and this discussion of our financial condition and results of operations is based on the results prepared in accordance with IFRS.
Overview
Our business is exploration for minerals. We do not have any properties that are in development or production. We have no earnings and, therefore, finance these exploration activities by the sale of our equity securities or through joint ventures with other mineral exploration companies. The key determinants of our operating results include the following:
| | ● | Our ability to identify quality mineral exploration properties and acquire them on favorable terms; |
| | ● | The cost of our exploration activities; |
| | ● | our ability to finance our exploration activities and general operations; |
| | ● | our ability to identify and exploit commercial deposits of mineralization; and |
| | ● | the write-down and abandonment of mineral properties as exploration results provide further information relating to the underlying value of such properties |
These determinants are affected by a number of factors, most of which are largely out of our control, including the following:
| | ● | The competitive demand for quality mineral exploration properties; |
| | ● | Political and regulatory climate in countries where properties of interest are located; |
| | ● | Regulatory and other costs associated with maintaining our operations as a public company; |
| | ● | the costs associated with exploration activities; and |
| | ● | the cost of acquiring and maintaining our mineral properties. |
Our primary capital and liquidity requirements relate to our ability to secure funds, principally through the sale of our securities, to raise sufficient capital to maintain our operations and fund our efforts to acquire mineral properties with attractive exploration targets and conduct successful exploration programs on them. We anticipate this requirement will continue until such time as we have either discovered sufficient mineralization on one or more properties with sufficient grade, tonnage and type of mineralization to support the commencement of sustained profitable mining operations and are thereafter able to place such property or properties into commercial production or until we have obtained sufficient positive exploration results on one or more of our properties to enable us to successfully negotiate a joint venture with a mining company with greater financial resources than us or some other suitable arrangement sufficient to fund our operations.
Our success in raising equity capital is dependant upon factors which are largely out of our control including:
| | ● | market prices for gold and other precious and base metals; |
| | ● | the market for our securities; and |
| | ● | the results from our exploration activities. |
Continuing effects from the global financial crisis including poor conditions in the U.S. housing market and the credit quality of mortgage backed securities, coupled with slow growth and high levels of unemployment, continued during 2010, causing a loss of confidence in the broader U.S. and global credit and financial markets. In addition, during 2011 new economic stresses emerged including extraordinarily high levels of government debt, major currency instability and a growing sovereign debt crisis. These events in turn resulted in international bailouts for Greece and Ireland, and threats of bailouts for Spain, Portugal and other countries. In the US, the effect of unprecedented levels of government funded stimulus, institutional bailouts, "quantitative easing" and other expansionist monetary policies has led to deterioration of the US dollar and its role as a reserve currency. These factors could, among other things, make it more difficult for us to obtain capital and financing for our operations in the future as well as increase our costs of obtaining such capital. Access to additional capital, when required, may not be available to us on acceptable terms or at all.
The most significant factors affecting our operations during the past year were related to reduction in the demand for, and in the prices of, uranium and base metals and a corresponding collapse in the market for shares of junior exploration companies. These factors are expected to have a significant effect on our operations during the next fiscal year and thereafter so long as we continue in our present business of mineral exploration. During 2011, the prices of gold and other metals have experienced significant price volatility, with gold maintaining prices substantially higher than the previous five years, as a result of global economic uncertainty. While the price of gold is significantly higher due to its risk premium, this has not had a commensurate impact on the share prices for junior gold exploration companies, and the general market for the shares of junior exploration companies, in all commodities remains uncertain. In prior years, there has been a significant increase in general mineral exploration activity, resulting in greater competition for mineral properties and the resources employed in mineral exploration, and a corresponding increase in the prices demanded for suitable exploration properties and the costs associated with mineral exploration. We anticipate the market for precious and other metals will continue to be volatile but will improve the short and medium term, resulting in a improved outlook for our ability to raise equity capital, but also an increase in exploration costs and the costs for acquiring new exploration properties due to an increase in competition in the sector.
Accordingly, while we anticipate our operating results will be most significantly affected by the results of our exploration activities on our existing properties, we anticipate we may see opportunities to acquire additional capital on more favourable terms than would have been the case in the past.. See “Special Note Regarding Forward Looking Statements” and “Risk Factors”.
Accounting Policies
We have adopted a number of accounting policies and made a number of assumptions and estimates in preparing our financial reporting, which are described in Note 2 to the attached audited consolidated financial statements. These policies, assumptions and estimates significantly affect how our historical financial performance is reported and also your ability to assess our future financial results. In addition, there are a number of factors which may indicate our historical financial results will not be predictive of anticipated future results. You should carefully review the following disclosure, together with the attached consolidated financial statements and the notes thereto, including, in particular, the statement of significant accounting policies set out in Note 2 to such statements.
Going Concern Assumptions
As described in Note 1 to our consolidated financial statements, our financial statements have been prepared on the assumption that we will continue as a going concern, meaning that we will continue in operation for the foreseeable future and will be able to realize assets and discharge our liabilities in the ordinary course of operations. We do not have any mineral properties in production, and have not yet generated any revenues and have a history of losses. Our continuation as a going concern is uncertain and dependent on our ability to discover commercial mineral deposits on our properties and place them into profitable commercial production and our ability to sustain our operations until such time. This, in turn depends on our ability to continue to fund our operations by the sale of our securities and other factors which are largely out of our control. Although we have been successful in the past in obtaining financing, it cannot be assured that adequate financing or financing on acceptable terms can be obtained in the future. In the event we cannot obtain the necessary funds, it will be necessary to delay, curtail or cancel further exploration on our properties. Our consolidated financial statements do not reflect adjustments to the carrying values and classifications of assets and liabilities that might be necessary should
we not be able to continue in our operations, and the amounts recorded for such items may be at amounts significantly different from those contained in our consolidated financial statements.
Treatment of Mineral Property Costs
As we are at the exploration stage, we capitalize the acquisition and exploration costs of our mineral properties under International Reporting Standards. Should any of these properties be placed into production, such costs would be amortized over the life of the properties on a unit-of-production basis. Should exploration results of any of our properties prove unsatisfactory, we would then abandon such property or properties, and write off costs incurred up to that time. The impact on our net loss for the fiscal period would be dependent upon the amount of costs deferred up to the time of the write-off.
Use of Estimates
The preparation of the Company’s consolidated financial statements in conformity with IFRS requires management to make judgments, estimates and assumptions that affect the reported amounts of assets, liabilities and contingent assets and liabilities at the date of the consolidated financial statements and reported amounts of revenues and expenses during the reporting period. Estimates and assumptions are continuously evaluated and are based on management’s experience and other factors, including expectations of future events that are believed to be reasonable under the circumstances. However, actual outcomes can differ significantly from these estimates.
Areas requiring a significant degree of estimation and judgment relate to the determination of the useful lives of property, plant and equipment, the recoverability of the carrying value of exploration and evaluation assets, allocation of costs to exploration and evaluation assets, fair value measurements for financial instruments and stock-based compensation and other equity-based payments, the recognition and valuation of provisions for restoration and environmental liabilities, and the recoverability and measurement of deferred tax assets and liabilities. Actual results may differ from those estimates and judgments.
Stock-Based Compensation
We have granted stock options to directors and employees as described in Note 10 to the attached audited consolidated financial statements. We adopted the accounting standards of the Canadian Institute of Chartered Accountants regarding stock-based compensation and other stock-based payments. The standard requires that all stock-based awards be measured and recognized using a fair value based method. Fair values are determined using the Black-Scholes option pricing model. Any consideration paid by employees on the exercise of the options is credited to share capital.
5.A Operating Results
Fiscal Year Ended December 31, 2011 compared to the Fiscal Year Ended December 31, 2010
During the year ended December 31, 201, we incurred operating expenses of $1,119,974 as compared to operating expenses of $566,064 for the year ended December 31, 2010. The significant changes during the current fiscal year compared to the same period a year prior are as follows:
Consulting fees increased to $77,587 during the year ended December 31, 2011 from the $60,920 incurred during the prior year. This was due to an increase in expenditures on property investigation during the current period.
During the year ended December 31, 2011, the Company incurred $509,357 of stock-based compensation, a non-cash expense, on the granting of 3,405,000 stock options. During the year ended December 31, 2010, the Company incurred $65,114 of stock-based compensation on the granting of 350,000 stock options.
Transfer agent, filing fees and shareholder relations expenses increased to $238,008 during the year ended December 31, 2011 from the $158,252 incurred during the year ended December 31, 2010. This was primarily due to increased expenditures on investor relations activities and advertising during the current fiscal period as compared to the same period a year prior.
During the year ended December 31, 2011 we incurred travel costs of $20,944 for attendance at trade shows, broker presentations and project review. This represents a slight decrease from the $24,870 incurred for travel expenses during the same period a year prior.
During the year ended December 31, 2010 we recorded a gain of $39,893 on mineral property option payments received. This gain related to the Company’s Diamond Peak Property in Nevada, where we received a property option payment from Kokanee Minerals in excess of what we had paid for the property as at March 31, 2010. There was no comparable gain during the year ended December 31, 2011.
Interest income decreased to $15,828 during the year ended December 31, 2011 from the $23,856 earned during the prior year due to the lower cash balance maintained during the current year.
As a result of the foregoing, the loss for the year ended December 31, 2011 was $1,112,646 as compared to a loss of $502,315 for the year ended December 31, 2010.
5.B Liquidity and Capital Resources
Since our incorporation, we have financed our operations almost exclusively through the sale of our common shares to investors. We expect to finance operations through the sale of equity in the foreseeable future as we have no source of revenue from our business operations. There is no guarantee that we will be successful in arranging financing on acceptable terms. As it is uncertain when we will generate revenues sufficient to fund our operating activities, if ever, we are dependent on raising additional equity or debt capital.
At December 31, 2011, we had working capital of $1,100,765, inclusive of cash and cash equivalents on hand of $1,131,358. This compares to working capital of $2,257,858 at December 31, 2010, inclusive of cash and cash equivalents on hand. We have no exposure to any asset-backed commercial paper investments.
We have two properties that we need to satisfy certain minimum work commitments on during 2012 in order to maintain our interests. These properties are EMW and the Majuba Hill Property in Nevada. See “Tabular Disclosure of Contractual Obligations”. In order to maintain our interest in EMW, we are required to undertake US$150,000 in exploration work on this property during 2012 but this requirement has been by the vendor until such time as we are granted a drill permit from the U.S. Forest Service. At Majuba Hill, we are required to have spent an aggregate US$1,250,000 on exploration by March 3, 2013 in order to maintain our interest in that property. As of April 30, 2012 we have spent in excess of US$1,000,000 at Majuba Hill. We began a core drilling program at Majuba Hill in May of 2012 that, on completion, will satisfy our work obligation until March 2013. See “Special Note Regarding Forward Looking Statements”.
Current Economic Conditions
While 2010 saw significant economic improvement over 2009, many of the effects of the 2008/2009 global financial crisis continued in 2010 and into 2011 and a number of new economic stresses, many likely caused or exacerbated by government responses to the crisis, including extraordinarily high levels of government debt, major currency instability and a growing sovereign debt crisis developed. These new economic stresses in turn resulted in international bailouts for Greece and Ireland, and threats of bailouts for Spain and Portugal. In the US, the effect of unprecedented levels of government funded stimulus, institutional bailouts, "quantitative easing" and other expansionist monetary policies has led to deterioration of the US dollar and its role as a reserve currency. These and other factors have made for extremely volatile commodity and capital markets and an environment in which it is more difficult to raise additional capital. MAX has taken precautions and implemented initiatives to preserve its cash requirements. We have reviewed our mineral properties and have written down or abandoned a number of properties described in detail above. We have several commitments in the future (this coming year and beyond) on its mineral properties and we may be forced to abandon and write-off other properties if we do not have the means to meet these commitments, or if we do not feel it is fiscally prudent to do so. However, we currently have sufficient cash to meet all obligations during fiscal 2012 and do not believe that any additional write-down of our mineral properties are required at this time. We will be reviewing our mineral property commitments as well as our capital position on an ongoing basis during fiscal 2012 and may abandon additional properties when obligations become due if management deems it necessary in order to maintain the long-term viability of the Company.
We intend to pursue both the acquisition of mineral properties which we consider to be highly prospective for gold, uranium and other metals and to maintain and explore our current properties while conserving capital during these difficult economic times. We will require substantial additional capital to achieve our goal of discovering significant economic mineralization on one or more of our properties. Until such time as we are able to make such a discovery and thereafter
place one or more of our properties into commercial production or negotiate one or more joint venture agreements, we will be largely dependent upon our ability to raise capital from the sale of our securities to fund our operations. We believe that our current capital resources will be sufficient to fund our general operations through 2012.
We do not anticipate being able to obtain revenue from commercial operations in the short term and anticipate we will be required to raise additional financing in the future to meet our working capital and on-going cash requirements. We intend to raise such financing through sales of our equity securities by way of private placements, and/or the exercise of warrants. We may also secure additional exploration funding through option or joint venture agreements on our mineral properties; or through the sale of our mineral properties, royalty interests or capital assets, or borrow to meet our working capital requirements. While we have in the past been able to raise sufficient funds to sustain our exploration programs, there is no assurance that we will continue to be able to do so. If, for any reason, we are not able to access the capital market, our resources during this period will be limited to cash on hand and any revenues we are able to generate from joint venture or similar arrangements we may hereafter enter into. If we are unable to secure sufficient funds to pursue such proposed acquisitions and exploration to the level desired, we will adjust our proposed activities to reflect the amount of capital available to us after providing for sufficient working capital to maintain our existing operations. At present, none of our properties have a known body of ore and all our proposed exploration programs are an exploratory search for ore. See “Special Note Regarding Forward Looking Statements” and “Risk Factors”.
5.C Research and Development, Patents and Licenses, etc.
We are a mineral exploration company and we do not carry on any research and development activities.
5.D Trend Information
The Majuba Hill Property is primarily is prospective for copper and silver, the Ravin Property is prospective for molybdenum, the C de Baca Property is prospective for uranium, our Tabletop and EMW properties are prospective for gold and our Diamond Peak Property is prospective for gold, silver and zinc.
The overall trend for the price of gold and silver has been upward during 2011 due to the uncertainty in the financial sector, while the price of other minerals, such as uranium, molybdenum and other base metals have remained depressed due to lack of demand as a result of the current global recession. We anticipate that the continuing weakness in the price of minerals, combined with the recent weakness in the price of gold and silver, as well as a lack of new capital for the mineral exploration sector in general, will make the acquisition of quality gold exploration prospects less expensive, as well as decreasing the costs of exploration generally. Metal prices cannot be predicted with accuracy and our plans will be largely dependent upon the timing and outcome of metal markets, particularly the price of gold, uranium, zinc and molybdenum which is entirely outside of our control. See “Special Note Regarding Forward Looking Statements”.
The market for gold, silver and copper are homogeneous, integrated commodities markets with a large number of both suppliers and buyers. These markets are not ones which are particularly susceptible to the influence of one or more large suppliers or buyers. As at May 17 2012, gold traded at US$1,575 per ounce, silver traded at US$28.07 per ounce and copper traded at US$3.465 per pound.
There are a smaller number of producers of molybdenum than there are for commodities such as gold. Molybdenum prices have increased from US$7.60/lb in 2000 to over US$35/lb in 2007. The price of molybdenum was holding steady in 2008 until October when it collapsed to approximately US$11/lb. At May 18, 2012 the price of molybdenum oxide was US$13.775/lb.
Our C de Baca mineral property is prospective for uranium. There are fewer producers of uranium in the world than there are for some other commodities such as copper and gold. The market for uranium is a homogeneous, integrated commodities market. The market is not one which is particularly susceptible to the influence of one or more large suppliers or buyers. The world average grade from producing uranium mines is 0.15 per cent U3O8, with spot uranium prices having risen from a cyclical low of US$7.10 per pound in late 2000 to a high of US$138.00 per pound on June 1, 2007. At May 14 2012, the most recent date for which we could find a quote for the sale of uranium, the spot price was US$52.00/lb.
5.E Off-balance Sheet Arrangements
We have no off-balance sheet arrangements that have or are reasonably likely to have a current or future effect on our financial condition, changes in financial condition, revenues or expenses, results of operations, liquidity, capital expenditures or capital resources that are material to investors.
5.F Tabular Disclosure of Contractual Obligations
The following table summarizes our contractual obligations at December 31, 2011 and the effect these obligations are expected to have on our liquidity and cash flows in future periods.
Contractual Obligations | Payment Due By Period |
| | Total
Remaining | Less than a year | 1-3 Years | 4-5 Years | After 5 Years |
Diamond Peak (1) Option Payments | US$280,000 | US$80,000 | US$100,000 | US$100,000 | Nil |
C de Baca Option (2) Option Payments | US$430,000 | US$10,000 | US$20,000 | US$20,000 | US$380,000 |
East Manhattan Wash (3) Option Payments Work Commitment | US$130,000 $600,000 | US$20,000 Nil | US$40,000 Nil | US$70,000 US$600,000 | Nil Nil |
Ravin Project (4) Option Payments | US$380,000 | US$10,000 | US$20,000 | US$20,000 | US$330,000 |
Table Top Project(5) Option Payment | US$460,000 | US$110,000 | US$100,000 | US$100,000 | US$150,000 |
Majuba Hill Work Commitment (6) | US$5,605,000 | $Nil | US$1,355,000 | US$2,750,000 | $1,500,000 |
Capital (Finances) Lease Obligations | NIL | | | | |
Operating Lease (7) Obligations | $8,945 | $8,945 | Nil | Nil | Nil |
Purchase Obligations Equipment | NIL | | | | |
Other Long-term Liabilities | NIL | | | | |
Total Contractual Obligations and Commitments | US$7,893,945 | US$553,945 | US$2,530,000 | US3,910,000 | US$900,000 |
| | (1) | These are option payments pursuant to an option agreement dated May 9, 2006, as amended, between us and The Wendt Family Trust of Reno, Nevada. While we are not obliged to make these payments, it will be necessary to do so if we wish to preserve our interest in this portion of the property. (See Item 4 “Information on the Company” – “Description of Property” - “Diamond Peak Property”) |
| | (2) | These are option payments pursuant to an option agreement dated September, 2005 between us and Applied Geological Services, Inc. While we are not obliged to make these payments, it will be necessary to do so if we wish to preserve our interest in this portion of the property. (See Item 4 “Information on the Company” – “Description of Property” - “C de Baca Project”) |
| | (3) | These are option payments pursuant to an option agreement dated November 11, 2007, as amended, between us and MSM L.L.C. While we are not obliged to make these payments, it will be necessary to do so if we wish to preserve our interest in this portion of the property. (See Item 4 “Information on the Company” – “Description of Property” - “East Manhattan Wash”) |
| | (4) | These are option payments pursuant to an option agreement dated September 9, 2007, as amended, between us and The Wendt Family Trust. While we are not obliged to make these payments, it will be necessary to do so if we wish to preserve our interest in this portion of the property. (See Item 4 “Information on the Company” – “Description of Property” - “Ravin Molybdenum/Tungsten Property”) |
| | (5) | These are option payments pursuant to an option agreement dated September 1, 2009 between us and Energex, LLC. While we are not obliged to make these payments, it will be necessary to do so if we wish to preserve our interest in this portion of the property. (See Item 4 “Information on the Company” – “Description of Property” – “Table Top Gold Property”. |
| | (6) | These are annual cumulative work commitments that must be made met pursuant to an option agreement dated March , 2011 between us and Claremont Nevada Mines LLC. While we are not obliged to complete these work obligations, it will be necessary to do so if we wish to preserve our interest in this portion of the property. (See Item 4 “Information on the Company” – “Description of Property” – “Majuba Hil Top Gold Property”. |
| | (7) | These are lease payments due monthly for office space in Vancouver leased from a property rental company for a term of two years, effective September 1, 2010. |
Item 6. Directors, Senior Management and Employees
6.A Directors and Senior Management
The following is a list of the current directors and senior officers of the Company, their municipalities of residence, their current position with the Company and their principal occupations:
| Name of Director | Age | Principal Occupation | Position with Company |
| | | | |
| STUART ROGERS, Vancouver, BC | 55 | President of the Company President of West Oak Capital Group Inc. | President, Chief Executive Officer & Director |
| PAUL JOHN, Penticton, BC | 65 | Businessman | Director |
| IAN SMITH, Vancouver, BC | 65 | President and CEO of Yellowhead Mining Corp. | Director |
CLARENCE J. WENDT Reno, Nevada | 73 | Independent professional geologist | Director, Vice President Exploration |
| DANIEL T. MACINNIS, Vancouver, BC | 60 | President, MAG Silver Corp. | Director |
| CHRISTOPHER CHERRY, Vancouver, BC | 33 | Chartered Accountant | Chief Financial Officer |
The following describes the business experience of our directors and executive officers, including other directorships held in reporting companies:
Stuart Rogers
Mr. Rogers has been involved in the venture capital community since 1987. He is currently the President of West Oak Capital Group, Inc., a privately held investment banking firm specializing in the early stage finance of technology projects through the junior capital markets in Canada and the United States, and has served as a director of client companies listed on the TSX Venture Exchange, the Toronto Stock Exchange, NASDAQ Small Capital Market and FINRA OTC Bulletin Board. Currently, Mr. Rogers acts as a director and officer of TerraX Minerals Inc. and as a director of Oro Mining Ltd. and Alberta Star Development Corp., all of which are reporting issuers on the TSX Venture Exchange in Canada.
Clarence (Clancy) J. Wendt, P. Geo
Mr. Wendt received his B.S. degree from San Diego State University in 1967. He began his career at Stauffer Chemical and worked at various companies until returning to the University of Arizona where he obtained his M.S. degree in 1978. After this he worked at Duval Corporation and other companies until becoming District Manager for Westmont Mining. He is credited with the Mt. Hamilton gold/molybdenum discovery in Nevada and managed the programs which led to the discovery of other deposits in the Carlin Trend. Mr. Wendt is currently a director of Santa Fe Minerals Corp., a reporting issuer on the TSX Venture Exchange.
Mr. Wendt has been a consulting geologist since 1992, specializing in exploration and evaluation of mineral deposits. He is a registered geologist in Arizona, British Columbia, Canada, and a Chartered Professional Geologist in Australia and writes reports for various exchanges. He is a member of SME, SEG, FAusIMM(CP), PDAC, a former Trustee of the NWMA and Member of the Board of Directors of the Mining Club of the Southwest. In addition, Mr. Wendt is the recipient of the President’s Award from the NWMA, the Ben F. Dickerson Award, and is a past President of the Geological Society of Nevada.
Mr. Wendt has prior experience in gold, base metal and uranium exploration with such notable exploration companies as Phillips Uranium, Teton Exploration, Duval and Westmont. He has conducted all phases of uranium, gold and base metal exploration, from conceptual targeting to drilling and evaluation, with extensive experience in the United States and Mexico as well as Central and South America.
Paul John
Mr. John graduated from the University of Victoria, B.C. with a Bachelor of Arts degree, majoring in Economics and Political Science. From 1971 to 1979, he worked with the Hudson Bay Company, a national Canadian department store chain, rising to the senior executive level. In 1980, he acquired a Work Wear World franchise in the interior of British Columbia, developing this initial location into 19 stores in B.C. and the Yukon Territories, with annual sales of $18 million in 1999.
In 1999, Mr. John sold his chain of Work Wear World stores to Mark’s Work Warehouse, a publicly traded company listed on the Toronto Stock Exchange, and was appointed as General Manager for Western Canada for their “Work World” franchised locations. He held this position until 2001, when he was appointed General Manager, Franchises for Work World, a position he held until 2010. He is currently a self-employed businessman.
Ian Smith, B.E. (Mining) Hons, F.AusIMM, CP Mgmt
Mr. Smith is the President and Chief Executive Officer of Yellowhead Mining Inc. which is listed on the TSX Venture Exchange and is in the process of preparing a detailed Feasibility Study on the Harper Creek copper-gold-silver project in south central B.C.
Mr. Smith graduated from the University of Queensland, Australia with a degree in mining engineering and has over 40 years of international experience in corporate development, operations, project management and consulting within the base, precious metals and coal industries. He is also President and a Director of Santa Fe Metals Corp., a reporting issuer listed on the TSX Venture Exchange and was recently President and CEO of bcMetals Corp., which had engineered the Red Chris copper/gold porphyry project for development in northwest BC prior to being acquired by Imperial Metals Corp. His involvement with large scale open pit copper operations at a senior management level includes Bougainville Copper in Papua New Quinea, La Caridad in Mexico and the Zambian Copperbelt.
Daniel T. MacInnis, P. Geo
Mr. MacInnis is currently the President and CEO of MAG Silver Corp. MAG Silver is listed on the TSX Venture Exchange in Canada and on the NYSE AMEX in the United States. He has over 31 years of experience in mineral exploration and experience with mineral property acquisitions and joint venture negotiations. Mr. MacInnis is a registered Professional Geologist (P.Geo.) in British Columbia and obtained a B.Sc. in Geology from Saint Francis Xavier University (Nova Scotia) in 1974.
Christopher Cherry, CA, CGA
Mr. Cherry has over ten years experience as an accountant and auditor, with KPMG and Davidson and Company in Vancouver. He achieved the Certified General Accountant designation in August 2004 and the Chartered Accountant designation in February 2009. Mr. Cherry is a financial controller with iO Corporate Services Ltd., a private company that provides administrative services to several public companies. In addition to serving as our CFO, Mr. Cherry currently serves as Chief Financial Officer to Reva Resources Corp., Remington Resources Inc., Black Isle Resources Corp., Mexivada Mining Corp., , AVC Venture Capital Corp., Caerus Resource Corporation, Gold Port Resources Ltd. and Stoneshield Capital Corp. He is also a director of Valiant Minerals, Acadia Resources Corp. and Remington Resources Inc.
There are no arrangements or understandings with major shareholders, customers, suppliers or others pursuant to which the foregoing individuals were selected to be a director or executive officer, nor are there any family relationships among any of our directors and officers.
6.B. Compensation
The following fairly reflects all material information regarding compensation paid to our directors and officers in our fiscal year ended December 31, 2011.
Summary Compensation Table NAME AND
PRINCIPAL
POSITION | YEAR | ANNUAL COMPENSATION | LONG-TERM COMPENSATION |
| Salary | Bonus | Other Annual
Compensation | Awards | LTIP
payouts | All Other
Compensation |
Restricted
Stock
Awards | Securities
Underlying
Options/
SAR’s |
Stuart Rogers President, Chief Executive Officer and Director | 2011 | Nil | Nil | $120,000(1) | Nil | 200,000 | Nil | Nil |
Paul John Director | 2011 | Nil | Nil | Nil | Nil | 225,000 | Nil | Nil |
Tim Coupland Director | 2011 | Nil | Nil | Nil | Nil | 100,000 | Nil | Nil |
Daniel T. MacInnis Director | 2011 | Nil | Nil | Nil | Nil | 250,000 | Nil | Nil |
NAME AND
PRINCIPAL
POSITION | YEAR | ANNUAL COMPENSATION | LONG-TERM COMPENSATION |
| Salary | Bonus | Other Annual
Compensation | Awards | LTIP
payouts | All Other
Compensation |
Restricted
Stock
Awards | Securities
Underlying
Options/
SAR’s |
Christopher Cherry Chief Financial Officer | 2011 | Nil | Nil | $42,000 | Nil | Nil | Nil | Nil |
Clarence J. Wendt Vice President Exploration | 2011 | Nil | Nil | US$120,000(2) | Nil | 250,000 | Nil | Nil |
| | (1) | the $120,000 represents a management fee paid to a company controlled by Stuart Rogers. |
| | (2) | this compensation is paid to Mr. Wendt pursuant to a consulting agreement entered into by Mr. Wendt for provision of geological consulting services, and for performance of duties normally associated with the position of VP Exploration. |
We are required, under applicable securities legislation in Canada, to disclose to our shareholders details of compensation paid to our directors and members of our administrative, supervisory or management bodies. We have no formal plan for compensating our directors for their services in their capacity as directors. The board of directors may award special remuneration to any director undertaking any special services on our behalf other than services ordinarily required of a director. Other than indicated above, no director received any compensation for his or her services as a director, including committee participation and/or special assignments.
6.C Board Practices
Stuart Rogers, Paul John, and Daniel T. MacInnis have acted as our directors since May 8, 2002, June 18, 2002 and December 7, 2005, respectively. Clancy Wendt was appointed to our board of directors at our Annual General Meeting held on June 30, 2010, with Ian Smith appointed to our board on February 22, 2012.
The directors will, unless they choose to resign, hold office until the next annual general meeting of the shareholders at which time they may stand for re-election. We are required to hold an annual general meeting once in every calendar year and not longer than fifteen months from the last annual general meeting.
We are party to a consulting agreement with West Oak Capital Group, Inc., a private company owned by Stuart Rogers, whereby it is entitled to be paid $10,000 per month for management services. We are also party to a consulting agreement with Clarence Wendt, whereby he is entitled to be paid USD$10,000 per month for provision of geological consulting services and duties normally associated with the position of Vice President, Exploration. No other directors have service contracts with us, nor are they entitled to any termination benefits.
There are no service contracts with the Company for the directors providing for benefits upon termination of their service save and except for Mr. Rogers, as set out in the Consulting Agreements referred to above. Under the terms of that Agreement, in the event of termination:
| | (a) | By the Company upon an “Event of Default” by the Consultant (as defined in Agreement) or by the Consultant for any reason other than an Event of Default by Company, the Company shall pay to the Consultant all amounts accruing hereunder up to and including the effective date of Termination. |
| | (b) | By the Consultant due to an Event of Default by the Company or by the Company for any reason other than an Event of Default by the Consultant (as defined in the Agreement), the Company shall pay the Consultant: |
| | ● | The full amount of monthly Fees multiplied by the number of months remaining in the Term of the Agreement; |
| | ● | The full amount of any Bonus then due and owing, provided that, in the absence of any bona fide award by the Compensation Committee made more than 60 days prior to the effective date of Termination, the amount of such Bonus shall be deemed to be equal to 50% of the total amount of Fees and Bonuses paid to the Consultant and the Key Employee within the 24 months prior to the effective date of Termination; |
| | ● | The full amount of any Expenses incurred up to the effective date of Termination; |
| | ● | Any Options then outstanding shall be deemed to be extended and exercisable for 90 days following the expiry of the Term. |
| | ● | Reference is made to the full text of the Consulting Agreements which are attached as exhibits to this Report. See Item 19 “Exhibits”. Other than the foregoing, we do not currently have any retirement, pension, bonus, profit-sharing or similar plans and none are proposed at this time. |
The Company does not have an executive committee or a remuneration committee.
Audit Committee
Our audit committee is comprised of Ian Smith, Paul John and Stuart Rogers. The specific functions and responsibilities of the audit committee are set forth in our audit committee charter.
Ian Smith and Paul John are Independent directors. We have determined that Stuart Rogers qualifies as an audit committee financial expert, pursuant to SEC regulations. Each of Tim Coupland and Paul John satisfy the independence and financial literacy requirements for audit committee members under the SEC rules and regulations and Rule 803 of the NYSE AMEX Company Guide. Since Stuart Rogers is not independent, the Audit Committee does not satisfy the requirements of Rule 10A-3 of the US Securities Exchange Act of 1934.
The Audit Committee’s primary function is to review the annual audited financial statements with our external auditor (the “Auditor”) prior to presentation to the Board and to make recommendations thereon, together with recommendations to the Board with respect to such financial statements and compensation payable to the Auditor. The audit committee also reviews our interim un-audited quarterly financial statements prior to finalization and publication. The Audit Committee also provides review oversight with respect to pre-approval of all non-audit services to be provided by the Auditor to the Company and a number of other related matters including issues related to a change of auditors and establishing procedures for treatment of complaints regarding accounting, internal accounting controls or auditing matters.
Our audit committee also establishes procedures for the receipt, retention and treatment of complaints regarding accounting, internal accounting controls or auditing matters; and establishes procedures for the confidential, anonymous submission by employees of concerns regarding questionable accounting or auditing matters. The specific functions and responsibilities of the audit committee are set forth in our audit committee charter. See, “Audit Committee Financial Expert” for information related to audit committee independence and financial expert.
The Audit Committee meets as a separate committee of the board as and when needed to carry out its functions and keeps formal minutes of its proceedings.
6.D Employees
We do not have any employees other than our directors and officers.
6.E Share Ownership
The following table sets forth the shareholdings, to the best of our knowledge, owned beneficially, directly or indirectly, by our directors and officers as of May 22, 2012. There were 24,505,985 common shares issued and outstanding as of May 22, 2012.
| Name | Number of Shares Owned | Percentage of Outstanding
Common Shares |
| Stuart Rogers | 692,605 | 2.82% |
| Paul John | 438,750 | 1.79% |
| Ian Smith | Nil | Nil |
| Daniel MacInnis | Nil | Nil |
| Christopher Cherry | 150,000 | 0.61% |
| Clancy Wendt | 540,000 | 2.20% |
Statements as to securities beneficially owned by directors and officers, or as to securities over which they exercise control or direction, are based upon information obtained from such directors and officers and from records available to the Company.
The following incentive stock options are outstanding to our directors and officers as at May 22, 2012:
| Name | Shares that may be
Purchased Upon
Exercise of Option | Exercise Price | Expiry Date |
Stuart Rogers (West Oak Capital) | 200,000 100,000 | $0.24 $0.25 | August 17, 2014 February 22, 2015 |
| Paul John | 225,000 25,000 | $0.24 $0.25 | August 17, 2014 February 22, 2015 |
| Ian Smith | 250,000 | $0.25 | February 22, 2015 |
| Daniel MacInnis | 250,000 | $0.24 | August 17, 2014 |
| Christopher Cherry | 250,000 | $0.25 | February 22, 2015 |
| Clancy Wendt | 250,000 50,000 | $0.24 $0.25 | August 17, 2014 February 22, 2015 |
We have an incentive stock option plan which was approved by the shareholders of the Company at the Annual General Meeting of Shareholders held on June 27, 2011 (the “Stock Option Plan”). This Stock Option Plan provides for equity participation in the Company by our directors, officers, employees and consultants through the acquisition of common shares pursuant to the grant of options to purchase common shares. The exercise price for options granted under the Stock Option Plan is determined by the closing trading price on the day immediately preceding the date of grant, less any discounts permitted by the TSX Venture Exchange or such other stock exchange on which the common shares are listed. We have reserved and authorized up to 17.7% (4,339,846) of our issued treasury shares for issuance under the Stock Option Plan to our directors and key employees.
Under the Stock Option Plan, the aggregate number of optioned common shares granted to any one optionee in a 12-month period must not exceed 5% of the issued and outstanding common shares. The number of optioned common shares granted to any one consultant in a 12-month period must not exceed 2% of the issued and outstanding common shares. The aggregate number of optioned common shares granted to an optionee who is employed to provide investor relations activities must not exceed 2% of our issued and outstanding common shares in any 12-month period.
Options will be exercisable for a term of up to ten years, subject to earlier termination in the event of death or the optionee’s cessation of services to the Company; and options granted under the stock option plan are non-assignable, except by will or the laws of descent and distribution.
The policies of the TSX-Venture Exchange limited the granting of stock options to our directors, officers, employees and consultants and provided limits on the length, number and exercise price of such options.
On July 3, 2009, we granted 250,000 incentive stock options to a consultant at an exercise price of $0.17 per share for a period of two years. On October 19, 2009, we granted a further 250,000 options to consultants at an exercise price of $0.40 per share for a period of two years, of which 50,000 of these options were cancelled in January 2010 when the consultant ceased to provide services to us.
On April 6, 2010, we granted 50,000 incentive stock options to a consultant at an exercise price of $0.25 per share for a period of two years. On April 12, 2010, we granted 250,000 incentive stock options to a consultant at an exercise price of $0.40 per share for a period of two years. A further 50,000 incentive stock options, exercisable at $0.25 for a two year period, were granted to a consultant on September 21, 2010.
On March 14, 2011, the Company granted stock options to consultants to purchase 1,300,000 common shares at a price of $0.35 per share to March 14, 2013. On August 17, 2011, the Company granted stock options to consultants to purchase 1,625,000 common shares at a price of $0.24 per share to August 17, 2014. A further 480,000 incentive stock options, exercisable at $0.24 per share until October 26, 2013, were granted to consultants on October 26, 2011.
As at December 31, 2011, there were 3,040,000 stock options outstanding and exercisable.
Item 7. Major Shareholders and Related Party Transactions
7.A Major Shareholders
As used in this section, the term "beneficial ownership" with respect to a security is defined as: (1) any person who, directly or indirectly, through any contract, arrangement, understanding, relationship or otherwise has or shares voting power (which includes the power to vote, or to direct the voting of such security) or investment power (which includes the power to dispose, or to direct the disposition of, such security); and (2) any person who, directly or indirectly, creates or uses a
trust, proxy, power of attorney, pooling arrangement or any other contract, arrangement or device with the purpose or effect of divesting such person of beneficial ownership of a security or preventing the vesting of such beneficial ownership.
As of the date of this annual report, there are 24,505,985 common shares issued and outstanding in our capital stock. We are authorized to issue an unlimited number of common shares and preferred shares. We have not issued any preferred shares since our incorporation.
As of the date of this annual report, no persons known to us were the beneficial owner of more than five percent of our outstanding common shares.
Of our 33 registered shareholders at April 30, 2012, 15 are Canadian residents representing 22,226,477 common shares or 90.70% of our issued and outstanding common shares. We have 18 registered US shareholders holding 2,279,508 common shareholders or 9.30% of our issued and outstanding common shares. The remaining common shares of the Company are held by brokerages and other intermediaries and the Company cannot determine the residency of the beneficial holders of those shares.
Each of our issued common shares entitles the holder to one vote in general meeting. There are no disproportionate or weighted voting privileges.
We are not controlled directly or indirectly by any other corporation or any other foreign government or by any other natural or legal person, severally or jointly.
There are no arrangements the operation of which at a subsequent date may result in a change in our control.
Our registrar and transfer agent is Computershare Trust Company of Canada, which is located at 3rd Floor, 510 Burrard Street, Vancouver, British Columbia, Canada Tel: (604) 661-9400.
7.B Related Party Transactions
Three month period ended March 31, 2012:
During the three month period ended March 31, 2012, we have not entered into transactions or loans with any (a) enterprises that directly or indirectly control, are controlled by or under common control with us; (b) our associates; (c) individuals directly or indirectly owning voting rights which give them significant influence over us or close members of their respective families, (d) our directors, senior management or close members of their respective families or (e) enterprises in which a substantial interest in the voting power is owned by any of the foregoing individuals (a “Related Party”) or over which such a person is able to exercise significant influence, except as follows:
| § | We paid $30,000 to a private company controlled by Stuart Rogers, our President, for management fees pursuant to an agreement with Mr. Rogers. |
| § | We paid US$30,000 to Clancy Wendt, our Vice-President of Exploration, for consulting fees pursuant to an agreement with Mr. Wendt. |
Fiscal Year ended December 31, 2011:
In the fiscal year ended December 31, 2011, we did not enter into transactions or loans with any Related Party except as follows:
| § | We paid $120,000 to a private company controlled by Stuart Rogers, our President, for management fees; |
| § | We paid US$120,000 to a private company controlled by Clancy Wendt, our Vice President Exploration, for consulting fees; |
Fiscal Year ended December 31, 2010:
In the fiscal year ended December 31, 2010, we did not enter into transactions or loans with any Related Party except as follows:
| § | We continue to hold rights under an Option Agreement that was entered into in 2009 whereby we can acquire a 100% interest in the Table Top claims in Humboldt Country, Nevada from Energex LLC, a private Nevada corporation wholly owned by Clancy J. Wendt, our Vice President of Exploration. |
| § | We continued to hold rights under an option agreement that was entered into during 2007 granting us the right to acquire a 100% interest in the Ravin molybdenum/tungsten property in Lander County, Nevada (the “Ravin Property”) from Energex, LLC, a Nevada corporation wholly-owned by Clancy J. Wendt, our Vice President of Exploration. |
| § | We continued to hold rights under an option agreement that was entered into during 2006 granting us the right to acquire a 100 % interest in the FMC claims in Eureka County, Nevada, the “Diamond Peak Property”, from The Wendt Family Trust of Reno, Nevada. The Wendt Family Trust is controlled by Clancy J. Wendt, our Vice President of Exploration |
| § | We paid $120,000 to a private company controlled by Stuart Rogers, our President, for management fees; |
| § | We paid US$120,000 to a private company controlled by Clancy Wendt, our Vice President Exploration, for consulting fees; |
Fiscal Year ended December 31, 2009:
In the fiscal year ended December 31, 2009, we have not entered into transactions or loans with any Related Party, except as follows:
| § | We entered into an Option Agreement to acquire a 100% interest in the Table Top claims in Humboldt Country, Nevada from Energex LLC, a private Nevada corporation wholly owned by Clancy J. Wendt, our Vice President of Exploration. |
| § | We paid $120,000 to a private company controlled by Stuart Rogers, our President, for management fees; |
| § | We continued to hold rights under an option agreement that was entered into during 2007 granting us the right to acquire a 100% interest in the Ravin Property from Energex, LLC, a Nevada corporation wholly-owned by Clancy J. Wendt, our Vice President of Exploration. |
| § | We continued to hold rights under an option agreement that was entered into during 2006 granting us the right to acquire a 100 % interest in the FMC claims in Eureka County, Nevada, the “Diamond Peak Property”, from The Wendt Family Trust of Reno, Nevada. The Wendt Family Trust is controlled by Clancy J. Wendt, our Vice President of Exploration |
Our directors or officers must disclose in writing to us the nature and extent of any interest they have in a material contract, or proposed material contract, with us. Such disclosure must be made immediately after the director or officer becomes aware of the contract or proposed contract. A director who is required to disclose an interest in a material contract or proposed material contract may not vote on any resolution to approve the contract except in very limited circumstances.
Stock option compensation to our directors and officers is disclosed elsewhere in this Form 20F. See Item 6.E “Share Ownership”.
7.C Interests of Experts and Counsel
Not Applicable.
Item 8. Financial Information
8.A Consolidated Statements and other Financial Information
The following financial statements for the years ended December 31, 2011 and 2010 and as of January 1, 2010 have been audited by an independent auditor and are accompanied by an audit report, are attached and incorporated herein:
(a) Consolidated Statements of Financial Position;
(b) Consolidated Statements of Comprehensive Loss;
(c) Consolidated Statements of Changes in Equity
(d) Consolidated Statements of Cash Flows; and
| (e) | Related notes and schedules required by the comprehensive body of accounting standards pursuant to which the financial statements are prepared. |
Export Sales
The Company had no export sales in its latest financial year ended December 31, 2011 and, as a result, the percentage of export sales for the Company was zero.
Legal Proceedings
There are no legal proceedings as at May 22, 2012.
Dividend Policy
We have never declared or paid any cash dividends on our common shares. As we do not have any earnings, we do not anticipate paying cash dividends on the common shares for the foreseeable future. Future dividends on the commons shares will be determined by the Board of Directors in light of circumstances existing at the time, including our earnings and financial condition. There is no assurance that dividends will ever be paid. See “Special Note Regarding Forward Looking Statements”.
8.B Significant Changes
There have been no significant changes since the date of the audited financial statements included herein.
Item 9. The Offer and Listing
9.A Offer and Listing Details
Our common shares trade on the TSX Venture Exchange under symbol “MXR” and on the FINRA Over The Counter Bulletin Board under symbol “MXROF”. On March 2, 2006, our shares were listed with the Frankfurt Stock Exchange under the trading symbol “M1D”.
Our principal trading market in volume is the TSX Venture Exchange. The closing price of our common shares on the TSX Venture Exchange on May 17, 2012, was $0.115. The following table sets forth the high and low closing prices in Canadian funds of our common shares traded on this Canadian exchange:
| Annual Periods | High | Low |
| | | |
| January 1, 2006 to December 31, 2006 | $0.98 | $0.33 |
| January 1, 2007 to December 31, 2007 | $1.65 | $0.55 |
| January 1, 2008 to December 31, 2008 | $0.75 | $0.07 |
| January 1, 2009 to December 31, 2009 | $0.66 | $0.09 |
| January 1, 2010 to December 31, 2010 | $0.45 | $0.15 |
| January 1, 2011 to December 31, 2011 | $0.53 | $0.15 |
| Quarterly Periods | High | Low |
| | | |
| January 1, 2009 to March 31, 2009 | $.018 | $0.09 |
| April 1, 2009 to June 30, 2009 | $0.26 | $0.10 |
| July 1, 2009 to September 30, 2009 | $0.40 | $0.12 |
| October 1, 2009 to December 31, 2009 | $0.66 | $0.26 |
| January 1, 2010 to March 31, 2010 | $0.45 | $0.18 |
| April 1, 2010 to June 30, 2010 | $0.28 | $0.16 |
| July 1, 2010 to September 30, 2010 | $0.29 | $0.15 |
| October 1, 2010 to December 31, 2010 | $0.28 | $0.21 |
| January 1, 2011 to March 31, 2011 | $0.53 | $0.23 |
| April 1, 2011 to June 30, 2011 | $0.475 | $0.22 |
| July 1, 2011 to September 30, 2011 | $0.26 | $0.19 |
| October 1, 2011 to December 31, 2011 | $0.255 | $0.15 |
| January 1, 2012 to March 31, 2012 | $0.30 | $0.16 |
| Monthly Periods | High | Low |
| | | |
| January 2011 | $0.29 | $0.23 |
| February 2011 | $0.33 | $0.23 |
| March 2011 | $0.53 | $0.31 |
| April 2011 | $0.48 | $0.32 |
| May 2011 | $0.40 | $0.24 |
| June 2011 | $0.26 | $0.22 |
| July 2011 | $0.26 | $0.19 |
| August 2011 | $0.24 | $0.20 |
| September 2011 | $0.30 | $0.19 |
| October 2011 | $0.255 | $0.15 |
| November 2011 | $0.23 | $0.165 |
| December 2011 | $0.20 | $0.15 |
| January 2012 | $0.25 | $0.16 |
| February 2012 | $0.30 | $0.21 |
| March 2012 | $0.27 | $0.19 |
| April 2012 | $0.25 | $0.17 |
Not Applicable.
9.C. Markets
The common shares of the Company were listed for trading on the TSX-Venture Exchange on the 15th day of June, 1994.
Our common shares have been quoted for trading on the FINRA OTC Bulletin Board since November 8, 2000.
Our common shares were listed on the Frankfurt Stock Exchange on March 2, 2006 with the symbol “M1D”.
9.D. Selling Shareholders
Not Applicable.
9.E. Dilution
Not Applicable.
9.F. Expenses of the Issue
Not Applicable.
Item 10. Additional Information
10.A Share Capital
Not applicable.
10.B Memorandum and Articles of Association
We were incorporated under the Business Corporations Act of Alberta (the “Alberta BCA”) by registration of our articles of incorporation and bylaws. Pursuant to the provisions of the Alberta BCA, a company may conduct any business that it is not restricted by the terms of its articles or bylaws from conducting. Our articles and bylaws contain no such restrictions.
On June 27, 2007, we were registered under the Business Corporations Act of British Columbia as an extra-provincial company in British Columbia.
Our directors are required to disclose to the board of directors the nature and extent of their interest in any proposed transaction or contract and must thereafter refrain from voting in respect thereof. An interested director may be counted in the quorum when a determination as to such director’s remuneration is being considered but may not vote in respect thereof. The directors have an unlimited power to borrow money, issue debt obligations and mortgage or charge our assets provided such actions are conducted bona fide and in our best interests. There are no mandatory retirement ages for directors or any required shareholdings.
All holders of common shares are entitled to receive dividends out of assets legally available therefore at such times and in such amounts as the board of directors may from time to time determine. All holders of common shares will share equally on a per share basis in any dividend declared by the board of directors. The dividend entitlement time limit will be fixed by the board of directors at the time any such dividend is declared. Each outstanding common share is entitled to one vote on all matters submitted to a vote of our shareholders at a general meeting. There are no cumulative voting rights attached to any of our shares and, accordingly, the holders
of more than half of the shares represented at a general meeting can elect all of the directors to be elected in a general meeting. All directors stand for re-election annually. Upon any liquidation, dissolution or winding up, all common shareholders are entitled to share ratably in all net assets available for distribution after payment to creditors. The common shares are not convertible or redeemable and have no preemptive, subscription or conversion rights. In the event of a merger or consolidation, all common shareholders will be entitled to receive the same per share consideration.
The rights of shareholders may only be altered by the shareholders passing a special resolution at a general meeting. A special resolution may only be passed when it has been circulated to all shareholders by way of information circular and then must be passed by seventy-five percent of the votes cast at the general meeting.
The board of directors may call an annual or extraordinary general meeting when required. One or more shareholders holding in aggregate five percent or more of our issued shares may requisition an extraordinary meeting and the directors are required to hold such meeting within four months of such requisition. Only registered shareholders or persons duly appointed by proxy may be admitted to meetings unless otherwise permitted by the chairman of the meeting.
There are no federal Canadian limitations or restrictions on the right to own our common shares.
Some regulatory restrictions, and disclosure obligations, would apply to persons purchasing 5% or more of our issued and outstanding common shares. Persons resident outside of Canada might be subject to foreign investment review regulations if they were to purchase a controlling interest in the Company.
There are no provisions in our bylaws or articles of incorporation that would have the effect of delaying, deferring or preventing a change in control.
There are no provisions in our bylaws or articles of incorporation that establish any threshold for disclosure of ownership. However, the Alberta and British Columbia Securities Commission require that persons that are the registered owners of, and/or have voting control over 10% or more of our common shares must file insider reports disclosing securities holdings and must disclose any plans to acquire additional securities above that 10%.
10.C Material Contracts
The following are the material contracts which we, or any of our subsidiaries, have entered into in the last two years immediately prior to date of this report. See “Principal Expenditures and Divestitures”:
| § | Mineral Lease and Participation Agreement between New Nevada Resources, LLC, and us dated April 9, 2012 to acquire a 85% interest in Section 33, a mineral property adjacent to the Majuba Hill project in Pershing County, Nevada |
| § | Mineral Property Option Agreement between Claremont Nevada Mines, LLC and us dated March 4, 2011to acquire up to a 75% interest in the Majuba Hill project located in Pershing County, Nevada. |
| § | Amending Agreement dated for reference November 9, 2010 between us and Energex, LLC amending our Option Agreement dated September 9, 2007 for the acquisition of a 100% Ravin molybdenum/tungsten property in Lander County, Nevada |
| § | Option Agreement dated March 4, 2011 between the Company and Claremont Nevada Mines LLC., granting an option to purchase up to a 75% interest in the Majuba Hill Property |
We have not entered into any other material agreements other than in the ordinary course of its business.
We have excluded management and public relations agreements, geological data access agreements, geological consulting agreements, professional services and other generic agreements as being in the ordinary course of our business.
10.D Exchange Controls
There are no governmental laws, decrees or regulations in Canada that restrict the export or import of capital (including, without limitation, foreign exchange controls), or that affect the remittance of dividends, interest or other payments to non-resident holders of our Common Shares. However, any such remittance to a resident of the United States may be subject to a withholding tax pursuant to the reciprocal tax treaty between Canada and the United States. For further information concerning such withholding tax, see “Item 10.E Taxation”
There are no limitations under the laws of Canada, the Province of Alberta, or in our charter or other constituent documents with respect to the right of non-resident or foreign owners to hold and/or vote our common shares. However, the Investment Canada Act (the “Act”), enacted on June 20, 1985, as amended, requires the prior notification and, in certain cases, advance review and approval by the Government of Canada of the acquisition by a “non-Canadian” of “control” of a “Canadian business,” all as defined in the Act. For the purposes of the Act, “control” can be acquired through the acquisition of all or substantially all of the assets used in the Canadian business, or the direct or indirect acquisition of interests in an entity that carries on a Canadian business or which controls the entity which carries on the Canadian business. Under the Act, control of a corporation is deemed to be acquired through the acquisition of a majority of the voting shares of a corporation, and is presumed to be acquired where more than one-third, but less than a majority, of the voting shares of a corporation are acquired, unless it can be established that the corporation is not controlled in fact through the ownership of voting shares. Other rules apply with respect to the acquisition of non-corporate entities.
Investments requiring review and approval include direct acquisition of Canadian businesses with assets with a gross book value of $5,000,000 or more; indirect acquisitions of Canadian businesses with assets of $50,000,000 or more; and indirect acquisitions of Canadian businesses where the value of assets of the entity or entities carrying on business in Canada, control of which is indirectly being acquired, is greater than $5,000,000 and represents greater than 50% of the total value of the assets of all of the entities, control of which is being acquired.
Pursuant to the World Trade Organization Agreement Implementation Act, the Act was amended to provide that the value of the business acquisition threshold (the “Threshold”) above described is increased from those levels outlined where the acquisition is by a World Trade Organization Investor or by a non-Canadian other than a World Trade Organization Investor where the Canadian business that is the subject of the investment is immediately before the investment controlled by a World Trade Organization Investor. The Threshold is to be determined yearly in accordance with a formula set forth in the Act. For 2010, the Threshold was determined to be $299,000.
A World Trade Organization Investor includes an individual, other than a Canadian, who is a national of a World Trade Organization Member, or who has the right of permanent residence in relation to that World Trade Organization Member.
Different provisions and considerations apply with respect to investment to acquire control of a Canadian business that, as defined in the Act or regulations:
| | ● | engages in production of uranium and owns an interest in a producing uranium property in Canada; |
| | ● | provides financial services; |
| | ● | provides transportation services; |
If an investment is reviewable, an application for review in the form prescribed by regulation is normally required to be filed with the Ministry of Industry, Director of Investment prior to the investment taking place and the investment may not be consummated until the review has been completed and ministerial approval obtained. Applications for review concerning indirect acquisitions may be filed up to 30 days after the investment is consummated. Applications concerning reviewable investments in culturally sensitive and other specified activities referred to in the preceding paragraph are required upon receipt of a notice for review. There is, moreover, provision for the Minister (a person designated as such under the Act) to permit an investment to be consummated prior to completion of review if he is satisfied that delay would cause undue hardship to the acquirer or jeopardize the operation of the Canadian business that is being acquired.
10.E Taxation
Certain United States Federal Income Tax Consideration
The following is a general summary of certain material U.S. federal income tax considerations applicable to a U.S. Holder (as defined below) arising from and relating to the acquisition, ownership, and disposition of common shares.
This summary is for general information purposes only and does not purport to be a complete analysis or listing of all potential U.S. federal income tax considerations that may apply to a U.S. Holder arising from and relating to the acquisition, ownership, and disposition of common shares. In addition, this summary does not take into account the individual facts and circumstances of any particular U.S. Holder that may affect the U.S. federal income tax consequences to such U.S. Holder, including specific tax consequences to a U.S. Holder under an applicable tax treaty. Accordingly, this summary is not intended to be, and should not be construed as, legal or U.S. federal income tax advice with respect to any U.S. Holder. Each U.S. Holder should consult its own tax advisor regarding the U.S. federal, U.S. federal alternative
minimum, U.S. federal estate and gift, U.S. state and local tax, and foreign tax consequences relating to the acquisition, ownership and disposition of common shares.
No legal opinion from U.S. legal counsel or ruling from the Internal Revenue Service (the “IRS”) has been requested, or will be obtained, regarding the U.S. federal income tax consequences of the acquisition, ownership, and disposition of common shares. This summary is not binding on the IRS, and the IRS is not precluded from taking a position that is different from, and contrary to, the positions taken in this summary. In addition, because the authorities on which this summary is based are subject to various interpretations, the IRS and the U.S. courts could disagree with one or more of the positions taken in this summary.
Scope of this Summary
Authorities
This summary is based on the Internal Revenue Code of 1986, as amended (the “Code”), Treasury Regulations (whether final, temporary, or proposed), published rulings of the IRS, published administrative positions of the IRS, U.S. court decisions, the Convention Between Canada and the United States of America with Respect to Taxes on Income and on Capital, signed September 26, 1980, as amended (the “Canada-U.S. Tax Convention”), and U.S. court decisions that are applicable and, in each case, as in effect and available, as of the date of this document. Any of the authorities on which this summary is based could be changed in a material and adverse manner at any time, and any such change could be applied on a retroactive or prospective basis which could affect the U.S. federal income tax considerations described in this summary. This summary does not discuss the potential effects, whether adverse or beneficial, of any proposed legislation that, if enacted, could be applied on a retroactive or prospective basis.
U.S. Holders
For purposes of this summary, the term "U.S. Holder" means a beneficial owner of common shares that is for U.S. federal income tax purposes:
| | ● | an individual who is a citizen or resident of the U.S.; |
| | ● | a corporation (or other entity taxable as a corporation for U.S. federal income tax purposes) organized under the laws of the U.S., any state thereof or the District of Columbia; |
| | ● | an estate whose income is subject to U.S. federal income taxation regardless of its source; or |
| | ● | a trust that (1) is subject to the primary supervision of a court within the U.S. and the control of one or more U.S. persons for all substantial decisions or (2) has a valid election in effect under applicable Treasury regulations to be treated as a U.S. person. |
Non-U.S. Holders
For purposes of this summary, a “non-U.S. Holder” is a beneficial owner of common shares that is not a U.S. Holder. This summary does not address the U.S. federal income tax consequences to non-U.S. Holders arising from and relating to the acquisition, ownership, and disposition of common shares. Accordingly, a non-U.S. Holder should consult its own tax advisor regarding the U.S. federal, U.S. federal alternative minimum, U.S. federal estate and gift, U.S. state and local tax, and foreign tax consequences (including the potential application of and operation of any income tax treaties) relating to the acquisition, ownership, and disposition of common shares.
U.S. Holders Subject to Special U.S. Federal Income Tax Rules Not Addressed
This summary does not address the U.S. federal income tax considerations applicable to U.S. Holders that are subject to special provisions under the Code, including the following U.S. Holders: (a) U.S. Holders that are tax-exempt organizations, qualified retirement plans, individual retirement accounts, or other tax-deferred accounts; (b) U.S. Holders that are financial institutions, underwriters, insurance companies, real estate investment trusts, or regulated investment companies; (c) U.S. Holders that are dealers in securities or currencies or U.S. Holders that are traders in securities that elect to apply a mark-to-market accounting method; (d) U.S. Holders that have a “functional currency” other than the U.S. dollar; (e) U.S. Holders that own common shares as part of a straddle, hedging transaction, conversion transaction, constructive sale, or other arrangement involving more than one position; (f) U.S. Holders that acquired common shares in connection with the exercise of employee stock options or otherwise as compensation for services; (g) U.S. Holders that hold common shares other than as a capital asset within the meaning of Section 1221 of the Code (generally, property held for investment purposes); (h) partnerships and other pass-through entities (and investors in such partnerships and entities); or (i) U.S. Holders that own or have owned (directly, indirectly, or by attribution) 10% or more of the total combined
voting power of the outstanding shares of the Company. This summary also does not address the U.S. federal income tax considerations applicable to U.S. Holders who are (a) U.S. expatriates or former long-term residents of the U.S. subject to Section 877 of the Code, (b) persons that have been, are, or will be a resident or deemed to be a resident in Canada for purposes of the Canadian Act (as defined below); (c) persons that use or hold, will use or hold, or that are or will be deemed to use or hold common shares in connection with carrying on a business in Canada; (d) persons whose common shares constitute “taxable Canadian property” under the Canadian Act; or (e) persons that have a permanent establishment in Canada for the purposes of the Canada-U.S. Tax Convention. U.S. Holders that are subject to special provisions under the Code, including U.S. Holders described immediately above, should consult their own tax advisor regarding the U.S. federal, U.S. federal alternative minimum, U.S. federal estate and gift, U.S. state and local tax, and foreign tax consequences relating to the acquisition, ownership and disposition of common shares.
If an entity that is classified as a partnership for U.S. federal income tax purposes holds common shares, the U.S. federal income tax consequences to such partnership and the partners of such partnership generally will depend on the activities of the partnership and the status of such partners. This summary does not address the tax consequences to any such partner. Partners of entities that are classified as partnerships for U.S. federal income tax purposes should consult their own tax advisor regarding the U.S. federal income tax consequences arising from and relating to the acquisition, ownership, and disposition of common shares.
Tax Consequences Not Addressed
This summary does not address the U.S. state and local, U.S. federal estate and gift, U.S. federal alternative minimum tax or foreign tax consequences to U.S. Holders of the acquisition, ownership, and disposition of common shares. Each U.S. Holder should consult its own tax advisor regarding the U.S. state and local, U.S. federal estate and gift, U.S. federal alternative minimum tax and foreign tax consequences of the acquisition, ownership, and disposition of common shares.
Passive Foreign Investment Company Rules
If the Company is considered a “passive foreign investment company” under the meaning of Section 1297 of the Code (a “PFIC”) at any time during a U.S. Holder’s holding period, the following sections will generally describe the U.S. federal income tax consequences to the U.S. Holder of the acquisition, ownership, and disposition of common shares.
PFIC Status of the Company
The Company generally will be a PFIC if, for a tax year, (a) 75% or more of the gross income of the Company for such tax year is passive income or (b) 50% or more of the value of the Company’s assets either produce passive income or are held for the production of passive income, based on the quarterly average of the fair market value of such assets. “Gross income” generally includes sales revenues less the cost of goods sold, plus income from investments and from incidental or outside operations or sources, and “passive income” generally includes, for example, dividends, interest, certain rents and royalties, certain gains from the sale of stock and securities, and certain gains from commodities transactions.
Active business gains arising from the sale of commodities generally are excluded from passive income if substantially all (85% or more) of a foreign corporation’s commodities are stock in trade of such foreign corporation or other property of a kind which would properly be included in inventory of such foreign corporation, or property held by such foreign corporation primarily for sale to customers in the ordinary course of business, and certain other requirements are satisfied.
For purposes of the PFIC income test and asset test described above, if the Company owns, directly or indirectly, 25% or more of the total value of the outstanding shares of another corporation, the Company will be treated as if it (a) held a proportionate share of the assets of such other corporation and (b) received directly a proportionate share of the income of such other corporation. In addition, for purposes of the PFIC income test and asset test described above, “passive income” does not include any interest, dividends, rents, or royalties that are received or accrued by the Company from a “related person” (as defined in Section 954(d)(3) of the Code), to the extent such items are properly allocable to the income of such related person that is not passive income.
In addition, under certain attribution rules, if the Company is a PFIC, U.S. Holders will be deemed to own their proportionate share of any subsidiary of the Company which is also a PFIC (a ‘‘Subsidiary PFIC’’), and will be subject to U.S. federal income tax on their proportionate share of (i) a distribution on the shares of a Subsidiary PFIC and (ii) a disposition or deemed disposition of shares of a Subsidiary PFIC, both as if such U.S. Holders directly held the shares of such Subsidiary PFIC.
The Company believes that it qualified as a PFIC for the tax year ended December 31, 2010 and may continue to be a PFIC in future years. The determination of whether a corporation was, or will be, a PFIC for a tax year depends, in part, on the application of complex U.S. federal income tax rules, which are subject to differing interpretations. In addition, whether a corporation will be a PFIC for any tax year depends on the assets and income of such corporation over the course of each such tax year and, as a result, cannot be predicted with certainty as of the date of this document. Accordingly, there can be no assurance that the IRS will not challenge any determination made by the Company (or a Subsidiary PFIC) concerning its PFIC status or that the Company (and each subsidiary) was not, or will not be, a PFIC for any tax year. Each U.S. Holder should consult its own tax advisor regarding the PFIC status of the Company and each subsidiary.
In addition, in any year in which the Company is classified as a PFIC, such holder would be required to file an annual report with the IRS containing such information as Treasury Regulations and/or other IRS guidance may require. U.S. Holders should consult their own tax advisors regarding the requirements of filing such information returns under these rules, including the requirement to file a IRS Form 8621.
Default PFIC Rules Under Section 1291 of the Code
If the Company is a PFIC, the U.S. federal income tax consequences to a U.S. Holder of the acquisition, ownership, and disposition of common shares will depend on whether such U.S. Holder makes an election to treat the Company as a “qualified electing fund” or “QEF” under Section 1295 of the Code (a “QEF Election”) or a mark-to-market election under Section 1296 of the Code (a “Mark-to-Market Election”). A U.S. Holder that does not make either a QEF Election or a Mark-to-Market Election will be referred to in this summary as a “Non-Electing U.S. Holder.”
A Non-Electing U.S. Holder will be subject to the rules of Section 1291 of the Code with respect to (a) any gain recognized on the sale or other taxable disposition of common shares and (b) any excess distribution received on the common shares. A distribution generally will be an “excess distribution” to the extent that such distribution (together with all other distributions received in the current tax year) exceeds 125% of the average distributions received during the three preceding tax years (or during a U.S. Holder’s holding period for the common shares, if shorter).
Under Section 1291 of the Code, any gain recognized on the sale or other taxable disposition of common shares, and any “excess distribution” received on common shares, must be ratably allocated to each day in a Non-Electing U.S. Holder’s holding period for the respective common shares. The amount of any such gain or excess distribution allocated to the tax year of disposition or distribution of the excess distribution and to years before the entity became a PFIC, if any, would be taxed as ordinary income. The amounts allocated to any other tax year would be subject to U.S. federal income tax at the highest tax applicable to ordinary income in each such year, and an interest charge would be imposed on the tax liability for each such year, calculated as if such tax liability had been due in each such year. A Non-Electing U.S. Holder that is not a corporation must treat any such interest paid as “personal interest,” which is not deductible.
If the Company is a PFIC for any tax year during which a Non-Electing U.S. Holder holds common shares, the Company will continue to be treated as a PFIC with respect to such Non-Electing U.S. Holder, regardless of whether the Company ceases to be a PFIC in one or more subsequent tax years. A Non-Electing U.S. Holder may terminate this deemed PFIC status by electing to recognize gain (which will be taxed under the rules of Section 1291 of the Code discussed above) as if such common shares were sold on the last day of the last tax year for which the Company was a PFIC.
QEF Election
A U.S. Holder that makes a QEF Election for the first tax year in which its holding period of its common shares begins, generally, will not be subject to the rules of Section 1291 of the Code discussed above with respect to its common shares. However, a U.S. Holder that makes a QEF Election will be subject to U.S. federal income tax on such U.S. Holder’s pro rata share of (a) the net capital gain of the Company, which will be taxed as long-term capital gain to such U.S. Holder, and (b) and the ordinary earnings of the Company, which will be taxed as ordinary income to such U.S. Holder. Generally, “net capital gain” is the excess of (a) net long-term capital gain over (b) net short-term capital loss, and “ordinary earnings” are the excess of (a) “earnings and profits” over (b) net capital gain. A U.S. Holder that makes a QEF Election will be subject to U.S. federal income tax on such amounts for each tax year in which the Company is a PFIC, regardless of whether such amounts are actually distributed to such U.S. Holder by the Company. However, for any tax year in which the Company is a PFIC and has no net income or gain, U.S. Holders that have made a QEF Election would not have any income inclusions as a result of the QEF Election. If a U.S. Holder that made a QEF Election has an income inclusion, such a U.S. Holder may, subject to certain limitations, elect to defer payment of current U.S. federal income tax on such amounts, subject to an interest charge. If such U.S. Holder is not a corporation, any such interest paid will be treated as “personal interest,” which is not deductible.
A U.S. Holder that makes a QEF Election generally (a) may receive a tax-free distribution from the Company to the extent that such distribution represents “earnings and profits” of the Company that were previously included in income by the U.S. Holder because of such QEF Election and (b) will adjust such U.S. Holder’s tax basis in the common shares to reflect the amount included in income or allowed as a tax-free distribution because of such QEF Election. In addition, a U.S. Holder that makes a QEF Election generally will recognize capital gain or loss on the sale or other taxable disposition of common shares.
The procedure for making a QEF Election, and the U.S. federal income tax consequences of making a QEF Election, will depend on whether such QEF Election is timely. A QEF Election will be treated as “timely” if such QEF Election is made for the first year in the U.S. Holder’s holding period for the common shares in which the Company was a PFIC. A U.S. Holder may make a timely QEF Election by filing the appropriate QEF Election documents at the time such U.S. Holder files a U.S. federal income tax return for such year.
A QEF Election will apply to the tax year for which such QEF Election is made and to all subsequent tax years, unless such QEF Election is invalidated or terminated or the IRS consents to revocation of such QEF Election. If a U.S. Holder makes a QEF Election and, in a subsequent tax year, the Company ceases to be a PFIC, the QEF Election will remain in effect (although it will not be applicable) during those tax years in which the Company is not a PFIC. Accordingly, if the Company becomes a PFIC in another subsequent tax year, the QEF Election will be effective and the U.S. Holder will be subject to the QEF rules described above during any subsequent tax year in which the Company qualifies as a PFIC.
U.S. Holders should be aware that there can be no assurance that we will satisfy record keeping requirements that apply to a QEF, or that we will supply U.S. Holders with information that such U.S. Holders require to report under the QEF rules, in event that we are a PFIC and a U.S. Holder wishes to make a QEF Election. Thus, U.S. Holders may not be able to make a QEF Election with respect to their common shares. Each U.S. Holder should consult its own financial advisor, legal counsel, or accountant regarding the availability of, and procedure for making, a QEF Election.
Mark-to-Market Election
A U.S. Holder may make a Mark-to-Market Election only if the common shares are marketable stock. The common shares generally will be “marketable stock” if the common shares are regularly traded on (a) a national securities exchange that is registered with the Securities and Exchange Commission, (b) the national market system established pursuant to section 11A of the Securities and Exchange Act of 1934, or (c) a foreign securities exchange that is regulated or supervised by a governmental authority of the country in which the market is located, provided that (i) such foreign exchange has trading volume, listing, financial disclosure, and other requirements and the laws of the country in which such foreign exchange is located, together with the rules of such foreign exchange, ensure that such requirements are actually enforced and (ii) the rules of such foreign exchange ensure active trading of listed stocks.
If such stock is traded on such a qualified exchange or other market, such stock generally will be “regularly traded” for any calendar year during which such stock is traded, other than in de minimis quantities, on at least 15 days during each calendar quarter.
A U.S. Holder that makes a Mark-to-Market Election with respect to its common shares generally will not be subject to the rules of Section 1291 of the Code discussed above with respect to such common shares. However, if a U.S. Holder does not make a Mark-to-Market Election beginning in the first tax year of such U.S. Holder’s holding period for the common shares or such U.S. Holder has not made a timely QEF Election, the rules of Section 1291 of the Code discussed above will apply to certain dispositions of, and distributions on, the common shares.
A U.S. Holder that makes a Mark-to-Market Election will include in ordinary income, for each tax year in which the Company is a PFIC, an amount equal to the excess, if any, of (a) the fair market value of the common shares, as of the close of such tax year over (b) such U.S. Holder’s tax basis in such common shares. A U.S. Holder that makes a Mark-to-Market Election will be allowed a deduction in an amount equal to the excess, if any, of (i) such U.S. Holder’s adjusted tax basis in the common shares, over (ii) the fair market value of such common shares (but only to the extent of the net amount of previously included income as a result of the Mark-to-Market Election for prior tax years).
A U.S. Holder that makes a Mark-to-Market Election generally also will adjust such U.S. Holder’s tax basis in the common shares to reflect the amount included in gross income or allowed as a deduction because of such Mark-to-Market Election. In addition, upon a sale or other taxable disposition of common shares, a U.S. Holder that makes a Mark-to-Market Election will recognize ordinary income or ordinary loss (not to exceed the excess, if any, of (a) the amount included in ordinary income because of such Mark-to-Market Election for prior tax years over (b) the amount allowed as a deduction because of such Mark-to-Market Election for prior tax years).
A Mark-to-Market Election applies to the tax year in which such Mark-to-Market Election is made and to each subsequent tax year, unless the common shares cease to be “marketable stock” or the IRS consents to revocation of such election. Each U.S. Holder should consult its own tax advisor regarding the availability of, and procedure for making, a Mark-to-Market Election.
Although a U.S. Holder may be eligible to make a Mark-to-Market Election with respect to the common shares, no such election may be made with respect to the stock of any Subsidiary PFIC that a U.S. Holder is treated as owning, because such stock is not marketable. Hence, the Mark-to-Market Election will not be effective to eliminate the interest charge described above with respect to deemed dispositions of Subsidiary PFIC stock or distributions from a Subsidiary PFIC.
Other PFIC Rules
Under Section 1291(f) of the Code, the IRS has issued proposed Treasury Regulations that, subject to certain exceptions, would cause a U.S. Holder that had not made a timely QEF Election to recognize gain (but not loss) upon certain transfers of common shares that would otherwise be tax-deferred (e.g., gifts and exchanges pursuant to corporate reorganizations). However, the specific U.S. federal income tax consequences to a U.S. Holder may vary based on the manner in which common shares are transferred.
Certain additional adverse rules will apply with respect to a U.S. Holder if the Company is a PFIC, regardless of whether such U.S. Holder makes a QEF Election. For example under Section 1298(b)(6) of the Code, a U.S. Holder that uses common shares as security for a loan will, except as may be provided in Treasury Regulations, be treated as having made a taxable disposition of such common shares.
Special rules also apply to the amount of foreign tax credit that a U.S. Holder may claim on a distribution from a PFIC. Subject to such special rules, foreign taxes paid with respect to any distribution in respect of stock in a PFIC are generally eligible for the foreign tax credit.
The rules relating to distributions by a PFIC and their eligibility for the foreign tax credit are complicated, and a U.S. Holder should consult with their own tax advisor regarding the availability of the foreign tax credit with respect to distributions by a PFIC.
In addition, a U.S. Holder who acquires common shares from a decedent will not receive a “step up” in tax basis of such common shares to fair market value.
The PFIC rules are complex, and each U.S. Holder should consult its own tax advisor regarding the PFIC rules and how the PFIC rules may affect the U.S. federal income tax consequences of the acquisition, ownership, and disposition of common shares.
U.S. Federal Income Tax Consequences of the Acquisition, Ownership, and Disposition of Common Shares
The following discussion is subject to the rules described above under the heading “Passive Foreign Investment Company Rules.”
General Taxation of Distributions
Subject to the PFIC rules discussed above, a U.S. Holder that receives a distribution, including a constructive distribution, with respect to a Common Share will be required to include the amount of such distribution in gross income as a dividend (without reduction for any Canadian income tax withheld from such distribution) to the extent of the current or accumulated “earnings and profits” of the Company, as computed for U.S. federal income tax purposes. A dividend generally will be taxed to a U.S. Holder at ordinary income tax rates. To the extent that a distribution exceeds the current and accumulated “earnings and profits” of the Company, such distribution will be treated first as a tax-free return of capital to the extent of a U.S. Holder's tax basis in the common shares and thereafter as gain from the sale or exchange of such common shares. (See “ Sale or Other Taxable Disposition of common shares” below). However, the Company may not maintain the calculations of earnings and profits in accordance with U.S. federal income tax principles, and each U.S. Holder should therefore assume that any distribution by the Company with respect to the common shares will constitute ordinary dividend income. Dividends received on common shares generally will not be eligible for the “dividends received deduction”. In addition, the Company does not anticipate that its distributions will be eligible for the preferential tax rates applicable to long-term capital gains. In addition, the Company does not anticipate that its distributions will constitute qualified dividend income eligible for the preferential tax rates applicable to long term capital gains. The dividend rules are complex, and each U.S. Holder should consult its own tax advisor regarding the application of such rules.
Sale or Other Taxable Disposition of Common Shares
Subject to the PFIC rules discussed above, upon the sale or other taxable disposition of common shares, a U.S. Holder generally will recognize capital gain or loss in an amount equal to the difference between the amount of cash plus the fair market value of any property received and such U.S. Holder's tax basis in such common shares sold or otherwise disposed of. Subject to the PFIC rules discussed above, gain or loss recognized on such sale or other disposition generally will be long-term capital gain or loss if, at the time of the sale or other disposition, the common shares have been held for more than one year.
Preferential tax rates apply to long-term capital gain of a U.S. Holder that is an individual, estate, or trust. There are currently no preferential tax rates for long-term capital gain of a U.S. Holder that is a corporation. Deductions for capital losses are subject to significant limitations under the Code.
Receipt of Foreign Currency
The amount of any distribution paid to a U.S. Holder in foreign currency, or on the sale, exchange or other taxable disposition of common shares, generally will be equal to the U.S. dollar value of such foreign currency based on the exchange rate applicable on the date of receipt (regardless of whether such foreign currency is converted into U.S. dollars at that time).
If the foreign currency received is not converted into U.S. dollars on the date of receipt, a U.S. Holder will have a basis in the foreign currency equal to its U.S. dollar value on the date of receipt. Any U.S. Holder who receives payment in foreign currency and engages in a subsequent conversion or other disposition of the foreign currency may have a foreign currency exchange gain or loss that would be treated as ordinary income or loss, and generally will be U.S. source income or loss for foreign tax credit purposes. Each U.S. Holder should consult its own U.S. tax advisor regarding the U.S. federal income tax consequences of receiving, owning, and disposing of foreign currency.
Foreign Tax Credit
Subject to the PFIC rules discussed above, a U.S. Holder who pays (whether directly or through withholding) Canadian income tax with respect to dividends paid on the common shares generally will be entitled, at the election of such U.S. Holder, to receive either a deduction or a credit for such Canadian income tax paid. Generally, a credit will reduce a U.S. Holder’s U.S. federal income tax liability on a dollar-for-dollar basis, whereas a deduction will reduce a U.S. Holder’s income subject to U.S. federal income tax. This election is made on a year-by-year basis and applies to all foreign taxes paid (whether directly or through withholding) by a U.S. Holder during a year.
Complex limitations apply to the foreign tax credit, including the general limitation that the credit cannot exceed the proportionate share of a U.S. Holder’s U.S. federal income tax liability that such U.S. Holder’s “foreign source” taxable income bears to such U.S. Holder’s worldwide taxable income. In applying this limitation, a U.S. Holder’s various items of income and deduction must be classified, under complex rules, as either “foreign source” or “U.S. source.” In addition, this limitation is calculated separately with respect to specific categories of income. Dividends paid by the Company generally will constitute “foreign source” income and generally will be categorized as “passive category income.” Gain or loss recognized by a U.S. Holder on the sale or other taxable disposition of common shares generally will be treated as “U.S. source” for purposes of applying the U.S. foreign tax credit rules unless the gain is subject to tax in Canada and its resourced as “foreign source” under the Canada U.S. Tax Convention and such U.S. Holder elects to treat such gain or loss as “foreign source”. The foreign tax credit rules are complex, and each U.S. Holder should consult its own tax advisor regarding the foreign tax credit rules.
Additional Tax on Passive Income
For tax years beginning after December 31, 2012, certain individuals, estates and trusts whose income exceeds certain thresholds will be required to pay a 3.8% Medicare surtax on “net investment income” including, among other things, dividends and net gain from dispositions of property (other than property held in a trade or business). U.S. Holders should consult with their own tax advisors regarding the effect, if any, of this tax on their ownership and disposition of Common Shares.
Backup Withholding and Information Reporting
Under U.S. federal income tax law and Treasury Regulations, certain categories of U.S. Holders must file information returns with respect to their investment in, or involvement in, a foreign corporation. For example, recently enacted legislation generally imposes new U.S. return disclosure obligations (and related penalties) on individuals who are U.S. Holders that hold certain specified foreign financial assets in excess of $50,000. The definition of specified foreign financial assets includes not only financial accounts maintained in foreign financial institutions, but also, unless held in accounts maintained by a financial institution, any stock or security issued by a non-U.S. person, any financial instrument or contract held for investment that has an issuer or counterparty other than a U.S. person and any interest in a foreign entity. U.S. Holders may be subject to these reporting requirements unless their common shares are held in an account at a domestic financial institution. Penalties for failure to file certain of these information returns are substantial. U.S. Holders should consult with their own tax advisors regarding the requirements of filing information returns under these rules, including the requirement to file an IRS Form 8938.
Payments made within the U.S. or by a U.S. payor or U.S. middleman, of dividends on, and proceeds arising from the sale or other taxable disposition of, common shares generally may be subject to information reporting and backup withholding tax, at the rate of 28%, (and increasing to 31% for payments made after December 31, 2012) if a U.S. Holder (a) fails to furnish such U.S. Holder’s correct U.S. taxpayer identification number (generally on Form W-9), (b) furnishes an incorrect U.S. taxpayer identification number, (c) is notified by the IRS that such U.S. Holder has previously failed to properly report items subject to backup withholding tax, or (d) fails to certify, under penalty of perjury, that such U.S. Holder has furnished its correct U.S. taxpayer identification number and that the IRS has not notified such U.S. Holder that it is subject to backup withholding tax. However, certain exempt persons, such as corporations, generally are excluded from these information reporting and backup withholding rules. Any amounts withheld under the U.S. backup withholding tax rules will be allowed as a credit against a U.S. Holder’s U.S. federal income tax liability, if any, or will be refunded, if such U.S. Holder furnishes required information to the IRS in a timely manner. Each U.S. Holder should consult its own tax advisor regarding the information reporting and backup withholding rules.
Certain Canadian Federal Income Tax Consequences
The following discussion summarizes the principal Canadian federal income tax considerations generally applicable to a person who owns one or more common shares of the Company (the "Shareholder"), and who at all material times for the purposes of the Income Tax Act (Canada) (the "Canadian Act") deals at arm's length with the Company, holds all common shares solely as capital property, is a non-resident of Canada, and does not, and is not deemed to, use or hold any Common share in or in the course of carrying on business in Canada. It is assumed that the common shares will at all material times be listed on a stock exchange that is prescribed for the purposes of the Canadian Act.
This summary is based on the current provisions of the Canadian Act, including the regulations thereunder, and the Canada-United States Income Tax Convention (1980) (the "Treaty") as amended. This summary takes into account all specific proposals to amend the Canadian Act and the regulations thereunder publicly announced by the government of Canada to the date hereof and the Company's understanding of the current published administrative and assessing practices of Canada Customs and Revenue Agency. It is assumed that all such amendments will be enacted substantially as currently proposed, and that there will be no other material change to any such law or practice, although no assurances can be given in these respects. Except to the extent otherwise expressly set out herein, this summary does not take into account any provincial, territorial or foreign income tax law or treaty.
This summary is not, and is not to be construed as, tax advice to any particular Shareholder. Each prospective and current Shareholder is urged to obtain independent advice as to the Canadian income tax consequences of an investment in common shares applicable to the Shareholder's particular circumstances.
A Shareholder generally will not be subject to tax pursuant to the Canadian Act on any capital gain realized by the Shareholder on a disposition of a Common share unless the Common share constitutes "taxable Canadian property" to the Shareholder for purposes of the Canadian Act and the Shareholder is not eligible for relief pursuant to an applicable bilateral tax treaty. A Common share that is disposed of by a Shareholder will not constitute taxable Canadian property of the Shareholder provided that the Common share is listed on a stock exchange that is prescribed for the purposes of the Canadian Act (the Toronto Stock Exchange is so prescribed), and that neither the Shareholder, nor one or more persons with whom the Shareholder did not deal at arm's length, alone or together at any time in the five years immediately preceding the disposition owned, or owned any right to acquire, 25% or more of the issued shares of any class of the capital stock of the Company.
In addition, the Treaty generally will exempt a Shareholder who is a resident of the United States for the purposes of the Treaty, and who would otherwise be liable to pay Canadian income tax in respect of any capital gain realized by the Shareholder on the disposition of a Common share, from such liability provided that the value of the Common share is not derived principally from real property (including resource property) situated in Canada or that the Shareholder does not have, and has not had within the 12-month period preceding the disposition, a "permanent establishment" or "fixed base," as those terms are defined for the purposes of the Treaty, available to the Shareholder in Canada. The Treaty may not be available to a non-resident Shareholder that is a U.S. LLC, which is not subject to tax in the U.S. Any dividend on a Common share, including a stock dividend, paid or credited, or deemed to be paid or credited, by the Company to a Shareholder will be subject to Canadian withholding tax at the rate of 25% on the gross amount of the dividend, or such lesser rate as may be available under an applicable income tax treaty. Pursuant to the Treaty, the rate of withholding tax applicable to a dividend paid on a Common share to a Shareholder who is a resident of the United States for the purposes of the Treaty will be reduced to 5% if the beneficial owner of the dividend is a company that owns at least 10% of the voting stock of the Company, and in any other case will be reduced to 15%, of the gross amount of the dividend. It is Canada Customs and Revenue Agency’s position that the Treaty reductions are not available to a Shareholder that is a "limited
liability company" resident in the United States. The Company will be required to withhold any such tax from the dividend, and remit the tax directly to Canada Customs and Revenue Agency for the account of the Shareholder.
ALL PROSPECTIVE INVESTORS ARE URGED TO CONSULT THEIR OWN TAX ADVISORS WITH RESPECT TO THE SPECIFIC TAX CONSEQUENCES OF PURCHASING THE COMMON SHARES.
10.F Dividends and Paying Agents
Not Applicable.
10.G Statement by Experts
Not Applicable.
10.H Documents on Display
We have filed with the Securities and Exchange Commission this annual report on Form 20-F, including exhibits, under the Securities and Exchange Act of 1934.
We are subject to the informational requirements of the Securities Exchange Act of 1934 and file reports and other information with the Securities and Exchange Commission. Reports and other information which we file with the Securities and Exchange Commission, including this Annual Report on Form 20-F, may be inspected and copied at the public reference facilities of the Securities and Exchange Commission at:
100 F Street, NE
Washington D.C. 20549
You can also obtain copies of this material by mail from the Public Reference Section of the Securities and Exchange Commission, 100 F Street, NE, Washington, D.C. 20549, at prescribed rates. Additionally, copies of this material may also be obtained from the Securities and Exchange Commission's internet site at http://www.sec.gov. The Commission's telephone number is 1-800-SEC-0330. Copies of the above material contracts may be inspected at our principal executive office at the address on the face page of this Report during normal business hours.
10.I Subsidiary Information
As of May 22, 2012, we have one subsidiary, MAX Resources, Inc., a wholly owned Nevada corporation.
Item 11. Quantitative and Qualitative Disclosures About Market Risk
We were incorporated under the laws of Alberta, Canada and our financial results are quantified in Canadian dollars. We raise equity funding through the sale of securities denominated in Canadian dollars, whereas the majority of our obligations and expenditures with respect to our properties will be incurred in US Dollars. Variations in the exchange rate may give rise to foreign exchange gains or losses that may be significant. Market risks relating to our operations, if we begin production, are anticipated to result primarily from changes in interest rates, foreign exchange rates and commodity prices, as well as credit risk concentrations. We do not use financial instruments for trading purposes and are not parties to any leverage derivatives. We do not currently engage in hedging transactions. See “Currency and Exchange Rates” and Item 4 – “Information on the Company”.
Item 12. Description of Securities Other than Equity Securities
Not Applicable.
PART II
Item 13. Defaults, Dividend Arrearages and Delinquencies
We have had no material defaults in payment of principal, interest or sinking or purchase fund installments or other material defaults relating to indebtedness.
Item 14. Material Modifications to the Rights of Security Holders and Use of Proceeds
Not Applicable.
Item 15. Controls and Procedures
(a) Disclosure Controls and Procedures
At the end of the period covered by this annual report for the fiscal year ended December 31, 2011 an evaluation was carried out under the supervision of, and the with the participation of, the Company’s management, including its Chief Executive Officer (CEO) and Chief Financial Officer (CFO), of the effectiveness of the design and operation of the Company’s disclosure controls and procedures (as defined in Rule 13a-15(e) of the Exchange Act). Based upon that evaluation, the Company’s CEO and CFO have concluded that the disclosure controls and procedures were effective to give reasonable assurance that the information required to be disclosed by the Company in reports that it files or submits under the Exchange Act is (i) recorded, processed, summarized and reported, within the time periods specified in the SEC’s rules and forms, and (ii) accumulated and communicated to management, including its principal executive and principal financial officers, or persons performing similar functions, as appropriate to allow timely decisions regarding required disclosure.
(b) Managements’ Annual Report on Internal Control Over Financial Reporting
Our management, under the supervision of our Chief Executive Officer and Chief Financial Officer, is responsible for establishing and maintaining adequate internal control over our financial reporting, as defined in Rules 13a-15(f) of the Exchange Act of 1934, as amended. Our internal control over financial reporting is a process designed to provide reasonable assurance regarding the reliability of financial reporting and the preparation of financial statements for external purposes in accordance with generally accepted accounting principles. Internal control over financial reporting includes policies and procedures that:
| | (i) | pertain to the maintenance of records that in reasonable detail accurately and fairly reflect our transactions and asset dispositions; |
| | (ii) | provide reasonable assurance that transactions are recorded as necessary to permit the preparation of our financial statements in accordance with generally accepted accounting principles; |
| | (iii) | provide reasonable assurance that receipts and expenditures are made only in accordance with authorizations of our management and board of directors (as appropriate); and |
| | (iv) | provide reasonable assurance regarding the prevention or timely detection of unauthorized acquisition, use or disposition of our assets that could have a material effect on our financial statements. |
Due to its inherent limitations, internal control over financial reporting may not prevent or detect misstatements. In addition, projections of any evaluation of effectiveness to future periods are subject to the risk that controls may become inadequate because of changes in conditions, or that the degree of compliance with the policies or procedures may deteriorate.
Our management conducted an assessment of the effectiveness of our internal control over financial reporting as of fiscal year ended December 31, 2011 based on the framework in “Internal Control – Integrated Framework” issued by the Committee of Sponsoring Organizations of the Treadway Commission (COSO) (the “Framework”).
Based on this evaluation, our management concluded that, as of fiscal year ended December 31, 2011, that management’s controls over financial reporting were effective.
(c) Attestation Report of the Registered Public Accounting Firm
This Annual Report does not include an attestation report of our registered public accounting firm regarding internal control over financial reporting. Management’s report was not subject to attestation by our registered public accounting firm
pursuant the Dodd-Frank Wall Street Reform and Consumer Protection Act of 2010, which permits the Company to provide only management’s report in this Annual Report. The Dodd-Frank Act permits a “non-accelerated filer” to provide only management’s report on internal control over financial reporting in an Annual Report and omit an attestation report of the issuer’s registered public accounting firm regarding management’s report on internal control over financial reporting
(d) Changes in Internal Control Over Financial Reporting
Based upon their evaluation of our controls, our CEO and CFO have concluded that, there were no significant changes in our internal control over financial reporting or in other factors during our last fiscal year that have materially affected, or are reasonably likely to materially affect, our internal control over financial reporting.
Item 16. Reserved
16A. Audit Committee Financial Expert
We have determined that Stuart Rogers qualifies as an audit committee financial expert, pursuant to SEC regulations and the other members of the audit committee (Ian Smith and Paul John) satisfy the financial literacy requirements for audit committee members and are independent members of the Audit Committee as determined in accordance with Section 803 of the NYSE Amex Company Guide and Rule 10A-3 of the Exchange Act. Mr. Rogers does not qualify as independent under Rule 10A-3 of the Exchange Act or Section 803 of the NYSE-AMEX Company Guide.
16B. Code of Ethics
We have not adopted a formal code of ethics. We have concluded that a written code of ethics would serve little practical purpose for us in deterring wrongdoing and promoting ethical conduct and full, fair and accurate public disclosure and compliance with applicable laws and regulatory requirements. Since our operations are currently relatively small, most of our important activities are conducted directly by or under the direct supervision of our directors and senior officers. All of our current directors and officers have held their positions for a number of years and are familiar with our operations and our informal requirements for conduct. In light of the lack of perceived benefit from adopting a formal code considered against the time and cost for management to consider and implement a code, we have decided not to do so at the present time. We will continue to monitor the possible benefits of adopting a formal code of ethics, particularly as our operations expand and will consider whether we should adopt a formal code of ethics at a future date.
16C. Principal Accountant Fees and Services
(a) Audit Fees
The aggregate fees billed for each of the last two fiscal years for professional services rendered by our principal accountant for the audit of our annual financial statements, together with services that are normally provided by the principal accountant in connection with statutory and regulatory filings or engagements were $26,000for the year ended December 31, 2011 and $25,500 for the year ending December 31, 2010.
(b) Audit-Related Fees
The aggregate fees billed for each of the last two fiscal years for assurance and related services by the principal accountant that were reasonably related to the performance of the audit or review of our financial statements but are not reported under paragraph (a) of this Item were approximately $2,000 for the year ending December 31, 2011, and $2,500 for the year ending December 31, 2010.
(c) Tax Fees
The aggregate fees billed in each of the last two fiscal years for professional services rendered by the principal accountant for tax compliance, tax advice and tax planning were approximately $5,000 for the year ending December 31, 2011 and $5,000 for the year ending December 31, 2010.
The aggregate fees billed in each of the last two fiscal years for products and services provided by the principal accountant other than services disclosed in paragraphs (a) through (c) of this Item were $ nil for the year ending December 31, 2011 and $ nil in the year ending December 31, 2010.
(e) Pre-Approval Policies
Our Audit Committee nominates and engages the independent auditors to audit the financial statements, and approves all audits, audit-related services, tax services and other services provided by the auditor. Any services provided by our independent auditor that are not specifically included within the scope of the audit must be pre-approved by our audit committee prior to any engagement. Our audit committee is permitted to approve certain fees for audit-related services, tax services and other services pursuant to a de minimus exception before the completion of the engagement.
16D. Exemptions from the Listing Standards for Audit Committees
Not Applicable.
16E. Purchases of Equity Securities by the Issuer and Affiliated Purchasers
There were no repurchases by or on behalf of the Company or any affiliated purchaser, including any repurchases made pursuant to a publicly announced plan or program or made pursuant to a plan or program that was not announced publicly, in the last fiscal year. We made no open market repurchases.
16F. Change in Registrant’s Certifying Accountant
Not Applicable.
16G. Corporate Governance
Not Applicable.
16H. Mine Safety Disclosure
Pursuant to Section 1503(a) of the Dodd-Frank Wall Street Reform and Consumer Protection Act (the “Dodd-Frank Act”), issuers that are operators, or that have a subsidiary that is an operator, of a coal or other mine in the United States are required to disclose in their periodic reports filed with the SEC information regarding specified health and safety violations, orders and citations, issued under the Federal Mine Safety and Health Act of 1977 (the “Mine Act”) by the Mine Safety and Health Administration (the “MSHA”), as well as related assessments and legal actions, and mining-related fatalities.
The following table provides information for the year ended December 31, 2011.
| Mine | Mine Act
§104
Violations
(1) | Mine Act
§104(b)
Orders (2) | Mine Act
§104(d)
Citations
and Orders
(3) | Mine Act
§110(b)(2)
Violations
(4) | Mine Act
§107(a)
Orders (5) | Proposed
Assessments
from MSHA
(In dollars $) | Mining
Related
Fatalities | Mine Act
§104(e)
Notice
(yes/no)
(6) | Pending
Legal Action
before
Federal Mine
Safety and
Health
Review
Commission
(yes/no) |
Majuba
Hill | 0 | 0 | 0 | 0 | 0 | 0 | 0 | 0 | No |
Ravin | 0 | 0 | 0 | 0 | 0 | 0 | 0 | 0 | No |
East
Manhattan
Wash | 0 | 0 | 0 | 0 | 0 | 0 | 0 | 0 | No |
| Mine | Mine Act
§104
Violations
(1) | Mine Act
§104(b)
Orders (2) | Mine Act
§104(d)
Citations
and Orders
(3) | Mine Act
§110(b)(2)
Violations
(4) | Mine Act
§107(a)
Orders (5) | Proposed
Assessments
from MSHA
(In dollars $) | Mining
Related
Fatalities | Mine Act
§104(e)
Notice
(yes/no)
(6) | Pending
Legal Action
before
Federal Mine
Safety and
Health
Review
Commission
(yes/no) |
Table Top | 0 | 0 | 0 | 0 | 0 | 0 | 0 | 0 | No |
C de Baca | 0 | 0 | 0 | 0 | 0 | 0 | 0 | 0 | No |
Diamond
Peak | 0 | 0 | 0 | 0 | 0 | 0 | 0 | 0 | No |
(1) | The total number of violations received from MSHA under §104 of the Mine Act, which includes citations for health or safety standards that could significantly and substantially contribute to a serious injury if left unabated. |
(2) | The total number of orders issued by MSHA under §104(b) of the Mine Act, which represents a failure to abate a citation under §104(a) within the period of time prescribed by MSHA. |
(3) | The total number of citations and orders issued by MSHA under §104(d) of the Mine Act for unwarrantable failure to comply with mandatory health or safety standards. |
(4) | The total number of flagrant violations issued by MSHA under §110(b)(2) of the Mine Act. |
(5) | The total number of orders issued by MSHA under §107(a) of the Mine Act for situations in which MSHA determined an imminent danger existed. |
(6) | A written notice from the MSHA regarding a pattern of violations, or a potential to have such pattern under §104(e) of the Mine Act. |
PART III FINANCIAL STATEMENTS
Item 17. Financial Statements
Not applicable as we have elected to provide financial statements in accordance with Item 18.
Item 18. Financial Statements
We are furnishing the following financial statements and reports:
Independent Auditor’s Report Of Registered Public Accounting Firm dated April 23, 2012
Consolidated Statements of Financial Position at December 31, 2011 and 2010 and January 1, 2010
Consolidated Statements of Comprehensive Loss for the years ended December 31, 2011 and 2010
Consolidated Statement of Changes In Equity at December 31, 2011 and 2010 and January 1, 2010
Consolidated Statements of Cash Flows for the years ended December 31, 2011 and 2010
Notes to the Consolidated Financial Statements
Our financial statements are stated in Canadian dollars and are prepared in accordance with International Financial Reporting Standards (IFRS).
Item 19. Exhibits
The following exhibits are filed as part of this Annual Report:
| 1. | Certificate of Incorporation and Certificate of Amendment and Registration of Restated Articles and Bylaws (1) |
| | 4.1 | Management Agreement dated May 8, 2002 between Vancan Capital Corp. and West Oak Capital Group Ltd. (2) |
| | 4.2 | Option Agreement dated May 17, 2004 between MAX Resource Corp. and Zazu Exploration, Inc. to acquire an interest in the Gold Hill Project near Cantwell, Alaska. (3) |
| | 4.3 | Mineral Property Option Agreement with Alberta Star Development Corp. to acquire up to a 50% interest in the MacInnis Lake Uranium Property dated April 1, 2005. (3) |
| | 4.4 | Mineral Property Option Agreement between the Wendt Family Trust and the Company dated May 9, 2006 optioning 100% of the Diamond Peak Property to the Company. (4) |
| | 4.5 | Mineral Property Option Agreement between Kokanee Placer Ltd. and the Company dated May 15, 2006 granting Kokanee Place Ltd. the right to acquire up to a 51% interest in the Diamond Peak Property. (4) |
| | 4.6 | Agreement dated September 22, 2005 between the Company and Applied Geological Services, Inc. regarding the acquisition by the Company of the C de Baca Project claims. (4) |
| | 4.7 | Agreement dated April 4, 2007 between NUSTAR Exploration LLC and the Company for the acquisition of the mineral claims in Colorado Plateau, Arizona. (5) |
| | 4.8 | Mineral Property Option Agreement dated September 10, 2007 between Energex LLC and us to acquire a 100% interest in the Ravin Property (6) |
| | 4.9 | Mineral Property Option Agreement between MSM LLC and us dated December, 2007 to acquire a 100% interest in the East Manhattan Wash claims in the Manhattan Mining District, Nye County, Nevada. (6) |
| | 4.10 | Mineral Property Option Agreement between Eastfield Resource Ltd. and us dated June 9, 2008 to acquire a 60% interest in and to the Indata project located in North Central B.C. (6) |
| | 4.11 | Mineral Property Option Agreement between Eastfield Resource Ltd. and us dated June 9, 2008 to acquire a 60% interest in and to the Howell property in southeastern B.C. (6) |
| | 4.12 | Consulting Agreement dated October 1, 2008 between MAX Resource Corp. and West Oak Capital Group, Inc. (7) |
| | 4.13 | Consulting Agreement dated October 1, 2008 between MAX Resource Corp. and Clarence Wendt; (7) |
| | 4.14 | Mineral Property Option Amending Agreement between Eastfield Resource Ltd. And us dated July 24, 2009 to acquire up to a 60% interest in and to either the Howell property or the Crowsnest property in southeastern BC (8) |
| | 4.15 | Mineral Property Lease and Option to Purchase Agreement between Energex, LLC and us, and dated September 1, 2009 to acquire the Table Top property in Humboldt County, Nevada. (8) |
| | 4.16 | Amending agreement dated November 9, 2010 between the Company and with Energex, LLC amending option to purchase a 100% interest in the Ravin Property (9) |
| | 4.17 | Amending agreement dated September 30, 2009 between the Company and the Wendt Family Trust amending option to purchase a 100% interest in the Diamond Peak Property (9) |
| | 4.18 | Option Agreement dated March 4, 2011 between the Company and Claremont Nevada Mines LLC., granting an option to purchase up to a 75% interest in the Majuba Hill Property |
| | 4.19 | Mineral Lease and Participation Agreement between New Nevada Resources, LLC, and us dated April 9, 2012 to acquire a 85% interest in Section 33. |
8.1 Subsidiary of the Company(10)
12.1 Section 302 Certification of CEO
12.2 Section 302 Certification of CFO
13.1 Section 906 Certification of CEO
13.2 Section 906 Certification of CFO
(1) incorporated by reference from our Form 20-F that was originally filed with the commission on June 8, 2001.
(2) incorporated by reference from our Form 20-F that was originally filed with the commission on June 27, 2003.
(3) incorporated by reference from our Form 20-F that was originally filed with the commission on June 29, 2005.
(4) incorporated by reference from our Form 20-F that was originally filed with the commission on June 30, 2006.
(5) incorporated by reference from our Form 20-F that was originally filed with the commission on July 2, 2007.
(6) incorporated by reference from our Form 20-F that was originally filed with the commission on June 25, 2008.
(7) incorporated by reference from our Form 20-F that was originally filed with the commission on April 22, 2009.
(8) incorporated by reference from our Form 20-F that was originally filed with the commission on April 2, 2010.
(9) incorporated by reference from our Form 20-F that was originally filed with the commission on June 28, 2011.
(10) incorporated by reference from our Form 20-F that was originally filed with the commission on April 22, 2009.
SIGNATURES
The registrant hereby certifies that it meets all of the requirements for filing on Form 20-F and that it has duly caused and authorized the undersigned to sign this Annual Report on its behalf.
MAX RESOURCE CORP.
Dated: May 24, 2012
“Stuart Rogers”
____________________________________
By: Stuart Rogers, Chief Executive Officer
“Christopher Cherry”
_____________________________________________
By: Christopher Cherry , Chief Financial Officer
Consolidated Financial Statements
Year Ended December 31, 2011
Expressed in Canadian Dollars
| | INDEPENDENT AUDITOR’S REPORT OF REGISTERED PUBLIC ACCOUNTING FIRM |
To the Shareholders of Max Resource Corp. We have audited the accompanying consolidated financial statements of Max Resource Corp., which comprise the consolidated statements of financial position as at December 31, 2011, 2010 and January 1, 2010, and the consolidated statements of comprehensive loss, changes in equity and cash flows for the years ended December 31, 2011 and 2010, and a summary of significant accounting policies and other explanatory information.
Management's Responsibility for the Consolidated Financial Statements Management is responsible for the preparation and fair presentation of these consolidated financial statements in accordance with International Financial Reporting Standards as issued by the International Accounting Standards Board, and for such internal control as management determines is necessary to enable the preparation of consolidated financial statements that are free from material misstatement, whether due to fraud or error.
Our responsibility is to express an opinion on these consolidated financial statements based on our audits. We conducted our audits in accordance with Canadian generally accepted auditing standards and the standards of the Public Company Accounting Oversight Board (United States). Those standards require that we comply with ethical requirements and plan and perform the audit to obtain reasonable assurance about whether the consolidated financial statements are free from material misstatement.
An audit involves performing procedures to obtain audit evidence about the amounts and disclosures in the consolidated financial statements. The procedures selected depend on the auditor’s judgment, including the assessment of the risks of material misstatement of the consolidated financial statements, whether due to fraud or error. In making those risk assessments, the auditor considers internal control relevant to the entity's preparation and fair presentation of the consolidated financial statements in order to design audit procedures that are appropriate in the circumstances, but not for the purpose of expressing an opinion on the effectiveness of the entity's internal control. An audit also includes evaluating the appropriateness of accounting policies used and the reasonableness of accounting estimates made by management, as well as evaluating the overall presentation of the consolidated financial statements.
We believe that the audit evidence that we have obtained in our audits is sufficient and appropriate to provide a basis for our audit opinion.
Opinion
In our opinion, the consolidated financial statements present fairly, in all material respects, the financial position of Max Resource Corp. as at December 31, 2011, 2010 and January 1, 2010, and its financial performance and its cash flows for the years ended December 31, 2011 and 2010, in accordance with International Financial Reporting Standards as issued by the International Accounting Standards Board.
Emphasis of Matter
Without modifying our opinion, we draw attention to Note 1 to the consolidated financial statements which describes matters and conditions that indicate the existence of a material uncertainty that may cast doubt about Max Resource Corp.’s ability to continue as a going concern.
“DMCL”
Vancouver, Canada
April 23, 2012
Max Resource Corp.
Consolidated statements of financial position
(Expressed in Canadian dollars)
| | | Notes | | | December 31, 2011 | | | December 31, 2010 (Note 16) | | | January 1, 2010 (Note 16) | |
| ASSETS | | | | | | | | | | | | |
| | | | | | | | | | | | | |
| Current assets | | | | | | | | | | | | |
| Cash and cash equivalents | | | 3 | | | $ | 1,131,358 | | | $ | 2,087,207 | | | $ | 3,118,960 | |
| Receivables and prepaids | | | 4 | | | | 14,910 | | | | 11,138 | | | | 22,203 | |
| Taxes recoverable | | | | | | | 10,106 | | | | 15,287 | | | | 9,753 | |
| Marketable securities | | | 5 | | | | 71,500 | | | | 174,000 | | | | - | |
| | | | | | | | 1,227,874 | | | | 2,287,632 | | | | 3,150,916 | |
| Non-current assets | | | | | | | | | | | | | | | | |
| Property, plant and equipment | | | 6 | | | | 1,578 | | | | 2,254 | | | | 3,218 | |
| Reclamation deposits | | | 7 | | | | 68,183 | | | | 61,983 | | | | 28,356 | |
| Exploration and evaluation assets | | | 7 | | | | 3,721,207 | | | | 2,592,248 | | | | 2,142,513 | |
| | | | | | | | 3,790,968 | | | | 2,656,485 | | | | 2,174,087 | |
| TOTAL ASSETS | | | | | | $ | 5,018,842 | | | $ | 4,944,117 | | | $ | 5,325,003 | |
| | | | | | | | | | | | | | | | | |
| LIABILITIES | | | | | | | | | | | | | | | | |
| Current liabilities | | | | | | | | | | | | | | | | |
| Trade payables and accrued liabilities | | | 8 | | | $ | 127,109 | | | $ | 29,774 | | | $ | 57,549 | |
| | | | | | | | | | | | | | | | | |
| SHAREHOLDERS’ EQUITY | | | | | | | | | | | | | | | | |
| Share capital | | | 10 | | | | 13,754,038 | | | | 13,003,168 | | | | 13,003,168 | |
| Share purchase warrant reserve | | | | | | | 288,562 | | | | 288,562 | | | | 288,562 | |
| Share-based payment reserve | | | 11 | | | | 1,881,765 | | | | 1,458,599 | | | | 1,393,485 | |
| Investment revaluation reserve | | | 11 | | | | - | | | | 84,000 | | | | - | |
| Deficit | | | | | | | (11,032,632 | ) | | | (9,919,986 | ) | | | (9,417,671 | ) |
| | | | | | | | 4,891,733 | | | | 4,914,343 | | | | 5,267,544 | |
TOTAL LIABILITIES AND
SHAREHOLDERS’ EQUITY | | | | | | $ | 5,018,842 | | | $ | 4,944,117 | | | $ | 5,325,003 | |
See accompanying notes to the consolidated financial statements
Max Resource Corp.
Consolidated statements of comprehensive loss
(Expressed in Canadian dollars)
| | | | | | Years ended | |
| | | Notes | | | December 31, 2011 | | | December 31, 2010 (Note 16) | |
| | | | | | | | | | |
| Expenses | | | | | | | | | |
Amortization | | | | | $ | 676 | | | $ | 964 | |
Consulting | | | | | | 77,587 | | | | 60,920 | |
Consulting – stock based compensation | | | 10 | | | | 509,357 | | | | 65,114 | |
Management fees | | | | | | | 121,253 | | | | 120,000 | |
Office and miscellaneous | | | | | | | 51,918 | | | | 38,172 | |
Professional fees | | | | | | | 100,231 | | | | 97,772 | |
Transfer agent, filing fees and shareholder relations | | | | | | | 238,008 | | | | 158,252 | |
Travel and promotion | | | | | | | 20,944 | | | | 24,870 | |
| | | | | | | | (1,119,974 | ) | | | (566,064 | ) |
| Other items | | | | | | | | | | | | |
Gain on exploration and evaluation assets received | | | 7 | | | | - | | | | 39,893 | |
Impairment of marketable securities | | | 5 | | | | (11,000 | ) | | | - | |
Interest income | | | | | | | 15,828 | | | | 23,856 | |
Gain on sale of marketable securities | | | 5 | | | | 2,500 | | | | - | |
| | | | | | | | 7,328 | | | | 63,749 | |
| | | | | | | | | | | | | |
| Loss for the year | | | | | | | (1,112,646 | ) | | | (502,315 | ) |
| | | | | | | | | | | | | |
| Other comprehensive income (loss) | | | | | | | | | | | | |
Unrealized gain (loss) on marketable securities | | | 5 | | | | (84,000 | ) | | | 84,000 | |
| Total comprehensive loss for the year | | | | | | $ | (1,196,646 | ) | | $ | (418,315 | ) |
| | | | | | | | | | | | | |
| Loss per share – basic and diluted | | | 10 | | | $ | (0.05 | ) | | $ | (0.02 | ) |
See accompanying notes to the consolidated financial statements
Max Resource Corp.
Consolidated statement of changes in equity
(Expressed in Canadian dollars)
| | | Share capital | | Reserves | | | | | |
| | Notes | Number of
shares | | Amount | | Share purchase Warrant reserve | | Share-based
payment
reserve | | Investment
revaluation
reserve | | Deficit | | Total | |
| Balance at January 1, 2010 | | 16 | | 21,699,230 | | $ | 13,003,168 | | $ | 288,562 | | $ | 1,393,485 | | $ | - | | $ | (9,417,671 | ) | $ | 5,267,544 | |
| Comprehensive income: | | | | | | | | | | | | | | | | | | | | | | | |
Loss for the year | | | | - | | | - | | | - | | | - | | | - | | | (502,315 | ) | | (502,315 | ) |
Other comprehensive income | | | | - | | | - | | | - | | | - | | | 84,000 | | | - | | | 84,000 | |
| Total comprehensive loss for the year | | | | - | | | - | | | - | | | - | | | 84,000 | | | (502,315 | ) | | (418,315 | ) |
| Transactions with owners, in their capacity as owners, and other transfers: | | | | | | | | | | | | | | | | | | | | | | | |
Stock-based compensation | | | | - | | | - | | | - | | | 65,114 | | | - | | | - | | | 65,114 | |
Balance at December 31, 2010 | | 16 | | 21,699,230 | | $ | 13,003,168 | | $ | 288,562 | | $ | 1,458,599 | | $ | 84,000 | | $ | (9,919,986 | ) | $ | 4,914,343 | |
| | | | | | | | | | | | | | | | | | | | | | | | |
| Comprehensive income: | | | | | | | | | | | | | | | | | | | | | | | |
Loss for the year | | | | - | | $ | - | | $ | - | | $ | - | | $ | - | | $ | (1,112,646 | ) | $ | (1,112,646 | ) |
Other comprehensive loss | | | | - | | | - | | | - | | | - | | | (84,000 | ) | | - | | | (84,000 | ) |
| Total comprehensive loss for the year | | | | - | | | - | | | - | | | - | | | (84,000 | ) | | (1,112,646 | ) | | (1,196,646 | ) |
| Transactions with owners, in their capacity as owners, and other transfers: | | | | | | | | | | | | | | | | | | | | | | | |
Shares issued for cash – private placement | | 10 | | 2,016,755 | | | 564,691 | | | - | | | - | | | - | | | - | | | 564,691 | |
Share issue costs | | 10 | | - | | | (35,512 | ) | | - | | | - | | | - | | | - | | | (35,512 | ) |
Shares issued for cash – option exercise | | | | 790,000 | | | 135,500 | | | - | | | - | | | - | | | - | | | 135,500 | |
Reallocation of share-based payment reserves on exercise of stock options | | | | - | | | 86,191 | | | - | | | (86,191 | ) | | - | | | - | | | - | |
Stock-based compensation | | | | - | | | - | | | - | | | 509,357 | | | - | | | - | | | 509,357 | |
| Total transactions with owners, in their capacity as owners, and other transfers | | | | 2,806,755 | | | 578,488 | | | - | | | 423,166 | | | - | | | - | | | 1,174,036 | |
Balance at December 31, 2011 | | | | 24,505,985 | | $ | 13,754,038 | | $ | 288,562 | | $ | 1,881,765 | | $ | - | | $ | (11,032,632 | ) | $ | 4,891,733 | |
See accompanying notes to the consolidated financial statements
Max Resource Corp.
Consolidated statements of cash flows
(Expressed in Canadian dollars)
| | | Year ended | |
| | | December 31, 2011 | | | December 31, 2010 (Note 17) | |
| Operating activities | | | | | | |
| Loss for the year | | $ | (1,112,646 | ) | | $ | (502,315 | ) |
| Adjustments for: | | | | | | | | |
Amortization | | | 676 | | | | 964 | |
Gain on exploration and evaluation asset option payments received | | | - | | | | (39,893 | ) |
Gain on sale of marketable securities | | | (2,500 | ) | | | - | |
Impairment of available for sale investment | | | 11,000 | | | | - | |
Stock-based compensation | | | 509,357 | | | | 65,114 | |
Changes in non-cash working capital items: | | | | | | | | |
Decrease (increase) in receivables and prepaids | | | (3,772 | ) | | | 11,065 | |
Decrease (increase) in taxes recoverable | | | 5,181 | | | | (5,534 | ) |
Increase (decrease) in trade payables and accrued liabilities | | | 97,335 | | | | (27,685 | ) |
| Net cash flows used in operating activities | | | (495,369 | ) | | | (498,284 | ) |
| | | | | | | | | |
| Investing activities | | | | | | | | |
| Expenditures on exploration and evaluation assets | | | (1,128,959 | ) | | | (676,246 | ) |
| Exploration and evaluation asset option payments received | | | - | | | | 176,404 | |
| Additions to reclamation bonds | | | (6,200 | ) | | | (3,627 | ) |
| Proceeds from sale of marketable securities | | | 10,000 | | | | - | |
| Net cash flows used in investing activities | | | (1,125,159 | ) | | | (533,469 | ) |
| | | | | | | | | |
| Financing activities | | | | | | | | |
| Proceeds on issuance of common shares | | | 700,191 | | | | - | |
| Share issuance costs | | | (35,512 | ) | | | - | |
| Net cash flows provided by financing activities | | | 664,679 | | | | - | |
| Decrease in cash and cash equivalents | | | (955,849 | ) | | | (1,031,753 | ) |
| | | | | | | | | |
| Cash and cash equivalents, beginning of year | | | 2,087,207 | | | | 3,118,960 | |
| | | | | | | | | |
| Cash and cash equivalents, end of year | | $ | 1,131,358 | | | $ | 2,087,207 | |
See accompanying notes to the consolidated financial statements
Max Resource Corp.
Notes to the Consolidated Financial Statements
(Expressed in Canadian dollars)
For the years ended December 31, 2011 and 2010
| 1. | Nature and continuance of operations |
Max Resource Corp. (the “Company”) was incorporated on April 25, 1994, under the laws of the province of Alberta, Canada, and its principal activity is the acquisition and exploration of mineral properties in Canada and the United States. The Company’s shares are traded on the TSX Venture Exchange (“TSX-V”) under the symbol “MXR”.
The head office, principal address records office and registered office of the Company are located at 2300 – 1066 West Hastings Street, Vancouver, British Columbia, Canada, V6E 3X2.
These consolidated financial statements have been prepared on the assumption that the Company will continue as a going concern, meaning it will continue in operation for the foreseeable future and will be able to realize assets and discharge liabilities in the ordinary course of operations. Different bases of measurement may be appropriate if the Company is not expected to continue operations for the foreseeable future. As at December 31, 2011, the Company had not advanced its properties to commercial production and is not able to finance day to day activities through operations. The Company’s continuation as a going concern is dependent upon the successful results from its mineral property exploration activities and its ability to attain profitable operations and generate funds there from and/or raise equity capital or borrowings sufficient to meet current and future obligations. Management intends to finance operating costs over the next twelve months with funds on hand.
| 2. | Significant accounting policies and basis of preparation |
The financial statements were authorized for issue on April 23,2012 by the directors of the Company.
Statement of compliance and conversion to International Financial Reporting Standards
The consolidated financial statements of the Company comply with International Financial Reporting Standards (“IFRS”) as issued by the International Accounting Standards Board (“IASB”) and interpretations of the International Financial Reporting Interpretations Committee (“IFRIC”).
These are the Company’s first set of annual financial statements prepared in accordance with IFRS. The disclosures concerning the transition from pre-changeover Canadian Generally Accepted Accounting Principles (“GAAP”) to IFRS are provided in Note 16.
Basis of preparation
The consolidated financial statements of the Company have been prepared on an accrual basis and are based on historical costs, modified where applicable. The consolidated financial statements are presented in Canadian dollars unless otherwise noted.
Consolidation
The consolidated financial statements include the accounts of the Company and its controlled entities. Details of controlled entities are as follows:
| | | | Percentage owned* | |
| | Country of incorporation | | December 31, 2011 | | | December 31, 2010 | |
| Max Resource, Inc. | USA | | | 100 | % | | | 100 | % |
*Percentage of voting power is in proportion to ownership.
Inter-company balances and transactions, including unrealized income and expenses arising from inter-company transactions, are eliminated on consolidation.
Max Resource Corp.
Notes to the Consolidated Financial Statements
(Expressed in Canadian dollars)
For the years ended December 31, 2011 and 2010
| 2. | Significant accounting policies and basis of preparation (cont’d) |
Significant accounting judgments, estimates and assumptions
The preparation of the Company’s consolidated financial statements in conformity with IFRS requires management to make judgments, estimates and assumptions that affect the reported amounts of assets, liabilities and contingent assets and liabilities at the date of the consolidated financial statements and reported amounts of revenues and expenses during the reporting period. Estimates and assumptions are continuously evaluated and are based on management’s experience and other factors, including expectations of future events that are believed to be reasonable under the circumstances. However, actual outcomes can differ significantly from these estimates.
Areas requiring a significant degree of estimation and judgment relate to the determination of the useful lives of property, plant and equipment, the recoverability of the carrying value of exploration and evaluation assets, allocation of costs to exploration and evaluation assets, fair value measurements for financial instruments and stock-based compensation and other equity-based payments, the recognition and valuation of provisions for restoration and environmental liabilities, and the recoverability and measurement of deferred tax assets and liabilities. Actual results may differ from those estimates and judgments.
Foreign currency translation
The functional currency of each entity is measured using the currency of the primary economic environment in which that entity operates. The consolidated financial statements are presented in Canadian dollars which is the parent company and United States subsidiary’s functional and presentation currency.
Transactions and balances:
Foreign currency transactions are translated into functional currency using the exchange rates prevailing at the date of the transaction. Foreign currency monetary items are translated at the period-end exchange rate. Non-monetary items measured at historical cost continue to be carried at the exchange rate at the date of the transaction. Non-monetary items measured at fair value are reported at the exchange rate at the date when fair values were determined.
Exchange differences arising on the translation of monetary items or on settlement of monetary items are recognized in profit or loss in the statement of comprehensive income in the period in which they arise, except where deferred in equity as a qualifying cash flow or net investment hedge.
Exchange differences arising on the translation of non-monetary items are recognized in other comprehensive income in the statement of comprehensive income to the extent that gains and losses arising on those non-monetary items are also recognized in other comprehensive income. Where the non-monetary gain or loss is recognized in profit or loss, the exchange component is also recognized in profit or loss.
Exploration and evaluation expenditures
Exploration and evaluation expenditures include the costs of acquiring licenses and rights, costs associated with exploration and evaluation activity, and the fair value (at acquisition date) of exploration and evaluation assets acquired in a business combination. Exploration and evaluation expenditures are capitalized. Costs incurred before the Company has obtained the legal rights to explore an area are recognized in profit or loss.
Government tax credits received are recorded as a reduction to the cumulative costs incurred and capitalized on the related property.
Exploration and evaluation assets are assessed for impairment if (i) sufficient data exists to determine technical feasibility and commercial viability, and (ii) facts and circumstances suggest that the carrying amount exceeds the recoverable amount.
Max Resource Corp.
Notes to the Consolidated Financial Statements
(Expressed in Canadian dollars)
For the years ended December 31, 2011 and 2010
| 2. | Significant accounting policies and basis of preparation (cont’d) |
Exploration and evaluation expenditures (cont’d)
Once the technical feasibility and commercial viability of the extraction of mineral resources in an area of interest are demonstrable, exploration and evaluation assets attributable to that area of interest are first tested for impairment and then reclassified to mining property and development assets within property, plant and equipment.
Recoverability of the carrying amount of any exploration and evaluation assets is dependent on successful development and commercial exploitation, or alternatively, sale of the respective areas of interest.
Farms outs
The Company does not record any expenditure made by the farmee on its account. It also does not recognize any gain or loss on its exploration and evaluation farm out arrangements but reallocates any costs previously capitalized in relation to the whole interest as relating to the partial interest retained and any consideration received directly from the farmee is credited against costs previously capitalized. A gain is only recognized when credited proceeds exceed carrying value.
Share-based payments
The Company operates an employee stock option plan. Share-based payments to employees are measured at the fair value of the instruments issued and amortized over the vesting periods. Share-based payments to non-employees are measured at the fair value of goods or services received or the fair value of the equity instruments issued, if it is determined the fair value of the goods or services cannot be reliably measured, and are recorded at the date the goods or services are received. The corresponding amount is recorded to the share-based payment reserve. The fair value of options is determined at the grant date using a Black–Scholes pricing model which incorporates market and vesting conditions. The number of shares and options expected to vest is reviewed and adjusted at the end of each reporting period such that the amount recognized for services received as consideration for the equity instruments granted shall be based on the number of equity instruments that eventually vest.
Loss per share
Basic loss per share is calculated by dividing the loss attributable to common shareholders by the weighted average number of common shares outstanding in the period. For all periods presented, the loss attributable to common shareholders equals the reported loss attributable to owners of the Company. Diluted loss per share is calculated by the treasury stock method. Under the treasury stock method, the weighted average number of common shares outstanding for the calculation of diluted loss per share assumes that the proceeds to be received on the exercise of dilutive share options and warrants are used to repurchase common shares at the average market price during the period.
Financial instruments
The Company classifies its financial instruments in the following categories: at fair value through profit or loss, loans and receivables, held-to-maturity investments, available-for-sale and financial liabilities. The classification depends on the purpose for which the financial instruments were acquired. The Company determines the classification of its financial instruments at initial recognition.
Financial assets are classified at fair value through profit or loss when they are either held for trading for the purpose of short-term profit taking, derivatives not held for hedging purposes, or when they are designated as such to avoid an accounting mismatch or to enable performance evaluation where a group of financial assets is managed by key management personnel on a fair value basis in accordance with a documented risk management or investment strategy. Such assets are subsequently measured at fair value with changes in carrying value being included in profit or loss.
Max Resource Corp.
Notes to the Consolidated Financial Statements
(Expressed in Canadian dollars)
For the years ended December 31, 2011 and 2010
| 2. | Significant accounting policies and basis of preparation (cont’d) |
Financial instruments (cont’d)
Loans and receivables are non-derivative financial assets with fixed or determinable payments that are not quoted in an active market and are subsequently measured at amortized cost. They are included in current assets, except for maturities greater than 12 months after the end of the reporting period. These are classified as non-current assets.
Held-to-maturity investments are non-derivative financial assets that have fixed maturities and fixed or determinable payments, and it is the Company’s intention to hold these investments to maturity. They are subsequently measured at amortized cost. Held-to-maturity investments are included in non-current assets, except for those which are expected to mature within 12 months after the end of the reporting period.
Available-for-sale financial assets are non-derivative financial assets that are designated as available-for-sale or are not suitable to be classified as financial assets at fair value through profit or loss, loans and receivables or held-to-maturity investments and are subsequently measured at fair value. These are included in current assets. Unrealized gains and losses are recognized in other comprehensive income, except for impairment losses and foreign exchange gains and losses on monetary financial assets.
Non-derivative financial liabilities (excluding financial guarantees) are subsequently measured at amortized cost.
Regular purchases and sales of financial assets are recognized on the trade-date – the date on which the group commits to purchase the asset.
Financial assets are derecognized when the rights to receive cash flows from the investments have expired or have been transferred and the Company has transferred substantially all risks and rewards of ownership.
At each reporting date, the Company assesses whether there is objective evidence that a financial instrument has been impaired. In the case of available-for-sale financial instruments, a significant and prolonged decline in the value of the instrument is considered to determine whether an impairment has arisen.
The Company does not have any derivative financial assets and liabilities.
Impairment of assets
The carrying amount of the Company’s assets (which include property, plant and equipment and exploration and evaluation assets) is reviewed at each reporting date to determine whether there is any indication of impairment. If such indication exists, the recoverable amount of the asset is estimated in order to determine the extent of the impairment loss. An impairment loss is recognized whenever the carrying amount of an asset or its cash generating unit exceeds its recoverable amount. Impairment losses are recognized in the statement of income and comprehensive income.
The recoverable amount of assets is the greater of an asset’s fair value less cost to sell and value in use. In assessing value in use, the estimated future cash flows are discounted to their present value using a pre-tax discount rate that reflects the current market assessments of the time value of money and the risks specific to the asset. For an asset that does not generate cash inflows largely independent of those from other assets, the recoverable amount is determined for the cash-generating unit to which the asset belongs.
An impairment loss is only reversed if there is an indication that the impairment loss may no longer exist and there has been a change in the estimates used to determine the recoverable amount, however, not to an amount higher than the carrying amount that would have been determined had no impairment loss been recognized in previous years.
Max Resource Corp.
Notes to the Consolidated Financial Statements
(Expressed in Canadian dollars)
For the years ended December 31, 2011 and 2010
| 2. | Significant accounting policies and basis of preparation (cont’d) |
Impairment of assets (cont’d)
Assets that have an indefinite useful life are not subject to amortization and are tested annually for impairment.
Cash and cash equivalents
Cash and cash equivalents include cash on hand, deposits held with banks, other short-term highly liquid investments with original maturities of three months or less, and bank overdrafts.
Income taxes
Current income tax:
Current income tax assets and liabilities for the current period are measured at the amount expected to be recovered from or paid to the taxation authorities. The tax rates and tax laws used to compute the amount are those that are enacted or substantively enacted, at the reporting date, in the countries where the Company operates and generates taxable income.
Current income tax relating to items recognized directly in other comprehensive income or equity is recognized in other comprehensive income or equity and not in profit or loss. Management periodically evaluates positions taken in the tax returns with respect to situations in which applicable tax regulations are subject to interpretation and establishes provisions where appropriate.
Deferred income tax:
Deferred income tax is provided using the balance sheet method on temporary differences at the reporting date between the tax bases of assets and liabilities and their carrying amounts for financial reporting purposes.
The carrying amount of deferred income tax assets is reviewed at the end of each reporting period and recognized only to the extent that it is probable that sufficient taxable profit will be available to allow all or part of the deferred income tax asset to be utilized.
Deferred income tax assets and liabilities are measured at the tax rates that are expected to apply to the year when the asset is realized or the liability is settled, based on tax rates (and tax laws) that have been enacted or substantively enacted by the end of the reporting period.
Deferred income tax assets and deferred income tax liabilities are offset only if a legally enforceable right exists to set off current tax assets against current income tax liabilities and the deferred income taxes relate to the same taxable entity and the same taxation authority.
Flow-through shares:
On the issuance of flow-through shares, any premium received in excess of the closing market price of the Company’s common shares is initially recorded as a liability (“flow-through tax liability”) and included in trade payables and accrued liabilities. Provided that the Company has renounced the related expenditures, or that there is a reasonable expectation that it will do so, the flow-through tax liability is reduced on a pro-rata basis as the expenditures are incurred and a deferred tax liability is recognized. The reduction to the flow-through tax liability is recognized in profit or loss as other income.
To the extent that the Company has suitable unrecognized deductible temporary differences, an offsetting recovery of deferred income taxes would be recorded.
Max Resource Corp.
Notes to the Consolidated Financial Statements
(Expressed in Canadian dollars)
For the years ended December 31, 2011 and 2010
| 2. | Significant accounting policies and basis of preparation (cont’d) |
Restoration and environmental obligations
The Company recognizes liabilities for statutory, contractual, constructive or legal obligations associated with the retirement of long-term assets, when those obligations result from the acquisition, construction, development or normal operation of the assets. The net present value of future restoration cost estimates arising from the decommissioning of plant and other site preparation work is capitalized to exploration and evaluation assets along with a corresponding increase in the restoration provision in the period incurred. Discount rates using a pre-tax rate that reflect the time value of money are used to calculate the net present value. The restoration asset will be depreciated on the same basis as other mining assets.
The Company’s estimates of restoration costs could change as a result of changes in regulatory requirements. These changes are recorded directly to mining assets with a corresponding entry to the restoration provision. The Company’s estimates are reviewed annually for changes in regulatory requirements, discount rates, effects of inflation and changes in estimates.
Changes in the net present value, excluding changes in the Company’s estimates of reclamation costs, are charged to profit or loss for the period.
The net present value of restoration costs arising from subsequent site damage that is incurred on an ongoing basis during production are charged to profit or loss in the period incurred.
The costs of restoration projects that were included in the provision are recorded against the provision as incurred. The costs to prevent and control environmental impacts at specific properties are capitalized in accordance with the Company’s accounting policy for exploration and evaluation assets.
Property, plant and equipment
Property, plant and equipment are stated at historical cost less accumulated amortization and accumulated impairment losses.
Subsequent costs are included in the asset’s carrying amount or recognized as a separate asset, as appropriate, only when it is probable that future economic benefits associated with the item will flow to the Company and the cost of the item can be measured reliably. The carrying amount of significant replaced parts are derecognized. All other repairs and maintenance costs are charged to the statement of income and comprehensive income during the financial period in which they are incurred.
Gains and losses on disposals are determined by comparing the proceeds with the carrying amount and are recognized in profit or loss.
Amortization is calculated on a straight-line method to write off the cost of the assets to their residual values over their estimated useful lives. The amortization rates applicable to each category of property, plant and equipment are as follows:
Class of property, plant and equipment Amortization rate
Equipment 30%
Accounting standards issued by not yet effective
Amendments to IFRS 7 “Financial Instruments: Disclosures”
This amendment increases the disclosure required regarding the transfer of financial assets, especially if there is a disproportionate amount of transfer transactions that take place around the end of a reporting period. This amendment is effective for annual periods beginning on or after July 1, 2011
Max Resource Corp.
Notes to the Consolidated Financial Statements
(Expressed in Canadian dollars)
For the years ended December 31, 2011 and 2010
| 2. | Significant accounting policies and basis of preparation (cont’d) |
Accounting standards issued by not yet effective (cont’d)
New standard IFRS 9 “Financial Instruments”
This new standard is a partial replacement of IAS 39 “Financial Instruments: Recognition and Measurement”. IFRS 9 uses a single approach to determine whether a financial asset is measured at amortized cost or fair value, replacing the multiple rules in IAS 39. The approach in IFRS 9 is based on how an entity manages its financial instruments in the context of its business model and the contractual cash flow characteristics of the financial assets.
The new standard also requires a single impairment method to be used, replacing the multiple impairment methods in IAS 39. IFRS 9 is effective for annual periods beginning on or after January 1, 2013.
New standard IFRS 10 “Consolidated Financial Statements”
This new standard will replace IAS 27 “Consolidated and Separate Financial Statements”, and SIC-12 “Consolidation – Special Purpose Entities”. Concurrent with IFRS 10, the IASB issued IFRS 11 “Joint Ventures”; IFRS 12 “Disclosures of Involvement with Other Entities”; IAS 27 “Separate Financial Statements”, which has been amended for the issuance of IFRS 10 but retains the current guidance for separate financial statements; and IAS 28 “Investments in Associates and Joint Ventures”, which has been amended for conforming changes based on the issuance of IFRS 10 and IFRS 11.
IFRS 10 uses control as the single basis for consolidation, irrespective of the nature of the investee, eliminating the risks and rewards approach included in SIC-12, and requires continuous assessment of control over an investee. The above consolidation standards are effective for annual periods beginning on or after January 1, 2013.
New interpretation IFRIC 20 “Stripping Costs in the Production Phase of a Surface Mine”
This new IFRIC clarifies when production stripping should lead to the recognition of an asset and how that asset should be measured, both initially and in subsequent periods. IFRIC 20 is effective for annual periods beginning on or after January 1, 2013.
The Company has not early adopted these revised standards and is currently assessing the impact that these standards will have on its consolidated financial statements.
IFRS 11, Joint Arrangements
IFRS 11 requires a venturer to classify its interest in a joint arrangement as a joint venture or joint operation. Joint ventures will be accounted for using the equity method of accounting whereas for a joint operation the venture will recognize its share of the assets, liabilities, revenue and expenses of the joint operation. Under existing IFRS, entities have the choice to proportionately consolidate or equity account for interests in joint ventures. IFRS 11 supersedes lAS 31, Interests in Joint Ventures, and SIC-13, Jointly Controlled Entities-Non-monetary Contributions by Venturers.
IFRS 12, Disclosure of Interests in Other Entities
IFRS 12 establishes disclosure requirements for interests in other entities, such as joint arrangements, associates, special purpose vehicles and off balance sheet vehicles. The standard carries forward existing disclosures and also introduces significant additional disclosure requirements that address the nature of, and risks associated with, an entity's interests in other entities.
Max Resource Corp.
Notes to the Consolidated Financial Statements
(Expressed in Canadian dollars)
For the years ended December 31, 2011 and 2010
| 2. | Significant accounting policies and basis of preparation (cont’d) |
Accounting standards issued by not yet effective (cont’d)
IFRS 13 Fair Value Measurement
IFRS 13 is a comprehensive standard for fair value measurement and disclosure requirements for use across all IFRS standards. The new standard clarifies that fair value is the price that would be received to sell an asset, or paid to transfer a liability in an orderly transaction between market participants, at the measurement date. It also establishes disclosures about fair value measurement. Under existing IFRS, guidance on measuring and disclosing fair value is dispersed among the specific standards requiring fair value measurements and in many cases does not reflect a clear measurement basis or consistent disclosures.
Other accounting standards or amendments to existing accounting standards that have been issued but have future effective dates are either not applicable or are not expected to have a significant impact on the Company’s financial statements.
| 3. | Cash and cash equivalents |
The components of cash and cash equivalents are as follows:
| | | December 31, 2011 | | | December 31,
2010 | | | January 1, 2010 |
| Cash at bank | | $ | 231,358 | | | $ | 87,207 | | | $ | 118,960 |
| Guaranteed investment certificates | | | 900,000 | | | | 2,000,000 | | | | 3,000,000 |
| | | $ | 1,131,358 | | | $ | 2,087,632 | | | $ | 3,118,960 |
| 4. | Receivables and prepaids |
The components of receivables and prepaids are as follows:
| | | December 31, 2011 | | | December 31, 2010 | | | January 1, 2010 |
| Accrued interest receivable | | $ | 6,932 | | | $ | 6,915 | | | $ | 17,264 |
| Prepaid expenses | | | 4,223 | | | | 4,223 | | | | 4,939 |
| | | $ | 11,155 | | | $ | 11,138 | | | $ | 22,203 |
During the year ended December 31, 2010, the Company received an option payment, consisting of 600,000 shares with a market value of $90,000 from Kokanee Placer Ltd. (“Kokanee”), a publically traded British Columbia company. The Company records these available for sale shares at fair value. As at December 31, 2010, the fair value of these shares was $174,000. During the year ended December 31, 2010, the Company recognized an unrealized gain of $84,000 on its marketable securities, which was recorded as other comprehensive income. During the year ended December 31, 2011, the Company sold 50,000 of these common shares for proceeds of $9,780 resulting in a gain of $2,500. At December 31, 2011, the Company held 550,000 common shares of Kokanee with a fair market value of $71,500 and as a result, the Company recognised an unrealized loss of $88,000 on its marketable securities, which was recorded as other comprehensive loss.
When a decline in the fair value of an available-for-sale financial asset has been recognised in other comprehensive income and there is objective evidence that the asset is impaired, the cumulative loss that had been recognised in other comprehensive income shall be reclassified from equity to profit or loss as a reclassification adjustment even though the financial asset has not been derecognised. Management determined that the fair value of the Kokanee shares declined permanently and recorded a resulting impairment charge of $11,000.
Max Resource Corp.
Notes to the Consolidated Financial Statements
(Expressed in Canadian dollars)
For the years ended December 31, 2011 and 2010
| 6. | Property, plant and equipment |
| | | Equipment |
| | | |
| Cost: | | |
| At January 1, 2010, December 31, 2010 and December 31, 2011 | | $ | 5,148 |
| | | | |
| Depreciation: | | | |
| At January 1, 2010 | | | 1,930 |
| Charge for the year | | | 964 |
| At December 31, 2010 | | | 2,894 |
| Charge for the year | | | 676 |
| At December 31, 2011 | | | 3,570 |
| | | | |
| Net book value: | | | |
| At January 1, 2010 | | $ | 3,218 |
| At December 31, 2010 | | $ | 2,254 |
| At December 31, 2011 | | $ | 1,578 |
Max Resource Corp.
Notes to the Consolidated Financial Statements
(Expressed in Canadian dollars)
For the years ended December 31, 2011 and 2010
| 7. | Exploration and evaluation assets |
| | | Balance January 1,
2010 | | Additions | | Option
Payments &
Recoveries
Received | | Balance December 31,
2010 | | Additions | | Option
Payments &
Recoveries
Received | | Balance December 31,
2011 |
| Acquisition costs: | | | | | | | | | | | | | | |
| C de Baca, NM | | $ | 188,902 | | $ | 17,570 | | $ | - | | $ | 206,472 | | $ | 19,319 | | $ | - | | $ | 225,791 |
| Diamond Peak, NV | | | 50,107 | | | 134,463 | | | (148,841 | ) | | 35,729 | | | 9,625 | | | - | | | 45,354 |
| Ravin, NV | | | 176,603 | | | 17,985 | | | - | | | 194,588 | | | 10,010 | | | - | | | 204,598 |
| East Manhattan, NV | | | 151,339 | | | 53,631 | | | - | | | 204,970 | | | 35,803 | | | - | | | 240,773 |
| Howell, BC (Note 17) | | | 37,500 | | | - | | | - | | | 37,500 | | | - | | | - | | | 37,500 |
Crowsnest, BC (Note 17) | | | 8,817 | | | - | | | - | | | 8,817 | | | - | | | - | | | 8,817 |
| Table Top, NV | | | 30,318 | | | 40,402 | | | - | | | 70,720 | | | 11,624 | | | - | | | 82,344 |
| Majuba Hill, NV | | | - | | | - | | | - | | | - | | | 54,526 | | | - | | | 54,526 |
| | | | 643,586 | | | 264,051 | | | (148,841 | ) | | 758,796 | | | 140,907 | | | - | | | 899,703 |
| | | | | | | | | | | | | | | | | | | | | | |
| Exploration costs: | | | | | | | | | | | | | | | | | | | | | |
| C de Baca, NM | | | 235,596 | | | - | | | - | | | 235,596 | | | - | | | - | | | 235,596 |
| Diamond Peak, NV | | | - | | | 58,092 | | | - | | | 58,092 | | | 2,371 | | | - | | | 60,463 |
| Ravin, NV | | | 504,348 | | | 639 | | | - | | | 504,987 | | | - | | | - | | | 504,987 |
| East Manhattan, NV | | | 63,106 | | | 38,748 | | | - | | | 101,854 | | | 6,327 | | | - | | | 108,181 |
Howell, BC (Note 17) | | | 437,801 | | | - | | | - | | | 437,801 | | | - | | | - | | | 437,801 |
Crowsnest, BC (Note 17) | | | 248,429 | | | 613 | | | (77,670 | ) | | 171,372 | | | - | | | (184 | ) | | 171,188 |
| Table Top, NV | | | 9,647 | | | 314,103 | | | - | | | 323,750 | | | 150,820 | | | - | | | 474,570 |
| Majuba Hill, NV | | | - | | | - | | | - | | | - | | | 828,718 | | | - | | | 828,718 |
| | | | 1,498,927 | | | 412,195 | | | (77,670 | ) | | 1,833,452 | | | 988,236 | | | (184 | ) | | 2,821,504 |
| | | $ | 2,142,513 | | $ | 676,246 | | $ | (226,511 | ) | $ | 2,592,248 | | $ | 1,129,143 | | $ | (184 | ) | $ | 3,721,207 |
C de Baca, New Mexico, United States
On September 22, 2005, the Company entered into an agreement to acquire a total of 108 claims (the “Dat Claims”) in Socorro County, New Mexico, pursuant to an agreement with Applied Geologic Services, Inc. of Denver, Colorado. Consideration for the acquisition of the Claims was US$10,000 cash payment (paid), with annual payments of US$10,000 until the commencement of production. After commencement of production, a royalty of 2% of gross revenues is payable until such time as a total of US$500,000 (including the initial cash payment and annual payments) has been paid.
During the year ended December 31, 2011 and 2010, the Company did not incur exploration costs on the C de Baca project.
At December 31, 2011, the Bureau of Land Management (“BLM”) of New Mexico holds an $16,272 reclamation bond (December 31, 2010 - $18,888; January 1, 2010 - $18,888) from the Company to guarantee reclamation of the environment on the property. Subsequent to December 31, 2011, this amount was refunded.
Max Resource Corp.
Notes to the Consolidated Financial Statements
(Expressed in Canadian dollars)
For the years ended December 31, 2011 and 2010
| 7. | Exploration and evaluation assets (cont’d) |
Diamond Peak, Nevada, United States
On May 9, 2006, the Company entered into an Option Agreement, as amended June 30, 2010, to acquire a 100% interest in the claims in Eureka County, Nevada, the “Diamond Peak Property”, from The Wendt Family Trust. The Wendt Family Trust is controlled by Clancy J. Wendt, the Vice President of Exploration for the Company. The terms of the Option Agreement require the issuance to the Wendt Family Trust of 100,000 escrowed shares (issued) of the Company with a fair value of $40,000 and the following rental payments:
| Date | | Payment Amount |
| Upon execution of the Agreement | $ | 25,000 (U.S.) (paid) |
| May 9, 2007 | | 35,000 (U.S.) (paid) |
| May 9, 2008 | | 45,000 (U.S.) (paid) |
| May 9, 2009 | | 50,000 (U.S.) (paid) |
| June 30, 2010 (on execution of amending agreement) | | 25,000 (U.S.) (paid) |
| May 9, 2011 (as amended) | | 35,000 (U.S.) (deferred) |
| May 9, 2012 (as amended) | | 45,000 (U.S.) |
| Each anniversary thereafter for 4 years (as amended) | | 50,000 (U.S.) |
On May 15, 2006, the Company entered into a mineral property Option Agreement with Kokanee whereby it granted Kokanee the right to acquire up to a 51% interest in the Diamond Peak Property in consideration of certain cash payments totaling US$470,000, the issuance of 600,000 common shares of Kokanee and incur mineral exploration commitments of $1,000,000.
During the year ended December 31, 2010, the Company received cash of $98,734 (US$95,000) and 600,000 common shares of Kokanee valued at $90,000 for total proceeds received of $188,734 on the Diamond Peak property. As the Company had only incurred costs of $148,841 at that point, a gain on option payments received of $39,893 has been recorded. In June 2010, Kokanee advised the Company that they would not make the annual option payment of US$50,000 then due and would be abandoning their option on the property.
During the year ended December 31, 2011, the Company incurred $1,794 of drilling and assaying fees and $577 of field expenses on the Diamond Peak project. During the year ended December 31, 2010, the Company incurred consulting fees of $21,248, drilling and assaying fees of $9,220 and field expenses of $27,624.
At December 31 2011, the BLM holds a $14,500 reclamation bond (December 31, 2010 - $14, 500; January 1, 2010 - $Nil) from the Company to guarantee reclamation of the property.
Max Resource Corp.
Notes to the Consolidated Financial Statements
(Expressed in Canadian dollars)
For the years ended December 31, 2011 and 2010
| 7. | Exploration and evaluation assets (cont’d) |
Ravin Claims, Nevada, United States
On September 10, 2007, as amended November 9, 2010, the Company entered into an Option Agreement with Energex LLC (“Energex”), a Nevada corporation, for the acquisition of a 100% interest in the Ravin property, consisting of mineral claims located in Lander County, Nevada. Energex is wholly-owned by Clancy J. Wendt, the Vice President of Exploration for the Company.
The terms, as amended, of the Option Agreement with Energex require the payment of $4,996 (US$5,000) on execution of the agreement (paid), $26,722 (US$25,000) by September 10, 2008 (paid), $38,700 (US$35,000) by September 10, 2009 (paid),$10,650 (US$10,000) by September 10, 2010 (paid) and $10,010 (US$10,000) by September 10, 2011 (paid), with an additional US$10,000 on each anniversary thereafter, subject to increase to US$50,000 upon certain triggering events. The Ravin Property is subject to a 3% NSR royalty. Upon full exercise of the option, the Company will own 100% of the project. In addition, the Company has paid filing fees of $106,185, which have been included in acquisition costs.
During the year ended December 31, 2011, the Company did not incur exploration costs on the Ravin claims. During the year ended December 31, 2010, the Company incurred geological consulting costs of $639 on the Ravin claims.
At December 31, 2011, the BLM holds an $8,046 reclamation bond (December 31, 2010 - $8,046; January 1, 2010 - $8,046) from the Company to guarantee reclamation of the environment on the property.
East Manhattan, Nevada, United States
On November 11, 2007, as amended December 4, 2008 and December 21, 2010, the Company entered into an Option Agreement with MSM Resource LLC (“MSM”), a Nevada corporation, for the acquisition of a 100% interest in the East Manhattan Wash mineral claims located in Nye County, Nevada.
The terms of the Option Agreement with MSM call for the payment of $27,874 (US$28,000) on execution of the agreement (paid), $25,029 (US$20,000) by December 4, 2008 (paid), $26,603 (US$25,000) by December 4, 2009 (paid), $40,560 (US$40,000) by December 4, 2010 (paid), US$50,000 by December 4, 2011 and US$100,000 by December 12, 2012, subject to securing a drill permit.
In addition, the Company must make exploration expenditures totaling US$700,000 on the claims including the following minimum expenditures (subject to receipt of drill permits and securing a drill rig, which to the date of this report has not been received):
| | (i) | on or before the second anniversary, US$50,000 (deferred until drill rig secured); |
| | (ii) | on or before the fourth anniversary, a further US$150,000; |
| | (iii) | on or before the fifth anniversary, a further US$200,000; and |
| | (iv) | on or before the sixth anniversary, a further US$300,000. |
The East Manhattan Property is subject to a 3% NSR royalty. Upon full exercise of the option, the Company will own 100% of the project.
During the year ended December 31, 2011, the Company incurred $6,045 of geological consulting and $282 of field expenses on the East Manhattan project. During the year ended December 31, 2010, the Company incurred drilling and assaying fees of $5,202, geological consulting of $29,923 and field expenses of $3,623 on the East Manhattan project.
Max Resource Corp.
Notes to the Consolidated Financial Statements
(Expressed in Canadian dollars)
For the years ended December 31, 2011 and 2010
| 7. | Exploration and evaluation assets (cont’d) |
Howell and Crowsnest, British Columbia, Canada
On June 9, 2008, the Company entered into an Option Agreement with Eastfield Resources Ltd. (“Eastfield”), whereby the Company may acquire a 60% interest in the Howell Gold Project in Southeast British Columbia. On July 23 2009, the Company agreed with Eastfield to amend the Howell property agreement to allow the Company to earn a 60% interest in either the Howell or the Crowsnest projects over a four year period by making cash payments totaling $60,000 to Eastfield ($10,000 paid on signing of the amended agreement), issuing 50,000 shares (issued) and by completing aggregate exploration expenditures on both properties of $400,000 by the second anniversary date (June 30, 2011 - completed). Following that date, the Company can earn its 60% interest in Howell by making further cash payments totaling $90,000, issuing 400,000 shares and spending a further $700,000 on exploration prior to June 30, 2013. To earn its 60% interest in Crowsnest, the Company must make further cash payments to Eastfield of $90,000, issue 400,000 shares and spend a further $1,050,000 on exploration at Crowsnest prior to June 30, 2013.
In February 2010, the Government of British Columbia announced a halt to all ongoing mineral exploration work and mine development in the Flathead Valley in southeastern British Columbia where the Howell and Crowsnest properties are located. The Company was immediately contacted by the Ministry of Energy, Mines and Petroleum Resources and discussions were initiated with respect to compensation. Subsequent to December 31, 2011, the Company was reimbursed for all its expenditures on the Howell and Crowsnest properties in the total amount of $655,306 (Note 17).
During the year ended December 31, 2011 and 2010, the Company did not incur exploration costs on the Howell property. During the year ended December 31, 2011, the Company received $184 of a mining tax credit on the Crowsnest property. During the year ended December 31, 2010, the Company incurred $613 of geological consulting on the property and received $77,670 of mining tax credit for mineral exploration in British Columbia.
Table Top, Nevada, United States
On August 31, 2009, the Company entered into an Option Agreement with Energex to acquire a 100% interest in the Table Top claims in Humboldt County Nevada.
The terms of the Option Agreement with Energex require the payment of $5,400 (US$5,000) upon execution of the Agreement (paid), US$25,000 on the first anniversary of the Agreement (deferred indefinitely), US$35,000 on the second anniversary of the Agreement (deferred indefinitely) and US$50,000 on each anniversary thereafter for a term of ten years, subject to renewal. The Company may buy the property at any time for US$300,000, at which point the annual payments will cease. The Table Top property is subject to a 3% NSR royalty. Upon full exercise of the Option Agreement, the Company will own 100% of the project.
During the year ended December 31, 2011, $27,139 of geological consulting, drilling and assaying fees of $109,682 and field expenses of $13,999 on the property. During the year ended December 31, 2010, the Company incurred geological consulting of $91,048, drilling and assaying fees of $198,915 and field expenses of $24,140 on the property.
At December 31, 2011, the BLM holds a $19,127 reclamation bond (December 31, 2010 - $19,127; January 1, 2010 - $Nil) from the Company to guarantee reclamation of the environment on the property.
Max Resource Corp.
Notes to the Consolidated Financial Statements
(Expressed in Canadian dollars)
For the years ended December 31, 2011 and 2010
| 7. | Exploration and evaluation assets (cont’d) |
Majuba Hill, Nevada, United States
On March 4, 2011, the Company entered into an option agreement (“Agreement”) to acquire up to a 75% interest in the Majuba Hill Copper/Gold/Silver property in Pershing County, Nevada from Claremont Nevada Mines LLC., (“Claremont”) of Nevada. The terms of the Agreement with Claremont allow the Company to earn an initial 60% interest in the property over six years by spending US$6,500,000 on exploration of the property, as follows:
| | - | incurring $500,000 in exploration work by March 4, 2012 (completed); |
| | - | incurring a further $750,000 in exploration work by March 4, 2013; |
| | - | incurring a further $1,000,000 in exploration work by March 4, 2014; |
| | - | incurring a further $1,250,000 in exploration work by March 4, 2015; |
| | - | incurring a further $1,500,000 in exploration work by March 4, 2016; and |
| | - | incurring a further $1,500,000 in exploration work by March 4, 2017. |
The Company can increase its interest in the property to 75% by spending a further $3,500,000 on exploration over a subsequent two year period. The Majuba Hill property will be subject to a 3% NSR payable to the vendor, 1.5% of which may be purchased at any time for US$1,500,000.
During the year ended December 31, 2011, the Company paid $19,560 (US$20,000) in lease payments on the Majuba Hill property. The Company incurred $36,171 for staking additional claims on the Majuba Hill property.
During the year ended December 31, 2011, the Company incurred $213,081 for geological consulting, $420,512 for drilling and $134,034 for field expenses on the Majubi Hill project.
At December 31, 2011, the BLM holds a $10,238 reclamation bond (December 31, 2010 - $Nil; January 1, 2010 - $Nil) from the Company to guarantee reclamation of the environment on the property.
Other
At December 31, 2011, an additional bond of $Nil (December 31, 2010 - $1,422; January 1, 2010 - $1,422) was held on properties previously fully impaired.
| 8. | Trade payables and accrued liabilities |
The components of trade payables and accrued liabilities are as follows:
| | | December 31, 2011 | | | December 31,
2010 | | | January 1, 2010 |
| Trade payables | | $ | 67,283 | | | $ | 29,774 | | | $ | 36,820 |
| Amounts due to related parties (Note 12) | | | 39,826 | | | | - | | | | 639 |
| Accrued liabilities | | | 20,000 | | | | - | | | | 20,000 |
| | | $ | 127,109 | | | $ | 29,774 | | | $ | 57,459 |
Max Resource Corp.
Notes to the Consolidated Financial Statements
(Expressed in Canadian dollars)
For the years ended December 31, 2011 and 2010
| 9. | Income tax expense and deferred tax assets and liabilities |
A reconciliation of the expected income tax recovery to the actual income tax recovery is as follows:
| | | Year ended
December 31,
2011 | | | Year ended
December 31,
2010 | |
| Net loss | | $ | (1,112,646 | ) | | $ | (502,315 | ) |
| | | | | | | | | |
| Statutory tax rate | | | 30 | % | | | 30 | % |
| Expected income tax recovery at the statutory tax rate | | $ | (333,794 | ) | | $ | (150,695 | ) |
| Non-deductible items | | | 152,807 | | | | 20,134 | |
| Other items | | | (13,394 | ) | | | 37,496 | |
| Effect of change in tax rates | | | 33,430 | | | | 9,314 | |
| Temporary differences not recognized | | | 160,950 | | | | 83,751 | |
| Income tax recovery | | $ | - | | | $ | - | |
The Company has the following deductible temporary differences for which no deferred tax asset has been recognized:
| | | December 31, 2011 | | | December 31,
2010 | | | January 1, 2010 |
| Non-capital loss carry-forwards | | $ | 7,870,476 | | | $ | 6,911,924 | | | $ | 970,682 |
| Exploration and evaluation assets | | | (20,056 | ) | | | 107,208 | | | | 1,074,772 |
| Share issuance costs | | | 28,410 | | | | 187,456 | | | | 95,078 |
| Equipment | | | 5,319 | | | | 5,114 | | | | 1,503 |
| Other | | | 11,000 | | | | - | | | | - |
| | | $ | 7,895,149 | | | $ | 7,211,702 | | | $ | 2,142,035 |
| | The tax pools relating to these deductible temporary differences expire as follows: |
| | | Canadian non-capital losses | | | Canadian
resource
pools | | | United States
tax losses | | | United States
resource pools |
| 2014 | | $ | 149,223 | | | $ | - | | | $ | - | | | $ | 16,132 |
| 2015 | | | 161,439 | | | | - | | | | - | | | | 16,132 |
| 2025 | | | - | | | | - | | | | 4,080 | | | | 16,132 |
| 2026 | | | 383,173 | | | | - | | | | - | | | | 16,131 |
| 2027 | | | 518,148 | | | | - | | | | 174,949 | | | | - |
| 2028 | | | 607,835 | | | | - | | | | 274,214 | | | | - |
| 2029 | | | 720,438 | | | | - | | | | 3,153,918 | | | | - |
| 2030 | | | 607,390 | | | | - | | | | 160,383 | | | | - |
| 2031 | | | 787,421 | | | | - | | | | 167,865 | | | | - |
| No expiry | | | - | | | | 3,935,409 | | | | - | | | | 2,596,573 |
| | | $ | 3,935,067 | | | $ | 3,935,409 | | | $ | 3,935,409 | | | $ | 2,661,100 |
Max Resource Corp.
Notes to the Consolidated Financial Statements
(Expressed in Canadian dollars)
For the years ended December 31, 2011 and 2010
Authorized share capital
Unlimited number of common shares without par value.
Issued share capital
At December 31, 2011, there were 24,505,985 issued and fully paid common shares (December 31, 2010 – 21,699,230; January 1, 2010 – 21,699,230).
Private placements
On April, 2011, the Company completed a non-brokered private placement of 2,016,755 units at a price of $0.28 per unit for gross proceeds of $564,691. Each unit is comprised of one common share and one warrant, with each warrant entitling the holder to purchase an additional common share at an exercise price of $0.38 per share until April 4, 2013. Cash finder’s fees of $35,512 were paid with respect to a portion of this placement.
Basic and diluted loss per share
The calculation of basic and diluted loss per share for the year ended December 31, 2011 was based on the loss attributable to common shareholders of $1,196,646 (2010 - $418,315) and the weighted average number of common shares outstanding of 23,423,021 (2010 – 21,699,230).
Stock options
The Company has adopted an incentive stock option plan, which provides that the Board of Directors of the Company may from time to time, in its discretion, and in accordance with the Exchange requirements, grant to directors, officers, employees and technical consultants to the Company, non-transferable stock options to purchase common shares, provided that the number of common shares reserved for issuance will not exceed 20% of the Company’s issued and outstanding common shares to a maximum of 4,309,846. Such options will be exercisable for a period of up to 5 years from the date of grant. Options granted typically vest on the grant date.
The changes in options during the year ended December 31, 2011 and 2010 are as follows:
| | | Year ended December 31, 2011 | | | Year ended December 31, 2010 |
| | | Number of options | | | Weighted average exercise price | | | Number of options | | | Weighted average exercise price |
| Options outstanding, beginning of year | | | 2,525,000 | | | $ | 0.30 | | | | 2,225,000 | | | $ | 0.29 |
| Options granted | | | 3,405,000 | | | | 0.28 | | | | 350,000 | | | | 0.36 |
| Options exercised | | | (790,000 | ) | | | 0.17 | | | | - | | | | - |
| Options expired | | | (2,100,000 | ) | | | 0.35 | | | | (50,000 | ) | | | 0.40 |
| Options outstanding, end of year | | | 3,040,000 | | | $ | 0.28 | | | | 2,525,000 | | | $ | 0.30 |
| Options exercisable, end of year | | | 2,680,000 | | | $ | 0.28 | | | | 2,525,000 | | | $ | 0.30 |
Max Resource Corp.
Notes to the Consolidated Financial Statements
(Expressed in Canadian dollars)
For the years ended December 31, 2011 and 2010
| 10. | Share capital (cont’d) |
Stock options (cont’d)
Details of options outstanding as at December 31, 2011 are as follows:
| Exercise price | | | Number of options outstanding | | Expiry Date | | WA Life Remaining
Life |
| $ | 0.25 | | | | 35,000 | | April 6, 2012 | | | 0.01 |
| | 0.40 | | | | 250,000 | | April 12, 2012 | | | 0.02 |
| | 0.25 | | | | 50,000 | | September 21, 2012 | | | 0.01 |
| | 0.35 | | | | 600,000 | | March 14, 2013 | | | 0.24 |
| | 0.24 | | | | 480,000 | | October 26, 2013 | | | 1.40 |
| | 0.24 | | | | 1,625,000 | | August 17, 2014 | | | 0.29 |
| | | | | | 3,040,000 | | | | | 1.97 |
On April 6, 2010, the Company granted stock options to a consultant to purchase 50,000 common shares at a price of $0.25 per share to April 6, 2012. These options vested immediately. The total fair value of $7,230 was estimated using the Black-Scholes option pricing model assuming an expected life of 2 years, a risk-free interest rate of 1.86% and an expected volatility of 149%. The granting of these options resulted in a stock-based compensation expense of $7,230 being recorded in fiscal 2010.
On April 12, 2010, the Company granted stock options to a consultant to purchase 250,000 common shares at a price of $0.40 per share to April 12, 2012. These options vested immediately. The total fair value of $52,375 was estimated using the Black-Scholes option pricing model assuming an expected life of 2 years, a risk-free interest rate of 1.86% and an expected volatility of 180%. The granting of these options resulted in a stock based compensation expense of $52,375 being recorded in fiscal 2010.
On September 21, 2010, the Company granted stock options to a consultant to purchase 50,000 common shares at a price of $0.25 per share to September 21, 2012. These options vested immediately. The total fair value of $5,509 was estimated using the Black-Scholes option pricing model assuming an expected life of 2 years, a risk-free interest rate of 1.42% and an expected volatility of 105%. The granting of these options resulted in a stock based compensation expense of $5,509 being recorded in fiscal 2010.
On March 14, 2011, the Company granted stock options to consultants to purchase 1,300,000 common shares at a price of $0.35 per share to March 14, 2013. These options vested immediately. The total fair value of $318,745 was estimated using the Black-Scholes option pricing model assuming an expected life of 2 years, a risk-free interest rate of 1.72% and an expected volatility of 111%. The granting of these options resulted in a stock based compensation expense of $261,401 being recorded during fiscal 2011.
On August 17, 2011, the Company granted stock options to consultants to purchase 1,625,000 common shares at a price of $0.24 per share to August 17, 2014. These options vested immediately. The total fair value of $186,063 was estimated using the Black-Scholes option pricing model assuming an expected life of 3 years, a risk-free interest rate of 1.27% and an expected volatility of 114%. The granting of these options resulted in a stock based compensation expense of $226,023 being recorded during fiscal 2011.
Max Resource Corp.
Notes to the Consolidated Financial Statements
(Expressed in Canadian dollars)
For the years ended December 31, 2011 and 2010
| 10. | Share capital (cont’d) |
Stock options (cont’d)
On October 26, 2011, the Company granted stock options to consultants to purchase 480,000 common shares at a price of $0.24 per share to October 26, 2013. These options vest over a one year period. The total fair value of $57,667 was estimated using the Black-Scholes option pricing model assuming an expected life of 2 years, a risk-free interest rate of 1.08% and an expected volatility of 102%. The granting of these options resulted in a stock based compensation expense of $21,934 being recorded during fiscal 2011.
Warrants
As at December 31, 2011, the Company had 2,016,755 warrants exercisable at $0.38 until April 4, 2013. There were no warrants issued or outstanding as at December 31, 2010 or January 1, 2010.
The changes in warrants during the year ended December 31, 2011 and the year ended December 31, 2010 are as follows:
| | | December 31, 2011 | | | December 31, 2010 |
| | | Number
of
warrants | | | Weighted
average
exercise
price | | | Number of
warrants | | | Weighted
average
exercise
price |
| Warrants outstanding, beginning of year | | | - | | | $ | - | | | | - | | | $ | - |
| Warrants issued | | | 2,016,755 | | | | 0.38 | | | | - | | | | - |
| Warrants outstanding, end of year | | | 2,016,755 | | | $ | 0.38 | | | | - | | | $ | - |
Stock option reserve
The stock option reserve records items recognized as stock-based compensation expense until such time that the stock options are exercised, at which time the corresponding amount will be transferred to share capital.
Warrant reserve
The warrant reserve records items recognized as stock-based compensation expense until such time that the warrants are exercised, at which time the corresponding amount will be transferred to share capital.
Investment revaluation reserve
The investment revaluation reserve records unrealized gains and losses arising on available-for-sale financial assets, except for impairment losses and foreign exchange gains and losses.
| 12. | Related party transactions |
Related party balances
The following amounts due to related parties are included in trade payables and accrued liabilities:
| | | December 31, 2011 | | | December 31,
2010 | | | January 1, 2010 |
| Companies controlled by directors of the Company | | $ | - | | | $ | - | | | $ | 639 |
| Directors of the Company | | | 39,826 | | | | - | | | | - |
| | | $ | 39,826 | | | $ | - | | | $ | 639 |
These amounts are unsecured, non-interest bearing and have no fixed terms of repayment.
Max Resource Corp.
Notes to the Consolidated Financial Statements
(Expressed in Canadian dollars)
For the years ended December 31, 2011 and 2010
| 12. | Related party transactions (cont’d) |
Related party transactions
Key management personnel compensation
| | | Years ended |
| | | December 31, 2011 | | | December 31, 2010 |
| Short-term employee benefits – management fees | | $ | 120,000 | | | $ | 120,000 |
| Geological consulting | | | 120,000 | | | | 120,000 |
| | | $ | 240,000 | | | $ | 240,000 |
Refer also to Note 7 and 10.
| 13. | Financial risk and capital management |
The Company is exposed in varying degrees to a variety of financial instrument related risks. The Board of Directors approves and monitors the risk management processes. The type of risk exposure and the way in which such exposure is managed is provided as follows:
Credit risk
Credit risk is the risk that one party to a financial instrument will fail to discharge an obligation and cause the other party to incur a financial loss. The Company’s primary exposure to credit risk is on its cash held in bank accounts. The majority of cash is deposited with major banks in Canada. As most of the Company’s cash is held by two banks there is a concentration of credit risk. This risk is managed by using major banks that are high credit quality financial institutions as determined by rating agencies. The Company’s secondary exposure to risk is on its HST receivable. This risk is considered to be minimal.
Liquidity risk
Liquidity risk is the risk that the Company will not be able to meet its financial obligations as they fall due. The Company has a planning and budgeting process in place to help determine the funds required to support the Company’s normal operating requirements on an ongoing basis. The Company ensures that there are sufficient funds to meet its short-term business requirements, taking into account its anticipated cash flows from operations and its holdings of cash and cash equivalents.
Historically, the Company's primary source of funding has been the issuance of equity securities for cash, primarily through private placements. The Company’s access to equity financing is dependent upon market conditions and market risks. There can be no assurance of continued access to significant equity funding.
Foreign exchange risk
Foreign currency risk is the risk that the fair values of future cash flows of a financial instrument will fluctuate because they are denominated in currencies that differ from the respective functional currency. The Company is exposed to currency risk as it incurs expenditures that are denominated in United States dollar while its functional currency is the Canadian dollar. The Company does not hedge its exposure to fluctuations in foreign exchange rates. The majority of cash is held in Canadian dollars.
Max Resource Corp.
Notes to the Consolidated Financial Statements
(Expressed in Canadian dollars)
For the years ended December 31, 2011 and 2010
| 13. | Financial risk and capital management (cont’d) |
Foreign exchange risk
The following is a summary of Canadian dollar equivalent financial assets and liabilities that are denominated in United States dollars:
| | | December 31, 2011 | | | December 31,
2010 | | | January 1, 2010 |
| Cash and cash equivalents | | $ | 22,197 | | | $ | 20,653 | | | $ | 22,993 |
| Accounts payable | | | 101,594 | | | | 7,889 | | | | - |
| | | $ | (79,397 | ) | | $ | 12,764 | | | $ | 22,993 |
Based on the above net exposures, as at December 31, 2011 a 10% change in the United States dollar to Canadian dollar exchange rate could impact the Company’s net loss by $7,900.
Interest rate risk
Interest rate risk is the risk that the fair value of future cash flows of a financial instrument will fluctuate because of changes in market interest rates. The Company is exposed to interest rate risk on certain of its cash equivalents as some instruments have original maturities of three months or less and are therefore exposed to interest rate fluctuations on renewal. A 1% change in market interest rates would have an impact on the Company’s net loss of $9,000.
Capital Management
The Company's policy is to maintain a strong capital base so as to maintain investor and creditor confidence and to sustain future development of the business. The capital structure of the Company consists of equity, net of cash and cash equivalents.
There were no changes in the Company's approach to capital management during the year.
The Company is not subject to any externally imposed capital requirements.
Classification of financial instruments
Financial assets included in the statement of financial position are as follows:
| | | December 31, 2011 | | | December 31,
2010 | | | January 1, 2010 |
| Cash and cash equivalents | | $ | 1,131,358 | | | $ | 2,087,207 | | | $ | 3,118,960 |
| Loans and receivables: | | | | | | | | | | | |
Receivables and prepaids | | | 14,910 | | | | 11,138 | | | | 22,203 |
Taxes recoverable | | | 10,106 | | | | 15,287 | | | | 9,753 |
Reclamation deposits | | | 68,183 | | | | 61,983 | | | | 28,356 |
| Available-for-sale financial instruments: | | | | | | | | | | | |
Marketable securities | | | 71,500 | | | | 174,000 | | | | - |
| | | $ | 1,285,951 | | | $ | 2,349,615 | | | $ | 3,179,272 |
Financial liabilities included in the statement of financial position are as follows:
| | | December 31, 2011 | | | December 31,
2010 | | | January 1, 2010 |
| Non-derivative financial liabilities: | | | | | | | | |
Trade payables | | $ | 127,109 | | | $ | 29,774 | | | $ | 57,549 |
Max Resource Corp.
Notes to the Consolidated Financial Statements
(Expressed in Canadian dollars)
For the years ended December 31, 2011 and 2010
| 13. | Financial risk management (cont’d) |
Fair value
The fair value of the Company’s financial assets and liabilities approximates the carrying amount.
Financial instruments measured at fair value are classified into one of three levels in the fair value hierarchy according to the relative reliability of the inputs used to estimate the fair values. The three levels of the fair value hierarchy are:
| | ● | Level 1 – Unadjusted quoted prices in active markets for identical assets or liabilities; |
| | ● | Level 2 – Inputs other than quoted prices that are observable for the asset or liability either directly or indirectly; and |
| | ● | Level 3 – Inputs that are not based on observable market data. |
The following is an analysis of the Company’s financial assets measured at fair value as at December 31, 2011 and December 31, 2010:
| | | As at December 31, 2011 |
| | | Level 1 | | | Level 2 | | | Level 3 |
Cash and cash equivalents | | $ | 1,131,358 | | | $ | - | | | $ | - |
Marketable securities | | | 71,500 | | | | - | | | | - |
| | | $ | 1,202,858 | | | $ | - | | | $ | - |
| | | As at December 31, 2010 |
| | | Level 1 | | | Level 2 | | | Level 3 |
Cash and cash equivalents | | $ | 2,087,207 | | | $ | - | | | $ | - |
Marketable securities | | | 174,000 | | | | - | | | | - |
| | | $ | 2,261,207 | | | $ | - | | | $ | - |
Operating segments
The Company operates in a single reportable operating segment – the acquisition, exploration and development of mineral properties.
Geographic segments
The following non-current assets are located in the following countries:
| | | As at December 31, 2011 |
| | | Canada | | | United States | | | Total |
| Property, plant and equipment | | $ | - | | | $ | 1,578 | | | $ | 1,578 |
| Reclamation bond | | | - | | | | 68,183 | | | | 68,183 |
| Exploration and evaluation assets | | | 655,306 | | | | 3,065,901 | | | | 3,721,207 |
| | | $ | 655,306 | | | $ | 3,135,663 | | | $ | 3,790,969 |
| | | As at December 31, 2010 |
| | | Canada | | | United States | | | Total |
| Property, plant and equipment | | $ | - | | | $ | 2,254 | | | $ | 2,254 |
| Reclamation bond | | | - | | | | 68,183 | | | | 68,183 |
| Exploration and evaluation assets | | | 655,306 | | | | 1,936,842 | | | | 2,592,248 |
| | | $ | 655,306 | | | $ | 2,007,279 | | | $ | 2,662,685 |
Max Resource Corp.
Notes to the Consolidated Financial Statements
(Expressed in Canadian dollars)
For the years ended December 31, 2011 and 2010
During the year ended December 31, 2011, the Company incurred the following non-cash transactions that are not reflected in the statement of cash flows:
| | | Years ended |
| | | December 31, 2011 | | | December 31, 2010 |
| Reclassification from share-based payment reserve to capital stock on exercise of stock options | | $ | 86,191 | | | $ | - |
| Received 600,000 common shares of Kokanee for an option payment on the Diamond Peak property | | | - | | | | 90,000 |
As result of the Accounting Standards Board of Canada’s decision to adopt IFRS for publicly accountable entities for financial reporting periods beginning on or after January 1, 2011, the Company has adopted IFRS in these financial statements, making them the first annual financial statements of the Company under IFRS. The Company previously applied the available standards under previous Canadian GAAP that were issued by the Accounting Standards Board of Canada.
As required by IFRS 1 “First-time Adoption of International Financial Reporting Standards”, January 1, 2010 has been considered to be the date of transition to IFRS by the Company. Therefore, the comparative figures that were previously reported under previous Canadian GAAP have been restated, where appropriate, in accordance with IFRS.
Exemptions applied
The Company has applied the following optional transition exemptions to full retrospective application of IFRS:
| | - | IFRS 3 “Business Combinations” has not been applied to acquisitions of subsidiaries or of interests in associates and joint ventures that occurred before January 1, 2010. |
| | - | IAS 21 “The Effects of Changes in Foreign Exchange Rates” has not been applied to cumulative translation differences that existed at the date of transition to IFRS. The Company has eliminated the cumulative translation difference and adjusted retained earnings by the same amount at the date of transition to IFRS. If, subsequent to adoption, a foreign operation is disposed of, the translation differences that arose before the date of transition to IFRS will not affect the gain or loss on disposal. |
| | - | IFRS 2 “Share-based Payment” has not been applied to equity instruments that were granted on or before November 7, 2002, or equity instruments that were granted subsequent to November 7, 2002 and vested before the date of transition to IFRS. The Company has elected not to apply IFRS 2 to awards that vested prior to January 1, 2010, which have been accounted for in accordance with Canadian GAAP. |
Estimates
IFRS 1 requires that estimates made in accordance with IFRS at the date of transition and other comparative periods shall be consistent with estimates made for the same date in accordance with Canadian GAAP, unless there is objective evidence that those estimates were in error. The Company’s IFRS estimates as of January 1, 2010 and December 31, 2010 are consistent with its Canadian GAAP estimates for the same date.
Max Resource Corp.
Notes to the Consolidated Financial Statements
(Expressed in Canadian dollars)
For the years ended December 31, 2011 and 2010
| 16. | Transition to IFRS (Cont’d) |
Reconciliation of Canadian GAAP to IFRS
Except for the reclassification of contributed surplus (the Canadian GAAP term) to share based payment and share purchase warrant reserve (the IFRS term), the adoption of IFRS had no impact on the financial position of the Company at December 31, 2010 or January 1, 2010 or the financial performance and cash flows of the Company for the year ended December 31, 2010.
| 17. | Events after the reporting period |
On February 22, 2012, the Company granted 675,000 incentive stock options at an exercise price of $0.25 per option expiring on February 22, 2015 to directors and officers of the Company.
On March 19, 2012, the Company received $655,306 as reimbursement on the Howell and Crowsnest properties (See Note 7).