UNITED STATES
SECURITIES AND EXCHANGE COMMISSION
Washington, D.C. 20549
FORM N-CSR
CERTIFIED SHAREHOLDER REPORT OF REGISTERED
MANAGEMENT INVESTMENT COMPANIES
Investment Company Act File Number: 811-09995
| T. Rowe Price Global Technology Fund, Inc. |
|
| (Exact name of registrant as specified in charter) |
| |
| 100 East Pratt Street, Baltimore, MD 21202 |
|
| (Address of principal executive offices) |
| |
| David Oestreicher |
| 100 East Pratt Street, Baltimore, MD 21202 |
|
| (Name and address of agent for service) |
Registrant’s telephone number, including area code: (410) 345-2000
Date of fiscal year end: December 31
Date of reporting period: June 30, 2012
Item 1. Report to Shareholders
| Global Technology Fund | June 30, 2012 |
The views and opinions in this report were current as of June 30, 2012. They are not guarantees of performance or investment results and should not be taken as investment advice. Investment decisions reflect a variety of factors, and the managers reserve the right to change their views about individual stocks, sectors, and the markets at any time. As a result, the views expressed should not be relied upon as a forecast of the fund’s future investment intent. The report is certified under the Sarbanes-Oxley Act, which requires mutual funds and other public companies to affirm that, to the best of their knowledge, the information in their financial reports is fairly and accurately stated in all material respects.
REPORTS ON THE WEB
Sign up for our E-mail Program, and you can begin to receive updated fund reports and prospectuses online rather than through the mail. Log in to your account at troweprice.com for more information.
Manager’s Letter
Fellow Shareholders
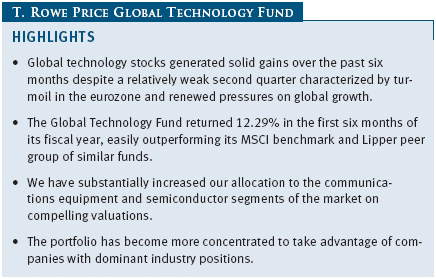
Global technology stocks generated strong gains in the beginning of the year, supported by an improved U.S. labor market and strong consumer spending. Investors also responded favorably to improvements in the eurozone, easing pressures on Japan’s economy, and continued strength in emerging markets. But markets snapped back in the second quarter as Europe’s economic woes deepened, and the U.S. and China hit an economic soft patch. In this environment, semiconductor and communications equipment companies began to fall short of earnings projections and showed signs of a mid-cycle slowdown. Nonetheless, the fund produced strong returns, and our holdings with exposure to the media, hardware, and software segments of the market bolstered performance.
PERFORMANCE COMPARISON
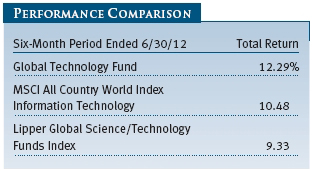
Our fund advanced 12.29% in the first half of the fiscal year and outperformed the MSCI All Country World Index Information Technology, as well as the Lipper Global Science/Technology Funds Index.
The fund’s long-term relative performance remained exceptional—it is Lipper’s top-ranked fund in its category for the 3-, 5-, and 10-year periods through June 30, 2012. Based on cumulative total return, Lipper ranked the Global Technology Fund 8 of 42, 1 of 30, 1 of 21, and 1 of 18 global science and technology funds for the 1-, 3-, 5-, and 10-year periods ended June 30, 2012, respectively. (Results will vary for other periods. Past performance cannot guarantee future results.)
MARKET ENVIRONMENT
In a reprise of last year, U.S. stocks produced extraordinary gains in the first quarter of 2012 before surrendering some of those gains in the second quarter. The S&P 500 Index surged 12.59% in the first three months of 2012 on improved corporate earnings, better U.S. job growth, a continued updraft in manufacturing, and an easing debt crisis in the eurozone. But the tables turned in the second quarter, and the S&P 500 Index shed 2.75%. Corporate earnings and job growth weakened, manufacturing began to slow, and the debt crisis flared anew. China also began to slow down, which further strained international markets. The Federal Reserve continued its easy monetary policies, and late in the period it extended “Operation Twist,” a program designed to suppress long-term interest rates and reduce borrowing costs, through the end of the year. But the Fed did not dig deeper in its tool box, which may have disappointed equity investors but served as a reminder that the economic recovery, while anemic by historical standards, was continuing. Fears of imminent recession were overdone.
INVESTMENT APPROACH
Having taken over the reins of the Global Technology Fund on June 1, 2012, I would like to lay out my approach to investing. I have been a semiconductor and semiconductor capital equipment analyst at T. Rowe Price for the past seven years, and I am steeped in technology issues and companies and, of course, in the fundamental research platform that distinguishes T. Rowe Price. The transition in portfolio management of the fund has been seamless, aided in large measure by the generous and insightful assistance of David Eiswert, who managed the fund for more than three years. The Global Technology Fund remains committed to seeking long-term capital growth through investments in companies around the world expected to benefit from technological progress. To that end, we will continue to emphasize industries and companies in communications, Internet infrastructure, semiconductors, computers, e-commerce, and media and entertainment.
My methods of assessing companies and their prospects are very similar to David’s, although the portfolio is now more concentrated to allow us to benefit from some of the world’s most extraordinary companies selling at compelling valuations. In seeking out the best investment opportunities for shareholders, I am engaged in the following:
- We look for technology companies that are well positioned in their industries with strong margins and balance sheets.
- We seek companies throughout the globe with the best profile in the software, Internet, information technology services, communications equipment, semiconductors, and hardware segments.
- We are focused on company fundamentals, with an eye toward market share gainers and a strong competitive position.
- We use valuation metrics and temporary market cycles as a chance to buy or add to companies we want to own. Fundamental analysis is at the core of our approach to investing.
- We are eager to buy good companies during periods of economic stress, as we are seeing in the current market environment.
- We think that by having a long-term outlook and an understanding of competitive industry dynamics, we can raise our odds of performing well versus those who focus on shorter-term horizons.
- We own both small and large companies and believe that our strong global research platform will help us even more with small companies.
- We believe that good management is critical to the fortunes of technology companies, and we seek out managers who are insightful about technology trends in light of the rapid pace of change. We do not rely on managements’ short-term predictions of their business trends but place great stock in their strategic direction and their shareholder friendliness.
PORTFOLIO REVIEW
As noted previously, we have elected to have fewer holdings during periods where we see value in plain sight. This, of course, does not mean that we will not continue to seek out smaller growth companies. In fact, our analysts continue to uncover many well-positioned companies in the media, communications equipment, and software segments of the market, among others. However, we found, in recent months, that one does not have to look far to find value in technology.
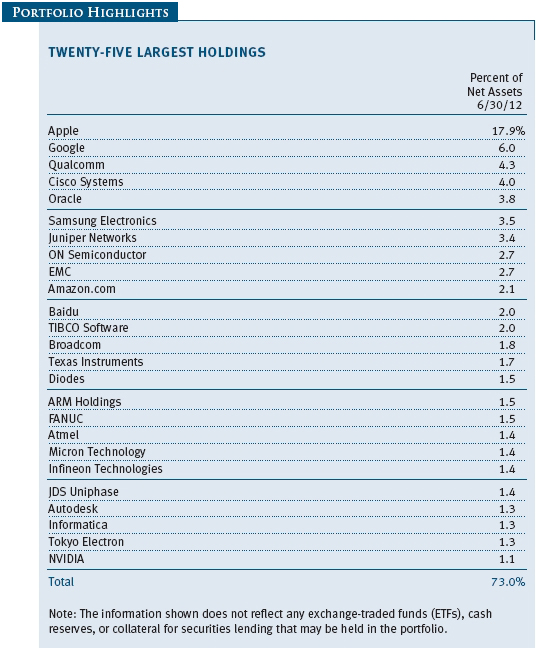
We have witnessed the emergence of several powerful platforms in recent years, particularly in the Internet and mobile computing worlds. Apple, Amazon.com, and Google each fill this bill in different ways. We have substantially increased our allocation to Apple, as it continues to redefine the way consumers—and, increasingly, businesses—use computers. We believe that investors have underestimated the long-term revenue potential of Apple’s iPad and that in the months and years ahead we will begin to see the mass adoption of the Apple platform of products by business, by government, and in the private and public education arenas. Apple holds less than a 10% share of the global computer market, and we believe that it will show strong growth even as the total PC market decelerates. Amazon has an extraordinary platform as well, and it is our view that the company has substantial earnings power and an incredible moat around its core retail business and its Web services. Google is pushing the boundaries of technology with its plethora of innovations and products that demonstrate the company’s strong position in mobile computing. (Please refer to the fund’s portfolio of investments for a complete list of our holdings and the amount each represents in the portfolio.)
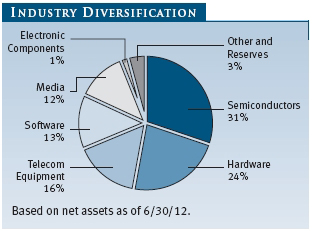
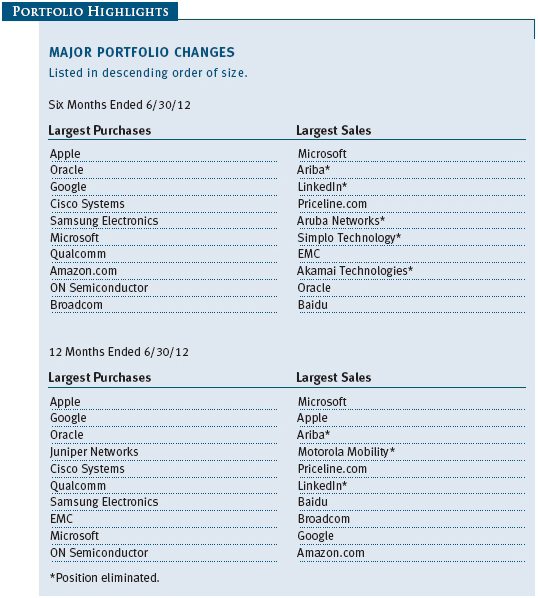
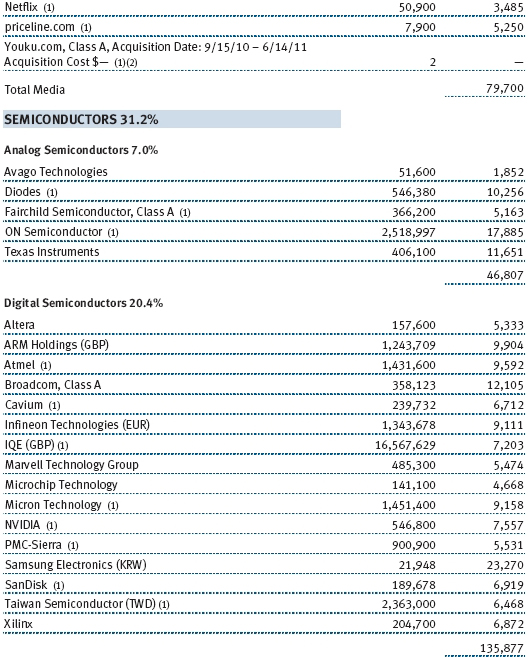
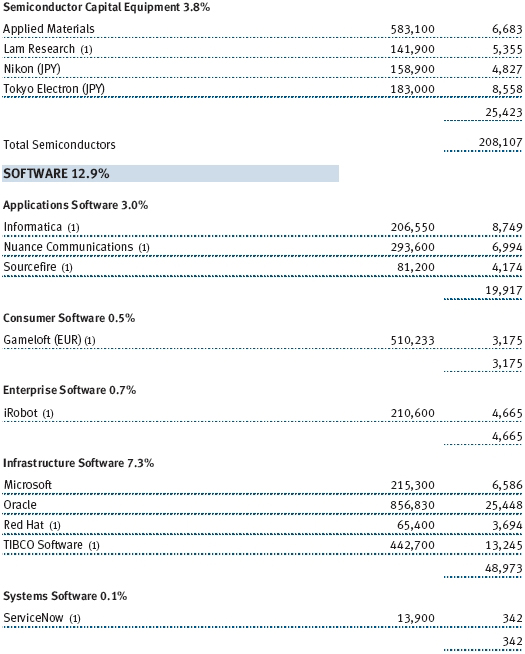
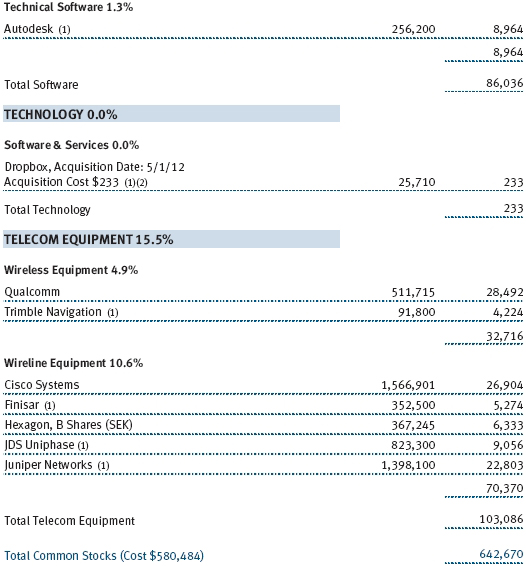
Semiconductors and communications equipment did poorly in the first six months, as they feature some of the most volatile and cyclical industries within technology. While there are better businesses in other parts of the technology sector, we believe these two areas offer some of the most attractive stocks. They have been beaten down on recent market weakness, which has prompted us to add to these segments. Indeed, we have seen time and again how quickly these stocks can snap back following periods like the current one. In communications equipment, we added Qualcomm, Cisco Systems, Finisar, and Juniper Networks. Among semiconductors, we like industry leaders Broadcom, Xilinx, Altera, Infineon Technologies, and Tokyo Electron.
We decreased our exposure to software stocks during the period due to rich valuations, particularly firms in the cloud software segment, an important trend that investors have bid up. We eliminated positions in NetSuite, Cornerstone OnDemand, and Concur Technologies. We believe there are some great businesses in security software and data analytics software. Data analytics is what helps us make sense of all the data these new mobile and software tools are creating. We own Informatica and TIBCO Software. Our position in EMC also reflects a world where more and more data are being created and need to be stored and transformed into information. We also established a position in Sourcefire, an applications and security software company, and increased our position size in Oracle and Autodesk. We eliminated Ariba, Salesforce.com, and NetSuite after their strong performances.
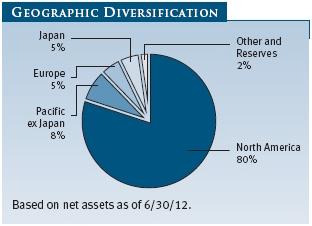
We further reduced our exposure to international names in the first half of 2012, including our positions in Chinese Internet media companies Tencent Holdings and Sina, as we took advantage of opportunities in the U.S. and harvested gains in strong performers. However, we increased our position size in several key holdings, including Samsung Electronics and FANUC. Samsung continued to benefit from its mobile sales on the back of smartphone adoption and share gains in the Android platform. FANUC is a great industrial technology business, featuring an excellent financial profile. We believe its suite of industrial robotics systems will find its way into many nontechnology companies. Our international exposure is lower than we would prefer, at about 20% of the portfolio. We expect to increase our holdings in the months ahead as opportunities arise. Our strong global technology research team is one of the key differentiators of our long-term performance.
In hardware, we remain underweight versus our benchmark due to the economic slowdown and our concerns over reduced enterprise spending. Our heavier allocation to this segment of the market reflected our increased position size in Apple, which was a top contributor to performance during the period.
OUTLOOK
Investors are rightly nervous about the numerous headwinds facing the global economy. The good news is that we appear to know what they are—the eurozone debt crisis, the U.S. fiscal cliff, and a slowdown in China. We know that the systemic problems facing the global economy will simply take more time to repair. U.S. manufacturing has slowed, along with job creation and, not surprisingly, corporate earnings. But we believe this slowdown is temporary. The housing market finally appears to be settling into a growth pattern, wages are on the rise, and energy costs are down, which has the effect of providing a tax cut to consumers every time they fill up at the pump. As a global fund, we are hardly immune to the gyrations of macroeconomic slumps. In particular, a major European country’s default on its debt would be unkind to us all.
Of course, we cannot predict the outcomes of the issues we’ve mentioned any more than we can know what bombshells could land on our doorstep in the future. As investors, we naturally take into account macroeconomic forces. But we are also in the business of constructing the building blocks of a technology portfolio that contains the best and most promising companies we can find.
In this environment, we believe that research, stock selection, and valuation matter. We are looking for products and companies gaining market share and participating in extreme positive outcomes. Tactically, we see solid near-term opportunities in semiconductors, components, and communications equipment. The market has punished these groups for a year, but we believe a classic cyclical recovery is at hand. We have increased our positions sizes in these areas of the technology market.
I agree with David that the key long-term trends in which we are seeing opportunity include mobile computing; cloud software and services, which deliver applications via the Internet; and data analytics. We also believe the penetration of technology in emerging markets will continue to grow. These inventions and trends would be powerful even in isolation, but we believe that the intersection of these developments increases their potential.
On a personal note, I am grateful to David for his enormous support during this transition and look forward to continuing to work with him on the Investment Advisory Committee. I wish him all the best as he becomes lead portfolio manager for the Global Stock Fund later this year.
Once again, we thank you for your continued support and look forward to informing you on our progress in six months.
Respectfully submitted,

Joshua K. Spencer
President of the fund and chairman of its Investment Advisory Committee
July 18, 2012
The committee chairman has day-to-day responsibility for managing the portfolio and works with committee members in developing and executing the fund’s investment program.
Effective June 1, 2012, Joshua K. Spencer succeeded David J. Eiswert as portfolio manager of the Global Technology Fund and chairman of its Investment Advisory Committee. Mr. Spencer has served as a research analyst covering semiconductors and semiconductor capital equipment at T. Rowe Price for the past seven years. He is a member of the advisory committees for several of the firm’s investment strategies with information technology exposure, including the Science & Technology Fund and Growth & Income Fund. He has 13 years of investment experience.
Mr. Spencer earned a B.A. in economics from Johns Hopkins University, where he was awarded the Max Hochschild Prize for Outstanding Student in Economics. He holds an M.A. in economics from the University of Chicago, where he was awarded the Century Scholarship for full tuition. He earned an M.B.A. in finance and accounting from the University of Chicago Booth School of Business, where he was an active member of the Investment Management Group and editor of the Chicago Advisor investment newsletter. He has also earned the Chartered Financial Analyst designation.
Mr. Eiswert was portfolio manager of the Global Technology Fund for more than three years. He will continue to serve on the fund’s Investment Advisory Committee and will become portfolio manager of the Global Stock Fund effective October 1, 2012.
RISKS OF INVESTING IN THE FUND
Funds that invest only in specific industries will experience greater volatility than funds investing in a broad range of industries. Technology stocks, historically, have experienced unusually wide price swings, both up and down. The potential for wide variation in performance reflects the special risks common to companies in the rapidly changing field of technology. For example, products or services that at first appear promising may not prove commercially successful and may become obsolete quickly. Earnings disappointments and intense competition for market share can result in sharp price declines.
GLOSSARY
Lipper Global Science/Technology Funds Index: An index of science and technology mutual fund performance returns of funds that invest in technology companies around the world for specified periods as tracked by Lipper Inc.
MSCI All Country World Index Information Technology: An index that tracks information technology stocks in developed and emerging markets.
S&P 500 Index: An unmanaged index that tracks the stocks of 500 primarily large-cap U.S. companies.
Performance and Expenses
This chart shows the value of a hypothetical $10,000 investment in the fund over the past 10 fiscal year periods or since inception (for funds lacking 10-year records). The result is compared with benchmarks, which may include a broad-based market index and a peer group average or index. Market indexes do not include expenses, which are deducted from fund returns as well as mutual fund averages and indexes.


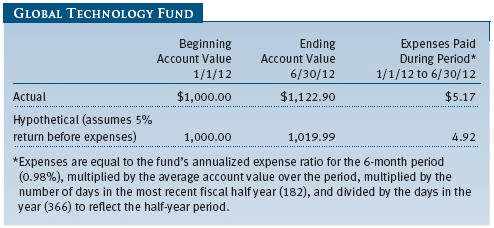
As a mutual fund shareholder, you may incur two types of costs: (1) transaction costs, such as redemption fees or sales loads, and (2) ongoing costs, including management fees, distribution and service (12b-1) fees, and other fund expenses. The following example is intended to help you understand your ongoing costs (in dollars) of investing in the fund and to compare these costs with the ongoing costs of investing in other mutual funds. The example is based on an investment of $1,000 invested at the beginning of the most recent six-month period and held for the entire period.
Actual Expenses
The first line of the following table (Actual) provides information about actual account values and expenses based on the fund’s actual returns. You may use the information on this line, together with your account balance, to estimate the expenses that you paid over the period. Simply divide your account value by $1,000 (for example, an $8,600 account value divided by $1,000 = 8.6), then multiply the result by the number on the first line under the heading “Expenses Paid During Period” to estimate the expenses you paid on your account during this period.
Hypothetical Example for Comparison Purposes
The information on the second line of the table (Hypothetical) is based on hypothetical account values and expenses derived from the fund’s actual expense ratio and an assumed 5% per year rate of return before expenses (not the fund’s actual return). You may compare the ongoing costs of investing in the fund with other funds by contrasting this 5% hypothetical example and the 5% hypothetical examples that appear in the shareholder reports of the other funds. The hypothetical account values and expenses may not be used to estimate the actual ending account balance or expenses you paid for the period.
Note: T. Rowe Price charges an annual account service fee of $20, generally for accounts with less than $10,000. The fee is waived for any investor whose T. Rowe Price mutual fund accounts total $50,000 or more; accounts electing to receive electronic delivery of account statements, transaction confirmations, prospectuses, and shareholder reports; or accounts of an investor who is a T. Rowe Price Preferred Services, Personal Services, or Enhanced Personal Services client (enrollment in these programs generally requires T. Rowe Price assets of at least $100,000). This fee is not included in the accompanying table. If you are subject to the fee, keep it in mind when you are estimating the ongoing expenses of investing in the fund and when comparing the expenses of this fund with other funds.
You should also be aware that the expenses shown in the table highlight only your ongoing costs and do not reflect any transaction costs, such as redemption fees or sales loads. Therefore, the second line of the table is useful in comparing ongoing costs only and will not help you determine the relative total costs of owning different funds. To the extent a fund charges transaction costs, however, the total cost of owning that fund is higher.
Unaudited

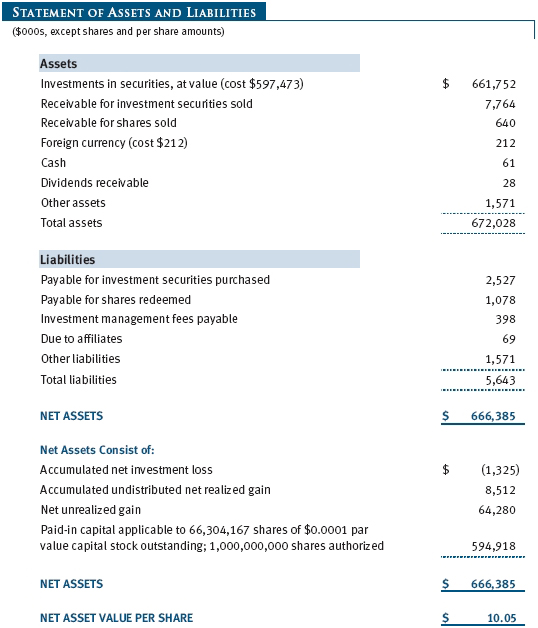
The accompanying notes are an integral part of these financial statements.
Unaudited


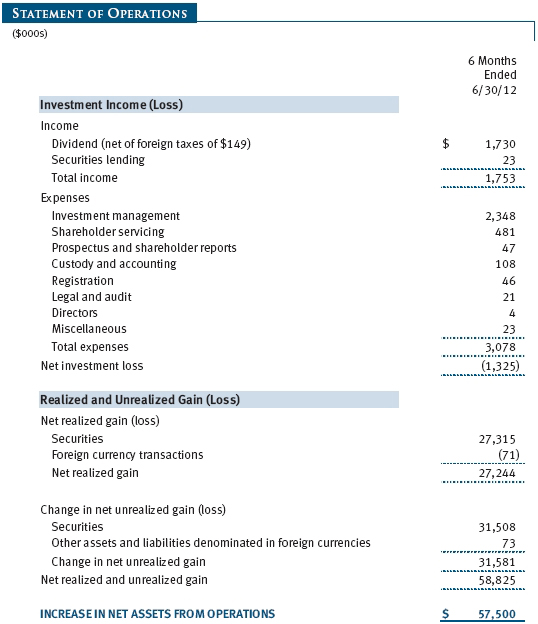
The accompanying notes are an integral part of these financial statements.
Unaudited
The accompanying notes are an integral part of these financial statements.
Unaudited
The accompanying notes are an integral part of these financial statements.
Unaudited

The accompanying notes are an integral part of these financial statements.
Unaudited
| Notes to Financial Statements |
T. Rowe Price Global Technology Fund, Inc. (the fund), is registered under the Investment Company Act of 1940 (the 1940 Act) as a diversified, open-end management investment company. The fund commenced operations on September 29, 2000. The fund seeks to provide long-term capital growth.
NOTE 1 - SIGNIFICANT ACCOUNTING POLICIES
Basis of Preparation The accompanying financial statements were prepared in accordance with accounting principles generally accepted in the United States of America (GAAP), which require the use of estimates made by management. Management believes that estimates and valuations are appropriate; however, actual results may differ from those estimates, and the valuations reflected in the accompanying financial statements may differ from the value ultimately realized upon sale or maturity.
Investment Transactions, Investment Income, and Distributions Income and expenses are recorded on the accrual basis. Dividends received from mutual fund investments are reflected as dividend income; capital gain distributions are reflected as realized gain/loss. Dividend income and capital gain distributions are recorded on the ex-dividend date. Income tax-related interest and penalties, if incurred, would be recorded as income tax expense. Investment transactions are accounted for on the trade date. Realized gains and losses are reported on the identified cost basis. Distributions to shareholders are recorded on the ex-dividend date. Income distributions are declared and paid annually. Capital gain distributions, if any, are generally declared and paid by the fund annually.
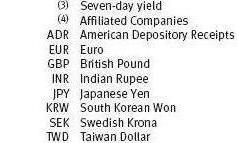
Currency Translation Assets, including investments, and liabilities denominated in foreign currencies are translated into U.S. dollar values each day at the prevailing exchange rate, using the mean of the bid and asked prices of such currencies against U.S. dollars as quoted by a major bank. Purchases and sales of securities, income, and expenses are translated into U.S. dollars at the prevailing exchange rate on the date of the transaction. The effect of changes in foreign currency exchange rates on realized and unrealized security gains and losses is reflected as a component of security gains and losses.
Rebates and Credits Subject to best execution, the fund may direct certain security trades to brokers who have agreed to rebate a portion of the related brokerage commission to the fund in cash. Commission rebates are reflected as realized gain on securities in the accompanying financial statements and totaled $16,000 for the six months ended June 30, 2012. Additionally, the fund earns credits on temporarily uninvested cash balances held at the custodian, which reduce the fund’s custody charges. Custody expense in the accompanying financial statements is presented before reduction for credits.
New Accounting Pronouncements In May 2011, the Financial Accounting Standards Board (FASB) issued amended guidance to align fair value measurement and disclosure requirements in U.S. GAAP with International Financial Reporting Standards. The guidance is effective for fiscal years and interim periods beginning on or after December 15, 2011. Adoption had no effect on net assets or results of operations.
In December 2011, the FASB issued amended guidance to enhance disclosure for offsetting assets and liabilities. The guidance is effective for fiscal years and interim periods beginning on or after January 1, 2013. Adoption will have no effect on the fund’s net assets or results of operations.
NOTE 2 - VALUATION
The fund’s financial instruments are reported at fair value as defined by GAAP. The fund determines the values of its assets and liabilities and computes its net asset value per share at the close of the New York Stock Exchange (NYSE), normally 4 p.m. ET, each day that the NYSE is open for business.
Valuation Methods Equity securities listed or regularly traded on a securities exchange or in the over-the-counter (OTC) market are valued at the last quoted sale price or, for certain markets, the official closing price at the time the valuations are made, except for OTC Bulletin Board securities, which are valued at the mean of the latest bid and asked prices. A security that is listed or traded on more than one exchange is valued at the quotation on the exchange determined to be the primary market for such security. Listed securities not traded on a particular day are valued at the mean of the latest bid and asked prices for domestic securities and the last quoted sale price for international securities.
Investments in mutual funds are valued at the mutual fund’s closing net asset value per share on the day of valuation.
Other investments, including restricted securities and private placements, and those financial instruments for which the above valuation procedures are inappropriate or are deemed not to reflect fair value, are stated at fair value as determined in good faith by the T. Rowe Price Valuation Committee, established by the fund’s Board of Directors (the Board). Subject to oversight by the Board, the Valuation Committee develops pricing-related policies and procedures and approves all fair-value determinations. The Valuation Committee regularly makes good faith judgments, using a wide variety of sources and information, to establish and adjust valuations of certain securities as events occur and circumstances warrant. For instance, in determining the fair value of private-equity instruments, the Valuation Committee considers a variety of factors, including the company’s business prospects, its financial performance, strategic events impacting the company, relevant valuations of similar companies, new rounds of financing, and any negotiated transactions of significant size between other investors in the company. Because any fair-value determination involves a significant amount of judgment, there is a degree of subjectivity inherent in such pricing decisions.
For valuation purposes, the last quoted prices of non-U.S. equity securities may be adjusted under the circumstances described below. If the fund determines that developments between the close of a foreign market and the close of the NYSE will, in its judgment, materially affect the value of some or all of its portfolio securities, the fund will adjust the previous closing prices to reflect what it believes to be the fair value of the securities as of the close of the NYSE. In deciding whether it is necessary to adjust closing prices to reflect fair value, the fund reviews a variety of factors, including developments in foreign markets, the performance of U.S. securities markets, and the performance of instruments trading in U.S. markets that represent foreign securities and baskets of foreign securities. A fund may also fair value securities in other situations, such as when a particular foreign market is closed but the fund is open. The fund uses outside pricing services to provide it with closing prices and information to evaluate and/or adjust those prices. The fund cannot predict how often it will use closing prices and how often it will determine it necessary to adjust those prices to reflect fair value. As a means of evaluating its security valuation process, the fund routinely compares closing prices, the next day’s opening prices in the same markets, and adjusted prices. Additionally, trading in the underlying securities of the fund may take place in various foreign markets on certain days when the fund is not open for business and does not calculate a net asset value. As a result, net asset values may be significantly affected on days when shareholders cannot make transactions.
Valuation Inputs Various inputs are used to determine the value of the fund’s financial instruments. These inputs are summarized in the three broad levels listed below:
Level 1 – quoted prices in active markets for identical financial instruments
Level 2 – observable inputs other than Level 1 quoted prices (including, but not limited to, quoted prices for similar financial instruments, interest rates, prepayment speeds, and credit risk)
Level 3 – unobservable inputs
Observable inputs are those based on market data obtained from sources independent of the fund, and unobservable inputs reflect the fund’s own assumptions based on the best information available. The input levels are not necessarily an indication of the risk or liquidity associated with financial instruments at that level. For example, non-U.S. equity securities actively traded in foreign markets generally are reflected in Level 2 despite the availability of closing prices because the fund evaluates and determines whether those closing prices reflect fair value at the close of the NYSE or require adjustment, as described above. The following table summarizes the fund's financial instruments, based on the inputs used to determine their values on June 30, 2012:

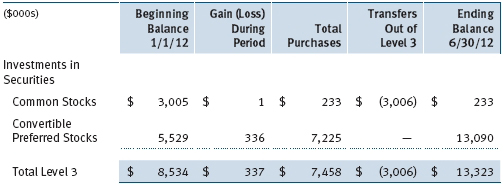
Following is a reconciliation of the fund’s Level 3 holdings for the six months ended June 30, 2012. Transfers into and out of Level 3 are reflected at the value of the financial instrument at the beginning of the period. Gain (loss) reflects both realized and change in unrealized gain (loss) on Level 3 holdings during the period, if any, and is included on the accompanying Statement of Operations. The change in unrealized gain (loss) on Level 3 instruments held at June 30, 2012, totaled $337,000 for the six months ended June 30, 2012.
NOTE 3 - DERIVATIVE INSTRUMENTS
During the six months ended June 30, 2012, the fund invested in derivative instruments. As defined by GAAP, a derivative is a financial instrument whose value is derived from an underlying security price, foreign exchange rate, interest rate, index of prices or rates, or other variable; it requires little or no initial investment and permits or requires net settlement. The fund invests in derivatives only if the expected risks and rewards are consistent with its investment objectives, policies, and overall risk profile, as described in its prospectus and Statement of Additional Information. The fund may use derivatives for a variety of purposes, such as seeking to hedge against declines in principal value, increase yield, invest in an asset with greater efficiency and at a lower cost than is possible through direct investment, or to adjust credit exposure. The risks associated with the use of derivatives are different from, and potentially much greater than, the risks associated with investing directly in the instruments on which the derivatives are based. Investments in derivatives can magnify returns positively or negatively; however, the fund at all times maintains sufficient cash reserves, liquid assets, or other SEC-permitted asset types to cover the settlement obligations under its open derivative contracts.
The fund values its derivatives at fair value, as described below and in Note 2, and recognizes changes in fair value currently in its results of operations. Accordingly, the fund does not follow hedge accounting, even for derivatives employed as economic hedges. The fund does not offset the fair value of derivative instruments against the right to reclaim or obligation to return collateral. As of June 30, 2012, the fund held no derivative instruments.
Additionally, during the six months ended June 30, 2012, the fund recognized $97,000 of realized gain on Foreign Currency Transactions and a $73,000 change in unrealized gain on Foreign Currency Transactions related to its investments in foreign exchange derivatives; such amounts are included on the accompanying Statement of Operations.
Forward Currency Exchange Contracts The fund is subject to foreign currency exchange rate risk in the normal course of pursuing its investment objectives. It uses forward currency exchange contracts (forwards) primarily to protect its non-U.S. dollar-denominated securities from adverse currency movements relative to the U.S. dollar. A forward involves an obligation to purchase or sell a fixed amount of a specific currency on a future date at a price set at the time of the contract. Although certain forwards may be settled by exchanging only the net gain or loss on the contract, most forwards are settled with the exchange of the underlying currencies in accordance with the specified terms. Forwards are valued at the unrealized gain or loss on the contract, which reflects the net amount the fund either is entitled to receive or obligated to deliver, as measured by the difference between the forward exchange rates at the date of entry into the contract and the forward rates at the reporting date. Appreciated forwards are reflected as assets, and depreciated forwards are reflected as liabilities on the accompanying Statement of Assets and Liabilities. Risks related to the use of forwards include the possible failure of counterparties to meet the terms of the agreements; that anticipated currency movements will not occur, thereby reducing the fund’s total return; and the potential for losses in excess of the fund’s initial investment. During the six months ended June 30, 2012, the fund’s exposure to forwards, based on underlying notional amounts, was generally between 0% and 2% of net assets.
NOTE 4 - OTHER INVESTMENT TRANSACTIONS
Consistent with its investment objective, the fund engages in the following practices to manage exposure to certain risks and/or to enhance performance. The investment objective, policies, program, and risk factors of the fund are described more fully in the fund’s prospectus and Statement of Additional Information.
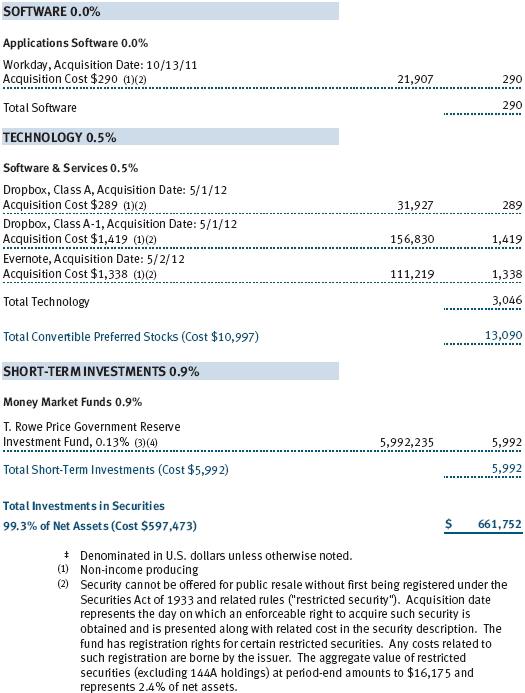
Restricted Securities The fund may invest in securities that are subject to legal or contractual restrictions on resale. Prompt sale of such securities at an acceptable price may be difficult and may involve substantial delays and additional costs.
Securities Lending The fund lends its securities to approved brokers to earn additional income. It receives as collateral cash and U.S. government securities valued at 102% to 105% of the value of the securities on loan. Collateral is maintained over the life of the loan in an amount not less than the value of loaned securities as determined at the close of fund business each day; any additional collateral required due to changes in security values is delivered to the fund the next business day. Cash collateral is invested by the fund’s lending agent(s) in accordance with investment guidelines approved by management. Although risk is mitigated by the collateral, the fund could experience a delay in recovering its securities and a possible loss of income or value if the borrower fails to return the securities or if collateral investments decline in value. Securities lending revenue recognized by the fund consists of earnings on invested collateral and borrowing fees, net of any rebates to the borrower and compensation to the lending agent. In accordance with GAAP, investments made with cash collateral are reflected in the accompanying financial statements, but collateral received in the form of securities are not. At June 30, 2012, there were no securities on loan.
Counterparty Risk and Collateral The fund has entered into collateral agreements with certain counterparties to mitigate counterparty risk associated with certain over-the-counter (OTC) financial instruments, including swaps, forward currency exchange contracts, TBA purchase commitments, and OTC options (collectively, covered OTC instruments). Subject to certain minimum exposure requirements (which typically range from $100,000 to $500,000), collateral requirements generally are determined and transfers made based on the net aggregate unrealized gain or loss on all covered OTC instruments covered by a particular collateral agreement with a specified counterparty. Collateral, both pledged by the fund to a counterparty and pledged by a counterparty to the fund, is held in a segregated account by a third-party agent and can be in the form of cash or debt securities issued by the U.S. government or related agencies. Securities posted as collateral by the fund to a counterparty are so noted in the accompanying Portfolio of Investments and remain in the fund’s assets. As of June 30, 2012, no collateral had been posted by the fund to counterparties for covered OTC instruments. Collateral pledged by counterparties to the fund is not included in the fund’s assets because the fund does not obtain effective control over those assets. As of June 30, 2012, no collateral was pledged by either the fund or counterparties for covered OTC instruments.
At any point in time, the fund’s risk of loss from counterparty credit risk on covered OTC instruments is the aggregate unrealized gain on appreciated covered OTC instruments in excess of collateral, if any, pledged by the counterparty to the fund. In accordance with the terms of the relevant derivatives agreements, counterparties to OTC derivatives may be able to terminate derivative contracts prior to maturity after the occurrence of certain stated events, such as a decline in net assets above a certain percentage or a failure by the fund to perform its obligations under the contract. Upon termination, all transactions would typically be liquidated and a net amount would be owed by or payable to the fund.
Other Purchases and sales of portfolio securities other than short-term securities aggregated $653,608,000 and $556,460,000, respectively, for the six months ended June 30, 2012.
NOTE 5 - FEDERAL INCOME TAXES
No provision for federal income taxes is required since the fund intends to continue to qualify as a regulated investment company under Subchapter M of the Internal Revenue Code and distribute to shareholders all of its taxable income and gains. Distributions determined in accordance with federal income tax regulations may differ in amount or character from net investment income and realized gains for financial reporting purposes. Financial reporting records are adjusted for permanent book/tax differences to reflect tax character but are not adjusted for temporary differences. The amount and character of tax-basis distributions and composition of net assets are finalized at fiscal year-end; accordingly, tax-basis balances have not been determined as of the date of this report.
The fund intends to retain realized gains to the extent of available capital loss carryforwards. Net realized capital losses may be carried forward indefinitely to offset future realized capital gains. As of December 31, 2011, the fund had $4,848,000 of available capital loss carryforwards.
At June 30, 2012, the cost of investments for federal income tax purposes was $609,187,000. Net unrealized gain aggregated $52,566,000 at period-end, of which $80,533,000 related to appreciated investments and $27,967,000 related to depreciated investments.
NOTE 6 - FOREIGN TAXES
The fund is subject to foreign income taxes imposed by certain countries in which it invests. Acquisition of certain foreign currencies related to security transactions are also subject to tax. Additionally, capital gains realized by the fund upon disposition of securities issued in or by certain foreign countries are subject to capital gains tax imposed by those countries. All taxes are computed in accordance with the applicable foreign tax law, and, to the extent permitted, capital losses are used to offset capital gains. Taxes attributable to income are accrued by the fund as a reduction of income. Taxes incurred on the purchase of foreign currencies are recorded as realized loss on foreign currency transactions. Current and deferred tax expense attributable to net capital gains is reflected as a component of realized and/or change in unrealized gain/loss on securities in the accompanying financial statements. At June 30, 2012, the fund had no deferred tax liability attributable to foreign securities and $1,456,000 of foreign capital loss carryforwards, including $705,000 that expire in 2014, $701,000 that expire in 2015, $16,000 that expire in 2017, and $34,000 that expire in 2020.
NOTE 7 - RELATED PARTY TRANSACTIONS
The fund is managed by T. Rowe Price Associates, Inc. (Price Associates), a wholly owned subsidiary of T. Rowe Price Group, Inc. (Price Group). The investment management agreement between the fund and Price Associates provides for an annual investment management fee, which is computed daily and paid monthly. The fee consists of an individual fund fee, equal to 0.45% of the fund’s average daily net assets, and a group fee. The group fee rate is calculated based on the combined net assets of certain mutual funds sponsored by Price Associates (the group) applied to a graduated fee schedule, with rates ranging from 0.48% for the first $1 billion of assets to 0.28% for assets in excess of $300 billion. The fund’s group fee is determined by applying the group fee rate to the fund’s average daily net assets. At June 30, 2011, the effective annual group fee rate was 0.30%.
In addition, the fund has entered into service agreements with Price Associates and two wholly owned subsidiaries of Price Associates (collectively, Price). Price Associates computes the daily share price and provides certain other administrative services to the fund. T. Rowe Price Services, Inc., provides shareholder and administrative services in its capacity as the fund’s transfer and dividend disbursing agent. T. Rowe Price Retirement Plan Services, Inc., provides subaccounting and recordkeeping services for certain retirement accounts invested in the fund. For the six months ended June 30, 2012, expenses incurred pursuant to these service agreements were $62,000 for Price Associates; $218,000 for T. Rowe Price Services, Inc.; and $21,000 for T. Rowe Price Retirement Plan Services, Inc. The total amount payable at period-end pursuant to these service agreements is reflected as Due to Affiliates in the accompanying financial statements.
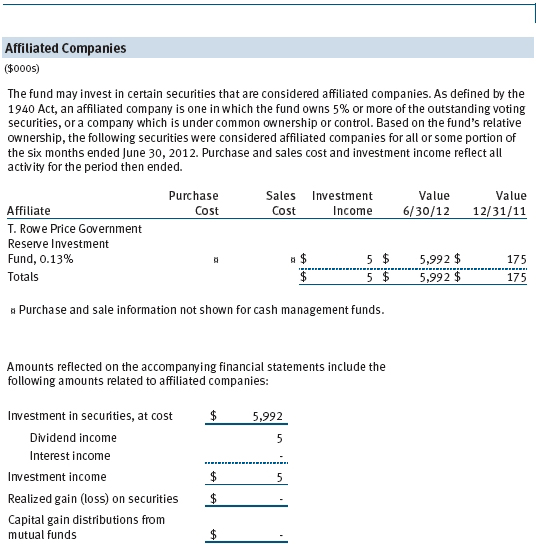
The fund may invest in the T. Rowe Price Reserve Investment Fund and the T. Rowe Price Government Reserve Investment Fund (collectively, the T. Rowe Price Reserve Investment Funds), open-end management investment companies managed by Price Associates and considered affiliates of the fund. The T. Rowe Price Reserve Investment Funds are offered as cash management options to mutual funds, trusts, and other accounts managed by Price Associates and/or its affiliates and are not available for direct purchase by members of the public. The T. Rowe Price Reserve Investment Funds pay no investment management fees.
As of June 30, 2012, T. Rowe Price Group, Inc., and/or its wholly owned subsidiaries owned 539,179 shares of the fund, representing less than 1% of the fund’s net assets.
| Information on Proxy Voting Policies, Procedures, and Records |
A description of the policies and procedures used by T. Rowe Price funds and portfolios to determine how to vote proxies relating to portfolio securities is available in each fund’s Statement of Additional Information, which you may request by calling 1-800-225-5132 or by accessing the SEC’s website, sec.gov. The description of our proxy voting policies and procedures is also available on our website, troweprice.com. To access it, click on the words “Our Company” at the top of our corporate homepage. Then, when the next page appears, click on the words “Proxy Voting Policies” on the left side of the page.
Each fund’s most recent annual proxy voting record is available on our website and through the SEC’s website. To access it through our website, follow the directions above, then click on the words “Proxy Voting Records” on the right side of the Proxy Voting Policies page.
| How to Obtain Quarterly Portfolio Holdings |
The fund files a complete schedule of portfolio holdings with the Securities and Exchange Commission for the first and third quarters of each fiscal year on Form N-Q. The fund’s Form N-Q is available electronically on the SEC’s website (sec.gov); hard copies may be reviewed and copied at the SEC’s Public Reference Room, 100 F St. N.E., Washington, DC 20549. For more information on the Public Reference Room, call 1-800-SEC-0330.
| Approval of Investment Management Agreement |
On March 6, 2012, the fund’s Board of Directors (Board), including a majority of the fund’s independent directors, approved the continuation of the investment management agreement (Advisory Contract) between the fund and its investment advisor, T. Rowe Price Associates, Inc. (Advisor). In connection with its deliberations, the Board requested, and the Advisor provided, such information as the Board (with advice from independent legal counsel) deemed reasonably necessary. The Board considered a variety of factors in connection with its review of the Advisory Contract, also taking into account information provided by the Advisor during the course of the year, as discussed below:Services Provided by the Advisor
The Board considered the nature, quality, and extent of the services provided to the fund by the Advisor. These services included, but were not limited to, directing the fund’s investments in accordance with its investment program and the overall management of the fund’s portfolio, as well as a variety of related activities such as financial, investment operations, and administrative services; compliance; maintaining the fund’s records and registrations; and shareholder communications. The Board also reviewed the background and experience of the Advisor’s senior management team and investment personnel involved in the management of the fund, as well as the Advisor’s compliance record. The Board concluded that it was satisfied with the nature, quality, and extent of the services provided by the Advisor.
Investment Performance of the Fund
The Board reviewed the fund’s average annual total returns over the three-month and 1-, 3-, 5-, and 10-year periods, as well as the fund’s year-by-year returns, and compared these returns with a wide variety of previously agreed upon comparable performance measures and market data, including those supplied by Lipper and Morningstar, which are independent providers of mutual fund data.
On the basis of this evaluation and the Board’s ongoing review of investment results, and factoring in the relative market conditions during certain of the performance periods, the Board concluded that the fund’s performance was satisfactory.
Costs, Benefits, Profits, and Economies of Scale
The Board reviewed detailed information regarding the revenues received by the Advisor under the Advisory Contract and other benefits that the Advisor (and its affiliates) may have realized from its relationship with the fund, including any research received under “soft dollar” agreements and commission-sharing arrangements with broker-dealers. The Board considered that the Advisor may receive some benefit from soft-dollar arrangements pursuant to which research is received from broker-dealers that execute the applicable fund’s portfolio transactions. The Board received information on the estimated costs incurred and profits realized by the Advisor from managing T. Rowe Price mutual funds. The Board also reviewed estimates of the profits realized from managing the fund in particular, and the Board concluded that the Advisor’s profits were reasonable in light of the services provided to the fund.
The Board also considered whether the fund benefits under the fee levels set forth in the Advisory Contract from any economies of scale realized by the Advisor. Under the Advisory Contract, the fund pays a fee to the Advisor for investment management services composed of two components—a group fee rate based on the combined average net assets of most of the T. Rowe Price mutual funds (including the fund) that declines at certain asset levels and an individual fund fee rate based on the fund’s average daily net assets—and the fund pays its own expenses of operations. The Board concluded that the advisory fee structure for the fund continued to provide for a reasonable sharing of benefits from any economies of scale with the fund’s investors.
Fees
The Board was provided with information regarding industry trends in management fees and expenses, and the Board reviewed the fund’s management fee rate, operating expenses, and total expense ratio in comparison with fees and expenses of other comparable funds based on information and data supplied by Lipper. The information provided to the Board indicated that the fund’s management fee rate was above the median for certain groups of comparable funds but at or below the median for other groups of comparable funds. The information provided to the Board also indicated that the fund’s total expense ratio was above the median for certain groups of comparable funds but below the median for other groups of comparable funds.
The Board also reviewed the fee schedules for institutional accounts and private accounts with similar mandates that are advised or subadvised by the Advisor and its affiliates. Management provided the Board with information about the Advisor’s responsibilities and services provided to institutional account clients, including information about how the requirements and economics of the institutional business are fundamentally different from those of the mutual fund business. The Board considered information showing that the mutual fund business is generally more complex from a business and compliance perspective than the institutional business and that the Advisor generally performs significant additional services and assumes greater risk in managing the fund and other T. Rowe Price mutual funds than it does for institutional account clients.
On the basis of the information provided and the factors considered, the Board concluded that the fees paid by the fund under the Advisory Contract are reasonable.
Approval of the Advisory Contract
As noted, the Board approved the continuation of the Advisory Contract. No single factor was considered in isolation or to be determinative to the decision. Rather, the Board concluded, in light of a weighting and balancing of all factors considered, that it was in the best interests of the fund and its shareholders for the Board to approve the continuation of the Advisory Contract (including the fees to be charged for services thereunder). The independent directors were advised throughout the process by independent legal counsel.
Item 2. Code of Ethics.
A code of ethics, as defined in Item 2 of Form N-CSR, applicable to its principal executive officer, principal financial officer, principal accounting officer or controller, or persons performing similar functions is filed as an exhibit to the registrant’s annual Form N-CSR. No substantive amendments were approved or waivers were granted to this code of ethics during the registrant’s most recent fiscal half-year.
Item 3. Audit Committee Financial Expert.
Disclosure required in registrant’s annual Form N-CSR.
Item 4. Principal Accountant Fees and Services.
Disclosure required in registrant’s annual Form N-CSR.
Item 5. Audit Committee of Listed Registrants.
Not applicable.
Item 6. Investments.
(a) Not applicable. The complete schedule of investments is included in Item 1 of this Form N-CSR.
(b) Not applicable.
Item 7. Disclosure of Proxy Voting Policies and Procedures for Closed-End Management Investment Companies.
Not applicable.
Item 8. Portfolio Managers of Closed-End Management Investment Companies.
Not applicable.
Item 9. Purchases of Equity Securities by Closed-End Management Investment Company and Affiliated Purchasers.
Not applicable.
Item 10. Submission of Matters to a Vote of Security Holders.
Not applicable.
Item 11. Controls and Procedures.
(a) The registrant’s principal executive officer and principal financial officer have evaluated the registrant’s disclosure controls and procedures within 90 days of this filing and have concluded that the registrant’s disclosure controls and procedures were effective, as of that date, in ensuring that information required to be disclosed by the registrant in this Form N-CSR was recorded, processed, summarized, and reported timely.
(b) The registrant’s principal executive officer and principal financial officer are aware of no change in the registrant’s internal control over financial reporting that occurred during the registrant’s second fiscal quarter covered by this report that has materially affected, or is reasonably likely to materially affect, the registrant’s internal control over financial reporting.
Item 12. Exhibits.
(a)(1) The registrant’s code of ethics pursuant to Item 2 of Form N-CSR is filed with the registrant’s annual Form N-CSR.
(2) Separate certifications by the registrant's principal executive officer and principal financial officer, pursuant to Section 302 of the Sarbanes-Oxley Act of 2002 and required by Rule 30a-2(a) under the Investment Company Act of 1940, are attached.
(3) Written solicitation to repurchase securities issued by closed-end companies: not applicable.
(b) A certification by the registrant's principal executive officer and principal financial officer, pursuant to Section 906 of the Sarbanes-Oxley Act of 2002 and required by Rule 30a-2(b) under the Investment Company Act of 1940, is attached.
SIGNATURES
Pursuant to the requirements of the Securities Exchange Act of 1934 and the Investment Company Act of 1940, the registrant has duly caused this report to be signed on its behalf by the undersigned, thereunto duly authorized.
T. Rowe Price Global Technology Fund, Inc.
| | By | /s/ Edward C. Bernard |
| | Edward C. Bernard |
| | Principal Executive Officer |
| |
| Date August 16, 2012 | | |
Pursuant to the requirements of the Securities Exchange Act of 1934 and the Investment Company Act of 1940, this report has been signed below by the following persons on behalf of the registrant and in the capacities and on the dates indicated.
| | By | /s/ Edward C. Bernard |
| | Edward C. Bernard |
| | Principal Executive Officer |
| |
| Date August 16, 2012 | | |
| |
| |
| By | /s/ Gregory K. Hinkle |
| | Gregory K. Hinkle |
| | Principal Financial Officer |
| |
| Date August 16, 2012 | | |