UNITED STATES
SECURITIES AND EXCHANGE COMMISSION
WASHINGTON, D.C. 20549
FORM N-CSR
CERTIFIED SHAREHOLDER REPORT OF REGISTERED MANAGEMENT
INVESTMENT COMPANIES
Investment Company Act file number 811-10001
Oppenheimer Main Street Select Fund
(Exact name of registrant as specified in charter)
6803 South Tucson Way, Centennial, Colorado 80112-3924
(Address of principal executive offices) (Zip code)
Arthur S. Gabinet
OppenheimerFunds, Inc.
Two World Financial Center, New York, New York 10281-1008
(Name and address of agent for service)
Registrant’s telephone number, including area code: (303) 768-3200
Date of fiscal year end: July 31
Date of reporting period: 7/31/2012
Item 1. Reports to Stockholders.
July 31, 2012
| | | | |
| | | Oppenheimer Main Street Select Fund® | | Management Commentary and Annual Report |
MANAGEMENT COMMENTARY
An Interview with Your Fund’s Portfolio Managers
ANNUAL REPORT
Listing of Top Holdings
Fund Performance Discussion
Financial Statements


TOP HOLDINGS AND ALLOCATIONS
| | | | |
| |
Top Ten Common Stock Industries
| |
| |
Diversified Financial Services
| |
| 10.1
| %
|
Computers & Peripherals
| |
| 9.6
|
|
Oil, Gas & Consumable Fuels
| |
| 7.4
|
|
Internet Software & Services
| |
| 6.5
|
|
Media
| |
| 5.0
|
|
IT Services
| |
| 4.7
|
|
Specialty Retail
| |
| 4.7
|
|
Beverages
| |
| 3.7
|
|
Air Freight & Logistics
| |
| 3.6
|
|
| Health Care Providers & Services | | | 3.6 | |
|
| Portfolio holdings and allocations are subject to change. Percentages are as of July 31, 2012, and are based on net assets. | |
| |
Top Ten Common Stock Holdings
| |
| |
Apple, Inc.
| |
| 9.6
| %
|
Chevron Corp.
| |
| 5.5
|
|
eBay, Inc.
| |
| 5.1
|
|
JPMorgan Chase & Co.
| |
| 5.1
|
|
McGraw-Hill Cos., Inc. (The)
| |
| 5.0
|
|
International Business Machines Corp.
| |
| 4.7
|
|
Dr. Pepper Snapple Group, Inc.
| |
| 3.7
|
|
United Parcel Service, Inc., Cl. B
| |
| 3.6
|
|
Boeing Co. (The)
| |
| 3.6
|
|
| Ford Motor Co. | | | 3.5 | |
|
| Portfolio holdings and allocations are subject to change. Percentages are as of July 31, 2012, and are based on net assets. For more current Top 10 Fund holdings, please visit oppenheimerfunds.com. | |
| | | | |
| 6 | | | | OPPENHEIMER MAIN STREET SELECT FUND |
Sector Allocation
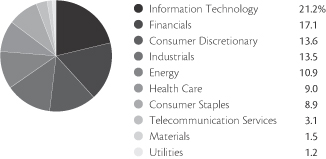
Portfolio holdings and allocations are subject to change. Percentages are as of July 31, 2012, and are based on the total market value of common stocks.
| | | | |
| 7 | | | | OPPENHEIMER MAIN STREET SELECT FUND |
FUND PERFORMANCE DISCUSSION
How has the Fund performed? Below is a discussion of the Fund’s performance during the reporting period ended July 31, 2012, followed by a graphical comparison of the Fund’s performance to appropriate broad-based market indices.
Management’s Discussion of Fund Performance. Oppenheimer Main Street Select Fund’s Class A shares (without sales charge) returned 9.73%, outperforming the S&P 500 Index (the “Index”) and the Russell 1000 Index, which returned 9.13% and 7.96%, respectively. Relative to the Index, the Fund’s outperformance stemmed primarily from stronger stock selection within the information technology and energy sectors. The most material underperforming sector for the Fund was financials, where weaker relative stock selection detracted.
During the period, the strongest performing holdings of the Fund were information technology stocks Apple, Inc. and eBay, Inc. Apple, which was the top holding of the Fund at period end, continued to out-execute its peers, and its success at innovation and highly recognizable brand led to global growth and share gains across its top revenue producing products – particularly iPhones and iPads. Also contributing to performance within information technology was eBay, Inc. The company’s first quarter earnings report beat expectations and management raised guidance for both revenues and profits. eBay continued to benefit from a turnaround in its Marketplace segment with improvements to the user experience leading to increased loyalty and a large number of transactions. PayPal, eBay’s online payment service, also continued to be a significant contributor to growth with results that exceeded expectations.
Other top contributing holdings during the period included industrials stock Tyco International Ltd., consumer staples holdings Dr. Pepper Snapple Group, Inc. and Philip Morris International, Inc., and consumer discretionary stock AutoZone, Inc. Tyco International is a global provider of electronic security products and services, fire protection and detection products and services, and valves and controls. Tyco has performed positively since announcing a three-way split of the company in September of last year. In addition, the company’s stock benefited after Pentair agreed to buy its flow-control unit. Dr. Pepper Snapple is a beverage company whose lack of European exposure helped protect it against market declines. Despite a slight disappointment when earnings were announced, management reaffirmed its full-year guidance due, in part, to a more favorable commodity cost environment. This is also a strong cash flow generating story and we expect management to remain aggressive at repurchasing the company’s shares. Philip Morris continued to generate substantial free cash flow stemming from ongoing market share gains and its considerable ability to raise prices. AutoZone, a retailer and distributor of auto parts, benefited from an aging car fleet as older cars require repairs.
| | | | |
| 8 | | | | OPPENHEIMER MAIN STREET SELECT FUND |
The most significant detractor from performance was Ford Motor Co. While North American results for Ford and most of its peers have been solid, weakness in international markets, particularly Europe and Latin America, have resulted in lowered revenue and profit expectations. Despite the sluggish international outlook, we anticipate that North American car sales will continue to improve as consumers replace an aging fleet of vehicles that is near a record high. Also hurting performance were financials holding Citigroup, Inc. and energy stock Occidental Petroleum Corp. Citigroup’s stock traded lower given the market’s concern over the company’s perceived exposure to the ongoing European sovereign debt crisis. A sluggish U.S. economy and continued weak housing data, as well as an uncertain regulatory environment for large financial institutions, also negatively contributed to Citi’s stock price. Occidental Petroleum Corp., which we exited by period end, was challenged by declining oil prices over the second half of the period.
Comparing the Fund’s Performance to the Market. The graphs that follow show the performance of a hypothetical $10,000 investment in each Class of shares of the Fund held until July 31, 2012. For all Classes, performance is measured over a ten-fiscal-year period. The Fund’s performance reflects the deduction of the maximum initial sales charge on Class A shares, the applicable contingent deferred sales charge on Class B, Class C and Class N shares, and reinvestments of all dividends and capital gains distributions. Past performance cannot guarantee future results.
The Fund’s performance is compared to the performance of the S&P 500 Index and the Russell 1000 Index. The S&P 500 Index is an unmanaged index of large-capitalization equity securities that is a measure of the general domestic stock market. The Russell 1000 Index is an index that is a widely used measure of domestic, large-cap stock performance, and is made up of the top 1,000 stocks in the Russell 3000 Index. Indices cannot be purchased directly by investors. Index performance reflects the reinvestment of income but does not consider the effect of transaction costs, and none of the data in the graphs show the effect of taxes. The Fund’s performance reflects the effects of the Fund’s business and operating expenses. While index comparisons may be useful to provide a benchmark for the Fund’s performance, it must be noted that the Fund’s investments are not limited to the investments comprising the indices.
| | | | |
| 9 | | | | OPPENHEIMER MAIN STREET SELECT FUND |
FUND PERFORMANCE DISCUSSION
Class A Shares
Comparison of Change in Value of $10,000 Hypothetical Investments in:
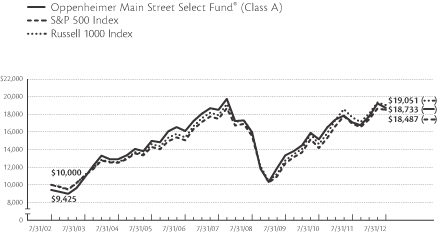
Average Annual Total Returns of Class A Shares With Sales Charge of the Fund at 7/31/12
1-Year 3.42% 5-Year –0.92% 10-Year 6.48%
| | | | |
| 10 | | | | OPPENHEIMER MAIN STREET SELECT FUND |
Class B Shares
Comparison of Change in Value of $10,000 Hypothetical Investments in:
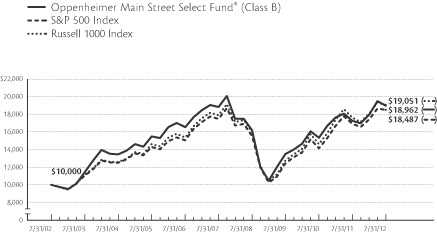
Average Annual Total Returns of Class B Shares With Sales Charge of the Fund at 7/31/12
1-Year 3.81% 5-Year –0.91% 10-Year 6.61%
The performance data quoted represents past performance, which does not guarantee future results. The investment return and principal value of an investment in the Fund will fluctuate so that an investor’s shares, when redeemed, may be worth more or less than their original cost. Current performance may be lower or higher than the performance quoted. Returns do not consider capital gains or income taxes on an individual’s investment. For performance data current to the most recent month-end, visit oppenheimerfunds.com or call 1.800.CALL OPP (225.5677). Fund returns include changes in share price, reinvested distributions, and the applicable sales charge: for Class A shares, the current maximum initial sales charge of 5.75%; for Class B shares, the contingent deferred sales charge of 5% (1-year) and 2% (5-year); and for Class C and N shares, the contingent deferred sales charge of 1% for the 1-year period. Because Class B shares convert to Class A shares 72 months after purchase, the 10-year return for Class B shares uses Class A performance for the period after conversion. There is no sales charge for Class Y shares. See page 15 for further information.
| | | | |
| 11 | | | | OPPENHEIMER MAIN STREET SELECT FUND |
FUND PERFORMANCE DISCUSSION
Class C Shares
Comparison of Change in Value of $10,000 Hypothetical Investments in:

Average Annual Total Returns of Class C Shares With Sales Charge of the Fund at 7/31/12
1-Year 7.82% 5-Year –0.47% 10-Year 6.33%
| | | | |
| 12 | | | | OPPENHEIMER MAIN STREET SELECT FUND |
Class N Shares
Comparison of Change in Value of $10,000 Hypothetical Investments in:
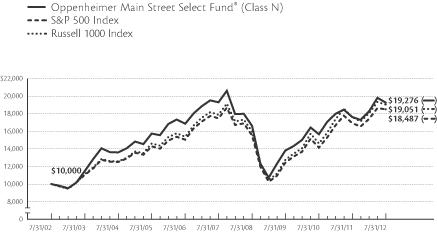
Average Annual Total Returns of Class N Shares With Sales Charge of the Fund at 7/31/12
1-Year 8.31% 5-Year –0.03% 10-Year 6.78%
The performance data quoted represents past performance, which does not guarantee future results. The investment return and principal value of an investment in the Fund will fluctuate so that an investor’s shares, when redeemed, may be worth more or less than their original cost. Current performance may be lower or higher than the performance quoted. Returns do not consider capital gains or income taxes on an individual’s investment. For performance data current to the most recent month-end, visit oppenheimerfunds.com or call 1.800.CALL OPP (225.5677). Fund returns include changes in share price, reinvested distributions, and the applicable sales charge: for Class A shares, the current maximum initial sales charge of 5.75%; for Class B shares, the contingent deferred sales charge of 5% (1-year) and 2% (5-year); and for Class C and N shares, the contingent deferred sales charge of 1% for the 1-year period. Because Class B shares convert to Class A shares 72 months after purchase, the 10-year return for Class B shares uses Class A performance for the period after conversion. There is no sales charge for Class Y shares. See page 15 for further information.
| | | | |
| 13 | | | | OPPENHEIMER MAIN STREET SELECT FUND |
FUND PERFORMANCE DISCUSSION
Class Y Shares
Comparison of Change in Value of $10,000 Hypothetical Investments in:
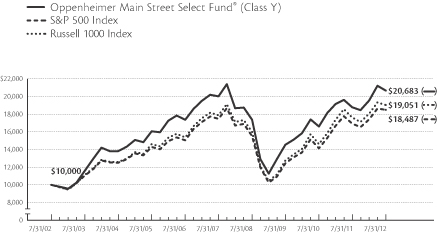
Average Annual Total Returns of Class Y Shares of the Fund at 7/31/12
1-Year 10.00% 5-Year 0.66% 10-Year 7.54%
The performance data quoted represents past performance, which does not guarantee future results. The investment return and principal value of an investment in the Fund will fluctuate so that an investor’s shares, when redeemed, may be worth more or less than their original cost. Current performance may be lower or higher than the performance quoted. Returns do not consider capital gains or income taxes on an individual’s investment. For performance data current to the most recent month-end, visit oppenheimerfunds.com or call 1.800.CALL OPP (225.5677). Fund returns include changes in share price, reinvested distributions, and the applicable sales charge: for Class A shares, the current maximum initial sales charge of 5.75%; for Class B shares, the contingent deferred sales charge of 5% (1-year) and 2% (5-year); and for Class C and N shares, the contingent deferred sales charge of 1% for the 1-year period. Because Class B shares convert to Class A shares 72 months after purchase, the 10-year return for Class B shares uses Class A performance for the period after conversion. There is no sales charge for Class Y shares. See page 15 for further information.
| | | | |
| 14 | | | | OPPENHEIMER MAIN STREET SELECT FUND |
NOTES
Total returns and the ending account values in the graphs include changes in share price and reinvestment of dividends and capital gains distributions in a hypothetical investment for the periods shown. The Fund’s total returns shown do not reflect the deduction of income taxes on an individual’s investment. Taxes may reduce your actual investment returns on income or gains paid by the Fund or any gains you may realize if you sell your shares.
Before investing in any of the Oppenheimer funds, investors should carefully consider a fund’s investment objectives, risks, charges and expenses. Fund prospectuses and summary prospectuses contain this and other information about the funds, and may be obtained by asking your financial advisor, visiting oppenheimerfunds.com, or calling 1.800.CALL OPP (225.5677). Read prospectuses and summary prospectuses carefully before investing.
The Fund’s investment strategy and focus can change over time. The mention of specific fund holdings does not constitute a recommendation by OppenheimerFunds, Inc.
Class A shares of the Fund were first publicly offered on 9/25/00. Unless otherwise noted, Class A returns include the current maximum initial sales charge of 5.75%.
Class B shares of the Fund were first publicly offered on 9/25/00. Unless otherwise noted, Class B returns include the applicable contingent deferred sales charge of 5% (1-year) and 2% (5-year). Because Class B shares convert to Class A shares 72 months after purchase, the 10-year return for Class B shares uses Class A performance for the period after conversion. Class B shares are subject to an annual 0.75% asset-based sales charge.
Class C shares of the Fund were first publicly offered on 9/25/00. Unless otherwise noted, Class C returns include the contingent deferred sales charge of 1% for the 1-year period. Class C shares are subject to an annual 0.75% asset-based sales charge.
Class N shares of the Fund were first publicly offered on 3/1/01. Class N shares are offered only through retirement plans. Unless otherwise noted, Class N returns include the contingent deferred sales charge of 1% for the 1-year period. Class N shares are subject to an annual 0.25% asset-based sales charge.
Class Y shares of the Fund were first publicly offered on 9/25/00. Class Y shares are offered only to fee-based clients of dealers that have a special agreement with the Distributor, to certain institutional investors under a special agreement with the Distributor, and to present or former officers, directors, trustees and employees (and their eligible family members) of the Fund, the Manager, its affiliates, its parent company and the subsidiaries of its parent company, and retirement plans established for the benefit of such individuals. There is no sales charge for Class Y shares.
| | | | |
| 15 | | | | OPPENHEIMER MAIN STREET SELECT FUND |
FUND EXPENSES
Fund Expenses. As a shareholder of the Fund, you incur two types of costs: (1) transaction costs, which may include sales charges (loads) on purchase payments, contingent deferred sales charges on redemptions and (2) ongoing costs, including management fees; distribution and service fees; and other Fund expenses. These examples are intended to help you understand your ongoing costs (in dollars) of investing in the Fund and to compare these costs with the ongoing costs of investing in other mutual funds.
The examples are based on an investment of $1,000.00 invested at the beginning of the period and held for the entire 6-month period ended July 31, 2012.
Actual Expenses. The first section of the table provides information about actual account values and actual expenses. You may use the information in this section for the class of shares you hold, together with the amount you invested, to estimate the expense that you paid over the period. Simply divide your account value by $1,000.00 (for example, an $8,600.00 account value divided by $1,000.00 = 8.60), then multiply the result by the number in the first section under the heading entitled “Expenses Paid During Period” to estimate the expenses you paid on your account during this period.
Hypothetical Example for Comparison Purposes. The second section of the table provides information about hypothetical account values and hypothetical expenses based on the Fund’s actual expense ratio for each class of shares, and an assumed rate of return of 5% per year for each class before expenses, which is not the actual return. The hypothetical account values and expenses may not be used to estimate the actual ending account balance or expenses you paid for the period. You may use this information to compare the ongoing costs of investing in the Fund and other funds. To do so, compare this 5% hypothetical example for the class of shares you hold with the 5% hypothetical examples that appear in the shareholder reports of the other funds.
Please note that the expenses shown in the table are meant to highlight your ongoing costs only and do not reflect any transactional costs, such as front-end or contingent deferred sales charges (loads), or a $12.00 fee imposed annually on accounts valued at less than $500.00 (subject to exceptions described in the Statement of Additional Information). Therefore, the “hypothetical” section of the table is useful in comparing ongoing costs only, and will not help you determine the relative total costs of owning different funds. In addition, if these transactional costs were included, your costs would have been higher.
| | | | |
| 16 | | | | OPPENHEIMER MAIN STREET SELECT FUND |
| | | | | | | | | | | | |
| Actual | | Beginning
Account
Value
February 1, 2012 | | | Ending
Account
Value
July 31, 2012 | | | Expenses
Paid During
6 Months Ended
July 31, 2012 | |
| Class A | | $ | 1,000.00 | | | $ | 1,056.30 | | | $ | 6.15 | |
| Class B | | | 1,000.00 | | | | 1,052.40 | | | | 10.77 | |
| Class C | | | 1,000.00 | | | | 1,052.90 | | | | 9.95 | |
| Class N | | | 1,000.00 | | | | 1,054.30 | | | | 7.95 | |
| Class Y | | | 1,000.00 | | | | 1,058.40 | | | | 4.77 | |
| | | |
Hypothetical
(5% return before expenses) | | | | | | | | | |
| Class A | | | 1,000.00 | | | | 1,018.90 | | | | 6.04 | |
| Class B | | | 1,000.00 | | | | 1,014.42 | | | | 10.57 | |
| Class C | | | 1,000.00 | | | | 1,015.22 | | | | 9.77 | |
| Class N | | | 1,000.00 | | | | 1,017.16 | | | | 7.80 | |
| Class Y | | | 1,000.00 | | | | 1,020.24 | | | | 4.68 | |
Expenses are equal to the Fund’s annualized expense ratio for that class, multiplied by the average account value over the period, multiplied by 182/366 (to reflect the one-half year period). Those annualized expense ratios, excluding indirect expenses from affiliated fund, based on the 6-month period ended July 31, 2012 are as follows:
| | | | |
| Class | | Expense Ratios | |
| Class A | | | 1.20 | % |
| Class B | | | 2.10 | |
| Class C | | | 1.94 | |
| Class N | | | 1.55 | |
| Class Y | | | 0.93 | |
The expense ratios reflect voluntary waivers and/or reimbursements of expenses by the Fund’s Manager and Transfer Agent. Some of these undertakings may be modified or terminated at any time, as indicated in the Fund’s prospectus. The “Financial Highlights” tables in the Fund’s financial statements, included in this report, also show the gross expense ratios, without such waivers or reimbursements and reduction to custodian expenses, if applicable.
| | | | |
| 17 | | | | OPPENHEIMER MAIN STREET SELECT FUND |
STATEMENT OF INVESTMENTS July 31, 2012
| | | | | | | | |
| | | Shares | | | Value | |
| Common Stocks—98.1% | |
| Consumer Discretionary—13.4% | |
| Automobiles—3.5% | |
| Ford Motor Co. | | | 5,422,050 | | | $ | 50,099,742 | |
| Hotels, Restaurants & Leisure—0.3% | |
| Yum! Brands, Inc. | | | 67,990 | | | | 4,408,472 | |
| Media—5.0% | |
| McGraw-Hill Cos., Inc. (The) | | | 1,533,174 | | | | 71,997,851 | |
| Specialty Retail—4.6% | |
| AutoZone, Inc.1 | | | 81,980 | | | | 30,761,355 | |
| CarMax, Inc.1 | | | 514,420 | | | | 14,316,309 | |
| TJX Cos., Inc. (The) | | | 510,640 | | |
| 22,611,139
|
|
| | | | | | | | 67,688,803 | |
| Consumer Staples—8.7% | |
| Beverages—3.7% | |
| Dr. Pepper Snapple Group, Inc. | | | 1,167,860 | | | | 53,231,059 | |
| Food Products—2.0% | |
| J.M. Smucker Co. (The) | | | 391,010 | | | | 30,029,568 | |
| Tobacco—3.0% | |
| Philip Morris International, Inc. | | | 471,824 | | | | 43,143,587 | |
| Energy—10.6% | |
| Energy Equipment & Services—3.2% | |
| National Oilwell Varco, Inc. | | | 651,980 | | | | 47,138,154 | |
| Oil, Gas & Consumable Fuels—7.4% | |
| Chevron Corp. | | | 732,771 | | | | 80,297,046 | |
| Enbridge Energy Management LLC1 | | | 1 | | | | 20 | |
| Noble Energy, Inc. | | | 311,280 | | |
| 27,215,210
|
|
| | | | | | | | 107,512,276 | |
| Financials—16.8% | |
| Commercial Banks—3.3% | |
| CIT Group, Inc.1 | | | 1,324,854 | | | | 48,383,668 | |
| Diversified Financial Services—10.1% | |
| Citigroup, Inc. | | | 1,622,008 | | | | 44,005,077 | |
| CME Group, Inc. | | | 564,850 | | | | 29,434,334 | |
| JPMorgan Chase & Co. | | | 2,051,520 | | |
| 73,854,720
|
|
| | | | | | | | 147,294,131 | |
| | | | | | | | |
| | | Shares | | | Value | |
| Insurance—3.4% | |
| Marsh & McLennan Cos., Inc. | | | 1,467,200 | | | $ | 48,725,712 | |
| Health Care—8.9% | |
| Health Care Equipment & Supplies—2.1% | |
| Covidien plc | | | 545,630 | | | | 30,489,804 | |
| Health Care Providers & Services—3.6% | |
| DaVita, Inc.1 | | | 73,140 | | | | 7,198,439 | |
| Express Scripts Holding Co.1 | | | 780,170 | | |
| 45,203,050
|
|
| | | | | | | | 52,401,489 | |
| Pharmaceuticals—3.2% | |
| Bristol-Myers Squibb Co. | | | 1,300,940 | | | | 46,313,464 | |
| Industrials—13.2% | |
| Aerospace & Defense—3.6% | |
| Boeing Co. (The) | | | 704,480 | | | | 52,068,117 | |
| Air Freight & Logistics—3.6% | |
| United Parcel Service, Inc., Cl. B | | | 696,830 | | | | 52,687,316 | |
| Industrial Conglomerates—3.2% | |
| Tyco International Ltd. | | | 854,875 | | | | 46,966,833 | |
| Professional Services—1.5% | |
| Towers Watson & Co., Cl. A | | | 361,350 | | | | 21,185,951 | |
| Road & Rail—1.3% | |
| CSX Corp. | | | 831,610 | | | | 19,077,133 | |
| Information Technology—20.8% | |
| Computers & Peripherals—9.6% | |
| Apple, Inc.1 | | | 227,276 | | | | 138,811,090 | |
| Internet Software & Services—6.5% | |
| eBay, Inc.1 | | | 1,680,550 | | | | 74,448,365 | |
| Google, Inc., Cl. A1 | | | 31,363 | | |
| 19,851,838
|
|
| | | | | | | | 94,300,203 | |
| IT Services—4.7% | |
| International Business Machines Corp. | | | 351,270 | | | | 68,841,895 | |
| Materials—1.5% | |
| Construction Materials—1.5% | |
| Vulcan Materials Co. | | | 545,430 | | | | 21,129,958 | |
| | | | |
| 18 | | | | OPPENHEIMER MAIN STREET SELECT FUND |
| | | | | | | | |
| | | Shares | | | Value | |
| Telecommunication Services—3.0% | |
| Wireless Telecommunication Services—3.0% | |
| America Movil SAB de CV, ADR, Series L | | | 1,652,832 | | | $ | 44,114,086 | |
| Utilities—1.2% | |
| Energy Traders—1.2% | |
| AES Corp. (The)1 | | | 1,398,742 | | |
| 16,868,827
|
|
Total Common Stocks
(Cost $1,099,821,352) | | | | 1,424,909,189 | |
| | | | | | | | |
| | | Shares | | | Value | |
| Investment Company—1.1% | |
Oppenheimer Institutional Money Market Fund, Cl. E, 0.18%2,3
(Cost $15,206,579) | | | 15,206,579 | | | $ | 15,206,579 | |
Total Investments, at Value
(Cost $1,115,027,931) | | | 99.2 | % | | | 1,440,115,768 | |
| Other Assets Net of Liabilities | | | 0.8 | | | | 11,796,344 | |
| | |
|
|
| |
|
|
|
| Net Assets | | | 100.0 | % | | $ | 1,451,912,112 | |
| | |
|
|
| |
|
|
|
Footnotes to Statement of Investments
1. Non-income producing security.
2. Is or was an affiliate, as defined in the Investment Company Act of 1940, at or during the period ended July 31, 2012, by virtue of the Fund owning at least 5% of the voting securities of the issuer or as a result of the Fund and the issuer having the same investment adviser. Transactions during the period in which the issuer was an affiliate are as follows:
| | | | | | | | | | | | | | | | | | | | |
| | | Shares
July 29, 2011a | | Gross
Additions | | Gross
Reductions | | Shares
July 31, 2012 |
| Oppenheimer Institutional Money Market Fund, Cl. E | | | | 512,169 | | | | | 340,345,552 | | | | | 325,651,142 | | | | | 15,206,579 | |
| | | | |
| | | | | | | Value | | Income |
| Oppenheimer Institutional Money Market Fund, Cl. E | | | | | | | | | | | | | | $15,206,579 | | | | | $33,818 | |
a. July 29, 2011 represents the last business day of the Fund’s 2011 fiscal year. See Note 1 of the accompanying Notes.
3. Rate shown is the 7-day yield as of July 31, 2012.
See accompanying Notes to Financial Statements.
| | | | |
| 19 | | | | OPPENHEIMER MAIN STREET SELECT FUND |
STATEMENT OF ASSETS AND LIABILITIES July 31, 2012
| | | | |
| Assets | | | |
| Investments, at value—see accompanying statement of investments: | | | | |
| Unaffiliated companies (cost $1,099,821,352) | | $ | 1,424,909,189 | |
| Affiliated companies (cost $15,206,579) | |
| 15,206,579
|
|
| | | | 1,440,115,768 | |
| Cash | | | 31,183 | |
| Receivables and other assets: | | | | |
| Investments sold | | | 19,050,562 | |
| Dividends | | | 1,121,041 | |
| Expense waivers/reimbursements due from manager | | | 27,000 | |
| Other | |
| 86,009
|
|
| Total assets | | | 1,460,431,563 | |
| Liabilities | | | |
| Payables and other liabilities: | | | | |
| Investments purchased | | | 4,479,495 | |
| Shares of beneficial interest redeemed | | | 3,188,964 | |
| Transfer and shareholder servicing agent fees | | | 348,863 | |
| Distribution and service plan fees | | | 290,641 | |
| Shareholder communications | | | 125,090 | |
| Trustees’ compensation | | | 57,852 | |
| Other | |
| 28,546
|
|
| Total liabilities | | | 8,519,451 | |
| Net Assets | | $
| 1,451,912,112
|
|
| Composition of Net Assets | | | |
| Par value of shares of beneficial interest | | $ | 107,455 | |
| Additional paid-in capital | | | 1,698,333,011 | |
| Accumulated net investment income | | | 1,866,898 | |
| Accumulated net realized loss on investments | | | (573,483,089 | ) |
| Net unrealized appreciation on investments | |
| 325,087,837
|
|
| Net Assets | | $
| 1,451,912,112
|
|
| | | | |
| 20 | | | | OPPENHEIMER MAIN STREET SELECT FUND |
| | | | |
| Net Asset Value Per Share | | | |
| Class A Shares: | | | | |
| Net asset value and redemption price per share (based on net assets of $962,017,276 and 70,159,632 shares of beneficial interest outstanding) | | $ | 13.71 | |
| Maximum offering price per share (net asset value plus sales charge of 5.75% of offering price) | | $ | 14.55 | |
| Class B Shares: | | | | |
| Net asset value, redemption price (excludes applicable contingent deferred sales charge) and offering price per share (based on net assets of $93,397,210 and 7,268,688 shares of beneficial interest outstanding) | | $ | 12.85 | |
| Class C Shares: | | | | |
| Net asset value, redemption price (excludes applicable contingent deferred sales charge) and offering price per share (based on net assets of $241,729,867 and 18,661,411 shares of beneficial interest outstanding) | | $ | 12.95 | |
| Class N Shares: | | | | |
| Net asset value, redemption price (excludes applicable contingent deferred sales charge) and offering price per share (based on net assets of $90,630,506 and 6,766,326 shares of beneficial interest outstanding) | | $ | 13.39 | |
| Class Y Shares: | | | | |
| Net asset value, redemption price and offering price per share (based on net assets of $64,137,253 and 4,598,698 shares of beneficial interest outstanding) | | $ | 13.95 | |
See accompanying Notes to Financial Statements.
| | | | |
| 21 | | | | OPPENHEIMER MAIN STREET SELECT FUND |
STATEMENT OF OPERATIONS For the Year Ended July 31, 2012
| | | | |
| Investment Income | | | |
| Dividends: | | | | |
| Unaffiliated companies | | $ | 23,392,111 | |
| Affiliated companies | | | 33,818 | |
| Interest | | | 842 | |
| Other income | |
| 44,859
|
|
| Total investment income | | | 23,471,630 | |
| Expenses | | | |
| Management fees | | | 9,458,973 | |
| Distribution and service plan fees: | | | | |
| Class A | | | 2,307,598 | |
| Class B | | | 1,036,261 | |
| Class C | | | 2,413,321 | |
| Class N | | | 445,890 | |
| Transfer and shareholder servicing agent fees: | | | | |
| Class A | | | 2,712,931 | |
| Class B | | | 522,974 | |
| Class C | | | 669,439 | |
| Class N | | | 325,047 | |
| Class Y | | | 150,338 | |
| Shareholder communications: | | | | |
| Class A | | | 241,743 | |
| Class B | | | 54,658 | |
| Class C | | | 59,453 | |
| Class N | | | 11,298 | |
| Class Y | | | 15,727 | |
| Trustees’ compensation | | | 67,735 | |
| Custodian fees and expenses | | | 9,025 | |
| Administration service fees | | | 1,500 | |
| Other | |
| 209,879
|
|
| Total expenses | | | 20,713,790 | |
| Less waivers and reimbursements of expenses | |
| (176,107
| )
|
| Net expenses | | | 20,537,683 | |
| Net Investment Income | | | 2,933,947 | |
| | | | |
| Realized and Unrealized Gain | | | |
| Net realized gain on investments from unaffiliated companies | | | 49,804,113 | |
| Net change in unrealized appreciation/depreciation on investments | | | 72,591,557 | |
| Net Increase in Net Assets Resulting from Operations | | $
| 125,329,617
|
|
See accompanying Notes to Financial Statements.
| | | | |
| 22 | | | | OPPENHEIMER MAIN STREET SELECT FUND |
STATEMENTS OF CHANGES IN NET ASSETS
| | | | | | | | |
| | | Year Ended
July 31,
2012 | | | Year Ended
July 29,
20111 | |
| Operations | | | | | | |
| Net investment income (loss) | | $ | 2,933,947 | | | $ | (1,280,954 | ) |
| Net realized gain | | | 49,804,113 | | | | 149,043,479 | |
| Net change in unrealized appreciation/depreciation | |
| 72,591,557
|
| |
| 49,458,514
|
|
| Net increase in net assets resulting from operations | | | 125,329,617 | | | | 197,221,039 | |
| Dividends and/or Distributions to Shareholders | | | | | | |
| Dividends from net investment income: | | | | | | | | |
| Class A | | | (1,809,690 | ) | | | — | |
| Class B | | | — | | | | — | |
| Class C | | | — | | | | — | |
| Class N | | | — | | | | — | |
| Class Y | |
| (281,769
| )
| |
| —
|
|
| | | | (2,091,459 | ) | | | — | |
| Beneficial Interest Transactions | | | | | | |
Net increase (decrease) in net assets resulting from beneficial
interest transactions: | | | | | |
| Class A | | | (108,466,754 | ) | | | (166,334,483 | ) |
| Class B | | | (35,301,046 | ) | | | (47,373,367 | ) |
| Class C | | | (43,680,530 | ) | | | (49,021,470 | ) |
| Class N | | | (12,197,349 | ) | | | (13,592,155 | ) |
| Class Y | |
| 1,811,660
|
| |
| 3,357,976
|
|
| | | | (197,834,019 | ) | | | (272,963,499 | ) |
| Net Assets | | | | | | |
| Total decrease | | | (74,595,861 | ) | | | (75,742,460 | ) |
| Beginning of period | |
| 1,526,507,973
|
| |
| 1,602,250,433
|
|
End of period (including accumulated net investment income
of $1,866,898 and $45,001, respectively) | | $
| 1,451,912,112
|
| | $
| 1,526,507,973
|
|
1. July 29, 2011 represents the last business day of the Fund’s 2011 fiscal year. See Note 1 of the accompanying Notes.
See accompanying Notes to Financial Statements.
| | | | |
| 23 | | | | OPPENHEIMER MAIN STREET SELECT FUND |
FINANCIAL HIGHLIGHTS
| | | | | | | | | | | | | | | | | | | | |
| | | Year Ended
July 31, | | | Year Ended
July 29, | | | Year Ended
July 30, | | | Year Ended July 31, | |
| Class A | | 2012 | | | 20111 | | | 20101 | | | 2009 | | | 2008 | |
| | | | | | | | | | | | | | | | | | | | | |
| Per Share Operating Data | | | | | | | | | | | | | | | |
| Net asset value, beginning of period | | $ | 12.52 | | | | $ 11.11 | | | $ | 9.81 | | | $ | 11.90 | | | $ | 15.35 | |
| Income (loss) from investment operations: | | | | | | | | | | | | | | | | | | | | |
| Net investment income2 | | | .05 | | | | .02 | | | | .05 | | | | .09 | | | | .10 | |
| Net realized and unrealized gain (loss) | |
| 1.16
|
| |
| 1.39
|
| |
| 1.29
|
| |
| (2.08
| )
| |
| (1.98
| )
|
| Total from investment operations | | | 1.21 | | | | 1.41 | | | | 1.34 | | | | (1.99 | ) | | | (1.88 | ) |
| Dividends and/or distributions to shareholders: | | | | | | | | | | | | | | | | | |
| Dividends from net investment income | | | (.02 | ) | | | — | | | | (.03 | ) | | | (.07 | ) | | | (.12 | ) |
| Tax return of capital distribution | | | — | | | | — | | | | (.01 | ) | | | — | | | | — | |
| Distributions from net realized gain | |
| —
|
| |
| —
|
| |
| —
|
| |
| (.03
| )
| |
| (1.45
| )
|
| Total dividends and/or distributions to shareholders | | | (.02 | ) | | | — | | | | (.04 | ) | | | (.10 | ) | | | (1.57 | ) |
| Net asset value, end of period | | $
| 13.71
|
| |
| $12.52
|
| | $
| 11.11
|
| | $
| 9.81
|
| | $
| 11.90
|
|
| Total Return, at Net Asset Value3 | | | 9.73 | % | | | 12.69 | % | | | 13.69 | % | | | (16.56 | )% | | | (13.62 | )% |
| | | | | | | | | | | | | | | | | | | | | |
| Ratios/Supplemental Data | | | | | | | | | | | | | | | |
| Net assets, end of period (in thousands) | | | $962,017 | | | | $ 988,188 | | | | $1,025,633 | | | | $1,024,470 | | | | $1,853,930 | |
| Average net assets (in thousands) | | | $940,509 | | | | $1,063,673 | | | | $1,065,511 | | | | $1,088,256 | | | | $2,282,800 | |
| Ratios to average net assets:4 | | | | | | | | | | | | | | | | | | | | |
| Net investment income | | | 0.40 | % | | | 0.13 | % | | | 0.44 | % | | | 0.95 | % | | | 0.69 | % |
| Total expenses5 | | | 1.24 | % | | | 1.22 | % | | | 1.25 | % | | | 1.30 | % | | | 1.12 | % |
| Expenses after payments, waivers and/or reimbursements and reduction to custodian expenses | | | 1.24 | % | | | 1.22 | % | | | 1.25 | % | | | 1.24 | % | | | 1.12 | % |
| Portfolio turnover rate | | | 37 | % | | | 58 | % | | | 66 | % | | | 124 | % | | | 146 | % |
1. July 29, 2011 and July 30, 2010 represent the last business days of the Fund’s respective reporting periods. See Note 1 of the accompanying Notes.
2. Per share amounts calculated based on the average shares outstanding during the period.
3. Assumes an initial investment on the business day before the first day of the fiscal period, with all dividends and distributions reinvested in additional shares on the reinvestment date, and redemption at the net asset value calculated on the last business day of the fiscal period. Sales charges are not reflected in the total returns. Total returns are not annualized for periods less than one full year. Returns do not reflect the deduction of taxes that a shareholder would pay on fund distributions or the redemption of fund shares.
4. Annualized for periods less than one full year.
5. Total expenses including indirect expenses from affiliated fund were as follows:
| | | | |
| Year Ended July 31, 2012 | | | 1.24 | % |
| Year Ended July 29, 2011 | | | 1.22 | % |
| Year Ended July 30, 2010 | | | 1.25 | % |
| Year Ended July 31, 2009 | | | 1.30 | % |
| Year Ended July 31, 2008 | | | 1.12 | % |
See accompanying Notes to Financial Statements.
| | | | |
| 24 | | | | OPPENHEIMER MAIN STREET SELECT FUND |
| | | | | | | | | | | | | | | | | | | | |
| | | Year Ended
July 31, | | | Year Ended
July 29, | | | Year Ended
July 30, | | | Year Ended July 31, | |
| Class B | | 2012 | | | 20111 | | | 20101 | | | 2009 | | | 2008 | |
| | | | | | | | | | | | | | | | | | | | | |
| Per Share Operating Data | | | | | | | | | | | | | | | |
| Net asset value, beginning of period | | $ | 11.81 | | | $ | 10.56 | | | $ | 9.36 | | | $ | 11.36 | | | $ | 14.71 | |
| Income (loss) from investment operations: | | | | | | | | | | | | | | | | | |
| Net investment income (loss)2 | | | (.05 | ) | | | (.08 | ) | | | (.04 | ) | | | .01 | | | | (.01 | ) |
| Net realized and unrealized gain (loss) | |
| 1.09
|
| |
| 1.33
|
| |
| 1.24
|
| |
| (1.98
| )
| |
| (1.89
| )
|
| Total from investment operations | | | 1.04 | | | | 1.25 | | | | 1.20 | | | | (1.97 | ) | | | (1.90 | ) |
| Dividends and/or distributions to shareholders: | | | | | | | | | | | | | | | | | |
| Dividends from net investment income | | | — | | | | — | | | | — | | | | — | | | | — | |
| Tax return of capital distribution | | | — | | | | — | | | | — | | | | — | | | | — | |
| Distributions from net realized gain | |
| —
|
| |
| —
|
| |
| —
|
| |
| (.03
| )
| |
| (1.45
| )
|
| Total dividends and/or distributions to shareholders | | | — | | | | — | | | | — | | | | (.03 | ) | | | (1.45 | ) |
| Net asset value, end of period | | $
| 12.85
|
| | $
| 11.81
|
| | $
| 10.56
|
| | $
| 9.36
|
| | $
| 11.36
|
|
| Total Return, at Net Asset Value3 | | | 8.81 | % | | | 11.84 | % | | | 12.82 | % | | | (17.32 | )% | | | (14.29 | )% |
| | | | | | | | | | | | | | | | | | | | | |
| Ratios/Supplemental Data | | | | | | | | | | | | | | | |
| Net assets, end of period (in thousands) | | | $ 93,397 | | | | $120,245 | | | | $150,292 | | | | $185,921 | | | | $307,836 | |
| Average net assets (in thousands) | | | $103,801 | | | | $141,973 | | | | $172,970 | | | | $196,338 | | | | $418,258 | |
| Ratios to average net assets:4 | | | | | | | | | | | | | | | | | | | | |
| Net investment income (loss) | | | (0.44 | )% | | | (0.69 | )% | | | (0.35 | )% | | | 0.16 | % | | | (0.07 | )% |
| Total expenses5 | | | 2.23 | % | | | 2.20 | % | | | 2.23 | % | | | 2.18 | % | | | 1.90 | % |
| Expenses after payments, waivers and/or reimbursements and reduction to custodian expenses | | | 2.08 | % | | | 2.05 | % | | | 2.06 | % | | | 2.04 | % | | | 1.90 | % |
| Portfolio turnover rate | | | 37 | % | | | 58 | % | | | 66 | % | | | 124 | % | | | 146 | % |
1. July 29, 2011 and July 30, 2010 represent the last business days of the Fund’s respective reporting periods. See Note 1 of the accompanying Notes.
2. Per share amounts calculated based on the average shares outstanding during the period.
3. Assumes an initial investment on the business day before the first day of the fiscal period, with all dividends and distributions reinvested in additional shares on the reinvestment date, and redemption at the net asset value calculated on the last business day of the fiscal period. Sales charges are not reflected in the total returns. Total returns are not annualized for periods less than one full year. Returns do not reflect the deduction of taxes that a shareholder would pay on fund distributions or the redemption of fund shares.
4. Annualized for periods less than one full year.
5. Total expenses including indirect expenses from affiliated fund were as follows:
| | | | |
| Year Ended July 31, 2012 | | | 2.23 | % |
| Year Ended July 29, 2011 | | | 2.20 | % |
| Year Ended July 30, 2010 | | | 2.23 | % |
| Year Ended July 31, 2009 | | | 2.18 | % |
| Year Ended July 31, 2008 | | | 1.90 | % |
See accompanying Notes to Financial Statements.
| | | | |
| 25 | | | | OPPENHEIMER MAIN STREET SELECT FUND |
FINANCIAL HIGHLIGHTS Continued
| | | | | | | | | | | | | | | | | | | | |
| | | Year Ended
July 31, | | | Year Ended
July 29, | | | Year Ended
July 30, | | | Year Ended July 31, | |
| Class C | | 2012 | | | 20111 | | | 20101 | | | 2009 | | | 2008 | |
| | | | | | | | | | | | | | | | | | | | | |
| Per Share Operating Data | | | | | | | | | | | | | | | |
| Net asset value, beginning of period | | $ | 11.90 | | | $ | 10.63 | | | $ | 9.42 | | | $ | 11.41 | | | $ | 14.78 | |
| Income (loss) from investment operations: | | | | | | | | | | | | | | | | | |
| Net investment income (loss)2 | | | (.04 | ) | | | (.07 | ) | | | (.03 | ) | | | .02 | | | | — | 3 |
| Net realized and unrealized gain (loss) | |
| 1.09
|
| |
| 1.34
|
| |
| 1.24
|
| |
| (1.98
| )
| |
| (1.90
| )
|
| Total from investment operations | | | 1.05 | | | | 1.27 | | | | 1.21 | | | | (1.96 | ) | | | (1.90 | ) |
| Dividends and/or distributions to shareholders: | | | | | | | | | | | | | | | | | |
| Dividends from net investment income | | | — | | | | — | | | | — | | | | — | | | | (.02 | ) |
| Tax return of capital distribution | | | — | | | | — | | | | — | | | | — | | | | — | |
| Distributions from net realized gain | |
| —
|
| |
| —
|
| |
| —
|
| |
| (.03
| )
| |
| (1.45
| )
|
| Total dividends and/or distributions to shareholders | | | — | | | | — | | | | — | | | | (.03 | ) | | | (1.47 | ) |
| Net asset value, end of period | | $
| 12.95
|
| | $
| 11.90
|
| | $
| 10.63
|
| | $
| 9.42
|
| | $
| 11.41
|
|
| Total Return, at Net Asset Value4 | | | 8.82 | % | | | 11.95 | % | | | 12.85 | % | | | (17.16 | )% | | | (14.24 | )% |
| | | | | | | | | | | | | | | | | | | | | |
| Ratios/Supplemental Data | | | | | | | | | | | | | | | |
| Net assets, end of period (in thousands) | | | $241,730 | | | | $266,186 | | | | $282,261 | | | | $297,329 | | | | $479,789 | |
| Average net assets (in thousands) | | | $241,841 | | | | $290,329 | | | | $299,670 | | | | $307,891 | | | | $604,615 | |
| Ratios to average net assets:5 | | | | | | | | | | | | | | | | | | | | |
| Net investment income (loss) | | | (0.34 | )% | | | (0.60 | )% | | | (0.30 | )% | | | 0.21 | % | | | (0.01 | )% |
| Total expenses6 | | | 1.98 | % | | | 1.95 | % | | | 2.00 | % | | | 2.02 | % | | | 1.83 | % |
| Expenses after payments, waivers and/or reimbursements and reduction to custodian expenses | | | 1.98 | % | | | 1.95 | % | | | 2.00 | % | | | 1.99 | % | | | 1.83 | % |
| Portfolio turnover rate | | | 37 | % | | | 58 | % | | | 66 | % | | | 124 | % | | | 146 | % |
1. July 29, 2011 and July 30, 2010 represent the last business days of the Fund’s respective reporting periods. See Note 1 of the accompanying Notes.
2. Per share amounts calculated based on the average shares outstanding during the period.
3. Less than $0.005 per share.
4. Assumes an initial investment on the business day before the first day of the fiscal period, with all dividends and distributions reinvested in additional shares on the reinvestment date, and redemption at the net asset value calculated on the last business day of the fiscal period. Sales charges are not reflected in the total returns. Total returns are not annualized for periods less than one full year. Returns do not reflect the deduction of taxes that a shareholder would pay on fund distributions or the redemption of fund shares.
5. Annualized for periods less than one full year.
6. Total expenses including indirect expenses from affiliated fund were as follows:
| | | | |
| Year Ended July 31, 2012 | | | 1.98 | % |
| Year Ended July 29, 2011 | | | 1.95 | % |
| Year Ended July 30, 2010 | | | 2.00 | % |
| Year Ended July 31, 2009 | | | 2.02 | % |
| Year Ended July 31, 2008 | | | 1.83 | % |
See accompanying Notes to Financial Statements.
| | | | |
| 26 | | | | OPPENHEIMER MAIN STREET SELECT FUND |
| | | | | | | | | | | | | | | | | | | | |
| | | Year Ended
July 31, | | | Year Ended
July 29, | | | Year Ended
July 30, | | | Year Ended July 31, | |
| Class N | | 2012 | | | 20111 | | | 20101 | | | 2009 | | | 2008 | |
| | | | | | | | | | | | | | | | | | | | | |
| Per Share Operating Data | | | | | | | | | | | | | | | |
| Net asset value, beginning of period | | $ | 12.25 | | | $ | 10.89 | | | $ | 9.62 | | | $ | 11.69 | | | $ | 15.12 | |
| Income (loss) from investment operations: | | | | | | | | | | | | | | | | | |
| Net investment income (loss)2 | | | .01 | | | | (.02 | ) | | | .02 | | | | .06 | | | | .05 | |
| Net realized and unrealized gain (loss) | |
| 1.13
|
| |
| 1.38
|
| |
| 1.27
|
| |
| (2.04
| )
| |
| (1.94
| )
|
| Total from investment operations | | | 1.14 | | | | 1.36 | | | | 1.29 | | | | (1.98 | ) | | | (1.89 | ) |
| Dividends and/or distributions to shareholders: | | | | | | | | | | | | | | | | | |
| Dividends from net investment income | | | — | | | | — | | | | (.01 | ) | | | (.06 | ) | | | (.09 | ) |
| Tax return of capital distribution | | | — | | | | — | | | | (.01 | ) | | | — | | | | — | |
| Distributions from net realized gain | |
| —
|
| |
| —
|
| |
| —
|
| |
| (.03
| )
| |
| (1.45
| )
|
| Total dividends and/or distributions to shareholders | | | — | | | | — | | | | (.02 | ) | | | (.09 | ) | | | (1.54 | ) |
| Net asset value, end of period | | $
| 13.39
|
| | $
| 12.25
|
| | $
| 10.89
|
| | $
| 9.62
|
| | $
| 11.69
|
|
| Total Return, at Net Asset Value3 | | | 9.31 | % | | | 12.49 | % | | | 13.42 | % | | | (16.83 | )% | | | (13.91 | )% |
| | | | | | | | | | | | | | | | | | | | | |
| Ratios/Supplemental Data | | | | | | | | | | | | | | | |
| Net assets, end of period (in thousands) | | | $90,631 | | | | $ 94,814 | | | | $96,516 | | | | $95,203 | | | | $129,855 | |
| Average net assets (in thousands) | | | $90,581 | | | | $101,524 | | | | $99,801 | | | | $92,119 | | | | $141,529 | |
| Ratios to average net assets:4 | | | | | | | | | | | | | | | | | | | | |
| Net investment income (loss) | | | 0.10 | % | | | (0.16 | )% | | | 0.18 | % | | | 0.68 | % | | | 0.38 | % |
| Total expenses5 | | | 1.54 | % | | | 1.51 | % | | | 1.56 | % | | | 1.61 | % | | | 1.43 | % |
| Expenses after payments, waivers and/or reimbursements and reduction to custodian expenses | | | 1.54 | % | | | 1.50 | % | | | 1.52 | % | | | 1.51 | % | | | 1.43 | % |
| Portfolio turnover rate | | | 37 | % | | | 58 | % | | | 66 | % | | | 124 | % | | | 146 | % |
1. July 29, 2011 and July 30, 2010 represent the last business days of the Fund’s respective reporting periods. See Note 1 of the accompanying Notes.
2. Per share amounts calculated based on the average shares outstanding during the period.
3. Assumes an initial investment on the business day before the first day of the fiscal period, with all dividends and distributions reinvested in additional shares on the reinvestment date, and redemption at the net asset value calculated on the last business day of the fiscal period. Sales charges are not reflected in the total returns. Total returns are not annualized for periods less than one full year. Returns do not reflect the deduction of taxes that a shareholder would pay on fund distributions or the redemption of fund shares.
4. Annualized for periods less than one full year.
5. Total expenses including indirect expenses from affiliated fund were as follows:
| | | | |
| Year Ended July 31, 2012 | | | 1.54 | % |
| Year Ended July 29, 2011 | | | 1.51 | % |
| Year Ended July 30, 2010 | | | 1.56 | % |
| Year Ended July 31, 2009 | | | 1.61 | % |
| Year Ended July 31, 2008 | | | 1.43 | % |
See accompanying Notes to Financial Statements.
| | | | |
| 27 | | | | OPPENHEIMER MAIN STREET SELECT FUND |
FINANCIAL HIGHLIGHTS Continued
| | | | | | | | | | | | | | | | | | | | |
| | | Year Ended
July 31, | | | Year Ended
July 29, | | | Year Ended
July 30, | | | Year Ended July 31, | |
| Class Y | | 2012 | | | 20111 | | | 20101 | | | 2009 | | | 2008 | |
| | | | | | | | | | | | | | | | | | | | | |
| Per Share Operating Data | | | | | | | | | | | | | | | |
| Net asset value, beginning of period | | $ | 12.75 | | | $ | 11.27 | | | $ | 9.94 | | | $ | 12.11 | | | $ | 15.60 | |
| Income (loss) from investment operations: | | | | | | | | | | | | | | | | | |
| Net investment income2 | | | .09 | | | | .06 | | | | .10 | | | | .13 | | | | .15 | |
| Net realized and unrealized gain (loss) | |
| 1.17
|
| |
| 1.42
|
| |
| 1.31
|
| |
| (2.13
| )
| |
| (2.00
| )
|
| Total from investment operations | | | 1.26 | | | | 1.48 | | | | 1.41 | | | | (2.00 | ) | | | (1.85 | ) |
| Dividends and/or distributions to shareholders: | | | | | | | | | | | | | | | | | |
| Dividends from net investment income | | | (.06 | ) | | | — | | | | (.06 | ) | | | (.14 | ) | | | (.19 | ) |
| Tax return of capital distribution | | | — | | | | — | | | | (.02 | ) | | | — | | | | — | |
| Distributions from net realized gain | |
| —
|
| |
| —
|
| |
| —
|
| |
| (.03
| )
| |
| (1.45
| )
|
| Total dividends and/or distributions to shareholders | | | (.06 | ) | | | — | | | | (.08 | ) | | | (.17 | ) | | | (1.64 | ) |
| Net asset value, end of period | | $
| 13.95
|
| | $
| 12.75
|
| | $
| 11.27
|
| | $
| 9.94
|
| | $
| 12.11
|
|
| Total Return, at Net Asset Value3 | | | 10.00 | % | | | 13.13 | % | | | 14.25 | % | | | (16.22 | )% | | | (13.26 | )% |
| | | | | | | | | | | | | | | | | | | | | |
| Ratios/Supplemental Data | | | | | | | | | | | | | | | |
| Net assets, end of period (in thousands) | | | $64,137 | | | | $57,075 | | | | $ 47,548 | | | | $161,707 | | | | $357,648 | |
| Average net assets (in thousands) | | | $57,816 | | | | $55,754 | | | | $125,884 | | | | $187,451 | | | | $368,893 | |
| Ratios to average net assets:4 | | | | | | | | | | | | | | | | | | | | |
| Net investment income | | | 0.66 | % | | | 0.45 | % | | | 0.90 | % | | | 1.40 | % | | | 1.11 | % |
| Total expenses5 | | | 0.97 | % | | | 0.87 | % | | | 0.80 | % | | | 0.78 | % | | | 0.69 | % |
| Expenses after payments, waivers and/or reimbursements and reduction to custodian expenses | | | 0.97 | % | | | 0.87 | % | | | 0.80 | % | | | 0.78 | % | | | 0.69 | % |
| Portfolio turnover rate | | | 37 | % | | | 58 | % | | | 66 | % | | | 124 | % | | | 146 | % |
1. July 29, 2011 and July 30, 2010 represent the last business days of the Fund’s respective reporting periods. See Note 1 of the accompanying Notes.
2. Per share amounts calculated based on the average shares outstanding during the period.
3. Assumes an initial investment on the business day before the first day of the fiscal period, with all dividends and distributions reinvested in additional shares on the reinvestment date, and redemption at the net asset value calculated on the last business day of the fiscal period. Sales charges are not reflected in the total returns. Total returns are not annualized for periods less than one full year. Returns do not reflect the deduction of taxes that a shareholder would pay on fund distributions or the redemption of fund shares.
4. Annualized for periods less than one full year.
5. Total expenses including indirect expenses from affiliated fund were as follows:
| | | | |
| Year Ended July 31, 2012 | | | 0.97 | % |
| Year Ended July 29, 2011 | | | 0.87 | % |
| Year Ended July 30, 2010 | | | 0.80 | % |
| Year Ended July 31, 2009 | | | 0.78 | % |
| Year Ended July 31, 2008 | | | 0.69 | % |
See accompanying Notes to Financial Statements.
| | | | |
| 28 | | | | OPPENHEIMER MAIN STREET SELECT FUND |
NOTES TO FINANCIAL STATEMENTS
1. Significant Accounting Policies
Oppenheimer Main Street Select Fund (the “Fund”) is registered under the Investment Company Act of 1940, as amended, as an open-end management investment company. The Fund’s investment objective is to seek long-term capital appreciation. The Fund’s investment adviser is OppenheimerFunds, Inc. (the “Manager”).
The Fund offers Class A, Class C, Class N and Class Y shares, and previously offered Class B shares for new purchase through June 29, 2012. Subsequent to that date, no new purchases of Class B shares will be permitted, however reinvestment of dividend and/or capital gain distributions and exchanges of Class B shares into and from other Oppenheimer funds will be allowed. Class A shares are sold at their offering price, which is normally net asset value plus a front-end sales charge. Class C and Class N shares are sold, and Class B shares were sold, without a front-end sales charge but may be subject to a contingent deferred sales charge (“CDSC”). Class N shares are sold only through retirement plans. Retirement plans that offer Class N shares may impose charges on those accounts. Class Y shares are sold to certain institutional investors or intermediaries without either a front-end sales charge or a CDSC, however, the intermediaries may impose charges on their accountholders who beneficially own Class Y shares. All classes of shares have identical rights and voting privileges with respect to the Fund in general and exclusive voting rights on matters that affect that class alone. Earnings, net assets and net asset value per share may differ due to each class having its own expenses, such as transfer and shareholder servicing agent fees and shareholder communications, directly attributable to that class. Class A, B, C and N shares have separate distribution and/or service plans under which they pay fees. Class Y shares do not pay such fees. Class B shares will automatically convert to Class A shares 72 months after the date of purchase.
The following is a summary of significant accounting policies consistently followed by the Fund.
Previous Annual Periods. The last day of certain of the Fund’s prior fiscal years was the last day the New York Stock Exchange was open for trading. The Fund’s financial statements have been presented through that date to maintain consistency with the Fund’s net asset value calculations used for shareholder transactions.
Investment in Oppenheimer Institutional Money Market Fund. The Fund is permitted to invest daily available cash balances in an affiliated money market fund. The Fund may invest the available cash in Class E shares of Oppenheimer Institutional Money Market Fund (“IMMF”) to seek current income while preserving liquidity. IMMF is a registered open-end management investment company, regulated as a money market fund under the Investment Company Act of 1940, as amended. The Manager is also the investment adviser of IMMF. When applicable, the Fund’s investment in IMMF is included in the Statement of Investments. Shares of IMMF are valued at their net asset value per share. As a shareholder, the Fund is subject to its proportional share of IMMF’s Class E expenses, including its management fee. The Manager will waive fees and/or reimburse Fund expenses in an amount equal to the indirect management fees incurred through the Fund’s investment in IMMF.
| | | | |
| 29 | | | | OPPENHEIMER MAIN STREET SELECT FUND |
NOTES TO FINANCIAL STATEMENTS Continued
1. Significant Accounting Policies Continued
Allocation of Income, Expenses, Gains and Losses. Income, expenses (other than those attributable to a specific class), gains and losses are allocated on a daily basis to each class of shares based upon the relative proportion of net assets represented by such class. Operating expenses directly attributable to a specific class are charged against the operations of that class.
Federal Taxes. The Fund intends to comply with provisions of the Internal Revenue Code applicable to regulated investment companies and to distribute substantially all of its investment company taxable income, including any net realized gain on investments not offset by capital loss carryforwards, if any, to shareholders. Therefore, no federal income or excise tax provision is required. The Fund files income tax returns in U.S. federal and applicable state jurisdictions. The statute of limitations on the Fund’s tax return filings generally remain open for the three preceding fiscal reporting period ends.
The tax components of capital shown in the following table represent distribution requirements the Fund must satisfy under the income tax regulations, losses the Fund may be able to offset against income and gains realized in future years and unrealized appreciation or depreciation of securities and other investments for federal income tax purposes.
| | | | | | | | | | |
Undistributed
Net Investment
Income | | Undistributed
Long-Term
Gain | | | Accumulated
Loss
Carryforward1,2,3 | | | Net Unrealized
Appreciation
Based on Cost of
Securities and Other
Investments for Federal
Income Tax Purposes |
| $1,924,750 | | | $— | | | | $573,400,257 | | | $325,005,004 |
1. As of July 31, 2012, the Fund had $573,400,257 of net capital loss carryforwards available to offset future realized capital gains, if any, and thereby reduce future taxable gain distributions. Details of the capital loss carryforwards are included in the table below. Capital loss carryovers with no expiration, if any, must be utilized prior to those with expiration dates.
| | | | |
| Expiring | |
| 2017 | | $ | 179,039,334 | |
| 2018 | | | 394,360,923 | |
| | |
|
|
|
| Total | | $ | 573,400,257 | |
| | |
|
|
|
2. During the fiscal year ended July 31, 2012, the Fund utilized $49,789,800 of capital loss carryforward to offset capital gains realized in that fiscal year.
3. During the fiscal year ended July 29, 2011, the Fund utilized $149,249,749 of capital loss carryforward to offset capital gains realized in that fiscal year.
Net investment income (loss) and net realized gain (loss) may differ for financial statement and tax purposes. The character of dividends and distributions made during the fiscal year from net investment income or net realized gains may differ from their ultimate characterization for federal income tax purposes. Also, due to timing of dividends and distributions, the fiscal year in which amounts are distributed may differ from the fiscal year in which the income or net realized gain was recorded by the Fund.
| | | | |
| 30 | | | | OPPENHEIMER MAIN STREET SELECT FUND |
Accordingly, the following amounts have been reclassified for July 31, 2012. Net assets of the Fund were unaffected by the reclassifications.
| | | | | | | | |
Reduction to
Paid-in Capital | | Increase
to Accumulated
Net Investment
Income | | | Increase
to Accumulated Net
Realized Loss
on Investments | |
| $40,914 | | $ | 979,409 | | | $ | 938,495 | |
The tax character of distributions paid during the years ended July 31, 2012 and July 31, 2011 was as follows:
| | | | | | | | |
| | | Year Ended
July 31, 2012 | | | Year Ended
July 31, 2011 | |
| Distributions paid from: | | | | | | | | |
| Ordinary income | | $ | 2,091,459 | | | $ | — | |
The aggregate cost of securities and other investments and the composition of unrealized appreciation and depreciation of securities and other investments for federal income tax purposes as of July 31, 2012 are noted in the following table. The primary difference between book and tax appreciation or depreciation of securities and other investments, if applicable, is attributable to the tax deferral of losses or tax realization of financial statement unrealized gain or loss.
| | | | |
| Federal tax cost of securities | | $ | 1,115,110,764 | |
| | |
|
|
|
| Gross unrealized appreciation | | $ | 360,756,764 | |
| Gross unrealized depreciation | | | (35,751,760 | ) |
| | |
|
|
|
| Net unrealized appreciation | | $ | 325,005,004 | |
| | |
|
|
|
Trustees’ Compensation. The Board of Trustees has adopted a compensation deferral plan for independent trustees that enables trustees to elect to defer receipt of all or a portion of the annual compensation they are entitled to receive from the Fund. For purposes of determining the amount owed to the Trustee under the plan, deferred amounts are treated as though equal dollar amounts had been invested in shares of the Fund or in other Oppenheimer funds selected by the Trustee. The Fund purchases shares of the funds selected for deferral by the Trustee in amounts equal to his or her deemed investment, resulting in a Fund asset equal to the deferred compensation liability. Such assets are included as a component of “Other” within the asset section of the Statement of Assets and Liabilities. Deferral of trustees’ fees under the plan will not affect the net assets of the Fund, and will not materially affect the Fund’s assets, liabilities or net investment income per share. Amounts will be deferred until distributed in accordance with the compensation deferral plan.
Dividends and Distributions to Shareholders. Dividends and distributions to shareholders, which are determined in accordance with income tax regulations and may differ from U.S. generally accepted accounting principles, are recorded on the ex-dividend date. Income and capital gain distributions, if any, are declared and paid annually or at other times as deemed necessary by the Manager.
| | | | |
| 31 | | | | OPPENHEIMER MAIN STREET SELECT FUND |
NOTES TO FINANCIAL STATEMENTS Continued
1. Significant Accounting Policies Continued
Investment Income. Dividend income is recorded on the ex-dividend date or upon ex-dividend notification in the case of certain foreign dividends where the ex-dividend date may have passed. Non-cash dividends included in dividend income, if any, are recorded at the fair market value of the securities received. Interest income is recognized on an accrual basis. Discount and premium, which are included in interest income on the Statement of Operations, are amortized or accreted daily.
Custodian Fees. “Custodian fees and expenses” in the Statement of Operations may include interest expense incurred by the Fund on any cash overdrafts of its custodian account during the period. Such cash overdrafts may result from the effects of failed trades in portfolio securities and from cash outflows resulting from unanticipated shareholder redemption activity. The Fund pays interest to its custodian on such cash overdrafts, to the extent they are not offset by positive cash balances maintained by the Fund, at a rate equal to the Federal Funds Rate plus 0.50%. The “Reduction to custodian expenses” line item, if applicable, represents earnings on cash balances maintained by the Fund during the period. Such interest expense and other custodian fees may be paid with these earnings.
Security Transactions. Security transactions are recorded on the trade date. Realized gains and losses on securities sold are determined on the basis of identified cost.
Indemnifications. The Fund’s organizational documents provide current and former trustees and officers with a limited indemnification against liabilities arising in connection with the performance of their duties to the Fund. In the normal course of business, the Fund may also enter into contracts that provide general indemnifications. The Fund’s maximum exposure under these arrangements is unknown as this would be dependent on future claims that may be made against the Fund. The risk of material loss from such claims is considered remote.
Other. The preparation of financial statements in conformity with accounting principles generally accepted in the United States of America requires management to make estimates and assumptions that affect the reported amounts of assets and liabilities and disclosure of contingent assets and liabilities at the date of the financial statements and the reported amounts of increases and decreases in net assets from operations during the reporting period. Actual results could differ from those estimates.
2. Securities Valuation
The Fund calculates the net asset value of its shares as of the close of the New York Stock Exchange (the “Exchange”), normally 4:00 P.M. Eastern time, on each day the Exchange is open for trading.
The Fund’s Board has adopted procedures for the valuation of the Fund’s securities and has delegated the day-to-day responsibility for valuation determinations under those procedures to the Manager. The Manager has established a Valuation Committee which is responsible for determining a “fair valuation” for any security for which market quotations
| | | | |
| 32 | | | | OPPENHEIMER MAIN STREET SELECT FUND |
are not “readily available.” The Valuation Committee’s fair valuation determinations are subject to review, approval and ratification by the Fund’s Board at its next regularly scheduled meeting covering the calendar quarter in which the fair valuation was determined.
Valuation Methods and Inputs
Securities are valued using unadjusted quoted market prices, when available, as supplied primarily by third party pricing services or dealers.
The following methodologies are used to determine the market value or the fair value of the types of securities described below:
Securities traded on a registered U.S. securities exchange (including exchange-traded derivatives other than futures and futures options) are valued based on the last sale price of the security reported on the principal exchange on which it is traded, prior to the time when the Fund’s assets are valued. In the absence of a sale, the security is valued at the last sale price on the prior trading day, if it is within the spread of the current day’s closing “bid” and “asked” prices, and if not, at the current day’s closing bid price. A security of a foreign issuer traded on a foreign exchange but not listed on a registered U.S. securities exchange is valued based on the last sale price on the principal exchange on which the security is traded, as identified by the third party pricing service used by the Manager, prior to the time when the Fund’s assets are valued. If the last sale price is unavailable, the security is valued at the most recent official closing price on the principal exchange on which it is traded. If the last sales price or official closing price for a foreign security is not available, the security is valued at the mean between the bid and asked price per the exchange or, if not available from the exchange, obtained from two dealers. If bid and asked prices are not available from either the exchange or two dealers, the security is valued by using one of the following methodologies (listed in order of priority); (1) using a bid from the exchange, (2) the mean between the bid and asked price as provided by a single dealer, or (3) a bid from a single dealer.
Shares of a registered investment company that are not traded on an exchange are valued at that investment company’s net asset value per share.
Corporate and government debt securities (of U.S. or foreign issuers) and municipal debt securities, event-linked bonds, loans, mortgage-backed securities, collateralized mortgage obligations, and asset-backed securities are valued at the mean between the “bid” and “asked” prices utilizing evaluated prices obtained from third party pricing services or broker-dealers who may use matrix pricing methods to determine the evaluated prices.
Short-term money market type debt securities with a remaining maturity of sixty days or less are valued at cost adjusted by the amortization of discount or premium to maturity (amortized cost), which approximates market value. Short-term debt securities with a remaining maturity in excess of sixty days are valued at the mean between the “bid” and “asked” prices utilizing evaluated prices obtained from third party pricing services or broker-dealers.
| | | | |
| 33 | | | | OPPENHEIMER MAIN STREET SELECT FUND |
NOTES TO FINANCIAL STATEMENTS Continued
2. Securities Valuation Continued
A description of the standard inputs that may generally be considered by the third party pricing vendors in determining their evaluated prices is provided below.
| | |
| Security Type | | Standard Inputs Generally Considered by Third-Party
Pricing Vendors |
| Corporate debt, government debt, municipal, mortgage-backed and asset-backed securities | | Reported trade data, broker-dealer price quotations, benchmark yields, issuer spreads on comparable securities, the credit quality, yield, maturity, and other appropriate factors. |
| Loans | | Information obtained from market participants regarding reported trade data and broker-dealer price quotations. |
| Event-linked bonds | | Information obtained from market participants regarding reported trade data and broker-dealer price quotations. |
If a market value or price cannot be determined for a security using the methodologies described above, or if, in the “good faith” opinion of the Manager, the market value or price obtained does not constitute a “readily available market quotation,” or a significant event has occurred that would materially affect the value of the security the security is fair valued either (i) by a standardized fair valuation methodology applicable to the security type or the significant event as previously approved by the Valuation Committee and the Fund’s Board or (ii) as determined in good faith by the Manager’s Valuation Committee. The Valuation Committee considers all relevant facts that are reasonably available, through either public information or information available to the Manager, when determining the fair value of a security. Fair value determinations by the Manager are subject to review, approval and ratification by the Fund’s Board at its next regularly scheduled meeting covering the calendar quarter in which the fair valuation was determined. Those fair valuation standardized methodologies include, but are not limited to, valuing securities at the last sale price or initially at cost and subsequently adjusting the value based on: changes in company specific fundamentals, changes in an appropriate securities index, or changes in the value of similar securities which may be further adjusted for any discounts related to security-specific resale restrictions. When possible, such methodologies use observable market inputs such as unadjusted quoted prices of similar securities, observable interest rates, currency rates and yield curves. The methodologies used for valuing securities are not necessarily an indication of the risks associated with investing in those securities nor can it be assured that the Fund can obtain the fair value assigned to a security if it were to sell the security.
To assess the continuing appropriateness of security valuations, the Manager, or its third party service provider who is subject to oversight by the Manager, regularly compares prior day prices, prices on comparable securities, and sale prices to the current day prices and challenges those prices exceeding certain tolerance levels with the third party pricing service or broker source. For those securities valued by fair valuations, whether through a standardized fair valuation methodology or a fair valuation determination, the Valuation Committee reviews and affirms the reasonableness of the valuations based on such
| | | | |
| 34 | | | | OPPENHEIMER MAIN STREET SELECT FUND |
methodologies and fair valuation determinations on a regular basis after considering all relevant information that is reasonably available.
Classifications
Each investment asset or liability of the Fund is assigned a level at measurement date based on the significance and source of the inputs to its valuation. Various data inputs are used in determining the value of each of the Fund’s investments as of the reporting period end. These data inputs are categorized in the following hierarchy under applicable financial accounting standards:
| 1) | | Level 1—unadjusted quoted prices in active markets for identical assets or liabilities (including securities actively traded on a securities exchange) |
| 2) | | Level 2—inputs other than unadjusted quoted prices that are observable for the asset or liability (such as unadjusted quoted prices for similar assets and market corroborated inputs such as interest rates, prepayment speeds, credit risks, etc.) |
| 3) | | Level 3—significant unobservable inputs (including the Manager’s own judgments about assumptions that market participants would use in pricing the asset or liability). |
The inputs used for valuing securities are not necessarily an indication of the risks associated with investing in those securities.
The table below categorizes amounts that are included in the Fund’s Statement of Assets and Liabilities as of July 31, 2012 based on valuation input level:
| | | | | | | | | | | | | | | | | | | | |
| | | Level 1—
Unadjusted
Quoted Prices | | Level 2—
Other Significant
Observable
Inputs | | Level 3—
Significant
Unobservable Inputs | | Value |
| Assets Table | | | | | | | | | | | | | | | | | | | | |
| Investments, at Value: | | | | | | | | | | | | | | | | | | | | |
| Common Stocks | | | | | | | | | | | | | | | | | | | | |
Consumer Discretionary | | | $ | 194,194,868 | | | | $ | — | | | | $ | — | | | | $ | 194,194,868 | |
Consumer Staples | | | | 126,404,214 | | | | | — | | | | | — | | | | | 126,404,214 | |
Energy | | | | 154,650,430 | | | | | — | | | | | — | | | | | 154,650,430 | |
Financials | | | | 244,403,511 | | | | | — | | | | | — | | | | | 244,403,511 | |
Health Care | | | | 129,204,757 | | | | | — | | | | | — | | | | | 129,204,757 | |
Industrials | | | | 191,985,350 | | | | | — | | | | | — | | | | | 191,985,350 | |
Information Technology | | | | 301,953,188 | | | | | — | | | | | — | | | | | 301,953,188 | |
Materials | | | | 21,129,958 | | | | | — | | | | | — | | | | | 21,129,958 | |
Telecommunication Services | | | | 44,114,086 | | | | | — | | | | | — | | | | | 44,114,086 | |
Utilities | | | | 16,868,827 | | | | | — | | | | | — | | | | | 16,868,827 | |
| Investment Company | | | | 15,206,579 | | | | | — | | | | | — | | | | | 15,206,579 | |
| | | |
|
|
|
| Total Assets | | | $ | 1,440,115,768 | | | | $ | — | | | | $ | — | | | | $ | 1,440,115,768 | |
| | | |
|
|
|
Currency contracts and forwards, if any, are reported at their unrealized appreciation/depreciation at measurement date, which represents the change in the contract’s value from trade date. Futures, if any, are reported at their variation margin at measurement date, which represents the amount due to/from the Fund at that date. All additional assets and liabilities included in the above table are reported at their market value at measurement date.
| | | | |
| 35 | | | | OPPENHEIMER MAIN STREET SELECT FUND |
NOTES TO FINANCIAL STATEMENTS Continued
2. Securities Valuation Continued
There have been no significant changes to the fair valuation methodologies of the Fund during the period.
3. Shares of Beneficial Interest
The Fund has authorized an unlimited number of $0.001 par value shares of beneficial interest of each class. Transactions in shares of beneficial interest were as follows:
| | | | | | | | | | | | | | | | |
| | | Year Ended July 31, 2012 | | | Year Ended July 29, 2011 | |
| | | Shares | | | Amount | | | Shares | | | Amount | |
| Class A | | | | | | | | | | | | | | | | |
| Sold | | | 8,522,552 | | | $ | 110,338,425 | | | | 12,433,873 | | | $ | 153,090,226 | |
| Dividends and/or distributions reinvested | | | 146,848 | | | | 1,748,956 | | | | — | | | | — | |
| Redeemed | | | (17,407,450 | ) | | | (220,554,135 | ) | | | (25,874,169 | ) | | | (319,424,709 | ) |
| | |
|
|
|
| Net decrease | | | (8,738,050 | ) | | $ | (108,466,754 | ) | | | (13,440,296 | ) | | $ | (166,334,483 | ) |
| | |
|
|
|
| | | | | | | | | | | | | | | | | |
| Class B | | | | | | | | | | | | | | | | |
| Sold | | | 818,078 | | | $ | 9,887,618 | | | | 1,194,863 | | | $ | 14,043,120 | |
| Dividends and/or distributions reinvested | | | — | | | | — | | | | — | | | | — | |
| Redeemed | | | (3,729,931 | ) | | | (45,188,664 | ) | | | (5,244,468 | ) | | | (61,416,487 | ) |
| | |
|
|
|
| Net decrease | | | (2,911,853 | ) | | $ | (35,301,046 | ) | | | (4,049,605 | ) | | $ | (47,373,367 | ) |
| | |
|
|
|
| | | | | | | | | | | | | | | | | |
| Class C | | | | | | | | | | | | | | | | |
| Sold | | | 1,786,282 | | | $ | 21,851,094 | | | | 2,348,124 | | | $ | 27,900,785 | |
| Dividends and/or distributions reinvested | | | — | | | | — | | | | — | | | | — | |
| Redeemed | | | (5,501,974 | ) | | | (65,531,624 | ) | | | (6,532,835 | ) | | | (76,922,255 | ) |
| | |
|
|
|
| Net decrease | | | (3,715,692 | ) | | $ | (43,680,530 | ) | | | (4,184,711 | ) | | $ | (49,021,470 | ) |
| | |
|
|
|
| | | | | | | | | | | | | | | | | |
| Class N | | | | | | | | | | | | | | | | |
| Sold | | | 1,497,364 | | | $ | 18,803,912 | | | | 1,495,386 | | | $ | 18,185,695 | |
| Dividends and/or distributions reinvested | | | — | | | | — | | | | — | | | | — | |
| Redeemed | | | (2,473,093 | ) | | | (31,001,261 | ) | | | (2,614,667 | ) | | | (31,777,850 | ) |
| | |
|
|
|
| Net decrease | | | (975,729 | ) | | $ | (12,197,349 | ) | | | (1,119,281 | ) | | $ | (13,592,155 | ) |
| | |
|
|
|
| | | | | | | | | | | | | | | | | |
| Class Y | | | | | | | | | | | | | | | | |
| Sold | | | 1,377,212 | | | $ | 18,032,752 | | | | 1,793,937 | | | $ | 22,669,234 | |
| Dividends and/or distributions reinvested | | | 22,842 | | | | 276,391 | | | | — | | | | — | |
| Redeemed | | | (1,278,746 | ) | | | (16,497,483 | ) | | | (1,537,045 | ) | | | (19,311,258 | ) |
| | |
|
|
|
| Net increase | | | 121,308 | | | $ | 1,811,660 | | | | 256,892 | | | $ | 3,357,976 | |
| | |
|
|
|
4. Purchases and Sales of Securities
The aggregate cost of purchases and proceeds from sales of securities, other than short-term obligations and investments in IMMF, for the year ended July 31, 2012, were as follows:
| | | | | | | | |
| | | Purchases | | | Sales | |
| Investment securities | | $ | 525,613,863 | | | $ | 738,442,720 | |
| | | | |
| 36 | | | | OPPENHEIMER MAIN STREET SELECT FUND |
5. Fees and Other Transactions with Affiliates
Management Fees. Under the investment advisory agreement, the Fund pays the Manager a management fee based on the daily net assets of the Fund at an annual rate as shown in the following table:
| | | | |
| Fee Schedule | |
| Up to $200 million | | | 0.75 | % |
| Next $200 million | | | 0.72 | |
| Next $200 million | | | 0.69 | |
| Next $200 million | | | 0.66 | |
| Next $4.2 billion | | | 0.60 | |
| Over $5 billion | | | 0.58 | |
Administration Service Fees. The Fund pays the Manager a fee of $1,500 per year for preparing and filing the Fund’s tax returns.
Transfer Agent Fees. OppenheimerFunds Services (“OFS”), a division of the Manager, acts as the transfer and shareholder servicing agent for the Fund. The Fund pays OFS a per account fee. For the year ended July 31, 2012, the Fund paid $4,187,676 to OFS for services to the Fund.
Additionally, Class Y shares are subject to minimum fees of $10,000 annually for assets of $10 million or more. The Class Y shares are subject to the minimum fees in the event that the per account fee does not equal or exceed the applicable minimum fees. OFS may voluntarily waive the minimum fees.
Distribution and Service Plan (12b-1) Fees. Under its General Distributor’s Agreement with the Fund, OppenheimerFunds Distributor, Inc. (the “Distributor”) acts as the Fund’s principal underwriter in the continuous public offering of the Fund’s classes of shares.
Service Plan for Class A Shares. The Fund has adopted a Service Plan (the “Plan”) for Class A shares under Rule 12b-1 of the Investment Company Act of 1940. Under the Plan, the Fund reimburses the Distributor for a portion of its costs incurred for services provided to accounts that hold Class A shares. Reimbursement is made periodically at an annual rate of up to 0.25% of the daily net assets of Class A shares of the Fund. The Distributor currently uses all of those fees to pay dealers, brokers, banks and other financial institutions periodically for providing personal service and maintenance of accounts of their customers that hold Class A shares. Any unreimbursed expenses the Distributor incurs with respect to Class A shares in any fiscal year cannot be recovered in subsequent periods. Fees incurred by the Fund under the Plan are detailed in the Statement of Operations.
Distribution and Service Plans for Class B, Class C and Class N Shares. The Fund has adopted Distribution and Service Plans (the “Plans”) for Class B, Class C and Class N shares under Rule 12b-1 of the Investment Company Act of 1940 to compensate the Distributor for its services in connection with the distribution of those shares and servicing accounts. Under the Plans, the Fund pays the Distributor an annual asset-based sales charge of 0.75% on Class B and Class C shares daily net assets and 0.25% on Class N shares daily net assets. The Distributor also receives a service fee of 0.25% per year under each plan. If either the Class B, Class C or Class N plan is terminated by the Fund or by the shareholders of a class, the Board of Trustees and its independent trustees must determine whether the
| | | | |
| 37 | | | | OPPENHEIMER MAIN STREET SELECT FUND |
NOTES TO FINANCIAL STATEMENTS Continued
5. Fees and Other Transactions with Affiliates Continued
Distributor shall be entitled to payment from the Fund of all or a portion of the service fee and/or asset-based sales charge in respect to shares sold prior to the effective date of such termination. Fees incurred by the Fund under the Plans are detailed in the Statement of Operations. The Distributor determines its uncompensated expenses under the Plans at calendar quarter ends. The Distributor’s aggregate uncompensated expenses under the Plans at June 30, 2012 were as follows:
| | | | |
| Class C | | $ | 8,126,733 | |
| Class N | | | 2,629,169 | |
Sales Charges. Front-end sales charges and contingent deferred sales charges (“CDSC”) do not represent expenses of the Fund. They are deducted from the proceeds of sales of Fund shares prior to investment or from redemption proceeds prior to remittance, as applicable. The sales charges retained by the Distributor from the sale of shares and the CDSC retained by the Distributor on the redemption of shares is shown in the following table for the period indicated.
| | | | | | | | | | | | | | | | | | | | |
| Year Ended | | Class A Front-End
Sales Charges
Retained by
Distributor | | | Class A
Contingent
Deferred
Sales Charges
Retained by
Distributor | | | Class B Contingent
Deferred
Sales Charges
Retained by
Distributor | | | Class C
Contingent
Deferred
Sales Charges
Retained by
Distributor | | | Class N
Contingent
Deferred
Sales Charges
Retained by
Distributor | |
| July 31, 2012 | | $ | 251,168 | | | $ | 346 | | | $ | 182,699 | | | $ | 9,548 | | | $ | 106 | |
Waivers and Reimbursements of Expenses. The Manager will waive fees and/or reimburse Fund expenses in an amount equal to the indirect management fees incurred through the Fund’s investment in IMMF. During the year ended July 31, 2012, the Manager waived fees and/or reimbursed the Fund $17,053 for IMMF management fees.
OFS has voluntarily agreed to limit transfer and shareholder servicing agent fees for all classes to 0.35% of average annual net assets per class.
During the year ended July 31, 2012, OFS waived transfer and shareholder servicing agent fees as follows:
| | | | |
| Class B | | $ | 155,054 | |
| Class N | | | 4,000 | |
Some of these undertakings may be modified or terminated at any time; some may not be modified or terminated until after one year from the date of the current prospectus, as indicated therein.
6. Pending Litigation
Since 2009, a number of class action, derivative and individual lawsuits have been pending in federal and state courts against OppenheimerFunds, Inc., the Fund’s investment advisor (the “Manager”), OppenheimerFunds Distributor, Inc., the Fund’s principal underwriter and distributor (the “Distributor”), and certain funds (but not including the Fund) advised by the Manager and distributed by the Distributor (the “Defendant Funds”). Several of these lawsuits also name as defendants certain officers and current and former trustees of the
| | | | |
| 38 | | | | OPPENHEIMER MAIN STREET SELECT FUND |
respective Defendant Funds. The lawsuits raise claims under federal securities law and allege, among other things, that the disclosure documents of the respective Defendant Funds contained misrepresentations and omissions and that the respective Defendant Funds’ investment policies were not followed. The plaintiffs in these actions seek unspecified damages, equitable relief and awards of attorneys’ fees and litigation expenses. The Defendant Funds’ Boards of Trustees have also engaged counsel to represent the Funds and the present and former Independent Trustees named in those suits.
Other class action and individual lawsuits have been filed since 2008 in various state and federal courts against the Manager and certain of its affiliates by investors seeking to recover investments they allegedly lost as a result of the “Ponzi” scheme run by Bernard L. Madoff and his firm, Bernard L. Madoff Investment Securities, LLC (“BLMIS”). Plaintiffs in these suits allege that they suffered losses as a result of their investments in several funds managed by an affiliate of the Manager and assert a variety of claims, including breach of fiduciary duty, fraud, negligent misrepresentation, unjust enrichment, and violation of federal and state securities laws and regulations, among others. They seek unspecified damages, equitable relief and awards of attorneys’ fees and litigation expenses. Neither the Distributor, nor any of the Oppenheimer mutual funds, their independent trustees or directors are named as defendants in these lawsuits. None of the Oppenheimer mutual funds invested in any funds or accounts managed by Madoff or BLMIS. On February 28, 2011, a stipulation of partial settlement of three groups of consolidated putative class action lawsuits relating to these matters was filed in the U.S. District Court for the Southern District of New York. On August 19, 2011, the court entered an order and final judgment approving the settlement as fair, reasonable and adequate. In September 2011, certain parties filed notices of appeal from the court’s order approving the settlement. On July 29, 2011, a stipulation of settlement between certain affiliates of the Manager and the Trustee appointed under the Securities Investor Protection Act to liquidate BLMIS was filed in the U.S. Bankruptcy Court for the Southern District of New York to resolve purported preference and fraudulent transfer claims by the Trustee. On September 22, 2011, the court entered an order approving the settlement as fair, reasonable and adequate. In October 2011, certain parties filed notices of appeal from the court’s order approving the settlement. In June 2012, the court granted appellees’ motion to dismiss the appeal. The aforementioned settlements do not resolve other outstanding lawsuits against the Manager and its affiliates relating to BLMIS.
On April 16, 2010, a lawsuit was filed in New York state court against the Manager, an affiliate of the Manager and AAArdvark IV Funding Limited (“AAArdvark IV”), an entity advised by the Manager’s affiliate, in connection with investments made by the plaintiffs in AAArdvark IV. Plaintiffs allege breach of contract against the defendants and seek compensatory damages, costs and disbursements, including attorney fees. On July 15, 2011, a lawsuit was filed in New York state court against the Manager, an affiliate of the Manager and AAArdvark Funding Limited (“AAArdvark I”), an entity advised by the Manager’s affiliate, in connection with investments made by the plaintiffs in AAArdvark I. The complaint alleges breach of contract against the defendants and seeks compensatory
| | | | |
| 39 | | | | OPPENHEIMER MAIN STREET SELECT FUND |
NOTES TO FINANCIAL STATEMENTS Continued
6. Pending Litigation Continued
damages, costs and disbursements, including attorney fees. On November 9, 2011, a lawsuit was filed in New York state court against the Manager, an affiliate of the Manager and AAArdvark XS Funding Limited (“AAArdvark XS”), an entity advised by the Manager’s affiliate, in connection with investments made by the plaintiffs in AAArdvark XS. The complaint alleges breach of contract against the defendants and seeks compensatory damages, costs and disbursements, including attorney fees.
The Manager believes the lawsuits and appeals described above are without legal merit and, with the exception of actions it has settled, is defending against them vigorously. While it is premature to render any opinion as to the outcome in these lawsuits, or whether any costs that the Defendant Funds may bear in defending the suits might not be reimbursed by insurance, the Manager believes that these suits should not impair the ability of the Manager or the Distributor to perform their respective duties to the Fund, and that the outcome of all of the suits together should not have any material effect on the operations of any of the Oppenheimer mutual funds.
| | | | |
| 40 | | | | OPPENHEIMER MAIN STREET SELECT FUND |
REPORT OF INDEPENDENT REGISTERED PUBLIC ACCOUNTING FIRM
The Board of Trustees and Shareholders of Oppenheimer Main Street Select Fund:
We have audited the accompanying statement of assets and liabilities of Oppenheimer Main Street Select Fund, including the statement of investments, as of July 31, 2012, and the related statement of operations for the year then ended, the statements of changes in net assets for each of the years in the two year period then ended, and the financial highlights for each of the years in the four-year period then ended. These financial statements and financial highlights are the responsibility of the Fund’s management. Our responsibility is to express an opinion on these financial statements and financial highlights based on our audits. The accompanying financial highlights of Oppenheimer Main Street Select Fund for the year ended July 31, 2008 were audited by other auditors whose report dated September 12, 2008 expressed an unqualified opinion on those financial highlights.
We conducted our audits in accordance with the standards of the Public Company Accounting Oversight Board (United States). Those standards require that we plan and perform the audit to obtain reasonable assurance about whether the financial statements and financial highlights are free of material misstatement. An audit includes examining, on a test basis, evidence supporting the amounts and disclosures in the financial statements. Our procedures included confirmation of securities owned as of July 31, 2012, by correspondence with the custodian, transfer agent and brokers, or by other appropriate auditing procedures where replies from brokers were not received. An audit also includes assessing the accounting principles used and significant estimates made by management, as well as evaluating the overall financial statement presentation. We believe that our audits provide a reasonable basis for our opinion.
In our opinion, the financial statements and financial highlights referred to above present fairly, in all material respects, the financial position of Oppenheimer Main Street Select Fund as of July 31, 2012, the results of its operations for the year then ended, the changes in its net assets for each of the years in the two-year period then ended and the financial highlights for each of the years in the four-year period then ended, in conformity with U.S. generally accepted accounting principles.
KPMG LLP
Denver, Colorado
September 17, 2012
| | | | |
| 41 | | | | OPPENHEIMER MAIN STREET SELECT FUND |
FEDERAL INCOME TAX INFORMATION Unaudited
In early 2012, if applicable, shareholders of record received information regarding all dividends and distributions paid to them by the Fund during calendar year 2011.
Dividends, if any, paid by the Fund during the fiscal year ended July 31, 2012 which are not designated as capital gain distributions should be multiplied by the maximum amount allowable but not less than 100% to arrive at the amount eligible for the corporate dividend-received deduction.
A portion, if any, of the dividends paid by the Fund during the fiscal year ended July 31, 2012 which are not designated as capital gain distributions are eligible for lower individual income tax rates to the extent that the Fund has received qualified dividend income as stipulated by recent tax legislation. The maximum amount allowable but not less than $23,256,101 of the Fund’s fiscal year taxable income may be eligible for the lower individual income tax rates. In early 2012, shareholders of record received information regarding the percentage of distributions that are eligible for lower individual income tax rates.
Recent tax legislation allows a regulated investment company to designate distributions not designated as capital gain distributions, as either interest related dividends or short-term capital gain dividends, both of which are exempt from the U.S. withholding tax applicable to non U.S. taxpayers. For the fiscal year ended July 31, 2012, the maximum amount allowable but not less than $4,373 of the ordinary distributions to be paid by the Fund qualifies as an interest related dividend.
The foregoing information is presented to assist shareholders in reporting distributions received from the Fund to the Internal Revenue Service. Because of the complexity of the federal regulations which may affect your individual tax return and the many variations in state and local tax regulations, we recommend that you consult your tax advisor for specific guidance.
| | | | |
| 42 | | | | OPPENHEIMER MAIN STREET SELECT FUND |
SPECIAL SHAREHOLDER MEETING Unaudited
On February 29, 2012, a shareholder meeting of Oppenheimer Main Street Select Fund (the “Fund”) was held at which the twelve Trustees identified below were elected (Proposal No. 1) as described in the Fund’s proxy statement dated December 16, 2011 (the “Proxy Statement”). The following is a report of the votes cast:
| | | | | | | | |
| Nominee/Proposal | | For | | | Withheld | |
| Trustees | | | | | | | | |
| William L. Armstrong | | | 64,756,294 | | | | 1,931,081 | |
| Edward L. Cameron | | | 64,736,234 | | | | 1,951,141 | |
| Jon S. Fossel | | | 64,605,126 | | | | 2,082,249 | |
| Sam Freedman | | | 64,780,752 | | | | 1,906,624 | |
| Richard F. Grabish | | | 64,600,384 | | | | 2,086,992 | |
| Beverly L. Hamilton | | | 64,796,796 | | | | 1,890,579 | |
| Robert J. Malone | | | 64,781,255 | | | | 1,906,121 | |
| F. William Marshall, Jr. | | | 64,781,667 | | | | 1,905,708 | |
| Victoria J. Herget | | | 64,763,618 | | | | 1,929,757 | |
| Karen L. Stuckey | | | 64,805,142 | | | | 1,882,234 | |
| James D. Vaughn | | | 64,800,751 | | | | 1,886,625 | |
| William F. Glavin, Jr. | | | 64,438,969 | | | | 2,248,407 | |
On April 18, 2012, following adjournments from the February 29, 2012 and the March 7, 2012 meetings, a meeting of the Fund was held at which the sub-proposals below (Proposal No. 2) and an Agreement and Plan of Reorganization to reorganize the Fund into a Delaware statutory trust (Proposal No. 3) were approved as described in the Fund’s Proxy Statement. The following is a report of the votes cast:
2a: Proposal to revise the fundamental policy relating to borrowing
| | | | | | | | | | | | |
| For | | Against | | | Abstain | | | Broker Non Vote | |
| 49,370,592 | | | 6,043,124 | | | | 1,973,524 | | | | 12,293,320 | |
2b-1: Proposal to revise the fundamental policy relating to concentration of investments
| | | | | | | | | | | | |
| For | | Against | | | Abstain | | | Broker Non Vote | |
| 49,324,893 | | | 6,026,610 | | | | 2,035,739 | | | | 12,293,320 | |
2c: Proposal to remove the fundamental policy relating to diversification of investments
| | | | | | | | | | | | |
| For | | Against | | | Abstain | | | Broker Non Vote | |
| 49,026,949 | | | 6,223,591 | | | | 2,136,701 | | | | 12,293,320 | |
2e-1: Proposal to revise the fundamental policy relating to lending
| | | | | | | | | | | | |
| For | | Against | | | Abstain | | | Broker Non Vote | |
| 49,113,981 | | | 6,164,765 | | | | 2,108,497 | | | | 12,293,320 | |
2g-1: Proposal to revise the fundamental policy relating to real estate and commodities
| | | | | | | | | | | | |
| For | | Against | | | Abstain | | | Broker Non Vote | |
| 49,221,957 | | | 6,016,182 | | | | 2,149,101 | | | | 12,293,320 | |
2g-2: Proposal to remove the additional fundamental policy relating to real estate and commodities
| | | | | | | | | | | | |
| For | | Against | | | Abstain | | | Broker Non Vote | |
| 48,993,058 | | | 6,163,698 | | | | 2,230,487 | | | | 12,293,320 | |
| | | | |
| 43 | | | | OPPENHEIMER MAIN STREET SELECT FUND |
SPECIAL SHAREHOLDER MEETING Unaudited / Continued
2h: Proposal to revise the fundamental policy relating to senior securities
| | | | | | | | | | | | |
| For | | Against | | | Abstain | | | Broker Non Vote | |
| 49,229,949 | | | 5,980,966 | | | | 2,176,328 | | | | 12,293,320 | |
2i: Proposal to revise fundamental policy relating to underwriting
| | | | | | | | | | | | |
| For | | Against | | | Abstain | | | Broker Non Vote | |
| 49,210,510 | | | 6,152,669 | | | | 2,024,064 | | | | 12,293,320 | |
2o: Proposal to convert the Fund’s investment objective from fundamental to non-fundamental
| | | | | | | | | | | | |
| For | | Against | | | Abstain | | | Broker Non Vote | |
| 48,107,404 | | | 7,099,744 | | | | 2,180,094 | | | | 12,293,320 | |
2p: Proposal to approve a change in the Fund’s investment objective
| | | | | | | | | | | | |
| For | | Against | | | Abstain | | | Broker Non Vote | |
| 48,942,882 | | | 6,300,115 | | | | 2,144,244 | | | | 12,293,320 | |
Proposal 3: To approve an Agreement and Plan of Reorganization that provides for the reorganization of a Fund from a Maryland corporation or Massachusetts business trust, as applicable, into a Delaware statutory trust.
| | | | | | | | | | | | |
| For | | Against | | | Abstain | | | Broker Non Vote | |
| 49,816,782 | | | 5,459,155 | | | | 2,111,307 | | | | 12,293,320 | |
| | | | |
| 44 | | | | OPPENHEIMER MAIN STREET SELECT FUND |
PORTFOLIO PROXY VOTING POLICIES AND PROCEDURES;
UPDATES TO STATEMENTS OF INVESTMENTS Unaudited
The Fund has adopted Portfolio Proxy Voting Policies and Procedures under which the Fund votes proxies relating to securities (“portfolio proxies”) held by the Fund. A description of the Fund’s Portfolio Proxy Voting Policies and Procedures is available (i) without charge, upon request, by calling the Fund toll-free at 1.800.CALL OPP (225.5677), (ii) on the Fund’s website at oppenheimerfunds.com, and (iii) on the SEC’s website at www.sec.gov. In addition, the Fund is required to file Form N-PX, with its complete proxy voting record for the 12 months ended June 30th, no later than August 31st of each year. The Fund’s voting record is available (i) without charge, upon request, by calling the Fund toll-free at 1.800.CALL OPP (225.5677), and (ii) in the Form N-PX filing on the SEC’s website at www.sec.gov.
The Fund files its complete schedule of portfolio holdings with the SEC for the first quarter and the third quarter of each fiscal year on Form N-Q. The Fund’s Form N-Q filings are available on the SEC’s website at www.sec.gov. Those forms may be reviewed and copied at the SEC’s Public Reference Room in Washington, D.C. Information on the operation of the Public Reference Room may be obtained by calling 1-800-SEC-0330.
Householding—Delivery of Shareholder Documents
This is to inform you about OppenheimerFunds’ “householding” policy. If more than one member of your household maintains an account in a particular fund, OppenheimerFunds will mail only one copy of the fund’s prospectus (or, if available, the fund’s summary prospectus), annual and semiannual report and privacy policy. The consolidation of these mailings, called householding, benefits your fund through reduced mailing expense, and benefits you by reducing the volume of mail you receive from OppenheimerFunds. Householding does not affect the delivery of your account statements.
Please note that we will continue to household these mailings for as long as you remain an OppenheimerFunds shareholder, unless you request otherwise. If you prefer to receive multiple copies of these materials, please call us at 1.800.CALL-OPP (225-5677). You may also notify us in writing or via email. We will begin sending you individual copies of the prospectus (or, if available, the summary prospectus), reports and privacy policy within 30 days of receiving your request to stop householding.
| | | | |
| 45 | | | | OPPENHEIMER MAIN STREET SELECT FUND |
TRUSTEES AND OFFICERS Unaudited
| | |
| Name, Position(s) Held with the Fund, Length of Service, Age | | Principal Occupation(s) During the Past 5 Years; Other Trusteeships/Directorships Held; Number of Portfolios in the Fund Complex Currently Overseen |
| |
INDEPENDENT
TRUSTEES | | The address of each Trustee in the chart below is 6803 S. Tucson Way, Centennial, Colorado 80112-3924. Each Trustee serves for an indefinite term, or until his or her resignation, retirement, death or removal. |
| |
William L. Armstrong,
Chairman of the Board of Trustees (since 2003),
Trustee (since 2000)
Age: 75 | | President, Colorado Christian University (since 2006); Chairman, Cherry Creek Mortgage Company (since 1991), Chairman, Centennial State Mortgage Company (since 1994), Chairman, The El Paso Mortgage Company (since 1993); Chairman, Ambassador Media Corporation (since 1984); Chairman, Broadway Ventures (since 1984); Director of Helmerich & Payne, Inc. (oil and gas drilling/production company) (since 1992), former Director of Campus Crusade for Christ (non-profit) (1991-2008); former Director, The Lynde and Harry Bradley Foundation, Inc. (non-profit organization) (2002-2006); former Chairman of: Transland Financial Services, Inc. (private mortgage banking company) (1997-2003), Great Frontier Insurance (1995-2000), Frontier Real Estate, Inc. (residential real estate brokerage) (1994-2000) and Frontier Title (title insurance agency) (1995-2000); former Director of the following: UNUMProvident (insurance company) (1991-2004), Storage Technology Corporation (computer equipment company) (1991-2003) and International Family Entertainment (television channel) (1992-1997); U.S. Senator (January 1979-January 1991). Oversees 37 portfolios in the OppenheimerFunds complex. Mr. Armstrong has served on the Boards of certain Oppenheimer funds since 1999, during which time he has become familiar with the Fund’s (and other Oppenheimer funds’) financial, accounting, regulatory and investment matters and has contributed to the Boards’ deliberations. |
| |
Edward L. Cameron,
Trustee (since 2000) Age: 73 | | Member of The Life Guard of Mount Vernon (George Washington historical site) (June 2000–June 2006); Partner of PricewaterhouseCoopers LLP (accounting firm) (July 1974-June 1999); Chairman of Price Waterhouse LLP Global Investment Management Industry Services Group (accounting firm) (July 1994-June 1998). Oversees 37 portfolios in the OppenheimerFunds complex. Mr. Cameron has served on the Boards of certain Oppenheimer funds since 1999, during which time he has become familiar with the Fund’s (and other Oppenheimer funds’) financial, accounting, regulatory and investment matters and has contributed to the Boards’ deliberations. |
| |
Jon S. Fossel, Trustee (since 2000)
Age: 70 | | Chairman of the Board (2006-December 2011) and Director (June 2002-December 2011) of UNUMProvident (insurance company); Director of Northwestern Energy Corp. (public utility corporation) (November 2004-December 2009); Director of P.R. Pharmaceuticals (October 1999-October 2003); Director of Rocky Mountain Elk Foundation (non-profit organization) (February 1998-February 2003 and February 2005-February 2007); Chairman and Director (until October 1996) and President and Chief Executive Officer (until October 1995) of the Manager; President, Chief Executive Officer and Director of the following: Oppenheimer Acquisition Corp. (“OAC”) (parent holding company of the Manager), Shareholders Services, Inc. and Shareholder Financial Services, Inc. (until October 1995). Oversees 37 portfolios in the OppenheimerFunds complex. Mr. Fossel has served on the Boards of certain Oppenheimer funds since 1990, during which time he has become familiar with the Fund’s (and other Oppenheimer funds’) financial, accounting, regulatory and investment matters and has contributed to the Boards’ deliberations. |
| | | | |
| 46 | | | | OPPENHEIMER MAIN STREET SELECT FUND |
| | |
Sam Freedman,
Trustee (since 2000)
Age: 71 | | Director of Colorado UpLIFT (charitable organization) (since September 1984). Mr. Freedman held several positions with the Manager and with subsidiary or affiliated companies of the Manager (until October 1994). Oversees 37 portfolios in the OppenheimerFunds complex. Mr. Freedman has served on the Boards of certain Oppenheimer funds since 1996, during which time he has become familiar with the Fund’s (and other Oppenheimer funds’) financial, accounting, regulatory and investment matters and has contributed to the Boards’ deliberations. |
| |
Richard F. Grabish,
Trustee (since 2012)
Age: 63 | | Formerly Senior Vice President and Assistant Director of Sales and Marketing (March 1997-December 2007), Director (March 1987-December 2007) and Manager of Private Client Services (June 1985-June 2005) of A.G. Edwards & Sons, Inc. (broker/dealer and investment firm); Chairman and Chief Executive Officer of A.G. Edwards Trust Company, FSB (March 2001-December 2007); President and Vice Chairman of A.G. Edwards Trust Company, FSB (investment adviser) (April 1987-March 2001); President of A.G. Edwards Trust Company, FSB (investment adviser) (June 2005-December 2007). Oversees 37 portfolios in the OppenheimerFunds complex. Mr. Grabish has served on the Boards of certain Oppenheimer funds since 2001, during the course of which he has become familiar with the Fund’s (and other Oppenheimer funds’) financial, accounting, regulatory and investment matters and has contributed to the Boards’ deliberations. |
| |
Beverly L. Hamilton,
Trustee (since 2002)
Age: 65 | | Trustee of Monterey Institute for International Studies (educational organization) (since February 2000); Board Member of Middlebury College (educational organization) (December 2005-June 2011); Chairman (since 2010) of American Funds’ Emerging Markets Growth Fund, Inc. (mutual fund); Director of The California Endowment (philanthropic organization) (April 2002-April 2008); Director (February 2002-2005) and Chairman of Trustees (2006-2007) of the Community Hospital of Monterey Peninsula; Director (October 1991-2005); Vice Chairman (2006-2009) of American Funds’ Emerging Markets Growth Fund, Inc. (mutual fund); President of ARCO Investment Management Company (February 1991-April 2000); Member of the investment committees of The Rockefeller Foundation (2001-2006) and The University of Michigan (since 2000); Advisor at Credit Suisse First Boston’s Sprout venture capital unit (venture capital fund) (1994-January 2005); Trustee of MassMutual Institutional Funds (investment company) (1996-June 2004); Trustee of MML Series Investment Fund (investment company) (April 1989-June 2004); Member of the investment committee of Hartford Hospital (2000-2003); and Advisor to Unilever (Holland) pension fund (2000-2003). Oversees 37 portfolios in the OppenheimerFunds complex. Ms. Hamilton has served on the Boards of certain Oppenheimer funds since 2002, during which time she has become familiar with the Fund’s (and other Oppenheimer funds’) financial, accounting, regulatory and investment matters and has contributed to the Boards’ deliberations. |
| |
Victoria J. Herget,
Trustee (since 2012)
Age: 60 | | Independent Director of the First American Funds (mutual fund family) (2003-2011); former Managing Director (1993-2001), Principal (1985-1993), Vice President (1978-1985) and Assistant Vice President (1973-1978) of Zurich Scudder Investments (and its predecessor firms); Board Chair (2008-Present) and Director (2004-Present), United Educators (insurance company); Trustee (1992-2007), Chair of the Board of Trustees (1999-2007), Investment Committee Chair (1994-1999) and Investment Committee member (2007-2010) of Wellesley College; Trustee (since 2000) and Chair (since 2010), Newberry Library; Trustee, Mather LifeWays (since 2001); Trustee, BoardSource (2006-2009) and Chicago City Day School (1994-2005). Oversees 37 portfolios |
| | | | |
| 47 | | | | OPPENHEIMER MAIN STREET SELECT FUND |
TRUSTEES AND OFFICERS Unaudited / Continued
| | |
Victoria J. Herget,
Continued | | in the OppenheimerFunds complex. Ms. Herget has served on the Boards of certain Oppenheimer funds since 2012, during which time she has become familiar with the Fund’s (and other Oppenheimer funds’) financial, accounting, regulatory and investment matters and has contributed to the Boards’ deliberations. |
| |
Robert J. Malone,
Trustee (since 2002)
Age: 67 | | Board of Directors of Opera Colorado Foundation (non-profit organization) (since March 2008); Director of Jones Knowledge, Inc. (2006-2010); Director of Jones International University (educational organization) (since August 2005); Chairman, Chief Executive Officer and Director of Steele Street Bank & Trust (commercial banking) (since August 2003); Director of Colorado UpLIFT (charitable organization) (1986-2010); Trustee of the Gallagher Family Foundation (non-profit organization) (since 2000); Former Chairman of U.S. Bank-Colorado (subsidiary of U.S. Bancorp and formerly Colorado National Bank) (July 1996-April 1999); Director of Commercial Assets, Inc. (real estate investment trust) (1993-2000); Director of Jones Knowledge, Inc. (2001-July 2004); Director of U.S. Exploration, Inc. (oil and gas exploration) (1997-February 2004); Chairman of the Board (1991-1994) and Trustee (1985-1994) of Regis University; and Chairman of the Board (1990-1991) and Trustee (1984-1999) of Young Presidents Organization. Oversees 37 portfolios in the OppenheimerFunds complex. Mr. Malone has served on the Boards of certain Oppenheimer funds since 2002, during which time he has become familiar with the Fund’s (and other Oppenheimer funds’) financial, accounting, regulatory and investment matters and has contributed to the Boards’ deliberations. |
| |
F. William Marshall, Jr.,
Trustee (since 2000) Age: 70 | | Trustee Emeritus of Worcester Polytech Institute (WPI) (private university) (since 2009); Trustee of MassMutual Select Funds (formerly MassMutual Institutional Funds) (investment company) (since 1996) and MML Series Investment Fund (investment company) (since 1996) and Mass Mutual Premier Funds (investment company) (since January 2012); President and Treasurer of the SIS Funds (private charitable fund) (January 1999–March 2011); Former Trustee of WPI (1985-2008); Former Chairman of the Board (2004-2006) and Former Chairman of the Investment Committee of WPI (1994-2008); Chairman of SIS & Family Bank, F.S.B. (formerly SIS Bank) (commercial bank) (January 1999-July 1999); Executive Vice President of Peoples Heritage Financial Group, Inc. (commercial bank) (January 1999-July 1999); and Former President and Chief Executive Officer of SIS Bancorp. (1993-1999). Oversees 41 portfolios in the OppenheimerFunds complex. Mr. Marshall has served on the Boards of certain Oppenheimer funds since 2000, during which time he has become familiar with the Fund’s (and other Oppenheimer funds’) financial, accounting, regulatory and investment matters and has contributed to the Boards’ deliberations. |
| |
Karen L. Stuckey, Trustee (since 2012) Age: 59 | | Partner (1990-2012) of PricewaterhouseCoopers LLP (held various positions 1975-1990); Trustee (1992-2006) and member of Executive, Nominating and Audit Committees and Chair of Finance Committee of Lehigh University; and member, Women’s Investment Management Forum since inception. Oversees 37 portfolios in the OppenheimerFunds complex. Ms. Stuckey has served on the Boards of certain Oppenheimer funds since 2012, during which time she has become familiar with the Fund’s (and other Oppenheimer funds’) financial, accounting, regulatory and investment matters and has contributed to the Boards’ deliberations. |
| |
James D. Vaughn, Trustee (since 2012) Age: 67 | | Retired; former managing partner (1994-2001) of Denver office of Deloitte & Touche LLP, (held various positions 1969-1993); Trustee and Chairman of the Audit Committee of Schroder Funds (since 2003); Board member and |
| | | | |
| 48 | | | | OPPENHEIMER MAIN STREET SELECT FUND |
| | |
James D. Vaughn, Continued | | Chairman of Audit Committee of AMG National Trust Bank (since 2005); Trustee, Audit Committee member and Investment Committee member, University of South Dakota Foundation (since 1996); Board member, Executive Committee Member, Audit Committee Member and past Board Chair, Junior Achievement (since 1993); former Board member, Mile High United Way, Boys and Girls Clubs, Boy Scouts, Colorado Business Committee for the Arts, Economic Club of Colorado and Metro Denver Network. Oversees 37 portfolios in the OppenheimerFunds complex. Mr. Vaughn has served on the Boards of certain Oppenheimer funds since 2012, during which time he has become familiar with the Fund’s (and other Oppenheimer funds’) financial, accounting, regulatory and investment matters and has contributed to the Boards’ deliberations. |
| INTERESTED TRUSTEE AND OFFICER | | The address of Mr. Glavin is Two World Financial Center, 225 Liberty Street, 11th Floor, New York, New York 10281-1008. Mr. Glavin serves as a Trustee for an indefinite term, or until his resignation, retirement, death or removal and as an Officer for an indefinite term, or until his resignation, retirement, death or removal. Mr. Glavin is an Interested Trustee due to his positions with OppenheimerFunds, Inc. and its affiliates. |
| |
William F. Glavin, Jr., Trustee, President and Principal Executive Officer (since 2009) Age: 53 | | Chairman of the Manager (since December 2009); Chief Executive Officer and Director of the Manager (since January 2009); President of the Manager (since May 2009); Director of Oppenheimer Acquisition Corp. (“OAC”) (the Manager’s parent holding company) (since June 2009); Executive Vice President (March 2006-February 2009) and Chief Operating Officer (July 2007-February 2009) of Massachusetts Mutual Life Insurance Company (OAC’s parent company); Director (May 2004-March 2006) and Chief Operating Officer and Chief Compliance Officer (May 2004-January 2005), President (January 2005-March 2006) and Chief Executive Officer (June 2005-March 2006) of Babson Capital Management LLC; Director (March 2005-March 2006), President (May 2003-March 2006) and Chief Compliance Officer (July 2005-March 2006) of Babson Capital Securities, Inc. (a broker-dealer); President (May 2003-March 2006) of Babson Investment Company, Inc.; Director (May 2004-August 2006) of Babson Capital Europe Limited; Director (May 2004-October 2006) of Babson Capital Guernsey Limited; Director (May 2004-March 2006) of Babson Capital Management LLC; Non-Executive Director (March 2005-March 2007) of Baring Asset Management Limited; Director (February 2005-June 2006) Baring Pension Trustees Limited; Director and Treasurer (December 2003-November 2006) of Charter Oak Capital Management, Inc.; Director (May 2006-September 2006) of C.M. Benefit Insurance Company; Director (May 2008-June 2009) and Executive Vice President (June 2007-July 2009) of C.M. Life Insurance Company; President (March 2006-May 2007) of MassMutual Assignment Company; Director (January 2005-December 2006), Deputy Chairman (March 2005-December 2006) and President (February 2005-March 2005) of MassMutual Holdings (Bermuda) Limited; Director (May 2008-June 2009) and Executive Vice President (June 2007-July 2009) of MML Bay State Life Insurance Company; Chief Executive Officer and President (April 2007-January 2009) of MML Distributors, LLC; and Chairman (March 2006-December 2008) and Chief Executive Officer (May 2007-December 2008) of MML Investors Services, Inc. Oversees 63 portfolios as a Trustee/Director and 95 portfolios as an officer in the OppenheimerFunds complex. |
| | | | |
| 49 | | | | OPPENHEIMER MAIN STREET SELECT FUND |
TRUSTEES AND OFFICERS Unaudited / Continued
| | |
| OTHER OFFICERS OF THE FUND | | The addresses of the Officers in the chart below are as follows: for Messrs. Govil, Gennaro, Jr., Gabinet and Ms. Nasta, Two World Financial Center, 225 Liberty Street, New York, New York 10281-1008, for Messrs. Vandehey and Wixted, 6803 S. Tucson Way, Centennial, Colorado 80112-3924. Each Officer serves for an indefinite term or until his or her resignation, retirement, death or removal. |
| |
Manind Govil, Vice President (since 2009) Age: 42 | | Senior Vice President, Main Street Team Leader and a portfolio manager of the Manager (since May 2009); a Chartered Financial Analyst. Prior to joining the Manager, a portfolio manager with RS Investment Management Co. LLC (October 2006-March 2009); head of equity investments at The Guardian Life Insurance Company of America (August 2005-October 2006) when Guardian Life Insurance acquired an interest in RS Investment Management Co. LLC; lead portfolio manager—large cap blend/core equity, co-head of equities and head of equity research (2001-July 2005); lead portfolio manager—core equity (April 1996-July 2005), at Mercantile Capital Advisers, Inc. A portfolio manager and officer of 4 portfolios in the OppenheimerFunds complex. |
| |
Anthony W. Gennaro, Jr., Vice President (since 2009) Age: 41 | | Vice President of the Manager (since May 2009); a Chartered Financial Analyst. Prior to joining the Manager, a sector manager for media, internet and telecom and a co-portfolio manager for mid-cap portfolios (August 2006-April 2009) first with Guardian Life Insurance Company of America then with RS Investment Management Co. LLC, subsequent to their merger; a financial analyst covering media and internet stocks at Principal Global Investors (1999-2006); Senior in the assurance and advisory business services division with Ernst & Young LLP (1994-1997). A portfolio manager and officer of 1 portfolio in the OppenheimerFunds complex. |
| |
Arthur S. Gabinet, Secretary and Chief Legal Officer (since 2011) Age: 54 | | Executive Vice President (since May 2010) and General Counsel (since January 2011) of the Manager; General Counsel of the Distributor (since January 2011); General Counsel of Centennial Asset Management Corporation (since January 2011); Executive Vice President and General Counsel of HarbourView Asset Management Corporation (since January 2011); Assistant Secretary (since January 2011) and Director (since January 2011) of OppenheimerFunds International Ltd. and OppenheimerFunds plc; Vice President and Director of Oppenheimer Partnership Holdings, Inc. (since January 2011); Director of Oppenheimer Real Asset Management, Inc. (since January 2011); Executive Vice President and General Counsel of Shareholder Financial Services, Inc. and Shareholder Services, Inc. (since January 2011); Executive Vice President and General Counsel of OFI Private Investments, Inc. (since January 2011); Vice President of OppenheimerFunds Legacy Program (January 2011-January 2012); Executive Vice President and General Counsel of OFI Institutional Asset Management, Inc. (since January 2011); General Counsel, Asset Management of the Manager (May 2010-December 2010); Principal, The Vanguard Group (November 2005-April 2010); District Administrator, U.S. Securities and Exchange Commission (January 2003-October 2005). An officer of 95 portfolios in the OppenheimerFunds complex. |
| |
Christina M. Nasta, Vice President and Chief Business Officer (since 2011) Age: 39 | | Senior Vice President of the Manager (since July 2010); Vice President of the Manager (since January 2003); Vice President of OppenheimerFunds Distributor, Inc. (since January 2003). An officer of 95 portfolios in the OppenheimerFunds complex. |
| |
Mark S. Vandehey, Vice President and Chief Compliance Officer (since 2004) Age: 61 | | Senior Vice President and Chief Compliance Officer of the Manager (since March 2004); Chief Compliance Officer of OppenheimerFunds Distributor, Inc., Centennial Asset Management and Shareholder Services, Inc. (since March 2004); Vice President of OppenheimerFunds Distributor, Inc., |
| | | | |
| 50 | | | | OPPENHEIMER MAIN STREET SELECT FUND |
| | |
Mark S. Vandehey, Continued | | Centennial Asset Management Corporation and Shareholder Services, Inc. (since June 1983). An officer of 95 portfolios in the OppenheimerFunds complex. |
| |
Brian W. Wixted, Treasurer and Principal Financial & Accounting Officer (since 2000) Age: 52 | | Senior Vice President of the Manager (since March 1999); Treasurer of the Manager and the following: HarbourView Asset Management Corporation, Shareholder Financial Services, Inc., Shareholder Services, Inc., Oppenheimer Real Asset Management, Inc. and Oppenheimer Partnership Holdings, Inc. (March 1999-June 2008), OFI Private Investments, Inc. (March 2000-June 2008), OppenheimerFunds International Ltd. and OppenheimerFunds plc (since May 2000), OFI Institutional Asset Management, Inc. (since November 2000), and OppenheimerFunds Legacy Program (charitable trust program established by the Manager) (June 2003-January 2012); Treasurer and Chief Financial Officer of OFI Trust Company (trust company subsidiary of the Manager) (since May 2000); Assistant Treasurer of OAC (March 1999-June 2008). An officer of 95 portfolios in the OppenheimerFunds complex. |
The Fund’s Statement of Additional Information contains additional information about the Fund’s Trustees and Officers and is available without charge upon request, by calling 1.800.CALL OPP (225.5677).
| | | | |
| 51 | | | | OPPENHEIMER MAIN STREET SELECT FUND |
OPPENHEIMER MAIN STREET SELECT FUND®
| | |
| Manager | | OppenheimerFunds, Inc. |
| Distributor | | OppenheimerFunds Distributor, Inc. |
| Transfer and Shareholder Servicing Agent | | OppenheimerFunds Services |
Independent
Registered Public Accounting Firm | | KPMG LLP |
| Counsel | | K&L Gates LLP |
©2012 OppenheimerFunds, Inc. All rights reserved.
| | | | |
| 52 | | | | OPPENHEIMER MAIN STREET SELECT FUND |
PRIVACY POLICY
As an Oppenheimer fund shareholder, you are entitled to know how we protect your personal information and how we limit its disclosure.
Information Sources
We obtain nonpublic personal information about our shareholders from the following sources:
| l | | Applications or other forms |
| l | | When you create a user ID and password for online account access |
| l | | When you enroll in eDocs Direct, our electronic document delivery service |
| l | | Your transactions with us, our affiliates or others |
| l | | A software program on our website, often referred to as a “cookie,” which indicates which parts of our site you’ve visited |
| l | | When you set up challenge questions to reset your password online |
If you visit oppenheimerfunds.com and do not log on to the secure account information areas, we do not obtain any personal information about you. When you do log on to a secure area, we do obtain your user ID and password to identify you. We also use this information to provide you with products and services you have requested, to inform you about products and services that you may be interested in and assist you in other ways.
We do not collect personal information through our website unless you willingly provide it to us, either directly by email or in those areas of the website that request information. In order to update your personal information (including your mailing address, email address and phone number) you must first log on and visit your user profile.
If you have set your browser to warn you before accepting cookies, you will receive the warning message with each cookie. You can refuse cookies by turning them off in your browser. However, doing so may limit your access to certain sections of our website.
We use cookies to help us improve and manage our website. For example, cookies help us recognize new versus repeat visitors to the site, track the pages visited, and enable some special features on the website. This data helps us provide a better service for our website visitors.
Protection of Information
We do not disclose any non-public personal information (such as names on a customer list) about current or former customers to anyone, except as permitted by law.
Disclosure of Information
We send your financial advisor (as designated by you) copies of confirmations, account statements and other documents reporting activity in your fund accounts. We may also use details about you and your investments to help us, our financial service affiliates, or firms that jointly market their financial products and services with ours, to better serve your investment needs or suggest financial services or educational material that may be of interest to you. If this requires us to provide you with an opportunity to “opt in” or “opt out” of such information sharing with a firm not affiliated with us, you will receive notification on how to do so, before any such sharing takes place.
Right of Refusal
We will not disclose your personal information to unaffiliated third parties (except as permitted by law), unless we first offer you a reasonable opportunity to refuse or “opt out” of such disclosure.
Internet Security and Encryption
In general, the email services provided by our website are encrypted and provide a secure and private means of communication with us. To protect your own privacy, confidential and/or personal information should only be communicated via email when you are advised that you are using a secure website.
| | | | |
| 53 | | | | OPPENHEIMER MAIN STREET SELECT FUND |
As a security measure, we do not include personal or account information in non-secure emails, and we advise you not to send such information to us in non-secure emails. Instead, you may take advantage of the secure features of our website to encrypt your email correspondence. To do this, you will need to use a browser that supports Secure Sockets Layer (SSL) protocol.
We do not guarantee or warrant that any part of our website, including files available for download, are free of viruses or other harmful code. It is your responsibility to take appropriate precautions, such as use of an anti-virus software package, to protect your computer hardware and software.
| l | | All transactions, including redemptions, exchanges and purchases, are secured by SSL and 128-bit encryption. SSL is used to establish a secure connection between your PC and OppenheimerFunds’ server. It transmits information in an encrypted and scrambled format. |
| l | | Encryption is achieved through an electronic scrambling technology that uses a “key” to code and then decode the data. Encryption acts like the cable converter box you may have on your television set. It scrambles data with a secret code so that no one can make sense of it while it is being transmitted. When the data reaches its destination, the same software unscrambles the data. |
| l | | You can exit the secure area by either closing your browser, or for added security, you can use the Log Out button before you close your browser. |
Other Security Measures
We maintain physical, electronic and procedural safeguards to protect your personal account information. Our employees and agents have access to that information only so that they may offer you products or provide services, for example, when responding to your account questions.
How You Can Help
You can also do your part to keep your account information private and to prevent unauthorized transactions. If you obtain a user ID and password for your account, do not allow it to be used by anyone else. Also, take special precautions when accessing your account on a computer used by others.
Who We Are
This joint notice describes the privacy policies of the Oppenheimer funds, OppenheimerFunds Distributor, Inc., the trustee of OppenheimerFunds Individual Retirement Accounts (IRAs) and the custodian of the OppenheimerFunds 403(b)(7) tax sheltered custodial accounts. It applies to all Oppenheimer fund accounts you presently have, or may open in the future, using your Social Security number—whether or not you remain a shareholder of our funds. This notice was last updated January 16, 2004. In the event it is updated or changed, we will post an updated notice on our website at oppenheimerfunds.com. If you have any questions about these privacy policies, write to us at P.O. Box 5270, Denver, CO 80217-5270, email us by clicking on the Contact Us section of our website at oppenheimerfunds.com or call us at 1.800.CALL OPP (225.5677).
| | | | |
| 54 | | | | OPPENHEIMER MAIN STREET SELECT FUND |
Item 2. Code of Ethics.
The registrant has adopted a code of ethics that applies to the registrant’s principal executive officer, principal financial officer, principal accounting officer or controller or persons performing similar functions.
Item 3. Audit Committee Financial Expert.
The Board of Trustees of the registrant has determined that F. William Marshall, Jr., the Chairman of the Board’s Audit Committee, is the audit committee financial expert and that Mr. Marshall is “independent” for purposes of this Item 3.
Item 4. Principal Accountant Fees and Services.
The principal accountant for the audit of the registrant’s annual financial statements billed $23,600 in fiscal 2012 and $23,100 in fiscal 2011.
The principal accountant for the audit of the registrant’s annual financial statements billed no such fees in fiscal 2012 and no such fees in fiscal 2011.
The principal accountant for the audit of the registrant’s annual financial statements billed $324,306 in fiscal 2012 and $168,500 in fiscal 2011 to the registrant’s investment adviser or any entity controlling, controlled by, or under common control with the adviser that provides ongoing services to the registrant.
Such services include: Internal control reviews, compliance procedures, and GIPS attestation procedures.
The principal accountant for the audit of the registrant’s annual financial statements billed $3,600 in fiscal 2012 and $1,050 in fiscal 2011.
The principal accountant for the audit of the registrant’s annual financial statements billed $317,764 in fiscal 2012 and no such fees in fiscal 2011 to the registrant’s investment adviser or any entity controlling, controlled by, or under common control with the adviser that provides ongoing services to the registrant.
Such services include: tax compliance, tax planning and tax advice. Tax compliance generally involves preparation of original and amended tax returns, claims for a refund and tax payment-planning services. Tax planning and tax advice includes assistance with tax audits and appeals, tax advice related to mergers and acquisitions and requests for rulings or technical advice from taxing authorities.
The principal accountant for the audit of the registrant’s annual financial statements billed no such fees in fiscal 2012 and no such fees in fiscal 2011.
The principal accountant for the audit of the registrant’s annual financial statements billed no such fees in fiscal 2012 and no such fees in fiscal 2011 to the registrant’s investment adviser or any entity controlling, controlled by, or under common control with the adviser that provides ongoing services to the registrant.
Such fees would include the cost to the principal accountant of attending audit committee meetings and consultations regarding the registrant’s retirement plan with respect to its Trustees.
| (e) | (1) During its regularly scheduled periodic meetings, the registrant’s audit committee will pre-approve all audit, audit-related, tax and other services to be provided by the principal accountants of the registrant. |
The audit committee has delegated pre-approval authority to its Chairman for any subsequent new engagements that arise between regularly scheduled meeting dates provided that any fees such pre-approved are presented to the audit committee at its next regularly scheduled meeting.
Under applicable laws, pre-approval of non-audit services maybe waived provided that: 1) the aggregate amount of all such services provided constitutes no more than five percent of the total amount of fees paid by the registrant to it principal accountant during the fiscal year in which services are provided 2) such services were not recognized by the registrant at the time of engagement as non-audit services and 3) such services are promptly brought to the attention of the audit committee of the registrant and approved prior to the completion of the audit.
(2) 100%
| (f) | Not applicable as less than 50%. |
| (g) | The principal accountant for the audit of the registrant’s annual financial statements billed $645,670 in fiscal 2012 and $169,550 in fiscal 2011 to the registrant and the registrant’s investment adviser or any entity controlling, controlled by, or under common control with the adviser that provides ongoing services to the registrant related to non-audit fees. Those billings did not include any prohibited non-audit services as defined by the Securities Exchange Act of 1934. |
| (h) | The registrant’s audit committee of the board of Trustees has considered whether the provision of non-audit services that were rendered to the registrant’s investment adviser, and any entity controlling, controlled by, or under common control with the investment adviser that provides ongoing services to the registrant that were not pre-approved pursuant to paragraph (c)(7)(ii) of Rule 2-01 of Regulation S-X is compatible with maintaining the principal accountant’s independence. No such services were rendered. |
Item 5. Audit Committee of Listed Registrants
Not applicable.
Item 6. Schedule of Investments.
a) Not applicable. The complete schedule of investments is included in Item 1 of this Form N-CSR.
b) Not applicable.
Item 7. Disclosure of Proxy Voting Policies and Procedures for Closed-End Management Investment Companies.
Not applicable.
Item 8. Portfolio Managers of Closed-End Management Investment Companies.
Not applicable.
Item 9. Purchases of Equity Securities by Closed-End Management Investment Company and Affiliated Purchasers.
Not applicable.
Item 10. Submission of Matters to a Vote of Security Holders.
The Fund’s Governance Committee Provisions with Respect to Nominations of Directors/Trustees to the Respective Boards
| 1. | The Fund’s Governance Committee (the “Committee”) will evaluate potential Board candidates to assess their qualifications. The Committee shall have the authority, upon approval of the Board, to retain an executive search firm to assist in this effort. The Committee may consider recommendations by business and personal contacts of current |
| | Board members and by executive search firms which the Committee may engage from time to time and may also consider shareholder recommendations. The Committee may consider the advice and recommendation of the Funds’ investment manager and its affiliates in making the selection. |
| 2. | The Committee shall screen candidates for Board membership. The Committee has not established specific qualifications that it believes must be met by a trustee nominee. In evaluating trustee nominees, the Committee considers, among other things, an individual’s background, skills, and experience; whether the individual is an “interested person” as defined in the Investment Company Act of 1940; and whether the individual would be deemed an “audit committee financial expert” within the meaning of applicable SEC rules. The Committee also considers whether the individual’s background, skills, and experience will complement the background, skills, and experience of other nominees and will contribute to the Board. There are no differences in the manner in which the Committee evaluates nominees for trustees based on whether the nominee is recommended by a shareholder. |
| 3. | The Committee may consider nominations from shareholders for the Board at such times as the Committee meets to consider new nominees for the Board. The Committee shall have the sole discretion to determine the candidates to present to the Board and, in such cases where required, to shareholders. Recommendations for trustee nominees should, at a minimum, be accompanied by the following: |
| | • | | the name, address, and business, educational, and/or other pertinent background of the person being recommended; |
| | • | | a statement concerning whether the person is an “interested person” as defined in the Investment Company Act of 1940; |
| | • | | any other information that the Funds would be required to include in a proxy statement concerning the person if he or she was nominated; and |
| | • | | the name and address of the person submitting the recommendation and, if that person is a shareholder, the period for which that person held Fund shares. |
The recommendation also can include any additional information which the person submitting it believes would assist the Committee in evaluating the recommendation.
| 4. | Shareholders should note that a person who owns securities issued by Massachusetts Mutual Life Insurance Company (the parent company of the Funds’ investment adviser) would be deemed an “interested person” under the Investment Company Act of 1940. In addition, certain other relationships with Massachusetts Mutual Life Insurance Company or its subsidiaries, with registered broker-dealers, or with the Funds’ outside legal counsel may cause a person to be deemed an “interested person.” |
| 5. | Before the Committee decides to nominate an individual as a trustee, Committee members and other directors customarily interview the individual in person. In addition, the individual customarily is asked to complete a detailed questionnaire which is designed to elicit information which must be disclosed under SEC and stock exchange rules and to determine whether the individual is subject to any statutory disqualification from serving as a trustee of a registered investment company. |
Item 11. Controls and Procedures.
Based on their evaluation of the registrant’s disclosure controls and procedures (as defined in rule 30a-3(c) under the Investment Company Act of 1940 (17 CFR 270.30a-3(c)) as of 7/31/2012, the registrant’s principal executive officer and principal financial officer found the registrant’s disclosure controls and procedures to provide reasonable assurances that information required to be disclosed by the registrant in the reports that it files under the Securities Exchange Act of 1934 (a) is accumulated and communicated to registrant’s management, including its principal executive officer and principal financial officer, to allow timely decisions regarding required disclosure, and (b) is recorded, processed, summarized and reported, within the time periods specified in the rules and forms adopted by the U.S. Securities and Exchange Commission.
There have been no changes in the registrant’s internal controls over financial reporting that occurred during the registrant’s second fiscal quarter of the period covered by this report that have materially affected, or are reasonably likely to materially affect, the registrant’s internal control over financial reporting.
Item 12. Exhibits.
| (a) | (1) Exhibit attached hereto. |
(2) Exhibits attached hereto.
(3) Not applicable.
| (b) | Exhibit attached hereto. |
SIGNATURES
Pursuant to the requirements of the Securities Exchange Act of 1934 and the Investment Company Act of 1940, the registrant has duly caused this report to be signed on its behalf by the undersigned, thereunto duly authorized.
Oppenheimer Main Street Select Fund
| | | | |
| By: | | /s/ William F. Glavin, Jr. | | |
| | William F. Glavin, Jr. | | |
| | Principal Executive Officer | | |
| Date: | | 9/11/2012 | | |
Pursuant to the requirements of the Securities Exchange Act of 1934 and the Investment Company Act of 1940, this report has been signed below by the following persons on behalf of the registrant and in the capacities and on the dates indicated.
| | | | |
| By: | | /s/ William F. Glavin, Jr. | | |
| | William F. Glavin, Jr. | | |
| | Principal Executive Officer | | |
| Date: | | 9/11/2012 | | |
| | | | |
| By: | | /s/ Brian W. Wixted | | |
| | Brian W. Wixted | | |
| | Principal Financial Officer | | |
| Date: | | 9/11/2012 | | |