UNITED STATES
SECURITIES AND EXCHANGE COMMISSION
WASHINGTON, D.C. 20549
FORM N-CSR
CERTIFIED SHAREHOLDER REPORT OF REGISTERED
MANAGEMENT INVESTMENT COMPANIES
Investment Company Act file number 811-10001
Oppenheimer Main Street Select Fund
(Exact name of registrant as specified in charter)
6803 South Tucson Way, Centennial, Colorado 80112-3924
(Address of principal executive offices) (Zip code)
Arthur S. Gabinet
OFI Global Asset Management, Inc.
225 Liberty Street, New York, New York 10281-1008
(Name and address of agent for service)
Registrant’s telephone number, including area code: (303) 768-3200
Date of fiscal year end: July 31
Date of reporting period: 1/30/2015
| Item 1. | Reports to Stockholders. |
Class A Shares
AVERAGE ANNUAL TOTAL RETURNS AT 1/30/15*
| | | | | | | | | | |
| | | Class A Shares of the Fund | | | | | | |
| | | Without Sales
Charge | | With Sales
Charge | | Russell 3000
Index | | Russell 1000
Index | | S&P 500 Index |
6-Month | | -0.48 % | | -6.20 % | | 4.38 % | | 4.35 % | | 4.37 % |
1-Year | | 7.04 | | 0.88 | | 12.99 | | 13.76 | | 14.22 |
5-Year | | 12.63 | | 11.30 | | 15.83 | | 15.84 | | 15.60 |
10-Year | | 6.42 | | 5.80 | | 7.93 | | 7.93 | | 7.61 |
Performance data quoted represents past performance, which does not guarantee future results. The investment return and principal value of an investment in the Fund will fluctuate so that an investor’s shares, when redeemed, may be worth more or less than their original cost. Fund returns include changes in share price, reinvested distributions, and a 5.75% maximum applicable sales charge except where “without sales charge” is indicated. Current performance may be lower or higher than the performance quoted. Returns do not consider capital gains or income taxes on an individual’s investment. Returns for periods of less than one year are cumulative and not annualized. For performance data current to the most recent month-end, visit oppenheimerfunds.com or call 1.800.CALL OPP (225.5677).
*January 30, 2015, was the last business day of the Fund’s semiannual period. See Note 2 of the accompanying Notes to Financial Statements. Index returns are calculated through January 31, 2015.
2 OPPENHEIMER MAIN STREET SELECT FUND
Fund Performance Discussion
During the reporting period, the Fund’s Class A shares (without sales charge) produced a cumulative total return of -0.48%. On a relative basis, the Fund underperformed the Russell 3000 Index (the “Index”) and the S&P 500 Index, which returned 4.38% and 4.37%, respectively. The Fund underperformed the Index primarily within the financials, industrials, consumer staples and energy sectors due to less favorable stock selection. The Fund outperformed the Index within the materials and information technology sectors, where stronger relative stock selection benefited.
MARKET OVERVIEW
While domestic equity as an asset class performed well in 2014, the ride throughout the year was anything but smooth, with markets experiencing volatility over the second half of 2014 and to begin 2015. Macro influences —particularly the strengthening dollar, flattening yield curve, and tumbling oil price — played a significant role in determining which equities out- or underperformed. Accommodation by the Federal Reserve (the “Fed”), which officially ended its bond-buying stimulus program in October, helped to fuel demand for high-dividend paying stocks such as utilities and real estate investment trusts (“REITs”), while a step-up in merger and acquisition activity — spurred on by the desire to relocate to advantageous low tax jurisdictions — boosted stocks primarily in the health care sector. But not all was rosy. The Fed’s accommodative behavior proved a headwind for many financials as long yields declined, hurting the profitability of banks. The
strengthening U.S. dollar also proved a headwind, especially for multi-national companies where translation from local currencies to the U.S. dollar negatively impacted the bottom line. Consequently, stocks with international businesses broadly underperformed stocks with mostly domestic exposure. Energy was also hit hard due to plummeting commodity prices in an environment of sluggish global economic growth and intensifying geopolitical tensions.
Geopolitical risks, including those concentrated in Ukraine and Russia and the ever-present turmoil in the Middle East, caused investors to fret and resulted in, at times, quite the roller coaster ride. Add to this the fact that growth outside of the U.S. was anemic, at best, leading investors to worry intermittently about the global outlook and its impact on domestic stocks. Though volatility remained below historical averages, these issues caused it to it to spike on a number of occasions throughout the year.
3 OPPENHEIMER MAIN STREET SELECT FUND
FUND REVIEW
Top contributors to performance this reporting period included information technology stocks Apple, Inc. and Skyworks Solutions, Inc., and health care holding Actavis plc. Apple benefited from the introduction of two new iPhones and the expected launch of a new Apple Watch product. The company also rallied in late January on the back of record iPhone sales. Skyworks Solutions is a supplier of analog semiconductors to the wireless industry. The company’s stock benefited from the continued demand for higher bandwidth mobile devices, including Apple’s iPhone 6. High performance requirements have allowed Skyworks to leverage its broad portfolio of products to deliver more complex, higher value, integrated solutions versus the commodity, standalone parts of many of its competitors. Actavis is a specialty pharmaceutical company that markets generic and branded drugs for patients suffering from diseases principally in the central nervous system, gastroenterology and women’s health categories. In early July, Actavis closed its acquisition of Forest Laboratories, which strengthened its existing gastroenterology business and expanded it into new areas of cognitive neuroscience, cardiovascular, respiratory, cystic fibrosis and infectious diseases. In addition to its organic growth potential, Actavis now has an improved tax structure and financial flexibility which allow it to consider additional
acquisitions to bolster its branded and generic businesses. In fact, the company announced plans to acquire Allergan, Inc. over the second half of the reporting period.
Detractors from performance this reporting period included energy stocks National Oilwell Varco, Inc., Noble Energy, Inc. and Chevron Corp. The precipitous decline in the price of oil significantly impacted energy stocks, including these three holdings. National Oilwell Varco provides equipment and services to the oil and gas industry worldwide. Additionally, rising expectations of a deeper downturn in new rig equipment orders and lower spending on oilfield consumables negatively affected the stock. We believe National Oilwell Varco remains an attractive investment, but we have lowered our holdings modestly. Noble has a high sensitivity to oil price changes as it has significant exploration and production operations globally. Growth projections are expected to decline as the company adjusts both its cash flow expectations and balance sheet to reflect a diminished outlook for global energy prices. We have maintained our position and continue to have confidence in management’s ability to execute well at period end. The stock of Chevron, a multinational energy corporation, also experienced declines in this environment as the fall in oil prices negatively impacted the company’s profits. We maintained our position at period end.
4 OPPENHEIMER MAIN STREET SELECT FUND
STRATEGY & OUTLOOK
While we have no crystal ball, we believe domestic equities should continue to be an attractive investment. The U.S. economic outlook remains favorable, with ongoing moderate real growth, low inflationary pressures and little expected impact from the Fed’s initial tightening of the yield curve’s short-end. We believe profit margins, which have expanded to peak historical levels, are unlikely to expand significantly further, but probably can be sustained at current levels. With interest rates remaining low, combined with the fall in oil prices, consumer spending — which is the majority of GDP — should support our outlook for moderate growth.
Shocks to the market — whether economic or geopolitical in nature — will no doubt continue and could result in rising volatility. If true, we expect investors may favor higher-
quality stocks — those that have pricing power, control over costs, and exhibit both improving returns on invested capital and generate excess cash flow. We believe this market environment can favor our consistent approach, which aims to construct an “all weather” portfolio by targeting companies we believe have: 1) sustainable competitive advantages; 2) skilled management with a proven track record of executing effectively; and 3) financial resources with the potential to generate improving profitability, gain market share, and/or return significant cash to shareholders. During times of volatile or slow economic growth such companies frequently widen their lead over weaker competitors. We seek to invest in companies characterized by these qualities at compelling valuations, and believe this disciplined approach is essential in seeking to generate strong long-term performance.
1. Magnus Krantz, Joy Budzinski and Benjamin Ram became portfolio managers in November 2014.
5 OPPENHEIMER MAIN STREET SELECT FUND
Top Holdings and Allocations*
| | |
TOP TEN COMMON STOCK HOLDINGS |
| Apple, Inc. | | 5.5% |
| Tyco International plc | | 4.3 |
| Actavis plc | | 4.3 |
| Comcast Corp., Cl. A | | 3.9 |
Mondelez International, Inc.,
Cl. A | | 3.8 |
| Citigroup, Inc. | | 3.7 |
| Merck & Co., Inc. | | 3.6 |
American International Group,
Inc. | | 3.3 |
| Henkel AG & Co. KGaA | | 3.3 |
| Vulcan Materials Co. | | 3.3 |
Portfolio holdings and allocations are subject to change. Percentages are as of January 30, 2015, and are based on net assets. For more current Fund holdings, please visit oppenheimerfunds.com.
| | |
TOP TEN COMMON STOCK INDUSTRIES |
| Pharmaceuticals | | 10.9% |
Technology Hardware, Storage
& Peripherals | | 8.6 |
| Commercial Banks | | 5.7 |
Health Care Providers &
Services | | 5.5 |
| Oil, Gas & Consumable Fuels | | 5.3 |
| IT Services | | 4.7 |
| Commercial Services & Supplies | | 4.3 |
| Specialty Retail | | 4.1 |
| Media | | 3.9 |
| Food Products | | 3.8 |
Portfolio holdings and allocations are subject to change. Percentages are as of January 30, 2015, and are based on net assets.
SECTOR ALLOCATION
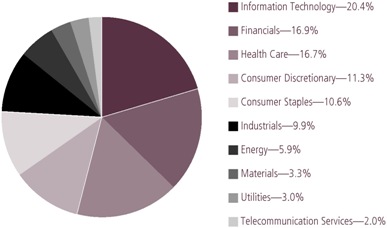
Portfolio holdings and allocations are subject to change. Percentages are as of January 30, 2015, and are based on the total market value of common stocks.
*January 30, 2015, was the last business day of the Fund’s semiannual period. See Note 2 of the accompanying Notes to Financial Statements.
6 OPPENHEIMER MAIN STREET SELECT FUND
Share Class Performance
AVERAGE ANNUAL TOTAL RETURNS WITHOUT SALES CHARGE AS OF 1/30/15
| | | | | | | | | | | | | | | | | | | | |
| | | Inception Date | | | 6-Month | | | 1-Year | | | 5-Year | | | 10-Year | |
Class A (OMSOX) | | | 9/25/00 | | | | -0.48% | | | | 7.04% | | | | 12.63% | | | | 6.42% | |
Class B (OMOBX) | | | 9/25/00 | | | | -0.84% | | | | 6.28% | | | | 11.71% | | | | 5.92% | |
Class C (OMSCX) | | | 9/25/00 | | | | -0.89% | | | | 6.28% | | | | 11.79% | | | | 5.64% | |
Class R (OMSNX) | | | 3/1/01 | | | | -0.60% | | | | 6.78% | | | | 12.31% | | | | 6.11% | |
Class Y (OMSYX) | | | 9/25/00 | | | | -0.36% | | | | 7.38% | | | | 12.98% | | | | 6.80% | |
AVERAGE ANNUAL TOTAL RETURNS WITH SALES CHARGE AS OF 1/30/15
| | | | | | | | | | | | | | | | | | | | |
| | | Inception Date | | | 6-Month | | | 1-Year | | | 5-Year | | | 10-Year | |
Class A (OMSOX) | | | 9/25/00 | | | | -6.20% | | | | 0.88% | | | | 11.30% | | | | 5.80% | |
Class B (OMOBX) | | | 9/25/00 | | | | -5.79% | | | | 1.28% | | | | 11.45% | | | | 5.92% | |
Class C (OMSCX) | | | 9/25/00 | | | | -1.88% | | | | 5.28% | | | | 11.79% | | | | 5.64% | |
Class R (OMSNX) | | | 3/1/01 | | | | -1.60% | | | | 5.78% | | | | 12.31% | | | | 6.11% | |
Class Y (OMSYX) | | | 9/25/00 | | | | -0.36% | | | | 7.38% | | | | 12.98% | | | | 6.80% | |
Performance data quoted represents past performance, which does not guarantee future results. The investment return and principal value of an investment in the Fund will fluctuate so that an investor’s shares, when redeemed, may be worth more or less than their original cost. Current performance may be lower or higher than the performance quoted. Returns do not consider capital gains or income taxes on an individual’s investment. For performance data current to the most recent month-end, visit oppenheimerfunds.com or call 1.800.CALL OPP (225.5677). Fund returns include changes in share price, reinvested distributions, and the applicable sales charge: for Class A shares, the current maximum initial sales charge of 5.75%; for Class B shares, the contingent deferred sales charge (“CDSC”) of 5% (1-year) and 2% (5-year); and for Class C shares, the 1% CDSC for the 1-year period. Prior to 7/1/14, Class R shares were named Class N shares. Beginning 7/1/14, new purchases of Class R shares will no longer be subject to a CDSC upon redemption (any CDSC will remain in effect for purchases prior to 7/1/14). There is no sales charge for Class Y shares. Because Class B shares convert to Class A shares 72 months after purchase, 10-year returns for Class B shares reflect Class A performance for the period after conversion. Returns for periods of less than one year are cumulative and not annualized.
The Fund’s performance is compared to the performance of the Russell 3000 Index, the Russell 1000 Index and the S&P 500 Index. The Russell 3000 Index measures the performance of the largest 3,000 U.S. companies, representing approximately 98% of the investable U.S. equity market. The Russell 1000 Index measures the performance of the large-cap segment of the U.S. equity universe. The S&P 500 Index is a broad-based measure of domestic stock performance. The Fund has changed its benchmark from the S&P 500 Index to the Russell 3000 Index, which it believes is a more appropriate measure of the Fund’s performance. The Indices are unmanaged and cannot be purchased directly by investors. Index performance is shown for illustrative purposes only and does not predict or depict the performance of the Fund. While index comparisons may be useful to provide a benchmark for the Fund’s performance, it must be noted that the Fund’s investments are not limited to the investments comprising the Index. Index performance includes reinvestment of income, but
7 OPPENHEIMER MAIN STREET SELECT FUND
does not reflect transaction costs, fees, expenses or taxes. Index performance is shown for illustrative purposes only as a benchmark for the Fund’s performance, and does not predict or depict performance of the Fund. The Fund’s performance reflects the effects of the Fund’s business and operating expenses.
The Fund’s investment strategy and focus can change over time. The mention of specific fund holdings does not constitute a recommendation by OppenheimerFunds, Inc. or its affiliates.
Before investing in any of the Oppenheimer funds, investors should carefully consider a fund’s investment objectives, risks, charges and expenses. Fund prospectuses and summary prospectuses contain this and other information about the funds, and may be obtained by asking your financial advisor, visiting oppenheimerfunds.com, or calling 1.800.CALL OPP (225.5677). Read prospectuses and summary prospectuses carefully before investing.
8 OPPENHEIMER MAIN STREET SELECT FUND
Fund Expenses
Fund Expenses. As a shareholder of the Fund, you incur two types of costs: (1) transaction costs, which may include sales charges (loads) on purchase payments, contingent deferred sales charges on redemptions; and (2) ongoing costs, including management fees; distribution and service fees; and other Fund expenses. These examples are intended to help you understand your ongoing costs (in dollars) of investing in the Fund and to compare these costs with the ongoing costs of investing in other mutual funds.
The examples are based on an investment of $1,000.00 invested at the beginning of the period and held for the entire 6-month period ended January 30, 2015.
Actual Expenses. The first section of the table provides information about actual account values and actual expenses. You may use the information in this section for the class of shares you hold, together with the amount you invested, to estimate the expense that you paid over the period. Simply divide your account value by $1,000.00 (for example, an $8,600.00 account value divided by $1,000.00 = 8.60), then multiply the result by the number in the first section under the heading entitled “Expenses Paid During 6 Months Ended January 30, 2015” to estimate the expenses you paid on your account during this period.
Hypothetical Example for Comparison Purposes. The second section of the table provides information about hypothetical account values and hypothetical expenses based on the Fund’s actual expense ratio for each class of shares, and an assumed rate of return of 5% per year for each class before expenses, which is not the Fund’s actual return. The hypothetical account values and expenses may not be used to estimate the actual ending account balance or expenses you paid for the period. You may use this information to compare the ongoing costs of investing in the Fund and other funds. To do so, compare this 5% hypothetical example for the class of shares you hold with the 5% hypothetical examples that appear in the shareholder reports of the other funds.
Please note that the expenses shown in the table are meant to highlight your ongoing costs only and do not reflect any transactional costs, such as front-end or contingent deferred sales charges (loads). Therefore, the “hypothetical” section of the table is useful in comparing ongoing costs only, and will not help you determine the relative total costs of owning different funds. In addition, if these transactional costs were included, your costs would have been higher.
9 OPPENHEIMER MAIN STREET SELECT FUND
| | | | | | | | | | | | | | | | | | | | |
| Actual | | | | Beginning
Account Value
August 1, 2014 | | Ending Account Value
January 30, 2015 | | Expenses
Paid During
6 Months Ended
January 30, 2015 |
Class A | | | | $ | 1,000.00 | | | | | $ | 995.20 | | | | | $ | 5.72 | | | |
Class B | | | | | 1,000.00 | | | | | | 991.60 | | | | | | 9.53 | | | |
Class C | | | | | 1,000.00 | | | | | | 991.10 | | | | | | 9.48 | | | |
Class R | | | | | 1,000.00 | | | | | | 994.00 | | | | | | 6.97 | | | |
Class Y | | | | | 1,000.00 | | | | | | 996.40 | | | | | | 4.46 | | | |
Hypothetical (5% return before expenses) | | | | | | | | | |
Class A | | | | | 1,000.00 | | | | | | 1,019.35 | | | | | | 5.79 | | | |
Class B | | | | | 1,000.00 | | | | | | 1,015.54 | | | | | | 9.65 | | | |
Class C | | | | | 1,000.00 | | | | | | 1,015.59 | | | | | | 9.59 | | | |
Class R | | | | | 1,000.00 | | | | | | 1,018.10 | | | | | | 7.06 | | | |
Class Y | | | | | 1,000.00 | | | | | | 1,020.61 | | | | | | 4.52 | | | |
Expenses are equal to the Fund’s annualized expense ratio for that class, multiplied by the average account value over the period, multiplied by 183/365 (to reflect the one-half year period). Those annualized expense ratios, excluding indirect expenses from affiliated funds, based on the 6-month period ended January 30, 2015 are as follows:
| | | | |
| Class | | Expense Ratios | |
| Class A | | | 1.14 | % |
| Class B | | | 1.90 | |
| Class C | | | 1.89 | |
| Class R | | | 1.39 | |
| Class Y | | | 0.89 | |
The expense ratios reflect voluntary and/or contractual waivers and/or reimbursements of expenses by the Fund’s Manager. Some of these undertakings may be modified or terminated at any time, as indicated in the Fund’s prospectus. The “Financial Highlights” tables in the Fund’s financial statements, included in this report, also show the gross expense ratios, without such waivers or reimbursements and reduction to custodian expenses, if applicable.
10 OPPENHEIMER MAIN STREET SELECT FUND
STATEMENT OF INVESTMENTS January 30, 2015* Unaudited
| | | | | | | | |
| | | Shares | | | Value | |
Common Stocks—98.1% | | | | | | | | |
Consumer Discretionary—11.1% | | | | | | | | |
Auto Components—3.1% | | | | | | | | |
Delphi Automotive plc | | | 673,330 | | | $ | 46,277,971 | |
Media—3.9% | | | | | | | | |
Comcast Corp., Cl. A | | | 1,084,700 | | | | 57,646,382 | |
Specialty Retail—4.1% | | | | | | | | |
AutoZone, Inc.1 | | | 75,300 | | | | 44,951,088 | |
Sally Beauty Holdings, Inc.1 | | | 487,780 | | | | 15,160,202 | |
| | | | | | | | |
| | | | | | | | 60,111,290 | |
Consumer Staples—10.3% | | | | | | | | |
Beverages—3.2% | | | | | | | | |
Diageo plc | | | 1,608,260 | | | | 47,638,293 | |
Food Products—3.8% | | | | | | | | |
Mondelez International, Inc., Cl. A | | | 1,595,380 | | | | 56,221,191 | |
Household Products—3.3% | | | | | | | | |
Henkel AG & Co. KGaA | | | 479,132 | | | | 49,151,870 | |
Energy—5.8% | | | | | | | | |
Energy Equipment & Services—0.5% | | | | | |
National Oilwell Varco, Inc. | | | 130,870 | | | | 7,123,254 | |
Oil, Gas & Consumable Fuels—5.3% | |
Chevron Corp. | | | 441,651 | | | | 45,282,477 | |
Noble Energy, Inc. | | | 706,760 | | | | 33,740,723 | |
| | | | | | | | |
| | | | | | | | 79,023,200 | |
Financials—16.5% | | | | | | | | |
Commercial Banks—5.7% | | | | | | | | |
CIT Group, Inc. | | | 682,438 | | | | 29,904,433 | |
Citigroup, Inc. | | | 1,181,720 | | | | 55,481,754 | |
| | | | | | | | |
| | | | | | | | 85,386,187 | |
Consumer Finance—3.0% | | | | | | | | |
Discover Financial Services | | | 822,840 | | | | 44,746,039 | |
Diversified Financial Services—2.2% | |
CME Group, Inc., Cl. A | | | 376,620 | | | | 32,125,686 | |
| | | | | | | | |
| | | Shares | | | Value | |
Insurance—3.3% | | | | | | | | |
American International Group, Inc. | | | 1,005,850 | | | $ | 49,155,890 | |
Real Estate Investment Trusts (REITs)—2.3% | |
Simon Property Group, Inc. | | | 169,010 | | | | 33,575,527 | |
Health Care—16.4% | | | | | | | | |
Health Care Providers & Services—5.5% | |
Express Scripts Holding Co.1 | | | 553,930 | | | | 44,707,690 | |
HCA Holdings, Inc.1 | | | 518,580 | | | | 36,715,464 | |
| | | | | | | | |
| | | | | | | | 81,423,154 | |
Pharmaceuticals—10.9% | | | | | | | | |
AbbVie, Inc. | | | 451,088 | | | | 27,223,161 | |
Actavis plc1 | | | 236,700 | | | | 63,090,018 | |
Merck & Co., Inc. | | | 886,130 | | | | 53,415,916 | |
Salix Pharmaceuticals Ltd.1 | | | 131,940 | | | | 17,768,360 | |
| | | | | | | | |
| | | | | | | | 161,497,455 | |
Industrials—9.7% | | | | | | | | |
Aerospace & Defense—3.0% | | | | | | | | |
United Technologies Corp. | | | 385,890 | | | | 44,292,454 | |
Commercial Services & Supplies—4.3% | |
Tyco International plc | | | 1,558,400 | | | | 63,598,304 | |
Road & Rail—2.4% | | | | | | | | |
Canadian National Railway Co. | | | 545,440 | | | | 35,988,131 | |
Information Technology—20.0% | | | | | | | | |
Internet Software & Services—3.0% | |
eBay, Inc.1 | | | 850,840 | | | | 45,094,520 | |
IT Services—4.7% | | | | | | | | |
MasterCard, Inc., Cl. A | | | 465,460 | | | | 38,181,683 | |
Xerox Corp. | | | 2,338,340 | | | | 30,795,938 | |
| | | | | | | | |
| | | | | | | | 68,977,621 | |
Semiconductors & Semiconductor Equipment—2.5% | |
Skyworks Solutions, Inc. | | | 447,040 | | | | 37,126,672 | |
11 OPPENHEIMER MAIN STREET SELECT FUND
STATEMENT OF INVESTMENTS Unaudited / Continued
| | | | | | | | |
| | | Shares | | | Value | |
Software—1.2% | | | | | | | | |
ServiceNow, Inc.1 | | | 241,260 | | | $ | 17,587,854 | |
| Technology Hardware, Storage & Peripherals—8.6% | |
Apple, Inc. | | | 689,442 | | | | 80,775,025 | |
Western Digital Corp. | | | 480,130 | | | | 46,683,040 | |
| | | | | | | | |
| | | | | | | 127,458,065 | |
Materials—3.3% | | | | | | | | |
Construction Materials—3.3% | | | | | | | | |
Vulcan Materials Co. | | | 683,540 | | | | 48,196,405 | |
Telecommunication Services—2.0% | |
| Diversified Telecommunication Services—2.0% | |
Verizon Communications, Inc. | | | 645,870 | | | | 29,522,718 | |
| | | | | | | | |
| | | Shares | | | Value | |
Utilities—3.0% | | | | | | | | |
Electric Utilities—3.0% | | | | | | | | |
Exelon Corp. | | | 1,214,108 | | | $ | 43,756,452 | |
| | | | | | | | |
Total Common Stocks
(Cost $1,186,650,435) | | | | | | | 1,452,702,585 | |
Investment Company—0.8% | | | | | |
Oppenheimer Institutional Money Market Fund, Cl. E, 0.10%2,3
(Cost $11,266,667) | | | 11,266,667 | | | | 11,266,667 | |
| Total Investments, at Value (Cost $1,197,917,102) | | | 98.9 | % | | | 1,463,969,252 | |
Net Other Assets (Liabilities) | | | 1.1 | | | | 16,609,129 | |
| | | | |
Net Assets | | | 100.0 | % | | $ | 1,480,578,381 | |
| | | | |
Footnotes to Statement of Investments
*January 30, 2015 represents the last business day of the Fund’s reporting period. See Note 2 of the accompanying Notes.
1. Non-income producing security.
2. Rate shown is the 7-day yield as of January 30, 2015.
3. Is or was an affiliate, as defined in the Investment Company Act of 1940, as amended, at or during the period ended January 30, 2015, by virtue of the Fund owning at least 5% of the voting securities of the issuer or as a result of the Fund and the issuer having the same investment adviser. Transactions during the period in which the issuer was an affiliate are as follows:
| | | | | | | | | | | | | | | | |
| | | Shares
July 31, 2014 | | | Gross Additions | | | Gross Reductions | | | Shares
January 30, 2015 | |
Oppenheimer Institutional Money Market Fund, Cl. E | | | 14,407,887 | | | | 209,218,828 | | | | 212,360,048 | | | | 11,266,667 | |
| | | | |
| | | | | | | | | Value | | | Income | |
Oppenheimer Institutional Money Market Fund, Cl. E | | | $ | 11,266,667 | | | $ | 10,292 | |
See accompanying Notes to Financial Statements.
12 OPPENHEIMER MAIN STREET SELECT FUND
STATEMENT OF ASSETS AND LIABILITIES January 30, 20151 Unaudited
| | | | | | |
Assets | | | | | | |
Investments, at value—see accompanying statement of investments: | | | | | | |
Unaffiliated companies (cost $1,186,650,435) | | $ | 1,452,702,585 | | | |
Affiliated companies (cost $11,266,667) | | | 11,266,667 | | | |
| | | |
| | | 1,463,969,252 | | | |
Cash | | | 500,002 | | | |
Receivables and other assets: | | | | | | |
Investments sold | | | 44,967,451 | | | |
Dividends | | | 1,144,707 | | | |
Shares of beneficial interest sold | | | 819,479 | | | |
Other | | | 115,571 | | | |
| | | |
Total assets | | | 1,511,516,462 | | | |
Liabilities | | | | | | |
Bank overdraft-foreign | | | 587 | | | |
Payables and other liabilities: | | | | | | |
Investments purchased | | | 27,999,813 | | | |
Shares of beneficial interest redeemed | | | 2,501,959 | | | |
Distribution and service plan fees | | | 320,529 | | | |
Trustees’ compensation | | | 88,238 | | | |
Shareholder communications | | | 4,897 | | | |
Other | | | 22,058 | | | |
| | | |
Total liabilities | | | 30,938,081 | | | |
| | | | | | |
Net Assets | | $ | 1,480,578,381 | | | |
| | | |
| | | | | | |
Composition of Net Assets | | | | | | |
Par value of shares of beneficial interest | | $ | 79,299 | | | |
Additional paid-in capital | | | 1,227,918,642 | | | |
Accumulated net investment loss | | | (1,074,827 | ) | | |
Accumulated net realized loss on investments and foreign currency transactions | | | (12,385,549 | ) | | |
Net unrealized appreciation on investments and translation of assets and liabilities denominated in foreign currencies | | | 266,040,816 | | | |
| | | |
Net Assets | | $ | 1,480,578,381 | | | |
| | | |
1. January 30, 2015 represents the last business day of the Fund’s reporting period. See Note 2 of the accompanying Notes.
13 OPPENHEIMER MAIN STREET SELECT FUND
STATEMENT OF ASSETS AND LIABILITIES Unaudited / Continued
| | | | |
Net Asset Value Per Share | | | | |
Class A Shares: | | | | |
| |
| Net asset value and redemption price per share (based on net assets of $1,041,022,850 and 54,984,459 shares of beneficial interest outstanding) | | $ | 18.93 | |
Maximum offering price per share (net asset value plus sales charge of 5.75% of offering price) | | $ | 20.08 | |
Class B Shares: | | | | |
| |
| Net asset value, redemption price (excludes applicable contingent deferred sales charge) and offering price per share (based on net assets of $45,195,269 and 2,565,581 shares of beneficial interest outstanding) | | $ | 17.62 | |
Class C Shares: | | | | |
| |
| Net asset value, redemption price (excludes applicable contingent deferred sales charge) and offering price per share (based on net assets of $259,198,532 and 14,566,984 shares of beneficial interest outstanding) | | $ | 17.79 | |
Class R Shares: | | | | |
| |
| Net asset value, redemption price (excludes applicable contingent deferred sales charge) and offering price per share (based on net assets of $78,171,374 and 4,219,962 shares of beneficial interest outstanding) | | $ | 18.52 | |
Class Y Shares: | | | | |
| |
| Net asset value, redemption price and offering price per share (based on net assets of $56,990,356 and 2,962,402 shares of beneficial interest outstanding) | | $ | 19.24 | |
See accompanying Notes to Financial Statements.
14 OPPENHEIMER MAIN STREET SELECT FUND
| | |
| STATEMENT OF OPERATIONS | | For the Six Months Ended January 30, 20151 Unaudited |
| | | | | | |
Investment Income | | | | | | |
Dividends: | | | | | | |
Unaffiliated companies (net of foreign withholding taxes of $46,377) | | $ | 12,748,897 | | | |
Affiliated companies | | | 10,292 | | | |
Interest | | | 261 | | | |
| | | |
Total investment income | | | 12,759,450 | | | |
Expenses | | | | | | |
Management fees | | | 5,176,828 | | | |
Distribution and service plan fees: | | | | | | |
Class A | | | 1,359,234 | | | |
Class B | | | 261,500 | | | |
Class C | | | 1,378,959 | | | |
Class R | | | 216,038 | | | |
Transfer and shareholder servicing agent fees: | | | | | | |
Class A | | | 1,220,160 | | | |
Class B | | | 57,770 | | | |
Class C | | | 304,498 | | | |
Class R | | | 96,239 | | | |
Class Y | | | 63,394 | | | |
Shareholder communications: | | | | | | |
Class A | | | 13,385 | | | |
Class B | | | 1,898 | | | |
Class C | | | 3,196 | | | |
Class R | | | 552 | | | |
Class Y | | | 439 | | | |
Trustees’ compensation | | | 25,330 | | | |
Custodian fees and expenses | | | 6,575 | | | |
Other | | | 46,251 | | | |
| | | |
Total expenses | | | 10,232,246 | | | |
Less waivers and reimbursements of expenses | | | (10,987 | ) | | |
| | | |
Net expenses | | | 10,221,259 | | | |
Net Investment Income | | | 2,538,191 | | | |
Realized and Unrealized Gain (Loss) | | | | | | |
Net realized gain (loss) on: | | | | | | |
Investments from unaffiliated companies | | | 163,630,333 | | | |
Foreign currency transactions | | | (16,930 | ) | | |
| | | |
Net realized gain | | | 163,613,403 | | | |
Net change in unrealized appreciation/depreciation on: | | | | | | |
Investments | | | (162,000,027 | ) | | |
Translation of assets and liabilities denominated in foreign currencies | | | (10,555,884 | ) | | |
| | | |
Net change in unrealized appreciation/depreciation | | | (172,555,911 | ) | | |
Net Decrease in Net Assets Resulting from Operations | | $ | (6,404,317 | ) | | |
| | | |
1. January 30, 2015 represents the last business day of the Fund’s reporting period. See Note 2 of the accompanying Notes.
See accompanying Notes to Financial Statements.
15 OPPENHEIMER MAIN STREET SELECT FUND
STATEMENTS OF CHANGES IN NET ASSETS
| | | | | | |
| | | Six Months Ended
January 30, 20151
(Unaudited) | | Year Ended
July 31, 2014 | | |
Operations | | | | | | |
Net investment income | | $ 2,538,191 | | $ 1,840,464 | | |
Net realized gain | | 163,613,403 | | 245,989,153 | | |
Net change in unrealized appreciation/depreciation | | (172,555,911) | | (9,176,247) | | |
| | | | |
Net increase (decrease) in net assets resulting from operations | | (6,404,317) | | 238,653,370 | | |
Dividends and/or Distributions to Shareholders | | | | | | |
Dividends from net investment income: | | | | | | |
Class A | | (3,953,935) | | (3,581,882) | | |
Class B | | (4,019) | | — | | |
Class C | | (21,745) | | — | | |
Class R2 | | (80,757) | | (46,892) | | |
Class Y | | (364,382) | | (433,613) | | |
| | |
| | (4,424,838) | | (4,062,387) | | |
Beneficial Interest Transactions | | | | | | |
Net decrease in net assets resulting from beneficial interest transactions: | | | | | | |
Class A | | (58,663,415) | | (107,637,897) | | |
Class B | | (11,671,173) | | (27,200,587) | | |
Class C | | (14,089,547) | | (26,211,661) | | |
Class R2 | | (11,168,425) | | (14,617,722) | | |
Class Y | | (3,791,376) | | (33,149,646) | | |
| | | | |
| | (99,383,936) | | (208,817,513) | | |
Net Assets | | | | | | |
Total increase (decrease) | | (110,213,091) | | 25,773,470 | | |
Beginning of period | | 1,590,791,472 | | 1,565,018,002 | | |
| | | | |
| End of period (including accumulated net investment income (loss) of $(1,074,827) and $811,820, respectively) | | $1,480,578,381 | | $1,590,791,472 | | |
| | |
1. January 30, 2015 represents the last business day of the Fund’s reporting period. See Note 2 of the accompanying Notes.
2. Effective July 1, 2014, Class N shares were renamed Class R. See Note 1 of the accompanying Notes.
See accompanying Notes to Financial Statements.
16 OPPENHEIMER MAIN STREET SELECT FUND
FINANCIAL HIGHLIGHTS
| | | | | | | | | | | | | | | | | | | | | | | | | | |
| Class A | | Six Months Ended January 30, 20151 (Unaudited) | | | Year Ended
July 31, 2014 | | | Year Ended
July 31, 2013 | | | Year Ended July 31, 2012 | | | Year Ended July 29, 20111 | | | Year Ended July 30, 20101 | | | |
Per Share Operating Data | | | | | | | | | | | | | | | | | | | | | | |
Net asset value, beginning of period | | $ | 19.09 | | | $ | 16.47 | | | $ | 13.71 | | | $ | 12.52 | | | $ | 11.11 | | | $ | 9.81 | | | |
Income (loss) from investment operations: | | | | | | | | | | | | | | | | | | | | | | |
Net investment income2 | | | 0.05 | | | | 0.05 | | | | 0.11 | | | | 0.05 | | | | 0.02 | | | | 0.05 | | | |
Net realized and unrealized gain (loss) | | | (0.14 | ) | | | 2.63 | | | | 2.74 | | | | 1.16 | | | | 1.39 | | | | 1.29 | | | |
| | | |
Total from investment operations | | | (0.09 | ) | | | 2.68 | | | | 2.85 | | | | 1.21 | | | | 1.41 | | | | 1.34 | | | |
Dividends and/or distributions to shareholders: | | | | | | | | | | | | | | | | | | | | | | |
Dividends from net investment income | | | (0.07 | ) | | | (0.06 | ) | | | (0.09 | ) | | | (0.02 | ) | | | 0.00 | | | | (0.03 | ) | | |
Tax return of capital distribution | | | 0.00 | | | | 0.00 | | | | 0.00 | | | | 0.00 | | | | 0.00 | | | | (0.01 | ) | | |
| | | |
Total dividends and/or distributions to shareholders | | | (0.07 | ) | | | (0.06 | ) | | | (0.09 | ) | | | (0.02 | ) | | | 0.00 | | | | (0.04 | ) | | |
Net asset value, end of period | | $ | 18.93 | | | $ | 19.09 | | | $ | 16.47 | | | $ | 13.71 | | | $ | 12.52 | | | $ | 11.11 | | | |
| | | |
| | | | | | | | | | | | | | | | | | | | | | | | | | |
| | | | | | | | | | | | | | | | | | | | | | | | | | |
| | | | | | | | | | | | | | | | | | | | | | | | | | |
Total Return, at Net Asset Value3 | | | (0.48)% | | | | 16.29% | | | | 20.93% | | | | 9.73% | | | | 12.69% | | | | 13.69% | | | |
| | | | | | | | | | | | | | | | | | | | | | | | | | |
Ratios/Supplemental Data | | | | | | | | | | | | | | | | | | | | | | |
Net assets, end of period (in thousands) | | $ | 1,041,023 | | | $ | 1,107,747 | | | $ | 1,053,568 | | | $ | 962,017 | | | $ | 988,188 | | | $ | 1,025,633 | | | |
Average net assets (in thousands) | | $ | 1,094,204 | | | $ | 1,102,039 | | | $ | 1,002,463 | | | $ | 940,509 | | | $ | 1,063,673 | | | $ | 1,065,511 | | | |
Ratios to average net assets:4 | | | | | | | | | | | | | | | | | | | | | | |
Net investment income | | | 0.48% | | | | 0.28% | | | | 0.74% | | | | 0.40% | | | | 0.13% | | | | 0.44% | | | |
Total expenses5 | | | 1.14% | | | | 1.14% | | | | 1.19% | | | | 1.24% | | | | 1.22% | | | | 1.25% | | | |
| Expenses after payments, waivers and/or reimbursements and reduction to custodian expenses | | | 1.14% | | | | 1.14% | | | | 1.19% | | | | 1.24% | | | | 1.22% | | | | 1.25% | | | |
Portfolio turnover rate | | | 36% | | | | 49% | | | | 40% | | | | 37% | | | | 58% | | | | 66% | | | |
17 OPPENHEIMER MAIN STREET SELECT FUND
FINANCIAL HIGHLIGHTS Continued
1. January 30, 2015, July 29, 2011 and July 30, 2010 represent the last business days of the Fund’s respective reporting periods. See Note 2 of the accompanying Notes.
2. Per share amounts calculated based on the average shares outstanding during the period.
3. Assumes an initial investment on the business day before the first day of the fiscal period, with all dividends and distributions reinvested in additional shares on the reinvestment date, and redemption at the net asset value calculated on the last business day of the fiscal period. Sales charges are not reflected in the total returns. Total returns are not annualized for periods less than one full year. Returns do not reflect the deduction of taxes that a shareholder would pay on fund distributions or the redemption of fund shares. The returns do not include adjustments in accordance with generally accepted accounting principles required at the period end for financial reporting purposes.
4. Annualized for periods less than one full year.
5. Total expenses including indirect expenses from affiliated fund fees and expenses were as follows:
| | | | |
Six Months Ended January 30, 2015 | | | 1.14 | % |
Year Ended July 31, 2014 | | | 1.14 | % |
Year Ended July 31, 2013 | | | 1.19 | % |
Year Ended July 31, 2012 | | | 1.24 | % |
Year Ended July 29, 2011 | | | 1.22 | % |
Year Ended July 30, 2010 | | | 1.25 | % |
See accompanying Notes to Financial Statements.
18 OPPENHEIMER MAIN STREET SELECT FUND
| | | | | | | | | | | | | | | | | | | | | | | | | | |
| Class B | | Six Months
Ended
January 30,
20151
(Unaudited) | | | Year Ended
July 31,
2014 | | | Year Ended
July 31,
2013 | | | Year Ended
July 31,
2012 | | | Year Ended
July 29,
20111 | | | Year Ended
July 30,
20101 | | | |
Per Share Operating Data | | | | | | | | | | | | | | | | | | |
Net asset value, beginning of period | | $ | 17.77 | | | $ | 15.40 | | | $ | 12.85 | | | $ | 11.81 | | | $ | 10.56 | | | $ | 9.36 | | | |
Income (loss) from investment operations: | | | | | | | | | | | | | | | | | | |
Net investment loss2 | | | (0.02 | ) | | | (0.09 | ) | | | (0.02 | ) | | | (0.05 | ) | | | (0.08 | ) | | | (0.04 | ) | | |
Net realized and unrealized gain (loss) | | | (0.13 | ) | | | 2.46 | | | | 2.57 | | | | 1.09 | | | | 1.33 | | | | 1.24 | | | |
| | | |
Total from investment operations | | | (0.15 | ) | | | 2.37 | | | | 2.55 | | | | 1.04 | | | | 1.25 | | | | 1.20 | | | |
| Dividends and/or distributions to shareholders: | | | | | | | | | | | | | | | | | | |
Dividends from net investment income | | | 0.00 | 3 | | | 0.00 | | | | 0.00 | | | | 0.00 | | | | 0.00 | | | | 0.00 | | | |
Tax return of capital distribution | | | 0.00 | | | | 0.00 | | | | 0.00 | | | | 0.00 | | | | 0.00 | | | | 0.00 | | | |
| | | |
| Total dividends and/or distributions to shareholders | | | 0.00 | 3 | | | 0.00 | | | | 0.00 | | | | 0.00 | | | | 0.00 | | | | 0.00 | | | |
Net asset value, end of period | | $ | 17.62 | | | $ | 17.77 | | | $ | 15.40 | | | $ | 12.85 | | | $ | 11.81 | | | $ | 10.56 | | | |
| | | |
| | | | | | | | | | | | | | | | | | | | | | | | | | |
Total Return, at Net Asset Value4 | | | (0.84)% | | | | 15.39% | | | | 19.84% | | | | 8.81% | | | | 11.84% | | | | 12.82% | | | |
| | | | | | | | | | | | | | | | | | | | | | | | | | |
Ratios/Supplemental Data | | | | | | | | | | | | | | | | | | |
Net assets, end of period (in thousands) | | $ | 45,195 | | | $ | 57,058 | | | $ | 74,439 | | | $ | 93,397 | | | $ | 120,245 | | | $ | 150,292 | | | |
Average net assets (in thousands) | | $ | 51,787 | | | $ | 66,878 | | | $ | 82,399 | | | $ | 103,801 | | | $ | 141,973 | | | $ | 172,970 | | | |
Ratios to average net assets:5 | | | | | | | | | | | | | | | | | | |
Net investment loss | | | (0.27)% | | | | (0.54)% | | | | (0.11)% | | | | (0.44)% | | | | (0.69)% | | | | (0.35)% | | | |
Total expenses6 | | | 1.90% | | | | 1.97% | | | | 2.17% | | | | 2.23% | | | | 2.20% | | | | 2.23% | | | |
| Expenses after payments, waivers and/or reimbursements and reduction to custodian expenses | | | 1.90% | | | | 1.96% | | | | 2.07% | | | | 2.08% | | | | 2.05% | | | | 2.06% | | | |
Portfolio turnover rate | | | 36% | | | | 49% | | | | 40% | | | | 37% | | | | 58% | | | | 66% | | | |
1. January 30, 2015, July 29, 2011 and July 30, 2010 represent the last business days of the Fund’s respective reporting periods. See Note 2 of the accompanying Notes.
2. Per share amounts calculated based on the average shares outstanding during the period.
3. Less than $0.005 per share.
4. Assumes an initial investment on the business day before the first day of the fiscal period, with all dividends and distributions reinvested in additional shares on the reinvestment date, and redemption at the net asset value calculated on the last business day of the fiscal period. Sales charges are not reflected in the total returns. Total returns are not annualized for periods less than one full year. Returns do not reflect the deduction of taxes that a shareholder would pay on fund distributions or the redemption of fund shares. The returns do not include adjustments in accordance with generally accepted accounting principles required at the period end for financial reporting purposes.
5. Annualized for periods less than one full year.
6. Total expenses including indirect expenses from affiliated fund fees and expenses were as follows:
| | | | | | |
| | Six Months Ended January 30, 2015 | | | 1.90 | % |
| | Year Ended July 31, 2014 | | | 1.97 | % |
| | Year Ended July 31, 2013 | | | 2.17 | % |
| | Year Ended July 31, 2012 | | | 2.23 | % |
| | Year Ended July 29, 2011 | | | 2.20 | % |
| | Year Ended July 30, 2010 | | | 2.23 | % |
See accompanying Notes to Financial Statements.
19 OPPENHEIMER MAIN STREET SELECT FUND
FINANCIAL HIGHLIGHTS Continued
| | | | | | | | | | | | | | | | | | | | | | | | | | | | |
| Class C | | Six Months
Ended
January 30,
20151
(Unaudited) | | | Year Ended
July 31,
2014 | | | Year Ended
July 31,
2013 | | | Year Ended
July 31,
2012 | | | Year Ended
July 29,
20111 | | | Year Ended
July 30,
20101 | | | | | |
Per Share Operating Data | | | | | | | | | | | | | | | | | | | | | | | | | | | | |
Net asset value, beginning of period | | $ | 17.95 | | | $ | 15.55 | | | $ | 12.95 | | | $ | 11.90 | | | $ | 10.63 | | | $ | 9.42 | | | | | |
Income (loss) from investment operations: | | | | | | | | | | | | | | | | | | | | | | | | | | | | |
Net investment loss2 | | | (0.02 | ) | | | (0.08 | ) | | | 0.00 | 3 | | | (0.04 | ) | | | (0.07 | ) | | | (0.03 | ) | | | | |
Net realized and unrealized gain (loss) | | | (0.14 | ) | | | 2.48 | | | | 2.60 | | | | 1.09 | | | | 1.34 | | | | 1.24 | | | | | |
| | | |
Total from investment operations | | | (0.16 | ) | | | 2.40 | | | | 2.60 | | | | 1.05 | | | | 1.27 | | | | 1.21 | | | | | |
Dividends and/or distributions to shareholders: | | | | | | | | | | | | | | | | | | | | | | | | | | | | |
Dividends from net investment income | | | 0.00 | 3 | | | 0.00 | | | | 0.00 | | | | 0.00 | | | | 0.00 | | | | 0.00 | | | | | |
Tax return of capital distribution | | | 0.00 | | | | 0.00 | | | | 0.00 | | | | 0.00 | | | | 0.00 | | | | 0.00 | | | | | |
| | | |
Total dividends and/or distributions to shareholders | | | 0.00 | 3 | | | 0.00 | | | | 0.00 | | | | 0.00 | | | | 0.00 | | | | 0.00 | | | | | |
Net asset value, end of period | | $ | 17.79 | | | $ | 17.95 | | | $ | 15.55 | | | $ | 12.95 | | | $ | 11.90 | | | $ | 10.63 | | | | | |
| | | |
| | | | | | | | | | | | | | | | | | | | | | | | | | | | |
| | | | | | | | | | | | | | | | | | | | | | | | | | | | |
| | | | | | | | | | | | | | | | | | | | | | | | | | | | |
Total Return, at Net Asset Value4 | | | (0.89)% | | | | 15.44% | | | | 20.08% | | | | 8.82% | | | | 11.95% | | | | 12.85% | | | | | |
| | | | | | | | | | | | | | | | | | | | | | | | | | | | |
Ratios/Supplemental Data | | | | | | | | | | | | | | | | | | | | | | | | | | | | |
Net assets, end of period (in thousands) | | $ | 259,199 | | | $ | 275,348 | | | $ | 262,506 | | | $ | 241,730 | | | $ | 266,186 | | | $ | 282,261 | | | | | |
Average net assets (in thousands) | | $ | 273,071 | | | $ | 273,813 | | | $ | 249,962 | | | $ | 241,841 | | | $ | 290,329 | | | $ | 299,670 | | | | | |
Ratios to average net assets:5 | | | | | | | | | | | | | | | | | | | | | | | | | | | | |
Net investment loss | | | (0.27)% | | | | (0.47)% | | | | 0.00%6 | | | | (0.34)% | | | | (0.60)% | | | | (0.30)% | | | | | |
Total expenses7 | | | 1.89% | | | | 1.88% | | | | 1.93% | | | | 1.98% | | | | 1.95% | | | | 2.00% | | | | | |
| Expenses after payments, waivers and/or reimbursements and reduction to custodian expenses | | | 1.89% | | | | 1.88% | | | | 1.93% | | | | 1.98% | | | | 1.95% | | | | 2.00% | | | | | |
Portfolio turnover rate | | | 36% | | | | 49% | | | | 40% | | | | 37% | | | | 58% | | | | 66% | | | | | |
1. January 30, 2015, July 29, 2011 and July 30, 2010 represent the last business days of the Fund’s respective reporting periods. See Note 2 of the accompanying Notes.
2. Per share amounts calculated based on the average shares outstanding during the period.
3. Less than $0.005 per share.
4. Assumes an initial investment on the business day before the first day of the fiscal period, with all dividends and distributions reinvested in additional shares on the reinvestment date, and redemption at the net asset value calculated on the last business day of the fiscal period. Sales charges are not reflected in the total returns. Total returns are not annualized for periods less than one full year. Returns do not reflect the deduction of taxes that a shareholder would pay on fund distributions or the redemption of fund shares. The returns do not include adjustments in accordance with generally accepted accounting principles required at the period end for financial reporting purposes.
5. Annualized for periods less than one full year.
6. Less than 0.005%.
7. Total expenses including indirect expenses from affiliated fund fees and expenses were as follows:
| | | | | | |
| | Six Months Ended January 30, 2015 | | 1.89% | | |
| | Year Ended July 31, 2014 | | 1.88% | | |
| | Year Ended July 31, 2013 | | 1.93% | | |
| | Year Ended July 31, 2012 | | 1.98% | | |
| �� | Year Ended July 29, 2011 | | 1.95% | | |
| | Year Ended July 30, 2010 | | 2.00% | | |
See accompanying Notes to Financial Statements.
20 OPPENHEIMER MAIN STREET SELECT FUND
| | | | | | | | | | | | | | | | | | | | | | | | | | |
| Class R | | Six Months
Ended
January 30,
20151
(Unaudited) | | | Year Ended
July 31,
2014 | | | Year Ended
July 31,
2013 | | | Year Ended
July 31,
2012 | | | Year Ended
July 29,
20111 | | | Year Ended
July 30,
20101 | | | |
Per Share Operating Data | | | | | | | | | | | | | | | | | | | | | | | | | | |
Net asset value, beginning of period | | $ | 18.65 | | | $ | 16.09 | | | $ | 13.39 | | | $ | 12.25 | | | $ | 10.89 | | | $ | 9.62 | | | |
Income (loss) from investment operations: | | | | | | | | | | | | | | | | | | | | | | | | | | |
Net investment income (loss)2 | | | 0.02 | | | | 0.00 | 3 | | | 0.07 | | | | 0.01 | | | | (0.02 | ) | | | 0.02 | | | |
Net realized and unrealized gain (loss) | | | (0.13 | ) | | | 2.57 | | | | 2.68 | | | | 1.13 | | | | 1.38 | | | | 1.27 | | | |
| | | |
Total from investment operations | | | (0.11 | ) | | | 2.57 | | | | 2.75 | | | | 1.14 | | | | 1.36 | | | | 1.29 | | | |
Dividends and/or distributions to shareholders: | | | | | | | | | | | | | | | | | | | | | | | | | | |
Dividends from net investment income | | | (0.02 | ) | | | (0.01 | ) | | | (0.05 | ) | | | 0.00 | | | | 0.00 | | | | (0.01 | ) | | |
Tax return of capital distribution | | | 0.00 | | | | 0.00 | | | | 0.00 | | | | 0.00 | | | | 0.00 | | | | (0.01 | ) | | |
| | | |
Total dividends and/or distributions to shareholders | | | (0.02 | ) | | | (0.01 | ) | | | (0.05 | ) | | | 0.00 | | | | 0.00 | | | | (0.02 | ) | | |
Net asset value, end of period | | $ | 18.52 | | | $ | 18.65 | | | $ | 16.09 | | | $ | 13.39 | | | $ | 12.25 | | | $ | 10.89 | | | |
| | | |
| | | | | | | | | | | | | | | | | | | | | | | | | | |
| | | | | | | | | | | | | | | | | | | | | | | | | | |
| | | | | | | | | | | | | | | | | | | | | | | | | | |
Total Return, at Net Asset Value4 | | | (0.60)% | | | | 15.97% | | | | 20.63% | | | | 9.31% | | | | 12.49% | | | | 13.42% | | | |
| | | | | | | | | | | | | | | | | | | | | | | | | | |
Ratios/Supplemental Data | | | | | | | | | | | | | | | | | | | | | | | | | | |
Net assets, end of period (in thousands) | | $ | 78,171 | | | $ | 89,674 | | | $ | 90,893 | | | $ | 90,631 | | | $ | 94,814 | | | $ | 96,516 | | | |
|
Average net assets (in thousands) | | $ | 86,299 | | | $ | 91,226 | | | $ | 90,872 | | | $ | 90,581 | | | $ | 101,524 | | | $ | 99,801 | | | |
|
Ratios to average net assets:5 | | | | | | | | | | | | | | | | | | | | | | | | | | |
Net investment income (loss) | | | 0.24% | | | | 0.02% | | | | 0.47% | | | | 0.10% | | | | (0.16)% | | | | 0.18% | | | |
Total expenses6 | | | 1.39% | | | | 1.40% | | | | 1.47% | | | | 1.54% | | | | 1.51% | | | | 1.56% | | | |
Expenses after payments, waivers and/or | | | | | | | | | | | | | | | | | | | | | | | | | | |
reimbursements and reduction to | | | | | | | | | | | | | | | | | | | | | | | | | | |
custodian expenses | | | 1.39% | | | | 1.40% | | | | 1.47% | | | | 1.54% | | | | 1.50% | | | | 1.52% | | | |
Portfolio turnover rate | | | 36 % | | | | 49 % | | | | 40 % | | | | 37 % | | | | 58 % | | | | 66 % | | | |
1. January 30, 2015, July 29, 2011 and July 30, 2010 represent the last business days of the Fund’s respective reporting periods. See Note 2 of the accompanying Notes.
2. Per share amounts calculated based on the average shares outstanding during the period.
3. Less than $0.005 per share.
4. Assumes an initial investment on the business day before the first day of the fiscal period, with all dividends and distributions reinvested in additional shares on the reinvestment date, and redemption at the net asset value calculated on the last business day of the fiscal period. Sales charges are not reflected in the total returns. Total returns are not annualized for periods less than one full year. Returns do not reflect the deduction of taxes that a shareholder would pay on fund distributions or the redemption of fund shares. The returns do not include adjustments in accordance with generally accepted accounting principles required at the period end for financial reporting purposes.
5. Annualized for periods less than one full year.
6. Total expenses including indirect expenses from affiliated fund fees and expenses were as follows:
| | | | | | |
| | Six Months Ended January 30, 2015 | | | 1.39 | % |
| | Year Ended July 31, 2014 | | | 1.40 | % |
| | Year Ended July 31, 2013 | | | 1.47 | % |
| | Year Ended July 31, 2012 | | | 1.54 | % |
| | Year Ended July 29, 2011 | | | 1.51 | % |
| | Year Ended July 30, 2010 | | | 1.56 | % |
See accompanying Notes to Financial Statements.
21 OPPENHEIMER MAIN STREET SELECT FUND
FINANCIAL HIGHLIGHTS Continued
| | | | | | | | | | | | | | | | | | | | | | | | | | |
| Class Y | | Six Months
Ended
January 30,
20151
(Unaudited) | | | Year Ended
July 31,
2014 | | | Year Ended
July 31,
2013 | | | Year Ended
July 31,
2012 | | | Year Ended
July 29,
20111 | | | Year Ended
July 30, 20101 | | | |
Per Share Operating Data | | | | | | | | | | | | | | | | | | | | | | |
Net asset value, beginning of period | | $ | 19.43 | | | $ | 16.76 | | | $ | 13.95 | | | $ | 12.75 | | | $ | 11.27 | | | $ | 9.94 | | | |
Income (loss) from investment operations: | | | | | | | | | | | | | | | | | | | | | | |
Net investment income2 | | | 0.07 | | | | 0.10 | | | | 0.16 | | | | 0.09 | | | | 0.06 | | | | 0.10 | | | |
Net realized and unrealized gain (loss) | | | (0.14 | ) | | | 2.67 | | | | 2.79 | | | | 1.17 | | | | 1.42 | | | | 1.31 | | | |
| | | |
Total from investment operations | | | (0.07 | ) | | | 2.77 | | | | 2.95 | | | | 1.26 | | | | 1.48 | | | | 1.41 | | | |
Dividends and/or distributions to shareholders: | | | | | | | | | | | | | | | | | | | | | | |
Dividends from net investment income | | | (0.12 | ) | | | (0.10 | ) | | | (0.14 | ) | | | (0.06 | ) | | | 0.00 | | | | (0.06 | ) | | |
Tax return of capital distribution | | | 0.00 | | | | 0.00 | | | | 0.00 | | | | 0.00 | | | | 0.00 | | | | (0.02 | ) | | |
| | | |
Total dividends and/or distributions to shareholders | | | (0.12 | ) | | | (0.10 | ) | | | (0.14 | ) | | | (0.06 | ) | | | 0.00 | | | | (0.08 | ) | | |
Net asset value, end of period | | $ | 19.24 | | | $ | 19.43 | | | $ | 16.76 | | | $ | 13.95 | | | $ | 12.75 | | | $ | 11.27 | | | |
| | | |
| | | | | | | | | | | | | | | | | | | | | | | | | | |
| | | | | | | | | | | | | | | | | | | | | | | | | | |
| | | | | | | | | | | | | | | | | | | | | | | | | | |
Total Return, at Net Asset Value3 | | | (0.36)% | | | | 16.61% | | | | 21.31% | | | | 10.00% | | | | 13.13% | | | | 14.25% | | | |
| | | | | | | | | | | | | | | | | | | | | | | | | | |
| | | | | | | | | | | | | | | | | | | | | | | | | | |
Ratios/Supplemental Data | | | | | | | | | | | | | | | | | | | | | | |
Net assets, end of period (in thousands) | | $ | 56,990 | | | $ | 60,964 | | | $ | 83,612 | | | $ | 64,137 | | | $ | 57,075 | | | $ | 47,548 | | | |
Average net assets (in thousands) | | $ | 56,930 | | | $ | 68,650 | | | $ | 74,218 | | | $ | 57,816 | | | $ | 55,754 | | | $ | 125,884 | | | |
Ratios to average net assets:4 | | | | | | | | | | | | | | | | | | | | | | |
Net investment income | | | 0.71% | | | | 0.56% | | | | 1.05% | | | | 0.66% | | | | 0.45% | | | | 0.90% | | | |
Total expenses5 | | | 0.89% | | | | 0.87% | | | | 0.86% | | | | 0.97% | | | | 0.87% | | | | 0.80% | | | |
| Expenses after payments, waivers and/or reimbursements and reduction to custodian expenses5 | | | 0.89% | | | | 0.87% | | | | 0.86% | | | | 0.97% | | | | 0.87% | | | | 0.80% | | | |
Portfolio turnover rate | | | 36% | | | | 49% | | | | 40% | | | | 37% | | | | 58% | | | | 66% | | | |
1. January 30, 2015, July 29, 2011 and July 30, 2010 represent the last business days of the Fund’s respective reporting periods. See Note 2 of the accompanying Notes.
2. Per share amounts calculated based on the average shares outstanding during the period.
3. Assumes an initial investment on the business day before the first day of the fiscal period, with all dividends and distributions reinvested in additional shares on the reinvestment date, and redemption at the net asset value calculated on the last business day of the fiscal period. Sales charges are not reflected in the total returns. Total returns are not annualized for periods less than one full year. Returns do not reflect the deduction of taxes that a shareholder would pay on fund distributions or the redemption of fund shares. The returns do not include adjustments in accordance with generally accepted accounting principles required at the period end for financial reporting purposes.
4. Annualized for periods less than one full year.
5. Total expenses including indirect expenses from affiliated fund fees and expenses were as follows:
| | | | | | |
| | Six Months Ended January 30, 2015 | | | 0.89 | % |
| | Year Ended July 31, 2014 | | | 0.87 | % |
| | Year Ended July 31, 2013 | | | 0.86 | % |
| | Year Ended July 31, 2012 | | | 0.97 | % |
| | Year Ended July 29, 2011 | | | 0.87 | % |
| | Year Ended July 30, 2010 | | | 0.80 | % |
See accompanying Notes to Financial Statements.
22 OPPENHEIMER MAIN STREET SELECT FUND
NOTES TO FINANCIAL STATEMENTS January 30, 2015 Unaudited
1. Organization
Oppenheimer Main Street Select Fund (the “Fund”) is a diversified open-end management investment company registered under the Investment Company Act of 1940 (“1940 Act”), as amended. The Fund’s investment objective is to seek capital appreciation. The Fund’s investment adviser is OFI Global Asset Management, Inc. (“OFI Global” or the “Manager”), a wholly-owned subsidiary of OppenheimerFunds, Inc. (“OFI” or the “Sub-Adviser”). The Manager has entered into a sub-advisory agreement with OFI.
The Fund offers Class A, Class C, Class R and Class Y shares, and previously offered Class B shares for new purchase through June 29, 2012. Subsequent to that date, no new purchases of Class B shares are permitted, however reinvestment of dividend and/or capital gain distributions and exchanges of Class B shares into and from other Oppenheimer funds will be allowed. As of July 1, 2014, Class N shares were renamed Class R shares. Class N shares subject to a CDSC on July 1, 2014, will continue to be subject to a CDSC after the shares are renamed. Purchases of Class R shares occurring on or after July 1, 2014, will not be subject to a CDSC upon redemption. Class A shares are sold at their offering price, which is normally net asset value plus a front-end sales charge. Class C and Class R shares are sold, and Class B shares were sold, without a front-end sales charge but may be subject to a contingent deferred sales charge (“CDSC”). Class R shares are sold only through retirement plans. Retirement plans that offer Class R shares may impose charges on those accounts. Class Y shares are sold to certain institutional investors or intermediaries without either a front-end sales charge or a CDSC, however, the intermediaries may impose charges on their accountholders who beneficially own Class Y shares. All classes of shares have identical rights and voting privileges with respect to the Fund in general and exclusive voting rights on matters that affect that class alone. Earnings, net assets and net asset value per share may differ due to each class having its own expenses, such as transfer and shareholder servicing agent fees and shareholder communications, directly attributable to that class. Class A, B, C and R shares have separate distribution and/or service plans under which they pay fees. Class Y shares do not pay such fees. Class B shares will automatically convert to Class A shares 72 months after the date of purchase.
The following is a summary of significant accounting policies consistently followed by the Fund.
2. Significant Accounting Policies
Security Valuation. All investments in securities are recorded at their estimated fair value, as described in Note 3.
Semiannual and Annual Periods. The last day of the Fund’s semiannual and annual periods was the last day the New York Stock Exchange was open for trading. The Fund’s financial statements have been presented through that date to maintain consistency with the Fund’s net asset value calculations used for shareholder transactions.
23 OPPENHEIMER MAIN STREET SELECT FUND
NOTES TO FINANCIAL STATEMENTS Unaudited / Continued
2. Significant Accounting Policies (Continued)
Foreign Currency Translation. The Fund’s accounting records are maintained in U.S. dollars. The values of securities denominated in foreign currencies and amounts related to the purchase and sale of foreign securities and foreign investment income are translated into U.S. dollars as of the close of the New York Stock Exchange (the “Exchange”), normally 4:00 P.M. Eastern time, on each day the Exchange is open for trading. Foreign exchange rates may be valued primarily using a reliable bank, dealer or service authorized by the Board of Trustees.
Reported net realized gains and losses from foreign currency transactions arise from sales of portfolio securities, sales and maturities of short-term securities, sales of foreign currencies, exchange rate fluctuations between the trade and settlement dates on securities transactions, and the difference between the amounts of dividends, interest, and foreign withholding taxes recorded on the Fund’s books and the U.S. dollar equivalent of the amounts actually received or paid. Net unrealized appreciation and depreciation on the translation of assets and liabilities denominated in foreign currencies arise from changes in the values of assets and liabilities, including investments in securities at fiscal period end, resulting from changes in exchange rates.
The effect of changes in foreign currency exchange rates on investments is separately identified from the fluctuations arising from changes in market values of securities held and reported with all other foreign currency gains and losses in the Fund’s Statement of Operations.
Allocation of Income, Expenses, Gains and Losses. Income, expenses (other than those attributable to a specific class), gains and losses are allocated on a daily basis to each class of shares based upon the relative proportion of net assets represented by such class. Operating expenses directly attributable to a specific class are charged against the operations of that class.
Dividends and Distributions to Shareholders. Dividends and distributions to shareholders, which are determined in accordance with income tax regulations and may differ from U.S. generally accepted accounting principles, are recorded on the ex-dividend date. Income and capital gain distributions, if any, are declared and paid annually or at other times as deemed necessary by the Manager.
The tax character of distributions is determined as of the Fund’s fiscal year end. Therefore, a portion of the Fund’s distributions made to shareholders prior to the Fund’s fiscal year end may ultimately be categorized as a tax return of capital.
Investment Income. Dividend income is recorded on the ex-dividend date or upon ex-dividend notification in the case of certain foreign dividends where the ex-dividend date may have passed. Non-cash dividends included in dividend income, if any, are recorded at the fair market value of the securities received. Interest income is recognized on an accrual basis. Discount and premium, which are included in interest income on the Statement of Operations, are amortized or accreted daily.
24 OPPENHEIMER MAIN STREET SELECT FUND
2. Significant Accounting Policies (Continued)
Custodian Fees. “Custodian fees and expenses” in the Statement of Operations may include interest expense incurred by the Fund on any cash overdrafts of its custodian account during the period. Such cash overdrafts may result from the effects of failed trades in portfolio securities and from cash outflows resulting from unanticipated shareholder redemption activity. The Fund pays interest to its custodian on such cash overdrafts, to the extent they are not offset by positive cash balances maintained by the Fund, at a rate equal to the Federal Funds Rate plus 0.50%. The “Reduction to custodian expenses” line item, if applicable, represents earnings on cash balances maintained by the Fund during the period. Such interest expense and other custodian fees may be paid with these earnings.
Security Transactions. Security transactions are recorded on the trade date. Realized gains and losses on securities sold are determined on the basis of identified cost.
Indemnifications. The Fund’s organizational documents provide current and former Trustees and officers with a limited indemnification against liabilities arising in connection with the performance of their duties to the Fund. In the normal course of business, the Fund may also enter into contracts that provide general indemnifications. The Fund’s maximum exposure under these arrangements is unknown as this would be dependent on future claims that may be made against the Fund. The risk of material loss from such claims is considered remote.
Federal Taxes. The Fund intends to comply with provisions of the Internal Revenue Code applicable to regulated investment companies and to distribute substantially all of its investment company taxable income to shareholders. Therefore, no federal income or excise tax provision is required. The Fund files income tax returns in U.S. federal and applicable state jurisdictions. The statute of limitations on the Fund’s tax return filings generally remain open for the three preceding fiscal reporting period ends.
During the fiscal year ended July 31, 2014, the Fund utilized $245,991,305 of capital loss carryforward to offset capital gains realized in that fiscal year. Details of the fiscal year ended July 31, 2014 capital loss carryforwards are included in the table below. Capital loss carryforwards with no expiration, if any, must be utilized prior to those with expiration dates. Capital losses with no expiration will be carried forward to future years if not offset by gains.
| | | | |
| Expiring | | | |
2018 | | $ | 175,933,757 | |
As of January 30, 2015, it is estimated that the capital loss carryforwards would be $12,320,354 expiring by 2018. The estimated capital loss carryforward represents the carryforward as of the end of the last fiscal year, increased or decreased by capital losses or gains realized in the first six months of the current fiscal year. During the six months ended January 30, 2015, it is estimated that the Fund will utilize $163,613,403 of capital loss carryforward to offset realized capital gains.
Net investment income (loss) and net realized gain (loss) may differ for financial statement and tax purposes. The character of dividends and distributions made during the fiscal year
25 OPPENHEIMER MAIN STREET SELECT FUND
NOTES TO FINANCIAL STATEMENTS Unaudited / Continued
2. Significant Accounting Policies (Continued)
from net investment income or net realized gains may differ from their ultimate characterization for federal income tax purposes. Also, due to timing of dividends and distributions, the fiscal year in which amounts are distributed may differ from the fiscal year in which the income or net realized gain was recorded by the Fund.
The aggregate cost of securities and other investments and the composition of unrealized appreciation and depreciation of securities and other investments for federal income tax purposes as of January 30, 2015 are noted in the following table. The primary difference between book and tax appreciation or depreciation of securities and other investments, if applicable, is attributable to the tax deferral of losses or tax realization of financial statement unrealized gain or loss.
| | | | |
Federal tax cost of securities | | $ | 1,197,920,039 | |
| | | | |
Gross unrealized appreciation | | $ | 292,683,491 | |
Gross unrealized depreciation | | | (26,634,278) | |
| | | | |
Net unrealized appreciation | | $ | 266,049,213 | |
| | | | |
Use of Estimates. The preparation of financial statements in conformity with accounting principles generally accepted in the United States of America requires management to make estimates and assumptions that affect the reported amounts of assets and liabilities and disclosure of contingent assets and liabilities at the date of the financial statements and the reported amounts of increases and decreases in net assets from operations during the reporting period. Actual results could differ from those estimates.
3. Securities Valuation
The Fund calculates the net asset value of its shares as of the close of the New York Stock Exchange (the “Exchange”), normally 4:00 P.M. Eastern time, on each day the Exchange is open for trading.
The Fund’s Board has adopted procedures for the valuation of the Fund’s securities and has delegated the day-to-day responsibility for valuation determinations under those procedures to the Manager. The Manager has established a Valuation Committee which is responsible for determining a “fair valuation” for any security for which market quotations are not “readily available.” The Valuation Committee’s fair valuation determinations are subject to review, approval and ratification by the Fund’s Board at its next regularly scheduled meeting covering the calendar quarter in which the fair valuation was determined.
Valuation Methods and Inputs
Securities are valued using unadjusted quoted market prices, when available, as supplied primarily by third party pricing services or dealers.
The following methodologies are used to determine the market value or the fair value of the types of securities described below:
Securities traded on a registered U.S. securities exchange (including exchange-traded derivatives other than futures and futures options) are valued based on the last sale price of the security reported on the principal exchange on which it is traded, prior to the time when
26 OPPENHEIMER MAIN STREET SELECT FUND
3. Securities Valuation (Continued)
the Fund’s assets are valued. In the absence of a sale, the security is valued at the last sale price on the prior trading day, if it is within the spread of the current day’s closing “bid” and “asked” prices, and if not, at the current day’s closing bid price. A security of a foreign issuer traded on a foreign exchange, but not listed on a registered U.S. securities exchange, is valued based on the last sale price on the principal exchange on which the security is traded, as identified by the third party pricing service used by the Manager, prior to the time when the Fund’s assets are valued. If the last sale price is unavailable, the security is valued at the most recent official closing price on the principal exchange on which it is traded. If the last sales price or official closing price for a foreign security is not available, the security is valued at the mean between the bid and asked price per the exchange or, if not available from the exchange, obtained from two dealers. If bid and asked prices are not available from either the exchange or two dealers, the security is valued by using one of the following methodologies (listed in order of priority): (1) using a bid from the exchange, (2) the mean between the bid and asked price as provided by a single dealer, or (3) a bid from a single dealer.
Shares of a registered investment company that are not traded on an exchange are valued at that investment company’s net asset value per share.
Corporate and government debt securities (of U.S. or foreign issuers) and municipal debt securities, event-linked bonds, loans, mortgage-backed securities, collateralized mortgage obligations, and asset-backed securities are valued at the mean between the “bid” and “asked” prices utilizing evaluated prices obtained from third party pricing services or broker-dealers who may use matrix pricing methods to determine the evaluated prices.
Short-term money market type debt securities with a remaining maturity of sixty days or less are valued at cost adjusted by the amortization of discount or premium to maturity (amortized cost), which approximates market value. Short-term debt securities with a remaining maturity in excess of sixty days are valued at the mean between the “bid” and “asked” prices utilizing evaluated prices obtained from third party pricing services or broker-dealers.
A description of the standard inputs that may generally be considered by the third party pricing vendors in determining their evaluated prices is provided below.
| | |
| Security Type | | Standard inputs generally considered by third-party pricing vendors |
| Corporate debt, government debt, municipal, mortgage-backed and asset-backed securities | | Reported trade data, broker-dealer price quotations, benchmark yields, issuer spreads on comparable securities, the credit quality, yield, maturity, and other appropriate factors. |
Loans | | Information obtained from market participants regarding reported trade data and broker-dealer price quotations. |
Event-linked bonds | | Information obtained from market participants regarding reported trade data and broker-dealer price quotations. |
If a market value or price cannot be determined for a security using the methodologies described above, or if, in the “good faith” opinion of the Manager, the market value or price obtained does not constitute a “readily available market quotation,” or a significant event has occurred that would materially affect the value of the security the security is fair valued either (i) by a standardized fair valuation methodology applicable to the security type or the
27 OPPENHEIMER MAIN STREET SELECT FUND
NOTES TO FINANCIAL STATEMENTS Unaudited / Continued
3. Securities Valuation (Continued)
significant event as previously approved by the Valuation Committee and the Fund’s Board or (ii) as determined in good faith by the Manager’s Valuation Committee. The Valuation Committee considers all relevant facts that are reasonably available, through either public information or information available to the Manager, when determining the fair value of a security. Fair value determinations by the Manager are subject to review, approval and ratification by the Fund’s Board at its next regularly scheduled meeting covering the calendar quarter in which the fair valuation was determined. Those fair valuation standardized methodologies include, but are not limited to, valuing securities at the last sale price or initially at cost and subsequently adjusting the value based on: changes in company specific fundamentals, changes in an appropriate securities index, or changes in the value of similar securities which may be further adjusted for any discounts related to security-specific resale restrictions. When possible, such methodologies use observable market inputs such as unadjusted quoted prices of similar securities, observable interest rates, currency rates and yield curves. The methodologies used for valuing securities are not necessarily an indication of the risks associated with investing in those securities nor can it be assured that the Fund can obtain the fair value assigned to a security if it were to sell the security.
To assess the continuing appropriateness of security valuations, the Manager, or its third party service provider who is subject to oversight by the Manager, regularly compares prior day prices, prices on comparable securities, and sale prices to the current day prices and challenges those prices exceeding certain tolerance levels with the third party pricing service or broker source. For those securities valued by fair valuations, whether through a standardized fair valuation methodology or a fair valuation determination, the Valuation Committee reviews and affirms the reasonableness of the valuations based on such methodologies and fair valuation determinations on a regular basis after considering all relevant information that is reasonably available.
Classifications
Each investment asset or liability of the Fund is assigned a level at measurement date based on the significance and source of the inputs to its valuation. Various data inputs are used in determining the value of each of the Fund’s investments as of the reporting period end. These data inputs are categorized in the following hierarchy under applicable financial accounting standards:
1) Level 1-unadjusted quoted prices in active markets for identical assets or liabilities (including securities actively traded on a securities exchange)
2) Level 2-inputs other than unadjusted quoted prices that are observable for the asset or liability (such as unadjusted quoted prices for similar assets and market corroborated inputs such as interest rates, prepayment speeds, credit risks, etc.)
3) Level 3-significant unobservable inputs (including the Manager’s own judgments about assumptions that market participants would use in pricing the asset or liability).
The inputs used for valuing securities are not necessarily an indication of the risks associated with investing in those securities.
28 OPPENHEIMER MAIN STREET SELECT FUND
3. Securities Valuation (Continued)
The table below categorizes amounts that are included in the Fund’s Statement of Assets and Liabilities as of January 30, 2015 based on valuation input level:
| | | | | | | | | | | | | | | | | | |
| | | Level 1—
Unadjusted Quoted Prices | | | Level 2— Other Significant
Observable Inputs | | | Level 3— Significant Unobservable Inputs | | | Value | | | |
Assets Table | | | | | | | | | | | | | | | | | | |
Investments, at Value: | | | | | | | | | | | | | | | | | | |
Common Stocks | | | | | | | | | | | | | | | | | | |
Consumer Discretionary | | $ | 164,035,643 | | | $ | — | | | $ | — | | | $ | 164,035,643 | | | |
Consumer Staples | | | 56,221,191 | | | | 96,790,163 | | | | — | | | | 153,011,354 | | | |
Energy | | | 86,146,454 | | | | — | | | | — | | | | 86,146,454 | | | |
Financials | | | 244,989,329 | | | | — | | | | — | | | | 244,989,329 | | | |
Health Care | | | 242,920,609 | | | | — | | | | — | | | | 242,920,609 | | | |
Industrials | | | 143,878,889 | | | | — | | | | — | | | | 143,878,889 | | | |
Information Technology | | | 296,244,732 | | | | — | | | | — | | | | 296,244,732 | | | |
Materials | | | 48,196,405 | | | | — | | | | — | | | | 48,196,405 | | | |
Telecommunication Services | | | 29,522,718 | | | | — | | | | — | | | | 29,522,718 | | | |
Utilities | | | 43,756,452 | | | | — | | | | — | | | | 43,756,452 | | | |
Investment Company | | | 11,266,667 | | | | — | | | | — | | | | 11,266,667 | | | |
| | | |
Total Assets | | $ | 1,367,179,089 | | | $ | 96,790,163 | | | $ | — | | | $ | 1,463,969,252 | | | |
| | | |
Forward currency exchange contracts and futures contracts, if any, are reported at their unrealized appreciation/depreciation at measurement date, which represents the change in the contract’s value from trade date. All additional assets and liabilities included in the above table are reported at their market value at measurement date.
4. Investments and Risks
Investment in Oppenheimer Institutional Money Market Fund. The Fund is permitted to invest daily available cash balances in an affiliated money market fund. The Fund may invest the available cash in Class E shares of Oppenheimer Institutional Money Market Fund (“IMMF”) to seek current income while preserving liquidity or for defensive purposes. IMMF is a registered open-end management investment company, regulated as a money market fund under the 1940 Act. The Manager is the investment adviser of IMMF, and the Sub-Adviser provides investment and related advisory services to IMMF. When applicable, the Fund’s investment in IMMF is included in the Statement of Investments. Shares of IMMF are valued at their net asset value per share. As a shareholder, the Fund is subject to its proportional share of IMMF’s Class E expenses, including its management fee. The Manager will waive fees and/or reimburse Fund expenses in an amount equal to the indirect management fees incurred through the Fund’s investment in IMMF.
Equity Security Risk. Stocks and other equity securities fluctuate in price. The value of the Fund’s portfolio may be affected by changes in the equity markets generally. Equity markets may experience significant short-term volatility and may fall sharply at times. Different markets may behave differently from each other and U.S. equity markets may move in the opposite direction from one or more foreign stock markets.
29 OPPENHEIMER MAIN STREET SELECT FUND
NOTES TO FINANCIAL STATEMENTS Unaudited / Continued
4. Investments and Risks (Continued)
The prices of individual equity securities generally do not all move in the same direction at the same time and a variety of factors can affect the price of a particular company’s securities. These factors may include, but are not limited to, poor earnings reports, a loss of customers, litigation against the company, general unfavorable performance of the company’s sector or industry, or changes in government regulations affecting the company or its industry.
5. Shares of Beneficial Interest
The Fund has authorized an unlimited number of $0.001 par value shares of beneficial interest of each class. Transactions in shares of beneficial interest were as follows:
| | | | | | | | | | | | | | | | | | |
| | | Six Months Ended January 30, 2015 | | | Year Ended July 31, 2014 | | | |
| | | Shares | | | Amount | | | Shares | | | Amount | | | |
Class A | | | | | | | | | | | | | | | | | | |
Sold | | | 2,091,996 | | | $ | 40,603,383 | | | | 5,371,664 | | | $ | 95,788,504 | | | |
Dividends and/or distributions reinvested | | | 196,520 | | | | 3,845,612 | | | | 198,729 | | | | 3,483,723 | | | |
Redeemed | | | (5,319,830 | ) | | | (103,112,410 | ) | | | (11,513,224 | ) | | | (206,910,124 | ) | | |
| | | |
Net decrease | | | (3,031,314 | ) | | $ | (58,663,415 | ) | | | (5,942,831 | ) | | $ | (107,637,897 | ) | | |
| | | |
| | | | | | | | | | | | | | | | | | |
Class B | | | | | | | | | | | | | | | | | | |
Sold | | | 8,079 | | | $ | 146,373 | | | | 40,305 | | | $ | 674,854 | | | |
Dividends and/or distributions reinvested | | | 215 | | | | 3,978 | | | | — | | | | — | | | |
Redeemed | | | (653,472 | ) | | | (11,821,524 | ) | | | (1,661,562 | ) | | | (27,875,441 | ) | | |
| | | |
Net decrease | | | (645,178 | ) | | $ | (11,671,173 | ) | | | (1,621,257 | ) | | $ | (27,200,587 | ) | | |
| | | |
| | | | | | | | | | | | | | | | | | |
Class C | | | | | | | | | | | | | | | | | | |
Sold | | | 507,192 | | | $ | 9,225,115 | | | | 1,140,928 | | | $ | 19,314,486 | | | |
Dividends and/or distributions reinvested | | | 1,132 | | | | 21,134 | | | | — | | | | — | | | |
Redeemed | | | (1,281,711 | ) | | | (23,335,796 | ) | | | (2,682,487 | ) | | | (45,526,147 | ) | | |
| | | |
Net decrease | | | (773,387 | ) | | $ | (14,089,547 | ) | | | (1,541,559 | ) | | $ | (26,211,661 | ) | | |
| | | |
| | | | | | | | | | | | | | | | | | |
Class R1 | | | | | | | | | | | | | | | | | | |
Sold | | | 242,276 | | | $ | 4,584,684 | | | | 626,265 | | | $ | 11,026,583 | | | |
Dividends and/or distributions reinvested | | | 4,098 | | | | 78,745 | | | | 2,646 | | | | 45,383 | | | |
Redeemed | | | (833,460 | ) | | | (15,831,854 | ) | | | (1,470,625 | ) | | | (25,689,688 | ) | | |
| | | |
Net decrease | | | (587,086 | ) | | $ | (11,168,425 | ) | | | (841,714 | ) | | $ | (14,617,722 | ) | | |
| | | |
| | | | | | | | | | | | | | | | | | |
Class Y | | | | | | | | | | | | | | | | | | |
Sold | | | 879,622 | | | $ | 17,259,251 | | | | 1,060,290 | | | $ | 19,131,758 | | | |
Dividends and/or distributions reinvested | | | 17,771 | | | | 353,115 | | | | 23,893 | | | | 425,534 | | | |
Redeemed | | | (1,072,869 | ) | | | (21,403,742 | ) | | | (2,935,601 | ) | | | (52,706,938 | ) | | |
| | | |
Net decrease | | | (175,476 | ) | | $ | (3,791,376 | ) | | | (1,851,418 | ) | | $ | (33,149,646 | ) | | |
| | | |
30 OPPENHEIMER MAIN STREET SELECT FUND
5. Shares of Beneficial Interest (Continued)
1. Effective July 1, 2014, Class N shares were renamed Class R.
6. Purchases and Sales of Securities
The aggregate cost of purchases and proceeds from sales of securities, other than short-term obligations and investments in IMMF, for the six months ended January 30, 2015 were as follows:
| | | | | | | | |
| | | Purchases | | | Sales | |
Investment securities | | $ | 557,350,445 | | | $ | 669,451,474 | |
7. Fees and Other Transactions with Affiliates
Management Fees. Under the investment advisory agreement, the Fund pays the Manager a management fee based on the daily net assets of the Fund at an annual rate as shown in the following table:
| | | | |
| Fee Schedule | | | |
Up to $200 million | | | 0.75 | % |
Next $200 million | | | 0.72 | |
Next $200 million | | | 0.69 | |
Next $200 million | | | 0.66 | |
Next $4.2 billion | | | 0.60 | |
Over $5.0 billion | | | 0.58 | |
The Fund’s management fee for the fiscal six months ended January 30, 2015 was 0.66% of average annual net assets before any applicable waivers.
Sub-Adviser Fees. The Manager has retained the Sub-Adviser to provide the day-to-day portfolio management of the Fund. Under the Sub-Advisory Agreement, the Manager pays the Sub-Adviser an annual fee in monthly installments, equal to a percentage of the investment management fee collected by the Manager from the Fund, which shall be calculated after any investment management fee waivers. The fee paid to the Sub-Adviser is paid by the Manager, not by the Fund.
Transfer Agent Fees. OFI Global (the “Transfer Agent”) serves as the transfer and shareholder servicing agent for the Fund. The Fund pays the Transfer Agent a fee based on annual net assets. Fees incurred and average net assets for each class with respect to these services are detailed in the Statement of Operations and Financial Highlights, respectively.
Sub-Transfer Agent Fees. The Transfer Agent has retained Shareholder Services, Inc., a wholly-owned subsidiary of OFI (the “Sub-Transfer Agent”), to provide the day-to-day transfer agent and shareholder servicing of the Fund. Under the Sub-Transfer Agency Agreement, the Transfer Agent pays the Sub-Transfer Agent an annual fee in monthly installments, equal to a percentage of the transfer agent fee collected by the Transfer Agent from the Fund, which shall be calculated after any applicable fee waivers. The fee paid to the Sub-Transfer Agent is paid by the Transfer Agent, not by the Fund.
31 OPPENHEIMER MAIN STREET SELECT FUND
NOTES TO FINANCIAL STATEMENTS Unaudited / Continued
7. Fees and Other Transactions with Affiliates (Continued)
Trustees’ Compensation. The Fund’s Board of Trustees (“Board”) has adopted a compensation deferral plan for Independent Trustees that enables Trustees to elect to defer receipt of all or a portion of the annual compensation they are entitled to receive from the Fund. For purposes of determining the amount owed to the Trustee under the plan, deferred amounts are treated as though equal dollar amounts had been invested in shares of the Fund or in other Oppenheimer funds selected by the Trustee. The Fund purchases shares of the funds selected for deferral by the Trustee in amounts equal to his or her deemed investment, resulting in a Fund asset equal to the deferred compensation liability. Such assets are included as a component of “Other” within the asset section of the Statement of Assets and Liabilities. Deferral of Trustees’ fees under the plan will not affect the net assets of the Fund and will not materially affect the Fund’s assets, liabilities or net investment income per share. Amounts will be deferred until distributed in accordance with the compensation deferral plan.
Distribution and Service Plan (12b-1) Fees. Under its General Distributor’s Agreement with the Fund, OppenheimerFunds Distributor, Inc. (the “Distributor”) acts as the Fund’s principal underwriter in the continuous public offering of the Fund’s classes of shares.
Service Plan for Class A Shares. The Fund has adopted a Service Plan (the “Plan”) for Class A shares pursuant to Rule 12b-1 under the 1940 Act. Under the Plan, the Fund reimburses the Distributor for a portion of its costs incurred for services provided to accounts that hold Class A shares. Reimbursement is made periodically at an annual rate of up to 0.25% of the daily net assets of Class A shares of the Fund. The Distributor currently uses all of those fees to pay dealers, brokers, banks and other financial institutions periodically for providing personal service and maintenance of accounts of their customers that hold Class A shares. Any unreimbursed expenses the Distributor incurs with respect to Class A shares in any fiscal year cannot be recovered in subsequent periods. Fees incurred by the Fund under the Plan are detailed in the Statement of Operations.
Distribution and Service Plans for Class B, Class C and Class R Shares. The Fund has adopted Distribution and Service Plans (the “Plans”) for Class B, Class C and Class R shares pursuant to Rule 12b-1 under the 1940 Act to compensate the Distributor for distributing those share classes, maintaining accounts and providing shareholder services. Under the Plans, the Fund pays the Distributor an annual asset-based sales charge of 0.75% on Class B and Class C shares daily net assets and 0.25% on Class R shares daily net assets. The Fund also pays a service fee under the Plans at an annual rate of 0.25% of daily net assets. The Plans continue in effect from year to year only if the Fund’s Board of Trustees vote annually to approve its continuance at an in person meeting called for that purpose. Fees incurred by the Fund under the Plans are detailed in the Statement of Operations.
Sales Charges. Front-end sales charges and CDSC do not represent expenses of the Fund. They are deducted from the proceeds of sales of Fund shares prior to investment or from redemption proceeds prior to remittance, as applicable. The sales charges retained by the
32 OPPENHEIMER MAIN STREET SELECT FUND
7. Fees and Other Transactions with Affiliates (Continued)
Distributor from the sale of shares and the CDSC retained by the Distributor on the redemption of shares is shown in the following table for the period indicated.
| | | | | | | | | | | | | | | | | | | | |
| Six Months Ended | | Class A Front-End
Sales Charges
Retained by
Distributor | | | Class A Contingent
Deferred Sales
Charges
Retained by
Distributor | | | Class B Contingent
Deferred Sales
Charges
Retained by
Distributor | | | Class C
Contingent
Deferred Sales
Charges
Retained by
Distributor | | | Class R
Contingent
Deferred Sales
Charges
Retained by Distributor | |
January 30, 2015 | | | $120,404 | | | | $— | | | | $19,163 | | | | $3,609 | | | | $568 | |
Waivers and Reimbursements of Expenses. The Manager will waive fees and/or reimburse Fund expenses in an amount equal to the indirect management fees incurred through the Fund’s investment in IMMF. During the six months ended January 30, 2015, the Manager waived fees and/or reimbursed the Fund $10,987 for IMMF management fees.
These undertakings may be modified or terminated as set forth according to the terms in the prospectus.
8. Pending Litigation
In 2009, seven class action lawsuits were filed in the U.S. District Court for the District of Colorado against OppenheimerFunds, Inc. (“OFI”), OppenheimerFunds Distributor, Inc., the Fund’s principal underwriter and distributor (the “Distributor”), and certain funds (but not including the Fund) advised by OFI Global Asset Management, Inc. and distributed by the Distributor (the “Defendant Funds”). The lawsuits also named as defendants certain officers and current and former trustees of the respective Defendant Funds. The lawsuits raised claims under federal securities laws and alleged, among other things, that the disclosure documents of the respective Defendant Funds contained misrepresentations and omissions and that the respective Defendant Funds’ investment policies were not followed. The plaintiffs in these actions sought unspecified damages, equitable relief and awards of attorneys’ fees and litigation expenses. The Defendant Funds’ Boards of Trustees also engaged counsel to represent the Funds and the present and former Independent Trustees named in those suits. In March 2014, the parties in six of these lawsuits executed stipulations and agreements of settlement resolving those actions. In July 2014, the court entered an order and final judgment approving the settlements as fair, reasonable and adequate. The settlements do not resolve a seventh outstanding lawsuit relating to Oppenheimer Rochester California Municipal Fund (the “California Fund Suit”). OFI believes the California Fund Suit is without legal merit and is defending the suit vigorously. While it is premature to render any opinion as to the outcome in the California Fund Suit, or whether any costs that OFI may bear in defending the California Fund Suit might not be reimbursed by insurance, OFI believes the California Fund Suit should not impair the ability of OFI or the Distributor to perform their respective duties to the Fund, and that the outcome of the California Fund Suit should not have any material effect on the operations of any of the Oppenheimer funds.
33 OPPENHEIMER MAIN STREET SELECT FUND
BOARD APPROVAL OF THE FUND’S INVESTMENT ADVISORY
AND SUB-ADVISORY AGREEMENTS Unaudited
The Fund has entered into an investment advisory agreement with OFI Global Asset Management, Inc. (“OFI Global” or the “Adviser”), a wholly-owned subsidiary of OppenheimerFunds, Inc. (“OFI” or the “Sub-Adviser”) (“OFI Global” and “OFI” together the “Managers”) and OFI Global has entered into a sub-advisory agreement with OFI whereby OFI provides investment sub-advisory services to the Fund (collectively, the “Agreements”). Each year, the Board of Trustees (the “Board”), including a majority of the independent Trustees, is required to determine whether to renew the Agreements. The Investment Company Act of 1940, as amended, requires that the Board request and evaluate, and that the Managers provide, such information as may be reasonably necessary to evaluate the terms of the Agreements. The Board employs an independent consultant to prepare a report that provides information, including comparative information that the Board requests for that purpose. In addition to in-person meetings focused on this evaluation, the Board receives information throughout the year regarding Fund services, fees, expenses and performance.
The Adviser, Sub-Adviser and the independent consultant provided information to the Board on the following factors: (i) the nature, quality and extent of the Managers’ services, (ii) the investment performance of the Fund and the Managers, (iii) the fees and expenses of the Fund, including comparative expense information, (iv) the profitability of the Managers and their affiliates, including an analysis of the cost of providing services, (v) whether economies of scale are realized as the Fund grows and whether fee levels reflect these economies of scale for Fund investors and (vi) other benefits to the Managers from their relationship with the Fund. The Board was aware that there are alternatives to retaining the Managers.
Outlined below is a summary of the principal information considered by the Board as well as the Board’s conclusions.
Nature, Quality and Extent of Services. The Board considered information about the nature, quality and extent of the services provided to the Fund and information regarding the Managers’ key personnel who provide such services. The Sub-Adviser’s duties include providing the Fund with the services of the portfolio managers and the Sub-Adviser’s investment team, who provide research, analysis and other advisory services in regard to the Fund’s investments; securities trading services; oversight of third-party service providers; monitoring compliance with applicable Fund policies and procedures and adherence to the Fund’s investment restrictions; and risk management. The Managers are responsible for providing certain administrative services to the Fund as well. Those services include providing and supervising all administrative and clerical personnel who are necessary in order to provide effective corporate administration for the Fund; compiling and maintaining records with respect to the Fund’s operations; preparing and filing reports required by the Securities and Exchange Commission; preparing periodic reports regarding the operations of the Fund for its shareholders; preparing proxy materials for shareholder meetings; and preparing the registration statements required by Federal and state securities laws for the sale of the Fund’s shares. The Managers also provide the Fund with office space, facilities and equipment.
The Board also considered the quality of the services provided and the quality of the Managers’ resources that are available to the Fund. The Board took account of the fact that the Sub-Adviser has had over fifty years of experience as an investment adviser and that its assets under management rank it among the top mutual fund managers in the United States. The Board evaluated the Sub-Adviser’s advisory, administrative, accounting, legal, compliance
34 OPPENHEIMER MAIN STREET SELECT FUND
services and risk management, and information the Board has received regarding the experience and professional qualifications of the Managers’ key personnel and the size and functions of its staff. In its evaluation of the quality of the portfolio management services provided, the Board considered the experience of Magnus Krantz, Joy Budzinski, and Benjamin Ram, the portfolio managers for the Fund, and the Sub-Adviser’s investment team and analysts. The Board members also considered the totality of their experiences with the Managers as directors or trustees of the Fund and other funds advised by the Managers. The Board considered information regarding the quality of services provided by affiliates of the Managers, which its members have become knowledgeable about in connection with the renewal of the Fund’s service agreements. The Board concluded, in light of the Managers’ experience, reputation, personnel, operations and resources that the Fund benefits from the services provided under the Agreements.
Investment Performance of the Manager, the Sub-Adviser and the Fund. Throughout the year, the Manager and the Sub-Adviser provided information on the investment performance of the Fund, including comparative performance information. The Board also reviewed information, prepared by the Manager, the Sub-Adviser and the independent consultant, comparing the Fund’s historical performance to relevant market indices and to the performance of other retail large blend funds. The Board noted that the Fund underperformed its performance category median for the one-, three- and ten-year periods and that it outperformed its performance category median for the five-year period. The Board also considered the recent change in portfolio management, which took effect on September 30, 2013. The Board noted the Manager’s assertion that the underperformance in the one- and three-year periods was primarily attributable to the Fund’s position in two companies, one of which has since been eliminated and one of which has been trimmed. The Board considered that the Fund’s performance has improved in 2014.
Costs of Services by the Manager. The Board reviewed the fees paid to the Manager and the Sub-Adviser and the other expenses borne by the Fund. The Board noted that the Manager, not the Fund, pays the Sub-Adviser’s fee under the sub-advisory agreement. The independent consultant provided comparative data in regard to the fees and expenses of the Fund and other retail large blend funds with comparable asset levels and distribution features. The Board considered that the Fund’s contractual management fee was lower than its peer group median and category median and its total expenses were higher than its peer group median and equal to its category median. The Board also noted that within the total asset range of $1 billion to $2 billion, the Fund’s effective management fee rate was lower than its category median but higher than its peer group median.
Economies of Scale and Profits Realized by the Manager and Sub-Adviser. The Board considered information regarding the Managers’ costs in serving as the Fund’s investment adviser and sub-adviser, including the costs associated with the personnel and systems necessary to manage the Fund, and information regarding the Managers’ profitability from their relationship with the Fund. The Board reviewed whether the Managers may realize economies of scale in managing and supporting the Fund. The Board noted that the Fund currently has management fee breakpoints, which are intended to share with Fund shareholders economies of scale that may exist as the Fund’s assets grow.
35 OPPENHEIMER MAIN STREET SELECT FUND
BOARD APPROVAL OF THE FUND’S INVESTMENT ADVISORY
AND SUB-ADVISORY AGREEMENTS Unaudited / Continued
Other Benefits to the Managers. In addition to considering the profits realized by the Managers, the Board considered information that was provided regarding the direct and indirect benefits the Managers receive as a result of their relationship with the Fund, including compensation paid to the Managers’ affiliates and research provided to the Adviser in connection with permissible brokerage arrangements (soft dollar arrangements).The Board also considered that the Managers must be able to pay and retain experienced professional personnel at competitive rates to provide quality services to the Fund.
Conclusions. These factors were also considered by the independent Trustees meeting separately from the full Board, assisted by experienced counsel to the Fund and to the independent Trustees. Fund counsel and the independent Trustees’ counsel are independent of the Managers within the meaning and intent of the Securities and Exchange Commission Rules.
Based on its review of the information it received and its evaluations described above, the Board, including a majority of the independent Trustees, decided to continue the Agreements through August 31, 2015. In arriving at its decision, the Board did not identify any factor or factors as being more important than others, but considered all of the above information, and considered the terms and conditions of the Agreements, including the management fees, in light of all the surrounding circumstances.
36 OPPENHEIMER MAIN STREET SELECT FUND
PORTFOLIO PROXY VOTING POLICIES AND PROCEDURES;
UPDATES TO STATEMENTS OF INVESTMENTS Unaudited
The Fund has adopted Portfolio Proxy Voting Policies and Procedures under which the Fund votes proxies relating to securities (“portfolio proxies”) held by the Fund. A description of the Fund’s Portfolio Proxy Voting Policies and Procedures is available (i) without charge, upon request, by calling the Fund toll-free at 1.800.CALL OPP (225.5677), (ii) on the Fund’s website at www.oppenheimerfunds.com, and (iii) on the SEC’s website at www.sec.gov. In addition, the Fund is required to file Form N-PX, with its complete proxy voting record for the 12 months ended June 30th, no later than August 31st of each year. The Fund’s voting record is available (i) without charge, upon request, by calling the Fund toll-free at 1.800.CALL OPP (225.5677), and (ii) in the Form N-PX filing on the SEC’s website at www.sec.gov.
The Fund files its complete schedule of portfolio holdings with the SEC for the first quarter and the third quarter of each fiscal year on Form N-Q. The Fund’s Form N-Q filings are available on the SEC’s website at www.sec.gov. Those forms may be reviewed and copied at the SEC’s Public Reference Room in Washington, D.C. Information on the operation of the Public Reference Room may be obtained by calling 1-800-SEC-0330.
Householding—Delivery of Shareholder Documents
This is to inform you about OppenheimerFunds’ “householding” policy. If more than one member of your household maintains an account in a particular fund, OppenheimerFunds will mail only one copy of the fund’s prospectus (or, if available, the fund’s summary prospectus), annual and semiannual report and privacy policy. The consolidation of these mailings, called householding, benefits your fund through reduced mailing expense, and benefits you by reducing the volume of mail you receive from OppenheimerFunds. Householding does not affect the delivery of your account statements.
Please note that we will continue to household these mailings for as long as you remain an OppenheimerFunds shareholder, unless you request otherwise. If you prefer to receive multiple copies of these materials, please call us at 1.800.CALL-OPP (225-5677). You may also notify us in writing or via email. We will begin sending you individual copies of the prospectus (or, if available, the summary prospectus), reports and privacy policy within 30 days of receiving your request to stop householding.
37 OPPENHEIMER MAIN STREET SELECT FUND
OPPENHEIMER MAIN STREET SELECT FUND
| | |
| Trustees and Officers | | Sam Freedman, Chairman of the Board of Trustees and Trustee |
| | Jon S. Fossel, Trustee |
| | Richard F. Grabish, Trustee |
| | Beverly L. Hamilton, Trustee |
| | Victoria J. Herget, Trustee |
| | Robert J. Malone, Trustee |
| | F. William Marshall, Jr., Trustee |
| | Karen L. Stuckey, Trustee |
| | James D. Vaughn, Trustee |
| | William F. Glavin, Jr., Trustee |
| | Magnus Krantz, Vice President |
| | Joy Budzinski, Vice President |
| | Benjamin Ram, Vice President |
| | Arthur P. Steinmetz, President and Principal Executive Officer |
| | Arthur S. Gabinet, Secretary and Chief Legal Officer |
| | Jennifer Sexton, Vice President and Chief Business Officer |
| | Mary Ann Picciotto, Chief Compliance Officer and Chief Anti-Money Laundering Officer |
| | Brian W. Wixted, Treasurer and Principal Financial & Accounting Officer |
| |
| Manager | | OFI Global Asset Management, Inc. |
| |
| Sub-Adviser | | OppenheimerFunds, Inc. |
| |
| Distributor | | OppenheimerFunds Distributor, Inc. |
| |
| Transfer and Shareholder Servicing Agent | | OFI Global Asset Management, Inc. |
| |
| Sub-Transfer Agent | | Shareholder Services, Inc. DBA OppenheimerFunds Services |
| |
| Independent Registered Public Accounting Firm | | KPMG LLP |
| |
| Counsel | | K&L Gates LLP |
| |
| | The financial statements included herein have been taken from the records of the Fund without examination of those records by the independent registered public accounting firm. |
© 2015 OppenheimerFunds, Inc. All rights reserved.
38 OPPENHEIMER MAIN STREET SELECT FUND
PRIVACY POLICY NOTICE
As an Oppenheimer fund shareholder, you are entitled to know how we protect your personal information and how we limit its disclosure.
Information Sources
We obtain nonpublic personal information about our shareholders from the following sources:
| — | | Applications or other forms |
| — | | When you create a user ID and password for online account access |
| — | | When you enroll in eDocs Direct, our electronic document delivery service |
| — | | Your transactions with us, our affiliates or others |
| — | | A software program on our website, often referred to as a “cookie,” which indicates which parts of our site you’ve visited |
| — | | When you set up challenge questions to reset your password online |
If you visit oppenheimerfunds.com and do not log on to the secure account information areas, we do not obtain any personal information about you. When you do log on to a secure area, we do obtain your user ID and password to identify you. We also use this information to provide you with products and services you have requested, to inform you about products and services that you may be interested in and assist you in other ways.
We do not collect personal information through our website unless you willingly provide it to us, either directly by email or in those areas of the website that request information. In order to update your personal information (including your mailing address, email address and phone number) you must first log on and visit your user profile.
If you have set your browser to warn you before accepting cookies, you will receive the warning message with each cookie. You can refuse cookies by turning them off in your browser. However, doing so may limit your access to certain sections of our website.
We use cookies to help us improve and manage our website. For example, cookies help us recognize new versus repeat visitors to the site, track the pages visited, and enable some special features on the website. This data helps us provide a better service for our website visitors.
Protection of Information
We do not disclose any non-public personal information (such as names on a customer list) about current or former customers to anyone, except as permitted by law.
Disclosure of Information
Copies of confirmations, account statements and other documents reporting activity in your fund accounts are made available to your financial advisor (as designated by you). We may also use details about you and your investments to help us, our financial service affiliates, or firms that jointly market their financial products and services with ours, to better serve your investment needs or suggest financial services or educational material that may be of interest to you. If this requires us to provide you with an opportunity to “opt in” or “opt out” of such information sharing with a firm not affiliated with us, you will receive notification on how to do so, before any such sharing takes place.
Right of Refusal
We will not disclose your personal information to unaffiliated third parties (except as permitted by law), unless we first offer you a reasonable opportunity to refuse or “opt out” of such disclosure.
39 OPPENHEIMER MAIN STREET SELECT FUND
PRIVACY POLICY NOTICE Continued
Internet Security and Encryption
In general, the email services provided by our website are encrypted and provide a secure and private means of communication with us. To protect your own privacy, confidential and/or personal information should only be communicated via email when you are advised that you are using a secure website.
As a security measure, we do not include personal or account information in non-secure emails, and we advise you not to send such information to us in non-secure emails. Instead, you may take advantage of the secure features of our website to encrypt your email correspondence. To do this, you will need to use a browser that supports Secure Sockets Layer (SSL) protocol.
We do not guarantee or warrant that any part of our website, including files available for download, are free of viruses or other harmful code. It is your responsibility to take appropriate precautions, such as use of an anti-virus software package, to protect your computer hardware and software.
| • | | All transactions, including redemptions, exchanges and purchases, are secured by SSL and 128-bit encryption. SSL is used to establish a secure connection between your PC and OppenheimerFunds’ server. It transmits information in an encrypted and scrambled format. |
| • | | Encryption is achieved through an electronic scrambling technology that uses a “key” to code and then decode the data. Encryption acts like the cable converter box you may have on your television set. It scrambles data with a secret code so that no one can make sense of it while it is being transmitted. When the data reaches its destination, the same software unscrambles the data. |
| • | | You can exit the secure area by either closing your browser, or for added security, you can use the Log Out button before you close your browser. |
Other Security Measures
We maintain physical, electronic and procedural safeguards to protect your personal account information. Our employees and agents have access to that information only so that they may offer you products or provide services, for example, when responding to your account questions.
How You Can Help
You can also do your part to keep your account information private and to prevent unauthorized transactions. If you obtain a user ID and password for your account, do not allow it to be used by anyone else. Also, take special precautions when accessing your account on a computer used by others.
Who We Are
This joint notice describes the privacy policies of the Oppenheimer funds, OppenheimerFunds, Inc., each of its investment adviser subsidiaries, OppenheimerFunds Distributor, Inc. and OFI Global Trust Co. It applies to all Oppenheimer fund accounts you presently have, or may open in the future, using your Social Security number—whether or not you remain a shareholder of our funds. This notice was last updated November 2014. In the event it is updated or changed, we will post an updated notice on our website at oppenheimerfunds.com. If you have any questions about this privacy policy, write to us at P.O. Box 5270, Denver, CO 80217-5270, email us by clicking on the Contact Us section of our website at oppenheimerfunds.com or call us at 1.800.CALL OPP (225.5677).
40 OPPENHEIMER MAIN STREET SELECT FUND
THIS PAGE INTENTIONALLY LEFT BLANK.
41 OPPENHEIMER MAIN STREET SELECT FUND
THIS PAGE INTENTIONALLY LEFT BLANK.
42 OPPENHEIMER MAIN STREET SELECT FUND
THIS PAGE INTENTIONALLY LEFT BLANK.
43 OPPENHEIMER MAIN STREET SELECT FUND
THIS PAGE INTENTIONALLY LEFT BLANK.
44 OPPENHEIMER MAIN STREET SELECT FUND
THIS PAGE INTENTIONALLY LEFT BLANK.
45 OPPENHEIMER MAIN STREET SELECT FUND
THIS PAGE INTENTIONALLY LEFT BLANK.
46 OPPENHEIMER MAIN STREET SELECT FUND
THIS PAGE INTENTIONALLY LEFT BLANK.
47 OPPENHEIMER MAIN STREET SELECT FUND

Not applicable to semiannual reports.
| Item 3. | Audit Committee Financial Expert. |
Not applicable to semiannual reports.
| Item 4. | Principal Accountant Fees and Services. |
Not applicable to semiannual reports.
| Item 5. | Audit Committee of Listed Registrants |
Not applicable.
| Item 6. | Schedule of Investments. |
a) Not applicable. The complete schedule of investments is included in Item 1 of this Form N-CSR.
b) Not applicable.
Item 7. Disclosure of Proxy Voting Policies and Procedures for Closed-End Management Investment Companies.
Not applicable.
| Item 8. | Portfolio Managers of Closed-End Management Investment Companies. |
Not applicable.
Item 9. Purchases of Equity Securities by Closed-End Management Investment Company and Affiliated Purchasers.
Not applicable.
| Item 10. | Submission of Matters to a Vote of Security Holders. |
The Fund’s Governance Committee Provisions with Respect to Nominations of Directors/Trustees to the Respective Boards
None
| Item 11. | Controls and Procedures. |
Based on their evaluation of the registrant’s disclosure controls and procedures (as defined in rule 30a-3(c) under the Investment Company Act of 1940 (17 CFR 270.30a-3(c)) as of 1/30/2015, the registrant’s principal executive officer and principal financial officer found the registrant’s disclosure controls and procedures to provide reasonable assurances that information required to be disclosed by the registrant in the reports that it files under the Securities Exchange Act of 1934 (a) is accumulated and communicated to registrant’s management, including its principal executive officer and principal financial officer, to allow timely decisions regarding required disclosure, and (b) is recorded, processed, summarized and reported, within the time periods specified in the rules and forms adopted by the U.S. Securities and Exchange Commission.
There have been no changes in the registrant’s internal controls over financial reporting that occurred during the registrant’s second fiscal quarter of the period covered by this report that have materially affected, or are reasonably likely to materially affect, the registrant’s internal control over financial reporting.
| (a) | (1) Not applicable to semiannual reports. |
(2) Exhibits attached hereto.
(3) Not applicable.
| (b) | Exhibit attached hereto. |
SIGNATURES
Pursuant to the requirements of the Securities Exchange Act of 1934 and the Investment Company Act of 1940, the registrant has duly caused this report to be signed on its behalf by the undersigned, thereunto duly authorized.
| | |
| Oppenheimer Main Street Select Fund |
| |
| By: | | /s/ Arthur P. Steinmetz |
| | Arthur P. Steinmetz |
| | Principal Executive Officer |
| Date: | | 3/9/2015 |
Pursuant to the requirements of the Securities Exchange Act of 1934 and the Investment Company Act of 1940, this report has been signed below by the following persons on behalf of the registrant and in the capacities and on the dates indicated.
| | |
| By: | | /s/ Arthur P. Steinmetz |
| | Arthur P. Steinmetz |
| | Principal Executive Officer |
| Date: | | 3/9/2015 |
| |
| By: | | /s/ Brian W. Wixted |
| | Brian W. Wixted |
| | Principal Financial Officer |
| Date: | | 3/9/2015 |