UNITED STATES
SECURITIES AND EXCHANGE COMMISSION
WASHINGTON, D.C. 20549
FORM N-CSR
CERTIFIED SHAREHOLDER REPORT OF REGISTERED
MANAGEMENT INVESTMENT COMPANIES
Investment Company Act file number 811-10001
Oppenheimer Main Street All Cap Fund
(Exact name of registrant as specified in charter)
6803 South Tucson Way, Centennial, Colorado 80112-3924
(Address of principal executive offices) (Zip code)
Cynthia Lo Bessette
OFI Global Asset Management, Inc.
225 Liberty Street, New York, New York 10281-1008
(Name and address of agent for service)
Registrant’s telephone number, including area code: (303) 768-3200
Date of fiscal year end: July 31
Date of reporting period: 7/31/2018
Item 1. Reports to Stockholders.
Table of Contents
Class A Shares
AVERAGE ANNUAL TOTAL RETURNS AT 7/31/18
| | | | | | |
| | |
| | | Class A Shares of the Fund | | |
| | | |
| | | Without Sales Charge | | With Sales Charge | | Russell 3000 Index |
| | | |
| 1-Year | | 10.55% | | 4.19% | | 16.39% |
|
| | | |
| 5-Year | | 9.56 | | 8.27 | | 12.83 |
|
| | | |
| 10-Year | | 8.40 | | 7.76 | | 10.68 |
|
Performance data quoted represents past performance, which does not guarantee future results. The investment return and principal value of an investment in the Fund will fluctuate so that an investor’s shares, when redeemed, may be worth more or less than their original cost. Fund returns include changes in share price, reinvested distributions, and a 5.75% maximum applicable sales charge except where “without sales charge” is indicated. Current performance may be lower or higher than the performance quoted. Returns do not consider capital gains or income taxes on an individual’s investment. Returns for periods of less than one year are cumulative and not annualized. For performance data current to the most recent month-end, visit oppenheimerfunds.com or call 1.800.CALL OPP (225.5677). See Fund prospectuses and summary prospectuses for more information on share classes and sales charges.
2 OPPENHEIMER MAIN STREET ALL CAP FUND
Fund Performance Discussion
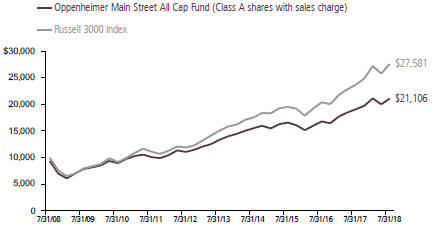
The Fund’s Class A shares (without sales charge) returned 10.55% during the reporting period. In comparison, the Fund underperformed the Russell 3000 Index (the “Index”), which returned 16.39%. The Fund’s underperformance versus the Index stemmed largely from stock selection in the Information Technology, Health Care, and Utilities sectors. The Fund outperformed the Index in the Industrials and Telecommunication Services sectors, due mainly to stock selection.
MARKET OVERVIEW
For the overall one-year reporting period, the U.S. equity markets produced strong results. However, after the buoyant market environment seen for most of 2017, volatility finally returned to the U.S. equity market over the first quarter of 2018. The CBOE Volatility Index (VIX), after hitting all-time lows in 2017, spiked during the first quarter of 2018 before settling to a lower level at period end. However, U.S. stock indices generally performed positively in the closing four months of the reporting period. The market
showed resiliency despite increasing concerns related to tariffs and trade wars.
As investors, it is important to know what is and what is not within one’s circle of competence. As such, we strive to keep the portfolio in an all-weather orientation. Whether rates, commodity prices, currencies or even whole economies go up or down, we seek to have a portfolio that has the potential to outperform no matter the environment.
COMPARISON OF CHANGE IN VALUE OF $10,000 HYPOTHETICAL INVESTMENTS IN:
3 OPPENHEIMER MAIN STREET ALL CAP FUND
We also believe we have the skills to identify company management teams that are likely to successfully execute on their plans. Lastly, we believe correctly valuing stocks and seeing what expectations the market is pricing in is also within our skillset. It is not by accident that we weight the portfolio more heavily towards companies that we see as having structural competitive advantages and/ or management teams that are executing (e.g. gaining market share, expanding profit margins), with at least reasonable stock valuations. Companies with these qualities generally have more stable earnings.
FUND REVIEW
During the reporting period, positive contributors to performance included Korn/Ferry International, Noble Energy, Inc., and Amedisys, Inc.
During the reporting period, recruiter and talent management consultant Korn/Ferry delivered another strong quarter in a series of strong quarterly results, with accelerating revenue growth and forward guidance that exceeded expectations. The company is effectively leveraging the intellectual property of its Hay Group organizational and leadership consulting business, acquired in 2015, to drive results in its traditional executive “headhunter” practice and its Futurestep recruitment process outsourcing division. A strengthening economy and tightening job market have been driving demand, and the company’s value-added
offerings have been helping it take market share.
Noble Energy has continued to drive greater productivity and growth from their onshore U.S. oil shale asset base. Furthermore, the company initiated a stock repurchase program and sold non-core assets during the reporting period. The very important Eastern Mediterranean gas project, Leviathan, is progressing well with a large percentage of the output now contracted under long-term arrangements. As this project comes online as expected in late 2019, and ramps up in 2020, we believe Noble Energy will be positioned to generate significant amounts of free cash flow for shareholders.
In May 2018, Amedisys reported a strong quarter, beating expectations driven by strength in margins. Also, the company announced it bought back 2.4 million, or 7% of its shares, from KKR, which will be 6%-7% accretive to earnings. Home health continues to be in a strong situation at period end as people increasingly try to be kept in their homes as long as possible.
Top detractors from performance included PG&E, Celgene, and Kraft Heinz.
PG&E is one of the largest utility companies in California. The stock has been under pressure since the start of the Northern California wildfires due to concerns that some of the company’s equipment may have played a role in some of the fires. The stock saw further
4 OPPENHEIMER MAIN STREET ALL CAP FUND
pressure after the company announced they would be suspending the dividend to preserve cash for potential future claims. We reduced the position size due to the current level of uncertainty.
Celgene is a biotechnology company that experienced significant weakness in the fourth quarter of 2017 after lowering earnings guidance for the quarter and longer term through 2020. This was primarily due to lower expected revenues from Otezla, a drug treating certain types of arthritis, which accounts for ~10% of the company’s revenues. Secondarily, there was disappointment due to the withdrawal of a pipeline drug. These concerns are amplified in the context of the company’s blockbuster Revlimid (60+% of sales) facing patent expirations that start in 2022. We exited our position.
Kraft, and consumer packaged goods companies in general, have faced volume and pricing headwinds. The company guided to increased reinvestment of their industry-leading margins in 2018 to try to spur revenue growth. Additionally, there has been widespread selling pressure in the Consumer Staples space due to the group’s interest rate sensitivity. “Bond proxy” stocks tend to trade down when interest rates are rising.
STRATEGY & OUTLOOK
In the short term, we expect the U.S. economy to continue to show decent economic growth driven by favorable ongoing consumer
confidence, tax benefits and falling regulatory hurdles. Rising home prices as well as technological innovation may also help drive the economy higher, in our view.
The risks we are focused on include trade tariffs, interest rates, disruption of traditional business models and the narrowness of the stock market rally in large-cap stocks. Regarding trade tariffs, we believe the market views it as a negotiating tactic and is implying that all will end well. A true escalation could severely hamper global growth and thereby stock prices, in our view. In addition, we are afraid companies are addicted to low interest rates. If interest rates were to rise materially, we believe some companies’ historical decisions could look like misallocation of capital and negatively impact their stock prices. Innovation, while a positive for the overall economy over the long-term, typically creates short-term disruptions. Finally, there is risk around the growing disparity between stock prices of companies perceived as having “growth characteristics” irrespective of valuation versus the rest of the companies. History tells us that sooner or later, such narrow rallies result in investors crowding in a few stocks and may ultimately result in meaningful declines of those stocks.
We continue to maintain our discipline around valuation. Additionally, while innovation is alive and well and helping generate economic growth, fundamental disruptions across market segments have been elevated. We are constantly monitoring potential disruption risk to our companies.
5 OPPENHEIMER MAIN STREET ALL CAP FUND
Volatility in the markets has been unusually low by historical standards but could increase. Traditionally, during periods of heightened market volatility, investors generally favor stocks of higher-quality companies—with greater consistency and stability of revenue and earnings—leading to relatively better stock performance of those companies. We think focusing on companies with competitive
advantages and skilled management teams positions us well, should this environment come to pass. During times of economic volatility such companies frequently widen their lead over weaker competitors. We seek to invest in companies characterized by these qualities at compelling valuations and believe this disciplined approach is essential to generating superior long-term performance.
| | |
 | |  |
| | Magnus Krantz Portfolio Manager |
| | |
 | |  |
| | Joy Budzinski Portfolio Manager |
6 OPPENHEIMER MAIN STREET ALL CAP FUND
Top Holdings and Allocations
TOP TEN COMMON STOCK HOLDINGS
| | | | |
| JPMorgan Chase & Co. | | | 4.5 | % |
| Apple, Inc. | | | 4.0 | |
| Microsoft Corp. | | | 3.5 | |
| Amazon.com, Inc. | | | 3.0 | |
| Facebook, Inc., Cl. A | | | 2.6 | |
| Lowe’s Cos., Inc. | | | 2.0 | |
| Mastercard, Inc., Cl. A | | | 2.0 | |
| Anthem, Inc. | | | 1.8 | |
| Duke Energy Corp. | | | 1.8 | |
| Intercontinental Exchange, Inc. | | | 1.8 | |
Portfolio holdings and allocations are subject to change. Percentages are as of July 31, 2018, and are based on net assets.
TOP TEN COMMON STOCK INDUSTRIES
| | | | |
| Software | | | 7.6 | % |
| Commercial Banks | | | 7.1 | |
| IT Services | | | 6.1 | |
| Internet Software & Services | | | 5.1 | |
| Oil, Gas & Consumable Fuels | | | 4.9 | |
| Technology Hardware, Storage & Peripherals | | | 4.8 | |
| Specialty Retail | | | 4.7 | |
| Health Care Providers & Services | | | 4.6 | |
| Insurance | | | 3.2 | |
| Aerospace & Defense | | | 3.2 | |
Portfolio holdings and allocations are subject to change. Percentages are as of July 31, 2018, and are based on net assets.
SECTOR ALLOCATION
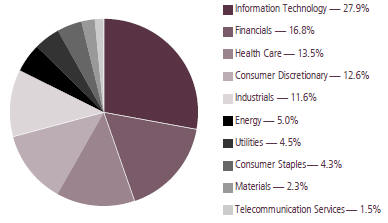
Portfolio holdings and strategies are subject to change. Percentages are as of July 31, 2018, and are based on the total market value of common stocks.
For more current Fund holdings, please visit oppenheimerfunds.com.
7 OPPENHEIMER MAIN STREET ALL CAP FUND
Share Class Performance
AVERAGE ANNUAL TOTAL RETURNS WITHOUT SALES CHARGE AS OF 7/31/18
| | | | | | | | | | | | | | | | |
| | | Inception Date | | | 1-Year | | | 5-Year | | | 10-Year | |
Class A (OMSOX) | | | 9/25/00 | | | | 10.55 | % | | | 9.56 | % | | | 8.40% | |
Class C (OMSCX) | | | 9/25/00 | | | | 9.67 | | | | 8.73 | | | | 7.59 | |
Class R (OMSNX) | | | 3/1/01 | | | | 10.27 | | | | 9.28 | | | | 8.10 | |
Class Y (OMSYX) | | | 9/25/00 | | | | 10.84 | | | | 9.83 | | | | 8.73 | |
AVERAGE ANNUAL TOTAL RETURNS WITH SALES CHARGE AS OF 7/31/18 | |
| | | Inception Date | | | 1-Year | | | 5-Year | | | 10-Year | |
Class A (OMSOX) | | | 9/25/00 | | | | 4.19 | % | | | 8.27 | % | | | 7.76% | |
Class C (OMSCX) | | | 9/25/00 | | | | 8.72 | | | | 8.73 | | | | 7.59 | |
Class R (OMSNX) | | | 3/1/01 | | | | 10.27 | | | | 9.28 | | | | 8.10 | |
Class Y (OMSYX) | | | 9/25/00 | | | | 10.84 | | | | 9.83 | | | | 8.73 | |
Performance data quoted represents past performance, which does not guarantee future results. The investment return and principal value of an investment in the Fund will fluctuate so that an investor’s shares, when redeemed, may be worth more or less than their original cost. Current performance may be lower or higher than the performance quoted. Returns do not consider capital gains or income taxes on an individual’s investment. For performance data current to the most recent month-end, visit oppenheimerfunds.com or call 1.800. CALL OPP (225.5677). Fund returns include changes in share price, reinvested distributions, and the applicable sales charge: for Class A shares, the current maximum initial sales charge of 5.75% and for Class C shares, the contingent deferred sales charge of 1% for the 1-year period. There is no sales charge for Class R and Class Y shares. Returns for periods of less than one year are cumulative and not annualized. See Fund prospectuses and summary prospectuses for more information on share classes and sales charges.
The Fund’s performance is compared to the performance of the Russell 3000 Index. The Russell 3000 Index measures the performance of the largest 3,000 U.S. companies, representing approximately 98% of the investable U.S. equity market. The Index is unmanaged and cannot be purchased directly by investors. While index comparisons may be useful to provide a benchmark for the Fund’s performance, it must be noted that the Fund’s investments are not limited to the investments comprising the Index. Index performance includes reinvestment of income, but does not reflect transaction costs, fees, expenses or taxes. Index performance is shown for illustrative purposes only as a benchmark for the Fund’s performance, and does not predict or depict performance of the Fund. The Fund’s performance reflects the effects of the Fund’s business and operating expenses.
The views in the Fund Performance Discussion represent the opinions of this Fund’s portfolio manager(s) and are not intended as investment advice or to predict or depict the performance of any investment. These views are as of the close of business on July 31, 2018, and are subject to change based on subsequent developments. The Fund’s portfolio and strategies are subject to change.
8 OPPENHEIMER MAIN STREET ALL CAP FUND
Before investing in any of the Oppenheimer funds, investors should carefully consider a fund’s investment objectives, risks, charges and expenses. Fund prospectuses and summary prospectuses contain this and other information about the funds, and may be obtained by asking your financial advisor, visiting oppenheimerfunds.com, or calling 1.800.CALL OPP (225.5677). Read prospectuses and summary prospectuses carefully before investing.
Shares of Oppenheimer funds are not deposits or obligations of any bank, are not guaranteed by any bank, are not insured by the FDIC or any other agency, and involve investment risks, including the possible loss of the principal amount invested.
9 OPPENHEIMER MAIN STREET ALL CAP FUND
Fund Expenses
Fund Expenses. As a shareholder of the Fund, you incur two types of costs: (1) transaction costs, which may include sales charges (loads) on purchase payments and/or contingent deferred sales charges on redemptions; and (2) ongoing costs, including management fees; distribution and service fees; and other Fund expenses. These examples are intended to help you understand your ongoing costs (in dollars) of investing in the Fund and to compare these costs with the ongoing costs of investing in other mutual funds.
The examples are based on an investment of $1,000.00 invested at the beginning of the period and held for the entire 6-month period ended July 31, 2018.
Actual Expenses. The first section of the table provides information about actual account values and actual expenses. You may use the information in this section for the class of shares you hold, together with the amount you invested, to estimate the expense that you paid over the period. Simply divide your account value by $1,000.00 (for example, an $8,600.00 account value divided by $1,000.00 = 8.60), then multiply the result by the number in the first section under the heading entitled “Expenses Paid During 6 Months Ended July 31, 2018” to estimate the expenses you paid on your account during this period.
Hypothetical Example for Comparison Purposes. The second section of the table provides information about hypothetical account values and hypothetical expenses based on the Fund’s actual expense ratio for each class of shares, and an assumed rate of return of 5% per year for each class before expenses, which is not the Fund’s actual return. The hypothetical account values and expenses may not be used to estimate the actual ending account balance or expenses you paid for the period. You may use this information to compare the ongoing costs of investing in the Fund and other funds. To do so, compare this 5% hypothetical example for the class of shares you hold with the 5% hypothetical examples that appear in the shareholder reports of the other funds.
Please note that the expenses shown in the table are meant to highlight your ongoing costs only and do not reflect any transactional costs, such as front-end or contingent deferred sales charges (loads). Therefore, the “hypothetical” section of the table is useful in comparing ongoing costs only, and will not help you determine the relative total costs of owning different funds. In addition, if these transactional costs were included, your costs would have been higher.
10 OPPENHEIMER MAIN STREET ALL CAP FUND
| | | | | | | | | | | | |
| Actual | | Beginning
Account Value
February 1, 2018 | | | Ending Account Value July 31, 2018 | | | Expenses Paid During 6 Months Ended
July 31, 2018 | |
Class A | | $ | 1,000.00 | | | $ | 998.90 | | | $ | 5.57 | |
Class C | | | 1,000.00 | | | | 994.80 | | | | 9.59 | |
Class R | | | 1,000.00 | | | | 997.30 | | | | 6.76 | |
Class Y | | | 1,000.00 | | | | 1,000.00 | | | | 4.37 | |
| | | |
| Hypothetical | | | | | | | | | |
| (5% return before expenses) | | | | | | | | | |
Class A | | | 1,000.00 | | | | 1,019.24 | | | | 5.62 | |
Class C | | | 1,000.00 | | | | 1,015.22 | | | | 9.69 | |
Class R | | | 1,000.00 | | | | 1,018.05 | | | | 6.83 | |
Class Y | | | 1,000.00 | | | | 1,020.43 | | | | 4.42 | |
Expenses are equal to the Fund’s annualized expense ratio for that class, multiplied by the average account value over the period, multiplied by 181/365 (to reflect the one-half year period). Those annualized expense ratios, excluding indirect expenses from affiliated funds, based on the 6-month period ended July 31, 2018 are as follows:
| | | | | | |
| Class | | Expense Ratios | | | |
Class A | | 1.12% | | | | |
Class C | | 1.93 | | | | |
Class R | | 1.36 | | | | |
Class Y | | 0.88 | | | | |
The expense ratios reflect voluntary and/or contractual waivers and/or reimbursements of expenses by the Fund’s Manager and Transfer Agent. Some of these undertakings may be modified or terminated at any time, as indicated in the Fund’s prospectus. The “Financial Highlights” tables in the Fund’s financial statements, included in this report, also show the gross expense ratios, without such waivers or reimbursements and reduction to custodian expenses, if applicable.
11 OPPENHEIMER MAIN STREET ALL CAP FUND
STATEMENT OF INVESTMENTS July 31, 2018
| | | | | | | | |
| | | Shares | | | Value | |
| |
| Common Stocks—97.4% | | | | | |
| |
| Consumer Discretionary—12.3% | |
| |
| Auto Components—1.2% | | | | | |
| Lear Corp. | | | 32,480 | | | $ | 5,850,622 | |
| |
| Visteon Corp.1 | | | 70,050 | | | | 8,201,454 | |
| | | | | | | | |
| | | | | | | 14,052,076 | |
|
| |
| Hotels, Restaurants & Leisure—1.8% | | | | | |
| Chipotle Mexican | | | | | | | | |
| Grill, Inc., Cl. A1 | | | 13,520 | | | | 5,863,083 | |
| |
| McDonald’s Corp. | | | 100,910 | | | | 15,897,362 | |
| | | | | | | | |
| | | | | | | 21,760,445 | |
|
| |
| Internet & Catalog Retail—3.0% | | | | | |
| Amazon.com, Inc.1 | | | 20,850 | | | | 37,059,624 | |
|
| |
| Specialty Retail—4.7% | | | | | |
| Burlington Stores, Inc.1 | | | 58,210 | | | | 8,895,070 | |
| |
| CarMax, Inc.1 | | | 151,490 | | | | 11,313,274 | |
| |
| Lowe’s Cos., Inc. | | | 249,730 | | | | 24,808,178 | |
| |
| O’Reilly Automotive, Inc.1 | | | 42,960 | | | | 13,145,760 | |
| | | | | | | | |
| | | | | | | 58,162,282 | |
|
| |
| Textiles, Apparel & Luxury Goods—1.6% | | | | | |
| NIKE, Inc., Cl. B | | | 260,010 | | | | 19,997,369 | |
|
| |
| Consumer Staples—4.2% | | | | | |
| |
Beverages—1.7% | | | | | | | | |
| Constellation Brands, Inc., Cl. A | | | 62,750 | | | | 13,191,932 | |
| |
| PepsiCo, Inc. | | | 67,274 | | | | 7,736,510 | |
| | | | | | | | |
| | | | | | | 20,928,442 | |
|
| |
| Food Products—1.4% | | | | | |
| Conagra Brands, Inc. | | | 259,620 | | | | 9,530,650 | |
| |
| Kraft Heinz Co. (The) | | | 126,286 | | | | 7,608,732 | |
| | | | | | | | |
| | | | | | | 17,139,382 | |
|
| |
| Tobacco—1.1% | | | | | |
| British American Tobacco plc | | | 242,350 | | | | 13,355,055 | |
|
| |
| Energy—4.9% | | | | | |
| |
Oil, Gas & Consumable Fuels—4.9% | | | | | |
| EQT Corp. | | | 161,139 | | | | 8,005,386 | |
| |
| Exxon Mobil Corp. | | | 184,720 | | | | 15,056,527 | |
| |
| Noble Energy, Inc. | | | 437,640 | | | | 15,794,428 | |
| |
| Suncor Energy, Inc. | | | 496,260 | | | | 20,912,396 | |
| | | | | | | | |
| | | | | | | 59,768,737 | |
| | | | | | | | |
| | | Shares | | | Value | |
| |
Financials—16.3% | | | | | | | | |
| |
Capital Markets—2.8% | | | | | | | | |
| Bank of New York Mellon Corp. (The) | | | 236,460 | | | $ | 12,643,516 | |
| |
| Intercontinental Exchange, Inc. | | | 287,490 | | | | 21,248,386 | |
| | | | | | | | |
| | | | | | | 33,891,902 | |
|
| |
| Commercial Banks—7.1% | | | | | |
| East West Bancorp, Inc. | | | 172,880 | | | | 11,192,251 | |
| |
| IBERIABANK Corp. | | | 117,090 | | | | 9,730,179 | |
| |
| JPMorgan Chase & Co. | | | 482,960 | | | | 55,516,252 | |
| |
| Signature Bank (New York) | | | 93,480 | | | | 10,255,691 | |
| | | | | | | | |
| | | | | | | 86,694,373 | |
|
| |
| Consumer Finance—1.0% | | | | | |
| Synchrony Financial | | | 425,460 | | | | 12,312,812 | |
|
| |
| Insurance—3.2% | | | | | |
| Arthur J. Gallagher & Co. | | | 169,780 | | | | 12,113,803 | |
| |
| Progressive Corp. (The) | | | 208,170 | | | | 12,492,282 | |
| |
| Prudential Financial, Inc. | | | 150,990 | | | | 15,236,401 | |
| | | | | | | | |
| | | | | | | 39,842,486 | |
|
| |
| Real Estate Investment Trusts (REITs)—2.2% | |
| EPR Properties | | | 187,310 | | | | 12,454,242 | |
| |
| Mid-America Apartment Communities, Inc. | | | 143,530 | | | | 14,464,953 | |
| | | | | | | | |
| | | | | | | 26,919,195 | |
|
| |
| Real Estate Management & Development—0.0% | |
| Realogy Holdings Corp. | | | 29,140 | | | | 637,292 | |
|
| |
| Health Care—13.1% | | | | | |
| Biotechnology—2.6% | | | | | | | | |
| Galapagos NV1 | | | 35,956 | | | | 3,959,125 | |
| |
| Gilead Sciences, Inc. | | | 137,100 | | | | 10,670,493 | |
| |
| uniQure NV1 | | | 110,780 | | | | 3,421,994 | |
| |
| Vertex Pharmaceuticals, Inc.1 | | | 78,810 | | | | 13,795,691 | |
| | | | | | | | |
| | | | | | | 31,847,303 | |
|
| |
| Health Care Equipment & Supplies—2.1% | | | | | |
| Becton Dickinson & Co. | | | 56,350 | | | | 14,108,349 | |
12 OPPENHEIMER MAIN STREET ALL CAP FUND
| | | | | | | | |
| | | Shares | | | Value | |
| |
Health Care Equipment & Supplies (Continued) | |
| |
| Intuitive Surgical, Inc.1 | | | 18,120 | | | $ | 9,208,403 | |
| Zimmer Biomet Holdings, Inc. | | | 22,550 | | | | 2,830,476 | |
| | | | | | | | |
| | | | | | | 26,147,228 | |
|
| |
| Health Care Providers & Services—4.6% | | | | | |
| Amedisys, Inc.1 | | | 77,936 | | | | 7,297,148 | |
| Anthem, Inc. | | | 89,100 | | | | 22,542,300 | |
| Humana, Inc. | | | 29,630 | | | | 9,309,153 | |
| Laboratory Corp. of America Holdings1 | | | 98,550 | | | | 17,279,757 | |
| | | | | | | | |
| | | | | | | 56,428,358 | |
|
| |
| Life Sciences Tools & Services—1.2% | | | | | |
| Agilent Technologies, Inc. | | | 221,350 | | | | 14,617,954 | |
Pharmaceuticals—2.6% | | | | | | | | |
| Johnson & Johnson | | | 124,060 | | | | 16,440,431 | |
| Merck & Co., Inc. | | | 235,010 | | | | 15,480,109 | |
| | | | | | | | |
| | | | | | | 31,920,540 | |
|
| |
| Industrials—11.3% | | | | | |
|
| |
Aerospace & Defense—3.2% | | | | | |
| Boeing Co. (The) | | | 43,690 | | | | 15,566,747 | |
| Lockheed Martin Corp. | | | 40,680 | | | | 13,265,748 | |
| Spirit AeroSystems Holdings, Inc., Cl. A | | | 109,770 | | | | 10,236,052 | |
| | | | | | | | |
| | | | | | | 39,068,547 | |
|
| |
| Air Freight & Couriers—0.7% | | | | | |
| XPO Logistics, Inc.1 | | | 89,510 | | | | 8,925,937 | |
Airlines—0.8% | | | | | | | | |
| Spirit Airlines, Inc.1 | | | 215,190 | | | | 9,347,854 | |
Building Products—1.4% | | | | | |
| Lennox International, Inc. | | | 44,390 | | | | 9,636,181 | |
| Masco Corp. | | | 175,930 | | | | 7,095,257 | |
| | | | | | | | |
| | | | | | | 16,731,438 | |
|
| |
Commercial Services & Supplies—1.5% | | | | | |
| KAR Auction Services, Inc. | | | 315,170 | | | | 18,736,857 | |
|
| |
Machinery—1.7% | | | | | | | | |
| Illinois Tool Works, Inc. | | | 75,970 | | | | 10,888,780 | |
| Stanley Black & Decker, Inc. | | | 68,820 | | | | 10,286,525 | |
| | | | | | | | |
| | | | | | | 21,175,305 | |
| | | | | | | | |
| | | Shares | | | Value | |
|
| |
Professional Services—1.4% | | | | | |
| Korn/Ferry International | | | 250,840 | | | $ | 16,550,423 | |
|
| |
Trading Companies & Distributors—0.6% | |
| Fastenal Co. | | | 133,960 | | | | 7,626,343 | |
|
| |
Information Technology—27.2% | | | | | |
|
| |
Communications Equipment—1.1% | | | | | |
| Palo Alto Networks, Inc.1 | | | 65,390 | | | | 12,964,221 | |
|
| |
Internet Software & Services—5.1% | | | | | |
| eBay, Inc.1 | | | 448,290 | | | | 14,995,300 | |
| Facebook, Inc., Cl. A1 | | | 184,850 | | | | 31,901,413 | |
| Q2 Holdings, Inc.1 | | | 131,250 | | | | 7,763,438 | |
| Yelp, Inc., Cl. A1 | | | 223,300 | | | | 8,235,304 | |
| | | | | | | | |
| | | | | | | 62,895,455 | |
|
| |
| IT Services—6.1% | | | | | |
| DXC Technology Co. | | | 179,070 | | | | 15,174,392 | |
| First Data Corp., Cl. A1 | | | 580,270 | | | | 13,497,080 | |
| Mastercard, Inc., Cl. A | | | 120,350 | | | | 23,829,300 | |
| PayPal Holdings, Inc.1 | | | 74,590 | | | | 6,126,822 | |
| Perspecta, Inc. | | | 276,048 | | | | 5,990,242 | |
| Teradata Corp.1 | | | 252,820 | | | | 9,680,478 | |
| | | | | | | | |
| | | | | | | 74,298,314 | |
|
| |
| Semiconductors & Semiconductor Equipment—2.5% | |
| Applied Materials, Inc. | | | 274,170 | | | | 13,332,887 | |
| Microchip Technology, Inc. | | | 177,950 | | | | 16,625,869 | |
| | | | | | | | |
| | | | | | | 29,958,756 | |
|
| |
| Software—7.6% | | | | | |
| Activision Blizzard, Inc. | | | 229,330 | | | | 16,837,408 | |
| Microsoft Corp. | | | 402,720 | | | | 42,720,538 | |
| Pegasystems, Inc. | | | 189,830 | | | | 10,554,548 | |
| Snap, Inc., Cl. A1 | | | 720,760 | | | | 9,009,500 | |
| Zynga, Inc., Cl. A1 | | | 3,829,220 | | | | 14,512,744 | |
| | | | | | | | |
| | | | | | | 93,634,738 | |
|
| |
| Technology Hardware, Storage & Peripherals—4.8% | |
| Apple, Inc. | | | 257,320 | | | | 48,965,423 | |
13 OPPENHEIMER MAIN STREET ALL CAP FUND
STATEMENT OF INVESTMENTS Continued
| | | | | | | | |
| | | Shares | | | Value | |
| |
Technology Hardware, Storage & Peripherals (Continued) | |
| |
| Western Digital Corp. | | | 146,140 | | | $ | 10,251,721 | |
| | | | | | | | |
| | | | | | | 59,217,144 | |
|
| |
| Materials—2.3% | | | | | |
| |
Chemicals—2.3% | | | | | | | | |
| DowDuPont, Inc. | | | 238,945 | | | | 16,432,248 | |
| |
| Eastman Chemical Co. | | | 111,000 | | | | 11,501,820 | |
| | | | | | | | |
| | | | | | | 27,934,068 | |
|
| |
| Telecommunication Services—1.5% | | | | | |
| |
Diversified Telecommunication Services—1.5% | |
| Verizon Communications, Inc. | | | 346,720 | | | | 17,904,621 | |
| |
Utilities—4.3% | | | | | | | | |
| |
Electric Utilities—2.6% | | | | | | | | |
| Duke Energy Corp. | | | 271,370 | | | | 22,149,219 | |
| |
| PG&E Corp. | | | 233,390 | | | | 10,054,441 | |
| | | | | | | | |
| | | | | | | 32,203,660 | |
| | | | | | | | |
| | | Shares | | | Value | |
| |
Gas Utilities—0.7% | | | | | | | | |
| Suburban Propane Partners LP2 | | | 390,155 | | | $ | 9,277,886 | |
| |
Multi-Utilities—1.0% | | | | | | | | |
| National Grid plc | | | 1,117,160 | | | | 11,920,925 | |
| | | | | | | | |
Total Common Stocks
(Cost $1,041,645,744) | | | | | | | 1,193,855,347 | |
|
| |
| Investment Company—2.1% | | | | | |
| |
Oppenheimer Institutional Government Money Market Fund, Cl. E, 1.87%3,4
(Cost $25,467,609) | | | 25,467,609 | | | | 25,467,609 | |
|
| |
Total Investments, at Value (Cost $1,067,113,353) | | | 99.5% | | | | 1,219,322,956 | |
| |
| Net Other Assets (Liabilities) | | | 0.5 | | | | 6,692,567 | |
| | | | |
| Net Assets | | | 100.0% | | | $ | 1,226,015,523 | |
| | | | |
Footnotes to Statement of Investments
1. Non-income producing security.
2. Security is a Master Limited Partnership.
3. Rate shown is the 7-day yield at period end.
4. Is or was an affiliate, as defined in the Investment Company Act of 1940, as amended, at or during the reporting period, by virtue of the Fund owning at least 5% of the voting securities of the issuer or as a result of the Fund and the issuer having the same investment adviser. Transactions during the reporting period in which the issuer was an affiliate are as follows:
| | | | | | | | | | | | | | | | |
| | | Shares
July 31, 2017 | | | Gross Additions | | | Gross
Reductions | | | Shares
July 31, 2018 | |
| |
Investment Company | | | | | | | | | | | | | | | | |
| Oppenheimer Institutional Government Money Market Fund, Cl. E | | | 39,081,927 | | | | 286,625,723 | | | | 300,240,041 | | | | 25,467,609 | |
| | | | |
| | | Value | | | Income | | | Realized
Gain (Loss) | | | Change in
Unrealized
Gain (Loss) | |
| |
Investment Company | | | | | | | | | | | | | | | | |
| Oppenheimer Institutional Government Money Market Fund, Cl. E | | $ | 25,467,609 | | | $ | 212,033 | | | $ | — | | | $ | — | |
See accompanying Notes to Financial Statements.
14 OPPENHEIMER MAIN STREET ALL CAP FUND
STATEMENT OF ASSETS AND LIABILITIES July 31, 2018
| | | | |
Assets | | | | |
| Investments, at value—see accompanying statement of investments: | | | | |
| Unaffiliated companies (cost $1,041,645,744) | | $ | 1,193,855,347 | |
| Affiliated companies (cost $25,467,609) | | | 25,467,609 | |
| | | | |
| | | 1,219,322,956 | |
| |
| Cash | | | 500,010 | |
| |
| Receivables and other assets: | | | | |
| Investments sold | | | 8,690,063 | |
| Dividends | | | 1,289,747 | |
| Shares of beneficial interest sold | | | 360,827 | |
| Other | | | 154,203 | |
| | | | |
| Total assets | | | 1,230,317,806 | |
|
| |
Liabilities | | | | |
| Payables and other liabilities: | | | | |
| Investments purchased | | | 2,831,279 | |
| Shares of beneficial interest redeemed | | | 1,026,300 | |
| Distribution and service plan fees | | | 252,972 | |
| Trustees’ compensation | | | 130,848 | |
| Shareholder communications | | | 7,602 | |
| Other | | | 53,282 | |
| | | | |
| Total liabilities | | | 4,302,283 | |
|
| |
Net Assets | | $ | 1,226,015,523 | |
| | | | |
|
| |
Composition of Net Assets | | | | |
| Par value of shares of beneficial interest | | $ | 66,424 | |
| |
| Additional paid-in capital | | | 1,011,037,153 | |
| |
| Accumulated net investment income | | | 1,580,298 | |
| |
| Accumulated net realized gain on investments and foreign currency transactions | | | 61,127,912 | |
| |
| Net unrealized appreciation on investments and translation of assets and liabilities denominated in foreign currencies | | | 152,203,736 | |
| | | | |
Net Assets | | $ | 1,226,015,523 | |
| | | | |
15 OPPENHEIMER MAIN STREET ALL CAP FUND
STATEMENT OF ASSETS AND LIABILITIES Continued
| | | | |
| Net Asset Value Per Share | | | | |
| Class A Shares: | | | | |
| |
| Net asset value and redemption price per share (based on net assets of $923,741,231 and 49,222,619 shares of beneficial interest outstanding) | | $ | 18.77 | |
| Maximum offering price per share (net asset value plus sales charge of 5.75% of offering price) | | $ | 19.92 | |
| |
|
Class C Shares: | |
| Net asset value, redemption price (excludes applicable contingent deferred sales charge) and offering price per share (based on net assets of $201,770,787 and 11,802,891 shares of beneficial interest outstanding) | | $ | 17.10 | |
| |
| Class R Shares: | | | | |
| |
| Net asset value, redemption price (excludes applicable contingent deferred sales charge) and offering price per share (based on net assets of $58,149,421 and 3,194,271 shares of beneficial interest outstanding) | | $ | 18.20 | |
| |
| |
| Class Y Shares: | | | | |
| Net asset value, redemption price and offering price per share (based on net assets of $42,354,084 and 2,203,883 shares of beneficial interest outstanding) | | $ | 19.22 | |
See accompanying Notes to Financial Statements.
16 OPPENHEIMER MAIN STREET ALL CAP FUND
STATEMENT
OF OPERATIONS For the Year Ended July 31, 2018
| | | | |
| Investment Income | | | | |
| Dividends: | | | | |
| Unaffiliated companies (net of foreign withholding taxes of $109,134) | | $ | 20,030,008 | |
| Affiliated companies | | | 212,033 | |
| |
| Interest | | | 12,734 | |
| | | | |
Total investment income | | | 20,254,775 | |
| |
| Expenses | | | | |
| Management fees | | | 8,295,288 | |
| |
| Distribution and service plan fees: | | | | |
| Class A | | | 2,244,469 | |
| Class B1 | | | 35,556 | |
| Class C | | | 2,118,857 | |
Class R | | | 291,610 | |
| |
| Transfer and shareholder servicing agent fees: | | | | |
| Class A | | | 1,898,274 | |
| Class B1 | | | 7,635 | |
| Class C | | | 437,231 | |
| Class R | | | 121,832 | |
Class Y | | | 89,161 | |
| |
| Shareholder communications: | | | | |
| Class A | | | 25,887 | |
| Class B1 | | | 1,354 | |
| Class C | | | 5,861 | |
| Class R | | | 1,132 | |
| Class Y | | | 987 | |
| |
| Borrowing fees | | | 45,992 | |
| |
| Trustees’ compensation | | | 43,210 | |
| |
| Custodian fees and expenses | | | 8,802 | |
| |
| Other | | | 132,275 | |
| | | | |
| Total expenses | | | 15,805,413 | |
| Less waivers and reimbursements of expenses | | | (95,352) | |
| | | | |
Net expenses | | | 15,710,061 | |
| |
| Net Investment Income | | | 4,544,714 | |
| |
| Realized and Unrealized Gain (Loss) | | | | |
| Net realized gain (loss) on: | | | | |
| Investment transactions in unaffiliated companies | | | 81,680,603 | |
| Foreign currency transactions | | | (30,556) | |
| | | | |
Net realized gain | | | 81,650,047 | |
| |
| Net change in unrealized appreciation/depreciation on: | | | | |
| Investment transactions in unaffiliated companies | | | 37,165,559 | |
| Translation of assets and liabilities denominated in foreign currencies | | | 901 | |
| | | | |
Net change in unrealized appreciation/depreciation | | | 37,166,460 | |
| |
| Net Increase in Net Assets Resulting from Operations | | $ | 123,361,221 | |
| | | | |
17 OPPENHEIMER MAIN STREET ALL CAP FUND
STATEMENT
OF OPERATIONS Continued
1. Effective June 1, 2018, all Class B shares converted to Class A shares.
See accompanying Notes to Financial Statements.
18 OPPENHEIMER MAIN STREET ALL CAP FUND
STATEMENTS OF CHANGES IN NET ASSETS
| | | | | | | | |
| | | Year Ended
July 31, 2018 | | | Year Ended
July 31, 2017 | |
Operations | | | | | | | | |
| Net investment income | | $ | 4,544,714 | | | $ | 9,554,707 | |
| |
| Net realized gain | | | 81,650,047 | | | | 149,527,888 | |
| |
| Net change in unrealized appreciation/depreciation | | | 37,166,460 | | | | (2,071,864) | |
| | | | |
Net increase in net assets resulting from operations | | | 123,361,221 | | | | 157,010,731 | |
| Dividends and/or Distributions to Shareholders | | | | | | | | |
Dividends from net investment income: | | | | | | | | |
Class A | | | (8,107,441) | | | | (9,759,047) | |
Class B1 | | | — | | | | — | |
Class C | | | (446,654) | | | | (950,032) | |
Class R | | | (379,577) | | | | (514,197) | |
| Class Y | | | (496,454) | | | | (325,023) | |
| | | | |
| | | (9,430,126) | | | | (11,548,299) | |
| |
Distributions from net realized gain: | | | | | | | | |
Class A | | | (109,062,665) | | | | (54,653,776) | |
Class B1 | | | (599,823) | | | | (957,904) | |
Class C | | | (27,535,933) | | | | (14,391,946) | |
Class R | | | (7,165,249) | | | | (3,700,554) | |
| Class Y | | | (5,116,039) | | | | (1,540,753) | |
| | | | |
| | | (149,479,709) | | | | (75,244,933) | |
Beneficial Interest Transactions | | | | | | | | |
Net increase (decrease) in net assets resulting from beneficial interest transactions: | | | | | | | | |
Class A | | | 28,094,931 | | | | (60,210,539) | |
Class B1 | | | (8,237,758) | | | | (12,149,580) | |
Class C | | | (9,531,397) | | | | (20,717,091) | |
Class R | | | (2,354,763) | | | | (2,300,866) | |
| Class Y | | | (373,132) | | | | 9,717,497 | |
| | | | |
| | | 7,597,881 | | | | (85,660,579) | |
| Net Assets | | | | | | | | |
| Total decrease | | | (27,950,733) | | | | (15,443,080) | |
| |
| Beginning of period | | | 1,253,966,256 | | | | 1,269,409,336 | |
| | | | |
| End of period (including accumulated net investment income of $1,580,298 and $6,496,266, respectively) | | $ | 1,226,015,523 | | | $ | 1,253,966,256 | |
| | | | |
1. Effective June 1, 2018, all Class B shares converted to Class A shares.
See accompanying Notes to Financial Statements.
19 OPPENHEIMER MAIN STREET ALL CAP FUND
FINANCIAL HIGHLIGHTS
| | | | | | | | | | | | | | | | | | | | |
| Class A | | Year Ended
July 31, 2018 | | | Year Ended
July 31, 2017 | | | Year Ended
July 31, 2016 | | | Year Ended
July 31, 2015 | | | Year Ended
July 31, 2014 | |
| |
| Per Share Operating Data | | | | | | | | | | | | | | | | | | | | |
| Net asset value, beginning of period | | | $19.40 | | | | $18.35 | | | | $20.29 | | | | $19.09 | | | | $16.47 | |
| |
| Income (loss) from investment operations: | | | | | | | | | | | | | | | | | | | | |
| Net investment income1 | | | 0.09 | | | | 0.17 | | | | 0.14 | | | | 0.10 | | | | 0.05 | |
| Net realized and unrealized gain | | | 1.84 | | | | 2.21 | | | | 0.002 | | | | 1.17 | | | | 2.63 | |
| | | | |
| Total from investment operations | | | 1.93 | | | | 2.38 | | | | 0.14 | | | | 1.27 | | | | 2.68 | |
| |
| Dividends and/or distributions to shareholders: | | | | | | | | | | | | | | | | | | | | |
| Dividends from net investment income | | | (0.18) | | | | (0.20) | | | | (0.10) | | | | (0.07) | | | | (0.06) | |
| Distributions from net realized gain | | | (2.38) | | | | (1.13) | | | | (1.98) | | | | 0.00 | | | | 0.00 | |
| | | | |
| Total dividends and/or distributions to shareholders | | | (2.56) | | | | (1.33) | | | | (2.08) | | | | (0.07) | | | | (0.06) | |
| |
| Net asset value, end of period | | | $18.77 | | | | $19.40 | | | | $18.35 | | | | $20.29 | | | | $19.09 | |
| | | | |
| |
| |
| Total Return, at Net Asset Value3 | | | 10.55% | | | | 13.67% | | | | 1.26% | | | | 6.67% | | | | 16.29% | |
| |
| Ratios/Supplemental Data | | | | | | | | | | | | | | | | | | | | |
| Net assets, end of period (in thousands) | | | $923,741 | | | | $919,892 | | | | $927,091 | | | | $1,038,270 | | | | $1,107,747 | |
| |
| Average net assets (in thousands) | | | $924,084 | | | | $915,013 | | | | $930,473 | | | | $1,083,643 | | | | $1,102,039 | |
| |
| Ratios to average net assets:4 | | | | | | | | | | | | | | | | | | | | |
| Net investment income | | | 0.50% | | | | 0.92% | | | | 0.80% | | | | 0.51% | | | | 0.28% | |
| Expenses excluding specific expenses listed below | | | 1.14% | | | | 1.15% | | | | 1.14% | | | | 1.14% | | | | 1.14% | |
| Interest and fees from borrowings | | | 0.00%5 | | | | 0.00%5 | | | | 0.00%5 | | | | 0.00%5 | | | | 0.00% | |
| | | | |
| Total expenses6 | | | 1.14% | | | | 1.15% | | | | 1.14% | | | | 1.14% | | | | 1.14% | |
| Expenses after payments, waivers and/or reimbursements and reduction to custodian expenses | | | 1.13% | | | | 1.14% | | | | 1.14%7 | | | | 1.14%7 | | | | 1.14%7 | |
| |
| Portfolio turnover rate | | | 48% | | | | 89% | | | | 67% | | | | 74% | | | | 49% | |
1. Per share amounts calculated based on the average shares outstanding during the period.
2. Less than $0.005 per share.
3. Assumes an initial investment on the business day before the first day of the fiscal period, with all dividends and distributions reinvested in additional shares on the reinvestment date, and redemption at the net asset value calculated on the last business day of the fiscal period. Sales charges are not reflected in the total returns. Total returns are not annualized for periods less than one full year. Returns do not reflect the deduction of taxes that a shareholder would pay on fund distributions or the redemption of fund shares.
4. Annualized for periods less than one full year.
5. Less than 0.005%.
6. Total expenses including indirect expenses from affiliated fund fees and expenses were as follows:
| | | | | | |
| | | | | | |
| | Year Ended July 31, 2018 | | | 1.14 | % |
| | Year Ended July 31, 2017 | | | 1.15 | % |
| | Year Ended July 31, 2016 | | | 1.14 | % |
| | Year Ended July 31, 2015 | | | 1.14 | % |
| | Year Ended July 31, 2014 | | | 1.14 | % |
7. Waiver was less than 0.005%.
See accompanying Notes to Financial Statements.
20 OPPENHEIMER MAIN STREET ALL CAP FUND
| | | | | | | | | | | | | | | | | | | | |
| Class C | | Year Ended
July 31, 2018 | | | Year Ended
July 31, 2017 | | | Year Ended
July 31, 2016 | | | Year Ended
July 31, 2015 | | | Year Ended
July 31, 2014 | |
| |
| Per Share Operating Data | | | | | | | | | | | | | | | | | | | | |
| Net asset value, beginning of period | | | $17.88 | | | | $17.01 | | | | $19.00 | | | | $17.95 | | | | $15.55 | |
| |
| Income (loss) from investment operations: | | | | | | | | | | | | | | | | | | | | |
| Net investment income (loss)1 | | | (0.04) | | | | 0.03 | | | | 0.01 | | | | (0.05) | | | | (0.08) | |
| Net realized and unrealized gain (loss) | | | 1.68 | | | | 2.04 | | | | (0.02) | | | | 1.10 | | | | 2.48 | |
| | | | |
| Total from investment operations | | | 1.64 | | | | 2.07 | | | | (0.01) | | | | 1.05 | | | | 2.40 | |
| |
| Dividends and/or distributions to shareholders: | | | | | | | | | | | | | | | | | | | | |
| Dividends from net investment income | | | (0.04) | | | | (0.07) | | | | 0.00 | | | | (0.00)2 | | | | 0.00 | |
| Distributions from net realized gain | | | (2.38) | | | | (1.13) | | | | (1.98) | | | | 0.00 | | | | 0.00 | |
| | | | |
| Total dividends and/or distributions to shareholders | | | (2.42) | | | | (1.20) | | | | (1.98) | | | | (0.00) 2 | | | | 0.00 | |
| |
| Net asset value, end of period | | | $17.10 | | | | $17.88 | | | | $17.01 | | | | $19.00 | | | | $17.95 | |
| | | | |
| |
| |
| Total Return, at Net Asset Value3 | | | 9.67% | | | | 12.84% | | | | 0.48% | | | | 5.86% | | | | 15.44% | |
|
| |
| Ratios/Supplemental Data | | | | | | | | | | | | | | | | | | | | |
| Net assets, end of period (in thousands) | | | $201,771 | | | | $219,426 | | | | $228,811 | | | | $260,200 | | | | $275,348 | |
| |
| Average net assets (in thousands) | | | $212,553 | | | | $221,928 | | | | $232,194 | | | | $269,678 | | | | $273,813 | |
| |
| Ratios to average net assets:4 | | | | | | | | | | | | | | | | | | | | |
| Net investment income (loss) | | | (0.25)% | | | | 0.17% | | | | 0.05% | | | | (0.25)% | | | | (0.47)% | |
| Expenses excluding specific expenses listed below | | | 1.89% | | | | 1.90% | | | | 1.89% | | | | 1.90% | | | | 1.88% | |
| Interest and fees from borrowings | | | 0.00%5 | | | | 0.00%5 | | | | 0.00%5 | | | | 0.00%5 | | | | 0.00% | |
| | | | |
| Total expenses6 | | | 1.89% | | | | 1.90% | | | | 1.89% | | | | 1.90% | | | | 1.88% | |
| Expenses after payments, waivers and/or reimbursements and reduction to custodian expenses | | | 1.88% | | | | 1.89% | | | | 1.89%7 | | | | 1.90%7 | | | | 1.88%7 | |
| |
| Portfolio turnover rate | | | 48% | | | | 89% | | | | 67% | | | | 74% | | | | 49% | |
1. Per share amounts calculated based on the average shares outstanding during the period.
2. Less than $0.005 per share.
3. Assumes an initial investment on the business day before the first day of the fiscal period, with all dividends and distributions reinvested in additional shares on the reinvestment date, and redemption at the net asset value calculated on the last business day of the fiscal period. Sales charges are not reflected in the total returns. Total returns are not annualized for periods less than one full year. Returns do not reflect the deduction of taxes that a shareholder would pay on fund distributions or the redemption of fund shares.
4. Annualized for periods less than one full year.
5. Less than 0.005%.
6. Total expenses including indirect expenses from affiliated fund fees and expenses were as follows:
| | | | | | |
| | | | | | |
| | Year Ended July 31, 2018 | | | 1.89 | % |
| | Year Ended July 31, 2017 | | | 1.90 | % |
| | Year Ended July 31, 2016 | | | 1.89 | % |
| | Year Ended July 31, 2015 | | | 1.90 | % |
| | Year Ended July 31, 2014 | | | 1.88 | % |
7. Waiver was less than 0.005%.
See accompanying Notes to Financial Statements.
21 OPPENHEIMER MAIN STREET ALL CAP FUND
FINANCIAL HIGHLIGHTS Continued
| | | | | | | | | | | | | | | | | | | | |
| Class R | | Year Ended
July 31, 2018 | | | Year Ended
July 31, 2017 | | | Year Ended
July 31, 2016 | | | Year Ended
July 31, 2015 | | | Year Ended
July 31, 2014 | |
| |
| Per Share Operating Data | | | | | | | | | | | | | | | | | | | | |
| Net asset value, beginning of period | | | $18.88 | | | | $17.89 | | | | $19.83 | | | | $18.65 | | | | $16.09 | |
| |
| Income (loss) from investment operations: | | | | | | | | | | | | | | | | | | | | |
| Net investment income1 | | | 0.05 | | | | 0.12 | | | | 0.10 | | | | 0.05 | | | | 0.002 | |
| Net realized and unrealized gain (loss) | | | 1.78 | | | | 2.16 | | | | (0.02) | | | | 1.15 | | | | 2.57 | |
| | | | |
| Total from investment operations | | | 1.83 | | | | 2.28 | | | | 0.08 | | | | 1.20 | | | | 2.57 | |
| |
| Dividends and/or distributions to shareholders: | | | | | | | | | | | | | | | | | | | | |
| Dividends from net investment income | | | (0.13) | | | | (0.16) | | | | (0.04) | | | | (0.02) | | | | (0.01) | |
| Distributions from net realized gain | | | (2.38) | | | | (1.13) | | | | (1.98) | | | | 0.00 | | | | 0.00 | |
| | | | |
| Total dividends and/or distributions to shareholders | | | (2.51) | | | | (1.29) | | | | (2.02) | | | | (0.02) | | | | (0.01) | |
| |
| Net asset value, end of period | | | $18.20 | | | | $18.88 | | | | $17.89 | | | | $19.83 | | | | $18.65 | |
| | | | |
| |
| |
| Total Return, at Net Asset Value3 | | | 10.27% | | | | 13.40% | | | | 0.96% | | | | 6.43% | | | | 15.97% | |
|
| |
| Ratios/Supplemental Data | | | | | | | | | | | | | | | | | | | | |
| Net assets, end of period (in thousands) | | | $58,150 | | | | $62,250 | | | | $61,124 | | | | $74,477 | | | | $89,674 | |
| |
| Average net assets (in thousands) | | | $59,234 | | | | $60,661 | | | | $64,020 | | | | $82,378 | | | | $91,226 | |
| |
| Ratios to average net assets:4 | | | | | | | | | | | | | | | | | | | | |
| Net investment income | | | 0.25% | | | | 0.67% | | | | 0.55% | | | | 0.26% | | | | 0.02% | |
| Expenses excluding specific expenses listed below | | | 1.39% | | | | 1.40% | | | | 1.39% | | | | 1.39% | | | | 1.40% | |
| Interest and fees from borrowings | | | 0.00%5 | | | | 0.00%5 | | | | 0.00%5 | | | | 0.00%5 | | | | 0.00% | |
| | | | |
| Total expenses6 | | | 1.39% | | | | 1.40% | | | | 1.39% | | | | 1.39% | | | | 1.40% | |
| Expenses after payments, waivers and/or reimbursements and reduction to custodian expenses | | | 1.38% | | | | 1.39% | | |
| 1.39%7
|
| |
| 1.39%7
|
| | | 1.40%7 | |
| |
| Portfolio turnover rate | | | 48% | | | | 89% | | | | 67% | | | | 74% | | | | 49% | |
1. Per share amounts calculated based on the average shares outstanding during the period.
2. Less than $0.005 per share.
3. Assumes an initial investment on the business day before the first day of the fiscal period, with all dividends and distributions reinvested in additional shares on the reinvestment date, and redemption at the net asset value calculated on the last business day of the fiscal period. Sales charges are not reflected in the total returns. Total returns are not annualized for periods less than one full year. Returns do not reflect the deduction of taxes that a shareholder would pay on fund distributions or the redemption of fund shares.
4. Annualized for periods less than one full year.
5. Less than 0.005%.
6. Total expenses including indirect expenses from affiliated fund fees and expenses were as follows:
| | | | | | |
| | | | | | |
| | Year Ended July 31, 2018 | | | 1.39 | % |
| | Year Ended July 31, 2017 | | | 1.40 | % |
| | Year Ended July 31, 2016 | | | 1.39 | % |
| | Year Ended July 31, 2015 | | | 1.39 | % |
| | Year Ended July 31, 2014 | | | 1.40 | % |
7. Waiver was less than 0.005%.
See accompanying Notes to Financial Statements.
22 OPPENHEIMER MAIN STREET ALL CAP FUND
| | | | | | | | | | | | | | | | | | | | |
| Class Y | | Year Ended
July 31, 2018 | | | Year Ended
July 31, 2017 | | | Year Ended
July 31, 2016 | | | Year Ended
July 31, 2015 | | | Year Ended
July 31, 2014 | |
| |
| Per Share Operating Data | | | | | | | | | | | | | | | | | | | | |
| Net asset value, beginning of period | | | $19.81 | | | | $18.70 | | | | $20.65 | | | | $19.43 | | | | $16.76 | |
| |
| Income (loss) from investment operations: | | | | | | | | | | | | | | | | | | | | |
| Net investment income1 | | | 0.14 | | | | 0.22 | | | | 0.19 | | | | 0.15 | | | | 0.10 | |
| Net realized and unrealized gain (loss) | | | 1.88 | | | | 2.26 | | | | (0.02) | | | | 1.19 | | | | 2.67 | |
| | | | |
| Total from investment operations | | | 2.02 | | | | 2.48 | | | | 0.17 | | | | 1.34 | | | | 2.77 | |
| |
| Dividends and/or distributions to shareholders: | | | | | | | | | | | | | | | | | | | | |
| Dividends from net investment income | | | (0.23) | | | | (0.24) | | | | (0.14) | | | | (0.12) | | | | (0.10) | |
| Distributions from net realized gain | | | (2.38) | | | | (1.13) | | | | (1.98) | | | | 0.00 | | | | 0.00 | |
| | | | |
| Total dividends and/or distributions to shareholders | | | (2.61) | | | | (1.37) | | | | (2.12) | | | | (0.12) | | | | (0.10) | |
| |
| Net asset value, end of period | | | $19.22 | | | | $19.81 | | | | $18.70 | | | | $20.65 | | | | $19.43 | |
| | | | |
| | | | | |
| |
| Total Return, at Net Asset Value2 | | | 10.84% | | | | 13.96% | | | | 1.43% | | | | 6.95% | | | | 16.61% | |
|
| |
| Ratios/Supplemental Data | | | | | | | | | | | | | | | | | | | | |
| Net assets, end of period (in thousands) | | | $42,354 | | | | $43,905 | | | | $32,254 | | | | $53,018 | | | | $60,964 | |
| |
| Average net assets (in thousands) | | | $43,351 | | | | $32,465 | | | | $37,452 | | | | $55,960 | | | | $68,650 | |
| |
| Ratios to average net assets:3 | | | | | | | | | | | | | | | | | | | | |
| Net investment income | | | 0.74% | | | | 1.15% | | | | 1.05% | | | | 0.75% | | | | 0.56% | |
| Expenses excluding specific expenses listed below | | | 0.89% | | | | 0.91% | | | | 0.89% | | | | 0.89% | | | | 0.87% | |
| Interest and fees from borrowings | | | 0.00%4 | | | | 0.00%4 | | | | 0.00%4 | | | | 0.00%4 | | | | 0.00% | |
| | | | |
| Total expenses5 | | | 0.89% | | | | 0.91% | | | | 0.89% | | | | 0.89% | | | | 0.87% | |
| Expenses after payments, waivers and/or reimbursements and reduction to custodian expenses | | | 0.88% | | | | 0.90% | | |
| 0.89%6
|
| |
| 0.89%6
|
| | | 0.87%6 | |
| |
| Portfolio turnover rate | | | 48% | | | | 89% | | | | 67% | | | | 74% | | | | 49% | |
1. Per share amounts calculated based on the average shares outstanding during the period.
2. Assumes an initial investment on the business day before the first day of the fiscal period, with all dividends and distributions reinvested in additional shares on the reinvestment date, and redemption at the net asset value calculated on the last business day of the fiscal period. Sales charges are not reflected in the total returns. Total returns are not annualized for periods less than one full year. Returns do not reflect the deduction of taxes that a shareholder would pay on fund distributions or the redemption of fund shares.
3. Annualized for periods less than one full year.
4. Less than 0.005%.
5. Total expenses including indirect expenses from affiliated fund fees and expenses were as follows:
| | | | | | |
| | | | | | |
| | Year Ended July 31, 2018 | | | 0.89 | % |
| | Year Ended July 31, 2017 | | | 0.91 | % |
| | Year Ended July 31, 2016 | | | 0.89 | % |
| | Year Ended July 31, 2015 | | | 0.89 | % |
| | Year Ended July 31, 2014 | | | 0.87 | % |
6. Waiver was less than 0.005%.
See accompanying Notes to Financial Statements.
23 OPPENHEIMER MAIN STREET ALL CAP FUND
NOTES TO FINANCIAL STATEMENTS July 31, 2018
1. Organization
Oppenheimer Main Street All Cap Fund (the “Fund”) is a diversified open-end management investment company registered under the Investment Company Act of 1940 (“1940 Act”), as amended. The Fund’s investment objective is to seek capital appreciation. The Fund’s investment adviser is OFI Global Asset Management, Inc. (“OFI Global” or the “Manager”), a wholly-owned subsidiary of OppenheimerFunds, Inc. (“OFI” or the “Sub-Adviser”). The Manager has entered into a sub-advisory agreement with OFI.
The Fund offers Class A, Class C, Class R and Class Y shares, and previously offered Class B shares for new purchase through June 29, 2012. Subsequent to that date, no new purchases of Class B shares were permitted. Reinvestment of dividend and/or capital gain distributions and exchanges of Class B shares into and from other Oppenheimer funds were permitted through May 31, 2018. Effective June 1, 2018 (the “Conversion Date”), all Class B shares converted to Class A shares. Class A shares are sold at their offering price, which is normally net asset value plus a front-end sales charge. Class C and Class R shares are sold, and Class B shares were sold, without a front-end sales charge but may be subject to a contingent deferred sales charge (“CDSC”). Class R shares are sold only through retirement plans. Retirement plans that offer Class R shares may impose charges on those accounts. Class Y shares are sold to certain institutional investors or intermediaries without either a front-end sales charge or a CDSC, however, the intermediaries may impose charges on their accountholders who beneficially own Class Y shares. All classes of shares have identical rights and voting privileges with respect to the Fund in general and exclusive voting rights on matters that affect that class alone. Earnings, net assets and net asset value per share may differ due to each class having its own expenses, such as transfer and shareholder servicing agent fees and shareholder communications, directly attributable to that class. Class A, C and R shares have, and Class B shares had, separate distribution and/or service plans under which they pay, and Class B shares paid, fees. Class Y shares do not pay such fees. Previously issued Class B shares automatically converted to Class A shares 72 months after the date of purchase.
The following is a summary of significant accounting policies followed in the Fund’s preparation of financial statements in accordance with accounting principles generally accepted in the United States (“U.S. GAAP”).
2. Significant Accounting Policies
Security Valuation. All investments in securities are recorded at their estimated fair value, as described in Note 3.
Foreign Currency Translation. The books and records of the Fund are maintained in U.S. dollars. Any foreign currency amounts are translated into U.S. dollars on the following basis:
(1) Value of investment securities, other assets and liabilities — at the exchange rates prevailing at market close as described in Note 3.
(2) Purchases and sales of investment securities, income and expenses — at the rates of exchange prevailing on the respective dates of such transactions.
24 OPPENHEIMER MAIN STREET ALL CAP FUND
2. Significant Accounting Policies (Continued)
Although the net assets and the values are presented at the foreign exchange rates at market close, the Fund does not isolate the portion of the results of operations resulting from changes in foreign exchange rates on investments from the fluctuations arising from changes in prices of securities held. Such fluctuations are included with the net realized and unrealized gains or losses from investments shown in the Statement of Operations.
For securities, which are subject to foreign withholding tax upon disposition, realized and unrealized gains or losses on such securities are recorded net of foreign withholding tax.
Reported net realized foreign exchange gains or losses arise from sales of foreign currencies, currency gains or losses realized between the trade and settlement dates on securities transactions, the difference between the amounts of dividends, interest, and foreign withholding tax reclaims recorded on the Fund’s books, and the U.S. dollar equivalent of the amounts actually received or paid. Net unrealized foreign exchange gains and losses arise from changes in the value of assets and liabilities other than investments in securities, resulting from changes in the exchange rate.
Allocation of Income, Expenses, Gains and Losses. Income, expenses (other than those attributable to a specific class), gains and losses are allocated on a daily basis to each class of shares based upon the relative proportion of net assets represented by such class. Operating expenses directly attributable to a specific class are charged against the operations of that class.
Dividends and Distributions to Shareholders. Dividends and distributions to shareholders, which are determined in accordance with income tax regulations and may differ from U.S. GAAP, are recorded on the ex-dividend date. Income and capital gain distributions, if any, are declared and paid annually or at other times as determined necessary by the Manager.
Investment Income. Dividend income is recorded on the ex-dividend date or upon ex-dividend notification in the case of certain foreign dividends where the ex-dividend date may have passed. Non-cash dividends included in dividend income, if any, are recorded at the fair value of the securities received. Withholding taxes on foreign dividends, if any, and capital gains taxes on foreign investments, if any, have been provided for in accordance with the Fund’s understanding of the applicable tax rules and regulations. Interest income, if any, is recognized on an accrual basis. Discount and premium, which are included in interest income on the Statement of Operations, are amortized or accreted daily.
Return of Capital Estimates. Distributions received from the Fund’s investments in Master Limited Partnerships (MLPs) and Real Estate Investments Trusts (REITs), generally are comprised of income and return of capital. The Fund records investment income and return of capital based on estimates. Such estimates are based on historical information available from each MLP, REIT and other industry sources. These estimates may subsequently be revised based on information received from MLPs and REITs after their tax reporting periods are
25 OPPENHEIMER MAIN STREET ALL CAP FUND
NOTES TO FINANCIAL STATEMENTS Continued
2. Significant Accounting Policies (Continued)
concluded.
Custodian Fees. “Custodian fees and expenses” in the Statement of Operations may include interest expense incurred by the Fund on any cash overdrafts of its custodian account during the period. Such cash overdrafts may result from the effects of failed trades in portfolio securities and from cash outflows resulting from unanticipated shareholder redemption activity. The Fund pays interest to its custodian on such cash overdrafts, to the extent they are not offset by positive cash balances maintained by the Fund, based on the negative rolling average balance at an average Federal Funds Rate plus 0.50%. The “Reduction to custodian expenses” line item, if applicable, represents earnings on cash balances maintained by the Fund during the period. Such interest expense and other custodian fees may be paid with these earnings.
Security Transactions. Security transactions are recorded on the trade date. Realized gains and losses on securities sold are determined on the basis of identified cost.
Indemnifications. The Fund’s organizational documents provide current and former Trustees and officers with a limited indemnification against liabilities arising in connection with the performance of their duties to the Fund. In the normal course of business, the Fund may also enter into contracts that provide general indemnifications. The Fund’s maximum exposure under these arrangements is unknown as this would be dependent on future claims that may be made against the Fund. The risk of material loss from such claims is considered remote.
Federal Taxes. The Fund intends to comply with provisions of the Internal Revenue Code applicable to regulated investment companies and to distribute substantially all of its investment company taxable income, including any net realized gain on investments not offset by capital loss carryforwards, if any, to shareholders. Therefore, no federal income or excise tax provision is required. The Fund files income tax returns in U.S. federal and applicable state jurisdictions. The statute of limitations on the Fund’s tax return filings generally remains open for the three preceding fiscal reporting period ends. The Fund has analyzed its tax positions for the fiscal year ended July 31, 2018, including open tax years, and does not believe there are any uncertain tax positions requiring recognition in the Fund’s financial statements.
The tax components of capital shown in the following table represent distribution requirements the Fund must satisfy under the income tax regulations, losses the Fund may be able to offset against income and gains realized in future years and unrealized appreciation or depreciation of securities and other investments for federal income tax purposes.
26 OPPENHEIMER MAIN STREET ALL CAP FUND
2. Significant Accounting Policies (Continued)
| | | | | | | | | | | | |
Undistributed Net Investment Income | | Undistributed
Long-Term
Gain | | | Accumulated
Loss
Carryforward1,2 | | | Net Unrealized
Appreciation
Based on cost of
Securities and
Other Investments
for Federal Income
Tax Purposes | |
| |
$3,087,701 | | | $59,789,802 | | | | $— | | | | $152,168,633 | |
1. During the reporting period, the Fund did not utilize any capital loss carryforward.
2. During the previous reporting period, the Fund did not utilize any capital loss carryforward.
Net investment income (loss) and net realized gain (loss) may differ for financial statement and tax purposes. The character of dividends and distributions made during the fiscal year from net investment income or net realized gains are determined in accordance with federal income tax requirements, which may differ from the character of net investment income or net realized gains presented in those financial statements in accordance with U.S. GAAP. Also, due to timing of dividends and distributions, the fiscal year in which amounts are distributed may differ from the fiscal year in which the income or net realized gain was recorded by the Fund.
Accordingly, the following amounts have been reclassified for the reporting period. Net assets of the Fund were unaffected by the reclassifications.
| | | | | | | | |
Increase to Paid-in Capital | | Reduction to
Accumulated
Net Investment
Income | | | Reduction to
Accumulated Net
Realized Gain
on Investments3 | |
| |
$5,151,860 | | | $30,556 | | | | $5,121,304 | |
3. $5,151,860, including $5,040,094 of long-term capital gain, was distributed in connection with Fund share redemptions.
The tax character of distributions paid during the reporting periods:
| | | | | | | | |
| | | Year Ended July 31, 2018 | | | Year Ended July 31, 2017 | |
| |
Distributions paid from: | | | | | | | | |
Ordinary income | | $ | 42,177,131 | | | $ | 11,548,299 | |
Long-term capital gain | | | 116,732,704 | | | | 75,244,933 | |
| | | | |
Total | | $ | 158,909,835 | | | $ | 86,793,232 | |
| | | | |
The aggregate cost of securities and other investments and the composition of unrealized appreciation and depreciation of securities and other investments for federal income tax purposes at period end are noted in the following table. The primary difference between book and tax appreciation or depreciation of securities and other investments, if applicable, is attributable to the tax deferral of losses or tax realization of financial statement unrealized gain or loss.
27 OPPENHEIMER MAIN STREET ALL CAP FUND
NOTES TO FINANCIAL STATEMENTS Continued
2. Significant Accounting Policies (Continued)
| | | | |
Federal tax cost of securities | | $ | 1,067,148,456 | |
| | | | |
Gross unrealized appreciation | | $ | 183,240,565 | |
Gross unrealized depreciation | | | (31,071,932) | |
| | | | |
Net unrealized appreciation | | $ | 152,168,633 | |
| | | | |
Use of Estimates. The preparation of financial statements in conformity with U.S. GAAP requires management to make estimates and assumptions that affect the reported amounts of assets and liabilities and disclosure of contingent assets and liabilities at the date of the financial statements and the reported amounts of increases and decreases in net assets from operations during the reporting period. Actual results could differ from those estimates.
New Accounting Pronouncement. In March 2017, Financial Accounting Standards Board (“FASB”) issued Accounting Standards Update (“ASU”), ASU 2017-08. This provides guidance related to the amortization period for certain purchased callable debt securities held at a premium. The ASU is effective for annual periods beginning after December 15, 2018, and interim periods within those annual periods. The Manager is evaluating the impacts of these changes on the financial statements.
3. Securities Valuation
The Fund calculates the net asset value of its shares as of 4:00 P.M. Eastern Time, on each day the New York Stock Exchange (the “Exchange”) is open for trading, except in the case of a scheduled early closing of the Exchange, in which case the Fund will calculate net asset value of the shares as of the scheduled early closing time of the Exchange.
The Fund’s Board has adopted procedures for the valuation of the Fund’s securities and has delegated the day-to-day responsibility for valuation determinations under those procedures to the Manager. The Manager has established a Valuation Committee which is responsible for determining a fair valuation for any security for which market quotations are not readily available. The Valuation Committee’s fair valuation determinations are subject to review, approval and ratification by the Fund’s Board at least quarterly or more frequently, if necessary.
Valuation Methods and Inputs
Securities are valued primarily using unadjusted quoted market prices, when available, as supplied by third party pricing services or broker-dealers.
The following methodologies are used to determine the market value or the fair value of the types of securities described below:
Equity securities traded on a securities exchange (including exchange-traded derivatives other than futures and futures options) are valued based on the official closing price on the principal exchange on which the security is traded, as identified by the Manager, prior to the time when the Fund’s assets are valued. If the official closing price is unavailable, the security is valued at the last sale price on the principal exchange on which it is traded, or if no sales
28 OPPENHEIMER MAIN STREET ALL CAP FUND
3. Securities Valuation (Continued)
occurred, the security is valued at the mean between the quoted bid and asked prices. Over-the-counter equity securities are valued at the last published sale price, or if no sales occurred, at the mean between the quoted bid and asked prices. Events occurring after the close of trading on foreign exchanges may result in adjustments to the valuation of foreign securities to more accurately reflect their fair value as of the time when the Fund’s assets are valued.
Shares of a registered investment company that are not traded on an exchange are valued at that investment company’s net asset value per share.
Securities for which market quotations are not readily available, or when a significant event has occurred that would materially affect the value of the security, are fair valued either (i) by a standardized fair valuation methodology applicable to the security type or the significant event as previously approved by the Valuation Committee and the Fund’s Board or (ii) as determined in good faith by the Manager’s Valuation Committee. The Valuation Committee considers all relevant facts that are reasonably available, through either public information or information available to the Manager, when determining the fair value of a security. Those standardized fair valuation methodologies include, but are not limited to, valuing securities at the last sale price or initially at cost and subsequently adjusting the value based on: changes in company specific fundamentals, changes in an appropriate securities index, or changes in the value of similar securities which may be further adjusted for any discounts related to security-specific resale restrictions. When possible, such methodologies use observable market inputs such as unadjusted quoted prices of similar securities, observable interest rates, currency rates and yield curves. The methodologies used for valuing securities are not necessarily an indication of the risks associated with investing in those securities nor can it be assured that the Fund can obtain the fair value assigned to a security if it were to sell the security.
Classifications
Each investment asset or liability of the Fund is assigned a level at measurement date based on the significance and source of the inputs to its valuation. Various data inputs may be used in determining the value of each of the Fund’s investments as of the reporting period end.
These data inputs are categorized in the following hierarchy under applicable financial accounting standards:
1) Level 1-unadjusted quoted prices in active markets for identical assets or liabilities (including securities actively traded on a securities exchange)
2) Level 2-inputs other than unadjusted quoted prices that are observable for the asset or liability (such as unadjusted quoted prices for similar assets and market corroborated inputs such as interest rates, prepayment speeds, credit risks, etc.)
3) Level 3-significant unobservable inputs (including the Manager’s own judgments about assumptions that market participants would use in pricing the asset or liability).
The inputs used for valuing securities are not necessarily an indication of the risks associated with investing in those securities.
The Fund classifies each of its investments in investment companies which are publicly
29 OPPENHEIMER MAIN STREET ALL CAP FUND
NOTES TO FINANCIAL STATEMENTS Continued
3. Securities Valuation (Continued)
offered as Level 1. Investment companies that are not publicly offered, if any, are classified as Level 2 in the fair value hierarchy.
The table below categorizes amounts that are included in the Fund’s Statement of Assets and Liabilities at period end based on valuation input level:
| | | | | | | | | | | | | | | | |
| | | Level 1— Unadjusted Quoted Prices | | | Level 2— Other Significant Observable Inputs | | | Level 3— Significant Unobservable Inputs | | | Value | |
| |
Assets Table | | | | | | | | | | | | | | | | |
Investments, at Value: | | | | | | | | | | | | | | | | |
Common Stocks | | | | | | | | | | | | | | | | |
Consumer Discretionary | | $ | 151,031,796 | | | $ | — | | | $ | — | | | $ | 151,031,796 | |
Consumer Staples | | | 38,067,824 | | | | 13,355,055 | | | | — | | | | 51,422,879 | |
Energy | | | 59,768,737 | | | | — | | | | — | | | | 59,768,737 | |
Financials | | | 200,298,060 | | | | — | | | | — | | | | 200,298,060 | |
Health Care | | | 157,002,258 | | | | 3,959,125 | | | | — | | | | 160,961,383 | |
Industrials | | | 138,162,704 | | | | — | | | | — | | | | 138,162,704 | |
Information Technology | | | 332,968,628 | | | | — | | | | — | | | | 332,968,628 | |
Materials | | | 27,934,068 | | | | — | | | | — | | | | 27,934,068 | |
Telecommunication Services | | | 17,904,621 | | | | — | | | | — | | | | 17,904,621 | |
Utilities | | | 41,481,546 | | | | 11,920,925 | | | | — | | | | 53,402,471 | |
Investment Company | | | 25,467,609 | | | | — | | | | — | | | | 25,467,609 | |
| | | | |
Total Assets | | $ | 1,190,087,851 | | | $ | 29,235,105 | | | $ | — | | | $ | 1,219,322,956 | |
| | | | |
Forward currency exchange contracts and futures contracts, if any, are reported at their unrealized appreciation/depreciation at measurement date, which represents the change in the contract’s value from trade date. All additional assets and liabilities included in the above table are reported at their market value at measurement date.
For the reporting period, there were no transfers between levels.
4. Investments and Risks
Investments in Affiliated Funds. The Fund is permitted to invest in other mutual funds advised by the Manager (“Affiliated Funds”). Affiliated Funds are open-end management investment companies registered under the 1940 Act, as amended. The Manager is the investment adviser of, and the Sub-Adviser provides investment and related advisory services to, the Affiliated Funds. When applicable, the Fund’s investments in Affiliated Funds are included in the Statement of Investments. Shares of Affiliated Funds are valued at their net asset value per share. As a shareholder, the Fund is subject to its proportional share of the Affiliated Funds’ expenses, including their management fee. The Manager will waive fees and/ or reimburse Fund expenses in an amount equal to the indirect management fees incurred through the Fund’s investment in the Affiliated Funds.
Each of the Affiliated Funds in which the Fund invests has its own investment risks, and those risks can affect the value of the Fund’s investments and therefore the value of the Fund’s shares. To the extent that the Fund invests more of its assets in one Affiliated Fund
30 OPPENHEIMER MAIN STREET ALL CAP FUND
4. Investments and Risks (Continued)
than in another, the Fund will have greater exposure to the risks of that Affiliated Fund.
Investments in Money Market Instruments. The Fund is permitted to invest its free cash balances in money market instruments to provide liquidity or for defensive purposes. The Fund may invest in money market instruments by investing in Class E shares of Oppenheimer Institutional Government Money Market Fund (“IGMMF”), which is an Affiliated Fund. IGMMF is regulated as a money market fund under the 1940 Act, as amended. The Fund may also invest in money market instruments directly or in other affiliated or unaffiliated money market funds.
Master Limited Partnerships (“MLPs”). MLPs issue common units that represent an equity ownership interest in a partnership and provide limited voting rights. MLP common units are registered with the Securities and Exchange Commission (“SEC”), and are freely tradable on securities exchanges such as the NYSE and the NASDAQ Stock Market (“NASDAQ”), or in the over-the-counter (“OTC”) market. An MLP consists of one or more general partners, who conduct the business, and one or more limited partners, who contribute capital. MLP common unit holders have a limited role in the partnership’s operations and management. The Fund, as a limited partner, normally would not be liable for the debts of the MLP beyond the amounts the Fund has contributed, but would not be shielded to the same extent that a shareholder of a corporation would be. In certain circumstances creditors of an MLP would have the right to seek return of capital distributed to a limited partner. This right of an MLP’s creditors would continue after the Fund sold its investment in the MLP.
Equity Security Risk. Stocks and other equity securities fluctuate in price. The value of the Fund’s portfolio may be affected by changes in the equity markets generally. Equity markets may experience significant short-term volatility and may fall sharply at times. Different markets may behave differently from each other and U.S. equity markets may move in the opposite direction from one or more foreign stock markets. Adverse events in any part of the equity or fixed-income markets may have unexpected negative effects on other market segments.
The prices of individual equity securities generally do not all move in the same direction at the same time and a variety of factors can affect the price of a particular company’s securities. These factors may include, but are not limited to, poor earnings reports, a loss of customers, litigation against the company, general unfavorable performance of the company’s sector or industry, or changes in government regulations affecting the company or its industry.
5. Market Risk Factors
The Fund’s investments in securities and/or financial derivatives may expose the Fund to various market risk factors:
Commodity Risk. Commodity risk relates to the change in value of commodities or commodity indexes as they relate to increases or decreases in the commodities market. Commodities are physical assets that have tangible properties. Examples of these types of
31 OPPENHEIMER MAIN STREET ALL CAP FUND
NOTES TO FINANCIAL STATEMENTS Continued
5. Market Risk Factors (Continued)
assets are crude oil, heating oil, metals, livestock, and agricultural products.
Credit Risk. Credit risk relates to the ability of the issuer of debt to meet interest and principal payments, or both, as they come due. In general, lower-grade, higher-yield debt securities are subject to credit risk to a greater extent than lower-yield, higher-quality securities.
Equity Risk. Equity risk relates to the change in value of equity securities as they relate to increases or decreases in the general market.
Foreign Exchange Rate Risk. Foreign exchange rate risk relates to the change in the U.S. dollar value of a security held that is denominated in a foreign currency. The U.S. dollar value of a foreign currency denominated security will decrease as the dollar appreciates against the currency, while the U.S. dollar value will increase as the dollar depreciates against the currency.
Interest Rate Risk. Interest rate risk refers to the fluctuations in value of fixed-income securities resulting from the inverse relationship between price and yield. For example, an increase in general interest rates will tend to reduce the market value of already issued fixed-income investments, and a decline in general interest rates will tend to increase their value. In addition, debt securities with longer maturities, which tend to have higher yields, are subject to potentially greater fluctuations in value from changes in interest rates than obligations with shorter maturities.
Volatility Risk. Volatility risk refers to the magnitude of the movement, but not the direction of the movement, in a financial instrument’s price over a defined time period. Large increases or decreases in a financial instrument’s price over a relative time period typically indicate greater volatility risk, while small increases or decreases in its price typically indicate lower volatility risk.
6. Shares of Beneficial Interest
The Fund has authorized an unlimited number of $0.001 par value shares of beneficial interest of each class. Transactions in shares of beneficial interest were as follows:
| | | | | | | | | | | | | | | | |
| | | Year Ended July 31, 2018 | | | Year Ended July 31, 2017 | |
| | | Shares | | | Amount | | | Shares | | | Amount | |
| |
Class A | | | | | | | | | | | | | | | | |
Sold1 | | | 2,615,009 | | | $ | 49,085,668 | | | | 3,057,550 | | | $ | 56,119,861 | |
Dividends and/or distributions reinvested | | | 6,418,432 | | | | 115,018,277 | | | | 3,559,818 | | | | 62,901,976 | |
Redeemed | | | (7,238,611 | ) | | | (136,009,014 | ) | | | (9,724,394 | ) | | | (179,232,376) | |
| | | | |
Net increase (decrease) | | | 1,794,830 | | | $ | 28,094,931 | | | | (3,107,026 | ) | | $ | (60,210,539) | |
| | | | |
|
| |
Class B | | | | | | | | | | | | | | | | |
Sold | | | 1,508 | | | $ | 25,153 | | | | 7,679 | | | $ | 128,998 | |
Dividends and/or distributions reinvested | | | 36,806 | | | | 599,564 | | | | 58,677 | | | | 952,915 | |
Redeemed1 | | | (517,070 | ) | | | (8,862,475 | ) | | | (784,655 | ) | | | (13,231,493) | |
| | | | |
Net decrease | | | (478,756 | ) | | $ | (8,237,758 | ) | | | (718,299 | ) | | $ | (12,149,580) | |
| | | | |
32 OPPENHEIMER MAIN STREET ALL CAP FUND
6. Shares of Beneficial Interest (Continued)
| | | | | | | | | | | | | | | | |
| | | Year Ended July 31, 2018 | | | Year Ended July 31, 2017 | |
| | | Shares | | | Amount | | | Shares | | | Amount | |
| |
Class C | | | | | | | | | | | | | | | | |
Sold | | | 600,054 | | | $ | 10,299,416 | | | | 757,622 | | | $ | 12,850,491 | |
Dividends and/or distributions reinvested | | | 1,692,772 | | | | 27,761,456 | | | | 915,777 | | | | 14,982,114 | |
Redeemed | | | (2,764,633) | | | | (47,592,269 | ) | | | (2,851,285) | | | | (48,549,696) | |
| | | | |
Net decrease | | | (471,807) | | | $ | (9,531,397 | ) | | | (1,177,886) | | | $ | (20,717,091) | |
| | | | |
|
| |
Class R | | | | | | | | | | | | | | | | |
Sold | | | 370,092 | | | $ | 6,760,789 | | | | 590,557 | | | $ | 10,567,258 | |
Dividends and/or distributions reinvested | | | 425,433 | | | | 7,406,798 | | | | 236,342 | | | | 4,072,170 | |
Redeemed | | | (898,008) | | | | (16,522,350 | ) | | | (946,239) | | | | (16,940,294) | |
| | | | |
Net decrease | | | (102,483) | | | $ | (2,354,763 | ) | | | (119,340) | | | $ | (2,300,866) | |
| | | | |
|
| |
Class Y | | | | | | | | | | | | | | | | |
Sold | | | 780,552 | | | $ | 15,067,733 | | | | 1,408,648 | | | $ | 26,843,245 | |
Dividends and/or distributions reinvested | | | 285,297 | | | | 5,226,638 | | | | 96,911 | | | | 1,746,331 | |
Redeemed | | | (1,078,208) | | | | (20,667,503 | ) | | | (1,013,887) | | | | (18,872,079) | |
| | | | |
Net increase (decrease) | | | (12,359) | | | $ | (373,132 | ) | | | 491,672 | | | $ | 9,717,497 | |
| | | | |
1. All outstanding Class B shares converted to Class A shares on June 1, 2018.
7. Purchases and Sales of Securities
The aggregate cost of purchases and proceeds from sales of securities, other than short-term obligations and investments in IGMMF, for the reporting period were as follows:
| | | | | | | | |
| | | Purchases | | | Sales | |
| |
Investment securities | | | $588,135,946 | | | | $736,211,061 | |
8. Fees and Other Transactions with Affiliates
Management Fees. Under the investment advisory agreement, the Fund pays the Manager a management fee based on the daily net assets of the Fund at an annual rate as shown in the following table:
| | | | |
Fee Schedule | | | | |
Up to $200 million | | | 0.75% | |
Next $200 million | | | 0.72 | |
Next $200 million | | | 0.69 | |
Next $200 million | | | 0.66 | |
Next $4.2 billion | | | 0.60 | |
Over $5.0 billion | | | 0.58 | |
The Fund’s effective management fee for the reporting period was 0.67% of average annual net assets before any applicable waivers.
Sub-Adviser Fees. The Manager has retained the Sub-Adviser to provide the day-to-day
33 OPPENHEIMER MAIN STREET ALL CAP FUND
NOTES TO FINANCIAL STATEMENTS Continued
8. Fees and Other Transactions with Affiliates (Continued)
portfolio management of the Fund. Under the Sub-Advisory Agreement, the Manager pays the Sub-Adviser an annual fee in monthly installments, equal to a percentage of the investment management fee collected by the Manager from the Fund, which shall be calculated after any investment management fee waivers. The fee paid to the Sub-Adviser is paid by the Manager, not by the Fund.
Transfer Agent Fees. OFI Global (the “Transfer Agent”) serves as the transfer and shareholder servicing agent for the Fund. The Fund pays the Transfer Agent a fee based on annual net assets, which shall be calculated after any applicable fee waivers. Fees incurred and average net assets for each class with respect to these services are detailed in the Statement of Operations and Financial Highlights, respectively.
Sub-Transfer Agent Fees. The Transfer Agent has retained Shareholder Services, Inc., a wholly-owned subsidiary of OFI (the “Sub-Transfer Agent”), to provide the day-to-day transfer agent and shareholder servicing of the Fund. Under the Sub-Transfer Agency Agreement, the Transfer Agent pays the Sub-Transfer Agent an annual fee in monthly installments, equal to a percentage of the transfer agent fee collected by the Transfer Agent from the Fund, which shall be calculated after any applicable fee waivers. The fee paid to the Sub-Transfer Agent is paid by the Transfer Agent, not by the Fund.
Trustees’ Compensation. The Fund’s Board of Trustees (“Board”) has adopted a compensation deferral plan for Independent Trustees that enables Trustees to elect to defer receipt of all or a portion of the annual compensation they are entitled to receive from the Fund. For purposes of determining the amount owed to the Trustees under the plan, deferred amounts are treated as though equal dollar amounts had been invested in shares of the Fund or in other Oppenheimer funds selected by the Trustees. The Fund purchases shares of the funds selected for deferral by the Trustees in amounts equal to his or her deemed investment, resulting in a Fund asset equal to the deferred compensation liability. Such assets are included as a component of “Other” within the asset section of the Statement of Assets and Liabilities. Deferral of Trustees’ fees under the plan will not affect the net assets of the Fund and will not materially affect the Fund’s assets, liabilities or net investment income per share. Amounts will be deferred until distributed in accordance with the compensation deferral plan.
Distribution and Service Plan (12b-1) Fees. Under its General Distributor’s Agreement with the Fund, OppenheimerFunds Distributor, Inc. (the “Distributor”) acts as the Fund’s principal underwriter in the continuous public offering of the Fund’s classes of shares.
Service Plan for Class A Shares. The Fund has adopted a Service Plan (the “Plan”) for Class A shares pursuant to Rule 12b-1 under the 1940 Act. Under the Plan, the Fund reimburses the Distributor for a portion of its costs incurred for services provided to accounts that hold Class A shares. Reimbursement is made periodically at an annual rate of up to 0.25% of the daily net assets of Class A shares of the Fund. The Distributor currently uses all
34 OPPENHEIMER MAIN STREET ALL CAP FUND
8. Fees and Other Transactions with Affiliates (Continued)
of those fees to pay dealers, brokers, banks and other financial institutions periodically for providing personal service and maintenance of accounts of their customers that hold Class A shares. Any unreimbursed expenses the Distributor incurs with respect to Class A shares in any fiscal year cannot be recovered in subsequent periods. Fees incurred by the Fund under the Plan are detailed in the Statement of Operations.
Distribution and Service Plans for Class B, Class C and Class R Shares. The Fund has adopted Distribution and Service Plans (the “Plans”) for Class C and Class R shares, and had previously adopted a similar plan for Class B shares, pursuant to Rule 12b-1 under the 1940 Act to compensate the Distributor for distributing those share classes, maintaining accounts and providing shareholder services. Under the Plans, the Fund pays the Distributor an annual asset-based sales charge of 0.75% on Class C shares’ daily net assets and 0.25% on Class R shares’ daily net assets. The Fund paid the Distributor an annual asset-based sales charge of 0.75% on Class B shares prior to their Conversion Date. The Fund also pays a service fee under the Plans at an annual rate of 0.25% of daily net assets and previously paid this fee for Class B prior to their Conversion Date. The Plans continue in effect from year to year only if the Fund’s Board of Trustees votes annually to approve their continuance at an in person meeting called for that purpose. Fees incurred by the Fund under the Plans are detailed in the Statement of Operations.
Sales Charges. Front-end sales charges and CDSC do not represent expenses of the Fund. They are deducted from the proceeds of sales of Fund shares prior to investment or from redemption proceeds prior to remittance, as applicable. The sales charges retained by the Distributor from the sale of shares and the CDSC retained by the Distributor on the redemption of shares is shown in the following table for the period indicated.
| | | | | | | | | | | | | | | | | | | | |
| Year Ended | | Class A
Front-End
Sales Charges
Retained by
Distributor | | | Class A
Contingent
Deferred
Sales Charges
Retained by
Distributor | | | Class B
Contingent
Deferred
Sales Charges
Retained by
Distributor1 | | | Class C
Contingent
Deferred
Sales Charges
Retained by
Distributor | | | Class R
Contingent
Deferred
Sales Charges
Retained by
Distributor | |
| July 31, 2018 | | | $154,656 | | | | $— | | | | $2,065 | | | | $5,029 | | | | $— | |
1. Effective June 1, 2018, all Class B shares converted to Class A shares.
Waivers and Reimbursements of Expenses. Effective for the period January 1, 2017 through December 31, 2017, the Transfer Agent voluntarily waived and/or reimbursed Fund expenses in an amount equal to 0.015% of average annual net assets for Classes A, B, C, R and Y.
During the reporting period, the Transfer Agent waived fees and/or reimbursed the Fund for transfer agent and shareholder servicing agent fees as follows:
35 OPPENHEIMER MAIN STREET ALL CAP FUND
NOTES TO FINANCIAL STATEMENTS Continued
8. Fees and Other Transactions with Affiliates (Continued)
| | | | |
Class A | | | $58,089 | |
Class B1 | | | 396 | |
Class C | | | 13,638 | |
Class R | | | 3,801 | |
Class Y | | | 2,780 | |
1. Effective June 1, 2018, all Class B shares converted to Class A shares.
The Manager will waive fees and/or reimburse Fund expenses in an amount equal to the indirect management fees incurred through the Fund’s investment in IGMMF. During the reporting period, the Manager waived fees and/or reimbursed the Fund $16,648 for IGMMF management fees. This fee waiver and/or expense reimbursement may not be amended or withdrawn for one year from the date of the Fund’s prospectus, unless approved by the Board.
9. Borrowings and Other Financing
Joint Credit Facility. A number of mutual funds managed by the Manager participate in a $1.95 billion revolving credit facility (the “Facility”) intended to provide short-term financing, if necessary, subject to certain restrictions in connection with atypical redemption activity. Expenses and fees related to the Facility are paid by the participating funds and are disclosed separately or as other expenses on the Statement of Operations. The Fund did not utilize the Facility during the reporting period.
36 OPPENHEIMER MAIN STREET ALL CAP FUND
REPORT OF INDEPENDENT REGISTERED PUBLIC ACCOUNTING FIRM
To the Shareholders and Board of Trustees
Oppenheimer Main Street All Cap Fund:
Opinion on the Financial Statements
We have audited the accompanying statement of assets and liabilities of Oppenheimer Main Street All Cap Fund (the “Fund”), including the statement of investments, as of July 31, 2018, the related statement of operations for the year then ended, the statements of changes in net assets for each of the years in the two year period then ended, and the related notes (collectively, the “financial statements”) and the financial highlights for each of the years in the five year period then ended. In our opinion, the financial statements and financial highlights present fairly, in all material respects, the financial position of the Fund as of July 31, 2018, the results of its operations for the year then ended, the changes in its net assets for each of the years in the two year period then ended, and the financial highlights for each of the years in the five year period then ended, in conformity with U.S. generally accepted accounting principles.
Basis for Opinion
These financial statements and financial highlights are the responsibility of the Fund’s management. Our responsibility is to express an opinion on these financial statements and financial highlights based on our audits. We are a public accounting firm registered with the Public Company Accounting Oversight Board (United States) (“PCAOB”) and are required to be independent with respect to the Fund in accordance with the U.S. federal securities laws and the applicable rules and regulations of the Securities and Exchange Commission and the PCAOB.
We conducted our audits in accordance with the standards of the PCAOB. Those standards require that we plan and perform the audit to obtain reasonable assurance about whether the financial statements and financial highlights are free of material misstatement, whether due to error or fraud. Our audits included performing procedures to assess the risks of material misstatement of the financial statements and financial highlights, whether due to error or fraud, and performing procedures that respond to those risks. Such procedures included examining, on a test basis, evidence regarding the amounts and disclosures in the financial statements and financial highlights. Such procedures also included confirmation of securities owned as of July 31, 2018, by correspondence with the custodian, brokers and the transfer agent, or by other appropriate auditing procedures. Our audits also included evaluating the accounting principles used and significant estimates made by management, as well as evaluating the overall presentation of the financial statements and financial highlights. We believe that our audits provide a reasonable basis for our opinion.
KPMGLLP
We have not been able to determine the specific year that we began serving as the auditor of one or more Oppenheimer Funds investment companies, however we are aware that we have served as the auditor of one or more Oppenheimer Funds investment companies since at least 1969.
Denver, Colorado
September 26, 2018
37 OPPENHEIMER MAIN STREET ALL CAP FUND
FEDERAL INCOME TAX INFORMATION Unaudited
In early 2018, if applicable, shareholders of record received information regarding all dividends and distributions paid to them by the Fund during calendar year 2017.
Capital gain distributions of $1.85786 per share were paid to Class A, Class B, Class C, Class R and Class Y shareholders, respectively, on December 13, 2017. Whether received in stock or in cash, the capital gain distribution should be treated by shareholders as a gain from the sale of the capital assets held for more than one year (long-term capital gains).
Dividends, if any, paid by the Fund during the reporting period which are not designated as capital gain distributions should be multiplied by the maximum amount allowable but not less than 100% to arrive at the amount eligible for the corporate dividend-received deduction.
A portion, if any, of the dividends paid by the Fund during the reporting period which are not designated as capital gain distributions are eligible for lower individual income tax rates to the extent that the Fund has received qualified dividend income as stipulated by recent tax legislation. The maximum amount allowable but not less than $18,328,819 of the Fund’s fiscal year taxable income may be eligible for the lower individual income tax rates. In early 2018, shareholders of record received information regarding the percentage of distributions that are eligible for lower individual income tax rates.
Recent tax legislation allows a regulated investment company to designate distributions not designated as capital gain distributions, as either interest related dividends or short-term capital gain dividends, both of which are exempt from the U.S. withholding tax applicable to non U.S. taxpayers. For the reporting period, the maximum amount allowable but not less than $50,220 of the ordinary distributions to be paid by the Fund qualifies as an interest related dividend and the maximum amount allowable but not less than $1,600,550 of the short-term capital gain distribution to be paid by the Fund qualifies as a short-term capital gain dividend.
The foregoing information is presented to assist shareholders in reporting distributions received from the Fund to the Internal Revenue Service. Because of the complexity of the federal regulations which may affect your individual tax return and the many variations in state and local tax regulations, we recommend that you consult your tax advisor for specific guidance.
38 OPPENHEIMER MAIN STREET ALL CAP FUND
PORTFOLIO PROXY VOTING POLICIES AND GUIDELINES;
UPDATES TO STATEMENT OF INVESTMENTS Unaudited
The Fund has adopted Portfolio Proxy Voting Policies and Guidelines under which the Fund votes proxies relating to securities (“portfolio proxies”) held by the Fund. A description of the Fund’s Portfolio Proxy Voting Policies and Guidelines is available (i) without charge, upon request, by calling the Fund toll-free at 1.800.CALL OPP (225.5677), (ii) on the Fund’s website at www.oppenheimerfunds.com, and (iii) on the SEC’s website at www.sec.gov. In addition, the Fund is required to file Form N-PX, with its complete proxy voting record for the 12 months ended June 30th, no later than August 31st of each year. The Fund’s voting record is available (i) without charge, upon request, by calling the Fund toll-free at 1.800.CALL OPP (225.5677), and (ii) in the Form N-PX filing on the SEC’s website at www.sec.gov.
The Fund files its complete schedule of portfolio holdings with the SEC for the first quarter and the third quarter of each fiscal year on Form N-Q. The Fund’s Form N-Q filings are available on the SEC’s website at www.sec.gov. Those forms may be reviewed and copied at the SEC’s Public Reference Room in Washington, D.C. Information on the operation of the Public Reference Room may be obtained by calling 1-800-SEC-0330.
Householding—Delivery of Shareholder Documents
This is to inform you about OppenheimerFunds’ “householding” policy. If more than one member of your household maintains an account in a particular fund, OppenheimerFunds will mail only one copy of the fund’s prospectus (or, if available, the fund’s summary prospectus), annual and semiannual report and privacy policy. The consolidation of these mailings, called householding, benefits your fund through reduced mailing expense, and benefits you by reducing the volume of mail you receive from OppenheimerFunds. Householding does not affect the delivery of your account statements.
Please note that we will continue to household these mailings for as long as you remain an OppenheimerFunds shareholder, unless you request otherwise. If you prefer to receive multiple copies of these materials, please call us at 1.800.CALL-OPP (225-5677). You may also notify us in writing or via email. We will begin sending you individual copies of the prospectus (or, if available, the summary prospectus), reports and privacy policy within 30 days of receiving your request to stop householding.
39 OPPENHEIMER MAIN STREET ALL CAP FUND
TRUSTEES AND OFFICERS Unaudited
| | |
| Name, Position(s) Held with the Funds, Length of Service, Year of Birth | | Principal Occupation(s) During the Past 5 Years; Other Trusteeships/ Directorships Held. |
| |
| INDEPENDENT TRUSTEES | | The address of each Trustee in the chart below is 6803 S. Tucson Way, Centennial, Colorado 80112-3924. Each Trustee serves for an indefinite term, or until his or her resignation, retirement, death or removal. Each of the Trustees in the chart below oversees 56 portfolios in the OppenheimerFunds complex. |
| |
Robert J. Malone, Chairman of the Board of Trustees (since 2016) and Trustee (since 2002) Year of Birth: 1944 | | Chairman - Colorado Market of MidFirst Bank (since January 2015); Chairman of the Board (2012-2016) and Director (August 2005-January 2016) of Jones International University (educational organization); Trustee of the Gallagher Family Foundation (non-profit organization) (2000-2016); Chairman, Chief Executive Officer and Director of Steele Street Bank Trust (commercial banking) (August 2003-January 2015); Director of Opera Colorado Foundation (non-profit organization) (2008-2012); Director of Colorado UpLIFT (charitable organization) (1986-2010); Director of Jones Knowledge, Inc. (2006-2010); Former Chairman of U.S. Bank-Colorado (subsidiary of U.S. Bancorp and formerly Colorado National Bank) (July 1996-April 1999); Director of Commercial Assets, Inc. (real estate investment trust) (1993-2000); Director of U.S. Exploration, Inc. (oil and gas exploration) (1997-February 2004); Chairman of the Board (1991-1994) and Trustee (1985-1994) of Regis University; and Chairman of the Board (1990-1991) and Member (1984-1999) of Young Presidents Organization. Mr. Malone has served on the Boards of certain Oppenheimer funds since 2002, during which time he has become familiar with the Fund’s (and other Oppenheimer funds’) financial, accounting, regulatory and investment matters and has contributed to the Board’s deliberations. |
| |
Andrew J. Donohue, Trustee (since 2017) Year of Birth: 1950 | | Director, Mutual Fund Directors Forum (since February 2018); Of Counsel, Shearman & Sterling LLP (since September 2017); Chief of Staff of the U.S. Securities and Exchange Commission (regulator) (June 2015-February 2017); Managing Director and Investment Company General Counsel of Goldman Sachs (investment bank) (November 2012-May 2015); Partner at Morgan Lewis & Bockius, LLP (law firm) (March 2011-October 2012); Director of the Division of Investment Management of U.S. Securities and Exchange Commission (regulator) (May 2006-November 2010); Global General Counsel of Merrill Lynch Investment Managers (investment firm) (May 2003-May 2006); General Counsel (October 1991-November 2001) and Executive Vice President (January 1993-November 2001) of OppenheimerFunds, Inc. (investment firm) (June 1991-November 2001). Mr. Donohue has served on the Boards of certain Oppenheimer funds since 2017, during which time he has become familiar with the Fund’s (and other Oppenheimer funds’) financial, accounting, regulatory and investment matters and has contributed to the Board’s deliberations. |
| |
Richard F. Grabish, Trustee (since 2012) Year of Birth: 1948 | | Formerly Senior Vice President and Assistant Director of Sales and Marketing (March 1997-December 2007), Director (March 1987-December 2007) and Manager of Private Client Services (June 1985-June 2005) of A.G. Edwards & Sons, Inc. (broker/dealer and investment firm); Chairman and Chief Executive Officer of A.G. Edwards Trust Company, FSB (March 2001-December 2007); President and Vice Chairman of A.G. Edwards Trust Company, FSB (investment adviser) (April 1987-March 2001); President of A.G. Edwards Trust Company, FSB (investment adviser) (June 2005-December 2007).Mr. Grabish has served on the Boards of certain Oppenheimer funds since 2001, during which time he has become familiar with the Fund’s (and other Oppenheimer funds’) financial, accounting, regulatory and investment matters and has contributed to the Boards’ deliberations. |
40 OPPENHEIMER MAIN STREET ALL CAP FUND
| | |
| |
Beverly L. Hamilton, Trustee (since 2002) Year of Birth: 1946 | | Trustee of Monterey Institute for International Studies (educational organization) (2000-2014); Board Member of Middlebury College (educational organization) (December 2005-June 2011); Director of the Board (1991-2016), Vice Chairman of the Board (2006-2009) and Chairman of the Board (2010-2013) of American Funds’ Emerging Markets Growth Fund, Inc. (mutual fund); Director of The California Endowment (philanthropic organization) (April 2002-April 2008); Director (February 2002-2005) and Chairman of Trustees (2006-2007) of the Community Hospital of Monterey Peninsula; President of ARCO Investment Management Company (February 1991-April 2000); Member of the investment committees of The Rockefeller Foundation (2001-2006) and The University of Michigan (since 2000); Advisor at Credit Suisse First Boston’s Sprout venture capital unit (venture capital fund) (1994-January 2005); Trustee of MassMutual Institutional Funds (investment company) (1996-June 2004); Trustee of MML Series Investment Fund (investment company) (April 1989-June 2004); Member of the investment committee of Hartford Hospital (2000-2003); and Advisor to Unilever (Holland) pension fund (2000-2003). Ms. Hamilton has served on the Boards of certain Oppenheimer funds since 2002, during which time she has become familiar with the Fund’s (and other Oppenheimer funds’) financial, accounting, regulatory and investment matters and has contributed to the Boards’ deliberations. |
| |
Victoria J. Herget, Trustee (since 2012) Year of Birth: 1951 | | Board Chair (2008-2015) and Director (2004-Present) of United Educators (insurance company); Trustee (since 2000) and Chair (2010-2017) of Newberry Library (independent research library); Trustee, Mather LifeWays (senior living organization) (since 2001); Independent Director of the First American Funds (mutual fund family) (2003-2011); former Managing Director (1993-2001), Principal (1985-1993), Vice President (1978-1985) and Assistant Vice President (1973-1978) of Zurich Scudder Investments (investment adviser) (and its predecessor firms); Trustee (1992-2007), Chair of the Board of Trustees (1999- 2007), Investment Committee Chair (1994-1999) and Investment Committee member (2007-2010) of Wellesley College; Trustee, BoardSource (non-profit organization) (2006-2009) and Chicago City Day School (K-8 School) (1994- 2005). Ms. Herget has served on the Boards of certain Oppenheimer funds since 2012, during which time she has become familiar with the Fund’s (and other Oppenheimer funds’) financial, accounting, regulatory and investment matters and has contributed to the Boards’ deliberations. |
| |
Karen L. Stuckey, Trustee (since 2012) Year of Birth: 1953 | | Member (since May 2015) of Desert Mountain Community Foundation Advisory Board (non-profit organization); Partner (1990-2012) of PricewaterhouseCoopers LLP (professional services firm) (held various positions 1975-1990); Trustee (1992-2006); member of Executive, Nominating and Audit Committees and Chair of Finance Committee (1992-2006), and Emeritus Trustee (since 2006) of Lehigh University; member, Women’s Investment Management Forum (professional organization) (since inception) and Trustee of Jennies School for Little Children (non-profit) (2011-2014). Ms. Stuckey has served on the Boards of certain Oppenheimer funds since 2012, during which time she has become familiar with the Fund’s (and other Oppenheimer funds’) financial, accounting, regulatory and investment matters and has contributed to the Boards’ deliberations. |
41 OPPENHEIMER MAIN STREET ALL CAP FUND
TRUSTEES AND OFFICERS Unaudited / Continued
| | |
| |
James D. Vaughn, Trustee (since 2012) Year of Birth: 1945 | | Retired; former managing partner (1994-2001) of Denver office of Deloitte & Touche LLP, (held various positions in Denver and New York offices from 1969- 1993); Trustee and Chairman of the Audit Committee of Schroder Funds (2003- 2012); Board member and Chairman of Audit Committee of AMG National Trust Bank (since 2005); Trustee and Investment Committee member, University of South Dakota Foundation (since 1996); Board member, Audit Committee Member and past Board Chair, Junior Achievement (since 1993); former Board member, Mile High United Way, Boys and Girls Clubs, Boy Scouts, Colorado Business Committee for the Arts, Economic Club of Colorado and Metro Denver Network. Mr. Vaughn has served on the Boards of certain Oppenheimer funds since 2012, during which time he has become familiar with the Fund’s (and other Oppenheimer funds’) financial, accounting, regulatory and investment matters and has contributed to the Boards’ deliberations. |
|
| INTERESTED TRUSTEE AND OFFICER | | Mr. Steinmetz is an “Interested Trustee” because he is affiliated with the Manager and the Sub-Adviser by virtue of his positions as Chairman of the Sub-Adviser and officer and director of the Manager. Both as a Trustee and as an officer, Mr. Steinmetz serves for an indefinite term, or until his resignation, retirement, death or removal. Mr. Steinmetz’s address is 225 Liberty Street, 16th Floor, New York, New York 10281-1008. Mr. Steinmetz is an officer of 104 portfolios in the OppenheimerFunds complex. |
| |
Arthur P. Steinmetz, Trustee (since 2015), President and Principal Executive Officer (since 2014) Year of Birth: 1958 | | Chairman of OppenheimerFunds, Inc. (since January 2015); CEO and Chairman of OFI Global Asset Management, Inc. (since July 2014), President of OFI Global Asset Management, Inc. (since May 2013), a Director of OFI Global Asset Management, Inc. (since January 2013), Director of OppenheimerFunds, Inc. (since July 2014), President, Management Director and CEO of Oppenheimer Acquisition Corp. (OppenheimerFunds, Inc.‘s parent holding company) (since July 2014), and President and Director of OFI SteelPath, Inc. (since January 2013). Chief Investment Officer of the OppenheimerFunds advisory entities from (January 2013-December 2013); Executive Vice President of OFI Global Asset Management, Inc. (January 2013-May 2013); Chief Investment Officer of OppenheimerFunds, Inc. (October 2010-December 2012); Chief Investment Officer, Fixed-Income, of OppenheimerFunds, Inc. (April 2009-October 2010); Executive Vice President of OppenheimerFunds, Inc. (October 2009-December 2012); Director of Fixed Income of OppenheimerFunds, Inc. (January 2009-April 2009); and a Senior Vice President of OppenheimerFunds, Inc. (March 1993-September 2009). |
|
| OTHER OFFICERS OF THE FUND | | The addresses of the Officers in the chart below are as follows: for Mr. Krantz, Mss. Budzinski, Lo Bessette, Foxson and Picciotto, 225 Liberty Street, New York, New York 10281-1008, for Mr. Petersen, 6803 S. Tucson Way, Centennial, Colorado 80112-3924. Each Officer serves for an indefinite term or until his or her resignation, retirement, death or removal. |
| |
Magnus Krantz, Vice President (since 2014) Year of Birth: 1967 | | Vice President of the Sub-Adviser (since May 2009) and a portfolio manager of the Sub-Adviser (since November 2012); sector manager for technology for the Sub-Adviser’s Main Street Investment Team (since May 2009). Prior to joining the Sub-Adviser, Mr. Krantz was a sector manager at RS Investment and Guardian Life Insurance Company. Mr. Krantz joined Guardian Life Insurance Company in December 2005 and transitioned to RS Investments in October 2006 in connection with Guardian Life Insurance Company’s acquisition of an interest in RS Investments. Portfolio manager and analyst at Citigroup Asset Management (1998-2005) and as a consultant at Price Waterhouse (1997-1998). He also served as product development engineer at Newbridge Networks (1993-1996) and as a software engineer at Mitel Corporation (1990-1993). |
42 OPPENHEIMER MAIN STREET ALL CAP FUND
| | |
| |
Joy Budzinski, Vice President (since 2014) Year of Birth: 1968 | | Vice President of the Sub-Adviser (since May 2009) and a portfolio manager of the Sub-Adviser (since November 2012). Sector manager for healthcare for the Sub-Adviser’s Main Street Investment Team (since May 2009). Healthcare sector manager at RS Investment and Guardian Life Insurance Company. Guardian Life Insurance Company (August 2006) and transitioned to RS Investments (October 2006) in connection with Guardian Life Insurance Company’s acquisition of an interest in RS Investments. Senior equity analyst at Bank of New York BNY Asset Management (2001 -2006); portfolio manager and analyst at Alliance of America (1999-2001); portfolio manager and analyst at JP Morgan Chase (1993-1997); analyst at Prudential Investments (1997-1998). |
| |
Cynthia Lo Bessette, Secretary and Chief Legal Officer (since 2016) Year of Birth: 1969 | | Executive Vice President, General Counsel and Secretary of OFI Global Asset Management, Inc. (since February 2016); Senior Vice President and Deputy General Counsel of OFI Global Asset Management, Inc. (March 2015-February 2016); Chief Legal Officer of OppenheimerFunds, Inc. and OppenheimerFunds Distributor, Inc. (since February 2016); Vice President, General Counsel and Secretary of Oppenheimer Acquisition Corp. (since February 2016); General Counsel of OFI SteelPath, Inc., OFI Advisors, LLC and Index Management Solutions, LLC (since February 2016); Chief Legal Officer of OFI Global Institutional, Inc., HarbourView Asset Management Corporation, OFI Global Trust Company, Oppenheimer Real Asset Management, Inc., OFI Private Investments Inc., Shareholder Services, Inc. and Trinity Investment Management Corporation (since February 2016); Corporate Counsel (February 2012-March 2015) and Deputy Chief Legal Officer (April 2013-March 2015) of Jennison Associates LLC; Assistant General Counsel (April 2008-September 2009) and Deputy General Counsel (October 2009-February 2012) of Lord Abbett & Co. LLC. |
| |
Jennifer Foxson, Vice President and Chief Business Officer (since 2014) Year of Birth: 1969 | | Senior Vice President of OppenheimerFunds Distributor, Inc. (since June 2014); Vice President of OppenheimerFunds Distributor, Inc. (April 2006-June 2014); Vice President of OppenheimerFunds, Inc. (January 1998-March 2006); Assistant Vice President of OppenheimerFunds, Inc. (October 1991-December 1998). |
| |
Mary Ann Picciotto, Chief Compliance Officer and Chief Anti-Money Laundering Officer (since 2014) Year of Birth: 1973 | | Senior Vice President and Chief Compliance Officer of OFI Global Asset Management, Inc. (since March 2014); Chief Compliance Officer of OppenheimerFunds, Inc., OFI SteelPath, Inc., OFI Global Institutional, Inc., Oppenheimer Real Asset Management, Inc., OFI Private Investments Inc., Harborview Asset Management Corporation, Trinity Investment Management Corporation, and Shareholder Services, Inc. (since March 2014); Managing Director of Morgan Stanley Investment Management Inc. and certain of its various affiliated entities; Chief Compliance Officer of various Morgan Stanley Funds (May 2010-January 2014); Chief Compliance Officer of Morgan Stanley Investment Management Inc. (April 2007-January 2014). |
| |
Brian S. Petersen, Treasurer and Principal Financial & Accounting Officer (since 2016) Year of Birth: 1970 | | Senior Vice President of OFI Global Asset Management, Inc. (since January 2017); Vice President of OFI Global Asset Management, Inc. (January 2013-January 2017); Vice President of OppenheimerFunds, Inc. (February 2007-December 2012); Assistant Vice President of OppenheimerFunds, Inc. (August 2002-2007). |
The Fund’s Statement of Additional Information contains additional information about the Fund’s Trustees and Officers and is available without charge upon request by calling 1.800.CALL OPP (225.5677).
43 OPPENHEIMER MAIN STREET ALL CAP FUND
OPPENHEIMER MAIN STREET ALL CAP FUND
| | |
| Manager | | OFI Global Asset Management, Inc. |
| |
| Sub-Adviser | | OppenheimerFunds, Inc. |
| |
| Distributor | | OppenheimerFunds Distributor, Inc. |
| |
| Transfer and Shareholder | | OFI Global Asset Management, Inc. |
| Servicing Agent | | |
| |
| Sub-Transfer Agent | | Shareholder Services, Inc. |
| | DBA OppenheimerFunds Services |
| |
| Independent Registered | | KPMG LLP |
| Public Accounting Firm | | |
| |
| Legal Counsel | | Ropes & Gray LLP |
© 2018 OppenheimerFunds, Inc. All rights reserved.
44 OPPENHEIMER MAIN STREET ALL CAP FUND
PRIVACY NOTICE
As an Oppenheimer fund shareholder, you are entitled to know how we protect your personal information and how we limit its disclosure.
Information Sources
We obtain non-public personal information about our shareholders from the following sources:
| ● | | Applications or other forms. |
| ● | | When you create a user ID and password for online account access. |
| ● | | When you enroll in eDocs Direct,SM our electronic document delivery service. |
| ● | | Your transactions with us, our affiliates or others. |
| ● | | Technologies on our website, including: “cookies” and web beacons, which are used to collect data on the pages you visit and the features you use. |
If you visit oppenheimerfunds.com and do not log on to the secure account information areas, we do not obtain any personal information about you. When you do log on to a secure area, we do obtain your user ID and password to identify you. We also use this information to provide you with products and services you have requested, to inform you about products and services that you may be interested in and assist you in other ways.
We do not collect personal information through our website unless you willingly provide it to us, either directly by email or in those areas of the website that request information. In order to update your personal information (including your mailing address, email address and phone number) you must first log on and visit your user profile.
If you have set your browser to warn you before accepting cookies, you will receive the warning message with each cookie. You can refuse cookies by turning them off in your browser. However, doing so may limit your access to certain sections of our website.
We use cookies to help us improve and manage our website. For example, cookies help us recognize new versus repeat visitors to the site, track the pages visited, and enable some special features on the website. This data helps us provide better service for our website visitors.
Protection of Information
We do not disclose any non-public personal information (such as names on a customer list) about current or former customers to anyone, except as permitted by law.
Disclosure of Information
Copies of confirmations, account statements and other documents reporting activity in your fund accounts are made available to your financial advisor (as designated by you). We may also use details about you and your investments to help us, our financial service affiliates, or firms that jointly market their financial products and services with ours, to better serve your investment needs or suggest educational material that may be of interest to you. If this requires us to provide you with an opportunity to “opt in” or “opt out” of such information sharing with a firm not affiliated with us, you will receive notification on how to do so, before any such sharing takes place.
Right of Refusal
We will not disclose your personal information to unaffiliated third parties (except as permitted by law), unless we first offer you a reasonable opportunity to refuse or “opt out” of such disclosure.
45 OPPENHEIMER MAIN STREET ALL CAP FUND
PRIVACY NOTICE Continued
Internet Security and Encryption
In general, the email services provided by our website are encrypted and provide a secure and private means of communication with us. To protect your own privacy, confidential and/ or personal information should only be communicated via email when you are advised that you are using a secure website.
As a security measure, we do not include personal or account information in non-secure emails, and we advise you not to send such information to us in non-secure emails. Instead, you may take advantage of the secure features of our website to encrypt your email correspondence. To do this, you will need to use a browser that supports Secure Sockets Layer (SSL) protocol.
| ● | | All transactions conducted via our websites, including redemptions, exchanges and purchases, are secured by the highest encryption standards available. SSL is used to establish a secure connection between your PC and OppenheimerFunds’ server. It transmits information in an encrypted and scrambled format. |
| ● | | Encryption is achieved through an electronic scrambling technology that uses a “key” to code and then decode the data. Encryption acts like the cable converter box you may have on your television set. It scrambles data with a secret code so that no one can make sense of it while it is being transmitted. When the data reaches its destination, the same software unscrambles the data. |
| ● | | You can exit the secure area by closing your browser or, for added security, you can use the Log Out button before you close your browser. |
Other Security Measures
We maintain physical, electronic and procedural safeguards to protect your personal account information. Our employees and agents have access to that information only so that they may offer you products or provide services, for example, when responding to your account questions.
How You Can Help
You can also do your part to keep your account information private and to prevent unauthorized transactions. If you obtain a user ID and password for your account, safeguard that information. Strengthening your online credentials–your online security profile–typically your user name, password, and security questions and answers, can be one of your most important lines of defense on the Internet. For additional information on how you can help prevent identity theft, visit https://www.oppenheimerfunds.com/security.
Who We Are
This joint notice describes the privacy policies of the Oppenheimer funds, OppenheimerFunds, Inc., each of its investment adviser subsidiaries, OppenheimerFunds Distributor, Inc. and OFI Global Trust Co. It applies to all Oppenheimer fund accounts you presently have, or may open in the future, using your Social Security number—whether or not you remain a shareholder of our funds. This notice was last updated as of November 2017. In the event it is updated or changed, we will post an updated notice on our website at oppenheimerfunds.com. If you have any questions about this privacy policy, email us by clicking on the Contact Us section of our website at oppenheimerfunds.com, write to us at P.O. Box 5270, Denver, CO 80217-5270, or call us at 800 CALL OPP (225 5677).
46 OPPENHEIMER MAIN STREET ALL CAP FUND
THIS PAGE INTENTIONALLY LEFT BLANK.
47 OPPENHEIMER MAIN STREET ALL CAP FUND

Visit us at oppenheimerfunds.com for 24-hr access to account information and transactions or call us at 800.CALL OPP (800.225.5677) for 24-hr automated information and automated transactions. Representatives also available Mon–Fri 8am-8pm ET.
| | |
Visit Us oppenheimerfunds.com | | |
| |
Call Us 800 225 5677 | | |
| |
| Follow Us | | |
 | | Oppenheimer funds are distributed by OppenheimerFunds Distributor, Inc. 225 Liberty Street, New York, NY 10281-1008 © 2018 OppenheimerFunds Distributor, Inc. All rights reserved. RA0731.001.0718 September 26, 2018 |
Item 2. Code of Ethics.
The registrant has adopted a code of ethics that applies to the registrant’s principal executive officer, principal financial officer, principal accounting officer or controller or persons performing similar functions.
Item 3. Audit Committee Financial Expert.
The Board of Trustees of the registrant has determined that Karen L. Stuckey, the Chairwoman of the Board’s Audit Committee, is the audit committee financial expert and that Ms. Stuckey is “independent” for purposes of this Item 3.
Item 4. Principal Accountant Fees and Services.
The principal accountant for the audit of the registrant’s annual financial statements billed $26,100 in fiscal 2018 and $25,600 in fiscal 2017.
The principal accountant for the audit of the registrant’s annual financial statements billed $3,500 in fiscal 2018 and $7,000 in fiscal 2017.
The principal accountant for the audit of the registrant’s annual financial statements billed $343,361 in fiscal 2018 and $320,775 in fiscal 2017 to the registrant’s investment adviser or any entity controlling, controlled by, or under common control with the adviser that provides ongoing services to the registrant.
Such services include: Internal control reviews, GIPS attestation procedures, custody audits, CP Conduit fees, incremental, and additional, audit services.
The principal accountant for the audit of the registrant’s annual financial statements billed no such fees in fiscal 2018 and no such fees in fiscal 2017.
The principal accountant for the audit of the registrant’s annual financial statements billed $533,392 in fiscal 2018 and $710,577 in fiscal 2017 to the registrant’s investment adviser or any entity controlling, controlled by, or under common control with the adviser that provides ongoing services to the registrant.
Such services include: tax compliance, tax planning and tax advice. Tax compliance generally involves preparation of original and amended tax returns, claims for a refund and tax payment-planning services. Tax planning and tax advice includes assistance with tax audits and appeals, tax advice related to mergers and acquisitions and requests for rulings or technical advice from taxing authorities.
The principal accountant for the audit of the registrant’s annual financial statements billed no such fees in fiscal 2018 and no such fees in fiscal 2017.
The principal accountant for the audit of the registrant’s annual financial statements billed no such fees in fiscal 2018 and no such fees in fiscal 2017 to the registrant’s investment adviser or any entity controlling, controlled by, or under common control with the adviser that provides ongoing services to the registrant.
Such fees would include the cost to the principal accountant of attending audit committee meetings and consultations regarding the registrant’s retirement plan with respect to its Trustees.
| (e) | (1) During its regularly scheduled periodic meetings, the registrant’s audit committee will pre-approve all audit, audit-related, tax and other services to be provided by the principal accountants of the registrant. |
The audit committee has delegated pre-approval authority to its Chairman for any subsequent new engagements that arise between regularly scheduled meeting dates provided that any fees such pre-approved are presented to the audit committee at its next regularly scheduled meeting.
Under applicable laws, pre-approval of non-audit services may be waived provided that: 1) the aggregate amount of all such services provided constitutes no more than five percent of the total amount of fees paid by the registrant to its principal accountant during the fiscal year in which services are provided 2) such services were not recognized by the registrant at the time of engagement as non-audit services and 3) such services are promptly brought to the attention of the audit committee of the registrant and approved prior to the completion of the audit.
(2) 0%
| (f) | Not applicable as less than 50%. |
| (g) | The principal accountant for the audit of the registrant’s annual financial statements billed $880,253 in fiscal 2018 and $1,038,352 in fiscal 2017 to the registrant and the registrant’s investment adviser or any entity controlling, controlled by, or under common control with the adviser that provides ongoing services to the registrant related to non-audit fees. Those billings did not include any prohibited non-audit services as defined by the Securities Exchange Act of 1934. |
| (h) | The registrant’s audit committee of the board of Trustees has considered whether the provision of non-audit services that were rendered to the registrant’s investment adviser, and any entity controlling, controlled by, or under common control with the investment adviser that provides ongoing services to the registrant that were not pre-approved pursuant to paragraph (c)(7)(ii) of Rule 2-01 of Regulation S-X is compatible with maintaining the principal accountant’s independence. No such services were rendered. |
Item 5. Audit Committee of Listed Registrants
Not applicable.
Item 6. Schedule of Investments.
a) Not applicable. The complete schedule of investments is included in Item 1 of this Form N-CSR.
b) Not applicable.
Item 7. Disclosure of Proxy Voting Policies and Procedures for Closed-End Management Investment Companies.
Not applicable.
Item 8. Portfolio Managers of Closed-End Management Investment Companies.
Not applicable.
Item 9. Purchases of Equity Securities by Closed-End Management Investment Company and Affiliated Purchasers.
Not applicable.
Item 10. Submission of Matters to a Vote of Security Holders.
The Fund’s Governance Committee Provisions with Respect to Nominations of Directors/Trustees to the Respective Boards
None
Item 11. Controls and Procedures.
Based on their evaluation of the registrant’s disclosure controls and procedures (as defined in rule 30a-3(c) under the Investment Company Act of 1940 (17 CFR 270.30a-3(c)) as of 7/31/2018, the registrant’s principal executive officer and principal financial officer found the registrant’s disclosure controls and procedures to provide reasonable assurances that information required to be disclosed by the registrant in the reports that it files under the Securities Exchange Act of 1934 (a) is accumulated and communicated to registrant’s management, including its principal executive officer and principal financial officer, to allow timely decisions regarding required disclosure, and (b) is recorded, processed, summarized and reported, within the time periods specified in the rules and forms adopted by the U.S. Securities and Exchange Commission.
There have been no changes in the registrant’s internal controls over financial reporting that occurred during the registrant’s second fiscal quarter of the period covered by this report that have materially affected, or are reasonably likely to materially affect, the registrant’s internal control over financial reporting.
Item 12. Disclosure of Securities Lending Activities for Closed-End Management Investment Companies.
Not applicable.
Item 13. Exhibits.
| | |
| (a) | | (1) Exhibit attached hereto. |
| |
| | (2) Exhibits attached hereto. |
SIGNATURES
Pursuant to the requirements of the Securities Exchange Act of 1934 and the Investment Company Act of 1940, the registrant has duly caused this report to be signed on its behalf by the undersigned, thereunto duly authorized.
| | |
| Oppenheimer Main Street All Cap Fund |
| |
| By: | | /s/ Arthur P. Steinmetz |
| | Arthur P. Steinmetz |
| | Principal Executive Officer |
| |
| Date: | | 9/21/2018 |
Pursuant to the requirements of the Securities Exchange Act of 1934 and the Investment Company Act of 1940, this report has been signed below by the following persons on behalf of the registrant and in the capacities and on the dates indicated.
| | |
| By: | | /s/ Arthur P. Steinmetz |
| | | Arthur P. Steinmetz |
| | | Principal Executive Officer |
| |
| Date: | | 9/21/2018 |
| | |
| By: | | /s/ Brian S. Petersen |
| | | Brian S. Petersen |
| | | Principal Financial Officer |
| |
| Date: | | 9/21/2018 |