Searchable text section of graphics shown above
[LOGO]
[GRAPHIC]
Needham & Company
8th Annual Growth Conference
January 12, 2006
[LOGO]
Safe Harbor Provision
During the course of this presentation, we will make projections or other forward-looking statements regarding future events or the future financial performance of the Company. We wish to caution you that such statements reflect only our current expectations, and that actual events or results may differ materially.
We refer you to the risk factors and cautionary language contained in the documents that the Company files from time to time with the Securities and Exchange Commission, specifically the Company’s most recent S-3 Registration Statement and Form 10-K. Such documents contain and identify important factors that could cause the actual results to differ materially from those contained in our projections or forward-looking statements. We undertake no obligation to update such projections or such forward-looking statements in the future.
2
[LOGO]
[GRAPHIC]
Kent Alder
President and CEO
3
Company Overview
TTM is a leading provider of time-critical and technologically complex printed circuit boards to the world’s leading electronic equipment designers and manufacturers.
• “Pure Play” printed circuit board (PCB) manufacturer
• Focused on time and technology service segments
• Three production facilities:
• Santa Ana, CA
• Redmond, WA
• Chippewa Falls, WI
• $177 million in Sep 2005 YTD sales
• 1,688 employees
[GRAPHIC]
4
Investment Highlights
Focused Strategy
and Leading
Market Position | • Leader in most attractive PCB segments – time & technology
• Mission-focused facilities – speed, flexibility, and technology |
| |
Demonstrated
Execution
Excellence | • Strong relationships with leading OEM and EMS customers
• Proven ability to integrate acquisitions
• Cross-selling efforts leading to success |
| |
Industry Leading
Financial
Performance | • Profitable business model across cycle
• Strong balance sheet |
Market Leadership…Focus…Execution…Performance
5
Attractive Strategy
Growth | • Early access to new customers with high-growth potential |
• Key supplier to high-growth programs within market leaders |
• Critical service for new product introduction across multiple industries |
| |
Limited
Competition | • Difficult business model to replicate |
• Significant technology expertise and investment required |
• Quick-turn, high-mix production subject to less competition |
| |
Performance | • Time & technology focus allows premium pricing |
• Leads to superior margins and profitability |
Consistent Strategic Focus Driving Growth and Profitability
6
[LOGO]
[GRAPHIC]
Industry Overview
7
Electronic Equipment Landscape
Electronic Equipment Orders | |
[CHART]
• Steady growth since late 2002
• Forecasted shipment growth for 2006 is 4.1%*
• Limited inventories have provided quick turn opportunities
*Source: Henderson Ventures 12/2005
8
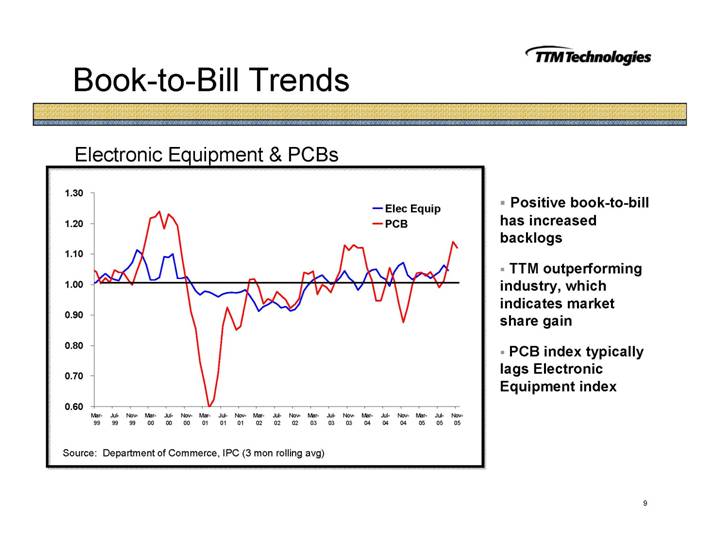
Book-to-Bill Trends
Electronic Equipment & PCBs
[CHART]
• Positive book-to-bill has increased backlogs
• TTM outperforming industry, which indicates market share gain
• PCB index typically lags Electronic Equipment index
Source: Department of Commerce, IPC (3 mon rolling avg)
9
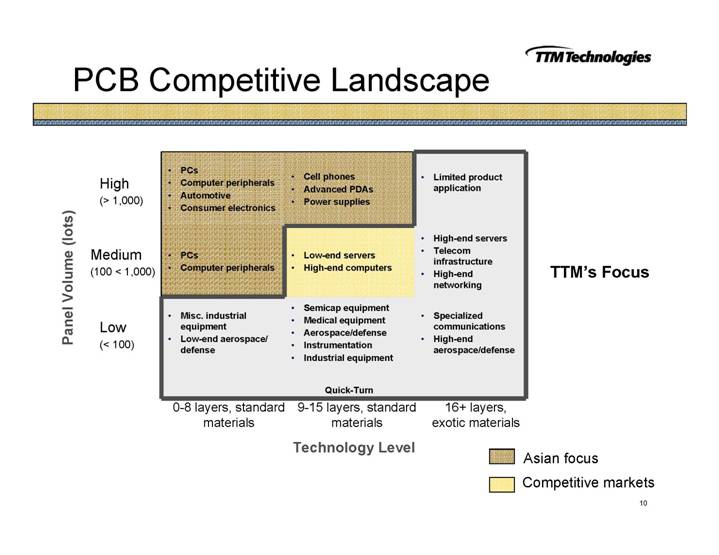
PCB Competitive Landscape
High
(> 1,000) | • PCs • Computer peripherals • Automotive • Consumer electronics | • Cell phones • Advanced PDAs • Power supplies | • Limited product
application |
| | | |
Medium
(100 < 1,000) | • PCs • Computer peripherals | • Low-end servers • High-end computers | • High-end servers • Telecom
infrastructure • High-end
networking |
Low
(< 100) | • Misc. industrial
equipment • Low-end aerospace/
defense | • Semicap equipment • Medical equipment • Aerospace/defense • Instrumentation • Industrial equipment | • Specialized
communications • High-end
aerospace/defense |
10
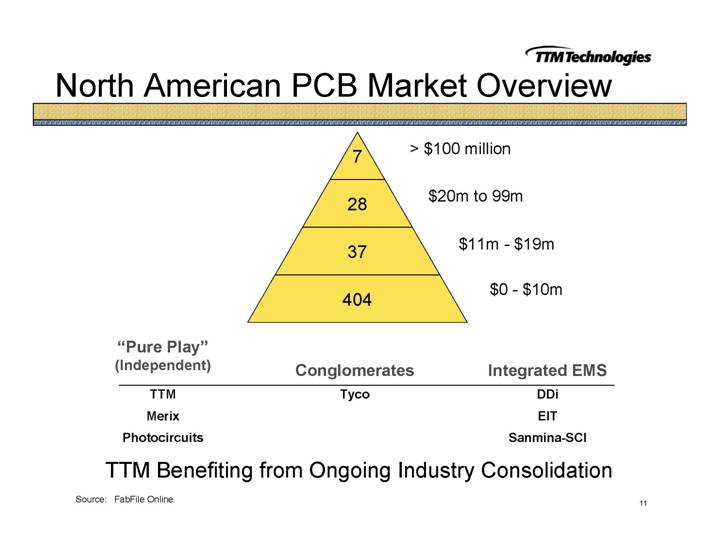
North American PCB Market Overview
[CHART]
“Pure Play” | | | | |
(Independent) | | Conglomerates | | Integrated EMS |
TTM | | Tyco | | DDi |
Merix | | | | EIT |
Photocircuits | | | | Sanmina-SCI |
TTM Benefiting from Ongoing Industry Consolidation
Source: FabFile Online.
11
[LOGO]
[GRAPHIC]
TTM’s Strategy
12
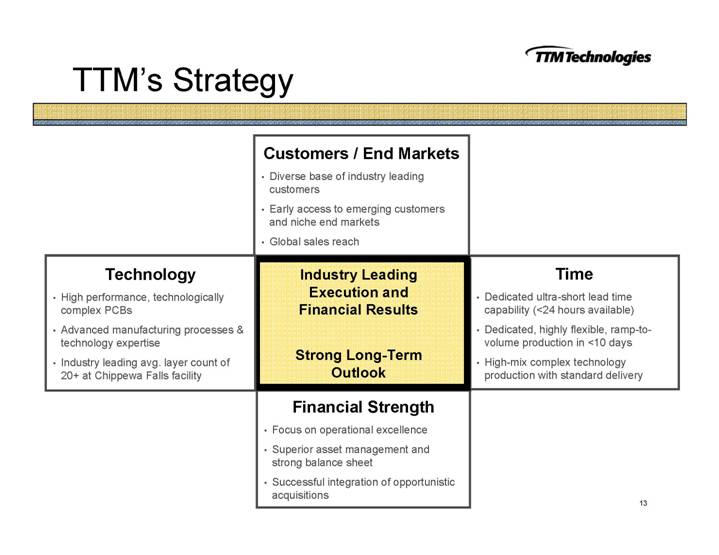
TTM’s Strategy
| Customers / End Markets
• Diverse base of industry leading
customers • Early access to emerging customers
and niche end markets • Global sales reach | |
| |
| |
| |
| |
| |
| |
| | |
Technology
• High performance, technologically
complex PCBs • Advanced manufacturing processes &
technology expertise • Industry leading avg. layer count of
20+ at Chippewa Falls facility | Industry Leading
Execution and
Financial Results
Strong Long-Term
Outlook | Time • Dedicated ultra-short lead time capability (<24 hours available) • Dedicated, highly flexible, ramp-to-volume
production in <10 days • High-mix complex technology
production with standard delivery |
| | |
| Financial Strength • Focus on operational excellence • Superior asset management and
strong balance sheet • Successful integration of opportunistic
acquisitions | |
| |
| |
| |
| |
| |
| |
13
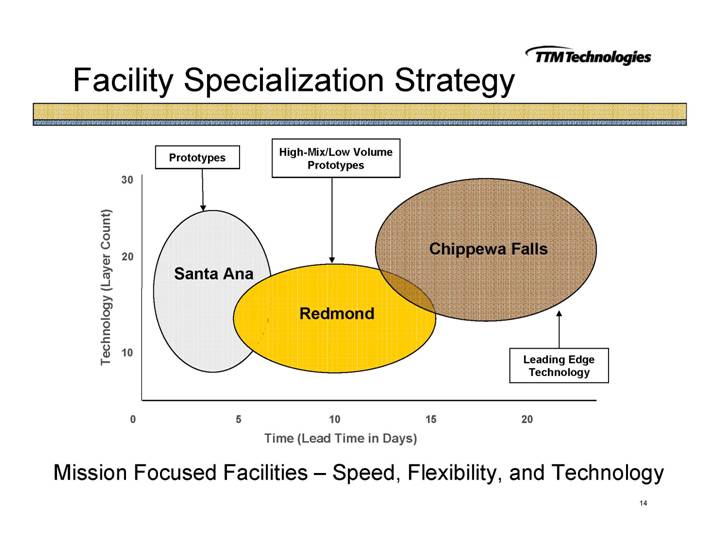
Facility Specialization Strategy
[CHART]
Mission Focused Facilities – Speed, Flexibility, and Technology
14
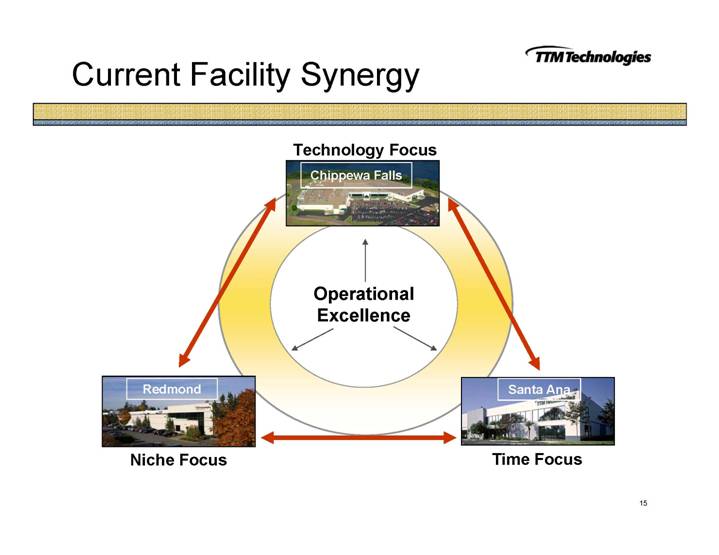
Current Facility Synergy
| Technology Focus | |
| Chippewa Falls | |
| [GRAPHIC] | |
| | |
| Operational Excellence | |
| | |
Redmond | | Santa Ana |
[GRAPHIC] | | [GRAPHIC] |
Niche Focus | | Time Focus |
15
Broadened Core Strategy
| Technology Focus | |
| Chippewa Falls | |
| [GRAPHIC] | |
Redmond | | Santa Ana |
[GRAPHIC] | Operational Excellence | [GRAPHIC] |
Niche Focus | | Time Focus |
| | |
| Future Off-Shore | |
| [GRAPHIC] | |
| Low Cost Focus | |
16
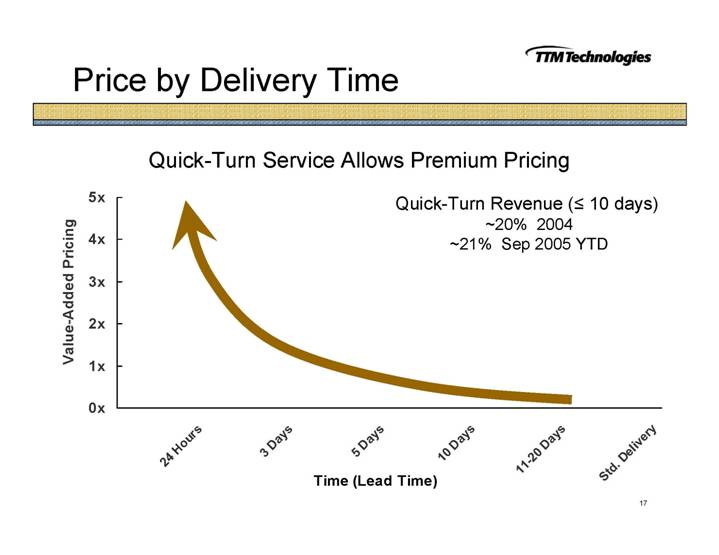
Price by Delivery Time
Quick-Turn Service Allows Premium Pricing
[CHART]
17
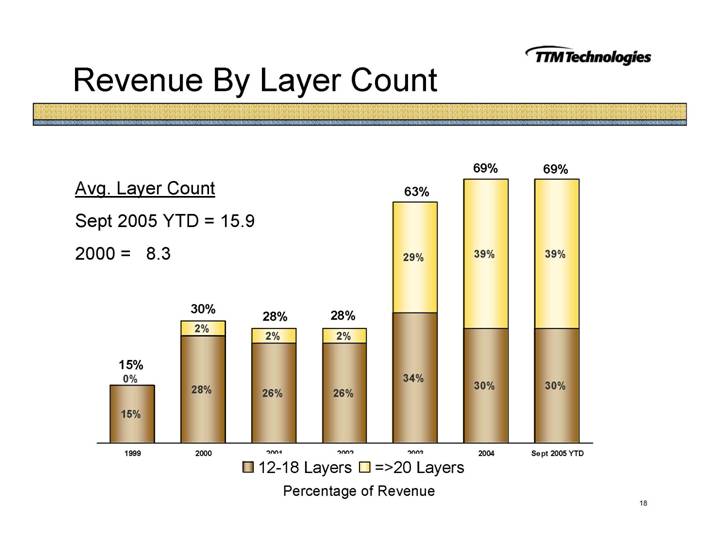
Revenue By Layer Count
[CHART]
18
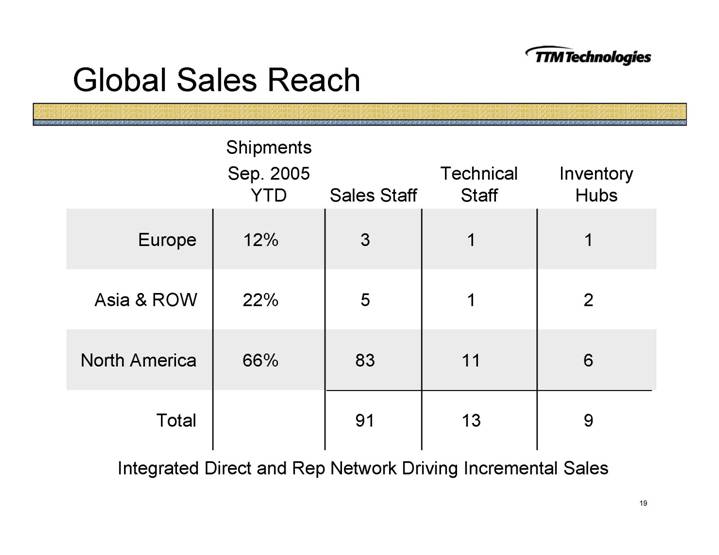
Global Sales Reach
| | Shipments | | | | | | | |
| | Sep. 2005 | | | | Technical | | Inventory | |
| | YTD | | Sales Staff | | Staff | | Hubs | |
| | | | | | | | | |
Europe | | 12 | % | 3 | | 1 | | 1 | |
| | | | | | | | | |
Asia & ROW | | 22 | % | 5 | | 1 | | 2 | |
| | | | | | | | | |
North America | | 66 | % | 83 | | 11 | | 6 | |
| | | | | | | | | |
Total | | | | 91 | | 13 | | 9 | |
Integrated Direct and Rep Network Driving Incremental Sales
19
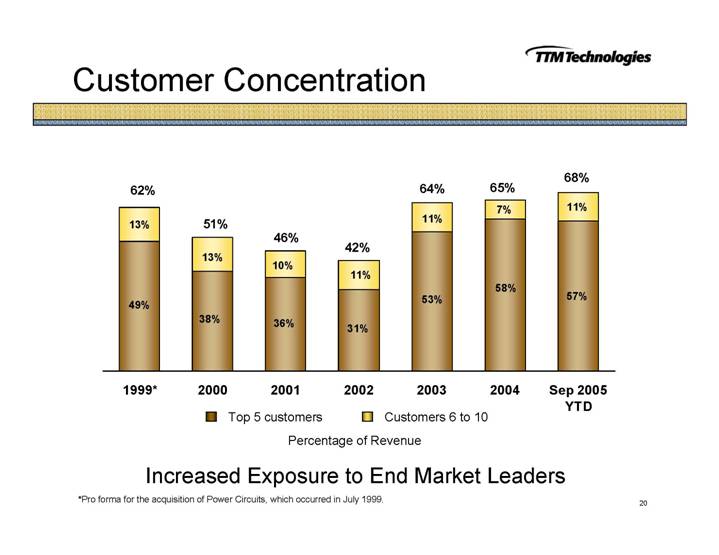
Customer Concentration
[CHART]
Increased Exposure to End Market Leaders
*Pro forma for the acquisition of Power Circuits, which occurred in July 1999.
20
Revenue Chain
| | End Markets | | | | Customers | | Channel | | |
Enterprise I/T | | High-End Computing
27% | | Networking/ Comms
46% | | 48% | | Top OEM
Customers • Cisco • Hewlett-Packard • IBM • ITT • Juniper | | EMS Providers - 65% • Celestica • Flextronics • Jabil • Plexus • Solectron • Others | | TTM Technologies |
Telecom
Service
Provider | | | | | | |
| | | | | | 25% | | | |
Other End Markets | | | | | | |
Indust./Med. - 15% |
|
Peripherals - 5% | 27% |
|
Handheld/Other - 7% |
|
| | | | | | | | Shipped OEM-direct 35% | |
Sep 2005 YTD - % of total production revenues
21
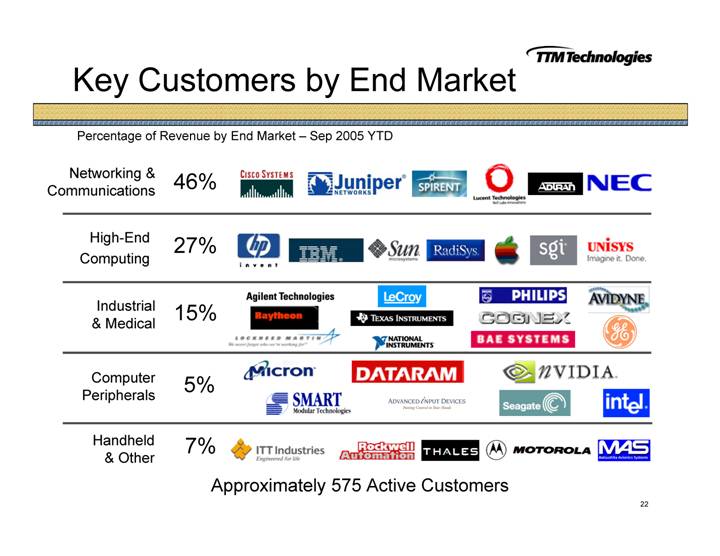
Key Customers by End Market
Percentage of Revenue by End Market – Sep 2005 YTD
Networking & Communications | | 46% | | [LOGO] |
High-End Computing | | 27% | | [LOGO] |
Industrial & Medical | | 15% | | [LOGO] |
Computer Peripherals | | 5% | | [LOGO] |
Handheld & Other | | 7% | | [LOGO] |
Approximately 575 Active Customers
22
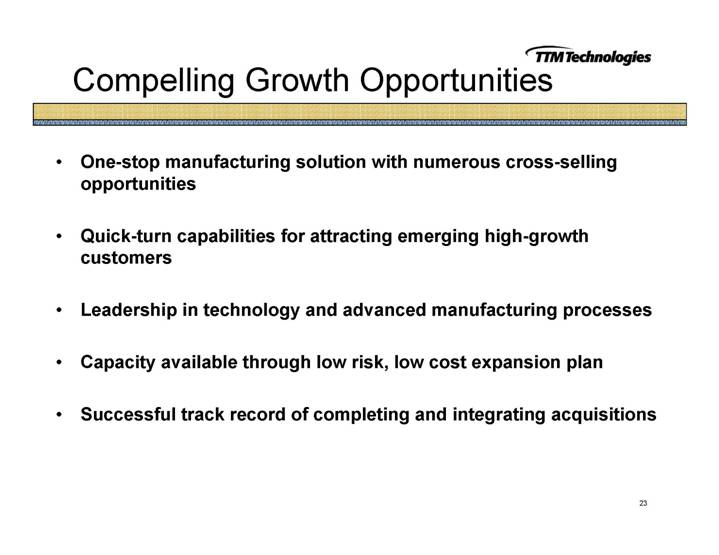
Compelling Growth Opportunities
• One-stop manufacturing solution with numerous cross-selling opportunities
• Quick-turn capabilities for attracting emerging high-growth customers
• Leadership in technology and advanced manufacturing processes
• Capacity available through low risk, low cost expansion plan
• Successful track record of completing and integrating acquisitions
23
[LOGO]
[GRAPHIC]
Steve Richards
Chief Financial Officer
24
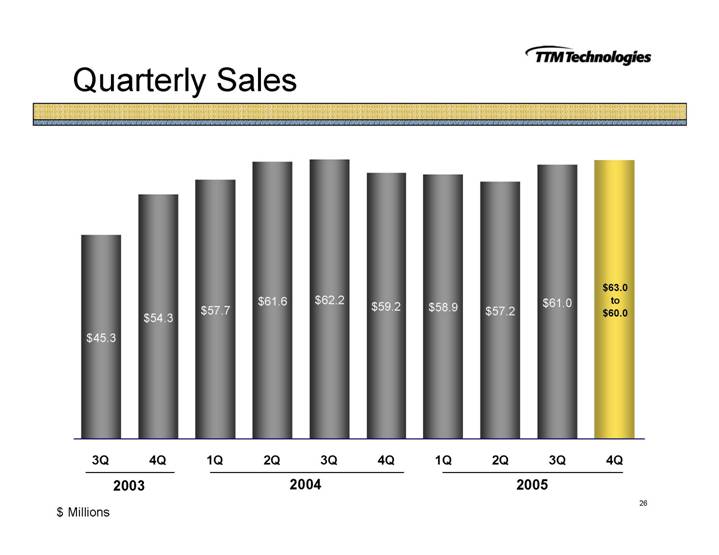
Quarterly Sales
[CHART]
26
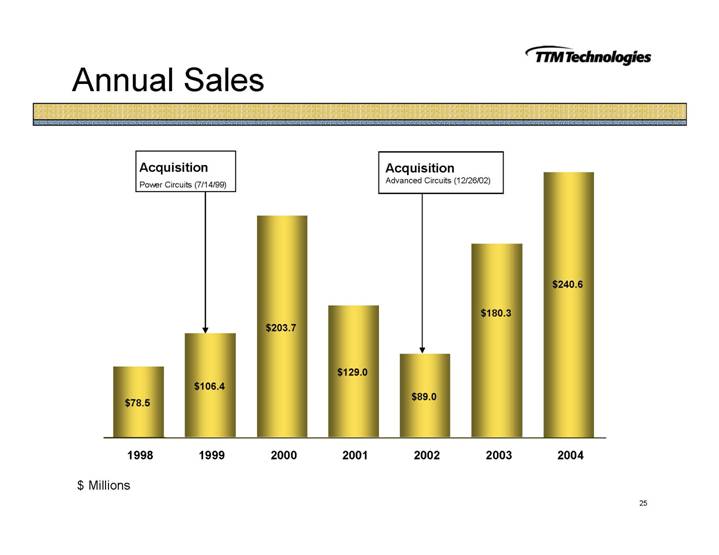
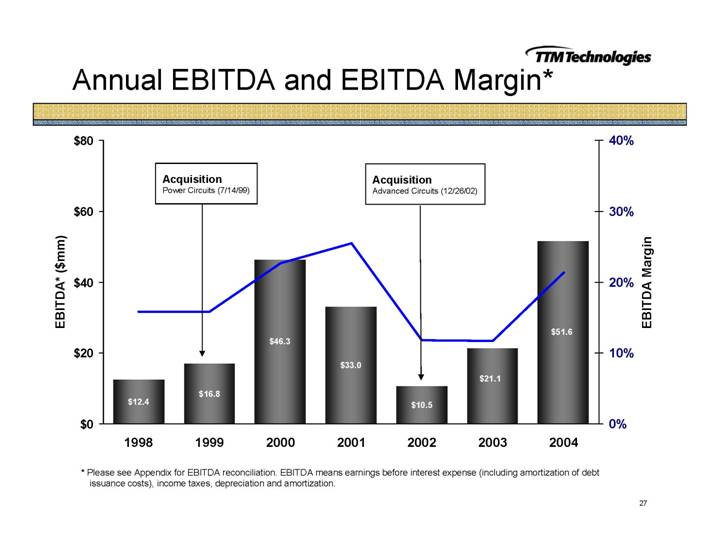
Annual EBITDA and EBITDA Margin*
[CHART]
* Please see Appendix for EBITDA reconciliation. EBITDA means earnings before interest expense (including amortization of debt issuance costs), income taxes, depreciation and amortization.
27
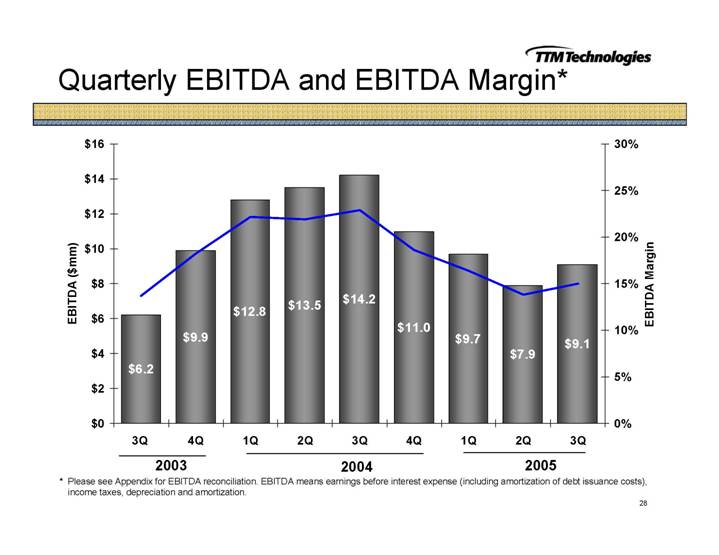
Quarterly EBITDA and EBITDA Margin*
[CHART]
* Please see Appendix for EBITDA reconciliation. EBITDA means earnings before interest expense (including amortization of debt issuance costs), income taxes, depreciation and amortization.
28
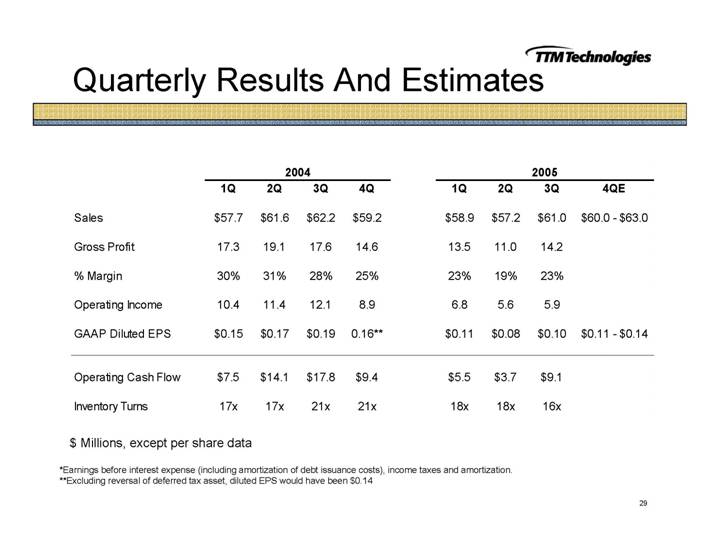
Quarterly Results And Estimates
| | 2004 | | 2005 | |
| | 1Q | | 2Q | | 3Q | | 4Q | | 1Q | | 2Q | | 3Q | | 4QE | |
| | | | | | | | | | | | | | | | | |
Sales | | $ | 57.7 | | $ | 61.6 | | $ | 62.2 | | $ | 59.2 | | $ | 58.9 | | $ | 57.2 | | $ | 61.0 | | $60.0 - $63.0 | |
| | | | | | | | | | | | | | | | | |
Gross Profit | | 17.3 | | 19.1 | | 17.6 | | 14.6 | | 13.5 | | 11.0 | | 14.2 | | | |
| | | | | | | | | | | | | | | | | |
% Margin | | 30 | % | 31 | % | 28 | % | 25 | % | 23 | % | 19 | % | 23 | % | | |
| | | | | | | | | | | | | | | | | |
Operating Income | | 10.4 | | 11.4 | | 12.1 | | 8.9 | | 6.8 | | 5.6 | | 5.9 | | | |
| | | | | | | | | | | | | | | | | |
GAAP Diluted EPS | | $ | 0.15 | | $ | 0.17 | | $ | 0.19 | | 0.16 | ** | $ | 0.11 | | $ | 0.08 | | $ | 0.10 | | $0.11 - $0.14 | |
| | | | | | | | | | | | | | | | | |
Operating Cash Flow | | $ | 7.5 | | $ | 14.1 | | $ | 17.8 | | $ | 9.4 | | $ | 5.5 | | $ | 3.7 | | $ | 9.1 | | | |
| | | | | | | | | | | | | | | | | |
Inventory Turns | | 17 | x | 17 | x | 21 | x | 21 | x | 18 | x | 18 | x | 16 | x | | |
| | | | | | | | | | | | | | | | | | | | | | | | | | | | |
$ Millions, except per share data
*Earnings before interest expense (including amortization of debt issuance costs), income taxes and amortization.
**Excluding reversal of deferred tax asset, diluted EPS would have been $0.14
29
Well Capitalized for Growth
$ Millions | | 12/31/2004 | | 10/3/2005 | |
| | | | | |
Cash and short-term investments | | $ | 58.5 | | $ | 71.1 | |
Accounts receivable, net | | $ | 35.8 | | $ | 39.3 | |
Inventories, net | | $ | 9.0 | | $ | 11.8 | |
Net property, plant and equipment | | $ | 52.2 | | $ | 53.1 | |
Other assets | | $ | 80.3 | | $ | 79.0 | |
| | | | | |
Total assets | | $ | 235.8 | | $ | 254.3 | |
| | | | | |
Accounts payable | | $ | 9.5 | | $ | 9.7 | |
Other current liabilities | | $ | 14.2 | | $ | 14.6 | |
Long-term liabilities | | $ | 0.5 | | $ | 5.2 | |
Stockholders’ equity | | $ | 211.6 | | $ | 224.8 | |
| | | | | |
Total liabilities and stockholders’ equity | | $ | 235.8 | | $ | 254.3 | |
30
Conclusion
• Solid industry fundamentals
• Focused strategy and strong market position
• Demonstrated execution excellence
• Industry leading financial performance
31
[LOGO]
[GRAPHIC]
Needham & Company
8th Annual Growth Conference
January 12, 2006
32
[LOGO]
[GRAPHIC]
Appendix
33
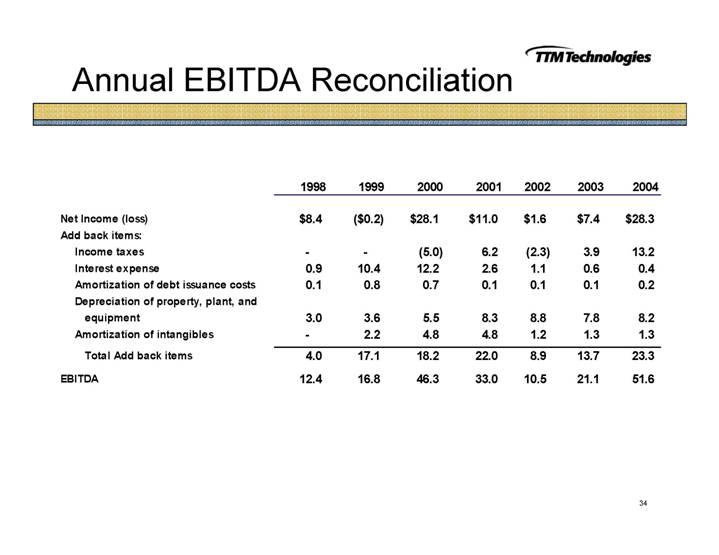
Annual EBITDA Reconciliation
| | 1998 | | 1999 | | 2000 | | 2001 | | 2002 | | 2003 | | 2004 | |
| | | | | | | | | | | | | | | |
Net Income (loss) | | $ | 8.4 | | $ | (0.2 | ) | $ | 28.1 | | $ | 11.0 | | $ | 1.6 | | $ | 7.4 | | $ | 28.3 | |
Add back items: | | | | | | | | | | | | | | | |
Income taxes | | — | | — | | (5.0 | ) | 6.2 | | (2.3 | ) | 3.9 | | 13.2 | |
Interest expense | | 0.9 | | 10.4 | | 12.2 | | 2.6 | | 1.1 | | 0.6 | | 0.4 | |
Amortization of debt issuance costs | | 0.1 | | 0.8 | | 0.7 | | 0.1 | | 0.1 | | 0.1 | | 0.2 | |
Depreciation of property, plant, and equipment | | 3.0 | | 3.6 | | 5.5 | | 8.3 | | 8.8 | | 7.8 | | 8.2 | |
Amortization of intangibles | | — | | 2.2 | | 4.8 | | 4.8 | | 1.2 | | 1.3 | | 1.3 | |
Total Add back items | | 4.0 | | 17.1 | | 18.2 | | 22.0 | | 8.9 | | 13.7 | | 23.3 | |
EBITDA | | 12.4 | | 16.8 | | 46.3 | | 33.0 | | 10.5 | | 21.1 | | 51.6 | |
| | | | | | | | | | | | | | | | | | | | | | |
34
Quarterly EBITDA Reconciliation
| | 2003 | | 2004 | | 2005 | |
| | 3 Q | | 4 Q | | 1 Q | | 2 Q | | 3 Q | | 4 Q | | 1 Q | | 2 Q | | 3 Q | |
| | | | | | | | | | | | | | | | | | | |
Net Income (loss) | | $ | 2.5 | | $ | 4.7 | | $ | 6.5 | | $ | 6.9 | | $ | 8.0 | | $ | 6.9 | | $ | 4.5 | | $ | 3.3 | | $ | 4.1 | |
Add back items: | | | | | | | | | | | | | | | | | | | |
Income taxes | | 1.4 | | 2.8 | | 3.9 | | 4.1 | | 3.6 | | 1.6 | | 2.7 | | 1.9 | | 2.4 | |
Interest expense | | 0.1 | | 0.1 | | 0.1 | | 0.1 | | 0.1 | | 0.1 | | 0.1 | | 0.1 | | — | |
Amortization of debt issuance costs | | 0.0 | | 0.0 | | 0.0 | | 0.0 | | 0.1 | | 0.0 | | 0.0 | | 0.0 | | 0.0 | |
Depreciation of property, plant, and equipment | | 1.9 | | 2.0 | | 2.0 | | 2.1 | | 2.1 | | 2.1 | | 2.1 | | 2.3 | | 2.3 | |
Amortization of intangibles | | 0.3 | | 0.3 | | 0.3 | | 0.3 | | 0.3 | | 0.3 | | 0.3 | | 0.3 | | 0.3 | |
Total Add back items | | 3.7 | | 5.2 | | 6.3 | | 6.6 | | 6.2 | | 4.1 | | 5.2 | | 4.6 | | 5.0 | |
EBITDA | | 6.2 | | 9.9 | | 12.8 | | 13.5 | | 14.2 | | 11.0 | | 9.7 | | 7.9 | | 9.1 | |
| | | | | | | | | | | | | | | | | | | | | | | | | | | | |
35