|
Exhibit 99.2 
|
TTM 2016 Investor Day
[Location]
[Date]
Global Presence Local Knowledge
Agenda
[Specific Agenda to be included for each conference.]
Disclaimer
Forward-Looking Statements
Certain statements in this communication may constitute “forward-looking statements” within the meaning of the Private Securities Litigation Reform Act of 1995, including statements related to TTM’s future business outlook. Actual results may differ materially from these forward-looking statements. Such statements relate to a variety of matters, including but not limited to: the operations of the businesses of TTM Technologies, Inc. (“TTM” or the “Company”). These statements are made on the basis of the current beliefs, expectations and assumptions of the management of TTM regarding future events and are subject to significant risks and uncertainty. Statements regarding our expected performance in the future are forward-looking statements.
It is uncertain whether any of the events anticipated by the forward-looking statements will transpire or occur, or if any of them do, what impact they will have on the results of operations and financial condition of the Company. These forward-looking statements involve certain risks and uncertainties that could cause actual results to differ materially from those indicated in such forward-looking statements and are set forth in the Company’s most recent Annual Report on Form 10-K and Quarterly Report on Form 10-Q and in the
Company’s other filings filed with the Securities and Exchange Commission (the “SEC”) under the heading “Risk Factors” and which are available at the SEC’s website at www.sec.gov.
TTM does not undertake any obligation to update any of theses statements to reflect any new information, subsequent events or circumstances, or otherwise, except as may be required by law.
Use of Non-GAAP Financial Measures
In addition to the financial statements presented in accordance with U.S. GAAP, TTM uses certain non-GAAP financial measures, including “adjusted EBITDA.” The companies present non-GAAP financial information to enable investors to see each company through the eyes of management and to provide better insight into its ongoing financial performance.
Adjusted EBITDA is defined as earnings before interest expense, income taxes, depreciation, amortization of intangibles, stock-based compensation expense, gain on sale of assets, asset impairments, restructuring, costs related to acquisitions, and other charges. For a reconciliation of adjusted EBITDA to net income, please see the appendix at the end of this presentation. Adjusted EBITDA is not a recognized financial measure under U.S. GAAP and does not purport to be an alternative to operating income or an indicator of operating performance. Adjusted EBITDA is presented to enhance an understanding of operating results and is not intended to represent cash flows or results of operations. The use of this non-GAAP measure provides an indication of each company’s ability to service debt, and management considers it an appropriate measure to use because of the Company’s leveraged positions.
Adjusted EBITDA has certain material limitations, primarily due to the exclusion of certain amounts that are material to each Company’s consolidated results of operations, such as interest expense, income tax expense, and depreciation and amortization. In addition, adjusted EBITDA may differ from the adjusted EBITDA calculations reported by other companies in the industry, limiting its usefulness as a comparative measure.
Data Used in This Presentation
Due to rounding, numbers presented throughout this and other documents may not add up precisely to the totals provided and percentages may not precisely reflect the absolute figures.
Third Party Information
This presentation has been prepared by the Company and includes information from other sources believed by the Company to be reliable. No representation or warranty, express or implied, is made as to the fairness, accuracy or completeness of any of the opinions and conclusions set forth herein based on such information. This presentation may contain descriptions or summaries of certain documents and agreements, but such descriptions or summaries are qualified in their entirety by reference to the actual documents or agreements. Unless otherwise indicated, the information contained herein speaks only as of the date hereof and is subject to change, completion or amendment without notice.
Diversified, Differentiated and Disciplined
Tom Edman
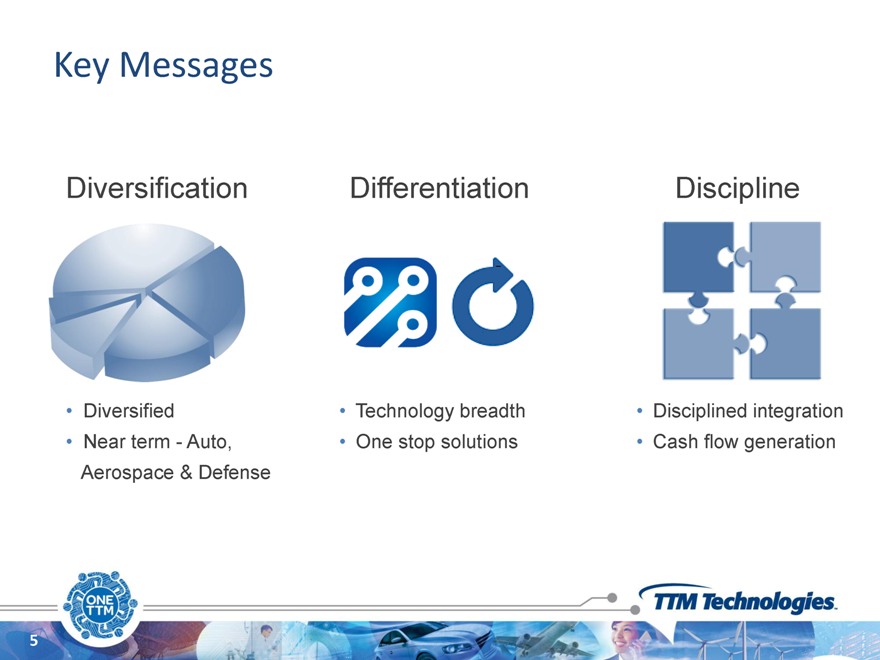
Key Messages
Diversification Differentiation Discipline
Diversified Near term—Auto, Aerospace & Defense
Technology breadth One stop solutions
Disciplined integration Cash flow generation
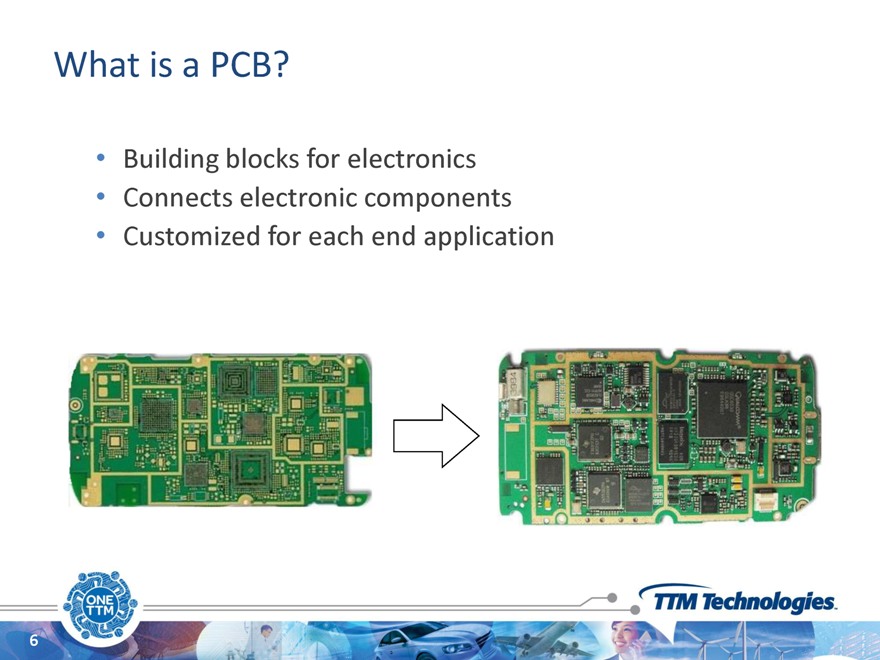
What is a PCB?
Building blocks for electronics Connects electronic components
Customized for each end application
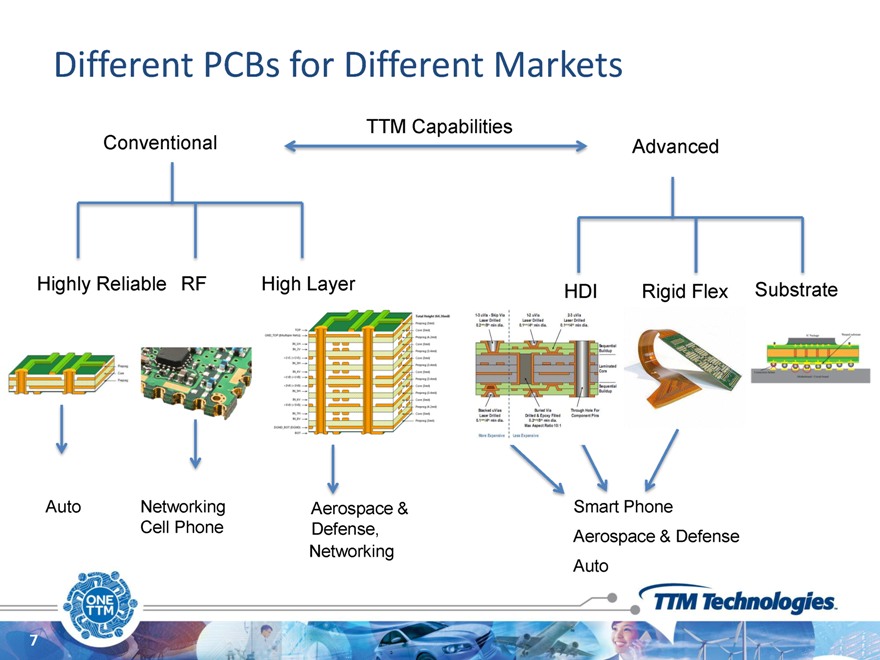
Different PCBs for Different Markets
TTM Capabilities
Conventional Advanced
Highly Reliable RF High Layer HDI Rigid Flex Substrate
Auto Networking pace & Cell Phone Defense,
Networking Aerospace & Defense Auto
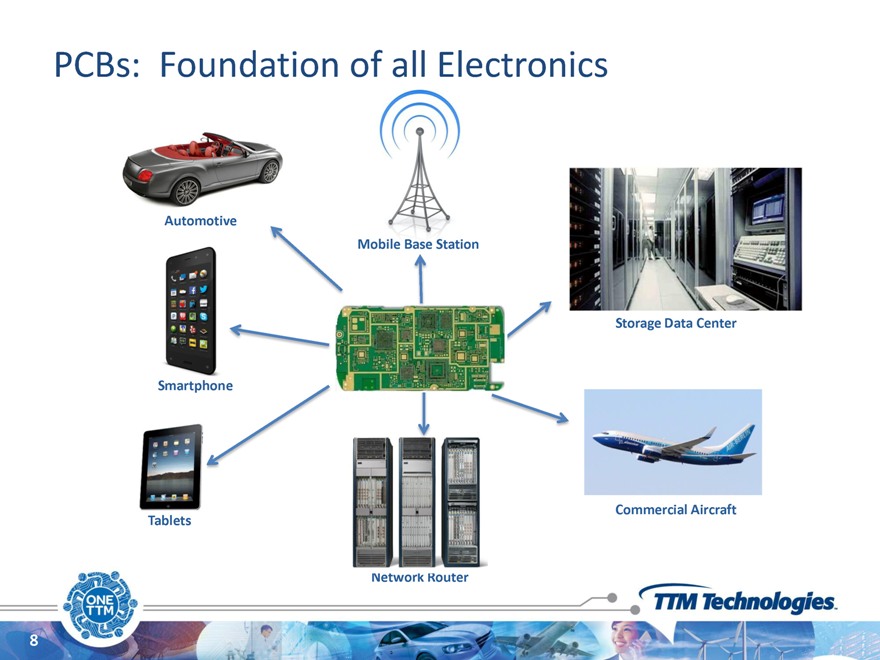
PCBs: Foundation of all Electronics
Automotive
Mobile Station
Storage Data Center
Smar
Commercial Aircraft
Network Router
Message #1 – Diversification and
Growth
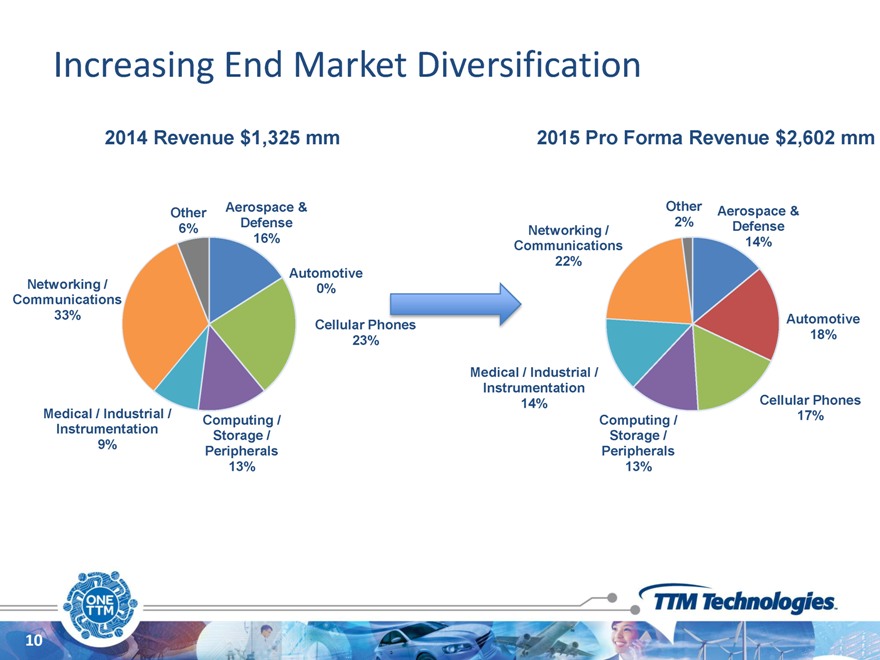
Increasing End Market Diversification
2014 Revenue $1,325 mm 2015 Pro Forma Revenue $2,602 mm
Aerospace & Other Aerospace & Other Defense 2% Defense
6% Networking /
16% 14% Communications Automotive 22% Networking / 0% Communications
33% Automotive Cellular Pho 18% 23%
Medical / Industrial /
Instrumentation Cellular Phones 14% Medical / Industrial / 17% Computing / Computing / Instrumentation Storage / Storage / 9% Peripherals Peripherals 13% 13%
10
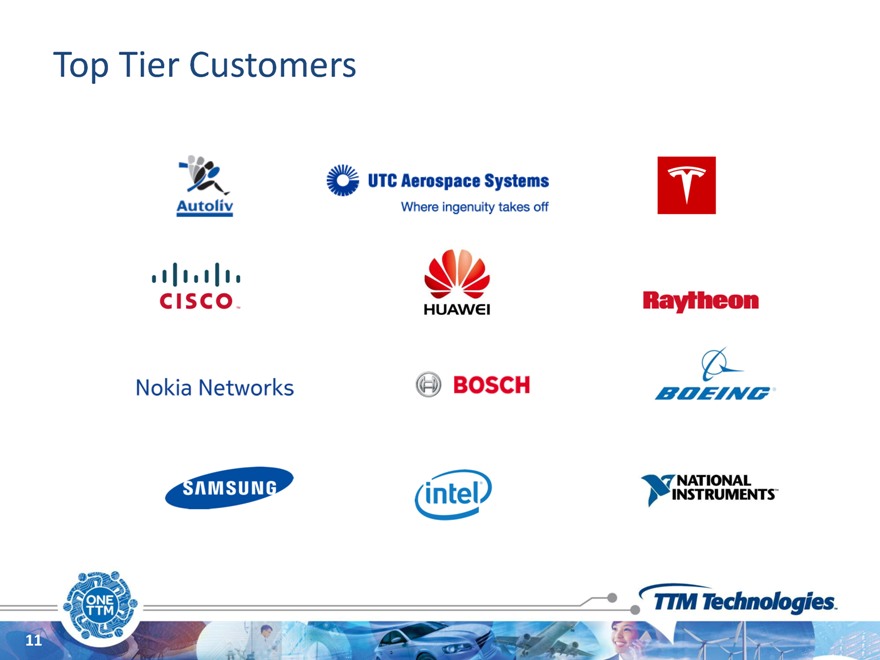
Top Tier Customers
11
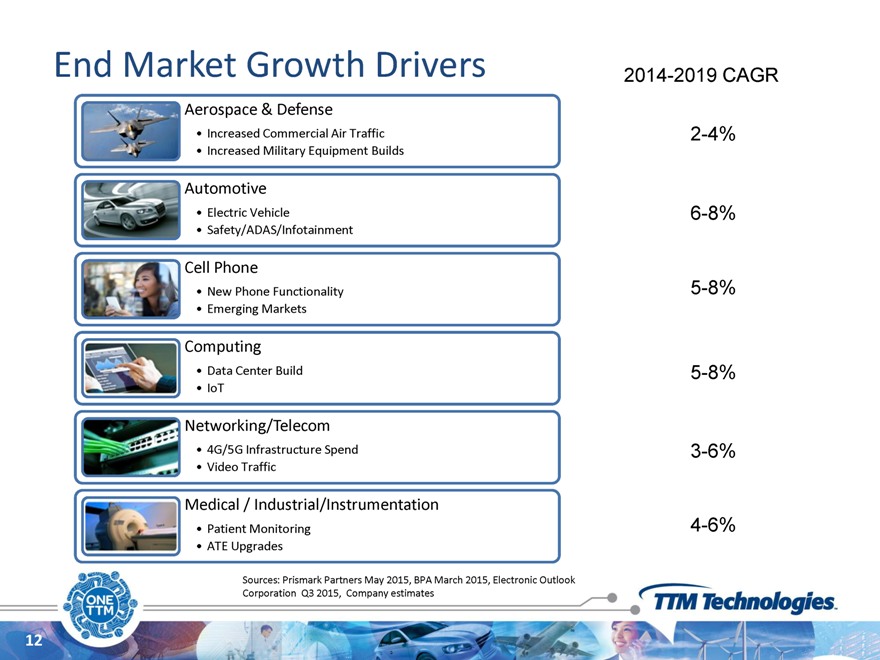
End Market Growth Drivers 2014-2019 CAGR
Aerospace & Defense
Increased Commercial Air Traffic 2-4%
Increased Military Equipment Builds
Automotive
Electric Vehicle 6-8%
Safety/ADAS/Infotainment
Cell Phone
New Phone Functionality 5-8%
Emerging Markets
Computing
Data Center Build 5-8%
IoT
Networking/Telecom
4G/5G Infrastructure Spend 3-6%
Video Traffic
Medical / Industrial/Instrumentation
Patient Monitoring 4-6%
ATE Upgrades
Sources: Prismark Partners May 2015, BPA March 2015, Electronic Outlook Corporation Q3 2015, Company estimates
12
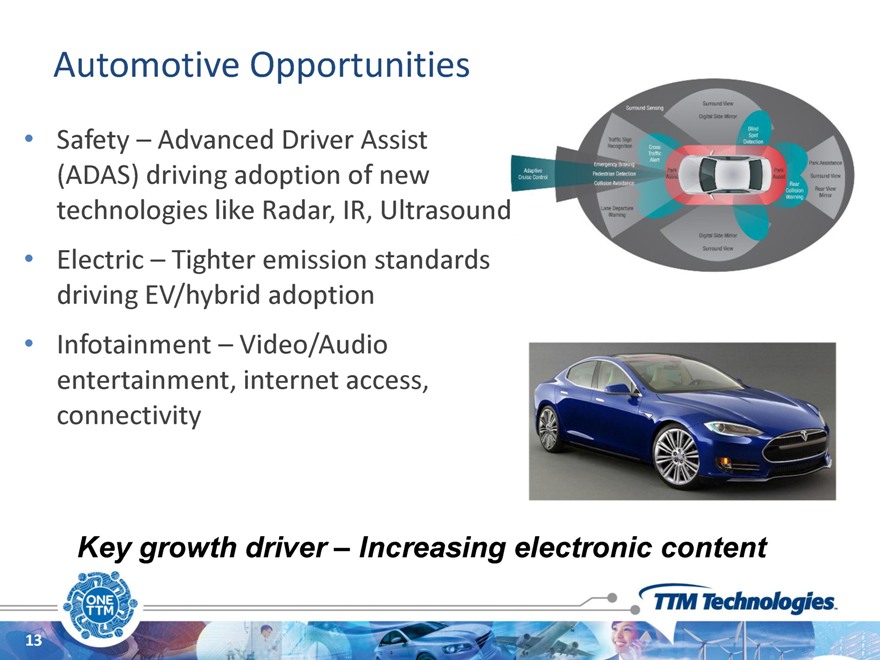
Automotive Opportunities
Safety – Advanced Driver Assist (ADAS) driving adoption of new technologies like Radar, IR, Ultrasound
Electric – Tighter emission standards driving EV/hybrid adoption
Infotainment – Video/Audio entertainment, internet access, connectivity
Key growth driver – Increasing electronic content
13
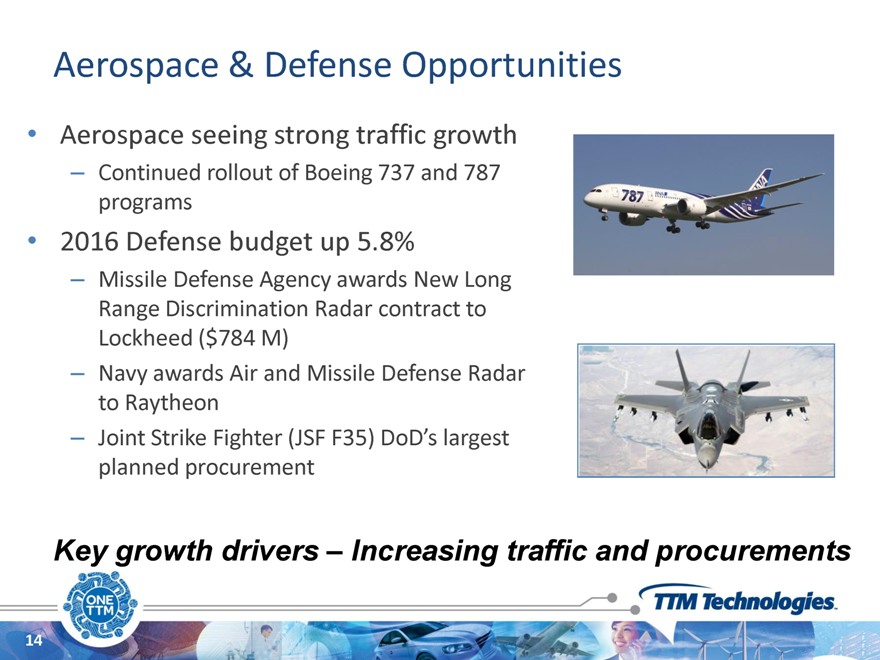
Aerospace & Defense Opportunities
Aerospace seeing strong traffic growth
Continued rollout of Boeing 737 and 787 programs
2016 Defense budget up 5.8%
Missile Defense Agency awards New Long Range Discrimination Radar contract to Lockheed ($784 M)
Navy awards Air and Missile Defense Radar to Raytheon
Joint Strike Fighter (JSF F35) DoD’s largest planned procurement
Key growth drivers – Increasing traffic and procurements
14
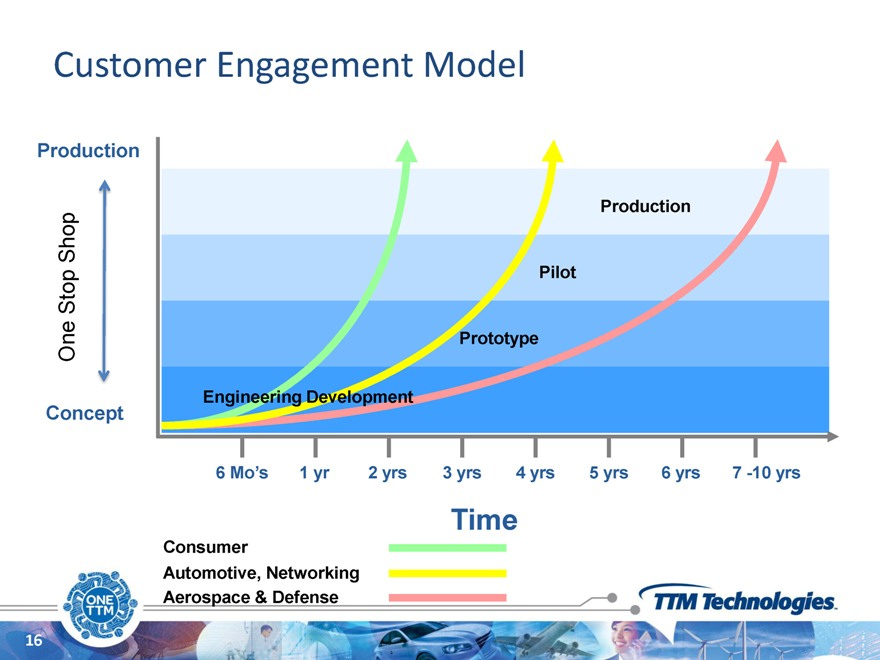
Message #2 – Differentiated through “One Stop Shop”
Customer Engagement Model
Production
Shop Production
Stop Pilot
One Prototype Concept Engineering Development
6 | | Mo’s 1 yr 2 yrs 3 yrs 4 yrs 5 yrs 6 yrs 7 -10 yrs |
Time
Consumer
Automotive, Networking Aerospace & Defense
16
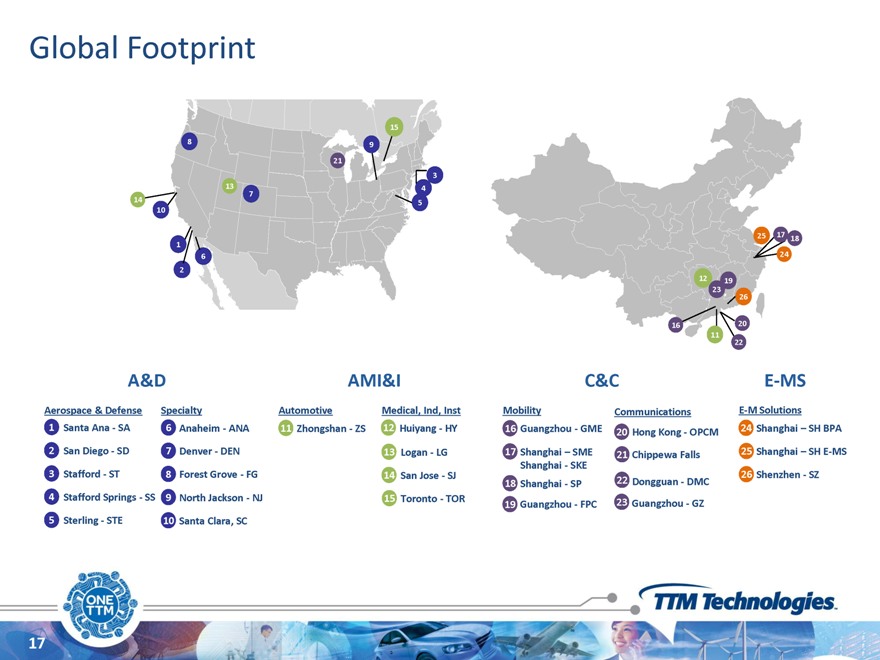
Global Footprint
15
8 9 21
3
13 4
14 7
5 10
25 17
1 18
6 24 2
12 19 23 26
16 20 11 22
A&D AMI&I C&C E-MS
Aerospace & Defense Specialty Automotive Medical, Ind, Inst Mobility Communications E-M Solutions
1 Santa Ana—SA 6 Anaheim—ANA 11 Zhongshan—ZS 12 Huiyang—HY 16 Guangzhou—GME 24 Shanghai – SH BPA
20 Hong Kong—OPCM
2 San Diego—SD 7 Denver—DEN 13 Logan—LG 17 Shanghai – SME 21 25 Shanghai – SH E-MS
Chippewa Falls
3 Shanghai—SKE
Stafford—ST 8 Forest Grove—FG 14 San Jose—SJ 26 Shenzhen—SZ
18 Shanghai—SP 22 Dongguan—DMC
4 Stafford Springs—SS 9 North Jackson—NJ 15 Toronto—TOR
19 Guangzhou—FPC 23 Guangzhou—GZ
5 Sterling—STE 10 Santa Clara, SC
17
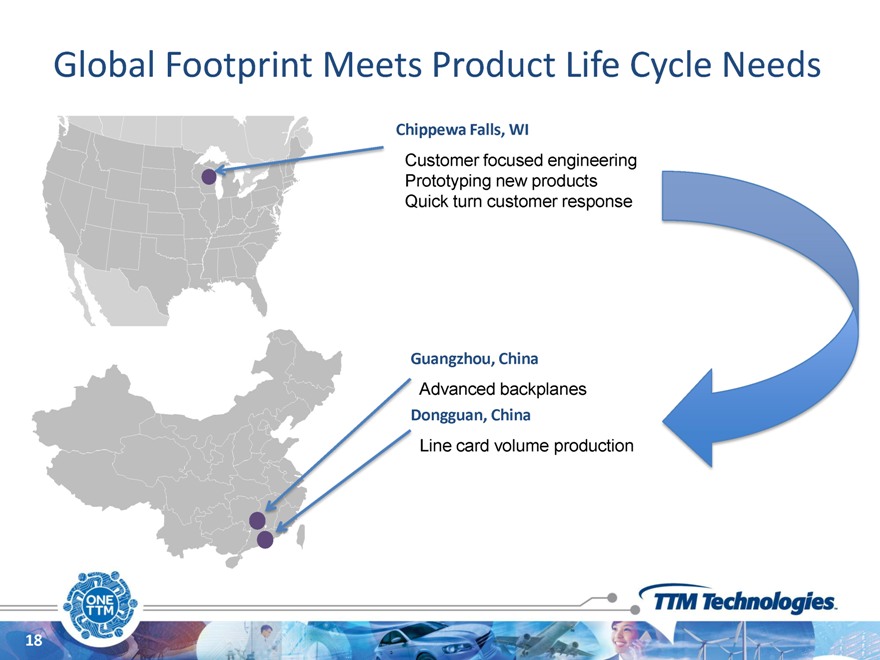
Global Footprint Meets Product Life Cycle Needs
Chippewa Falls, WI
Customer focused engineering Prototyping new products Quick turn customer response
Guangzhou, China
Advanced backplanes
Dongguan, China
Line card volume production
18
Aligned with Technology Trends
End Device Trends PCB Features TTM Capabilities
Increasing complexity Decreasing size Increasing signal speed Increasing performance
Higher layer count Microvias Thin cores Material/Laminate innovations
HDI Rigid Flex RF Radar
Increasingly Crowded PCBs Microvias
Laser Drills
19
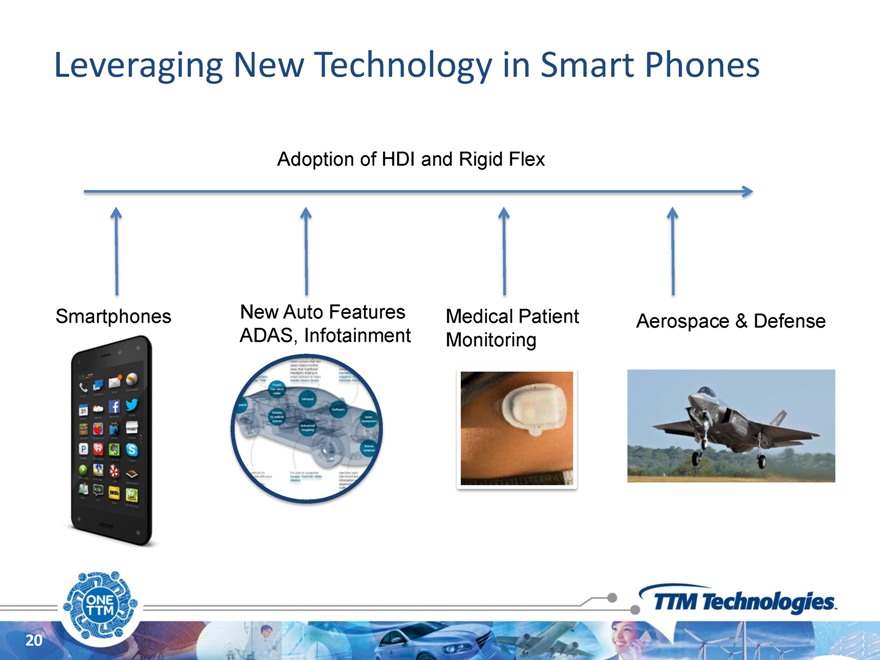
Leveraging New Technology in Smart Phones
Adoption of HDI and Rigid Flex
Smartphones New Auto Features Medical Patient
Aerospace & Defense ADAS, Infotainment Monitoring
20
Message #3 – Disciplined
Integration & Deleveraging
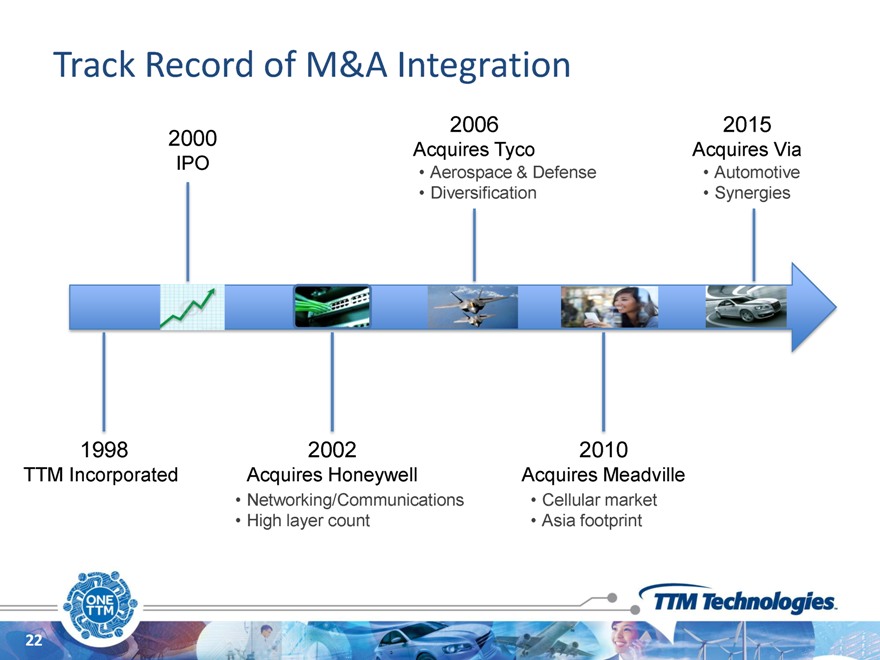
Track Record of M&A Integration
2006 2015 2000
Acquires Tyco Acquires Via IPO
Aerospace & Defense Automotive
Diversification Synergies
1998 2002 2010
TTM Incorporated Acquires Honeywell Acquires Meadville
Networking/Communications Cellular market
High layer count Asia footprint
22
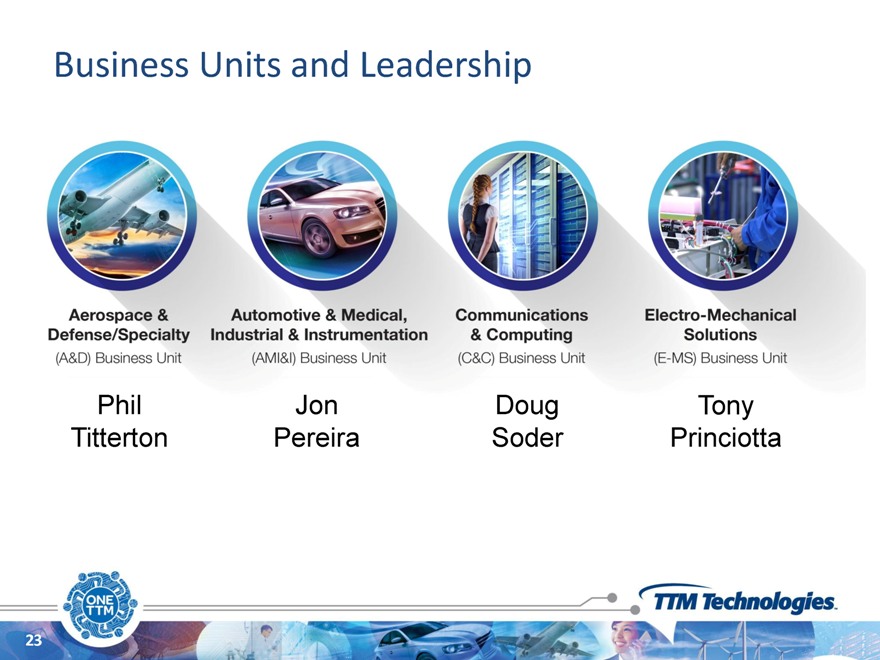
Business Units and Leadership
Phil Jon Doug Tony Titterton Pereira Soder Princiotta
23
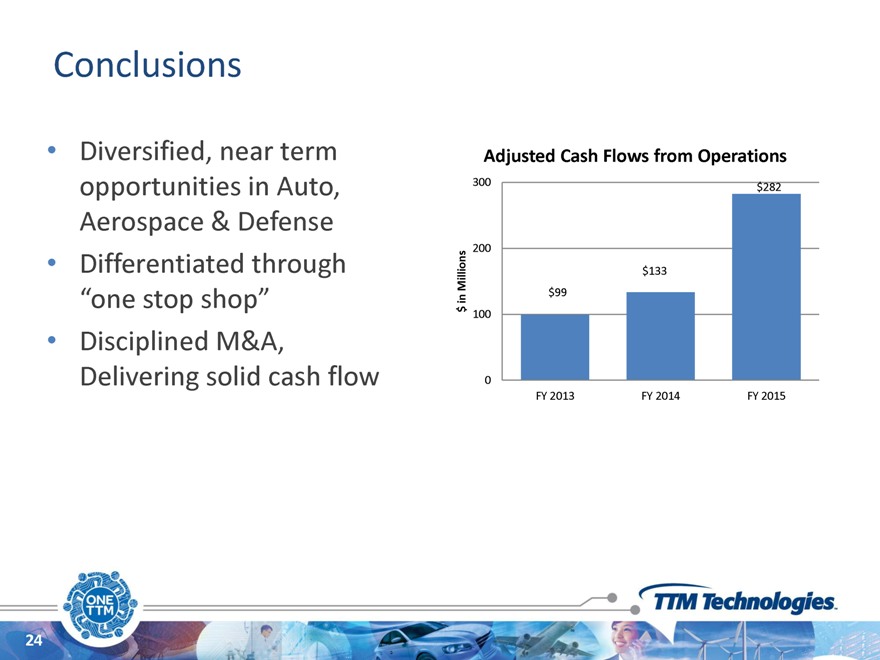
Conclusions
Diversified, near term opportunities in Auto,
Aerospace & Defense Differentiated through
“one stop shop”
Disciplined M&A,
Delivering solid cash flow
Adjusted Cash Flows from Operations
300 $282
200
Millions $133 in $99 $
100
0
FY 2013 FY 2014 FY 2015
24
Communications and Computing
Doug Soder
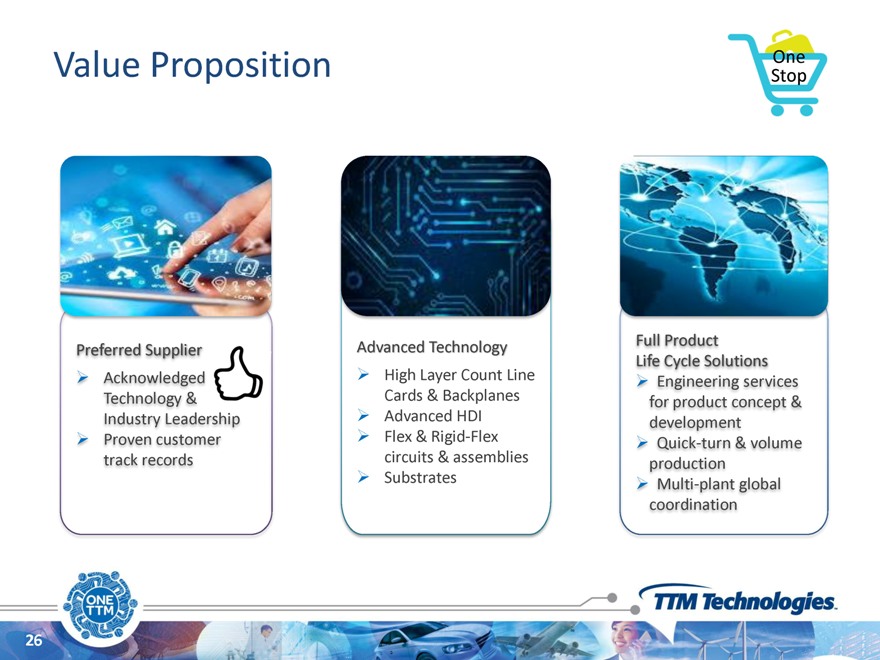
Value Proposition
Full Product Preferred Supplier Advanced Technology Life Cycle Solutions Acknowledged High Layer Count Line Engineering services Technology & Cards & Backplanes for product concept & Industry Leadership Advanced HDI development Proven customer Flex & Rigid-Flex Quick-turn & volume track records circuits & assemblies production Substrates Multi-plant global coordination
26
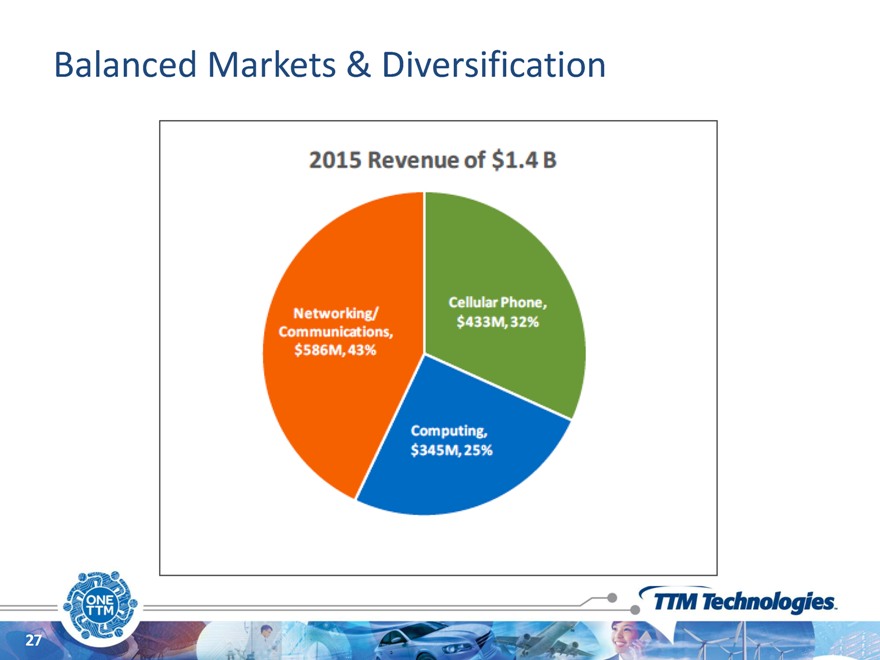
Balanced Markets & Diversification
27
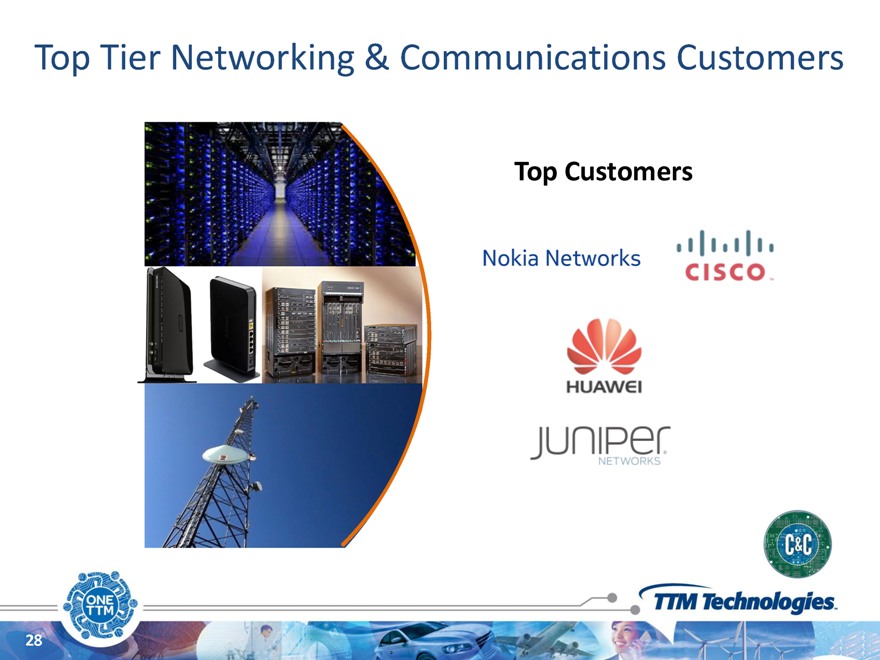
Top Tier Networking & Communications Customers
Top Customers
28
Top Tier Cellular Phone Customers
Top Customers
Chengrui
29
Top Tier Computing Customers
Top Customers
30
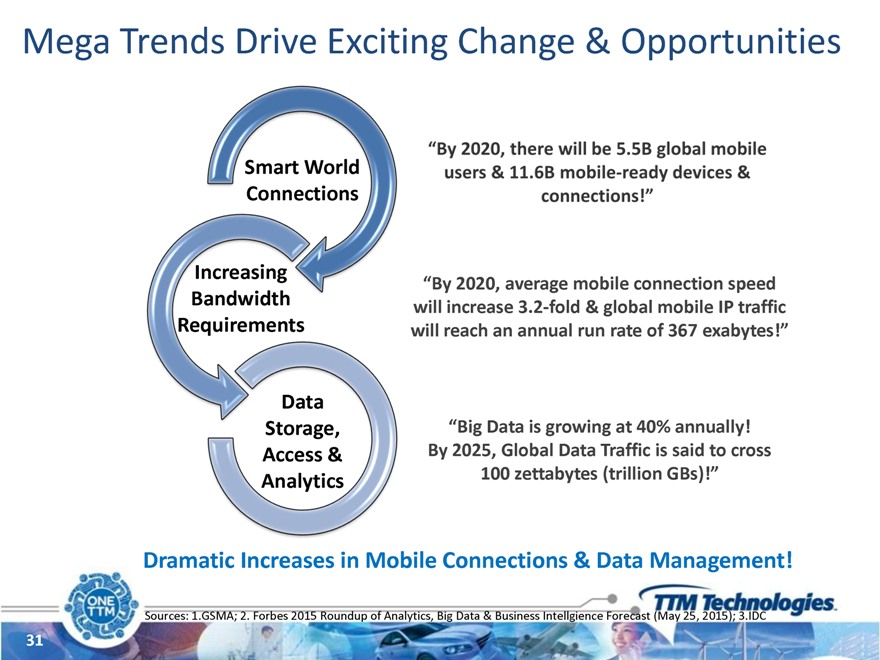
Mega Trends Drive Exciting Change & Opportunities
Smart World Connections
“By 2020, average mobile connection speed will increase 3.2-fold & global mobile IP traffic will reach an annual run rate of 367 exabytes!”
Data
Storage, “Big Data is growing at 40% annually! Access & By 2025, Global Data Traffic is said to cross Analytics 100 zettabytes (trillion GBs)!”
Dramatic Increases in Mobile Connections & Data Management!
Sources: 1.GSMA; 2. Forbes 2015 Roundup of Analytics, Big Data & Business Intellgience Forecast (May 25, 2015); 3.IDC
31
Networking & Communications
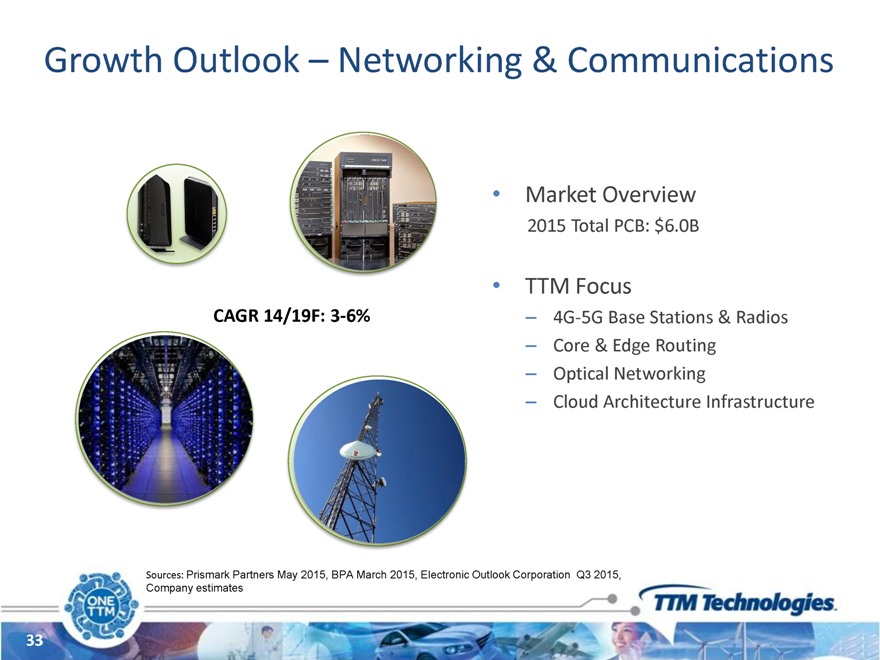
Growth Outlook – Networking & Communications
Market Overview
2015 Total PCB: $6.0B
TTM Focus
4G-5G Base Stations & Radios Core & Edge Routing Optical Networking Cloud Architecture Infrastructure
CAGR 14/19F: 3-6%
Sources: Prismark Partners May 2015, BPA March 2015, Electronic Outlook Corporation Q3 2015, Company estimates
33
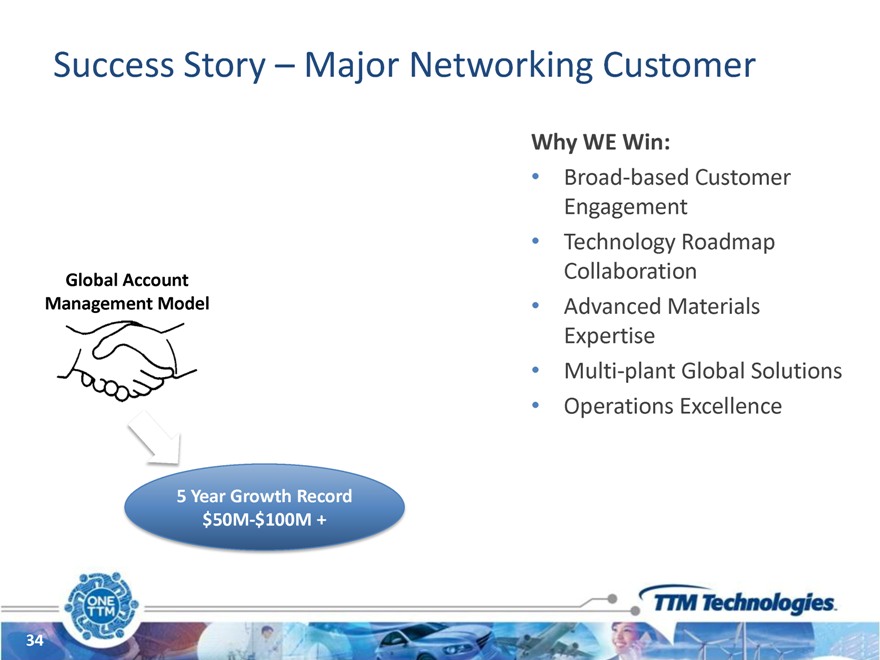
Success Story – Major Networking Customer
Why WE Win:
Broad-based Customer Engagement Technology Roadmap Collaboration Advanced Materials Expertise Multi-plant Global Solutions Operations Excellence
Product Portfolio Global Account Management Model Line Cards Backplanes Flex Rigid Flex HDI
5 | | Year Growth Record $50M-$100M + |
34
Cellular Phones
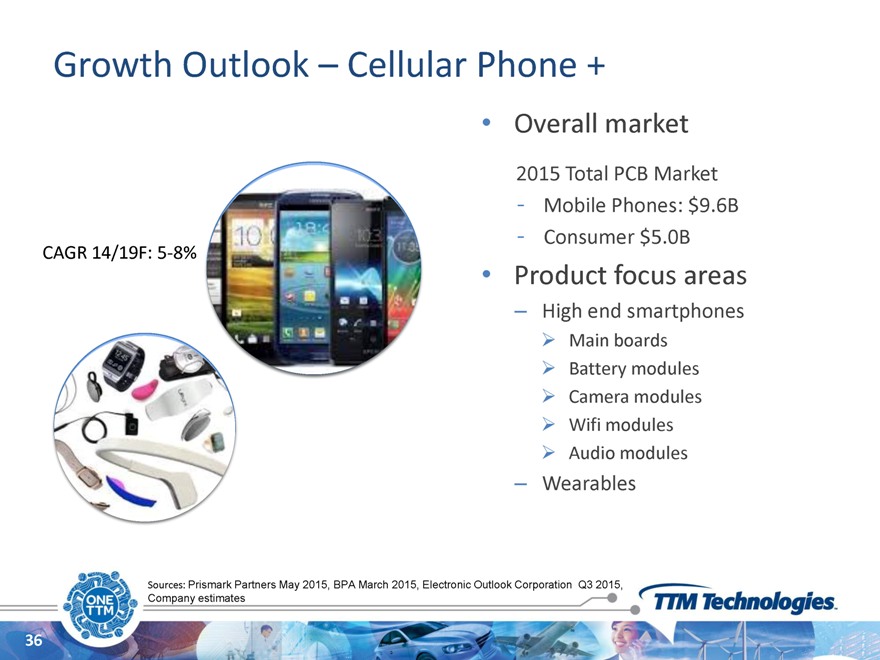
Growth Outlook – Cellular Phone +
Overall market
2015 Total PCB Market
Mobile Phones: $9.6B
Consumer $5.0B
Product focus areas
High end smartphones
Main boards Battery modules Camera modules Wifi modules Audio modules
Wearables
CAGR 14/19F: 5-8%
Sources: Prismark Partners May 2015, BPA March 2015, Electronic Outlook Corporation Q3 2015, Company estimates
36
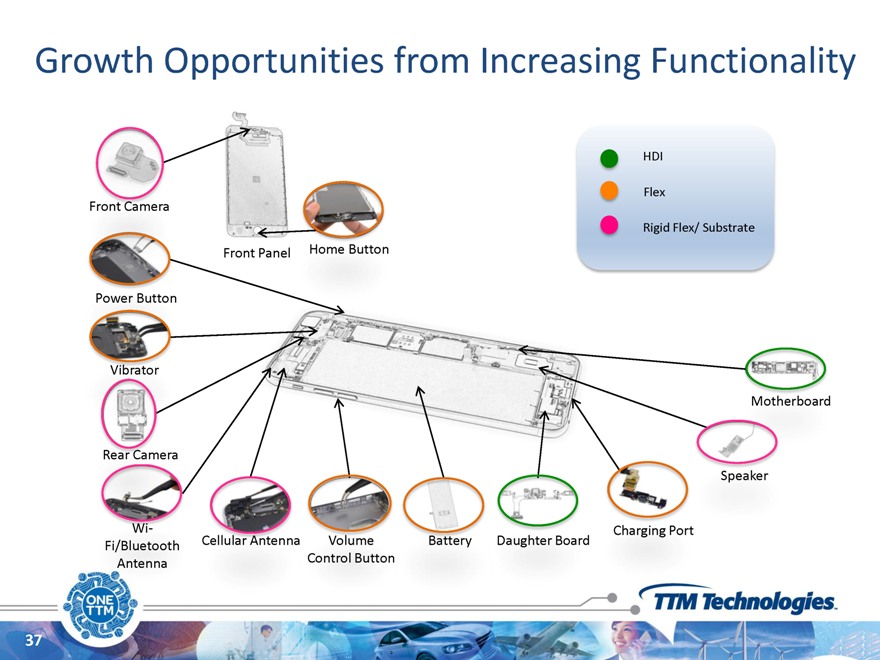
Growth Opportunities from Increasing Functionality
HDI
Flex
Rigid Flex/ Substrate
Front Panel Home Button
Power Button
Vibrator
Motherboard
Charging Battery Daughter Board
37
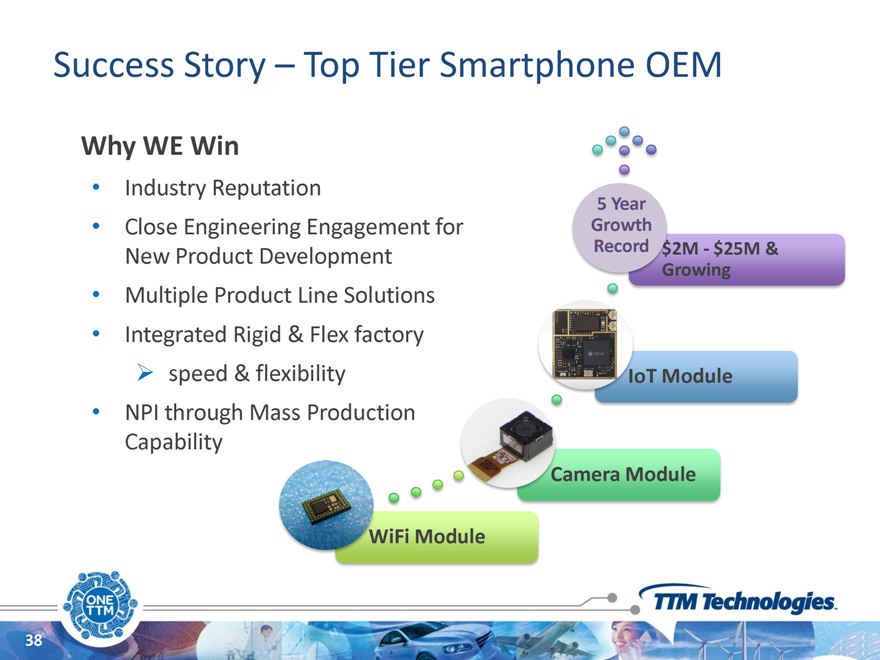
Success Story – Top Tier Smartphone OEM
Why WE Win
Industry Reputation
Close Engineering Engagement for New Product Development Multiple Product Line Solutions Integrated Rigid & Flex factory
speed & flexibility
NPI through Mass Production Capability
Record 2M—$25M & Growing
IoT Module
Camera Module
WiFi Module
38
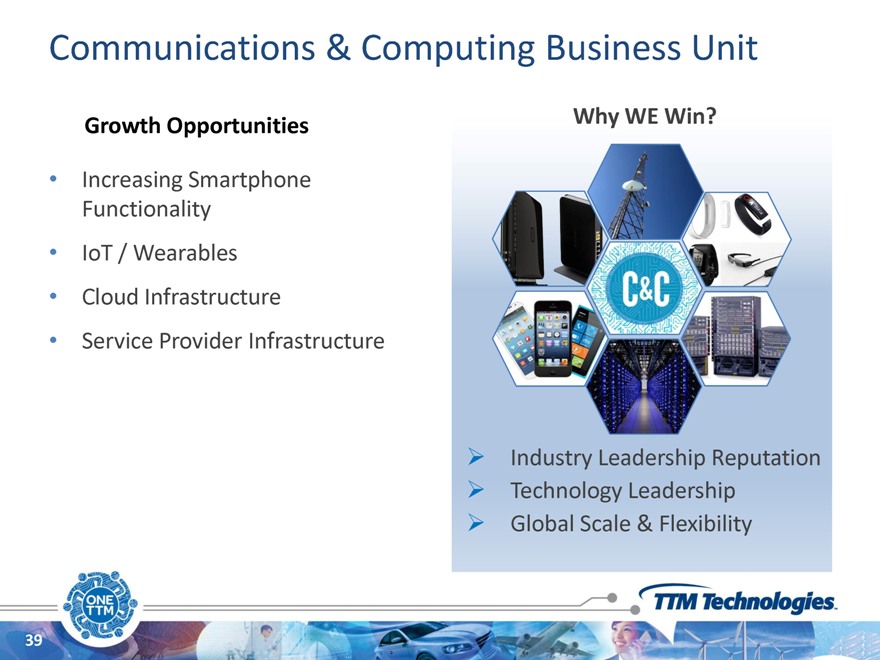
Communications & Computing Business Unit
Growth Opportunities
Increasing Smartphone Functionality
IoT / Wearables
Cloud Infrastructure
Service Provider Infrastructure
Why WE Win?
Industry Leadership Reputation Technology Leadership Global Scale & Flexibility
39
Electro-Mechanical Solutions
Tony Princiotta
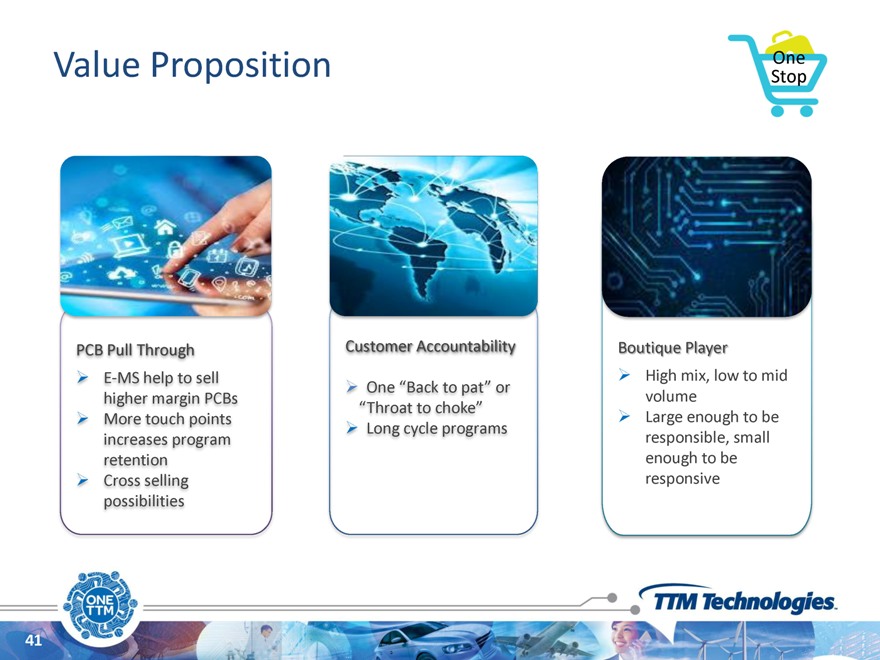
Value Proposition
PCB Pull Through Customer Accountability Boutique Player E-MS help to sell High mix, low to mid
One “Back to pat” or higher margin PCBs volume
“Throat to choke”
More touch points Large enough to be Long cycle programs increases program responsible, small retention enough to be Cross selling responsive possibilities
41
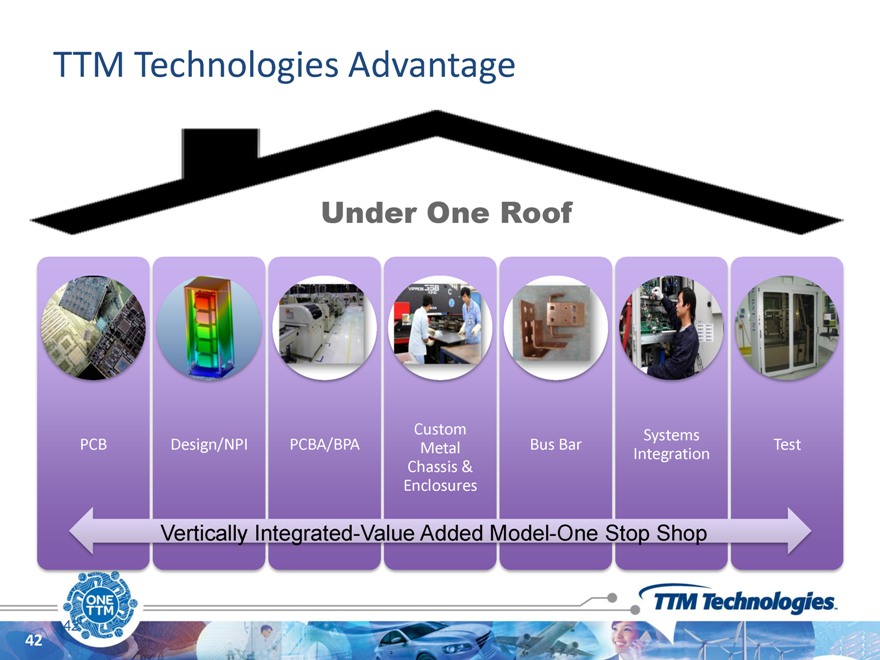
TTM Technologies Advantage
Under One Roof
Custom Systems
PCB Design/NPI PCBA/BPA Metal Bus Bar Test Chassis & Integration Enclosures
Vertically Integrated-Value Added Model-One Stop Shop
42
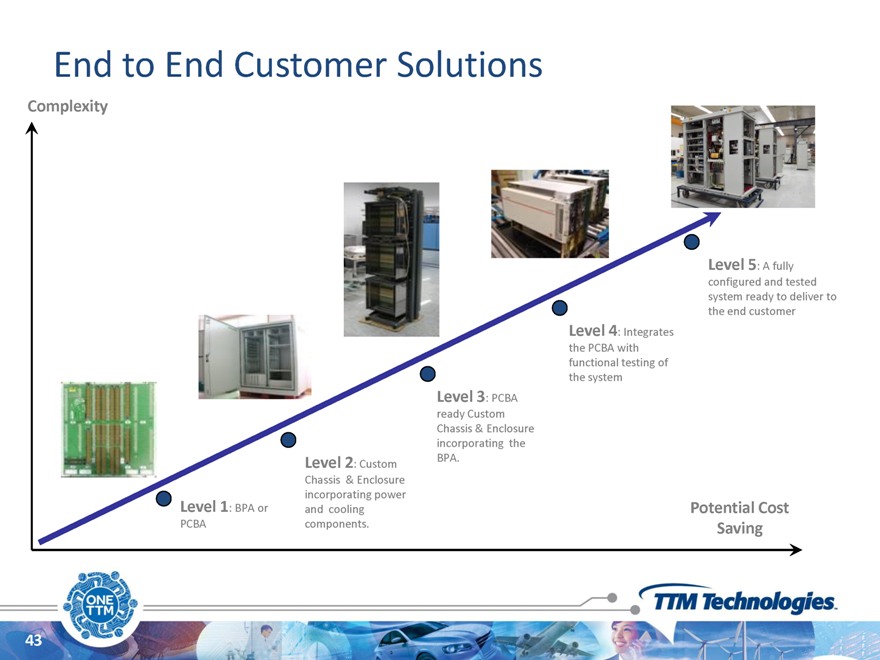
End to End Customer Solutions
Complexity
Level 5: A fully configured and tested system ready to deliver to the end customer Level 4: Integrates the PCBA with functional testing of the system Level 3: PCBA ready Custom Chassis & Enclosure incorporating the BPA.
Level 2: Custom
Chassis & Enclosure incorporating power
Level 1: BPA or and cooling Potential Cost PCBA components. Saving
43
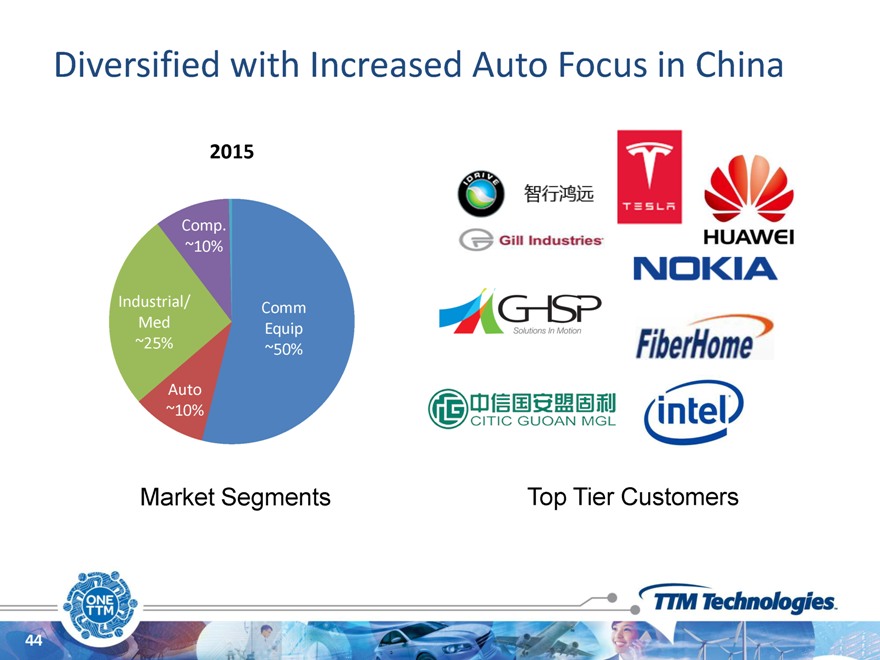
Diversified with Increased Auto Focus in China
2015
Comp. ~10%
Industrial/ Comm Med Equip ~25% ~50%
Auto ~10%
Market Segments Top Tier Customers
44
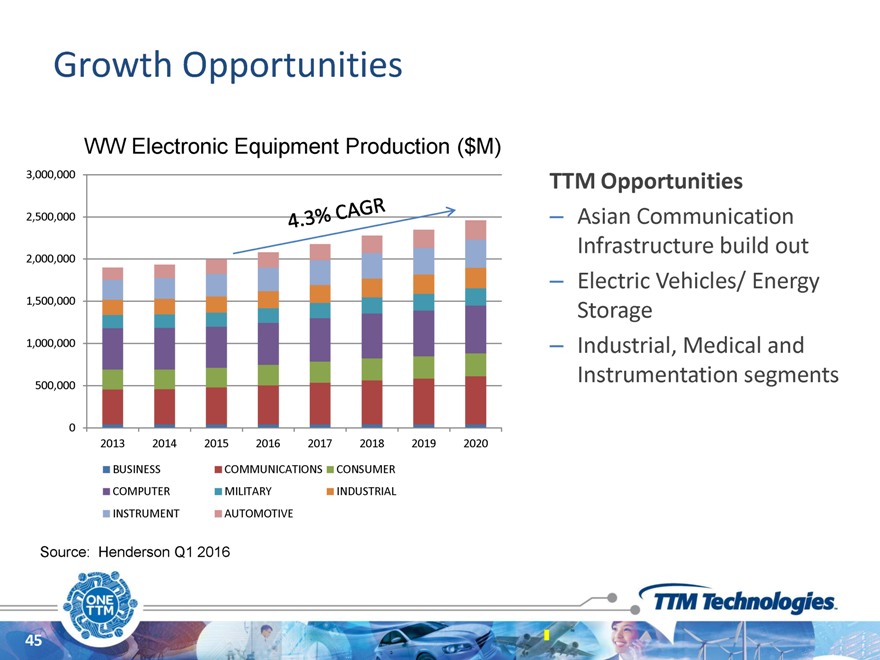
Growth Opportunities
WW Electronic Equipment Production ($M)
3,000,000 2,500,000 2,000,000 1,500,000 1,000,000 500,000
0
2013 2014 2015 2016 2017 2018 2019 2020
BUSINESS COMMUNICATIONS CONSUMER
COMPUTER MILITARY INDUSTRIAL
INSTRUMENT AUTOMOTIVE
Source: Henderson Q1 2016
TTM Opportunities
Asian Communication Infrastructure build out Electric Vehicles/ Energy Storage Industrial, Medical and Instrumentation segments
45
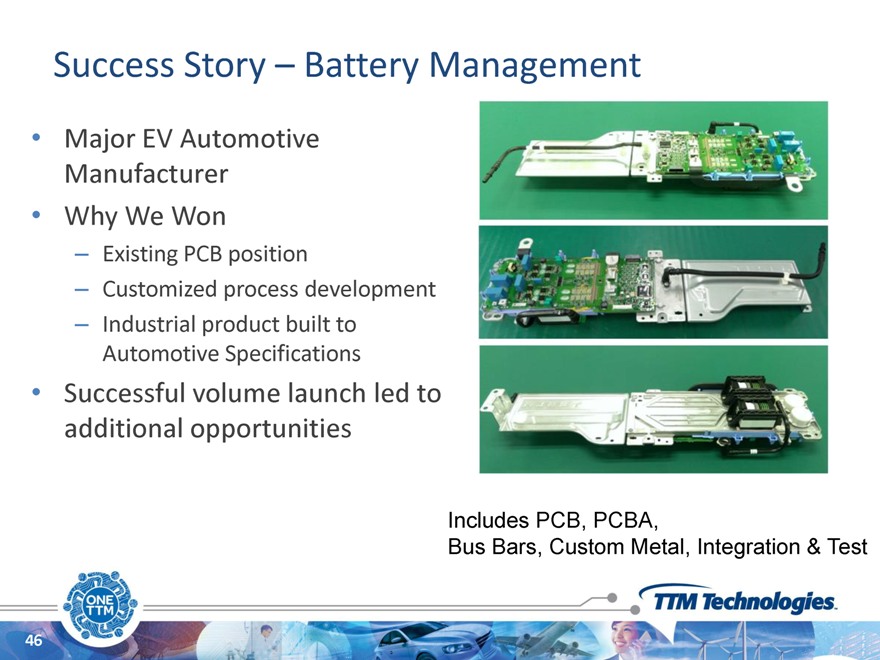
Success Story – Battery Management
Major EV Automotive
Manufacturer
Why We Won
Existing PCB position
Customized process development Industrial product built to Automotive Specifications
Successful volume launch led to additional opportunities
Includes PCB, PCBA,
Bus Bars, Custom Metal, Integration & Test
46
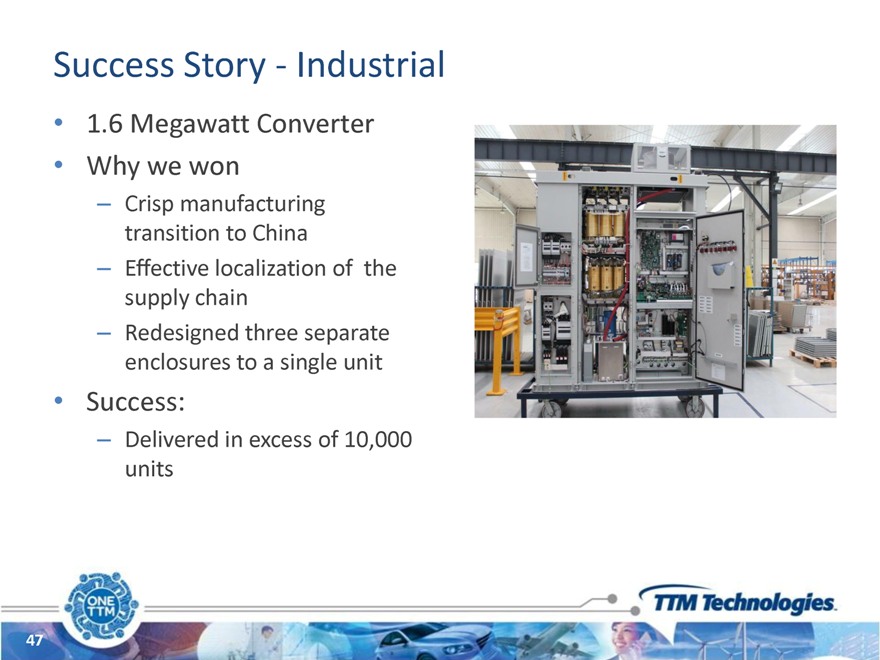
Success Story—Industrial
1.6 Megawatt Converter Why we won
Crisp manufacturing transition to China Effective localization of the supply chain Redesigned three separate enclosures to a single unit
Success:
Delivered in excess of 10,000 units
47
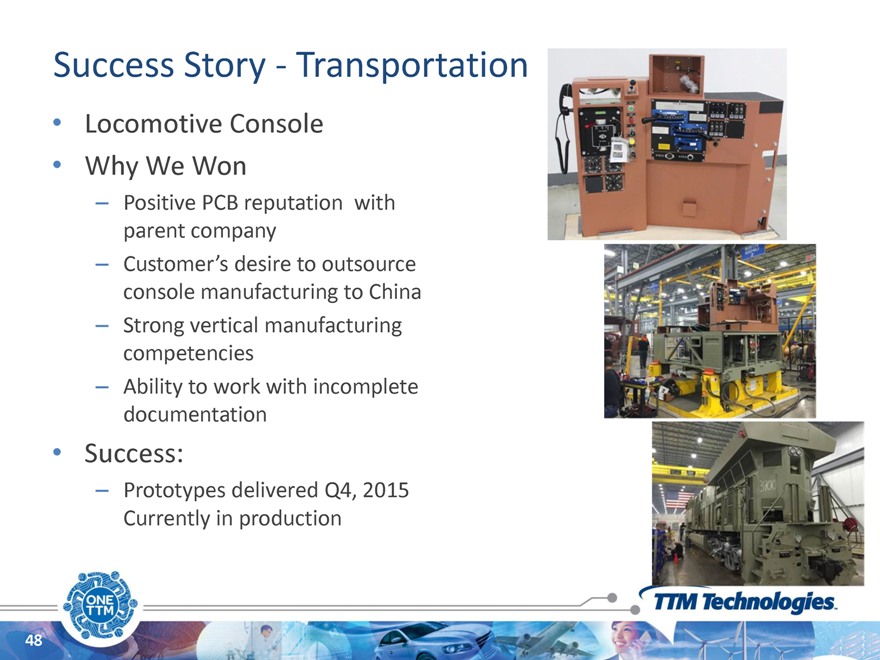
Success Story—Transportation
Locomotive Console Why We Won
Positive PCB reputation with parent company Customer’s desire to outsource console manufacturing to China Strong vertical manufacturing competencies Ability to work with incomplete documentation
Success:
Prototypes delivered Q4, 2015 Currently in production
48
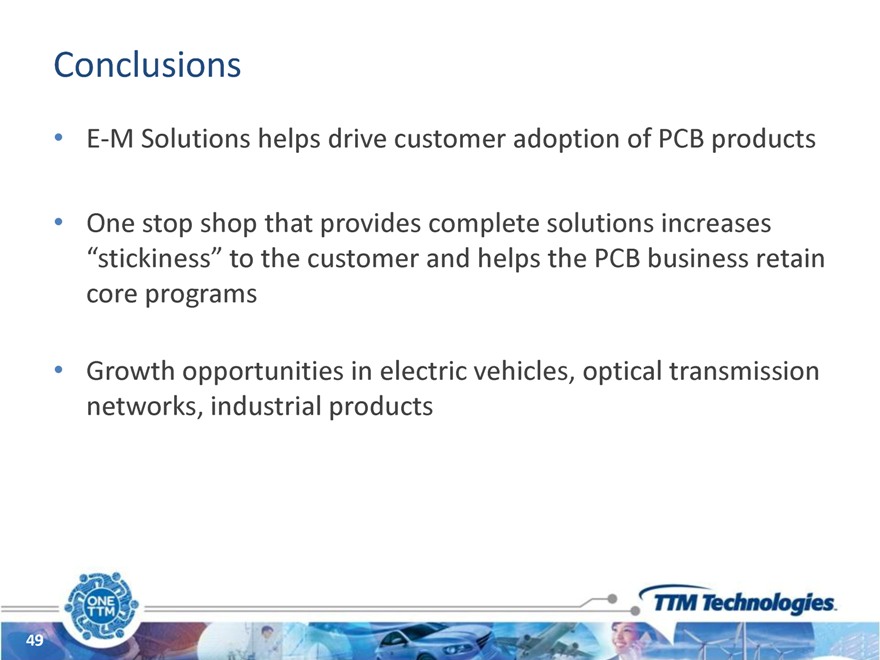
Conclusions
E-M Solutions helps drive customer adoption of PCB products
One stop shop that provides complete solutions increases
“stickiness” to the customer and helps the PCB business retain core programs
Growth opportunities in electric vehicles, optical transmission networks, industrial products
49
Aerospace & Defense / Specialty
Phil Titterton
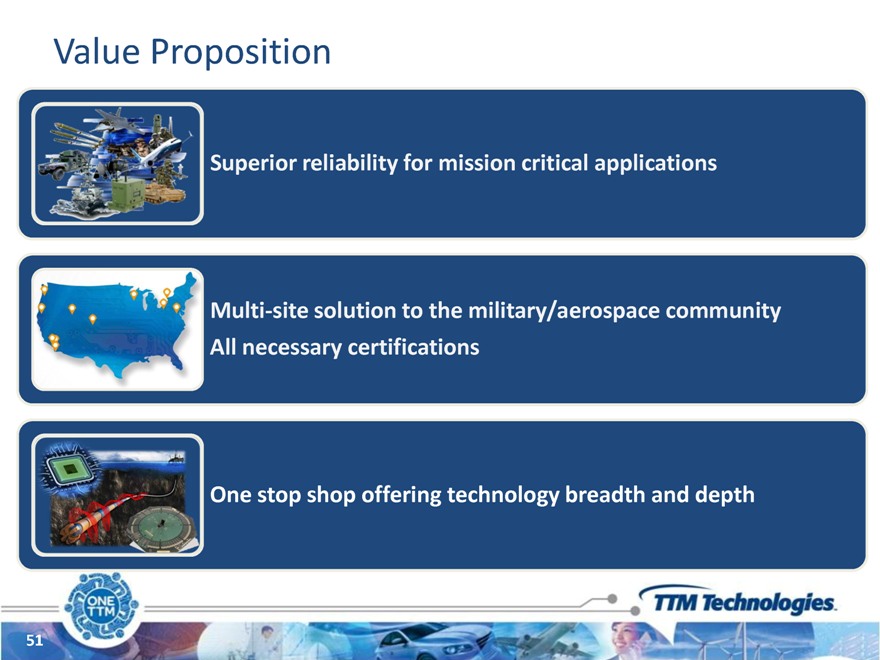
Value Proposition
Superior reliability for mission critical applications
Multi-site solution to the military/aerospace community All necessary certifications
One stop shop offering technology breadth and depth
51
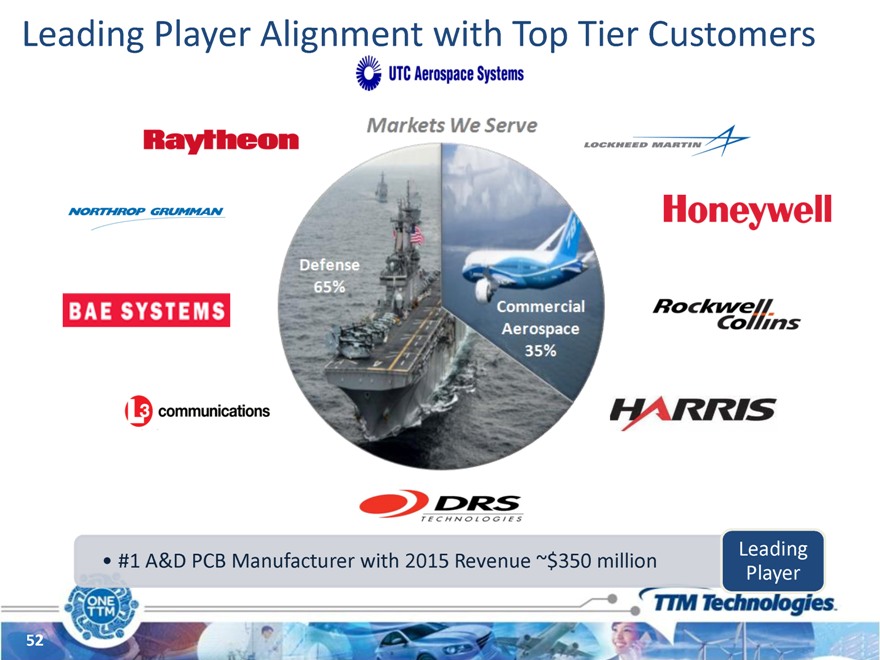
Leading Player Alignment with Top Tier Customers
Leading
#1 A&D PCB Manufacturer with 2015 Revenue ~$350 million
Player
52
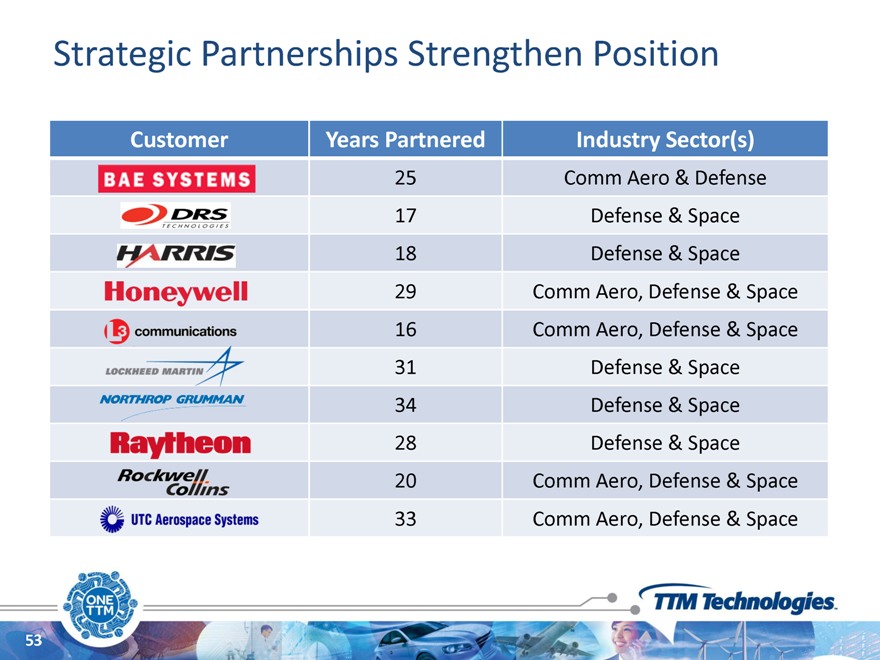
Strategic Partnerships Strengthen Position
Customer Years Partnered Industry Sector(s)
25 Comm Aero & Defense
17 Defense & Space
18 Defense & Space
29 Comm Aero, Defense & Space
16 Comm Aero, Defense & Space
31 Defense & Space
34 Defense & Space
28 Defense & Space
20 Comm Aero, Defense & Space
33 Comm Aero, Defense & Space
53
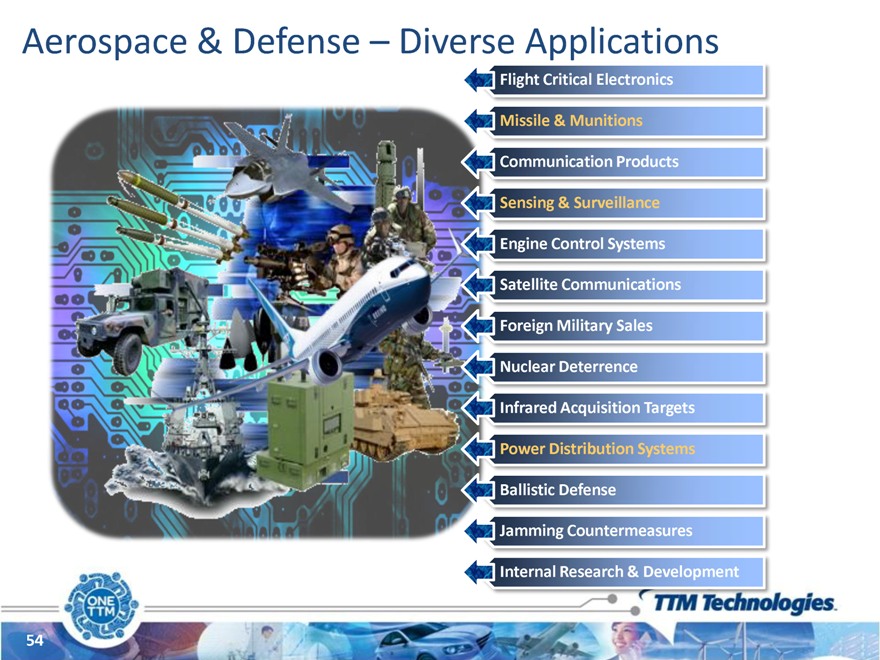
Aerospace & Defense – Diverse Applications
Flight Critical Electronics Missile & Munitions Communication Products Sensing & Surveillance Engine Control Systems Satellite Communications Foreign Military Sales Nuclear Deterrence Infrared Acquisition Targets Power Distribution Systems Ballistic Defense Jamming Countermeasures Internal Research & Development
54
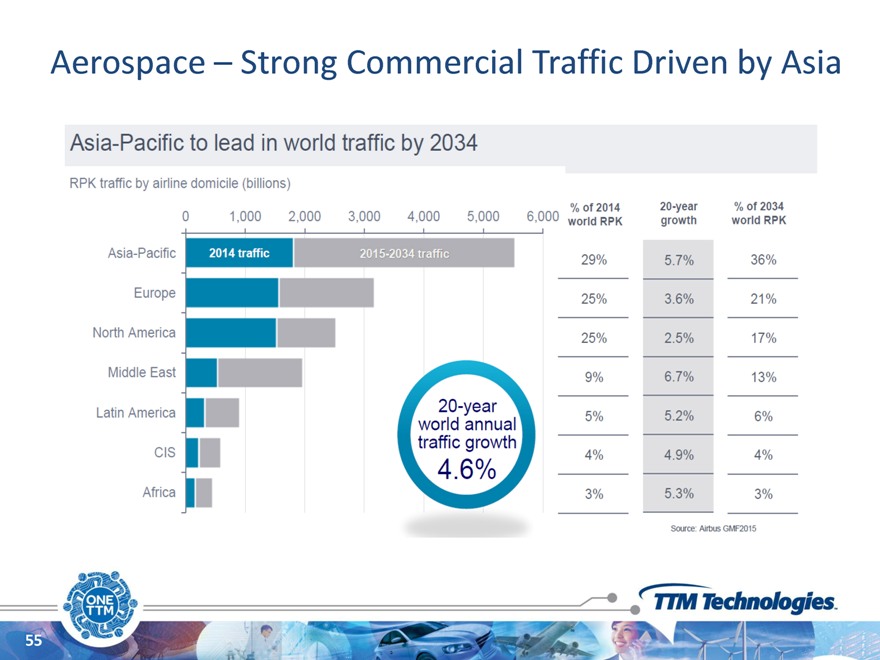
Aerospace – Strong Commercial Traffic Driven by Asia
55
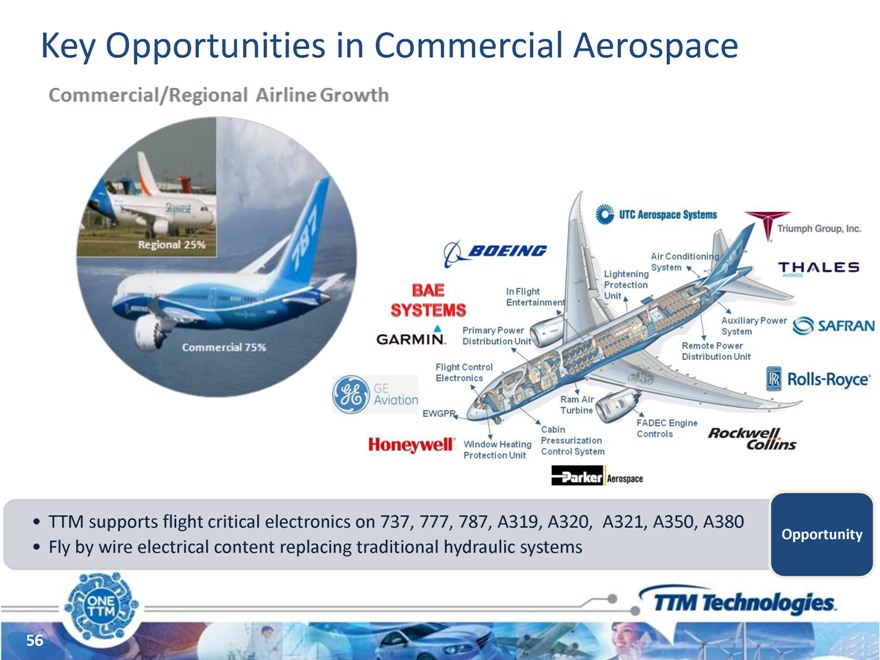
cial Aerospace
TTM supports flight critical electronics on 737, 777, 787, A319, A320, A321, A350, A380 Fly by wire electrical content replacing traditional hydraulic systems
Opportunity
56
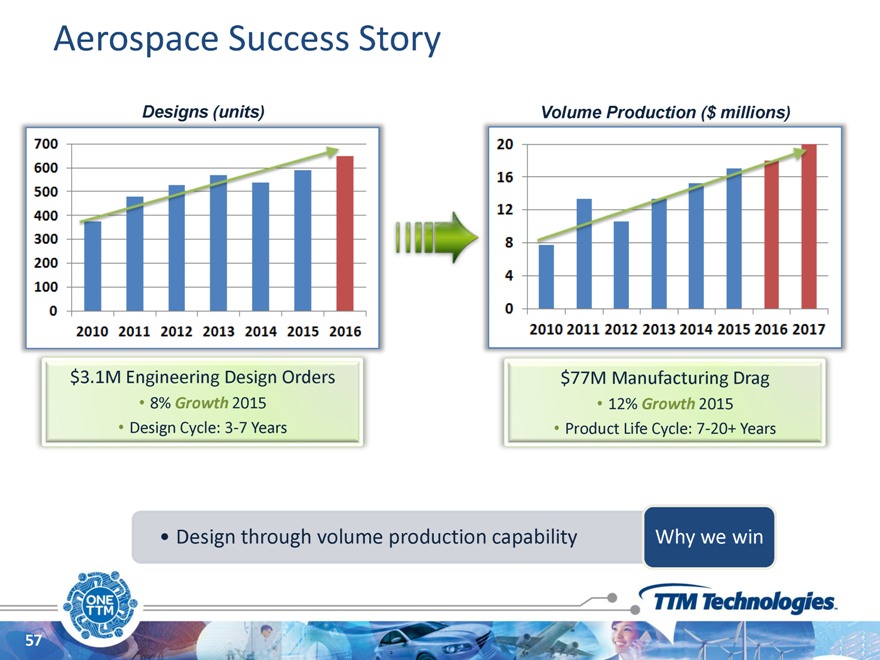
Aerospace Success Story
Designs (units) Volume Production ($ millions)
$3.1M Engineering Design Orders $77M Manufacturing Drag
8% Growth 2015 12% Growth 2015
Design Cycle: 3-7 Years Product Life Cycle: 7-20+ Years
Design through volume production capability
Why we win
57
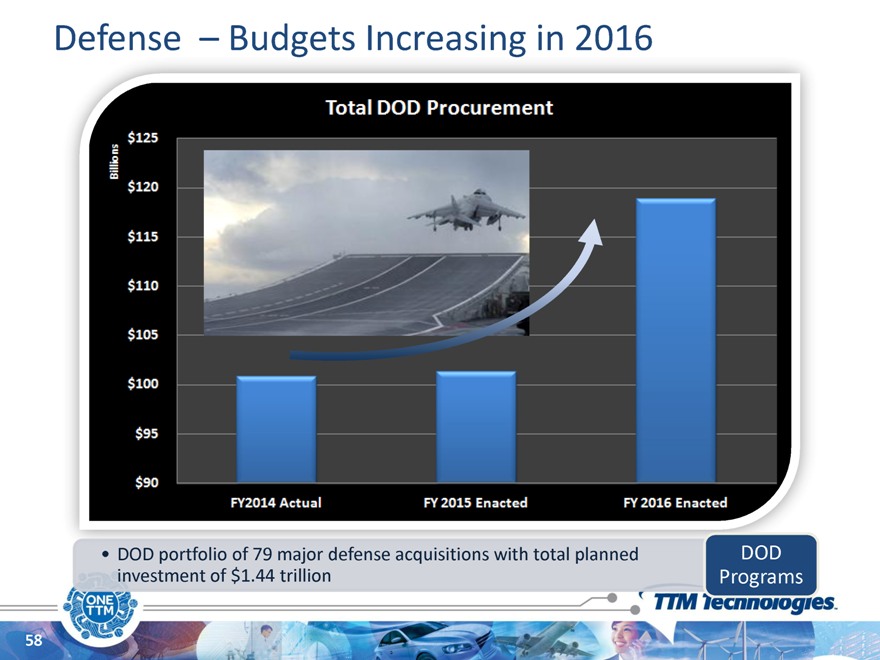
Defense – Budgets Increasing in 2016
DOD portfolio of 79 major defense acquisitions with total planned investment of $1.44 trillion
DOD Programs
58
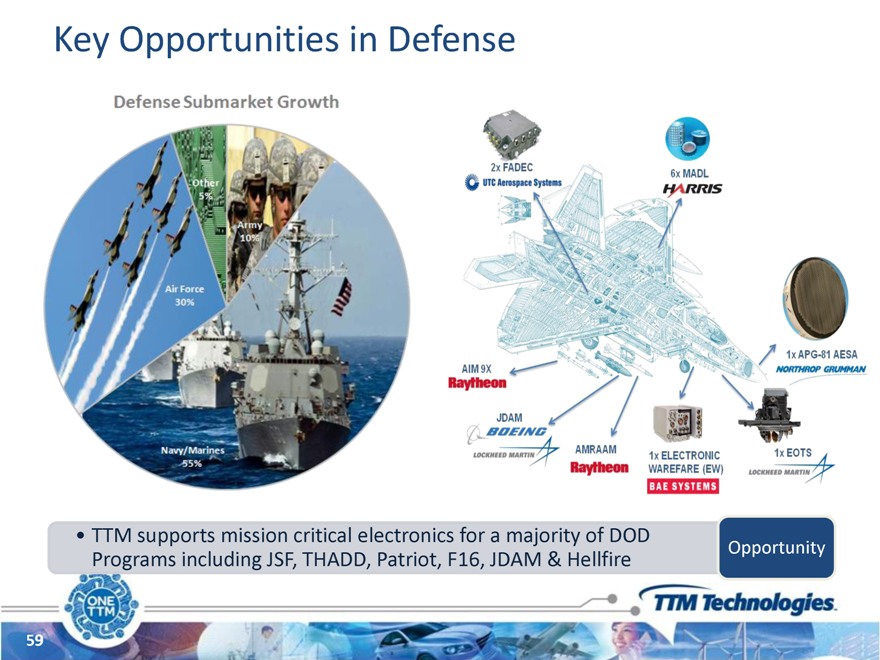
Key Opportunities in Defense
TTM supports mission critical electronics for a majority of DOD Programs including JSF, THADD, Patriot, F16, JDAM & Hellfire
Opportunity
59
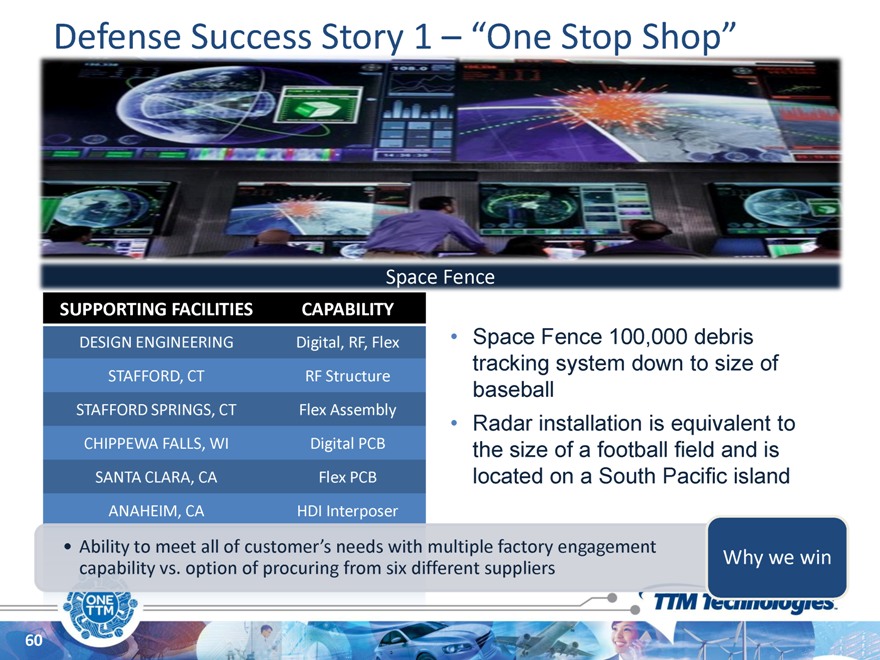
Defense Success Story 1 – “One Stop Shop”
Space Fence
SUPPORTING FACILITIES CAPABILITY
DESIGN ENGINEERING Digital, RF, Flex • Space Fence 100,000 debris
tracking system down to size of
STAFFORD, CT RF Structure
baseball
STAFFORD SPRINGS, CT Flex Assembly
Radar installation is equivalent to
CHIPPEWA FALLS, WI Digital PCB the size of a football field and is
SANTA CLARA, CA Flex PCB located on a South Pacific island
ANAHEIM, CA HDI Interposer
Ability to meet all of customer’s needs with multiple factory engagement
Why we win
capability vs. option of procuring from six different suppliers
60
Defense Success Story 2 – “Mission Critical”
Proven mission critical technology provider Why we win
61
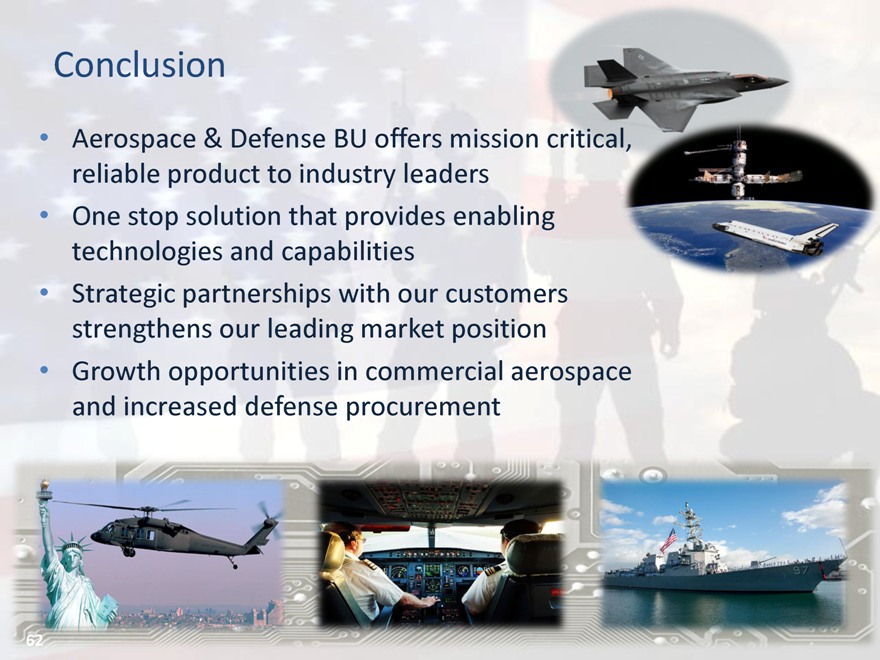
Conclusion
Aerospace & Defense BU offers mission critical, reliable product to industry leaders
One stop solution that provides enabling technologies and capabilities
Strategic partnerships with our customers strengthens our leading market position
Growth opportunities in commercial aerospace and increased defense procurement
62
Automotive, Medical, Industrial and Instrumentation
Jon Pereira
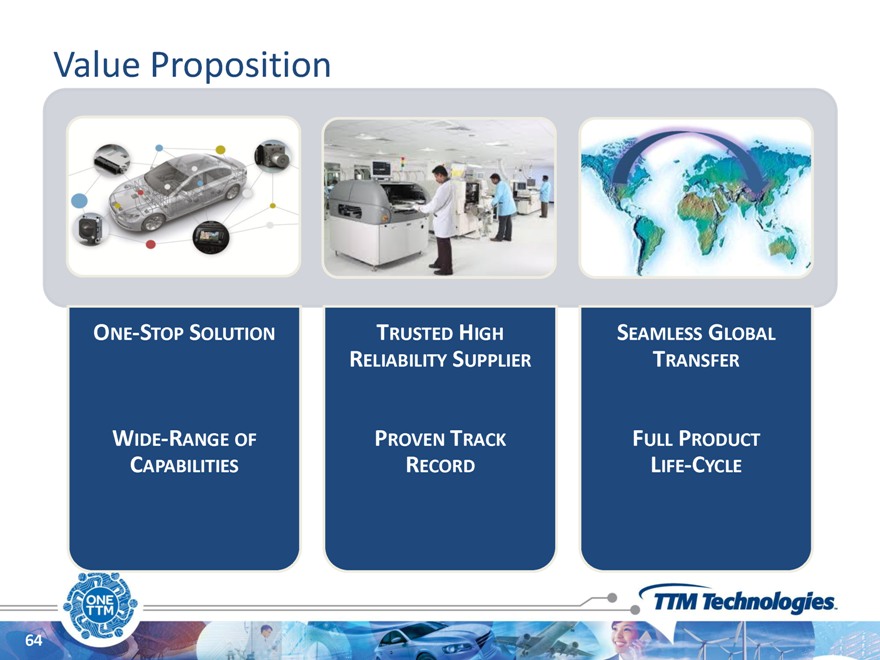
Value Proposition
ONE-STOP SOLUTION TRUSTED HIGH SEAMLESS GLOBAL RELIABILITY SUPPLIER TRANSFER
WIDE-RANGE OF PROVEN TRACK FULL PRODUCT CAPABILITIES RECORD LIFE-CYCLE
64
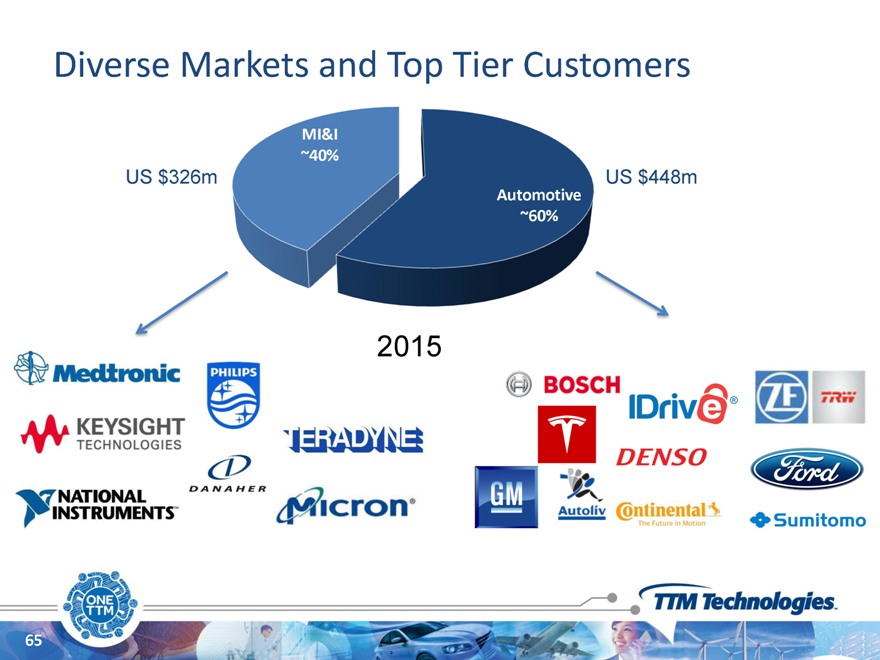
Diverse Markets and Top Tier Customers
MI&I ~40%
US $326m US $448m
Automotive ~60%
2015
65
Automotive
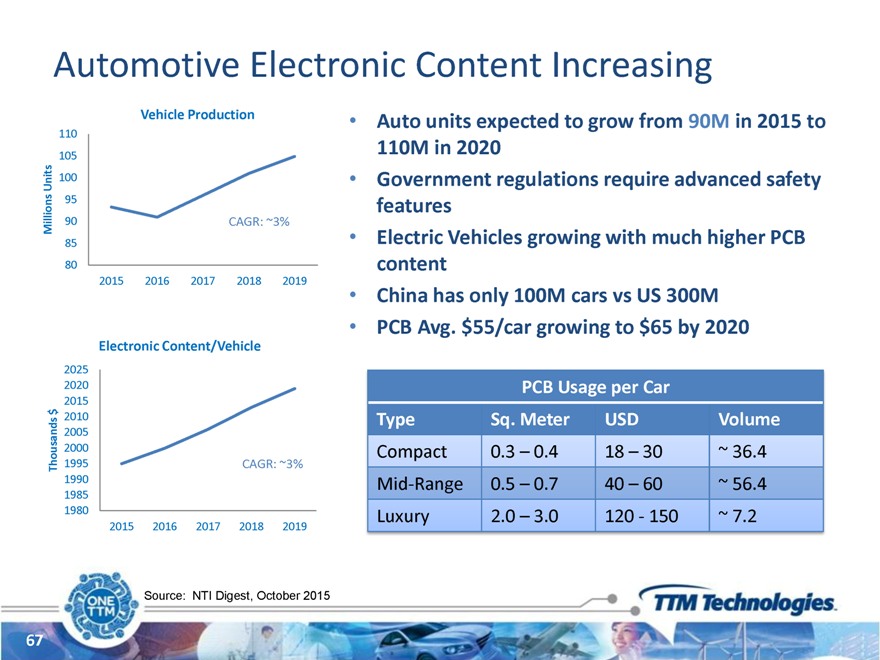
Automotive Electronic Content Increasing
Vehicle Production • Auto units expected to grow from 90M in 2015 to
110 110M in 2020
105
Units 100 • Government regulations require advanced safety
95
features
Millions 90 CAGR: ~3%
85 • Electric Vehicles growing with much higher PCB
80 content
2015 2016 2017 2018 2019
China has only 100M cars vs US 300M
PCB Avg. $55/car growing to $65 by 2020
Electronic Content/Vehicle
2025
2020 PCB Usage per Car
2015 $
2010 Type Sq. Meter USD Volume
2005
2000 Compact 0.3 – 0.4 18 – 30 ~ 36.4
Thousands 1995 CAGR: ~3%
1990 Mid-Range 0.5 – 0.7 40 – 60 ~ 56.4
1985
1980 Luxury 2.0 – 3.0 120—150 ~ 7.2
2015 2016 2017 2018 2019
Source: NTI Digest, October 2015
67
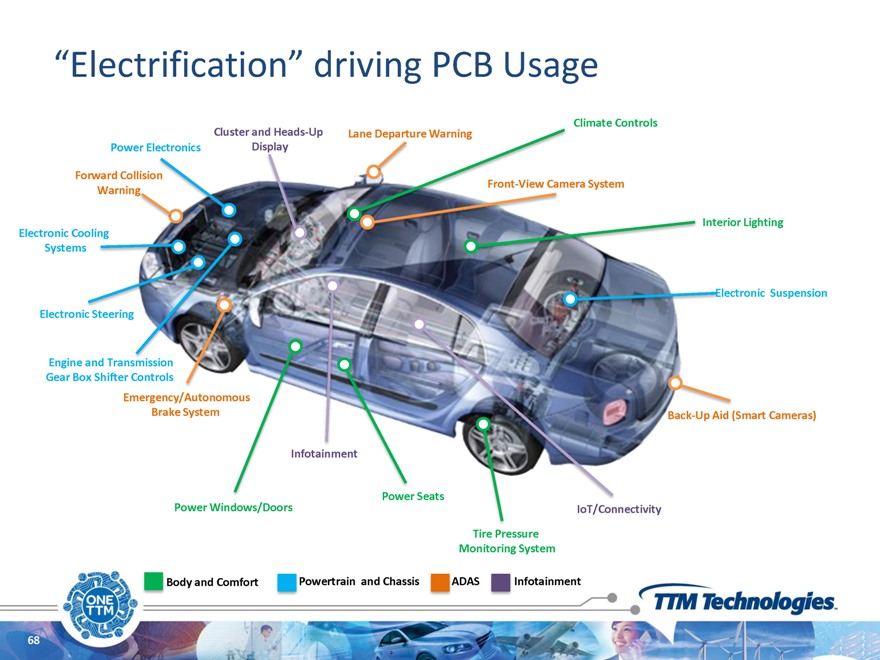
“Electrification” driving PCB Usage
Cluster and Heads-Up Climate Controls Lane Departure Warning Power Electronics Display
Forward Collision
Front-View Camera System Warning
Interior Lighting Electronic Cooling Systems
Electronic Suspension
Electronic Steering
Engine and Transmission Gear Box Shifter Controls
Emergency/Autonomous
Brake System Back-Up Aid (Smart Cameras)
Infotainment
Power Seats
Power Windows/Doors IoT/Connectivity
Tire Pressure Monitoring System
Body and Comfort Powertrain and Chassis ADAS Infotainment
68
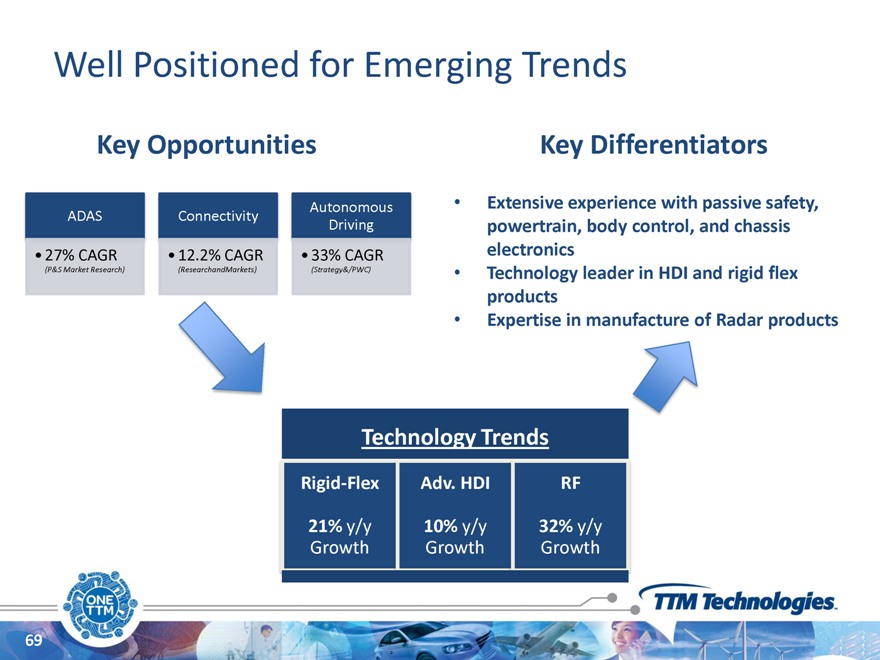
Well Positioned for Emerging Trends
Key Opportunities Key Differentiators
ADAS Connectivity Autonomous Extensive experience with passive safety, Driving powertrain, body control, and chassis
27% CAGR 12.2% CAGR 33% CAGR electronics
(P&S Market Research) (ResearchandMarkets) (Strategy&/PWC) Technology leader in HDI and rigid flex
products
Expertise in manufacture of Radar products
Technology Trends
Rigid-Flex Adv. HDI RF
21% y/y 10% y/y 32% y/y Growth Growth Growth
69
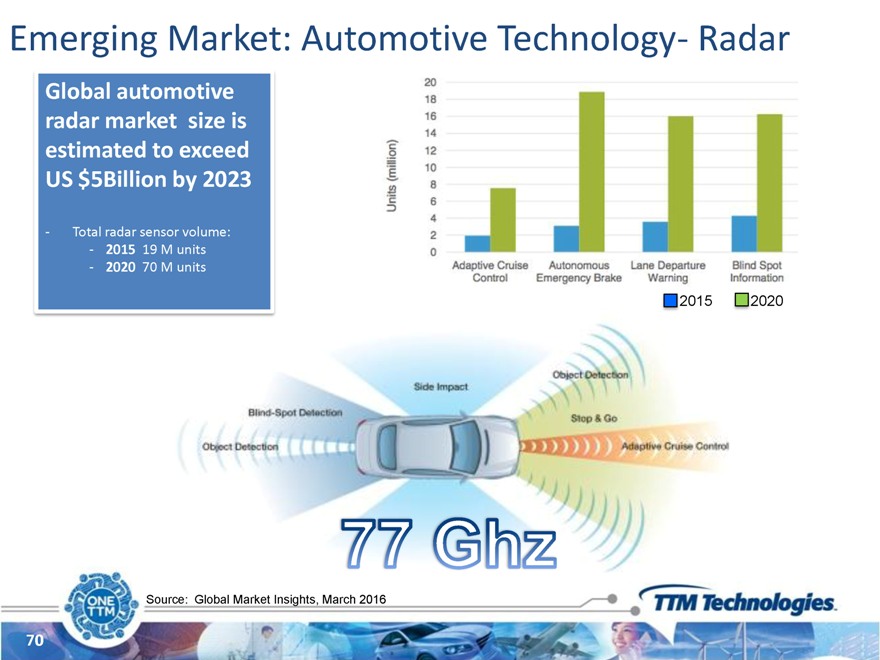
Emerging Market: Automotive Technology- Radar
Global automotive radar market size is estimated to exceed US $5Billion by 2023
- Total radar sensor volume:
- 2015 19 M units
- 2020 70 M units
2015 2020
Source: Global Market Insights, March 2016
70
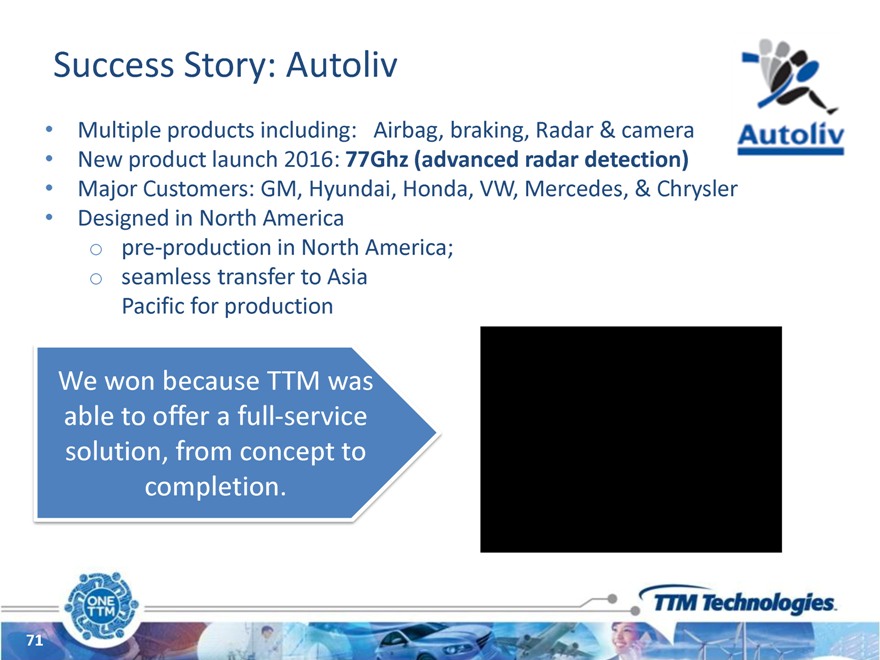
Success Story: Autoliv
Multiple products including: Airbag, braking, Radar & camera
New product launch 2016: 77Ghz (advanced radar detection)
Major Customers: GM, Hyundai, Honda, VW, Mercedes, & Chrysler Designed in North America
pre-production in North America; seamless transfer to Asia Pacific for production
We won because TTM was able to offer a full-service solution, from concept to completion.
71
Medical, Industrial and Instrumentation
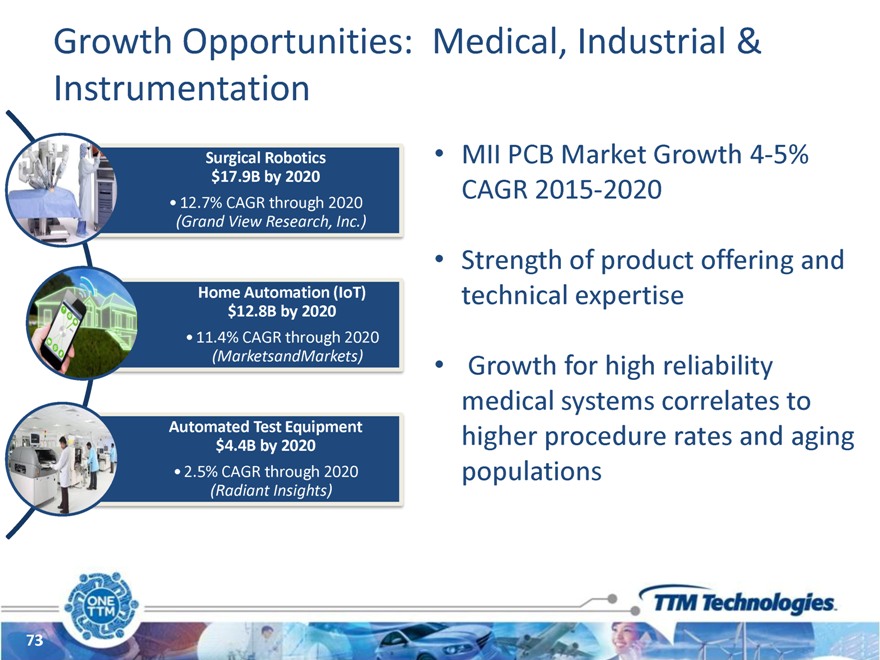
Growth Opportunities: Medical, Industrial & Instrumentation
Surgical Robotics $17.9B by 2020
12.7% CAGR through 2020
(Grand View Research, Inc.)
Home Automation (IoT) $12.8B by 2020
11.4% CAGR through 2020
(MarketsandMarkets)
Automated Test Equipment $4.4B by 2020
2.5% CAGR through 2020
(Radiant Insights)
73
MII PCB Market Growth 4-5%
CAGR 2015-2020
Strength of product offering and technical expertise
Growth for high reliability medical systems correlates to higher procedure rates and aging populations
73
Seamless Transition Wins MI&I Business
Medical Device Company specializing in ``continuous” glucose monitoring systems
Small wearable device — smart device compatible Development initiated in Sterling and seamlessly migrated to Toronto; FDA approval required Patient monitoring systems are expected to grow at a CAGR of 5.6% from 2015 – 2020
(markets and markets)
TTM won because we can support the entire product life cycle— in North America.
74
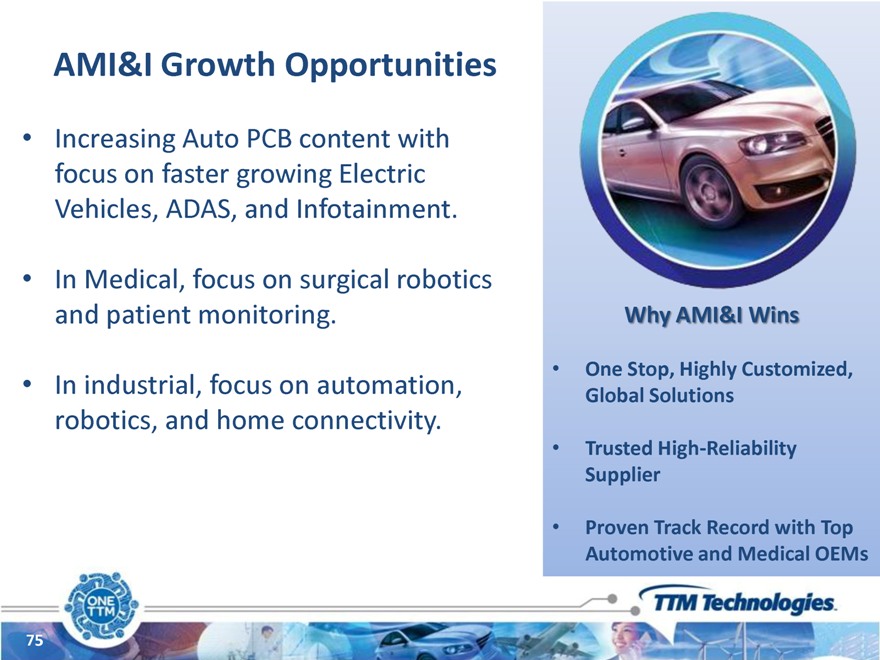
AMI&I Growth Opportunities
Increasing Auto PCB content with focus on faster growing Electric
Vehicles, ADAS, and Infotainment.
In Medical, focus on surgical robotics and patient monitoring.
In industrial, focus on automation, robotics, and home connectivity.
Why AMI&I Wins
One Stop, Highly Customized, Global Solutions
Trusted High-Reliability
Supplier
Proven Track Record with Top Automotive and Medical OEMs
75
Diversified, Disciplined and Deleveraging
Todd Schull
Agenda
Via Integration/Cost Improvement P&L Operating Model Cash Flow/Deleveraging Model
77
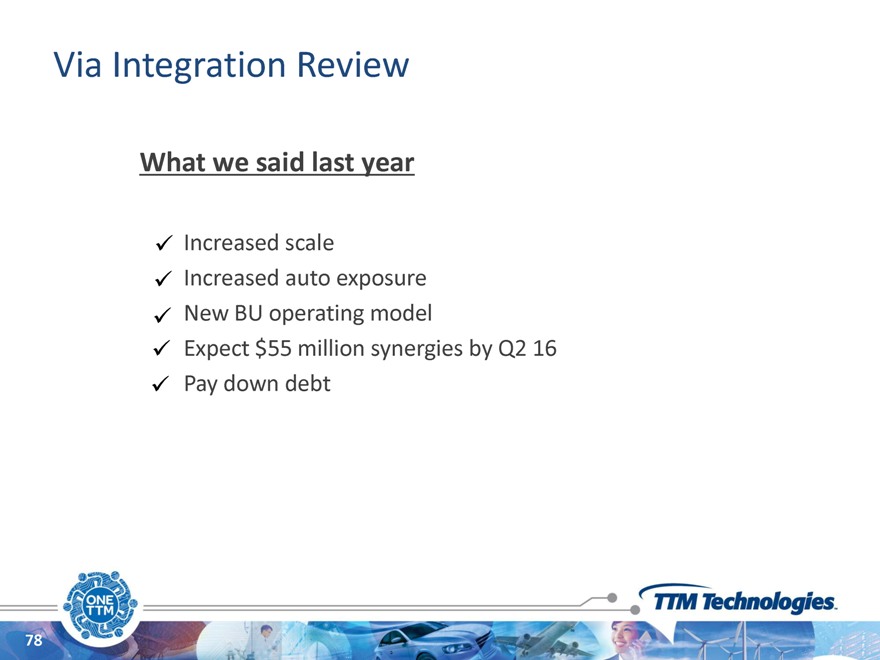
Via Integration Review
What we said last year
Increased scale
Increased auto exposure New BU operating model
Expect $55 million synergies by Q2 16 Pay down debt
78
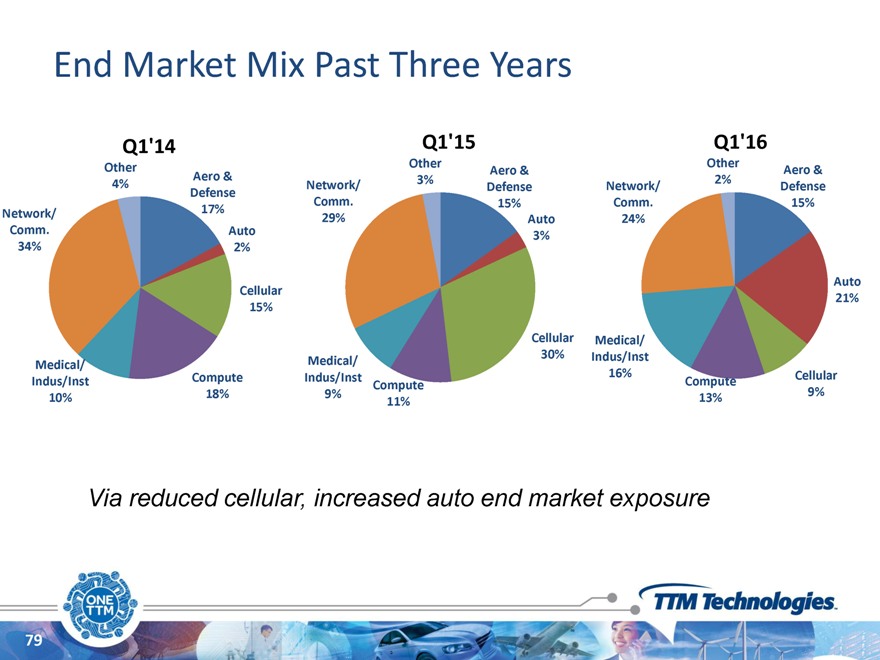
End Market Mix Past Three Years
Q1’14 Q1’15 Q1’16
Other Other Other
Aero & Aero & Aero & 3% 2%
4% Network/ Defense Network/ Defense Defense Comm. 15% Comm. 15% Network/ 17% 29% Auto 24% Comm. Auto 3% 34% 2%
Auto Cellular 21% 15%
Cellular Medical/ 30% Indus/Inst Medical/ Medical/
Compute Indus/Inst 16% Cellular Indus/Inst Compute Compute 9% 10% 18% 9% 13% 11%
Via reduced cellular, increased auto end market exposure
79
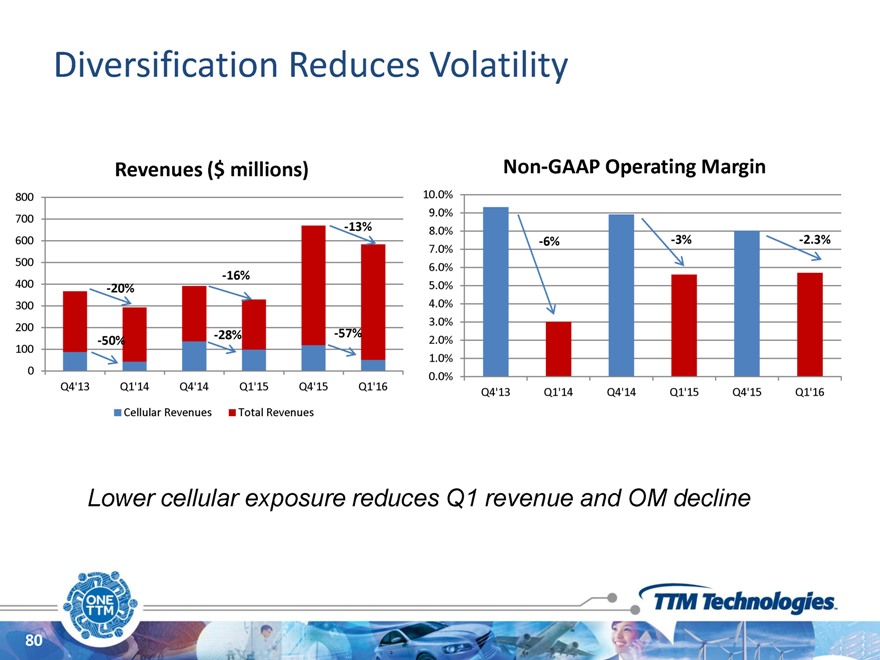
Diversification Reduces Volatility
Revenues ($ millions) Non-GAAP Operating Margin
800 10.0%
9.0% 700
-13% 8.0%
600 7.0% -6% -3% -2.3%
500
6.0%
-16%
400 -20% 5.0% 300 4.0%
3.0% 200
-28% -57%
100 -50% 2.0%
1.0% 0
0.0% Q4’13 Q1’14 Q4’14 Q1’15 Q4’15 Q1’16
Q4’13 Q1’14 Q4’14 Q1’15 Q4’15 Q1’16 Cellular Revenues Total Revenues
Lower cellular exposure reduces Q1 revenue and OM decline
80
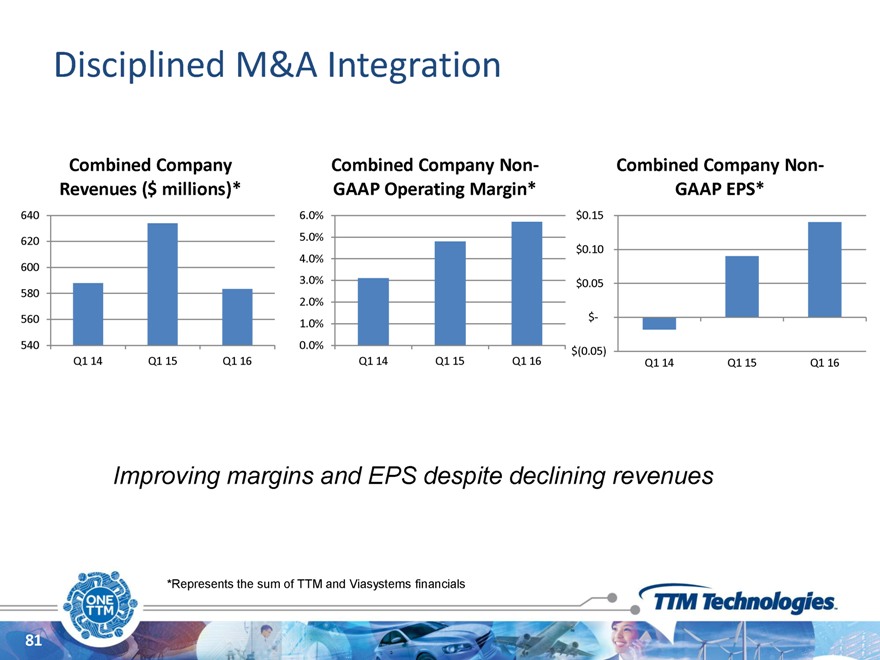
Disciplined M&A Integration
Combined Company Combined Company Non- Combined Company Non-Revenues ($ millions)* GAAP Operating Margin* GAAP EPS*
640 6.0% $0.15
620 5.0%
4.0% $0.10 600
3.0% $0.05 580 2.0%
560 $-
1.0%
540 0.0% $(0.05)
Q1 14 Q1 15 Q1 16 Q1 14 Q1 15 Q1 16 Q1 14 Q1 15 Q1 16
Improving margins and EPS despite declining revenues
*Represents the sum of TTM and Viasystems financials
81
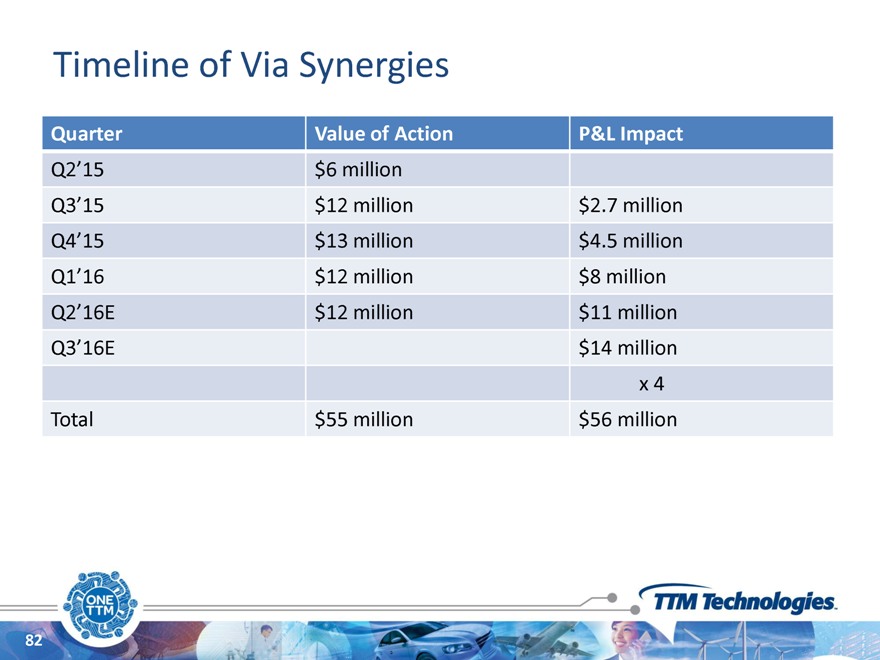
Timeline of Via Synergies
Quarter Value of Action P&L Impact
Q2’15 $6 million
Q3’15 $12 million $2.7 million Q4’15 $13 million $4.5 million Q1’16 $12 million $8 million Q2’16E $12 million $11 million Q3’16E $14 million x 4
Total $55 million $56 million
82
Post Via—Continuous Cost Improvement
Supply chain management
Alternate suppliers Price reductions
Best practice sharing
Materials usage reduction Process improvement
Margin improvement
Yield/Scrap improvement Productivity improvement
G&A efficiencies
Shared services ERP
83
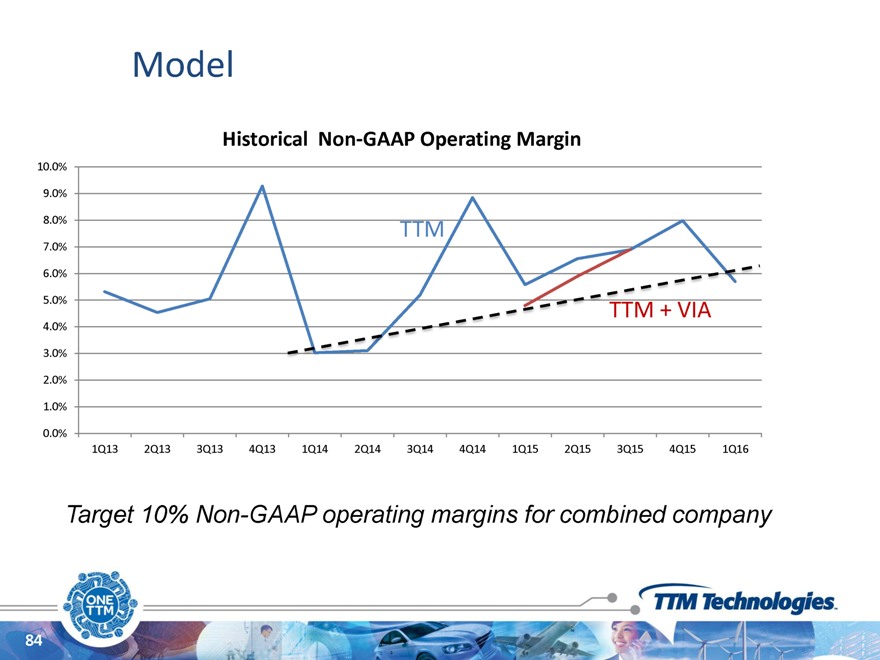
Operating Model
Historical Non-GAAP Operating Margin
10.0% 9.0%
8.0% TTM 7.0%
6.0% 5.0% 4.0% 3.0% 2.0% 1.0%
0.0%
1Q13 2Q13 3Q13 4Q13 1Q14 2Q14 3Q14 4Q14 1Q15 2Q15 3Q15 4Q15 1Q16
Target 10% Non-GAAP operating margins for combined company
84
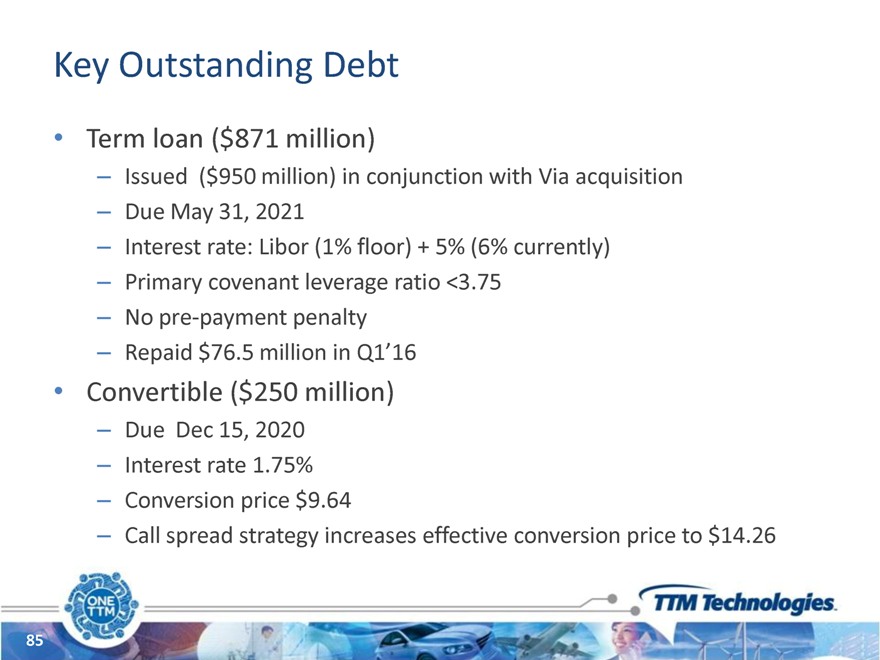
Key Outstanding Debt
Term loan ($871 million)
Issued ($950 million) in conjunction with Via acquisition Due May 31, 2021 Interest rate: Libor (1% floor) + 5% (6% currently) Primary covenant leverage ratio <3.75 No pre-payment penalty
Repaid $76.5 million in Q1’16
Convertible ($250 million)
Due Dec 15, 2020 Interest rate 1.75% Conversion price $9.64
Call spread strategy increases effective conversion price to $14.26
85
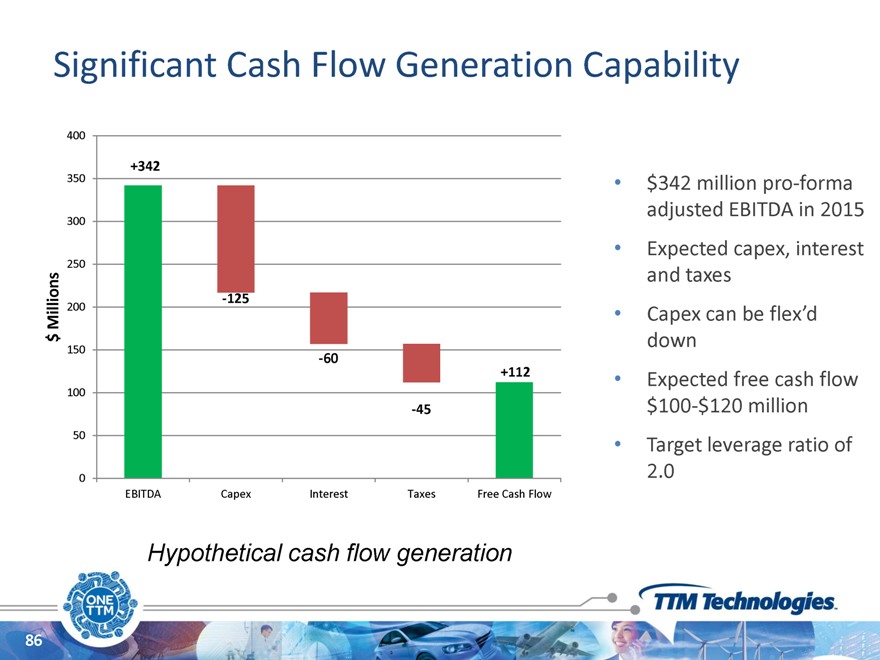
Significant Cash Flow Generation Capability
400
+342
350 • $342 million pro-forma
300 adjusted EBITDA in 2015
Expected capex, interest
250
and taxes
-125
Millions 200 • Capex can be flex’d $ down
150
-60
+112 • Expected free cash flow 100 $100-$120 million
-45
50 •
Target leverage ratio of
0 2.0
EBITDA Capex Interest Taxes Free Cash Flow
Hypothetical cash flow generation
86
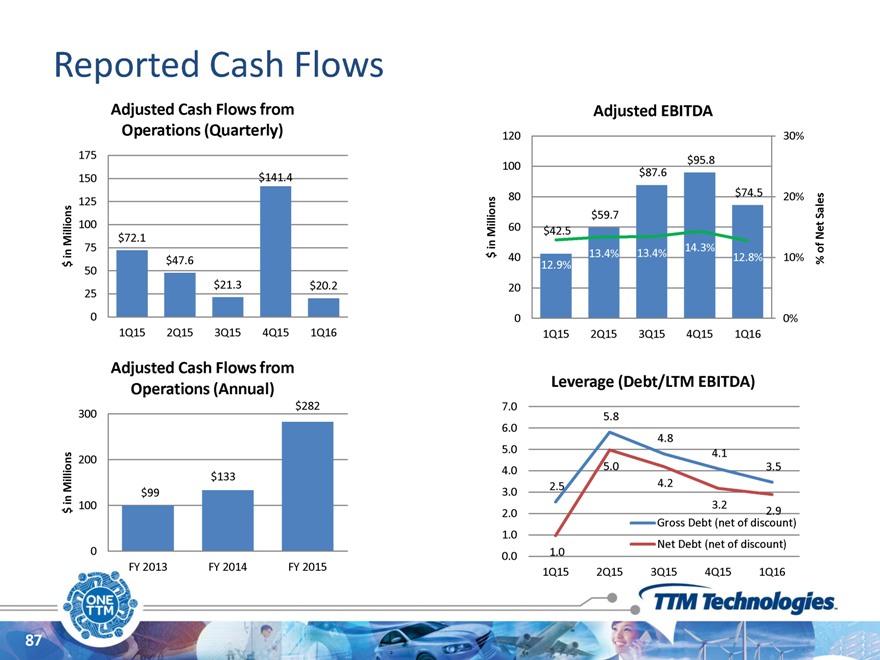
Reported Cash Flows
Adjusted Cash Flows from Adjusted EBITDA
Operations (Quarterly) 120 30%
175
$95.8 100
$87.6 150 $141.4
$74.5 125 80 20%
Sales
100 $59.7 Millions 60 $42.5 Net Millions $72.1 75 in 14.3% of in $ 13.4% 13.4%
$ $47.6 40 12.9% 12.8% 10% % 50
25 $21.3 $20.2 20
0 0 0% 1Q15 2Q15 3Q15 4Q15 1Q16 1Q15 2Q15 3Q15 4Q15 1Q16
Adjusted Cash Flows from
Leverage (Debt/LTM EBITDA) Operations (Annual)
$282 7.0
300 5.8 6.0
4.8
5.0 4.1 200
4.0 5.0 3.5 $133
Millions 2.5 4.2 in $99 3.0 $ 100 3.2 2.9 2.0 Gross Debt (net of discount) 1.0 Net Debt (net of discount)
0 1.0 0.0 FY 2013 FY 2014 FY 2015
1Q15 2Q15 3Q15 4Q15 1Q16
87
Future Priorities for Cash Flow Generation
Generate Cash from Operations – Grow Earnings
Execution
Synergies
Generate Cash through Asset Efficiency
Deleverage our Balance Sheet – More Cash for Shareholders
88
Conclusions
Successful Via integration – Improved cost structure
Continuous focus on cost reduction and cash flow generation
Solid cash flow capability for deleveraging
89
Thank You
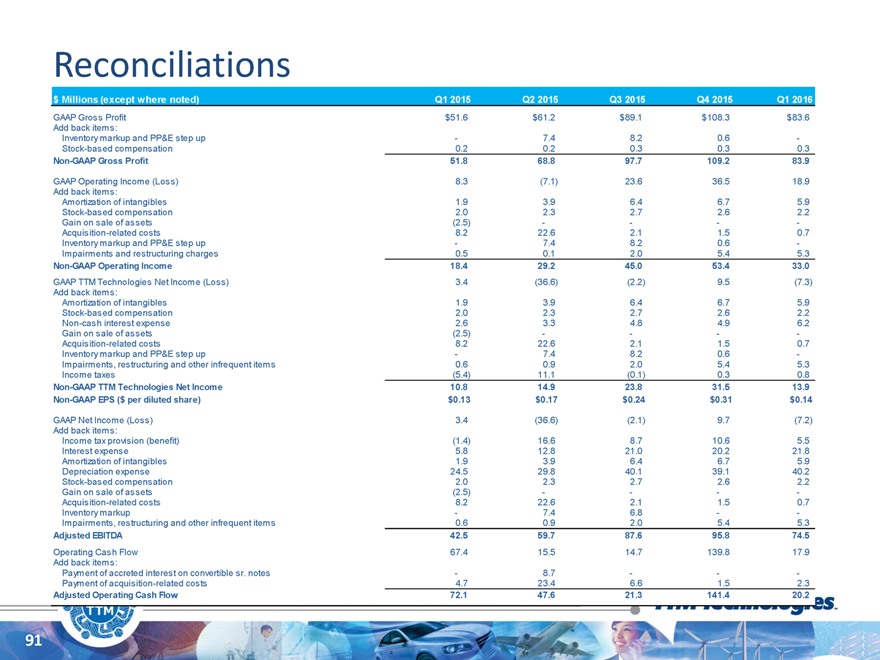
Reconciliations
$ Millions (except where noted) Q1 2015 Q2 2015 Q3 2015 Q4 2015 Q1 2016
GAAP Gross Profit $51.6 $61.2 $89.1 $108.3 $83.6
Add back items:
Inventory markup and PP&E step up — 7.4 8.2 0.6 -
Stock-based compensation 0.2 0.2 0.3 0.3 0.3
Non-GAAP Gross Profit 51.8 68.8 97.7 109.2 83.9
GAAP Operating Income (Loss) 8.3 (7.1) 23.6 36.5 18.9
Add back items:
Amortization of intangibles 1.9 3.9 6.4 6.7 5.9
Stock-based compensation 2.0 2.3 2.7 2.6 2.2
Gain on sale of assets (2.5) ——— -
Acquisition-related costs 8.2 22.6 2.1 1.5 0.7
Inventory markup and PP&E step up — 7.4 8.2 0.6 -
Impairments and restructuring charges 0.5 0.1 2.0 5.4 5.3
Non-GAAP Operating Income 18.4 29.2 45.0 53.4 33.0
GAAP TTM Technologies Net Income (Loss) 3.4 (36.6) (2.2) 9.5 (7.3)
Add back items:
Amortization of intangibles 1.9 3.9 6.4 6.7 5.9
Stock-based compensation 2.0 2.3 2.7 2.6 2.2
Non-cash interest expense 2.6 3.3 4.8 4.9 6.2
Gain on sale of assets (2.5) ——— -
Acquisition-related costs 8.2 22.6 2.1 1.5 0.7
Inventory markup and PP&E step up — 7.4 8.2 0.6 -
Impairments, restructuring and other infrequent items 0.6 0.9 2.0 5.4 5.3
Income taxes (5.4) 11.1 (0.1) 0.3 0.8
Non-GAAP TTM Technologies Net Income 10.8 14.9 23.8 31.5 13.9
Non-GAAP EPS ($ per diluted share) $0.13 $0.17 $0.24 $0.31 $0.14
GAAP Net Income (Loss) 3.4 (36.6) (2.1) 9.7 (7.2)
Add back items:
Income tax provision (benefit) (1.4) 16.6 8.7 10.6 5.5
Interest expense 5.8 12.8 21.0 20.2 21.8
Amortization of intangibles 1.9 3.9 6.4 6.7 5.9
Depreciation expense 24.5 29.8 40.1 39.1 40.2
Stock-based compensation 2.0 2.3 2.7 2.6 2.2
Gain on sale of assets (2.5) ——— -
Acquisition-related costs 8.2 22.6 2.1 1.5 0.7
Inventory markup — 7.4 6.8 — -
Impairments, restructuring and other infrequent items 0.6 0.9 2.0 5.4 5.3
Adjusted EBITDA 42.5 59.7 87.6 95.8 74.5
Operating Cash Flow 67.4 15.5 14.7 139.8 17.9
Add back items:
Payment of accreted interest on convertible sr. notes — 8.7 —— -
Payment of acquisition-related costs 4.7 23.4 6.6 1.5 2.3
Adjusted Operating Cash Flow 72.1 47.6 21.3 141.4 20.2
91
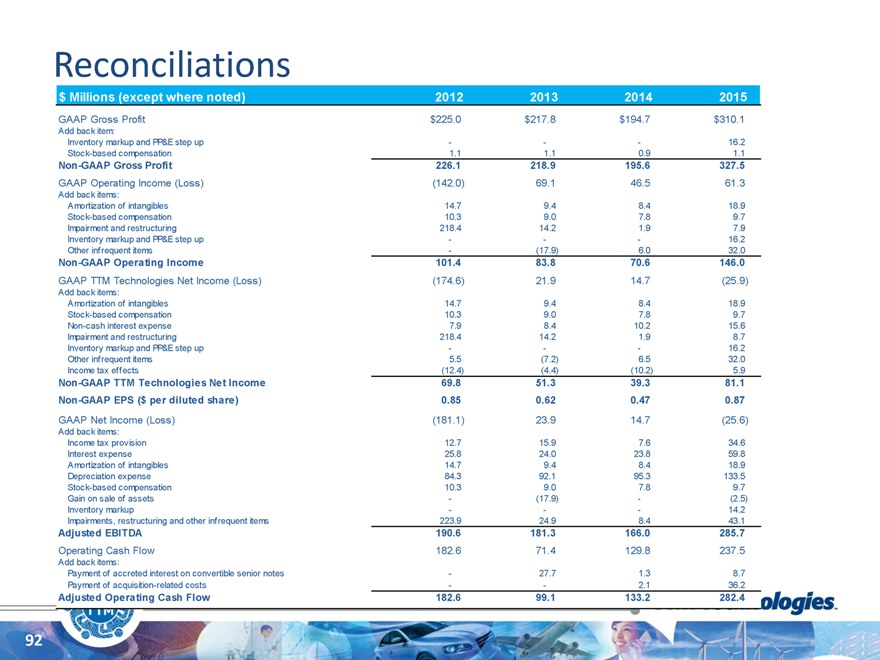
Reconciliations
$ Millions (except where noted) 2012 2013 2014 2015
GAAP Gross Profit $225.0 $217.8 $194.7 $310.1
Add back item:
Inventory markup and PP&E step up ——— 16.2
Stock-based compensation 1.1 1.1 0.9 1.1
Non-GAAP Gross Profit 226.1 218.9 195.6 327.5
GAAP Operating Income (Loss) (142.0) 69.1 46.5 61.3
Add back items:
Amortization of intangibles 14.7 9.4 8.4 18.9
Stock-based compensation 10.3 9.0 7.8 9.7
Impairment and restructuring 218.4 14.2 1.9 7.9
Inventory markup and PP&E step up ——— 16.2
Other infrequent items — (17.9) 6.0 32.0
Non-GAAP Operating Income 101.4 83.8 70.6 146.0
GAAP TTM Technologies Net Income (Loss) (174.6) 21.9 14.7 (25.9)
Add back items:
Amortization of intangibles 14.7 9.4 8.4 18.9
Stock-based compensation 10.3 9.0 7.8 9.7
Non-cash interest expense 7.9 8.4 10.2 15.6
Impairment and restructuring 218.4 14.2 1.9 8.7
Inventory markup and PP&E step up ——— 16.2
Other infrequent items 5.5 (7.2) 6.5 32.0
Income tax effects (12.4) (4.4) (10.2) 5.9
Non-GAAP TTM Technologies Net Income 69.8 51.3 39.3 81.1
Non-GAAP EPS ($ per diluted share) 0.85 0.62 0.47 0.87
GAAP Net Income (Loss) (181.1) 23.9 14.7 (25.6)
Add back items:
Income tax provision 12.7 15.9 7.6 34.6
Interest expense 25.8 24.0 23.8 59.8
Amortization of intangibles 14.7 9.4 8.4 18.9
Depreciation expense 84.3 92.1 95.3 133.5
Stock-based compensation 10.3 9.0 7.8 9.7
Gain on sale of assets — (17.9) — (2.5)
Inventory markup ——— 14.2
Impairments, restructuring and other infrequent items 223.9 24.9 8.4 43.1
Adjusted EBITDA 190.6 181.3 166.0 285.7
Operating Cash Flow 182.6 71.4 129.8 237.5
Add back items:
Payment of accreted interest on convertible senior notes — 27.7 1.3 8.7
Payment of acquisition-related costs —— 2.1 36.2
Adjusted Operating Cash Flow 182.6 99.1 133.2 282.4
92