UNITED STATES
SECURITIES AND EXCHANGE COMMISSION
Washington, D.C. 20549
FORM 10-K
(Mark One)
| x | ANNUAL REPORT PURSUANT TO SECTION 13 OR 15(d) OF THE SECURITIES EXCHANGE ACT OF 1934 |
For the fiscal year ended December 31, 2007
OR
| ¨ | TRANSITION REPORT PURSUANT TO SECTION 13 OR 15(d) OF THE SECURITIES EXCHANGE ACT OF 1934 |
For the transition period from to
Commission file number: 001-33870
NetSuite Inc.
(Exact name of registrant as specified in its charter)
| | |
| Delaware | | 94-3310471 |
(State or other jurisdiction of
incorporation or organization) | | (I.R.S. Employer
Identification Number) |
2955 Campus Drive, Suite 100
San Mateo, CA
94403-2511
(Address of principal executive offices, including zip code)
(650) 627-1000
(Registrant’s telephone number, including area code)
Securities registered pursuant to Section 12(b) of the Act:
| | |
| Common Stock, $0.01 par value | | New York Stock Exchange, Inc. |
| (Title of class) | | (Name of each exchange on which registered) |
Securities registered pursuant to Section 12(g) of the Act:
None
Indicate by check mark if the Registrant is a well-known seasoned issuer as defined in Rule 405 of the Securities Act. Yes ¨ No x
Indicate by check mark if the Registrant is not required to file reports pursuant to Section 13 or Section 15(d) of the Act. Yes ¨ No x
Indicate by check mark whether the Registrant (1) has filed all reports required to be filed by Section 13 or 15(d) of the Securities Exchange Act of 1934 during the preceding 12 months (or for such shorter period that the registrant was required to file such reports), and (2) has been subject to such filing requirements for the past 90 days. Yes x No ¨
Indicate by check mark if disclosure of delinquent filers pursuant to Item 405 of Regulation S-K is not contained herein, and will not be contained, to the best of the Registrant’s knowledge, in definitive proxy or information statements incorporated by reference in Part III of this Form 10-K or any amendment to this Form 10-K. x
Indicate by check mark whether the Registrant is a large accelerated filer, an accelerated filer, a non-accelerated filer, or a smaller reporting company. See definitions of “large accelerated filer,” “accelerated filer,” and “smaller reporting company” in Rule 12b-2 of the Exchange Act. (Check one):
¨ Large accelerated filer ¨ Accelerated filer x Non-accelerated filer (Do not check if a smaller reporting company)¨ Smaller reporting company
Indicate by check mark whether the Registrant is a shell company (as defined in Rule 12b-2 of the Exchange Act). Yes ¨ No x
As of June 30, 2007, the last business day of our most recently completed second fiscal quarter; our common stock was not listed on any exchange or over-the-counter market. Our common stock began trading on the New York Stock Exchange on December 20, 2007. As of December 31, 2007, the aggregate market value of the voting stock held by non-affiliates was $309,731,260, based on the number of shares held by non-affiliates of the registrant as of December 31, 2007, and based on the reported last sale price of common stock on December 31, 2007. This calculation does not reflect a determination that persons are affiliates for any other purposes.
Number of shares of common stock outstanding as of February 29, 2008: 60,211,259.
DOCUMENTS INCORPORATED BY REFERENCE
Portions of the Registrant’s definitive proxy statement for its fiscal 2008 Annual Meeting of Stockholders to be filed within 120 days of the Registrant’s fiscal year ended December 31, 2007 are incorporated by reference into Part III.
TABLE OF CONTENTS
FORM 10-K
INDEX
2
PART I
Overview
We are a leading vendor of on-demand, integrated business management application suites that include Accounting / Enterprise Resource Planning, or ERP, Customer Relationship Management, or CRM, and Ecommerce software for small and medium-sized businesses and divisions of large companies. We enable customers to manage their critical back-office, front-office and web operations in a single application. Our suite serves as a single system for running business operations and is targeted at small and medium-sized businesses, or SMBs, as well as divisions of large companies. Our suite is designed to be affordable and easy to use, while delivering functionality and levels of reliability, scalability and security that have typically only been available to large enterprises with substantial information technology resources. We deliver our suite over the Internet as a subscription service using the software-as-a-service or on-demand model.
Our revenue has grown from $17.7 million during the year ended December 31, 2004 to $108.5 million during the year ended December 31, 2007. As of December 31, 2007, we had over 5,600 active customers. For the years ended December 31, 2005, 2006 and 2007, the percentage of our revenue generated outside of North America was 11%, 14% and 18%, respectively.
Industry Background
The 1990s saw the widespread adoption among large enterprises of packaged business management software applications that automated a variety of departmental functions, such as accounting, finance, order and inventory management, human resources, sales and customer support. These sophisticated applications required significant cash outlays for the initial purchase and for ongoing maintenance and support. In addition, these applications were internally managed and maintained by enterprise customers, requiring large staffs to support complex information technology infrastructures. Most importantly, the applications generally were provided by multiple vendors, with each application providing only a departmental view of the enterprise. To gain an enterprise-wide view, organizations attempted to tie together their various incompatible packaged applications through long, complex and costly integration efforts. Many of these attempts failed, in whole or in part, often after significant delay and expense. As a consequence, many large enterprises have transitioned from multiple point products to comprehensive, integrated business management suites, such as those offered by Oracle and SAP, as their core business management platforms.
SMBs, which we define as businesses with up to 1,000 employees, have application software requirements that are similar, in many respects, to large enterprises because their core business processes are substantially similar to those of large enterprises. These requirements include the integration of back-office activities, such as managing payroll and tracking inventory; front-office activities, including order management and customer support; and, increasingly, sophisticated e-commerce capabilities.
SMBs are generally less capable than large enterprises of performing the costly, complex and time-consuming integration of multiple point products from one or more vendors. As a result, SMBs can frequently derive greater benefits from a comprehensive business suite. Suites designed for, and broadly adopted by, large enterprises to provide a comprehensive, integrated platform for managing these core business processes, however, generally are not well suited to SMBs due to the complexity and cost of such applications.
Recently, SMBs have begun to benefit from the development of the on-demand software-as-a-service, or SaaS, model. SaaS uses the Internet to deliver software applications from a centrally hosted computing facility to end users through a web browser. SaaS eliminates the costs associated with installing and maintaining applications within the customer’s information technology infrastructure. On-demand applications are generally licensed for a monthly, quarterly or annual subscription fee, as opposed to on-premise enterprise applications that
3
typically require the payment of a much larger, upfront license fee. As a result, on-demand applications require substantially less initial and ongoing investment in software, hardware and implementation services and lower ongoing support and maintenance, making them more affordable for SMBs.
To date, the on-demand software model has been applied to a variety of types of business software applications, including CRM, security, accounting, human resources management, messaging and others, and it has been adopted by a wide variety of businesses.
While SaaS applications have enabled SMBs to benefit from enterprise-class capabilities, most are still point products that require extensive, costly and time-consuming integration to work with other applications. SMBs generally have been unable to purchase a comprehensive business management application suite at an affordable cost that enables them to run their businesses using a single system of record, provides real-time views of their operations and can be readily customized and rapidly implemented. Until NetSuite, we believe there was no provider of an on-demand, integrated suite of business management applications that addresses the needs of SMBs in the comprehensive manner that Oracle and SAP address the similar needs of large enterprises.
Our Solution
Our comprehensive business management application suite is designed to serve as a single system for running a business. All elements of our application suite share the same customer and transaction data, enabling seamless, cross-departmental business process automation and real-time monitoring of core business metrics. In addition, our integrated ERP, CRM and e-commerce capabilities provide users with real-time visibility and appropriate application functionality through dashboards tailored to their particular job function and access rights. Because our offering is delivered via the Internet, it is available wherever a user has Internet access, whether on a personal computer or a mobile device. The key advantages of our application suite to our customers are:
One Integrated System for Running a Business. Our integrated business application suite provides the functionality required to automate the core operations of an SMB, as well as divisions of large companies. This unified approach to managing a business enables companies to create cross-functional business processes; extend access to appropriate customers, partners, suppliers or other relevant constituencies; and efficiently share and disseminate information in real time. Our suite is designed to be easy to use, while also providing in depth functionality to meet the needs of our most sophisticated customers. Our customers can use our application suite to manage mission-critical business processes, including complex ERP (finance, accounting, inventory and payroll), CRM (sales, order management, marketing and customer support) and e-commerce (hosting, online stores and website analytics) functions. We also have tailored our offering to the specific needs of customers in the wholesale/distribution, services and software industries, to better serve those customers’ distinct business requirements and accelerate the implementation of our offerings for customers in those industries.
Role-Based Application Functionality and Real-Time Business Intelligence. Users access our suite through a role-based user interface, or dashboard that delivers specific application functionality and information appropriate for each user’s job responsibilities in a format familiar to them. For example, the dashboard for a salesperson would deliver functionality for managing contacts, leads and forecasts, while the dashboard for a warehouse manager would deliver capabilities appropriate for managing shipping, receiving and returns. These dashboards also incorporate sophisticated business intelligence tools that enable users to track key performance indicators, analyze operational data to identify trends, issues and opportunities and make decisions that can improve the performance of their business, all in real time.
On-Demand Delivery Model. We deliver our suite over the Internet as a subscription service using the SaaS model, eliminating the need for customers to buy and maintain on-premise hardware and software. Our suite is designed to achieve levels of reliability, scalability and security for our customers that have typically only been available to large enterprises with substantial information technology resources. Our architecture enables us to maintain very high levels of availability, scale easily as our customers grow and provide a safe and secure environment for their business-critical data and applications.
4
Low Total Cost of Ownership. Our suite incorporates the functionality of multiple applications, thereby eliminating the costs associated with attempting to integrate disparate applications, whether managed on-premise or delivered on-demand. Our on-demand delivery model and our application’s ease of use and configurability significantly reduce implementation costs for hardware, software and services and the need for dedicated information technology personnel. Customers typically subscribe to our application suite for a quarterly or annual fee based on the number of users and the solutions they elect to deploy. Our subscription fees are significantly less than typical upfront costs to purchase perpetual licenses and our on-demand delivery system eliminates ongoing maintenance and upgrade charges.
Rapid Implementation. Because we offer a relatively comprehensive application suite that incorporates the functionality of multiple applications, we significantly reduce the time and risk associated with implementing and integrating multiple point products. Our on-demand delivery model enables remote implementations and eliminates many of the steps associated with on-premise installations, such as purchasing and setting up hardware. In addition to our industry-specific offerings, our professional services organization is organized along customers’ industries; therefore, knowledge gained through an implementation with one customer may be applied to other customers within that industry, speeding implementations. Customers can implement our offerings themselves, engage our professional services organization or utilize the services of our partners.
Ease of Customization and Configuration. We enable users to customize our application suite to the particular needs of their businesses. Our application suite can be configured by end users without software programming expertise. In contrast to traditional on-premise applications, as new versions of our application suite become available, each customer’s customizations and configurations are maintained with little or no additional effort or expense required.
Our Business Strategy
Our goal is to enhance our position as a leading vendor of on-demand, integrated business management application suites for SMBs. The key elements of our strategy include:
Expanding Our Leadership in On-Demand, Integrated Business Suites. We believe we were the first software vendor to integrate front-office, back-office and e-commerce management capabilities into a single on-demand software suite. We intend to improve our position in the on-demand applications market by continuing to provide high quality offerings that encompass the enterprise-class functionality and ease-of-use our customers require. We also intend to leverage our position as our customers’ primary business management platform to add new and enhanced functionality that will help them run their businesses more efficiently and expand our presence within their organizations.
Tailoring Our Offering to Customers’ Specific Industries. While we provide a general purpose suite applicable to all businesses, we believe that tailoring our application to customers’ specific industries has been and will continue to be important to our growth. We currently offer industry-specific editions of our service for wholesale/distribution, services and software companies. We will continue to enhance the capabilities of our application by further tailoring the functionality for these and other industries.
Growing Our Customer Base and Expanding Use of Our Service Within Existing Accounts. We intend to broaden our offerings and expand our direct and indirect sales efforts to grow our customer base. In addition, we seek to increase ongoing subscription revenue from our existing customers by broadening their use of our suite, thereby increasing the number of users and modules deployed.
Fostering the Continued Development of the NetSuite Partner Network. We provide tools and programs to foster the development of a network of value-added resellers, or VARs, systems integrators and independent software vendors. In addition to programs that enable our partners to resell our suite, our NetSuite Business Operating System (NS-BOS) allows these partners to extend our platform by developing products of their own, including industry-specific versions of our application suite. We intend to continue to enhance the NS-BOS platform and establish distribution models to bring these new solutions to market.
5
Addressing the Multinational Business Requirements of SMBs. SMBs are increasingly seeking global business opportunities, in large part by leveraging the Internet. We believe that there is significant opportunity to address the needs of SMBs with multinational business operations, and we currently offer a localized version of our suite in a number of countries and languages. We will continue to extend our application offerings to support the requirements of multinational SMBs.
Our Offerings
Our main offering is NetSuite, which is designed to provide the core business management capabilities that most of our customers require. NetSuite, NetSuite CRM+ and NetSuite Small Business are designed for use by most types of businesses. In addition, we offer industry-specific configurations for use by wholesale/distribution, services and software companies. Finally, we sell additional on-demand application modules that customers can purchase to obtain additional functionality required for their specific business needs.
NetSuite. NetSuite is targeted at SMBs and divisions of large companies, and provides a single platform for ERP, CRM and e-commerce capabilities. It contains a broad array of features that enable users to do their individual jobs more effectively. In addition, because all users are transacting business on the same database system, NetSuite can easily automate processes across departments. For example, when a sales representative enters an order, upon approval it automatically appears on the warehouse manager’s dashboard as an item to be shipped and, once the item has been shipped, it automatically appears on the finance manager’s dashboard as an item to be billed. Each customer can automate their key business functions across all departments, including sales, marketing, service, finance, inventory, order fulfillment, purchasing and employee management. As with all of our offerings, users access the application and data through a role-based user interface, or dashboard, tailored to deliver specific functionality and information appropriate for their position.
NetSuite CRM+. NetSuite CRM+ is targeted at a wide range of companies, including companies larger than our traditional SMB customers. SMB customers may use NetSuite CRM+ as an entry point into the entire suite, while larger enterprises often implement it as an alternative to more limited CRM offerings. This application provides traditional sales force automation, marketing automation, customer support and service management functionality. NetSuite CRM+ contrasts with competitive CRM products by also incorporating, without requiring additional integration, order management and many other ERP and e-commerce capabilities. This provides users with a more comprehensive, real-time view of customer interactions than can be provided by traditional, stand-alone CRM products, whether on-premise or on-demand. NetSuite CRM+ also offers incentive management, project tracking, website hosting and analytics and partner relationship management.
NetSuite Small Business. NetSuite Small Business is targeted primarily at small businesses that require fewer features than our NetSuite application. It includes basic ERP, CRM and e-commerce functionality, as well as customizable, real-time dashboards.
Add-On Modules. We also offer advanced capabilities that are part of our integrated suite, but are typically sold separately. These modules allow our customers to specifically augment aspects of our suite to enhance its relevance to their businesses.
NetSuite Industry Editions. We have configured NetSuite to meet the requirements of selected industries. Our current editions serve companies in the wholesale/distribution, services and software industries. Within each edition, we offer advanced functionality to complement our core NetSuite offering, templates of best practices and dedicated sales and professional services teams with industry-specific expertise.
Wholesale/Distribution Company Edition. NetSuite Wholesale/Distribution Edition allows product-based companies to manage their entire customer lifecycle, from lead through fulfillment, invoicing and payment. It includes customer-facing sales force automation, marketing and customer service processes integrated with back-office inventory management, fulfillment and accounting processes, all within a single, flexible business application. In this edition, we have extended the core NetSuite application to include industry-specific business
6
functionality, such as demand-based inventory replenishment, to meet the unique requirements of wholesale/distribution companies. In addition, we have taken advantage of the expertise gathered from working with over 800 wholesale/distribution customers to create best practices implementation methodologies.
Services Company Edition. NetSuite Services Company Edition allows customers to manage their entire client service and business management processes with a flexible, powerful business application, integrating professional services automation, CRM, client service delivery, financials and many more capabilities of particular importance to services companies. This edition manages the end-to-end project lifecycle business processes in one system, from prospecting through proposal generation, contract management, project/time tracking, service delivery and billing. NetSuite Services Company Edition incorporates deeper project and resource management capabilities than the core NetSuite offering. Other important features include milestone and percentage-of-completion billing; resource scheduling, tracking and utilization; and project document management.
Software Company Edition. In addition to the comprehensive, integrated front-office, back-office and e-commerce capabilities of our NetSuite offering, NetSuite Software Company Edition adds functionality to address the complex accounting, billing and order management requirements of software companies. This edition is designed to enable our software customers to conform to the various revenue recognition and other compliance requirements relevant to software companies. This edition can be supplemented with modules designed to streamline business processes unique to software companies, such as bug tracking and electronic software distribution.
NetSuite Business Operating System. NetSuite Business Operating System (NS-BOS) is our technology platform that allows customers, partners and developers to tailor and extend our suite to meet specific company, vertical and industry requirements for personalization, business processes and best practices. NS-BOS allows partners to develop products of their own, including industry-specific versions of our application suite. NS-BOS and our SuiteFlex customization environment are designed to continue to operate across version upgrades without modification and include the following tools: SuiteBuilder, SuiteScript, SuiteTalk, SuiteScript D-Bug and SuiteBundler.
| | • | | SuiteBuilder. SuiteBuilder is an integrated set of easy-to-use, point-and-click tools that enables customers to tailor NetSuite to fit their company and industry requirements. SuiteBuilder enables users to easily customize fields and forms and add database tables, without the need for additional programming. The flexibility of SuiteBuilder also allows the look, feel and content of individual users’ dashboards to be easily personalized. |
| | • | | SuiteScript. Customers, partners and developers use SuiteScript to extend the suite with everything from simple functions to new business process flows and even entirely new applications. SuiteScript provides the benefits of a robust architecture and on-demand hosting efficiencies for interaction between our standard and custom processes. SuiteScript introduces customization and tailoring capabilities that allow complex processes with branching logic and time-based decision trees to be automated. SuiteScript gives developers access to the same software objects used to build our core application, allowing seamless extensions of the suite’s core functionality. |
| | • | | SuiteTalk. SuiteTalk is an integration tool that utilizes simple object access protocol and standards-based web service application programming interfaces to integrate our suite with other applications, such as third-party vertical applications and legacy systems. Our suite’s single data repository, combined with SuiteTalk’s advanced integration technologies, enables our application suite to incorporate and leverage a wide range of data generated by our customers’ legacy applications. Developers can also use SuiteTalk to build add-on capabilities, such as wireless interfaces. |
| | • | | SuiteScript D-Bug.SuiteScript D-Bug, the real-time, interactive debugger enables code validation and testing as third-party applications run on the application server. Most if not all SaaS development environments support testing of third-party applications on client machines. SuiteScript D-Bug enables |
7
| | third-party applications to be tested in an actual server environment against live data, allowing developers to see and correct the behavior exhibited by the application in real-world conditions. |
| | • | | SuiteBundler. SuiteBundler enables the reuse of customizations and applications built with SuiteFlex. Our value-added reseller, systems integration and independent software vendor partners will use SuiteBundler to package and distribute industry-specific extensions and customizations of NetSuite they have developed. SuiteBundler allows our partners to embed their applications, knowledge and industry best practices into our suite, converting professional services traditionally applicable only to an individual customer into a product offering that can be sold to all customers in the same industry. In addition, our customers can use SuiteBundler to share their SuiteFlex customizations with others. |
Sales and Marketing
Sales. We generate sales through both direct and indirect approaches, with most selling done over the phone. Our direct sales team consists of professionals in various locations across the United States, Europe and the Asia-Pacific region. Within these regions, our direct sales organization focuses on selling to SMBs and divisions of large companies.
Indirect sales are produced through our relationships with channel partners in North America, Latin America, Europe and the Asia-Pacific region. In 2006, we expanded into Japan with the formation of our Japanese subsidiary and strategic partnerships with Transcosmos, Inc., or TCI, Miroku Jyoho Service Ltd., or MJS and Inspire Corporation, each of which is a Japanese corporation. In the future, we plan to continue to invest to expand our direct sales force within North America, Europe and the Asia-Pacific region and pursue additional indirect channel partnerships.
Our sales process typically begins with the generation of a sales lead from a marketing program or customer referral. After the lead is qualified, our sales personnel conduct focused web-based demonstrations along with initial price discussions. Members of our professional services team are engaged as needed to offer insight around aspects of the implementation. Our sales cycle typically ranges from one to six months, but can vary based on the specific application, the size and complexity of the potential customer’s information technology environment and other factors.
Marketing. We tailor our marketing efforts around relevant application categories, customer sizes and customer industries. As part of our marketing strategy, we have established a number of key programs and initiatives including online and search engine advertising, email campaigns and web seminars, product launch events, trade show and industry event sponsorship and participation, marketing support for channel partners, and referral programs.
Japanese Majority-Owned Subsidiary. In March 2006, we established a majority-owned subsidiary in Japan, NetSuite Kabushiki Kaisha, or NetSuite KK. We own this subsidiary with TCI, MJS and Inspire Corporation. TCI and MJS have exclusive distribution rights to distribute our on-demand application suite in Japan. As of December 31, 2007, we owned approximately 72% of the subsidiary. Because of this majority interest, we consolidate NetSuite KK’s financial results, which are reflected in each revenue, cost of revenue and expense category in our consolidated statement of operations. We then record minority interest, which reflects the minority investors’ interest in NetSuite KK’s results. Through December 31, 2007, the operating performance and liquidity requirements of NetSuite KK had not been material to our results of operations or financial condition. Although we plan to expand our selling and marketing activities in Japan to add new customers, we believe the future liquidity requirements of NetSuite KK will not be significant in the near future.
Service and Support
Professional Services. We have developed repeatable, cost-effective consulting and implementation services to assist our customers with integrating and importing data from other systems, changing their business processes
8
to take advantage of the enhanced capabilities enabled by our integrated suite, implementing those new business processes within their organization and configuring and customizing our application suite for their business processes and requirements.
Our consulting and implementation methodology leverages the nature of our on-demand software architecture, the industry-specific expertise of our professional services employees and the design of our platform to simplify, streamline and expedite the implementation process. We generally employ a joint staffing model for implementation projects whereby we involve the customer more actively in the implementation process than traditional software companies. We believe this better prepares our customers to support the application throughout their use of our service. In addition, because our service is on-demand, our professional services employees can remotely configure our application for most customers based on telephonic consultations. Our consulting and implementation services are generally offered on a fixed price basis. Our network of partners also provides professional services to our customers.
Client Support. Our technical support organization, with personnel in Canada and Asia, offers support 24 hours a day, seven days a week. Our system allows for skills-based and time zone-based routing to address general and technical inquiries across all aspects of our services. For our direct customers, we offer tiered customer support programs depending upon the service needs of our customers’ deployments. Support contracts typically have a one-year term. For customers purchasing through resellers, primary product support is provided by our resellers, with escalation support provided by us.
Training. We offer a variety of training services through our training resource, NetSuite University, to facilitate the successful adoption of our suite throughout the customer’s organization.
Operations, Technology and Development
Our customers rely on our application suite to run their businesses, and, as a result, we need to ensure the availability of our service. We have developed our infrastructure with the goal of maximizing the availability of our application, which is hosted on a highly-scalable network located in a single, secure third-party facility. On March 17, 2006, we entered into a revised Master Service Agreement with Level 3 Communications, LLC in connection with our data center facility. Pursuant to this agreement, and associated work orders, we have leased facility space, power, and internet connectivity for multiple one-year terms. On December 4, 2007, we entered into an agreement with SAVVIS Communications Corporation, or SAVVIS, a secondary data center facility provider, to provide additional capacity beginning in 2008. Our hosting operations incorporate industry-standard hardware, the Linux open-source operating system and Oracle databases and application servers into a flexible, scalable architecture. Elements of our application suite’s infrastructure can be replaced or added with no interruption in service, helping to ensure that the failure of any single device will not cause a broad service outage.
Our single-instance, multi-tenant architecture allows us to provide our customers with enterprise-class capabilities, high quality of service, scalability and security, all at an affordable price. Our architecture enables us to host multiple smaller customers on a single x86 server while preserving the ability to migrate any customer to its own server without interruption or alteration when the customers’ growth and business needs require it. In addition to the enhanced flexibility and scalability our architecture provides, it also is designed to work on inexpensive, industry-standard hardware, thereby providing us a significant cost advantage that is reflected in the pricing we are able to offer our customers.
Unlike other SaaS companies that deploy major new releases to all customers at once, we roll out all major releases and many upgrades of our application suite to only a portion of our customer base at any one time. This “phased release process” is designed to allow us to mitigate the impact of major changes and new releases, ensuring that any potential issues affect only a portion of our customers before they are addressed.
9
The combination of our hosting infrastructure, flexible architecture and phased release process enables us to offer a service level commitment to our customers of 99.5% uptime per period, excluding designated periods of maintenance. Under the terms of this commitment, we offer to credit a full month’s service fees for any period in which we do not meet this service level.
In developing our service offerings, we rely on customer feedback and spend significant time with our customers in formal user testing sessions as well as less formal “ride-alongs” and customer roundtables. We use the NetSuite service to track customer interest in service enhancements and actual work done on these enhancements. We develop our offerings using Java and the Oracle database on the server and AJAX on the client with a goal of making our service scalable, high performance, robust and easy to use. Finally, we expose many of our internal development tools to third party developers via SuiteFlex to allow extensions to the service that mirror the built-in capabilities we develop internally.
In April 2005, we entered into a software license agreement with Oracle USA, Inc., an affiliate of Oracle Corporation. Lawrence J. Ellison, who beneficially owns our majority stockholder, is the Chief Executive Officer, a principal stockholder and a director of Oracle Corporation. This perpetual license is for the use of Oracle database and application server software on a certain number of individual computers, along with technical support. Under the April 2005 agreement, we paid $2.5 million over nine installments, including the final buyout payment of $227,000, which occurred on June 19, 2007. In May 23, 2007, we entered into another software license agreement with Oracle USA, Inc. to license Oracle software for an additional number of computers, along with technical support. The May 2007 agreement calls for payments in total of $0.9 million payable over 12 equal quarterly installments through 2010. On October 31, 2007 we entered into another perpetual software license agreement with Oracle USA, Inc. to license Oracle database and application server software, along with technical support. This license has a forty-two month term that allows us to download an unlimited number of licenses which are perpetual in nature. We also purchased the initial 12 months of technical support services under the agreement, which are renewable annually. The October 2007 agreement requires us to pay a total of $4.7 million for the net license fees to be paid over 12 equal quarterly installments through 2010 and annual payments of $1.4 million for the technical support fees. The October 2007 agreement replaces the support portion of the product orders made under the April 2005 and May 2007 agreements.
Our product development expenses were $24.8 million in 2005, $20.7 million in 2006 and $23.7 million in 2007.
Customers
As of December 31, 2007, we served over 5,600 active customers, which we define as companies under contract at that date who have used our service within the past quarter. Our customers are diverse in size and type across a wide variety of industries, with a focus on SMBs, which we define as businesses with up to 1,000 employees, and divisions of large companies. In 2007, the top 10 industries in which our customers operated, as measured by our recognized revenue, were as follows: Distribution & Wholesale; Professional, Consulting and Other Services; Computer Software; e-Commerce & Retail; Manufacturing; Computer & IT Services; Telecommunications Services; Financial Services; Healthcare Services; and Education. We had customers in over 60 countries in 2007. No single customer accounted for more than 3% of our revenue in 2005, 2006 or 2007.
Competition
We compete with a broad array of ERP, CRM and e-commerce companies. Our markets are highly competitive, fragmented and subject to rapid changes in technology. Many of our potential customers are seeking their first packaged ERP, CRM or e-commerce application and, as such, evaluate a wide range of alternatives during their purchase process. Although we believe that none of our larger competitors currently offer an on-demand comprehensive business management suite, we face significant competition within each of our markets from companies with broad product suites and greater name recognition and resources than we have, as
10
well as smaller companies focused on specialized solutions. In addition, some of our larger competitors have announced plans to launch new products that could compete more closely with our on-demand application suite. Internationally, we face competition from local companies as well as larger competitors, each of which has products tailored for those local markets. To a lesser extent, we compete with internally developed and maintained solutions. Our current principal competitors include Epicor Software Corporation, Intuit Inc., Microsoft Corporation, SAP, The Sage Group plc and salesforce.com, inc.
We believe the principal competitive factors in our markets include:
| | • | | service breadth and functionality; |
| | • | | service performance, security and reliability; |
| | • | | ability to tailor and customize services for a specific company, vertical or industry; |
| | • | | speed and ease of deployment, integration and configuration; |
| | • | | total cost of ownership, including price and implementation and support costs; |
| | • | | sales and marketing approach; and |
| | • | | financial resources and reputation of the vendor. |
We believe that we compete favorably with most of our competitors on the basis of each of the factors listed above, except that certain of our competitors have greater sales, marketing and financial resources, more extensive geographic presence and greater name recognition than we do. In addition, although we have extended the number of applications we have introduced for specific vertical markets, we may be at a disadvantage in certain vertical markets compared to certain of our competitors. We may face future competition in our markets from other large, established companies, as well as from emerging companies. In addition, we expect that there is likely to be continued consolidation in our industry that could lead to increased price competition and other forms of competition.
Intellectual Property
Our success depends upon our ability to protect our core technology and intellectual property. To accomplish this, we rely on a combination of intellectual property rights, including trade secrets, patents, copyrights and trademarks, as well as customary contractual protections. We view our trade secrets and know-how as a significant component of our intellectual property assets, as we have spent years designing and developing our on-demand, integrated application suite, which we believe differentiates us from our competitors.
As of December 31, 2007, we had eight U.S. and no foreign pending patent applications. We do not know whether any of our pending patent applications will result in the issuance of patents or whether the examination process will require us to narrow our claims. Even if granted, there can be no assurance that these pending patent applications will provide us with protection.
We have a number of registered and unregistered trademarks. We maintain a policy requiring our employees, consultants and other third parties to enter into confidentiality and proprietary rights agreements and to control access to software, documentation and other proprietary information.
In addition, we license third-party technologies that are incorporated into some elements of our services. Licenses of third-party technologies may not continue to be available to us at a reasonable cost, or at all. The steps we have taken to protect our intellectual property rights may not be adequate. Third parties may infringe or misappropriate our proprietary rights. Competitors may also independently develop technologies that are substantially equivalent or superior to the technologies we employ in our services. Failure to protect our proprietary rights adequately could significantly harm our competitive position and operating results.
11
The software and technology industries are characterized by the existence of a large number of patents, copyrights, trademarks and trade secrets and by frequent litigation based on allegations of infringement or other violations of intellectual property rights. As we face increasing competition, the possibility of intellectual property rights claims against us grows. Many of our service agreements require us to indemnify our customers for certain third-party intellectual property infringement claims, which would increase our costs as a result of defending those claims and might require that we pay damages if there were an adverse ruling in any such claims. We, and certain of our customers, have in the past received correspondence from third parties alleging that certain of our services, or customers’ use of our services, violate these third parties’ patent rights. These types of correspondence and future claims could harm our relationships with our customers and might deter future customers from subscribing to our services.
With respect to any intellectual property rights claim against us or our customers, we may have to pay damages or stop using technology found to be in violation of a third party’s rights. We may have to seek a license for the technology, which may not be available on reasonable terms, significantly increase our operating expenses or require us to restrict our business activities in one or more respects. The technology also may not be available for license to us at all. As a result, we may be required to develop alternative non-infringing technology, which could require significant effort and expense.
Employees
As of December 31, 2007, we had approximately 675 employees. We also engage a number of independent contractors and consultants.
None of our employees is represented by a labor union with respect to his or her employment with us. We have not experienced any work stoppages, and we consider our relations with our employees to be good. Our future success will depend upon our ability to attract and retain qualified personnel. Competition for qualified personnel remains intense and we may not be successful in retaining our key employees or attracting skilled personnel.
Available Information
You can obtain copies of our Form 10-K, Quarterly Reports on Form 10-Q, Current Reports on Form 8-K, and other filings with the Securities and Exchange Commission (“SEC”), and all amendments to these filings, free of charge from our Web site athttp://www.netsuite.com/investors as soon as reasonably practicable following our filing of any of these reports with the SEC. You can also obtain copies free of charge by contacting our Investor Relations department at our corporate headquarters.
You can also read and copy any materials we file with the SEC at the SEC’s Public Reference Room at 100 F Street, N.E., Washington, DC 20549. You can obtain additional information about the operation of the Public Reference Room by calling the SEC at 1-800-SEC-0330. In addition, the SEC maintains a website (http://www.sec.gov) that contains reports, proxy and information statements, and other information regarding issuers that file electronically with the SEC, including us.
12
Executive Officers of the Registrant
Our current executive officers, and their ages and positions as of December 31, 2007, are set forth below:
| | | | |
Name | | Age | | Position(s) |
Zachary Nelson | | 46 | | President, Chief Executive Officer and Director |
Evan M. Goldberg | | 41 | | Chief Technology Officer and Chairman of the Board |
James McGeever | | 40 | | Chief Financial Officer |
Timothy Dilley | | 48 | | Executive Vice President, Services |
Dean Mansfield | | 45 | | President, Worldwide Sales and Distribution |
Douglas P. Solomon | | 41 | | Vice President, Legal and Corporate Affairs and Secretary |
Zachary Nelsonhas served as a director since July 2002 and as our President and Chief Executive Officer since January 2003. Prior to that, Mr. Nelson served as our President and Chief Operating Officer from July 2002 to January 2003. From March 1996 to October 2001, Mr. Nelson was employed by Network Associates, Inc. (now McAfee, Inc.), an enterprise security software company. While at Network Associates, Mr. Nelson held positions including Chief Strategy Officer of Network Associates and President and Chief Executive Officer of MyCIO.com, a subsidiary that provided on-demand software security services. From 1992 to 1996, he held various positions, including Vice President of Worldwide Marketing at Oracle Corporation, an enterprise software company. He holds B.S. and M.A. degrees from Stanford University.
Evan M. Goldberg co-founded our company in 1998 and has served as Chairman of our board of directors and as our Chief Technology Officer since January 2003. From October 1998 through January 2003, Mr. Goldberg held various positions with us, including President and Chief Executive Officer and Chief Technology Officer. Prior to joining us, Mr. Goldberg founded mBed Software, Inc., a software company focused on multimedia tools for website developers, where he served as Chief Executive Officer from November 1995 to September 1998. From August 1987 to November 1995, Mr. Goldberg held various positions in product development at Oracle Corporation, including Vice President of Development in the New Media Division. Mr. Goldberg holds a B.A. from Harvard College.
James McGeever has served as our Chief Financial Officer since June 2000. Mr. McGeever served as our Director of Finance from January 2000 to June 2000. Prior to joining us, Mr. McGeever was the controller of Clontech Laboratories, Inc., a privately held biotechnology company from 1998 to 2000 and the corporate controller at Photon Dynamics, Inc., a capital equipment maker from 1994 to 1998. Mr. McGeever holds a B.Sc. from the London School of Economics. Mr. McGeever has qualified as a chartered accountant in the United Kingdom.
Timothy Dilley has served as our Executive Vice President, Services since December 2006. Prior to joining us, Mr. Dilley served as Senior Vice President of Global Customer Services at Informatica Corporation, an enterprise software company, from December 1998 until December 2006. He holds a B.S. from California State University at Fresno.
Dean Mansfield has served as our President, Worldwide Sales and Distribution since January 2007. Mr. Mansfield served as our Senior Vice President, Worldwide Sales from May 2005 until January 2007 and served as our Vice President of Europe, Middle East and Africa Sales from January 2004 until May 2005. Prior to joining us, Mr. Mansfield held a senior management position with Brocade Communications, a data storage company, from January 2002 until December 2002. He holds a LL.B. from the University of London, TVU.
Douglas P. Solomon has served as our Vice President, Legal & Corporate Affairs since November 2006 and has been our Secretary since January 2007. Prior to joining us, Mr. Solomon served in senior legal and management roles at Openwave Systems Inc., a software company, from April 2000 through March 2006, including Vice President, Legal & Corporate Affairs. He holds a B.A. from the University of Michigan and a J.D. from Harvard Law School.
13
Set forth below and elsewhere in this Annual Report, and in other documents we file with the SEC, are risks and uncertainties that could cause actual results to differ materially from the results contemplated by the forward-looking statements contained in this Annual Report. Because of the following factors, as well as other variables affecting our operating results, past financial performance should not be considered as a reliable indicator of future performance, and investors should not use historical trends to anticipate results or trends in future periods.
Risks Related to Our Business
We have a history of losses and we may not achieve profitability in the future.
We have not been profitable on a quarterly or annual basis since our formation. We experienced a net loss of $23.9 million during the year ended December 31, 2007. As of December 31, 2007, our accumulated deficit was $244.9 million. We expect to make significant future expenditures related to the development and expansion of our business. In addition, as a public company, we are incurring significant legal, accounting and other expenses that we did not incur as a private company. As a result of these increased expenditures, we will have to generate and sustain increased revenue to achieve and maintain future profitability. While our revenue has grown in recent periods, this growth may not be sustainable and we may not achieve sufficient revenue to achieve or maintain profitability. We may incur significant losses in the future for a number of reasons, including due to the other risks described in this Annual Report, and we may encounter unforeseen expenses, difficulties, complications and delays and other unknown factors. Accordingly, we may not be able to achieve or maintain profitability and we may continue to incur significant losses for the foreseeable future.
The market for on-demand applications may develop more slowly than we expect.
Our success will depend, to a large extent, on the willingness of SMBs to accept on-demand services for applications that they view as critical to the success of their business. Many companies have invested substantial effort and financial resources to integrate traditional enterprise software into their businesses and may be reluctant or unwilling to switch to a different application or to migrate these applications to on-demand services. Other factors that may affect market acceptance of our application include:
| | • | | the security capabilities, reliability and availability of on-demand services; |
| | • | | customer concerns with entrusting a third party to store and manage their data, especially confidential or sensitive data; |
| | • | | our ability to minimize the time and resources required to implement our suite; |
| | • | | our ability to maintain high levels of customer satisfaction; |
| | • | | our ability to implement upgrades and other changes to our software without disrupting our service; |
| | • | | the level of customization or configuration we offer; |
| | • | | our ability to provide rapid response time during periods of intense activity on customer websites; and |
| | • | | the price, performance and availability of competing products and services. |
The market for these services may not develop further, or may develop more slowly than we expect , either of which would harm our business.
14
Our customers are small and medium-sized businesses and divisions of large companies, which may result in increased costs as we attempt to reach, acquire and retain customers.
We market and sell our application suite to SMBs and divisions of large companies. To grow our revenue quickly, we must add new customers, sell additional services to existing customers and encourage existing customers to renew their subscriptions. However, selling to and retaining SMBs can be more difficult than selling to and retaining large enterprises because SMB customers:
| | • | | are more price sensitive; |
| | • | | are more difficult to reach with broad marketing campaigns; |
| | • | | have high churn rates in part because of the nature of their businesses; |
| | • | | often lack the staffing to benefit fully from our application suite’s rich feature set; and |
| | • | | often require higher sales, marketing and support expenditures by vendors that sell to them per revenue dollar generated for those vendors. |
If we are unable to cost-effectively market and sell our service to our target customers, our ability to grow our revenue quickly and become profitable will be harmed.
Our quarterly operating results may fluctuate in the future. As a result, we may fail to meet or exceed the expectations of research analysts or investors, which could cause our stock price to decline.
Our quarterly operating results may fluctuate as a result of a variety of factors, many of which are outside of our control. A decline in general macroeconomic conditions could adversely affect our customers’ ability or willingness to purchase our application suite, which could adversely affect our operating results or financial outlook. Fluctuations in our quarterly operating results or financial outlook may also be due to a number of additional factors, including the risks and uncertainties discussed elsewhere in this Annual Report.
Fluctuations in our quarterly operating results could cause our stock price to decline rapidly, may lead analysts to change their long-term model for valuing our common stock, could cause us to face short-term liquidity issues, may impact our ability to retain or attract key personnel, or cause other unanticipated issues. If our quarterly operating results or financial outlook fall below the expectations of research analysts or investors, the price of our common stock could decline substantially.
We believe that our quarterly revenue and operating results may vary significantly in the future and that period-to-period comparisons of our operating results may not be meaningful. You should not rely on the results of one quarter as an indication of future performance.
Our limited operating history makes it difficult to evaluate our current business and future prospects, and may increase the risk of your investment.
Our company has been in existence since 1998, and much of our growth has occurred since 2004, with our revenue increasing from $17.7 million during the year ended December 31, 2004 to $108.5 million during the year ended December 31, 2007. Our limited operating history may make it difficult to evaluate our current business and our future prospects. We have encountered and will continue to encounter risks and difficulties frequently experienced by growing companies in rapidly changing industries. If we do not address these risks successfully, our business may be harmed.
We use a single data center to deliver our services. Any disruption of service at this facility could interrupt or delay our ability to deliver our service to our customers.
We host our services and serve all of our customers from a single third-party data center facility with Level 3 Communications located in California. We do not control the operation of this facility. This facility is
15
vulnerable to damage or interruption from earthquakes, hurricanes, floods, fires, terrorist attacks, power losses, telecommunications failures and similar events. Our data facility is located in an area known for seismic activity, increasing our susceptibility to the risk that an earthquake could significantly harm the operations of this facility. It also could be subject to break-ins, computer viruses, sabotage, intentional acts of vandalism and other misconduct. The occurrence of a natural disaster or an act of terrorism, a decision to close the facilities without adequate notice or other unanticipated problems could result in lengthy interruptions in our services. We currently operate and maintain an offsite facility for customers who specifically pay for accelerated disaster recovery services. For customers who do not pay for such services, although we maintain tape backups of their data, we do not operate or maintain a separate disaster recovery facility, which may increase delays in the restoration of our service for those customers.
On December 4, 2007, we entered into an agreement with SAVVIS, a secondary data center facility provider, to provide additional capacity beginning in 2008. We will be transferring our existing data center facility to SAVVIS in 2008. This additional facility may not be operational in a timely manner.
Our data center facility provider has no obligation to renew its agreement with us on commercially reasonable terms, or at all. If we are unable to renew our agreement with the facility provider on commercially reasonable terms, or when we elect to make changes to data center facility providers in order to increase capacity we may experience costs or downtime in connection with the transfer to a new data center facility. There can be no assurance that the transfer of our data services to any such alternative provider will not result in errors, defects, disruptions or other performance problems with our services.
Any errors, defects, disruptions or other performance problems with our services could harm our reputation and may damage our customers’ businesses. Interruptions in our services might reduce our revenue, cause us to issue credits to customers, subject us to potential liability, cause customers to terminate their subscriptions and harm our renewal rates.
We may become liable to our customers and lose customers if we have defects or disruptions in our service or if we provide poor service.
Because we deliver our application suite as a service, errors or defects in the software applications underlying our service, or a failure of our hosting infrastructure, may make our service unavailable to our customers. Since our customers use our suite to manage critical aspects of their business, any errors, defects, disruptions in service or other performance problems with our suite, whether in connection with the day-to-day operation of our suite, upgrades or otherwise, could damage our customers’ businesses. If we have any errors, defects, disruptions in service or other performance problems with our suite, customers could elect not to renew, or delay or withhold payment to us, we could lose future sales or customers may make warranty claims against us, which could result in an increase in our provision for doubtful accounts, an increase in collection cycles for accounts receivable or costly litigation.
Our business depends substantially on customers renewing, upgrading and expanding their subscriptions for our services. Any decline in our customer renewals, upgrades and expansions would harm our future operating results.
We sell our application suite pursuant to service agreements that are generally one year in length. Our customers have no obligation to renew their subscriptions after their subscription period expires, and these subscriptions may not be renewed at the same or higher levels. Moreover, under specific circumstances, our customers have the right to cancel their service agreements before they expire. In addition, in the first year of a subscription, customers often purchase a higher level of professional services than they do in renewal years. As a result, our ability to grow is dependent in part on customers purchasing additional subscriptions and modules after the first year of their subscriptions. We have limited historical data with respect to rates of customer subscription renewals, upgrades and expansions so we may not accurately predict future trends in customer
16
renewals. Our customers’ renewal rates may decline or fluctuate because of several factors, including their satisfaction or dissatisfaction with our services, the prices of our services, the prices of services offered by our competitors or reductions in our customers’ spending levels. If our customers do not renew their subscriptions for our services, renew on less favorable terms, or do not purchase additional functionality or subscriptions, our revenue may grow more slowly than expected or decline and our profitability and gross margins may be harmed.
If our security measures are breached and unauthorized access is obtained to a customer’s data, we may incur significant liabilities, our service may be perceived as not being secure and customers may curtail or stop using our suite.
The services we offer involve the storage of large amounts of our customers’ sensitive and proprietary information. If our security measures are breached as a result of third-party action, employee error, malfeasance or otherwise, and someone obtains unauthorized access to our customers’ data, we could incur significant liability to our customers and to individuals or businesses whose information was being stored by our customers, our business may suffer and our reputation will be damaged. Because techniques used to obtain unauthorized access to, or to sabotage, systems change frequently and generally are not recognized until launched against a target, we may be unable to anticipate these techniques or to implement adequate preventive measures. If an actual or perceived breach of our security occurs, the market perception of the effectiveness of our security measures could be harmed and we could lose sales and customers. Such an actual or perceived breach could also cause a significant and rapid decline in our stock price.
We provide service level commitments to our customers, which could cause us to issue credits for future services if the stated service levels are not met for a given period and could significantly harm our revenue.
Our customer agreements provide service level commitments on a monthly basis. If we are unable to meet the stated service level commitments or suffer extended periods of unavailability for our service, we may be contractually obligated to provide these customers with credits for future services. Our revenue could be significantly impacted if we suffer unscheduled downtime that exceeds the allowed downtimes under our agreements with our customers. In light of our historical experience with meeting our service level commitments, we do not currently have any reserves on our balance sheet for these commitments. Our service level commitment to all customers is 99.5% uptime per period, excluding scheduled maintenance. The failure to meet this level of service availability may require us to credit qualifying customers for the value of an entire month of their subscription fees, not just the value of the subscription fee for the period of the downtime. As a result, a failure to deliver services for a relatively short duration could cause us to issue these credits to all qualifying customers. Any extended service outages could harm our reputation, revenue and operating results.
We have experienced rapid growth in recent periods. If we fail to manage our growth effectively, we may be unable to execute our business plan, maintain high levels of service or address competitive challenges adequately.
We have increased our number of full-time employees from approximately 296 at December 31, 2004 to approximately 675 at December 31, 2007 and have increased our revenue from $17.7 million during the year ended December 31, 2004 to $108.5 million during the year ended December 31, 2007. Our expansion has placed, and our anticipated growth may continue to place, a significant strain on our managerial, administrative, operational, financial and other resources. We intend to further expand our overall business, customer base, headcount and operations. We also intend to continue expanding our operations internationally. Creating a global organization and managing a geographically dispersed workforce will require substantial management effort and significant additional investment in our infrastructure. We will be required to continue to improve our operational, financial and management controls and our reporting procedures and we may not be able to do so effectively. As such, we may be unable to manage our expenses effectively in the future, which may negatively impact our gross margins or operating expenses in any particular quarter.
17
The market in which we participate is intensely competitive, and if we do not compete effectively, our operating results may be harmed.
The markets for ERP, CRM and e-commerce applications are intensely competitive and rapidly changing with relatively low barriers to entry. With the introduction of new technologies and market entrants, we expect competition to intensify in the future. In addition, pricing pressures and increased competition generally could result in reduced sales, reduced margins or the failure of our service to achieve or maintain more widespread market acceptance. Often we compete to sell our application suite against existing systems that our potential customers have already made significant expenditures to install. Competition in our market is based principally upon service breadth and functionality; service performance, security and reliability; ability to tailor and customize services for a specific company, vertical or industry; ease of use of the service; speed and ease of deployment, integration and configuration; total cost of ownership, including price and implementation and support costs; professional services implementation; and financial resources of the vendor.
We face competition from both traditional software vendors and SaaS providers. Our principal competitors include Epicor Software Corporation, Intuit Inc., Microsoft Corporation, SAP, The Sage Group plc and salesforce.com, inc. Many of our actual and potential competitors enjoy substantial competitive advantages over us, such as greater name recognition, longer operating histories, more varied products and services and larger marketing budgets, as well as substantially greater financial, technical and other resources. In addition, many of our competitors have established marketing relationships and access to larger customer bases, and have major distribution agreements with consultants, system integrators and resellers. If we are not able to compete effectively, our operating results will be harmed.
Our brand name and our business may be harmed by aggressive marketing strategies of our competitors.
Because of the early stage of development of our markets, we believe that building and maintaining brand recognition and customer goodwill is critical to our success. Our efforts in this area have, on occasion, been complicated by the marketing efforts of our competitors, which may include incomplete, inaccurate and false statements about our company and our services that could harm our business. Our ability to respond to our competitors’ misleading marketing efforts may be limited under certain circumstances by legal prohibitions on permissible public communications by us as a public company.
Many of our customers are price sensitive, and if the prices we charge for our services are unacceptable to our customers, our operating results will be harmed.
Many of our customers are price sensitive, and we have limited experience with respect to determining the appropriate prices for our services. As the market for our services matures, or as new competitors introduce new products or services that compete with ours, we may be unable to renew our agreements with existing customers or attract new customers at the same price or based on the same pricing model as previously used. As a result, it is possible that competitive dynamics in our market may require us to change our pricing model or reduce our prices, which could harm our revenue, gross margin and operating results.
If we do not effectively expand and train our direct sales force and our services and support teams, we may be unable to add new customers and retain existing customers.
We plan to continue to expand our direct sales force and our services and support teams both domestically and internationally to increase our customer base and revenue. We believe that there is significant competition for direct sales, service and support personnel with the skills and technical knowledge that we require. Our ability to achieve significant revenue growth will depend, in large part, on our success in recruiting, training and retaining sufficient numbers of personnel to support our growth. New hires require significant training and, in most cases, take significant time before they achieve full productivity. Our recent hires and planned hires may not become as productive as we expect, and we may be unable to hire or retain sufficient numbers of qualified individuals in the markets where we do business. If these expansion efforts are not successful or do not generate a corresponding increase in revenue, our business will be harmed.
18
If we are unable to develop new services or sell our services into new markets, our revenue growth will be harmed and we may not be able to achieve profitability.
Our ability to attract new customers and increase revenue from existing customers will depend in large part on our ability to enhance and improve our existing application suite and to introduce new services and sell into new markets. The success of any enhancement or new service depends on several factors, including the timely completion, introduction and market acceptance of the enhancement or service. Any new service we develop or acquire may not be introduced in a timely or cost-effective manner and may not achieve the broad market acceptance necessary to generate significant revenue. Any new markets into which we attempt to sell our application, including new vertical markets and new countries or regions, may not be receptive. If we are unable to successfully develop or acquire new services, enhance our existing services to meet customer requirements or sell our services into new markets, our revenue will not grow as expected and we may not be able to achieve profitability.
Because we are a global organization and our long-term success depends, in part, on our ability to expand the sales of our services to customers located outside of the United States, our business is susceptible to risks associated with international sales and operations.
We currently maintain offices outside of the United States and have sales personnel or independent consultants in several countries. We have limited experience operating in foreign jurisdictions and are rapidly building our international operations. Managing a global organization is difficult, time consuming and expensive. Our inexperience in operating our business outside of the United States increases the risk that any international expansion efforts that we may undertake will not be successful. In addition, conducting international operations subjects us to new risks that we have not generally faced in the United States. These risks include:
| | • | | localization of our services, including translation into foreign languages and adaptation for local practices and regulatory requirements; |
| | • | | lack of familiarity with and unexpected changes in foreign regulatory requirements; |
| | • | | longer accounts receivable payment cycles and difficulties in collecting accounts receivable; |
| | • | | difficulties in managing and staffing international operations; |
| | • | | fluctuations in currency exchange rates; |
| | • | | potentially adverse tax consequences, including the complexities of foreign value added tax systems and restrictions on the repatriation of earnings; |
| | • | | dependence on certain third parties, including channel partners with whom we do not have extensive experience; |
| | • | | the burdens of complying with a wide variety of foreign laws and legal standards; |
| | • | | increased financial accounting and reporting burdens and complexities; |
| | • | | political, social and economic instability abroad, terrorist attacks and security concerns in general; and |
| | • | | reduced or varied protection for intellectual property rights in some countries. |
Operating in international markets also requires significant management attention and financial resources. The investment and additional resources required to establish operations and manage growth in other countries may not produce desired levels of revenue or profitability.
We rely on third-party software, including Oracle database software, that may be difficult to replace or which could cause errors or failures of our service that could lead to lost customers or harm to our reputation.
We rely on software licensed from third parties to offer our service, including database software from Oracle. This software may not continue to be available to us on commercially reasonable terms, or at all. Any
19
loss of the right to use any of this software could result in delays in the provisioning of our service until equivalent technology is either developed by us, or, if available, is identified, obtained and integrated, which could harm our business. Any errors or defects in third-party software could result in errors or a failure of our service which could harm our business.
Assertions by a third party that we infringe its intellectual property, whether successful or not, could subject us to costly and time-consuming litigation or expensive licenses.
The software and technology industries are characterized by the existence of a large number of patents, copyrights, trademarks and trade secrets and by frequent litigation based on allegations of infringement or other violations of intellectual property rights. As we face increasing competition, the possibility of intellectual property rights claims against us may grow. Our technologies may not be able to withstand any third-party claims or rights against their use. Additionally, although we have licensed from other parties proprietary technology covered by patents, we cannot be certain that any such patents will not be challenged, invalidated or circumvented. Furthermore, many of our service agreements require us to indemnify our customers for certain third-party intellectual property infringement claims, which could increase our costs as a result of defending such claims and may require that we pay damages if there were an adverse ruling related to any such claims. These types of claims could harm our relationships with our customers, may deter future customers from subscribing to our services or could expose us to litigation for these claims. Even if we are not a party to any litigation between a customer and a third party, an adverse outcome in any such litigation could make it more difficult for us to defend our intellectual property in any subsequent litigation in which we are a named party.
Any intellectual property rights claim against us or our customers, with or without merit, could be time-consuming, expensive to litigate or settle and could divert management attention and financial resources. An adverse determination also could prevent us from offering our suite to our customers and may require that we procure or develop substitute services that do not infringe.
For any intellectual property rights claim against us or our customers, we may have to pay damages or stop using technology found to be in violation of a third party’s rights. We may have to seek a license for the technology, which may not be available on reasonable terms, if at all, may significantly increase our operating expenses or may require us to restrict our business activities in one or more respects. As a result, we may also be required to develop alternative non-infringing technology, which could require significant effort and expense.
Our success depends in large part on our ability to protect and enforce our intellectual property rights.
We rely on a combination of patent, copyright, service mark, trademark and trade secret laws, as well as confidentiality procedures and contractual restrictions, to establish and protect our proprietary rights, all of which provide only limited protection. We cannot assure you that any patents will issue from our currently pending patent applications in a manner that gives us the protection that we seek, if at all, or that any future patents issued to us will not be challenged, invalidated or circumvented. We do not have any issued patents and currently have eight patent applications pending. Any patents that may issue in the future from pending or future patent applications may not provide sufficiently broad protection or they may not prove to be enforceable in actions against alleged infringers. Also, we cannot assure you that any future service mark or trademark registrations will be issued for pending or future applications or that any registered service marks or trademarks will be enforceable or provide adequate protection of our proprietary rights.
We endeavor to enter into agreements with our employees and contractors and agreements with parties with whom we do business to limit access to and disclosure of our proprietary information. The steps we have taken, however, may not prevent unauthorized use or the reverse engineering of our technology. Moreover, others may independently develop technologies that are competitive to ours or infringe our intellectual property. Enforcement of our intellectual property rights also depends on our successful legal actions against these infringers, but these actions may not be successful, even when our rights have been infringed.
20
Furthermore, effective patent, trademark, service mark, copyright and trade secret protection may not be available in every country in which our services are available. In addition, the legal standards relating to the validity, enforceability and scope of protection of intellectual property rights in Internet-related industries are uncertain and still evolving.
If we fail to maintain proper and effective internal controls or are unable to remediate the material weakness in our internal controls, our ability to produce accurate and timely financial statements could be impaired and investors’ views of us could be harmed.
Ensuring that we have adequate internal financial and accounting controls and procedures in place so that we can produce accurate financial statements on a timely basis is a costly and time-consuming effort that needs to be re-evaluated frequently. Our internal control over financial reporting is a process designed to provide reasonable assurance regarding the reliability of financial reporting and the preparation of financial statements in accordance with generally accepted accounting principles. We are in the process of documenting, reviewing and improving our internal controls and procedures for compliance with Section 404 of the Sarbanes-Oxley Act of 2002, or the Sarbanes-Oxley Act, which requires annual management assessment of the effectiveness of our internal control over financial reporting and a report by our independent auditors on our internal control over financial reporting. Both we and our independent auditors will be testing our internal controls in connection with the audit of our financial statements for the year ending December 31, 2008 and, as part of that documentation and testing, identifying areas for further attention and improvement.
Based upon an evaluation performed as of June 30, 2007, we and our independent registered public accounting firm identified a material weakness in our internal controls. The material weakness related to the need for additional finance and accounting personnel who possess the skill sets necessary to operate and report as a public company, specifically the skills necessary to ensure that adequate review of critical account reconciliations is performed, that supporting documentation is complete, and that transactions are recorded accurately and in accordance with generally accepted accounting principles.
After the identification of the material weakness we implemented a remediation plan during 2007 to address the weakness. These remedial steps will need to be placed in operation for a sufficient period of time before we can evaluate the overall effectiveness of our remediation plan and be able to conclude that the material weakness has been remediated.
An evaluation was performed by management, with the participation of our Chief Executive Officer (“CEO”) and our Chief Financial Officer (“CFO”), of the effectiveness of our disclosure controls and procedures as of December 31, 2007. Based on that evaluation, our management determined that the previously identified material weakness had not yet been fully remediated as of December 31, 2007. Due to existence of this unremediated material weakness, our disclosure controls and procedures were deemed to be ineffective.
Implementing any additional required changes to our internal controls may distract our officers and employees, entail substantial costs to modify our existing processes and add personnel and take significant time to complete. These changes may not, however, be effective in remediating the material weakness and maintaining the adequacy of our internal controls, and any failure to remediate the material weakness or maintain that adequacy, or consequent inability to produce accurate financial statements on a timely basis, could increase our operating costs and harm our business. In addition, investors’ perceptions that our internal controls are inadequate or that we are unable to produce accurate financial statements on a timely basis may harm our stock price and make it more difficult for us to effectively market and sell our service to new and existing customers.
21
Because we recognize subscription revenue over the term of the applicable agreement, the lack of subscription renewals or new service agreements may not be reflected immediately in our operating results.
The majority of our quarterly revenue is attributable to service agreements entered into during previous quarters. A decline in new or renewed service agreements in any one quarter will not be fully reflected in our revenue in that quarter but will harm our revenue in future quarters. As a result, the effect of significant downturns in sales and market acceptance of our services in a particular quarter may not be fully reflected in our operating results until future periods. Our subscription model also makes it difficult for us to rapidly increase our revenue through additional sales in any period, because revenue from new customers must be recognized over the applicable subscription term.
Material defects or errors in the software we use to deliver our services could harm our reputation, result in significant costs to us and impair our ability to sell our services.
The software applications underlying our services are inherently complex and may contain material defects or errors, particularly when first introduced or when new versions or enhancements are released. We have from time to time found defects in our service, and new errors in our existing service may be detected in the future. Any defects that cause interruptions to the availability of our services could result in:
| | • | | a reduction in sales or delay in market acceptance of our services; |
| | • | | sales credits or refunds to our customers; |
| | • | | loss of existing customers and difficulty in attracting new customers; |
| | • | | diversion of development resources; |
| | • | | harm to our reputation; and |
| | • | | increased warranty and insurance costs. |
After the release of our services, defects or errors may also be identified from time to time by our internal team and by our customers. The costs incurred in correcting any material defects or errors in our services may be substantial and could harm our operating results.
Government regulation of the Internet and e-commerce is evolving, and unfavorable changes or our failure to comply with regulations could harm our operating results.
As Internet commerce continues to evolve, increasing regulation by federal, state or foreign agencies becomes more likely. For example, we believe increased regulation is likely in the area of data privacy, and laws and regulations applying to the solicitation, collection, processing or use of personal or consumer information could affect our customers’ ability to use and share data, potentially reducing demand for ERP, CRM and e-commerce solutions and restricting our ability to store, process and share our customers’ data. In addition, taxation of services provided over the Internet or other charges imposed by government agencies or by private organizations for accessing the Internet may also be imposed. Any regulation imposing greater fees for Internet use or restricting information exchange over the Internet could result in a decline in the use of the Internet and the viability of Internet-based services, which could harm our business and operating results.
Privacy concerns and laws or other domestic or foreign regulations may reduce the effectiveness of our application suite and harm our business.
Our customers can use our service to store personal or identifying information regarding their customers and contacts. Federal, state and foreign government bodies and agencies, however, have adopted or are considering adopting laws and regulations regarding the collection, use and disclosure of personal information obtained from consumers and other individuals. The costs of compliance with, and other burdens imposed by, such laws and
22
regulations that are applicable to the businesses of our customers may limit the use and adoption of our service and reduce overall demand for it.
In addition to government activity, privacy advocacy groups and the technology and other industries are considering various new, additional or different self-regulatory standards that may place additional burdens on us. If the gathering of personal information were to be curtailed, ERP, CRM and e-commerce solutions would be less effective, which may reduce demand for our service and harm our business.
Our operating results may be harmed if we are required to collect sales taxes for our subscription service in jurisdictions where we have not historically done so.
In 2007, we began to collect sales tax from our customers and remit such taxes in states where we believe we are required to do so. However, additional states or one or more countries may seek to impose sales or other tax collection obligations on us, including for past sales by us or our resellers and other channel partners. We have recorded sales tax liabilities of $1.2 million, $2.0 million and $1.9 million for the years ended December 31, 2005, 2006 and 2007, respectively, in respect of sales and use tax liabilities in various states and local jurisdictions. A successful assertion that we should be collecting additional sales or other taxes on our service could result in substantial tax liabilities for past sales, discourage customers from purchasing our application or otherwise harm our business and operating results.
Changes in financial accounting standards or practices may cause adverse, unexpected financial reporting fluctuations and harm our operating results.
A change in accounting standards or practices could harm our operating results and may even affect our reporting of transactions completed before the change is effective. New accounting pronouncements and varying interpretations of accounting pronouncements have occurred and may occur in the future. Changes to existing rules or the questioning of current practices may harm our operating results or the way we conduct our business. For example, on December 16, 2004, the Financial Accounting Standards Board, or FASB, issued Statement of Financial Accounting Standards No. 123 (revised 2004), “Share-Based Payment,” or SFAS No. 123(R). SFAS No. 123(R), which became effective for fiscal periods beginning after June 15, 2005, requires that employee stock-based compensation be measured based on its fair-value on the grant date and treated as an expense that is reflected in the financial statements over the related service period. As a result of SFAS No. 123(R), our operating results in 2006 and 2007 reflect expenses that are not reflected in prior periods, making it more difficult for investors to evaluate our 2006 and 2007 operating results relative to prior periods.
Unanticipated changes in our effective tax rate could harm our future operating results.
We are subject to income taxes in the United States and various foreign jurisdictions, and our domestic and international tax liabilities are subject to the allocation of expenses in differing jurisdictions. Our tax rate is affected by changes in the mix of earnings and losses in countries with differing statutory tax rates, certain non-deductible expenses arising from the new requirement to expense stock options and the valuation of deferred tax assets and liabilities, including our ability to utilize our net operating losses. Increases in our effective tax rate could harm our operating results.
23
We may acquire or invest in other companies, which may divert our management’s attention, result in additional dilution to our stockholders and consume resources that are necessary to sustain our business.
We may in the future seek to acquire or invest in businesses, products, technologies or other assets. We also may enter into relationships with other businesses to expand our service offerings or our ability to provide service in foreign jurisdictions, which could involve preferred or exclusive licenses, additional channels of distribution, discount pricing or investments in other companies. Negotiating these transactions can be time-consuming, difficult and expensive, and our ability to close these transactions may often be subject to approvals that are beyond our control. Consequently, these transactions, even if undertaken and announced, may not close.
An acquisition, investment or business relationship may result in unforeseen operating difficulties and expenditures. In particular, we may encounter difficulties assimilating or integrating the businesses, technologies, products, personnel or operations of the acquired companies, particularly if the key personnel of the acquired company choose not to work for us, the company’s software is not easily adapted to work with ours or we have difficulty retaining the customers of any acquired business due to changes in management or otherwise. Acquisitions may also disrupt our business, divert our resources and require significant management attention that would otherwise be available for development of our business. Moreover, the anticipated benefits of any acquisition, investment or business relationship may not be realized or we may be exposed to unknown liabilities. For one or more of those transactions, we may:
| | • | | issue additional equity securities that would dilute our stockholders; |
| | • | | use cash that we may need in the future to operate our business; |
| | • | | incur debt on terms unfavorable to us or that we are unable to repay; |
| | • | | incur large charges or substantial liabilities; |
| | • | | encounter difficulties retaining key employees of the acquired company or integrating diverse software codes or business cultures; and |
| | • | | become subject to adverse tax consequences, substantial depreciation or deferred compensation charges. |
Any of these risks could harm our business and operating results.
We rely on our management team and need additional personnel to grow our business, and the loss of one or more key employees or our inability to attract and retain qualified personnel could harm our business.
Our success and future growth depends to a significant degree on the skills and continued services of our management team, especially Zachary Nelson, our President and Chief Executive Officer, and Evan M. Goldberg, our Chief Technology Officer and Chairman of the Board. We do not maintain key man insurance on any members of our management team, including Messrs. Nelson and Goldberg. Our future success also depends on our ability to attract, retain and motivate highly skilled technical, managerial, sales, marketing and service and support personnel, including members of our management team. Competition for sales, marketing and technology development personnel is particularly intense in the software and technology industries. As a result, we may be unable to successfully attract or retain qualified personnel. Our inability to attract and retain the necessary personnel could harm our business.
24
Risks Related to Ownership of our Common Stock
Lawrence J. Ellison or members of his family, and related entities, beneficially own a majority of our outstanding shares of common stock, which may limit your ability to influence or control certain of our corporate actions. This concentration of ownership may also reduce the market price of our common stock and impair a takeover attempt of us.
Entities beneficially owned by Lawrence J. Ellison hold an aggregate of approximately 53.9% of our common stock as of December 31, 2007. Further, Mr. Ellison, his family members, trusts for their benefit, and related entities together beneficially own an aggregate of approximately 65.3% of our common stock as of December 31, 2007. Mr. Ellison is able to exercise control over approval of significant corporate transactions, including a change of control or liquidation. In addition, if the voting restrictions that apply to NetSuite Restricted Holdings LLC, the investment entity to which Mr. Ellison has transferred his shares, lapse or are amended, Mr. Ellison will be able to exercise control over additional corporate matters, including elections of our directors. So long as Mr. Ellison continues to be either an officer or director of Oracle, these voting restrictions cannot be changed without the approval of an independent committee of Oracle’s board of directors. Mr. Ellison’s interests and investment objectives may differ from our other stockholders. Mr. Ellison is also the Chief Executive Officer, a principal stockholder and a director of Oracle Corporation. Oracle supplies us with database software on which we rely to provide our service and is also a potential competitor of ours.
Our board of directors adopted resolutions, which renounce and provide for a waiver of the corporate opportunity doctrine as it relates to Mr. Ellison. As a result, Mr. Ellison will have no fiduciary duty to present corporate opportunities to us. In addition, Mr. Ellison’s indirect majority interest in us could discourage potential acquirers or result in a delay or prevention of a change in control of our company or other significant corporate transactions, even if a transaction of that sort would be beneficial to our other stockholders or in our best interest.
We are a “controlled company” within the meaning of the rules of the New York Stock Exchange and, as a result, will qualify for exemptions from certain corporate governance requirements.
Because a majority of our common stock is held by a single stockholder, we qualify for exemptions from certain corporate governance standards. Under the rules of the New York Stock Exchange, a company of which more than 50% of the voting power is held by a single person or a group of persons is a “controlled company” and may elect not to comply with certain corporate governance requirements, including (1) the requirement that a majority of the board of directors consist of independent directors, (2) the requirement that the compensation of officers be determined, or recommended to the board of directors for determination, by a majority of the independent directors or a compensation committee comprised solely of independent directors and (3) the requirement that director nominees be selected, or recommended for the board of directors’ selection, by a majority of the independent directors or a nominating committee comprised solely of independent directors with a written charter or board resolution addressing the nomination process.
We incur significant costs and demands upon management as a result of complying with the laws and regulations affecting public companies, which could harm our operating results.
As a public company, we incur significant legal, accounting and other expenses that we did not incur as a private company, including costs associated with public company reporting requirements. We also have incurred and will incur costs associated with current corporate governance requirements, including requirements under Section 404 and other provisions of the Sarbanes-Oxley Act, as well as rules implemented by the SEC and New York Stock Exchange, Inc. The expenses incurred by public companies for reporting and corporate governance purposes have increased dramatically. We expect these rules and regulations to substantially increase our legal and financial compliance costs and to make some activities more time-consuming and costly. We are unable to currently estimate these costs with any degree of certainty. We also expect these new rules and regulations may make it more difficult and more expensive for us to obtain director and officer liability insurance, and we may be required to accept reduced policy limits and coverage or incur substantially higher costs to obtain the same or
25
similar coverage than used to be available. As a result, it may be more difficult for us to attract and retain qualified individuals to serve on our board of directors or as our executive officers.
Our failure to raise additional capital or generate the cash flows necessary to expand our operations and invest in our application could reduce our ability to compete successfully.
We may need to raise additional funds, and we may not be able to obtain additional debt or equity financing on favorable terms, if at all. If we raise additional equity financing, our stockholders may experience significant dilution of their ownership interests and the per share value of our common stock could decline. If we engage in debt financing, we may be required to accept terms that restrict our ability to incur additional indebtedness and force us to maintain specified liquidity or other ratios. If we need additional capital and cannot raise it on acceptable terms, we may not be able to, among other things:
| | • | | develop or enhance our application and services; |
| | • | | continue to expand our product development, sales and marketing organizations; |
| | • | | acquire complementary technologies, products or businesses; |
| | • | | expand operations, in the United States or internationally; |
| | • | | hire, train and retain employees; or |
| | • | | respond to competitive pressures or unanticipated working capital requirements. |
Future sales of shares by existing stockholders could cause our stock price to decline.
If our existing stockholders sell or otherwise dispose of, or indicate an intention to sell or dispose of, substantial amounts of our common stock in the public market after the lock-up and other legal restrictions on resale to which they are subject lapse, the trading price of our common stock could decline. Based on shares of common stock outstanding as of December 31, 2007, we have outstanding a total of 60,175,567 shares of common stock, of which 7,130,000 are freely tradable, without restriction, in the public market. The managing underwriter of our initial public offering, however, may, in its sole discretion, permit our officers, directors and other current stockholders who are subject to the contractual lock-up to sell or otherwise dispose of shares before the lock-up agreements expire.
We expect that the lock-up agreements pertaining to our initial public offering will expire on June 16, 2008 (subject to extension upon the occurrence of specified events). After the lock-up agreements expire, up to an additional 53,045,567 shares of common stock will be eligible for sale in the public market, 52,270,226 of which shares are held by directors, executive officers and other affiliates and will be subject to volume limitations under Rule 144 under the Securities Act of 1933, as amended, or the Securities Act, and various vesting agreements. In addition, shares of common stock that are either subject to outstanding options or reserved for future issuance under our employee benefit plans will become eligible for sale in the public market to the extent permitted by the provisions of various vesting agreements, the lock-up agreements and Rule 144 and Rule 701 under the Securities Act. If these additional shares of common stock are sold, or if it is perceived that they will be sold, in the public market, the trading price of our common stock could decline.
Anti-takeover provisions contained in our amended and restated certificate of incorporation and amended and restated bylaws, as well as provisions of Delaware law, could impair a takeover attempt.
Our amended and restated certificate of incorporation, amended and restated bylaws and Delaware law contain provisions that could have the effect of rendering more difficult or discouraging an acquisition deemed undesirable by our board of directors. Our corporate governance documents include provisions:
| | • | | authorizing blank check preferred stock, which could be issued with voting, liquidation, dividend and other rights superior to our common stock; |
26
| | • | | limiting the liability of, and providing indemnification to, our directors and officers; |
| | • | | limiting the ability of our stockholders to call and bring business before special meetings and to take action by written consent in lieu of a meeting; |
| | • | | requiring advance notice of stockholder proposals for business to be conducted at meetings of our stockholders and for nominations of candidates for election to our board of directors; |
| | • | | controlling the procedures for the conduct and scheduling of board and stockholder meetings; |
| | • | | providing the board of directors with the express power to postpone previously scheduled annual meetings and to cancel previously scheduled special meetings; |
| | • | | limiting the determination of the number of directors on our board and the filling of vacancies or newly created seats on the board to our board of directors then in office; and |
| | • | | providing that directors may be removed by stockholders only for cause. |
These provisions, alone or together, could delay hostile takeovers and changes in control or changes in our management.
As a Delaware corporation, we are also subject to provisions of Delaware law, including Section 203 of the Delaware General Corporation law, which prevents some stockholders holding more than 15% of our outstanding common stock from engaging in certain business combinations without approval of the holders of substantially all of our outstanding common stock. Under Section 203, our majority stockholder, which is beneficially owned by Lawrence J. Ellison, and our current stockholders associated with members of Mr. Ellison’s family are not subject to the prohibition from engaging in such business combinations.
Any provision of our amended and restated certificate of incorporation or bylaws or Delaware law that has the effect of delaying or deterring a change in control could limit the opportunity for our stockholders to receive a premium for their shares of our common stock, and could also affect the price that some investors are willing to pay for our common stock.
| ITEM 1B. | UNRESOLVED STAFF COMMENTS |
None.
Our corporate headquarters is located in San Mateo, California and comprise approximately 59,000 square feet of space leased through 2012. Our largest international office is in Toronto, Canada and comprises 63,000 square feet of space. In addition, we maintain offices in Denver, Australia, Japan, the Philippines, Singapore and the United Kingdom.
We believe that our existing properties are in good condition and are suitable for the conduct of our business. As our existing leases expire and as we continue to expand our operations, we believe that suitable space will be available to us on commercially reasonable terms.
From time to time, we are involved in various legal proceedings arising from the normal course of business activities. We are not presently a party to any litigation the outcome of which, we believe, if determined adversely to us, would individually or in the aggregate have a material adverse effect on our business, operating results or financial condition.
27
| ITEM 4. | SUBMISSION OF MATTERS TO A VOTE OF SECURITY HOLDERS |
On November 29, 2007, we distributed a written consent to our stockholders requesting approval of the following matters in connection with our initial public offering, or IPO: (1) the amendment and restatement of our Certificate of Incorporation, which included a reverse stock split of 1:20, which became effective prior to the closing of our IPO, (2) the further amendment and restatement of our Certificate of Incorporation, which became effective upon the closing of our IPO, (3) the amendment and restatement of our Bylaws to provide certain changes consistent with our becoming a public company that became effective upon the closing of our IPO, (4) adoption of our public company form of Indemnification Agreement, (5) the adoption of our 2007 Equity Incentive Plan, (6) in connection with his agreement to place shares into an LLC with restricted voting rights, a waiver of the corporate opportunity doctrine as it may have applied to Lawrence J. Ellison, who beneficially owns our majority stockholder, (7) the election of our board of directors, and (8) the selection of KPMG LLP as our independent registered public accounting firm for the fiscal year ending December 31, 2007. 53,330,801 shares of our capital stock were eligible to vote on these matters. All matters were approved, with written consents from stockholders holding an aggregate of 50,629,894 shares of our capital stock voting in favor of all of these matters were received by us. Stockholders holding an aggregate of 2,700,907 shares of our capital stock did not vote on such matters.
On November 13, 2007, we distributed a written consent to our stockholders requesting approval of our reincorporation into Delaware by way of merger with a wholly-owned subsidiary. 53,330,801 shares of our capital stock were eligible to vote on these matters. The matter was approved by stockholders holding an aggregate of 32,450,334 shares of our capital stock. Stockholders holding an aggregate of 20,880,467 shares of our capital stock did not vote on this matter.
28
PART II
| ITEM 5. | MARKET FOR THE REGISTRANT’S COMMON EQUITY, RELATED STOCKHOLDER MATTERS AND ISSUER PURCHASES OF EQUITY SECURITIES |
Market Information for Common Stock
Our common stock has been quoted on the New York Stock Exchange under the symbol “N” since our initial public offering on December 20, 2007. Prior to that time, there was no public market for our common stock.
The following table sets forth for the indicated periods the high and low sales prices of our common stock as reported by the New York Stock Exchange.
| | | | | | |
| | | High | | Low |
Fourth Quarter 2007 (from December 20, 2007) | | $ | 45.98 | | $ | 23.86 |
The last reported sale price for our common stock on the New York Stock Exchange was $24.12 per share on March 24, 2008.
Dividend Policy
We have never paid any cash dividends on our common stock. Our board of directors currently intends to retain any future earnings to support operations and to finance the growth and development of our business and does not intend to pay cash dividends on our common stock for the foreseeable future. Any future determination related to our dividend policy will be made at the discretion of our board.
Stockholders
As of February 29, 2008, there were 470 registered stockholders of record of our common stock.
29
Stock Performance Graph
The graph set forth below compares the cumulative total stockholder return on our common stock between December 20, 2007 (the date of our initial public offering) and December 31, 2007, with the cumulative total return of (i) the Nasdaq Composite Index and (ii) the Nasdaq Computer Index, over the same period. This graph assumes the investment of $100 on December 20, 2007 in our common stock, the Nasdaq Composite Index and the Nasdaq Computer Index, and assumes the reinvestment of dividends, if any. The graph assumes the initial value of our common stock on December 20, 2007 was the IPO price of $26.00 per share.
The comparisons shown in the graph below are based upon historical data. We caution that the stock price performance shown in the graph below is not necessarily indicative of, nor is it intended to forecast, the potential future performance of our common stock.
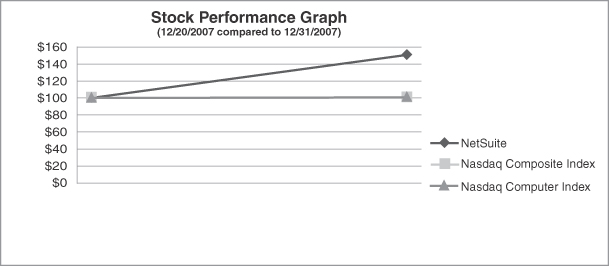
| | | | | | |
| | | 12/20/07 | | 12/31/07 |
NetSuite | | $ | 100.00 | | $ | 150.69 |
Nasdaq Composite Index | | $ | 100.00 | | $ | 100.43 |
Nasdaq Computer Index | | $ | 100.00 | | $ | 100.91 |
30
Recent Sales of Unregistered Securities
Sales of Unregistered Securities
1. From January 1, 2007 through December 31, 2007, we granted to our employees and consultants options to purchase an aggregate of 2,747,448 shares of our common stock under our 1999 Stock Plan at exercise prices ranging from $7.00 to $14.50 per share for an aggregate purchase price of $34,830,354.
2. From January 1, 2007 through December 31, 2007, we sold and issued to our employees and consultants an aggregate of 522,124 shares of our common stock pursuant to option exercises under our 1999 Stock Plan at exercise prices ranging from $0.20 to $12.40 per share for an aggregate purchase price of $1,187,545.
The issuance of the above securities were deemed to be exempt from registration under the Securities Act with respect to items 1 and 2 above in reliance on Section 4(2) of the Securities Act or Rule 701 promulgated under Section 3(b) of the Securities Act. The recipients of securities in each such transaction represented their intention to acquire the securities for investment only and not with a view to or for sale in connection with any distribution thereof and appropriate legends were affixed to the stock certificates and option agreements issued in such transactions. All recipients had adequate access, through their relationships with us, to information about us.
Use of Proceeds from Public Offering of Common Stock
In December 2007, we completed our IPO pursuant to a registration statement on Form S-1 (Registration No. 333-144257), which the SEC declared effective on December 19, 2007. Under the registration statement, we registered the offering and sale of an aggregate of 6,765,000 shares of our common stock, and another 365,000 shares of our common stock sold by selling stockholders. The offering did not terminate until after the sale of all of the shares registered on the registration statement. All of the shares of common stock issued pursuant to the registration statement, including the shares sold by the selling stockholders, were sold at a price to the public of $26.00 per share. The managing underwriters were Credit Suisse Securities (USA) LLC and W.R. Hambrecht + Co., LLC.
As a result of the IPO, we raised a total of $175.9 million in gross proceeds, or approximately $161.9 million in net proceeds after deducting underwriting discounts and commissions of $10.1 million and offering expenses of $3.9 million. No payments for such expenses were made directly or indirectly to (i) any of our officers or directors or their associates, (ii) any persons owning 10% or more of any class of our equity securities, or (iii) any of our affiliates. We did not receive any proceeds from the sale of shares in the IPO by the selling stockholders.
We used the net proceeds of the offering to retire the outstanding balance and close the secured line of credit with Tako Ventures. We intend to invest the remaining net proceeds in short-term, interest-bearing investment grade securities. We plan to use the net proceeds for capital expenditures of approximately $10 million to $15 million, including the purchase of property, plant and equipment and the addition of a second data center facility, and for working capital and other general purposes, including the expansion of our business internationally. We may also use a portion of the net proceeds from the offering to acquire other businesses, products or technologies.
Purchases of Equity Securities by the Issuer and Affiliated Purchasers
None.
31
| ITEM 6. | SELECTED FINANCIAL DATA |
The following selected consolidated financial data should be read in conjunction with our audited consolidated financial statements and related notes thereto and with Management’s Discussion and Analysis of Financial Condition and Results of Operations which are included elsewhere in this Annual Report. The consolidated statement of operations data for the years ended December 31, 2005, 2006 and 2007 and the selected consolidated balance sheet data as of December 31, 2006 and 2007 are derived from, and are qualified by reference to, the audited consolidated financial statements included in this Annual Report. The consolidated statement of operations data for the year ended December 31, 2004 and the consolidated balance sheet data as of December 31, 2004 and 2005 are derived from audited consolidated financial statements which are not included in this Annual Report. The consolidated statement of operations data for the year ended December 31, 2003 and the consolidated balance sheet data as of December 31, 2003 are unaudited.
| | | | | | | | | | | | | | | | | | | | |
| | | Year Ended December 31, | |
| | | 2003
(unaudited) | | | 2004 | | | 2005 | | | 2006 | | | 2007 | |
| | | (In thousands, except per share data) | |
Condensed Consolidated Statements of Operations Data: | | | | | | | | | | | | | | | | | | | | |
Revenue | | $ | 8,345 | | | $ | 17,684 | | | $ | 36,356 | | | $ | 67,202 | | | $ | 108,541 | |
Cost of revenue (1) | | | 5,871 | | | | 8,191 | | | | 15,607 | | | | 22,993 | | | | 33,766 | |
| | | | | | | | | | | | | | | | | | | | |
Gross profit | | | 2,474 | | | | 9,493 | | | | 20,749 | | | | 44,209 | | | | 74,775 | |
| | | | | | | | | | | | | | | | | | | | |
Operating expenses: | | | | | | | | | | | | | | | | | | | | |
Product development (1) | | | 7,507 | | | | 8,016 | | | | 24,780 | | | | 20,690 | | | | 23,703 | |
Sales and marketing (1) | | | 15,415 | | | | 26,963 | | | | 39,179 | | | | 43,892 | | | | 57,932 | |
General and administrative (1) | | | 2,181 | | | | 3,068 | | | | 13,685 | | | | 14,619 | | | | 16,720 | |
| | | | | | | | | | | | | | | | | | | | |
Total operating expenses | | | 25,103 | | | | 38,047 | | | | 77,644 | | | | 79,201 | | | | 98,355 | |
| | | | | | | | | | | | | | | | | | | | |
Operating loss | | | (22,629 | ) | | | (28,554 | ) | | | (56,895 | ) | | | (34,992 | ) | | | (23,580 | ) |
| | | | | | | | | | | | | | | | | | | | |
Other expense, net, including the effect of minority interest and income taxes | | | (117 | ) | | | (1 | ) | | | (769 | ) | | | (730 | ) | | | (326 | ) |
| | | | | | | | | | | | | | | | | | | | |
Net loss | | $ | (22,746 | ) | | $ | (28,555 | ) | | $ | (57,664 | ) | | $ | (35,722 | ) | | $ | (23,906 | ) |
| | | | | | | | | | | | | | | | | | | | |
Net loss per common share, basic and diluted | | $ | (43.00 | ) | | $ | (41.26 | ) | | $ | (27.99 | ) | | $ | (6.42 | ) | | $ | (2.45 | ) |
| | | | | | | | | | | | | | | | | | | | |
Weighted average number of shares used in computing basic and diluted net loss per common share | | | 529 | | | | 692 | | | | 2,060 | | | | 5,567 | | | | 9,774 | |
| | | | | | | | | | | | | | | | | | | | |
(1) Includes stock-based compensation expense as follows: | |
| | | Year Ended December 31, | |
| | | 2003
(unaudited) | | | 2004 | | | 2005 | | | 2006 | | | 2007 | |
| | | (In thousands) | |
Cost of revenue | | $ | — | | | $ | — | | | $ | — | | | $ | 19 | | | $ | 1,703 | |
Product development | | | — | | | | — | | | | 14,146 | | | | 8,885 | | | | 10,376 | |
Sales and marketing | | | — | | | | — | | | | — | | | | 75 | | | | 2,540 | |
General and administrative | | | — | | | | — | | | | 8,323 | | | | 6,329 | | | | 3,605 | |
| | | | | | | | | | | | | | | | | | | | |
Total stock-based compensation expense | | $ | — | | | $ | — | | | $ | 22,469 | | | $ | 15,308 | | | $ | 18,224 | |
| | | | | | | | | | | | | | | | | | | | |
| |
| | | December 31, | |
| | | 2003
(unaudited) | | | 2004 | | | 2005 | | | 2006 | | | 2007 | |
| | | (In thousands, except per share data) | |
Condensed Consolidated Balance Sheet Data: | | | | | | | | | | | | | | | | | | | | |
Cash and cash equivalents | | $ | 99 | | | $ | 3,532 | | | $ | 1,657 | | | $ | 9,910 | | | $ | 169,408 | |
Working capital, excluding deferred revenue | | | 1,455 | | | | 9,789 | | | | 13,616 | | | | 20,504 | | | | 178,001 | |
Total assets | | | 8,166 | | | | 21,970 | | | | 35,178 | | | | 48,053 | | | | 218,777 | |
Current and long-term debt from related party | | | — | | | | — | | | | 7,250 | | | | 7,013 | | | | — | |
Convertible preferred stock | | | 90,785 | | | | 110,694 | | | | 125,654 | | | | 125,654 | | | | — | |
Total stockholders’ equity (deficit) | | | (98,643 | ) | | | (127,030 | ) | | | (162,642 | ) | | | (177,267 | ) | | | 111,080 | |
32
| ITEM 7. | MANAGEMENT’S DISCUSSION AND ANALYSIS OF FINANCIAL CONDITION AND RESULTS OF OPERATIONS |
This annual report on Form 10-K contains “forward-looking statements” that involve risks and uncertainties, as well as assumptions that, if they never materialize or prove incorrect, could cause our results to differ materially from those expressed or implied by such forward-looking statements. Such forward-looking statements include any expectation of earnings, revenues or other financial items; any statements of the plans, strategies and objectives of management for future operations; factors that may affect our operating results; statements concerning new products or services; statements related to future capital expenditures; statements related to future economic conditions or performance; statements related to our ability to remediate, and the timing of the remediation, of our material weakness; statements as to industry trends and other matters that do not relate strictly to historical facts or statements of assumptions underlying any of the foregoing. These statements are often identified by the use of words such as “anticipate,” “believe,” “continue,” “could,” “estimate,” “expect,” “intend,” “may,” or “will,” and similar expressions or variations. These statements are based on the beliefs and assumptions of our management based on information currently available to management. Such forward-looking statements are subject to risks, uncertainties and other factors that could cause actual results and the timing of certain events to differ materially from future results expressed or implied by such forward-looking statements. Factors that could cause or contribute to such differences include, but are not limited to, those identified below, and those discussed in the section titled “Risk Factors” included in Item 1A of Part I of this annual report on Form 10-K. You should review these risk factors for a more complete understanding of the risks associated with an investment in our securities. All forward-looking statements in this document are based on information available to us as of the date hereof and we undertake no obligation to revise or update any forward-looking statements. The following discussion and analysis should be read in conjunction with our “Selected Consolidated Financial Data” and consolidated financial statements and notes thereto included elsewhere in this annual report on Form 10-K.
Overview
We provide an on-demand suite of integrated business management software services to SMBs and divisions of large companies. Our offerings consist of a single application suite that provides ERP, CRM and e-commerce functionality. We also offer technical support and professional services related to our suite. We deliver our suite over the Internet as a subscription service using the SaaS model. We were incorporated in California in September 1998 and reincorporated in Delaware in November 2007. In 1999, we released our first application, NetLedger, which focused on accounting applications. We then released e-Commerce functionality in 2000 and CRM and sales force automation functionality in 2001. In 2002, we released our next generation suite under the name NetSuite to which we have regularly added features and functionality.
Our revenue has increased from $17.7 million during the year ended December 31, 2004 to $108.5 million during the year ended December 31, 2007. As of December 31, 2007, our accumulated deficit was $244.9 million.
We generate sales directly through our sales team and, to a lesser extent, indirectly through channel partners. As of December 31, 2007, we had over 5,600 active customers, which we define as companies under contract at that date who have used our service within the past quarter. We sell our service to customers across a broad spectrum of industries, and we have tailored our service for wholesalers/distributors, services companies and software companies. The primary target customers for our service are SMBs, which we define as companies with up to 1,000 employees. An increasing percentage of our customers and our revenue has been derived from larger businesses within this market. For the year ended December 31, 2007, we did not have any single customer that accounted for greater than 3% of our revenue.
We sell our suite pursuant to subscription agreements. The duration of these agreements has evolved over time. Prior to 2006, the majority of our revenue was derived from customers who had entered into multi-year
33
agreements. Beginning in 2006, we decided to transition most of our customer agreements to one-year agreements because we believe one-year agreements are more customary in our industry, align more with customer preferences and provide us with a more predictable sales compensation structure. We rely on a large percentage of our customers to renew their agreements to drive our revenue growth. Our customers have no obligation to renew their subscriptions after the expiration of their subscription period. As of December 31, 2007, we had deferred revenue of $68.1 million, which excludes approximately $8.9 million of deferred revenue related to the TCI and MJS agreements discussed below. The deferred revenue represents amounts that have been invoiced to customers and not yet recognized as revenue, not the entire value of the contract.
We expect our product development costs to continue to increase in absolute dollars as we intend to expand and enhance our application suite. Although we expect our cost of revenue and operating expenses to remain relatively stable as a percentage of revenue, we expect that they may vary period-to-period.
Our subscription agreements provide service level commitments of 99.5% uptime per period, excluding scheduled maintenance. The failure to meet this level of service availability may require us to credit qualifying customers up to the value of an entire month of their subscription and support fees. In light of our historical experience with meeting our service level commitments, we do not currently have any reserves on our balance sheet for these commitments.
In 2007, we began to collect sales tax from our customers and remit such taxes in states where we believe we are required to do so. However, additional states or local jurisdictions may seek to impose sales or other tax collection obligations on us, including for past sales by us or our resellers and other channel partners. We have accrued amounts for those states and local jurisdictions where our obligation to pay sales tax on past sales was deemed probable and estimable.
For the years ended December 31, 2005, 2006 and 2007, the percentage of our revenue generated outside of North America was 11%, 14% and 18%, respectively. As part of our overall growth, we expect the percentage of our revenue generated outside of North America to continue to increase as we invest in and enter new markets.
We experience competitive pricing pressure where our products are compared with solutions that address a narrower range of customer needs, or are not fully integrated (for example, when compared with e-commerce or CRM stand-alone solutions). In addition, since we sell primarily to SMBs, we also face pricing pressure in terms of the more limited financial resources or budgetary constraints of many of our target customers. We do not currently experience significant pricing pressure from competitors that offer a similar on-demand integrated business management suite.
In March 2006, we formed a subsidiary, NetSuite Kabushiki Kaisha, or NetSuite KK, to exclusively market and sell our on-demand application suite in Japan. On March 8, 2006, we and NetSuite KK entered into a reseller agreement, a development fund agreement and an investment agreement with TCI. Under the terms of these agreements, TCI paid us $16.5 million, including refundable prepaid royalties of $1.5 million, the unused portions of which are refundable upon the termination or expiration of the agreements, to acquire distribution rights in Japan for three years, a 20% stake in NetSuite KK, and to fund non-recoverable expenses related to localization of our on-demand application service in Japan. On October 20, 2006, we and NetSuite KK entered into similar agreements with MJS. Under the terms of these agreements, MJS paid us $4.1 million, including refundable prepaid royalties of $394,000, the unused portions of which are refundable upon the termination or expiration of the agreements, to acquire distribution rights in Japan for five years, a 5% equity stake in NetSuite KK, and to fund non-recoverable expenses related to localization of our on-demand application service in Japan. In the year ended December 31, 2007, we recognized $2.0 million in revenue related to these agreements. For each of the quarters in 2008, we expect to recognize $1.5 million in revenue related to these agreements. See Note 3 to our Consolidated Financial Statements for a further description of NetSuite KK.
During our review of our financial statements for the three and six months ended June 30, 2007, we and our independent registered public accounting firm identified a material weakness in our internal controls. The
34
material weakness relates to the need for additional finance and accounting personnel who possess the skill sets necessary to operate and report as a public company. We have recruited and are continuing to recruit additional finance and accounting personnel to address this observation. We believe we have made progress in addressing this material weakness and expect to complete the remediation as of March 31, 2008. We do not expect the costs of remediating the material weakness to be material.
For the three months ended June 30, 2007, we incurred non-cash expenses of $1.3 million in connection with the acceleration of vesting of certain options held by two of our named executive officers that were subject to variable accounting. Based upon this acceleration of vesting with respect to these options we will no longer incur stock-based compensation expense related to these options, which was $1.5 million and $0.4 million for the three months ended March 31, 2007 and June 30, 2007, respectively. Including those expenses recognized in connection with the acceleration of the vesting of stock options, our stock-based compensation was $15.3 million and $18.2 million for the years ended December 31, 2006 and 2007, respectively.
During 2008, we expect to incur additional expenses in connection with our international expansion, the localization of our service in new locations and the opening of a second data center facility.
Key Components of Our Results of Operations
Revenue
We deliver our suite over the Internet as a subscription service using the software-as-a-service or on-demand model. In most instances, revenue is generated under sales agreements with multiple elements which are comprised of subscription fees from customers accessing our on-demand application service and professional services and customer support. Our revenue has grown from $17.7 million during the year ended December 31, 2004 to $108.5 million during the year ended December 31, 2007.
We have determined that we do not have objective and reliable evidence of fair value for each element of our sale agreements that contain a subscription to our on-demand application suite and customer support and professional services or both. As a result, the elements within our multiple-element sales agreements do not qualify for treatment as separate units of accounting. Accordingly, we account for fees received under multiple element arrangements as a single unit of accounting and recognize the entire arrangement ratably over the term of the related agreement, commencing upon the later of the agreement start date or when all revenue recognition criteria have been met.
We generally invoice our customers in advance in annual or quarterly installments, and typical payment terms provide that our clients pay us within 30 to 60 days of invoice. Amounts that have been invoiced where the customer has a legal obligation to pay are recorded in accounts receivable and deferred revenue. Prior to 2006, the majority of our revenue was derived from customers who had entered multi-year agreements. Beginning in 2006, we no longer provided incentives to our sales force to sign customers to multi-year agreements and consequently transitioned to predominately signing one-year contracts. The transition from multi-year agreements resulted in a reduction in the balance of non-current deferred revenue.
Cost of Revenue
Cost of revenue primarily consists of costs related to hosting our on-demand application suite, providing customer support, data communications expenses, salaries and benefits of operations and support personnel, software license fees, costs associated with website development activities, allocated overhead, amortization expense associated with capitalized internal use software and related plant and equipment depreciation and amortization expenses. We allocate overhead such as rent, information technology costs and employee benefit costs to all departments based on headcount. As such, general overhead expenses are reflected in each cost of revenue and operating expense category. The cost associated with providing professional services is significantly higher as a percentage of revenue than the cost associated with delivering our on-demand subscription service due to the labor costs associated with providing professional services.
35
We expect cost of revenue to remain relatively stable as a percentage of revenue; however, it could fluctuate period-to-period depending on the growth of our professional services business and any associated increased costs relating to the delivery of professional services and the timing of significant expenditures. Additionally, we expect to add a new data center in 2008, which will further increase our cost of revenue. We may also incur additional expenses associated with the acquisition of additional database software licenses in 2008.
Operating Expenses
Product Development. Product development expenses primarily consist of personnel and related costs for our product development employees and executives, including salaries, employee benefits and allocated overhead. Our product development efforts have been devoted primarily to increasing the functionality and enhancing the ease-of-use of our on-demand application suite. A key component of our strategy is to expand our business internationally. This will require us to conform our application to comply with local regulations and languages, which will cause us to incur additional expenses related to translation and localization of our application for use in other countries. We expect product development expenses to increase in absolute terms as we extend our service offerings in other countries and develop new technologies, but such expenses may vary due to the timing of these offerings and technologies.
Sales and Marketing. Sales and marketing expenses primarily consist of personnel and related costs for our sales and marketing employees and executives, including wages, benefits, bonuses and commissions, commissions paid to our channel partners, the cost of marketing programs such as on-line lead generation, promotional events and webinars, and allocated overhead. We market and sell our suite worldwide through our direct sales organization and indirect distribution channels such as strategic resellers. We capitalize and amortize our direct and channel sales commissions over the period the related revenue is recognized. The commission expense for customer renewals is at lower rates than for sales to new customers. As such, we expect our commission expense to decline as a percentage of revenue going forward as a larger percentage of our recognized revenue is expected to result from customer renewals. We intend to continue to invest in sales and marketing to pursue new customers and expand relationships with existing customers. Our sales and marketing expenses have increased in absolute dollars although they have decreased as a percentage of total revenue over the past three years. We expect our sales and marketing expenses to continue to increase in absolute dollars for the foreseeable future.
General and Administrative. General and administrative expenses primarily consist of personnel and related costs for executive, finance, human resources and administrative personnel, professional fees and other corporate expenses and allocated overhead. We expect our general and administrative expenses to increase in absolute dollars as we expand our business and incur additional costs associated with operating as a public company, including higher legal, insurance and financial reporting expenses, and the additional costs to achieve and maintain compliance with Section 404 of the Sarbanes-Oxley Act. We will be required to comply with the provisions of Section 404 for the year ended December 31, 2008.
Income Taxes
Since inception, we have incurred annual operating losses and, accordingly, have not recorded a provision for income taxes for any of the periods presented other than provisions for minimum and foreign income taxes. As of December 31, 2007, we had net operating loss carryforwards for federal and state income tax purposes of approximately $169.9 million and $124.3 million, respectively. We also had federal and state research and development tax credit carryforwards of approximately $3.9 million and $2.6 million, respectively. Realization of deferred tax assets depends upon future earnings, if any, the timing and amount of which are uncertain. Accordingly, we have offset all of our net deferred tax assets by a valuation allowance. If not utilized, our federal net operating loss and tax credit carryforwards will begin to expire in 2018 and 2019, and our state net operating losses will begin to expire in 2008. Our state tax credit carryforwards will carry forward indefinitely if not utilized. While not currently subject to an annual limitation, the utilization of these carryforwards may become
36
subject to an annual limitation because of provisions in the Internal Revenue Code of 1986, as amended, that are applicable if we experience an “ownership change,” which may occur, for example, as a result of issuances of stock.
Critical Accounting Policies and Judgments
Our consolidated financial statements are prepared in accordance with generally accepted accounting principles in the United States (“GAAP”). The preparation of these consolidated financial statements requires us to make estimates and assumptions that affect the reported amounts of assets, liabilities, revenue, costs and expenses and related disclosures. We base our estimates on historical experience and on various other assumptions that we believe to be reasonable under the circumstances. In many instances, we could have reasonably used different accounting estimates, and in other instances changes in the accounting estimates are reasonably likely to occur from period-to-period. Accordingly, actual results could differ significantly from the estimates made by our management. To the extent that there are material differences between these estimates and actual results, our future financial statement presentation, financial condition, results of operations and cash flows will be affected.
In many cases, the accounting treatment of a particular transaction is specifically dictated by GAAP and does not require management’s judgment in its application, while in other cases, management’s judgment is required in selecting among available alternative accounting standards that allow different accounting treatment for similar transactions. We believe that there are several accounting policies that are critical to understanding our business and prospects for future performance, as these policies affect the reported amounts of revenue and other significant areas that involve management’s judgment and estimates.
These significant policies are:
| | • | | Internal use software and website development costs; |
| | • | | Deferred commissions; and |
| | • | | Accounting for stock-based compensation. |
These policies and our procedures related to these policies, are described in detail below. In addition, please refer to the Notes to Consolidated Financial Statements for further discussion of our accounting policies.
Revenue Recognition
We generate revenue from the sale of subscriptions and our services. In most instances, revenue is generated under sales agreements with multiple elements, which are comprised of subscription fees from customers accessing our on-demand application suite, professional services associated with consultation services and customer support. Our sales agreements have contract terms ranging from one to three years in length. Our services do not provide our customers the right to take possession of the software supporting the on-demand application service at any time.
We provide our software as a service, and follow the provisions of the SEC Staff Accounting Bulletin No. 104, “Revenue Recognition,” or SAB No. 104, and FASB Emerging Issues Task Force Issue No. 00-21, “Revenue Arrangements with Multiple Deliverables,” or EITF No. 00-21. We commence revenue recognition when all of the following conditions are met:
| | • | | there is persuasive evidence of an arrangement; |
| | • | | the service is being provided to the customer; |
37
| | • | | the collection of the fees is probable; and |
| | • | | the amount of fees to be paid by the customer is fixed or determinable. |
In applying the provisions of EITF No. 00-21, we have determined that we do not have objective and reliable evidence of fair value for each element of our sales agreements that contain a subscription to our on-demand application suite and customer support, professional services or both. As a result, the elements within our multiple-element sales agreements do not qualify for treatment as separate units of accounting. Therefore, we account for fees received under our agreements that contain multiple elements as a single unit of accounting and recognize the entire arrangement ratably over the term of the related agreement, commencing upon the later of the agreement start date or when all revenue recognition criteria have been met. Amounts that have been invoiced are initially recorded in accounts receivable and deferred revenue.
Deferred revenue consists of billings or payments received in advance of revenue recognition and is recognized as the revenue recognition criteria are met. Amounts are recorded as deferred revenue and accounts receivable when we have a legal right to enforce the contract. We generally invoice our customers annually or in quarterly installments. Accordingly, the deferred revenue balance does not represent the total contract value of annual or multi-year, non-cancelable subscription agreements. Deferred revenue that will be recognized during the succeeding 12-month period is recorded as current deferred revenue and the remaining portion is recorded as non-current deferred revenue.
Internal Use Software and Website Development Costs
In accordance with EITF No. 00-2, “Accounting for Web Site Development Costs,” and EITF No. 00-3, “Application of AICPA Statement of Position 97-2 to Arrangements That Include the Right to Use Software Stored on Another Entity’s Hardware,” we apply AICPA SOP No. 98-1, “Accounting for the Costs of Computer Software Developed or Obtained for Internal Use.” The costs incurred in the preliminary stages of development are expensed as incurred. Once an application has reached the development stage, internal and external costs, if direct and incremental, are capitalized until the software is substantially complete and ready for its intended use. Capitalization ceases upon completion of all substantial testing. We also capitalize costs related to specific upgrades and enhancements when it is probable the expenditures will result in additional functionality. Capitalized costs are recorded as part of property and equipment. Training costs are expensed as incurred. Internal use software is amortized on a straight-line basis over its estimated useful life, generally three years. Management evaluates the useful lives of these assets on an annual basis and tests for impairment whenever events or changes in circumstances occur that could impact the recoverability of these assets. There were no impairments to internal use software during the years ended December 31, 2005, 2006 or 2007.
Deferred Commissions
We capitalize commission costs that are incremental and directly related to the acquisition of customer contracts. Commission costs are accrued and capitalized upon execution of the sales contract by the customer. Payments to sales personnel are made shortly after the receipt of the related customer payment. Deferred commissions are amortized over the term of the related non-cancelable customer contract and are recoverable through the related future revenue streams. We believe this is the preferable method of accounting as the commission costs are so closely related to the revenue from the customer contracts that they should be charged to expense over the same period that the related revenue is recognized.
Accounting for Stock-Based Compensation
Prior to January 1, 2006, we accounted for stock-based compensation for equity grants made to our officers, directors and employees under the provisions of Accounting Principles Board, or APB, Opinion No. 25, “Accounting for Stock Issued to Employees,” or APB No. 25, and elected to follow the disclosure-only alternative prescribed by SFAS No. 123, “Accounting for Stock-Based Compensation,” or SFAS No. 123, as
38
amended by SFAS No. 148, “Accounting for Stock-Based Compensation—Transition and Disclosure.” Under APB No. 25, stock-based employee and director compensation arrangements were accounted for using the intrinsic-value method based on the difference, if any, between the estimated fair value of our common stock and the exercise price on the date of grant. Effective January 1, 2006, we adopted the fair value recognition provisions of SFAS No. 123R, “Share-Based Payment,” or SFAS No. 123R, using the prospective transition method, which requires us to apply the provisions of SFAS No. 123R only to new awards granted, and to awards modified, repurchased or cancelled, after the adoption date. Under this transition method, stock-based compensation expense recognized beginning January 1, 2006 is based on the grant date fair value of stock option awards granted or modified after January 1, 2006. Estimates are used in determining the fair value of such awards. Changes in these estimates could result in changes to our stock-based compensation expense. As a result of adopting SFAS No. 123R on January 1, 2006, our net loss for 2006 and 2007 was $120,000 and $6.7 million higher than if we had continued to account for stock-based compensation under APB No. 25.
For all periods, we granted employees options to purchase shares of common stock at exercise prices equal to the fair value of the underlying common stock at the time of grant, as determined by our board of directors. To determine the fair value of our common stock, our board of directors considered many factors, including:
| | • | | our current and historical operating performance; |
| | • | | our expected future operating performance; |
| | • | | our financial condition at the grant date; |
| | • | | the liquidation rights and other preferences of our preferred stock; |
| | • | | any recent privately negotiated sales of our securities to independent third parties; |
| | • | | our then-current book value per share; |
| | • | | the lack of marketability of our common stock; |
| | • | | the potential future marketability of our common stock; and |
| | • | | the business risks inherent in our business and in high technology companies generally. |
Between February and May 2007, there were third-party sales of our common stock at $11.85 and $12.45 per share. Shares were purchased by Meritech Capital Partners, a venture capital firm, and Craig Ramsey, investors with significant experience investing in late stage ventures or on-demand software companies. See the section titled “Directors and Executive Officers” in our Proxy Statement for our 2008 Annual Meeting of Stockholders to be filed with the SEC within 120 days after the end of the fiscal year ended December 31, 2007 for a description of these third party sales.
In accordance with the AICPA Practice Aid “Valuation of Privately Held Company Equity Securities Issued as Compensation,” a third-party transaction between a willing buyer and a willing seller is the best indication of the fair value of an enterprise. As such, we have utilized these most recent third-party transactions in determining the fair value of options granted in periods subsequent to these sales. In addition, we reassessed for accounting purposes the fair value of certain option grants in 2006 and 2007 in light of these sales. As a result of this reassessment, we determined that the fair value for accounting purposes for the following grants should be revised:
| | | | | | | | |
Grant Date | | Options
Granted | | Exercise Price Per Share
and Original Fair Value | | Reassessed
Fair Value |
April 28, 2006 | | 37,886 | | $ | 6.00 | | $ | 6.40 |
July 26, 2006 | | 50,450 | | | 7.00 | | | 7.80 |
November 21, 2006 | | 161,942 | | | 7.00 | | | 9.00 |
January 2, 2007 | | 246,461 | | | 7.00 | | | 11.00 |
39
Revised stock-based compensation expenses were calculated using the same assumptions for term, volatility, annual rate of dividends and discount rate as when originally calculated and these amounts have been recorded in our financial statements. As of December 31, 2007, we had $19.7 million of unrecognized compensation costs, adjusted for estimated forfeitures, related to non-vested stock option awards granted after January 1, 2006, which are expected to be recognized over a weighted-average period of 3.8 years.
On June 20, 2007, our compensation committee accelerated the vesting of options to purchase 65,861 shares and 333,434 shares held by Messrs. Nelson and Goldberg, respectively. These shares represented all of the unvested shares remaining under the options granted to Messrs. Nelson and Goldberg on May 17, 2005. As a result of the acceleration of vesting of these options, there was a one-time stock-based compensation charge of $1.3 million in the three months ended June 30, 2007 and these options are no longer subject to variable accounting and will not cause us to incur stock-based compensation expenses for these grants in future periods.
On June 28, 2007, we granted an aggregate of 1,289,785 options to our employees, of which 942,912 were fully vested upon grant. These option grants were the first option grants received by the majority of our employees since 2005. In connection with these grants, we incurred a stock-based compensation expense of $5.7 million for the three months ended June 30, 2007.
In November 2007, we entered into amendments to outstanding stock options with two of our named executive officers to raise the exercise prices of certain stock options subject to variable accounting. This action resulted in a substantive modification under SFAS No. 123(R) and at the date of this modification the intrinsic value amount was fixed, and will be recognized as stock compensation expense over the remaining service period.
As a result of our stock based compensation activity, we recorded $22.5 million, $15.3 million, and $18.2 million of stock based compensation during the years ended December 31, 2005, 2006, and 2007, respectively.
Results of Operations for Fiscal Years Ended December 31, 2005, 2006 and 2007
The following tables set forth our results of operations for the specified periods and as a percentage of our revenue for those periods. The period-to-period comparison of financial results is not necessarily indicative of future results.
Condensed Consolidated Statements of Operations
| | | | | | | | | | | | |
| | | Year Ended December 31, | |
| | | 2005 | | | 2006 | | | 2007 | |
| | | (In thousands) | |
Condensed Consolidated Statements of Operation Data: | | | | | | | | | | | | |
Revenue | | $ | 36,356 | | | $ | 67,202 | | | $ | 108,541 | |
Cost of revenue (1) | | | 15,607 | | | | 22,993 | | | | 33,766 | |
| | | | | | | | | | | | |
Gross profit | | | 20,749 | | | | 44,209 | | | | 74,775 | |
| | | | | | | | | | | | |
Operating expenses: | | | | | | | | | | | | |
Product development (1) | | | 24,780 | | | | 20,690 | | | | 23,703 | |
Sales and marketing (1) | | | 39,179 | | | | 43,892 | | | | 57,932 | |
General and administrative (1) | | | 13,685 | | | | 14,619 | | | | 16,720 | |
| | | | | | | | | | | | |
Total operating expenses | | | 77,644 | | | | 79,201 | | | | 98,355 | |
| | | | | | | | | | | | |
Operating loss | | | (56,895 | ) | | | (34,992 | ) | | | (23,580 | ) |
| | | | | | | | | | | | |
Other income (expense), net, including the effect of minority interest and income taxes | | | (769 | ) | | | (730 | ) | | | (326 | ) |
| | | | | | | | | | | | |
Net loss | | $ | (57,664 | ) | | $ | (35,722 | ) | | $ | (23,906 | ) |
| | | | | | | | | | | | |
Net loss per common share, basic and diluted | | $ | (27.99 | ) | | $ | (6.42 | ) | | $ | (2.45 | ) |
| | | | | | | | | | | | |
Weighted average number of shares | | | 2,060 | | | | 5,567 | | | | 9,774 | |
| | | | | | | | | | | | |
40
| (1) | Includes stock-based compensation expense as follows: |
| | | | | | | | | |
| | | Year Ended December 31, |
| | | 2005 | | 2006 | | 2007 |
| | | (In thousands) |
Cost of revenue | | $ | — | | $ | 19 | | $ | 1,703 |
Product development | | | 14,146 | | | 8,885 | | | 10,376 |
Sales and marketing | | | — | | | 75 | | | 2,540 |
General and administrative | | | 8,323 | | | 6,329 | | | 3,605 |
| | | | | | | | | |
Total stock-based compensation expense | | $ | 22,469 | | $ | 15,308 | | $ | 18,224 |
| | | | | | | | | |
| | | | | | | | | |
| | | Year Ended December 31, | |
| | | 2005 | | | 2006 | | | 2007 | |
Revenue | | 100 | % | | 100 | % | | 100 | % |
Cost of revenue | | 43 | % | | 34 | % | | 31 | % |
| | | | | | | | | |
Gross profit | | 57 | % | | 66 | % | | 69 | % |
| | | | | | | | | |
Operating expenses: | | | | | | | | | |
Product development | | 68 | % | | 31 | % | | 22 | % |
Sales and marketing | | 108 | % | | 65 | % | | 53 | % |
General and administrative | | 38 | % | | 22 | % | | 15 | % |
| | | | | | | | | |
Total operating expenses* | | 214 | % | | 118 | % | | 91 | % |
| | | | | | | | | |
Operating loss | | (156 | )% | | (52 | )% | | (22 | )% |
| | | | | | | | | |
Other income (expense), net, including the effect of minority interest and income taxes | | (2 | )% | | (1 | )% | | — | |
| | | | | | | | | |
Net loss | | (159 | )% | | (53 | )% | | (22 | )% |
| | | | | | | | | |
| * | Due to rounding to the nearest percent, totals may not equal the sum of the line items in the table above. |
Revenue
| | | | | | | | | |
| | | 2005 | | 2006 | | 2007 |
| | | ($ in thousands) |
Revenue | | $ | 36,356 | | $ | 67,202 | | $ | 108,541 |
2006 compared to 2007. Revenue for the year ended December 31, 2007 was $108.5 million compared to $67.2 million for the year ended December 31, 2006, an increase of $41.3 million, or 62%. Of this increase, $18.7 million, or 45%, represents an increase in revenue recognized from customers acquired in prior periods, primarily as a result of existing customers purchasing additional user subscriptions and modules as well as to a lesser extent the recognition in 2007 of revenue under contracts with customers acquired late in 2006 in accordance with our deferred revenue policies. The remaining $22.6 million of the increase, or 55%, represents revenue recognized from customers acquired during the year ended December 31, 2007. The $22.6 million in revenue from new customers represents a $6.1 million, or 37%, increase from revenue of $16.5 million recognized from new customers acquired in 2006. This increase in revenue from new customers for the year ended 2007 as compared with 2006 reflects a 47% increase in the average revenue recognized per new customer in 2006 due to these new customers adopting more elements of our service in 2007 and to their broader adoption of specific vertical industry solutions that are more costly.
In addition, the increased revenue in 2007 versus 2006 reflects an increase in sales to international customers from $9.6 million, or 14% of revenue, to $19.2 million, or 18% of revenue.
41
2005 compared to 2006. Revenue for the year ended December 31, 2006 was $67.2 million compared to $36.4 million for the year ended December 31, 2005, an increase of $30.8 million or 85%. Of this increase, $17.1 million, or 56%, of the increase in our revenue for the year ended December 31, 2006 compared to the year ended December 31, 2005 represents revenue recognized from customers acquired during 2006. The $17.1 million in revenue from new customers represents a $7.1 million, or 70%, increase from revenue of $10.1 million recognized from new customers acquired during 2005. This increase in revenue from new customers for 2006 as compared with the same period a year ago reflects a 71% increase in the average revenue recognized per new customer in 2006 as compared to the average revenue recognized per new customer in 2005. This increase was due to these new customers adopting more elements of our service and to their broader adoption of specific vertical industry solutions. The remaining $13.7 million, or 44%, represents an increase in revenue recognized from customers acquired in prior periods, primarily as a result of existing customers purchasing additional user subscriptions and modules as well as, to a lesser extent, the recognition in 2006 of revenue under contracts with customers acquired late in 2005 in accordance with our deferred revenue policies. New sales to existing customers more than offset the lost revenue from customer churn and non-recurring professional services revenue.
In addition, the increases described above reflect an increase in sales to international customers from $4.0 million, or 11% of revenue, to $9.6 million, or 14% of revenue.
Cost of revenue and gross profit
| | | | | | | | | | | | |
| | | 2005 | | | 2006 | | | 2007 | |
| | | ($ in thousands) | |
Revenue | | $ | 36,356 | | | $ | 67,202 | | | $ | 108,541 | |
Cost of revenue | | | 15,607 | | | | 22,993 | | | | 33,766 | |
| | | | | | | | | | | | |
Gross profit | | $ | 20,749 | | | $ | 44,209 | | | $ | 74,775 | |
| | | | | | | | | | | | |
Gross margin | | | 57 | % | | | 66 | % | | | 69 | % |
| | | | | | | | | | | | |
2006 compared to 2007.Cost of revenue for the year ended December 31, 2007 was $33.8 million compared to $23.0 million for the year ended December 31, 2006, an increase of $10.8 million, or 47%. The increase was primarily the result of a $7.7 million increase in personnel costs, a $1.6 million increase in data center expenses resulting from an increase in capacity, and a $1.2 million increase in overhead expenses. Of the $7.7 million increase in personnel related costs, $1.7 million related to an increase in stock-based compensation expense and the remainder is associated with increasing our professional services and customer support capacity.
2005 compared to 2006. Cost of revenue for the year ended December 31, 2006 was $23.0 million compared to $15.6 million for the year ended December 31, 2005, an increase of $7.4 million, or 47%. The increase in cost of revenue was primarily the result of a $3.2 million increase in personnel costs, a $2.3 million increase in externally sourced professional services, a $0.5 million increase in capacity at our outsourced customer support center and a $0.9 million increase in our infrastructure costs relating to data center expansion. The increase in both internal and external professional services resources was a result of growing capacity to meet the growth of new customers and by an increase in the number of customers with more complex implementation requirements.
Our gross margins increased from 57% to 66% to 69% in the years ended December 31, 2005, 2006 and 2007, respectively, as a result of economies of scale associated with increased revenue during the periods allowing for more efficient utilization of our resources.
42
Product development
| | | | | | | | | | | | |
| | | 2005 | | | 2006 | | | 2007 | |
| | | ($ in thousands) | |
Product development | | $ | 24,780 | | | $ | 20,690 | | | $ | 23,703 | |
| | | | | | | | | | | | |
% of Revenue | | | 68 | % | | | 31 | % | | | 22 | % |
| | | | | | | | | | | | |
2006 compared to 2007. Product development expenses for the year ended December 31, 2007 were $23.7 million compared to $20.7 million for the year ended December 31, 2006, an increase of $3.0 million, or 15%. The increase in product development expenses was primarily the result of a $2.1 million increase in personnel costs, as well as a $426,000 increase in outside services costs necessary to support the increased development efforts associated with international expansion. Of the $2.1 million increase in personnel related costs, $1.5 million related to an increase in stock-based compensation expense that was primarily attributed to a larger number of equity grants to employees during 2007 as compared to 2006.
2005 compared to 2006. Product development expenses for the year ended December 31, 2006 were $20.7 million compared to $24.8 million for the year ended December 31, 2005, a decrease of $4.1 million, or 17%. The decrease in product development expenses was primarily the result of a $4.2 million decrease in personnel expenses and a $264,000 increase in the capitalization of software development costs, offset by a $285,000 increase in outsourced quality assurance costs. Of the $4.2 million decrease in personnel expenses, $5.3 million related to a decrease in stock-based compensation expense, offset by a $1.1 million increase related to additional payroll and related expenses. The overall increase in payroll and related expenses was a result of the development of enhanced application functionality and features, as well as offering our application in additional international locations.
Sales and marketing
| | | | | | | | | | | | |
| | | 2005 | | | 2006 | | | 2007 | |
| | | ($ in thousands) | |
Sales and marketing | | $ | 39,179 | | | $ | 43,892 | | | $ | 57,932 | |
| | | | | | | | | | | | |
% of Revenue | | | 108 | % | | | 65 | % | | | 53 | % |
| | | | | | | | | | | | |
2006 compared to 2007. Sales and marketing expenses for the year ended December 31, 2007 were $57.9 million compared to $43.9 million for the year ended December 31, 2006, an increase of $14.0 million, or 32%. The increase in sales and marketing expenses was primarily the result of an increase in personnel costs of $13.1 million and an increase in marketing costs of $0.8 million. Of the $13.1 million increase in personnel costs, $7.0 million related to an increase in amortization of deferred commissions expense resulting from increased revenue during the comparative periods, and $2.5 million related to an increase in stock-based compensation expense that was primarily attributed to a larger number of equity grants to employees in 2007 as compared to 2006.
2005 compared to 2006. Sales and marketing expenses for the year ended December 31, 2006 were $43.9 million compared to $39.2 million for the year ended December 31, 2005, an increase of $4.7 million, or 12%. The increase in sales and marketing expenses was primarily the result of an increase of $4.3 million in commission expense, and a $451,000 increase in marketing expense. The increase in commission expense is related to the increase in sales by our direct sales force.
43
General and administrative
| | | | | | | | | | | | |
| | | 2005 | | | 2006 | | | 2007 | |
| | | ($ in thousands) | |
General and administrative | | $ | 13,685 | | | $ | 14,619 | | | $ | 16,720 | |
| | | | | | | | | | | | |
% of Revenue | | | 38 | % | | | 22 | % | | | 15 | % |
| | | | | | | | | | | | |
2006 compared to 2007. General and administrative expenses for the year ended December 31, 2007 were $16.7 million compared to $14.6 million for the year ended December 31, 2006, an increase of $2.1 million, or 14%. The increase in general and administrative expenses was due primarily to a $2.4 million increase in outside services, including $1.3 million in expenses relating to the transition to a different accounting firm, and a $0.9 million increase in personnel costs, offset by a $1.3 million decrease in expenses for uncollected sales tax primarily resulting from the new practice of charging sales tax expense directly to the customer, which began in the first quarter of 2007, as well as certain 2007 tax settlements that resulted in the reversal of previously accrued sales tax liabilities in the amount of $0.6 million.
2005 compared to 2006. General and administrative expenses for the year ended December 31, 2006 were $14.6 million compared to $13.7 million for the year ended December 31, 2005, an increase of $0.9 million, or 7%. The increase in general and administrative expenses was the result of a $0.7 million increase in legal fees, a $332,000 increase in sales tax expense and a $1.3 million increase related to increased headcount and outside professional services expense in general and administrative areas, offset by a $2.0 million decrease related to stock-based compensation expense. The increases in non stock-based compensation expenses are primarily due to the incremental costs of preparing to be a publicly-traded company.
Other income (expense), net, including the effect of minority interest and income taxes
| | | | | | | | | | | | |
| | | Year Ended December 31, | |
| | | 2005 | | | 2006 | | | 2007 | |
| | | (In thousands) | |
Interest income | | $ | 123 | | | $ | 203 | | | $ | 335 | |
Interest expense | | | (194 | ) | | | (657 | ) | | | (854 | ) |
Minority interest | | | — | | | | 240 | | | | 614 | |
Income taxes | | | (399 | ) | | | (643 | ) | | | (734 | ) |
Other income (expense), net | | | (299 | ) | | | 127 | | | | 313 | |
| | | | | | | | | | | | |
Other expense, net, including the effect of minority interest and income taxes | | $ | (769 | ) | | $ | (730 | ) | | $ | (326 | ) |
| | | | | | | | | | | | |
% of Revenue | | | (2 | )% | | | (1 | )% | | | — | % |
| | | | | | | | | | | | |
2006 compared to 2007. Other expense, net, including the effect of minority interest and income taxes for the year ended December 31, 2007 was an expense of $326,000 compared to an expense of $0.7 million for the year ended December 31, 2006. The decreased net expense of $404,000 was primarily due to an increase in the minority interest in NetSuite KK share of losses of $374,000 during the comparative periods.
2005 compared to 2006. Other expense, net, including the effect of minority interest and income taxes for the year ended December 31, 2006 was an expense of $0.7 million compared to an expense of $0.8 million for the year ended December 31, 2005. The change in expense was primarily the result of increased interest expense of $463,000 due to an increase in borrowing against the related party line of credit and an increase in foreign income tax of $244,000, offset by a foreign exchange loss of $430,000 and an increase in the minority interest in NetSuite KK share of losses of $240,000.
44
Quarterly Results of Operations
The following tables set forth our unaudited quarterly condensed consolidated statements of operations data for each of the eight quarters ended December 31, 2007 in the aggregate and as a percentage of revenue. The data has been prepared on the same basis as the audited consolidated financial statements and related notes included in this Annual Report on Form 10-K and you should read the following tables in conjunction with such financial statements. The table includes all necessary adjustments, consisting only of normal recurring adjustments that we consider necessary for a fair presentation of this data. The results of historical periods are not necessarily indicative of future results.
| | | | | | | | | | | | | | | | | | | | | | | | | | | | | | | | |
| | | Three Months Ended | |
| | | March 31,
2006 | | | June 30,
2006 | | | September 30,
2006 | | | December 31,
2006 | | | March 31,
2007 | | | June 30,
2007 | | | September 30,
2007 | | | December 31,
2007 | |
| | | (In thousands) | |
Condensed Consolidated Statements of Operations Data: | | | | | | | | | | | | | | | | | | | | | | | | | | | | | | | | |
Revenue | | $ | 13,533 | | | $ | 15,530 | | | $ | 17,950 | | | $ | 20,189 | | | $ | 23,229 | | | $ | 25,513 | | | $ | 28,065 | | | $ | 31,734 | |
Cost of revenue (1) | | | 4,828 | | | | 5,451 | | | | 6,179 | | | | 6,535 | | | | 6,901 | | | | 8,842 | | | | 8,440 | | | | 9,583 | |
| | | | | | | | | | | | | | | | | | | | | | | | | | | | | | | | |
Gross profit | | | 8,705 | | | | 10,079 | | | | 11,771 | | | | 13,654 | | | | 16,328 | | | | 16,671 | | | | 19,625 | | | | 22,151 | |
| | | | | | | | | | | | | | | | | | | | | | | | | | | | | | | | |
Operating expenses: | | | | | | | | | | | | | | | | | | | | | | | | | | | | | | | | |
Product development (1) | | | 3,826 | | | | 5,744 | | | | 5,700 | | | | 5,420 | | | | 8,425 | | | | 6,605 | | | | 3,683 | | | | 4,990 | |
Sales and marketing (1) | | | 10,211 | | | | 10,665 | | | | 10,809 | | | | 12,207 | | | | 12,528 | | | | 15,295 | | | | 14,083 | | | | 16,026 | |
General and administrative (1) | | | 2,207 | | | | 3,959 | | | | 4,316 | | | | 4,137 | | | | 4,630 | | | | 4,045 | | | | 3,622 | | | | 4,423 | |
| | | | | | | | | | | | | | | | | | | | | | | | | | | | | | | | |
Total operating expenses | | | 16,244 | | | | 20,368 | | | | 20,825 | | | | 21,764 | | | | 25,583 | | | | 25,945 | | | | 21,388 | | | | 25,439 | |
| | | | | | | | | | | | | | | | | | | | | | | | | | | | | | | | |
Operating loss | | | (7,539 | ) | | | (10,289 | ) | | | (9,054 | ) | | | (8,110 | ) | | | (9,255 | ) | | | (9,274 | ) | | | (1,763 | ) | | | (3,288 | ) |
| | | | | | | | | | | | | | | | | | | | | | | | | | | | | | | | |
Other income (expense), net, including the effect of minority interest and provision for income taxes | | | (324 | ) | | | (234 | ) | | | (165 | ) | | | (7 | ) | | | (22 | ) | | | (278 | ) | | | (32 | ) | | | 6 | |
| | | | | | | | | | | | | | | | | | | | | | | | | | | | | | | | |
Net loss | | $ | (7,863 | ) | | $ | (10,523 | ) | | $ | (9,219 | ) | | $ | (8,117 | ) | | $ | (9,277 | ) | | $ | (9,552 | ) | | $ | (1,795 | ) | | $ | (3,282 | ) |
| | | | | | | | | | | | | | | | | | | | | | | | | | | | | | | | |
| (1) | Includes stock-based compensation expense as follows: |
| | | | | | | | | | | | | | | | | | | | | | | | |
| | | Three Months Ended |
| | | March 31,
2006 | | June 30,
2006 | | September 30,
2006 | | December 31,
2006 | | March 31,
2007 | | June 30,
2007 | | September 30,
2007 | | December 31,
2007 |
| | | (In thousands) |
Cost of revenue | | $ | — | | $ | 3 | | $ | 6 | | $ | 10 | | $ | 95 | | $ | 1,300 | | $ | 125 | | $ | 183 |
Product development | | | 1,022 | | | 2,689 | | | 2,755 | | | 2,419 | | | 5,304 | | | 3,338 | | | 256 | | | 1,478 |
Sales and marketing | | | 11 | | | 15 | | | 22 | | | 27 | | | 43 | | | 2,226 | | | 46 | | | 225 |
General and administrative | | | 600 | | | 1,942 | | | 1,993 | | | 1,794 | | | 1,520 | | | 1,316 | | | 215 | | | 554 |
| | | | | | | | | | | | | | | | | | | | | | | | |
Total stock-based compensation expense | | $ | 1,633 | | $ | 4,649 | | $ | 4,776 | | $ | 4,250 | | $ | 6,962 | | $ | 8,180 | | $ | 642 | | $ | 2,440 |
| | | | | | | | | | | | | | | | | | | | | | | | |
45
| | | | | | | | | | | | | | | | | | | | | | | | |
| | | Three Months Ended | |
| | | March 31,
2006 | | | June 30,
2006 | | | September 30,
2006 | | | December 31,
2006 | | | March 31,
2007 | | | June 30,
2007 | | | September 30,
2007 | | | December 31,
2007 | |
Revenue (1) | | 100 | % | | 100 | % | | 100 | % | | 100 | % | | 100 | % | | 100 | % | | 100 | % | | 100 | % |
Cost of revenue) | | 36 | % | | 35 | % | | 34 | % | | 32 | % | | 30 | % | | 35 | % | | 30 | % | | 30 | % |
| | | | | | | | | | | | | | | | | | | | | | | | |
Gross profit | | 64 | % | | 65 | % | | 66 | % | | 68 | % | | 70 | % | | 65 | % | | 70 | % | | 70 | % |
| | | | | | | | | | | | | | | | | | | | | | | | |
Operating expenses: | | | | | | | | | | | | | | | | | | | | | | | | |
Product development | | 28 | % | | 37 | % | | 32 | % | | 27 | % | | 36 | % | | 26 | % | | 13 | % | | 16 | % |
Sales and marketing | | 75 | % | | 69 | % | | 60 | % | | 60 | % | | 54 | % | | 60 | % | | 50 | % | | 50 | % |
General and administrative | | 16 | % | | 25 | % | | 24 | % | | 20 | % | | 20 | % | | 16 | % | | 13 | % | | 14 | % |
| | | | | | | | | | | | | | | | | | | | | | | | |
Total operating expenses | | 120 | % | | 131 | % | | 116 | % | | 108 | % | | 110 | % | | 102 | % | | 76 | % | | 80 | % |
| | | | | | | | | | | | | | | | | | | | | | | | |
Operating loss | | (56 | )% | | (66 | )% | | (50 | )% | | (40 | )% | | (40 | )% | | (36 | )% | | (6 | )% | | (10 | )% |
| | | | | | | | | | | | | | | | | | | | | | | | |
Other income (expense), net, including the effect of minority interest and income taxes | | (2 | )% | | (2 | )% | | (1 | )% | | — | % | | — | % | | (1 | )% | | (0 | )% | | — | % |
| | | | | | | | | | | | | | | | | | | | | | | | |
Net loss | | (58 | )% | | (68 | )% | | (51 | )% | | (40 | )% | | (40 | )% | | (37 | )% | | (6 | )% | | (10 | )% |
| | | | | | | | | | | | | | | | | | | | | | | | |
| (1) | Due to rounding to the nearest percent, totals may not equal the sum of the line items in the table above. |
Our revenue increased in each of the quarters presented above as a result of adding new customers, as well as an increase in overall transaction size and upselling to existing customers. To date, we have not experienced any significant impact on our results of operations due to seasonality.
Cost of revenue has continued to increase in absolute dollars, excluding the effect of stock-based compensation, over the eight quarters presented to support the increase in revenue. While cost of revenue increased in absolute dollars, gross margin also increased during the five quarters ended March 31, 2007, and in the quarter ended September 30, 2007, while remaining flat during the quarter ended December 31, 2007, as we realized improved economies of scale in our professional services, operations and customer support organizations. In the three months ended June 30, 2007, gross margin decreased due to one-time stock-based compensation expenses relating to options that were fully vested upon grant.
Total operating expenses has continued to be significantly impacted by the variable accounting associated with outstanding stock options. If the operating expenses had excluded the stock-based compensation expense, operating expense as a percentage of revenue would have decreased from 108% for the quarter ended March 31, 2006 to 81% for the quarter ended March 31, 2007, remaining relatively constant near 74% during the quarters ended June 30, September 30, and December 31, 2007. This decrease and then stabilization of expenses as a percentage of revenue primarily exhibits the improved operational efficiencies within our sales organization.
Liquidity and Capital Resources
Prior to our IPO that raised $161.9 million in net proceeds in December 2007, we financed our operations primarily through private placements of preferred equity securities and common stock as described below and a line of credit from Tako Ventures, a related party. As of December 31, 2007, we had $169.4 million of cash and cash equivalents, and $178.0 million of working capital, excluding deferred revenue. Restricted cash consisting of letters of credit for our facility lease agreements is included in long-term other assets, and was $276,000 at December 31, 2007. As of December 31, 2007, we had an accumulated deficit of $244.9 million. We have funded this deficit primarily through the net proceeds raised from the sale of our capital stock and from debt financing activities.
In December 2007, we paid off the outstanding balance of the $20.0 million secured line of credit with Tako Ventures by making a payment of $8.0 million. The line of credit expired in February 2008.
46
Cash Flows
| | | | | | | | | | | | |
| | | Year Ended December 31, | |
| | | 2005 | | | 2006 | | | 2007 | |
| | | ($ in thousands) | |
Net cash provided by (used in) operating activities | | $ | (21,100 | ) | | $ | 2,768 | | | $ | 4,119 | |
Net cash used in investing activities | | $ | (3,201 | ) | | $ | (2,350 | ) | | $ | (4,772 | ) |
Net cash provided by financing activities | | $ | 22,426 | | | $ | 7,888 | | | $ | 159,805 | |
Net cash provided by (used in) operating activities Net cash provided by (used in) operating activities was $(21.1) million, $2.8 million and $4.1 million for the years ended December 31, 2005, 2006 and 2007, respectively. Cash provided by, or used in, operating activities is driven by sales of our service. The timing of our billings and collections relating to the sales of our on-demand application suite is a significant component of our cash flows from operations, as is the level of the deferred revenue on these sales. With revenue increasing in all comparative periods, cash flows from operations has continued to improve. In addition, the cash flows from operations in 2006 were positively impacted by a non-recurring receipt of $10.7 million related to the proceeds received for distribution rights, recorded in deferred revenue, by NetSuite KK.
Net cash used in investing activities Net cash used in investing activities was $(3.2) million, $(2.4) million and $(4.8) million and for the years ended December 31, 2005, 2006 and 2007, respectively. Cash used in investing activities is primarily related to capital expenditures consisting of the purchase of software licenses, computer equipment, leasehold improvements and furniture and fixtures as we have expanded our infrastructure and work force.
Net cash provided by financing activities Net cash provided by financing activities was $22.4 million, $7.9 million, and $159.8 million for the years ended December 31, 2005, 2006 and 2007, respectively. The net cash provided by financing activities in the year ended December 31, 2007 was primarily related to net proceeds received on the initial public offering of $161.9 million, offset by $8.0 million in payments on the related party line of credit. The net cash provided by financing activities in 2006 was primarily related to $6.7 million of proceeds related to the sale of stock in NetSuite KK, $1.9 million of refundable prepaid royalties related to NetSuite KK and proceeds from the issuance of common stock to employees. The net cash provided by financing activities in 2005 was primarily related to our receipt of $15.0 million in net proceeds from the issuance of preferred stock, our utilization of $7.3 million from our line of credit, and proceeds from the issuance of common stock to employees.
Contractual Obligations and Commitments
We generally do not enter into long-term minimum purchase commitments. Our principal commitments consist of obligations under capital leases for equipment, note payable used for purchase of equipment, operating leases primarily for office space, and other purchase obligations consisting of maintenance support contracts on leased or owned equipment and other general purchase obligations. The following table summarizes our commitments to settle contractual obligations in cash under capital lease and long-term debt obligations, operating leases and other purchase obligations, as of December 31, 2007, for the next five years and thereafter (In thousands):
| | | | | | | | | | | | | | | |
| | | Total | | Less than
1 year | | 1-3 years | | 3-5 years | | More than
5 years |
Capital lease and long-term debt obligations | | $ | 4,828 | | $ | 1,828 | | $ | 3,000 | | $ | — | | $ | — |
Operating lease obligations | | | 14,190 | | | 4,344 | | | 5,437 | | | 3,947 | | | 462 |
Purchase obligations | | | 8,353 | | | 4,974 | | | 3,329 | | | 50 | | | — |
| | | | | | | | | | | | | | | |
Total contractual obligations | | $ | 27,371 | | $ | 11,146 | | $ | 11,766 | | $ | 3,997 | | $ | 462 |
| | | | | | | | | | | | | | | |
47
Warranties and Indemnifications
Our application suite is typically warranted to perform in a manner consistent with general industry standards that are reasonably applicable and materially in accordance with our online help documentation under normal use and circumstances.
Our customer agreements provide service level commitments to our customers on a monthly basis that warrant certain levels of uptime and performance. If we are unable to meet these stated service level commitments, we will be contractually obligated to credit these customers for the value of future services. To date, we have not incurred any significant costs as a result of such commitments and we have, therefore, not accrued any liabilities related to such commitments in our consolidated financial statements.
We have also agreed to indemnify our directors and executive officers for costs associated with any fees, expenses, judgments, fines and settlement amounts incurred by any of these persons in any action or proceeding to which any of those persons is, or is threatened to be, made a party by reason of the person’s service as a director or officer, including any action by us, arising out of that person’s services as our director or officer or that person’s services provided to any other company or enterprise at our request. We maintain director and officer insurance coverage that may enable us to recover a portion of any future amounts paid.
Off-Balance Sheet Arrangements
During the years ended December 31, 2005, 2006 and 2007, we did not have any relationships with unconsolidated entities or financial partnerships, such as entities often referred to as structured finance or special purpose entities, which would have been established for the purpose of facilitating off-balance sheet arrangements or other contractually narrow or limited purposes.
Capital Resources
We intend to use cash provided from the initial public offering for general corporate purposes, including potential future acquisitions or other transactions. Further, during 2008, we expect to incur additional expenses in connection with our international expansion, the localization of our service in new locations and our intent to add an additional data center facility in 2008. While we believe that our current working capital and anticipated cash flows from operations will be adequate to meet our cash needs for daily operations and capital expenditures for at least the next 12 months, we may elect to raise additional capital through the sale of additional equity or debt securities, obtain a credit facility or sell certain assets. If additional funds are raised through the issuance of additional debt securities, these securities could have rights, preferences and privileges senior to holders of common stock, and terms of any debt could impose restrictions on our operations. The sale of additional equity or convertible debt securities could result in additional dilution to our stockholders, and additional financing may not be available in amounts or on terms acceptable to us. If additional financing is necessary and we are unable to obtain the additional financing, we may be required to reduce the scope of our planned product development and marketing efforts, which could harm our business, financial condition and operating results. In the mean time, we intend to continue to manage our cash portfolios in a manner designed to ensure that we have adequate cash and cash equivalents to fund our operations as well as future acquisitions, if any.
Recent Accounting Pronouncements
In September 2006, the FASB issued SFAS No. 157, “Fair Value Measurements,” which defines fair value, establishes a framework for measuring fair value and requires additional disclosures about fair value measurements. In February 2008, the FASB issued FASB Staff Position (FSP) 157-1, “Application of FASB Statement No. 157 to FASB Statement No. 13 and Other Accounting Pronouncements That Address Fair Value Measurements for Purposes of Lease Classification or Measurement under Statement 13” (FSP 157-1) and FSP 157-2, “Effective Date of FASB Statement No. 157” (FSP 157-2). FSP 157-1 amends SFAS No. 157 to remove
48
certain leasing transactions from its scope. FSP 157-2 delays the effective date of SFAS No. 157 for all non-financial assets and non-financial liabilities, except for items that are recognized or disclosed at fair value in the financial statements on a recurring basis (at least annually), until fiscal years beginning after November 15, 2008. The measurement and disclosure requirements related to financial assets and financial liabilities are effective fiscal years beginning after November 15, 2007. We will adopt the provisions of SFAS No. 157 on January 1, 2008. We do not anticipate that it will have an impact on our financial statements when adopted.
In February 2007, the FASB issued SFAS No. 159, “The Fair Value Option for Financial Assets and Financial Liabilities,” including an Amendment of FASB Statement No. 115, which allows an entity to choose to measure certain financial instruments and liabilities at fair value. Subsequent measurements for the financial instruments and liabilities an entity elects to measure at fair value will be recognized in earnings. SFAS No. 159 also establishes additional disclosure requirements. SFAS No. 159 is effective for fiscal years beginning after November 15, 2007, with early adoption permitted provided that the entity also adopts SFAS No. 157. We will adopt the provisions of SFAS No. 159 on January 1, 2008 and have elected not to apply the fair value option to any of our financial instruments. We do not anticipate that it will have an impact on our financial statements when adopted.
In December 2007, the FASB issued SFAS No. 141R, “Business Combinations” and SFAS No. 160, “Noncontrolling Interests in Consolidated Financial Statements, an amendment of Accounting Research Bulletin No. 51.” SFAS No. 141R will change how business acquisitions are accounted for and will impact financial statements both on the acquisition date and in subsequent periods. SFAS No. 160 will change the accounting and reporting for minority interests, which will be recharacterized as noncontrolling interests and classified as a component of equity. SFAS No. 141R and SFAS No. 160 are effective for fiscal years beginning after December 15, 2008. Early adoption is not permitted. We are currently evaluating the impact that SFAS No. 141R and SFAS No. 160 will have on our consolidated financial statements.
| ITEM 7A. | QUANTITATIVE AND QUALITATIVE DISCLOSURES ABOUT MARKET RISK |
Interest Rate Sensitivity
We had cash and cash equivalents $169.4 million at December 31, 2007. These amounts were held primarily in money market funds.
Cash and cash equivalents are held for working capital purposes, and restricted cash amounts are held as security against various lease obligations. Due to the short-term nature of these investments, we believe that we do not have any material exposure to changes in the fair value of our investment portfolio as a result of changes in interest rates. Declines in interest rates, however, will reduce future interest income. We believe that we do not have any material exposure to changes in the fair value as a result of changes in interest rates. Declines in interest rates, however, will reduce future investment income.
At December 31, 2007, we paid off the outstanding balance of the $20.0 million secured line of credit with Tako Ventures. The interest rate on our line of credit is variable and adjusted periodically based on the prime rate. The line of credit expired in February 2008.
Foreign Currency Risk
Our results of operations and cash flows are subject to fluctuations due to changes in foreign currency exchange rates, particularly changes in the Euro, British Pound Sterling, Canadian dollar, Japanese yen, Singapore dollar, Philippine peso and Australian dollar. Our revenue is generally denominated in the local currency of the contracting party. The majority of our revenue is denominated in U.S. dollars. Our expenses are generally denominated in the currencies of the countries in which our operations are located. Our expenses are incurred primarily in the United States, Canada and the UK, with a small portion of expenses incurred where our
49
other international sales and operations offices are located. Our results of operations and cash flows are, therefore, subject to fluctuations due to changes in foreign currency exchange rates. We do not currently enter into forward exchange contracts to hedge exposure denominated in foreign currencies or any derivative financial instruments for trading or speculative purposes. Fluctuations in currency exchange rates could harm our business in the future. The effect of an immediate 10% adverse change in exchange rates on foreign denominated receivables as of December 31, 2007 would result in a loss of approximately $434,000. To date, we have not entered into any hedging contracts although we may do so in the future.
Fair Value of Financial Instruments
We do not have material exposure to market risk with respect to investments, as our investments consist primarily of highly liquid investments purchased with a remaining maturity of three months or less. We do not use derivative financial instruments for speculative or trading purposes, however, this does not preclude our adoption of specific hedging strategies in the future.
50
| ITEM 8. | FINANCIAL STATEMENTS AND SUPPLEMENTARY DATA |
INDEX TO CONSOLIDATED FINANCIAL STATEMENTS
The following financial statements are filed as part of this Annual Report:
51
Report of Independent Registered Public Accounting Firm
The Board of Directors and Stockholders of NetSuite Inc.:
We have audited the accompanying consolidated balance sheets of NetSuite Inc. and subsidiaries (the Company) as of December 31, 2006 and 2007, and the related consolidated statements of operations, convertible preferred stock and stockholders’ equity (deficit), and cash flows for each of the years in the three-year period ended December 31, 2007. In connection with our audits of the consolidated financial statements, we have also audited financial statement Schedule II, as set forth in Item 15(b). These consolidated financial statements and financial statement schedule are the responsibility of the Company’s management. Our responsibility is to express an opinion on these consolidated financial statements and financial statement schedule based on our audits.
We conducted our audits in accordance with the auditing standards of the Public Company Accounting Oversight Board (United States). Those standards require that we plan and perform the audit to obtain reasonable assurance about whether the financial statements are free of material misstatement. An audit also includes examining, on a test basis, evidence supporting the amounts and disclosures in the financial statements, assessing the accounting principles used and significant estimates made by management, as well as evaluating the overall financial statement presentation. We believe that our audits provide a reasonable basis for our opinion.
In our opinion, the consolidated financial statements referred to above present fairly, in all material respects, the financial position of NetSuite Inc. and subsidiaries as of December 31, 2006 and 2007, and the results of their operations and their cash flows for each of the years in the three-year period ended December 31, 2007, in conformity with U.S. generally accepted accounting principles. Also in our opinion, the related financial statement schedule, when considered in relation to the basic consolidated financial statements taken as a whole, presents fairly, in all material respects, the information set forth therein.
As discussed in note 2-W to the consolidated financial statements, effective January 1, 2006, the Company adopted the provisions of Statement of Financial Accounting Standards No. 123 (R),Share-Based Payment.
/s/ KPMG LLP
Mountain View, California
March 19, 2008
52
CONSOLIDATED BALANCE SHEETS
As of December 31, 2006 and 2007
(In thousands, except for share and per share information)
| | | | | | |
| | | December 31, |
| | | 2006 | | 2007 |
ASSETS | | | | | | |
Current assets: | | | | | | |
Cash and cash equivalents | | $ | 9,910 | | $ | 169,408 |
Accounts receivable, net of allowances of $384 and $585 as of December 31, 2006 and 2007, respectively | | | 15,274 | | | 18,698 |
Deferred commissions | | | 11,871 | | | 13,241 |
Other current assets | | | 935 | | | 1,778 |
| | | | | | |
Total current assets | | | 37,990 | | | 203,125 |
Property and equipment, net | | | 5,513 | | | 12,068 |
Deferred commissions, non-current | | | 3,353 | | | 2,275 |
Other assets | | | 1,197 | | | 1,309 |
| | | | | | |
Total assets | | $ | 48,053 | | $ | 218,777 |
| | | | | | |
LIABILITIES, CONVERTIBLE PREFERRED STOCK, MINORITY INTEREST, AND STOCKHOLDERS’ EQUITY (DEFICIT) | | | | | | |
Current liabilities: | | | | | | |
Accounts payable | | $ | 1,770 | | $ | 2,788 |
Deferred revenue | | | 52,660 | | | 65,875 |
Accrued compensation | | | 6,614 | | | 8,552 |
Other current liabilities | | | 9,102 | | | 13,784 |
| | | | | | |
Total current liabilities | | | 70,146 | | | 90,999 |
| | | | | | |
Long-term liabilities: | | | | | | |
Line of credit from related party | | | 7,013 | | | — |
Deferred revenue, non-current | | | 19,109 | | | 11,111 |
Other long-term liabilities | | | 1,453 | | | 4,257 |
| | | | | | |
Total long-term liabilities | | | 27,575 | | | 15,368 |
| | | | | | |
Total liabilities | | | 97,721 | | | 106,367 |
| | | | | | |
Commitments and contingencies (Note 5) | | | | | | |
Minority interest | | | 1,945 | | | 1,330 |
| | | | | | |
Convertible preferred stock (total aggregate liquidation preference of $124,966 as of December 31, 2006)(Note 7): | | | | | | |
Series A, $0.01 par value, 900,000 and zero shares authorized as of December 31, 2006 and 2007, respectively ; 900,000 and zero shares issued and outstanding as of December 31, 2006 and 2007, respectively. (aggregate liquidation preference of $1,001 as of December 31, 2006) | | | 1,000 | | | — |
Series B, $0.01 par value, 120,000 and zero shares authorized as of December 31, 2006 and 2007, respectively; 120,000 and zero shares issued and outstanding as of December 31, 2006 and 2007, respectively (aggregate liquidation preference of $4,008 as of December 31, 2006) | | | 5,001 | | | — |
Series C, $0.01 par value, 437,868 and zero shares authorized as of December 31, 2006 and 2007, respectively; 436,223 and zero shares issued and outstanding as of December 31, 2006 and 2007, respectively (aggregate liquidation preference of $20,035 as of December 31, 2006) | | | 20,021 | | | — |
See accompanying notes to consolidated financial statements
53
CONSOLIDATED BALANCE SHEETS—(Continued)
As of December 31, 2006 and 2007
(In thousands, except for share and per share information)
| | | | | | | | |
| | | December 31, | |
| | | 2006 | | | 2007 | |
Series D, $0.01 par value, 1,434,446 and zero shares authorized as of December 31, 2006 and 2007, respectively; 1,434,444 and zero shares issued and outstanding as of December 31, 2006 and 2007, respectively (aggregate liquidation preference of $30,000 as of December 31, 2006) | | | 29,927 | | | | — | |
Series E, $0.01 par value, 4,832,427 and zero shares authorized as of December 31, 2006 and 2007, respectively; 4,832,423 and zero shares issued and outstanding as of December 31, 2006 and 2007, respectively (aggregate liquidation preference of $20,000 as of December 31, 2006) | | | 19,941 | | | | — | |
Series F, $0.01 par value, 7,919,859 and zero shares authorized as of December 31, 2006 and 2007, respectively; 7,919,853 and zero shares issued and outstanding as of December 31, 2006 and 2007, respectively (aggregate liquidation preference of $14,973 as of December 31, 2006) | | | 14,896 | | | | — | |
Series G, $0.01 par value, 10,922,574 and zero shares authorized as of December 31, 2006 and 2007, respectively; 10,922,571 and zero shares issued and outstanding as of December 31, 2006 and 2007, respectively (aggregate liquidation preference of $19,949 as of December 31, 2006) | | | 19,909 | | | | — | |
Series H, $0.01 par value, 8,750,000 shares and zero authorized as of December 31, 2006 and 2007, respectively; 7,281,547 and zero shares issued and outstanding as of December 31, 2006 and 2007, respectively (aggregate liquidation preference of $15,000 as of December 31, 2006) | | | 14,959 | | | | — | |
| | | | | | | | |
Total convertible preferred stock | | | 125,654 | | | | — | |
| | | | | | | | |
Stockholders’ equity (deficit): | | | | | | | | |
Preferred stock, par value $0.01, zero and 25,000,000 shares authorized as of December 31, 2006 and 2007, respectively; zero shares issued and outstanding | | | — | | | | — | |
Common stock, par value $0.01, 100,000,000 and 500,000,000 shares authorized as of December 31, 2006 and 2007, respectively; 7,288,199 and 60,059,453 shares issued and outstanding, excluding 923,907 and 116,114 shares subject to repurchase | | | 73 | | | | 601 | |
Additional paid-in capital | | | 48,061 | | | | 355,155 | |
Notes receivable from stockholders | | | (4,373 | ) | | | — | |
Accumulated other comprehensive income (loss) | | | (43 | ) | | | 215 | |
Accumulated deficit | | | (220,985 | ) | | | (244,891 | ) |
| | | | | | | | |
Total stockholders’ equity (deficit) | | | (177,267 | ) | | | 111,080 | |
| | | | | | | | |
Total liabilities, minority interest, convertible preferred stock and stockholders’ equity (deficit) | | $ | 48,053 | | | $ | 218,777 | |
| | | | | | | | |
See accompanying notes to consolidated financial statements
54
CONSOLIDATED STATEMENTS OF OPERATIONS
For the Years Ended December 31, 2005, 2006 and 2007
(In thousands, except for share and per share information)
| | | | | | | | | | | | |
| | | Year Ended December 31, | |
| | | 2005 | | | 2006 | | | 2007 | |
Revenue | | $ | 36,356 | | | $ | 67,202 | | | $ | 108,541 | |
Cost of revenue (1) | | | 15,607 | | | | 22,993 | | | | 33,766 | |
| | | | | | | | | | | | |
Gross profit | | | 20,749 | | | | 44,209 | | | | 74,775 | |
| | | | | | | | | | | | |
Operating expenses: | | | | | | | | | | | | |
Product development (1) | | | 24,780 | | | | 20,690 | | | | 23,703 | |
Sales and marketing (1) | | | 39,179 | | | | 43,892 | | | | 57,932 | |
General and administrative (1) | | | 13,685 | | | | 14,619 | | | | 16,720 | |
| | | | | | | | | | | | |
Total operating expenses | | | 77,644 | | | | 79,201 | | | | 98,355 | |
| | | | | | | | | | | | |
Operating loss | | | (56,895 | ) | | | (34,992 | ) | | | (23,580 | ) |
| | | | | | | | | | | | |
Other expense, net: | | | | | | | | | | | | |
Interest income | | | 123 | | | | 203 | | | | 335 | |
Interest expense | | | (89 | ) | | | (113 | ) | | | (29 | ) |
Interest expense to related party | | | (105 | ) | | | (544 | ) | | | (825 | ) |
Other income (expense) | | | (299 | ) | | | 127 | | | | 313 | |
| | | | | | | | | | | | |
Total other expense, net | | | (370 | ) | | | (327 | ) | | | (206 | ) |
| | | | | | | | | | | | |
Loss before income taxes and minority interest | | | (57,265 | ) | | | (35,319 | ) | | | (23,786 | ) |
Income taxes | | | 399 | | | | 643 | | | | 734 | |
| | | | | | | | | | | | |
Loss before minority interest | | | (57,664 | ) | | | (35,962 | ) | | | (24,520 | ) |
Minority interest | | | — | | | | 240 | | | | 614 | |
| | | | | | | | | | | | |
Net loss | | $ | (57,664 | ) | | $ | (35,722 | ) | | $ | (23,906 | ) |
| | | | | | | | | | | | |
Net loss per common share, basic and diluted | | $ | (27.99 | ) | | $ | (6.42 | ) | | $ | (2.45 | ) |
| | | | | | | | | | | | |
Weighted average number of shares used in computing basic and diluted net loss per common share | | | 2,060 | | | | 5,567 | | | | 9,774 | |
| | | | | | | | | | | | |
| (1) | Includes stock-based compensation expense as follows: |
| | | | | | | | | |
| | | Year Ended December 31, |
| | | 2005 | | 2006 | | 2007 |
Cost of revenue | | $ | — | | $ | 19 | | $ | 1,703 |
Product development | | | 14,146 | | | 8,885 | | | 10,376 |
Sales and marketing | | | — | | | 75 | | | 2,540 |
General and administrative | | | 8,323 | | | 6,329 | | | 3,605 |
| | | | | | | | | |
Total stock-based compensation expense | | $ | 22,469 | | $ | 15,308 | | $ | 18,224 |
| | | | | | | | | |
See accompanying notes to consolidated financial statements
55
CONSOLIDATED STATEMENTS OF CONVERTIBLE PREFERRED STOCK AND STOCKHOLDERS’ EQUITY (DEFICIT)
For the Years Ended December 31, 2005, 2006 and 2007
(In thousands, except for share and per share information)
| | | | | | | | | | | | | | | | | | | | | | | | | | | | | | | | |
| | | Convertible Preferred | | | Common Stock | | Additional
Paid-In
Capital | | Notes
Receivable
From
Stockholders | | | Accumulated
Other
Comprehensive
Income
(Loss) | | | Accumulated
Deficit | | | Total
Stockholders’
Equity
(Deficit) | |
| | | Shares | | | Amount | | | Shares | | Amount | | | | | |
BALANCES, December 31, 2004 | | | 26,565,514 | | | $ | 110,695 | | | 822,013 | | $ | 8 | | $ | 561 | | $ | — | | | $ | — | | | $ | (127,599 | ) | | | $(127,030 | ) |
Issuance of Series H preferred stock at $2.06 per share (net of issuance costs of $41) | | | 7,281,547 | | | | 14,959 | | | — | | | — | | | — | | | — | | | | — | | | | — | | | | — | |
Exercise of stock options for cash | | | — | | | | — | | | 923,563 | | | 9 | | | 563 | | | — | | | | — | | | | — | | | | 572 | |
Issuance of notes receivable from stockholders for exercise of stock options | | | — | | | | — | | | 3,154,840 | | | 32 | | | 1,965 | | | (3,020 | ) | | | — | | | | — | | | | (1,023 | ) |
Interest income on notes receivable | | | — | | | | — | | | — | | | | | | — | | | (69 | ) | | | — | | | | — | | | | (69 | ) |
Stock-based compensation | | | — | | | | — | | | — | | | — | | | 22,469 | | | — | | | | — | | | | — | | | | 22,469 | |
Lapse of restrictions on common stock related to early exercise of stock options | | | — | | | | — | | | 145,639 | | | 2 | | | 101 | | | — | | | | — | | | | — | | | | 103 | |
Net and comprehensive loss | | | — | | | | — | | | — | | | — | | | — | | | — | | | | — | | | | (57,664 | ) | | | (57,664 | ) |
| | | | | | | | | | | | | | | | | | | | | | | | | | | | | | | | |
BALANCES, December 31, 2005 | | | 33,847,061 | | | | 125,654 | | | 5,046,055 | | | 51 | | | 25,659 | | | (3,089 | ) | | | — | | | | (185,263 | ) | | | (162,642 | ) |
| | | | | | | | | | | | | | | | | | | | | | | | | | | | | | | | |
Issuance of notes receivable from stockholders for exercise of stock options | | | — | | | | — | | | 1,334,687 | | | 13 | | | 859 | | | (1,128 | ) | | | — | | | | — | | | | (256 | ) |
Interest income on notes receivable | | | — | | | | — | | | — | | | — | | | — | | | (156 | ) | | | — | | | | — | | | | (156 | ) |
Exercise of stock options for services | | | — | | | | — | | | 2,000 | | | — | | | — | | | — | | | | — | | | | — | | | | — | |
Exercise of stock options for cash | | | — | | | | — | | | 404,101 | | | 4 | | | 334 | | | — | | | | — | | | | — | | | | 338 | |
Lapse of restrictions on common stock related to early exercise of stock options | | | — | | | | — | | | 501,356 | | | 5 | | | 382 | | | — | | | | — | | | | — | | | | 387 | |
Stock-based compensation | | | — | | | | — | | | — | | | — | | | 15,291 | | | — | | | | — | | | | — | | | | 15,291 | |
Excess of proceeds over parent’s basis related to sale of subsidiary common stock | | | — | | | | — | | | — | | | — | | | 5,532 | | | — | | | | — | | | | — | | | | 5,532 | |
Contribution to capital by related party | | | — | | | | — | | | — | | | — | | | 4 | | | — | | | | — | | | | — | | | | 4 | |
Comprehensive loss: | | | | | | | | | | | | | | | | | | | | | | | | | | | | | | | | |
Foreign currency translation adjustment | | | — | | | | — | | | — | | | — | | | — | | | — | | | | (43 | ) | | | — | | | | (43 | ) |
Net loss | | | — | | | | — | | | — | | | — | | | — | | | — | | | | — | | | | (35,722 | ) | | | (35,722 | ) |
| | | | | | | | | | | | | | | | | | | | | | | | | | | | | | | | |
Comprehensive loss | | | — | | | | | | | | | | | | | | | | | | | | | | | | | | | | (35,765 | ) |
| | | | | | | | | | | | | | | | | | | | | | | | | | | | | | | | |
BALANCES, December 31, 2006 | | | 33,847,061 | | | | 125,654 | | | 7,288,199 | | | 73 | | | 48,061 | | | (4,373 | ) | | | (43 | ) | | | (220,985 | ) | | | (177,267 | ) |
| | | | | | | | | | | | | | | | | | | | | | | | | | | | | | | | |
Interest income on notes receivable | | | — | | | | — | | | — | | | — | | | — | | | (56 | ) | | | — | | | | — | | | | (56 | ) |
Conversion of preferred stock into common | | | (33,847,061 | ) | | | (125,654 | ) | | 44,676,597 | | | 447 | | | 125,207 | | | — | | | | — | | | | — | | | | 125,654 | |
Payment of notes receivable from stockholders | | | — | | | | — | | | — | | | — | | | — | | | 4,429 | | | | — | | | | — | | | | 4,429 | |
Issuance of common stock, net of issuance costs of $14.0 million | | | — | | | | — | | | 6,765,000 | | | 68 | | | 161,786 | | | — | | | | — | | | | — | | | | 161,854 | |
Exercise of stock options for cash | | | — | | | | — | | | 487,397 | | | 5 | | | 1,099 | | | — | | | | — | | | | — | | | | 1,104 | |
Lapse of restrictions on common stock related to early exercise of stock options | | | — | | | | — | | | 842,260 | | | 8 | | | 778 | | | — | | | | — | | | | — | | | | 786 | |
Stock-based compensation | | | — | | | | — | | | — | | | — | | | 18,202 | | | — | | | | — | | | | — | | | | 18,202 | |
Contribution to capital by related party | | | — | | | | — | | | — | | | — | | | 22 | | | — | | | | — | | | | — | | | | 22 | |
Comprehensive loss: | | | — | | | | — | | | — | | | — | | | — | | | — | | | | — | | | | — | | | | | |
Foreign currency translation adjustment | | | — | | | | — | | | — �� | | | — | | | — | | | — | | | | 258 | | | | — | | | | 258 | |
Net loss | | | — | | | | — | | | — | | | — | | | — | | | — | | | | — | | | | (23,906 | ) | | | (23,906 | ) |
| | | | | | | | | | | | | | | | | | | | | | | | | | | | | | | | |
Comprehensive loss | | | — | | | | — | | | — | | | — | | | — | | | — | | | | — | | | | — | | | | (23,648 | ) |
| | | | | | | | | | | | | | | | | | | | | | | | | | | | | | | | |
BALANCES, December 31, 2007 | | $ | — | | | $ | — | | | 60,059,453 | | $ | 601 | | $ | 355,155 | | $ | — | | | $ | 215 | | | $ | (244,891 | ) | | $ | 111,080 | |
| | | | | | | | | | | | | | | | | | | | | | | | | | | | | | | | |
See accompanying notes to consolidated financial statements
56
CONSOLIDATED STATEMENTS OF CASH FLOWS
For the Years Ended December 31, 2005, 2006 and 2007
(In thousands, except for share and per share information)
| | | | | | | | | | | | |
| | | Year Ended December 31, | |
| | | 2005 | | | 2006 | | | 2007 | |
Cash flows from operating activities: | | | | | | | | | | | | |
Net loss | | $ | (57,664 | ) | | $ | (35,722 | ) | | $ | (23,906 | ) |
Adjustments to reconcile net loss to net cash provided by (used in) operating activities: | | | | | | | | | | | | |
Depreciation and amortization | | | 2,189 | | | | 2,584 | | | | 3,381 | |
Provision for accounts receivable allowances | | | 176 | | | | 432 | | | | 530 | |
Stock-based compensation | | | 22,469 | | | | 15,308 | | | | 18,224 | |
Amortization of deferred commissions | | | 8,471 | | | | 12,762 | | | | 19,752 | |
Minority interest | | | — | | | | (240 | ) | | | (614 | ) |
Accrued interest on notes receivable from stockholders | | | (69 | ) | | | (156 | ) | | | (56 | ) |
Changes in operating assets and liabilities: | | | | | | | | | | | | |
Accounts receivable | | | (7,473 | ) | | | (974 | ) | | | (3,984 | ) |
Deferred commissions | | | (13,364 | ) | | | (17,138 | ) | | | (20,034 | ) |
Other current assets | | | (1,053 | ) | | | 551 | | | | (882 | ) |
Other assets | | | (300 | ) | | | (491 | ) | | | (103 | ) |
Accounts payable | | | 1,312 | | | | (110 | ) | | | 633 | |
Accrued compensation | | | 1,889 | | | | 1,710 | | | | 1,934 | |
Deferred revenue | | | 19,321 | | | | 19,728 | | | | 5,215 | |
Other current liabilities | | | 1,656 | | | | 2,456 | | | | 3,874 | |
Other long-term liabilities | | | 1,340 | | | | 2,068 | | | | 155 | |
| | | | | | | | | | | | |
Net cash provided by (used in) operating activities | | | (21,100 | ) | | | 2,768 | | | | 4,119 | |
| | | | | | | | | | | | |
Cash flows from investing activities: | | | | | | | | | | | | |
Purchases of property and equipment | | | (2,972 | ) | | | (1,903 | ) | | | (4,664 | ) |
Capitalized internal use software | | | (229 | ) | | | (447 | ) | | | (108 | ) |
| | | | | | | | | | | | |
Net cash used in investing activities | | | (3,201 | ) | | | (2,350 | ) | | | (4,772 | ) |
| | | | | | | | | | | | |
Cash flows from financing activities: | | | | | | | | | | | | |
Proceeds from refundable prepaid royalties | | | — | | | | 1,903 | | | | — | |
Proceeds from line of credit from related party | | | 7,305 | | | | 9,046 | | | | 1,000 | |
Payments on line of credit from related party | | | (56 | ) | | | (9,282 | ) | | | (8,000 | ) |
Proceeds from notes receivable from stockholders | | | — | | | | — | | | | 4,429 | |
Payments under capital leases and long-term debt | | | (354 | ) | | | (820 | ) | | | (1,133 | ) |
Proceeds from issuance of common stock, net of issuance costs | | | 572 | | | | 325 | | | | 163,509 | |
Proceeds received from sale of subsidiary stock | | | — | | | | 6,716 | | | | — | |
Proceeds from issuance of convertible preferred stock | | | 14,959 | | | | — | | | | — | |
| | | | | | | | | | | | |
Net cash provided by financing activities | | | 22,426 | | | | 7,888 | | | | 159,805 | |
| | | | | | | | | | | | |
Effect of exchange rate changes on cash and cash equivalents | | | — | | | | (53 | ) | | | 346 | |
| | | | | | | | | | | | |
Net increase (decrease) in cash and cash equivalents | | | (1,875 | ) | | | 8,253 | | | | 159,498 | |
Cash and cash equivalents at beginning of year | | | 3,532 | | | | 1,657 | | | | 9,910 | |
| | | | | | | | | | | | |
Cash and cash equivalents at end of year | | $ | 1,657 | | | $ | 9,910 | | | $ | 169,408 | |
| | | | | | | | | | | | |
Supplemental cash flow disclosure: | | | | | | | | | | | | |
Cash paid during the period for: | | | | | | | | | | | | |
Interest paid on line of credit from related party | | $ | 56 | | | $ | 581 | | | $ | 708 | |
Interest paid on capital leases and long-term debt | | | 54 | | | | 114 | | | | 75 | |
Income taxes, net of tax refunds | | | 60 | | | | 157 | | | | 261 | |
Noncash financing and investing activities: | | | | | | | | | | | | |
Property and equipment acquired under capital leases and long-term debt | | | 1,873 | | | | — | | | | 4,736 | |
Exercise of stock options for stockholder notes receivable | | | 3,020 | | | | 1,128 | | | | — | |
Conversion of preferred stock | | | — | | | | — | | | | 125,654 | |
See accompanying notes to consolidated financial statements
57
NOTES TO CONSOLIDATED FINANCIAL STATEMENTS
1. ORGANIZATION
NetSuite Inc. (the “Company”), provides an on-demand suite of integrated business management software services to small and medium sized businesses and divisions of large companies. The Company’s offerings consist of a single application that provides Accounting / Enterprise Resource Planning, Customer Relationship Management and E-commerce functionality. The Company’s headquarters are located in San Mateo, California. The Company conducts its business worldwide, with locations in Canada, Europe, Asia, and Australia.
2. SIGNIFICANT ACCOUNTING POLICIES
A. Basis of Presentation and Principles of Consolidation
The consolidated financial statements include the accounts of the Company and its majority-owned subsidiaries. Intercompany balances and transactions have been eliminated.
The Company owns a majority interest in NetSuite Kabushiki Kaisha (“NetSuite KK”), a Japanese legal entity. As of December 31, 2007, the Company owned a 72% interest in NetSuite KK. Given the Company’s majority ownership interest, the accounts of NetSuite KK have been consolidated with the accounts of the Company, and a minority interest has been recorded for the minority investors’ interests in the net assets and operations of NetSuite KK to the extent of the minority investors’ individual investments.
On November 19, 2007, the Company was reincorporated in the State of Delaware. As a result, in order to account for the common stock par value of $0.01 per share, the Company reclassified the outstanding common stock and additional paid-in capital amounts within the stockholders equity (deficit) for all periods presented.
B. Use of Estimates
The preparation of financial statements in conformity with accounting principles generally accepted in the United States of America requires management to make certain estimates and assumptions. These estimates and assumptions affect the reported amounts of assets and liabilities and disclosure of contingent assets and liabilities at the date of the financial statements, as well as reported amounts of revenue and expenses during the reporting period. Actual results could differ from those estimates.
C. Segments
The Company’s chief operating decision maker is its chief executive officer, who reviews financial information presented on a consolidated basis, accompanied by information about revenue by geographic region. Accordingly, in accordance with Statement of Financial Accounting Standards No. 131, Disclosures about Segments of an Enterprise and Related Information, or SFAS No. 131, the Company has determined that it has a single reporting segment and operating unit structure, specifically, the provision of an on-demand suite of integrated business management software services.
D. Revenue Recognition
The Company generates revenue from the sale of subscriptions and its services. In most instances, revenue is generated under sales agreements with multiple elements, which are comprised of subscription fees from customers accessing its on-demand application service and professional services associated with consultation services and customer support. The Company’s sales agreements have contract terms ranging from one to three years in length. Arrangements with customers do not provide the customer with the right to take possession of the software supporting the on-demand application service at any time.
58
The Company provides its software as a service and follows the provisions of the Securities and Exchange Commission Staff Accounting Bulletin No. 104, “Revenue Recognition,” or SAB No. 104, and Financial Accounting Standards Board or FASB Emerging Issues Task Force or EITF Issue No. 00-21, “Revenue Arrangements with Multiple Deliverables,” or EITF No. 00-21. The Company commences revenue recognition when all of the following conditions are met:
| | • | | There is persuasive evidence of an arrangement; |
| | • | | The service is being provided to the customer; |
| | • | | The collection of the fees is probable; and |
| | • | | The amount of fees to be paid by the customer is fixed or determinable. |
In applying the provisions of EITF No. 00-21, the Company has determined that it does not have objective and reliable evidence of fair value for each element of its sales agreements that contain a subscription to its on-demand application service and customer support, professional services, or both. As a result, the elements within its multiple-element sales agreements do not qualify for treatment as separate units of accounting. Accordingly, the Company accounts for fees received under multiple-element arrangements as a single unit of accounting and recognizes the entire arrangement ratably over the term of the related agreement, commencing upon the later of the agreement start date or when all revenue recognition criteria have been met. Amounts that have been invoiced are initially recorded in accounts receivable and deferred revenue.
The Company will occasionally sell professional services separately from a subscription agreement. In determining whether the professional services can be accounted for separately from a subscription agreement, the Company considers the timing of when the professional service agreement was signed in comparison to the subscription agreement start date and the contractual dependence of the subscription service on the successful completion of the professional services. If the Company determines that the professional services do not qualify as a separate arrangement, and hence a separate unit of accounting, this revenue is amortized over the remaining term of the subscription agreement. If these professional services do qualify as a separate arrangement, the Company recognizes such revenue on a completed contract basis. To date, the professional services qualifying as a separate unit of accounting have not been material.
E. Deferred Revenue
Deferred revenue consists of billings or payments received in advance of revenue recognition and is recognized as the revenue recognition criteria are met. Amounts are recorded as deferred revenue and accounts receivable when the Company has a legal right to enforce the contract. The Company generally invoices its customers annually or in quarterly installments. Accordingly, the deferred revenue balance does not represent the total contract value of annual or multi-year, non-cancelable subscription agreements. Deferred revenue that will be recognized during the succeeding 12-month period is recorded as current deferred revenue and the remaining portion is recorded as non-current deferred revenue.
F. Cost of Revenue
Cost of revenue primarily consists of costs related to hosting the Company’s on-demand application suite, providing customer support, data communications expenses, salaries and benefits of operations and support personnel, software license fees, costs associated with website development activities, allocated overhead, amortization expense associated with capitalized internal use software and related plant and equipment depreciation and amortization expenses.
G. Deferred Commissions
The Company capitalizes commission costs that are incremental and directly related to the acquisition of customer contracts. Commission costs are accrued and capitalized upon execution of the sales contract by the
59
customer. Payments to sales personnel are made shortly after the receipt of the related customer payment. Deferred commissions are amortized over the term of the related non-cancelable customer contract and are recoverable through the related future revenue streams. The Company capitalized commission costs of $13.4 million, $17.1 million and $20.0 million during the years ended December 31, 2005, 2006 and 2007, respectively. Commission amortization expense was $8.5 million, $12.8 million and $19.8 million during the years ended December 31, 2005, 2006 and 2007, respectively.
H. Internal Use Software and Website Development Costs
In accordance with EITF No. 00-2, “Accounting for Web Site Development Costs,” and EITF No. 00-3, “Application of AICPA Statement of Position (SOP) No. 97-2 to Arrangements That Include the Right to Use Software Stored on Another Entity’s Hardware” the Company applies AICPA SOP No. 98-1, “Accounting for the Costs of Computer Software Developed or Obtained for Internal Use,” to the accounting for capitalization of internal use software. Under these guidelines, costs incurred in the preliminary stages of development are expensed as incurred. Once an application has reached the development stage, internal and external costs, if direct and incremental, are capitalized until the software is substantially complete and ready for its intended use. Capitalization ceases upon completion of all substantial testing. The Company also capitalizes costs related to specific upgrades and enhancements when it is probable the expenditures will result in additional functionality. Capitalized costs are recorded as part of property and equipment. Maintenance and training costs are expensed as incurred. Internal use software is amortized on a straight-line basis over its estimated useful life, generally three years. Management evaluates the useful lives of these assets on an annual basis and tests for impairment whenever events or changes in circumstances occur that could impact the recoverability of these assets. There were no impairments to internal software during the years ended December 31, 2005, 2006 and 2007. The Company capitalized $229,000, $447,000, and $108,000 in internal use software during the years ended December 31, 2005, 2006 and 2007, respectively. Amortization expense totaled $300,000, $254,000, and $250,000 during the years ended December 31, 2005, 2006 and 2007, respectively. The net book value of capitalized internal use software at December 31, 2006 and 2007 was $634,000 and $491,000, respectively.
I. Comprehensive Loss
Comprehensive loss consists of net loss and other comprehensive income (loss), which includes certain changes in equity that are excluded from net loss. Cumulative foreign currency translation, net of tax, are included in accumulated other comprehensive loss. Comprehensive loss has been reflected in stockholders’ equity (deficit).
J. Income Taxes
The Company accounts for income taxes under the asset and liability approach. Deferred income taxes reflect the impact of temporary differences between assets and liabilities recognized for financial reporting purposes and amounts recognized for income tax reporting purposes, net operating loss carryforwards and other tax credits measured by applying currently enacted tax laws. Valuation allowances are provided when necessary to reduce deferred tax assets to an amount that is more likely than not to be realized.
Compliance with income tax regulations requires the Company to make decisions relating to the transfer pricing of revenue and expenses between each of its legal entities that are located in several countries. The Company’s determinations include many decisions based on management’s knowledge of the underlying assets of the business, the legal ownership of these assets, and the ultimate transactions conducted with customers and other third-parties. The calculation of the Company’s tax liabilities involves dealing with uncertainties in the application of complex tax regulations in multiple tax jurisdictions. The Company may be periodically reviewed by domestic and foreign tax authorities regarding the amount of taxes due. These reviews may include questions regarding the timing and amount of deductions and the allocation of income among various tax jurisdictions. In evaluating the exposure associated with various filing positions, the Company records estimated reserves when it
60
is not probable that an uncertain tax position will be sustained upon examination by a taxing authority. Such estimates are subject to change. See note 9 for information regarding the Company’s adoption of FASB Interpretation No. 48 “Accounting for Uncertainty in Income Taxes.”
K. Cash and Cash Equivalents
The Company considers all highly liquid investments purchased with a remaining maturity of three months or less to be cash equivalents. Cash equivalents are comprised of investments in money market mutual funds. The money market mutual funds that the Company invested in did not have any investments in auction rate securities as of December 31, 2007. Cash and cash equivalents, are recorded at cost, which approximates fair value.
L. Restricted Cash
Restricted cash secures letters of credit applied against the Company’s facility lease agreements in the amount of $276,000 at December 31, 2006 and 2007, and is included in long-term other assets.
M. Fair Value of Financial Instruments
The carrying amounts of the Company’s financial assets and liabilities, including cash, accounts receivable, line of credit and accounts payable approximate fair value due to the short maturities or variable rates of these instruments.
N. Impairment of Long-Lived Assets
The Company reviews the carrying value of long-lived assets annually or whenever events or changes in circumstances indicate that an asset’s carrying value may not be recoverable. If such review indicates the carrying amount of long-lived assets is not recoverable, the carrying amount of the asset is reduced to fair value.
O. Leases
The Company leases worldwide facilities and certain other equipment under non-cancelable lease agreements. The terms of certain lease agreements provide for rental payments on a graduated basis. The Company recognizes rent expense on the straight-line basis over the lease period and accrues for rent expense incurred but not paid.
Under certain leases, the Company also received reimbursements for leasehold improvements. These reimbursements are lease incentives which have been recognized as a liability and are being amortized on a straight-line basis over the term of the lease as a component of minimum rental expense. The leasehold improvements are included in property, plant and equipment and are being amortized over the shorter of the estimated useful life of the improvements or the lease term.
P. Property and Equipment
Property and equipment are stated at cost less accumulated depreciation and amortization. Depreciation is computed using the straight-line method over the estimated useful life of the related asset. Depreciation of computer equipment, purchased software and office equipment is generally computed over three to five years. Depreciation of furniture and fixtures is generally computed over five years. Leasehold improvements are amortized using the straight-line method over the shorter of the lease term or the estimated useful lives of the related assets.
61
Q. Warranties and Indemnification
The Company’s on-demand application service is typically warranted to perform in a manner consistent with general industry standards that are reasonably applicable and materially in accordance with the Company’s online help documentation under normal use and circumstances.
The Company includes service level commitments to its customers warranting certain levels of uptime reliability and performance and permitting those customers to receive credits in the event that the Company fails to meet those levels. To date, the Company has not incurred any material costs as a result of such commitments and has not accrued any liabilities related to such obligations in the accompanying consolidated financial statements.
The Company has also agreed to indemnify its directors and executive officers for costs associated with any fees, expenses, judgments, fines and settlement amounts incurred by any of these persons in any action or proceeding to which any of those persons is, or is threatened to be, made a party by reason of the person’s service as a director or officer, including any action by the Company, arising out of that person’s services as the Company’s director or officer or that person’s services provided to any other company or enterprise at the Company’s request. The Company maintains director and officer insurance coverage that may enable the Company to recover a portion of any future amounts paid.
R. Concentration of Credit Risk and Significant Customers and Suppliers
Financial instruments potentially exposing the Company to concentration of credit risk consist primarily of cash and cash equivalents, restricted cash, and trade accounts receivable. The Company maintains an allowance for doubtful accounts receivable balances. The allowance is based upon historical loss patterns, the number of days that billings are past due and an evaluation of the potential risk of loss associated with problem accounts. Credit risk arising from accounts receivable is mitigated due to the large number of customers comprising the Company’s customer base and their dispersion across various industries. At December 31, 2006 and 2007, there were no customers that represented more than 10% of the net accounts receivable balance. There were no customers that individually exceeded 10% of the Company’s revenue in any of the periods presented. At December 31, 2006 and 2007, long-lived assets located outside the United States were not significant.
Revenue by geographic region, based on the billing address of the customer, was as follows:
| | | | | | | | | |
| | | Year Ended December 31, |
| | | 2005 | | 2006 | | 2007 |
| | | ($ in thousands) |
Americas | | $ | 32,365 | | $ | 57,561 | | $ | 89,349 |
International | | | 3,991 | | | 9,641 | | | 19,192 |
| | | | | | | | | |
Total Revenue | | $ | 36,356 | | $ | 67,202 | | $ | 108,541 |
| | | | | | | | | |
No single international country represents more than 10% of revenue.
Cash balances are maintained at several banks. Accounts located in the United States are insured by the Federal Deposit Insurance Corporation, or FDIC, up to $100,000. Certain operating cash accounts may exceed the FDIC limits.
S. Recent Accounting Pronouncements
In September 2006, the FASB issued SFAS No. 157, “Fair Value Measurements,” which defines fair value, establishes a framework for measuring fair value and requires additional disclosures about fair value measurements. In February 2008, the FASB issued FASB Staff Position (FSP) 157-1, “Application of FASB
62
Statement No. 157 to FASB Statement No. 13 and Other Accounting Pronouncements That Address Fair Value Measurements for Purposes of Lease Classification or Measurement under Statement 13” (FSP 157-1) and FSP 157-2, “Effective Date of FASB Statement No. 157” (FSP 157-2). FSP 157-1 amends SFAS No. 157 to remove certain leasing transactions from its scope. FSP 157-2 delays the effective date of SFAS No. 157 for all non-financial assets and non-financial liabilities, except for items that are recognized or disclosed at fair value in the financial statements on a recurring basis (at least annually), until fiscal years beginning after November 15, 2008. The measurement and disclosure requirements related to financial assets and financial liabilities are effective for fiscal years beginning after November 15, 2007. The Company will adopt the provisions of SFAS No. 157 on January 1, 2008. The Company does not anticipate that it will have an impact on our financial statements when adopted.
In February 2007, the FASB issued SFAS No. 159, “The Fair Value Option for Financial Assets and Financial Liabilities,” including an Amendment of FASB Statement No. 115, which allows an entity to choose to measure certain financial instruments and liabilities at fair value. Subsequent measurements for the financial instruments and liabilities an entity elects to measure at fair value will be recognized in earnings. SFAS No. 159 also establishes additional disclosure requirements. SFAS No. 159 is effective for fiscal years beginning after November 15, 2007, with early adoption permitted provided that the entity also adopts SFAS No. 157. The Company will adopt the provisions of SFAS No. 159 on January 1, 2008 and has elected not to apply the fair value option to any of its financial instruments. The Company does not anticipate that it will have a material impact on its financial statements when adopted.
In December 2007, the FASB issued SFAS No. 141R, “Business Combinations” and SFAS No. 160, “Noncontrolling Interests in Consolidated Financial Statements, an amendment of Accounting Research Bulletin No. 51.” SFAS No. 141R will change how business acquisitions are accounted for and will impact financial statements both on the acquisition date and in subsequent periods. SFAS No. 160 will change the accounting and reporting for minority interests, which will be recharacterized as noncontrolling interests and classified as a component of equity. SFAS No. 141R and SFAS No. 160 are effective for fiscal years beginning after December 15, 2008. Early adoption is not permitted. The Company is currently evaluating the impact that SFAS No. 141R and SFAS No. 160 will have on its consolidated financial statements.
T. Certain Significant Risks and Uncertainties
The Company participates in a dynamic high technology industry and believes that changes in any of the following areas could have a material adverse effect on the Company’s future financial position, results of operations or cash flows: advances and trends in new technologies and industry standards; pressures resulting from new applications offered by competitors; changes in certain strategic relationships or customer relationships; litigation or claims against the Company based on intellectual property, patent, product, regulatory or other factors; risk associated with changes in domestic and international economic or political conditions or regulations; availability of necessary product components; and the Company’s ability to attract and retain employees necessary to support its growth.
U. Foreign Currency Translation
The U.S. dollar is the reporting currency for all periods presented. The financial information for entities outside the United States is measured using local currency as the functional currency. Assets and liabilities are translated into U.S. dollars at the exchange rate in effect on the respective balance sheet dates. Income statement balances are translated into U.S. dollars based on the average rate of exchange for the corresponding period. Exchange rate differences resulting from translation adjustments are accounted for as a component of accumulated other comprehensive income (loss). Gains or losses, whether realized or unrealized, due to transactions in foreign currencies are reflected in the consolidated statements of operations under the line item other expense and to date have not been material.
63
V. Advertising Expense
Advertising costs are expensed as incurred. Advertising expense was $1.7 million, $1.0 million and $0.9 million for the years ended December 31, 2005, 2006 and 2007, respectively.
W. Stock-Based Compensation
The Company has a stock-based compensation plan, which is described in Note 7. Prior to January 1, 2006, the Company accounted for options granted to employees and directors using the intrinsic-value-based method in accordance with Accounting Principles Board Opinion No. 25, “Accounting for Stock Issued to Employees” or APB No. 25, and Financial Accounting Standards Board Interpretation No. 44, “Accounting for Certain Transactions Involving Stock Compensation, an Interpretation of APB Opinion No. 25” or FIN 44, and had adopted the disclosure only provisions of SFAS No. 123, “Accounting for Stock-Based Compensation” or SFAS No. 123 and SFAS No. 148, “Accounting for Stock-Based—Compensation Transition and Disclosure” or SFAS No. 148.
Under APB No. 25, stock-based employee and director compensation arrangements were accounted for using the intrinsic-value method based on the difference, if any, between the estimated fair value of the Company’s common stock and the exercise price on the date of grant. All options granted were intended to be exercisable at a price per share not less than fair market value of the shares of the Company’s common stock underlying those options on their respective dates of grant. The Company’s board of directors determined these exercise prices in good faith based on the best information available to the Company’s board of directors and its management at the time of the grant. Certain options were subject to variable accounting in all periods presented.
Effective January 1, 2006, the Company adopted the fair value recognition provisions of SFAS No. 123R, “Share-Based Payment” or SFAS No. 123R, using the prospective transition method, which requires the Company to apply the provisions of SFAS No. 123R only to new awards granted, and to awards modified, repurchased or cancelled, after the adoption date. Under this transition method, stock-based compensation expense recognized beginning January 1, 2006 is based on the grant date fair value of stock option awards granted or modified after January 1, 2006. As a result of independent sales of common stock in February 2007, the Company performed a retrospective calculation of the fair value of option grants made since January 1, 2006. The Company’s operating loss, loss before taxes and net loss for fiscal 2006 and 2007 was $120,000 and $6.7 million higher, respectively, than if it had continued to account for stock-based compensation under APB No. 25. Basic and diluted loss per share for fiscal 2006 and 2007 were each $0.02 and $0.69 higher, respectively, than if it had continued to account for stock-based compensation under APB No. 25.
In November 2007, the Company entered into amendments to outstanding stock options with two of its named executive officers increasing the exercise prices of certain stock options subject to variable accounting under APB No. 25. This action resulted in a substantive modification under SFAS No. 123(R) and at the date of this modification the intrinsic value amount was fixed, and will be recognized as stock compensation expense over the remaining service period.
The Company accounts for compensation expense related to stock options granted to consultants and other non-employees based on the fair values estimated using the Black-Scholes model on the date of grant and re-measured at each reporting date in compliance with Emerging Issues Task Force Issue No. 96-18 “Accounting for Equity Instruments That Are Issued to Other Than Employees for Acquiring, or in Conjunction with Selling, Goods or Services.” The compensation expense is amortized using the straight-line method over the related service term.
X. Common and Convertible Preferred Stock Split
On December 4, 2007, the Company effected a one-for-twenty reverse stock split affecting all outstanding shares of common stock, convertible preferred stock, stock options and warrants of the Company. All references
64
in the accompanying consolidated financial statements and notes thereto have been retroactively restated to reflect the reverse stock split.
3. NETSUITE KABUSHIKI KAISHA
In March 2006, the Company formed NetSuite Kabushiki Kaisha, or NetSuite KK, a subsidiary of the Company, in order to market and sell applications and services of the Company in Japan. The Company and NetSuite KK entered into a Distribution Agreement in which the Company granted NetSuite KK exclusive rights with respect to the business of providing the Company’s on-demand application service in the Japanese market.
In March 2006, the Company and NetSuite KK entered into a Share Purchase Agreement, a Development Fund Agreement and a Preferred Reseller Agreement with TCI, an unrelated Japanese firm. Pursuant to the Share Purchase Agreement, TCI acquired a 20% ownership interest in NetSuite KK. Under the terms of the Development Fund Agreement, the Company is required to undertake its best efforts to provide localization of the Company’s on-demand application service for the Japanese market. The Preferred Reseller Distribution Agreement provides TCI with a three-year right to distribute the localized on-demand application service in the Japanese market with certain favorable pricing terms. In conjunction with these agreements, the Company and NetSuite KK received $16.5 million from TCI, including $1.5 million in prepaid royalties, the unused portions of which are refundable upon the termination or expiration of the agreements.
In October 2006, the Company and NetSuite KK entered into a similar Share Purchase Agreement, Development Fund Agreement and Preferred Reseller Agreement with MJS, an unrelated Japanese firm. Pursuant to the Share Purchase Agreement, MJS acquired a 5% ownership interest in NetSuite KK. Under the terms of the Development Fund Agreement, the Company is again required to undertake its best efforts to provide localization of the Company’s on-demand applications for the Japanese market. The Preferred Reseller Distribution Agreement provides MJS with a five-year right to distribute the localized product in the Japanese market with the same favorable pricing terms as those granted to TCI. In conjunction with these agreements, the Company and NetSuite KK received $4.1 million from MJS, including $394,000 in prepaid royalties, the unused portions of which are refundable upon the termination or expiration of the agreements. Also in October 2006, TCI invested a further $0.5 million in NetSuite KK to maintain its 20% ownership interest and Inspire Corporation, an unrelated financial investor, purchased a 3% ownership interest in NetSuite KK for $807,000. As a result of these transactions, the Company owned 72% of NetSuite KK at December 31, 2006 and 2007, respectively.
As the prepaid royalties are refundable, the aggregate proceeds received from TCI and MJS were reduced by this amount to determine the fixed and determinable amount received from the parties. The Company then determined that there were two remaining elements to be valued in this arrangement: the equity investment and the favorable distribution rights. In order to allocate the aggregate consideration received from TCI and MJS among these two components, the Company has determined the fair value of the elements by valuing NetSuite KK using a discounted cash flow method and the preferred pricing terms of the distribution rights using a differential cash flow method. The fair value of the development agreement was determined to not be a separate element as neither TCI or MJS received any ownership or rights to the localization of the Company’s on-demand application service other than the right to distribute the service within the Japanese market. The total consideration was then allocated to the two identified components based on relative fair value.
The relative fair value for the favorable distribution rights of $11.4 million was recorded as deferred revenue and will be amortized into revenue ratably over the contractual term of the reseller period beginning with the release of the localized on-demand application service. As localization of the Japanese on-demand application suite was completed in 2007, the Company recognized $2.0 million in revenue related to these agreements in the year ended December 31, 2007. The amounts allocated to the equity investment in NetSuite KK were recorded as equity and minority interest. The amount allocated to prepaid royalties has been recorded as a distributor advance in current liabilities.
65
In conjunction with the agreements with TCI and MJS, the Company agreed to pay a commission fee to an independent party who brokered the transaction. This commission payment was allocated to favorable distribution rights and the equity investment based on their relative fair value. The amount allocated to equity was accounted for as an issuance cost and the amount allocated to the distribution rights has been recorded as deferred commission. On any future sales of stock by NetSuite KK, any difference between the excess of the proceeds over the Company’s basis in the stock will be accounted for as an adjustment to stockholders’ equity.
4. LINE OF CREDIT
In September 2005, the Company entered into a $10.0 million secured line of credit agreement with Tako Ventures, LLC, which was then the Company’s majority stockholder. This agreement was amended in March 2006 to increase the amount available for borrowing to $20.0 million. The interest rate at December 31, 2006 and 2007 was 9.25% and 8.50%, respectively. The line of credit was collateralized by substantially all of the Company’s assets. The outstanding debt was retired in December 2007 with proceeds from the Company’s initial public offering. The line of credit expired in February 2008.
Outstanding borrowings as of December 31, 2006 and 2007 were $7.0 million and zero, respectively. The weighted average interest rate on the borrowings outstanding for the years ended December 31, 2005, 2006, and 2007 was 7.8%, 8.7%, and 9.1%, respectively.
5. COMMITMENTS AND CONTINGENCIES
Long-term debt
On October 31, 2007, the Company entered into a perpetual software license agreement with Oracle USA, Inc. to license Oracle database and application server software, along with technical support. This license agreement has a forty-two month term that allows the Company to download an unlimited number of licenses which are perpetual in nature and was financed by Oracle USA, Inc. The current and long-term portions of the note payable in the amounts of $1.3 million and $2.6 million as of December 31, 2007, respectively, have been recorded in “Other current liabilities” and “Other long term liabilities,” respectively, on the consolidated balance sheets as of December 31, 2007. The note bears interest at a rate of 6.20 % per annum. The principal amounts due on the notes for the years ended December 31, 2008, 2009, and 2010 are $1.3 million, $1.4 million, and $1.2 million, respectively.
Lease Commitments
The Company leases computer equipment and purchased software under capital lease agreements that expire through April 2010. Total amounts financed under these capital leases was $1.2 million and $0.7 million at December 31, 2006 and 2007, respectively, net of accumulated amortization of $0.9 million and $223,000, respectively. The current and long-term portions of the capital leases have been recorded in “Other current liabilities” and “Other long term liabilities,” respectively on the consolidated balance sheets as of December 31, 2006 and 2007. The current and long-term portions of capital leases totaled $0.7 million and $95,000 as of December 31, 2006, and $229,000 and $225,000 as of December 31, 2007, respectively. Amortization of assets recorded under the capital lease is included in depreciation expense.
The Company also has several non-cancelable operating leases, primarily for its facilities, that expire through 2013. Certain of these leases contain renewal options for periods ranging from two to five years and require the Company to pay all executory costs such as maintenance, taxes, and insurance. The Company also subleases a portion of its facilities under agreements that expire in periods through 2010. The Company’s corporate headquarters is located in San Mateo, California and such lease expires in 2012. In addition, the Company also leases office space in the United Kingdom, Canada, Singapore, Philippines, Australia, and Japan, which expire on various dates from 2008 through 2013. Minimum rent payments under operating leases are recognized on a straight-line basis over the term of the lease including any periods of free rent and rent concessions.
66
Future minimum lease payments under non-cancelable operating leases (with initial or remaining lease terms in excess of one year) and the future minimum capital lease payments as of December 31, 2007 are as follows (in thousands):
| | | | | | |
Years Ending December 31 | | Capital
Leases | | Operating
Leases |
2008 | | $ | 258 | | $ | 4,344 |
2009 | | | 163 | | | 3,258 |
2010 | | | 81 | | | 2,179 |
2011 | | | — | | | 2,226 |
2012 | | | — | | | 1,721 |
Thereafter | | | — | | | 462 |
| | | | | | |
Future minimum lease payments | | | 502 | | $ | 14,190 |
| | | | | | |
Amount representing interest | | | 48 | | | |
| | | | | | |
Present value of future minimum lease payments | | | 454 | | | |
Less current portion | | | 229 | | | |
| | | | | | |
Long-term portion | | $ | 225 | | | |
| | | | | | |
Rental expense for operating leases (except those with lease terms of a month or less that were not renewed), net of sublease income, was $1.9 million, $2.2 million and $2.8 million for the years ended December 31, 2005, 2006 and 2007, respectively. Sublease income was not material for any of the periods presented.
Sales and Use Taxes
Based on the services provided to customers in certain states, and subsequent research of the applicable statutes, regulations, rulings and other authority, the Company has determined that it is both probable and estimable that the Company owes sales and use tax in various states and local jurisdictions. Historically, the Company did not collect sales and use taxes from its customers and accordingly, has provided for amounts including applicable penalties and interest that are considered reasonably estimable. During the first quarter of 2007, the Company began to charge sales taxes to its customers. Sales tax liabilities totaled $2.0 million and $1.9 million as of December 31, 2006 and 2007, respectively. The previously established liability was reduced by $1.1 million during the second quarter of 2007 as a result of a favorable administrative court ruling. Subsequently, that favorable ruling was reversed on appeal and as a result a liability was reinstated for the agreed settlement amount which was included in the December 31, 2007 liability balance.
Legal Proceedings
The Company is not currently subject to any material legal proceedings. From time to time, however, the Company is named as a defendant in legal actions arising from normal business activities. Although the Company cannot accurately predict the amount of its liability, if any, that could arise with respect to currently pending legal actions, it is not expected that any such liability will have a material adverse effect on the Company’s financial position, operating results or cash flows.
67
6. BALANCE SHEET COMPONENTS
A. Cash and Cash Equivalents
Cash and cash equivalents as of December 31, 2006 and 2007 consist of:
| | | | | | |
| | | Year Ended
December 31, |
| | | 2006 | | 2007 |
Cash | | $ | 9,910 | | $ | 11,461 |
Money Market Mutual Funds | | | — | | | 157,947 |
| | | | | | |
Cash and cash equivalents | | $ | 9,910 | | $ | 169,408 |
| | | | | | |
B. Property and Equipment
Property and equipment as of December 31, 2006 and 2007 consists of:
| | | | | | | | |
| | | Year Ended
December 31, | |
| | | 2006 | | | 2007 | |
Computer equipment | | $ | 9,479 | | | $ | 13,329 | |
Purchased software | | | 3,265 | | | | 8,386 | |
Internally developed software | | | 2,652 | | | | 2,760 | |
Leasehold improvements | | | 1,325 | | | | 1,841 | |
Furniture and fixtures | | | 1,182 | | | | 1,356 | |
Office equipment | | | 452 | | | | 628 | |
| | | | | | | | |
Total property and equipment | | | 18,355 | | | | 28,300 | |
| | | | | | | | |
Accumulated depreciation and amortization | | | (12,842 | ) | | | (16,232 | ) |
| | | | | | | | |
Property and equipment—net | | $ | 5,513 | | | $ | 12,068 | |
| | | | | | | | |
Depreciation and amortization expense was $2.2 million, $2.6 million and $3.4 million for the years ended December 31, 2005, 2006 and 2007, respectively.
Fixed assets as of December 31, 2006 and 2007 included $1.2 million and $0.7 million, respectively, recorded under capital lease agreements. Accumulated depreciation and amortization relating to equipment and software under capital leases totaled $0.9 million and $223,000 as of December 31, 2006 and 2007, respectively.
7. CONVERTIBLE PREFERRED STOCK AND STOCKHOLDERS’ EQUITY (DEFICIT)
Common Stock and Preferred Stock Authorized Shares
At September 30, 2007, the Company had authorized 100,000,000 shares of common stock and 35,317,174 of convertible preferred stock. During the quarter ended December 31, 2007 and in association with the initial public offering, the Company re-incorporated in the State of Delaware and amended its post initial public offering certificate of incorporation to set the authorized capital stock of the Company at 525,000,000 at a par value of $0.01 per share, comprised of 500,000,000 shares of common stock and 25,000,000 of preferred stock. Each share of common stock shall entitle the holder thereof to one vote on each matter submitted to a vote at any meeting of stockholders.
Initial Public Offering
In December 2007, the Company completed the sale of 6,765,000 shares of common stock, which includes the underwriters’ exercise of an over-allotment option, at a price of $26.00 a share. A total of $175.9 million in
68
gross proceeds was raised in this initial offering. After deducting the underwriting discount of $10.1 million, and offering expenses of $3.9 million, net proceeds were $161.9 million.
Preferred Stock
After the consummation of the Company’s initial public offering in December 2007 and the filing of the Company’s amended and restated certificate of incorporation, the Company’s board of directors has the authority, without further action by stockholders, to issue up to 25,000,000 shares of preferred stock in one or more series, to fix the number of shares of any such series and the designation thereof and to fix the rights, preferences, privileges and restrictions granted to or imposed upon such preferred stock, including dividend rights, dividend rate, conversion rights, voting rights, rights and terms of redemption, redemption prices, liquidation preference and sinking fund terms, any or all of which may be greater than or senior to the rights of the common stock. The issuance of preferred stock could adversely affect the voting power of holders of common stock and reduce the likelihood that such holders will receive dividend payments and payments upon liquidation. Such issuance could have the effect of decreasing the market price of the common stock. The issuance of preferred stock or even the ability to issue preferred stock could have the effect of delaying, deterring or preventing a change in control. At December 31, 2007, no shares of preferred stock were outstanding.
Convertible Preferred Stock
In March and April 2005, the Company received net proceeds of approximately $15.0 million, net of issuance costs of $41,000, from the sale of 7,281,547 shares of Series H preferred stock. The Company’s convertible preferred stock were reported at their respective issuance date fair values in the accompanying consolidated balance sheets. A merger or consolidation of the Company into another entity or the merger of any other entity into the Company in which the stockholders of the Company own less than a majority of the outstanding voting stock of the surviving company or sale of all or substantially all of the assets of the Company would have been deemed a liquidation, dissolution or winding up of the Company. Because certain liquidation events were within the control of the Company’s majority convertible preferred stockholder, the convertible preferred stock was classified outside of the stockholders’ deficit section of the balance sheet in accordance with EITF Topic No. D-98, “Classification and Measurement of Redeemable Securities.”
In December 2007, the Company completed its initial public offering and converted all 33.8 million preferred shares that were previously outstanding into 44.7 million shares of common stock in accordance with the terms of such instruments.
Common Stock Warrants
In June 2000, in conjunction with an equipment lease, the Company issued warrants with a contractual life of 10 years to a lender to purchase 1,633 shares of Series C preferred stock at $45.926 per share. The warrants were not exercised as of December 19, 2007, the date of the IPO, and subsequently became exercisable for 9,522 shares of common stock with an exercise price of $7.88 per share. The fair value of the warrants was estimated on the date of grant and amortized over the nine-month term of the equipment lease. The warrant was fully vested and exercisable at the date of grant.
Notes Receivable from Stockholders
In October 2005, 4,359,444 shares of common stock were issued to officers of the Company upon exercise of stock options in exchange for full-recourse promissory notes. The stock options issued to these officers were modified by the Company’s board of directors in March 2005 to allow exercise pursuant to promissory notes that are at least 51% recourse and bear interest of at least 5%.
These notes bore interest at a rate of 5% annually and were repayable along with accrued and unpaid interest on the earlier of (i) September 15, 2010, (ii) termination of employment for any reason, (iii) immediately prior
69
the closing of any consolidation, merger, reorganization, sale of all or substantially all of the assets of the Company, and (iv) the date on which the Company filed a registration statement with the Securities and Exchange Commission.
The shares were restricted and their restrictions lapsed on a graded basis as the employee performed services for the Company over a four-year period. Restricted shares are subject to repurchase by the Company at the original issue price in the event the employee terminates prior to vesting. For accounting purposes, the restricted shares of common stock are not deemed to be issued until the restriction lapses because the employee does not bear the risks and rewards of share ownership until such time. Consequently, unvested shares are excluded from the shares of common stock outstanding at each balance sheet date and the earnings per share computation for each respective period.
As a result of the modification noted above and since the 5% interest rate on each note was determined to not represent a market rate at the time the shares vest, the fair value of the notes may fluctuate and differ from the stated exercise price of the shares at each vesting date. Accordingly, each award was subject to variable accounting whereby compensation cost was measured as the excess of the fair value of the shares over the fair value of the notes until the shares vest.
For the years ended December 31, 2005, 2006 and 2007, the Company recorded compensation expense for these shares of $22.4 million, $15.1 million and $10.8 million, respectively.
In December 2006, additional full-recourse promissory notes were issued with the same terms as described above in exchange for the exercise of stock options by officers and employees. As with the promissory notes issued in 2005, the interest rate was deemed to be lower than the market rate at the date of issuance. Accordingly, stock compensation was recorded based on a modification of terms under SFAS 123R and is being amortized over the remaining requisite vesting period. Compensation cost related to these restricted shares of common stock for the years ended December 31, 2006 and 2007 was immaterial.
During the year ended December 31, 2007 all notes receivable from stockholders, which totaled $4.4 million as of December 31, 2006, were repaid to the Company.
In November 2007, the Company entered into amendments to outstanding stock options with two of its named executive officers increasing the exercise prices of certain stock options subject to variable accounting under APB No. 25. This action resulted in a substantive modification under SFAS No. 123(R) and at the date of this modification the intrinsic value amount was fixed, and will be recognized as stock compensation expense over the remaining service period.
Stock Plans
1999 Stock Plan
In December 1999, the 1999 Stock Plan or the “1999 Plan” was approved by the Board of Directors. Under the 1999 Plan, as amended on June 27, 2007, up to 16,260,750 options may be granted to employees, directors and consultants, as incentive or nonstatutory options. Incentive stock options are granted only to employees. If the optionee, at the time the option is granted, owns stock totaling more than 10% of the total combined voting rights of all classes of stock of the Company, the option price of incentive stock options shall not be less than 110% of the fair value of the shares on the date of grant. Incentive and nonstatutory stock options shall become exercisable as determined by the Board of Directors and documented in writing through an option agreement with the optionee. Options granted generally vest over a four year period. Options expire 10 years from the date of grant. The Company uses authorized and unissued shares to satisfy share option exercises. In the event of termination, the Company has the right to cancel any vested options not exercised as defined. In connection with the closing of the initial public offering on December 19, 2007, the Company no longer grants new shares under the 1999 Stock Plan. However, canceled options under the 1999 plan will be returned to the 2007 Stock Plan and are available for future grants.
70
2007 Stock Plan
On June 27, 2007, the Company’s Board of Directors adopted the 2007 Equity Incentive Plan, or the 2007 Plan. A total of 2,375,000 shares of common stock have been authorized for issuance pursuant to the 2007 Plan, which became effective on December 24, 2007. The Plan permits the Company to grant the following types of awards: incentive stock options, nonstatutory stock options, restricted stock, restricted stock units, stock appreciation rights, performance units, and performance shares. Restricted stock and restricted stock unit awards (collectively referred to as restricted awards) generally vest based on the attainment of certain performance objectives, the passage of time, or a combination of both, subject to continued employment through the applicable vesting period. The exercise price for options is the fair market value of an underlying share of common stock on the date of grant. However, if an optionee, at the time the option is granted, owns stock totaling more than 10% of the total combined voting rights of all classes of stock of the Company (a “10% Owner”), the exercise price for any incentive stock option granted to such optionee shall not be less than 110% of the fair value of an underlying share of common stock on the date of grant. Incentive and nonstatutory stock options shall become exercisable as determined by the administrator and documented in writing through an option agreement with the optionee. Options generally vest over a four year period and have a term of 10 years from the date of grant, except incentive stock options granted to 10% Owners that have a maximum term of 5 years. Stock appreciation rights must be granted with an exercise price equal to the fair market value of an underlying share of common stock on the date of grant. Such stock appreciation rights may be granted separately or in tandem with stock option awards and generally are otherwise subject to the same provisions as option awards. Performance awards generally consist of grants made subject to the attainment of one or more performance goals during a specified performance period. The performance goals are established by the administrator and may be based upon one or more business criteria that apply to the individual employee, or the company as a whole. The administrator may amend or terminate the 2007 Plan in response to any legal requirements or for any other purpose permitted by law; provided, however, no amendment that would adversely affect the rights of a participant may be made without the consent of the participant, and no amendment may be effective prior to its approval by the stockholders of the company if legally required. In addition, the 2007 Plan provides for annual increases in the number of shares available for issuance thereunder on the first day of each fiscal year, beginning in 2009, equal to the least of a) 9,000,000 shares of the Company’s common stock; b) 3.5% of the Company’s aggregate common stock outstanding plus common stock issuable pursuant to outstanding awards under the Company’s equity plans; or c) such other amount as the board of directors may determine.
A summary of the Company’s stock option activity is as follows:
| | | | | | | |
| | | Number of
Options | | | Weighted Average
Exercise Price | |
Outstanding, December 31, 2004 | | 10,138,772 | | | | | |
Granted | | 3,875,891 | | | $ | 2.36 | |
Exercised | | (5,327,559 | ) | | $ | (0.68 | ) |
Canceled | | (624,188 | ) | | $ | (0.76 | ) |
| | | | | | | |
Outstanding, December 31, 2005 | | 8,062,916 | | | | | |
Granted | | 250,278 | | | $ | 6.84 | |
Exercised | | (2,062,534 | ) | | $ | (0.74 | ) |
Canceled | | (364,917 | ) | | $ | (1.70 | ) |
| | | | | | | |
Outstanding, December 31, 2006 | | 5,885,743 | | | | | |
Granted | | 3,054,310 | | | $ | 13.98 | |
Exercised | | (522,124 | ) | | $ | (2.27 | ) |
Canceled | | (178,815 | ) | | $ | (5.45 | ) |
| | | | | | | |
Outstanding, December 31, 2007 | | 8,239,114 | | | | | |
| | | | | | | |
At December 31, 2007, 2,069,341 options were available for future grants under the 2007 Stock Plan.
71
Additional information regarding options outstanding as of December 31, 2007, is as follows:
| | | | | | | | | | | | |
| | | Options Outstanding | | Options Exercisable |
Range of Exercise Prices | | Number of
Options | | Weighted-
Average
Remaining
Contractual
Life (Years) | | Weighted-
Average
Exercise Price | | Number of
Options | | Weighted-
Average
Exercise Price |
$0.00* | | 4,651 | | 9.97 | | $ | 0.00 | | — | | | — |
$0.60 – $0.70 | | 2,922,044 | | 5.88 | | $ | 0.67 | | 2,890,953 | | $ | 0.67 |
$1.00 | | 1,058,413 | | 7.38 | | $ | 1.00 | | 846,085 | | $ | 1.00 |
$5.00 – $7.00 | | 1,516,924 | | 8.22 | | $ | 5.51 | | 475,458 | | $ | 5.33 |
$12.40 | | 1,283,529 | | 9.48 | | $ | 12.40 | | 942,302 | | $ | 12.40 |
$13.50 – $26.00 | | 1,453,553 | | 9.95 | | $ | 16.78 | | 81,815 | | $ | 13.58 |
| | | | | | | | | | | | |
Total | | 8,239,114 | | 7.78 | | $ | 6.27 | | 5,236,613 | | $ | 3.46 |
| | | | | | | | | | | | |
| * | Reflects restricted stock grants |
Options exercisable at December 31, 2007 have a weighted-average remaining contractual term of 7.0 years.
Options outstanding that have vested and are expected to vest are as follows:
| | | | | | | | | | |
| | | Number of
Shares | | Weighted-
Average Price | | Weighted
Average
Remaining
Contractual
Term | | Aggregate
Intrinsic Value (1) |
| | | | | | | (Years) | | (In thousands) |
As of December 31, 2007 | | 7,832,900 | | $ | 6.06 | | 7.7 | | $ | 259,407 |
| (1) | This amount represents the difference between the exercise price and the fair market value of common stock for all in-the-money options outstanding that have vested and are expected to vest as of December 31, 2007. |
The total intrinsic value of the options exercised during the years ended December 31, 2005, 2006 and 2007 was $19.1 million, $13.8 million and $5.2 million, respectively.
The Company uses the Black-Scholes pricing model to determine the fair value of stock options. The determination of the fair value of stock-based payment awards on the date of grant using a pricing model is affected by assumptions regarding a number of complex and subjective variables. These variables include the Company’s expected stock price volatility over the term of the awards, actual and projected employee stock option exercise behaviors, risk-free interest rates and expected dividends. The estimated grant date fair values of the employee stock options were calculated using the Black-Scholes valuation model, based on the following assumptions for the year ended December 31, 2007:
| | |
| | | Year Ended
December 31, 2007 |
Weighted average expected term (in years) | | 4.82 – 6.27 |
Expected stock price volatility | | 49 – 55% |
Risk-free interest rate | | 3.45 – 5.0% |
Expected dividend yield | | 0% |
Weighted Average Expected Term. The Company utilized the midpoint between vesting date and contractual expiration date to determine expected term, in accordance with Staff Accounting Bulletin No. 107.
Volatility. Since the Company is a newly public entity with limited historical data regarding the volatility of its own common stock price, the expected volatility being used is based on the historical and implied volatility of comparable companies from a representative industry peer group.
72
Risk-Free Interest Rate. The risk-free interest rate is based on U.S. Treasury zero-coupon issues with remaining terms similar to the expected term on the options.
Dividend Yield. The Company has never declared or paid any cash dividends and does not plan to pay cash dividends in the foreseeable future, and, therefore, used an expected dividend yield of zero in the valuation model.
Forfeitures. SFAS No. 123R also requires the Company to estimate forfeitures at the time of grant and to revise those estimates in subsequent periods if actual forfeitures differ from those estimates. The Company uses historical data to estimate pre-vesting option forfeitures and records stock-based compensation expense only for those awards that are expected to vest. All stock-based payment awards are amortized on a straight-line basis over the requisite service periods of the awards, which are generally the vesting periods. If the Company’s actual forfeiture rate is materially different from its estimate, the stock-based compensation expense could be significantly different from what the Company has recorded in the current period.
The weighted average grant date fair value of options granted to employees for the year ended December 31, 2007 was $8.94. As of December 31, 2007, there was $19.7 million of total unrecognized compensation cost, adjusted for estimated forfeitures, related to non-vested stock options. That cost is expected to be recognized over a weighted average period of 3.8 years.
Early Exercise of Employee Options
In accordance with EITF No. 00-23, Issues Related to the Accounting for Stock Compensation under APB No. 25, and FIN No. 44, shares purchased by employees pursuant to the early exercise of stock options are not deemed to be issued until all restrictions on such shares lapse. The EITF reached a consensus that these guidelines should be applied to stock option awards granted or modified after March 21, 2002. Therefore, cash received in exchange for exercised and restricted shares related to stock options granted after that date is recorded as a liability for early exercise of stock options on the accompanying consolidated balance sheets, and will be transferred into common stock and additional paid-in capital as the restrictions on such shares lapse. As of December 31, 2006, there were 923,907 shares outstanding as a result of the early exercise of options that were reclassified as approximately $0.7 million and $125,000 in current and long-term liabilities, respectively. As of December 31, 2007, there were 116,114 shares outstanding as a result of the early exercise of options, reclassified as approximately $116,000 and $36,000 in current and long-term liabilities, respectively.
Common Stock Reserved for Future Issuance
At December 31, 2007, the Company has reserved shares of common stock for issuance as follows:
| | |
Options available and outstanding under stock option plans | | 10,308,455 |
Common stock warrants issued and outstanding | | 9,522 |
| | |
Total | | 10,317,977 |
| | |
8. NET LOSS PER SHARE
Basic net loss per common share is computed by dividing net loss attributable to common stockholders by the weighted average number of common shares outstanding during the period less the weighted average number of unvested common shares subject to the Company’s right of repurchase. Diluted net loss per common share is computed by giving effect to all potential dilutive common shares, including options, common stock subject to repurchase, warrants and convertible preferred stock. Basic and diluted net loss per common share were the same for all periods presented as the impact of all potentially dilutive securities outstanding was anti-dilutive.
73
The following table presents the calculation of historical basic and diluted net loss per common share (in thousands except for Net loss per common share, basic and diluted):
| | | | | | | | | | | | |
| | | Year Ended December 31, | |
| | | 2005 | | | 2006 | | | 2007 | |
Net loss attributable to common stockholders | | $ | (57,664 | ) | | $ | (35,722 | ) | | $ | (23,906 | ) |
| | | | | | | | | | | | |
Weighted average number of common shares outstanding | | | 2,318 | | | | 6,430 | | | | 10,213 | |
Less: Weighted average number of common shares subject to repurchase | | | (258 | ) | | | (863 | ) | | | (439 | ) |
| | | | | | | | | | | | |
Weighted average number of common shares outstanding used in computing basic and diluted net loss per common share | | | 2,060 | | | | 5,567 | | | | 9,774 | |
| | | | | | | | | | | | |
Net loss per common share, basic and diluted | | $ | (27.99 | ) | | $ | (6.42 | ) | | $ | (2.45 | ) |
| | | | | | | | | | | | |
Outstanding common stock purchased by employees subject to repurchase by the Company is not included in the calculation of the weighted-average shares outstanding for basic earnings per share.
The following outstanding shares subject to options and warrants to purchase common stock, common stock subject to repurchase, convertible preferred stock and shares subject to warrants to purchase convertible preferred stock were excluded from the computation of diluted net loss per common share for the periods presented because including them would have had an anti-dilutive effect (in thousands):
| | | | | | |
| | | Year Ended December 31, |
| | | 2005 | | 2006 | | 2007 |
Shares underlying options to purchase common stock | | 8,063 | | 5,886 | | 8,239 |
Shares subject to warrants to purchase common stock | | 10 | | 10 | | 10 |
Common stock subject to repurchase | | 1,104 | | 924 | | 116 |
Convertible preferred stock (as if-converted basis) | | 44,677 | | 44,677 | | — |
| | | | | | |
Total | | 53,854 | | 51,497 | | 8,365 |
| | | | | | |
9. INCOME TAXES
The provision for income taxes consists of the following (in thousands):
| | | | | | | | | | | | |
| | | December 31, | |
| | | 2005 | | | 2006 | | | 2007 | |
Loss before income taxes and minority interest: | | | | | | | | | | | | |
Domestic | | $ | (58,469 | ) | | $ | (35,618 | ) | | $ | (23,591 | ) |
Foreign | | | 1,204 | | | | 299 | | | | (195 | ) |
| | | | | | | | | | | | |
Total | | $ | (57,265 | ) | | $ | (35,319 | ) | | $ | (23,786 | ) |
| | | | | | | | | | | | |
| |
| | | December 31, | |
| | | 2005 | | | 2006 | | | 2007 | |
Current taxes: | | | | | | | | | | | | |
Federal | | $ | — | | | $ | — | | | $ | — | |
State | | | — | | | | — | | | | — | |
Foreign | | | 399 | | | | 643 | | | | 734 | |
| | | | | | | | | | | | |
| | $ | 399 | | | $ | 643 | | | $ | 734 | |
| | | | | | | | | | | | |
74
A reconciliation of the statutory U.S. federal income tax rate to the Company’s effective income tax rate is as follows:
| | | | | | | | | |
| | | December 31, | |
| | | 2005 | | | 2006 | | | 2007 | |
Federal statutory income tax rate | | (35.0 | )% | | (35.0 | )% | | (35.0 | )% |
State tax, net of federal benefit | | (4.21 | ) | | (4.61 | ) | | (1.29 | ) |
Foreign rate differential | | 0.64 | | | 1.48 | | | 1.64 | |
Stock options | | 4.41 | | | 6.84 | | | 10.87 | |
Research and development credit | | (0.74 | ) | | (1.48 | ) | | (0.98 | ) |
Valuation allowance | | 35.61 | | | 34.60 | | | 27.33 | |
Meals and entertainment | | 0.12 | | | 0.39 | | | 0.67 | |
Other permanent difference | | (0.13 | ) | | (0.40 | ) | | (0.16 | ) |
| | | | | | | | | |
Effective income tax rate | | 0.70 | % | | 1.82 | % | | 3.08 | % |
| | | | | | | | | |
Net deferred tax assets consist of the following (in thousands):
| | | | | | | | |
| | | December 31, | |
| | | 2006 | | | 2007 | |
Deferred tax assets: | | | | | | | | |
Property and equipment | | $ | 192 | | | $ | (11 | ) |
Deferred revenue | | | 8,917 | | | | 8,025 | |
Other reserves and accruals | | | 2,296 | | | | 2,277 | |
Stock options | | | 4,160 | | | | 7,540 | |
Federal operating loss carryforwards | | | 56,830 | | | | 59,468 | |
State and foreign net operating loss carryforwards | | | 7,265 | | | | 8,459 | |
Research and development credits | | | 5,324 | | | | 4,081 | |
| | | | | | | | |
Deferred tax assets | | | 84,984 | | | | 89,839 | |
Valuation allowance | | | (84,984 | ) | | | (89,839 | ) |
| | | | | | | | |
Net deferred tax assets | | $ | — | | | $ | — | |
| | | | | | | | |
As of December 31, 2007, the Company had approximately $169.9 million of federal and $124.3 million of state net operating loss carryforwards available to offset future taxable income, respectively. The federal net operating loss carryforwards expire in varying amounts between 2018 and 2027. The California net operating loss carryforwards expire in varying amounts between 2008 and 2017. The net operating losses include $83,000 relating to the tax benefit of stock option exercises which when realized will be recorded as a credit to additional paid-in capital.
The Company also had approximately $3.9 million of federal and $2.6 million of state research and development tax credit carryforwards for 2007, and $58,000 of Manufacturer Investment Credit carryforwards. The federal credits expire in varying amounts between 2019 and 2027. The California research credits do not expire and the Manufacturer Investment Credits for California expire in varying amounts between 2009 and 2013.
The Company’s ability to utilize the net operating loss and tax credit carryforwards in the future may be subject to substantial restriction in the event of past or future ownership changes as defined in Section 382 of the Internal Revenue code and similar state tax law.
As a result of continuing losses, management has determined that it is more likely than not that the Company will not realize the benefits of the deferred tax assets and therefore has recorded a valuation allowance to reduce the carrying value of the deferred tax assets to zero.
75
The Company considers all undistributed earnings of its foreign subsidiaries to be permanently invested in foreign operations. Accordingly, no deferred tax liabilities have been recorded in this regard.
The Company adopted the provisions of FASB Interpretation No. 48, “Accounting for Uncertainty in Income Taxes, an interpretation of FASB Statement 109,” (“FIN 48”) effective January 1, 2007. The adoption of FIN 48 had no impact on the Company’s consolidated financial position. The Company’s only material uncertain tax position identified during the implementation process was its research and development credits. The unrecognized tax benefits related to federal and state research and development credits are recorded as reductions to their associated deferred tax assets. Since the Company has a full valuation allowance against its deferred tax assets, there was no impact to prior year retained earnings.
The following table summarizes the activity during the year ended December 31, 2007 related to unrecognized tax benefits (in thousands):
| | | | |
Beginning Balance-Unrecognized Tax Benefits (gross) | | $ | 1,889 | * |
Increases—current year tax positions | | | 511 | * |
| | | | |
Ending Balance—Unrecognized Tax Benefits (gross) | | $ | 2,400 | |
| | | | |
| * | The state unrecognized tax benefits included in these amounts are reported gross instead of net of federal benefit. |
Total unrecognized tax benefits at December 31, 2007 were $2.4 million. This entire amount, if recognized, would affect the Company’s annual effective tax rate.
The Company does not anticipate either material changes in the total amount or composition of its unrecognized tax benefits within 12 months of the reporting date. The Company has not accrued any interest or penalties related to unrecognized tax benefits as of December 31, 2007.
The Company files federal, state and foreign income tax returns in jurisdictions with varying statutes of limitations. Due to its net operating loss carryforwards, the Company’s income tax returns generally remain subject to examination by federal and most state tax authorities. In significant foreign jurisdictions, the 2004 through 2007 tax years generally remain subject to examination by their respective tax authorities.
10. EMPLOYEE BENEFIT PLANS
The Company has a retirement plan (the Plan) that covers substantially all employees of the Company. The Plan allows employees to contribute gross salary through payroll deductions up to the legally mandated limit in each jurisdiction.
Since 2005, in the United States, Canada and the United Kingdom, the Company has made matching contributions equal to 34% of deferral contributions, up to $3,570 per employee per year. The Company contributed approximately $0.7 million and $0.8 million to the Plan for the years ended December 31, 2006 and 2007, respectively.
The Company will also be responsible for making nationally mandated pension plan payments for the employees of NetSuite Philippines. These payments will not begin until 2011, and are not expected to have a material effect on the Company’s financial position, operating results or cash flows.
11. RELATED PARTY TRANSACTIONS
In April 2005, the Company entered into a software license agreement with Oracle USA, Inc., an affiliate of Oracle. Lawrence J. Ellison, who beneficially owns the Company’s majority stockholder, is the Chief Executive
76
Officer, a principal stockholder and a director of Oracle Corporation. This perpetual license is for the use of Oracle database and application server software on a certain number of individual computers, along with technical support. Under the April 2005 agreement, the Company paid $2.5 million over nine installments, including the final buyout payment, which occurred on June 19, 2007. In May 23, 2007, the Company entered into another software license agreement with Oracle USA, Inc. to license Oracle software for an additional number of computers, along with technical support. The May 2007 agreement calls for payments of $0.9 million over 12 equal quarterly installments through 2010. On October 31, 2007 the Company entered into another perpetual software license agreement with Oracle USA, Inc. to license Oracle database and application server software, along with technical support. This license has a forty-two month term that allows the Company to download an unlimited number of licenses which are perpetual in nature. The Company also purchased the initial 12 months of technical support services under the agreement, which are renewable annually. The October 2007 agreement requires the Company to pay $4.7 million for the net license fees to be paid over 12 equal quarterly installments through 2010 and annual payments of $1.4 million for the technical support fees. The October 2007 agreement replaces the support portion of the product orders made under the April 2005 and May 2007 agreements.
In October 2005, the Company made a loan of $2.2 million to Evan M. Goldberg, its Chief Technology Officer and Chairman of the Board, with an interest rate of 5.00%. In February 2007, Mr. Goldberg repaid $400,000 owed on the loan. In June 2007, Mr. Goldberg repaid the remaining $2.0 million owed on the loan from the Company, which included $200,000 of interest accrued thereon.
In November 2005, June 2007 and October 2007, Mr. Goldberg received loans for $250,000, $2.0 million and $2.5 million at interest rates of 4.04%, 4.64% and 4.20%, respectively, from an entity affiliated with Lawrence J. Ellison. Any compensatory elements of the loans provided to Mr. Goldberg by the entity affiliated with Lawrence J. Ellison are recorded as a contribution to capital by related party and compensation expense. The loans to Mr. Goldberg remained outstanding as of December 31, 2007.
As disclosed in Note 3, in September 2005, the Company entered into a $10.0 million secured line of credit agreement with Tako Ventures, LLC, a California limited liability company and at that time the Company’s majority stockholder. This agreement was amended in March 2006 to increase the amount to $20.0 million. The line of credit was paid off in December 2007 and expired in February 2008. As of December 31, 2006 amounts due under the line of credit was $7.0 million.
Commencing in 2004, the Company entered into a verbal agreement with Oracle Racing, Inc. (Oracle Racing), a sailboat racing syndicate. Lawrence J. Ellison, who beneficially owns the Company’s majority stockholder, is the primary source of funding for Oracle Racing. Under the terms of the agreement, the Company agreed to supply certain of its on-demand application services to Oracle Racing in exchange for logo placement on the sailboats. Based on the pricing for similar licenses to unaffiliated third parties, the Company calculated the fair market value of the services provided to Oracle Racing to be approximately $291,000, $251,000, and $251,000 for 2005, 2006 and 2007, respectively. The Company did not obtain an independent valuation of the logo placement rights received from Oracle Racing. Based on an estimate received from Oracle Racing, the Company determined the value of the logo placement on the sailboat to be approximately $250,000 to $350,000 per year for 2005, 2006 and 2007. The incremental cost to the Company of providing on-demand services and the incremental cost to Oracle Racing of providing logo placement rights on the sailboat was nominal. The on-demand application suite provided to Oracle Racing has been recorded for accounting purposes at historical cost in accordance with SEC Staff Accounting Bulletin No. 5-G, “Transfers of Non-Monetary Assets by Promoters and Shareholders,” and SFAS No. 153, “Exchanges of Non-Monetary Assets—an amendment of APB Opinion No. 29.”
In August 2006, the Company entered into a license agreement with SolarWinds.net, Inc., or SolarWinds. A member of the Company’s Board of Directors, Kevin Thompson, is the Chief Operating Officer, Chief Financial Officer and Treasurer of SolarWinds. Under the terms of the agreement, SolarWinds paid the Company $148,000 and $223,000 in 2006 and 2007, respectively, for the use of its services.
77
In August 2004, the Company entered into a license agreement with FieldGlass Inc. A member of the Company’s Board of Directors, Deborah Farrington, is also a member of the Board of Directors of FieldGlass Inc. Under the terms of the agreement, FieldGlass Inc. paid the Company $71,000, $69,000 and $115,000 in 2005, 2006 and 2007, respectively, for the use of its services.
In July 2004, the Company entered into a License Agreement with the Oakland Athletics (Athletics) with a term of 41 months. The agreement provided for an upfront payment to the Company of $50,000 by the Athletics for the use of its on-demand application services through November 2007. In December 2006, the Company entered into a three-year partnership agreement with the Athletics. Under the terms of the agreement, the Company will pay the Athletics $375,000 over the three-year term of the agreement for certain sponsorship benefits. This agreement also extended the Athletics’ right to use the Company’s service through December 2009 for no additional consideration from the Athletics. For the years ended December 31, 2005, 2006 and 2007, the Company also paid the Athletics $75,000, $110,000 and $100,000, respectively, for advertising and promotional events. William L. Beane III, the General Manager of the Athletics, became a member of the Company’s board of directors in January 2007.
In March 2005, the Company entered into a business agreement with Perquest. A member of the Company’s Board of Directors, Deborah Farrington, is also a member of the Board of Directors of Perquest. Under the business agreement, Perquest became the exclusive backend payroll service provider for the Company’s customers located in the United States. Additionally, Perquest’s payroll and tax service application would be accessible to, and available for use by, the Company’s customers through the NetSuite application. Under the terms of the agreement, we recognized revenues of $118,000 and $438,000 in 2006 and 2007, respectively and recognized costs of $167,000 and $346,000 in 2006 and 2007, respectively. There were no revenues or costs recognized under the business agreement during 2005.
78
| ITEM 9. | CHANGES IN AND DISAGREEMENTS WITH ACCOUNTANTS ON ACCOUNTING AND FINANCIAL DISCLOSURE |
In January 2007, we and Deloitte & Touche LLP, our independent auditors, mutually agreed to terminate Deloitte & Touche LLP’s engagement to audit our financial statements because Deloitte & Touche LLP, or Deloitte, would not qualify as a registered independent accounting firm for us if we were a public company. In January 2007, we engaged KPMG LLP as our new independent registered public accounting firm for the fiscal years ended December 31, 2004, 2005 and 2006. Our board of directors authorized the dismissal of Deloitte and the engagement of KPMG.
Deloitte did not issue any audit reports on our financial statements for the years ended December 31, 2005 and 2006.
During the years ended December 31, 2005 and 2006, and the subsequent period preceding the dismissal of Deloitte in January 2007, there were no disagreements with Deloitte on any matter of accounting principles or practices, financial statement disclosure or auditing scope or procedure, which disagreements, if not resolved to the satisfaction of Deloitte, would have caused it to make reference thereto in its reports on the consolidated financial statements for such periods, if such reports were to have been issued, and there occurred no “reportable events” within the meaning of Item 304(a)(1) of SEC Regulation S-K.
We have provided Deloitte with a copy of the foregoing statements. Deloitte has notified us that they do not disagree with these statements.
During the years ended December 31, 2005 and 2006, and the subsequent period preceding the dismissal of Deloitte in January 2007, neither we nor anyone on our behalf consulted with KPMG regarding any of the matters or events set forth in Item 304(a)(2)(i) or (ii) of SEC Regulation S-K.
| ITEM 9A. | CONTROLS AND PROCEDURES |
Evaluation of Disclosure Controls and Procedures
Based upon an evaluation performed as of June 30, 2007, we and our independent registered public accounting firm identified a material weakness in our internal controls. The material weakness related to the need for additional finance and accounting personnel who possess the skill sets necessary to operate and report as a public company, specifically the skills necessary to ensure that adequate review of critical account reconciliations is performed, that supporting documentation is complete, and that transactions are recorded accurately and in accordance with generally accepted accounting principles.
After the identification of the material weakness we implemented a remediation plan during 2007 to address the weakness. As a part of this remediation plan, we made several key staffing additions that provide additional expertise in financial operations oversight and tax compliance. Furthermore, we contracted with an external public accounting firm to assist in the review of complex accounting issues and we have added additional accounting staff in order to increase capacity. With these additional resources, we believe that as of December 31, 2007, we have the resources necessary to remediate the material weakness. Subsequent to year end, we have also added additional staff with expertise in financial reporting and Sarbanes-Oxley compliance.
These remedial steps will need to be placed in operation for a sufficient period of time before we can evaluate the overall effectiveness of our remediation plan and be able to conclude that the material weakness has been remediated. We expect to reach such a conclusion as of March 31, 2008.
An evaluation was performed by management, with the participation of our CEO and our CFO, of the effectiveness of our disclosure controls and procedures as of December 31, 2007 (as defined in Rules 13a-15(e)
79
and 15-d and 15(e) under the Securities Exchange Act of 1934, as amended). Disclosure controls and procedures are controls and procedures that are designed to ensure that information required to be disclosed in our reports filed or submitted under the 1934 Act is recorded, processed, summarized and reported within the time periods specified in the SEC’s rules and forms. Based on that evaluation, our management determined that despite significant progress in the implementation of our remediation plan, the previously identified material weakness had not yet been fully remediated as of December 31, 2007. Due to existence of this unremediated material weakness, our disclosure controls and procedures were deemed to be ineffective. Notwithstanding the identified control weakness, management concluded that the financial statements included in this Annual Report on Form 10-K present fairly, in all material respects, the financial position, results of operations and cash flows for the periods presented in conformity with generally accepted accounting principles in the United States.
Changes in Internal Control over Financial Reporting
Except for the implementation of our remediation plan, there were no changes in our internal control over financial reporting during our most recent fiscal quarter that have materially affected, or are reasonably likely to materially affect, our internal control over financial reporting.
Inherent Limitations of Internal Controls
Our management, including our CEO and CFO, does not expect that our disclosure controls and procedures or our internal controls will prevent all error and all fraud. A control system, no matter how well conceived and operated, can provide only reasonable, not absolute, assurance that the objectives of the control system are met. Because of the inherent limitations in all control systems, no evaluation of controls can provide absolute assurance that all control issues and instances of fraud, if any, within the Company have been detected. These inherent limitations include the realities that judgments in decision-making can be faulty, and that breakdowns can occur because of a simple error or mistake. Additionally, controls can be circumvented by the individual acts of some persons, by collusion of two or more people, or by management override of the control. The design of any system of controls also is based in part upon certain assumptions about the likelihood of future events, and there can be no assurance that any design will succeed in achieving its stated goals under all potential future conditions. Over time, controls may become inadequate because of changes in conditions, or the degree of compliance with the policies or procedures may deteriorate. Because of the inherent limitations in a cost-effective control system, misstatements due to error or fraud may occur and not be detected.
Management’s Annual Report on Internal Control over Financial Reporting and Attestation Report of the Registered Accounting Firm
This Annual Report does not include a report of management’s assessment regarding internal control over financial reporting or an attestation report of the Company’s registered public accounting firm due to a transition period established by rules of the Securities and Exchange Commission for newly public companies.
| ITEM 9B. | OTHER INFORMATION |
None.
80
PART III
| ITEM 10. | DIRECTORS, EXECUTIVE OFFICERS AND CORPORATE GOVERNANCE |
The information required by this item is incorporated by reference to NetSuite’s Proxy Statement for its 2008 Annual Meeting of Stockholders to be filed with the SEC within 120 days after the end of the fiscal year ended December 31, 2007.
The information required by this item concerning our executive officers is set forth under the heading “Executive Officers of the Registrant” in Part I of this Annual Report on Form 10-K.
| ITEM 11. | EXECUTIVE COMPENSATION |
The information required by this item is incorporated by reference to NetSuite’s Proxy Statement for its 2008 Annual Meeting of Stockholders to be filed with the SEC within 120 days after the end of the fiscal year ended December 31, 2007.
| ITEM 12. | SECURITY OWNERSHIP OF CERTAIN BENEFICIAL OWNERS AND MANAGEMENT AND RELATED STOCKHOLDER MATTERS |
The information required by this item is incorporated by reference to NetSuite’s Proxy Statement for its 2008 Annual Meeting of Stockholders to be filed with the SEC within 120 days after the end of the fiscal year ended December 31, 2007.
| ITEM 13. | CERTAIN RELATIONSHIPS AND RELATED TRANSACTIONS, AND DIRECTOR INDEPENDENCE |
The information required by this item is incorporated by reference to NetSuite’s Proxy Statement for its 2008 Annual Meeting of Stockholders to be filed with the SEC within 120 days after the end of the fiscal year ended December 31, 2007.
| ITEM 14. | PRINCIPAL ACCOUNTING FEES AND SERVICES |
The information required by this item is incorporated by reference to NetSuite’s Proxy Statement for its 2008 Annual Meeting of Stockholders to be filed with the SEC within 120 days after the end of the fiscal year ended December 31, 2007.
81
PART IV
| ITEM 15. | EXHIBITS AND FINANCIAL STATEMENT SCHEDULES |
(a) Financial Statements
The financial statements filed as part of this report are listed on the index to financial statements on page 52.
(b)Financial Statement Schedules
The following financial statement schedule is filed as a part of this Annual Report:
Schedule II—Valuation and Qualifying Accounts
All other schedules are omitted because they are not required or the required information is shown in the financial statements or notes thereto.
Schedule II
Valuation and Qualifying Accounts
| | | | | | | | | | |
| | | Beginning
Balance | | Additions
Charged to
Operations | | Write-Offs | | Ending
Balance |
| | | (In thousands) |
Trade Receivables Allowance: | | | | | | | | | | |
Year ended December 31, 2005 | | $ | 179,000 | | 529,000 | | 554,000 | | $ | 154,000 |
Year ended December 31, 2006 | | $ | 154,000 | | 904,000 | | 674,000 | | $ | 384,000 |
Year ended December 31, 2007 | | $ | 384,000 | | 1,352,000 | | 1,151,000 | | $ | 585,000 |
(c)Exhibits
The following exhibits are incorporated by reference or filed herewith.
| | |
Exhibit
Number | | Description |
| 3.1 | | Amended and Restated Certificate of Incorporation of the Registrant (incorporated by reference to Exhibit 3.2 of Registrant’s Form S-1 Registration No. 333-144257). |
| |
| 3.2 | | Amended and Restated Bylaws of the Registrant (incorporated by reference to Exhibit 3.4 of Registrant’s Form S-1 Registration No. 333-144257). |
| |
| 4.1 | | Form of Common Stock certificate of the Registrant (incorporated by reference to Exhibit 4.1 of Registrant’s Form S-1 Registration No. 333-144257). |
| |
| 4.2 | | Amended and Restated Investor Rights Agreement by and among the Registrant and certain stockholders dated March 31, 2005, and amendments thereto (incorporated by reference to Exhibit 4.2 of Registrant’s Form S-1 Registration No. 333-144257). |
| |
| 4.3 | | Limited Liability Company Operating Agreement of NetSuite Restricted Holdings LLC (incorporated by reference to Exhibit 4.4 of Registrant’s Form S-1 Registration No. 333-144257). |
| |
| 4.4 | | Board resolutions approving corporate opportunity waiver (incorporated by reference to Exhibit 4.5 of Registrant’s Form S-1 Registration No. 333-144257). |
| |
| 10.1+ | | Form of Indemnification Agreement between the Registrant and each of its directors and executive officers (incorporated by reference to Exhibit 10.1 of Registrant’s Form S-1 Registration No. 333-144257). |
82
| | |
Exhibit
Number | | Description |
| 10.2+ | | 1999 Stock Plan and forms of agreements thereunder (incorporated by reference to Exhibit 10.2 of Registrant’s Form S-1 Registration No. 333-144257). |
| |
| 10.3+ | | 2007 Equity Incentive Plan and forms of agreements thereunder (incorporated by reference to Exhibit 10.3 of Registrant’s Form S-1 Registration No. 333-144257). |
| |
| 10.4+ | | 2007 Executive Bonus Plan (incorporated by reference to Exhibit 10.4 of Registrant’s Form S-1 Registration No. 333-144257). |
| |
| 10.5+ | | Offer Letter Agreement by and between the Registrant and Zachary Nelson effective July 1, 2007 (incorporated by reference to Exhibit 10.6 of Registrant’s Form S-1 Registration No. 333-144257). |
| |
| 10.6+ | | Offer Letter Agreement by and between the Registrant and Evan M. Goldberg effective July 1, 2007 (incorporated by reference to Exhibit 10.7 of Registrant’s Form S-1 Registration No. 333-144257). |
| |
| 10.7+ | | Offer Letter Agreement by and between the Registrant and James McGeever effective July 1, 2007 (incorporated by reference to Exhibit 10.8 of Registrant’s Form S-1 Registration No. 333-144257). |
| |
| 10.8+ | | Offer Letter Agreement by and between the Registrant and Timothy Dilley effective July 1, 2007 (incorporated by reference to Exhibit 10.9 of Registrant’s Form S-1 Registration No. 333-144257). |
| |
| 10.9+ | | Offer Letter Agreement by and between the Registrant and Dean Mansfield effective July 1, 2007 (incorporated by reference to Exhibit 10.10 of Registrant’s Form S-1 Registration No. 333-144257). |
| |
| 10.10 | | Office Lease Agreement by and between the Registrant and EOP-Peninsula Office Park, L.L.C. dated August 2, 2005 (incorporated by reference to Exhibit 10.12 of Registrant’s Form S-1 Registration No. 333-144257). |
| |
| 10.11 | | Amended and Restated Secured Promissory Note and Security Agreement by and between the Registrant and Tako Ventures, LLC dated March 1, 2006, as amended February 5, 2007 (incorporated by reference to Exhibit 10.13 of Registrant’s Form S-1 Registration No. 333-144257). |
| |
| 10.12 | | Distribution Agreement by and between the Registrant and NetSuite KK dated March 8, 2006 (incorporated by reference to Exhibit 10.14 of Registrant’s Form S-1 Registration No. 333-144257). |
| |
| 10.13 | | Strategic Reseller Program Development Fund Agreement by and among the Registrant, NetSuite KK and Transcosmos, Inc. dated March 8, 2006 (incorporated by reference to Exhibit 10.15 of Registrant’s Form S-1 Registration No. 333-144257). |
| |
| 10.14 | | Preferred Reseller Distribution Agreement by and between NetSuite KK and Transcosmos, Inc. dated March 8, 2006 (incorporated by reference to Exhibit 10.16 of Registrant’s Form S-1 Registration No. 333-144257). |
| |
| 10.15 | | Strategic Reseller Program Development Fund Agreement by and among the Registrant, NetSuite KK and Miroku Jyoho Service Co., Ltd. dated October 20, 2006 (incorporated by reference to Exhibit 10.17 of Registrant’s Form S-1 Registration No. 333-144257). |
| |
| 10.16 | | Preferred Reseller Agreement by and between NetSuite KK and Miroku Jyoho Service Co., Ltd. dated October 20, 2006 (incorporated by reference to Exhibit 10.18 of Registrant’s Form S-1 Registration No. 333-144257). |
| |
| 10.17 | | Software License Agreement by and between the Registrant and Oracle USA, Inc. dated May 11, 2007 (incorporated by reference to Exhibit 10.19 of Registrant’s Form S-1 Registration No. 333-144257). |
| |
| 10.18† | | Master Service Agreement by and between the Registrant and Level 3 Communications, LLC dated March 17, 2006 (incorporated by reference to Exhibit 10.20 of Registrant’s Form S-1 Registration No. 333-144257). |
83
| | |
Exhibit
Number | | Description |
| 10.19+ | | Severance and Change of Control Agreement by and between the Registrant and Zachary Nelson effective July 1, 2007 (incorporated by reference to Exhibit 10.21 of Registrant’s Form S-1 Registration No. 333-144257). |
| |
| 10.20+ | | Severance and Change of Control Agreement by and between the Registrant and Evan M. Goldberg effective July 1, 2007 (incorporated by reference to Exhibit 10.22 of Registrant’s Form S-1 Registration No. 333-144257). |
| |
| 10.21+ | | Severance and Change of Control Agreement by and between the Registrant and James McGeever effective July 1, 2007 (incorporated by reference to Exhibit 10.23 of Registrant’s Form S-1 Registration No. 333-144257). |
| |
| 10.22+ | | Severance and Change of Control Agreement by and between the Registrant and Timothy Dilley effective July 1, 2007 (incorporated by reference to Exhibit 10.24 of Registrant’s Form S-1 Registration No. 333-144257). |
| |
| 10.23+ | | Severance and Change of Control Agreement by and between the Registrant and Dean Mansfield effective July 1, 2007 (incorporated by reference to Exhibit 10.25 of Registrant’s Form S-1 Registration No. 333-144257). |
| |
| 10.24 | | Ordering Document by and between the Registrant and Oracle USA, Inc. dated October 31, 2007 (incorporated by reference to Exhibit 10.26 of Registrant’s Form S-1 Registration No. 333-144257). |
| |
| 10.25 | | Master Services Agreement by and between the Registrant and SAVVIS Communications Corporation (formerly Exodus Communications, Inc. and Cable & Wireless USA, Inc.) dated May 14, 2001, Amendment No. 1 thereto dated May 15, 2007, Amendment No. 2 thereto dated December 4, 2007 and the Hosting Colocation terms thereto (incorporated by reference to Exhibit 10.27 of Registrant’s Form S-1 Registration No. 333-144257). |
| |
| 21.1 | | Subsidiaries of the Registrant. |
| |
| 23.1 | | Consent of KPMG LLP, Independent Registered Public Accounting Firm. |
| |
| 31.1 | | Certification of the Chief Executive Officer pursuant to Section 302 of the Sarbanes-Oxley Act. |
| |
| 31.2 | | Certification of the Chief Financial Officer pursuant to Section 302 of the Sarbanes-Oxley Act. |
| |
| 32.1 | | Certification of the Chief Executive Officer and Chief Financial Officer pursuant to Section 906 of the Sarbanes-Oxley Act. |
The certification attached as Exhibit 32.1 that accompanies this Annual Report on Form 10-K is not deemed filed with the Securities and Exchange Commission and is not to be incorporated by reference into any filing of NetSuite Inc. under the Securities Act of 1933 or the Securities Exchange Act of 1934, whether made before or after the date of this Annual Report on Form 10-K, irrespective of any general incorporation language contained in such filing.
| + | Indicates management contract or compensatory plan or arrangement. |
| † | Confidential treatment has been granted for portions of this exhibit. These portions have been omitted and submitted separately to the Securities and Exchange Commission. |
84
SIGNATURES
Pursuant to the requirements of Section 13 or 15(d) of the Securities Exchange Act of 1934, the Registrant has duly caused this Annual Report on Form 10-K to be signed on its behalf by the undersigned, thereunto duly authorized, on March 25, 2008.
| | |
| NETSUITE INC. |
| |
| By: | | /s/ ZACHARY NELSON |
| | Zachary Nelson |
| | President and Chief Executive Officer |
Pursuant to the requirements of the Securities Exchange Act of 1934, this report has been signed below by the following persons on behalf of the Registrant and in the capacities and on the dates indicated.
| | | | |
Signature | | Title | | Date |
| | |
/s/ ZACHARY NELSON Zachary Nelson | | Director, President and Chief Executive Officer (Principal Executive Officer) | | March 25, 2008 |
| | |
/s/ JAMES MCGEEVER James McGeever | | Chief Financial Officer (Principal Financial and Accounting Officer) | | March 25, 2008 |
| | |
/s/ WILLIAM L. BEANE III William L. Beane III | | Director | | March 25, 2008 |
| | |
/s/ DEBORAH A. FARRINGTON Deborah A. Farrington | | Director | | March 25, 2008 |
| | |
/s/ EVAN M. GOLDBERG Evan M. Goldberg | | Director | | March 25, 2008 |
| | |
/s/ KEITH D GRINSTEIN Keith D. Grinstein | | Director | | March 25, 2008 |
| | |
/s/ KEVIN THOMPSON Kevin Thompson | | Director | | March 25, 2008 |
85