American Physicians Capital, Inc. First Quarter 2007 Investor Presentation Updated June 2007 |
Snapshot of APCapital Medical professional liability insurance carrier Formed as mutual in 1975 by the Michigan State Medical Society (MSMS) Demutualized in December 2000 (IPO) Endorsed by MSMS, Michigan Osteopathic Association and the New Mexico Medical Society Headquartered in East Lansing, MI Focus on individual and small physicians groups |
Snapshot of APCapital Approximately 9,400 policies in-force at March 31, 2007 Marketing in primarily 5 states with a focus on the upper Midwest region Direct premiums written totaled $156.9 million for the year ended December 31, 2006 and $36.3 million for the three months ended March 31, 2007 Assets totaled $1.1 billion at March 31, 2007 NASDAQ Global Select Market: ACAP Market cap $461.9 million1 1As of June 11, 2007 |
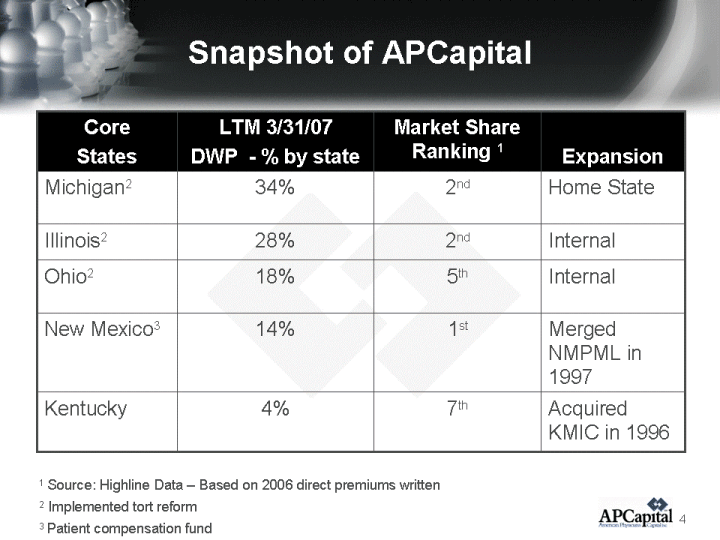
Snapshot of APCapital Core States LTM 3/31/07 DWP - % by state Market Share Ranking 1 Expansion Michigan2 34% 2nd Home State Illinois2 28% 2nd Internal Ohio2 18% 5th Internal New Mexico3 14% 1st Merged NMPML in 1997 Kentucky 4% 7th Acquired KMIC in 1996 1 Source: Highline Data - Based on 2006 direct premiums written 2 Implemented tort reform 3 Patient compensation fund |
Key Components of our Strategic Plan Focus on return on equity Strong management team Focus on medical professional liability in core markets Rate adequacy Stringent and innovative underwriting practices Strong reserves Aggressive claims management |
Strong Management Team Name Title Years of Industry Experience Year Joined APCapital Kevin Clinton, FCAS President & CEO 29 2001 Frank Freund, CPA Chief Financial Officer 25 1997 Annette Flood, RN, JD Chief Operating Officer 21 2001 Kevin Dyke, FCAS VP, Actuarial 14 2002 Nancy Fitzgerald LPN, CPHQ VP, Risk Management 18 2002 Rhonda Fossitt CPCU, RPLU VP, Underwriting 28 2002 Laura Kline CIC, CPCU VP, Marketing 20 1987 Cathy Shutack BS, RRT VP, Claims 18 2002 |
Return to Profitability via Rate Adequacy 2002 2003 2004 2005 2006 Annual 0.3 0.349 0.211 0.092 -0.031 Cumulative 0.3 0.754 1.124 1.325 1.253 Average Rate Increases Since 2002 |
Performing on-site visits by risk management Implementing unique underwriting systems Policy type primarily claims-made 68% of premiums are claims-made policies Only offer occurrence policies in: Michigan - our home state with 30+ years of data and good tort reform New Mexico and Indiana- required for access to state compensation funds Stringent and Innovative Underwriting |
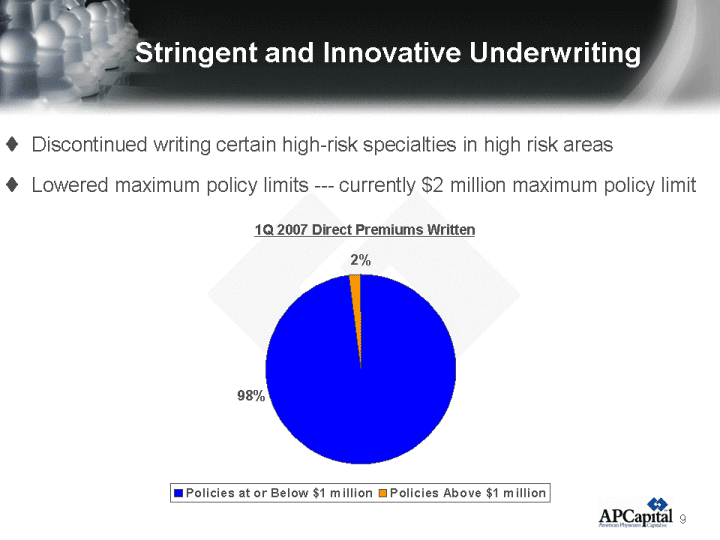
Stringent and Innovative Underwriting Discontinued writing certain high-risk specialties in high risk areas Lowered maximum policy limits --- currently $2 million maximum policy limit Policies at or Below $1 million Policies Above $1 million East 0.98 0.02 98% 2% 1Q 2007 Direct Premiums Written |
Direct Captive Agents Independent Agents East 0.13 0.42 0.45 Strong Distribution System Use a focused, multi-channeled distribution system Direct 13% 42% Captive Agents 45% Independent Agents 55% Controlled Distribution 2006 Direct Premiums Written |
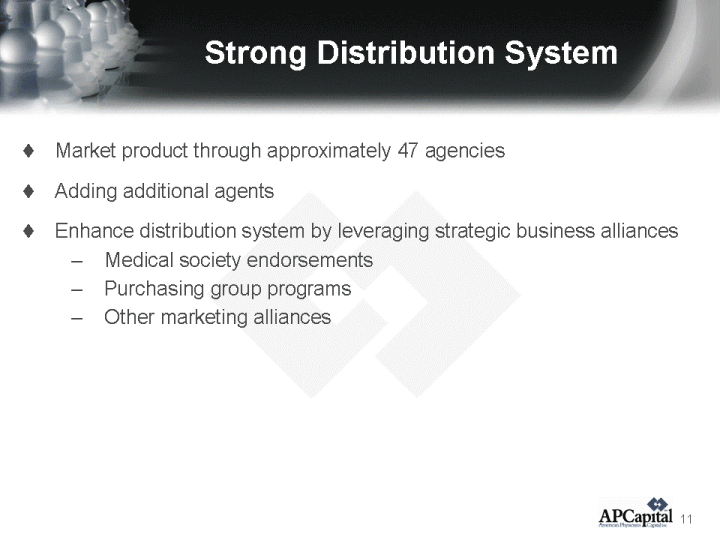
Strong Distribution System Market product through approximately 47 agencies Adding additional agents Enhance distribution system by leveraging strategic business alliances Medical society endorsements Purchasing group programs Other marketing alliances |
Strong Reserves Dec-03 Mar-04 Jun-04 Sep-04 Dec-04 Mar-05 6/1/2005 9/1/2005 Dec-05 3/1/2006 6/1/2006 9/1/2006 12/31/2006 Mar-07 Net Loss & LAE IBNR* 118 122 141 141 144 154 164 170 178 188 203 228 241 248 Number of Open Claims 4447 4103 3885 3803 3342 3344 3211 3109 2991 2976 2558 2347 2256 2200 *Includes Death, Disability & Retirement and Unallocated Loss Adjustment Expense, Excludes PIC - FL PL Net Loss & LAE IBNR and Open Claims $130M increase since Dec 2003 |
Strong Reserves 12/1/2003 Mar-04 Jun-04 Sep-04 Dec-04 Mar-05 Jun-05 Sep-05 Dec-05 Mar-06 6/1/2006 9/1/2006 12/31/2006 Mar-07 East 114000 125200 136300 140400 160000 160800 167300 173900 181970 183380 215630 236049 244774 251469 |
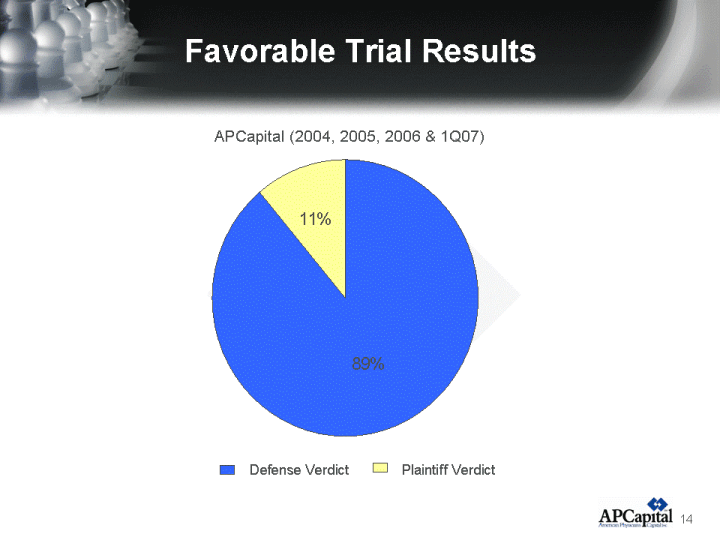
Favorable Trial Results Defense Verdict Plaintiff Verdict APA 0.89 0.11 APCapital (2004, 2005, 2006 & 1Q07) Defense Verdict Plaintiff Verdict |
Positive Trends Medical Professional Liability Reported Claim Count by Quarter *Includes 76 claims reported by four physicians at the end of their coverage with the company. 1Q02 2Q02 3Q02 4Q02 1Q03* 2Q03 3Q03 4Q03 1Q04 2Q04 3Q04 4Q04 1Q05 2Q05 3Q05 4Q05 1Q06 2Q06 3Q06 4Q06 1Q07 East 767 748 729 774 803 694 631 529 525 459 431 371 404 401 361 347 308 296 297 267 247 |
Positive Trends Net Premiums Earned Per Reported Claim --- Excluding Florida 1Q02 2Q02 3Q02 4Q02 1Q03 2Q03 3Q03 4Q03 1Q04 2Q04 3Q04 4Q04 1Q05 2Q05 3Q05 4Q05 1Q06 2Q06 3Q06 4Q06 1Q07 East 41296 46554 58045 51124 57641 55209 67631 82319 81893 95498 102920 119046 104027 102648 113898 117309 121568 126747 127185 138768 141838 Medical Professional Liability |
Strategies for Success in Changing Underwriting Cycles Maintain underwriting discipline Be a market timer Have tough, but smart defense of claims Continue to develop new and innovative underwriting systems Be opportunistic and flexible Actively look for strategic acquisitions |
FRANK H. FREUND CHIEF FINANCIAL OFFICER Note: All share and per share data in this presentation have been adjusted to reflect the three-for-two stock split payable on Nov. 2, 2006. |
Financial Highlights Quarter End March 31, 2007 Highlights Net income up 18.5% to $10.5 million Continued strong investment returns Current year Loss & LAE ratio at 76.0% Positive reserve development of $4.3 million Less ceded premium due to new reinsurance terms for 2007 Effective tax rate 31.8% - impacted by movement into tax-exempt securities APCapital, Inc. Consolidated |
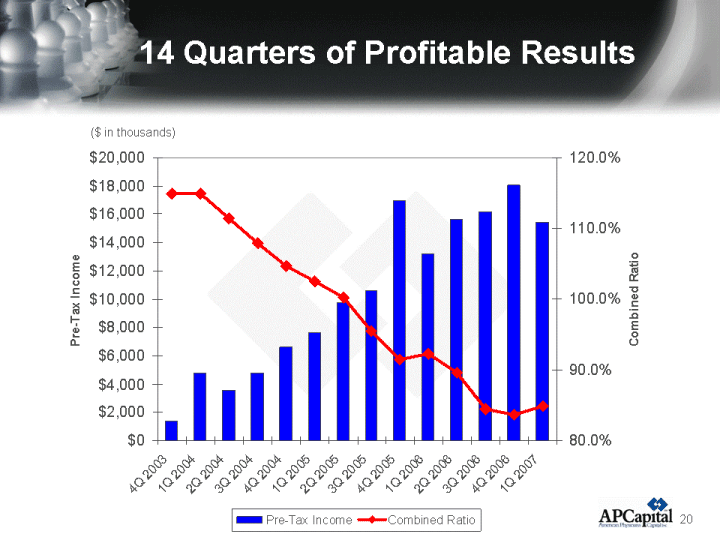
14 Quarters of Profitable Results 4Q 2003 1Q 2004 2Q 2004 3Q 2004 4Q 2004 1Q 2005 2Q 2005 3Q 2005 4Q 2005 1Q 2006 2Q 2006 3Q 2006 4Q 2006 1Q 2007 Pre-Tax Income 1363 4781 3576 4773 6620 7591 9767 10561 16948 13172 15617 16187 18027 15402 Combined Ratio 1.149 1.149 1.114 1.079 1.047 1.025 1.002 0.955 0.915 0.923 0.896 0.845 0.836 0.848 ($ in thousands) |
Tax-Adjusted Operating Income* 1Q04 2Q04 3Q04 4Q04 1Q05 2Q05 3Q05 4Q05 1Q06 2Q06 3Q06 4Q06 1Q07 East 0.17 0.23 0.26 0.29 0.37 0.48 0.55 0.67 0.7 0.79 0.91 0.96 0.9 *Diluted operating income per share is adjusted for deferred tax valuation allowance changes from 1Q04 to 2Q05 and excludes net realized gains or loss, net of tax. |
High-Quality Investment Portfolio Investment Portfolio Highlights Average rating of bond portfolio is AA+ at 3/31/07 Mortgage-backed securities are high quality, government agency issues Average yield on investments: 5.12% in 1Q07 Maintain a modified duration of 3.74 years at 3/31/07 5th best bond investment performance nationwide according to Ward's* Corporate Bonds Mortgage-backed Securities U.S Government Bonds Tax-Exempt Securities Cash & Cash Equivalents Other East 0.27 0.18 0.17 0.24 0.13 0.01 Investments totaled $874.1 million at March 31, 2007 *Based on highest 2005 bond yield, minimum net premiums written of $100 million |
Book Value Growth 3Q03 4Q03 1Q04 2Q04 3Q04 4Q04 1Q05 2Q05 3Q05 4Q05 1Q06 2Q06 3Q06 4Q06 1Q07 16.11 15.93 16.51 15.14 15.69 15.54 15.31 20.08 20.37 20.9 21.29 21.71 22.75 23.26 23.74 Up $8.20 since YE04 |
Active Share Repurchase Plan Two Outstanding Programs 10b5-1 Plan Board authorized $32 million for the 2007 10b5-1 plan and APCapital had $29.9 million remaining as of May 21, 2007. Discretionary Plan ^ 55,000 shares remaining from November 2005 Board authorization as of May 22, 2007 On May 22, 2007, Board authorized $15 million upon completion of November 2005 authorization (Dollars in thousands) (Shares repurchased in thousands) |
Why Invest in APCapital Experienced management team Business strategy producing positive results Strong financial position Well positioned for changes in underwriting cycle Continued positive trends |
Questions |
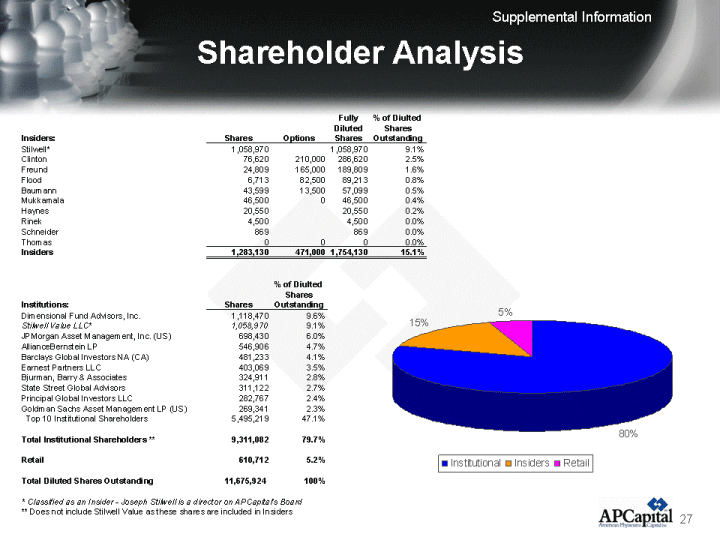
Shareholder Analysis Institutional Insiders Retail East 0.8 0.15 0.05 Supplemental Information |