UNITED STATES
SECURITIES AND EXCHANGE COMMISSION
Washington, D.C. 20549
FORM 6-K
Report of Foreign Private Issuer
Pursuant to Rule 13a-16 or 15d-16 of the
Securities Exchange Act of 1934
For the month of May, 2023
Commission File Number 1-15106
PETRÓLEO BRASILEIRO S.A. – PETROBRAS
(Exact name of registrant as specified in its charter)
Brazilian Petroleum Corporation – PETROBRAS
(Translation of Registrant's name into English)
Avenida Henrique Valadares, 28 – 19th floor
20231-030 – Rio de Janeiro, RJ
Federative Republic of Brazil
(Address of principal executive office)
Indicate by check mark whether the registrant files or will file annual reports under cover Form 20-F or Form 40-F.
Form 20-F ___X___ Form 40-F _______
Indicate by check mark whether the registrant by furnishing the information contained in this Form is also thereby furnishing the information to the Commission pursuant to Rule 12g3-2(b) under the Securities Exchange Act of 1934.
Yes _______ No___X____

Petrobras financial performance in 1Q23
Rio de Janeiro, May 11, 2023
Message from CEO Jean Paul Prates
I am very proud to share with you the first quarterly results of Petrobras under our management. Since I became CEO, in January, I have been working so that Petrobras can become more efficient, financially healthy and inclusive, where people are the focus of decisions and the top priority. If today we register a series of advances and records that is only because our workers managed to transform technical expertise into results. We aim that each and every Petrobras’ worker see in our joint mission a commitment to life, the pride of a constant search for excellence, and the challenge of producing ever more value to Brazil.
Our financial results reflect the company’s excellent operational performance. Pre-salt continues to be the driver of our revenues and operational cash flows, accounting today for 77% of our total production. In February, pre-salt reached a new monthly production record, with 2.13 million barrels of oil equivalent a day, thanks to high wells productivity and the use of cutting-edge technologies that combine high efficiency with low carbon intensity. We are growing production, increasingly more efficiently and with lower emissions.
We started up, in May, the most recent platform in Campos Basin: FPSO Anna Nery. Furthermore, we have two additional platforms ready for production: Almirante Barroso, in Búzios field, and Anita Garibaldi, currently undergoing mooring in Marlim field. Moreover, 13 other platforms will start up production by 2027.
We are committed to develop more efficient and sustainable products and fuels. We produced 5.8 million liters of diesel with renewable content, resulting in emissions reduction equivalent to around 610 tons of CO2. And we have reached, in this first quarter, record S-10 diesel sales, with lower sulfur content, which represented 63% of Petrobras total diesel sales, surpassing the mark on 4Q22.
We are getting ready for a more sustainable future. Thus, we have created the Executive Directorship for Energy Transition and Sustainability and we have signed partnerships with Equinor, Shell and other companies so that together we will analyze new projects focused on renewable energies.
We are also evaluating the creation of taskforces with other companies to seek business opportunities in Brazil and abroad. We set up a commission with BNDES for joint projects development on the energy transition, national industry and research, development and technological innovation.
Lastly, I would like to thank all our shareholders for trusting in our company. We will continue to work with efficiency, commitment and transparency to increase our results, open new opportunities and contribute to a more sustainable future.
Warm regards,
Jean Paul Prates
| 2 |
| |
Main achievements:
| • | Recurring EBITDA of US$ 14.3 billion, the fourth highest in Petrobras history |
| • | Net Debt / Adjusted EBITDA ratio of 0.58x, best mark since 2010 |
| • | Lowest gross debt level since 2010, reaching US$ 53.3 billion |
| • | Consistent operational cash generation, with operating cash flow reaching US$ 10.3 billion |
| • | Return to society with tax payments of R$62.6 billion |
| • | Monthly production record in the pre-salt with 2.13 MMboed production in February 2023. Pre-salt production accounted for 77% of Petrobras total production in the quarter) |
| • | New platforms in Marlim: FPSO Anna Nery operation start-up in May 2023 and FPSO Anita Garibaldi already on location |
| • | Fifth unit of the Búzios field - The FPSO Almirante Barroso is already on location and is expected to start operating in 2Q23 |
| • | Record production in the pre-salt: FPSO Guanabara (Mero field) with average production of 179 Mbpd of oil in February 2023 |
| • | High refining yields with diesel, gasoline and QAV reaching 67% of total production |
| • | Sustainable products: certification of Diesel R at REPAR, launch of the new Premium gasoline, commercialization exclusively of fuel oil with a maximum 1% sulfur content in the domestic market, and the start of commercialization of Ultra Low Sulfur Marine Gas Oil. |
Disclaimer
This report may contain forward-looking statements. Such forward-looking statements only reflect expectations of the Company's managers regarding future economic conditions, as well as the Company's performance, financial performance and results, among others. The terms "anticipates", "believes", "expects", "predicts", "intends", "plans", "projects", "objective", "should", and similar terms, which evidently involve risks and uncertainties that may or may not be anticipated by the Company and therefore are not guarantees of future results of the Company's operations that may differ from current expectations. The readers should not rely exclusively on any forward-looking statement contained herein. The Company does not undertake any responsibility to update the presentations and forecasts in the light of new information or its future developments, and the figures reported for 1Q23 onwards are estimates or targets. These indicators do not have standardized meanings and may not be comparable to indicators with a similar description used by others. We provide these indicators because we use them as measures of company performance; they should not be considered in isolation or as a substitute for other financial metrics that have been disclosed in accordance with BR GAAP or IFRS. See definitions of Free Cash Flow, Adjusted EBITDA and Net Indebtedness in the Glossary and their reconciliations in the Liquidity and Capital Resources sections, Reconciliation of Adjusted EBITDA and Net Indebtedness. Consolidated accounting information revised by independent auditors in accordance with international accounting standard IAS 34 – Interim Financial Reporting, issued by International Accounting Standards Board (IASB).
| 3 |
| |
Main items *
Table 1 – Main items
| Variation (%) | |||||
| US$ million | 1Q23 | 4Q22 | 1Q22 | 1Q23 X 4Q22 | 1Q23 X 1Q22 |
| Sales revenues | 26,771 | 30,171 | 27,189 | (11.3) | (1.5) |
| Gross profit | 14,113 | 14,579 | 14,410 | (3.2) | (2.1) |
| Operating expenses | (2,560) | (3,460) | (2,142) | (26.0) | 19.5 |
| Consolidated net income (loss) attributable to the shareholders of Petrobras | 7,341 | 8,245 | 8,605 | (11.0) | (14.7) |
| Recurring consolidated net income (loss) attributable to the shareholders of Petrobras * | 7,252 | 8,163 | 8,373 | (11.2) | (13.4) |
| Net cash provided by operating activities | 10,347 | 12,848 | 10,308 | (19.5) | 0.4 |
| Free cash flow | 7,924 | 9,287 | 7,932 | (14.7) | (0.1) |
| Adjusted EBITDA | 13,956 | 13,903 | 14,961 | 0.4 | (6.7) |
| Recurring adjusted EBITDA * | 14,343 | 14,362 | 15,061 | (0.1) | (4.8) |
| Gross debt (US$ million) | 53,349 | 53,799 | 58,554 | (0.8) | (8.9) |
| Net debt (US$ million) | 37,588 | 41,516 | 40,072 | (9.5) | (6.2) |
| Net debt/LTM Adjusted EBITDA ratio | 0.58 | 0.63 | 0.81 | (7.9) | (28.4) |
| Average commercial selling rate for U.S. dollar | 5.19 | 5.26 | 5.23 | (1.3) | (0.8) |
| Brent crude (US$/bbl) | 81.27 | 88.71 | 101.40 | (8.4) | (19.9) |
| Domestic basic oil by-products price (US$/bbl) | 117.02 | 118.20 | 104.62 | (1.0) | 11.9 |
| TRI (total recordable injuries per million men-hour frequency rate) | 0.77 | 0.68 | 0.51 | 13.2 | 51.0 |
| ROCE (Return on Capital Employed) | 15.7% | 15.9% | 9.9% | -0,2 p.p. | 5,8 p.p. |
* See reconciliation of Recurring net income and Adjusted EBITDA in the Special Items section.
| 4 |
| |
Consolidated results
Net revenues
Table 2 – Net revenues by products
| Variation (%) | |||||
| US$ million | 1Q23 | 4Q22 | 1Q22 | 1Q23 X 4Q22 | 1Q23 X 1Q22 |
| Diesel | 8,305 | 10,300 | 7,483 | (19.4) | 11.0 |
| Gasoline | 3,694 | 4,032 | 3,725 | (8.4) | (0.8) |
| Liquefied petroleum gas (LPG) | 929 | 1,143 | 1,186 | (18.7) | (21.7) |
| Jet fuel | 1,406 | 1,498 | 991 | (6.1) | 41.9 |
| Naphtha | 478 | 432 | 611 | 10.6 | (21.8) |
| Fuel oil (including bunker fuel) | 286 | 312 | 366 | (8.3) | (21.9) |
| Other oil products | 1,084 | 1,163 | 1,274 | (6.8) | (14.9) |
| Subtotal oil products | 16,182 | 18,880 | 15,636 | (14.3) | 3.5 |
| Natural gas | 1,526 | 1,982 | 1,723 | (23.0) | (11.4) |
| Crude oil | 1,350 | 1,301 | 1,761 | 3.8 | (23.3) |
| Renewables and nitrogen products | 21 | 53 | 66 | (60.4) | (68.2) |
| Revenues from non-exercised rights | 220 | 207 | 104 | 6.3 | 111.5 |
| Electricity | 110 | 151 | 293 | (27.2) | (62.5) |
| Services, agency and others | 244 | 244 | 238 | − | 2.5 |
| Total domestic market | 19,653 | 22,818 | 19,821 | (13.9) | (0.8) |
| Exports | 6,741 | 6,877 | 6,735 | (2.0) | 0.1 |
| Crude oil | 5,547 | 5,290 | 4,812 | 4.9 | 15.3 |
| Fuel oil (including bunker fuel) | 1,034 | 1,495 | 1,885 | (30.8) | (45.1) |
| Other oil products and other products | 160 | 92 | 38 | 73.9 | 321.1 |
| Sales abroad (*) | 377 | 476 | 633 | (20.8) | (40.4) |
| Total foreign market | 7,118 | 7,353 | 7,368 | (3.2) | (3.4) |
| Total | 26,771 | 30,171 | 27,189 | (11.3) | (1.5) |
| (*) Sales revenues from operations outside of Brazil, including trading and excluding exports. | |||||
In 1Q23, net revenues fell 11% compared to 4Q22, largely due to the 8% devaluation of Brent during the period. Revenues from oil products in the domestic market fell 14%, also influenced by the lower sales volume in the quarter, due to lower demand for diesel and gasoline. Moreover, there was a drop in LPG revenues, affected not only by seasonal factors, but also by the increased competition. The reduction in natural gas revenues was due mainly to lower sales to the non-thermoelectric sector and to lower prices, resulting from the drop in Brent prices. On the other hand, revenues from oil sales in the domestic market increased 4% in 1Q23 despite the drop in Brent prices, thanks to higher sales volumes to Acelen.
Export revenues decreased by only 2% compared to 4Q22, despite the drop in Brent prices. This result mainly reflected the realization in 1Q23 of exports from previous periods. This effect was partially offset by lower revenues from fuel oil exports, for which demand was lower in 1Q23.
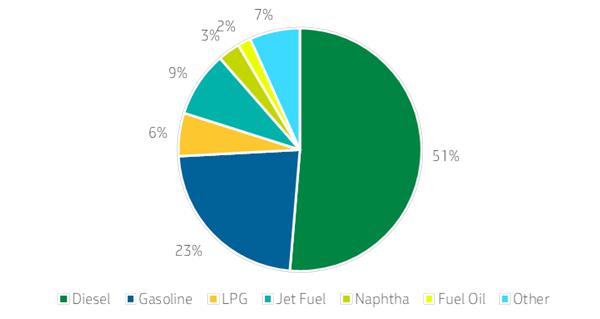
In 1Q23, diesel and gasoline remained the main products, accounting for 74% of the revenues generated from the sale of oil products.
| 5 |
| |
Graph 1 – Oil products sales revenues 1Q23 – domestic market
Over the years, Petrobras has been implementing a constant search for global opportunities and the development of new clients, which was decisive for the company to change the flow of its exports as well, taking advantage of new arbitrages and maximizing value generation in its sales.
In 1Q23, Petrobras expanded sales of the Mero, Sururu, Búzios and Tupi streams, attracting new clients in Europe and the USA. In this period, the company distributed its export volumes among different destinations, as follows:
Table 3 – Destination of oil exports | Table 4 – Destination of exports of oil products | |||||||
| Country | 1Q23 | 4Q22 | 1Q22 | Country | 1Q23 | 4Q22 | 1Q22 | |
| China | 42% | 45% | 56% | Singapore | 63% | 70% | 59% | |
| Europe | 26% | 29% | 14% | USA | 18% | 16% | 28% | |
| Latam | 22% | 10% | 9% | Caribbean | 0% | 8% | 5% | |
| USA | 2% | 7% | 3% | Europe | 0% | 6% | 3% | |
| Asia (Ex China) | 9% | 7% | 14% | Others | 19% | 0% | 5% | |
| Caribbean | 0% | 2% | 4% | |||||
Cost of goods sold *
Table 5 – Cost of goods sold
| Variation (%) | |||||
| US$ million | 1Q23 | 4Q22 | 1Q22 | 1Q23 X 4Q22 | 1Q23 X 1Q22 |
| Acquisitions | (4,885) | (6,891) | (4,628) | (29.1) | 5.6 |
| Crude oil imports | (2,668) | (2,991) | (1,684) | (10.8) | 58.4 |
| Oil products imports | (1,811) | (3,036) | (1,355) | (40.3) | 33.7 |
| Natural gas imports | (406) | (864) | (1,589) | (53.0) | (74.4) |
| Production | (7,155) | (7,796) | (7,485) | (8.2) | (4.4) |
| Crude oil | (6,249) | (6,363) | (6,161) | (1.8) | 1.4 |
| Production taxes | (2,710) | (3,146) | (3,173) | (13.9) | (14.6) |
| Other costs | (3,539) | (3,217) | (2,988) | 10.0 | 18.4 |
| Oil products | (440) | (746) | (624) | (41.0) | (29.5) |
| Natural gas | (466) | (687) | (700) | (32.2) | (33.4) |
| Production taxes | (92) | (171) | (232) | (46.2) | (60.3) |
| Other costs | (374) | (516) | (468) | (27.5) | (20.1) |
| Services, electricity, operations abroad and others | (618) | (905) | (666) | (31.7) | (7.2) |
| Total | (12,658) | (15,592) | (12,779) | (18.8) | (0.9) |
In 1Q23, cost of goods sold fell 19% compared to 4Q22, mainly reflecting lower costs with oil and oil products imports, due to lower prices and volumes in the period.
The decrease in sales volumes of oil products in domestic market was the predominant factor in the reduction of production costs of oil products in 1Q23.
* Managerial information (non-audited).
| 6 |
| |
In addition, lower costs with government take, because of the depreciation of Brent, also contributed to the reduction in cost of goods sold in 1Q23.
Operating expenses
Table 6 – Operating expenses
| Variation (%) | |||||
| US$ million | 1Q23 | 4Q22 | 1Q22 | 1Q23 X 4Q22 | 1Q23 X 1Q22 |
| Selling, General and Administrative Expenses | (1,578) | (1,669) | (1,477) | (5.5) | 6.8 |
| Selling expenses | (1,221) | (1,293) | (1,178) | (5.6) | 3.7 |
| Materials, third-party services, freight, rent and other related costs | (1,026) | (1,066) | (948) | (3.8) | 8.2 |
| Depreciation, depletion and amortization | (150) | (178) | (200) | (15.7) | (25.0) |
| Allowance for expected credit losses | (21) | (24) | (8) | (12.5) | 162.5 |
| Employee compensation | (24) | (25) | (22) | (4.0) | 9.1 |
| General and administrative expenses | (357) | (376) | (299) | (5.1) | 19.4 |
| Employee compensation | (229) | (228) | (198) | 0.4 | 15.7 |
| Materials, third-party services, rent and other related costs | (102) | (116) | (78) | (12.1) | 30.8 |
| Depreciation, depletion and amortization | (26) | (32) | (23) | (18.8) | 13.0 |
| Exploration costs | (157) | (657) | (79) | (76.1) | 98.7 |
| Research and Development | (154) | (179) | (206) | (14.0) | (25.2) |
| Other taxes | (200) | (194) | (59) | 3.1 | 239.0 |
| Impairment of assets | (3) | (893) | 1 | (99.7) | − |
| Other income and expenses, net | (468) | 132 | (322) | − | 45.3 |
| Total | (2,560) | (3,460) | (2,142) | (26.0) | 19.5 |
In 1Q23, operating expenses decreased 26% compared to 4Q22, mainly reflecting lower impairment expenses (-US$ 0.9 billion), exploration costs (-US$ 0.5 billion), legal contingencies (-US$ 0.3 billion) and higher gains from the sale and write-off of assets (+US$ 0.5 billion) with the sale of Albacora Leste, partly offset by the absence of gains from the surplus volumes from the transfer of rights, which took place in 4Q22 (-US$ 1.4 billion).
The 6% drop in selling expenses in 1Q23 is explained by lower logistics expenses with offshore trading operations and natural gas transportation and by the reduction in volumes of oil products exports, particularly fuel oil. These factors were partially offset by higher oil exports and increased sales of oil in the domestic market.
General and administrative expenses fell 5% in 1Q23, which is explained by lower service expenses that impacted 4Q22.
The variation in tax expenses in 1Q23 compared to 1Q22 is mainly due to the effect of the oil export tax, effective as of March 2023.
Adjusted EBITDA
In 1Q23, Adjusted EBITDA reached US$ 14 billion, in line with 4Q22, despite the 8% depreciation of Brent, which is mainly explained by lower exploration costs and legal contingencies.
Financial results
Table 7 – Financial results
| Variation (%) | |||||
| US$ million | 1Q23 | 4Q22 | 1Q22 | 1Q23 X 4Q22 | 1Q23 X 1Q22 |
| Finance income | 465 | 436 | 262 | 6.7 | 77.5 |
| Income from investments and marketable securities (Government Bonds) | 333 | 287 | 163 | 16.0 | 104.3 |
| Other income, net | 132 | 149 | 99 | (11.4) | 33.3 |
| Finance expenses | (844) | (994) | (757) | (15.1) | 11.5 |
| Interest on finance debt | (541) | (577) | (530) | (6.2) | 2.1 |
| Unwinding of discount on lease liabilities | (358) | (379) | (290) | (5.5) | 23.4 |
| Capitalized borrowing costs | 271 | 237 | 238 | 14.3 | 13.9 |
| Unwinding of discount on the provision for decommissioning costs | (212) | (125) | (130) | 69.6 | 63.1 |
| Other finance expenses , net | (4) | (150) | (45) | (97.3) | (91.1) |
| Foreign exchange gains (losses) and indexation charges | (243) | 844 | 1,091 | − | − |
| Foreign exchange gains (losses) | 797 | 1,023 | 2,421 | (22.1) | (67.1) |
| Reclassification of hedge accounting to the Statement of Income | (1,154) | (1,274) | (1,380) | (9.4) | (16.4) |
| Monetary restatement of dividends payable | (32) | 876 | − | − | − |
| Recoverable taxes inflation indexation income | 64 | 12 | 21 | 433.3 | 204.8 |
| Other foreign exchange gains (losses) and indexation charges, net | 82 | 207 | 29 | (60.3) | 182.8 |
| Total | (622) | 286 | 596 | − | − |
| 7 |
| |
In 1Q23, the financial result was negative by US$ 0.6 billion, against a positive result of US$ 0.3 billion in 4Q22. This result is mostly explained by the absence in 1Q23 of revenues with monetary restatement in 4Q22 (-US$ 0.8 billion). In addition there was a lower gain from the FX variation of the BRL against the USD (-US$ 0.3 billion), which appreciated 3.5% in 4Q22 (from R$ 5.41/US$ on 09/30/2022 to R$ 5.22/US$ on 12/31/2022) versus an appreciation of 2.6% in 1Q23 (from R$ 5.22/US$ on 12/31/2022 to R$ 5.08/US$ on 03/31/2023). These effects were partially offset by lower financial expenses (+U$ 0.2 billion).
Net profit (loss) attributable to Petrobras shareholders
In 1Q23, net income was US$ 7.3 billion, compared to US$ 8.2 billion in 4Q22. This result is mainly explained by the depreciation of Brent and lower financial result (-US$ 0.9 billion), partially offset by lower operating expenses (+US$ 0.9 billion). In addition, there was a higher income tax expense (+US$ 0.6 billion) mainly due to the absence of tax credits in 4Q22 for the distribution of FY2022 dividends in the form of interest on equity.
Recurring net income attributable to Petrobras shareholders and recurring Adjusted EBITDA
Excluding non-recurring items, net income would have reached US$ 7.25 billion. Among the items that make up the positive impact of US$ 0.1 billion the highlights were the gains from the sale and write-off of assets (+US$ 0.5 billion) mainly with the sale of Albacora Leste and the Car Wash Operation reimbursement (+US$ 0.1 billion), partially offset by expenses with compensation for the termination of leasing contracts (-US$ 0.3 billion) and legal contingencies (-US$ 0.1 billion).
Adjusted EBITDA had a negative impact of US$ 0.4 billion, influenced by the same factors that affected net income, except for gains from the sale and write-off of assets. Excluding the effects of non-recurring items, Adjusted EBITDA would have reached US$ 14.3 billion in 1Q23.
| 8 |
| |
Special items
Table 8 – Special items
| Variation (%) | |||||
| US$ million | 1Q23 | 4Q22 | 1Q22 | 1Q23 X 4Q22 | 1Q23 X 1Q22 |
| Net income | 7,370 | 8,276 | 8,648 | (10.9) | (14.8) |
| Non-recurring items | 134 | 125 | 356 | 7.2 | (62.4) |
| Non-recurring items that do not affect Adjusted EBITDA | 521 | 584 | 456 | (10.8) | 14.3 |
| Impairment of assets and investments | (2) | (890) | (8) | (99.8) | (75.0) |
| Gains and losses on disposal / write-offs of assets | 496 | 7 | 476 | 6985.7 | 4.2 |
| Results from co-participation agreements in bid areas | 27 | 1,424 | − | (98.1) | − |
| Discount and premium on repurchase of debt securities | − | 43 | (12) | − | − |
| Other non-recurring items | (387) | (459) | (100) | (15.7) | 287.0 |
| Voluntary Separation Plan | 3 | (11) | (4) | − | − |
| Amounts recovered from Lava Jato investigation | 89 | 62 | 12 | 43.5 | 641.7 |
| Gains / (losses) on decommissioning of returned/abandoned areas | − | (196) | (24) | − | − |
| Gains / (losses) related to legal proceedings | (145) | (300) | (112) | (51.7) | 29.5 |
| Equalization of expenses - Production Individualization Agreements | (17) | (14) | 28 | 21.4 | − |
| Compensation for the termination of a vessel charter agreement | (317) | − | − | − | − |
| Net effect of non-recurring items on IR / CSLL | (45) | (42) | (123) | 7.1 | (63.4) |
| Recurring net income | 7,281 | 8,193 | 8,415 | (11.1) | (13.5) |
| Shareholders of Petrobras | 7,252 | 8,163 | 8,373 | (11.2) | (13.4) |
| Non-controlling interests | 29 | 30 | 42 | (3.3) | (31.0) |
| Adjusted EBITDA | 13,956 | 13,903 | 14,961 | 0.4 | (6.7) |
| Non-recurring items | (387) | (459) | (100) | (15.7) | 287.0 |
| Recurring Adjusted EBITDA | 14,343 | 14,362 | 15,061 | (0.1) | (4.8) |
In management's opinion, the special items presented above, although related to the Company's business, were highlighted as complementary information for a better understanding and evaluation of the result. Such items do not necessarily occur in all periods and are disclosed when relevant.
| 9 |
| |
Capex
Table 9 - Capex
| Variation (%) | |||||
| US$ million | 1Q23 | 4Q22 | 1Q22 | 1Q23 X 4Q22 | 1Q23 X 1Q22 |
| Exploration and Production | 2,040 | 2,218 | 1,374 | (8.0) | 48.5 |
| Refining, Transportation and Marketing | 342 | 372 | 252 | (8.1) | 35.6 |
| Gas and Power | 33 | 99 | 94 | (66.7) | (65.0) |
| Others | 67 | 187 | 48 | (64.1) | 40.9 |
| Subtotal | 2,482 | 2,876 | 1,768 | (13.7) | 40.4 |
In 1Q23, capex totaled US$ 2.5 billion.
In the Exploration and & Production segment, capex totaled US$ 2.0 billion, 49% above 1Q22, due to the development of large projects that will sustain the production curve in the coming years, in particular the construction and integration of new production units, in addition to expanding investments in the revitalization of Marlim. Investments in 1Q23 were mainly focused on: (i) the development of production in the Santos Basin pre-salt (US$ 1.1 billion); (ii) deepwater production development (US$0.4 billion); and (iii) exploratory investments (US$ 0.1 billion).
In the Refining, Transport and Marketing segment, capex totaled US$ 0.34 billion, with focus on scheduled refinery stoppages, investments in the logistics network and the GASLUB utilities unit. In the Gas and Power segment, capex reached US$ 33 million in 1Q23, with emphasis on investments in natural gas processing units.
| 10 |
| |
The following table presents the main information about the new oil and gas production systems, already contracted.
Table 10 – Main projects
| Unit | Start-up | FPSO capacity (bbl/day) | Petrobras Actual Investment US$ bn | Petrobras Total Investment US$ bn1 | Petrobras Stake | Status |
Búzios 5 FPSO Alm. Barroso (Chartered unit) | 2023 | 150,000 | 1.06 | 2.0 | 88,99%2 | Project in phase of execution. Production system arrived at the Buzios field. 10 wells drilled and 8 completed. |
Marlim 1 FPSO Anita Garibaldi (Chartered unit) | 2023 | 80,000 | 0.20 | 1.8 | 100% | Project in phase of execution. Production system arrived at the Marlim field.4 1 well drilled and completed |
Mero 2 FPSO Sepetiba (Chartered unit) | 2023 | 180,000 | 0.32 | 0.8 | 38,6%3 | Project in phase of execution with production system under construction. 13 wells drilled and 11 completed |
Mero 3 FPSO Marechal Duque de Caxias (Chartered unit) | 2024 | 180,000 | 0.12 | 0.8 | 38,6%3 | Project in phase of execution with production system under construction. 6 wells drilled and 1 completed |
Integrado Parque das Baleias (IPB) FPSO Maria Quitéria (Chartered unit) | 2025 | 100,000 | 0.41 | 1.7 | 100% | Project in phase of execution with production system under construction. 3 wells drilled and 1 completed4 |
Búzios 7 FPSO Almirante Tamandaré (Chartered unit) | 2025 | 225,000 | 0.21 | 2.0 | 88,99%2 | Project in phase of execution with production system under construction. 4 wells drilled and 1 completed |
Búzios 6 P-78 (Owned unit) | 2025 | 180,000 | 0.66 | 4.2 | 88,99%2 | Project in phase of execution with production system under construction. 2 wells drilled. |
Búzios 8 P-79 (Owned unit) | 2025 | 180,000 | 0.50 | 4.3 | 88,99%2 | Project in phase of execution with production system under construction. 5 wells drilled and 4 completed |
Mero 4 FPSO Alexandre de Gusmão (Chartered unit) | 2025 | 180,000 | 0.05 | 0.8 | 38,6%3 | Project in phase of execution with production system under construction. 6 wells drilled and 2 completed |
Búzios 9 P-80 (Owned unit) | 2026 | 225,000 | 0.15 | 4.9 | 88,99%2 | Project in phase of execution with production system under construction. 2 wells drilled and 2 completed |
Búzios 10 P-82 (Owned unit) | 2027 | 225,000 | 0.10 | 5.5 | 88,99%2 | Project in phase of execution with production system under construction. 1 well drilled and 1 completed |
Búzios 11 P-83 (Owned unit) | 2027 | 225,000 | 0.12 | 4.8 | 88,99%2 | Project in phase of execution. Production system construction contract signed on September 2022. 2 wells drilled |
1 Total investment with the Strategic Plan 2023-27 assumptions and Petrobras work interest (WI). Chartered units leases are not included. 2 In November 2022, Petrobras concluded the assignment of 5% of its interest in the Production Sharing Contract of the Surplus Volume of the Transfer of Rights, for the Búzios field, in the pre-salt of Santos Basin, to the partner CNOOC. Petrobras stake was adjusted. 3 Petrobras stake updated after the approval of the Production Individualization Agreement (AIP) of the Mero accumulation. As the compensation relative to the non-contracted area expenses will be paid in oil to the consortium, the work interest (WI) of the investments reported will not change. 4 Production Unit for revitalization project. Refers only to new wells. The scope of the project also includes the relocation of some wells of the units being decommissioned.
| ||||||
| 11 |
| |
Liquidity and capital resources[1]
Table 11 - Liquidity and capital resources
| US$ million | 1Q23 | 4Q22 | 1Q22 |
| Adjusted cash and cash equivalents at the beginning of period | 12,283 | 6,785 | 11,117 |
| Government bonds, bank deposit certificates and time deposits with maturities of more than 3 months at the end of period* | (4,287) | (2,411) | (650) |
| Cash and cash equivalents in companies classified as held for sale at the beginning of the period | − | − | 13 |
| Cash and cash equivalents at the beginning of period | 7,996 | 4,374 | 10,480 |
| Net cash provided by operating activities | 10,347 | 12,848 | 10,308 |
| Net cash provided by (used in) investing activities | (1,104) | (2,345) | (988) |
| Acquisition of PP&E and intangibles assets | (2,423) | (3,561) | (2,376) |
| Investments in investees | (8) | (7) | (9) |
| Proceeds from disposal of assets - Divestment | 1,855 | 931 | 1,753 |
| Financial compensation from co-participation agreements | 391 | 1,950 | 61 |
| Dividends received | 11 | 55 | 52 |
| Divestment (investment) in marketable securities | (930) | (1,713) | (469) |
| (=) Net cash provided by operating and investing activities | 9,243 | 10,503 | 9,320 |
| Net cash used in financing activities | (6,973) | (7,047) | (3,150) |
| Net financings | (1,269) | (1,600) | (1,908) |
| Proceeds from finance debt | 51 | 350 | 150 |
| Repayments | (1,320) | (1,950) | (2,058) |
| Repayment of lease liability | (1,389) | (1,424) | (1,321) |
| Dividends paid to shareholders of Petrobras | (4,192) | (4,030) | − |
| Dividends paid to non-controlling interest | (48) | (13) | (5) |
| Investments by non-controlling interest | (75) | 20 | 84 |
| Effect of exchange rate changes on cash and cash equivalents | 24 | 166 | 582 |
| Cash and cash equivalents at the end of period | 10,290 | 7,996 | 17,232 |
| Government bonds, bank deposit certificates and time deposits with maturities of more than 3 months at the end of period* | 5,471 | 4,287 | 1,259 |
| Cash and cash equivalents in companies classified as held for sale at the end of the period | − | − | (9) |
| Adjusted cash and cash equivalents at the end of period | 15,761 | 12,283 | 18,482 |
| Reconciliation of Free Cash Flow | |||
| Net cash provided by operating activities | 10,347 | 12,848 | 10,308 |
| Acquisition of PP&E and intangibles assets | (2,423) | (3,561) | (2,376) |
| Free cash flow** | 7,924 | 9,287 | 7,932 |
As of March 31, 2022, cash and cash equivalents totaled US$ 10.3 billion and adjusted cash and cash equivalents totaled US$ 15.8 billion.
In 1Q23, cash generated from operating activities reached US$ 10.3 billion and positive free cash flow totaled US$ 7.9 billion. This level of cash generation, along with the inflow of funds from the divestments of US$ 1.9 billion, specially the conclusion of the sale of the Albacora Leste field (US$ 1.6 billion), and the inflow of US$ 0.4 billion referring to financial compensation for co-participation agreements in Sepia and Atapu were used to: (a) pay remuneration to shareholders (US$ 4.2 billion), (b) make investments (US$ 2.4 billion), (c) amortize lease liabilities (US$ 1.4 billion), and (d) prepay debt and amortize principal and interest due in the period (US$ 1.3 billion).
The current level of gross debt, high cash generation and solid liquidity allowed the company to approve a shareholder remuneration payment in the amount of R$ 1.89 per common and preferred share, in accordance with its shareholder remuneration policy.
* Includes government bonds, bank deposit certificates and time deposits of companies classified as held for sale.
** Free cash flow (FCF) is in accordance with the Shareholder Remuneration Policy, which is the result of the equation: FCF = net cash provided by operating activities less acquisitions of PP&E and intangible assets.
| 12 |
| |
Debt
As of 03/31/2023, gross debt reached US$ 53.3 billion, a decrease of 0.8% compared to 12/31/2022, reaching the lowest level since 2010.
Average maturity was 12 years and average cost was 6.5%, both in line with those recorded on 12/31/2022.
The gross debt/EBITDA ratio reached 0.82x on 03/31/2023, compared to 0.81x on 12/31/2022.
On 03/31/2023, net debt reached US$ 37.6 billion, a decrease of 9.5% compared to 12/31/2022.
Table 12 – Debt indicators
| US$ million | 03.31.2023 | 12.31.2022 | Δ % | 03.31.2022 |
| Financial Debt | 29,836 | 29,954 | (0.4) | 35,421 |
| Capital Markets | 17,011 | 16,957 | 0.3 | 21,683 |
| Banking Market | 9,741 | 9,672 | 0.7 | 9,970 |
| Development banks | 720 | 723 | (0.4) | 878 |
| Export Credit Agencies | 2,201 | 2,443 | (9.9) | 2,708 |
| Others | 163 | 159 | 2.5 | 182 |
| Finance leases | 23,513 | 23,845 | (1.4) | 23,133 |
| Gross debt | 53,349 | 53,799 | (0.8) | 58,554 |
| Adjusted cash and cash equivalents | 15,761 | 12,283 | 28.3 | 18,482 |
| Net debt | 37,588 | 41,516 | (9.5) | 40,072 |
| Net Debt/(Net Debt + Market Cap) - Leverage | 37% | 39% | (5.1) | 30% |
| Average interest rate (% p.a.) | 6.5 | 6.5 | − | 6.2 |
| Weighted average maturity of outstanding debt (years) | 12.02 | 12.07 | (0.4) | 13.22 |
| Net debt/LTM Adjusted EBITDA ratio | 0.58 | 0.63 | (7.9) | 0.81 |
| Gross debt/LTM Adjusted EBITDA ratio | 0.82 | 0.81 | 0.7 | 1.18 |
| 13 |
| |
Results by segment
Exploration and Production
Table 13 – E&P results
| Variation (%) (*) | |||||
| US$ million | 1Q23 | 4Q22 | 1Q22 | 1Q23 / 4Q22 | 1Q23 / 1Q22 |
| Sales revenues | 15,730 | 16,973 | 19,684 | (7.3) | (20.1) |
| Gross profit | 9,351 | 9,787 | 12,008 | (4.5) | (22.1) |
| Operating expenses | (123) | (1,099) | (35) | (88.8) | 251.4 |
| Operating income | 9,228 | 8,688 | 11,973 | 6.2 | (22.9) |
| Net income (loss) attributable to the shareholders of Petrobras | 6,108 | 5,751 | 7,954 | 6.2 | (23.2) |
| Adjusted EBITDA of the segment | 10,895 | 10,964 | 14,022 | (0.6) | (22.3) |
| EBITDA margin of the segment (%) | 69 | 65 | 71 | 4.7 | (2.0) |
| ROCE (Return on Capital Employed) (%) | 18.5 | 19.8 | 14.2 | (1.3) | 4.3 |
| Average Brent crude (US$/bbl) | 81.27 | 88.71 | 101.40 | (8.4) | (19.9) |
| Lifting cost - Brazil (US$/boe) | |||||
| excluding production taxes and leases | 5.51 | 6.07 | 5.22 | (9.4) | 5.4 |
| excluding production taxes | 7.27 | 7.81 | 6.97 | (6.9) | 4.2 |
| Onshore and shallow waters | |||||
| with leases | 14.70 | 18.77 | 16.44 | (21.7) | (10.6) |
| excluding leases | 14.70 | 18.77 | 16.44 | (21.7) | (10.6) |
| Deep and ultra-deep post-salt | |||||
| with leases | 12.94 | 13.72 | 11.28 | (5.7) | 14.7 |
| excluding leases | 11.45 | 11.94 | 9.57 | (4.1) | 19.6 |
| Pre-salt | |||||
| with leases | 5.61 | 5.70 | 5.13 | (1.7) | 9.4 |
| excluding leases | 3.71 | 3.89 | 3.25 | (4.6) | 14.1 |
| including production taxes and excluding leases | 19.19 | 21.12 | 24.36 | (9.1) | (21.2) |
| including production taxes and leases | 20.95 | 22.85 | 26.11 | (8.3) | (19.8) |
| Production taxes - Brazil | 2,784 | 3,085 | 4,068 | (9.8) | (31.6) |
| Royalties | 1,610 | 1,751 | 2,142 | (8.1) | (24.8) |
| Special participation | 1,162 | 1,322 | 1,914 | (12.1) | (39.3) |
| Retention of areas | 12 | 12 | 12 | − | − |
| (*) EBITDA margin and ROCE variations in percentage points | |||||
In 1Q23, E&P gross profit was US$ 9.4 billion, a reduction of 4.5% when compared to 4Q22, due to lower Brent prices, partially offset by higher production and lower government take and production costs.
Operating income in 1Q23 was 6.2% higher than 4Q22, mainly due to expenses incurred in the previous quarter, such as impairment, exploratory write-offs and abandonment liabilities, partially offset by the results of Sepia and Atapu co-participation agreements and Buzios 5% PSA farm-out. Additionally, in 1Q23 there were higher revenues from asset divestments, mainly due to Albacora Leste.
Lifting costs, excluding production taxes and leases, were US$ 5.51/boe in 1Q23, a decrease of 9% when compared to 4Q22. The reduction reflects the divestments of the Sergipe and Alagoas onshore fields, Papa-Terra and Albacora Leste, the definitive shutdown of platforms in the Marlim field and the start-up of P-71 in December 2022. In 1Q23, there were lower expenses with subsea operations, in addition to the production shutdown of the onshore assets in Bahia.
In the pre-salt, there was a 5% reduction in lifting costs, mainly driven by lower costs on well interventions and on subsea operations.
In the post-salt, the 4% reduction in lifting costs was due to the definitive shutdown of platforms in Marlim and the divestments of Papa-Terra and Albacora Leste, besides to lower costs on subsea operations and the production start-up of new wells in Campos Basin.
In onshore and shallow water assets, there was a 22% reduction in lifting costs due to the divestments of the Sergipe and Alagoas fields and to the production shutdown of onshore assets in Bahia, as required by ANP.
The decrease in government take is explained mainly by lower Brent prices in 1Q23.
| 14 |
| |
Refining, Transportation and Marketing
Table 14 – RTM results
| Variation (%) (*) | |||||
| US$ million | 1Q23 | 4Q22 | 1Q22 | 1Q23 X 4Q22 | 1Q23 X 1Q22 |
| Sales revenues | 24,842 | 27,542 | 24,685 | (9.8) | 0.6 |
| Gross profit (loss) | 2,974 | 3,329 | 3,138 | (10.7) | (5.2) |
| Operating expenses | (1,178) | (869) | (613) | 35.6 | 92.2 |
| Operating Income | 1,796 | 2,460 | 2,525 | (27.0) | (28.9) |
| Net income (loss) attributable to the shareholders of Petrobras | 1,199 | 1,474 | 1,938 | (18.7) | (38.1) |
| Adjusted EBITDA of the segment | 2,381 | 2,816 | 3,043 | (15.4) | (21.8) |
| EBITDA margin of the segment (%) | 10 | 10 | 12 | (1) | (3) |
| ROCE (Return on Capital Employed) (%) | 11.7 | 12.6 | 7.2 | (0.9) | 4.5 |
| Refining cost (US$ / barrel) - Brazil | 2.12 | 1.98 | 1.77 | 6.9 | 19.8 |
| Domestic basic oil by-products price (US$/bbl) | 117.02 | 118.20 | 104.62 | (1.0) | 11.9 |
| (*) EBITDA margin and ROCE variations in percentage points | |||||
In 1Q23, gross profit was US$ 3.0 billion, US$ 0.4 billion lower than 4Q22, mainly due to the higher inventory turnover, - US$ 1.28 billion in 1Q23 and - US$ 0.7 billion in 4Q22. Excluding this effect, gross profit would have been US$ 4.25 billion in 1Q23 and US$ 4.1 billion in 4Q22.
In 1Q23, there were higher margins on oil products in the domestic market, mainly due to gasoline prices and to the appreciation of international prices, besides LPG and Naphtha prices. These were partially offset by lower margins on diesel due to the depreciation of international prices and lower sales volumes in the domestic market due to the typical seasonality of the first quarter.
In 1Q23, operating income was lower, due to lower gross profit and higher operating expenses which are mainly explained by the reversal of the impairment related to the second train of RNEST in 4Q22.
In 1Q23 the refining cost per barrel was 6.9% above 4Q22 due to lower feedstock, mainly due to relevant planned shutdowns at REFAP and RPBC. Total costs were in line with 4Q22.
| 15 |
| |
Gas and Power
Table 15 – G&P results
| Variation (%) (*) | |||||
| US$ million | 1Q23 | 4Q22 | 1Q22 | 1Q23 X 4Q22 | 1Q23 X 1Q22 |
| Sales revenues | 2,854 | 3,821 | 3,365 | (25.3) | (15.2) |
| Gross profit | 1,387 | 1,200 | 480 | 15.6 | 189.0 |
| Operating expenses | (779) | (707) | (882) | 10.2 | (11.7) |
| Operating income | 608 | 493 | (402) | 23.3 | − |
| Net income (loss) attributable to the shareholders of Petrobras | 388 | 319 | (263) | 21.6 | − |
| Adjusted EBITDA of the segment | 739 | 599 | (294) | 23.4 | − |
| EBITDA margin of the segment (%) | 26 | 16 | (9) | 10 | 35 |
| ROCE (Return on Capital Employed) (%) | 10.7 | 5.6 | (5.3) | 5.1 | 16.0 |
| Natural gas sales price - Brazil (US$/bbl) | 73.27 | 76.83 | 55.85 | (4.6) | 31.2 |
| Natural gas sales price - Brazil (US$/MMBtu) | 12.35 | 12.95 | 9.42 | (4.6) | 31.2 |
| Fixed revenues from power auctions | 81.72 | 103.48 | 95.70 | (21.0) | (14.6) |
| Average price for power generation(US$/MWh) | 6.20 | 11.31 | 55.27 | (45.2) | (88.8) |
| (*) EBITDA margin and ROCE variations in percentage points | |||||
In 1Q23, gross profit was US$ 1.4 billion, an increase of 15.6% when compared to 4Q22, mainly due to lower acquisition costs for natural gas. This cost reduction exceeded the revenue reduction from the marketing of gas and energy, which occurred due to the following factors: (i) lower average natural gas sales prices due to lower Brent prices, (ii) lower volume of natural gas sold to the non-thermoelectric segment, (iii) expiration of energy contracts at auctions and (iv) fewer opportunities to export energy.
Operating income reached US$ 0.6 billion, 23.3% higher than 4Q22, mainly due to the higher gross profit which more than offset the increase in transportation expenses in 1Q23.
| 16 |
| |
Reconciliation of Adjusted EBITDA
EBITDA is an indicator calculated as the net income for the period plus taxes on profit, net financial result, depreciation and amortization. Petrobras announces EBITDA, as authorized by CVM Resolution 156 of June 2022.
In order to reflect the management view regarding the formation of the company's current business results, EBITDA is also presented adjusted (Adjusted EBITDA) as a result of: results in equity-accounted investments; impairment, reclassification of comprehensive income (loss) due to the disposal of equity-accounted investments, results with co-participation agreement in production fields and gains/losses on disposal/write-offs of assets.
Adjusted EBITDA, reflecting the sum of the last twelve months (Last Twelve Months), also represents an alternative to the company's operating cash generation. This measure is used to calculate the Gross Debt and Net Debt to Adjusted EBITDA metric, helping to evaluate the company's leverage and liquidity.
EBITDA and adjusted EBITDA are not provided for in International Financial Reporting Standards (IFRS) and should not serve as a basis for comparison with those disclosed by other companies and should not be considered as a substitute for any other measure calculated in accordance with IFRS. These measures should be considered in conjunction with other measures and indicators for a better understanding of the company's performance and financial condition.
Table 16 - Reconciliation of Adjusted EBITDA
| Variation (%) (*) | |||||
| US$ million | 1Q23 | 4Q22 | 1Q22 | 1Q23 X 4Q22 | 1Q23 X 1Q22 |
| Net income | 7,370 | 8,276 | 8,648 | (10.9) | (14.8) |
| Net finance (expense) income | 622 | (286) | (596) | − | − |
| Income taxes | 3,596 | 3,007 | 4,566 | 19.6 | (21.2) |
| Depreciation, depletion and amortization | 2,924 | 3,321 | 3,170 | (12.0) | (7.8) |
| EBITDA | 14,512 | 14,318 | 15,788 | 1.4 | (8.1) |
| Results in equity-accounted investments | (35) | 122 | (350) | − | (90.0) |
| Impairment of assets (reversals) | 3 | 893 | (1) | (99.7) | − |
| Results on disposal/write-offs of assets and on remeasurement of investment retained with loss of control | (496) | (6) | (476) | 8166.7 | 4.2 |
| Results from co-participation agreements in bid areas | (28) | (1,424) | − | (98.0) | − |
| Adjusted EBITDA | 13,956 | 13,903 | 14,961 | 0.4 | (6.7) |
| Adjusted EBITDA margin (%) | 52 | 46 | 55 | 6.0 | (3.0) |
| (*) EBITDA Margin variations in percentage points | |||||
| 17 |
| |
Financial statements
Table 17 - Income statement - Consolidated
| US$ million | 1Q23 | 4Q22 | 1Q22 |
| Sales revenues | 26,771 | 30,171 | 27,189 |
| Cost of sales | (12,658) | (15,592) | (12,779) |
| Gross profit | 14,113 | 14,579 | 14,410 |
| Selling expenses | (1,221) | (1,293) | (1,178) |
| General and administrative expenses | (357) | (376) | (299) |
| Exploration costs | (157) | (657) | (79) |
| Research and development expenses | (154) | (179) | (206) |
| Other taxes | (200) | (194) | (59) |
| Impairment (losses) reversals | (3) | (893) | 1 |
| Other income and expenses, net | (468) | 132 | (322) |
| (2,560) | (3,460) | (2,142) | |
| Operating income | 11,553 | 11,119 | 12,268 |
| Finance income | 465 | 436 | 262 |
| Finance expenses | (844) | (994) | (757) |
| Foreign exchange gains (losses) and inflation indexation charges | (243) | 844 | 1,091 |
| Net finance income (expense) | (622) | 286 | 596 |
| Results of equity-accounted investments | 35 | (122) | 350 |
| Income before income taxes | 10,966 | 11,283 | 13,214 |
| Income taxes | (3,596) | (3,007) | (4,566) |
| Net Income | 7,370 | 8,276 | 8,648 |
| Net income attributable to: | |||
| Shareholders of Petrobras | 7,341 | 8,245 | 8,605 |
| Non-controlling interests | 29 | 31 | 43 |
| 18 |
| |
Table 18 - Statement of financial position – Consolidated
| ASSETS - US$ million | 03.31.2023 | 12.31.2022 |
| Current assets | 30,941 | 31,250 |
| Cash and cash equivalents | 10,290 | 7,996 |
| Marketable securities | 2,879 | 2,773 |
| Trade and other receivables, net | 4,625 | 5,010 |
| Inventories | 7,968 | 8,779 |
| Recoverable taxes | 1,201 | 1,307 |
| Assets classified as held for sale | 1,939 | 3,608 |
| Other current assets | 2,039 | 1,777 |
| Non-current assets | 161,677 | 155,941 |
| Long-term receivables | 23,414 | 21,220 |
| Trade and other receivables, net | 1,942 | 2,440 |
| Marketable securities | 2,642 | 1,564 |
| Judicial deposits | 12,026 | 11,053 |
| Deferred taxes | 728 | 832 |
| Other tax assets | 4,051 | 3,778 |
| Other non-current assets | 2,025 | 1,553 |
| Investments | 1,636 | 1,566 |
| Property, plant and equipment | 133,576 | 130,169 |
| Intangible assets | 3,051 | 2,986 |
| Total assets | 192,618 | 187,191 |
| LIABILITIES - US$ million | 03.31.2023 | 12.31.2022 |
| Current liabilities | 25,283 | 31,380 |
| Trade payables | 5,047 | 5,464 |
| Finance debt | 4,098 | 3,576 |
| Lease liability | 5,642 | 5,557 |
| Taxes payable | 4,379 | 5,931 |
| Dividends payable | − | 4,171 |
| Short-term employee benefits | 2,339 | 2,215 |
| Liabilities related to assets classified as held for sale | 1,041 | 1,465 |
| Other current liabilities | 2,737 | 3,001 |
| Non-current liabilities | 87,931 | 85,975 |
| Finance debt | 25,738 | 26,378 |
| Lease liability | 17,871 | 18,288 |
| Income taxes payable | 305 | 302 |
| Deferred taxes | 8,380 | 6,750 |
| Employee benefits | 11,246 | 10,675 |
| Provision for legal and administrative proceedings | 3,242 | 3,010 |
| Provision for decommissioning costs | 19,084 | 18,600 |
| Other non-current liabilities | 2,065 | 1,972 |
| Shareholders' equity | 79,404 | 69,836 |
| Share capital (net of share issuance costs) | 107,101 | 107,101 |
| Profit reserves and others | (27,957) | (37,609) |
| Non-controlling interests | 260 | 344 |
| Total liabilities and shareholders´ equity | 192,618 | 187,191 |
| 19 |
| |
Table 19 - Statement of cash flow – Consolidated
| US$ million | 1Q23 | 4Q22 | 1Q22 |
| Cash flows from operating activities | |||
| Net income for the period | 7,370 | 8,276 | 8,648 |
| Adjustments for: | |||
| Pension and medical benefits - actuarial gains | 370 | 289 | 307 |
| Results of equity-accounted investments | (35) | 122 | (350) |
| Depreciation, depletion and amortization | 2,924 | 3,321 | 3,170 |
| Impairment of assets (reversals) | 3 | 893 | (1) |
| Inventory (write-back) to net realizable value | (8) | 4 | (7) |
| Allowance for credit loss on trade and other receivables | 24 | 23 | 21 |
| Exploratory expenditure write-offs | 32 | 563 | 23 |
| Disposal/write-offs of assets, remeasurement of investment retained with loss of control and reclassification of CTA | (496) | (6) | (476) |
| Foreign exchange, indexation and finance charges | 656 | (178) | (489) |
| Income taxes | 3,596 | 3,007 | 4,566 |
| Revision and unwinding of discount on the provision for decommissioning costs | 212 | 321 | 154 |
| Results from co-participation agreements in bid areas | (28) | (1,424) | − |
| Early termination and cash outflows revision of lease agreements | (167) | (71) | (225) |
| Losses with legal, administrative and arbitration proceedings, net | 254 | 541 | 259 |
| Decrease (Increase) in assets | |||
| Trade and other receivables | 412 | (374) | 641 |
| Inventories | 989 | 1,378 | (1,917) |
| Judicial deposits | (403) | (397) | (398) |
| Other assets | 111 | 343 | (27) |
| Increase (Decrease) in liabilities | |||
| Trade payables | (478) | (18) | (138) |
| Other taxes payable | (217) | (46) | 230 |
| Pension and medical benefits | (178) | (261) | (1,477) |
| Provisions for legal proceedings | (85) | (126) | (52) |
| Other employee benefits | 35 | (119) | (150) |
| Provision for decommissioning costs | (165) | (160) | (132) |
| Other liabilities | (101) | (338) | (297) |
| Income taxes paid | (4,280) | (2,715) | (1,575) |
| Net cash provided by operating activities | 10,347 | 12,848 | 10,308 |
| Cash flows from investing activities | |||
| Acquisition of PP&E and intangible assets | (2,423) | (3,561) | (2,376) |
| Investments in investees | (8) | (7) | (9) |
| Proceeds from disposal of assets - Divestment | 1,855 | 931 | 1,753 |
| Financial compensation from co-participation agreements | 391 | 1,950 | 61 |
| Divestment (investment) in marketable securities | (930) | (1,713) | (469) |
| Dividends received | 11 | 55 | 52 |
| Net cash provided by (used in) investing activities | (1,104) | (2,345) | (988) |
| Cash flows from financing activities | |||
| Changes in non-controlling interest | (75) | 20 | 84 |
| Financing and loans, net: | |||
| Proceeds from finance debt | 51 | 350 | 150 |
| Repayment of principal - finance debt | (750) | (1,538) | (1,491) |
| Repayment of interest - finance debt | (570) | (412) | (567) |
| Repayment of lease liability | (1,389) | (1,424) | (1,321) |
| Dividends paid to Shareholders of Petrobras | (4,192) | (4,030) | − |
| Dividends paid to non-controlling interests | (48) | (13) | (5) |
| Net cash (used in) financing activities | (6,973) | (7,047) | (3,150) |
| Effect of exchange rate changes on cash and cash equivalents | 24 | 166 | 582 |
| Net change in cash and cash equivalents | 2,294 | 3,622 | 6,752 |
| Cash and cash equivalents at the beginning of the period | 7,996 | 4,374 | 10,480 |
| Cash and cash equivalents at the end of the period | 10,290 | 7,996 | 17,232 |
| 20 |
| |
Financial information by business areas
Table 20 - Consolidated income by segment – 1Q23
| US$ million | E&P | RTM | GAS & POWER | CORP. | ELIMIN. | TOTAL |
| Sales revenues | 15,730 | 24,842 | 2,854 | 76 | (16,731) | 26,771 |
| Intersegments | 15,450 | 474 | 805 | 2 | (16,731) | − |
| Third parties | 280 | 24,368 | 2,049 | 74 | − | 26,771 |
| Cost of sales | (6,379) | (21,868) | (1,467) | (77) | 17,133 | (12,658) |
| Gross profit | 9,351 | 2,974 | 1,387 | (1) | 402 | 14,113 |
| Expenses | (123) | (1,178) | (779) | (475) | (5) | (2,560) |
| Selling expenses | (7) | (533) | (652) | (24) | (5) | (1,221) |
| General and administrative expenses | (16) | (78) | (15) | (248) | − | (357) |
| Exploration costs | (157) | − | − | − | − | (157) |
| Research and development expenses | (124) | (2) | (1) | (27) | − | (154) |
| Other taxes | (18) | (106) | (9) | (67) | − | (200) |
| Impairment (losses) reversals | 13 | (16) | − | − | − | (3) |
| Other income and expenses, net | 186 | (443) | (102) | (109) | − | (468) |
| Operating income (loss) | 9,228 | 1,796 | 608 | (476) | 397 | 11,553 |
| Net finance income (expense) | − | − | − | (622) | − | (622) |
| Results of equity-accounted investments | 17 | 14 | 4 | − | − | 35 |
| Income (loss) before income taxes | 9,245 | 1,810 | 612 | (1,098) | 397 | 10,966 |
| Income taxes | (3,138) | (611) | (206) | 494 | (135) | (3,596) |
| Net Income (Loss) | 6,107 | 1,199 | 406 | (604) | 262 | 7,370 |
| Net income (loss) attributable to: | ||||||
| Shareholders of Petrobras | 6,108 | 1,199 | 388 | (616) | 262 | 7,341 |
| Non-controlling interests | (1) | − | 18 | 12 | − | 29 |
Table 21 - Consolidated income by segment – 1Q22
| US$ million | E&P | RTM | GAS & POWER | CORP. | ELIMIN. | TOTAL |
| Sales revenues | 19,684 | 24,685 | 3,365 | 126 | (20,671) | 27,189 |
| Intersegments | 19,374 | 433 | 861 | 3 | (20,671) | − |
| Third parties | 310 | 24,252 | 2,504 | 123 | − | 27,189 |
| Cost of sales | (7,676) | (21,547) | (2,885) | (125) | 19,454 | (12,779) |
| Gross profit | 12,008 | 3,138 | 480 | 1 | (1,217) | 14,410 |
| Expenses | (35) | (613) | (882) | (608) | (4) | (2,142) |
| Selling expenses | (2) | (405) | (756) | (11) | (4) | (1,178) |
| General and administrative expenses | (12) | (61) | (16) | (210) | − | (299) |
| Exploration costs | (79) | − | − | − | − | (79) |
| Research and development expenses | (173) | (3) | (3) | (27) | − | (206) |
| Other taxes | (15) | (7) | (10) | (27) | − | (59) |
| Impairment (losses) reversals | 1 | − | 1 | (1) | − | 1 |
| Other income and expenses, net | 245 | (137) | (98) | (332) | − | (322) |
| Operating income (loss) | 11,973 | 2,525 | (402) | (607) | (1,221) | 12,268 |
| Net finance income (expense) | − | − | − | 596 | − | 596 |
| Results of equity-accounted investments | 51 | 271 | 29 | (1) | − | 350 |
| Income (loss) before income taxes | 12,024 | 2,796 | (373) | (12) | (1,221) | 13,214 |
| Income taxes | (4,071) | (858) | 136 | (189) | 416 | (4,566) |
| Net Income (Loss) | 7,953 | 1,938 | (237) | (201) | (805) | 8,648 |
| Net income (loss) attributable to: | ||||||
| Shareholders of Petrobras | 7,954 | 1,938 | (263) | (219) | (805) | 8,605 |
| Non-controlling interests | (1) | − | 26 | 18 | − | 43 |
| 21 |
| |
Table 22 - Quarterly consolidated income by segment – 4Q22
| US$ million | E&P | RTM | GAS & POWER | CORP. | ELIMIN. | TOTAL |
| Sales revenues | 16,973 | 27,542 | 3,821 | 109 | (18,274) | 30,171 |
| Intersegments | 16,661 | 490 | 1,119 | 4 | (18,274) | − |
| Third parties | 312 | 27,052 | 2,702 | 105 | − | 30,171 |
| Cost of sales | (7,186) | (24,213) | (2,621) | (113) | 18,541 | (15,592) |
| Gross profit | 9,787 | 3,329 | 1,200 | (4) | 267 | 14,579 |
| Expenses | (1,099) | (869) | (707) | (782) | (3) | (3,460) |
| Selling expenses | (10) | (531) | (719) | (30) | (3) | (1,293) |
| General and administrative expenses | (16) | (71) | (13) | (276) | − | (376) |
| Exploration costs | (657) | − | − | − | − | (657) |
| Research and development expenses | (154) | 1 | (1) | (25) | − | (179) |
| Other taxes | (32) | (16) | (9) | (137) | − | (194) |
| Impairment (losses) reversals | (1,091) | 198 | − | − | − | (893) |
| Other income and expenses, net | 861 | (450) | 35 | (314) | − | 132 |
| Operating income (loss) | 8,688 | 2,460 | 493 | (786) | 264 | 11,119 |
| Net finance income (expense) | − | − | − | 286 | − | 286 |
| Results of equity-accounted investments | 16 | (150) | 12 | − | − | (122) |
| Income (loss) before income taxes | 8,704 | 2,310 | 505 | (500) | 264 | 11,283 |
| Income taxes | (2,954) | (836) | (167) | 1,040 | (90) | (3,007) |
| Net income (loss) | 5,750 | 1,474 | 338 | 540 | 174 | 8,276 |
| Net income (loss) attributable to: | ||||||
| Shareholders of Petrobras | 5,751 | 1,474 | 319 | 527 | 174 | 8,245 |
| Non-controlling interests | (1) | − | 19 | 13 | − | 31 |
| 22 |
| |
Table 23 - Other income and expenses by segment – 1Q23
| US$ million | E&P | RTM | GAS & POWER | CORP. | ELIMIN. | TOTAL |
| Unscheduled stoppages and pre-operating expenses | (477) | (5) | (10) | (7) | − | (499) |
| Pension and medical benefits - retirees | − | − | − | (281) | − | (281) |
| Gains (losses) with legal, administrative and arbitration proceedings | (58) | (212) | 7 | 9 | − | (254) |
| Performance award program | (55) | (31) | (7) | (47) | − | (140) |
| Profit sharing | (14) | (9) | (2) | (10) | − | (35) |
| Losses on decommissioning of returned/abandoned areas | (1) | − | − | − | − | (1) |
| Results from co-participation agreements in bid areas | 28 | − | − | − | − | 28 |
| Gains (losses) with Commodities Derivatives | − | 85 | (7) | 1 | − | 79 |
| Amounts recovered from Lava Jato investigation (*) | − | − | − | 89 | − | 89 |
| Government grants | 1 | − | − | 103 | − | 104 |
| Reimbursements from E&P partnership operations | 161 | − | − | − | − | 161 |
| Early termination and changes to cash flow estimates of leases | 84 | 81 | 1 | 1 | − | 167 |
| Results on disposal/write-offs of assets and on remeasurement of investment retained with loss of control | 507 | (11) | (7) | 7 | − | 496 |
| Others (**) | 10 | (341) | (77) | 26 | − | (382) |
| 186 | (443) | (102) | (109) | − | (468) | |
| (*) Through December 31, 2022, the amount recovered of US$ 1,618 was recognized through collaboration and leniency agreements entered into with individuals and legal entities. | ||||||
| (**) It includes, in 2023, expenses with compensation for the termination of a vessel charter agreement in the amount of US$ 317. | ||||||
Table 24 - Other income and expenses by segment – 1Q22
| US$ million | E&P | RTM | GAS & POWER | CORP. | ELIMIN. | TOTAL |
| Unscheduled stoppages and pre-operating expenses | (358) | (4) | (7) | (7) | − | (376) |
| Pension and medical benefits - retirees | − | − | − | (238) | − | (238) |
| Losses with legal, administrative and arbitration proceedings | (62) | (68) | (55) | (74) | − | (259) |
| Performance award program | (48) | (24) | (6) | (40) | − | (118) |
| Profit sharing | (12) | (8) | (2) | (9) | − | (31) |
| Losses on decommissioning of returned/abandoned areas | (24) | − | − | − | − | (24) |
| Results from co-participation agreements in bid areas | − | − | − | − | − | − |
| Losses with Commodities Derivatives | − | (53) | − | − | − | (53) |
| Amounts recovered from Lava Jato investigation | − | − | − | 12 | − | 12 |
| Government grants | 1 | − | − | 73 | − | 74 |
| Reimbursements from E&P partnership operations | 27 | − | − | − | − | 27 |
| Early termination and changes to cash flow estimates of leases | 202 | 20 | 3 | − | − | 225 |
| Results on disposal/write-offs of assets and on remeasurement of investment retained with loss of control | 420 | 54 | (1) | 3 | − | 476 |
| Others | 99 | (54) | (30) | (52) | − | (37) |
| 245 | (137) | (98) | (332) | − | (322) | |
| 23 |
| |
Table 25 - Other income and expenses by segment – 4Q22
| US$ million | E&P | RTM | GAS & POWER | CORP. | ELIMIN. | TOTAL |
| Unscheduled stoppages and pre-operating expenses | (468) | (5) | (9) | (8) | − | (490) |
| Pension and medical benefits - retirees | − | − | − | (220) | − | (220) |
| Losses with legal, administrative and arbitration proceedings | (77) | (236) | (12) | (216) | − | (541) |
| Performance award program | (60) | (30) | (8) | (49) | − | (147) |
| Profit sharing | (14) | (3) | (2) | (9) | − | (28) |
| Losses on decommissioning of returned/abandoned areas | (197) | − | − | − | − | (197) |
| Results from co-participation agreements in bid areas | 1,424 | − | − | − | − | 1,424 |
| Losses with Commodities Derivatives | − | (116) | − | (5) | − | (121) |
| Amounts recovered from Lava Jato investigation | − | − | − | 62 | − | 62 |
| Government grants | 1 | − | − | 140 | − | 141 |
| Reimbursements from E&P partnership operations | 235 | − | − | − | − | 235 |
| Early termination and changes to cash flow estimates of leases | 66 | 15 | (9) | (1) | − | 71 |
| Results on disposal/write-offs of assets and on remeasurement of investment retained with loss of control | (13) | 2 | 8 | 9 | − | 6 |
| Others | (36) | (77) | 67 | (17) | − | (63) |
| 861 | (450) | 35 | (314) | − | 132 | |
| 24 |
| |
Table 26 - Consolidated assets by segment – 03.31.2023
| US$ million | E&P | RTM | GAS & POWER | CORP. AND OTHERS | ELIMIN. | TOTAL |
| Total assets | 118,716 | 33,705 | 7,700 | 37,412 | (4,915) | 192,618 |
| Current assets | 3,632 | 10,914 | 381 | 20,929 | (4,915) | 30,941 |
| Non-current assets | 115,084 | 22,791 | 7,319 | 16,483 | − | 161,677 |
| Long-term receivables | 7,309 | 1,890 | 97 | 14,118 | − | 23,414 |
| Investments | 387 | 1,032 | 178 | 39 | − | 1,636 |
| Property, plant and equipment | 104,847 | 19,753 | 6,966 | 2,010 | − | 133,576 |
| Operating assets | 92,883 | 16,782 | 4,808 | 1,614 | − | 116,087 |
| Assets under construction | 11,964 | 2,971 | 2,158 | 396 | − | 17,489 |
| Intangible assets | 2,541 | 116 | 78 | 316 | − | 3,051 |
Table 27 - Consolidated assets by segment – 12.31.2022
| US$ million | E&P | RTM | GAS & POWER | CORP. AND OTHERS | ELIMIN. | TOTAL |
| Total assets | 116,334 | 34,431 | 7,584 | 34,106 | (5,264) | 187,191 |
| Current assets | 5,224 | 12,035 | 391 | 18,864 | (5,264) | 31,250 |
| Non-current assets | 111,110 | 22,396 | 7,193 | 15,242 | − | 155,941 |
| Long-term receivables | 6,351 | 1,811 | 94 | 12,964 | − | 21,220 |
| Investments | 379 | 977 | 173 | 37 | − | 1,566 |
| Property, plant and equipment | 101,875 | 19,496 | 6,851 | 1,947 | − | 130,169 |
| Operating assets | 92,087 | 16,851 | 4,808 | 1,585 | − | 115,331 |
| Assets under construction | 9,788 | 2,645 | 2,043 | 362 | − | 14,838 |
| Intangible assets | 2,505 | 112 | 75 | 294 | − | 2,986 |
| 25 |
| |
Table 28 - Reconciliation of Adjusted EBITDA by segment – 1Q23
| US$ million | E&P | RTM | GAS & POWER | CORP. AND OTHERS | ELIMIN. | TOTAL |
| Net income (loss) | 6,107 | 1,199 | 406 | (604) | 262 | 7,370 |
| Net finance income (expense) | − | − | − | 622 | − | 622 |
| Income taxes | 3,138 | 611 | 206 | (494) | 135 | 3,596 |
| Depreciation, depletion and amortization | 2,215 | 558 | 124 | 27 | − | 2,924 |
| EBITDA | 11,460 | 2,368 | 736 | (449) | 397 | 14,512 |
| Results in equity-accounted investments | (17) | (14) | (4) | − | − | (35) |
| Impairment of assets (reversals) | (13) | 16 | − | − | − | 3 |
| Results on disposal/write-offs of assets and on remeasurement of investment retained with loss of control | (507) | 11 | 7 | (7) | − | (496) |
| Results from co-participation agreements in bid areas | (28) | − | − | − | − | (28) |
| Adjusted EBITDA | 10,895 | 2,381 | 739 | (456) | 397 | 13,956 |
Table 29 - Reconciliation of Adjusted EBITDA by segment – 1Q22
| US$ million | E&P | RTM | GAS & POWER | CORP. AND OTHERS | ELIMIN. | TOTAL |
| Net income (loss) | 7,953 | 1,938 | (237) | (201) | (805) | 8,648 |
| Net finance income (expense) | − | − | − | (596) | − | (596) |
| Income taxes | 4,071 | 858 | (136) | 189 | (416) | 4,566 |
| Depreciation, depletion and amortization | 2,470 | 572 | 108 | 20 | − | 3,170 |
| EBITDA | 14,494 | 3,368 | (265) | (588) | (1,221) | 15,788 |
| Results in equity-accounted investments | (51) | (271) | (29) | 1 | − | (350) |
| Impairment of assets (reversals) | (1) | − | (1) | 1 | − | (1) |
| Results on disposal/write-offs of assets and on remeasurement of investment retained with loss of control | (420) | (54) | 1 | (3) | − | (476) |
| Results from co-participation agreements in bid areas | − | − | − | − | − | − |
| Adjusted EBITDA | 14,022 | 3,043 | (294) | (589) | (1,221) | 14,961 |
Table 30 - Reconciliation of Adjusted EBITDA by segment – 4Q22
| US$ million | E&P | RTM | GAS & POWER | CORP. AND OTHERS | ELIMIN. | TOTAL |
| Net income (loss) | 5,750 | 1,474 | 338 | 540 | 174 | 8,276 |
| Net finance income (expense) | − | − | − | (286) | − | (286) |
| Income taxes | 2,954 | 836 | 167 | (1,040) | 90 | 3,007 |
| Depreciation, depletion and amortization | 2,596 | 556 | 114 | 55 | − | 3,321 |
| EBITDA | 11,300 | 2,866 | 619 | (731) | 264 | 14,318 |
| Results in equity-accounted investments | (16) | 150 | (12) | − | − | 122 |
| Impairment of assets (reversals) | 1,091 | (198) | − | − | − | 893 |
| Results on disposal/write-offs of assets and on remeasurement of investment retained with loss of control | 13 | (2) | (8) | (9) | − | (6) |
| Results from co-participation agreements in bid areas | (1,424) | − | − | − | − | (1,424) |
| Adjusted EBITDA | 10,964 | 2,816 | 599 | (740) | 264 | 13,903 |
| 26 |
| |
Glossary ACL - Ambiente de Contratação Livre (Free contracting market) in the electricity system. ACR - Ambiente de Contratação Regulada (Regulated contracting market) in the electricity system. Adjusted cash and cash equivalents - Sum of cash and cash equivalents and investments in securities in domestic and international markets that have high liquidity, i.e., convertible into cash within 3 months, even if maturity is longer than 12 months, held for the purpose of complying with cash commitments. This measure is not defined under the International Financial Reporting Standards – IFRS and should not be considered in isolation or as a substitute for cash and cash equivalents computed in accordance with IFRS. It may not be comparable to adjusted cash and cash equivalents of other companies, however management believes that it is an appropriate supplemental measure to assess our liquidity and supports leverage management. Adjusted EBITDA – Adjusted EBITDA (a non-GAAP measure defined as net income plus net finance income (expense); income taxes; depreciation, depletion and amortization; results in equity-accounted investments; impairment of assets (reversals); results on disposal/write-offs of assets, remeasurement of investment retained with loss of control and reclassification of CTA; and results from co-participation agreements in bid areas). Adjusted EBITDA margin - Adjusted EBITDA divided by sales revenues. Basic and diluted earnings (losses) per share - Calculated based on the weighted average number of shares. CAPEX – Capital Expenditure – investments that encompasses acquisition of property, plant, and equipment, including costs with leasing, intangible assets, investments in subsidiaries and affiliates, costs with geology and geophysics and pre-operating costs. Consolidated Structured Entities – Entities that have been designated so that voting rights or the like are not the determining factor in deciding who controls the entity. Petrobras has no equity interest in certain structured entities that are consolidated in the Company's financial statements, but control is determined by the power it has over its relevant operating activities. As there is no equity interest, the income from certain consolidated structured entities is attributable to non-controlling shareholders in the income statement, and disregarding the profit or loss attributable to Petrobras shareholders. CTA – Cumulative translation adjustment – The cumulative amount of exchange variation arising on translation of foreign operations that is recognized in Shareholders’ Equity and will be transferred to profit or loss on the disposal of the investment. Effect of average cost in the Cost of Sales – In view of the average inventory term of 60 days, the crude oil and oil products international prices movement, as well as foreign exchange effect over imports, production taxes and other factors that impact costs, do not entirely influence the cost of sales in the current period, having their total effects only in the following period. Free cash flow - Net cash provided by operating activities less acquisition of PP&E and intangibles assets. Free cash flow is not defined under the IFRS and should not be considered in isolation or as a substitute for cash and cash equivalents calculated in accordance with IFRS. It may not be comparable to free cash flow of other companies, however management believes that it is an appropriate supplemental measure to assess our liquidity and supports leverage management. Investments – Capital expenditures based on the cost assumptions and financial methodology adopted in our Business and Management Plan, which include acquisition of PP&E, including expenses with leasing, intangibles assets, investment in investees and other items that do not necessarily qualify as cash flows used in investing activities, primarily geological and geophysical expenses, pre-operating charges, purchase of property, plant and equipment on credit and borrowing costs directly attributable to works in progress. | Leverage – Ratio between the Net Debt and the sum of Net Debt and Shareholders’ Equity. Leverage is not a measure defined in the IFRS and it is possible that it may not be comparable to similar measures reported by other companies, however management believes that it is an appropriate supplemental measure to assess our liquidity. Lifting Cost - Crude oil and natural gas lifting cost indicator, which considers expenditures occurred in the period. LTM Adjusted EBITDA - Sum of the last 12 months (Last Twelve Months) of Adjusted EBITDA. This metric is not foreseen in the international accounting standards - IFRS and it is possible that it is not comparable with similar indexes reported by other companies, however Management believes that it is supplementary information to assess liquidity and helps manage leverage. Adjusted EBITDA should be considered in conjunction with other metrics to better understand the Company's liquidity. OCF - Net Cash provided by (used in) operating activities (operating cash flow), presented in the consolidated cash flow statement. Net Debt – Gross debt less adjusted cash and cash equivalents. Net debt is not a measure defined in the IFRS and should not be considered in isolation or as a substitute for total long-term debt calculated in accordance with IFRS. Our calculation of net debt may not be comparable to the calculation of net debt by other companies, however our management believes that net debt is an appropriate supplemental measure that helps investors assess our liquidity and supports leverage management. Net Income by Business Segment - The information by the company's business segment is prepared based on available financial information that is directly attributable to the segment or that can be allocated on a reasonable basis, being presented by business activities used by the Executive Board to make resource allocation decisions. and performance evaluation. When calculating segmented results, transactions with third parties, including jointly controlled and associated companies, and transfers between business segments are considered. Transactions between business segments are valued at internal transfer prices calculated based on methodologies that take into account market parameters, and these transactions are eliminated, outside the business segments, for the purpose of reconciling the segmented information with the consolidated financial statements of the company. company. PLD (differences settlement price) - Electricity price in the spot market. Weekly weighed prices per output level (light, medium and heavy), number of hours and related market capacity. Refining - includes crude oil refining, logistics, transportation, acquisition and export activities, as well as the purchase and sale of petroleum and ethanol products in Brazil and abroad. Additionally, this segment includes the petrochemical area, which includes investments in companies in the petrochemical sector, shale exploration and processing. ROCE - operating profit after taxes / average capital employed, both measured in US$ on a LTM basis Operating profit after taxes: Adjusted EBITDA, minus DD&A of assets booked at historical exchange rates and 34% income tax rate. Average capital employed: quarterly average considering inventories, intangibles and fixed assets at historical exchange rates. Sales Price of Petroleum in Brazil - Average internal transfer prices from the E&P segment to the Refining segment. Total net liabilities - Total liability less adjusted cash and cash equivalents.
|
| 27 |
SIGNATURES
Pursuant to the requirements of the Securities Exchange Act of 1934, the registrant has duly caused this report to be signed on its behalf by the undersigned, thereunto duly authorized.
Date: May 11, 2023
PETRÓLEO BRASILEIRO S.A–PETROBRAS
By: /s/ Sergio Caetano Leite
______________________________
Sergio Caetano Leite
Chief Financial Officer and Investor Relations Officer