UNITED STATES
SECURITIES AND EXCHANGE COMMISSION
Washington, D.C. 20549
FORM 6-K
Report of Foreign Private Issuer
Pursuant to Rule 13a-16 or 15d-16 of the
Securities Exchange Act of 1934
For the month of October, 2019
Commission File Number 1-15106
PETRÓLEO BRASILEIRO S.A. - PETROBRAS
(Exact name of registrant as specified in its charter)
Brazilian Petroleum Corporation - PETROBRAS
(Translation of Registrant's name into English)
Avenida República do Chile, 65
20031-912 - Rio de Janeiro, RJ
Federative Republic of Brazil
(Address of principal executive office)
Indicate by check mark whether the registrant files or will file annual reports under cover Form 20-F or Form 40-F.
Form 20-F ___X___ Form 40-F _______
Indicate by check mark whether the registrant by furnishing the information contained in this Form is also thereby furnishing the information to the Commission pursuant to Rule 12g3-2(b) under the Securities Exchange Act of 1934.
Yes _______ No___X____
2
3Q19 Production and Sales Highlights
Rio de Janeiro, October 17, 2019 – We posted a solid operating performance in 3Q19, delivering significant growth in oil, NGL and natural gas production, which reached 2,878 kboed, 9.3% higher than 2Q19, led by the 17.0% increase in pre-salt production, which reached 1,367 kboed, representing 60.4% of oil production in Brazil. Pre-salt’s performance is due to the ramp-up of the 6 platforms that started up in 2018 and 2019 (P-74, P-75, P-76 and P-77 in Buzios field and P-67 and P- 69 in Lula field), which contributed 441 kbpd in 3Q19. Adding up the contribution of FPSO Cidade Campos dos Goytacazes inTartaruga Verde field, in the post-salt, we totaled 555 kbpd, which represents an increase of c. 48% over 2Q19, with the start-up of nine producing wells. It is also worth mentioning that platforms P-69 and P-76, in Lula and Búzios fields, reached the production capacity of 150 kbpd with a ramp-up time of 10.3 and 7.7 months (a record in the pre-salt), respectively.
In 3Q19, production reached a new monthly record of 3.0 MMboed, in addition to a new daily record of 3.1 MMboed, both reached in August. The operated production reached the monthly record of 3.7 MMboed in the same month. With these results we maintain the trajectory to reach the annual production target, of 2.7 MMboed, with a variation of 2.5% up or down.
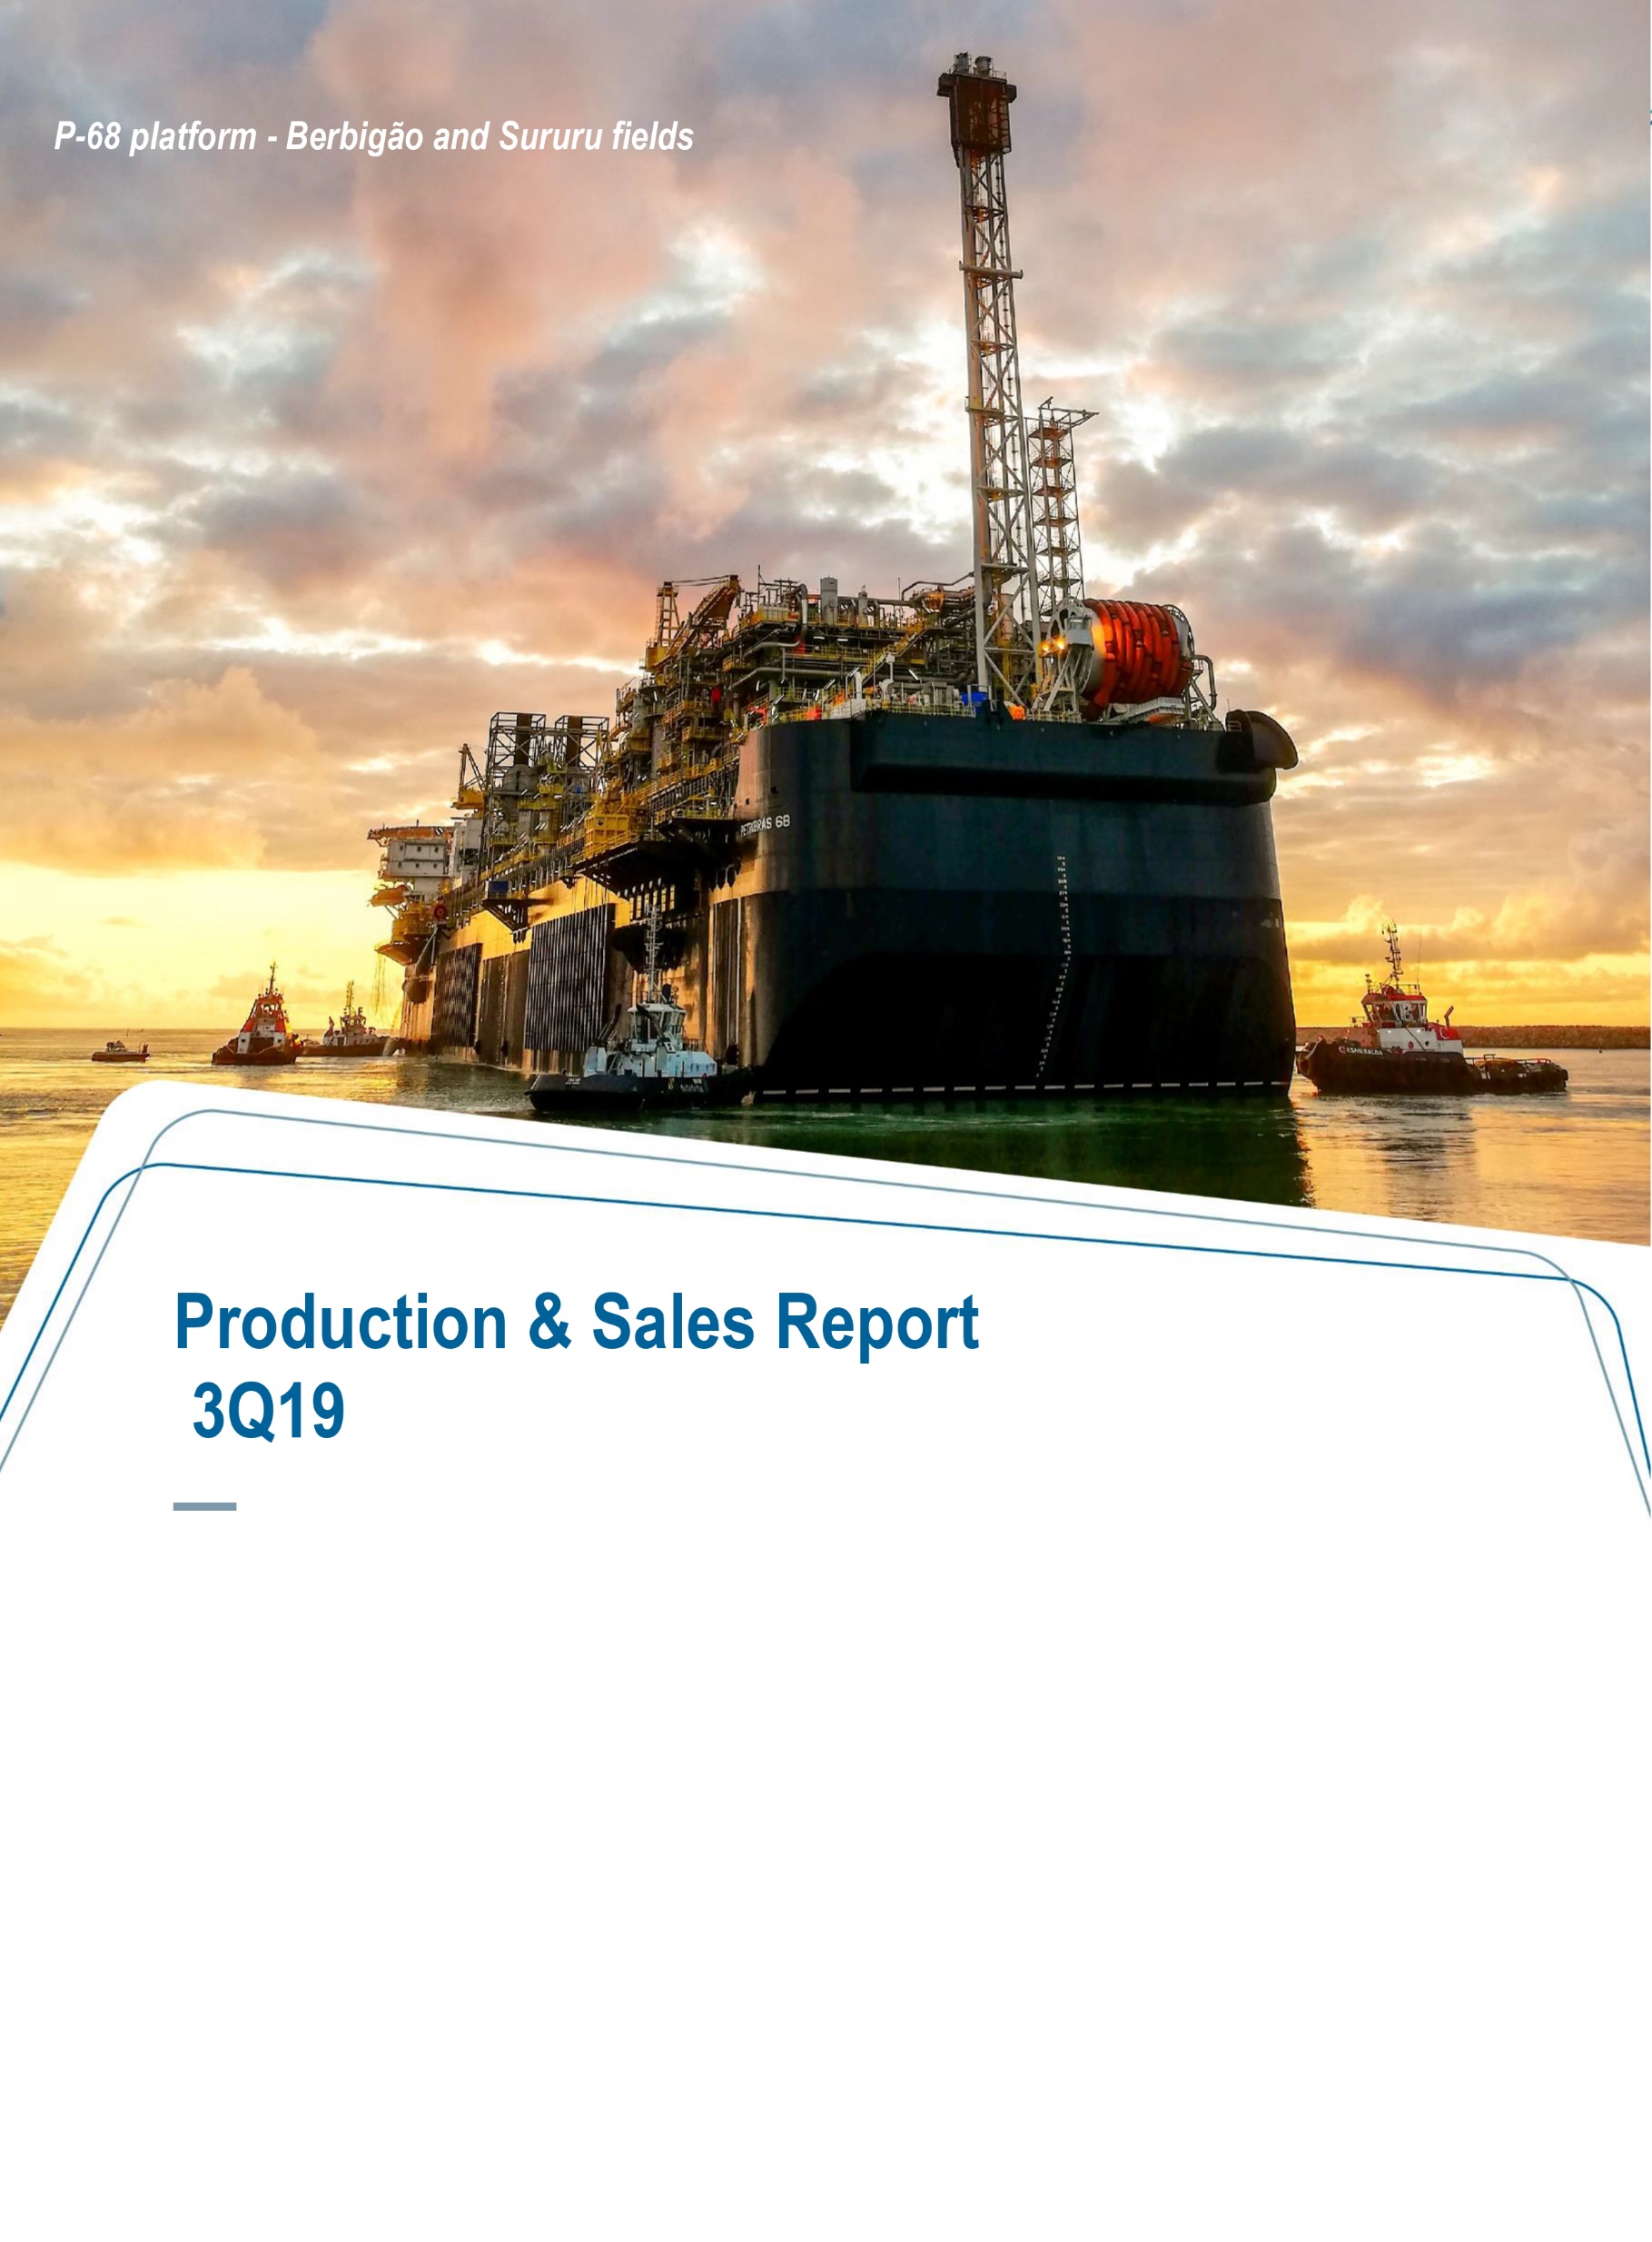
The P-68 platform, which will produce in the Berbigão and Sururu fields in the pre-salt, left the shipyard in September and is in the process of being moored. The project is expected to start operating in the fourth quarter of 2019. 11 wells have already been drilled, 8 producers and 3 injectors, and 5 of these wells are ready for interconnection.
Post-salt oil production was stable at 706 kbpd compared to 2Q19, while onshore and shallow water oil production increased 4.3% compared to 2Q19, reaching 192 kbpd.
In September, we celebrated 51 years of the first oil in the Brazilian continental shelf, eight kilometers off the coast of Aracaju, in a water depth of 33 meters, an event that marked the beginning of offshore production in Brazil. Nine years later, in August 1977, we produced the first oil at Enchova, in Campos Basin, four times deeper, marking the beginning of the success story that continued with the discovery of the giant fields in the following decades, until we reached the discovery of pre-salt, which today represents 60.4% of Brazil’s oil production. Throughout our trajectory, we have been challenged to produce in ever-deeper depths of water, now exceeding 2,100 meters and 300 km offshore, safely and with successive offshore world records through innovative technologies.
3
In Campos Basin, we reinforced our commitment to invest in the acquisition of new exploration areas, complementary development, Marlim revitalization and strategic partnerships to increase the recovery factor. With this strategic vision, we participated in the 16th ANP concession bidding round, on October 10, 2019, in which we acquired, as an operator, in partnership with BP Energy do Brasil, block CM-477, where we identified a large geological potential.
In the refining segment, following the higher demand in the quarter in the Brazilian market, we increased the production of oil products by 2.9% compared to the previous quarter – which also contributed to the reduction of imports, especially gasoline and LPG –, through the higher utilization of the refining system (which grew from 76% to 80%) and conversion units. Oil products sales increased 3.2% over the previous quarter, led by the increase in diesel sales, which grew by 5.2%, driven by agricultural and industrial activity. LPG sales increased 3.2% compared to 2Q19 mainly due to lower average temperatures. There was also an increase in exports, following the higher oil production, and a reduction in oil imports with greater domestic oil feedstock in the refineries.
We highlight the continuous optimization of the integrated refining plants, which has been improved through digital transformation technologies, such as the use of Digital Twins. This tool allows us to simulate replicates of our refineries to maximize profitability of the refining activity and aims to accelerate decision making. Process optimization using this tool generated a gain of about US$ 25 million in the quarter.
By reducing bunker sulfur content (marine fuel) according to IMO 2020, we are increasing bunker 0.5% production and low sulfur fuel oil streams, thereby capturing export opportunities and preparing to supply the market. The production of these streams amounted to 110 kbpd, an increase of 139% over 2Q19, which was 46 kbpd. It is worth mentioning that our refining system is well positioned to capture these opportunities due to the feedstock that favor the production of these streams.
In the gas and energy segment, thermoelectric generation stood out, with an increase of 124.6% over the previous quarter reflecting hydrological conditions and lower natural gas costs, and the increase in 9 MMm3/day of natural gas supply to meet thermoelectric demand.
4
1 – Exploration & Production
|
|
|
|
| Variation (%) | |||
Thousand barrels of oil equivalent per day (Kboed) | 3Q19 | 2Q19 | 3Q18 | 9M19 | 9M18 | 3Q19 / 2Q19 | 3Q19 / 3Q18 | 9M19 / 9M18 |
Crude oil, NGL and natural gas – Brazil | 2,794 | 2,553 | 2,398 | 2,604 | 2,514 | 9.5 | 16.5 | 3.6 |
Crude oil and NGLs (Kbpd) | 2,264 | 2,052 | 1,937 | 2,097 | 2,028 | 10.3 | 16.9 | 3.4 |
Onshore | 123 | 122 | 131 | 125 | 136 | 0.7 | (6.3) | (8.5) |
Shallow water | 69 | 62 | 89 | 69 | 92 | 9.8 | (22.7) | (24.9) |
Post-salt – deep and ultra deep | 706 | 700 | 742 | 712 | 823 | 0.8 | (4.9) | (13.5) |
Pre-salt | 1,367 | 1,168 | 975 | 1,191 | 977 | 17.0 | 40.2 | 22.0 |
Natural gas (Kboed) | 530 | 500 | 462 | 507 | 486 | 5.9 | 14.8 | 4.3 |
Crude oil, NGL and natural gas - abroad | 84 | 81 | 114 | 81 | 103 | 4.7 | (26.1) | (21.4) |
Total (Kboed) | 2,878 | 2,633 | 2,513 | 2,685 | 2,617 | 9.3 | 14.6 | 2.6 |
Oil, NGL and natural gas production totaled 2,878 kboed in 3Q19, an increase of 9.3% over 2Q19 and 14.6% over 3Q18, mainly due to the ramp-up of the 7 new systems that went into production in 2018 and 2019 in the Búzios field (P-74, P-75, P-76 and P-77), Lula (P-67 and P-69) and Tartaruga Verde (FPSO Campos dos Goytacazes).
Compared to 2Q19, pre-salt oil production increased by 17.0%, led by Búzios field, which increased production by 64% in 3Q19, with the start-up of four producing wells. In 3Q19, pre-salt oil production increased by 40.2% over 3Q18, mainly reflecting the start-up of new producing wells in the Lula and Búzios fields and in line with our strategy of concentrating efforts in assets that generate the highest return for our shareholders.
Deep and ultra-deepwater post-salt oil production remained stable in 3Q19 compared to the previous quarter as a result of efforts to increase the productivity of the Campos Basin platforms and the start-up of new producing wells into the FPSO Cidade de Campos dos Goytacazes in Tartaruga Verde field, which compensated the natural production decline in this region. Compared to 3Q18, there was a 4.9% reduction, due to the decline in production, partially offset by the start-up of new wells in the Tartaruga Verde field.
Oil production in shallow waters, non core assets and subject to divestment, was 69 kbpd in 3Q19, an increase of 7 kbpd compared to 2Q19, due to the return to production of the PPM-1 and PCH-2 platforms, which had stopped for maintenance in the previous quarter. Compared to 3Q18, there was a decrease of 22.7%, due to the natural decline and the shutdown of the PCP-1, PCP-2 and P-9 platforms.
Oil production in the onshore fields totaled 123 kbpd in 3Q19, in line with 2Q19 and reducing by 8 kbpd compared to 3Q18. Onshore fields are included in the Company’s portfolio optimization processes.
5
2 – Refining
|
|
|
|
| Variation (%) | |||
Thousand barrels per day (kbpd) | 3Q19 | 2Q19 | 3Q18 | 9M19 | 9M18 | 3Q19 / 2Q19 | 3Q19 / 3Q18 | 9M19 / 9M18 |
Total production volume | 1,816 | 1,765 | 1,801 | 1,774 | 1,774 | 2.9 | 0.8 | − |
Total sales volume | 1,805 | 1,745 | 1,941 | 1,763 | 1,794 | 3.4 | (7.0) | (1.7) |
Reference feedstock | 2,176 | 2,176 | 2,176 | 2,176 | 2,176 | − | − | − |
Refining plants utilization factor (%) | 80 | 76 | 78 | 77 | 77 | 5.3 | 2.6 | − |
Processed feedstock (excluding LNG) | 1,740 | 1,665 | 1,693 | 1,681 | 1,672 | 4.5 | 2.8 | 0.5 |
Processed feedstock | 1,791 | 1,707 | 1,743 | 1,724 | 1,726 | 4.9 | 2.8 | (0.1) |
Domestic crude oil as % of total processed feedstock | 90 | 89 | 88 | 90 | 92 | 1.1 | 2.3 | (2.2) |
Oil products output in 3Q19 reached 1,816 kbpd, an increase of 2.9% over 2Q19. This growth is mainly due to the demand expansion in the domestic market, which was met with a higher refining utilization factor, which reached 80% in 3Q19 against 76% in 2Q19. The refinery utilization factor is set on a monthly basis, being the result of the integrated refining system optimization, through a planning process that, based on the availability of oil and the assets, as well as demand forecasts, indicates the solution with the best economic result for the whole system.
The main production highlights were gasoline and LPG, as a result of the higher utilization factor of the catalytic cracking units, and bunker, due to its price appreciation in the international market. On the other hand, there was a drop in diesel production, and a consequent increase in imports to meet demand, due to the use of some of its streams for bunker production.
2.1 – Diesel
|
|
|
|
| Variation (%) | |||
Thousand barrels per day (kbpd) | 3Q19 | 2Q19 | 3Q18 | 9M19 | 9M18 | 3Q19 / 2Q19 | 3Q19 / 3Q18 | 9M19 / 9M18 |
Production volume | 710 | 720 | 750 | 703 | 708 | (1.4) | (5.3) | (0.7) |
Sales volume for the Brazilian market | 770 | 732 | 843 | 734 | 714 | 5.2 | (8.7) | 2.8 |
Diesel production in 3Q19 fell 1.4% and 5.3% compared to 2Q19 and 3Q18, respectively. The lower 3Q19 numbers were mainly due to the use of diesel streams for the production of bunker 0.5%, in line with IMO 2020 specifications. This was necessary in order to reduce the sulfur content of the final product and it proved to be economically advantageous.
6
Diesel sales increased 5.2% in 3Q19 compared to 2Q19 due to seasonality, with higher consumption in the third quarter due to the summer grain crop and to the industrial activity. As for mitigating factors, sales by competitors increased in 3Q19 and there was an increase in the average biodiesel content in diesel formulation between the periods, from 10.0%, the minimum percentage required since March 2018, to 11.0% from September1st, leading to a rise of diesel prices at the pump. Compared to 3Q18, sales fell mainly due to the increase in the competitors market share.
2.2 – Gasoline
|
|
|
|
| Variation (%) | |||
Thousand barrels per day (kbpd) | 3Q19 | 2Q19 | 3Q18 | 9M19 | 9M18 | 3Q19 / 2Q19 | 3Q19 / 3Q18 | 9M19 / 9M18 |
Production volume | 416 | 388 | 384 | 398 | 398 | 7.2 | 8.3 | − |
Sales volume for the Brazilian market | 377 | 367 | 387 | 376 | 401 | 2.6 | (2.7) | (6.1) |
In 3Q19, gasoline production increased by 7.2% compared to 2Q19 and 8.3% compared to 3Q18, as a result of the higher demand in the Brazilian market, which has been met by the increase in the use of catalytic cracking units. In addition, the lower demand for petrochemical naphtha in Brazil led to a production optimization, with naphtha streams being directed to the gasoline pool.
Gasoline sales in 3Q19 were 2.6% higher than in 2Q19 due to the drop in average consumer prices. As a mitigating factor there was an increase in imports by competitors QoQ, which grew from 52 kbpd in 2Q19 to 62 kbpd in 3Q19. Compared to 3Q18, sales decreased by 2.7% due to higher imports by competitors. It should be noted that gasoline consumption was positively influenced by the increase in ethanol average prices between the periods.
2.3 – Fuel Oil
|
|
|
|
| Variation (%) | |||
Thousand barrels per day (kbpd) | 3Q19 | 2Q19 | 3Q18 | 9M19 | 9M18 | 3Q19 / 2Q19 | 3Q19 / 3Q18 | 9M19 / 9M18 |
Production volume | 197 | 176 | 180 | 190 | 183 | 11.9 | 9.4 | 3.8 |
Sales volume for the Brazilian market | 38 | 38 | 58 | 40 | 47 | (1.9) | (34.8) | (14.9) |
Fuel oil production increased 11.9% in 3Q19 compared to 2Q19, mainly due to the higher utilization of distillation units and to the beginning of the bunker 0.5% production, whose price appreciation allowed for increased exports under better economic conditions. IMO 2020 also brought export opportunities to the 0.7% sulfur fuel oil, especially to the Singapore market.
7
Fuel oil sales in Brazil were in line with 2Q19. There was a reduction in deliveries to thermoelectric plants but, in contrast, there were increased deliveries to Alunorte due to the resumption of its operations in the second half of May. Compared to 3Q18, sales were lower due to lower thermoelectric demand.
2.4 – Naphta
|
|
|
|
| Variation (%) | |||
Thousand barrels per day (kbpd) | 3Q19 | 2Q19 | 3Q18 | 9M19 | 9M18 | 3Q19 / 2Q19 | 3Q19 / 3Q18 | 9M19 / 9M18 |
Production volume | 73 | 82 | 83 | 75 | 69 | (11.0) | (12.0) | 8.7 |
Sales volume for the Brazilian market | 72 | 85 | 102 | 83 | 97 | (15.2) | (29.0) | (14.6) |
Naphtha production in 3Q19 decreased by 11.0% compared to 2Q19, mainly due to the lower demand for this oil product in the Brazilian market, which was entirely met by our own production. In addition, part of the volume of naphtha production went to gasoline production.
2.5 – Liquefied Petroleum Gas (LPG)
|
|
|
|
| Variation (%) | |||
Thousand barrels per day (kbpd) | 3Q19 | 2Q19 | 3Q18 | 9M19 | 9M18 | 3Q19 / 2Q19 | 3Q19 / 3Q18 | 9M19 / 9M18 |
Production volume | 137 | 122 | 129 | 126 | 127 | 12.3 | 6.2 | (0.8) |
Sales volume for the Brazilian market | 240 | 232 | 242 | 229 | 232 | 3.2 | (1.0) | (1.5) |
LPG production increased by 12.3% in 3Q19 over 2Q19 to meet market expansion (due to the winter period) through the increase of catalytic cracking units utilization. Compared to the same period of 2018, the 6.2% increase is due to the higher utilization and availability of conversion units, especially catalytic cracking units.
LPG sales increased 3.2% compared to 2Q19 mainly due to lower average temperatures and seasonality of LPG consumption due to higher economic activity in the period.
2.6 – Jet Fuel
|
|
|
|
| Variation (%) | |||
Thousand barrels per day (kbpd) | 3Q19 | 2Q19 | 3Q18 | 9M19 | 9M18 | 3Q19 / 2Q19 | 3Q19 / 3Q18 | 9M19 / 9M18 |
Production volume | 101 | 105 | 100 | 106 | 111 | (3.8) | 1.0 | (4.5) |
Sales volume for the Brazilian market | 116 | 114 | 126 | 119 | 122 | 2.3 | (7.7) | (2.6) |
In 3Q19, jet fuel production volume remained stable compared to 2Q19 and 3Q18.
8
Jet fuel sales in 3Q19 increased 2.3% over 2Q19 as a consequence of stronger seasonality in the third quarter due to July school holidays in Brazil and the northern hemisphere holidays in August, as well as the reduction in the international price of jet fuel. Compared to 3Q18, sales were down 7.7% due to the adjustment in the domestic airline sector in 2019.
3 – Gas & Power
|
|
|
|
| Variation (%) | |||
| 3Q19 | 2Q19 | 3Q18 | 9M19 | 9M18 | 3Q19 / 2Q19 | 3Q19 / 3Q18 | 9M19 / 9M18 |
Thermal availability – Average MW | 2,788 | 2,788 | 2,788 | 2,788 | 2,788 | – | – | – |
Contract sales – Average MW | 1,154 | 1,194 | 1,142 | 1,167 | 1,239 | (3.4) | 1.1 | (5.8) |
Generation of electricity – average MW | 2,190 | 975 | 3,371 | 1,856 | 2,533 | 124.6 | (35.0) | (26.7) |
Settlement price of the differences SE / CO – R$ / MWh | 214 | 131 | 495 | 210 | 332 | 63.4 | (56.8) | (36.7) |
National gas delivery (MM m³ / day) | 52 | 49 | 42 | 50 | 48 | 6.1 | 23.8 | 4.2 |
Regasification of liquefied natural gas (MM m³ / day) | 13 | 8 | 19 | 9 | 9 | 62.5 | (31.6) | – |
Imports of natural gas (MM m³ / day) | 14 | 13 | 24 | 15 | 23 | 7.7 | (41.7) | (34.8) |
Sales volume of natural gas – MM m³ / day | 78 | 70 | 85 | 75 | 80 | 11.4 | (8.2) | (6.3) |
Electricity generation averaged 2,190 MW in 3Q19, an increase of 124.6% over 2Q19. This increase can be explained mainly by two factors: (i) higher dispatch on merit due to the higher settlement price of the differences value, reflecting worse hydrological conditions with lower inflows in rivers and basins, impacting reservoir levels; and (ii) higher off-merit power generation, due to lower fuel costs and better remuneration by the settlement price of the differences.
The 35.0% drop in thermoelectric power generation between 3Q19 and 3Q18 was due to the improved hydrological scenario compared to the previous year, which led to an increase in the level of water storage in the reservoirs.
Natural gas sales volume was 78 MMm³/day in 3Q19, representing an increase of 11.4% over 2Q19, due to the higher natural gas thermoelectric dispatch, with the volume growing from 17 MMm³/day to 26 MMm³/day. In the same period, the volume of natural gas supplied to the non-thermoelectric segment was stable at 38.5 MMm³/day.
In 2019, the lower prices of liquefied natural gas (LNG) in the international market allowed us to opt for higher imports of this product – to the detriment of Bolivian gas imports – to complement the natural gas supply.
9
Annex I: Consolidated Sales Volume
|
|
|
|
| Variation (%) | |||
Thousand barrels per day (kbpd) | 3Q19 | 2Q19 | 3Q18 | 9M19 | 9M18 | 3Q19 / 2Q19 | 3Q19 / 3Q18 | 9M19 / 9M18 |
Diesel | 770 | 732 | 843 | 734 | 714 | 5.2 | (8.7) | 2.8 |
Gasoline | 377 | 367 | 387 | 376 | 401 | 2.6 | (2.7) | (6.1) |
Fuel oil | 38 | 38 | 58 | 40 | 47 | (1.9) | (34.8) | (14.9) |
Naphtha | 72 | 85 | 102 | 83 | 97 | (15.2) | (29.0) | (14.6) |
LPG | 240 | 232 | 241 | 229 | 232 | 3.2 | (1.0) | (1.5) |
Jet Fuel | 116 | 114 | 126 | 119 | 122 | 2.3 | (7.7) | (2.6) |
Others | 172 | 156 | 160 | 161 | 161 | 10.3 | 7.5 | – |
Total oil products | 1,785 | 1,724 | 1,917 | 1,742 | 1,774 | 3.5 | (6.9) | (1.8) |
Alcohols, nitrogenous, renewable and others | 4 | 7 | 17 | 8 | 18 | (42.9) | (76.5) | (55.6) |
Natural gas | 356 | 323 | 367 | 339 | 352 | 10.2 | (3.0) | (3.7) |
Total domestic market | 2,145 | 2,054 | 2,301 | 2,089 | 2,144 | 4.4 | (6.8) | (2.6) |
Exports of crude oil, oil products and other | 802 | 606 | 497 | 691 | 582 | 32.3 | 61.4 | 18.7 |
Sales from international units | 78 | 67 | 231 | 104 | 238 | 16.4 | (66.2) | (56.3) |
Total external market | 880 | 673 | 728 | 795 | 820 | 30.8 | 20.9 | (3.0) |
Grand total | 3,025 | 2,727 | 3,029 | 2,884 | 2,964 | 10.9 | (0.1) | (2.7) |
Annex II: Net Exports and Imports
|
|
|
|
| Variation (%) | |||
Thousand barrels per day (kbpd) | 3Q19 | 2Q19 | 3Q18 | 9M19 | 9M18 | 3Q19 / 2Q19 | 3Q19 / 3Q18 | 9M19 / 9M18 |
Net export (import) | 469 | 217 | 58 | 336 | 258 | 116.1 | 708.6 | 30.23 |
Import | 332 | 389 | 438 | 354 | 323 | (14.7) | (24.2) | 9.6 |
Crude Oil | 153 | 189 | 207 | 173 | 157 | (19.0) | (26.1) | 10.2 |
Diesel | 87 | 51 | 91 | 69 | 47 | 70.6 | (4.4) | 46.8 |
Gasoline | 14 | 36 | 17 | 25 | 9 | (61.1) | (17.6) | 177.8 |
Naphtha | – | 14 | 18 | 9 | 26 | (100.0) | (100.0) | (65.4) |
GLP | 55 | 85 | 68 | 62 | 67 | (35.3) | (19.1) | (7.5) |
Other oil products | 23 | 14 | 37 | 16 | 17 | 64.3 | (37.8) | (5.9) |
Export | 801 | 606 | 496 | 690 | 581 | 32.2 | 61.5 | 18.8 |
Crude Oil | 583 | 416 | 322 | 498 | 415 | 40.1 | 81.1 | 20.0 |
Fuel oil | 131 | 129 | 137 | 125 | 125 | 1.6 | (4.4) | – |
Other oil products | 87 | 61 | 37 | 67 | 41 | 42.6 | 135.1 | 63.4 |
Net exports increased by 252 kbpd to 469 kbpd in 3Q19, mainly due to higher oil exports following the increase in production. In addition, there was also an increase in gasoline exports due to the higher production of this oil product. Reduced imports of oil and oil products also contributed to the increase in net exports.
Compared to 3Q18, net exports increased by 411 kbpd, also due to the increase in oil exports. Between these quarters there was also a reduction of 106 kbpd in oil and oil products imports.
Disclaimer
These presentations may contain predictions about future events. Such forecasts reflect only the expectations of the Company's management regarding future economic conditions, as well as the Company's operating sector, performance and financial results, among others. The terms "anticipate", "believe", "expect", "predict", "intend", "plan", "project", "aim", "should", as well as other similar terms, are intended to identify such predictions, which, of course, involve risks and uncertainties anticipated or not by the Company and, therefore, are not guarantees of the Company's future results, therefore, the future results of the Company's operations may differ from current expectations and the reader should not rely solely on The Company does not undertake to update its presentation and forecasts in light of new information or future developments. The figures for 3Q19 onwards are estimates or targets. The operating data contained in this report are not audited by the auditor. independent.
Pursuant to the requirements of the Securities Exchange Act of 1934, the registrant has duly caused this report to be signed on its behalf by the undersigned, thereunto duly authorized.
Date: October 17, 2019.
PETRÓLEO BRASILEIRO S.A—PETROBRAS
By: /s/ Andrea Marques de Almeida
______________________________
Andrea Marques de Almeida
Chief Financial Officer and Investor Relations Officer