EXHIBIT 99.4

1 1 Q3 2016 Earnings Presentation November 7, 2016
2 Safe Harbor Statement CertainstatementsintheBusinessUpdateandOrderBacklogsectionscontainforward-lookingstatementswithinthemeaningofthe“safeharbor” provisionsoftheU.S.PrivateSecuritiesLitigationReformActof1995,andunderapplicableCanadiansecuritieslaws.Thesestatementsarebased onmanagement’scurrentexpectationsandactualresultsmaydifferfromtheseforward-lookingstatementsduetonumerousfactors,including:our inabilitytoincreaseourrevenuesorraiseadditionalfundingtocontinueoperations,executeourbusinessplan,ortogrowourbusiness;ourinability toaddressaslowreturntoeconomicgrowth,anditsimpactonourbusiness,resultsofoperationsandconsolidatedfinancialcondition;ourlimited operating history; inability to implement our business strategy; fluctuations in our quarterly results; failure to maintain our customer base that generatesthemajorityofourrevenues;currencyfluctuations;failuretomaintainsufficientinsurancecoverage;changesinvalueofgoodwill;failureof asignificantmarkettodevelopforourproducts;failureofhydrogenbeingreadilyavailableonacost-effectivebasis;changesingovernmentpolicies andregulations;failureofuniformcodesandstandardsforhydrogenfuelledvehiclesandrelatedinfrastructuretodevelop;liabilityforenvironmental damagesresultingfromourresearch,development ormanufacturingoperations;failuretocompetewithotherdevelopersandmanufacturersof products in our industry; failure to compete with developers and manufacturers of traditional and alternative technologies; failure to develop partnershipswithoriginalequipmentmanufacturers,governments,systemsintegratorsandotherthirdparties;inabilitytoobtainsufficientmaterials andcomponentsforourproductsfromsuppliers;failuretomanageexpansionofouroperations;failuretomanageforeignsalesandoperations; failuretorecruit,trainandretainkeymanagementpersonnel;inabilitytointegrateacquisitions;failuretodevelopadequatemanufacturingprocesses andcapabilities;failuretocompletethedevelopmentofcommerciallyviableproducts;failuretoproducecost-competitiveproducts;failureordelayin fieldtestingofourproducts;failuretoproduceproductsfreeofdefectsorerrors;inability toadapttotechnologicaladvancesornewcodesand standards;failuretoprotectourintellectualproperty;ourinvolvementinintellectualpropertylitigation;exposuretoproductliabilityclaims;failureto meetrulesregardingpassiveforeigninvestmentcompanies;actionsofoursignificantandprincipalshareholders;dilutionasaresultofsignificant issuancesofourcommonsharesandpreferredshares;inabilityofUSinvestorstoenforceUScivilliabilityjudgmentsagainstus;volatilityofour commonshareprice;dilutionasaresultoftheexerciseofoptions;andfailuretomeetcontinuedlistingrequirementsofNasdaq.Readersshouldnot placeunduerelianceonHydrogenics’forward-lookingstatements.Investorsareencouragedtoreviewthesectioncaptioned“RiskFactors”inour regulatory filings with the Canadian securities regulatory authorities and the US Securities and Exchange Commission for a more complete discussionoffactorsthatcouldaffectourfutureperformance. Furthermore,theforward-lookingstatementscontainedhereinaremadeasofthedate ofthispresentation,andweundertakenoobligationtoreviseorupdateanyforward-lookingstatementsinordertoreflecteventsorcircumstances thatmayariseafterthedateofthispresentation,unlessotherwiserequiredbylaw.Theforward-lookingstatementscontainedinthispresentationare expresslyqualifiedbythis.
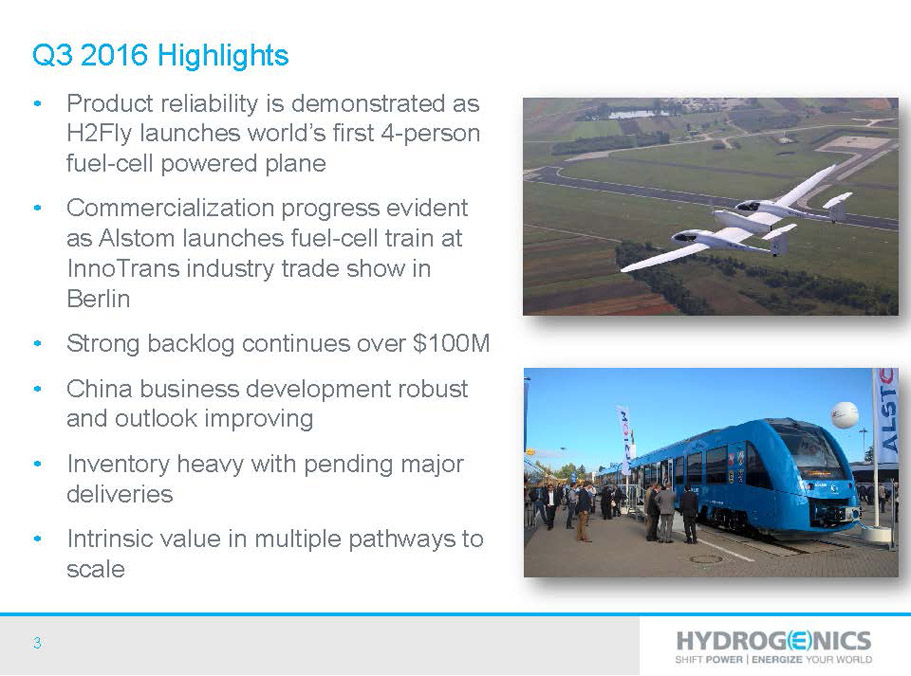
3 Q3 2016 Highlights • Product reliability is demonstrated as H2Fly launches world’s first 4-person fuel-cell powered plane • Commercialization progress evident as Alstomlaunches fuel-cell train at InnoTrans industry trade show in Berlin • Strong backlog continues over $100M • China business development robust and outlook improving • Inventory heavy with pending major deliveries • Intrinsic value in multiple pathways to scale
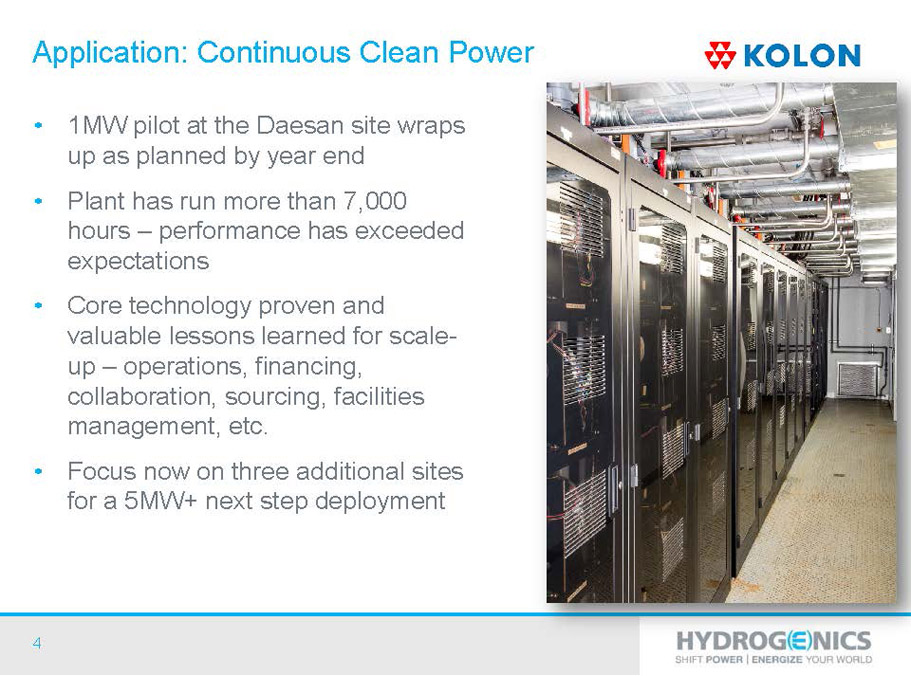
4 Application: Continuous Clean Power • 1MW pilot at the Daesansite wraps up as planned by year end • Plant has run more than 7,000 hours –performance has exceeded expectations • Core technology proven and valuable lessons learned for scale- up –operations, financing, collaboration, sourcing, facilities management, etc. • Focus now on three additional sites for a 5MW+ next step deployment
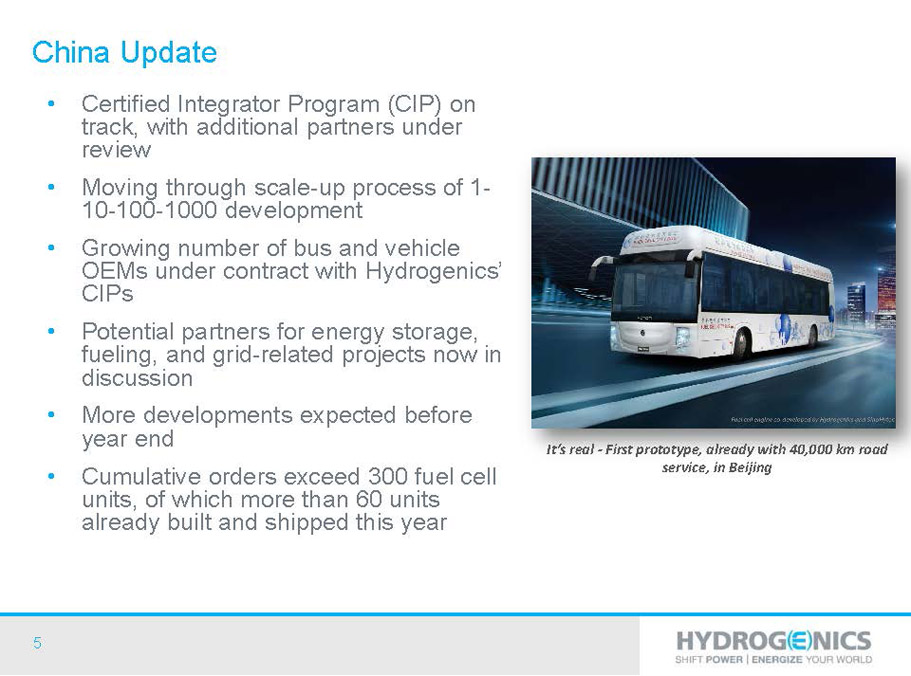
5 China Update • Certified Integrator Program (CIP) on track, with additional partners under review • Moving through scale-up process of 1- 10-100-1000 development • Growing number of bus and vehicle OEMs under contract with Hydrogenics’ CIPs • Potential partners for energy storage, fueling, and grid-related projects now in discussion • More developments expected before year end • Cumulative orders exceed 300 fuel cell units, of which more than 60 units already built and shipped this year It’s real -First prototype, already with 40,000 km road service, in Beijing
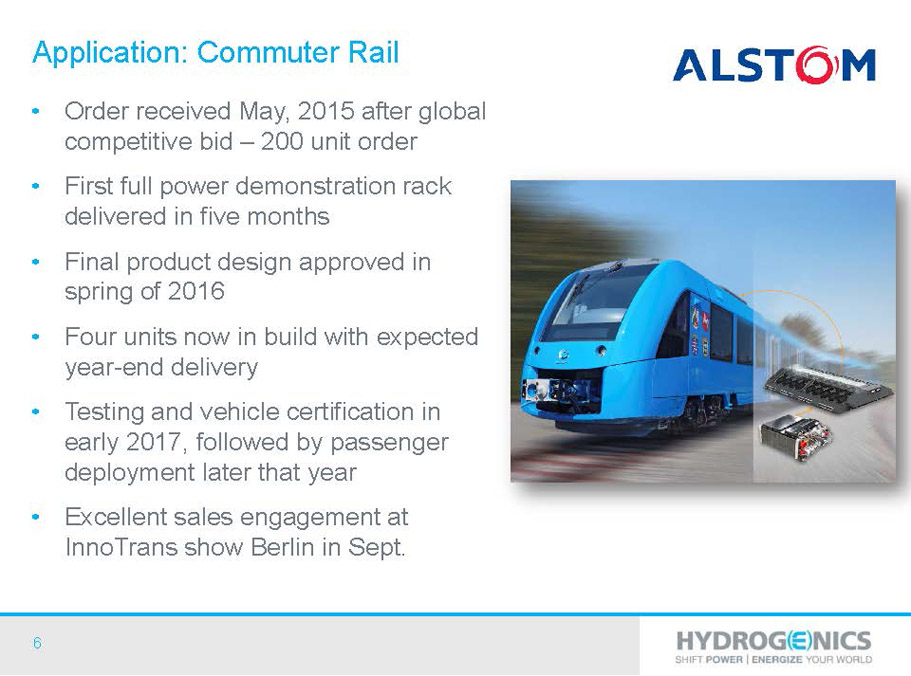
6 Application: Commuter Rail • Order received May, 2015 after global competitive bid –200 unit order • First full power demonstration rack delivered in five months • Final product design approved in spring of 2016 • Four units now in build with expected year-end delivery • Testing and vehicle certification in early 2017, followed by passenger deployment later that year • Excellent sales engagement at InnoTrans show Berlin in Sept.
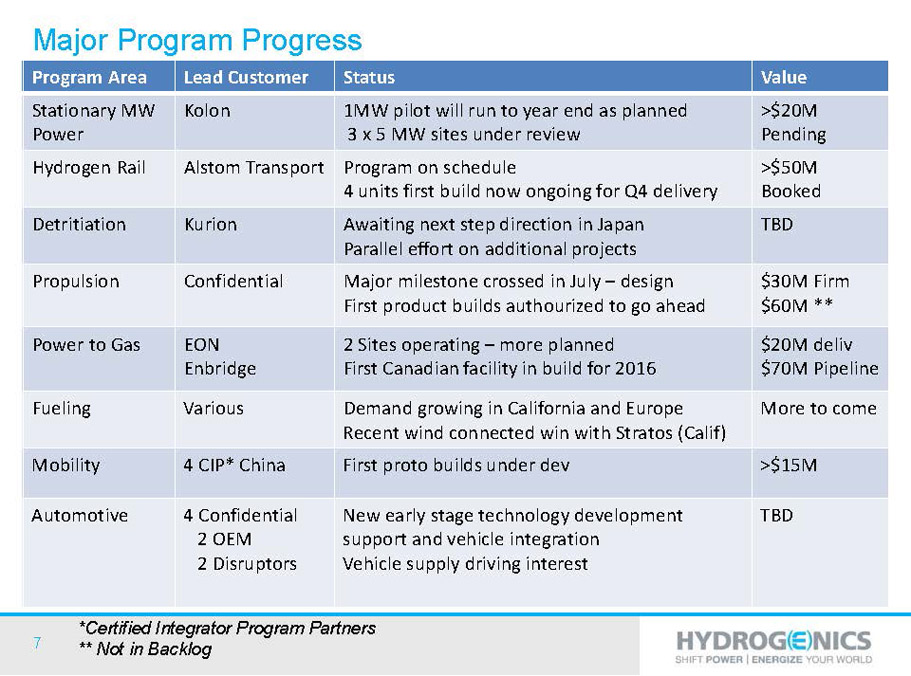
7 Major Program Progress Program Area LeadCustomer Status Value Stationary MW Power Kolon 1MWpilot will run to year end as planned 3 x 5MW sites under review >$20M Pending Hydrogen Rail Alstom Transport Program on schedule 4 units first build now ongoingfor Q4 delivery >$50M Booked Detritiation Kurion Awaiting next step direction in Japan Paralleleffort on additional projects TBD Propulsion Confidential Major milestone crossed in July –design First product builds authourizedto go ahead $30M Firm $60M ** Power to Gas EON Enbridge 2Sites operating –more planned FirstCanadian facility in build for 2016 $20M deliv $70M Pipeline Fueling Various Demand growingin California and Europe Recent wind connected win with Stratos(Calif) More to come Mobility 4 CIP* China First proto builds under dev >$15M Automotive 4 Confidential 2 OEM 2 Disruptors New early stage technology development support and vehicle integration Vehicle supply driving interest TBD *Certified Integrator Program Partners ** Not in Backlog
8 $9M Loan Facility and Business Plan • New debt facility provides funding for growth • Long duration, large projects put pressure on cash cycle – Example: propulsion project is based on percentage completion, and revenue exceeds cash realized by $5M • Other government funded work for Power-to-Gas and fueling projects • Current high inventory level will cycle to cash in coming quarters, but debt facility will provide important support for future business • Funding of recently completed expansion of facilities and equipment expenditures
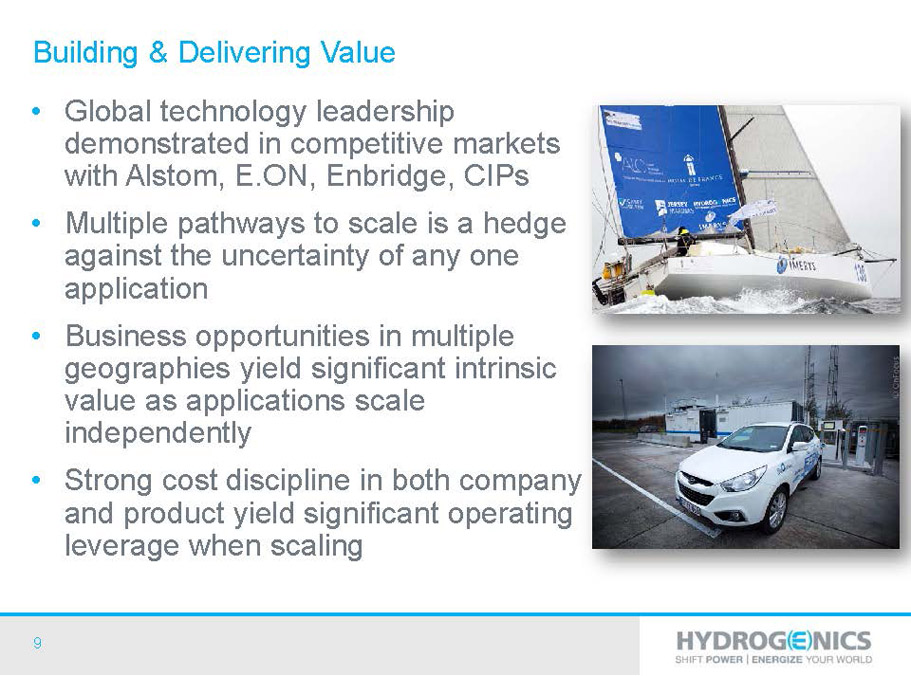
9 Building & Delivering Value • Global technology leadership demonstrated in competitive markets with Alstom, E.ON, Enbridge, CIPs • Multiple pathways to scale is a hedge against the uncertainty of any one application • Business opportunities in multiple geographies yield significant intrinsic value as applications scale independently • Strong cost discipline in both company and product yield significant operating leverage when scaling
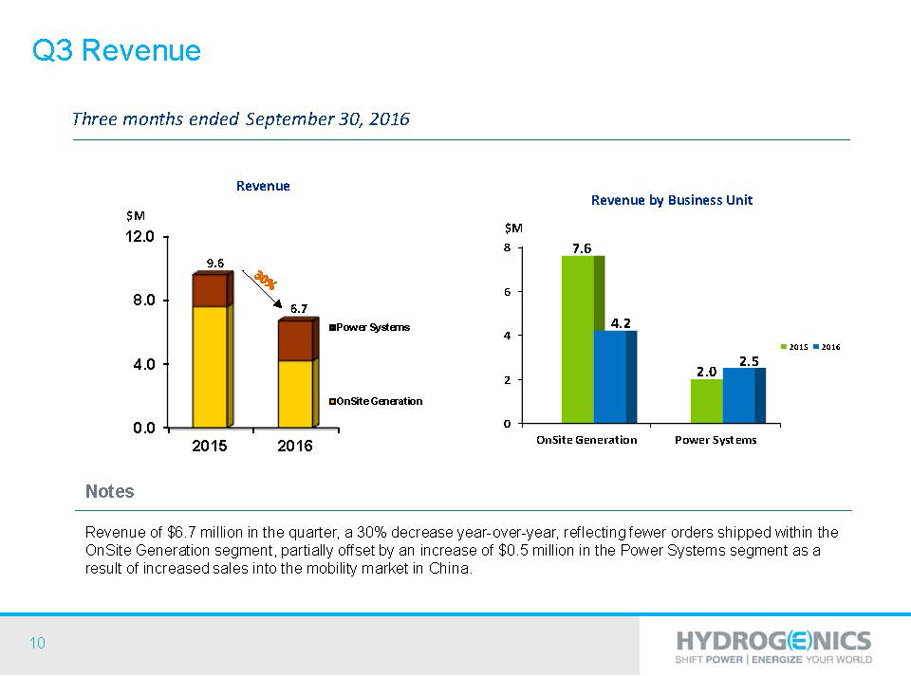
10 0.0 4.0 8.0 12.0 2015 2016 Power Systems OnSite Generation Notes Revenue of $6.7 million in the quarter, a 30% decrease year-over-year, reflecting fewer orders shipped within the OnSite Generation segment, partially offset by an increase of $0.5 million in the Power Systems segment as a result of increased sales into the mobility market in China. Revenue Three months endedSeptember 30, 2016 $M Revenue by Business Unit 6.7 9.6 0 2 4 6 8 OnSite Generation Power Systems 7.6 2.0 4.2 2.5 2015 2016 $M Q3 Revenue
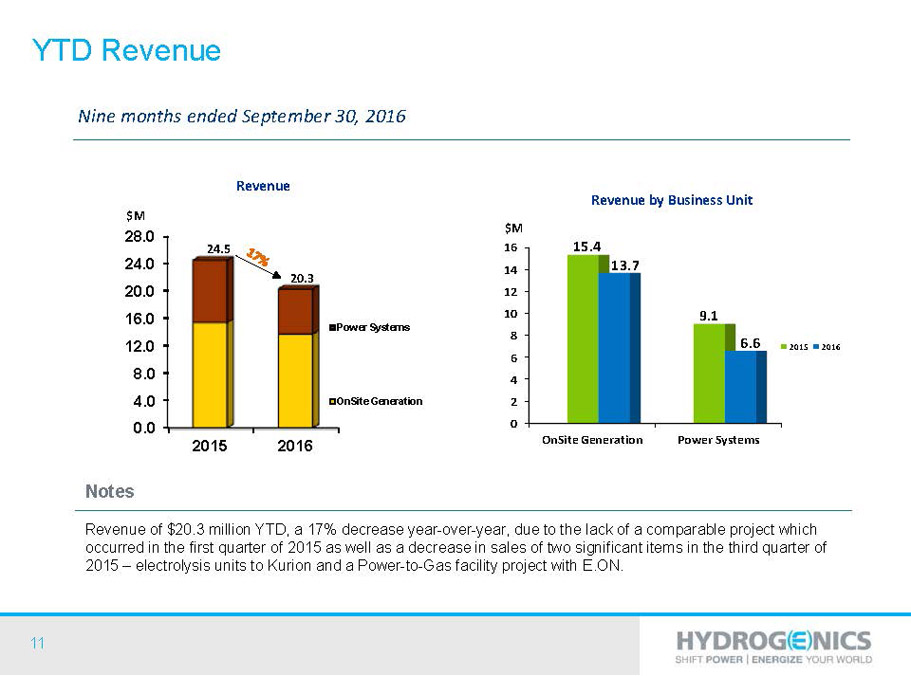
11 0.0 4.0 8.0 12.0 16.0 20.0 24.0 28.0 2015 2016 Power Systems OnSite Generation Notes Revenue of $20.3 million YTD, a 17% decrease year-over-year, due to the lack of a comparable project which occurred in the first quarter of 2015 as well as a decrease in sales of two significant items in the third quarter of 2015 –electrolysis units to Kurion and a Power-to-Gas facility project with E.ON. Revenue Nine months ended September 30, 2016 $M Revenue by Business Unit 20.3 24.5 0 2 4 6 8 10 12 14 16 OnSite Generation Power Systems 15.4 9.1 13.7 6.6 2015 2016 $M YTD Revenue
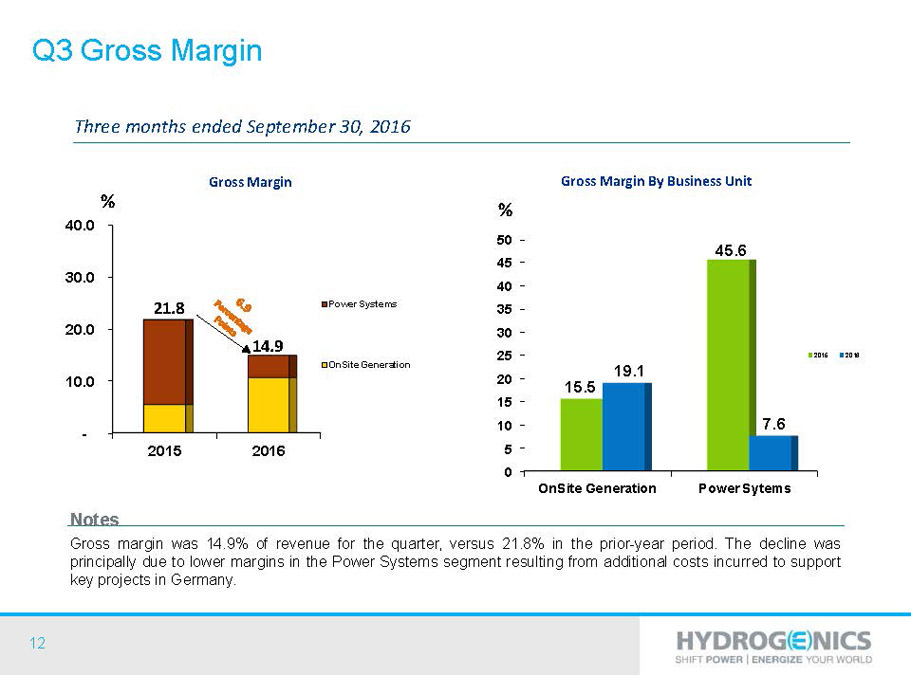
12 - 10.0 20.0 30.0 40.0 2015 2016 Power Systems OnSite Generation 0 5 10 15 20 25 30 35 40 45 50 OnSite Generation Power Sytems 15.5 45.6 19.1 7.6 2015 2016 Three months ended September 30, 2016 Gross Margin By Business Unit 21.8 14.9 Gross Margin Notes Gross margin was 14.9% of revenue for the quarter,versus 21.8% in the prior-year period. The decline was principallyduetolowermarginsinthePowerSystemssegmentresultingfromadditionalcostsincurredtosupport keyprojectsinGermany. % % Q3 GrossMargin
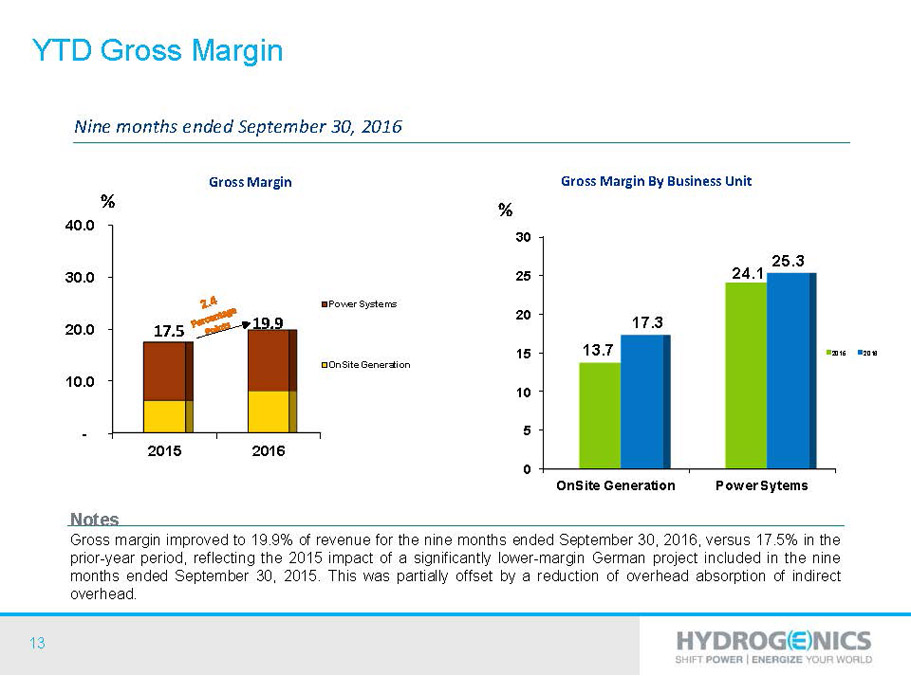
13 - 10.0 20.0 30.0 40.0 2015 2016 Power Systems OnSite Generation 0 5 10 15 20 25 30 OnSite Generation Power Sytems 13.7 24.1 17.3 25.3 2015 2016 Nine months ended September 30, 2016 Gross Margin By Business Unit 17.5 19.9 Gross Margin Notes Grossmarginimprovedto19.9%ofrevenuefortheninemonthsendedSeptember30,2016,versus17.5%inthe prior-yearperiod,reflectingthe2015impactofasignificantlylower-marginGermanprojectincludedinthenine monthsendedSeptember30,2015.Thiswaspartiallyoffsetbyareductionofoverheadabsorptionofindirect overhead. % % YTDGrossMargin
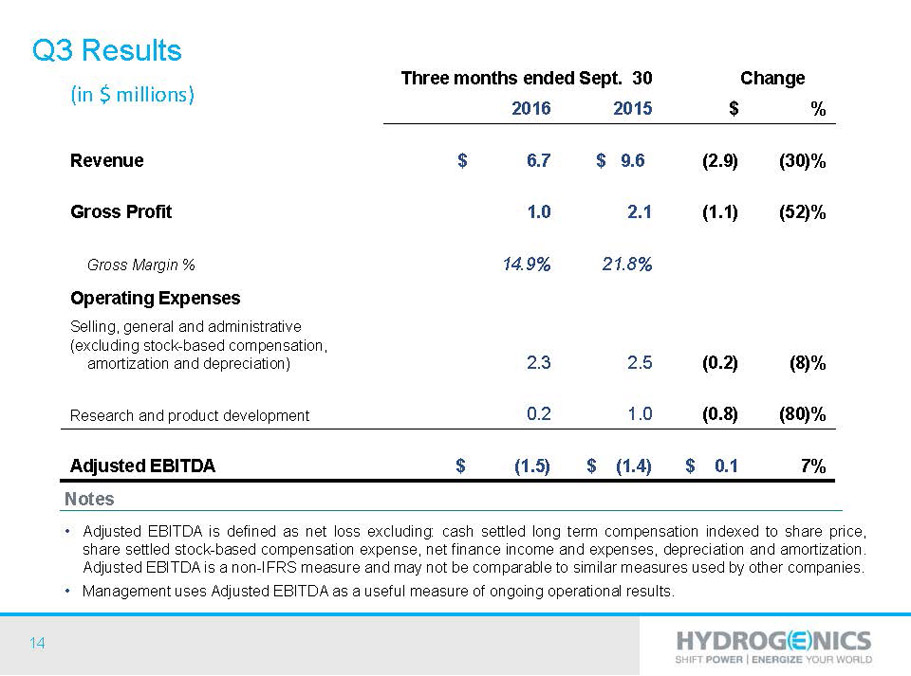
14 Three months ended Sept. 30 Change 2016 2015 $ % Revenue $ 6.7 $ 9.6 (2.9) (30)% Gross Profit 1.0 2.1 (1.1) (52)% Gross Margin % 14.9% 21.8% Operating Expenses Selling, general and administrative (excluding stock-based compensation, amortization and depreciation) 2.3 2.5 (0.2) (8)% Research and product development 0.2 1.0 (0.8) (80)% Adjusted EBITDA $ (1.5) $ (1.4) $ 0.1 7% Notes • AdjustedEBITDAisdefinedasnetlossexcluding: cashsettledlongtermcompensationindexedtoshareprice, sharesettledstock-basedcompensationexpense,netfinanceincomeandexpenses,depreciationandamortization. AdjustedEBITDAisanon-IFRSmeasureandmaynotbecomparabletosimilarmeasuresusedbyothercompanies. • ManagementusesAdjustedEBITDAasausefulmeasureofongoingoperationalresults. (in $ millions) Q3 Results
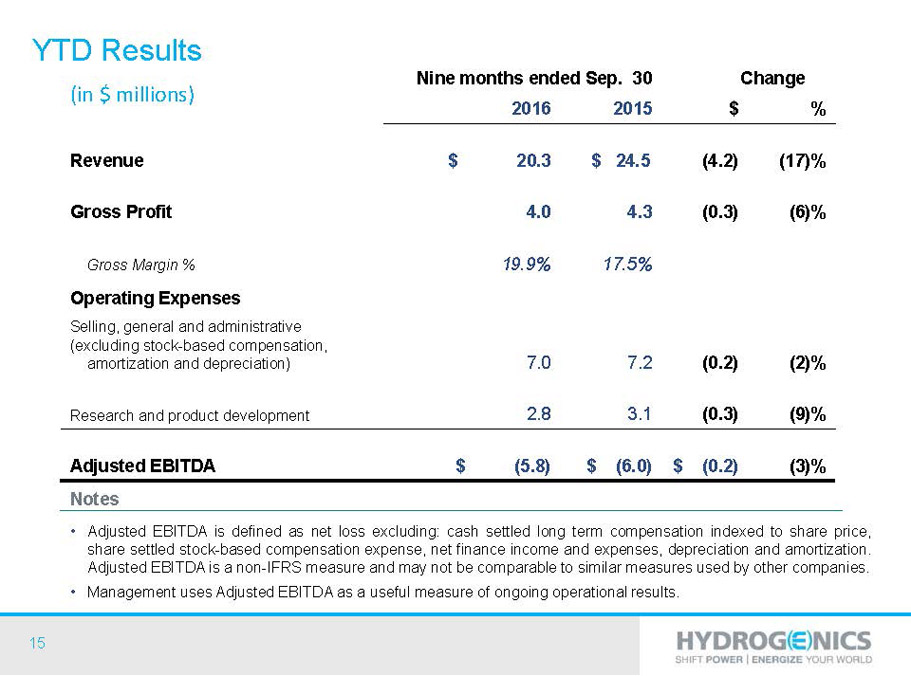
15 Nine months ended Sep. 30 Change 2016 2015 $ % Revenue $ 20.3 $ 24.5 (4.2) (17)% Gross Profit 4.0 4.3 (0.3) (6)% Gross Margin % 19.9% 17.5% Operating Expenses Selling, general and administrative (excluding stock-based compensation, amortization and depreciation) 7.0 7.2 (0.2) (2)% Research and product development 2.8 3.1 (0.3) (9)% Adjusted EBITDA $ (5.8) $ (6.0) $ (0.2) (3)% Notes • AdjustedEBITDAisdefinedasnetlossexcluding: cashsettledlongtermcompensationindexedtoshareprice, sharesettledstock-basedcompensationexpense,netfinanceincomeandexpenses,depreciationandamortization. AdjustedEBITDAisanon-IFRSmeasureandmaynotbecomparabletosimilarmeasuresusedbyothercompanies. • ManagementusesAdjustedEBITDAasausefulmeasureofongoingoperationalresults. (in $ millions) YTD Results
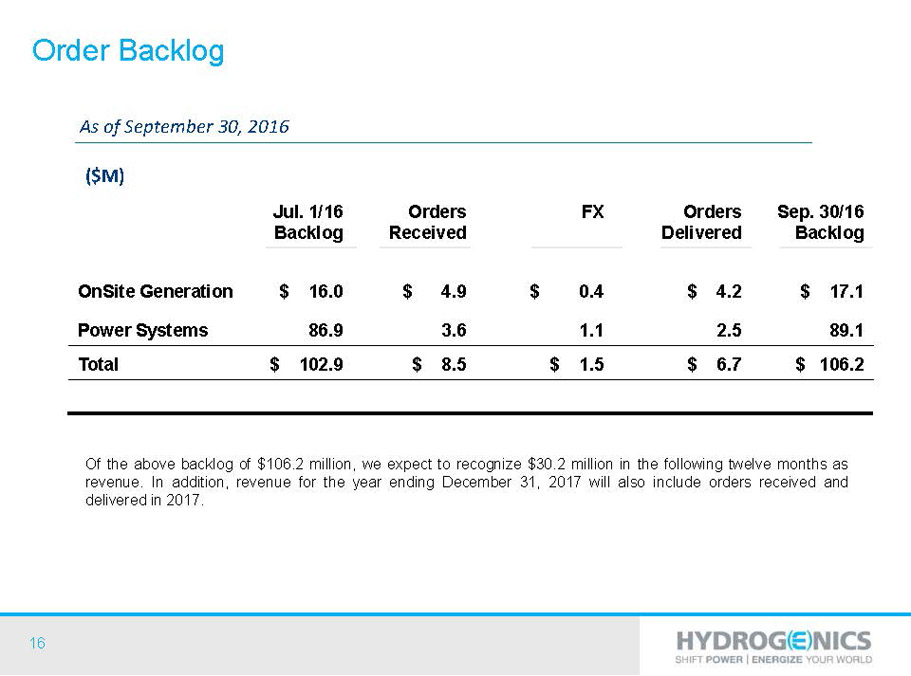
16 Jul. 1/16 Backlog Orders Received FX Orders Delivered Sep. 30/16 Backlog OnSiteGeneration $ 16.0 $ 4.9 $ 0.4 $ 4.2 $ 17.1 Power Systems 86.9 3.6 1.1 2.5 89.1 Total $ 102.9 $ 8.5 $ 1.5 $ 6.7 $ 106.2 As of September 30, 2016 ($M) Order Backlog Oftheabovebacklogof$106.2million,weexpecttorecognize$30.2millioninthefollowingtwelvemonthsas revenue. In addition, revenue for the year ending December 31, 2017 will also include orders received and deliveredin2017.

17 Cash and cash equivalents and restricted cash $ 11.2 $ 24.9 (13.7) (55)% Trade, other and grants receivable 13.6 10.4 3.2 30% Inventories 18.9 14.3 4.6 32% Operating borrowings 2.2 1.1 1.1 100% Trade and other payables 11.4 7.8 3.6 46% Financial liabilities 8.7 9.0 (0.3) (3)% Dec. 31, 2015 $ % ($M) ChangeSep.30, 2016 Consolidated Balance Sheet Highlights
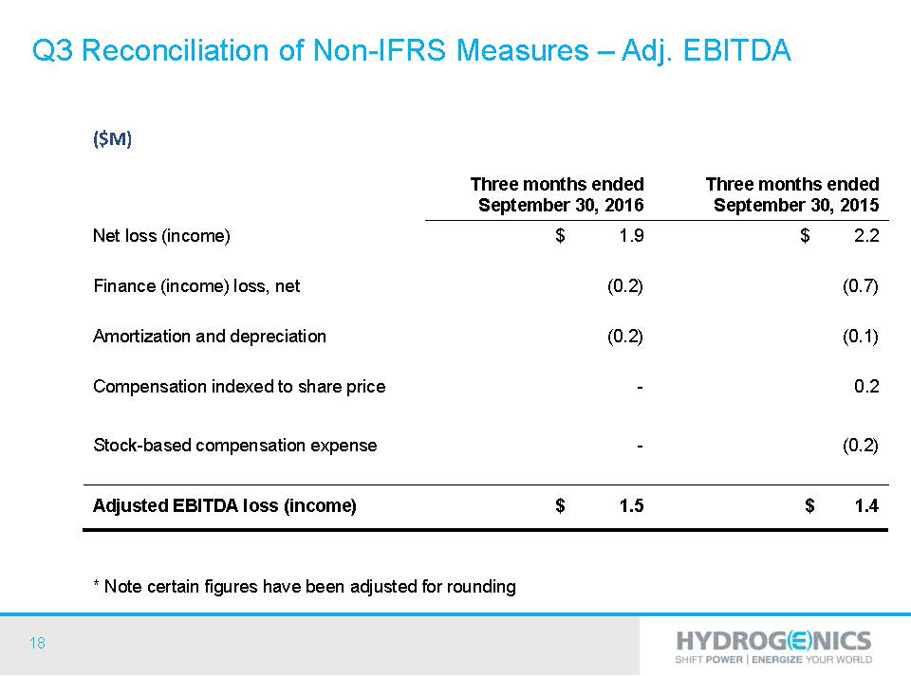
18 Three months ended September 30, 2016 Three months ended September 30, 2015 Net loss (income) $ 1.9 $ 2.2 Finance (income) loss, net (0.2) (0.7) Amortization and depreciation (0.2) (0.1) Compensation indexed to share price - 0.2 Stock-based compensation expense - (0.2) Adjusted EBITDA loss (income) $ 1.5 $ 1.4 ($M) Q3 Reconciliationof Non-IFRS Measures –Adj. EBITDA * Note certain figures have been adjusted for rounding
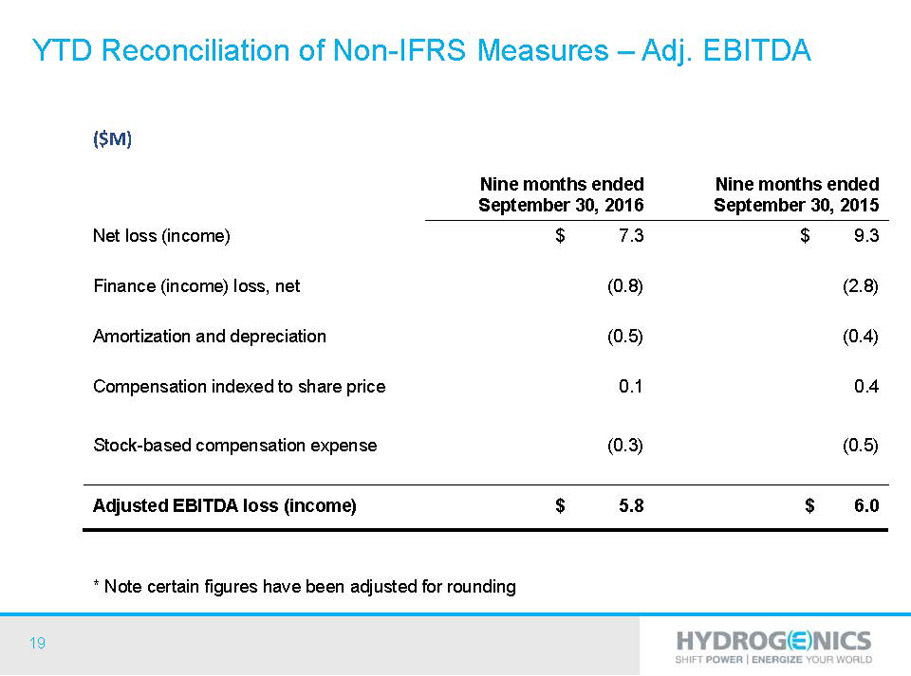
19 Nine months ended September 30, 2016 Nine months ended September 30, 2015 Net loss (income) $ 7.3 $ 9.3 Finance (income) loss, net (0.8) (2.8) Amortization and depreciation (0.5) (0.4) Compensation indexed to share price 0.1 0.4 Stock-based compensation expense (0.3) (0.5) Adjusted EBITDA loss (income) $ 5.8 $ 6.0 ($M) YTD Reconciliationof Non-IFRS Measures –Adj. EBITDA * Note certain figures have been adjusted for rounding

20